Zip Codes with the Highest Percentage of Population Employed in Architecture & Engineering in Valparaiso, IN
RELATED REPORTS & OPTIONS
Architecture & Engineering
Valparaiso
Compare Zip Codes
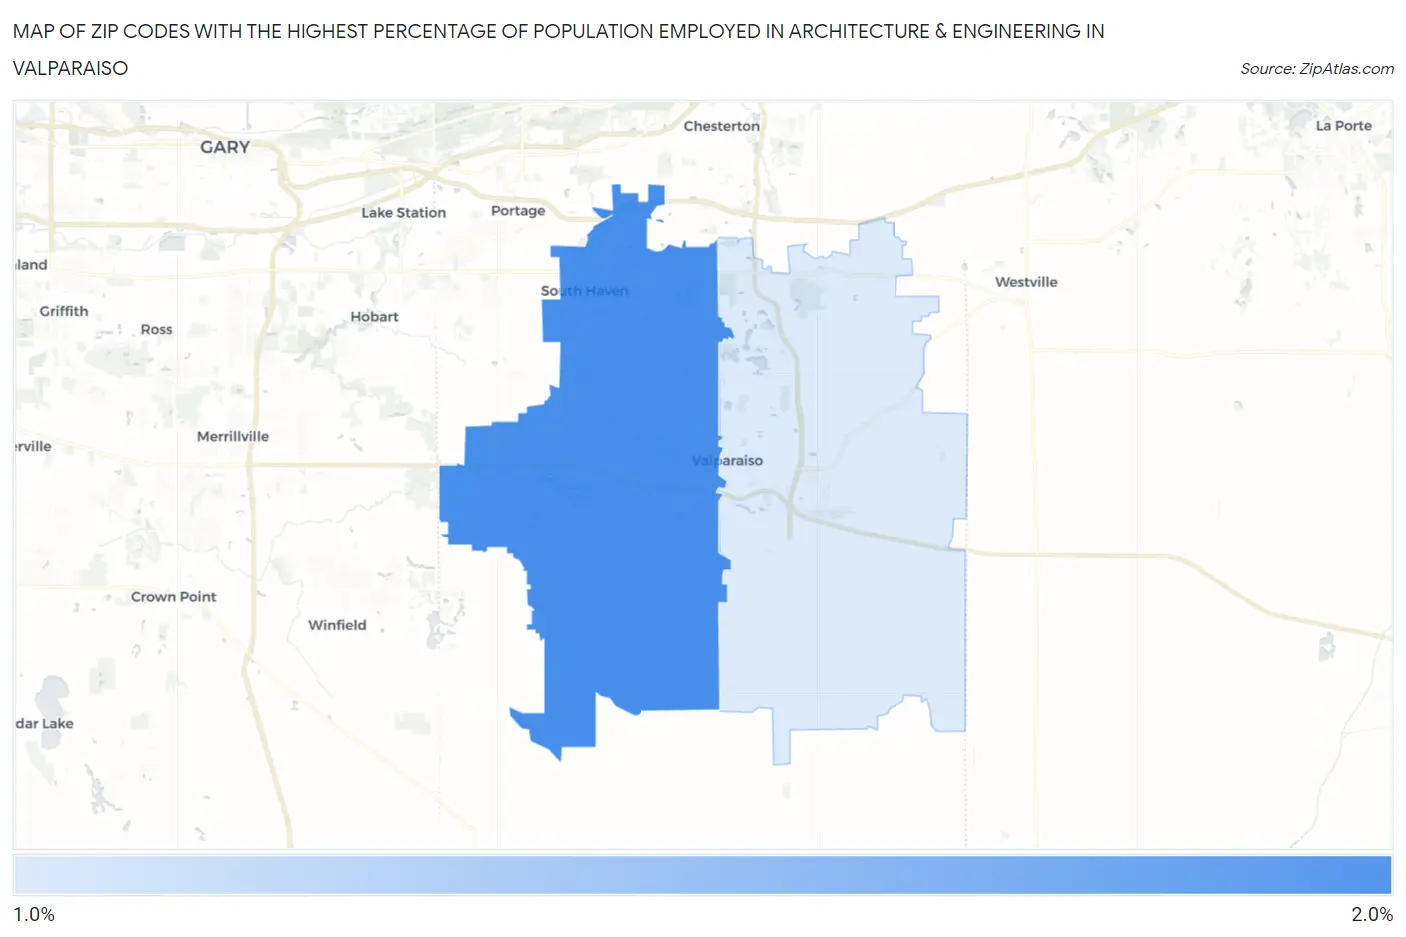
Map of Zip Codes with the Highest Percentage of Population Employed in Architecture & Engineering in Valparaiso
1.7%
2.0%
Zip Codes with the Highest Percentage of Population Employed in Architecture & Engineering in Valparaiso, IN
| Zip Code | % Employed | vs State | vs National | |
| 1. | 46385 | 2.0% | 2.2%(-0.235)#292 | 2.1%(-0.163)#9,698 |
| 2. | 46383 | 1.7% | 2.2%(-0.515)#338 | 2.1%(-0.443)#11,446 |
1
Common Questions
What are the Top Zip Codes with the Highest Percentage of Population Employed in Architecture & Engineering in Valparaiso, IN?
Top Zip Codes with the Highest Percentage of Population Employed in Architecture & Engineering in Valparaiso, IN are:
What zip code has the Highest Percentage of Population Employed in Architecture & Engineering in Valparaiso, IN?
46385 has the Highest Percentage of Population Employed in Architecture & Engineering in Valparaiso, IN with 2.0%.
What is the Percentage of Population Employed in Architecture & Engineering in Valparaiso, IN?
Percentage of Population Employed in Architecture & Engineering in Valparaiso is 1.4%.
What is the Percentage of Population Employed in Architecture & Engineering in Indiana?
Percentage of Population Employed in Architecture & Engineering in Indiana is 2.2%.
What is the Percentage of Population Employed in Architecture & Engineering in the United States?
Percentage of Population Employed in Architecture & Engineering in the United States is 2.1%.