Newton, MA Map & Demographics
Newton Map
Newton Overview
$91,282
PER CAPITA INCOME
$222,500
AVG FAMILY INCOME
$176,373
AVG HOUSEHOLD INCOME
45.6%
WAGE / INCOME GAP [ % ]
54.4¢/ $1
WAGE / INCOME GAP [ $ ]
0.49
INEQUALITY / GINI INDEX
88,453
TOTAL POPULATION
42,981
MALE POPULATION
45,472
FEMALE POPULATION
94.52
MALES / 100 FEMALES
105.80
FEMALES / 100 MALES
41.7
MEDIAN AGE
3.0
AVG FAMILY SIZE
2.6
AVG HOUSEHOLD SIZE
47,683
LABOR FORCE [ PEOPLE ]
65.6%
PERCENT IN LABOR FORCE
3.5%
UNEMPLOYMENT RATE
Newton Zip Codes
Income in Newton
Income Overview in Newton
Per Capita Income in Newton is $91,282, while median incomes of families and households are $222,500 and $176,373 respectively.
| Characteristic | Number | Measure |
| Per Capita Income | 88,453 | $91,282 |
| Median Family Income | 22,592 | $222,500 |
| Mean Family Income | 22,592 | $304,838 |
| Median Household Income | 31,735 | $176,373 |
| Mean Household Income | 31,735 | $251,210 |
| Income Deficit | 22,592 | $0 |
| Wage / Income Gap (%) | 88,453 | 45.64% |
| Wage / Income Gap ($) | 88,453 | 54.36¢ per $1 |
| Gini / Inequality Index | 88,453 | 0.49 |
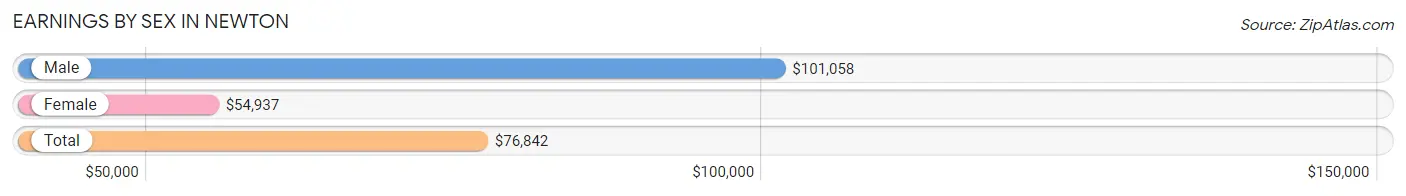
Earnings by Sex in Newton
Average Earnings in Newton are $76,842, $101,058 for men and $54,937 for women, a difference of 45.6%.
| Sex | Number | Average Earnings |
| Male | 26,827 (51.8%) | $101,058 |
| Female | 24,909 (48.1%) | $54,937 |
| Total | 51,736 (100.0%) | $76,842 |
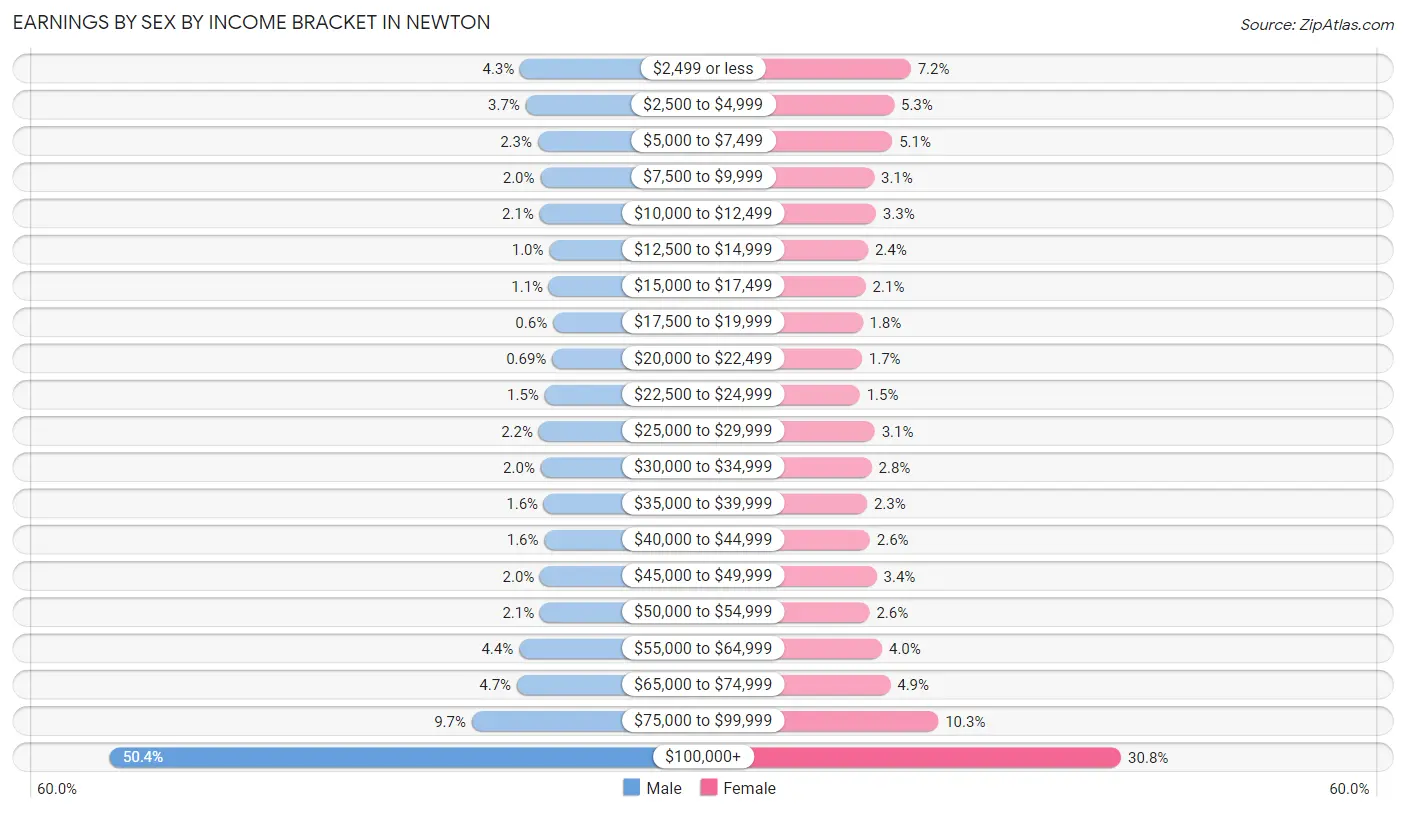
Earnings by Sex by Income Bracket in Newton
The most common earnings brackets in Newton are $100,000+ for men (13,524 | 50.4%) and $100,000+ for women (7,682 | 30.8%).
| Income | Male | Female |
| $2,499 or less | 1,153 (4.3%) | 1,790 (7.2%) |
| $2,500 to $4,999 | 985 (3.7%) | 1,323 (5.3%) |
| $5,000 to $7,499 | 619 (2.3%) | 1,273 (5.1%) |
| $7,500 to $9,999 | 541 (2.0%) | 763 (3.1%) |
| $10,000 to $12,499 | 566 (2.1%) | 815 (3.3%) |
| $12,500 to $14,999 | 271 (1.0%) | 592 (2.4%) |
| $15,000 to $17,499 | 285 (1.1%) | 529 (2.1%) |
| $17,500 to $19,999 | 162 (0.6%) | 441 (1.8%) |
| $20,000 to $22,499 | 185 (0.7%) | 420 (1.7%) |
| $22,500 to $24,999 | 412 (1.5%) | 361 (1.5%) |
| $25,000 to $29,999 | 590 (2.2%) | 781 (3.1%) |
| $30,000 to $34,999 | 531 (2.0%) | 696 (2.8%) |
| $35,000 to $39,999 | 435 (1.6%) | 565 (2.3%) |
| $40,000 to $44,999 | 422 (1.6%) | 646 (2.6%) |
| $45,000 to $49,999 | 547 (2.0%) | 834 (3.4%) |
| $50,000 to $54,999 | 552 (2.1%) | 634 (2.5%) |
| $55,000 to $64,999 | 1,186 (4.4%) | 986 (4.0%) |
| $65,000 to $74,999 | 1,250 (4.7%) | 1,218 (4.9%) |
| $75,000 to $99,999 | 2,611 (9.7%) | 2,560 (10.3%) |
| $100,000+ | 13,524 (50.4%) | 7,682 (30.8%) |
| Total | 26,827 (100.0%) | 24,909 (100.0%) |
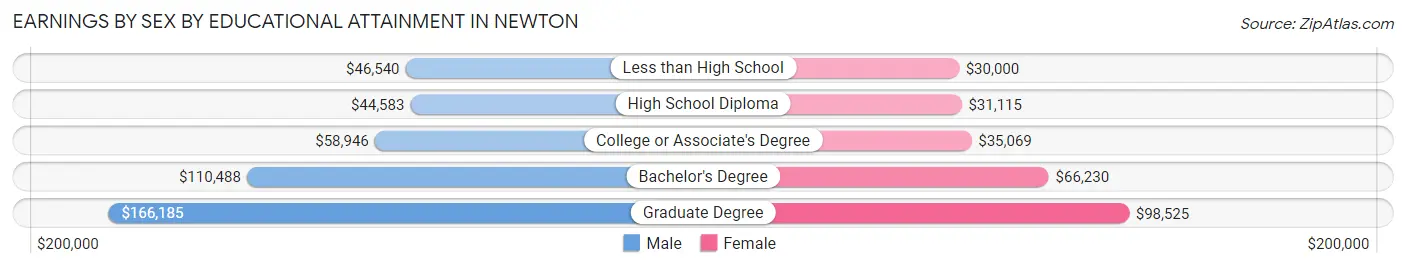
Earnings by Sex by Educational Attainment in Newton
Average earnings in Newton are $124,666 for men and $75,188 for women, a difference of 39.7%. Men with an educational attainment of graduate degree enjoy the highest average annual earnings of $166,185, while those with high school diploma education earn the least with $44,583. Women with an educational attainment of graduate degree earn the most with the average annual earnings of $98,525, while those with less than high school education have the smallest earnings of $30,000.
| Educational Attainment | Male Income | Female Income |
| Less than High School | $46,540 | $30,000 |
| High School Diploma | $44,583 | $31,115 |
| College or Associate's Degree | $58,946 | $35,069 |
| Bachelor's Degree | $110,488 | $66,230 |
| Graduate Degree | $166,185 | $98,525 |
| Total | $124,666 | $75,188 |
Family Income in Newton
Family Income Brackets in Newton
According to the Newton family income data, there are 12,539 families falling into the $200,000+ income range, which is the most common income bracket and makes up 55.5% of all families. Conversely, the $10,000 to $14,999 income bracket is the least frequent group with only 136 families (0.6%) belonging to this category.
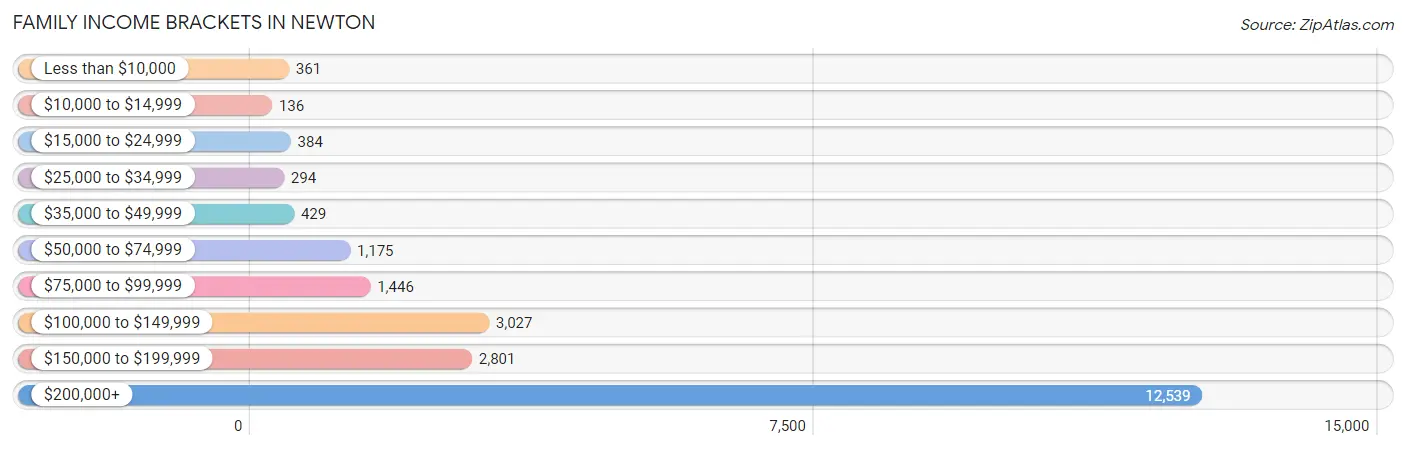
| Income Bracket | # Families | % Families |
| Less than $10,000 | 361 | 1.6% |
| $10,000 to $14,999 | 136 | 0.6% |
| $15,000 to $24,999 | 384 | 1.7% |
| $25,000 to $34,999 | 294 | 1.3% |
| $35,000 to $49,999 | 429 | 1.9% |
| $50,000 to $74,999 | 1,175 | 5.2% |
| $75,000 to $99,999 | 1,446 | 6.4% |
| $100,000 to $149,999 | 3,027 | 13.4% |
| $150,000 to $199,999 | 2,801 | 12.4% |
| $200,000+ | 12,539 | 55.5% |
Family Income by Famaliy Size in Newton
4-person families (5,356 | 23.7%) account for the highest median family income in Newton with $250,001 per family, while 2-person families (9,941 | 44.0%) have the highest median income of $97,544 per family member.
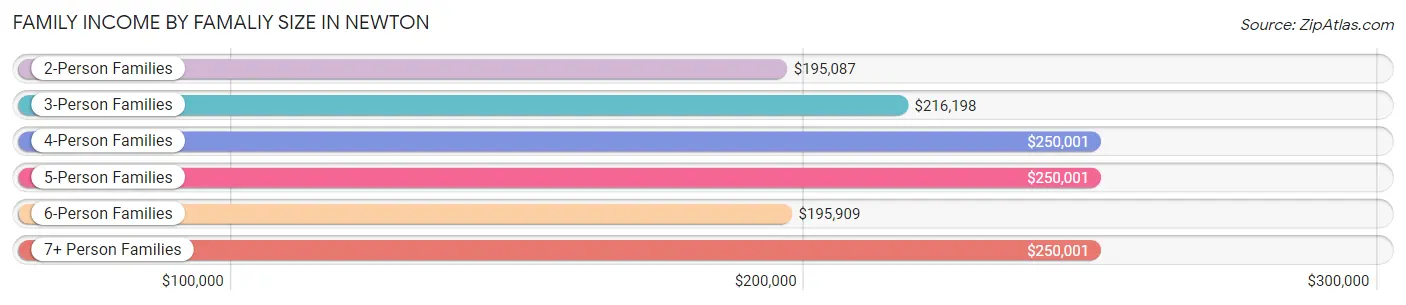
| Income Bracket | # Families | Median Income |
| 2-Person Families | 9,941 (44.0%) | $195,087 |
| 3-Person Families | 5,001 (22.1%) | $216,198 |
| 4-Person Families | 5,356 (23.7%) | $250,001 |
| 5-Person Families | 1,881 (8.3%) | $250,001 |
| 6-Person Families | 342 (1.5%) | $195,909 |
| 7+ Person Families | 71 (0.3%) | $250,001 |
| Total | 22,592 (100.0%) | $222,500 |
Family Income by Number of Earners in Newton
The median family income in Newton is $222,500, with families comprising 2 earners (11,648) having the highest median family income of $250,001, while families with no earners (2,118) have the lowest median family income of $83,703, accounting for 51.6% and 9.4% of families, respectively.
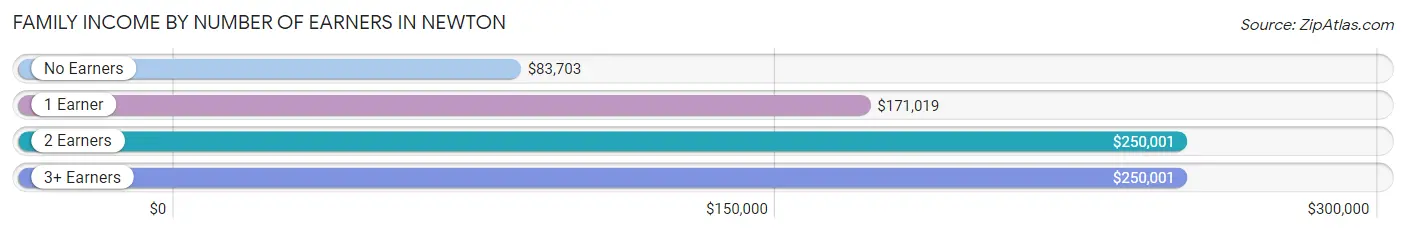
| Number of Earners | # Families | Median Income |
| No Earners | 2,118 (9.4%) | $83,703 |
| 1 Earner | 6,299 (27.9%) | $171,019 |
| 2 Earners | 11,648 (51.6%) | $250,001 |
| 3+ Earners | 2,527 (11.2%) | $250,001 |
| Total | 22,592 (100.0%) | $222,500 |
Household Income in Newton
Household Income Brackets in Newton
With 14,090 households falling in the category, the $200,000+ income range is the most frequent in Newton, accounting for 44.4% of all households. In contrast, only 698 households (2.2%) fall into the $10,000 to $14,999 income bracket, making it the least populous group.
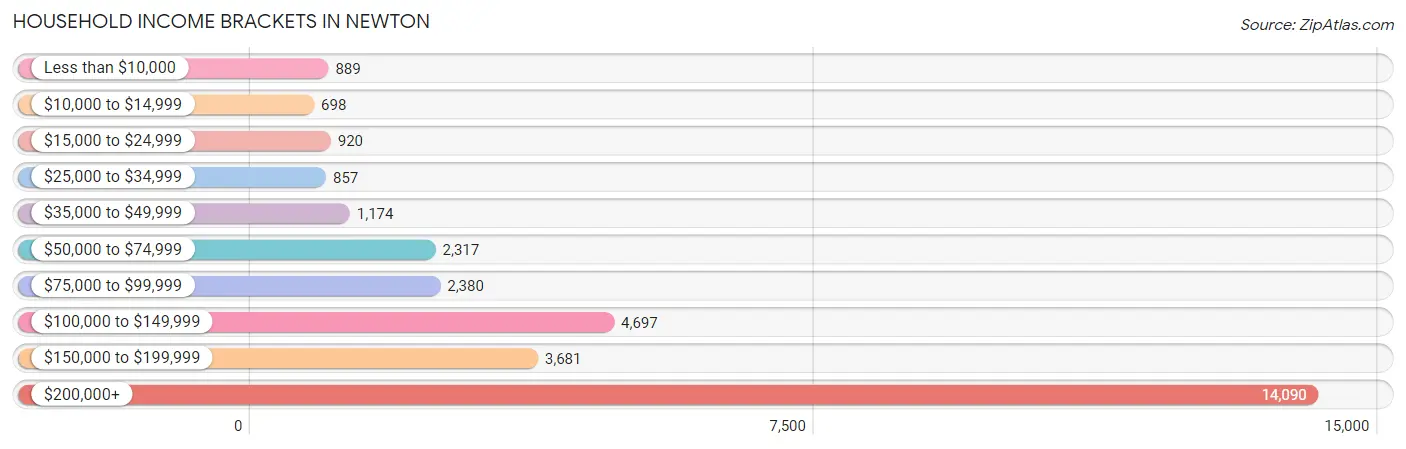
| Income Bracket | # Households | % Households |
| Less than $10,000 | 889 | 2.8% |
| $10,000 to $14,999 | 698 | 2.2% |
| $15,000 to $24,999 | 920 | 2.9% |
| $25,000 to $34,999 | 857 | 2.7% |
| $35,000 to $49,999 | 1,174 | 3.7% |
| $50,000 to $74,999 | 2,317 | 7.3% |
| $75,000 to $99,999 | 2,380 | 7.5% |
| $100,000 to $149,999 | 4,697 | 14.8% |
| $150,000 to $199,999 | 3,681 | 11.6% |
| $200,000+ | 14,090 | 44.4% |
Household Income by Householder Age in Newton
The median household income in Newton is $176,373, with the highest median household income of $216,289 found in the 45 to 64 years age bracket for the primary householder. A total of 13,093 households (41.3%) fall into this category. Meanwhile, the 15 to 24 years age bracket for the primary householder has the lowest median household income of $53,693, with 452 households (1.4%) in this group.
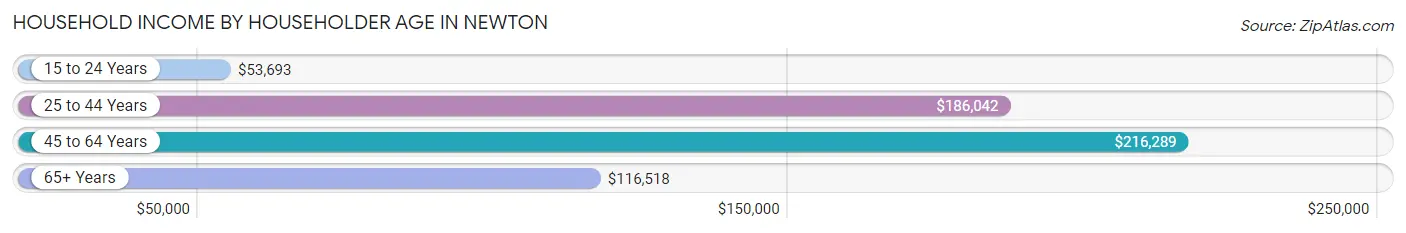
| Income Bracket | # Households | Median Income |
| 15 to 24 Years | 452 (1.4%) | $53,693 |
| 25 to 44 Years | 8,351 (26.3%) | $186,042 |
| 45 to 64 Years | 13,093 (41.3%) | $216,289 |
| 65+ Years | 9,839 (31.0%) | $116,518 |
| Total | 31,735 (100.0%) | $176,373 |
Poverty in Newton
Income Below Poverty by Sex and Age in Newton
With 3.8% poverty level for males and 5.3% for females among the residents of Newton, 18 to 24 year old males and 18 to 24 year old females are the most vulnerable to poverty, with 242 males (9.0%) and 423 females (16.8%) in their respective age groups living below the poverty level.
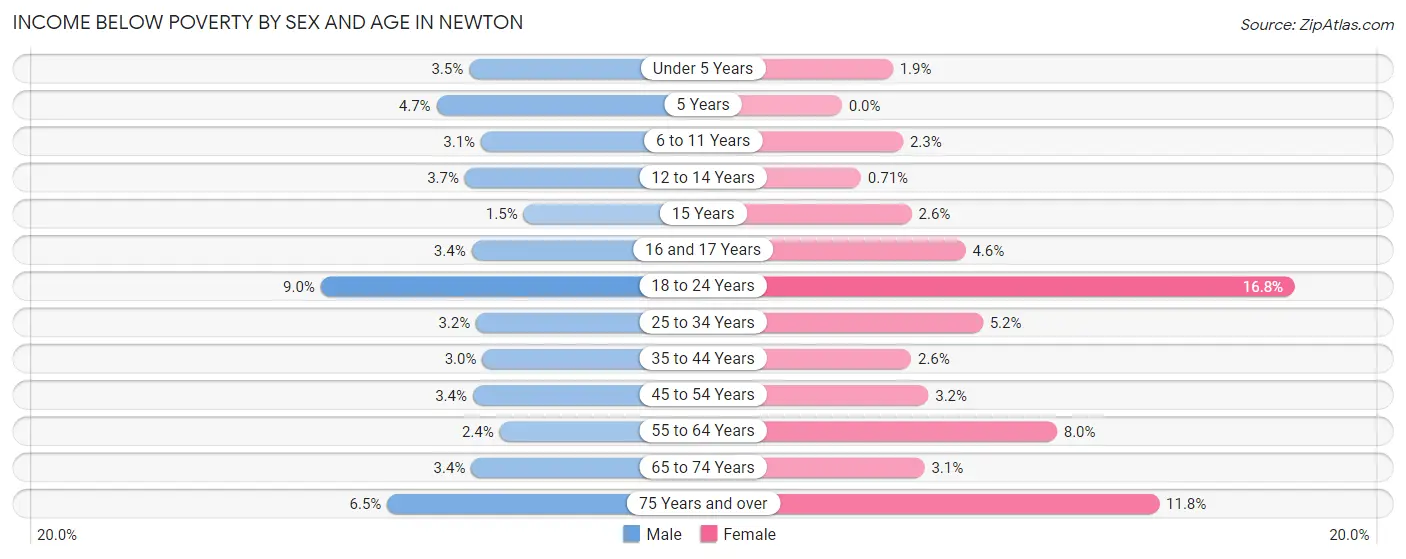
| Age Bracket | Male | Female |
| Under 5 Years | 66 (3.5%) | 33 (1.9%) |
| 5 Years | 17 (4.7%) | 0 (0.0%) |
| 6 to 11 Years | 107 (3.1%) | 72 (2.3%) |
| 12 to 14 Years | 53 (3.7%) | 13 (0.7%) |
| 15 Years | 9 (1.5%) | 19 (2.6%) |
| 16 and 17 Years | 47 (3.4%) | 54 (4.6%) |
| 18 to 24 Years | 242 (9.0%) | 423 (16.8%) |
| 25 to 34 Years | 139 (3.2%) | 216 (5.2%) |
| 35 to 44 Years | 160 (3.0%) | 129 (2.6%) |
| 45 to 54 Years | 202 (3.4%) | 207 (3.2%) |
| 55 to 64 Years | 132 (2.4%) | 468 (8.0%) |
| 65 to 74 Years | 145 (3.4%) | 155 (3.1%) |
| 75 Years and over | 193 (6.5%) | 456 (11.8%) |
| Total | 1,512 (3.8%) | 2,245 (5.3%) |
Income Above Poverty by Sex and Age in Newton
According to the poverty statistics in Newton, males aged 15 years and females aged 5 years are the age groups that are most secure financially, with 98.5% of males and 100.0% of females in these age groups living above the poverty line.
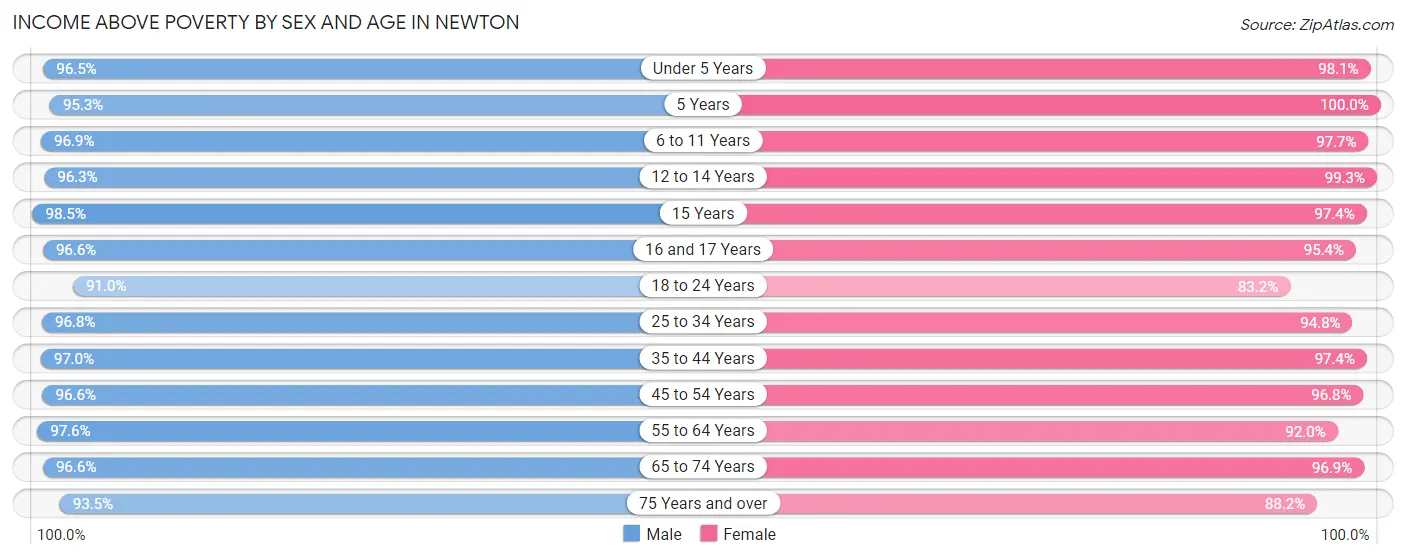
| Age Bracket | Male | Female |
| Under 5 Years | 1,821 (96.5%) | 1,710 (98.1%) |
| 5 Years | 344 (95.3%) | 430 (100.0%) |
| 6 to 11 Years | 3,388 (96.9%) | 3,096 (97.7%) |
| 12 to 14 Years | 1,396 (96.3%) | 1,806 (99.3%) |
| 15 Years | 599 (98.5%) | 716 (97.4%) |
| 16 and 17 Years | 1,330 (96.6%) | 1,123 (95.4%) |
| 18 to 24 Years | 2,443 (91.0%) | 2,092 (83.2%) |
| 25 to 34 Years | 4,153 (96.8%) | 3,915 (94.8%) |
| 35 to 44 Years | 5,161 (97.0%) | 4,888 (97.4%) |
| 45 to 54 Years | 5,814 (96.6%) | 6,237 (96.8%) |
| 55 to 64 Years | 5,444 (97.6%) | 5,396 (92.0%) |
| 65 to 74 Years | 4,093 (96.6%) | 4,890 (96.9%) |
| 75 Years and over | 2,760 (93.5%) | 3,414 (88.2%) |
| Total | 38,746 (96.2%) | 39,713 (94.7%) |
Income Below Poverty Among Married-Couple Families in Newton
The poverty statistics for married-couple families in Newton show that 1.6% or 309 of the total 19,610 families live below the poverty line. Families with no children have the highest poverty rate of 2.1%, comprising of 223 families. On the other hand, families with 3 or 4 children have the lowest poverty rate of 0.0%, which includes 0 families.
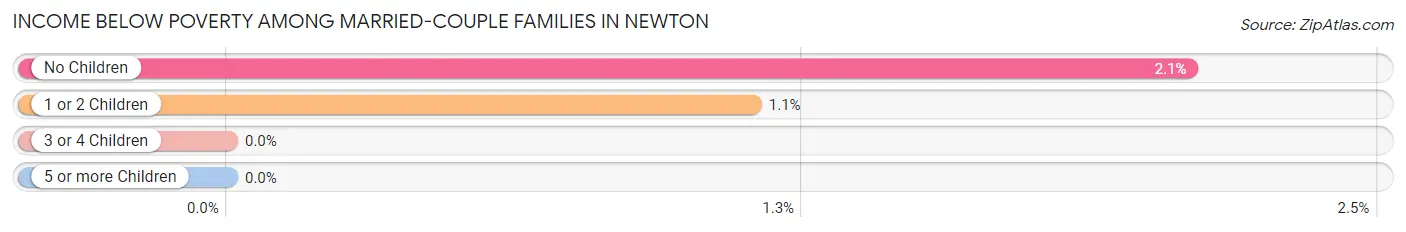
| Children | Above Poverty | Below Poverty |
| No Children | 10,439 (97.9%) | 223 (2.1%) |
| 1 or 2 Children | 7,488 (98.9%) | 86 (1.1%) |
| 3 or 4 Children | 1,362 (100.0%) | 0 (0.0%) |
| 5 or more Children | 12 (100.0%) | 0 (0.0%) |
| Total | 19,301 (98.4%) | 309 (1.6%) |
Income Below Poverty Among Single-Parent Households in Newton
According to the poverty data in Newton, 8.5% or 78 single-father households and 13.4% or 277 single-mother households are living below the poverty line. Among single-father households, those with no children have the highest poverty rate, with 78 households (15.7%) experiencing poverty. Likewise, among single-mother households, those with 3 or 4 children have the highest poverty rate, with 25 households (56.8%) falling below the poverty line.
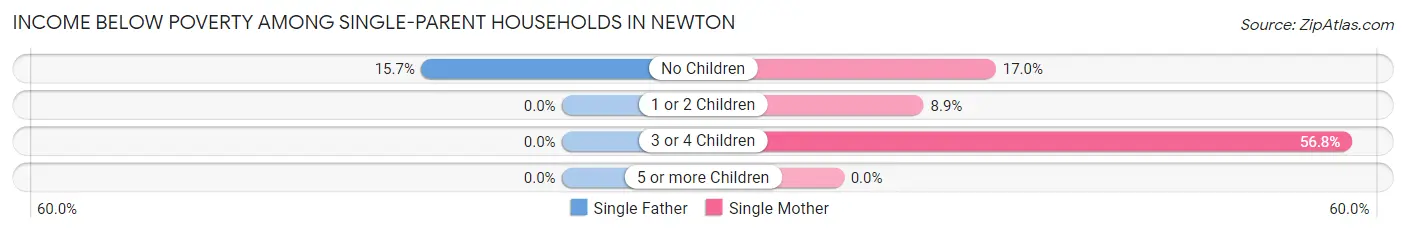
| Children | Single Father | Single Mother |
| No Children | 78 (15.7%) | 151 (17.0%) |
| 1 or 2 Children | 0 (0.0%) | 101 (8.9%) |
| 3 or 4 Children | 0 (0.0%) | 25 (56.8%) |
| 5 or more Children | 0 (0.0%) | 0 (0.0%) |
| Total | 78 (8.5%) | 277 (13.4%) |
Income Below Poverty Among Married-Couple vs Single-Parent Households in Newton
The poverty data for Newton shows that 309 of the married-couple family households (1.6%) and 355 of the single-parent households (11.9%) are living below the poverty level. Within the married-couple family households, those with no children have the highest poverty rate, with 223 households (2.1%) falling below the poverty line. Among the single-parent households, those with 3 or 4 children have the highest poverty rate, with 25 household (56.8%) living below poverty.
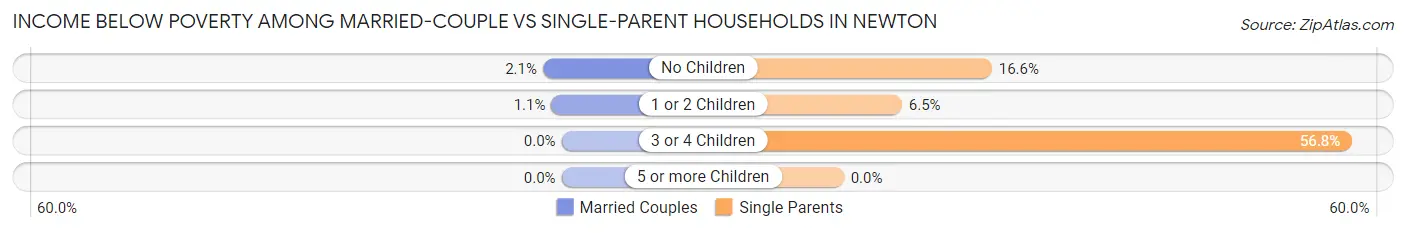
| Children | Married-Couple Families | Single-Parent Households |
| No Children | 223 (2.1%) | 229 (16.6%) |
| 1 or 2 Children | 86 (1.1%) | 101 (6.5%) |
| 3 or 4 Children | 0 (0.0%) | 25 (56.8%) |
| 5 or more Children | 0 (0.0%) | 0 (0.0%) |
| Total | 309 (1.6%) | 355 (11.9%) |
Race in Newton
The most populous races in Newton are White / Caucasian (66,079 | 74.7%), Asian (12,667 | 14.3%), and Two or more Races (5,178 | 5.9%).
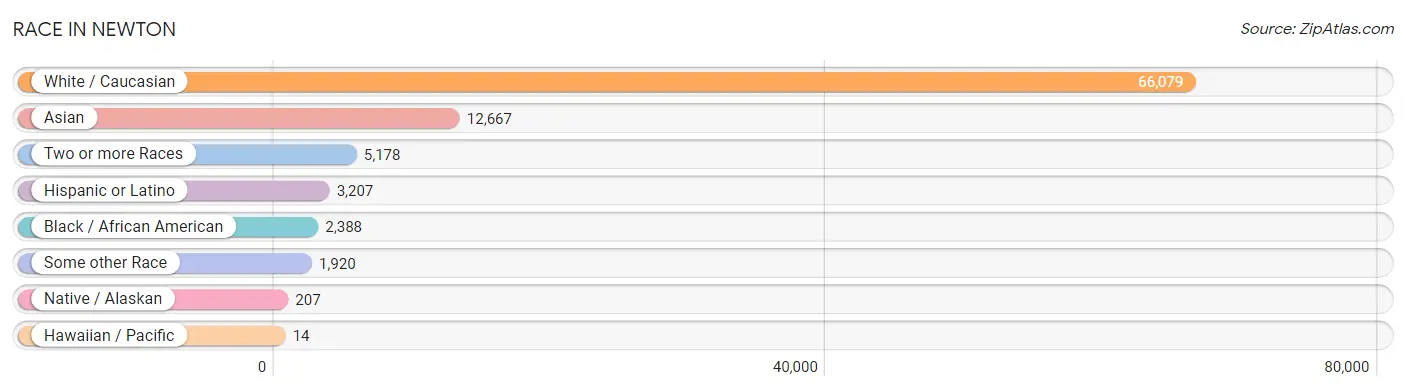
| Race | # Population | % Population |
| Asian | 12,667 | 14.3% |
| Black / African American | 2,388 | 2.7% |
| Hawaiian / Pacific | 14 | 0.0% |
| Hispanic or Latino | 3,207 | 3.6% |
| Native / Alaskan | 207 | 0.2% |
| White / Caucasian | 66,079 | 74.7% |
| Two or more Races | 5,178 | 5.9% |
| Some other Race | 1,920 | 2.2% |
| Total | 88,453 | 100.0% |
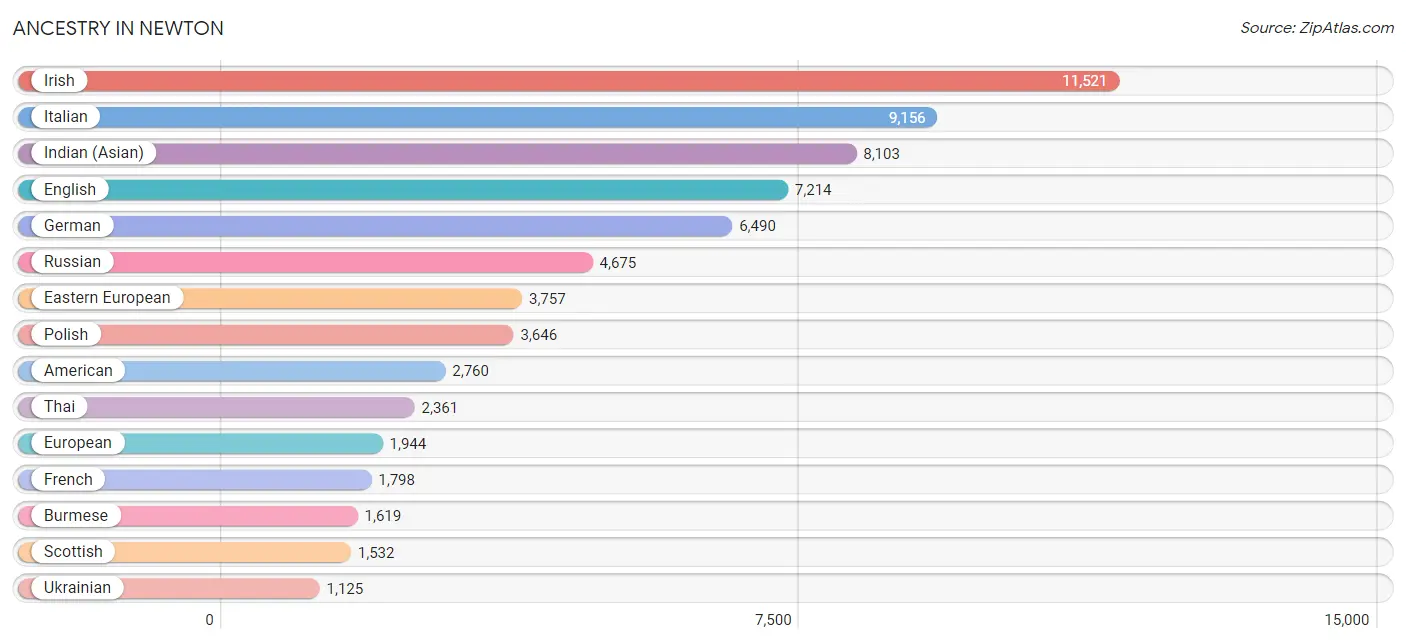
Ancestry in Newton
The most populous ancestries reported in Newton are Irish (11,521 | 13.0%), Italian (9,156 | 10.3%), Indian (Asian) (8,103 | 9.2%), English (7,214 | 8.2%), and German (6,490 | 7.3%), together accounting for 48.0% of all Newton residents.
| Ancestry | # Population | % Population |
| Afghan | 158 | 0.2% |
| African | 198 | 0.2% |
| Albanian | 476 | 0.5% |
| Alsatian | 10 | 0.0% |
| American | 2,760 | 3.1% |
| Arab | 894 | 1.0% |
| Argentinean | 68 | 0.1% |
| Armenian | 413 | 0.5% |
| Australian | 7 | 0.0% |
| Austrian | 458 | 0.5% |
| Barbadian | 52 | 0.1% |
| Belgian | 125 | 0.1% |
| Bhutanese | 476 | 0.5% |
| Brazilian | 750 | 0.9% |
| British | 870 | 1.0% |
| British West Indian | 38 | 0.0% |
| Bulgarian | 75 | 0.1% |
| Burmese | 1,619 | 1.8% |
| Cambodian | 31 | 0.0% |
| Canadian | 474 | 0.5% |
| Cape Verdean | 50 | 0.1% |
| Central American | 403 | 0.5% |
| Central American Indian | 26 | 0.0% |
| Cherokee | 111 | 0.1% |
| Chilean | 75 | 0.1% |
| Choctaw | 10 | 0.0% |
| Colombian | 225 | 0.3% |
| Cree | 7 | 0.0% |
| Croatian | 105 | 0.1% |
| Cuban | 150 | 0.2% |
| Cypriot | 15 | 0.0% |
| Czech | 112 | 0.1% |
| Czechoslovakian | 25 | 0.0% |
| Danish | 271 | 0.3% |
| Delaware | 9 | 0.0% |
| Dominican | 80 | 0.1% |
| Dutch | 634 | 0.7% |
| Eastern European | 3,757 | 4.3% |
| Ecuadorian | 108 | 0.1% |
| Egyptian | 39 | 0.0% |
| English | 7,214 | 8.2% |
| Estonian | 16 | 0.0% |
| Ethiopian | 94 | 0.1% |
| European | 1,944 | 2.2% |
| Filipino | 425 | 0.5% |
| Finnish | 234 | 0.3% |
| French | 1,798 | 2.0% |
| French American Indian | 7 | 0.0% |
| French Canadian | 1,120 | 1.3% |
| German | 6,490 | 7.3% |
| Ghanaian | 59 | 0.1% |
| Greek | 631 | 0.7% |
| Guatemalan | 181 | 0.2% |
| Guyanese | 9 | 0.0% |
| Haitian | 268 | 0.3% |
| Honduran | 86 | 0.1% |
| Hungarian | 444 | 0.5% |
| Icelander | 59 | 0.1% |
| Indian (Asian) | 8,103 | 9.2% |
| Iranian | 287 | 0.3% |
| Iraqi | 153 | 0.2% |
| Irish | 11,521 | 13.0% |
| Iroquois | 7 | 0.0% |
| Israeli | 717 | 0.8% |
| Italian | 9,156 | 10.3% |
| Jamaican | 166 | 0.2% |
| Japanese | 14 | 0.0% |
| Kenyan | 85 | 0.1% |
| Korean | 654 | 0.7% |
| Laotian | 96 | 0.1% |
| Latvian | 65 | 0.1% |
| Lebanese | 251 | 0.3% |
| Liberian | 85 | 0.1% |
| Lithuanian | 839 | 0.9% |
| Malaysian | 25 | 0.0% |
| Mexican | 652 | 0.7% |
| Mexican American Indian | 146 | 0.2% |
| Mongolian | 240 | 0.3% |
| Moroccan | 63 | 0.1% |
| Native Hawaiian | 14 | 0.0% |
| New Zealander | 9 | 0.0% |
| Nicaraguan | 24 | 0.0% |
| Nigerian | 150 | 0.2% |
| Northern European | 266 | 0.3% |
| Norwegian | 593 | 0.7% |
| Osage | 80 | 0.1% |
| Pakistani | 287 | 0.3% |
| Panamanian | 12 | 0.0% |
| Paraguayan | 10 | 0.0% |
| Peruvian | 129 | 0.2% |
| Polish | 3,646 | 4.1% |
| Portuguese | 387 | 0.4% |
| Pueblo | 17 | 0.0% |
| Puerto Rican | 449 | 0.5% |
| Romanian | 498 | 0.6% |
| Russian | 4,675 | 5.3% |
| Salvadoran | 100 | 0.1% |
| Scandinavian | 61 | 0.1% |
| Scotch-Irish | 749 | 0.9% |
| Scottish | 1,532 | 1.7% |
| Serbian | 100 | 0.1% |
| Sioux | 10 | 0.0% |
| Slovak | 228 | 0.3% |
| Slovene | 7 | 0.0% |
| South African | 119 | 0.1% |
| South American | 737 | 0.8% |
| South American Indian | 41 | 0.1% |
| Spaniard | 207 | 0.2% |
| Spanish | 248 | 0.3% |
| Spanish American | 52 | 0.1% |
| Sri Lankan | 686 | 0.8% |
| Subsaharan African | 1,050 | 1.2% |
| Swedish | 1,050 | 1.2% |
| Swiss | 380 | 0.4% |
| Syrian | 79 | 0.1% |
| Thai | 2,361 | 2.7% |
| Trinidadian and Tobagonian | 45 | 0.1% |
| Turkish | 75 | 0.1% |
| U.S. Virgin Islander | 26 | 0.0% |
| Ugandan | 148 | 0.2% |
| Ukrainian | 1,125 | 1.3% |
| Venezuelan | 89 | 0.1% |
| Welsh | 369 | 0.4% |
| West Indian | 89 | 0.1% |
| Yugoslavian | 8 | 0.0% | View All 125 Rows |
Immigrants in Newton
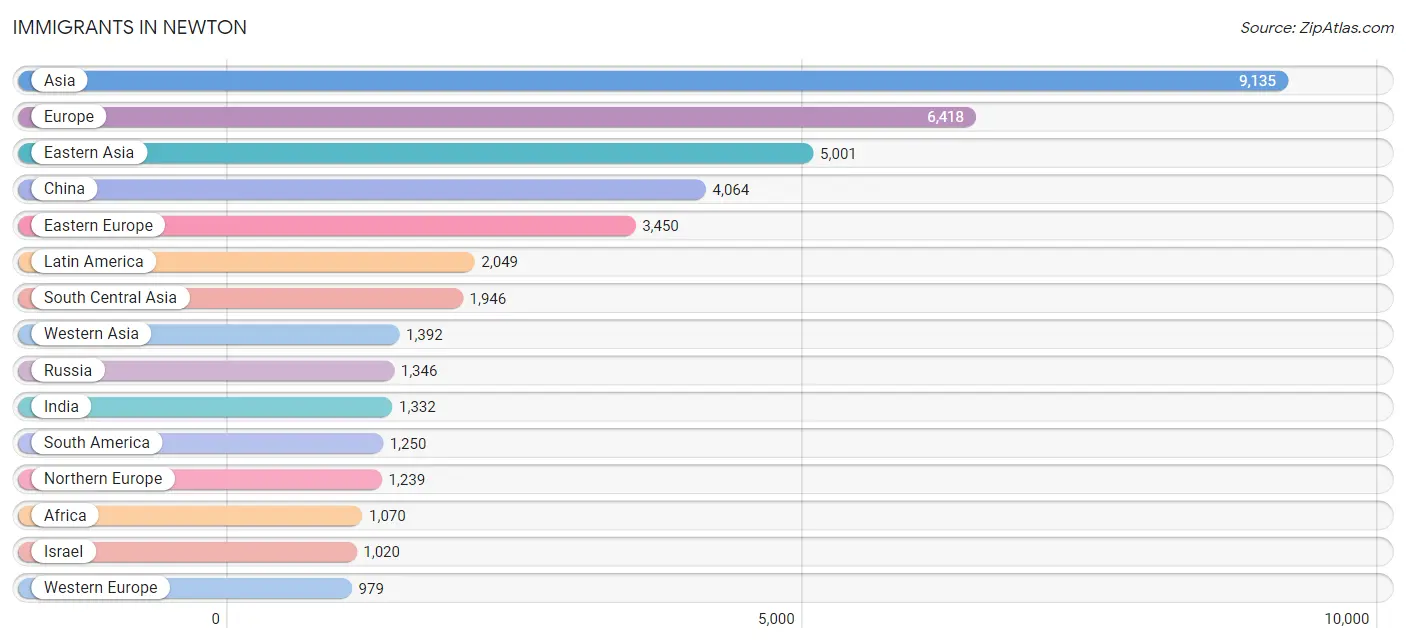
The most numerous immigrant groups reported in Newton came from Asia (9,135 | 10.3%), Europe (6,418 | 7.3%), Eastern Asia (5,001 | 5.7%), China (4,064 | 4.6%), and Eastern Europe (3,450 | 3.9%), together accounting for 31.7% of all Newton residents.
| Immigration Origin | # Population | % Population |
| Afghanistan | 48 | 0.1% |
| Africa | 1,070 | 1.2% |
| Albania | 227 | 0.3% |
| Argentina | 46 | 0.1% |
| Armenia | 10 | 0.0% |
| Asia | 9,135 | 10.3% |
| Australia | 87 | 0.1% |
| Austria | 60 | 0.1% |
| Bahamas | 16 | 0.0% |
| Bangladesh | 124 | 0.1% |
| Belarus | 73 | 0.1% |
| Belgium | 31 | 0.0% |
| Brazil | 812 | 0.9% |
| Bulgaria | 72 | 0.1% |
| Canada | 694 | 0.8% |
| Caribbean | 289 | 0.3% |
| Central America | 510 | 0.6% |
| Chile | 91 | 0.1% |
| China | 4,064 | 4.6% |
| Colombia | 139 | 0.2% |
| Cuba | 12 | 0.0% |
| Czechoslovakia | 27 | 0.0% |
| Denmark | 35 | 0.0% |
| Dominican Republic | 42 | 0.1% |
| Eastern Africa | 267 | 0.3% |
| Eastern Asia | 5,001 | 5.7% |
| Eastern Europe | 3,450 | 3.9% |
| Ecuador | 49 | 0.1% |
| Egypt | 142 | 0.2% |
| El Salvador | 83 | 0.1% |
| England | 363 | 0.4% |
| Ethiopia | 39 | 0.0% |
| Europe | 6,418 | 7.3% |
| France | 279 | 0.3% |
| Germany | 444 | 0.5% |
| Ghana | 137 | 0.2% |
| Greece | 21 | 0.0% |
| Grenada | 9 | 0.0% |
| Guatemala | 142 | 0.2% |
| Haiti | 118 | 0.1% |
| Honduras | 69 | 0.1% |
| Hong Kong | 556 | 0.6% |
| Hungary | 26 | 0.0% |
| India | 1,332 | 1.5% |
| Indonesia | 57 | 0.1% |
| Iran | 243 | 0.3% |
| Iraq | 44 | 0.1% |
| Ireland | 278 | 0.3% |
| Israel | 1,020 | 1.1% |
| Italy | 568 | 0.6% |
| Jamaica | 36 | 0.0% |
| Japan | 149 | 0.2% |
| Kazakhstan | 27 | 0.0% |
| Kenya | 90 | 0.1% |
| Korea | 788 | 0.9% |
| Kuwait | 5 | 0.0% |
| Latin America | 2,049 | 2.3% |
| Lebanon | 41 | 0.1% |
| Liberia | 85 | 0.1% |
| Lithuania | 22 | 0.0% |
| Malaysia | 16 | 0.0% |
| Mexico | 187 | 0.2% |
| Middle Africa | 46 | 0.1% |
| Moldova | 117 | 0.1% |
| Morocco | 23 | 0.0% |
| Nepal | 38 | 0.0% |
| Netherlands | 89 | 0.1% |
| Nigeria | 62 | 0.1% |
| Northern Africa | 287 | 0.3% |
| Northern Europe | 1,239 | 1.4% |
| Oceania | 101 | 0.1% |
| Panama | 29 | 0.0% |
| Peru | 69 | 0.1% |
| Philippines | 208 | 0.2% |
| Poland | 159 | 0.2% |
| Romania | 187 | 0.2% |
| Russia | 1,346 | 1.5% |
| Saudi Arabia | 129 | 0.2% |
| Scotland | 52 | 0.1% |
| Serbia | 55 | 0.1% |
| Singapore | 46 | 0.1% |
| South Africa | 163 | 0.2% |
| South America | 1,250 | 1.4% |
| South Central Asia | 1,946 | 2.2% |
| South Eastern Asia | 796 | 0.9% |
| Southern Europe | 706 | 0.8% |
| Spain | 117 | 0.1% |
| Sri Lanka | 35 | 0.0% |
| Sudan | 122 | 0.1% |
| Sweden | 63 | 0.1% |
| Switzerland | 76 | 0.1% |
| Syria | 48 | 0.1% |
| Taiwan | 363 | 0.4% |
| Thailand | 200 | 0.2% |
| Trinidad and Tobago | 34 | 0.0% |
| Turkey | 78 | 0.1% |
| Uganda | 123 | 0.1% |
| Ukraine | 713 | 0.8% |
| Uzbekistan | 28 | 0.0% |
| Venezuela | 44 | 0.1% |
| Vietnam | 236 | 0.3% |
| Western Africa | 307 | 0.4% |
| Western Asia | 1,392 | 1.6% |
| Western Europe | 979 | 1.1% |
| Zaire | 46 | 0.1% |
| Zimbabwe | 15 | 0.0% | View All 106 Rows |
Sex and Age in Newton
Sex and Age in Newton
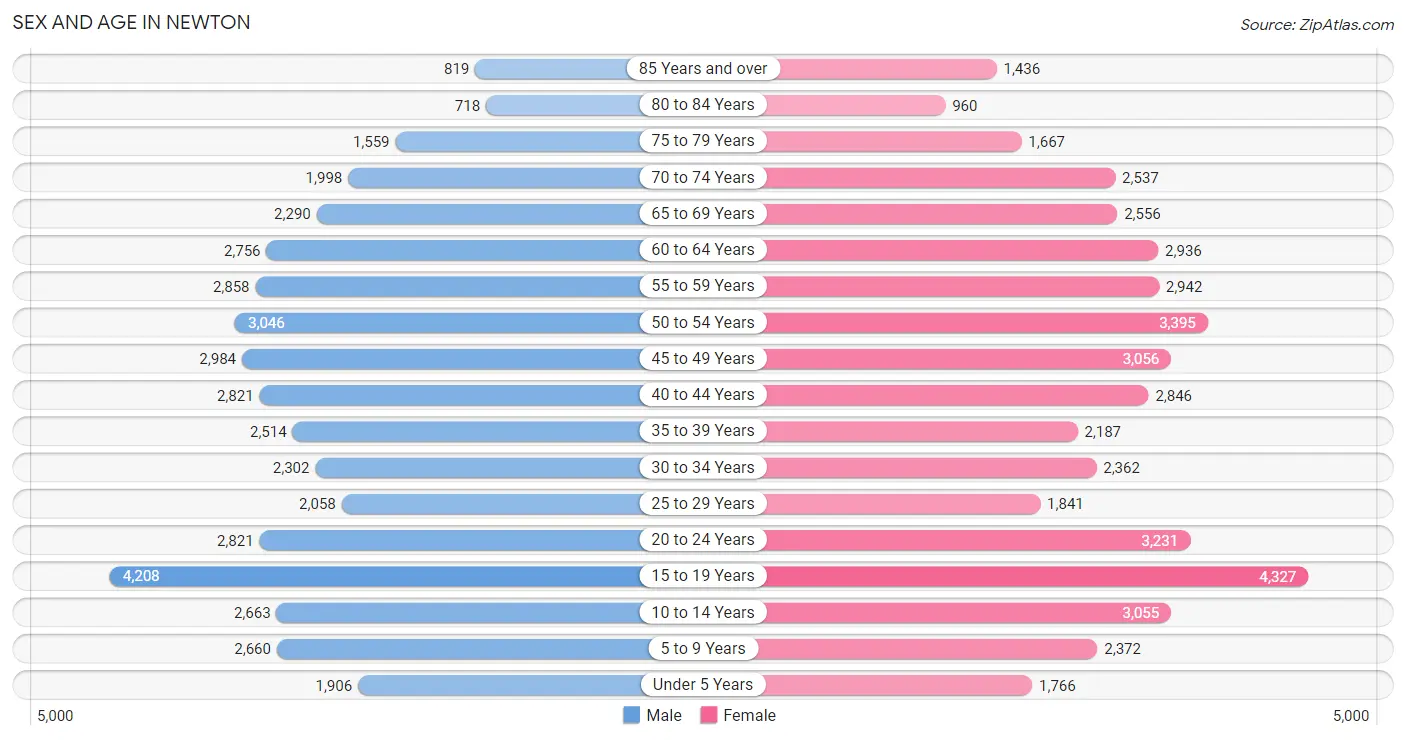
The most populous age groups in Newton are 15 to 19 Years (4,208 | 9.8%) for men and 15 to 19 Years (4,327 | 9.5%) for women.
| Age Bracket | Male | Female |
| Under 5 Years | 1,906 (4.4%) | 1,766 (3.9%) |
| 5 to 9 Years | 2,660 (6.2%) | 2,372 (5.2%) |
| 10 to 14 Years | 2,663 (6.2%) | 3,055 (6.7%) |
| 15 to 19 Years | 4,208 (9.8%) | 4,327 (9.5%) |
| 20 to 24 Years | 2,821 (6.6%) | 3,231 (7.1%) |
| 25 to 29 Years | 2,058 (4.8%) | 1,841 (4.1%) |
| 30 to 34 Years | 2,302 (5.4%) | 2,362 (5.2%) |
| 35 to 39 Years | 2,514 (5.9%) | 2,187 (4.8%) |
| 40 to 44 Years | 2,821 (6.6%) | 2,846 (6.3%) |
| 45 to 49 Years | 2,984 (6.9%) | 3,056 (6.7%) |
| 50 to 54 Years | 3,046 (7.1%) | 3,395 (7.5%) |
| 55 to 59 Years | 2,858 (6.7%) | 2,942 (6.5%) |
| 60 to 64 Years | 2,756 (6.4%) | 2,936 (6.5%) |
| 65 to 69 Years | 2,290 (5.3%) | 2,556 (5.6%) |
| 70 to 74 Years | 1,998 (4.6%) | 2,537 (5.6%) |
| 75 to 79 Years | 1,559 (3.6%) | 1,667 (3.7%) |
| 80 to 84 Years | 718 (1.7%) | 960 (2.1%) |
| 85 Years and over | 819 (1.9%) | 1,436 (3.2%) |
| Total | 42,981 (100.0%) | 45,472 (100.0%) |
Families and Households in Newton
Median Family Size in Newton
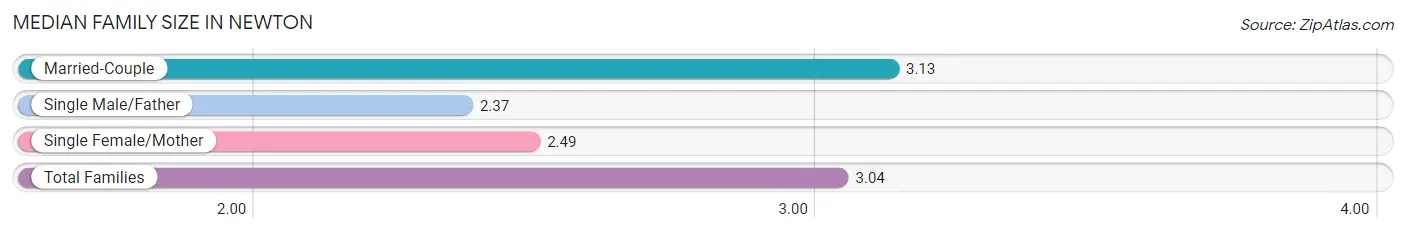
The median family size in Newton is 3.04 persons per family, with married-couple families (19,610 | 86.8%) accounting for the largest median family size of 3.13 persons per family. On the other hand, single male/father families (919 | 4.1%) represent the smallest median family size with 2.37 persons per family.
| Family Type | # Families | Family Size |
| Married-Couple | 19,610 (86.8%) | 3.13 |
| Single Male/Father | 919 (4.1%) | 2.37 |
| Single Female/Mother | 2,063 (9.1%) | 2.49 |
| Total Families | 22,592 (100.0%) | 3.04 |
Median Household Size in Newton
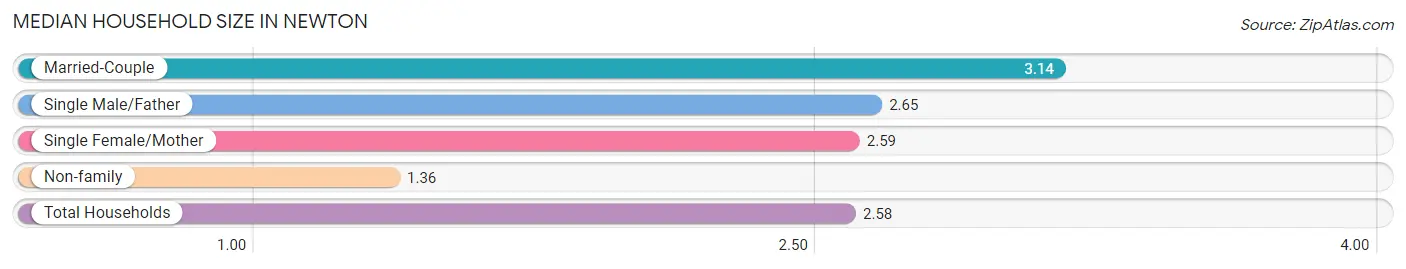
The median household size in Newton is 2.58 persons per household, with married-couple households (19,610 | 61.8%) accounting for the largest median household size of 3.14 persons per household. non-family households (9,143 | 28.8%) represent the smallest median household size with 1.36 persons per household.
| Household Type | # Households | Household Size |
| Married-Couple | 19,610 (61.8%) | 3.14 |
| Single Male/Father | 919 (2.9%) | 2.65 |
| Single Female/Mother | 2,063 (6.5%) | 2.59 |
| Non-family | 9,143 (28.8%) | 1.36 |
| Total Households | 31,735 (100.0%) | 2.58 |
Household Size by Marriage Status in Newton
Out of a total of 31,735 households in Newton, 22,592 (71.2%) are family households, while 9,143 (28.8%) are nonfamily households. The most numerous type of family households are 2-person households, comprising 9,638, and the most common type of nonfamily households are 1-person households, comprising 6,792.
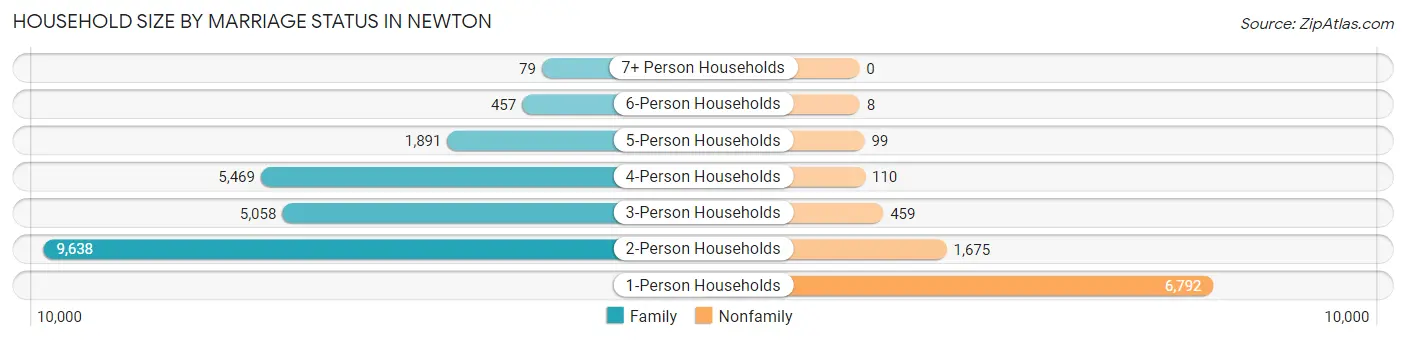
| Household Size | Family Households | Nonfamily Households |
| 1-Person Households | - | 6,792 (21.4%) |
| 2-Person Households | 9,638 (30.4%) | 1,675 (5.3%) |
| 3-Person Households | 5,058 (15.9%) | 459 (1.5%) |
| 4-Person Households | 5,469 (17.2%) | 110 (0.4%) |
| 5-Person Households | 1,891 (6.0%) | 99 (0.3%) |
| 6-Person Households | 457 (1.4%) | 8 (0.0%) |
| 7+ Person Households | 79 (0.3%) | 0 (0.0%) |
| Total | 22,592 (71.2%) | 9,143 (28.8%) |
Female Fertility in Newton
Fertility by Age in Newton
Average fertility rate in Newton is 30.0 births per 1,000 women. Women in the age bracket of 35 to 50 years have the highest fertility rate with 40.0 births per 1,000 women. Women in the age bracket of 35 to 50 years acount for 57.0% of all women with births.
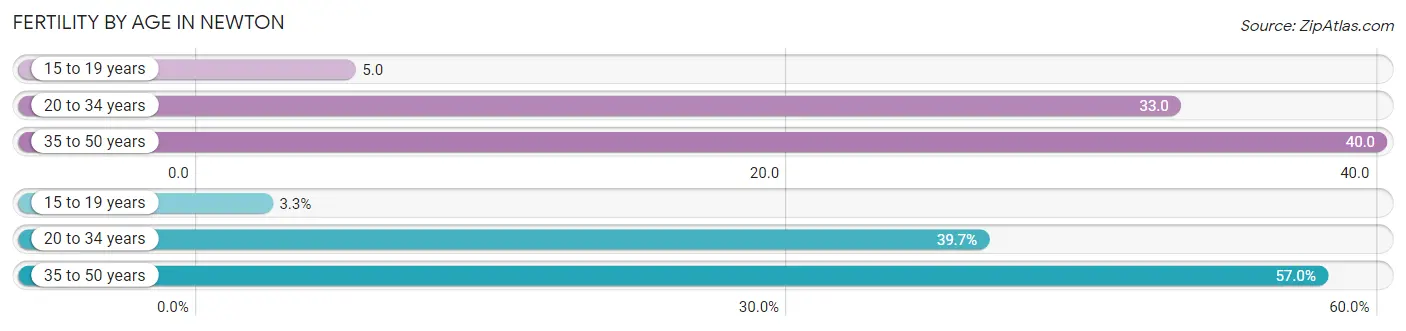
| Age Bracket | Women with Births | Births / 1,000 Women |
| 15 to 19 years | 20 (3.3%) | 5.0 |
| 20 to 34 years | 242 (39.7%) | 33.0 |
| 35 to 50 years | 347 (57.0%) | 40.0 |
| Total | 609 (100.0%) | 30.0 |
Fertility by Age by Marriage Status in Newton
96.6% of women with births (609) in Newton are married. The highest percentage of unmarried women with births falls into 15 to 19 years age bracket with 100.0% of them unmarried at the time of birth, while the lowest percentage of unmarried women with births belong to 35 to 50 years age bracket with 0.0% of them unmarried.
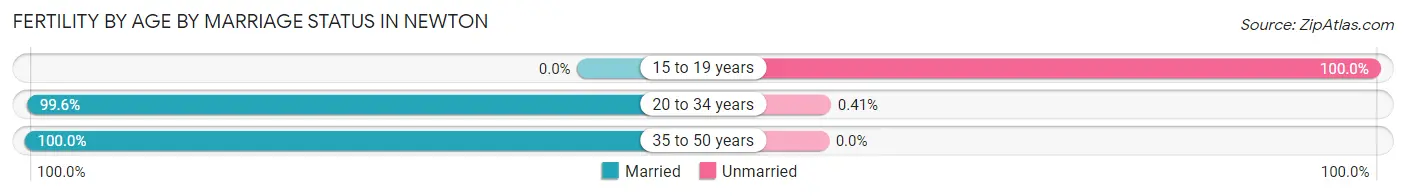
| Age Bracket | Married | Unmarried |
| 15 to 19 years | 0 (0.0%) | 20 (100.0%) |
| 20 to 34 years | 241 (99.6%) | 1 (0.4%) |
| 35 to 50 years | 347 (100.0%) | 0 (0.0%) |
| Total | 588 (96.6%) | 21 (3.5%) |
Fertility by Education in Newton
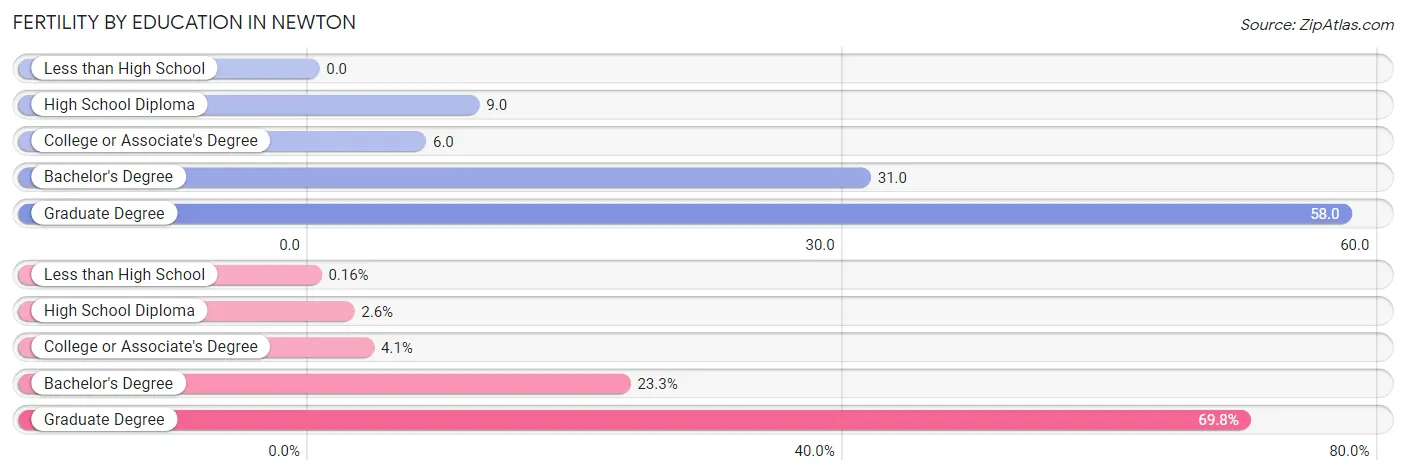
| Educational Attainment | Women with Births | Births / 1,000 Women |
| Less than High School | 1 (0.2%) | 0.0 |
| High School Diploma | 16 (2.6%) | 9.0 |
| College or Associate's Degree | 25 (4.1%) | 6.0 |
| Bachelor's Degree | 142 (23.3%) | 31.0 |
| Graduate Degree | 425 (69.8%) | 58.0 |
| Total | 609 (100.0%) | 30.0 |
Fertility by Education by Marriage Status in Newton
3.5% of women with births in Newton are unmarried. Women with the educational attainment of high school diploma are most likely to be married with 100.0% of them married at childbirth, while women with the educational attainment of less than high school are least likely to be married with 100.0% of them unmarried at childbirth.
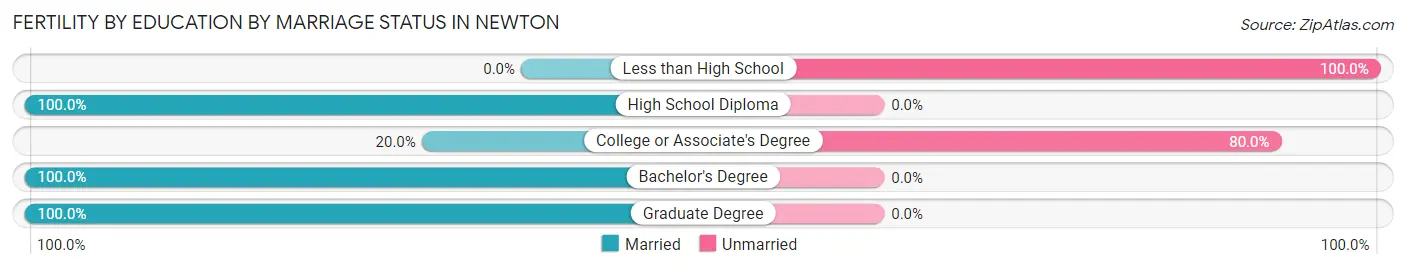
| Educational Attainment | Married | Unmarried |
| Less than High School | 0 (0.0%) | 1 (100.0%) |
| High School Diploma | 16 (100.0%) | 0 (0.0%) |
| College or Associate's Degree | 5 (20.0%) | 20 (80.0%) |
| Bachelor's Degree | 142 (100.0%) | 0 (0.0%) |
| Graduate Degree | 425 (100.0%) | 0 (0.0%) |
| Total | 588 (96.6%) | 21 (3.5%) |
Employment Characteristics in Newton
Employment by Class of Employer in Newton
Among the 45,456 employed individuals in Newton, private company employees (26,057 | 57.3%), not-for-profit organizations (10,089 | 22.2%), and self-employed (not incorporated) (3,434 | 7.5%) make up the most common classes of employment.
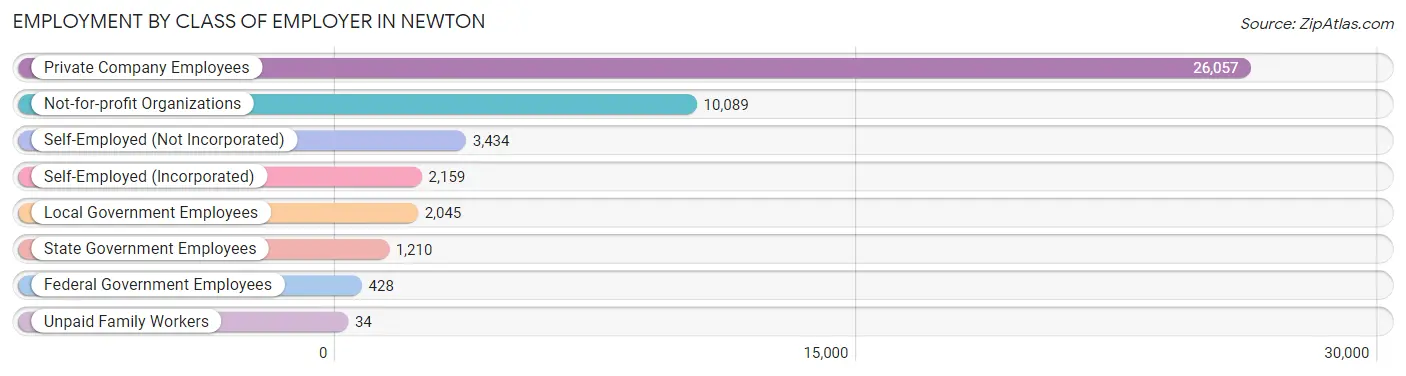
| Employer Class | # Employees | % Employees |
| Private Company Employees | 26,057 | 57.3% |
| Self-Employed (Incorporated) | 2,159 | 4.8% |
| Self-Employed (Not Incorporated) | 3,434 | 7.5% |
| Not-for-profit Organizations | 10,089 | 22.2% |
| Local Government Employees | 2,045 | 4.5% |
| State Government Employees | 1,210 | 2.7% |
| Federal Government Employees | 428 | 0.9% |
| Unpaid Family Workers | 34 | 0.1% |
| Total | 45,456 | 100.0% |
Employment Status by Age in Newton
According to the labor force statistics for Newton, out of the total population over 16 years of age (72,688), 65.6% or 47,683 individuals are in the labor force, with 3.5% or 1,669 of them unemployed. The age group with the highest labor force participation rate is 30 to 34 years, with 89.6% or 4,179 individuals in the labor force. Within the labor force, the 25 to 29 years age range has the highest percentage of unemployed individuals, with 6.7% or 229 of them being unemployed.
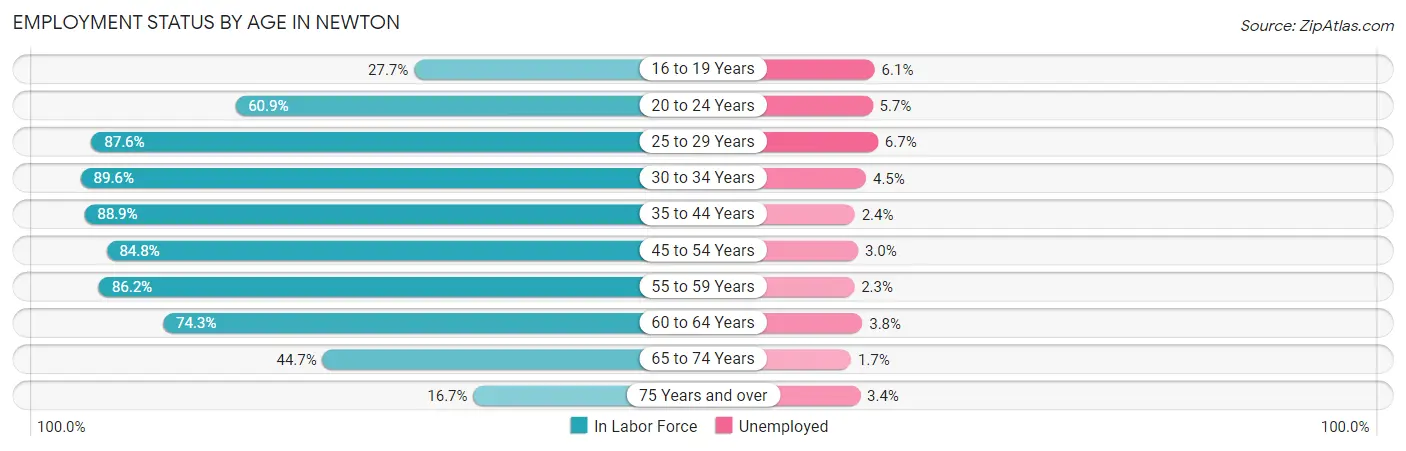
| Age Bracket | In Labor Force | Unemployed |
| 16 to 19 Years | 1,992 (27.7%) | 122 (6.1%) |
| 20 to 24 Years | 3,686 (60.9%) | 210 (5.7%) |
| 25 to 29 Years | 3,416 (87.6%) | 229 (6.7%) |
| 30 to 34 Years | 4,179 (89.6%) | 188 (4.5%) |
| 35 to 44 Years | 9,217 (88.9%) | 221 (2.4%) |
| 45 to 54 Years | 10,584 (84.8%) | 318 (3.0%) |
| 55 to 59 Years | 5,000 (86.2%) | 115 (2.3%) |
| 60 to 64 Years | 4,229 (74.3%) | 161 (3.8%) |
| 65 to 74 Years | 4,193 (44.7%) | 71 (1.7%) |
| 75 Years and over | 1,196 (16.7%) | 41 (3.4%) |
| Total | 47,683 (65.6%) | 1,669 (3.5%) |
Employment Status by Educational Attainment in Newton
According to labor force statistics for Newton, 85.4% of individuals (36,640) out of the total population between 25 and 64 years of age (42,904) are in the labor force, with 3.4% or 1,246 of them being unemployed. The group with the highest labor force participation rate are those with the educational attainment of bachelor's degree or higher, with 87.8% or 31,309 individuals in the labor force. Within the labor force, individuals with college / associate degree education have the highest percentage of unemployment, with 9.6% or 281 of them being unemployed.
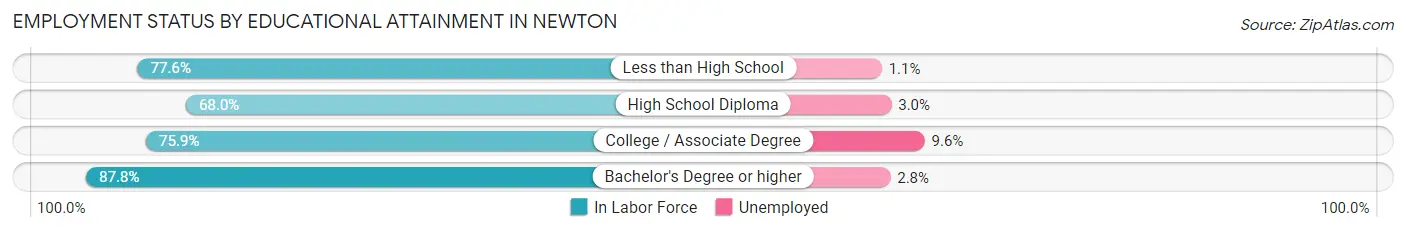
| Educational Attainment | In Labor Force | Unemployed |
| Less than High School | 654 (77.6%) | 9 (1.1%) |
| High School Diploma | 1,734 (68.0%) | 76 (3.0%) |
| College / Associate Degree | 2,923 (75.9%) | 370 (9.6%) |
| Bachelor's Degree or higher | 31,309 (87.8%) | 998 (2.8%) |
| Total | 36,640 (85.4%) | 1,459 (3.4%) |
Employment Occupations by Sex in Newton
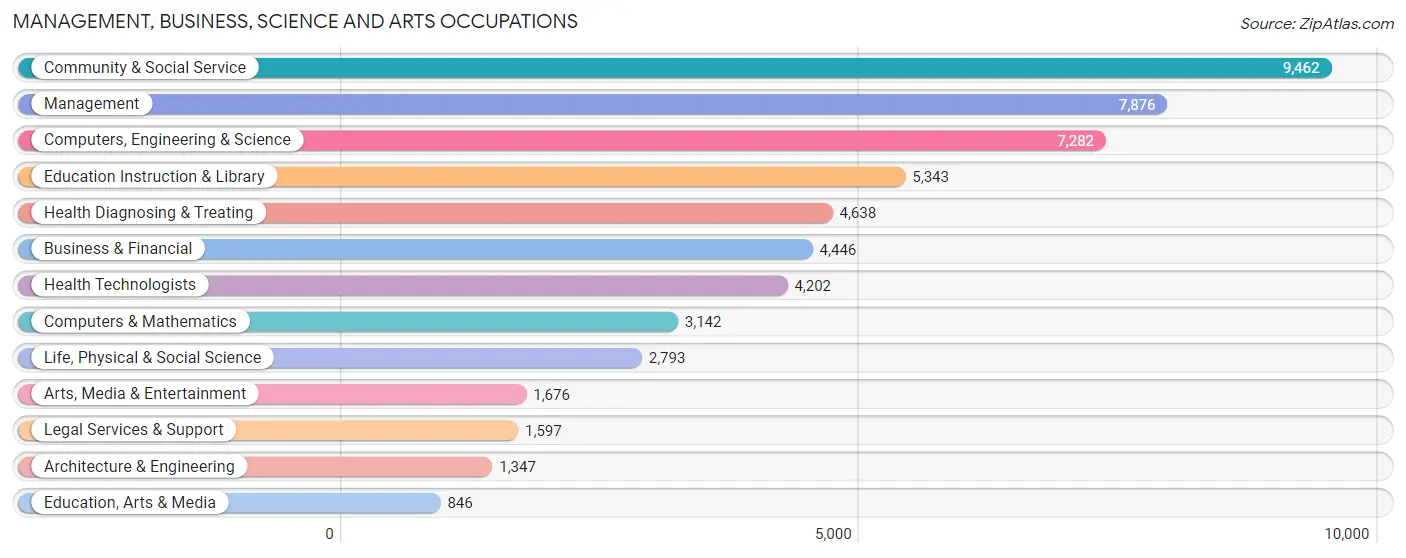
Management, Business, Science and Arts Occupations
The most common Management, Business, Science and Arts occupations in Newton are Community & Social Service (9,462 | 20.6%), Management (7,876 | 17.1%), Computers, Engineering & Science (7,282 | 15.8%), Education Instruction & Library (5,343 | 11.6%), and Health Diagnosing & Treating (4,638 | 10.1%).
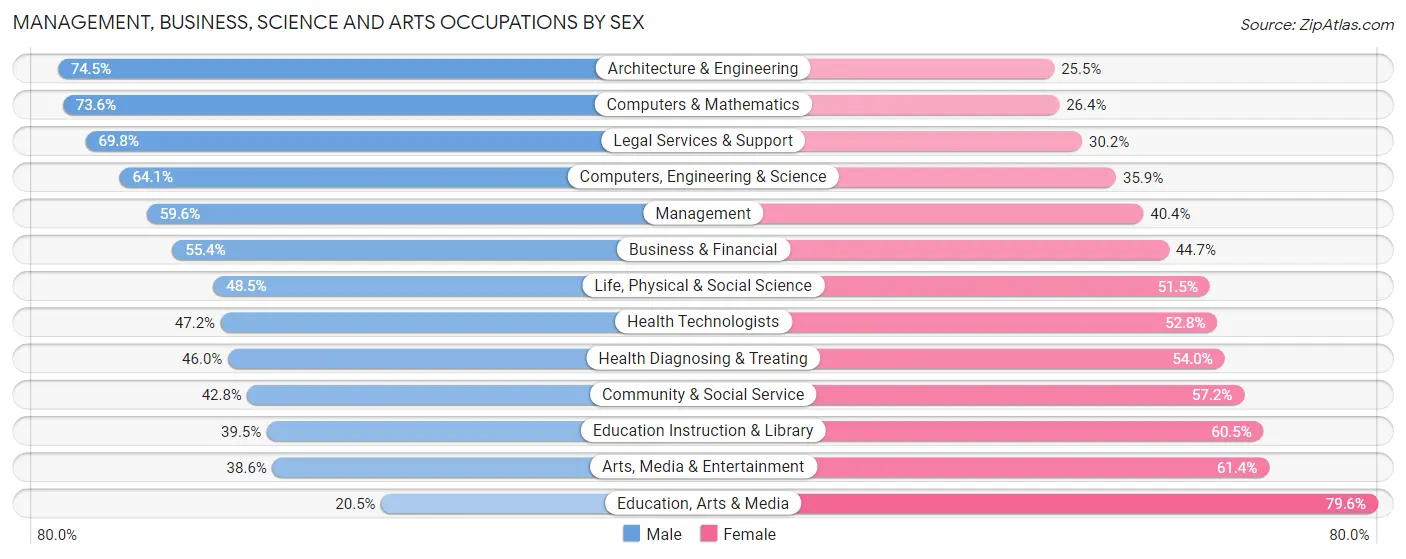
Management, Business, Science and Arts Occupations by Sex
Within the Management, Business, Science and Arts occupations in Newton, the most male-oriented occupations are Architecture & Engineering (74.5%), Computers & Mathematics (73.6%), and Legal Services & Support (69.8%), while the most female-oriented occupations are Education, Arts & Media (79.5%), Arts, Media & Entertainment (61.4%), and Education Instruction & Library (60.5%).
| Occupation | Male | Female |
| Management | 4,693 (59.6%) | 3,183 (40.4%) |
| Business & Financial | 2,461 (55.3%) | 1,985 (44.7%) |
| Computers, Engineering & Science | 4,671 (64.1%) | 2,611 (35.9%) |
| Computers & Mathematics | 2,313 (73.6%) | 829 (26.4%) |
| Architecture & Engineering | 1,003 (74.5%) | 344 (25.5%) |
| Life, Physical & Social Science | 1,355 (48.5%) | 1,438 (51.5%) |
| Community & Social Service | 4,047 (42.8%) | 5,415 (57.2%) |
| Education, Arts & Media | 173 (20.4%) | 673 (79.5%) |
| Legal Services & Support | 1,115 (69.8%) | 482 (30.2%) |
| Education Instruction & Library | 2,112 (39.5%) | 3,231 (60.5%) |
| Arts, Media & Entertainment | 647 (38.6%) | 1,029 (61.4%) |
| Health Diagnosing & Treating | 2,135 (46.0%) | 2,503 (54.0%) |
| Health Technologists | 1,985 (47.2%) | 2,217 (52.8%) |
| Total (Category) | 18,007 (53.4%) | 15,697 (46.6%) |
| Total (Overall) | 24,271 (52.8%) | 21,733 (47.2%) |
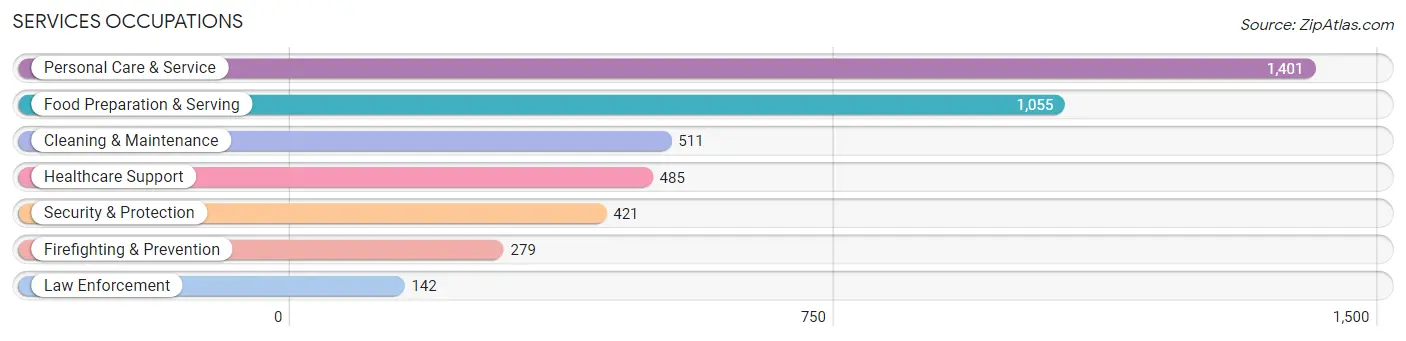
Services Occupations
The most common Services occupations in Newton are Personal Care & Service (1,401 | 3.0%), Food Preparation & Serving (1,055 | 2.3%), Cleaning & Maintenance (511 | 1.1%), Healthcare Support (485 | 1.1%), and Security & Protection (421 | 0.9%).
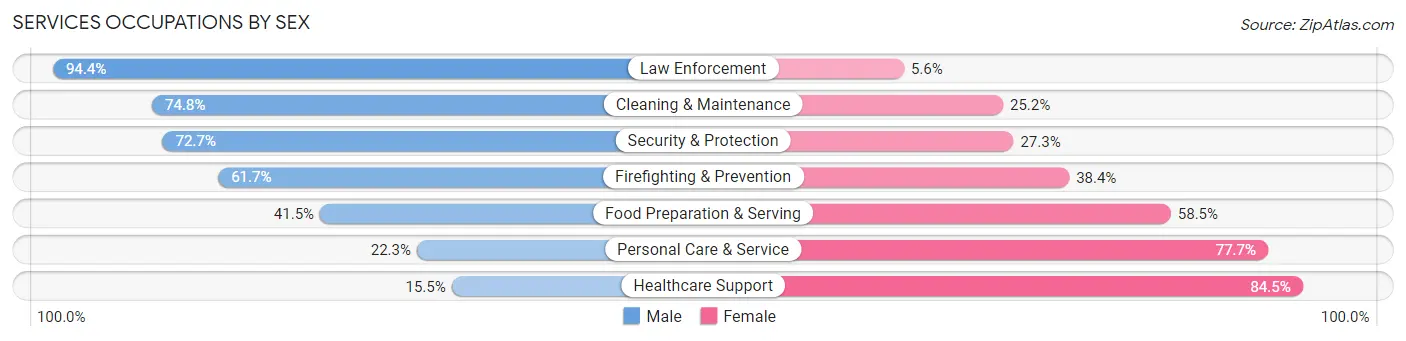
Services Occupations by Sex
Within the Services occupations in Newton, the most male-oriented occupations are Law Enforcement (94.4%), Cleaning & Maintenance (74.8%), and Security & Protection (72.7%), while the most female-oriented occupations are Healthcare Support (84.5%), Personal Care & Service (77.7%), and Food Preparation & Serving (58.5%).
| Occupation | Male | Female |
| Healthcare Support | 75 (15.5%) | 410 (84.5%) |
| Security & Protection | 306 (72.7%) | 115 (27.3%) |
| Firefighting & Prevention | 172 (61.7%) | 107 (38.4%) |
| Law Enforcement | 134 (94.4%) | 8 (5.6%) |
| Food Preparation & Serving | 438 (41.5%) | 617 (58.5%) |
| Cleaning & Maintenance | 382 (74.8%) | 129 (25.2%) |
| Personal Care & Service | 313 (22.3%) | 1,088 (77.7%) |
| Total (Category) | 1,514 (39.1%) | 2,359 (60.9%) |
| Total (Overall) | 24,271 (52.8%) | 21,733 (47.2%) |
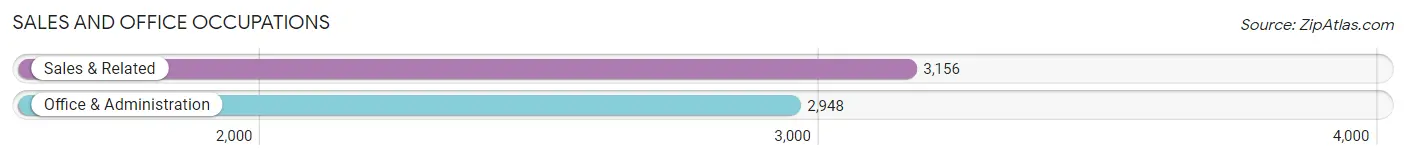
Sales and Office Occupations
The most common Sales and Office occupations in Newton are Sales & Related (3,156 | 6.9%), and Office & Administration (2,948 | 6.4%).
Sales and Office Occupations by Sex
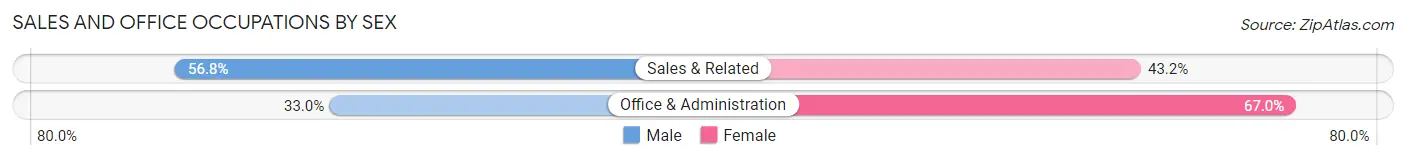
| Occupation | Male | Female |
| Sales & Related | 1,794 (56.8%) | 1,362 (43.2%) |
| Office & Administration | 973 (33.0%) | 1,975 (67.0%) |
| Total (Category) | 2,767 (45.3%) | 3,337 (54.7%) |
| Total (Overall) | 24,271 (52.8%) | 21,733 (47.2%) |
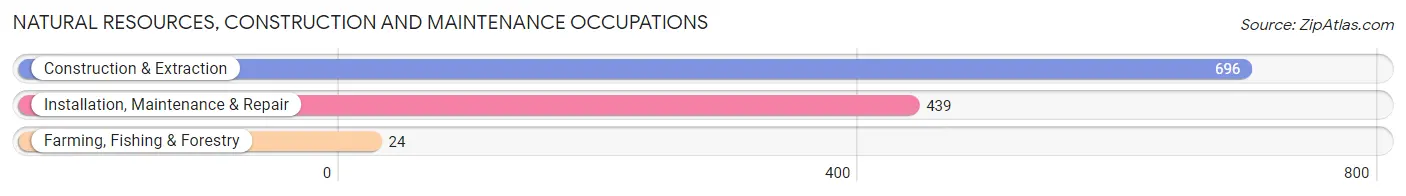
Natural Resources, Construction and Maintenance Occupations
The most common Natural Resources, Construction and Maintenance occupations in Newton are Construction & Extraction (696 | 1.5%), Installation, Maintenance & Repair (439 | 0.9%), and Farming, Fishing & Forestry (24 | 0.1%).
Natural Resources, Construction and Maintenance Occupations by Sex
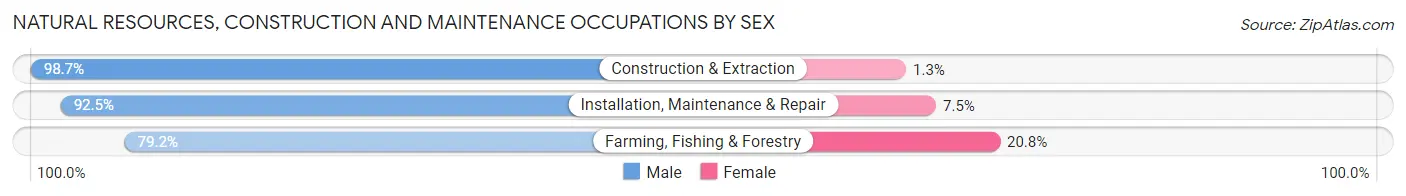
| Occupation | Male | Female |
| Farming, Fishing & Forestry | 19 (79.2%) | 5 (20.8%) |
| Construction & Extraction | 687 (98.7%) | 9 (1.3%) |
| Installation, Maintenance & Repair | 406 (92.5%) | 33 (7.5%) |
| Total (Category) | 1,112 (95.9%) | 47 (4.1%) |
| Total (Overall) | 24,271 (52.8%) | 21,733 (47.2%) |
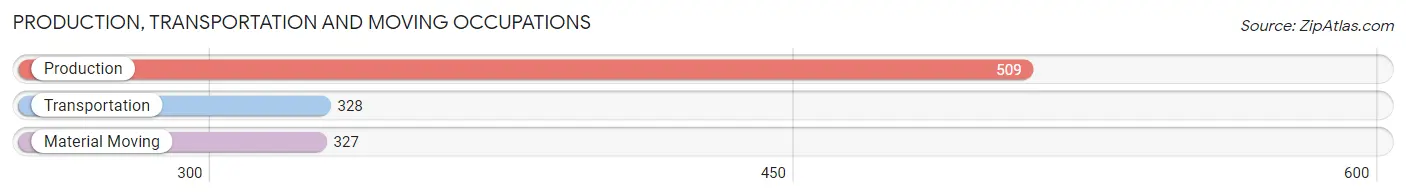
Production, Transportation and Moving Occupations
The most common Production, Transportation and Moving occupations in Newton are Production (509 | 1.1%), Transportation (328 | 0.7%), and Material Moving (327 | 0.7%).
Production, Transportation and Moving Occupations by Sex
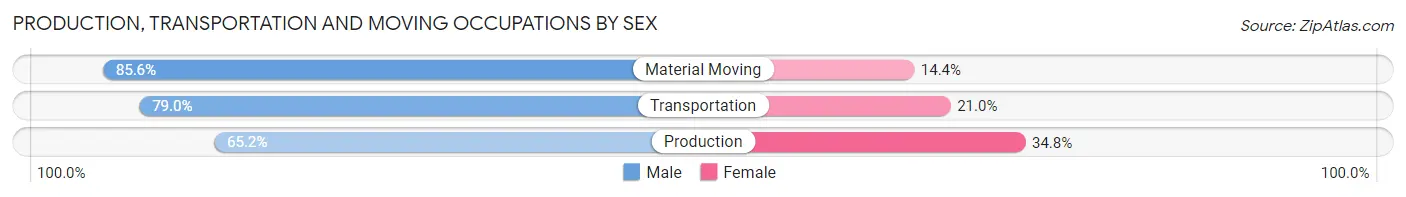
| Occupation | Male | Female |
| Production | 332 (65.2%) | 177 (34.8%) |
| Transportation | 259 (79.0%) | 69 (21.0%) |
| Material Moving | 280 (85.6%) | 47 (14.4%) |
| Total (Category) | 871 (74.8%) | 293 (25.2%) |
| Total (Overall) | 24,271 (52.8%) | 21,733 (47.2%) |
Employment Industries by Sex in Newton
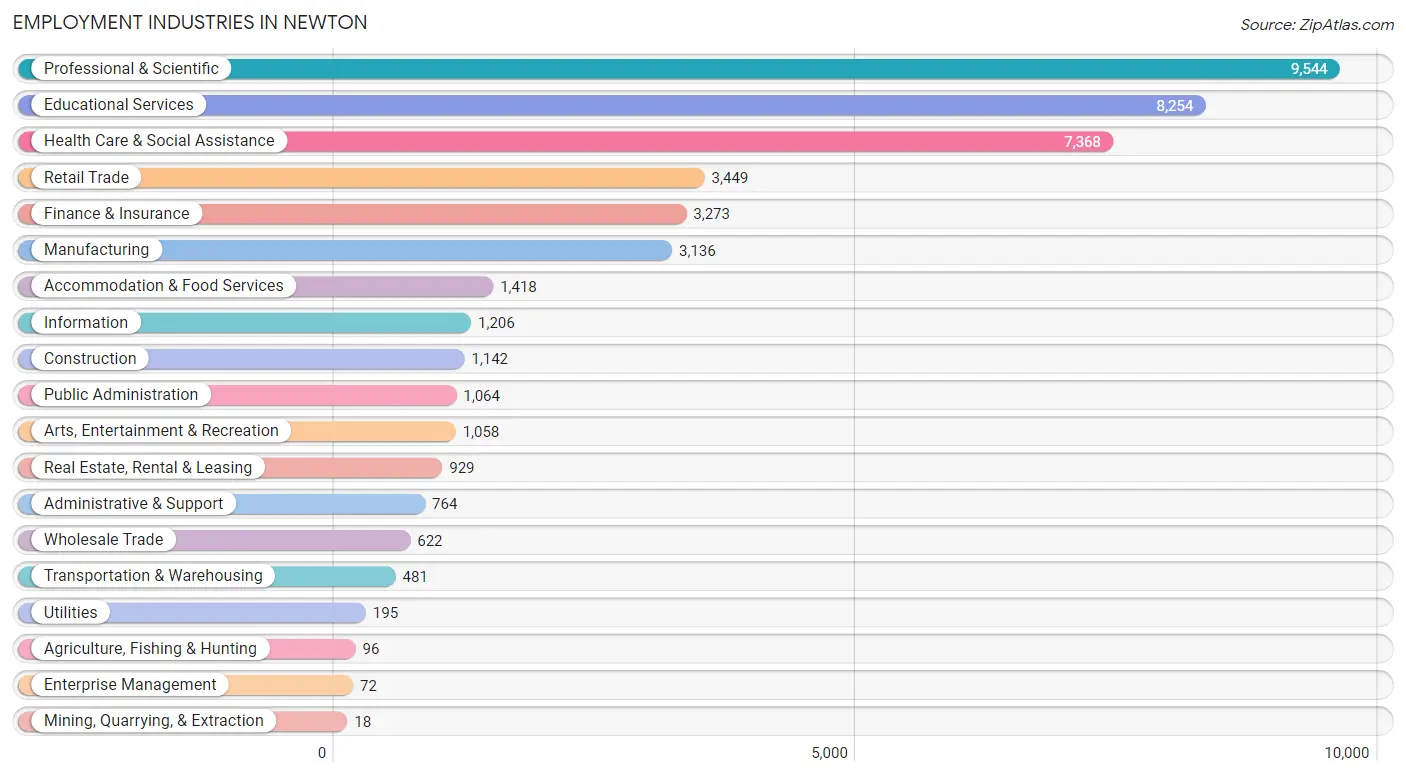
Employment Industries in Newton
The major employment industries in Newton include Professional & Scientific (9,544 | 20.7%), Educational Services (8,254 | 17.9%), Health Care & Social Assistance (7,368 | 16.0%), Retail Trade (3,449 | 7.5%), and Finance & Insurance (3,273 | 7.1%).
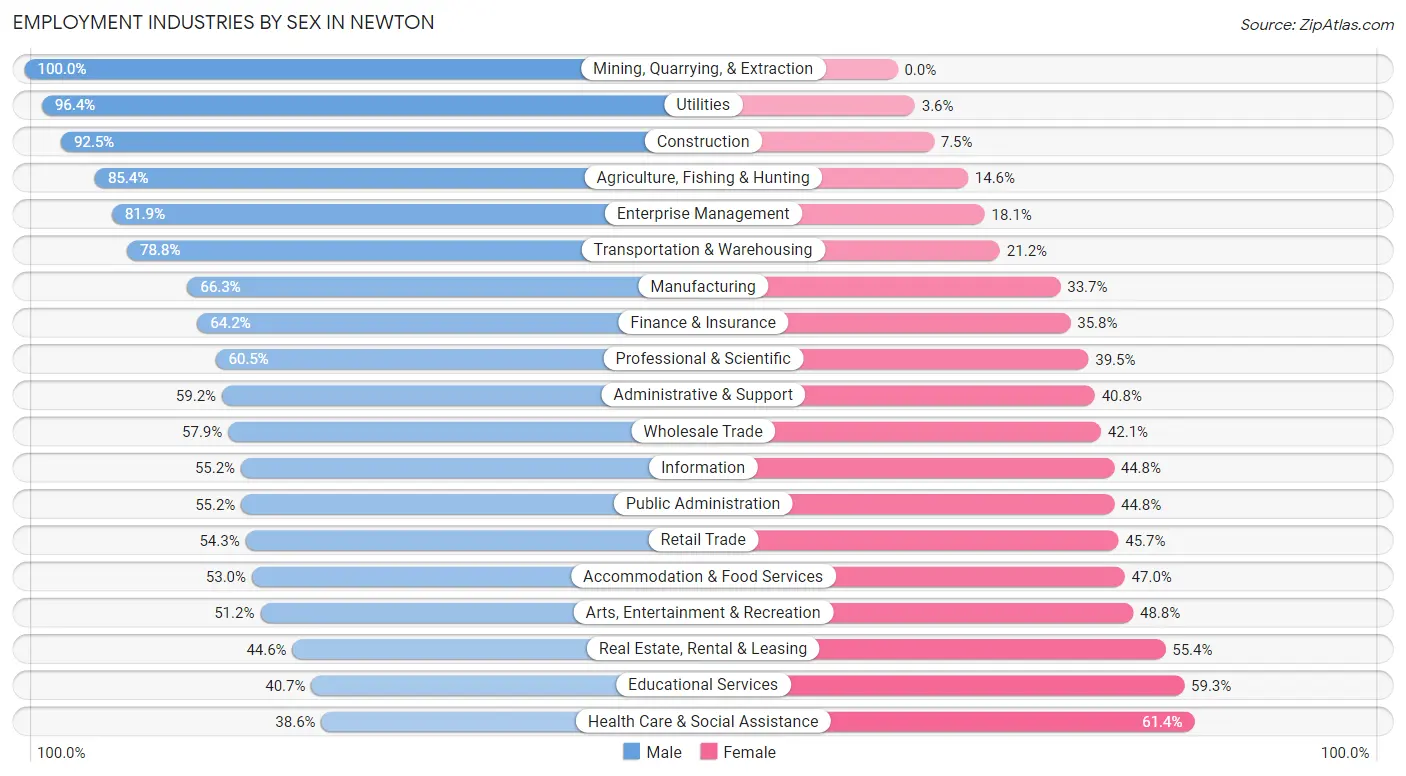
Employment Industries by Sex in Newton
The Newton industries that see more men than women are Mining, Quarrying, & Extraction (100.0%), Utilities (96.4%), and Construction (92.5%), whereas the industries that tend to have a higher number of women are Health Care & Social Assistance (61.4%), Educational Services (59.3%), and Real Estate, Rental & Leasing (55.4%).
| Industry | Male | Female |
| Agriculture, Fishing & Hunting | 82 (85.4%) | 14 (14.6%) |
| Mining, Quarrying, & Extraction | 18 (100.0%) | 0 (0.0%) |
| Construction | 1,056 (92.5%) | 86 (7.5%) |
| Manufacturing | 2,079 (66.3%) | 1,057 (33.7%) |
| Wholesale Trade | 360 (57.9%) | 262 (42.1%) |
| Retail Trade | 1,872 (54.3%) | 1,577 (45.7%) |
| Transportation & Warehousing | 379 (78.8%) | 102 (21.2%) |
| Utilities | 188 (96.4%) | 7 (3.6%) |
| Information | 666 (55.2%) | 540 (44.8%) |
| Finance & Insurance | 2,102 (64.2%) | 1,171 (35.8%) |
| Real Estate, Rental & Leasing | 414 (44.6%) | 515 (55.4%) |
| Professional & Scientific | 5,773 (60.5%) | 3,771 (39.5%) |
| Enterprise Management | 59 (81.9%) | 13 (18.1%) |
| Administrative & Support | 452 (59.2%) | 312 (40.8%) |
| Educational Services | 3,356 (40.7%) | 4,898 (59.3%) |
| Health Care & Social Assistance | 2,841 (38.6%) | 4,527 (61.4%) |
| Arts, Entertainment & Recreation | 542 (51.2%) | 516 (48.8%) |
| Accommodation & Food Services | 751 (53.0%) | 667 (47.0%) |
| Public Administration | 587 (55.2%) | 477 (44.8%) |
| Total | 24,271 (52.8%) | 21,733 (47.2%) |
Education in Newton
School Enrollment in Newton
The most common levels of schooling among the 26,584 students in Newton are college / undergraduate (7,897 | 29.7%), high school (5,488 | 20.6%), and middle school (4,555 | 17.1%).
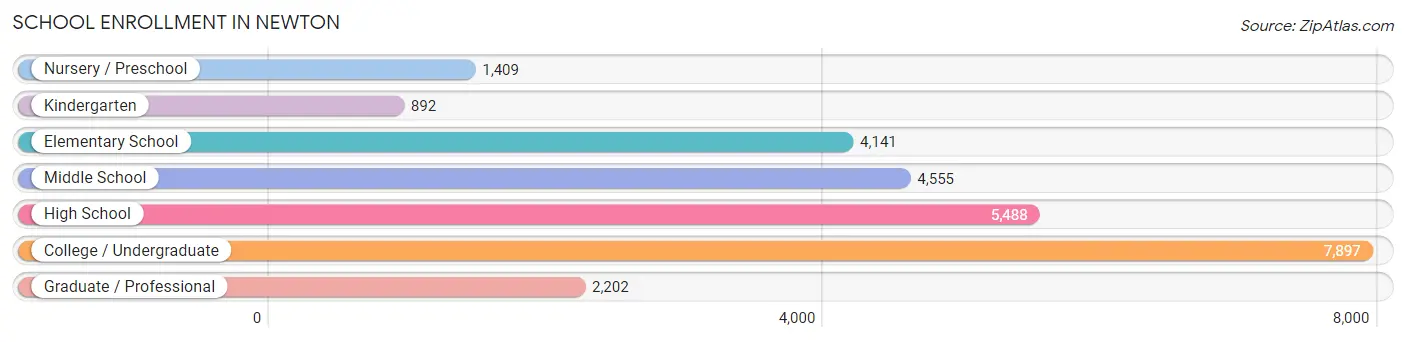
| School Level | # Students | % Students |
| Nursery / Preschool | 1,409 | 5.3% |
| Kindergarten | 892 | 3.4% |
| Elementary School | 4,141 | 15.6% |
| Middle School | 4,555 | 17.1% |
| High School | 5,488 | 20.6% |
| College / Undergraduate | 7,897 | 29.7% |
| Graduate / Professional | 2,202 | 8.3% |
| Total | 26,584 | 100.0% |
School Enrollment by Age by Funding Source in Newton
Out of a total of 26,584 students who are enrolled in schools in Newton, 12,415 (46.7%) attend a private institution, while the remaining 14,169 (53.3%) are enrolled in public schools. The age group of 20 to 24 year olds has the highest likelihood of being enrolled in private schools, with 3,731 (86.5% in the age bracket) enrolled. Conversely, the age group of 5 to 9 year old has the lowest likelihood of being enrolled in a private school, with 3,952 (82.4% in the age bracket) attending a public institution.
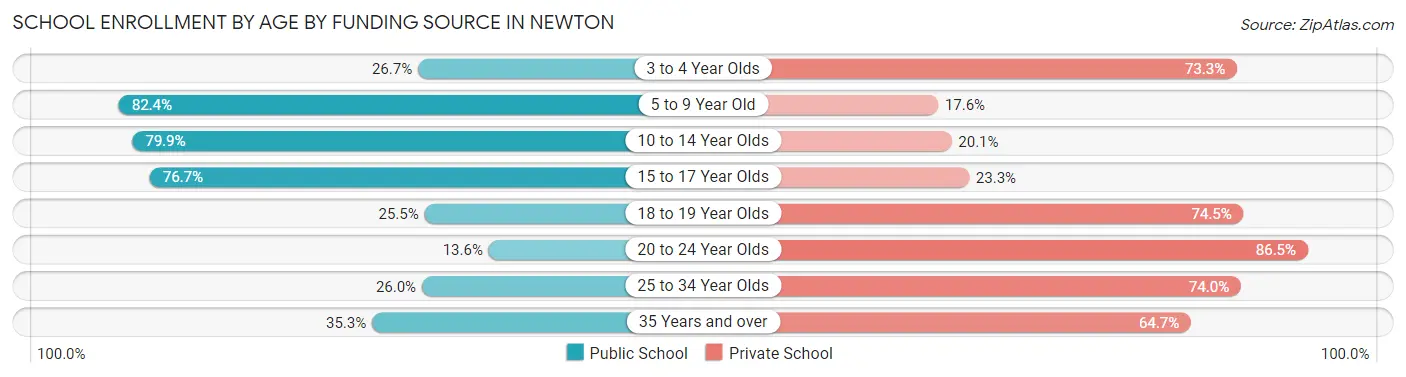
| Age Bracket | Public School | Private School |
| 3 to 4 Year Olds | 313 (26.7%) | 858 (73.3%) |
| 5 to 9 Year Old | 3,952 (82.4%) | 842 (17.6%) |
| 10 to 14 Year Olds | 4,470 (79.9%) | 1,122 (20.1%) |
| 15 to 17 Year Olds | 2,981 (76.7%) | 907 (23.3%) |
| 18 to 19 Year Olds | 1,116 (25.5%) | 3,259 (74.5%) |
| 20 to 24 Year Olds | 585 (13.6%) | 3,731 (86.5%) |
| 25 to 34 Year Olds | 335 (26.0%) | 954 (74.0%) |
| 35 Years and over | 409 (35.3%) | 750 (64.7%) |
| Total | 14,169 (53.3%) | 12,415 (46.7%) |
Educational Attainment by Field of Study in Newton
Social sciences (7,058 | 13.4%), business (5,757 | 10.9%), bio, nature & agricultural (5,068 | 9.6%), engineering (4,897 | 9.3%), and literature & languages (4,267 | 8.1%) are the most common fields of study among 52,642 individuals in Newton who have obtained a bachelor's degree or higher.
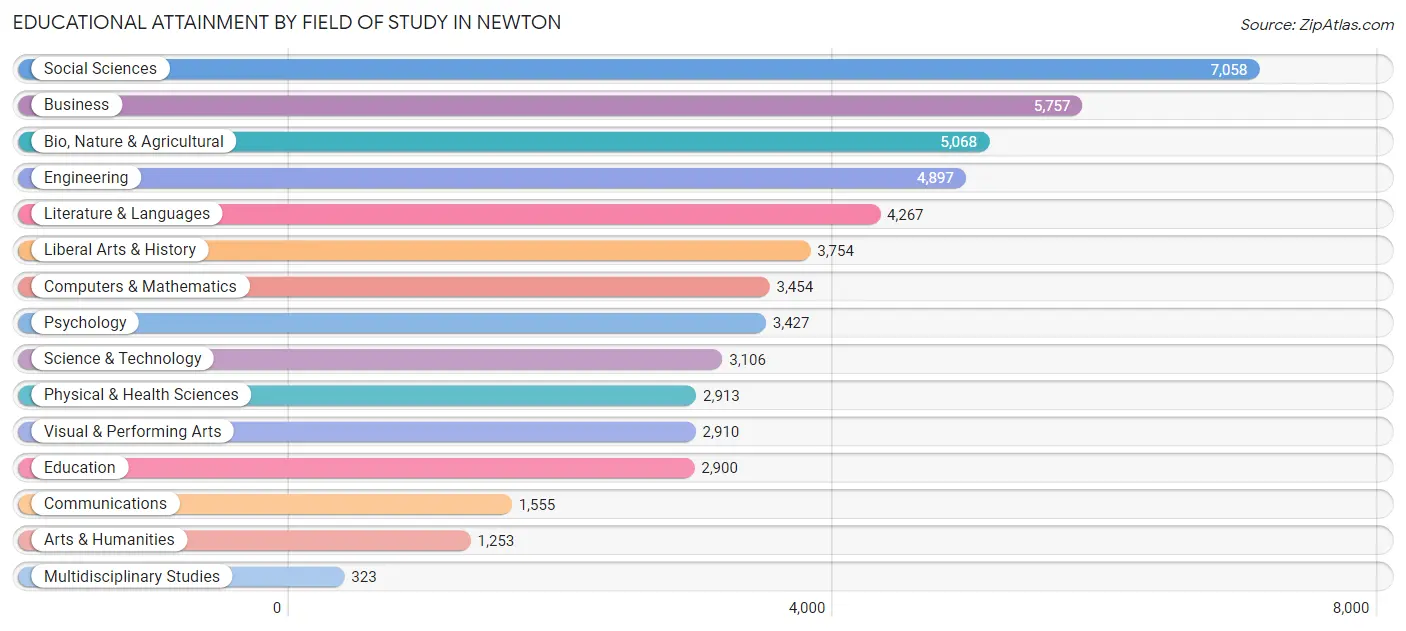
| Field of Study | # Graduates | % Graduates |
| Computers & Mathematics | 3,454 | 6.6% |
| Bio, Nature & Agricultural | 5,068 | 9.6% |
| Physical & Health Sciences | 2,913 | 5.5% |
| Psychology | 3,427 | 6.5% |
| Social Sciences | 7,058 | 13.4% |
| Engineering | 4,897 | 9.3% |
| Multidisciplinary Studies | 323 | 0.6% |
| Science & Technology | 3,106 | 5.9% |
| Business | 5,757 | 10.9% |
| Education | 2,900 | 5.5% |
| Literature & Languages | 4,267 | 8.1% |
| Liberal Arts & History | 3,754 | 7.1% |
| Visual & Performing Arts | 2,910 | 5.5% |
| Communications | 1,555 | 2.9% |
| Arts & Humanities | 1,253 | 2.4% |
| Total | 52,642 | 100.0% |
Transportation & Commute in Newton
Vehicle Availability by Sex in Newton
The most prevalent vehicle ownership categories in Newton are males with 2 vehicles (12,291, accounting for 52.5%) and females with 2 vehicles (10,278, making up 62.3%).
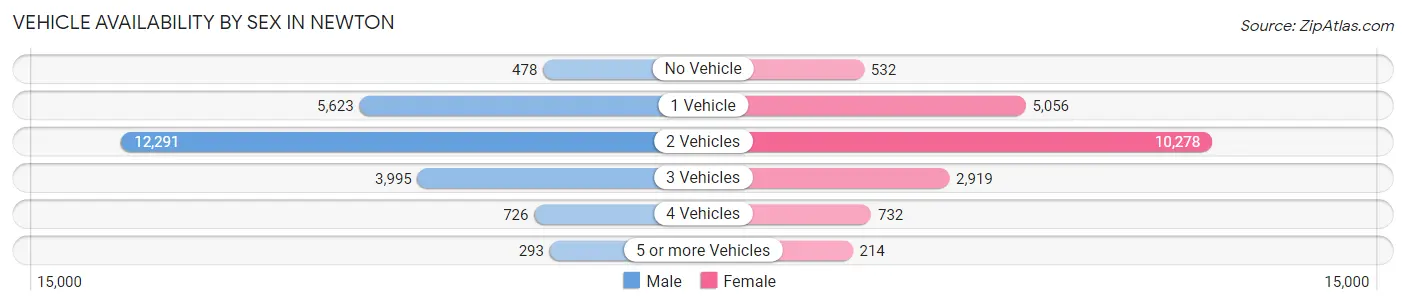
| Vehicles Available | Male | Female |
| No Vehicle | 478 (2.0%) | 532 (2.7%) |
| 1 Vehicle | 5,623 (24.0%) | 5,056 (25.6%) |
| 2 Vehicles | 12,291 (52.5%) | 10,278 (52.1%) |
| 3 Vehicles | 3,995 (17.1%) | 2,919 (14.8%) |
| 4 Vehicles | 726 (3.1%) | 732 (3.7%) |
| 5 or more Vehicles | 293 (1.3%) | 214 (1.1%) |
| Total | 23,406 (100.0%) | 19,731 (100.0%) |
Commute Time in Newton
The most frequently occuring commute durations in Newton are 30 to 34 minutes (5,158 commuters, 15.2%), 20 to 24 minutes (4,786 commuters, 14.1%), and 15 to 19 minutes (4,186 commuters, 12.4%).
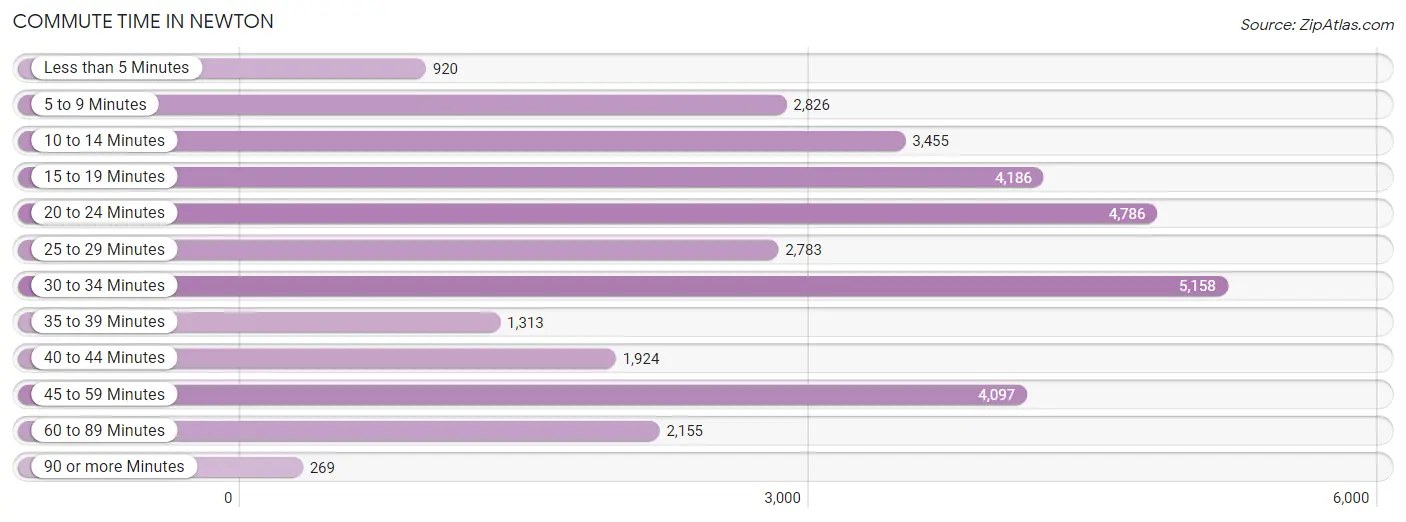
| Commute Time | # Commuters | % Commuters |
| Less than 5 Minutes | 920 | 2.7% |
| 5 to 9 Minutes | 2,826 | 8.3% |
| 10 to 14 Minutes | 3,455 | 10.2% |
| 15 to 19 Minutes | 4,186 | 12.4% |
| 20 to 24 Minutes | 4,786 | 14.1% |
| 25 to 29 Minutes | 2,783 | 8.2% |
| 30 to 34 Minutes | 5,158 | 15.2% |
| 35 to 39 Minutes | 1,313 | 3.9% |
| 40 to 44 Minutes | 1,924 | 5.7% |
| 45 to 59 Minutes | 4,097 | 12.1% |
| 60 to 89 Minutes | 2,155 | 6.4% |
| 90 or more Minutes | 269 | 0.8% |
Commute Time by Sex in Newton
The most common commute times in Newton are 30 to 34 minutes (2,962 commuters, 16.3%) for males and 20 to 24 minutes (2,227 commuters, 14.2%) for females.
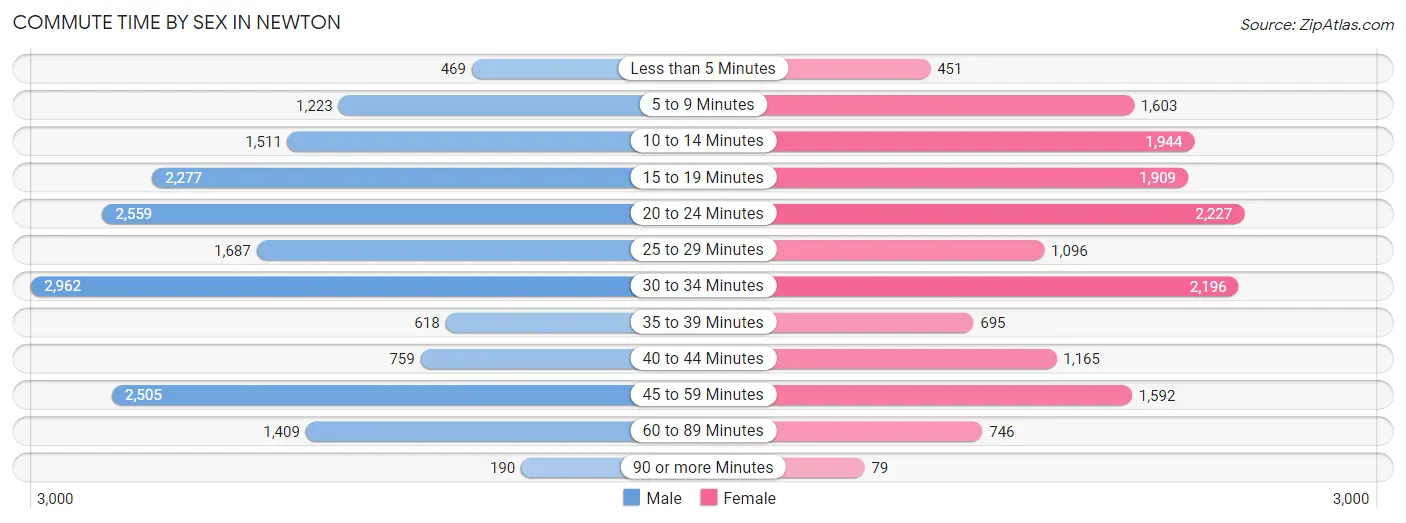
| Commute Time | Male | Female |
| Less than 5 Minutes | 469 (2.6%) | 451 (2.9%) |
| 5 to 9 Minutes | 1,223 (6.7%) | 1,603 (10.2%) |
| 10 to 14 Minutes | 1,511 (8.3%) | 1,944 (12.4%) |
| 15 to 19 Minutes | 2,277 (12.5%) | 1,909 (12.2%) |
| 20 to 24 Minutes | 2,559 (14.1%) | 2,227 (14.2%) |
| 25 to 29 Minutes | 1,687 (9.3%) | 1,096 (7.0%) |
| 30 to 34 Minutes | 2,962 (16.3%) | 2,196 (14.0%) |
| 35 to 39 Minutes | 618 (3.4%) | 695 (4.4%) |
| 40 to 44 Minutes | 759 (4.2%) | 1,165 (7.4%) |
| 45 to 59 Minutes | 2,505 (13.8%) | 1,592 (10.1%) |
| 60 to 89 Minutes | 1,409 (7.7%) | 746 (4.8%) |
| 90 or more Minutes | 190 (1.1%) | 79 (0.5%) |
Time of Departure to Work by Sex in Newton
The most frequent times of departure to work in Newton are 8:00 AM to 8:29 AM (3,289, 18.1%) for males and 8:00 AM to 8:29 AM (2,873, 18.3%) for females.
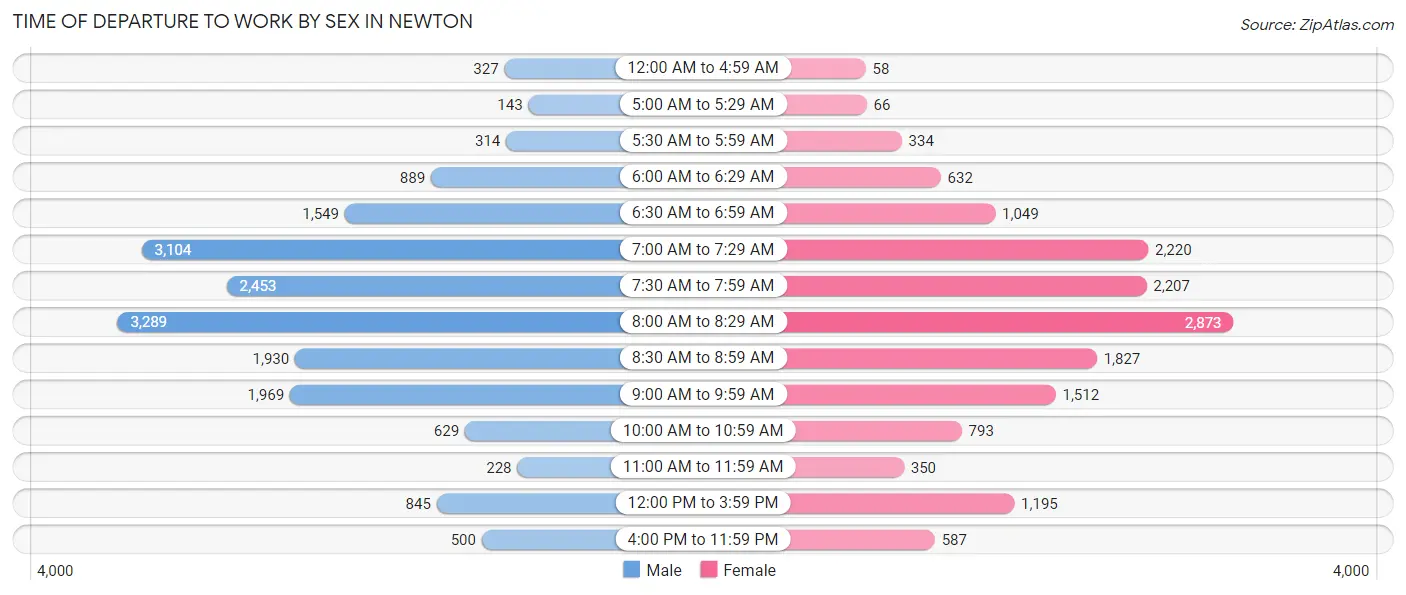
| Time of Departure | Male | Female |
| 12:00 AM to 4:59 AM | 327 (1.8%) | 58 (0.4%) |
| 5:00 AM to 5:29 AM | 143 (0.8%) | 66 (0.4%) |
| 5:30 AM to 5:59 AM | 314 (1.7%) | 334 (2.1%) |
| 6:00 AM to 6:29 AM | 889 (4.9%) | 632 (4.0%) |
| 6:30 AM to 6:59 AM | 1,549 (8.5%) | 1,049 (6.7%) |
| 7:00 AM to 7:29 AM | 3,104 (17.1%) | 2,220 (14.1%) |
| 7:30 AM to 7:59 AM | 2,453 (13.5%) | 2,207 (14.1%) |
| 8:00 AM to 8:29 AM | 3,289 (18.1%) | 2,873 (18.3%) |
| 8:30 AM to 8:59 AM | 1,930 (10.6%) | 1,827 (11.6%) |
| 9:00 AM to 9:59 AM | 1,969 (10.8%) | 1,512 (9.6%) |
| 10:00 AM to 10:59 AM | 629 (3.5%) | 793 (5.1%) |
| 11:00 AM to 11:59 AM | 228 (1.3%) | 350 (2.2%) |
| 12:00 PM to 3:59 PM | 845 (4.6%) | 1,195 (7.6%) |
| 4:00 PM to 11:59 PM | 500 (2.8%) | 587 (3.7%) |
| Total | 18,169 (100.0%) | 15,703 (100.0%) |
Housing Occupancy in Newton
Occupancy by Ownership in Newton
Of the total 31,735 dwellings in Newton, owner-occupied units account for 22,344 (70.4%), while renter-occupied units make up 9,391 (29.6%).
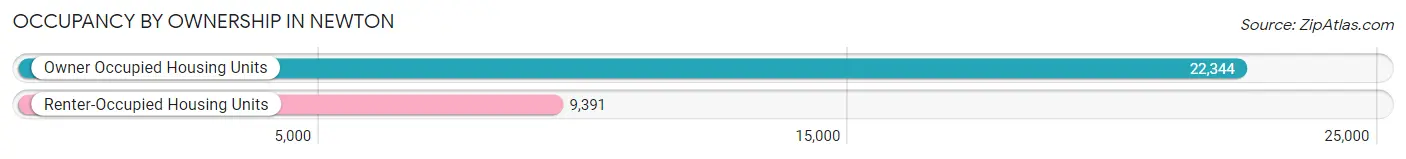
| Occupancy | # Housing Units | % Housing Units |
| Owner Occupied Housing Units | 22,344 | 70.4% |
| Renter-Occupied Housing Units | 9,391 | 29.6% |
| Total Occupied Housing Units | 31,735 | 100.0% |
Occupancy by Household Size in Newton
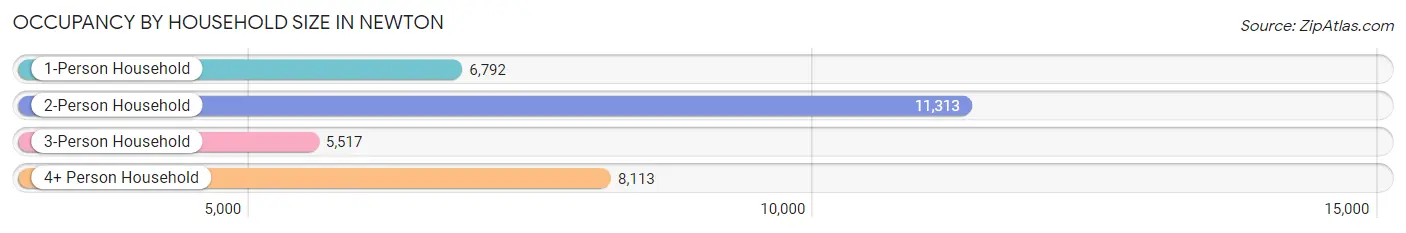
| Household Size | # Housing Units | % Housing Units |
| 1-Person Household | 6,792 | 21.4% |
| 2-Person Household | 11,313 | 35.6% |
| 3-Person Household | 5,517 | 17.4% |
| 4+ Person Household | 8,113 | 25.6% |
| Total Housing Units | 31,735 | 100.0% |
Occupancy by Ownership by Household Size in Newton
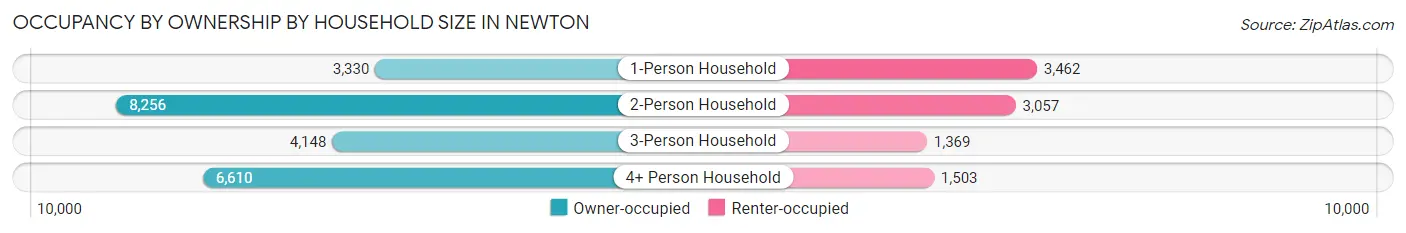
| Household Size | Owner-occupied | Renter-occupied |
| 1-Person Household | 3,330 (49.0%) | 3,462 (51.0%) |
| 2-Person Household | 8,256 (73.0%) | 3,057 (27.0%) |
| 3-Person Household | 4,148 (75.2%) | 1,369 (24.8%) |
| 4+ Person Household | 6,610 (81.5%) | 1,503 (18.5%) |
| Total Housing Units | 22,344 (70.4%) | 9,391 (29.6%) |
Occupancy by Educational Attainment in Newton
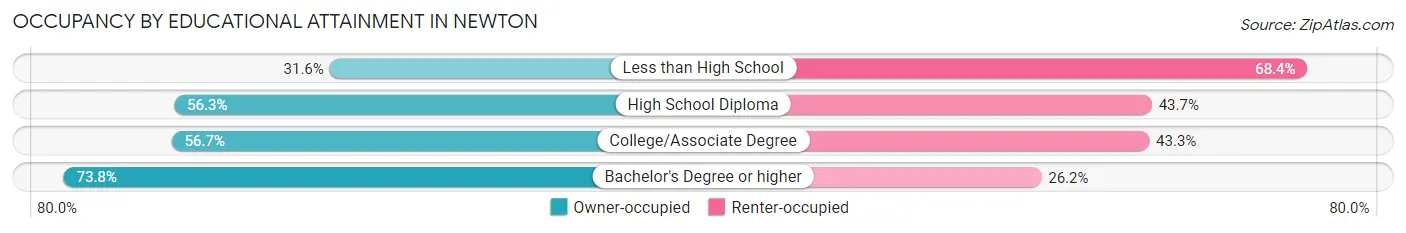
| Household Size | Owner-occupied | Renter-occupied |
| Less than High School | 184 (31.6%) | 398 (68.4%) |
| High School Diploma | 1,181 (56.3%) | 917 (43.7%) |
| College/Associate Degree | 1,549 (56.7%) | 1,183 (43.3%) |
| Bachelor's Degree or higher | 19,430 (73.8%) | 6,893 (26.2%) |
Occupancy by Age of Householder in Newton
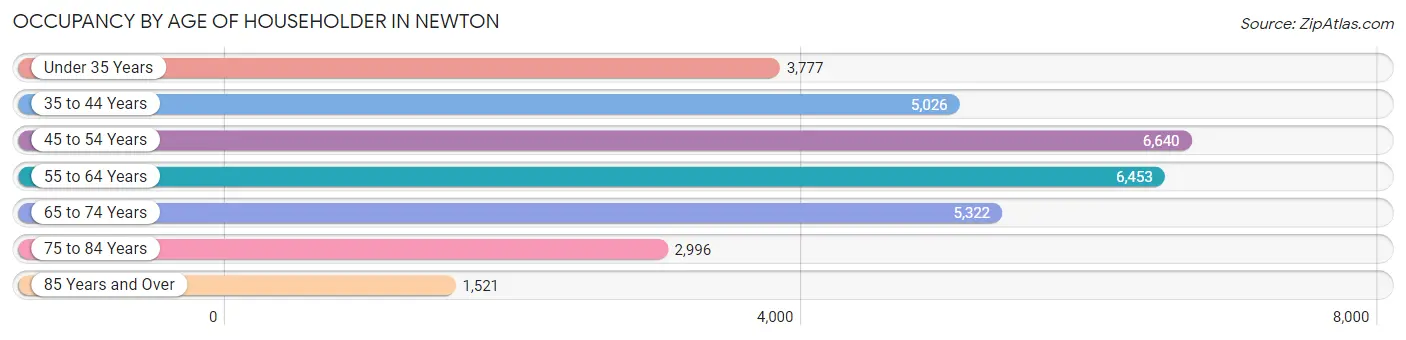
| Age Bracket | # Households | % Households |
| Under 35 Years | 3,777 | 11.9% |
| 35 to 44 Years | 5,026 | 15.8% |
| 45 to 54 Years | 6,640 | 20.9% |
| 55 to 64 Years | 6,453 | 20.3% |
| 65 to 74 Years | 5,322 | 16.8% |
| 75 to 84 Years | 2,996 | 9.4% |
| 85 Years and Over | 1,521 | 4.8% |
| Total | 31,735 | 100.0% |
Housing Finances in Newton
Median Income by Occupancy in Newton
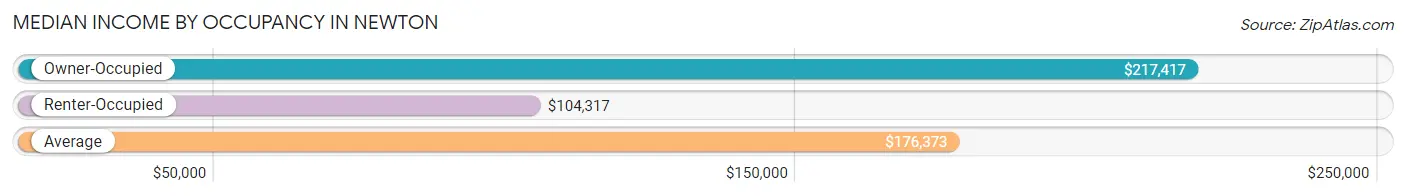
| Occupancy Type | # Households | Median Income |
| Owner-Occupied | 22,344 (70.4%) | $217,417 |
| Renter-Occupied | 9,391 (29.6%) | $104,317 |
| Average | 31,735 (100.0%) | $176,373 |
Occupancy by Householder Income Bracket in Newton
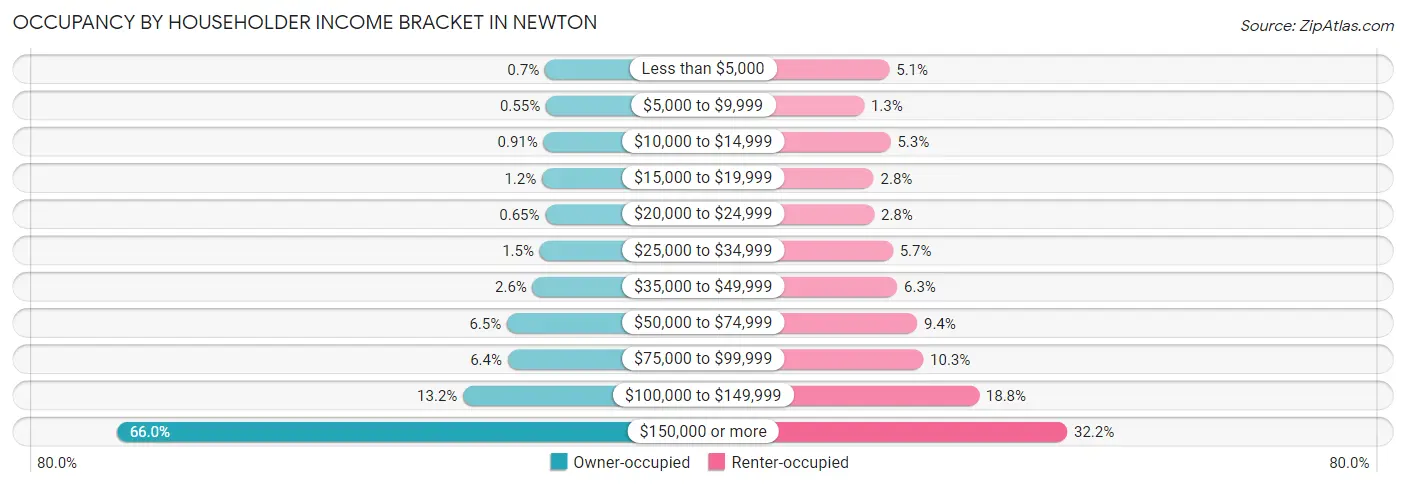
| Income Bracket | Owner-occupied | Renter-occupied |
| Less than $5,000 | 156 (0.7%) | 483 (5.1%) |
| $5,000 to $9,999 | 122 (0.5%) | 120 (1.3%) |
| $10,000 to $14,999 | 203 (0.9%) | 500 (5.3%) |
| $15,000 to $19,999 | 256 (1.1%) | 258 (2.8%) |
| $20,000 to $24,999 | 145 (0.6%) | 265 (2.8%) |
| $25,000 to $34,999 | 334 (1.5%) | 532 (5.7%) |
| $35,000 to $49,999 | 577 (2.6%) | 594 (6.3%) |
| $50,000 to $74,999 | 1,448 (6.5%) | 880 (9.4%) |
| $75,000 to $99,999 | 1,424 (6.4%) | 967 (10.3%) |
| $100,000 to $149,999 | 2,942 (13.2%) | 1,765 (18.8%) |
| $150,000 or more | 14,737 (66.0%) | 3,027 (32.2%) |
| Total | 22,344 (100.0%) | 9,391 (100.0%) |
Monthly Housing Cost Tiers in Newton
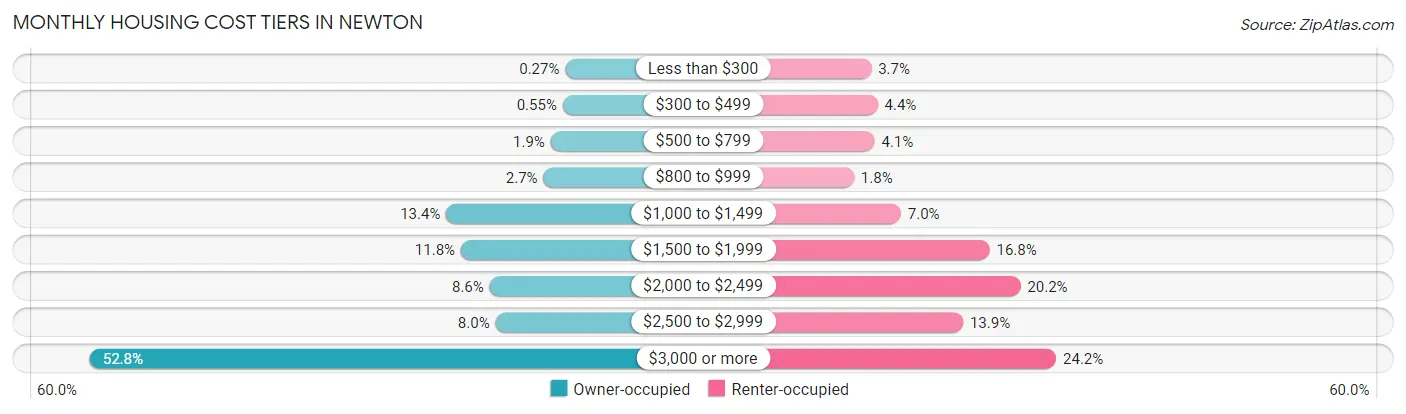
| Monthly Cost | Owner-occupied | Renter-occupied |
| Less than $300 | 60 (0.3%) | 350 (3.7%) |
| $300 to $499 | 124 (0.5%) | 417 (4.4%) |
| $500 to $799 | 419 (1.9%) | 385 (4.1%) |
| $800 to $999 | 598 (2.7%) | 171 (1.8%) |
| $1,000 to $1,499 | 2,998 (13.4%) | 658 (7.0%) |
| $1,500 to $1,999 | 2,637 (11.8%) | 1,579 (16.8%) |
| $2,000 to $2,499 | 1,929 (8.6%) | 1,899 (20.2%) |
| $2,500 to $2,999 | 1,784 (8.0%) | 1,303 (13.9%) |
| $3,000 or more | 11,795 (52.8%) | 2,269 (24.2%) |
| Total | 22,344 (100.0%) | 9,391 (100.0%) |
Physical Housing Characteristics in Newton
Housing Structures in Newton
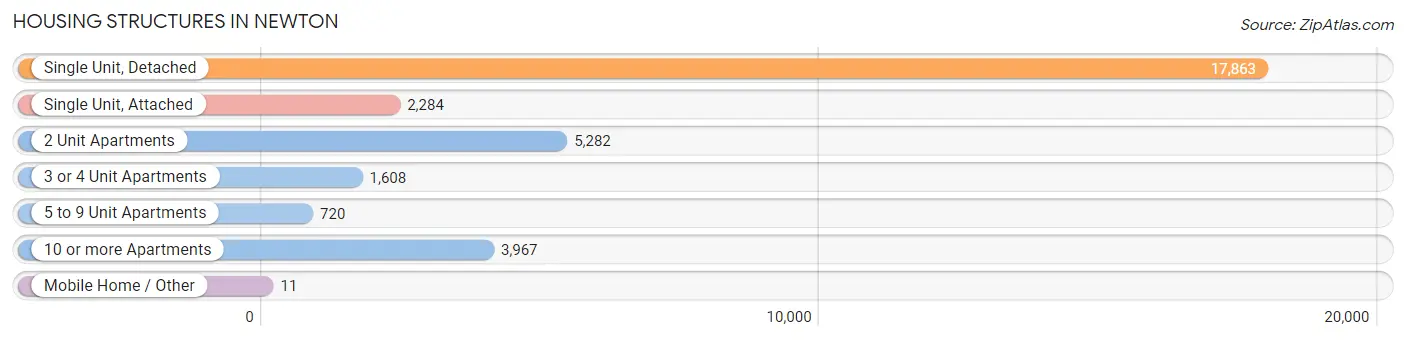
| Structure Type | # Housing Units | % Housing Units |
| Single Unit, Detached | 17,863 | 56.3% |
| Single Unit, Attached | 2,284 | 7.2% |
| 2 Unit Apartments | 5,282 | 16.6% |
| 3 or 4 Unit Apartments | 1,608 | 5.1% |
| 5 to 9 Unit Apartments | 720 | 2.3% |
| 10 or more Apartments | 3,967 | 12.5% |
| Mobile Home / Other | 11 | 0.0% |
| Total | 31,735 | 100.0% |
Housing Structures by Occupancy in Newton
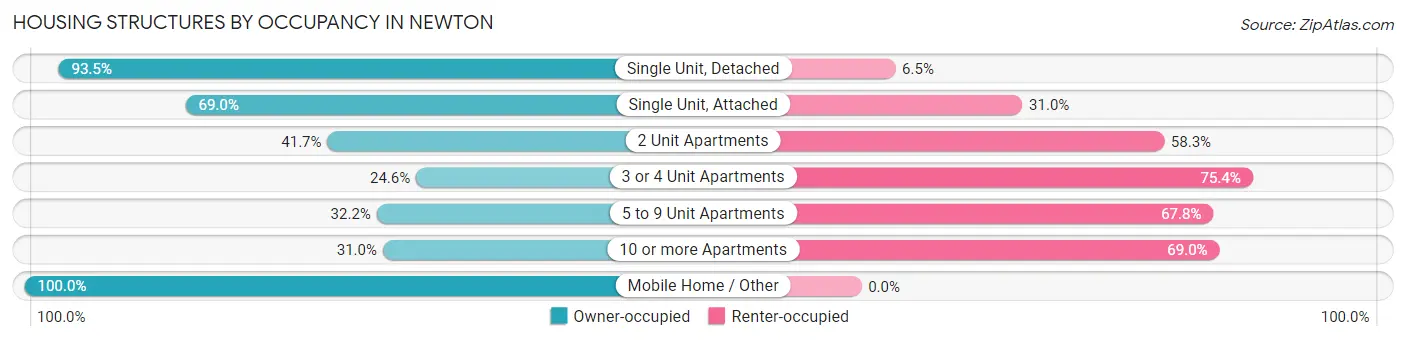
| Structure Type | Owner-occupied | Renter-occupied |
| Single Unit, Detached | 16,695 (93.5%) | 1,168 (6.5%) |
| Single Unit, Attached | 1,576 (69.0%) | 708 (31.0%) |
| 2 Unit Apartments | 2,203 (41.7%) | 3,079 (58.3%) |
| 3 or 4 Unit Apartments | 396 (24.6%) | 1,212 (75.4%) |
| 5 to 9 Unit Apartments | 232 (32.2%) | 488 (67.8%) |
| 10 or more Apartments | 1,231 (31.0%) | 2,736 (69.0%) |
| Mobile Home / Other | 11 (100.0%) | 0 (0.0%) |
| Total | 22,344 (70.4%) | 9,391 (29.6%) |
Housing Structures by Number of Rooms in Newton
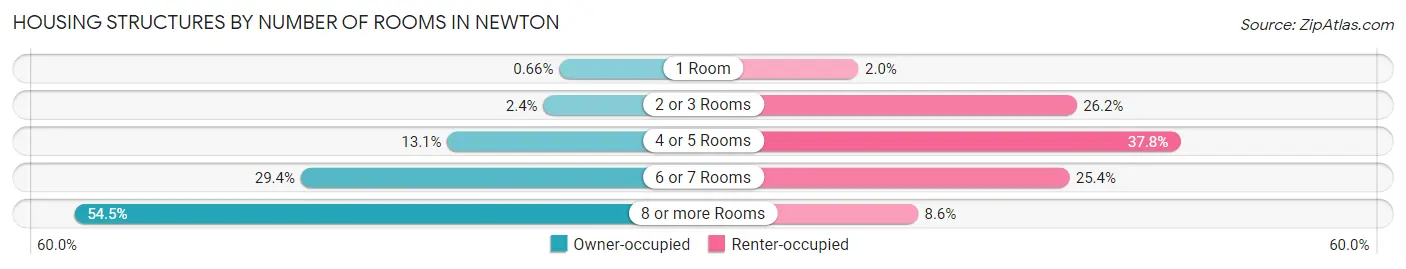
| Number of Rooms | Owner-occupied | Renter-occupied |
| 1 Room | 147 (0.7%) | 190 (2.0%) |
| 2 or 3 Rooms | 541 (2.4%) | 2,462 (26.2%) |
| 4 or 5 Rooms | 2,923 (13.1%) | 3,545 (37.8%) |
| 6 or 7 Rooms | 6,557 (29.3%) | 2,385 (25.4%) |
| 8 or more Rooms | 12,176 (54.5%) | 809 (8.6%) |
| Total | 22,344 (100.0%) | 9,391 (100.0%) |
Housing Structure by Heating Type in Newton
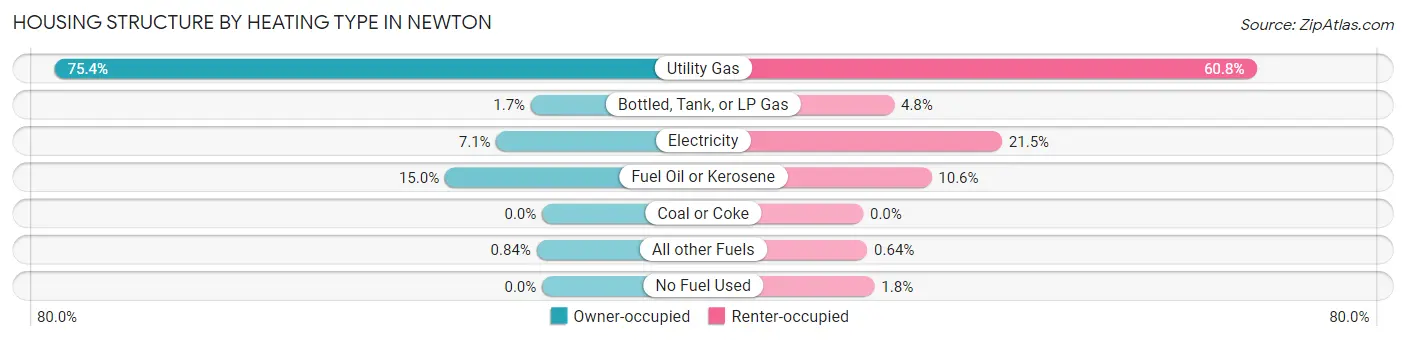
| Heating Type | Owner-occupied | Renter-occupied |
| Utility Gas | 16,837 (75.3%) | 5,708 (60.8%) |
| Bottled, Tank, or LP Gas | 387 (1.7%) | 450 (4.8%) |
| Electricity | 1,578 (7.1%) | 2,016 (21.5%) |
| Fuel Oil or Kerosene | 3,354 (15.0%) | 992 (10.6%) |
| Coal or Coke | 0 (0.0%) | 0 (0.0%) |
| All other Fuels | 188 (0.8%) | 60 (0.6%) |
| No Fuel Used | 0 (0.0%) | 165 (1.8%) |
| Total | 22,344 (100.0%) | 9,391 (100.0%) |
Household Vehicle Usage in Newton
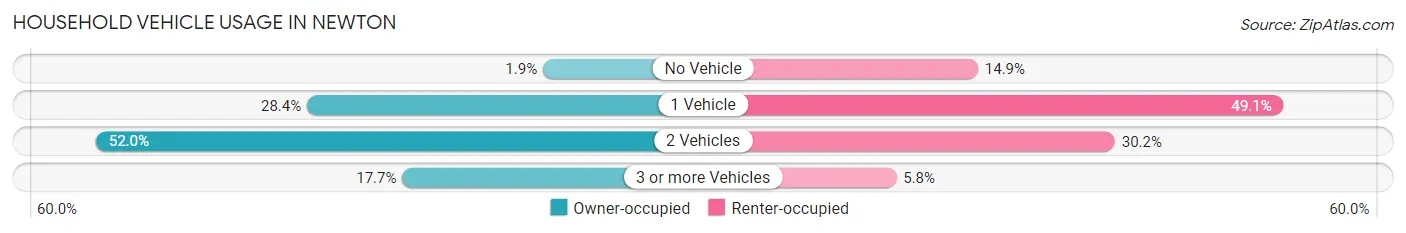
| Vehicles per Household | Owner-occupied | Renter-occupied |
| No Vehicle | 432 (1.9%) | 1,398 (14.9%) |
| 1 Vehicle | 6,336 (28.4%) | 4,614 (49.1%) |
| 2 Vehicles | 11,623 (52.0%) | 2,839 (30.2%) |
| 3 or more Vehicles | 3,953 (17.7%) | 540 (5.8%) |
| Total | 22,344 (100.0%) | 9,391 (100.0%) |
Real Estate & Mortgages in Newton
Real Estate and Mortgage Overview in Newton
| Characteristic | Without Mortgage | With Mortgage |
| Housing Units | 8,276 | 14,068 |
| Median Property Value | $1,097,500 | $1,163,600 |
| Median Household Income | $155,574 | $10,476 |
| Monthly Housing Costs | $1,501 | $11,013 |
| Real Estate Taxes | $10,001 | $47 |
Property Value by Mortgage Status in Newton
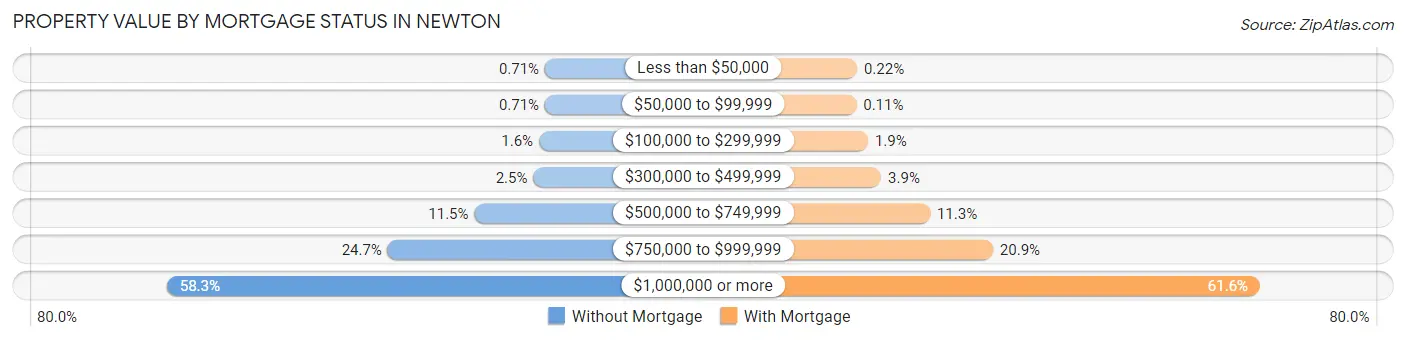
| Property Value | Without Mortgage | With Mortgage |
| Less than $50,000 | 59 (0.7%) | 31 (0.2%) |
| $50,000 to $99,999 | 59 (0.7%) | 15 (0.1%) |
| $100,000 to $299,999 | 134 (1.6%) | 266 (1.9%) |
| $300,000 to $499,999 | 206 (2.5%) | 548 (3.9%) |
| $500,000 to $749,999 | 949 (11.5%) | 1,596 (11.3%) |
| $750,000 to $999,999 | 2,042 (24.7%) | 2,945 (20.9%) |
| $1,000,000 or more | 4,827 (58.3%) | 8,667 (61.6%) |
| Total | 8,276 (100.0%) | 14,068 (100.0%) |
Household Income by Mortgage Status in Newton
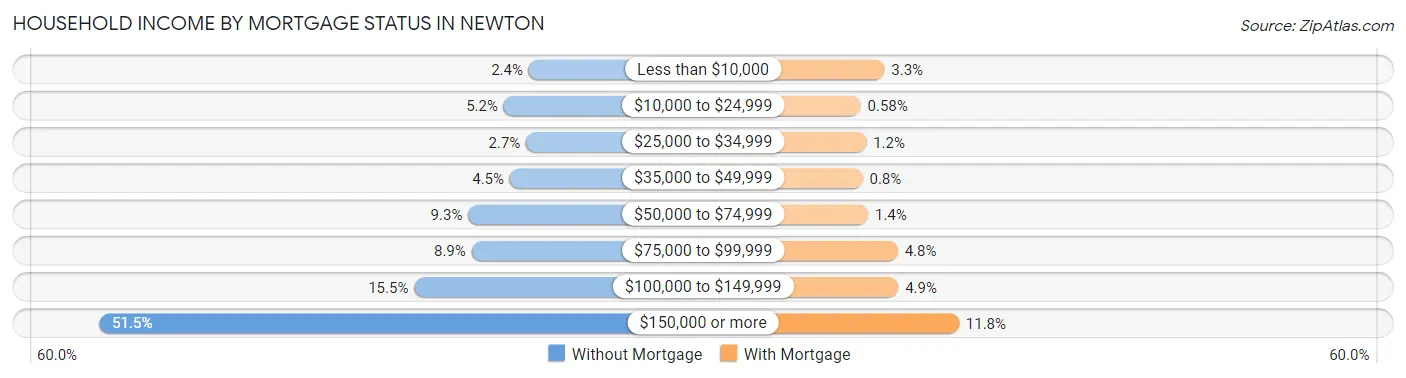
| Household Income | Without Mortgage | With Mortgage |
| Less than $10,000 | 197 (2.4%) | 463 (3.3%) |
| $10,000 to $24,999 | 433 (5.2%) | 81 (0.6%) |
| $25,000 to $34,999 | 222 (2.7%) | 171 (1.2%) |
| $35,000 to $49,999 | 376 (4.5%) | 112 (0.8%) |
| $50,000 to $74,999 | 770 (9.3%) | 201 (1.4%) |
| $75,000 to $99,999 | 737 (8.9%) | 678 (4.8%) |
| $100,000 to $149,999 | 1,280 (15.5%) | 687 (4.9%) |
| $150,000 or more | 4,261 (51.5%) | 1,662 (11.8%) |
| Total | 8,276 (100.0%) | 14,068 (100.0%) |
Property Value to Household Income Ratio in Newton
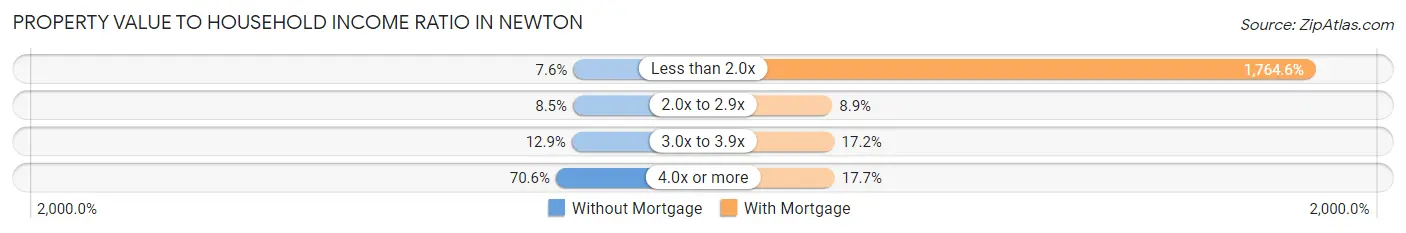
| Value-to-Income Ratio | Without Mortgage | With Mortgage |
| Less than 2.0x | 628 (7.6%) | 248,242 (1,764.6%) |
| 2.0x to 2.9x | 699 (8.5%) | 1,253 (8.9%) |
| 3.0x to 3.9x | 1,067 (12.9%) | 2,416 (17.2%) |
| 4.0x or more | 5,839 (70.6%) | 2,483 (17.6%) |
| Total | 8,276 (100.0%) | 14,068 (100.0%) |
Real Estate Taxes by Mortgage Status in Newton
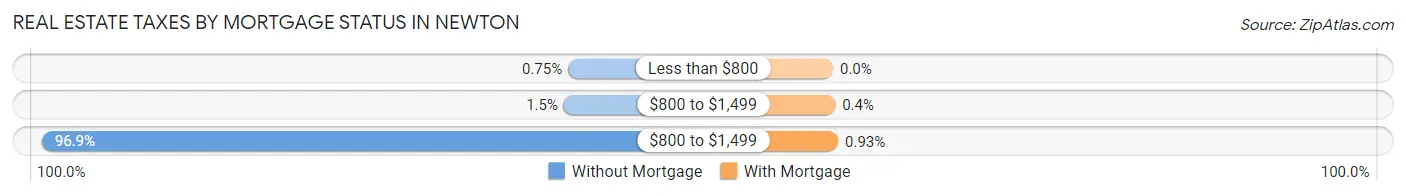
| Property Taxes | Without Mortgage | With Mortgage |
| Less than $800 | 62 (0.7%) | 0 (0.0%) |
| $800 to $1,499 | 126 (1.5%) | 56 (0.4%) |
| $800 to $1,499 | 8,016 (96.9%) | 131 (0.9%) |
| Total | 8,276 (100.0%) | 14,068 (100.0%) |
Health & Disability in Newton
Health Insurance Coverage by Age in Newton
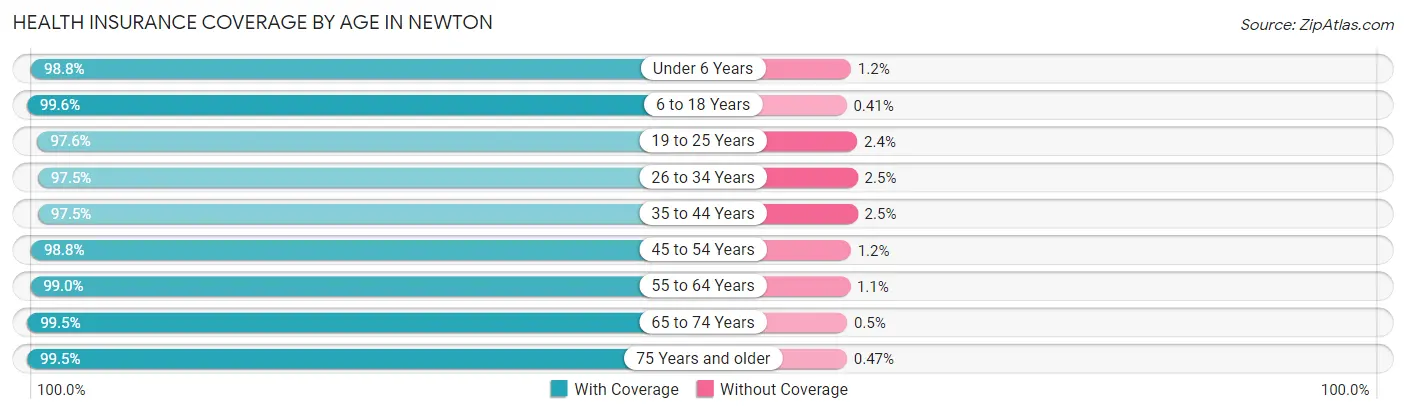
| Age Bracket | With Coverage | Without Coverage |
| Under 6 Years | 4,408 (98.8%) | 55 (1.2%) |
| 6 to 18 Years | 16,621 (99.6%) | 69 (0.4%) |
| 19 to 25 Years | 8,302 (97.6%) | 204 (2.4%) |
| 26 to 34 Years | 7,689 (97.5%) | 196 (2.5%) |
| 35 to 44 Years | 10,089 (97.5%) | 258 (2.5%) |
| 45 to 54 Years | 12,325 (98.8%) | 150 (1.2%) |
| 55 to 64 Years | 11,320 (99.0%) | 120 (1.1%) |
| 65 to 74 Years | 9,237 (99.5%) | 46 (0.5%) |
| 75 Years and older | 6,791 (99.5%) | 32 (0.5%) |
| Total | 86,782 (98.7%) | 1,130 (1.3%) |
Health Insurance Coverage by Citizenship Status in Newton
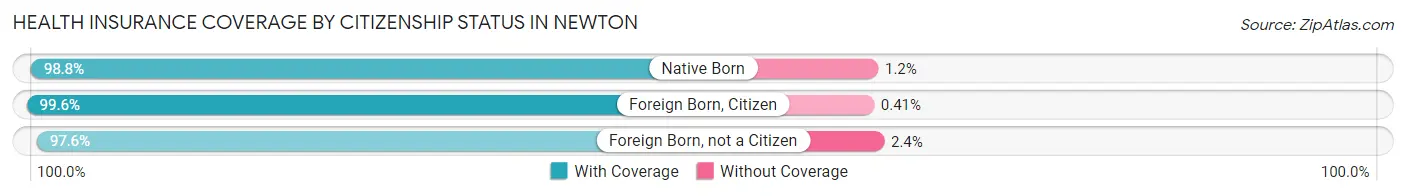
| Citizenship Status | With Coverage | Without Coverage |
| Native Born | 4,408 (98.8%) | 55 (1.2%) |
| Foreign Born, Citizen | 16,621 (99.6%) | 69 (0.4%) |
| Foreign Born, not a Citizen | 8,302 (97.6%) | 204 (2.4%) |
Health Insurance Coverage by Household Income in Newton
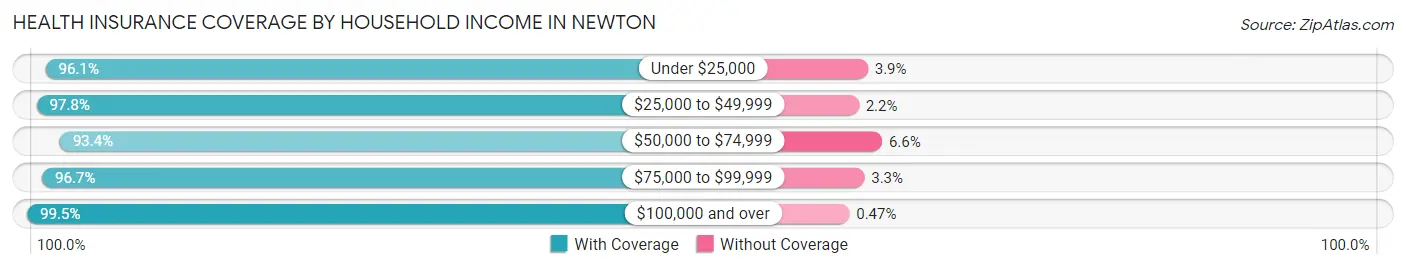
| Household Income | With Coverage | Without Coverage |
| Under $25,000 | 3,737 (96.1%) | 153 (3.9%) |
| $25,000 to $49,999 | 2,978 (97.8%) | 68 (2.2%) |
| $50,000 to $74,999 | 4,252 (93.4%) | 300 (6.6%) |
| $75,000 to $99,999 | 5,576 (96.7%) | 189 (3.3%) |
| $100,000 and over | 64,313 (99.5%) | 304 (0.5%) |
Public vs Private Health Insurance Coverage by Age in Newton
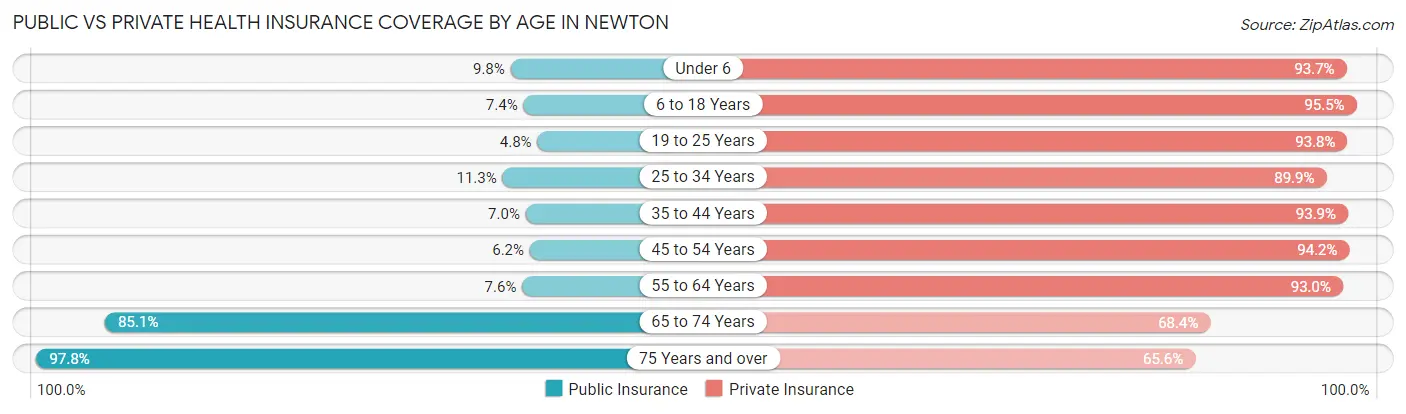
| Age Bracket | Public Insurance | Private Insurance |
| Under 6 | 437 (9.8%) | 4,180 (93.7%) |
| 6 to 18 Years | 1,235 (7.4%) | 15,942 (95.5%) |
| 19 to 25 Years | 409 (4.8%) | 7,981 (93.8%) |
| 25 to 34 Years | 890 (11.3%) | 7,091 (89.9%) |
| 35 to 44 Years | 722 (7.0%) | 9,719 (93.9%) |
| 45 to 54 Years | 776 (6.2%) | 11,752 (94.2%) |
| 55 to 64 Years | 873 (7.6%) | 10,637 (93.0%) |
| 65 to 74 Years | 7,897 (85.1%) | 6,348 (68.4%) |
| 75 Years and over | 6,673 (97.8%) | 4,473 (65.6%) |
| Total | 19,912 (22.7%) | 78,123 (88.9%) |
Disability Status by Sex by Age in Newton
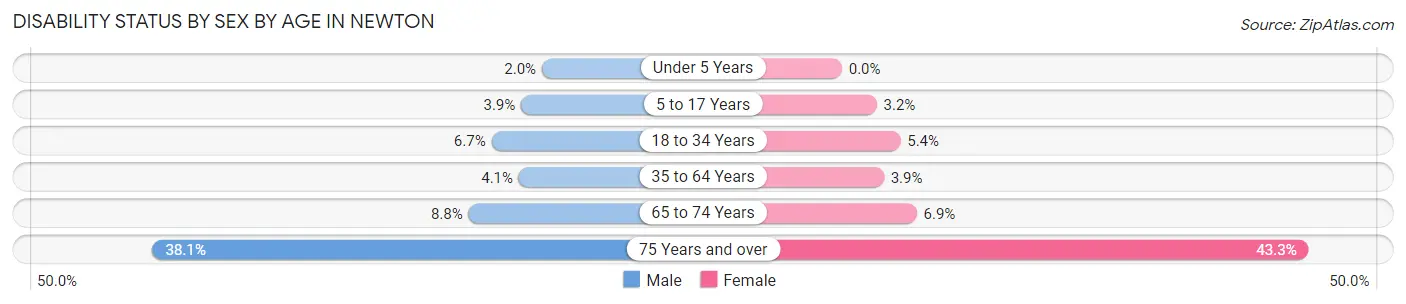
| Age Bracket | Male | Female |
| Under 5 Years | 38 (2.0%) | 0 (0.0%) |
| 5 to 17 Years | 287 (3.9%) | 238 (3.2%) |
| 18 to 34 Years | 626 (6.7%) | 532 (5.4%) |
| 35 to 64 Years | 698 (4.1%) | 675 (3.9%) |
| 65 to 74 Years | 373 (8.8%) | 350 (6.9%) |
| 75 Years and over | 1,126 (38.1%) | 1,676 (43.3%) |
Disability Class by Sex by Age in Newton
Disability Class: Hearing Difficulty
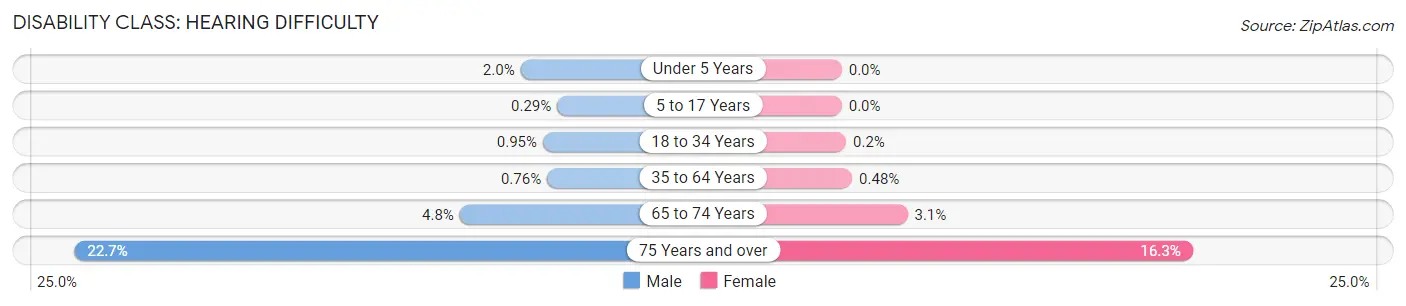
| Age Bracket | Male | Female |
| Under 5 Years | 38 (2.0%) | 0 (0.0%) |
| 5 to 17 Years | 21 (0.3%) | 0 (0.0%) |
| 18 to 34 Years | 89 (0.9%) | 20 (0.2%) |
| 35 to 64 Years | 129 (0.8%) | 83 (0.5%) |
| 65 to 74 Years | 204 (4.8%) | 154 (3.0%) |
| 75 Years and over | 670 (22.7%) | 630 (16.3%) |
Disability Class: Vision Difficulty
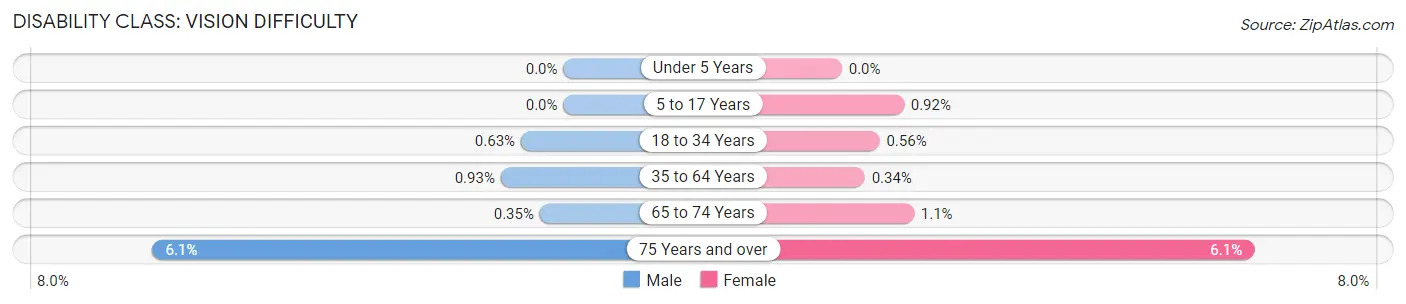
| Age Bracket | Male | Female |
| Under 5 Years | 0 (0.0%) | 0 (0.0%) |
| 5 to 17 Years | 0 (0.0%) | 68 (0.9%) |
| 18 to 34 Years | 59 (0.6%) | 55 (0.6%) |
| 35 to 64 Years | 158 (0.9%) | 59 (0.3%) |
| 65 to 74 Years | 15 (0.4%) | 54 (1.1%) |
| 75 Years and over | 180 (6.1%) | 237 (6.1%) |
Disability Class: Cognitive Difficulty
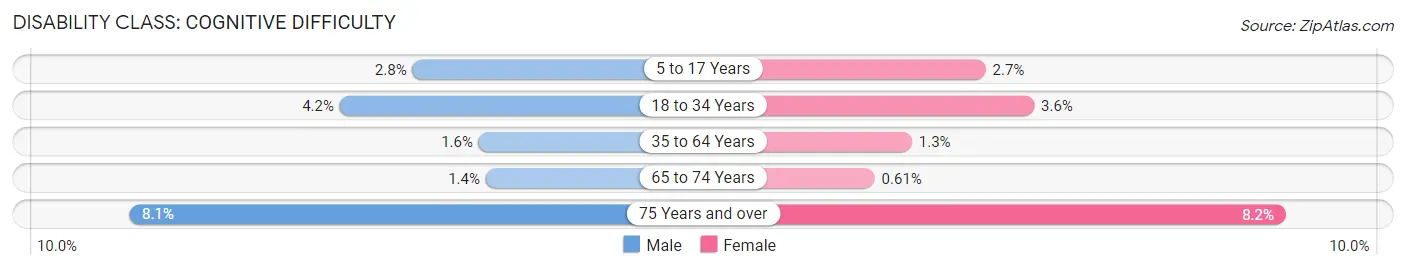
| Age Bracket | Male | Female |
| 5 to 17 Years | 205 (2.8%) | 197 (2.7%) |
| 18 to 34 Years | 389 (4.2%) | 350 (3.6%) |
| 35 to 64 Years | 266 (1.6%) | 226 (1.3%) |
| 65 to 74 Years | 61 (1.4%) | 31 (0.6%) |
| 75 Years and over | 238 (8.1%) | 319 (8.2%) |
Disability Class: Ambulatory Difficulty
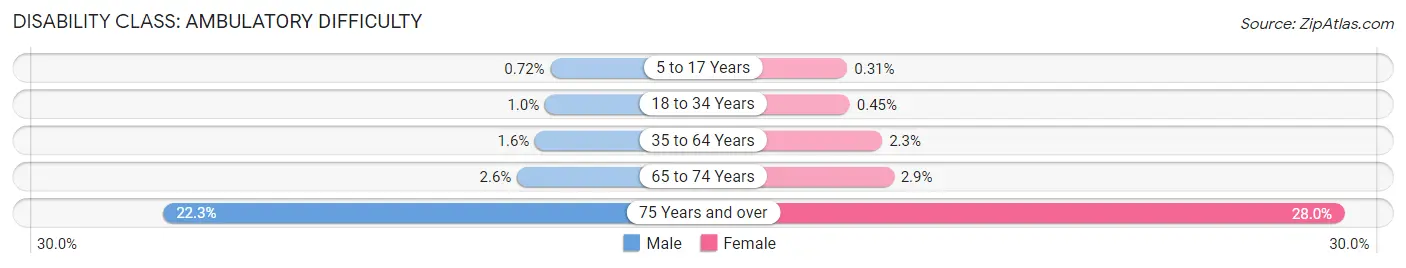
| Age Bracket | Male | Female |
| 5 to 17 Years | 53 (0.7%) | 23 (0.3%) |
| 18 to 34 Years | 96 (1.0%) | 44 (0.4%) |
| 35 to 64 Years | 266 (1.6%) | 391 (2.2%) |
| 65 to 74 Years | 109 (2.6%) | 146 (2.9%) |
| 75 Years and over | 658 (22.3%) | 1,082 (28.0%) |
Disability Class: Self-Care Difficulty
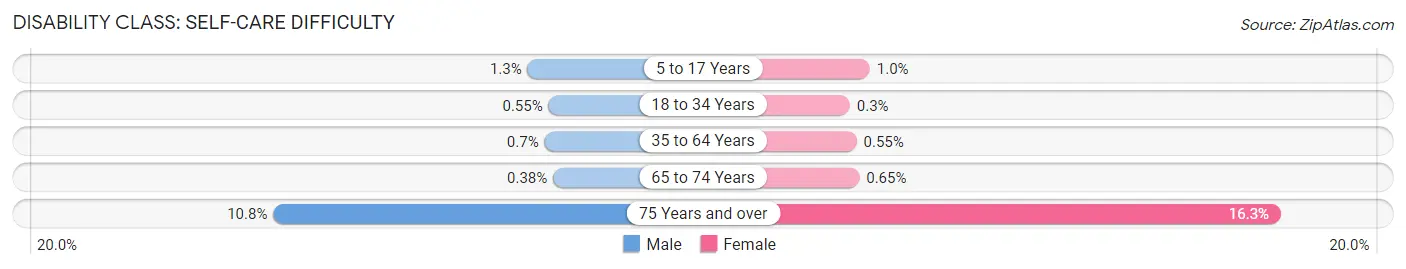
| Age Bracket | Male | Female |
| 5 to 17 Years | 97 (1.3%) | 77 (1.0%) |
| 18 to 34 Years | 52 (0.5%) | 29 (0.3%) |
| 35 to 64 Years | 118 (0.7%) | 95 (0.5%) |
| 65 to 74 Years | 16 (0.4%) | 33 (0.6%) |
| 75 Years and over | 318 (10.8%) | 631 (16.3%) |
Technology Access in Newton
Computing Device Access in Newton
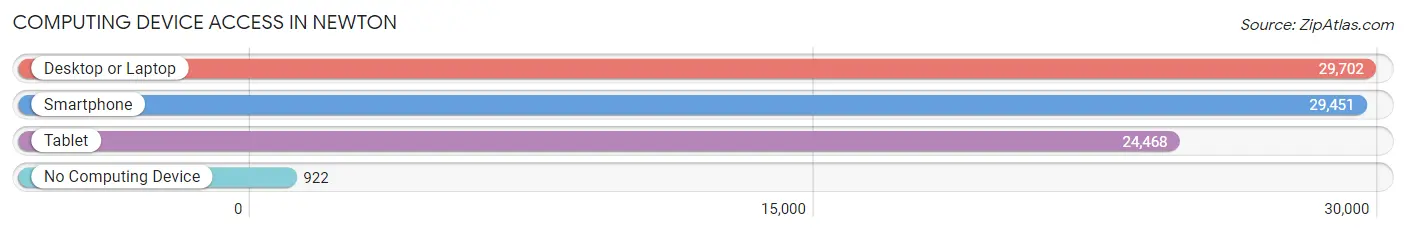
| Device Type | # Households | % Households |
| Desktop or Laptop | 29,702 | 93.6% |
| Smartphone | 29,451 | 92.8% |
| Tablet | 24,468 | 77.1% |
| No Computing Device | 922 | 2.9% |
| Total | 31,735 | 100.0% |
Internet Access in Newton
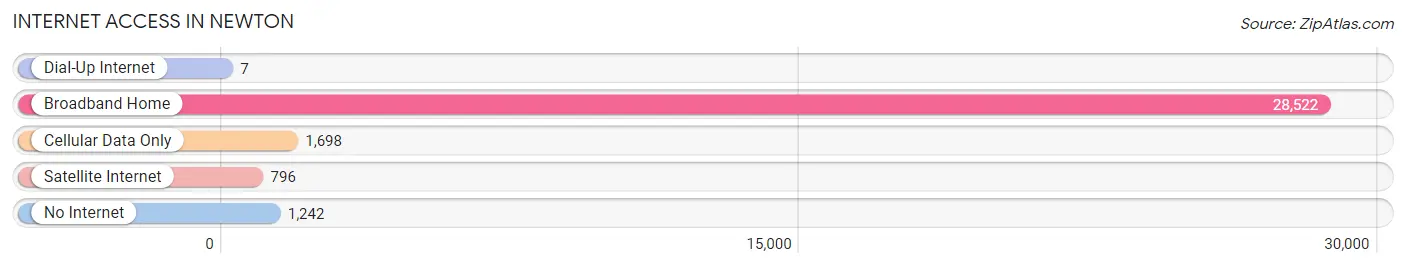
| Internet Type | # Households | % Households |
| Dial-Up Internet | 7 | 0.0% |
| Broadband Home | 28,522 | 89.9% |
| Cellular Data Only | 1,698 | 5.3% |
| Satellite Internet | 796 | 2.5% |
| No Internet | 1,242 | 3.9% |
| Total | 31,735 | 100.0% |
Newton Summary
Newton, Massachusetts is a city located in Middlesex County, just west of Boston. It is a suburb of Boston and is part of the Greater Boston metropolitan area. The city is home to approximately 88,000 people, making it the eleventh largest city in Massachusetts.
Geography
Newton is located in eastern Massachusetts, about 8 miles west of Boston. It is bordered by the towns of Watertown, Waltham, Needham, Wellesley, Weston, and Brookline. The city is situated on the Charles River, which forms its eastern border. The city is divided into two sections, the "Villages" and the "Hamlets". The Villages are the larger, more developed areas of the city, while the Hamlets are smaller, more rural areas.
The city is made up of several distinct neighborhoods, including Auburndale, Chestnut Hill, Newton Centre, Newton Corner, Newton Highlands, Newton Lower Falls, Newton Upper Falls, Nonantum, Oak Hill, Thompsonville, Waban, and West Newton. Each of these neighborhoods has its own unique character and charm.
Climate
Newton has a humid continental climate, with warm summers and cold winters. The average high temperature in July is 81°F, and the average low temperature in January is 19°F. The city receives an average of 48 inches of precipitation per year, with the most occurring in the months of May and June.
Economy
Newton is home to a diverse economy, with a variety of industries represented. The city is home to several large employers, including Boston Scientific, EMC Corporation, and Fidelity Investments. The city is also home to several smaller businesses, including restaurants, retail stores, and professional services.
The city is also home to several educational institutions, including Boston College, Brandeis University, and Lasell College. These institutions provide a variety of educational opportunities for students, as well as employment opportunities for faculty and staff.
Demographics
As of the 2010 census, the population of Newton was 88,219. The racial makeup of the city was 79.2% White, 8.2% Asian, 6.3% African American, 0.3% Native American, 0.1% Pacific Islander, and 5.9% from other races. The median household income was $107,817, and the median family income was $133,817.
The city is home to a large Jewish population, with approximately 20% of the population identifying as Jewish. The city is also home to a large Irish population, with approximately 10% of the population identifying as Irish.
Conclusion
Newton, Massachusetts is a vibrant city located in eastern Massachusetts, just west of Boston. The city is home to a diverse population and a thriving economy. The city is divided into several distinct neighborhoods, each with its own unique character and charm. The city is home to several large employers, educational institutions, and a variety of businesses. The city is also home to a large Jewish and Irish population. Newton is a great place to live, work, and play.
Common Questions
What is Per Capita Income in Newton?
Per Capita income in Newton is $91,282.
What is the Median Family Income in Newton?
Median Family Income in Newton is $222,500.
What is the Median Household income in Newton?
Median Household Income in Newton is $176,373.
What is Income or Wage Gap in Newton?
Income or Wage Gap in Newton is 45.6%.
Women in Newton earn 54.4 cents for every dollar earned by a man.
What is Inequality or Gini Index in Newton?
Inequality or Gini Index in Newton is 0.49.
What is the Total Population of Newton?
Total Population of Newton is 88,453.
What is the Total Male Population of Newton?
Total Male Population of Newton is 42,981.
What is the Total Female Population of Newton?
Total Female Population of Newton is 45,472.
What is the Ratio of Males per 100 Females in Newton?
There are 94.52 Males per 100 Females in Newton.
What is the Ratio of Females per 100 Males in Newton?
There are 105.80 Females per 100 Males in Newton.
What is the Median Population Age in Newton?
Median Population Age in Newton is 41.7 Years.
What is the Average Family Size in Newton
Average Family Size in Newton is 3.0 People.
What is the Average Household Size in Newton
Average Household Size in Newton is 2.6 People.
How Large is the Labor Force in Newton?
There are 47,683 People in the Labor Forcein in Newton.
What is the Percentage of People in the Labor Force in Newton?
65.6% of People are in the Labor Force in Newton.
What is the Unemployment Rate in Newton?
Unemployment Rate in Newton is 3.5%.