Omaha, NE Map & Demographics
Omaha Map
Omaha Overview
$40,081
PER CAPITA INCOME
$92,630
AVG FAMILY INCOME
$70,202
AVG HOUSEHOLD INCOME
23.7%
WAGE / INCOME GAP [ % ]
76.3¢/ $1
WAGE / INCOME GAP [ $ ]
$10,335
FAMILY INCOME DEFICIT
0.48
INEQUALITY / GINI INDEX
489,201
TOTAL POPULATION
243,241
MALE POPULATION
245,960
FEMALE POPULATION
98.89
MALES / 100 FEMALES
101.12
FEMALES / 100 MALES
35.1
MEDIAN AGE
3.2
AVG FAMILY SIZE
2.4
AVG HOUSEHOLD SIZE
266,796
LABOR FORCE [ PEOPLE ]
69.9%
PERCENT IN LABOR FORCE
4.2%
UNEMPLOYMENT RATE
Omaha Zip Codes
Omaha Area Codes
Income in Omaha
Income Overview in Omaha
Per Capita Income in Omaha is $40,081, while median incomes of families and households are $92,630 and $70,202 respectively.
| Characteristic | Number | Measure |
| Per Capita Income | 489,201 | $40,081 |
| Median Family Income | 115,277 | $92,630 |
| Mean Family Income | 115,277 | $122,476 |
| Median Household Income | 197,842 | $70,202 |
| Mean Household Income | 197,842 | $97,761 |
| Income Deficit | 115,277 | $10,335 |
| Wage / Income Gap (%) | 489,201 | 23.69% |
| Wage / Income Gap ($) | 489,201 | 76.31¢ per $1 |
| Gini / Inequality Index | 489,201 | 0.48 |
Earnings by Sex in Omaha
Average Earnings in Omaha are $41,797, $47,028 for men and $35,889 for women, a difference of 23.7%.
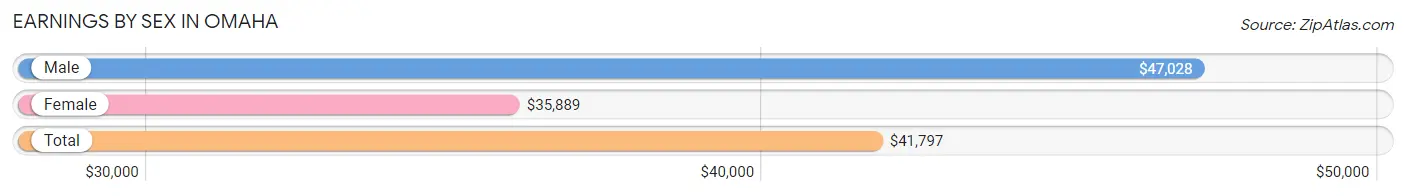
| Sex | Number | Average Earnings |
| Male | 146,285 (52.5%) | $47,028 |
| Female | 132,545 (47.5%) | $35,889 |
| Total | 278,830 (100.0%) | $41,797 |
Earnings by Sex by Income Bracket in Omaha
The most common earnings brackets in Omaha are $100,000+ for men (23,713 | 16.2%) and $100,000+ for women (11,311 | 8.5%).
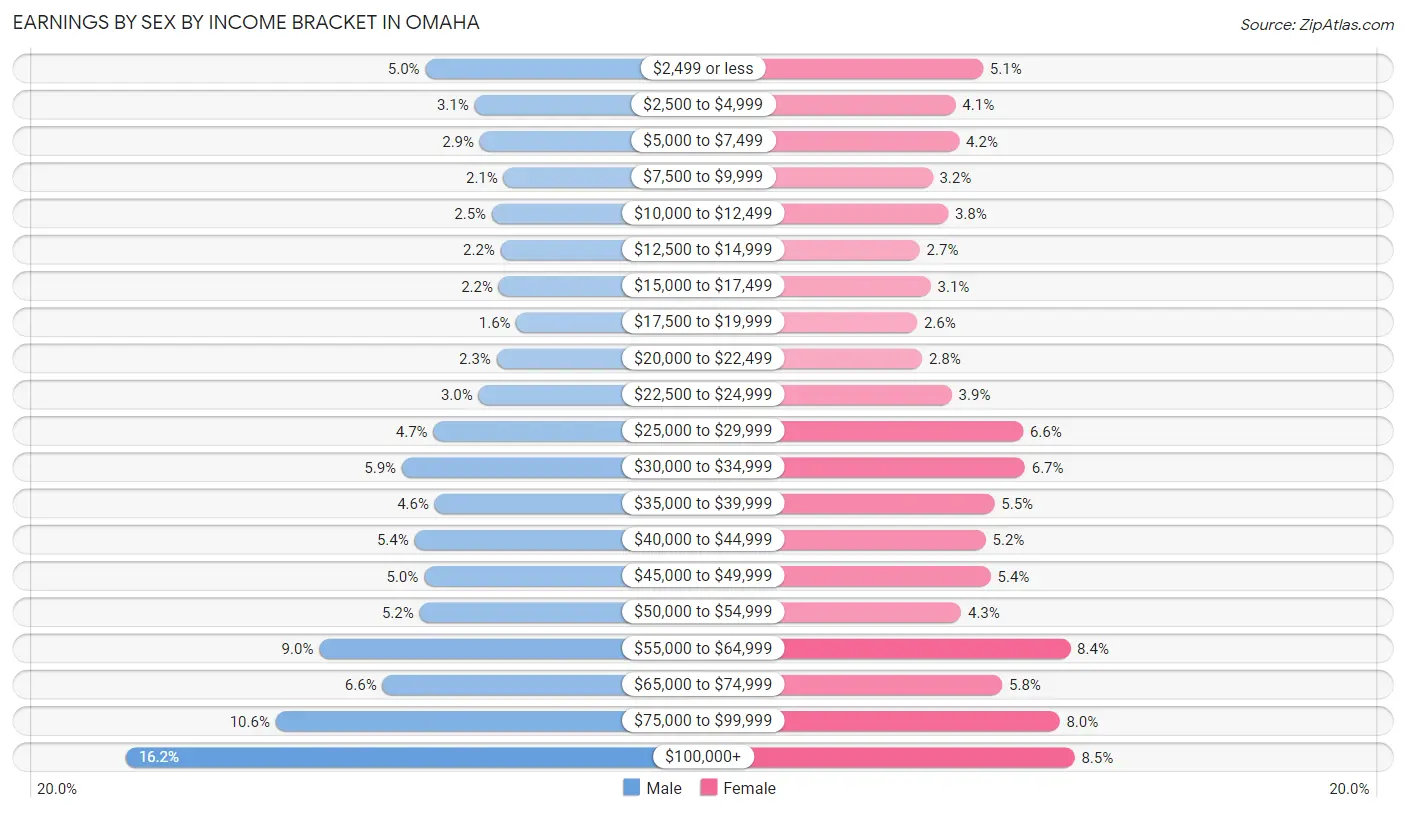
| Income | Male | Female |
| $2,499 or less | 7,289 (5.0%) | 6,762 (5.1%) |
| $2,500 to $4,999 | 4,595 (3.1%) | 5,394 (4.1%) |
| $5,000 to $7,499 | 4,301 (2.9%) | 5,580 (4.2%) |
| $7,500 to $9,999 | 2,992 (2.1%) | 4,261 (3.2%) |
| $10,000 to $12,499 | 3,649 (2.5%) | 5,027 (3.8%) |
| $12,500 to $14,999 | 3,154 (2.2%) | 3,618 (2.7%) |
| $15,000 to $17,499 | 3,257 (2.2%) | 4,168 (3.1%) |
| $17,500 to $19,999 | 2,292 (1.6%) | 3,481 (2.6%) |
| $20,000 to $22,499 | 3,386 (2.3%) | 3,738 (2.8%) |
| $22,500 to $24,999 | 4,370 (3.0%) | 5,203 (3.9%) |
| $25,000 to $29,999 | 6,843 (4.7%) | 8,742 (6.6%) |
| $30,000 to $34,999 | 8,574 (5.9%) | 8,844 (6.7%) |
| $35,000 to $39,999 | 6,775 (4.6%) | 7,329 (5.5%) |
| $40,000 to $44,999 | 7,884 (5.4%) | 6,892 (5.2%) |
| $45,000 to $49,999 | 7,363 (5.0%) | 7,149 (5.4%) |
| $50,000 to $54,999 | 7,608 (5.2%) | 5,671 (4.3%) |
| $55,000 to $64,999 | 13,107 (9.0%) | 11,093 (8.4%) |
| $65,000 to $74,999 | 9,643 (6.6%) | 7,717 (5.8%) |
| $75,000 to $99,999 | 15,490 (10.6%) | 10,565 (8.0%) |
| $100,000+ | 23,713 (16.2%) | 11,311 (8.5%) |
| Total | 146,285 (100.0%) | 132,545 (100.0%) |
Earnings by Sex by Educational Attainment in Omaha
Average earnings in Omaha are $54,873 for men and $42,966 for women, a difference of 21.7%. Men with an educational attainment of graduate degree enjoy the highest average annual earnings of $90,556, while those with less than high school education earn the least with $35,551. Women with an educational attainment of graduate degree earn the most with the average annual earnings of $68,425, while those with less than high school education have the smallest earnings of $26,865.
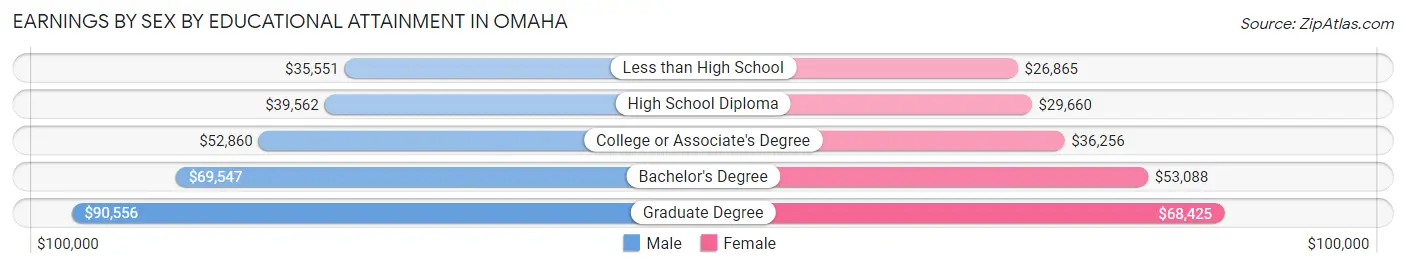
| Educational Attainment | Male Income | Female Income |
| Less than High School | $35,551 | $26,865 |
| High School Diploma | $39,562 | $29,660 |
| College or Associate's Degree | $52,860 | $36,256 |
| Bachelor's Degree | $69,547 | $53,088 |
| Graduate Degree | $90,556 | $68,425 |
| Total | $54,873 | $42,966 |
Family Income in Omaha
Family Income Brackets in Omaha
According to the Omaha family income data, there are 25,591 families falling into the $100,000 to $149,999 income range, which is the most common income bracket and makes up 22.2% of all families. Conversely, the $10,000 to $14,999 income bracket is the least frequent group with only 2,190 families (1.9%) belonging to this category.
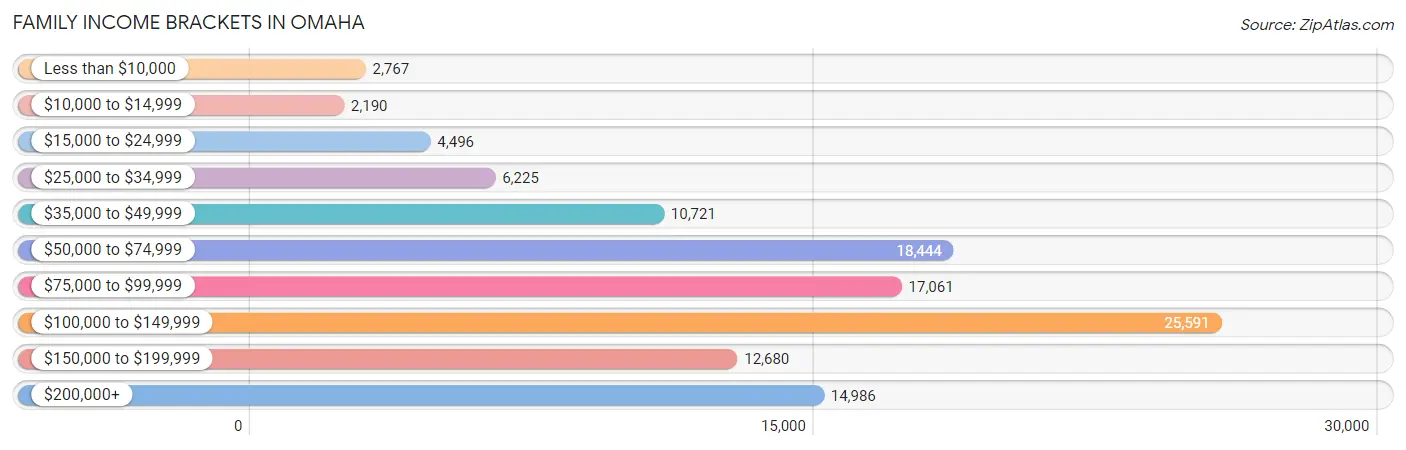
| Income Bracket | # Families | % Families |
| Less than $10,000 | 2,767 | 2.4% |
| $10,000 to $14,999 | 2,190 | 1.9% |
| $15,000 to $24,999 | 4,496 | 3.9% |
| $25,000 to $34,999 | 6,225 | 5.4% |
| $35,000 to $49,999 | 10,721 | 9.3% |
| $50,000 to $74,999 | 18,444 | 16.0% |
| $75,000 to $99,999 | 17,061 | 14.8% |
| $100,000 to $149,999 | 25,591 | 22.2% |
| $150,000 to $199,999 | 12,680 | 11.0% |
| $200,000+ | 14,986 | 13.0% |
Family Income by Famaliy Size in Omaha
4-person families (19,223 | 16.7%) account for the highest median family income in Omaha with $117,260 per family, while 2-person families (53,362 | 46.3%) have the highest median income of $41,726 per family member.
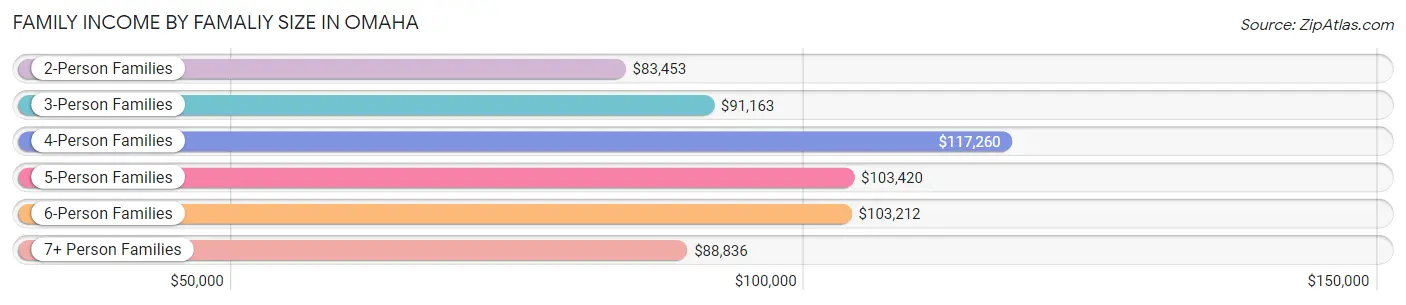
| Income Bracket | # Families | Median Income |
| 2-Person Families | 53,362 (46.3%) | $83,453 |
| 3-Person Families | 24,548 (21.3%) | $91,163 |
| 4-Person Families | 19,223 (16.7%) | $117,260 |
| 5-Person Families | 11,196 (9.7%) | $103,420 |
| 6-Person Families | 4,129 (3.6%) | $103,212 |
| 7+ Person Families | 2,819 (2.5%) | $88,836 |
| Total | 115,277 (100.0%) | $92,630 |
Family Income by Number of Earners in Omaha
The median family income in Omaha is $92,630, with families comprising 3+ earners (14,664) having the highest median family income of $131,467, while families with no earners (12,291) have the lowest median family income of $52,195, accounting for 12.7% and 10.7% of families, respectively.
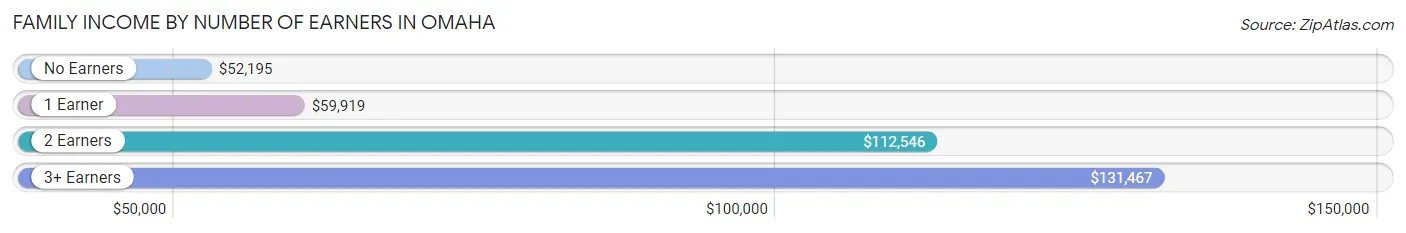
| Number of Earners | # Families | Median Income |
| No Earners | 12,291 (10.7%) | $52,195 |
| 1 Earner | 34,979 (30.3%) | $59,919 |
| 2 Earners | 53,343 (46.3%) | $112,546 |
| 3+ Earners | 14,664 (12.7%) | $131,467 |
| Total | 115,277 (100.0%) | $92,630 |
Household Income in Omaha
Household Income Brackets in Omaha
With 35,612 households falling in the category, the $50,000 to $74,999 income range is the most frequent in Omaha, accounting for 18.0% of all households. In contrast, only 8,112 households (4.1%) fall into the $10,000 to $14,999 income bracket, making it the least populous group.
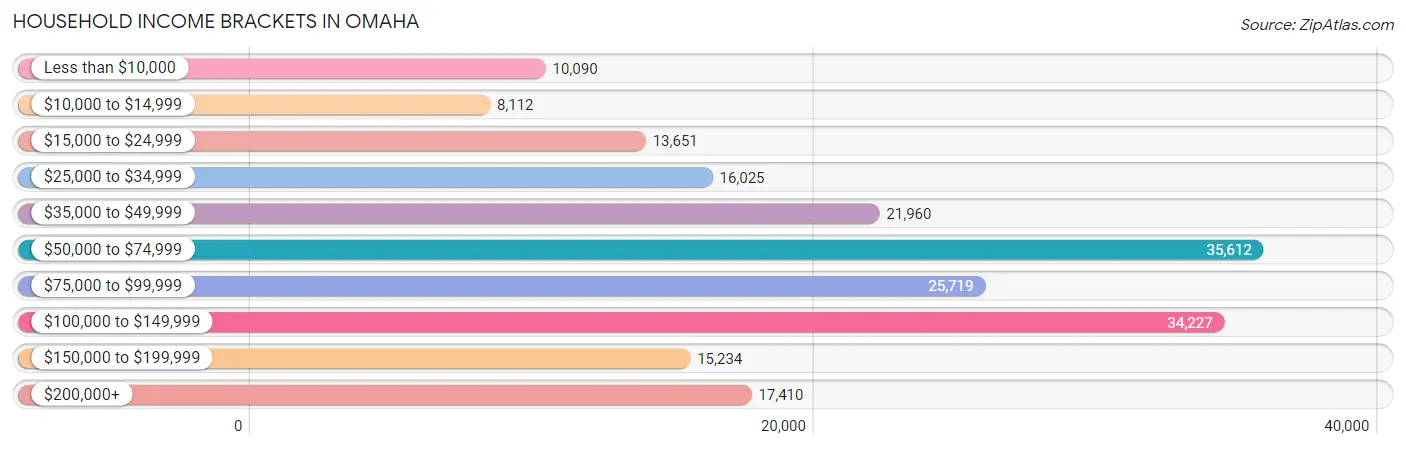
| Income Bracket | # Households | % Households |
| Less than $10,000 | 10,090 | 5.1% |
| $10,000 to $14,999 | 8,112 | 4.1% |
| $15,000 to $24,999 | 13,651 | 6.9% |
| $25,000 to $34,999 | 16,025 | 8.1% |
| $35,000 to $49,999 | 21,960 | 11.1% |
| $50,000 to $74,999 | 35,612 | 18.0% |
| $75,000 to $99,999 | 25,719 | 13.0% |
| $100,000 to $149,999 | 34,227 | 17.3% |
| $150,000 to $199,999 | 15,234 | 7.7% |
| $200,000+ | 17,410 | 8.8% |
Household Income by Householder Age in Omaha
The median household income in Omaha is $70,202, with the highest median household income of $86,658 found in the 45 to 64 years age bracket for the primary householder. A total of 66,450 households (33.6%) fall into this category. Meanwhile, the 15 to 24 years age bracket for the primary householder has the lowest median household income of $37,252, with 11,364 households (5.7%) in this group.
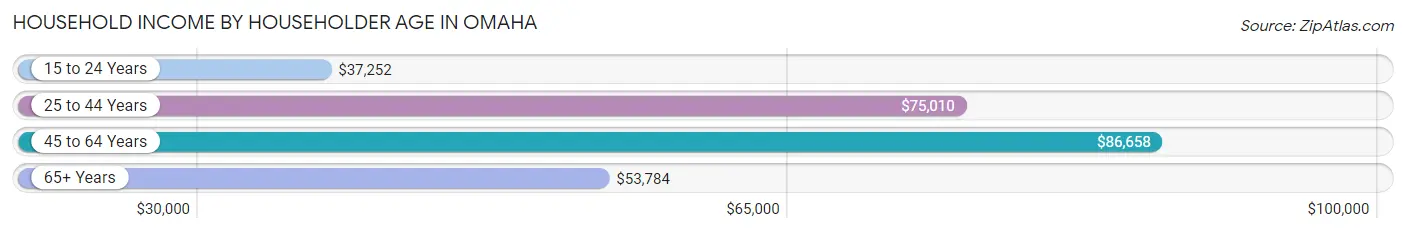
| Income Bracket | # Households | Median Income |
| 15 to 24 Years | 11,364 (5.7%) | $37,252 |
| 25 to 44 Years | 75,765 (38.3%) | $75,010 |
| 45 to 64 Years | 66,450 (33.6%) | $86,658 |
| 65+ Years | 44,263 (22.4%) | $53,784 |
| Total | 197,842 (100.0%) | $70,202 |
Poverty in Omaha
Income Below Poverty by Sex and Age in Omaha
With 11.5% poverty level for males and 13.4% for females among the residents of Omaha, 5 year old males and 18 to 24 year old females are the most vulnerable to poverty, with 694 males (19.4%) and 5,088 females (23.1%) in their respective age groups living below the poverty level.
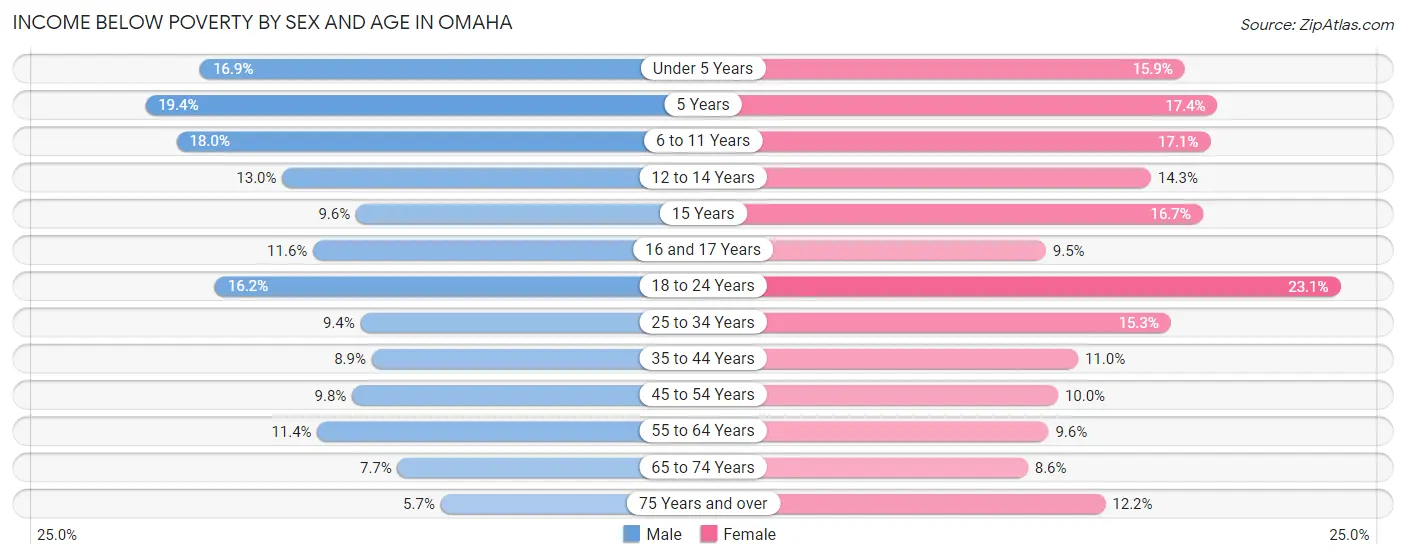
| Age Bracket | Male | Female |
| Under 5 Years | 2,867 (16.9%) | 2,546 (15.9%) |
| 5 Years | 694 (19.4%) | 582 (17.4%) |
| 6 to 11 Years | 3,413 (17.9%) | 3,321 (17.1%) |
| 12 to 14 Years | 1,334 (13.0%) | 1,415 (14.3%) |
| 15 Years | 353 (9.6%) | 628 (16.7%) |
| 16 and 17 Years | 749 (11.6%) | 567 (9.5%) |
| 18 to 24 Years | 3,565 (16.2%) | 5,088 (23.1%) |
| 25 to 34 Years | 3,542 (9.4%) | 5,533 (15.3%) |
| 35 to 44 Years | 2,948 (8.9%) | 3,532 (11.0%) |
| 45 to 54 Years | 2,717 (9.8%) | 2,731 (10.0%) |
| 55 to 64 Years | 3,140 (11.4%) | 2,735 (9.6%) |
| 65 to 74 Years | 1,460 (7.7%) | 1,889 (8.6%) |
| 75 Years and over | 571 (5.7%) | 1,816 (12.2%) |
| Total | 27,353 (11.5%) | 32,383 (13.4%) |
Income Above Poverty by Sex and Age in Omaha
According to the poverty statistics in Omaha, males aged 75 years and over and females aged 65 to 74 years are the age groups that are most secure financially, with 94.3% of males and 91.4% of females in these age groups living above the poverty line.
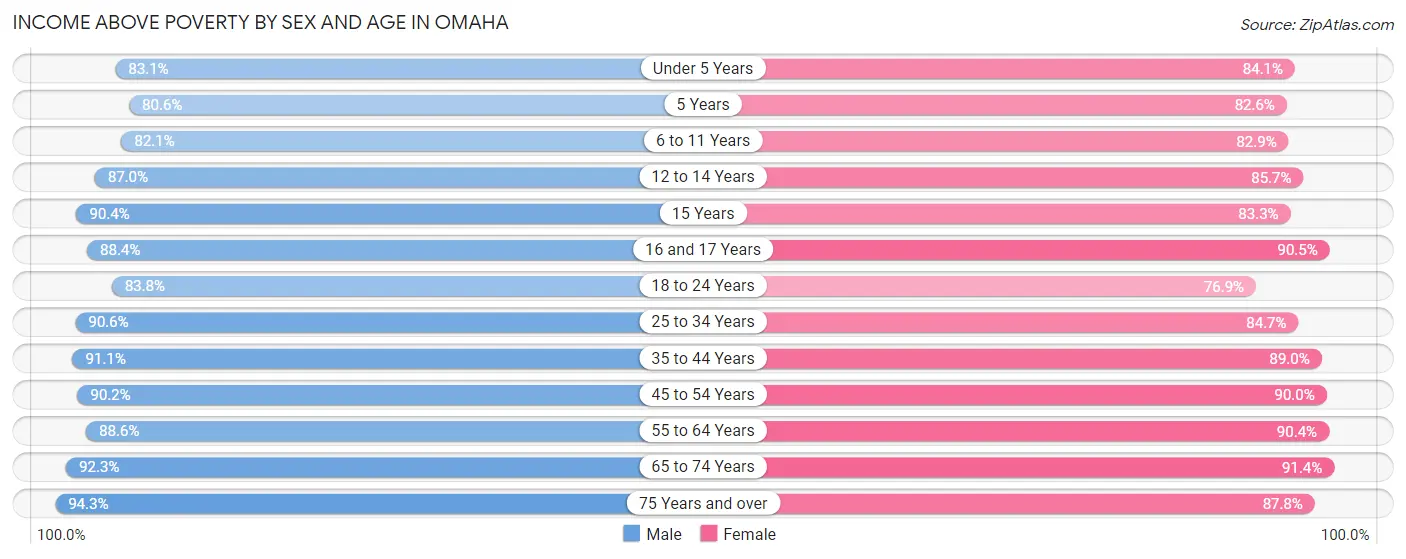
| Age Bracket | Male | Female |
| Under 5 Years | 14,138 (83.1%) | 13,460 (84.1%) |
| 5 Years | 2,884 (80.6%) | 2,757 (82.6%) |
| 6 to 11 Years | 15,597 (82.1%) | 16,117 (82.9%) |
| 12 to 14 Years | 8,898 (87.0%) | 8,451 (85.7%) |
| 15 Years | 3,317 (90.4%) | 3,123 (83.3%) |
| 16 and 17 Years | 5,701 (88.4%) | 5,423 (90.5%) |
| 18 to 24 Years | 18,478 (83.8%) | 16,914 (76.9%) |
| 25 to 34 Years | 34,086 (90.6%) | 30,719 (84.7%) |
| 35 to 44 Years | 30,224 (91.1%) | 28,704 (89.0%) |
| 45 to 54 Years | 25,007 (90.2%) | 24,504 (90.0%) |
| 55 to 64 Years | 24,381 (88.6%) | 25,787 (90.4%) |
| 65 to 74 Years | 17,530 (92.3%) | 20,010 (91.4%) |
| 75 Years and over | 9,458 (94.3%) | 13,030 (87.8%) |
| Total | 209,699 (88.5%) | 208,999 (86.6%) |
Income Below Poverty Among Married-Couple Families in Omaha
The poverty statistics for married-couple families in Omaha show that 4.1% or 3,354 of the total 81,896 families live below the poverty line. Families with 5 or more children have the highest poverty rate of 15.5%, comprising of 147 families. On the other hand, families with no children have the lowest poverty rate of 2.5%, which includes 1,108 families.
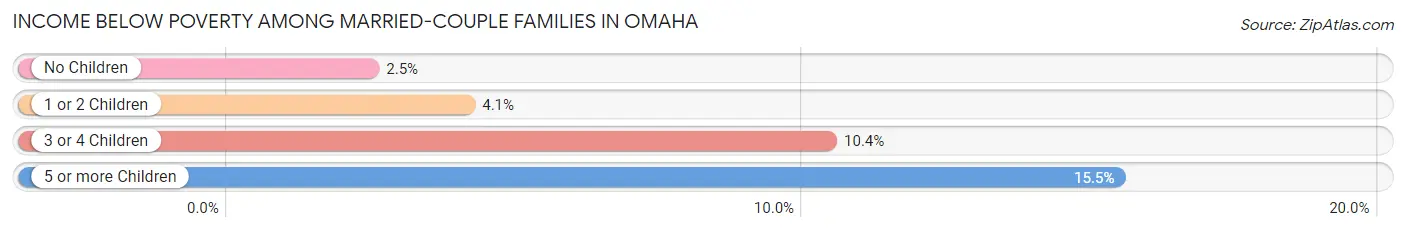
| Children | Above Poverty | Below Poverty |
| No Children | 44,019 (97.5%) | 1,108 (2.5%) |
| 1 or 2 Children | 24,890 (95.9%) | 1,071 (4.1%) |
| 3 or 4 Children | 8,829 (89.6%) | 1,028 (10.4%) |
| 5 or more Children | 804 (84.5%) | 147 (15.5%) |
| Total | 78,542 (95.9%) | 3,354 (4.1%) |
Income Below Poverty Among Single-Parent Households in Omaha
According to the poverty data in Omaha, 13.0% or 1,353 single-father households and 21.2% or 4,873 single-mother households are living below the poverty line. Among single-father households, those with 1 or 2 children have the highest poverty rate, with 800 households (16.1%) experiencing poverty. Likewise, among single-mother households, those with 3 or 4 children have the highest poverty rate, with 1,347 households (47.8%) falling below the poverty line.
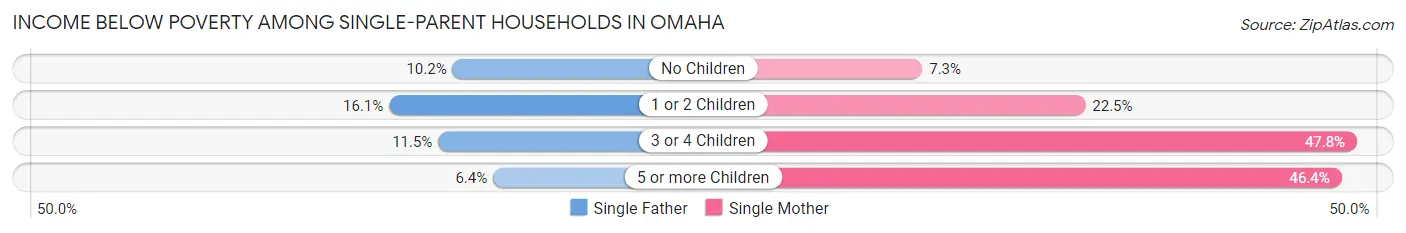
| Children | Single Father | Single Mother |
| No Children | 466 (10.2%) | 540 (7.3%) |
| 1 or 2 Children | 800 (16.1%) | 2,775 (22.5%) |
| 3 or 4 Children | 77 (11.5%) | 1,347 (47.8%) |
| 5 or more Children | 10 (6.4%) | 211 (46.4%) |
| Total | 1,353 (13.0%) | 4,873 (21.2%) |
Income Below Poverty Among Married-Couple vs Single-Parent Households in Omaha
The poverty data for Omaha shows that 3,354 of the married-couple family households (4.1%) and 6,226 of the single-parent households (18.6%) are living below the poverty level. Within the married-couple family households, those with 5 or more children have the highest poverty rate, with 147 households (15.5%) falling below the poverty line. Among the single-parent households, those with 3 or 4 children have the highest poverty rate, with 1,424 household (40.8%) living below poverty.
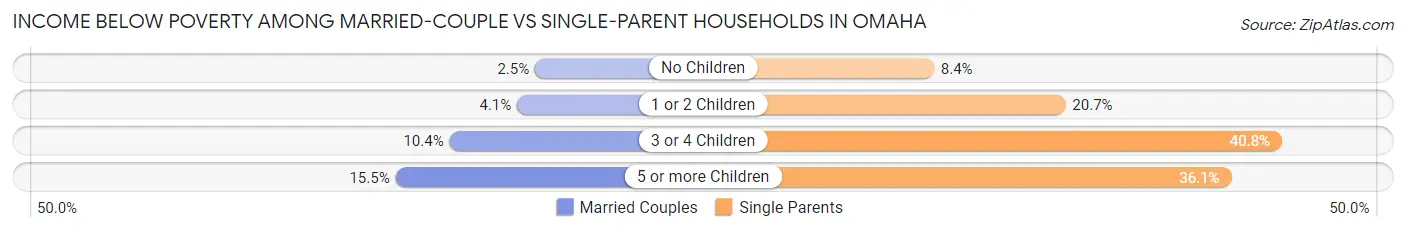
| Children | Married-Couple Families | Single-Parent Households |
| No Children | 1,108 (2.5%) | 1,006 (8.4%) |
| 1 or 2 Children | 1,071 (4.1%) | 3,575 (20.6%) |
| 3 or 4 Children | 1,028 (10.4%) | 1,424 (40.8%) |
| 5 or more Children | 147 (15.5%) | 221 (36.1%) |
| Total | 3,354 (4.1%) | 6,226 (18.6%) |
Race in Omaha
The most populous races in Omaha are White / Caucasian (349,548 | 71.5%), Hispanic or Latino (72,164 | 14.7%), and Black / African American (58,246 | 11.9%).
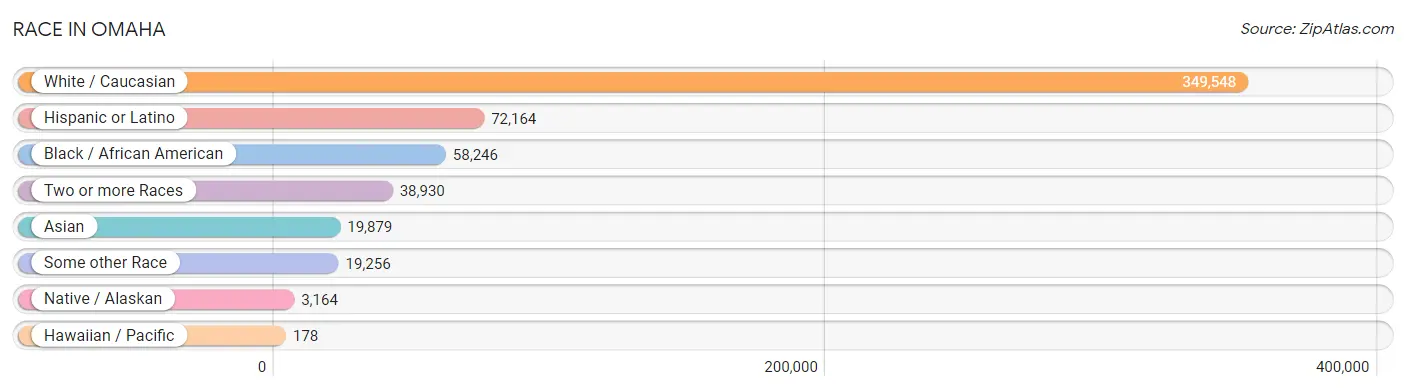
| Race | # Population | % Population |
| Asian | 19,879 | 4.1% |
| Black / African American | 58,246 | 11.9% |
| Hawaiian / Pacific | 178 | 0.0% |
| Hispanic or Latino | 72,164 | 14.7% |
| Native / Alaskan | 3,164 | 0.6% |
| White / Caucasian | 349,548 | 71.5% |
| Two or more Races | 38,930 | 8.0% |
| Some other Race | 19,256 | 3.9% |
| Total | 489,201 | 100.0% |
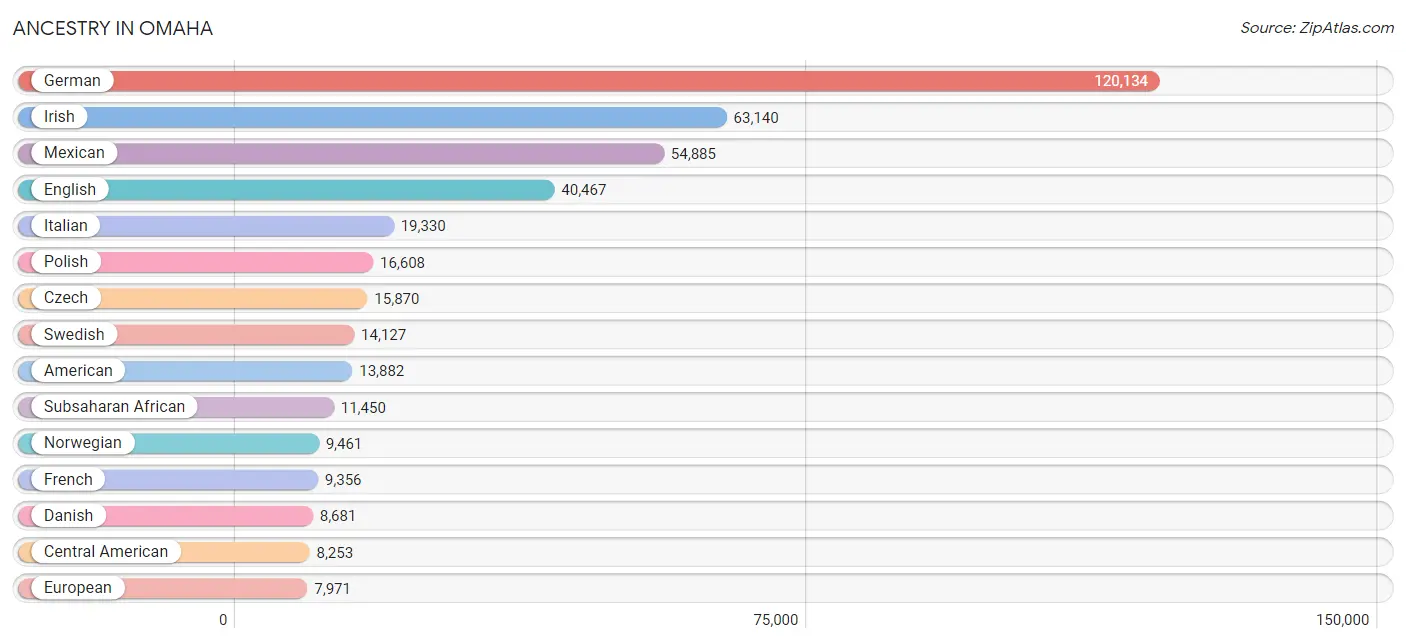
Ancestry in Omaha
The most populous ancestries reported in Omaha are German (120,134 | 24.6%), Irish (63,140 | 12.9%), Mexican (54,885 | 11.2%), English (40,467 | 8.3%), and Italian (19,330 | 4.0%), together accounting for 60.9% of all Omaha residents.
| Ancestry | # Population | % Population |
| Afghan | 361 | 0.1% |
| African | 3,040 | 0.6% |
| Alaska Native | 16 | 0.0% |
| Alaskan Athabascan | 57 | 0.0% |
| Albanian | 40 | 0.0% |
| Aleut | 29 | 0.0% |
| Alsatian | 3 | 0.0% |
| American | 13,882 | 2.8% |
| Apache | 108 | 0.0% |
| Arab | 2,380 | 0.5% |
| Arapaho | 93 | 0.0% |
| Argentinean | 116 | 0.0% |
| Armenian | 93 | 0.0% |
| Assyrian / Chaldean / Syriac | 12 | 0.0% |
| Australian | 152 | 0.0% |
| Austrian | 1,040 | 0.2% |
| Bangladeshi | 97 | 0.0% |
| Barbadian | 6 | 0.0% |
| Basque | 42 | 0.0% |
| Belgian | 823 | 0.2% |
| Belizean | 10 | 0.0% |
| Bhutanese | 1,297 | 0.3% |
| Blackfeet | 205 | 0.0% |
| Bolivian | 30 | 0.0% |
| Brazilian | 71 | 0.0% |
| British | 2,094 | 0.4% |
| British West Indian | 1 | 0.0% |
| Bulgarian | 109 | 0.0% |
| Burmese | 1,766 | 0.4% |
| Cajun | 36 | 0.0% |
| Cambodian | 18 | 0.0% |
| Canadian | 509 | 0.1% |
| Cape Verdean | 10 | 0.0% |
| Carpatho Rusyn | 27 | 0.0% |
| Celtic | 9 | 0.0% |
| Central American | 8,253 | 1.7% |
| Central American Indian | 420 | 0.1% |
| Cherokee | 1,203 | 0.3% |
| Chickasaw | 46 | 0.0% |
| Chilean | 721 | 0.2% |
| Chinese | 46 | 0.0% |
| Chippewa | 75 | 0.0% |
| Choctaw | 259 | 0.1% |
| Colombian | 612 | 0.1% |
| Comanche | 132 | 0.0% |
| Costa Rican | 119 | 0.0% |
| Cree | 10 | 0.0% |
| Creek | 39 | 0.0% |
| Croatian | 976 | 0.2% |
| Crow | 12 | 0.0% |
| Cuban | 1,002 | 0.2% |
| Czech | 15,870 | 3.2% |
| Czechoslovakian | 1,155 | 0.2% |
| Danish | 8,681 | 1.8% |
| Dominican | 304 | 0.1% |
| Dutch | 6,692 | 1.4% |
| Eastern European | 920 | 0.2% |
| Ecuadorian | 109 | 0.0% |
| Egyptian | 272 | 0.1% |
| English | 40,467 | 8.3% |
| Estonian | 26 | 0.0% |
| Ethiopian | 183 | 0.0% |
| European | 7,971 | 1.6% |
| Fijian | 10 | 0.0% |
| Filipino | 332 | 0.1% |
| Finnish | 642 | 0.1% |
| French | 9,356 | 1.9% |
| French American Indian | 15 | 0.0% |
| French Canadian | 1,435 | 0.3% |
| German | 120,134 | 24.6% |
| German Russian | 316 | 0.1% |
| Ghanaian | 114 | 0.0% |
| Greek | 1,248 | 0.3% |
| Guamanian / Chamorro | 422 | 0.1% |
| Guatemalan | 3,733 | 0.8% |
| Guyanese | 38 | 0.0% |
| Haitian | 61 | 0.0% |
| Honduran | 1,334 | 0.3% |
| Hopi | 31 | 0.0% |
| Hungarian | 1,279 | 0.3% |
| Icelander | 177 | 0.0% |
| Indian (Asian) | 2,798 | 0.6% |
| Indonesian | 5,129 | 1.1% |
| Inupiat | 12 | 0.0% |
| Iranian | 479 | 0.1% |
| Iraqi | 172 | 0.0% |
| Irish | 63,140 | 12.9% |
| Iroquois | 8 | 0.0% |
| Israeli | 25 | 0.0% |
| Italian | 19,330 | 4.0% |
| Jamaican | 319 | 0.1% |
| Japanese | 78 | 0.0% |
| Jordanian | 74 | 0.0% |
| Kenyan | 122 | 0.0% |
| Korean | 2,498 | 0.5% |
| Laotian | 147 | 0.0% |
| Latvian | 176 | 0.0% |
| Lebanese | 766 | 0.2% |
| Lithuanian | 1,061 | 0.2% |
| Luxembourger | 291 | 0.1% |
| Macedonian | 24 | 0.0% |
| Malaysian | 120 | 0.0% |
| Maltese | 71 | 0.0% |
| Mexican | 54,885 | 11.2% |
| Mexican American Indian | 725 | 0.2% |
| Mongolian | 3 | 0.0% |
| Moroccan | 19 | 0.0% |
| Native Hawaiian | 245 | 0.1% |
| Navajo | 167 | 0.0% |
| New Zealander | 11 | 0.0% |
| Nicaraguan | 327 | 0.1% |
| Nigerian | 700 | 0.1% |
| Northern European | 732 | 0.2% |
| Norwegian | 9,461 | 1.9% |
| Osage | 12 | 0.0% |
| Pakistani | 1,130 | 0.2% |
| Palestinian | 72 | 0.0% |
| Panamanian | 60 | 0.0% |
| Paraguayan | 9 | 0.0% |
| Pennsylvania German | 192 | 0.0% |
| Peruvian | 272 | 0.1% |
| Polish | 16,608 | 3.4% |
| Portuguese | 316 | 0.1% |
| Potawatomi | 31 | 0.0% |
| Pueblo | 26 | 0.0% |
| Puerto Rican | 2,234 | 0.5% |
| Romanian | 277 | 0.1% |
| Russian | 2,101 | 0.4% |
| Salvadoran | 2,680 | 0.5% |
| Samoan | 97 | 0.0% |
| Scandinavian | 2,200 | 0.4% |
| Scotch-Irish | 2,967 | 0.6% |
| Scottish | 7,753 | 1.6% |
| Seminole | 73 | 0.0% |
| Serbian | 209 | 0.0% |
| Sierra Leonean | 79 | 0.0% |
| Sioux | 1,421 | 0.3% |
| Slavic | 282 | 0.1% |
| Slovak | 275 | 0.1% |
| Slovene | 202 | 0.0% |
| Somali | 1,670 | 0.3% |
| South African | 110 | 0.0% |
| South American | 2,326 | 0.5% |
| South American Indian | 9 | 0.0% |
| Spaniard | 751 | 0.2% |
| Spanish | 531 | 0.1% |
| Spanish American | 13 | 0.0% |
| Sri Lankan | 1,765 | 0.4% |
| Subsaharan African | 11,450 | 2.3% |
| Sudanese | 3,185 | 0.6% |
| Swedish | 14,127 | 2.9% |
| Swiss | 1,507 | 0.3% |
| Syrian | 438 | 0.1% |
| Taiwanese | 68 | 0.0% |
| Thai | 4,114 | 0.8% |
| Tlingit-Haida | 23 | 0.0% |
| Trinidadian and Tobagonian | 109 | 0.0% |
| Turkish | 167 | 0.0% |
| Ukrainian | 663 | 0.1% |
| Ute | 8 | 0.0% |
| Venezuelan | 417 | 0.1% |
| Vietnamese | 84 | 0.0% |
| Welsh | 2,294 | 0.5% |
| West Indian | 67 | 0.0% |
| Yaqui | 7 | 0.0% |
| Yugoslavian | 234 | 0.1% |
| Zimbabwean | 63 | 0.0% | View All 167 Rows |
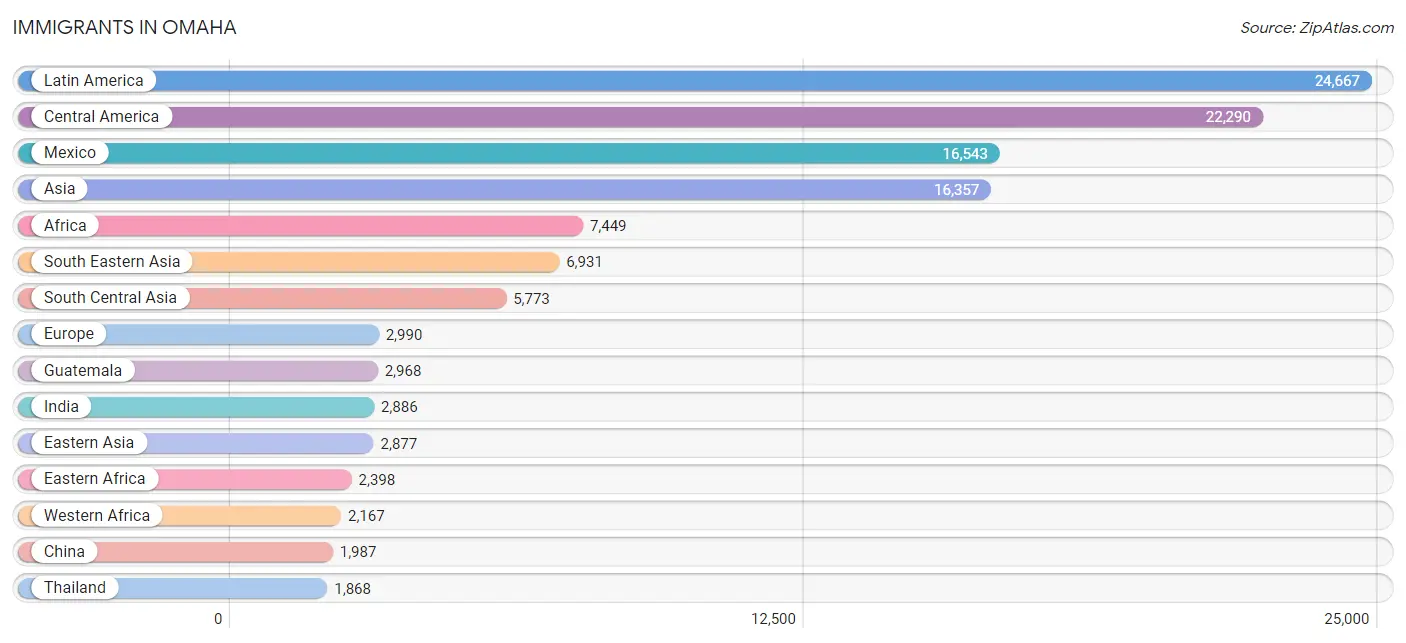
Immigrants in Omaha
The most numerous immigrant groups reported in Omaha came from Latin America (24,667 | 5.0%), Central America (22,290 | 4.6%), Mexico (16,543 | 3.4%), Asia (16,357 | 3.3%), and Africa (7,449 | 1.5%), together accounting for 17.8% of all Omaha residents.
| Immigration Origin | # Population | % Population |
| Afghanistan | 417 | 0.1% |
| Africa | 7,449 | 1.5% |
| Argentina | 26 | 0.0% |
| Asia | 16,357 | 3.3% |
| Australia | 90 | 0.0% |
| Austria | 5 | 0.0% |
| Bangladesh | 25 | 0.0% |
| Barbados | 8 | 0.0% |
| Belarus | 115 | 0.0% |
| Belgium | 12 | 0.0% |
| Belize | 56 | 0.0% |
| Bosnia and Herzegovina | 120 | 0.0% |
| Brazil | 133 | 0.0% |
| Bulgaria | 18 | 0.0% |
| Cambodia | 6 | 0.0% |
| Cameroon | 209 | 0.0% |
| Canada | 894 | 0.2% |
| Caribbean | 736 | 0.2% |
| Central America | 22,290 | 4.6% |
| Chile | 271 | 0.1% |
| China | 1,987 | 0.4% |
| Colombia | 516 | 0.1% |
| Congo | 43 | 0.0% |
| Costa Rica | 45 | 0.0% |
| Croatia | 20 | 0.0% |
| Cuba | 535 | 0.1% |
| Czechoslovakia | 61 | 0.0% |
| Dominican Republic | 97 | 0.0% |
| Eastern Africa | 2,398 | 0.5% |
| Eastern Asia | 2,877 | 0.6% |
| Eastern Europe | 1,217 | 0.3% |
| Ecuador | 23 | 0.0% |
| Egypt | 360 | 0.1% |
| El Salvador | 1,687 | 0.3% |
| England | 216 | 0.0% |
| Ethiopia | 306 | 0.1% |
| Europe | 2,990 | 0.6% |
| France | 161 | 0.0% |
| Germany | 555 | 0.1% |
| Ghana | 194 | 0.0% |
| Greece | 66 | 0.0% |
| Guatemala | 2,968 | 0.6% |
| Honduras | 800 | 0.2% |
| Hong Kong | 107 | 0.0% |
| Hungary | 54 | 0.0% |
| India | 2,886 | 0.6% |
| Indonesia | 107 | 0.0% |
| Iran | 320 | 0.1% |
| Iraq | 178 | 0.0% |
| Ireland | 12 | 0.0% |
| Israel | 60 | 0.0% |
| Italy | 204 | 0.0% |
| Jamaica | 89 | 0.0% |
| Japan | 207 | 0.0% |
| Jordan | 147 | 0.0% |
| Kazakhstan | 31 | 0.0% |
| Kenya | 367 | 0.1% |
| Korea | 683 | 0.1% |
| Kuwait | 19 | 0.0% |
| Laos | 70 | 0.0% |
| Latin America | 24,667 | 5.0% |
| Latvia | 66 | 0.0% |
| Lebanon | 32 | 0.0% |
| Lithuania | 54 | 0.0% |
| Malaysia | 70 | 0.0% |
| Mexico | 16,543 | 3.4% |
| Micronesia | 14 | 0.0% |
| Middle Africa | 316 | 0.1% |
| Morocco | 19 | 0.0% |
| Nepal | 888 | 0.2% |
| Netherlands | 25 | 0.0% |
| Nicaragua | 160 | 0.0% |
| Nigeria | 391 | 0.1% |
| North Macedonia | 11 | 0.0% |
| Northern Africa | 1,492 | 0.3% |
| Northern Europe | 518 | 0.1% |
| Oceania | 137 | 0.0% |
| Pakistan | 77 | 0.0% |
| Panama | 25 | 0.0% |
| Peru | 255 | 0.1% |
| Philippines | 844 | 0.2% |
| Poland | 228 | 0.1% |
| Portugal | 14 | 0.0% |
| Romania | 55 | 0.0% |
| Russia | 135 | 0.0% |
| Saudi Arabia | 100 | 0.0% |
| Scotland | 27 | 0.0% |
| Sierra Leone | 96 | 0.0% |
| Somalia | 817 | 0.2% |
| South Africa | 249 | 0.1% |
| South America | 1,641 | 0.3% |
| South Central Asia | 5,773 | 1.2% |
| South Eastern Asia | 6,931 | 1.4% |
| Southern Europe | 453 | 0.1% |
| Spain | 169 | 0.0% |
| Sri Lanka | 24 | 0.0% |
| Sudan | 1,077 | 0.2% |
| Switzerland | 16 | 0.0% |
| Syria | 107 | 0.0% |
| Taiwan | 286 | 0.1% |
| Thailand | 1,868 | 0.4% |
| Trinidad and Tobago | 3 | 0.0% |
| Turkey | 85 | 0.0% |
| Uganda | 60 | 0.0% |
| Ukraine | 188 | 0.0% |
| Uzbekistan | 13 | 0.0% |
| Venezuela | 408 | 0.1% |
| Vietnam | 1,098 | 0.2% |
| Western Africa | 2,167 | 0.4% |
| Western Asia | 776 | 0.2% |
| Western Europe | 802 | 0.2% |
| Zaire | 64 | 0.0% |
| Zimbabwe | 101 | 0.0% | View All 113 Rows |
Sex and Age in Omaha
Sex and Age in Omaha
The most populous age groups in Omaha are 25 to 29 Years (19,658 | 8.1%) for men and 25 to 29 Years (18,615 | 7.6%) for women.
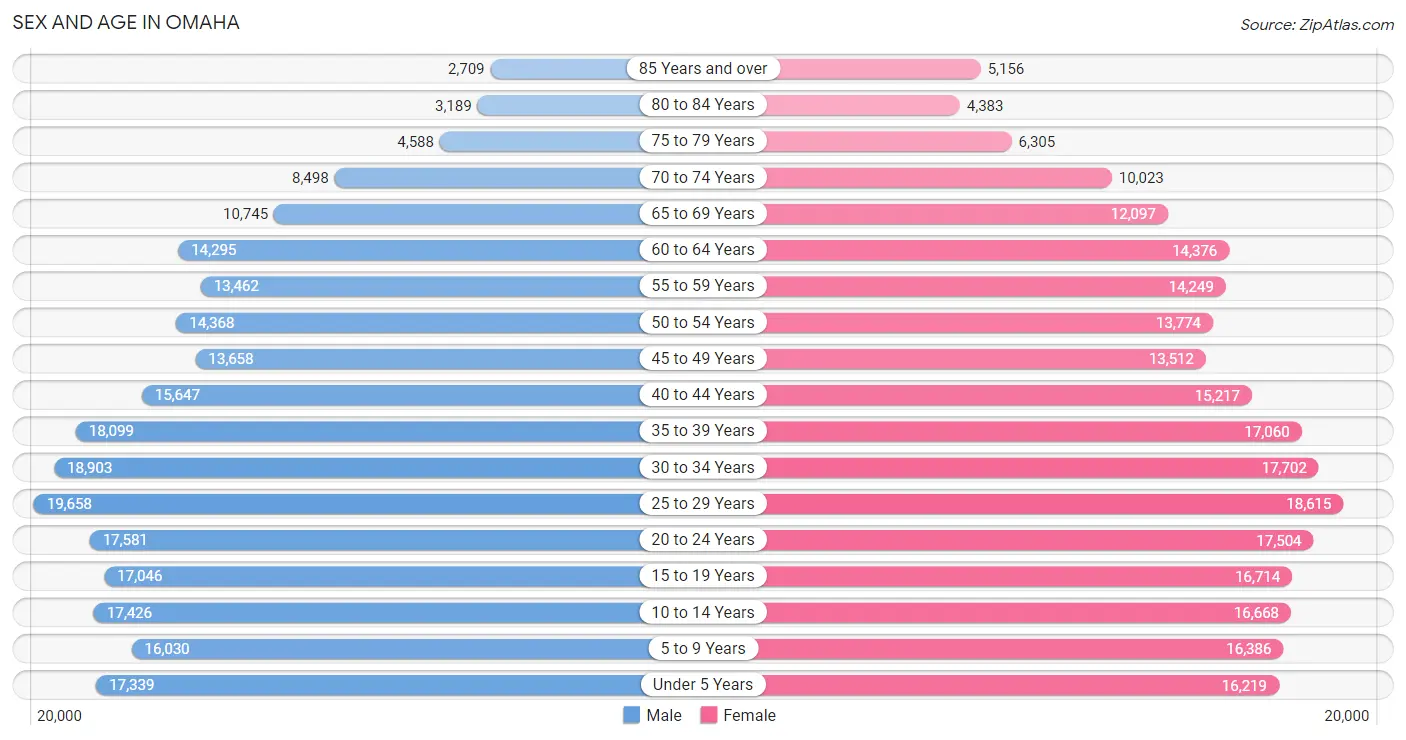
| Age Bracket | Male | Female |
| Under 5 Years | 17,339 (7.1%) | 16,219 (6.6%) |
| 5 to 9 Years | 16,030 (6.6%) | 16,386 (6.7%) |
| 10 to 14 Years | 17,426 (7.2%) | 16,668 (6.8%) |
| 15 to 19 Years | 17,046 (7.0%) | 16,714 (6.8%) |
| 20 to 24 Years | 17,581 (7.2%) | 17,504 (7.1%) |
| 25 to 29 Years | 19,658 (8.1%) | 18,615 (7.6%) |
| 30 to 34 Years | 18,903 (7.8%) | 17,702 (7.2%) |
| 35 to 39 Years | 18,099 (7.4%) | 17,060 (6.9%) |
| 40 to 44 Years | 15,647 (6.4%) | 15,217 (6.2%) |
| 45 to 49 Years | 13,658 (5.6%) | 13,512 (5.5%) |
| 50 to 54 Years | 14,368 (5.9%) | 13,774 (5.6%) |
| 55 to 59 Years | 13,462 (5.5%) | 14,249 (5.8%) |
| 60 to 64 Years | 14,295 (5.9%) | 14,376 (5.8%) |
| 65 to 69 Years | 10,745 (4.4%) | 12,097 (4.9%) |
| 70 to 74 Years | 8,498 (3.5%) | 10,023 (4.1%) |
| 75 to 79 Years | 4,588 (1.9%) | 6,305 (2.6%) |
| 80 to 84 Years | 3,189 (1.3%) | 4,383 (1.8%) |
| 85 Years and over | 2,709 (1.1%) | 5,156 (2.1%) |
| Total | 243,241 (100.0%) | 245,960 (100.0%) |
Families and Households in Omaha
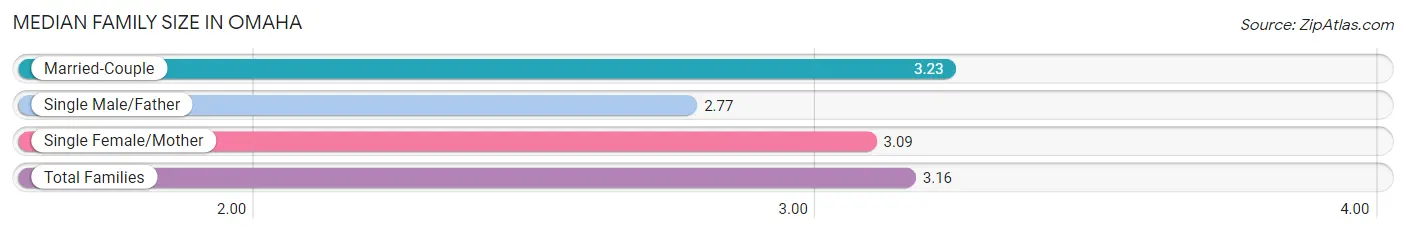
Median Family Size in Omaha
The median family size in Omaha is 3.16 persons per family, with married-couple families (81,896 | 71.0%) accounting for the largest median family size of 3.23 persons per family. On the other hand, single male/father families (10,398 | 9.0%) represent the smallest median family size with 2.77 persons per family.
| Family Type | # Families | Family Size |
| Married-Couple | 81,896 (71.0%) | 3.23 |
| Single Male/Father | 10,398 (9.0%) | 2.77 |
| Single Female/Mother | 22,983 (19.9%) | 3.09 |
| Total Families | 115,277 (100.0%) | 3.16 |
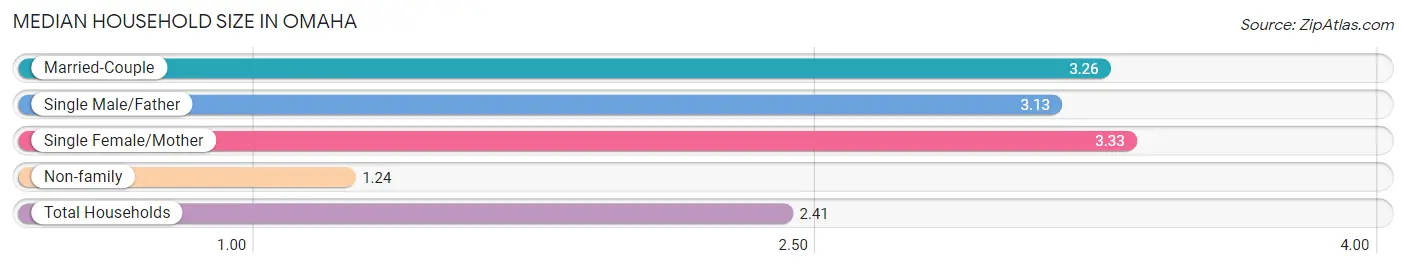
Median Household Size in Omaha
The median household size in Omaha is 2.41 persons per household, with single female/mother households (22,983 | 11.6%) accounting for the largest median household size of 3.33 persons per household. non-family households (82,565 | 41.7%) represent the smallest median household size with 1.24 persons per household.
| Household Type | # Households | Household Size |
| Married-Couple | 81,896 (41.4%) | 3.26 |
| Single Male/Father | 10,398 (5.3%) | 3.13 |
| Single Female/Mother | 22,983 (11.6%) | 3.33 |
| Non-family | 82,565 (41.7%) | 1.24 |
| Total Households | 197,842 (100.0%) | 2.41 |
Household Size by Marriage Status in Omaha
Out of a total of 197,842 households in Omaha, 115,277 (58.3%) are family households, while 82,565 (41.7%) are nonfamily households. The most numerous type of family households are 2-person households, comprising 49,556, and the most common type of nonfamily households are 1-person households, comprising 67,599.
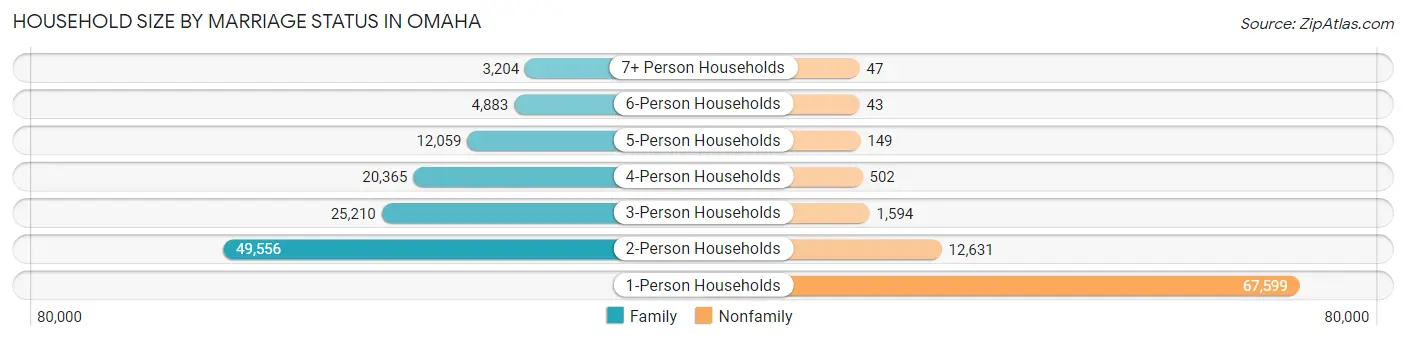
| Household Size | Family Households | Nonfamily Households |
| 1-Person Households | - | 67,599 (34.2%) |
| 2-Person Households | 49,556 (25.1%) | 12,631 (6.4%) |
| 3-Person Households | 25,210 (12.7%) | 1,594 (0.8%) |
| 4-Person Households | 20,365 (10.3%) | 502 (0.3%) |
| 5-Person Households | 12,059 (6.1%) | 149 (0.1%) |
| 6-Person Households | 4,883 (2.5%) | 43 (0.0%) |
| 7+ Person Households | 3,204 (1.6%) | 47 (0.0%) |
| Total | 115,277 (58.3%) | 82,565 (41.7%) |
Female Fertility in Omaha
Fertility by Age in Omaha
Average fertility rate in Omaha is 64.0 births per 1,000 women. Women in the age bracket of 20 to 34 years have the highest fertility rate with 109.0 births per 1,000 women. Women in the age bracket of 20 to 34 years acount for 76.8% of all women with births.
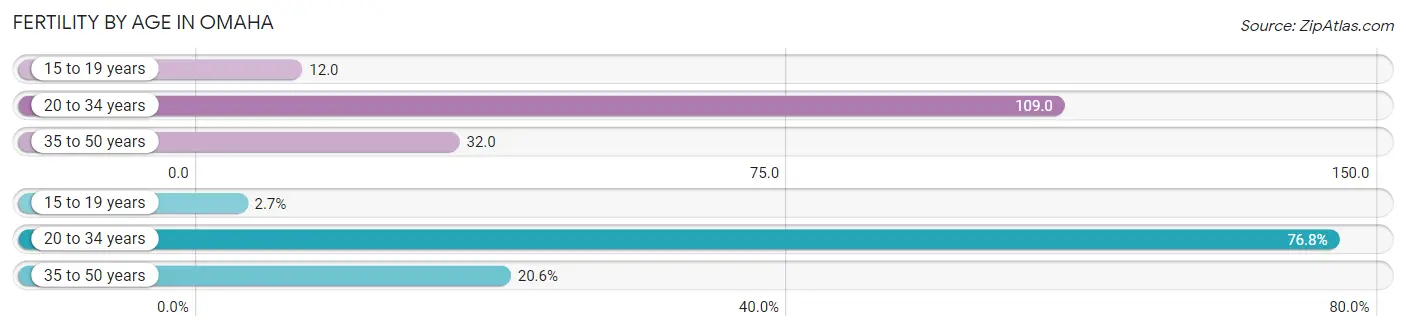
| Age Bracket | Women with Births | Births / 1,000 Women |
| 15 to 19 years | 205 (2.7%) | 12.0 |
| 20 to 34 years | 5,871 (76.8%) | 109.0 |
| 35 to 50 years | 1,572 (20.5%) | 32.0 |
| Total | 7,648 (100.0%) | 64.0 |
Fertility by Age by Marriage Status in Omaha
65.1% of women with births (7,648) in Omaha are married. The highest percentage of unmarried women with births falls into 15 to 19 years age bracket with 72.2% of them unmarried at the time of birth, while the lowest percentage of unmarried women with births belong to 35 to 50 years age bracket with 15.7% of them unmarried.
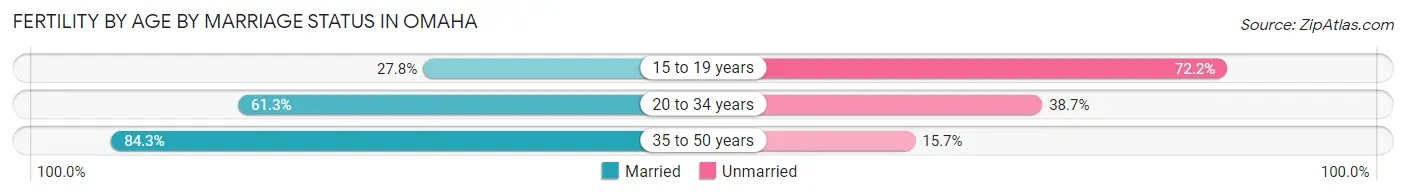
| Age Bracket | Married | Unmarried |
| 15 to 19 years | 57 (27.8%) | 148 (72.2%) |
| 20 to 34 years | 3,599 (61.3%) | 2,272 (38.7%) |
| 35 to 50 years | 1,325 (84.3%) | 247 (15.7%) |
| Total | 4,979 (65.1%) | 2,669 (34.9%) |
Fertility by Education in Omaha
Average fertility rate in Omaha is 64.0 births per 1,000 women. Women with the education attainment of high school diploma have the highest fertility rate of 88.0 births per 1,000 women, while women with the education attainment of less than high school have the lowest fertility at 50.0 births per 1,000 women. Women with the education attainment of college or associate's degree represent 27.8% of all women with births.
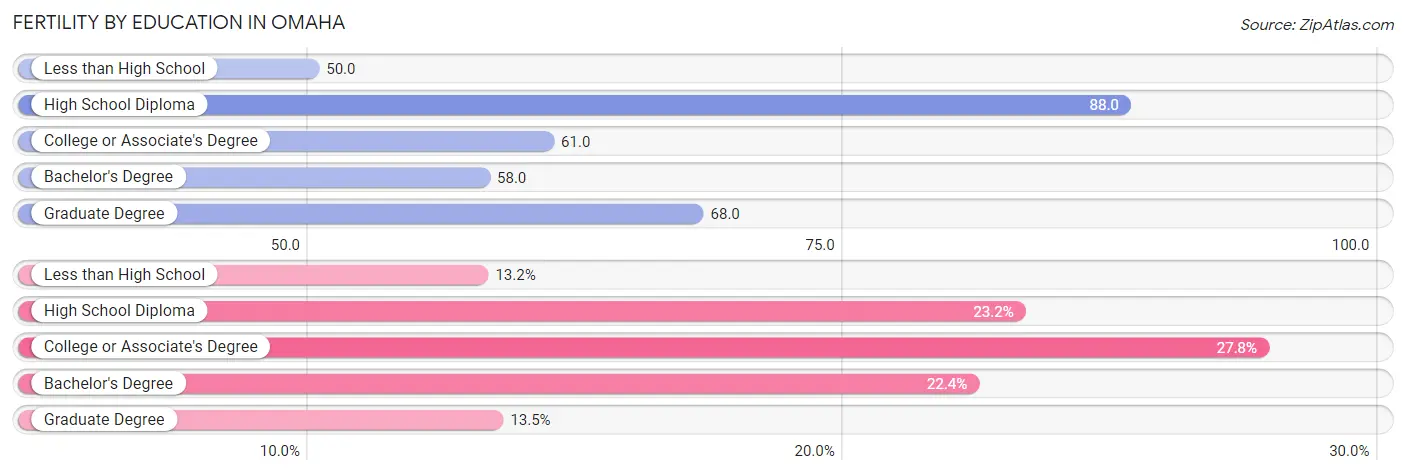
| Educational Attainment | Women with Births | Births / 1,000 Women |
| Less than High School | 1,007 (13.2%) | 50.0 |
| High School Diploma | 1,777 (23.2%) | 88.0 |
| College or Associate's Degree | 2,125 (27.8%) | 61.0 |
| Bachelor's Degree | 1,710 (22.4%) | 58.0 |
| Graduate Degree | 1,029 (13.5%) | 68.0 |
| Total | 7,648 (100.0%) | 64.0 |
Fertility by Education by Marriage Status in Omaha
34.9% of women with births in Omaha are unmarried. Women with the educational attainment of graduate degree are most likely to be married with 98.7% of them married at childbirth, while women with the educational attainment of high school diploma are least likely to be married with 55.9% of them unmarried at childbirth.
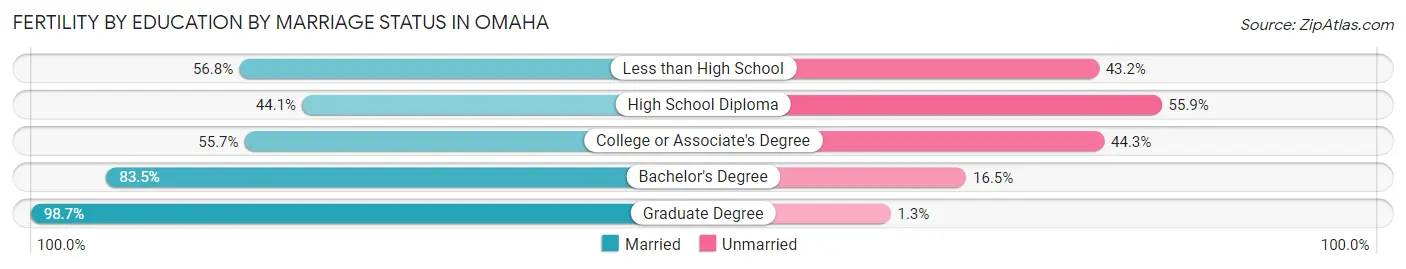
| Educational Attainment | Married | Unmarried |
| Less than High School | 572 (56.8%) | 435 (43.2%) |
| High School Diploma | 784 (44.1%) | 993 (55.9%) |
| College or Associate's Degree | 1,184 (55.7%) | 941 (44.3%) |
| Bachelor's Degree | 1,428 (83.5%) | 282 (16.5%) |
| Graduate Degree | 1,016 (98.7%) | 13 (1.3%) |
| Total | 4,979 (65.1%) | 2,669 (34.9%) |
Employment Characteristics in Omaha
Employment by Class of Employer in Omaha
Among the 251,518 employed individuals in Omaha, private company employees (173,294 | 68.9%), not-for-profit organizations (27,574 | 11.0%), and local government employees (14,393 | 5.7%) make up the most common classes of employment.
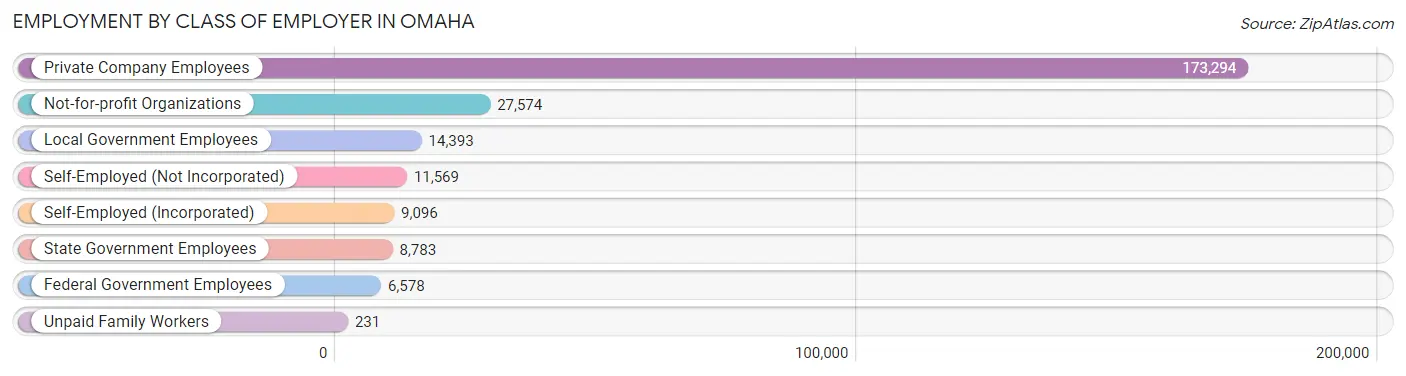
| Employer Class | # Employees | % Employees |
| Private Company Employees | 173,294 | 68.9% |
| Self-Employed (Incorporated) | 9,096 | 3.6% |
| Self-Employed (Not Incorporated) | 11,569 | 4.6% |
| Not-for-profit Organizations | 27,574 | 11.0% |
| Local Government Employees | 14,393 | 5.7% |
| State Government Employees | 8,783 | 3.5% |
| Federal Government Employees | 6,578 | 2.6% |
| Unpaid Family Workers | 231 | 0.1% |
| Total | 251,518 | 100.0% |
Employment Status by Age in Omaha
According to the labor force statistics for Omaha, out of the total population over 16 years of age (381,682), 69.9% or 266,796 individuals are in the labor force, with 4.2% or 11,205 of them unemployed. The age group with the highest labor force participation rate is 35 to 44 years, with 86.8% or 57,308 individuals in the labor force. Within the labor force, the 16 to 19 years age range has the highest percentage of unemployed individuals, with 14.3% or 2,073 of them being unemployed.
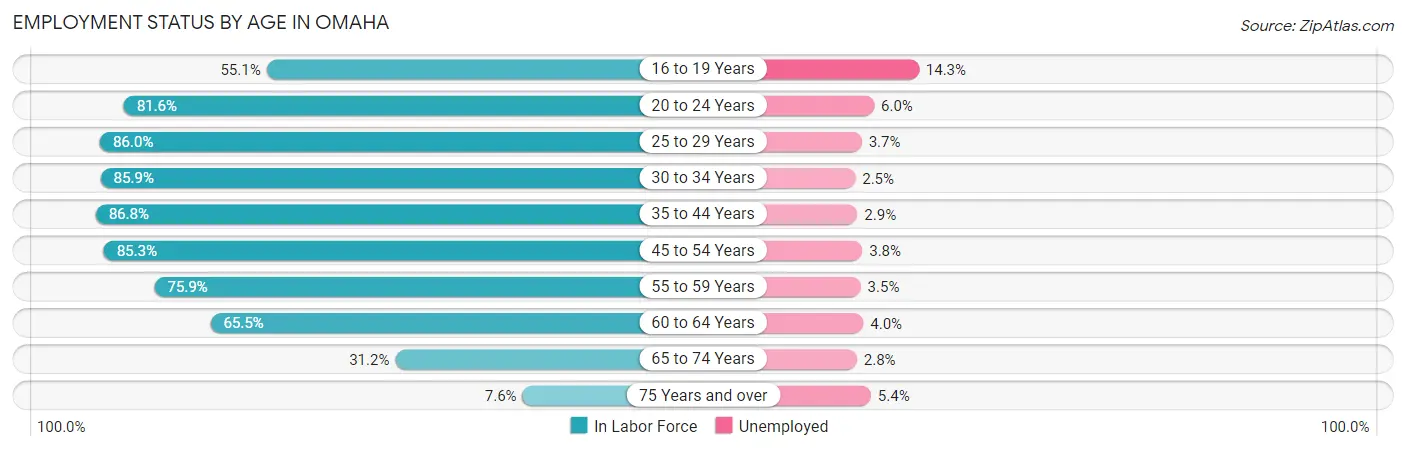
| Age Bracket | In Labor Force | Unemployed |
| 16 to 19 Years | 14,496 (55.1%) | 2,073 (14.3%) |
| 20 to 24 Years | 28,629 (81.6%) | 1,718 (6.0%) |
| 25 to 29 Years | 32,915 (86.0%) | 1,218 (3.7%) |
| 30 to 34 Years | 31,444 (85.9%) | 786 (2.5%) |
| 35 to 44 Years | 57,308 (86.8%) | 1,662 (2.9%) |
| 45 to 54 Years | 47,181 (85.3%) | 1,793 (3.8%) |
| 55 to 59 Years | 21,033 (75.9%) | 736 (3.5%) |
| 60 to 64 Years | 18,780 (65.5%) | 751 (4.0%) |
| 65 to 74 Years | 12,905 (31.2%) | 361 (2.8%) |
| 75 Years and over | 2,001 (7.6%) | 108 (5.4%) |
| Total | 266,796 (69.9%) | 11,205 (4.2%) |
Employment Status by Educational Attainment in Omaha
According to labor force statistics for Omaha, 82.6% of individuals (208,643) out of the total population between 25 and 64 years of age (252,595) are in the labor force, with 3.3% or 6,885 of them being unemployed. The group with the highest labor force participation rate are those with the educational attainment of bachelor's degree or higher, with 89.4% or 91,775 individuals in the labor force. Within the labor force, individuals with less than high school education have the highest percentage of unemployment, with 7.2% or 1,219 of them being unemployed.
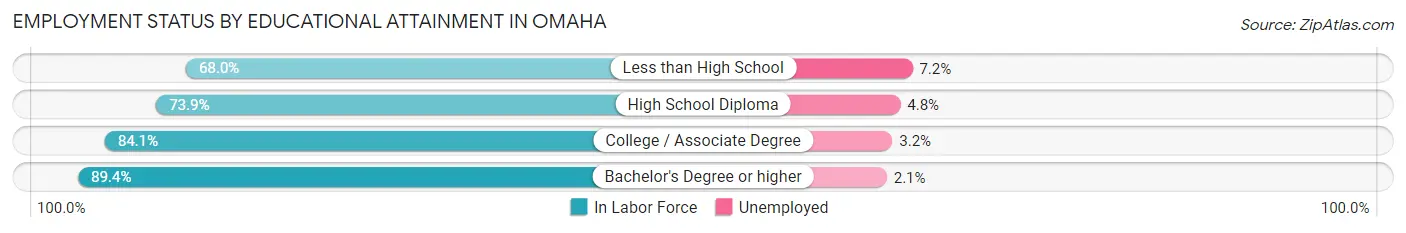
| Educational Attainment | In Labor Force | Unemployed |
| Less than High School | 16,929 (68.0%) | 1,793 (7.2%) |
| High School Diploma | 37,470 (73.9%) | 2,434 (4.8%) |
| College / Associate Degree | 62,518 (84.1%) | 2,379 (3.2%) |
| Bachelor's Degree or higher | 91,775 (89.4%) | 2,156 (2.1%) |
| Total | 208,643 (82.6%) | 8,336 (3.3%) |
Employment Occupations by Sex in Omaha
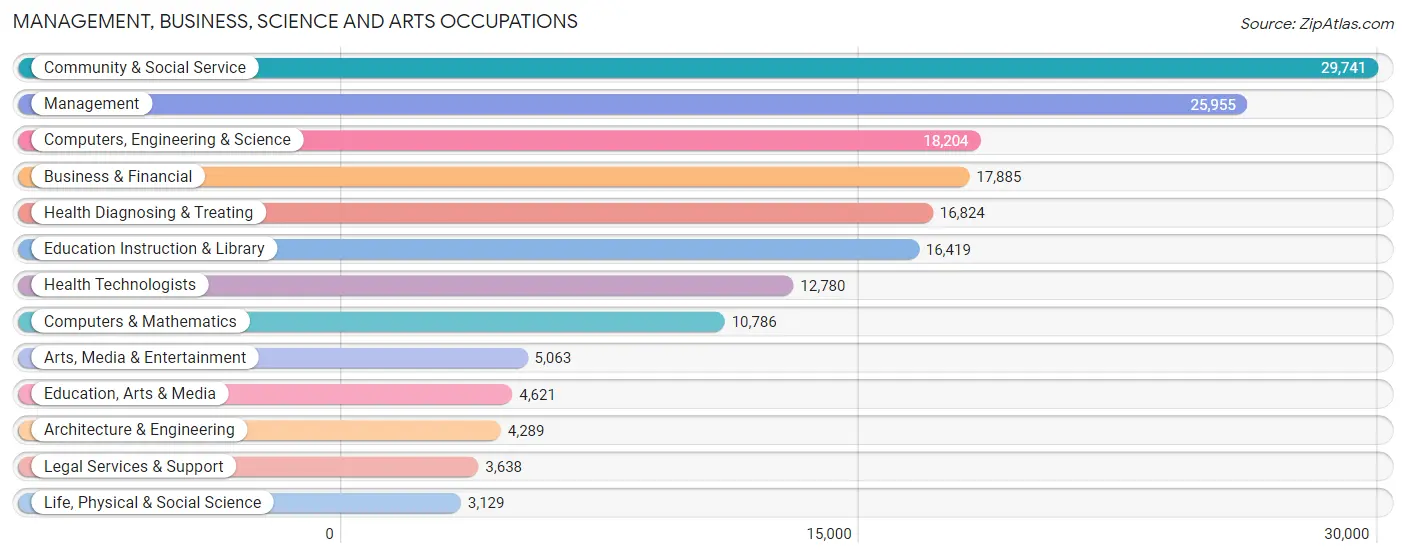
Management, Business, Science and Arts Occupations
The most common Management, Business, Science and Arts occupations in Omaha are Community & Social Service (29,741 | 11.7%), Management (25,955 | 10.2%), Computers, Engineering & Science (18,204 | 7.1%), Business & Financial (17,885 | 7.0%), and Health Diagnosing & Treating (16,824 | 6.6%).
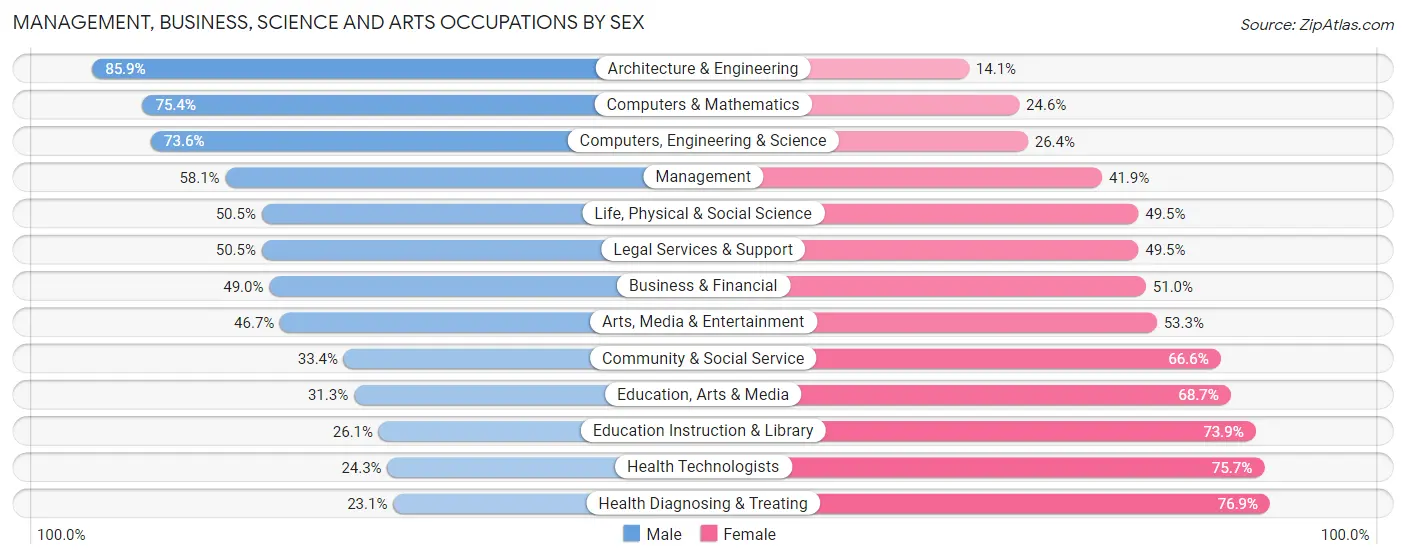
Management, Business, Science and Arts Occupations by Sex
Within the Management, Business, Science and Arts occupations in Omaha, the most male-oriented occupations are Architecture & Engineering (85.9%), Computers & Mathematics (75.4%), and Computers, Engineering & Science (73.6%), while the most female-oriented occupations are Health Diagnosing & Treating (76.9%), Health Technologists (75.7%), and Education Instruction & Library (73.9%).
| Occupation | Male | Female |
| Management | 15,081 (58.1%) | 10,874 (41.9%) |
| Business & Financial | 8,757 (49.0%) | 9,128 (51.0%) |
| Computers, Engineering & Science | 13,396 (73.6%) | 4,808 (26.4%) |
| Computers & Mathematics | 8,132 (75.4%) | 2,654 (24.6%) |
| Architecture & Engineering | 3,683 (85.9%) | 606 (14.1%) |
| Life, Physical & Social Science | 1,581 (50.5%) | 1,548 (49.5%) |
| Community & Social Service | 9,934 (33.4%) | 19,807 (66.6%) |
| Education, Arts & Media | 1,446 (31.3%) | 3,175 (68.7%) |
| Legal Services & Support | 1,838 (50.5%) | 1,800 (49.5%) |
| Education Instruction & Library | 4,286 (26.1%) | 12,133 (73.9%) |
| Arts, Media & Entertainment | 2,364 (46.7%) | 2,699 (53.3%) |
| Health Diagnosing & Treating | 3,886 (23.1%) | 12,938 (76.9%) |
| Health Technologists | 3,107 (24.3%) | 9,673 (75.7%) |
| Total (Category) | 51,054 (47.0%) | 57,555 (53.0%) |
| Total (Overall) | 133,296 (52.4%) | 121,287 (47.6%) |
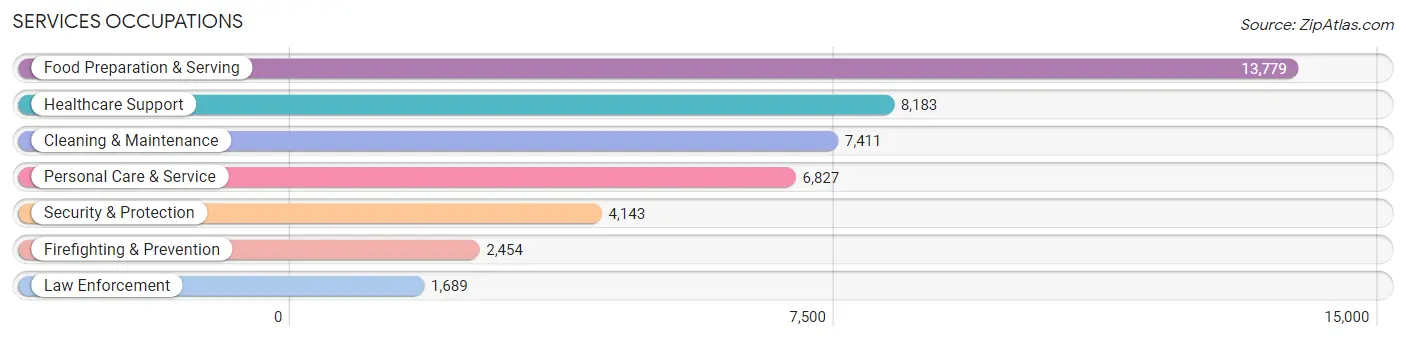
Services Occupations
The most common Services occupations in Omaha are Food Preparation & Serving (13,779 | 5.4%), Healthcare Support (8,183 | 3.2%), Cleaning & Maintenance (7,411 | 2.9%), Personal Care & Service (6,827 | 2.7%), and Security & Protection (4,143 | 1.6%).
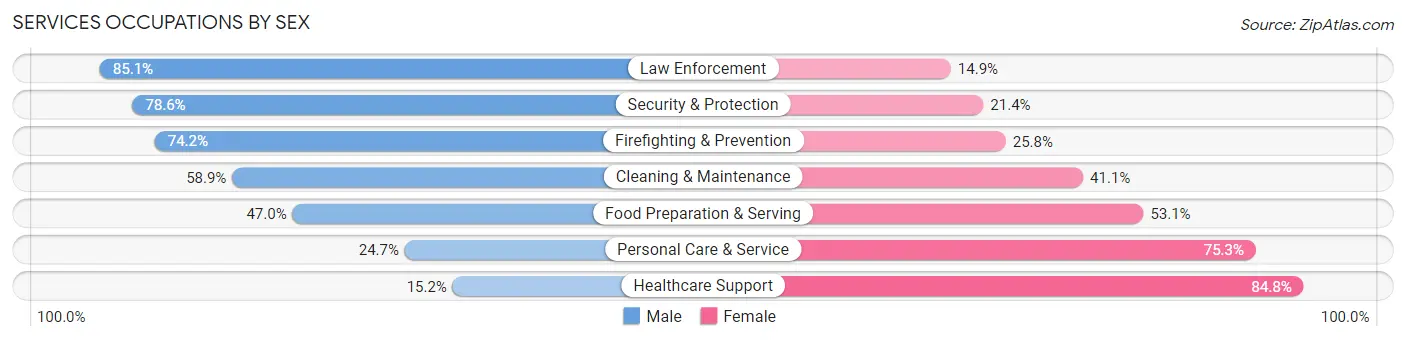
Services Occupations by Sex
Within the Services occupations in Omaha, the most male-oriented occupations are Law Enforcement (85.1%), Security & Protection (78.6%), and Firefighting & Prevention (74.2%), while the most female-oriented occupations are Healthcare Support (84.8%), Personal Care & Service (75.3%), and Food Preparation & Serving (53.0%).
| Occupation | Male | Female |
| Healthcare Support | 1,246 (15.2%) | 6,937 (84.8%) |
| Security & Protection | 3,258 (78.6%) | 885 (21.4%) |
| Firefighting & Prevention | 1,821 (74.2%) | 633 (25.8%) |
| Law Enforcement | 1,437 (85.1%) | 252 (14.9%) |
| Food Preparation & Serving | 6,469 (46.9%) | 7,310 (53.0%) |
| Cleaning & Maintenance | 4,364 (58.9%) | 3,047 (41.1%) |
| Personal Care & Service | 1,687 (24.7%) | 5,140 (75.3%) |
| Total (Category) | 17,024 (42.2%) | 23,319 (57.8%) |
| Total (Overall) | 133,296 (52.4%) | 121,287 (47.6%) |
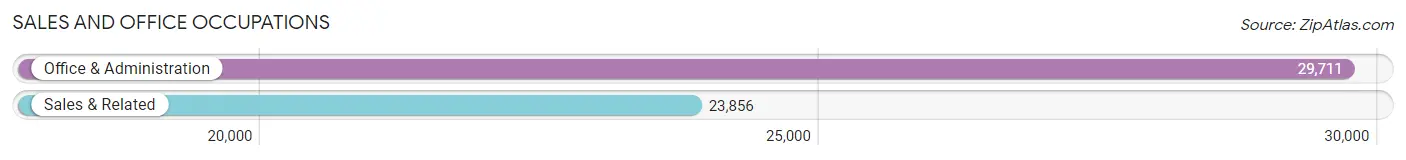
Sales and Office Occupations
The most common Sales and Office occupations in Omaha are Office & Administration (29,711 | 11.7%), and Sales & Related (23,856 | 9.4%).
Sales and Office Occupations by Sex
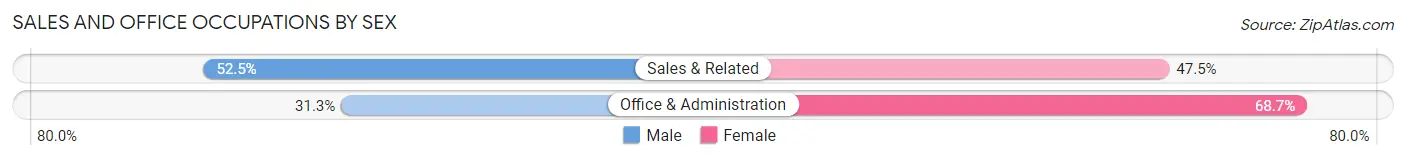
| Occupation | Male | Female |
| Sales & Related | 12,519 (52.5%) | 11,337 (47.5%) |
| Office & Administration | 9,303 (31.3%) | 20,408 (68.7%) |
| Total (Category) | 21,822 (40.7%) | 31,745 (59.3%) |
| Total (Overall) | 133,296 (52.4%) | 121,287 (47.6%) |
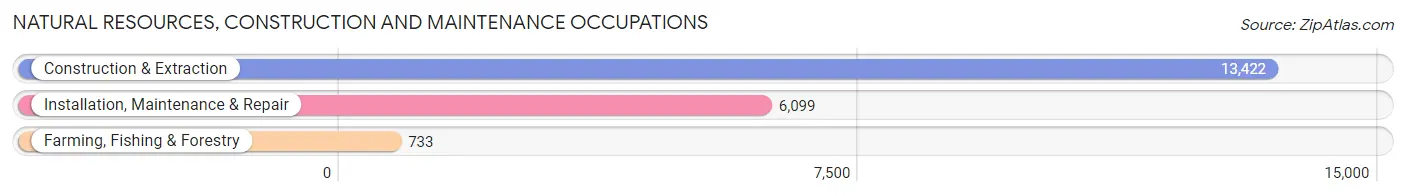
Natural Resources, Construction and Maintenance Occupations
The most common Natural Resources, Construction and Maintenance occupations in Omaha are Construction & Extraction (13,422 | 5.3%), Installation, Maintenance & Repair (6,099 | 2.4%), and Farming, Fishing & Forestry (733 | 0.3%).
Natural Resources, Construction and Maintenance Occupations by Sex
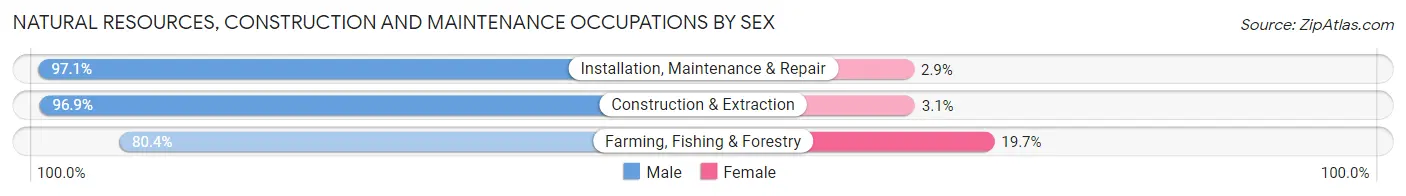
| Occupation | Male | Female |
| Farming, Fishing & Forestry | 589 (80.3%) | 144 (19.7%) |
| Construction & Extraction | 13,005 (96.9%) | 417 (3.1%) |
| Installation, Maintenance & Repair | 5,920 (97.1%) | 179 (2.9%) |
| Total (Category) | 19,514 (96.4%) | 740 (3.6%) |
| Total (Overall) | 133,296 (52.4%) | 121,287 (47.6%) |
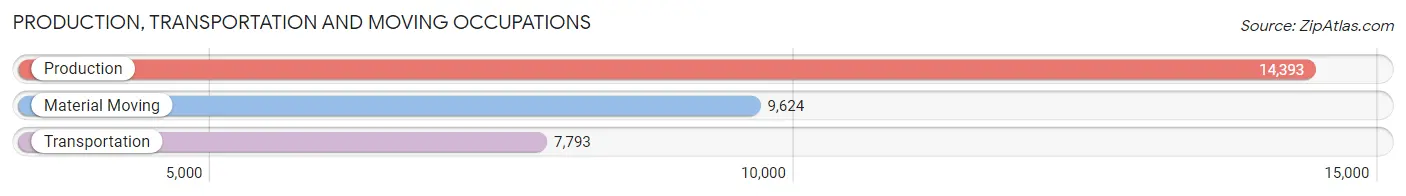
Production, Transportation and Moving Occupations
The most common Production, Transportation and Moving occupations in Omaha are Production (14,393 | 5.7%), Material Moving (9,624 | 3.8%), and Transportation (7,793 | 3.1%).
Production, Transportation and Moving Occupations by Sex
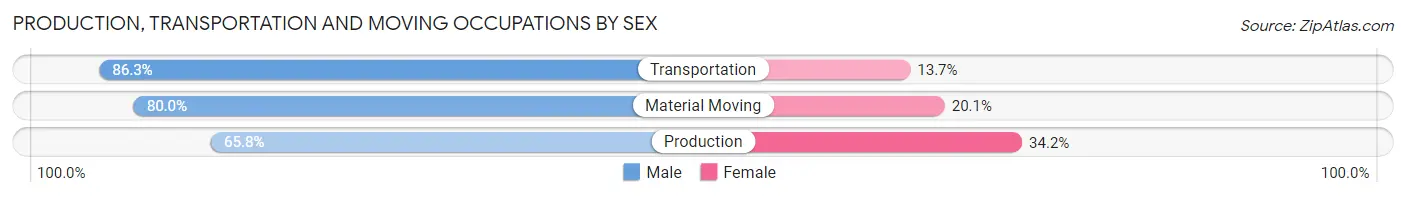
| Occupation | Male | Female |
| Production | 9,465 (65.8%) | 4,928 (34.2%) |
| Transportation | 6,723 (86.3%) | 1,070 (13.7%) |
| Material Moving | 7,694 (79.9%) | 1,930 (20.1%) |
| Total (Category) | 23,882 (75.1%) | 7,928 (24.9%) |
| Total (Overall) | 133,296 (52.4%) | 121,287 (47.6%) |
Employment Industries by Sex in Omaha
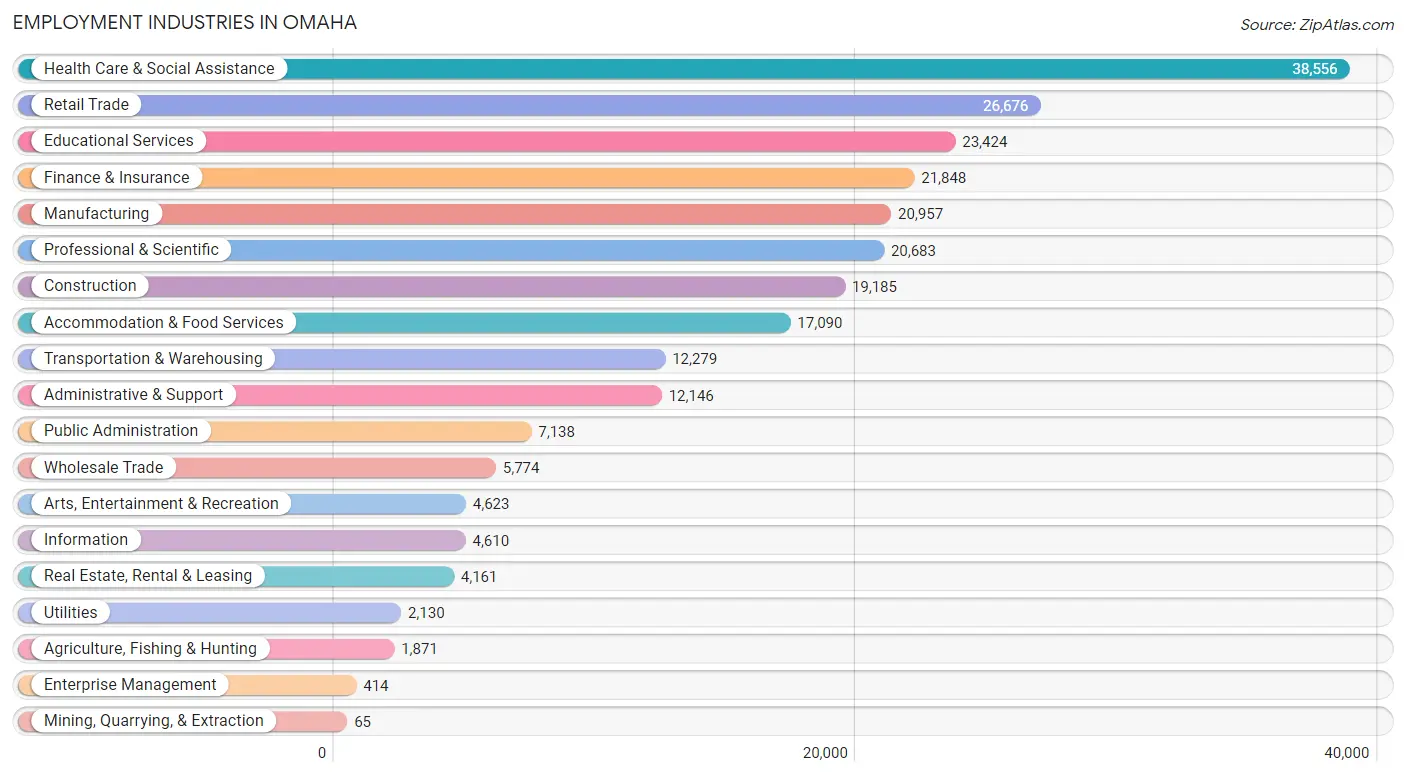
Employment Industries in Omaha
The major employment industries in Omaha include Health Care & Social Assistance (38,556 | 15.1%), Retail Trade (26,676 | 10.5%), Educational Services (23,424 | 9.2%), Finance & Insurance (21,848 | 8.6%), and Manufacturing (20,957 | 8.2%).
Employment Industries by Sex in Omaha
The Omaha industries that see more men than women are Construction (91.1%), Mining, Quarrying, & Extraction (90.8%), and Agriculture, Fishing & Hunting (82.0%), whereas the industries that tend to have a higher number of women are Health Care & Social Assistance (77.7%), Educational Services (67.6%), and Accommodation & Food Services (55.3%).
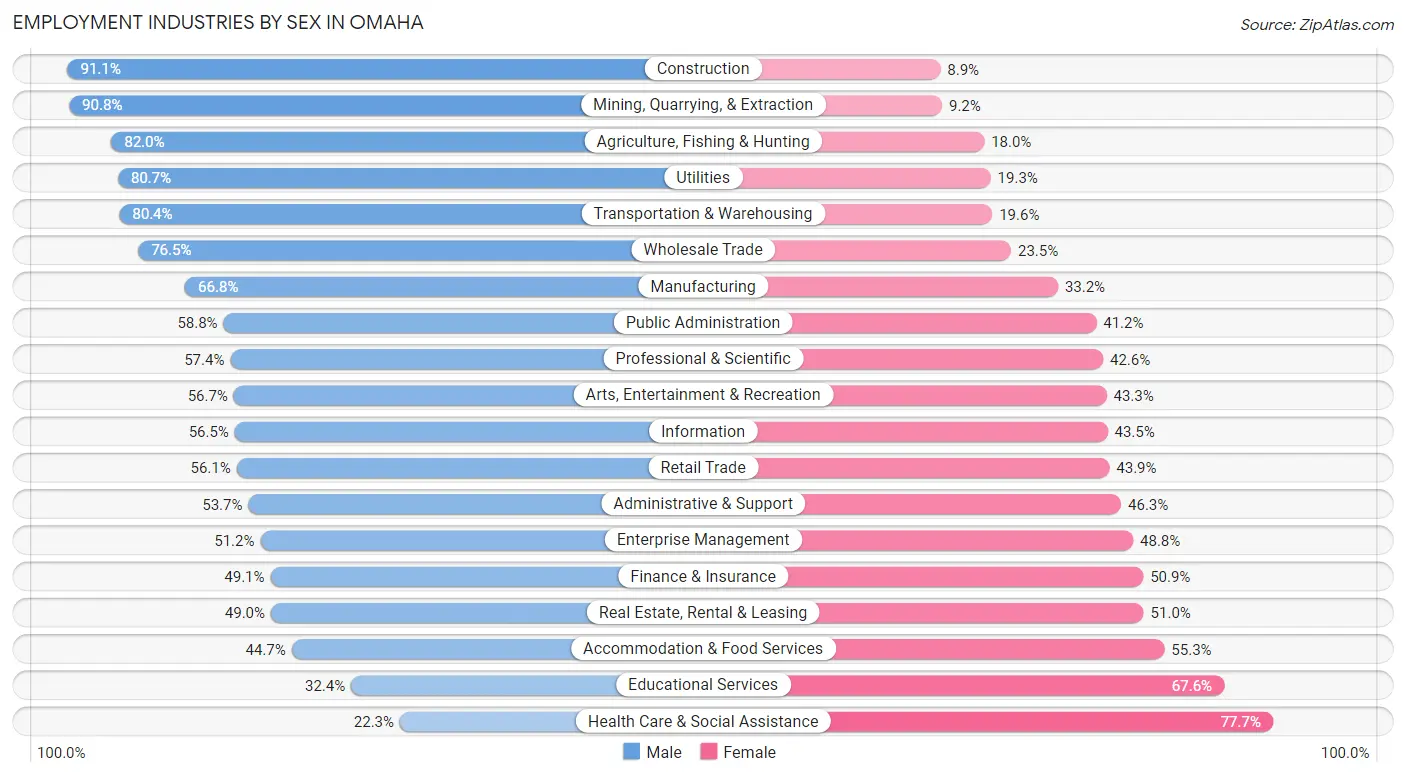
| Industry | Male | Female |
| Agriculture, Fishing & Hunting | 1,535 (82.0%) | 336 (18.0%) |
| Mining, Quarrying, & Extraction | 59 (90.8%) | 6 (9.2%) |
| Construction | 17,480 (91.1%) | 1,705 (8.9%) |
| Manufacturing | 13,994 (66.8%) | 6,963 (33.2%) |
| Wholesale Trade | 4,416 (76.5%) | 1,358 (23.5%) |
| Retail Trade | 14,974 (56.1%) | 11,702 (43.9%) |
| Transportation & Warehousing | 9,870 (80.4%) | 2,409 (19.6%) |
| Utilities | 1,719 (80.7%) | 411 (19.3%) |
| Information | 2,605 (56.5%) | 2,005 (43.5%) |
| Finance & Insurance | 10,734 (49.1%) | 11,114 (50.9%) |
| Real Estate, Rental & Leasing | 2,040 (49.0%) | 2,121 (51.0%) |
| Professional & Scientific | 11,880 (57.4%) | 8,803 (42.6%) |
| Enterprise Management | 212 (51.2%) | 202 (48.8%) |
| Administrative & Support | 6,522 (53.7%) | 5,624 (46.3%) |
| Educational Services | 7,597 (32.4%) | 15,827 (67.6%) |
| Health Care & Social Assistance | 8,605 (22.3%) | 29,951 (77.7%) |
| Arts, Entertainment & Recreation | 2,622 (56.7%) | 2,001 (43.3%) |
| Accommodation & Food Services | 7,646 (44.7%) | 9,444 (55.3%) |
| Public Administration | 4,200 (58.8%) | 2,938 (41.2%) |
| Total | 133,296 (52.4%) | 121,287 (47.6%) |
Education in Omaha
School Enrollment in Omaha
The most common levels of schooling among the 130,062 students in Omaha are high school (27,842 | 21.4%), college / undergraduate (26,687 | 20.5%), and middle school (25,765 | 19.8%).
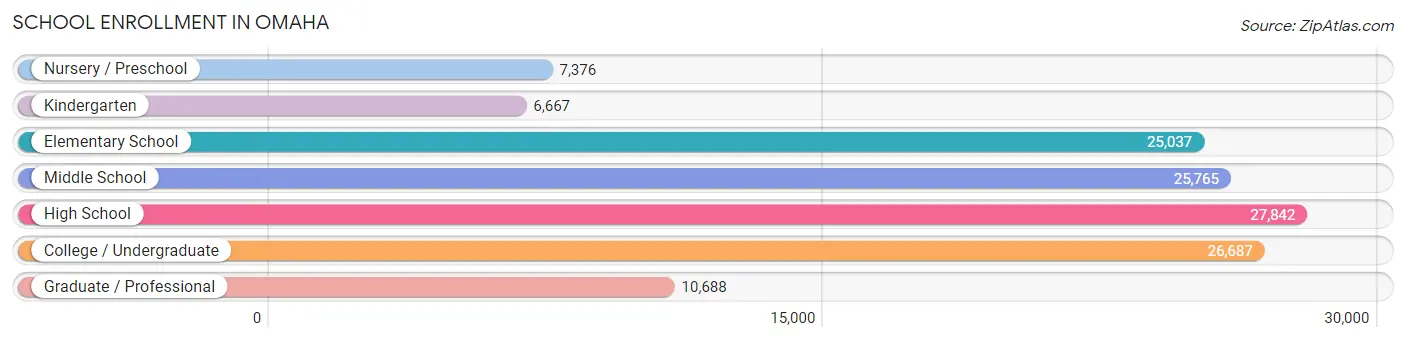
| School Level | # Students | % Students |
| Nursery / Preschool | 7,376 | 5.7% |
| Kindergarten | 6,667 | 5.1% |
| Elementary School | 25,037 | 19.3% |
| Middle School | 25,765 | 19.8% |
| High School | 27,842 | 21.4% |
| College / Undergraduate | 26,687 | 20.5% |
| Graduate / Professional | 10,688 | 8.2% |
| Total | 130,062 | 100.0% |
School Enrollment by Age by Funding Source in Omaha
Out of a total of 130,062 students who are enrolled in schools in Omaha, 29,784 (22.9%) attend a private institution, while the remaining 100,278 (77.1%) are enrolled in public schools. The age group of 3 to 4 year olds has the highest likelihood of being enrolled in private schools, with 2,444 (47.3% in the age bracket) enrolled. Conversely, the age group of 15 to 17 year olds has the lowest likelihood of being enrolled in a private school, with 16,505 (85.2% in the age bracket) attending a public institution.
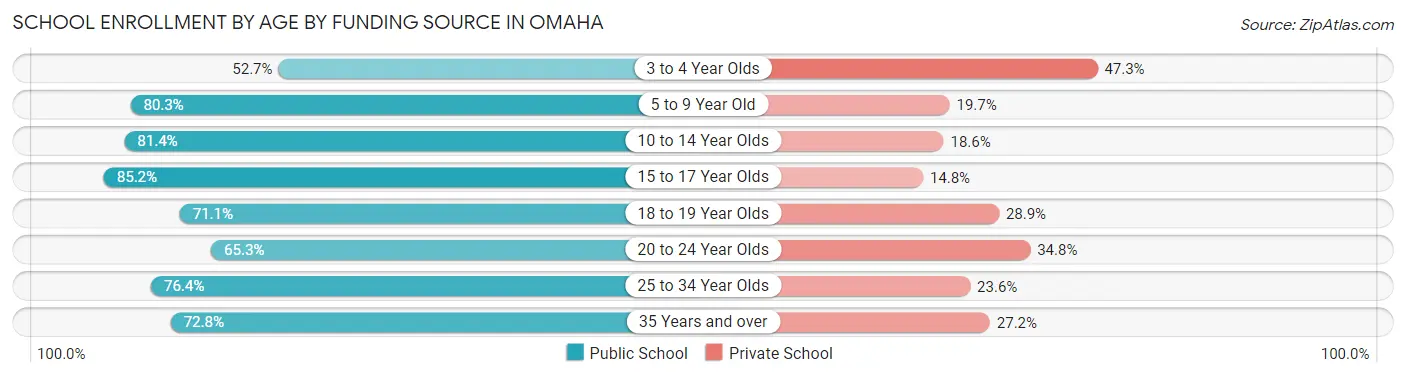
| Age Bracket | Public School | Private School |
| 3 to 4 Year Olds | 2,726 (52.7%) | 2,444 (47.3%) |
| 5 to 9 Year Old | 24,308 (80.3%) | 5,971 (19.7%) |
| 10 to 14 Year Olds | 27,102 (81.4%) | 6,191 (18.6%) |
| 15 to 17 Year Olds | 16,505 (85.2%) | 2,861 (14.8%) |
| 18 to 19 Year Olds | 7,251 (71.1%) | 2,950 (28.9%) |
| 20 to 24 Year Olds | 9,902 (65.2%) | 5,273 (34.7%) |
| 25 to 34 Year Olds | 7,451 (76.4%) | 2,297 (23.6%) |
| 35 Years and over | 4,970 (72.8%) | 1,860 (27.2%) |
| Total | 100,278 (77.1%) | 29,784 (22.9%) |
Educational Attainment by Field of Study in Omaha
Business (30,334 | 21.9%), education (16,890 | 12.2%), science & technology (14,428 | 10.4%), bio, nature & agricultural (10,019 | 7.2%), and arts & humanities (9,627 | 6.9%) are the most common fields of study among 138,666 individuals in Omaha who have obtained a bachelor's degree or higher.
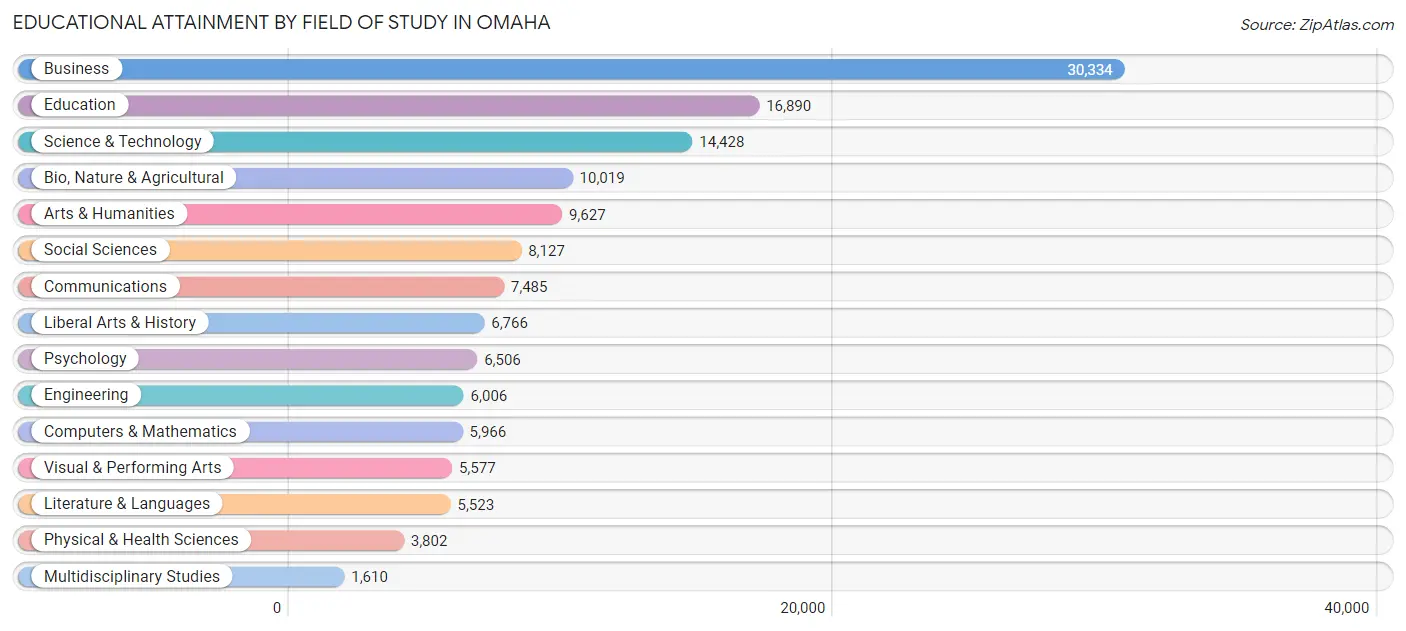
| Field of Study | # Graduates | % Graduates |
| Computers & Mathematics | 5,966 | 4.3% |
| Bio, Nature & Agricultural | 10,019 | 7.2% |
| Physical & Health Sciences | 3,802 | 2.7% |
| Psychology | 6,506 | 4.7% |
| Social Sciences | 8,127 | 5.9% |
| Engineering | 6,006 | 4.3% |
| Multidisciplinary Studies | 1,610 | 1.2% |
| Science & Technology | 14,428 | 10.4% |
| Business | 30,334 | 21.9% |
| Education | 16,890 | 12.2% |
| Literature & Languages | 5,523 | 4.0% |
| Liberal Arts & History | 6,766 | 4.9% |
| Visual & Performing Arts | 5,577 | 4.0% |
| Communications | 7,485 | 5.4% |
| Arts & Humanities | 9,627 | 6.9% |
| Total | 138,666 | 100.0% |
Transportation & Commute in Omaha
Vehicle Availability by Sex in Omaha
The most prevalent vehicle ownership categories in Omaha are males with 2 vehicles (58,927, accounting for 44.9%) and females with 2 vehicles (51,807, making up 50.0%).
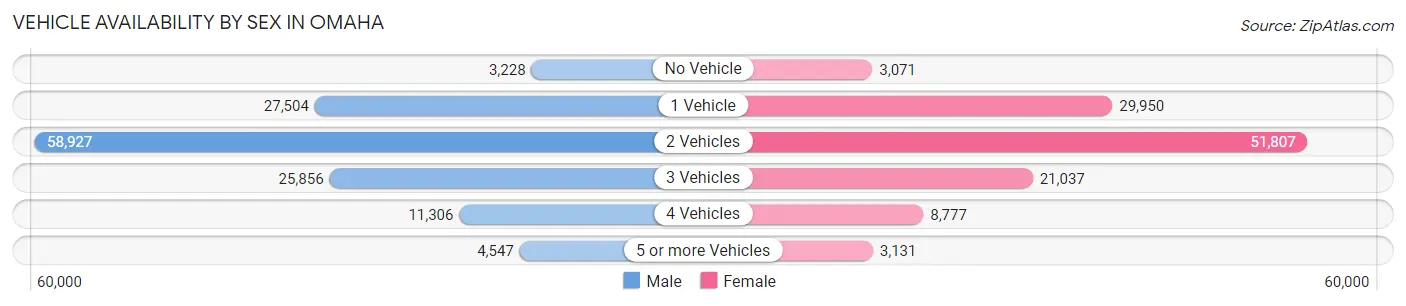
| Vehicles Available | Male | Female |
| No Vehicle | 3,228 (2.5%) | 3,071 (2.6%) |
| 1 Vehicle | 27,504 (20.9%) | 29,950 (25.4%) |
| 2 Vehicles | 58,927 (44.9%) | 51,807 (44.0%) |
| 3 Vehicles | 25,856 (19.7%) | 21,037 (17.9%) |
| 4 Vehicles | 11,306 (8.6%) | 8,777 (7.4%) |
| 5 or more Vehicles | 4,547 (3.5%) | 3,131 (2.7%) |
| Total | 131,368 (100.0%) | 117,773 (100.0%) |
Commute Time in Omaha
The most frequently occuring commute durations in Omaha are 15 to 19 minutes (50,524 commuters, 22.7%), 20 to 24 minutes (41,903 commuters, 18.8%), and 10 to 14 minutes (41,598 commuters, 18.7%).
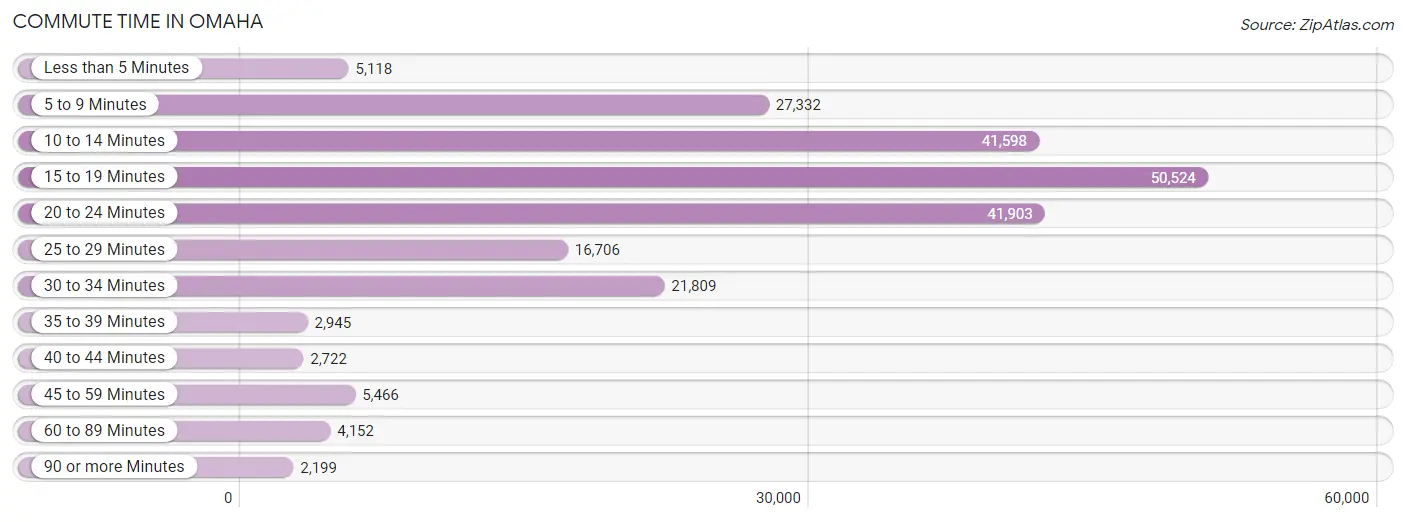
| Commute Time | # Commuters | % Commuters |
| Less than 5 Minutes | 5,118 | 2.3% |
| 5 to 9 Minutes | 27,332 | 12.3% |
| 10 to 14 Minutes | 41,598 | 18.7% |
| 15 to 19 Minutes | 50,524 | 22.7% |
| 20 to 24 Minutes | 41,903 | 18.8% |
| 25 to 29 Minutes | 16,706 | 7.5% |
| 30 to 34 Minutes | 21,809 | 9.8% |
| 35 to 39 Minutes | 2,945 | 1.3% |
| 40 to 44 Minutes | 2,722 | 1.2% |
| 45 to 59 Minutes | 5,466 | 2.5% |
| 60 to 89 Minutes | 4,152 | 1.9% |
| 90 or more Minutes | 2,199 | 1.0% |
Commute Time by Sex in Omaha
The most common commute times in Omaha are 15 to 19 minutes (27,387 commuters, 23.1%) for males and 15 to 19 minutes (23,137 commuters, 22.3%) for females.
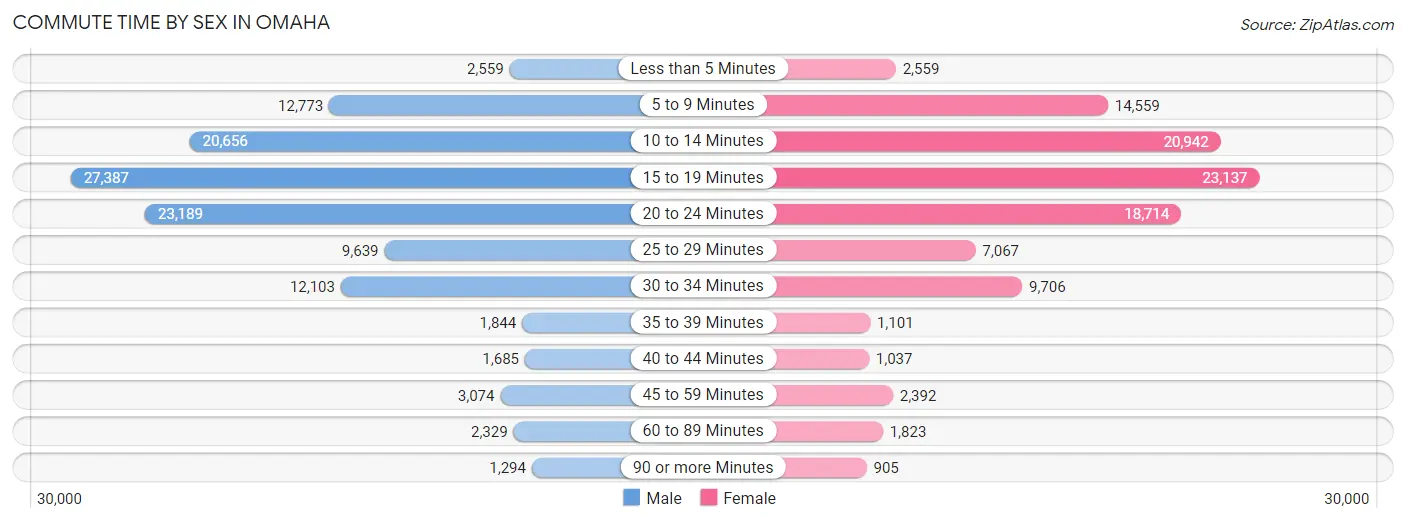
| Commute Time | Male | Female |
| Less than 5 Minutes | 2,559 (2.2%) | 2,559 (2.5%) |
| 5 to 9 Minutes | 12,773 (10.8%) | 14,559 (14.0%) |
| 10 to 14 Minutes | 20,656 (17.4%) | 20,942 (20.2%) |
| 15 to 19 Minutes | 27,387 (23.1%) | 23,137 (22.3%) |
| 20 to 24 Minutes | 23,189 (19.6%) | 18,714 (18.0%) |
| 25 to 29 Minutes | 9,639 (8.1%) | 7,067 (6.8%) |
| 30 to 34 Minutes | 12,103 (10.2%) | 9,706 (9.3%) |
| 35 to 39 Minutes | 1,844 (1.6%) | 1,101 (1.1%) |
| 40 to 44 Minutes | 1,685 (1.4%) | 1,037 (1.0%) |
| 45 to 59 Minutes | 3,074 (2.6%) | 2,392 (2.3%) |
| 60 to 89 Minutes | 2,329 (2.0%) | 1,823 (1.8%) |
| 90 or more Minutes | 1,294 (1.1%) | 905 (0.9%) |
Time of Departure to Work by Sex in Omaha
The most frequent times of departure to work in Omaha are 7:00 AM to 7:29 AM (17,938, 15.1%) for males and 7:30 AM to 7:59 AM (17,707, 17.0%) for females.
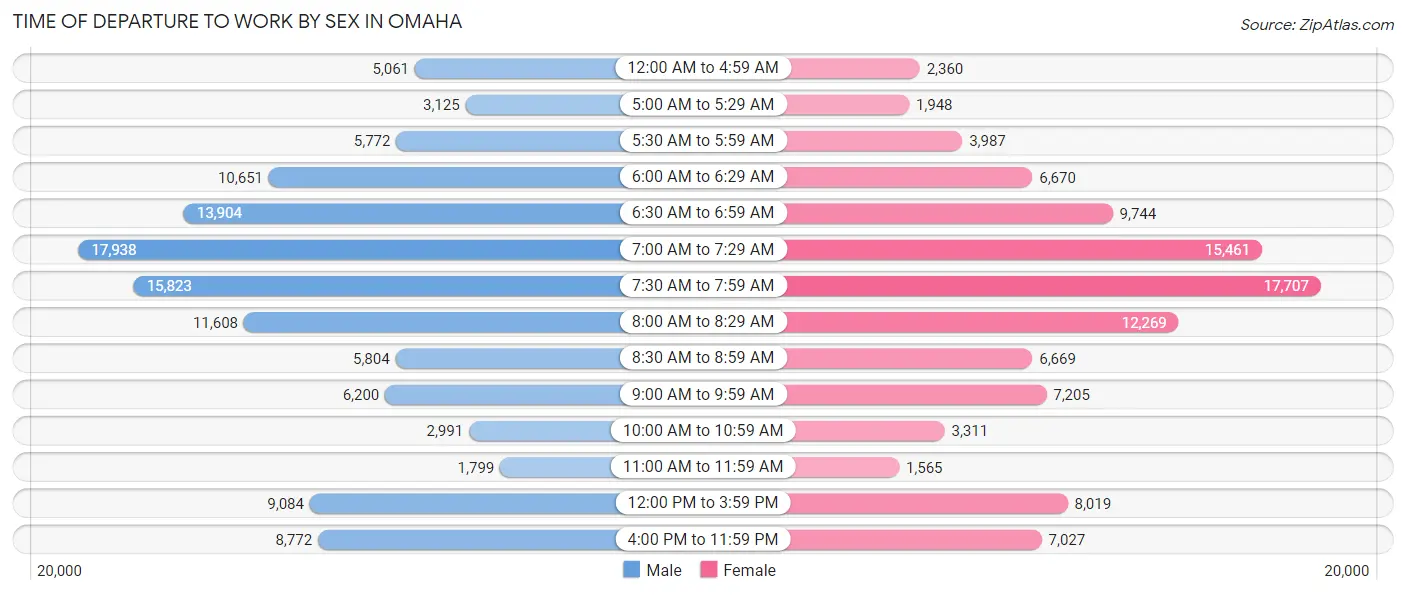
| Time of Departure | Male | Female |
| 12:00 AM to 4:59 AM | 5,061 (4.3%) | 2,360 (2.3%) |
| 5:00 AM to 5:29 AM | 3,125 (2.6%) | 1,948 (1.9%) |
| 5:30 AM to 5:59 AM | 5,772 (4.9%) | 3,987 (3.8%) |
| 6:00 AM to 6:29 AM | 10,651 (9.0%) | 6,670 (6.4%) |
| 6:30 AM to 6:59 AM | 13,904 (11.7%) | 9,744 (9.4%) |
| 7:00 AM to 7:29 AM | 17,938 (15.1%) | 15,461 (14.9%) |
| 7:30 AM to 7:59 AM | 15,823 (13.4%) | 17,707 (17.0%) |
| 8:00 AM to 8:29 AM | 11,608 (9.8%) | 12,269 (11.8%) |
| 8:30 AM to 8:59 AM | 5,804 (4.9%) | 6,669 (6.4%) |
| 9:00 AM to 9:59 AM | 6,200 (5.2%) | 7,205 (6.9%) |
| 10:00 AM to 10:59 AM | 2,991 (2.5%) | 3,311 (3.2%) |
| 11:00 AM to 11:59 AM | 1,799 (1.5%) | 1,565 (1.5%) |
| 12:00 PM to 3:59 PM | 9,084 (7.7%) | 8,019 (7.7%) |
| 4:00 PM to 11:59 PM | 8,772 (7.4%) | 7,027 (6.8%) |
| Total | 118,532 (100.0%) | 103,942 (100.0%) |
Housing Occupancy in Omaha
Occupancy by Ownership in Omaha
Of the total 197,842 dwellings in Omaha, owner-occupied units account for 114,534 (57.9%), while renter-occupied units make up 83,308 (42.1%).
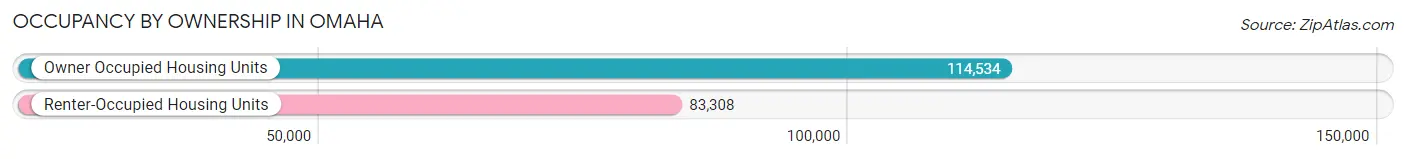
| Occupancy | # Housing Units | % Housing Units |
| Owner Occupied Housing Units | 114,534 | 57.9% |
| Renter-Occupied Housing Units | 83,308 | 42.1% |
| Total Occupied Housing Units | 197,842 | 100.0% |
Occupancy by Household Size in Omaha
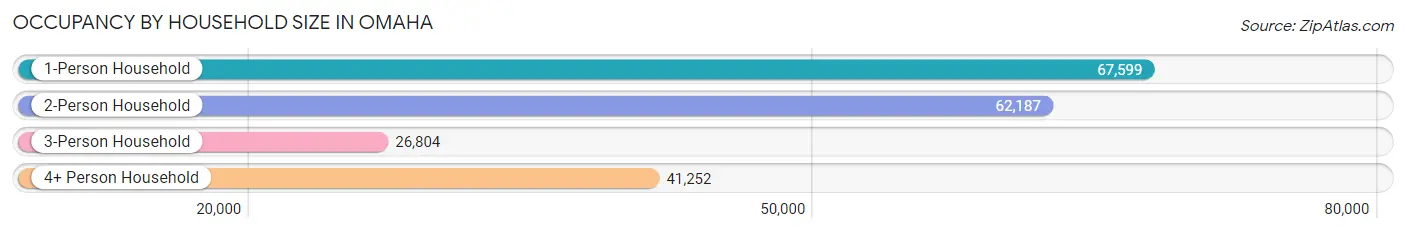
| Household Size | # Housing Units | % Housing Units |
| 1-Person Household | 67,599 | 34.2% |
| 2-Person Household | 62,187 | 31.4% |
| 3-Person Household | 26,804 | 13.6% |
| 4+ Person Household | 41,252 | 20.8% |
| Total Housing Units | 197,842 | 100.0% |
Occupancy by Ownership by Household Size in Omaha
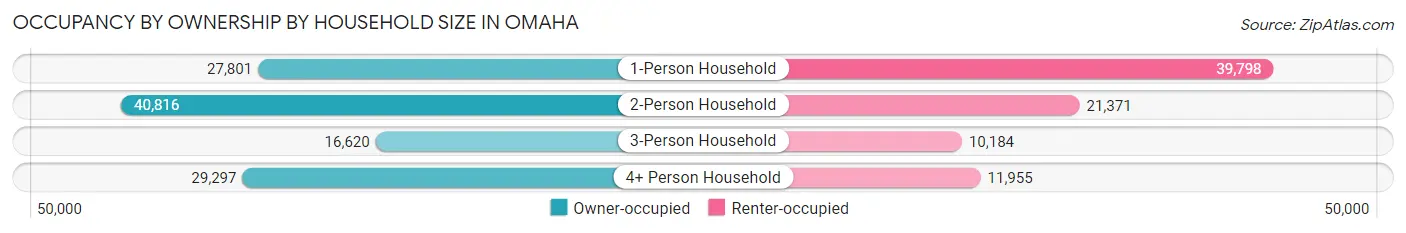
| Household Size | Owner-occupied | Renter-occupied |
| 1-Person Household | 27,801 (41.1%) | 39,798 (58.9%) |
| 2-Person Household | 40,816 (65.6%) | 21,371 (34.4%) |
| 3-Person Household | 16,620 (62.0%) | 10,184 (38.0%) |
| 4+ Person Household | 29,297 (71.0%) | 11,955 (29.0%) |
| Total Housing Units | 114,534 (57.9%) | 83,308 (42.1%) |
Occupancy by Educational Attainment in Omaha
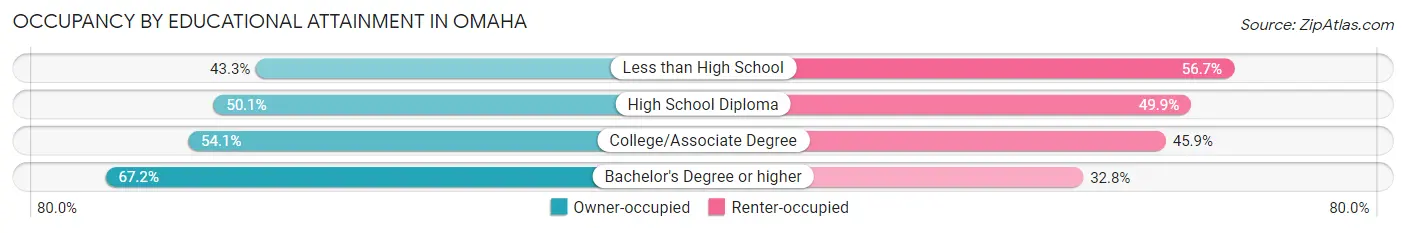
| Household Size | Owner-occupied | Renter-occupied |
| Less than High School | 6,400 (43.3%) | 8,392 (56.7%) |
| High School Diploma | 19,194 (50.1%) | 19,147 (49.9%) |
| College/Associate Degree | 34,032 (54.1%) | 28,923 (45.9%) |
| Bachelor's Degree or higher | 54,908 (67.2%) | 26,846 (32.8%) |
Occupancy by Age of Householder in Omaha
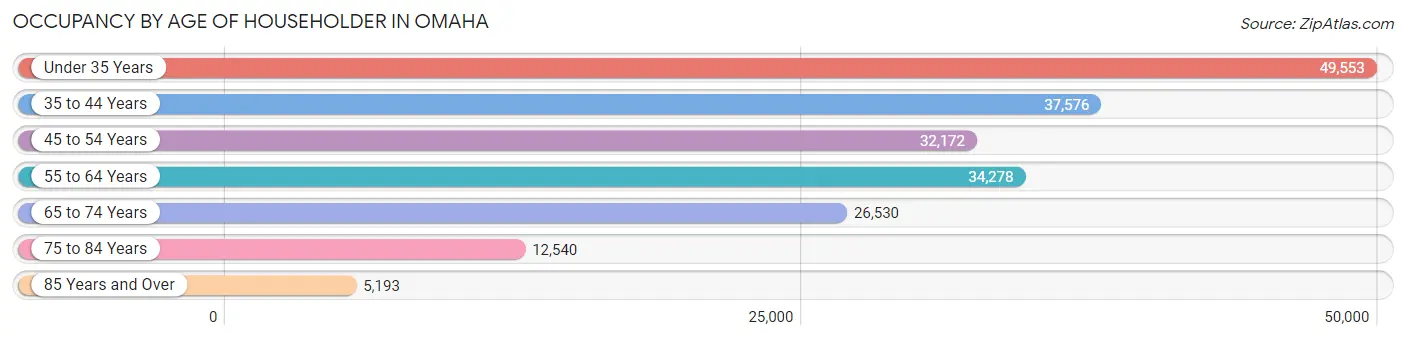
| Age Bracket | # Households | % Households |
| Under 35 Years | 49,553 | 25.1% |
| 35 to 44 Years | 37,576 | 19.0% |
| 45 to 54 Years | 32,172 | 16.3% |
| 55 to 64 Years | 34,278 | 17.3% |
| 65 to 74 Years | 26,530 | 13.4% |
| 75 to 84 Years | 12,540 | 6.3% |
| 85 Years and Over | 5,193 | 2.6% |
| Total | 197,842 | 100.0% |
Housing Finances in Omaha
Median Income by Occupancy in Omaha
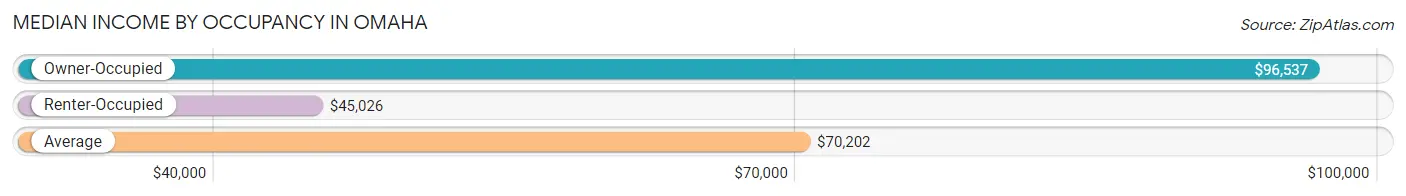
| Occupancy Type | # Households | Median Income |
| Owner-Occupied | 114,534 (57.9%) | $96,537 |
| Renter-Occupied | 83,308 (42.1%) | $45,026 |
| Average | 197,842 (100.0%) | $70,202 |
Occupancy by Householder Income Bracket in Omaha
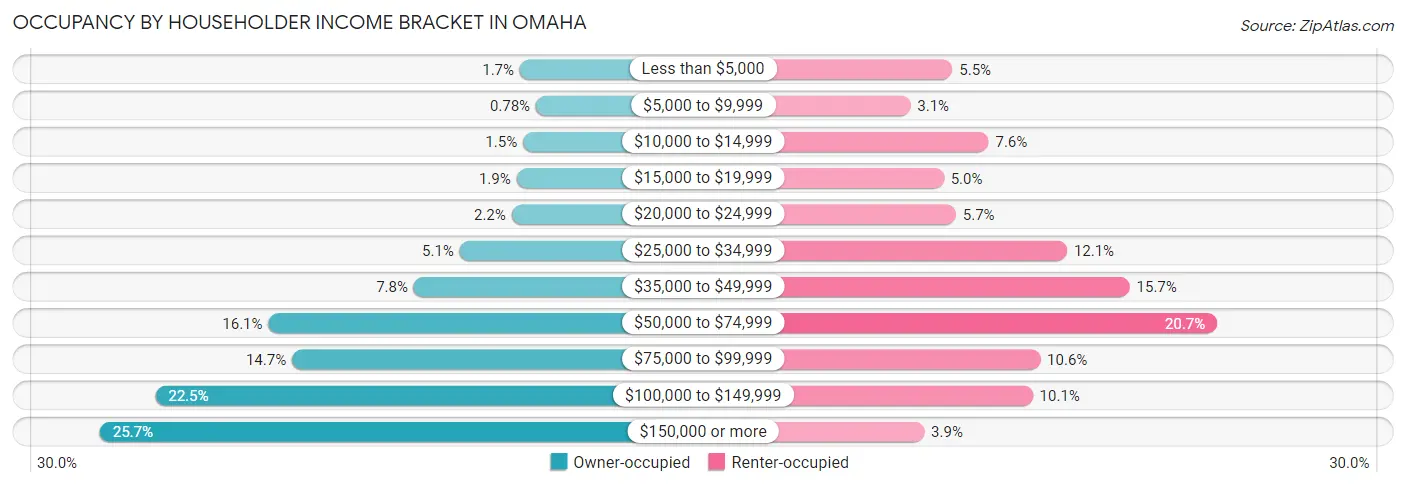
| Income Bracket | Owner-occupied | Renter-occupied |
| Less than $5,000 | 1,950 (1.7%) | 4,603 (5.5%) |
| $5,000 to $9,999 | 898 (0.8%) | 2,606 (3.1%) |
| $10,000 to $14,999 | 1,744 (1.5%) | 6,331 (7.6%) |
| $15,000 to $19,999 | 2,165 (1.9%) | 4,196 (5.0%) |
| $20,000 to $24,999 | 2,484 (2.2%) | 4,772 (5.7%) |
| $25,000 to $34,999 | 5,888 (5.1%) | 10,060 (12.1%) |
| $35,000 to $49,999 | 8,890 (7.8%) | 13,044 (15.7%) |
| $50,000 to $74,999 | 18,411 (16.1%) | 17,209 (20.7%) |
| $75,000 to $99,999 | 16,863 (14.7%) | 8,793 (10.5%) |
| $100,000 to $149,999 | 25,808 (22.5%) | 8,432 (10.1%) |
| $150,000 or more | 29,433 (25.7%) | 3,262 (3.9%) |
| Total | 114,534 (100.0%) | 83,308 (100.0%) |
Monthly Housing Cost Tiers in Omaha

| Monthly Cost | Owner-occupied | Renter-occupied |
| Less than $300 | 2,002 (1.8%) | 1,804 (2.2%) |
| $300 to $499 | 6,567 (5.7%) | 2,030 (2.4%) |
| $500 to $799 | 17,961 (15.7%) | 11,009 (13.2%) |
| $800 to $999 | 11,061 (9.7%) | 17,378 (20.9%) |
| $1,000 to $1,499 | 29,308 (25.6%) | 33,728 (40.5%) |
| $1,500 to $1,999 | 24,568 (21.4%) | 11,544 (13.9%) |
| $2,000 to $2,499 | 10,544 (9.2%) | 2,434 (2.9%) |
| $2,500 to $2,999 | 6,076 (5.3%) | 395 (0.5%) |
| $3,000 or more | 6,447 (5.6%) | 1,033 (1.2%) |
| Total | 114,534 (100.0%) | 83,308 (100.0%) |
Physical Housing Characteristics in Omaha
Housing Structures in Omaha
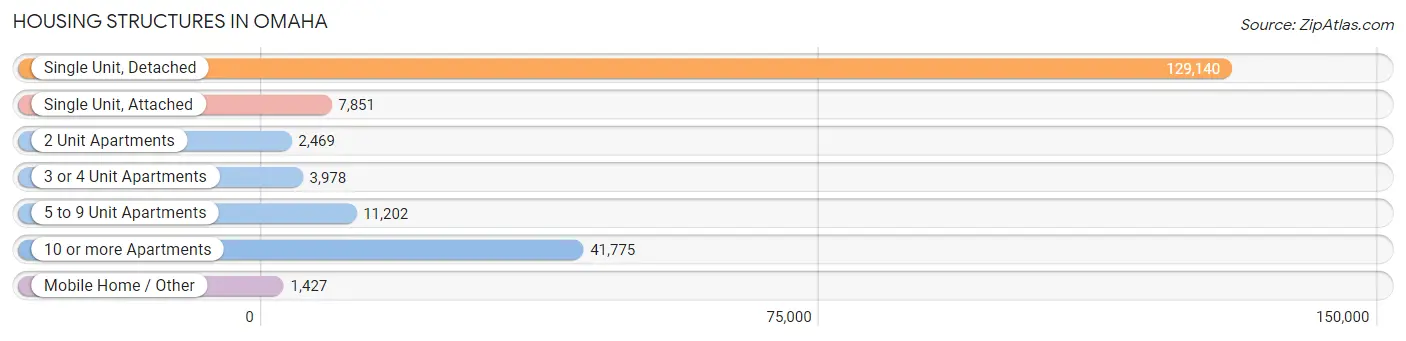
| Structure Type | # Housing Units | % Housing Units |
| Single Unit, Detached | 129,140 | 65.3% |
| Single Unit, Attached | 7,851 | 4.0% |
| 2 Unit Apartments | 2,469 | 1.3% |
| 3 or 4 Unit Apartments | 3,978 | 2.0% |
| 5 to 9 Unit Apartments | 11,202 | 5.7% |
| 10 or more Apartments | 41,775 | 21.1% |
| Mobile Home / Other | 1,427 | 0.7% |
| Total | 197,842 | 100.0% |
Housing Structures by Occupancy in Omaha
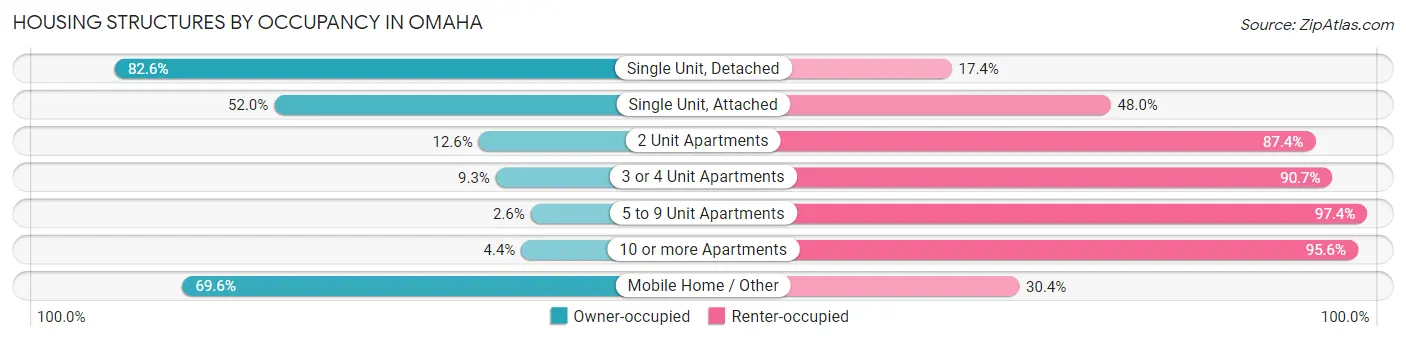
| Structure Type | Owner-occupied | Renter-occupied |
| Single Unit, Detached | 106,657 (82.6%) | 22,483 (17.4%) |
| Single Unit, Attached | 4,079 (52.0%) | 3,772 (48.0%) |
| 2 Unit Apartments | 311 (12.6%) | 2,158 (87.4%) |
| 3 or 4 Unit Apartments | 370 (9.3%) | 3,608 (90.7%) |
| 5 to 9 Unit Apartments | 290 (2.6%) | 10,912 (97.4%) |
| 10 or more Apartments | 1,834 (4.4%) | 39,941 (95.6%) |
| Mobile Home / Other | 993 (69.6%) | 434 (30.4%) |
| Total | 114,534 (57.9%) | 83,308 (42.1%) |
Housing Structures by Number of Rooms in Omaha
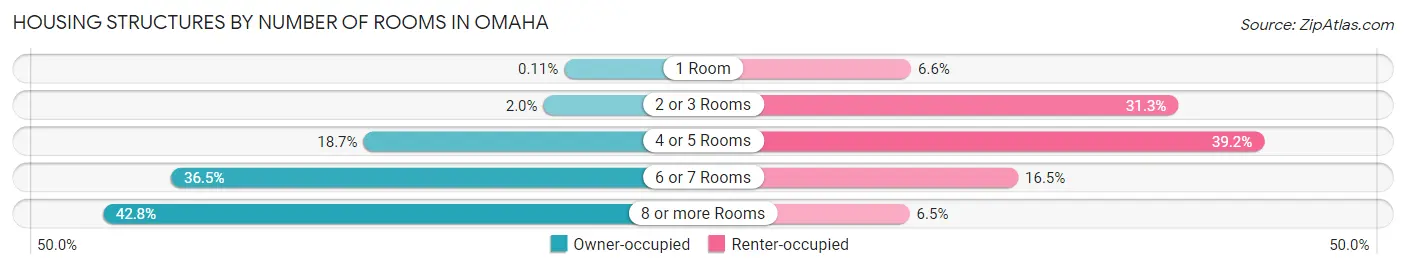
| Number of Rooms | Owner-occupied | Renter-occupied |
| 1 Room | 121 (0.1%) | 5,480 (6.6%) |
| 2 or 3 Rooms | 2,311 (2.0%) | 26,056 (31.3%) |
| 4 or 5 Rooms | 21,383 (18.7%) | 32,670 (39.2%) |
| 6 or 7 Rooms | 41,748 (36.4%) | 13,726 (16.5%) |
| 8 or more Rooms | 48,971 (42.8%) | 5,376 (6.5%) |
| Total | 114,534 (100.0%) | 83,308 (100.0%) |
Housing Structure by Heating Type in Omaha
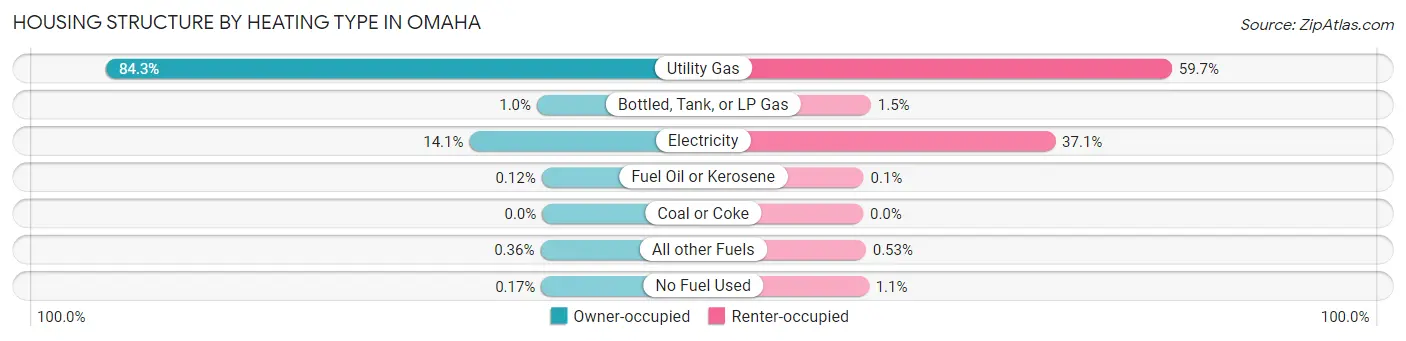
| Heating Type | Owner-occupied | Renter-occupied |
| Utility Gas | 96,523 (84.3%) | 49,699 (59.7%) |
| Bottled, Tank, or LP Gas | 1,154 (1.0%) | 1,262 (1.5%) |
| Electricity | 16,112 (14.1%) | 30,920 (37.1%) |
| Fuel Oil or Kerosene | 137 (0.1%) | 82 (0.1%) |
| Coal or Coke | 0 (0.0%) | 0 (0.0%) |
| All other Fuels | 413 (0.4%) | 439 (0.5%) |
| No Fuel Used | 195 (0.2%) | 906 (1.1%) |
| Total | 114,534 (100.0%) | 83,308 (100.0%) |
Household Vehicle Usage in Omaha
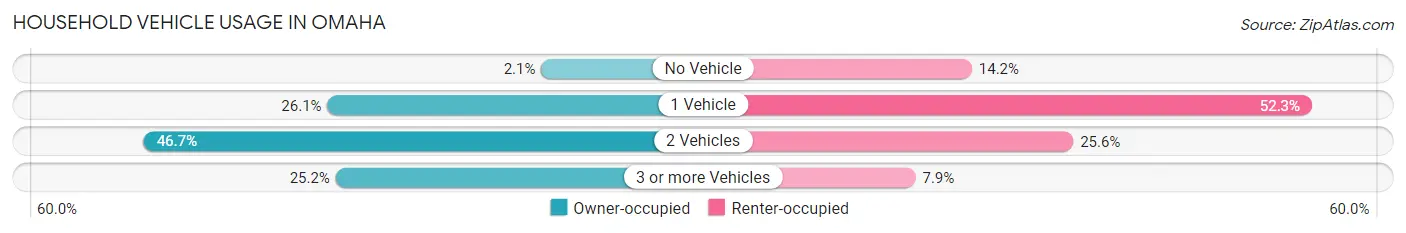
| Vehicles per Household | Owner-occupied | Renter-occupied |
| No Vehicle | 2,427 (2.1%) | 11,845 (14.2%) |
| 1 Vehicle | 29,871 (26.1%) | 43,572 (52.3%) |
| 2 Vehicles | 53,430 (46.7%) | 21,304 (25.6%) |
| 3 or more Vehicles | 28,806 (25.2%) | 6,587 (7.9%) |
| Total | 114,534 (100.0%) | 83,308 (100.0%) |
Real Estate & Mortgages in Omaha
Real Estate and Mortgage Overview in Omaha
| Characteristic | Without Mortgage | With Mortgage |
| Housing Units | 39,066 | 75,468 |
| Median Property Value | $193,400 | $217,700 |
| Median Household Income | $73,766 | $22,292 |
| Monthly Housing Costs | $712 | $6,257 |
| Real Estate Taxes | $3,549 | $2,081 |
Property Value by Mortgage Status in Omaha
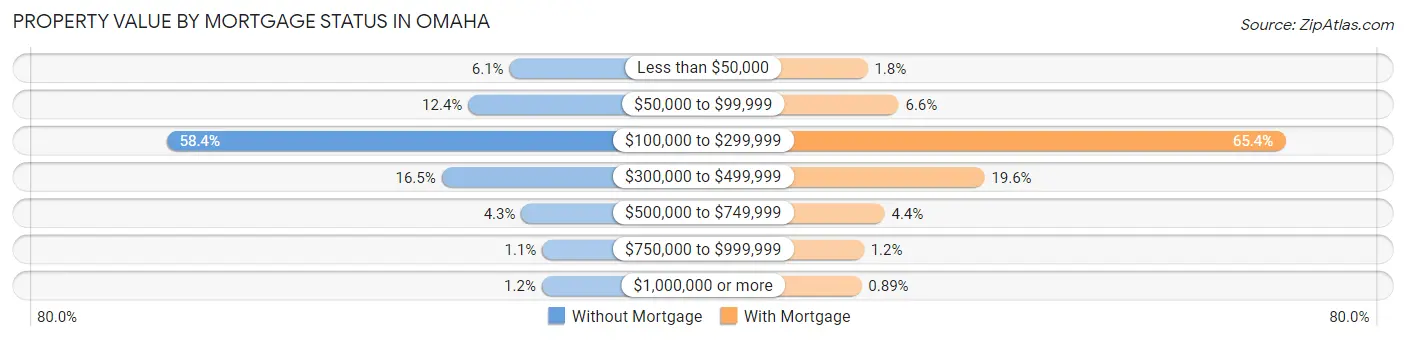
| Property Value | Without Mortgage | With Mortgage |
| Less than $50,000 | 2,390 (6.1%) | 1,367 (1.8%) |
| $50,000 to $99,999 | 4,847 (12.4%) | 4,944 (6.6%) |
| $100,000 to $299,999 | 22,799 (58.4%) | 49,384 (65.4%) |
| $300,000 to $499,999 | 6,435 (16.5%) | 14,825 (19.6%) |
| $500,000 to $749,999 | 1,685 (4.3%) | 3,339 (4.4%) |
| $750,000 to $999,999 | 441 (1.1%) | 939 (1.2%) |
| $1,000,000 or more | 469 (1.2%) | 670 (0.9%) |
| Total | 39,066 (100.0%) | 75,468 (100.0%) |
Household Income by Mortgage Status in Omaha
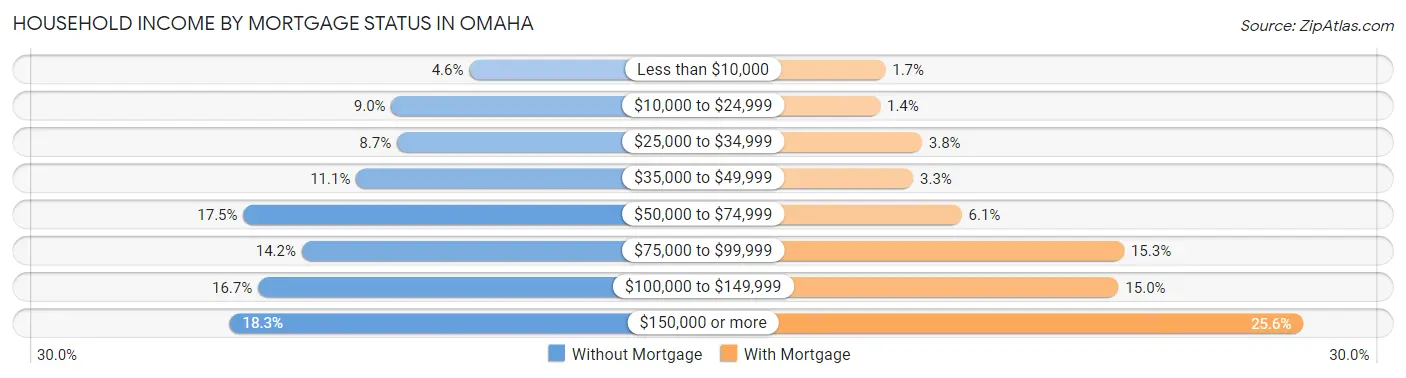
| Household Income | Without Mortgage | With Mortgage |
| Less than $10,000 | 1,792 (4.6%) | 1,283 (1.7%) |
| $10,000 to $24,999 | 3,533 (9.0%) | 1,056 (1.4%) |
| $25,000 to $34,999 | 3,408 (8.7%) | 2,860 (3.8%) |
| $35,000 to $49,999 | 4,317 (11.1%) | 2,480 (3.3%) |
| $50,000 to $74,999 | 6,837 (17.5%) | 4,573 (6.1%) |
| $75,000 to $99,999 | 5,531 (14.2%) | 11,574 (15.3%) |
| $100,000 to $149,999 | 6,507 (16.7%) | 11,332 (15.0%) |
| $150,000 or more | 7,141 (18.3%) | 19,301 (25.6%) |
| Total | 39,066 (100.0%) | 75,468 (100.0%) |
Property Value to Household Income Ratio in Omaha
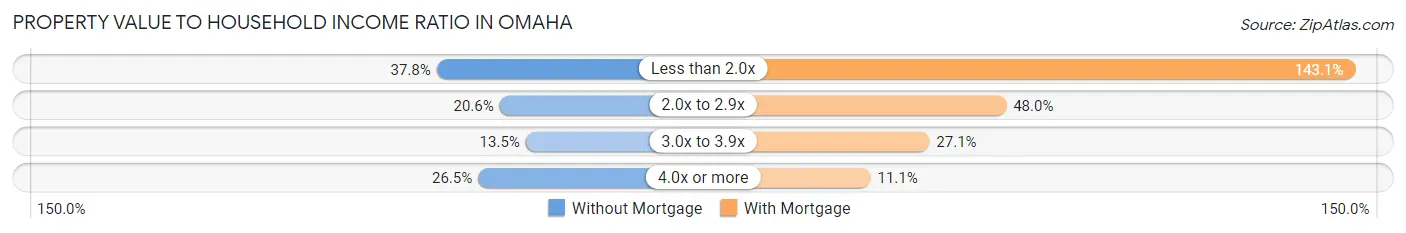
| Value-to-Income Ratio | Without Mortgage | With Mortgage |
| Less than 2.0x | 14,757 (37.8%) | 107,987 (143.1%) |
| 2.0x to 2.9x | 8,055 (20.6%) | 36,246 (48.0%) |
| 3.0x to 3.9x | 5,272 (13.5%) | 20,452 (27.1%) |
| 4.0x or more | 10,344 (26.5%) | 8,353 (11.1%) |
| Total | 39,066 (100.0%) | 75,468 (100.0%) |
Real Estate Taxes by Mortgage Status in Omaha
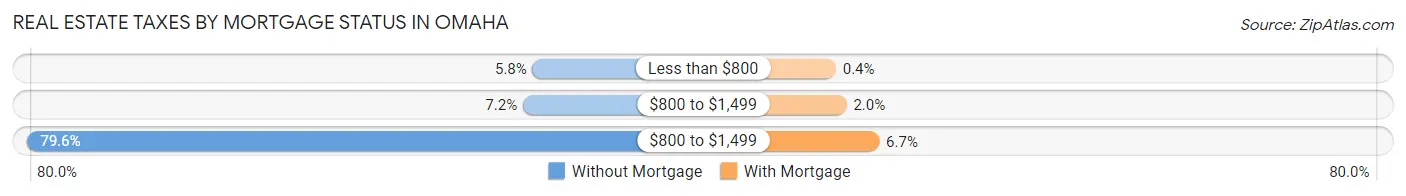
| Property Taxes | Without Mortgage | With Mortgage |
| Less than $800 | 2,256 (5.8%) | 299 (0.4%) |
| $800 to $1,499 | 2,805 (7.2%) | 1,480 (2.0%) |
| $800 to $1,499 | 31,097 (79.6%) | 5,083 (6.7%) |
| Total | 39,066 (100.0%) | 75,468 (100.0%) |
Health & Disability in Omaha
Health Insurance Coverage by Age in Omaha
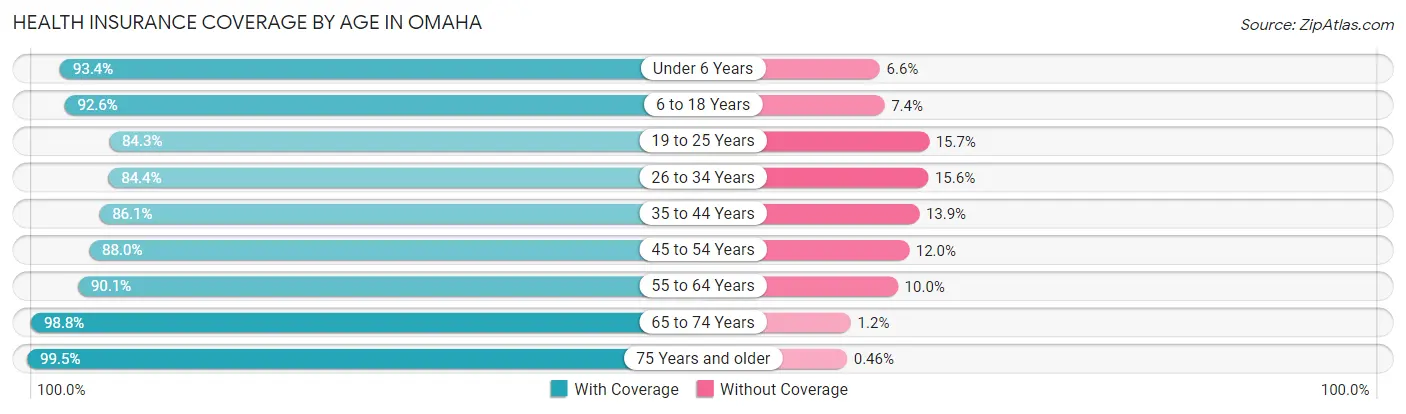
| Age Bracket | With Coverage | Without Coverage |
| Under 6 Years | 37,895 (93.4%) | 2,667 (6.6%) |
| 6 to 18 Years | 80,080 (92.6%) | 6,433 (7.4%) |
| 19 to 25 Years | 41,651 (84.3%) | 7,783 (15.7%) |
| 26 to 34 Years | 54,862 (84.4%) | 10,148 (15.6%) |
| 35 to 44 Years | 56,094 (86.1%) | 9,073 (13.9%) |
| 45 to 54 Years | 48,264 (88.0%) | 6,601 (12.0%) |
| 55 to 64 Years | 50,461 (90.0%) | 5,578 (10.0%) |
| 65 to 74 Years | 40,403 (98.8%) | 486 (1.2%) |
| 75 Years and older | 24,760 (99.5%) | 115 (0.5%) |
| Total | 434,470 (89.9%) | 48,884 (10.1%) |
Health Insurance Coverage by Citizenship Status in Omaha
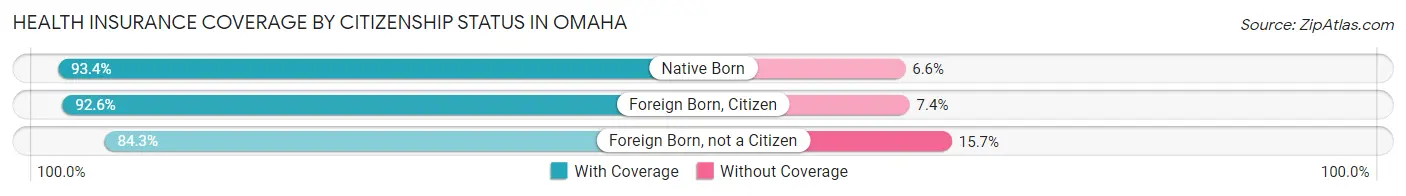
| Citizenship Status | With Coverage | Without Coverage |
| Native Born | 37,895 (93.4%) | 2,667 (6.6%) |
| Foreign Born, Citizen | 80,080 (92.6%) | 6,433 (7.4%) |
| Foreign Born, not a Citizen | 41,651 (84.3%) | 7,783 (15.7%) |
Health Insurance Coverage by Household Income in Omaha
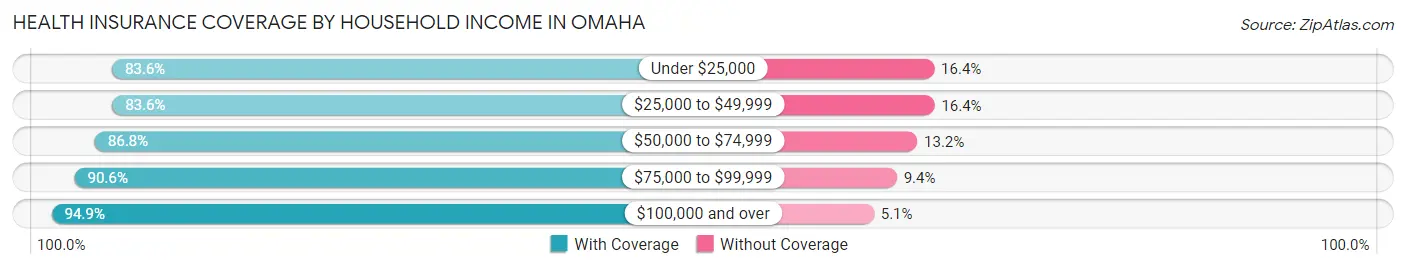
| Household Income | With Coverage | Without Coverage |
| Under $25,000 | 42,209 (83.6%) | 8,260 (16.4%) |
| $25,000 to $49,999 | 63,624 (83.6%) | 12,503 (16.4%) |
| $50,000 to $74,999 | 69,773 (86.8%) | 10,585 (13.2%) |
| $75,000 to $99,999 | 58,602 (90.6%) | 6,054 (9.4%) |
| $100,000 and over | 194,706 (94.9%) | 10,377 (5.1%) |
Public vs Private Health Insurance Coverage by Age in Omaha
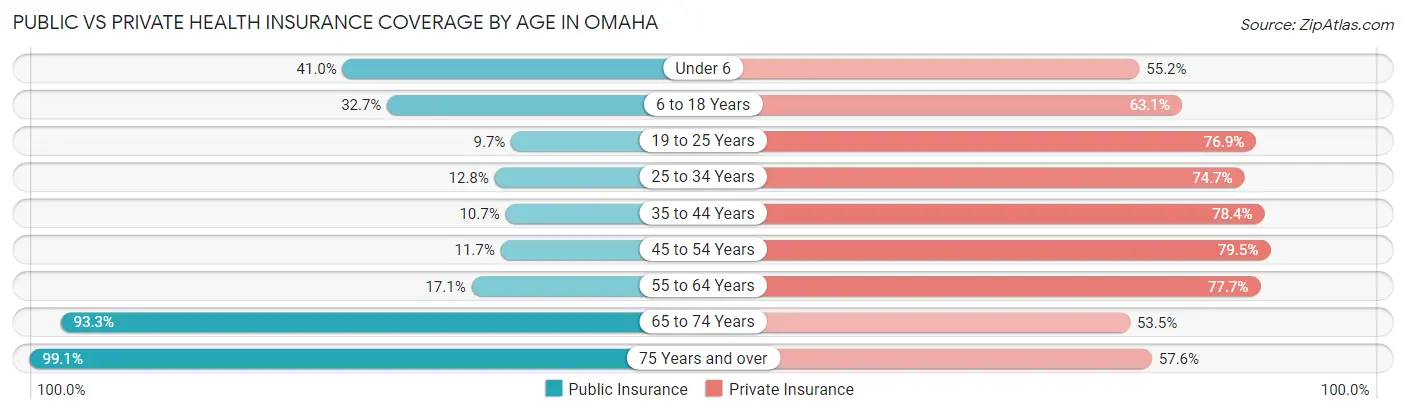
| Age Bracket | Public Insurance | Private Insurance |
| Under 6 | 16,620 (41.0%) | 22,402 (55.2%) |
| 6 to 18 Years | 28,286 (32.7%) | 54,585 (63.1%) |
| 19 to 25 Years | 4,787 (9.7%) | 38,021 (76.9%) |
| 25 to 34 Years | 8,297 (12.8%) | 48,579 (74.7%) |
| 35 to 44 Years | 6,997 (10.7%) | 51,118 (78.4%) |
| 45 to 54 Years | 6,397 (11.7%) | 43,614 (79.5%) |
| 55 to 64 Years | 9,554 (17.1%) | 43,517 (77.6%) |
| 65 to 74 Years | 38,155 (93.3%) | 21,871 (53.5%) |
| 75 Years and over | 24,643 (99.1%) | 14,315 (57.6%) |
| Total | 143,736 (29.7%) | 338,022 (69.9%) |
Disability Status by Sex by Age in Omaha
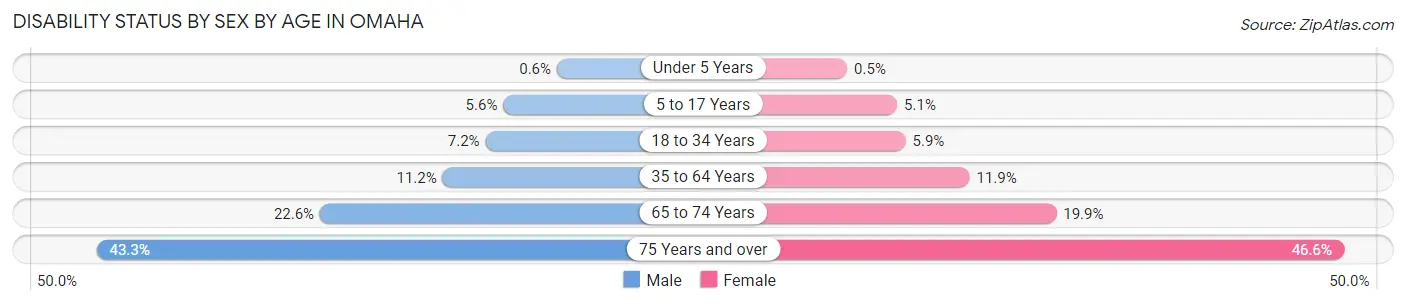
| Age Bracket | Male | Female |
| Under 5 Years | 104 (0.6%) | 81 (0.5%) |
| 5 to 17 Years | 2,433 (5.6%) | 2,200 (5.1%) |
| 18 to 34 Years | 4,411 (7.2%) | 3,586 (5.9%) |
| 35 to 64 Years | 9,883 (11.2%) | 10,431 (11.9%) |
| 65 to 74 Years | 4,289 (22.6%) | 4,361 (19.9%) |
| 75 Years and over | 4,345 (43.3%) | 6,915 (46.6%) |
Disability Class by Sex by Age in Omaha
Disability Class: Hearing Difficulty
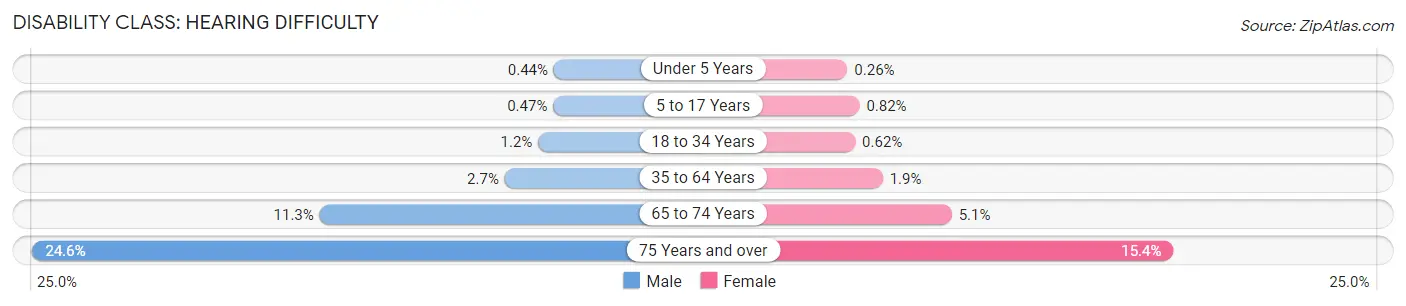
| Age Bracket | Male | Female |
| Under 5 Years | 77 (0.4%) | 42 (0.3%) |
| 5 to 17 Years | 203 (0.5%) | 349 (0.8%) |
| 18 to 34 Years | 715 (1.2%) | 373 (0.6%) |
| 35 to 64 Years | 2,394 (2.7%) | 1,672 (1.9%) |
| 65 to 74 Years | 2,147 (11.3%) | 1,117 (5.1%) |
| 75 Years and over | 2,471 (24.6%) | 2,283 (15.4%) |
Disability Class: Vision Difficulty
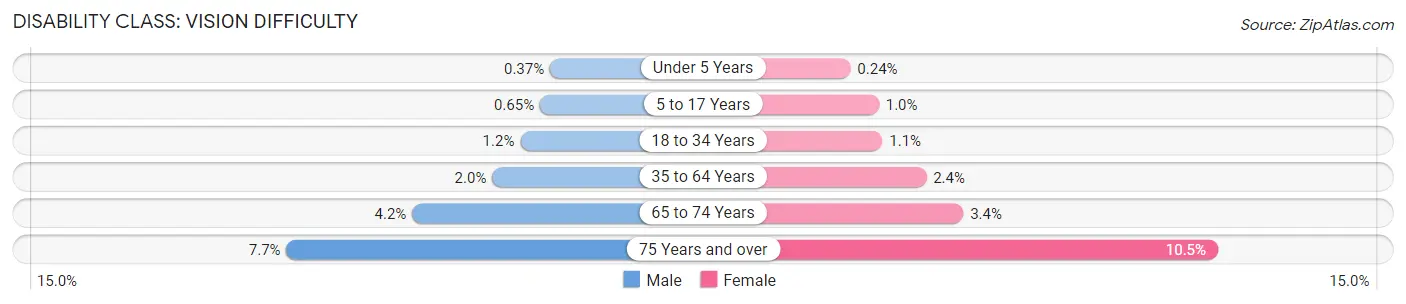
| Age Bracket | Male | Female |
| Under 5 Years | 64 (0.4%) | 39 (0.2%) |
| 5 to 17 Years | 285 (0.6%) | 439 (1.0%) |
| 18 to 34 Years | 730 (1.2%) | 685 (1.1%) |
| 35 to 64 Years | 1,749 (2.0%) | 2,069 (2.4%) |
| 65 to 74 Years | 800 (4.2%) | 740 (3.4%) |
| 75 Years and over | 773 (7.7%) | 1,555 (10.5%) |
Disability Class: Cognitive Difficulty
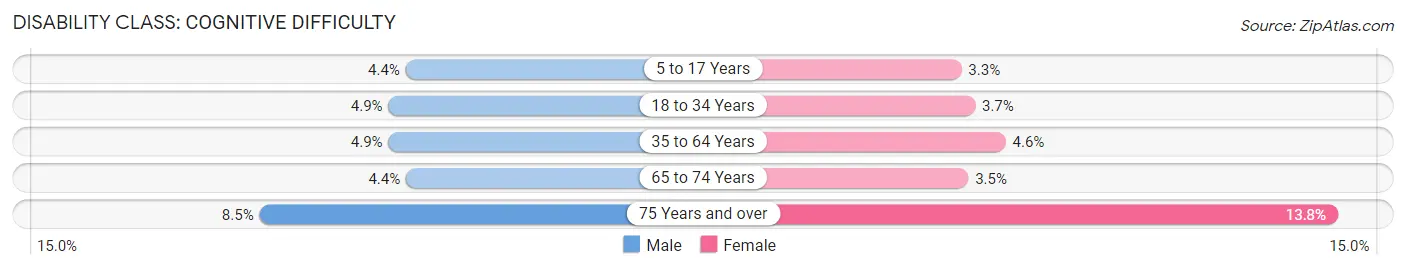
| Age Bracket | Male | Female |
| 5 to 17 Years | 1,911 (4.4%) | 1,425 (3.3%) |
| 18 to 34 Years | 2,974 (4.9%) | 2,245 (3.7%) |
| 35 to 64 Years | 4,289 (4.9%) | 4,010 (4.6%) |
| 65 to 74 Years | 832 (4.4%) | 771 (3.5%) |
| 75 Years and over | 848 (8.5%) | 2,050 (13.8%) |
Disability Class: Ambulatory Difficulty
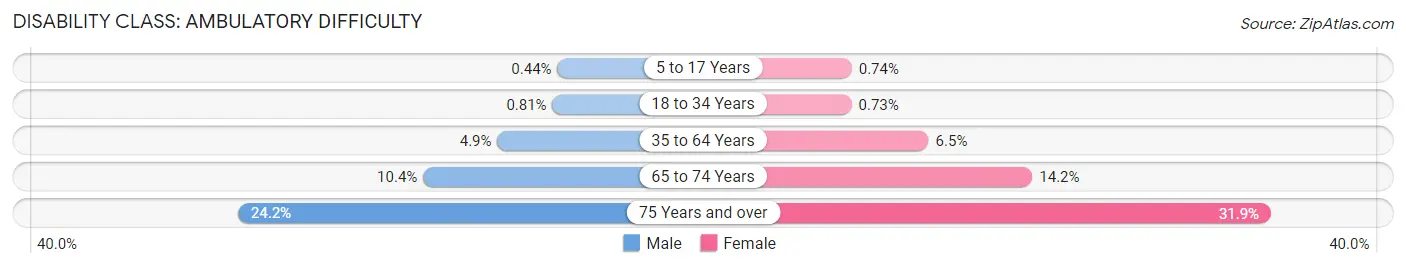
| Age Bracket | Male | Female |
| 5 to 17 Years | 193 (0.4%) | 316 (0.7%) |
| 18 to 34 Years | 497 (0.8%) | 443 (0.7%) |
| 35 to 64 Years | 4,320 (4.9%) | 5,671 (6.5%) |
| 65 to 74 Years | 1,977 (10.4%) | 3,099 (14.1%) |
| 75 Years and over | 2,423 (24.2%) | 4,730 (31.9%) |
Disability Class: Self-Care Difficulty
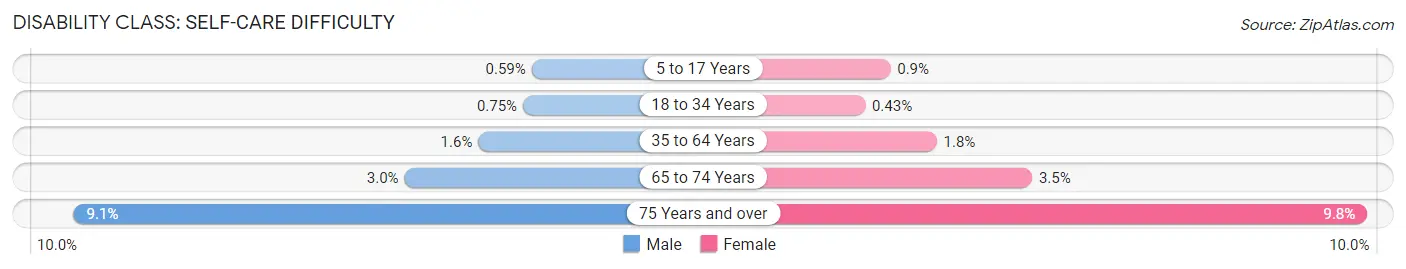
| Age Bracket | Male | Female |
| 5 to 17 Years | 255 (0.6%) | 384 (0.9%) |
| 18 to 34 Years | 460 (0.7%) | 259 (0.4%) |
| 35 to 64 Years | 1,390 (1.6%) | 1,549 (1.8%) |
| 65 to 74 Years | 560 (2.9%) | 772 (3.5%) |
| 75 Years and over | 912 (9.1%) | 1,448 (9.8%) |
Technology Access in Omaha
Computing Device Access in Omaha
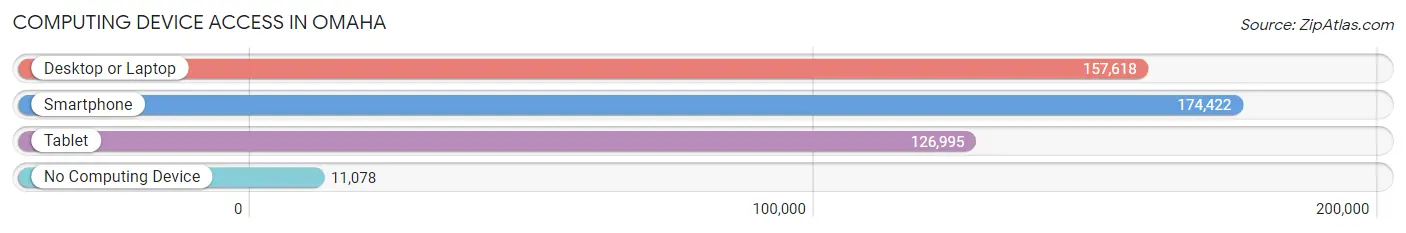
| Device Type | # Households | % Households |
| Desktop or Laptop | 157,618 | 79.7% |
| Smartphone | 174,422 | 88.2% |
| Tablet | 126,995 | 64.2% |
| No Computing Device | 11,078 | 5.6% |
| Total | 197,842 | 100.0% |
Internet Access in Omaha
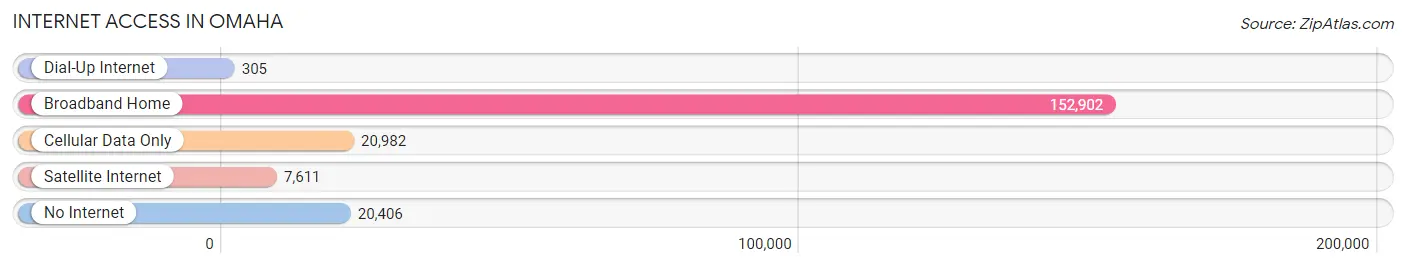
| Internet Type | # Households | % Households |
| Dial-Up Internet | 305 | 0.2% |
| Broadband Home | 152,902 | 77.3% |
| Cellular Data Only | 20,982 | 10.6% |
| Satellite Internet | 7,611 | 3.8% |
| No Internet | 20,406 | 10.3% |
| Total | 197,842 | 100.0% |
Omaha Summary
Omaha is the largest city in the state of Nebraska and is located in the Midwestern United States. It is situated on the Missouri River, and is the county seat of Douglas County. Omaha is the anchor of the Omaha-Council Bluffs metropolitan area, which includes Council Bluffs, Iowa, across the Missouri River from Omaha.
History
Omaha was founded in 1854 by the Council Bluffs and Omaha Railroad Company, and was named after the Omaha tribe of Native Americans who had lived in the area for centuries. The city grew rapidly in the late 19th century, becoming a major transportation hub and a major center of industry. By the early 20th century, Omaha had become a major center of the meatpacking industry, and was home to several large stockyards and packing plants.
In the 1950s, Omaha experienced a period of rapid growth and development, as the city's population grew from around 200,000 to over 400,000. This growth was largely due to the city's strong economy, which was based on the meatpacking industry, as well as the city's location on the Missouri River, which allowed for easy transportation of goods.
Geography
Omaha is located in the Midwestern United States, in the state of Nebraska. It is situated on the Missouri River, and is the county seat of Douglas County. The city is located in the Great Plains region of the United States, and is bordered by Iowa to the east, South Dakota to the north, and Kansas to the south.
The city has a total area of 130.58 square miles, of which 129.45 square miles is land and 1.13 square miles is water. The city is located at an elevation of 1,189 feet above sea level.
Economy
Omaha has a strong and diverse economy, which is based on a variety of industries. The city is home to several Fortune 500 companies, including Berkshire Hathaway, Union Pacific, and ConAgra Foods. The city is also home to several major healthcare providers, including the University of Nebraska Medical Center and the Nebraska Medical Center.
The city is also a major transportation hub, with several major highways and railroads running through the city. The city is home to the Omaha Airport, which is the largest airport in the state of Nebraska.
Demographics
As of the 2010 census, Omaha had a population of 446,599. The city has a population density of 3,400 people per square mile. The racial makeup of the city was 73.2% White, 14.3% African American, 0.7% Native American, 3.2% Asian, 0.1% Pacific Islander, 5.2% from other races, and 3.3% from two or more races.
The median income for a household in the city was $45,735, and the median income for a family was $54,735. The per capita income for the city was $24,945. About 14.3% of the population was below the poverty line.
Common Questions
What is Per Capita Income in Omaha?
Per Capita income in Omaha is $40,081.
What is the Median Family Income in Omaha?
Median Family Income in Omaha is $92,630.
What is the Median Household income in Omaha?
Median Household Income in Omaha is $70,202.
What is Income or Wage Gap in Omaha?
Income or Wage Gap in Omaha is 23.7%.
Women in Omaha earn 76.3 cents for every dollar earned by a man.
What is Family Income Deficit in Omaha?
Family Income Deficit in Omaha is $10,335.
Families that are below poverty line in Omaha earn $10,335 less on average than the poverty threshold level.
What is Inequality or Gini Index in Omaha?
Inequality or Gini Index in Omaha is 0.48.
What is the Total Population of Omaha?
Total Population of Omaha is 489,201.
What is the Total Male Population of Omaha?
Total Male Population of Omaha is 243,241.
What is the Total Female Population of Omaha?
Total Female Population of Omaha is 245,960.
What is the Ratio of Males per 100 Females in Omaha?
There are 98.89 Males per 100 Females in Omaha.
What is the Ratio of Females per 100 Males in Omaha?
There are 101.12 Females per 100 Males in Omaha.
What is the Median Population Age in Omaha?
Median Population Age in Omaha is 35.1 Years.
What is the Average Family Size in Omaha
Average Family Size in Omaha is 3.2 People.
What is the Average Household Size in Omaha
Average Household Size in Omaha is 2.4 People.
How Large is the Labor Force in Omaha?
There are 266,796 People in the Labor Forcein in Omaha.
What is the Percentage of People in the Labor Force in Omaha?
69.9% of People are in the Labor Force in Omaha.
What is the Unemployment Rate in Omaha?
Unemployment Rate in Omaha is 4.2%.