Fort Lauderdale, FL Map & Demographics
Fort Lauderdale Map
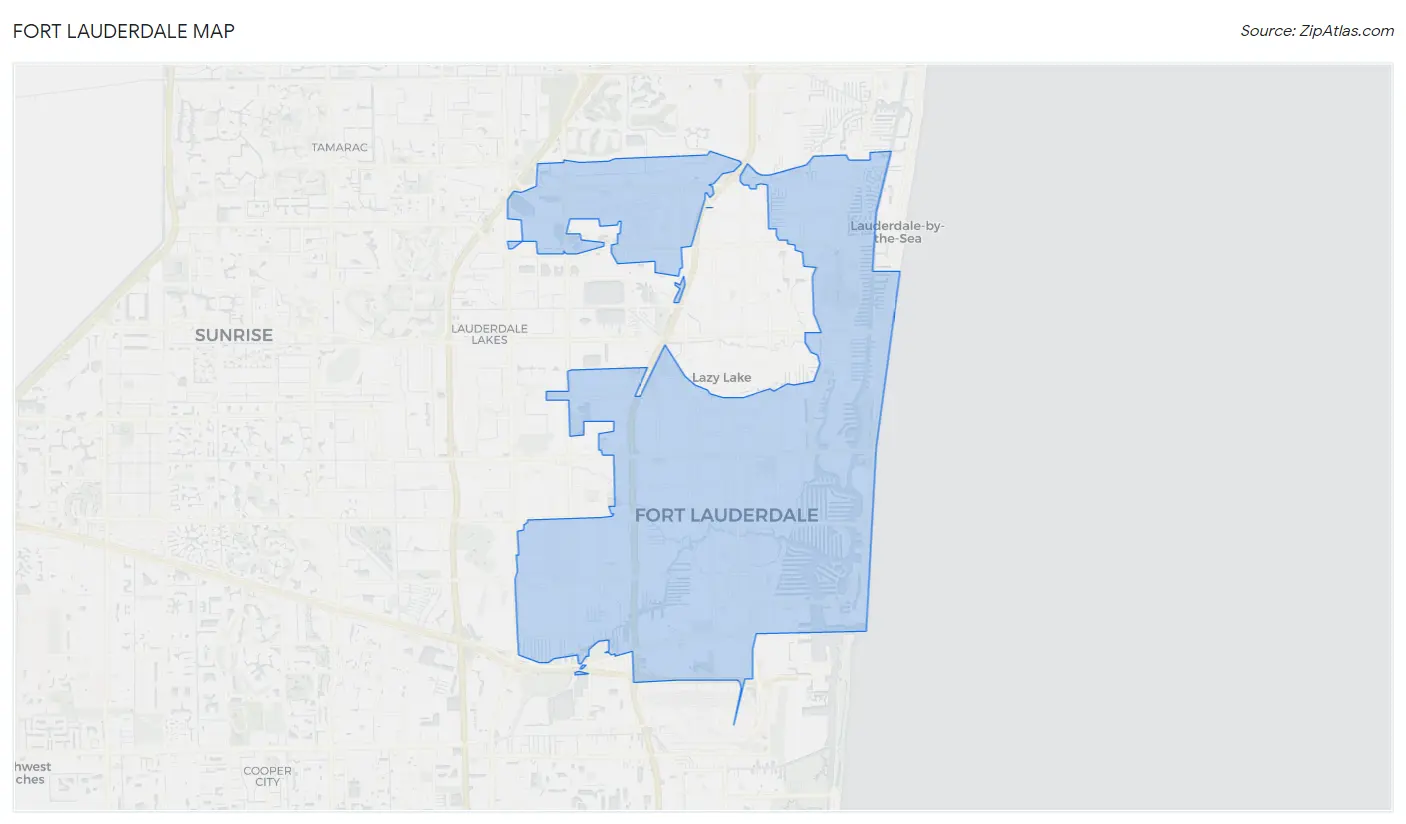
Fort Lauderdale Overview
$55,060
PER CAPITA INCOME
$87,676
AVG FAMILY INCOME
$75,376
AVG HOUSEHOLD INCOME
21.0%
WAGE / INCOME GAP [ % ]
79.0¢/ $1
WAGE / INCOME GAP [ $ ]
$10,210
FAMILY INCOME DEFICIT
0.54
INEQUALITY / GINI INDEX
182,673
TOTAL POPULATION
95,334
MALE POPULATION
87,339
FEMALE POPULATION
109.15
MALES / 100 FEMALES
91.61
FEMALES / 100 MALES
43.2
MEDIAN AGE
3.1
AVG FAMILY SIZE
2.2
AVG HOUSEHOLD SIZE
100,613
LABOR FORCE [ PEOPLE ]
64.6%
PERCENT IN LABOR FORCE
5.4%
UNEMPLOYMENT RATE
Fort Lauderdale Zip Codes
Income in Fort Lauderdale
Income Overview in Fort Lauderdale
Per Capita Income in Fort Lauderdale is $55,060, while median incomes of families and households are $87,676 and $75,376 respectively.
| Characteristic | Number | Measure |
| Per Capita Income | 182,673 | $55,060 |
| Median Family Income | 40,116 | $87,676 |
| Mean Family Income | 40,116 | $147,203 |
| Median Household Income | 80,031 | $75,376 |
| Mean Household Income | 80,031 | $122,245 |
| Income Deficit | 40,116 | $10,210 |
| Wage / Income Gap (%) | 182,673 | 21.04% |
| Wage / Income Gap ($) | 182,673 | 78.96¢ per $1 |
| Gini / Inequality Index | 182,673 | 0.54 |
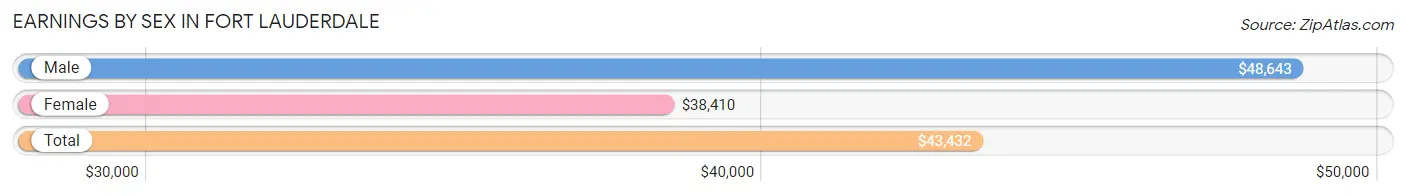
Earnings by Sex in Fort Lauderdale
Average Earnings in Fort Lauderdale are $43,432, $48,643 for men and $38,410 for women, a difference of 21.0%.
| Sex | Number | Average Earnings |
| Male | 57,697 (55.7%) | $48,643 |
| Female | 45,949 (44.3%) | $38,410 |
| Total | 103,646 (100.0%) | $43,432 |
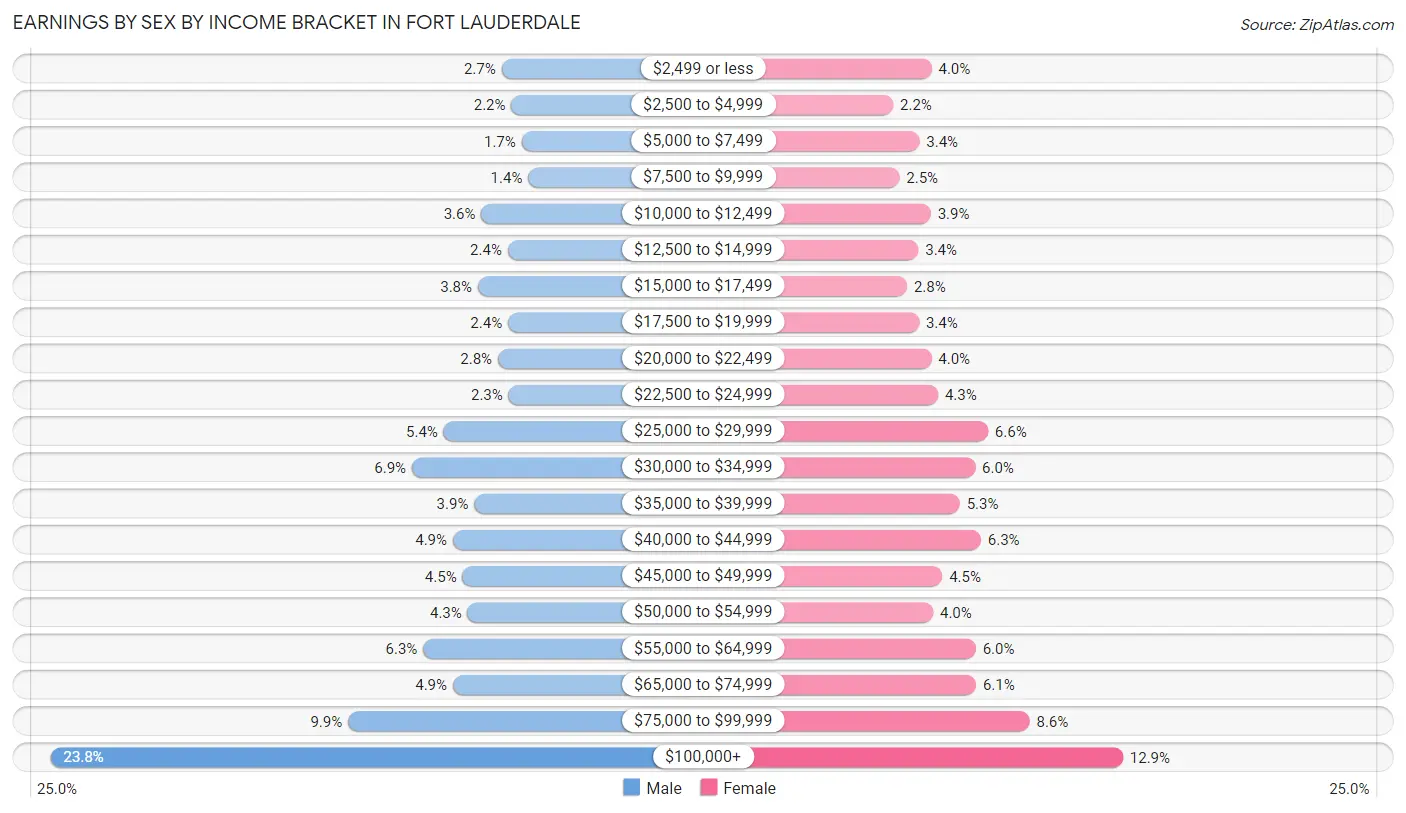
Earnings by Sex by Income Bracket in Fort Lauderdale
The most common earnings brackets in Fort Lauderdale are $100,000+ for men (13,725 | 23.8%) and $100,000+ for women (5,940 | 12.9%).
| Income | Male | Female |
| $2,499 or less | 1,536 (2.7%) | 1,825 (4.0%) |
| $2,500 to $4,999 | 1,270 (2.2%) | 999 (2.2%) |
| $5,000 to $7,499 | 990 (1.7%) | 1,560 (3.4%) |
| $7,500 to $9,999 | 814 (1.4%) | 1,129 (2.5%) |
| $10,000 to $12,499 | 2,085 (3.6%) | 1,805 (3.9%) |
| $12,500 to $14,999 | 1,366 (2.4%) | 1,540 (3.4%) |
| $15,000 to $17,499 | 2,175 (3.8%) | 1,297 (2.8%) |
| $17,500 to $19,999 | 1,359 (2.4%) | 1,552 (3.4%) |
| $20,000 to $22,499 | 1,630 (2.8%) | 1,821 (4.0%) |
| $22,500 to $24,999 | 1,342 (2.3%) | 1,963 (4.3%) |
| $25,000 to $29,999 | 3,098 (5.4%) | 3,039 (6.6%) |
| $30,000 to $34,999 | 3,956 (6.9%) | 2,763 (6.0%) |
| $35,000 to $39,999 | 2,275 (3.9%) | 2,432 (5.3%) |
| $40,000 to $44,999 | 2,848 (4.9%) | 2,885 (6.3%) |
| $45,000 to $49,999 | 2,593 (4.5%) | 2,054 (4.5%) |
| $50,000 to $54,999 | 2,453 (4.3%) | 1,855 (4.0%) |
| $55,000 to $64,999 | 3,652 (6.3%) | 2,776 (6.0%) |
| $65,000 to $74,999 | 2,849 (4.9%) | 2,779 (6.0%) |
| $75,000 to $99,999 | 5,681 (9.9%) | 3,935 (8.6%) |
| $100,000+ | 13,725 (23.8%) | 5,940 (12.9%) |
| Total | 57,697 (100.0%) | 45,949 (100.0%) |
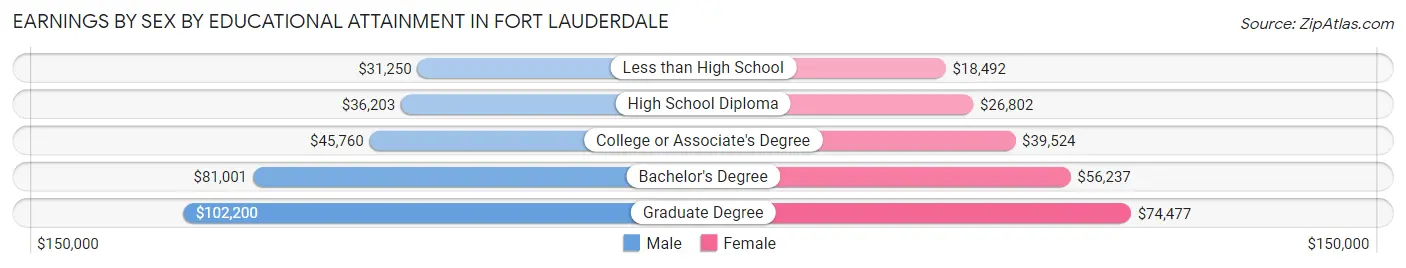
Earnings by Sex by Educational Attainment in Fort Lauderdale
Average earnings in Fort Lauderdale are $53,196 for men and $41,847 for women, a difference of 21.3%. Men with an educational attainment of graduate degree enjoy the highest average annual earnings of $102,200, while those with less than high school education earn the least with $31,250. Women with an educational attainment of graduate degree earn the most with the average annual earnings of $74,477, while those with less than high school education have the smallest earnings of $18,492.
| Educational Attainment | Male Income | Female Income |
| Less than High School | $31,250 | $18,492 |
| High School Diploma | $36,203 | $26,802 |
| College or Associate's Degree | $45,760 | $39,524 |
| Bachelor's Degree | $81,001 | $56,237 |
| Graduate Degree | $102,200 | $74,477 |
| Total | $53,196 | $41,847 |
Family Income in Fort Lauderdale
Family Income Brackets in Fort Lauderdale
According to the Fort Lauderdale family income data, there are 7,341 families falling into the $200,000+ income range, which is the most common income bracket and makes up 18.3% of all families. Conversely, the $10,000 to $14,999 income bracket is the least frequent group with only 1,043 families (2.6%) belonging to this category.
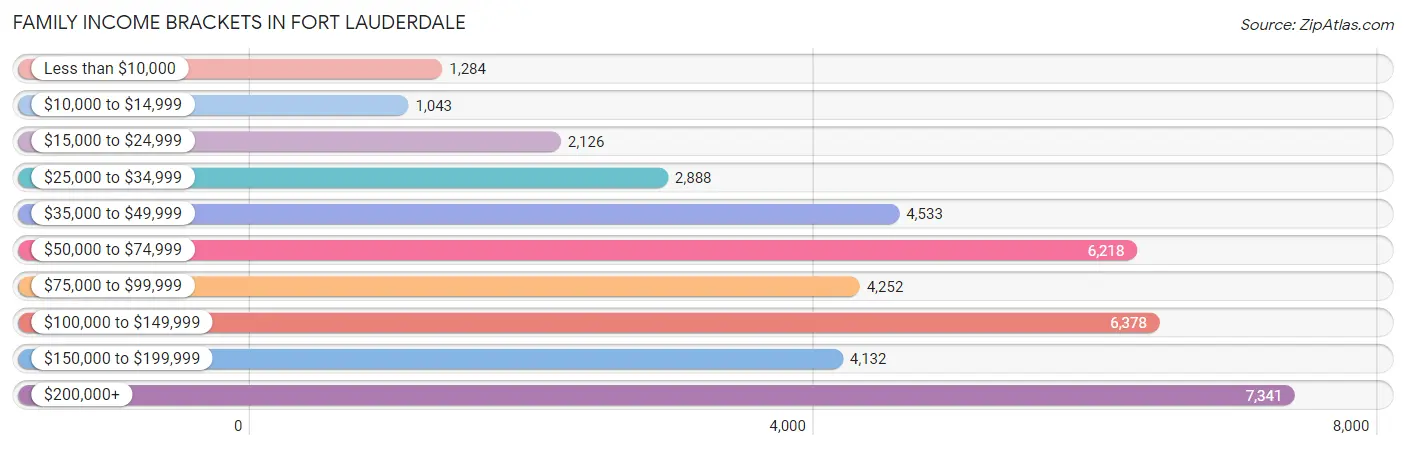
| Income Bracket | # Families | % Families |
| Less than $10,000 | 1,284 | 3.2% |
| $10,000 to $14,999 | 1,043 | 2.6% |
| $15,000 to $24,999 | 2,126 | 5.3% |
| $25,000 to $34,999 | 2,888 | 7.2% |
| $35,000 to $49,999 | 4,533 | 11.3% |
| $50,000 to $74,999 | 6,218 | 15.5% |
| $75,000 to $99,999 | 4,252 | 10.6% |
| $100,000 to $149,999 | 6,378 | 15.9% |
| $150,000 to $199,999 | 4,132 | 10.3% |
| $200,000+ | 7,341 | 18.3% |
Family Income by Famaliy Size in Fort Lauderdale
4-person families (6,166 | 15.4%) account for the highest median family income in Fort Lauderdale with $101,806 per family, while 2-person families (21,878 | 54.5%) have the highest median income of $45,967 per family member.
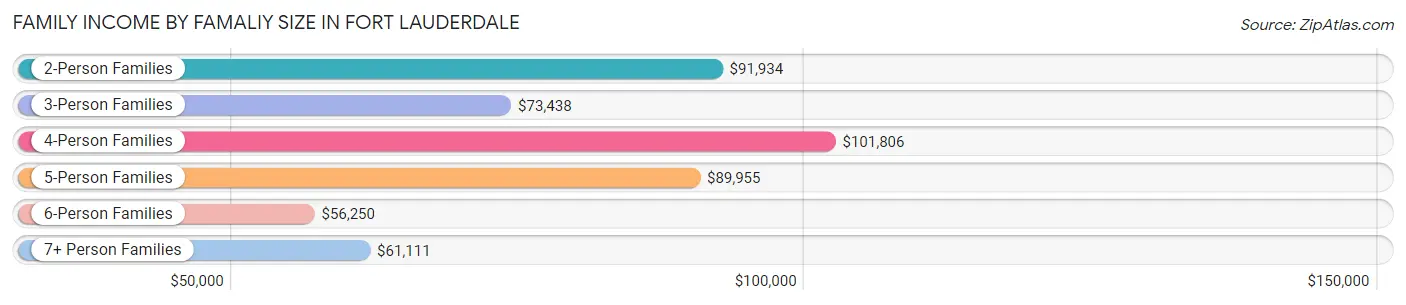
| Income Bracket | # Families | Median Income |
| 2-Person Families | 21,878 (54.5%) | $91,934 |
| 3-Person Families | 8,057 (20.1%) | $73,438 |
| 4-Person Families | 6,166 (15.4%) | $101,806 |
| 5-Person Families | 2,542 (6.3%) | $89,955 |
| 6-Person Families | 1,111 (2.8%) | $56,250 |
| 7+ Person Families | 362 (0.9%) | $61,111 |
| Total | 40,116 (100.0%) | $87,676 |
Family Income by Number of Earners in Fort Lauderdale
The median family income in Fort Lauderdale is $87,676, with families comprising 2 earners (16,343) having the highest median family income of $119,723, while families with no earners (5,777) have the lowest median family income of $42,380, accounting for 40.7% and 14.4% of families, respectively.
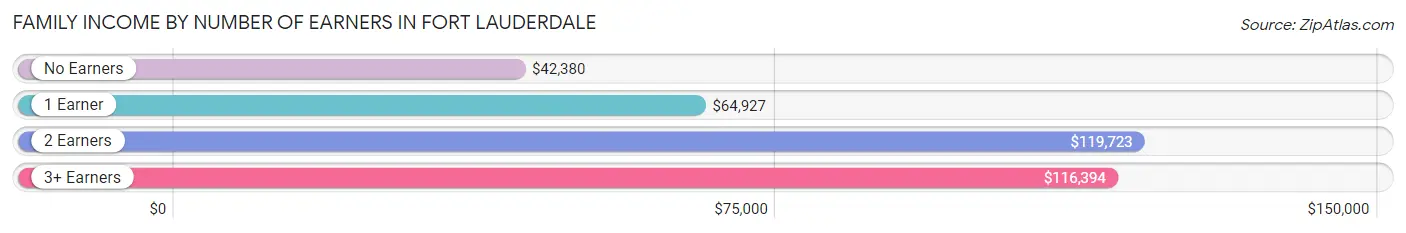
| Number of Earners | # Families | Median Income |
| No Earners | 5,777 (14.4%) | $42,380 |
| 1 Earner | 14,029 (35.0%) | $64,927 |
| 2 Earners | 16,343 (40.7%) | $119,723 |
| 3+ Earners | 3,967 (9.9%) | $116,394 |
| Total | 40,116 (100.0%) | $87,676 |
Household Income in Fort Lauderdale
Household Income Brackets in Fort Lauderdale
With 12,885 households falling in the category, the $50,000 to $74,999 income range is the most frequent in Fort Lauderdale, accounting for 16.1% of all households. In contrast, only 3,201 households (4.0%) fall into the $10,000 to $14,999 income bracket, making it the least populous group.
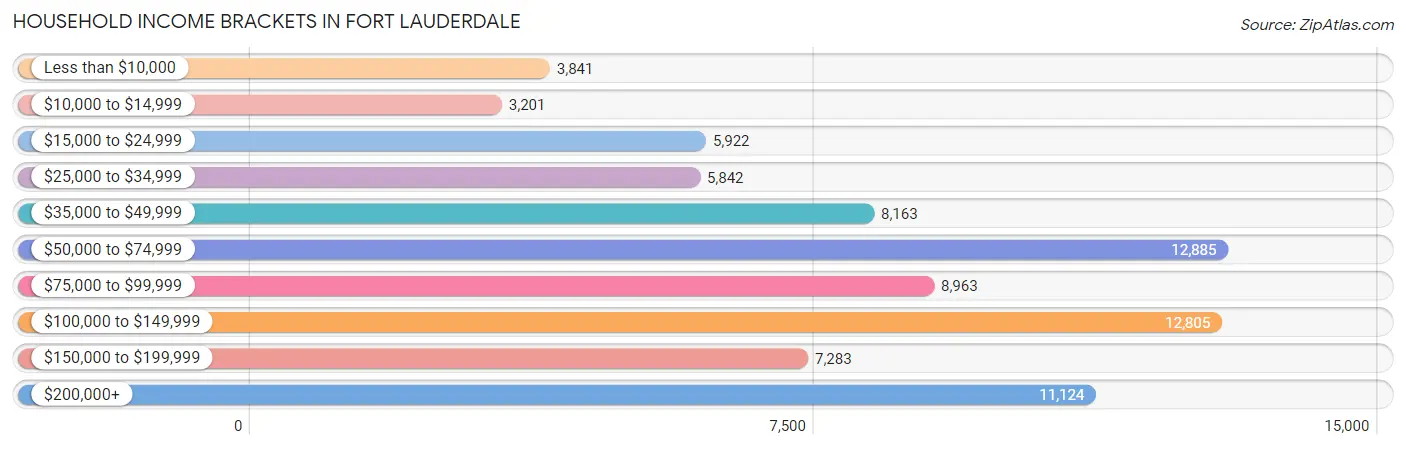
| Income Bracket | # Households | % Households |
| Less than $10,000 | 3,841 | 4.8% |
| $10,000 to $14,999 | 3,201 | 4.0% |
| $15,000 to $24,999 | 5,922 | 7.4% |
| $25,000 to $34,999 | 5,842 | 7.3% |
| $35,000 to $49,999 | 8,163 | 10.2% |
| $50,000 to $74,999 | 12,885 | 16.1% |
| $75,000 to $99,999 | 8,963 | 11.2% |
| $100,000 to $149,999 | 12,805 | 16.0% |
| $150,000 to $199,999 | 7,283 | 9.1% |
| $200,000+ | 11,124 | 13.9% |
Household Income by Householder Age in Fort Lauderdale
The median household income in Fort Lauderdale is $75,376, with the highest median household income of $83,536 found in the 45 to 64 years age bracket for the primary householder. A total of 30,631 households (38.3%) fall into this category. Meanwhile, the 15 to 24 years age bracket for the primary householder has the lowest median household income of $52,092, with 1,842 households (2.3%) in this group.
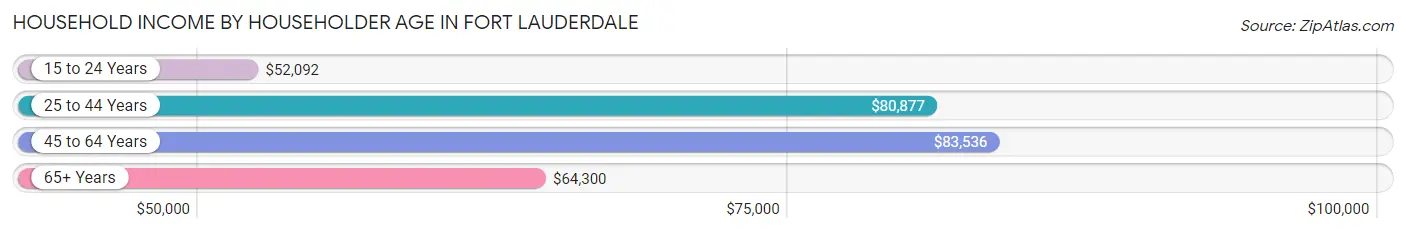
| Income Bracket | # Households | Median Income |
| 15 to 24 Years | 1,842 (2.3%) | $52,092 |
| 25 to 44 Years | 24,857 (31.1%) | $80,877 |
| 45 to 64 Years | 30,631 (38.3%) | $83,536 |
| 65+ Years | 22,701 (28.4%) | $64,300 |
| Total | 80,031 (100.0%) | $75,376 |
Poverty in Fort Lauderdale
Income Below Poverty by Sex and Age in Fort Lauderdale
With 13.4% poverty level for males and 16.5% for females among the residents of Fort Lauderdale, 5 year old males and 6 to 11 year old females are the most vulnerable to poverty, with 339 males (35.5%) and 1,559 females (32.1%) in their respective age groups living below the poverty level.
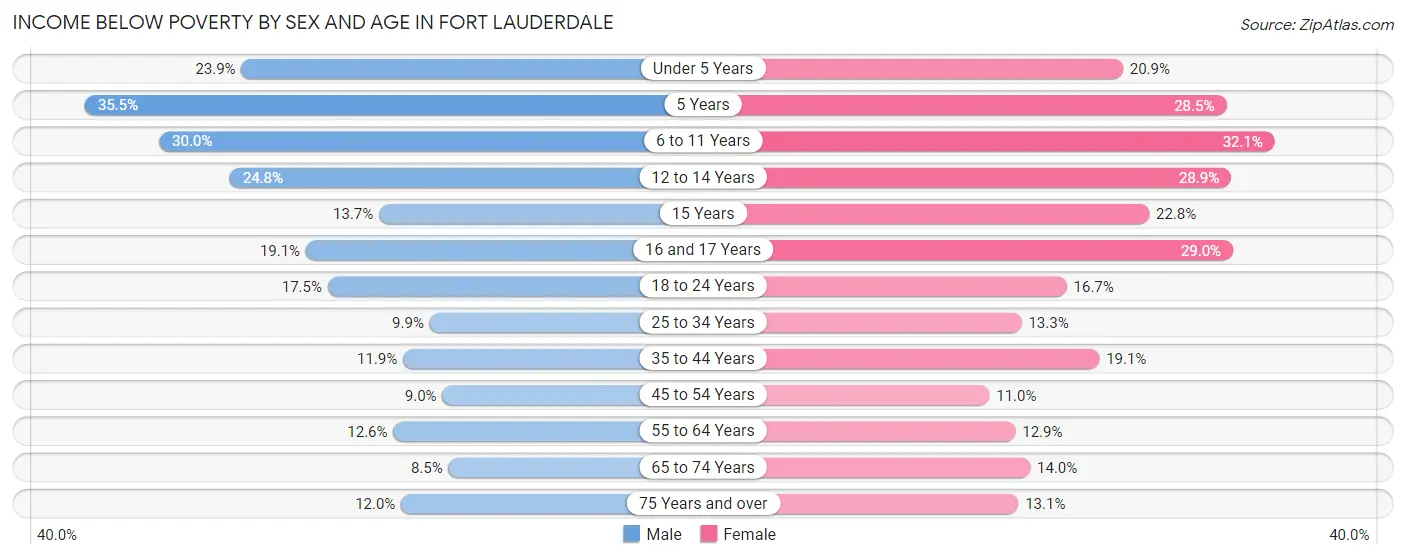
| Age Bracket | Male | Female |
| Under 5 Years | 1,123 (23.9%) | 843 (20.9%) |
| 5 Years | 339 (35.5%) | 256 (28.5%) |
| 6 to 11 Years | 1,306 (30.0%) | 1,559 (32.1%) |
| 12 to 14 Years | 544 (24.8%) | 728 (28.9%) |
| 15 Years | 119 (13.7%) | 274 (22.8%) |
| 16 and 17 Years | 354 (19.1%) | 606 (29.0%) |
| 18 to 24 Years | 1,169 (17.5%) | 1,062 (16.7%) |
| 25 to 34 Years | 1,391 (9.9%) | 1,661 (13.3%) |
| 35 to 44 Years | 1,476 (11.9%) | 2,150 (19.1%) |
| 45 to 54 Years | 1,205 (9.0%) | 1,311 (11.0%) |
| 55 to 64 Years | 1,812 (12.6%) | 1,594 (12.9%) |
| 65 to 74 Years | 975 (8.5%) | 1,245 (14.0%) |
| 75 Years and over | 795 (12.0%) | 1,026 (13.1%) |
| Total | 12,608 (13.4%) | 14,315 (16.5%) |
Income Above Poverty by Sex and Age in Fort Lauderdale
According to the poverty statistics in Fort Lauderdale, males aged 65 to 74 years and females aged 45 to 54 years are the age groups that are most secure financially, with 91.5% of males and 89.0% of females in these age groups living above the poverty line.
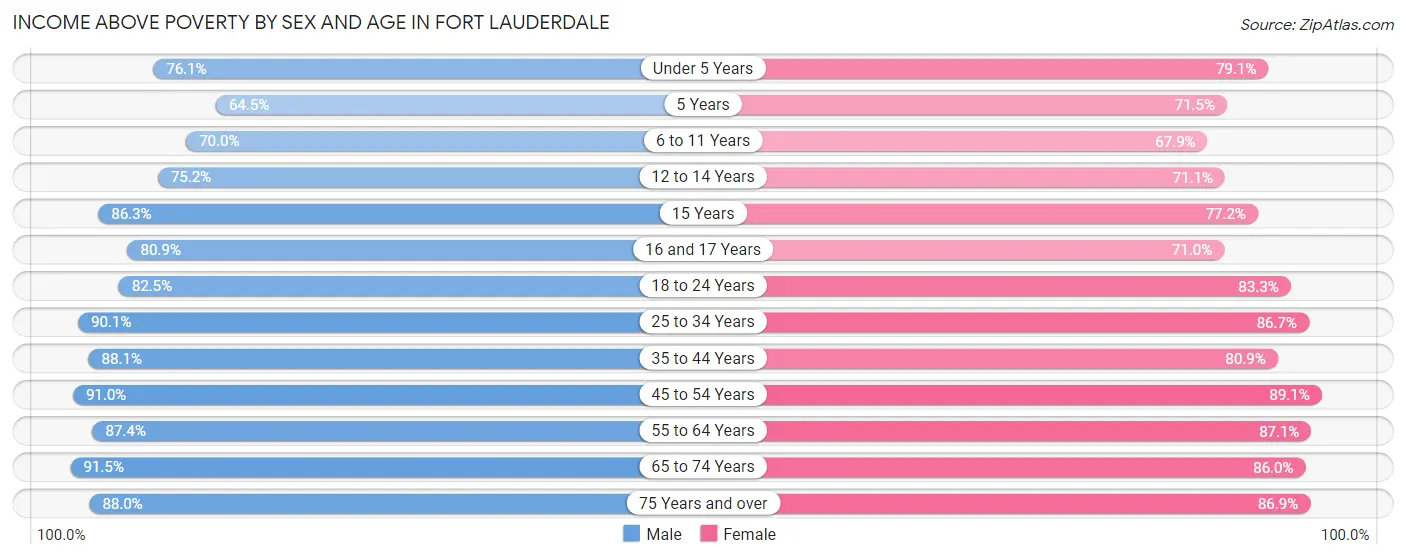
| Age Bracket | Male | Female |
| Under 5 Years | 3,575 (76.1%) | 3,199 (79.1%) |
| 5 Years | 615 (64.5%) | 641 (71.5%) |
| 6 to 11 Years | 3,046 (70.0%) | 3,291 (67.9%) |
| 12 to 14 Years | 1,653 (75.2%) | 1,791 (71.1%) |
| 15 Years | 751 (86.3%) | 927 (77.2%) |
| 16 and 17 Years | 1,498 (80.9%) | 1,481 (71.0%) |
| 18 to 24 Years | 5,514 (82.5%) | 5,300 (83.3%) |
| 25 to 34 Years | 12,637 (90.1%) | 10,793 (86.7%) |
| 35 to 44 Years | 10,925 (88.1%) | 9,100 (80.9%) |
| 45 to 54 Years | 12,208 (91.0%) | 10,662 (89.0%) |
| 55 to 64 Years | 12,542 (87.4%) | 10,785 (87.1%) |
| 65 to 74 Years | 10,475 (91.5%) | 7,661 (86.0%) |
| 75 Years and over | 5,806 (88.0%) | 6,804 (86.9%) |
| Total | 81,245 (86.6%) | 72,435 (83.5%) |
Income Below Poverty Among Married-Couple Families in Fort Lauderdale
The poverty statistics for married-couple families in Fort Lauderdale show that 6.2% or 1,726 of the total 27,600 families live below the poverty line. Families with 5 or more children have the highest poverty rate of 89.1%, comprising of 82 families. On the other hand, families with no children have the lowest poverty rate of 3.6%, which includes 671 families.
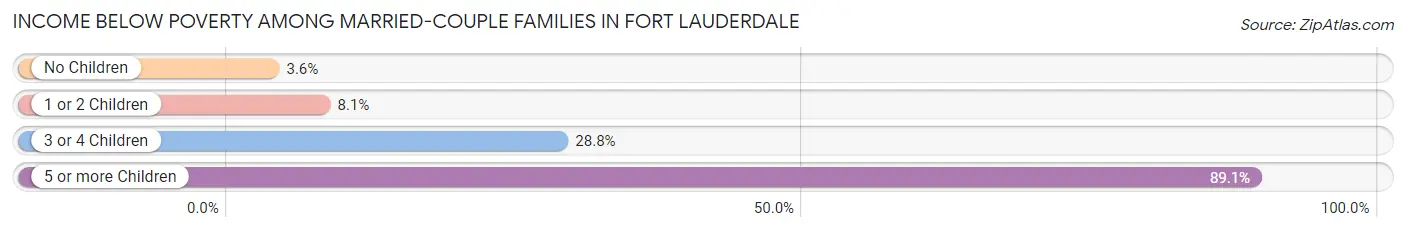
| Children | Above Poverty | Below Poverty |
| No Children | 17,925 (96.4%) | 671 (3.6%) |
| 1 or 2 Children | 7,062 (91.9%) | 619 (8.1%) |
| 3 or 4 Children | 877 (71.2%) | 354 (28.8%) |
| 5 or more Children | 10 (10.9%) | 82 (89.1%) |
| Total | 25,874 (93.8%) | 1,726 (6.2%) |
Income Below Poverty Among Single-Parent Households in Fort Lauderdale
According to the poverty data in Fort Lauderdale, 11.6% or 415 single-father households and 27.0% or 2,412 single-mother households are living below the poverty line. Among single-father households, those with 5 or more children have the highest poverty rate, with 30 households (100.0%) experiencing poverty. Likewise, among single-mother households, those with 5 or more children have the highest poverty rate, with 73 households (67.0%) falling below the poverty line.
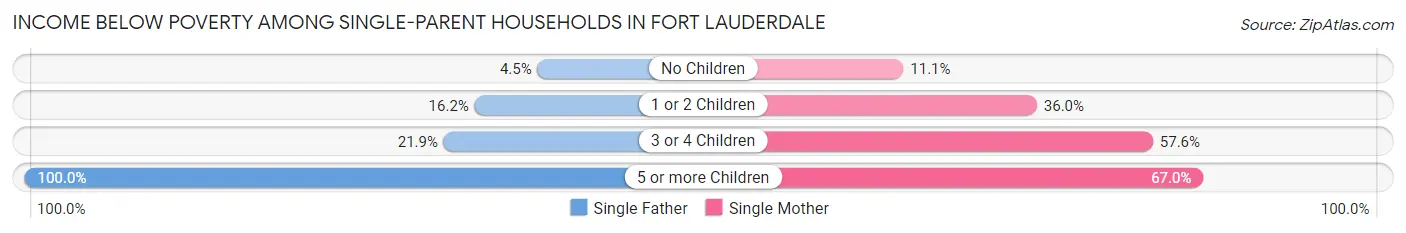
| Children | Single Father | Single Mother |
| No Children | 73 (4.5%) | 472 (11.1%) |
| 1 or 2 Children | 296 (16.2%) | 1,294 (36.0%) |
| 3 or 4 Children | 16 (21.9%) | 573 (57.6%) |
| 5 or more Children | 30 (100.0%) | 73 (67.0%) |
| Total | 415 (11.6%) | 2,412 (27.0%) |
Income Below Poverty Among Married-Couple vs Single-Parent Households in Fort Lauderdale
The poverty data for Fort Lauderdale shows that 1,726 of the married-couple family households (6.2%) and 2,827 of the single-parent households (22.6%) are living below the poverty level. Within the married-couple family households, those with 5 or more children have the highest poverty rate, with 82 households (89.1%) falling below the poverty line. Among the single-parent households, those with 5 or more children have the highest poverty rate, with 103 household (74.1%) living below poverty.
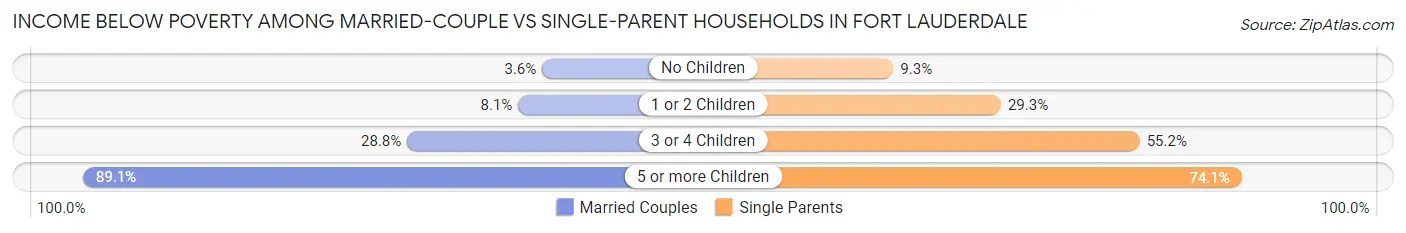
| Children | Married-Couple Families | Single-Parent Households |
| No Children | 671 (3.6%) | 545 (9.3%) |
| 1 or 2 Children | 619 (8.1%) | 1,590 (29.3%) |
| 3 or 4 Children | 354 (28.8%) | 589 (55.1%) |
| 5 or more Children | 82 (89.1%) | 103 (74.1%) |
| Total | 1,726 (6.2%) | 2,827 (22.6%) |
Race in Fort Lauderdale
The most populous races in Fort Lauderdale are White / Caucasian (99,938 | 54.7%), Black / African American (53,400 | 29.2%), and Hispanic or Latino (36,082 | 19.8%).
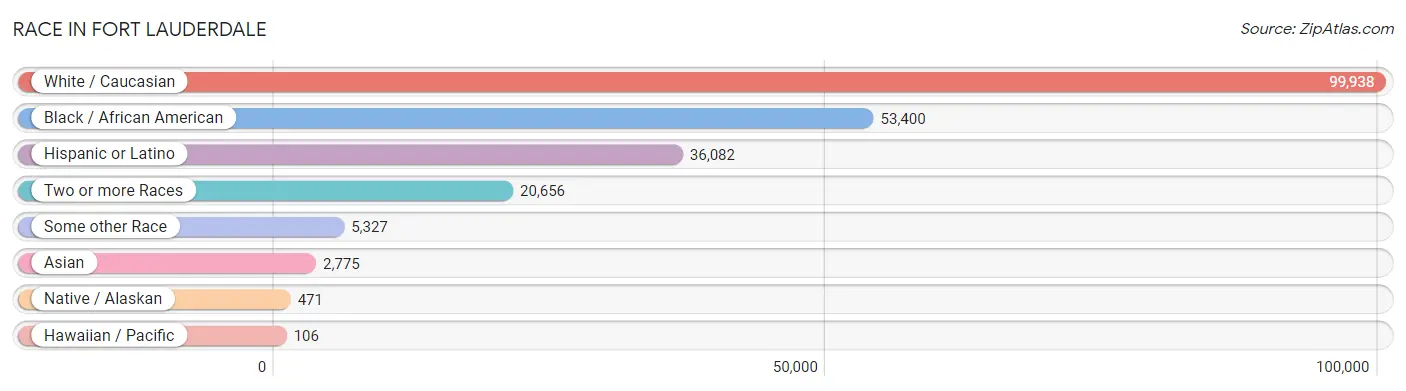
| Race | # Population | % Population |
| Asian | 2,775 | 1.5% |
| Black / African American | 53,400 | 29.2% |
| Hawaiian / Pacific | 106 | 0.1% |
| Hispanic or Latino | 36,082 | 19.8% |
| Native / Alaskan | 471 | 0.3% |
| White / Caucasian | 99,938 | 54.7% |
| Two or more Races | 20,656 | 11.3% |
| Some other Race | 5,327 | 2.9% |
| Total | 182,673 | 100.0% |
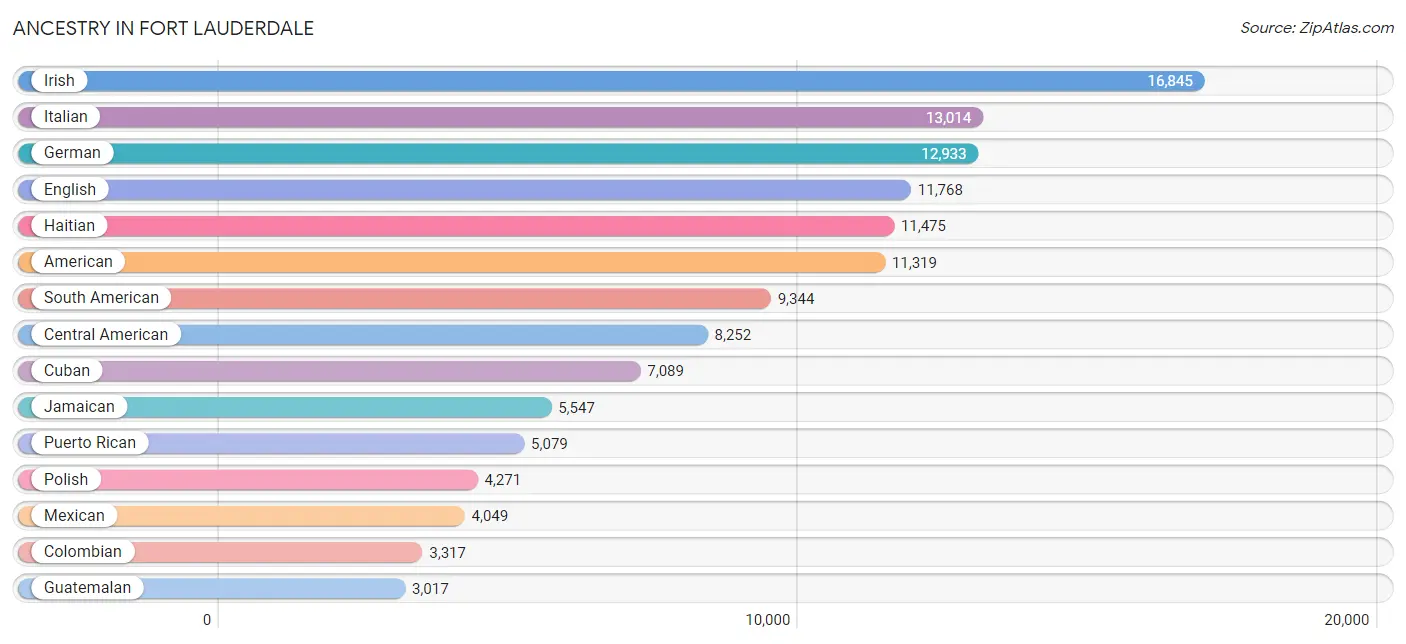
Ancestry in Fort Lauderdale
The most populous ancestries reported in Fort Lauderdale are Irish (16,845 | 9.2%), Italian (13,014 | 7.1%), German (12,933 | 7.1%), English (11,768 | 6.4%), and Haitian (11,475 | 6.3%), together accounting for 36.1% of all Fort Lauderdale residents.
| Ancestry | # Population | % Population |
| African | 939 | 0.5% |
| Albanian | 176 | 0.1% |
| American | 11,319 | 6.2% |
| Apache | 8 | 0.0% |
| Arab | 1,311 | 0.7% |
| Argentinean | 1,329 | 0.7% |
| Armenian | 269 | 0.2% |
| Australian | 753 | 0.4% |
| Austrian | 602 | 0.3% |
| Bahamian | 1,079 | 0.6% |
| Barbadian | 70 | 0.0% |
| Basque | 20 | 0.0% |
| Belgian | 137 | 0.1% |
| Belizean | 11 | 0.0% |
| Bhutanese | 255 | 0.1% |
| Blackfeet | 14 | 0.0% |
| Bolivian | 128 | 0.1% |
| Brazilian | 1,194 | 0.6% |
| British | 1,500 | 0.8% |
| British West Indian | 221 | 0.1% |
| Bulgarian | 44 | 0.0% |
| Burmese | 60 | 0.0% |
| Canadian | 588 | 0.3% |
| Cape Verdean | 11 | 0.0% |
| Carpatho Rusyn | 9 | 0.0% |
| Central American | 8,252 | 4.5% |
| Central American Indian | 221 | 0.1% |
| Cherokee | 153 | 0.1% |
| Chickasaw | 15 | 0.0% |
| Chilean | 289 | 0.2% |
| Choctaw | 13 | 0.0% |
| Colombian | 3,317 | 1.8% |
| Comanche | 12 | 0.0% |
| Costa Rican | 373 | 0.2% |
| Cree | 26 | 0.0% |
| Creek | 6 | 0.0% |
| Croatian | 211 | 0.1% |
| Cuban | 7,089 | 3.9% |
| Cypriot | 73 | 0.0% |
| Czech | 466 | 0.3% |
| Czechoslovakian | 88 | 0.1% |
| Danish | 338 | 0.2% |
| Dominican | 654 | 0.4% |
| Dutch | 1,284 | 0.7% |
| Dutch West Indian | 107 | 0.1% |
| Eastern European | 1,089 | 0.6% |
| Ecuadorian | 577 | 0.3% |
| Egyptian | 93 | 0.1% |
| English | 11,768 | 6.4% |
| Ethiopian | 7 | 0.0% |
| European | 2,334 | 1.3% |
| Filipino | 149 | 0.1% |
| Finnish | 101 | 0.1% |
| French | 2,994 | 1.6% |
| French Canadian | 597 | 0.3% |
| German | 12,933 | 7.1% |
| Ghanaian | 25 | 0.0% |
| Greek | 1,133 | 0.6% |
| Guamanian / Chamorro | 55 | 0.0% |
| Guatemalan | 3,017 | 1.7% |
| Guyanese | 112 | 0.1% |
| Haitian | 11,475 | 6.3% |
| Honduran | 2,347 | 1.3% |
| Hungarian | 905 | 0.5% |
| Indian (Asian) | 838 | 0.5% |
| Inupiat | 37 | 0.0% |
| Iranian | 229 | 0.1% |
| Iraqi | 42 | 0.0% |
| Irish | 16,845 | 9.2% |
| Israeli | 789 | 0.4% |
| Italian | 13,014 | 7.1% |
| Jamaican | 5,547 | 3.0% |
| Japanese | 100 | 0.1% |
| Jordanian | 21 | 0.0% |
| Korean | 1,122 | 0.6% |
| Latvian | 52 | 0.0% |
| Lebanese | 667 | 0.4% |
| Lithuanian | 614 | 0.3% |
| Lumbee | 4 | 0.0% |
| Luxembourger | 29 | 0.0% |
| Macedonian | 76 | 0.0% |
| Maltese | 8 | 0.0% |
| Mexican | 4,049 | 2.2% |
| Mexican American Indian | 41 | 0.0% |
| Mongolian | 7 | 0.0% |
| Moroccan | 266 | 0.2% |
| Native Hawaiian | 45 | 0.0% |
| Navajo | 17 | 0.0% |
| New Zealander | 15 | 0.0% |
| Nicaraguan | 549 | 0.3% |
| Nigerian | 321 | 0.2% |
| Northern European | 174 | 0.1% |
| Norwegian | 796 | 0.4% |
| Osage | 3 | 0.0% |
| Pakistani | 117 | 0.1% |
| Palestinian | 8 | 0.0% |
| Panamanian | 236 | 0.1% |
| Paraguayan | 47 | 0.0% |
| Pennsylvania German | 60 | 0.0% |
| Peruvian | 1,155 | 0.6% |
| Polish | 4,271 | 2.3% |
| Portuguese | 844 | 0.5% |
| Potawatomi | 18 | 0.0% |
| Puerto Rican | 5,079 | 2.8% |
| Romanian | 621 | 0.3% |
| Russian | 2,694 | 1.5% |
| Salvadoran | 1,730 | 0.9% |
| Scandinavian | 200 | 0.1% |
| Scotch-Irish | 1,166 | 0.6% |
| Scottish | 1,916 | 1.1% |
| Serbian | 207 | 0.1% |
| Sioux | 9 | 0.0% |
| Slavic | 87 | 0.1% |
| Slovak | 268 | 0.2% |
| Slovene | 55 | 0.0% |
| South African | 84 | 0.1% |
| South American | 9,344 | 5.1% |
| South American Indian | 43 | 0.0% |
| Spaniard | 529 | 0.3% |
| Spanish | 171 | 0.1% |
| Spanish American Indian | 17 | 0.0% |
| Sri Lankan | 230 | 0.1% |
| Subsaharan African | 1,450 | 0.8% |
| Swedish | 1,141 | 0.6% |
| Swiss | 287 | 0.2% |
| Syrian | 150 | 0.1% |
| Thai | 837 | 0.5% |
| Tlingit-Haida | 22 | 0.0% |
| Trinidadian and Tobagonian | 370 | 0.2% |
| Turkish | 675 | 0.4% |
| U.S. Virgin Islander | 4 | 0.0% |
| Ukrainian | 735 | 0.4% |
| Uruguayan | 264 | 0.1% |
| Venezuelan | 2,192 | 1.2% |
| Welsh | 933 | 0.5% |
| West Indian | 969 | 0.5% |
| Yugoslavian | 13 | 0.0% |
| Zimbabwean | 19 | 0.0% | View All 138 Rows |
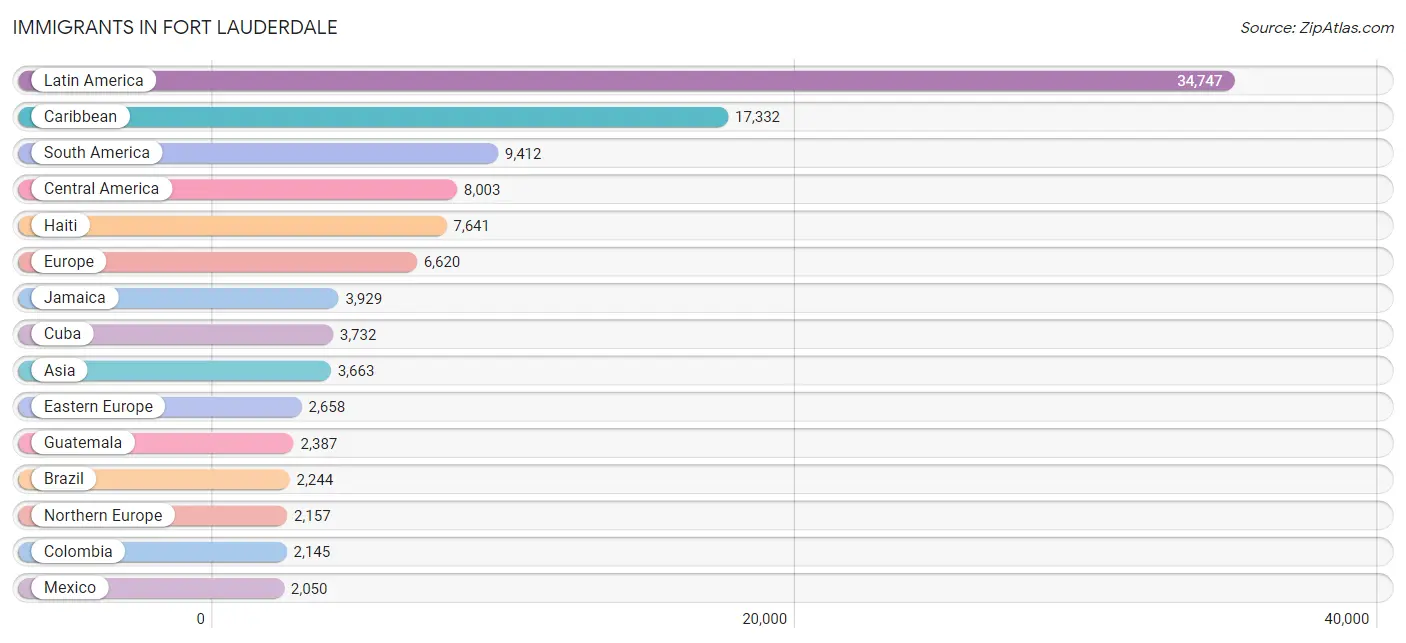
Immigrants in Fort Lauderdale
The most numerous immigrant groups reported in Fort Lauderdale came from Latin America (34,747 | 19.0%), Caribbean (17,332 | 9.5%), South America (9,412 | 5.1%), Central America (8,003 | 4.4%), and Haiti (7,641 | 4.2%), together accounting for 42.2% of all Fort Lauderdale residents.
| Immigration Origin | # Population | % Population |
| Africa | 884 | 0.5% |
| Albania | 122 | 0.1% |
| Argentina | 1,088 | 0.6% |
| Armenia | 27 | 0.0% |
| Asia | 3,663 | 2.0% |
| Australia | 292 | 0.2% |
| Austria | 9 | 0.0% |
| Bahamas | 829 | 0.4% |
| Barbados | 56 | 0.0% |
| Belarus | 61 | 0.0% |
| Belgium | 22 | 0.0% |
| Belize | 11 | 0.0% |
| Bolivia | 106 | 0.1% |
| Bosnia and Herzegovina | 7 | 0.0% |
| Brazil | 2,244 | 1.2% |
| Bulgaria | 44 | 0.0% |
| Cambodia | 63 | 0.0% |
| Canada | 1,737 | 0.9% |
| Caribbean | 17,332 | 9.5% |
| Central America | 8,003 | 4.4% |
| Chile | 270 | 0.2% |
| China | 323 | 0.2% |
| Colombia | 2,145 | 1.2% |
| Costa Rica | 91 | 0.1% |
| Croatia | 9 | 0.0% |
| Cuba | 3,732 | 2.0% |
| Czechoslovakia | 243 | 0.1% |
| Denmark | 76 | 0.0% |
| Dominica | 16 | 0.0% |
| Dominican Republic | 281 | 0.2% |
| Eastern Africa | 38 | 0.0% |
| Eastern Asia | 367 | 0.2% |
| Eastern Europe | 2,658 | 1.5% |
| Ecuador | 364 | 0.2% |
| Egypt | 172 | 0.1% |
| El Salvador | 1,264 | 0.7% |
| England | 833 | 0.5% |
| Europe | 6,620 | 3.6% |
| Fiji | 16 | 0.0% |
| France | 327 | 0.2% |
| Germany | 624 | 0.3% |
| Greece | 237 | 0.1% |
| Grenada | 8 | 0.0% |
| Guatemala | 2,387 | 1.3% |
| Guyana | 110 | 0.1% |
| Haiti | 7,641 | 4.2% |
| Honduras | 1,578 | 0.9% |
| Hong Kong | 16 | 0.0% |
| Hungary | 110 | 0.1% |
| India | 298 | 0.2% |
| Iran | 121 | 0.1% |
| Iraq | 69 | 0.0% |
| Ireland | 451 | 0.3% |
| Israel | 346 | 0.2% |
| Italy | 210 | 0.1% |
| Jamaica | 3,929 | 2.1% |
| Japan | 15 | 0.0% |
| Jordan | 21 | 0.0% |
| Kazakhstan | 266 | 0.2% |
| Korea | 29 | 0.0% |
| Kuwait | 20 | 0.0% |
| Latin America | 34,747 | 19.0% |
| Lebanon | 121 | 0.1% |
| Malaysia | 36 | 0.0% |
| Mexico | 2,050 | 1.1% |
| Middle Africa | 10 | 0.0% |
| Moldova | 45 | 0.0% |
| Morocco | 110 | 0.1% |
| Netherlands | 126 | 0.1% |
| Nicaragua | 441 | 0.2% |
| Nigeria | 270 | 0.2% |
| North Macedonia | 38 | 0.0% |
| Northern Africa | 329 | 0.2% |
| Northern Europe | 2,157 | 1.2% |
| Oceania | 381 | 0.2% |
| Pakistan | 61 | 0.0% |
| Panama | 181 | 0.1% |
| Peru | 1,038 | 0.6% |
| Philippines | 702 | 0.4% |
| Poland | 623 | 0.3% |
| Portugal | 18 | 0.0% |
| Romania | 282 | 0.2% |
| Russia | 670 | 0.4% |
| Scotland | 51 | 0.0% |
| Serbia | 59 | 0.0% |
| South Africa | 237 | 0.1% |
| South America | 9,412 | 5.1% |
| South Central Asia | 1,039 | 0.6% |
| South Eastern Asia | 1,062 | 0.6% |
| Southern Europe | 665 | 0.4% |
| Spain | 200 | 0.1% |
| Sri Lanka | 141 | 0.1% |
| Sweden | 115 | 0.1% |
| Switzerland | 32 | 0.0% |
| Syria | 31 | 0.0% |
| Taiwan | 81 | 0.0% |
| Thailand | 117 | 0.1% |
| Trinidad and Tobago | 413 | 0.2% |
| Turkey | 525 | 0.3% |
| Ukraine | 323 | 0.2% |
| Uruguay | 147 | 0.1% |
| Uzbekistan | 105 | 0.1% |
| Venezuela | 1,839 | 1.0% |
| Vietnam | 144 | 0.1% |
| West Indies | 36 | 0.0% |
| Western Africa | 270 | 0.2% |
| Western Asia | 1,187 | 0.6% |
| Western Europe | 1,140 | 0.6% |
| Zimbabwe | 19 | 0.0% | View All 109 Rows |
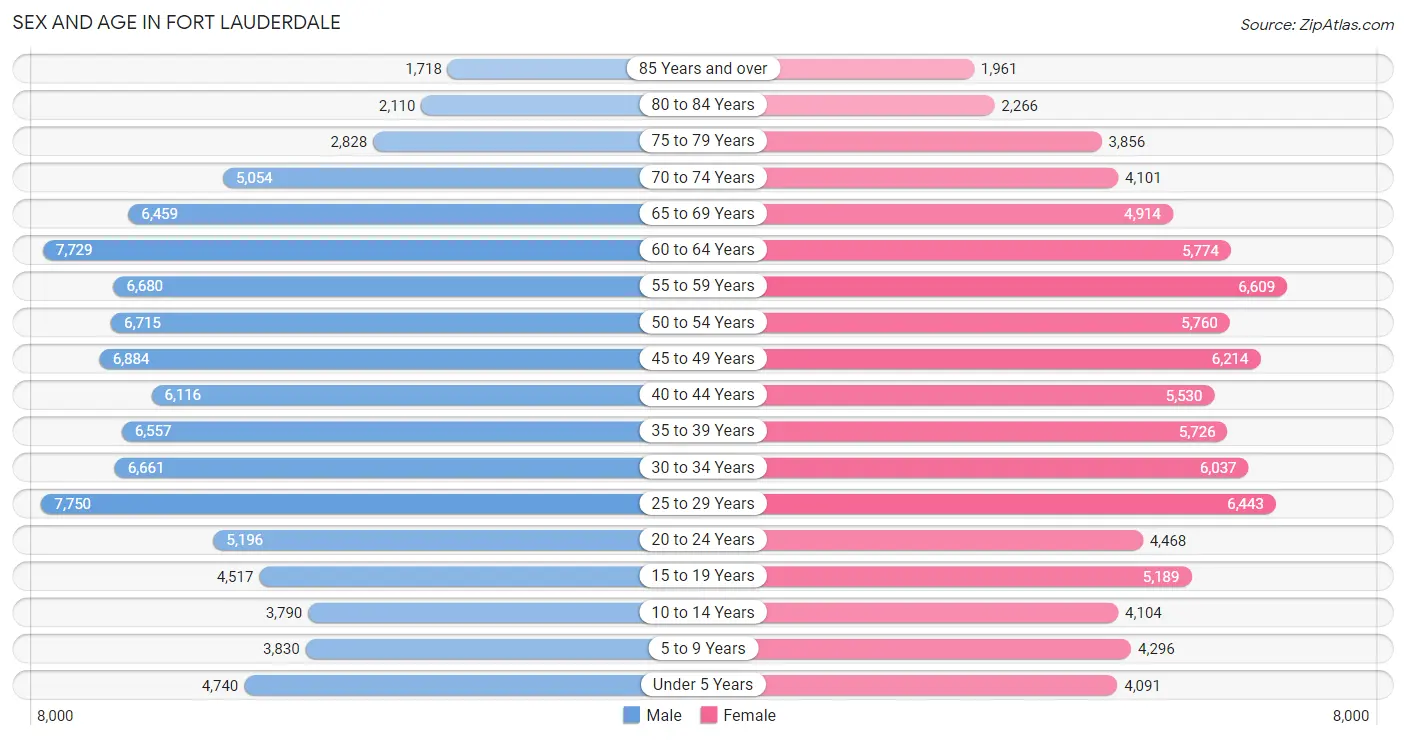
Sex and Age in Fort Lauderdale
Sex and Age in Fort Lauderdale
The most populous age groups in Fort Lauderdale are 25 to 29 Years (7,750 | 8.1%) for men and 55 to 59 Years (6,609 | 7.6%) for women.
| Age Bracket | Male | Female |
| Under 5 Years | 4,740 (5.0%) | 4,091 (4.7%) |
| 5 to 9 Years | 3,830 (4.0%) | 4,296 (4.9%) |
| 10 to 14 Years | 3,790 (4.0%) | 4,104 (4.7%) |
| 15 to 19 Years | 4,517 (4.7%) | 5,189 (5.9%) |
| 20 to 24 Years | 5,196 (5.4%) | 4,468 (5.1%) |
| 25 to 29 Years | 7,750 (8.1%) | 6,443 (7.4%) |
| 30 to 34 Years | 6,661 (7.0%) | 6,037 (6.9%) |
| 35 to 39 Years | 6,557 (6.9%) | 5,726 (6.6%) |
| 40 to 44 Years | 6,116 (6.4%) | 5,530 (6.3%) |
| 45 to 49 Years | 6,884 (7.2%) | 6,214 (7.1%) |
| 50 to 54 Years | 6,715 (7.0%) | 5,760 (6.6%) |
| 55 to 59 Years | 6,680 (7.0%) | 6,609 (7.6%) |
| 60 to 64 Years | 7,729 (8.1%) | 5,774 (6.6%) |
| 65 to 69 Years | 6,459 (6.8%) | 4,914 (5.6%) |
| 70 to 74 Years | 5,054 (5.3%) | 4,101 (4.7%) |
| 75 to 79 Years | 2,828 (3.0%) | 3,856 (4.4%) |
| 80 to 84 Years | 2,110 (2.2%) | 2,266 (2.6%) |
| 85 Years and over | 1,718 (1.8%) | 1,961 (2.2%) |
| Total | 95,334 (100.0%) | 87,339 (100.0%) |
Families and Households in Fort Lauderdale
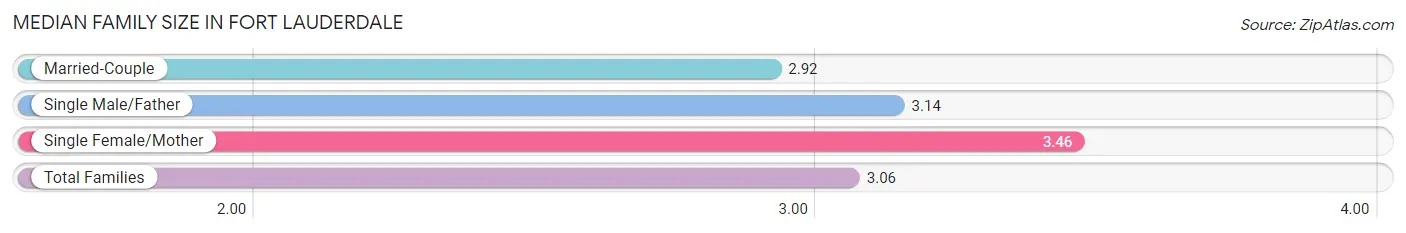
Median Family Size in Fort Lauderdale
The median family size in Fort Lauderdale is 3.06 persons per family, with single female/mother families (8,945 | 22.3%) accounting for the largest median family size of 3.46 persons per family. On the other hand, married-couple families (27,600 | 68.8%) represent the smallest median family size with 2.92 persons per family.
| Family Type | # Families | Family Size |
| Married-Couple | 27,600 (68.8%) | 2.92 |
| Single Male/Father | 3,571 (8.9%) | 3.14 |
| Single Female/Mother | 8,945 (22.3%) | 3.46 |
| Total Families | 40,116 (100.0%) | 3.06 |
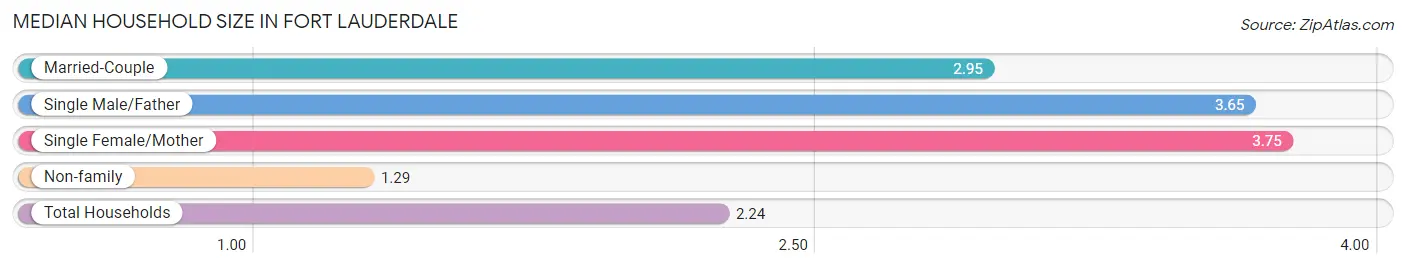
Median Household Size in Fort Lauderdale
The median household size in Fort Lauderdale is 2.24 persons per household, with single female/mother households (8,945 | 11.2%) accounting for the largest median household size of 3.75 persons per household. non-family households (39,915 | 49.9%) represent the smallest median household size with 1.29 persons per household.
| Household Type | # Households | Household Size |
| Married-Couple | 27,600 (34.5%) | 2.95 |
| Single Male/Father | 3,571 (4.5%) | 3.65 |
| Single Female/Mother | 8,945 (11.2%) | 3.75 |
| Non-family | 39,915 (49.9%) | 1.29 |
| Total Households | 80,031 (100.0%) | 2.24 |
Household Size by Marriage Status in Fort Lauderdale
Out of a total of 80,031 households in Fort Lauderdale, 40,116 (50.1%) are family households, while 39,915 (49.9%) are nonfamily households. The most numerous type of family households are 2-person households, comprising 20,192, and the most common type of nonfamily households are 1-person households, comprising 31,238.
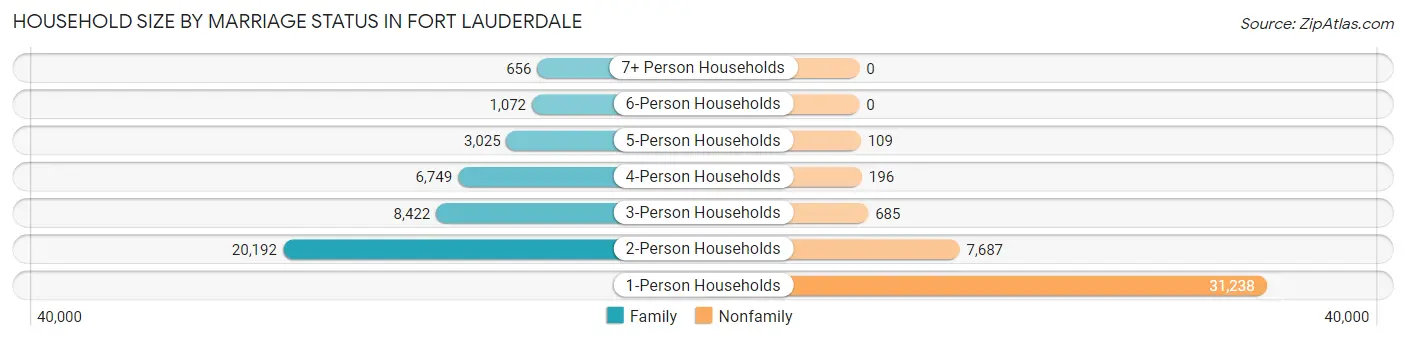
| Household Size | Family Households | Nonfamily Households |
| 1-Person Households | - | 31,238 (39.0%) |
| 2-Person Households | 20,192 (25.2%) | 7,687 (9.6%) |
| 3-Person Households | 8,422 (10.5%) | 685 (0.9%) |
| 4-Person Households | 6,749 (8.4%) | 196 (0.2%) |
| 5-Person Households | 3,025 (3.8%) | 109 (0.1%) |
| 6-Person Households | 1,072 (1.3%) | 0 (0.0%) |
| 7+ Person Households | 656 (0.8%) | 0 (0.0%) |
| Total | 40,116 (50.1%) | 39,915 (49.9%) |
Female Fertility in Fort Lauderdale
Fertility by Age in Fort Lauderdale
Average fertility rate in Fort Lauderdale is 43.0 births per 1,000 women. Women in the age bracket of 20 to 34 years have the highest fertility rate with 67.0 births per 1,000 women. Women in the age bracket of 20 to 34 years acount for 65.6% of all women with births.
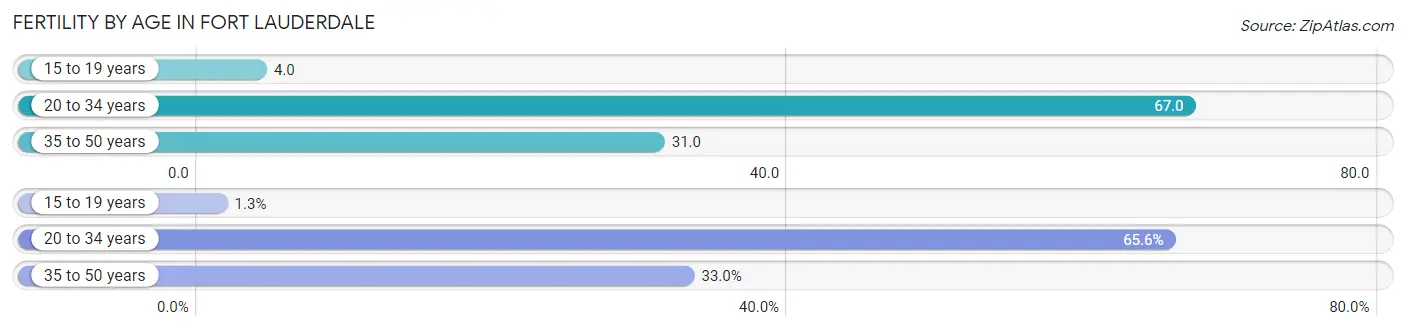
| Age Bracket | Women with Births | Births / 1,000 Women |
| 15 to 19 years | 23 (1.3%) | 4.0 |
| 20 to 34 years | 1,135 (65.6%) | 67.0 |
| 35 to 50 years | 571 (33.0%) | 31.0 |
| Total | 1,729 (100.0%) | 43.0 |
Fertility by Age by Marriage Status in Fort Lauderdale
61.4% of women with births (1,729) in Fort Lauderdale are married. The highest percentage of unmarried women with births falls into 15 to 19 years age bracket with 100.0% of them unmarried at the time of birth, while the lowest percentage of unmarried women with births belong to 35 to 50 years age bracket with 13.8% of them unmarried.
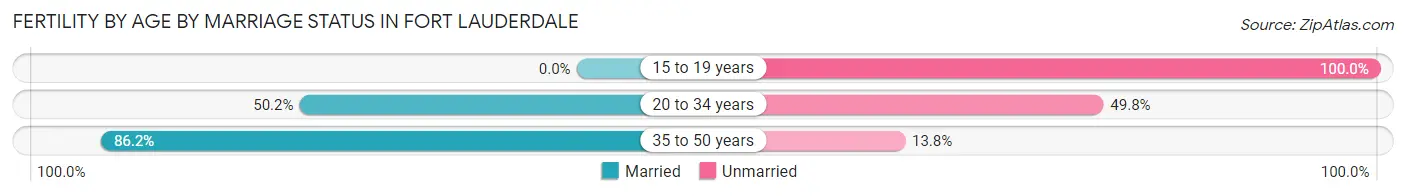
| Age Bracket | Married | Unmarried |
| 15 to 19 years | 0 (0.0%) | 23 (100.0%) |
| 20 to 34 years | 570 (50.2%) | 565 (49.8%) |
| 35 to 50 years | 492 (86.2%) | 79 (13.8%) |
| Total | 1,062 (61.4%) | 667 (38.6%) |
Fertility by Education in Fort Lauderdale
Average fertility rate in Fort Lauderdale is 43.0 births per 1,000 women. Women with the education attainment of graduate degree have the highest fertility rate of 64.0 births per 1,000 women, while women with the education attainment of less than high school have the lowest fertility at 24.0 births per 1,000 women. Women with the education attainment of bachelor's degree represent 24.1% of all women with births.
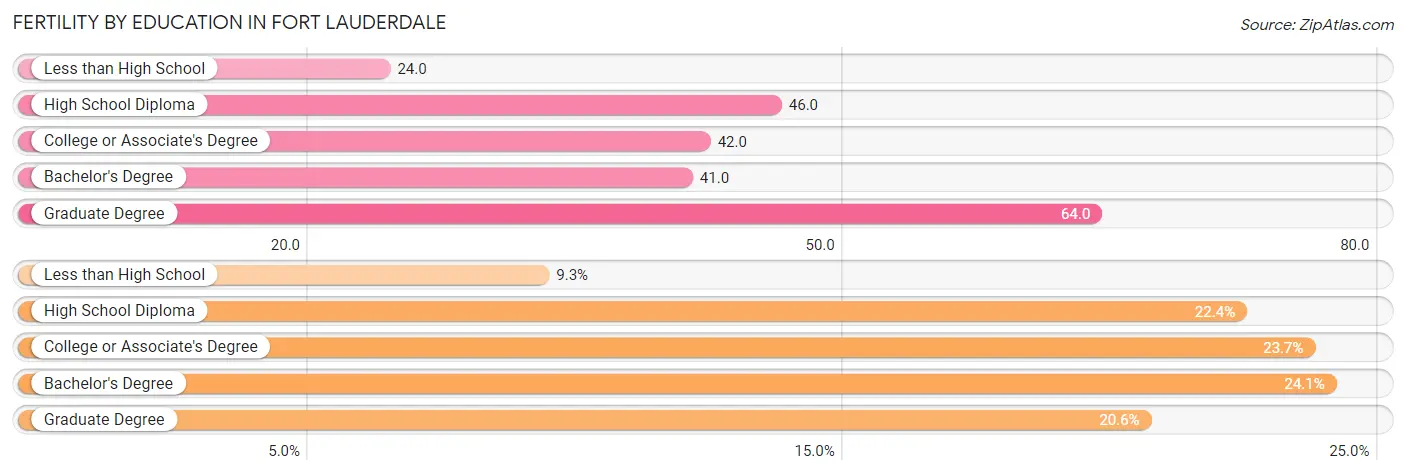
| Educational Attainment | Women with Births | Births / 1,000 Women |
| Less than High School | 161 (9.3%) | 24.0 |
| High School Diploma | 387 (22.4%) | 46.0 |
| College or Associate's Degree | 409 (23.7%) | 42.0 |
| Bachelor's Degree | 416 (24.1%) | 41.0 |
| Graduate Degree | 356 (20.6%) | 64.0 |
| Total | 1,729 (100.0%) | 43.0 |
Fertility by Education by Marriage Status in Fort Lauderdale
38.6% of women with births in Fort Lauderdale are unmarried. Women with the educational attainment of graduate degree are most likely to be married with 88.5% of them married at childbirth, while women with the educational attainment of college or associate's degree are least likely to be married with 68.7% of them unmarried at childbirth.
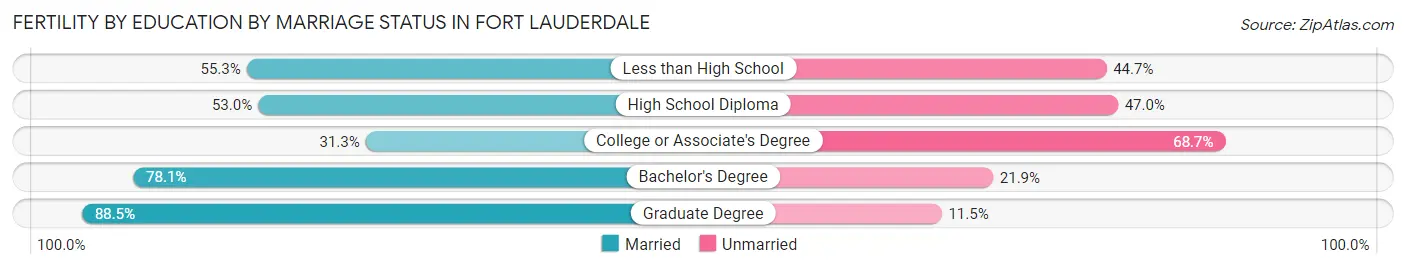
| Educational Attainment | Married | Unmarried |
| Less than High School | 89 (55.3%) | 72 (44.7%) |
| High School Diploma | 205 (53.0%) | 182 (47.0%) |
| College or Associate's Degree | 128 (31.3%) | 281 (68.7%) |
| Bachelor's Degree | 325 (78.1%) | 91 (21.9%) |
| Graduate Degree | 315 (88.5%) | 41 (11.5%) |
| Total | 1,062 (61.4%) | 667 (38.6%) |
Employment Characteristics in Fort Lauderdale
Employment by Class of Employer in Fort Lauderdale
Among the 93,202 employed individuals in Fort Lauderdale, private company employees (66,303 | 71.1%), self-employed (incorporated) (8,145 | 8.7%), and self-employed (not incorporated) (5,868 | 6.3%) make up the most common classes of employment.
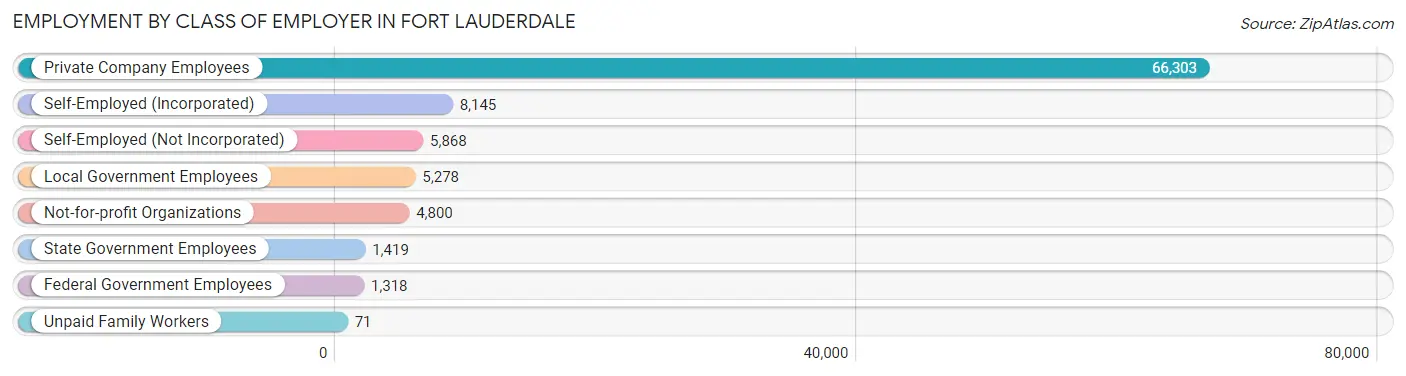
| Employer Class | # Employees | % Employees |
| Private Company Employees | 66,303 | 71.1% |
| Self-Employed (Incorporated) | 8,145 | 8.7% |
| Self-Employed (Not Incorporated) | 5,868 | 6.3% |
| Not-for-profit Organizations | 4,800 | 5.1% |
| Local Government Employees | 5,278 | 5.7% |
| State Government Employees | 1,419 | 1.5% |
| Federal Government Employees | 1,318 | 1.4% |
| Unpaid Family Workers | 71 | 0.1% |
| Total | 93,202 | 100.0% |
Employment Status by Age in Fort Lauderdale
According to the labor force statistics for Fort Lauderdale, out of the total population over 16 years of age (155,747), 64.6% or 100,613 individuals are in the labor force, with 5.4% or 5,433 of them unemployed. The age group with the highest labor force participation rate is 30 to 34 years, with 89.1% or 11,314 individuals in the labor force. Within the labor force, the 16 to 19 years age range has the highest percentage of unemployed individuals, with 27.4% or 642 of them being unemployed.
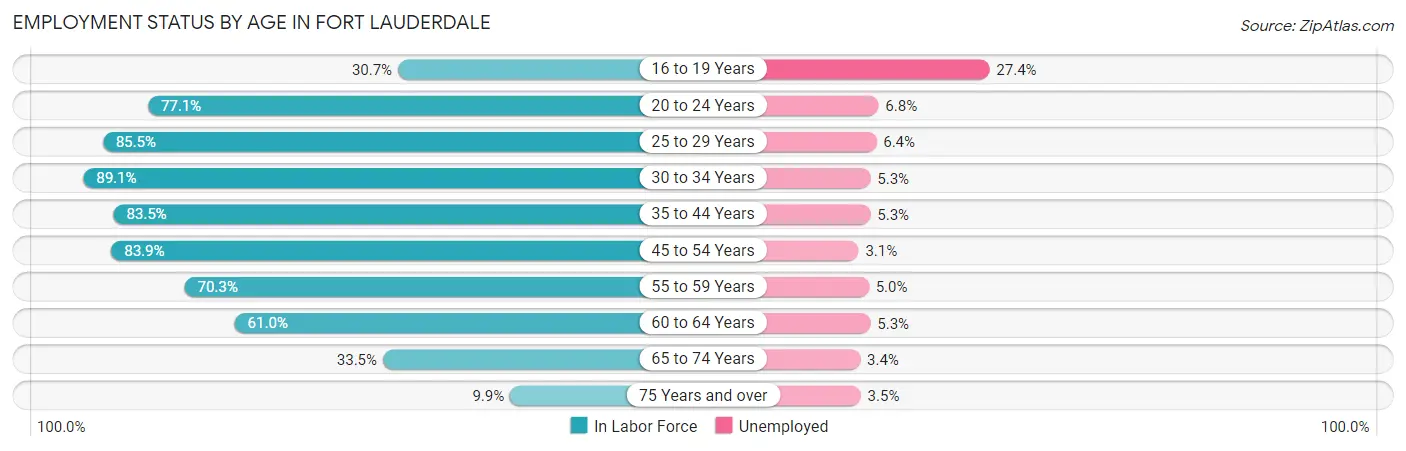
| Age Bracket | In Labor Force | Unemployed |
| 16 to 19 Years | 2,343 (30.7%) | 642 (27.4%) |
| 20 to 24 Years | 7,451 (77.1%) | 507 (6.8%) |
| 25 to 29 Years | 12,135 (85.5%) | 777 (6.4%) |
| 30 to 34 Years | 11,314 (89.1%) | 600 (5.3%) |
| 35 to 44 Years | 19,981 (83.5%) | 1,059 (5.3%) |
| 45 to 54 Years | 21,456 (83.9%) | 665 (3.1%) |
| 55 to 59 Years | 9,342 (70.3%) | 467 (5.0%) |
| 60 to 64 Years | 8,237 (61.0%) | 437 (5.3%) |
| 65 to 74 Years | 6,877 (33.5%) | 234 (3.4%) |
| 75 Years and over | 1,459 (9.9%) | 51 (3.5%) |
| Total | 100,613 (64.6%) | 5,433 (5.4%) |
Employment Status by Educational Attainment in Fort Lauderdale
According to labor force statistics for Fort Lauderdale, 79.9% of individuals (82,445) out of the total population between 25 and 64 years of age (103,185) are in the labor force, with 4.9% or 4,040 of them being unemployed. The group with the highest labor force participation rate are those with the educational attainment of bachelor's degree or higher, with 86.9% or 37,138 individuals in the labor force. Within the labor force, individuals with less than high school education have the highest percentage of unemployment, with 12.2% or 779 of them being unemployed.
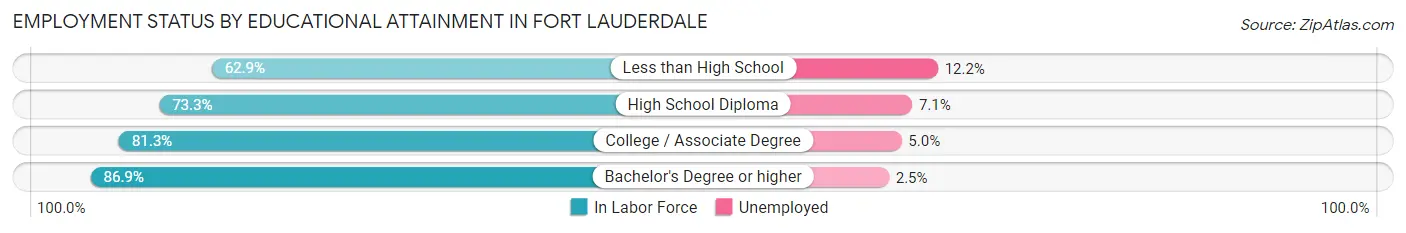
| Educational Attainment | In Labor Force | Unemployed |
| Less than High School | 6,387 (62.9%) | 1,239 (12.2%) |
| High School Diploma | 17,871 (73.3%) | 1,731 (7.1%) |
| College / Associate Degree | 21,068 (81.3%) | 1,296 (5.0%) |
| Bachelor's Degree or higher | 37,138 (86.9%) | 1,068 (2.5%) |
| Total | 82,445 (79.9%) | 5,056 (4.9%) |
Employment Occupations by Sex in Fort Lauderdale
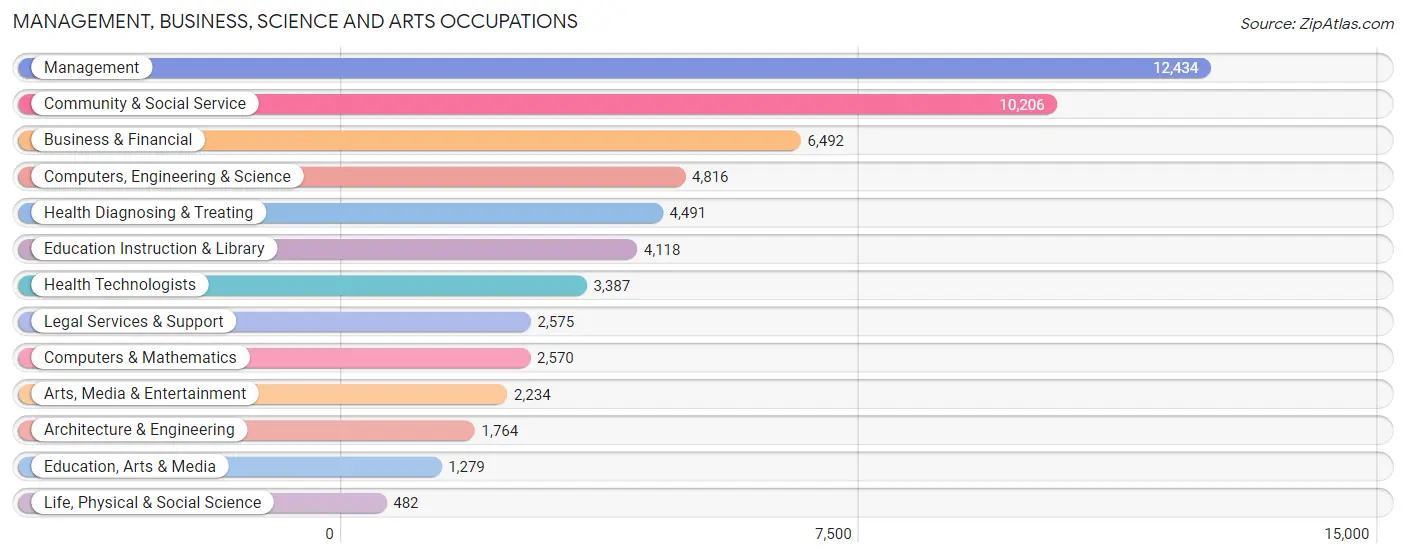
Management, Business, Science and Arts Occupations
The most common Management, Business, Science and Arts occupations in Fort Lauderdale are Management (12,434 | 13.1%), Community & Social Service (10,206 | 10.7%), Business & Financial (6,492 | 6.8%), Computers, Engineering & Science (4,816 | 5.1%), and Health Diagnosing & Treating (4,491 | 4.7%).
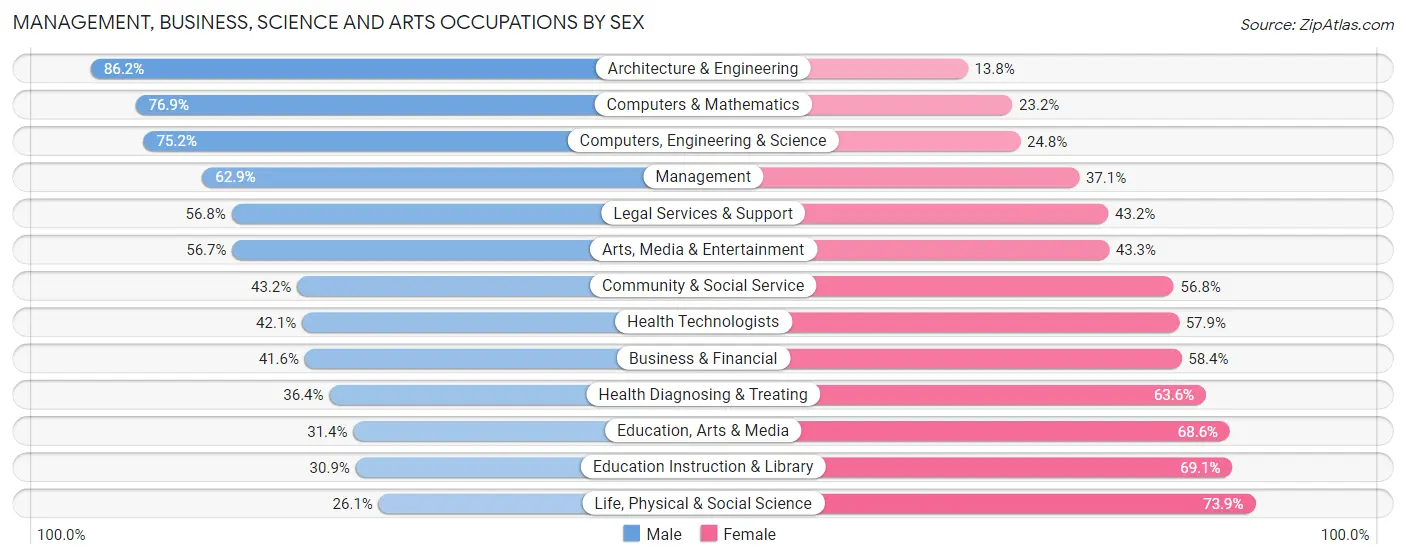
Management, Business, Science and Arts Occupations by Sex
Within the Management, Business, Science and Arts occupations in Fort Lauderdale, the most male-oriented occupations are Architecture & Engineering (86.2%), Computers & Mathematics (76.8%), and Computers, Engineering & Science (75.2%), while the most female-oriented occupations are Life, Physical & Social Science (73.9%), Education Instruction & Library (69.1%), and Education, Arts & Media (68.6%).
| Occupation | Male | Female |
| Management | 7,822 (62.9%) | 4,612 (37.1%) |
| Business & Financial | 2,698 (41.6%) | 3,794 (58.4%) |
| Computers, Engineering & Science | 3,621 (75.2%) | 1,195 (24.8%) |
| Computers & Mathematics | 1,975 (76.8%) | 595 (23.2%) |
| Architecture & Engineering | 1,520 (86.2%) | 244 (13.8%) |
| Life, Physical & Social Science | 126 (26.1%) | 356 (73.9%) |
| Community & Social Service | 4,405 (43.2%) | 5,801 (56.8%) |
| Education, Arts & Media | 402 (31.4%) | 877 (68.6%) |
| Legal Services & Support | 1,463 (56.8%) | 1,112 (43.2%) |
| Education Instruction & Library | 1,274 (30.9%) | 2,844 (69.1%) |
| Arts, Media & Entertainment | 1,266 (56.7%) | 968 (43.3%) |
| Health Diagnosing & Treating | 1,636 (36.4%) | 2,855 (63.6%) |
| Health Technologists | 1,426 (42.1%) | 1,961 (57.9%) |
| Total (Category) | 20,182 (52.5%) | 18,257 (47.5%) |
| Total (Overall) | 53,526 (56.3%) | 41,538 (43.7%) |
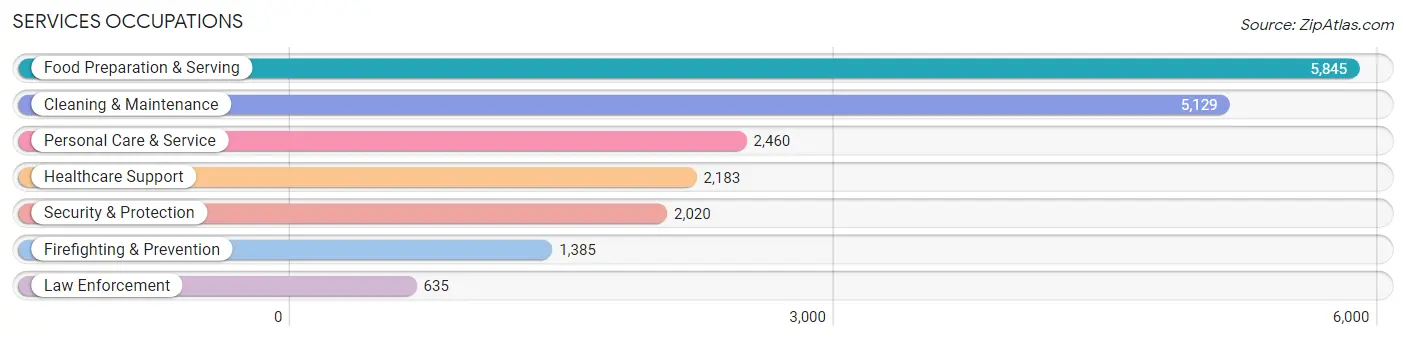
Services Occupations
The most common Services occupations in Fort Lauderdale are Food Preparation & Serving (5,845 | 6.1%), Cleaning & Maintenance (5,129 | 5.4%), Personal Care & Service (2,460 | 2.6%), Healthcare Support (2,183 | 2.3%), and Security & Protection (2,020 | 2.1%).
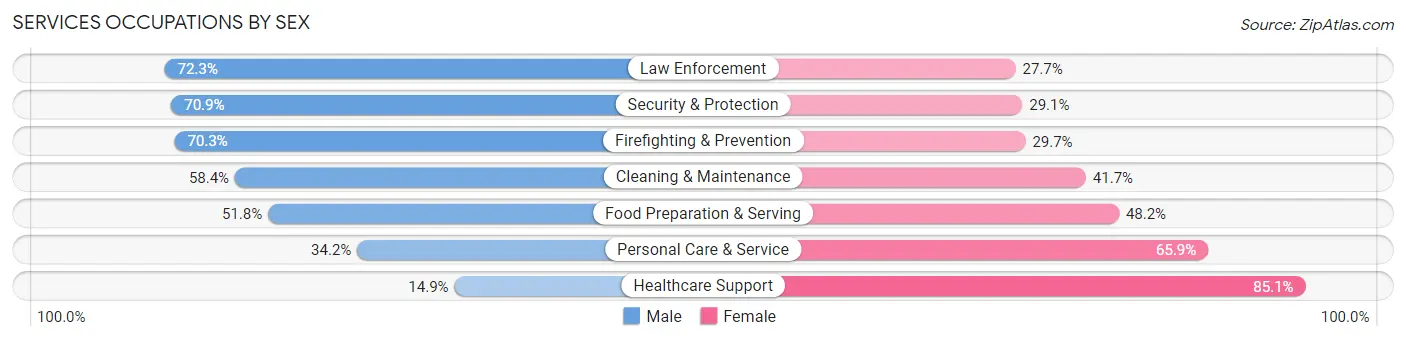
Services Occupations by Sex
Within the Services occupations in Fort Lauderdale, the most male-oriented occupations are Law Enforcement (72.3%), Security & Protection (70.9%), and Firefighting & Prevention (70.3%), while the most female-oriented occupations are Healthcare Support (85.1%), Personal Care & Service (65.8%), and Food Preparation & Serving (48.2%).
| Occupation | Male | Female |
| Healthcare Support | 325 (14.9%) | 1,858 (85.1%) |
| Security & Protection | 1,433 (70.9%) | 587 (29.1%) |
| Firefighting & Prevention | 974 (70.3%) | 411 (29.7%) |
| Law Enforcement | 459 (72.3%) | 176 (27.7%) |
| Food Preparation & Serving | 3,028 (51.8%) | 2,817 (48.2%) |
| Cleaning & Maintenance | 2,993 (58.4%) | 2,136 (41.6%) |
| Personal Care & Service | 840 (34.2%) | 1,620 (65.8%) |
| Total (Category) | 8,619 (48.9%) | 9,018 (51.1%) |
| Total (Overall) | 53,526 (56.3%) | 41,538 (43.7%) |
Sales and Office Occupations
The most common Sales and Office occupations in Fort Lauderdale are Sales & Related (12,407 | 13.1%), and Office & Administration (9,169 | 9.7%).

Sales and Office Occupations by Sex
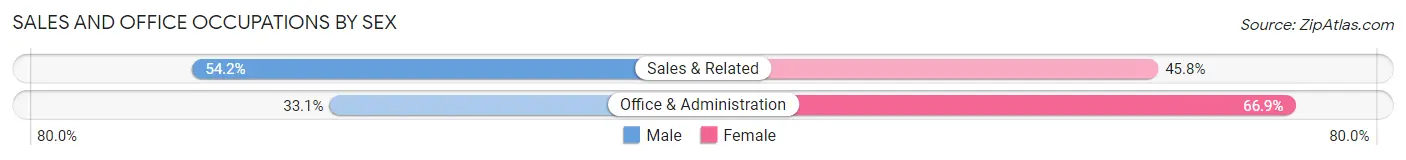
| Occupation | Male | Female |
| Sales & Related | 6,724 (54.2%) | 5,683 (45.8%) |
| Office & Administration | 3,037 (33.1%) | 6,132 (66.9%) |
| Total (Category) | 9,761 (45.2%) | 11,815 (54.8%) |
| Total (Overall) | 53,526 (56.3%) | 41,538 (43.7%) |
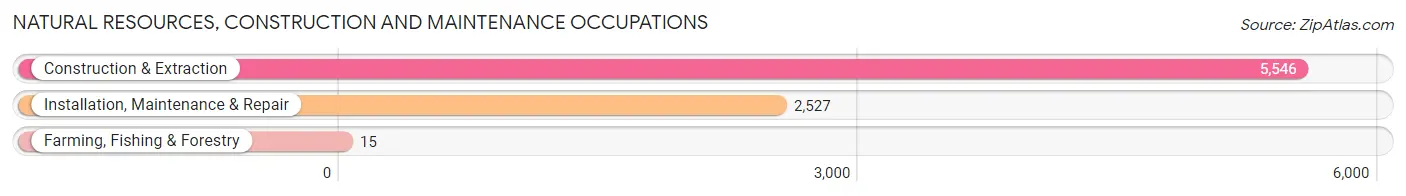
Natural Resources, Construction and Maintenance Occupations
The most common Natural Resources, Construction and Maintenance occupations in Fort Lauderdale are Construction & Extraction (5,546 | 5.8%), Installation, Maintenance & Repair (2,527 | 2.7%), and Farming, Fishing & Forestry (15 | 0.0%).
Natural Resources, Construction and Maintenance Occupations by Sex
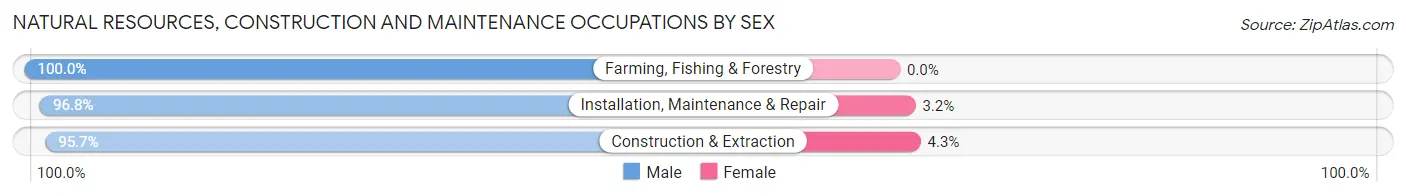
| Occupation | Male | Female |
| Farming, Fishing & Forestry | 15 (100.0%) | 0 (0.0%) |
| Construction & Extraction | 5,307 (95.7%) | 239 (4.3%) |
| Installation, Maintenance & Repair | 2,445 (96.8%) | 82 (3.2%) |
| Total (Category) | 7,767 (96.0%) | 321 (4.0%) |
| Total (Overall) | 53,526 (56.3%) | 41,538 (43.7%) |
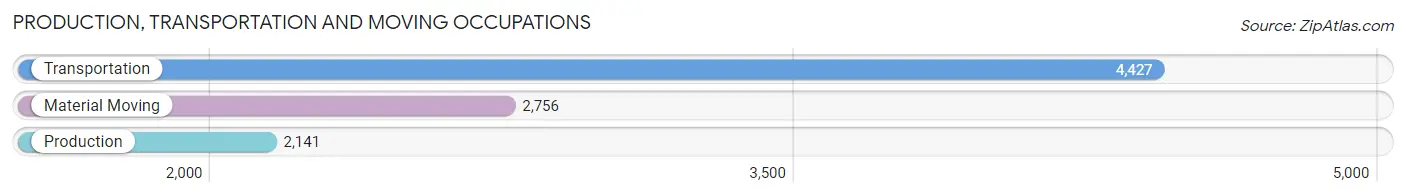
Production, Transportation and Moving Occupations
The most common Production, Transportation and Moving occupations in Fort Lauderdale are Transportation (4,427 | 4.7%), Material Moving (2,756 | 2.9%), and Production (2,141 | 2.2%).
Production, Transportation and Moving Occupations by Sex
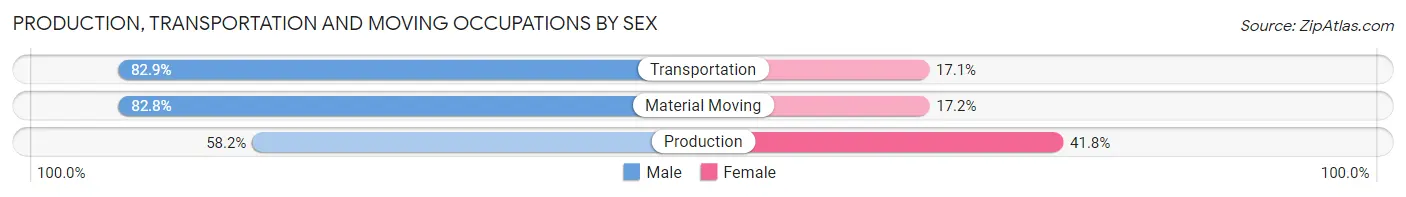
| Occupation | Male | Female |
| Production | 1,247 (58.2%) | 894 (41.8%) |
| Transportation | 3,668 (82.9%) | 759 (17.1%) |
| Material Moving | 2,282 (82.8%) | 474 (17.2%) |
| Total (Category) | 7,197 (77.2%) | 2,127 (22.8%) |
| Total (Overall) | 53,526 (56.3%) | 41,538 (43.7%) |
Employment Industries by Sex in Fort Lauderdale
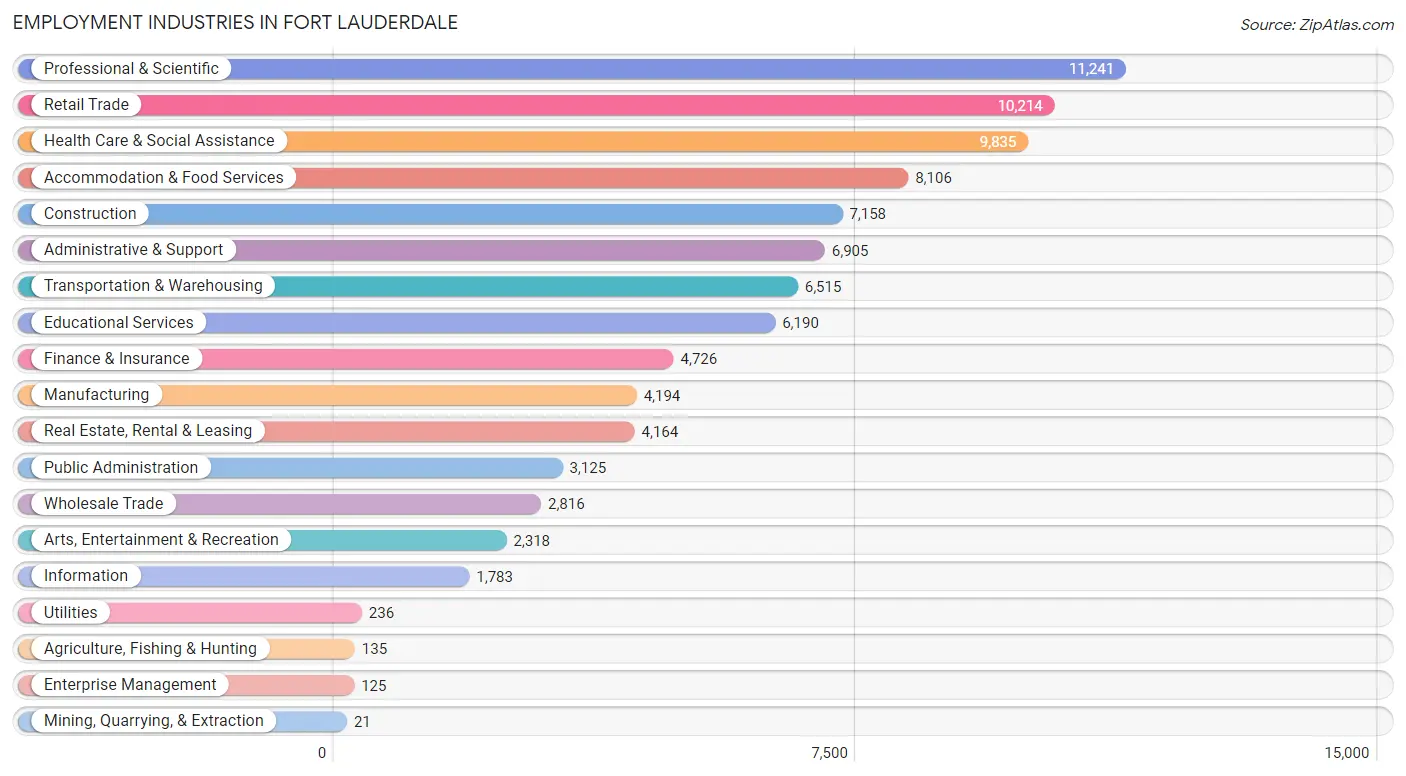
Employment Industries in Fort Lauderdale
The major employment industries in Fort Lauderdale include Professional & Scientific (11,241 | 11.8%), Retail Trade (10,214 | 10.7%), Health Care & Social Assistance (9,835 | 10.3%), Accommodation & Food Services (8,106 | 8.5%), and Construction (7,158 | 7.5%).
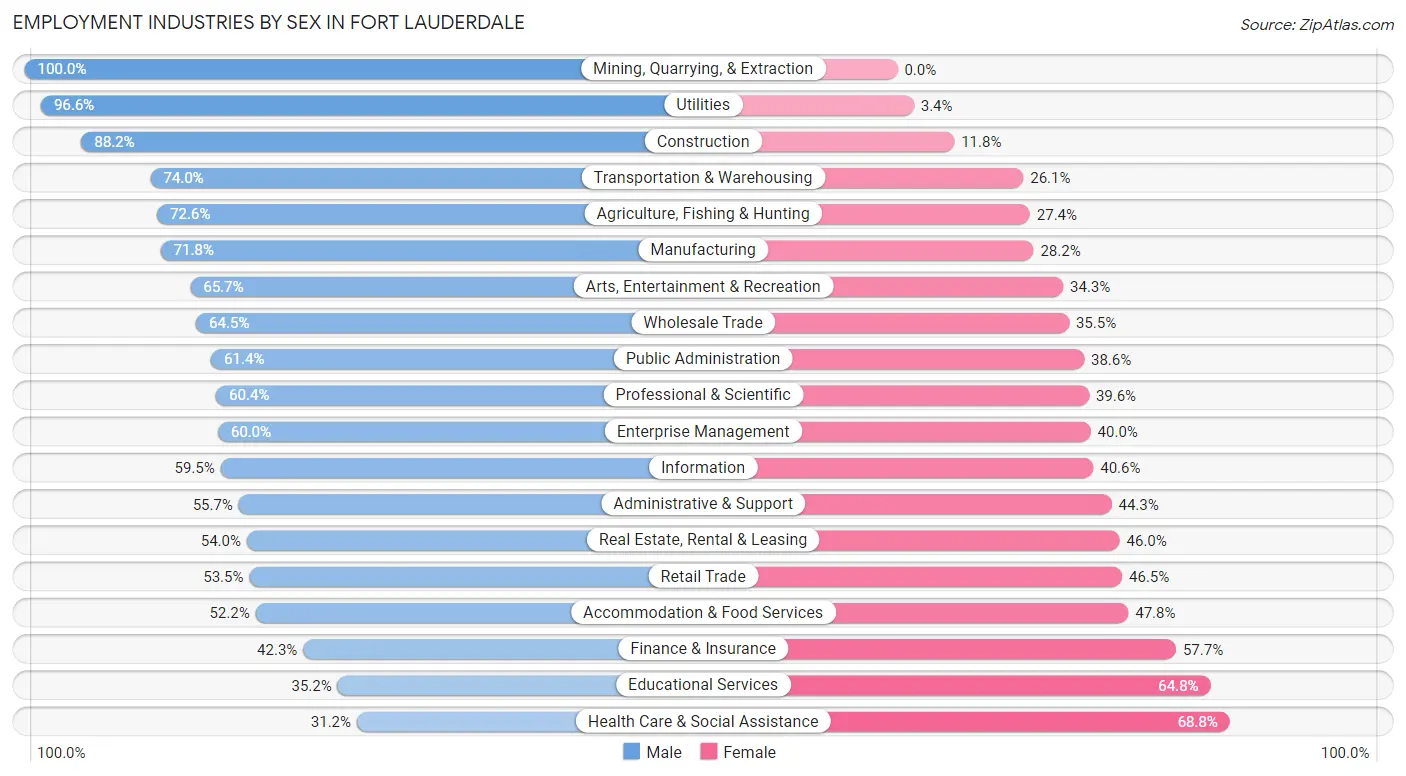
Employment Industries by Sex in Fort Lauderdale
The Fort Lauderdale industries that see more men than women are Mining, Quarrying, & Extraction (100.0%), Utilities (96.6%), and Construction (88.2%), whereas the industries that tend to have a higher number of women are Health Care & Social Assistance (68.8%), Educational Services (64.8%), and Finance & Insurance (57.7%).
| Industry | Male | Female |
| Agriculture, Fishing & Hunting | 98 (72.6%) | 37 (27.4%) |
| Mining, Quarrying, & Extraction | 21 (100.0%) | 0 (0.0%) |
| Construction | 6,316 (88.2%) | 842 (11.8%) |
| Manufacturing | 3,013 (71.8%) | 1,181 (28.2%) |
| Wholesale Trade | 1,816 (64.5%) | 1,000 (35.5%) |
| Retail Trade | 5,463 (53.5%) | 4,751 (46.5%) |
| Transportation & Warehousing | 4,818 (74.0%) | 1,697 (26.1%) |
| Utilities | 228 (96.6%) | 8 (3.4%) |
| Information | 1,060 (59.5%) | 723 (40.6%) |
| Finance & Insurance | 2,001 (42.3%) | 2,725 (57.7%) |
| Real Estate, Rental & Leasing | 2,249 (54.0%) | 1,915 (46.0%) |
| Professional & Scientific | 6,785 (60.4%) | 4,456 (39.6%) |
| Enterprise Management | 75 (60.0%) | 50 (40.0%) |
| Administrative & Support | 3,845 (55.7%) | 3,060 (44.3%) |
| Educational Services | 2,180 (35.2%) | 4,010 (64.8%) |
| Health Care & Social Assistance | 3,071 (31.2%) | 6,764 (68.8%) |
| Arts, Entertainment & Recreation | 1,523 (65.7%) | 795 (34.3%) |
| Accommodation & Food Services | 4,232 (52.2%) | 3,874 (47.8%) |
| Public Administration | 1,918 (61.4%) | 1,207 (38.6%) |
| Total | 53,526 (56.3%) | 41,538 (43.7%) |
Education in Fort Lauderdale
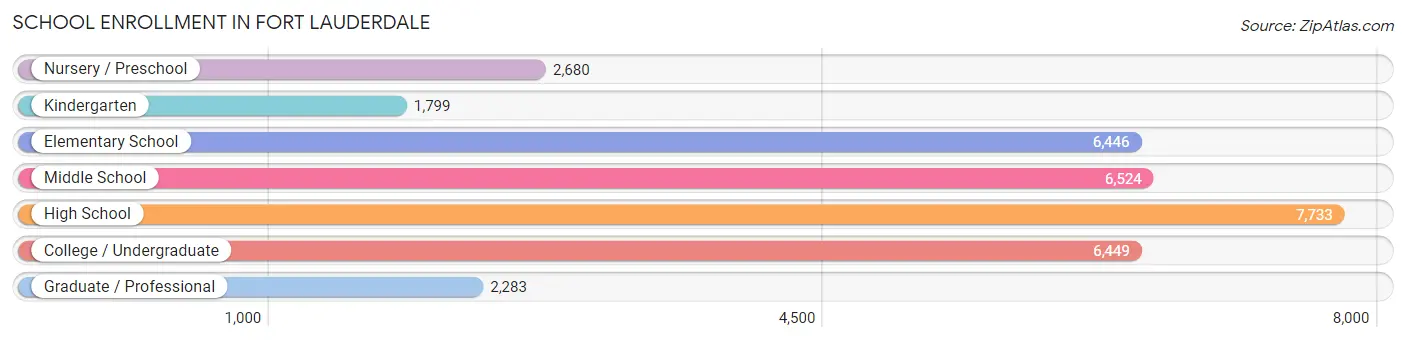
School Enrollment in Fort Lauderdale
The most common levels of schooling among the 33,914 students in Fort Lauderdale are high school (7,733 | 22.8%), middle school (6,524 | 19.2%), and college / undergraduate (6,449 | 19.0%).
| School Level | # Students | % Students |
| Nursery / Preschool | 2,680 | 7.9% |
| Kindergarten | 1,799 | 5.3% |
| Elementary School | 6,446 | 19.0% |
| Middle School | 6,524 | 19.2% |
| High School | 7,733 | 22.8% |
| College / Undergraduate | 6,449 | 19.0% |
| Graduate / Professional | 2,283 | 6.7% |
| Total | 33,914 | 100.0% |
School Enrollment by Age by Funding Source in Fort Lauderdale
Out of a total of 33,914 students who are enrolled in schools in Fort Lauderdale, 9,021 (26.6%) attend a private institution, while the remaining 24,893 (73.4%) are enrolled in public schools. The age group of 3 to 4 year olds has the highest likelihood of being enrolled in private schools, with 1,073 (45.7% in the age bracket) enrolled. Conversely, the age group of 18 to 19 year olds has the lowest likelihood of being enrolled in a private school, with 2,009 (82.9% in the age bracket) attending a public institution.
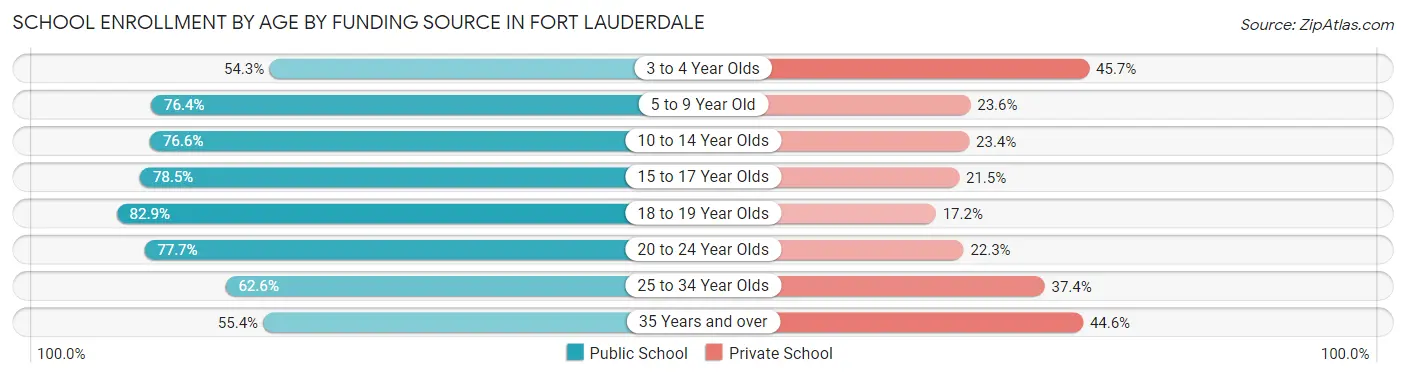
| Age Bracket | Public School | Private School |
| 3 to 4 Year Olds | 1,274 (54.3%) | 1,073 (45.7%) |
| 5 to 9 Year Old | 5,931 (76.4%) | 1,830 (23.6%) |
| 10 to 14 Year Olds | 5,883 (76.6%) | 1,793 (23.4%) |
| 15 to 17 Year Olds | 4,653 (78.5%) | 1,274 (21.5%) |
| 18 to 19 Year Olds | 2,009 (82.9%) | 416 (17.2%) |
| 20 to 24 Year Olds | 2,201 (77.7%) | 632 (22.3%) |
| 25 to 34 Year Olds | 1,619 (62.6%) | 968 (37.4%) |
| 35 Years and over | 1,307 (55.4%) | 1,051 (44.6%) |
| Total | 24,893 (73.4%) | 9,021 (26.6%) |
Educational Attainment by Field of Study in Fort Lauderdale
Business (16,325 | 27.3%), social sciences (5,168 | 8.6%), science & technology (5,137 | 8.6%), education (4,911 | 8.2%), and engineering (4,171 | 7.0%) are the most common fields of study among 59,903 individuals in Fort Lauderdale who have obtained a bachelor's degree or higher.
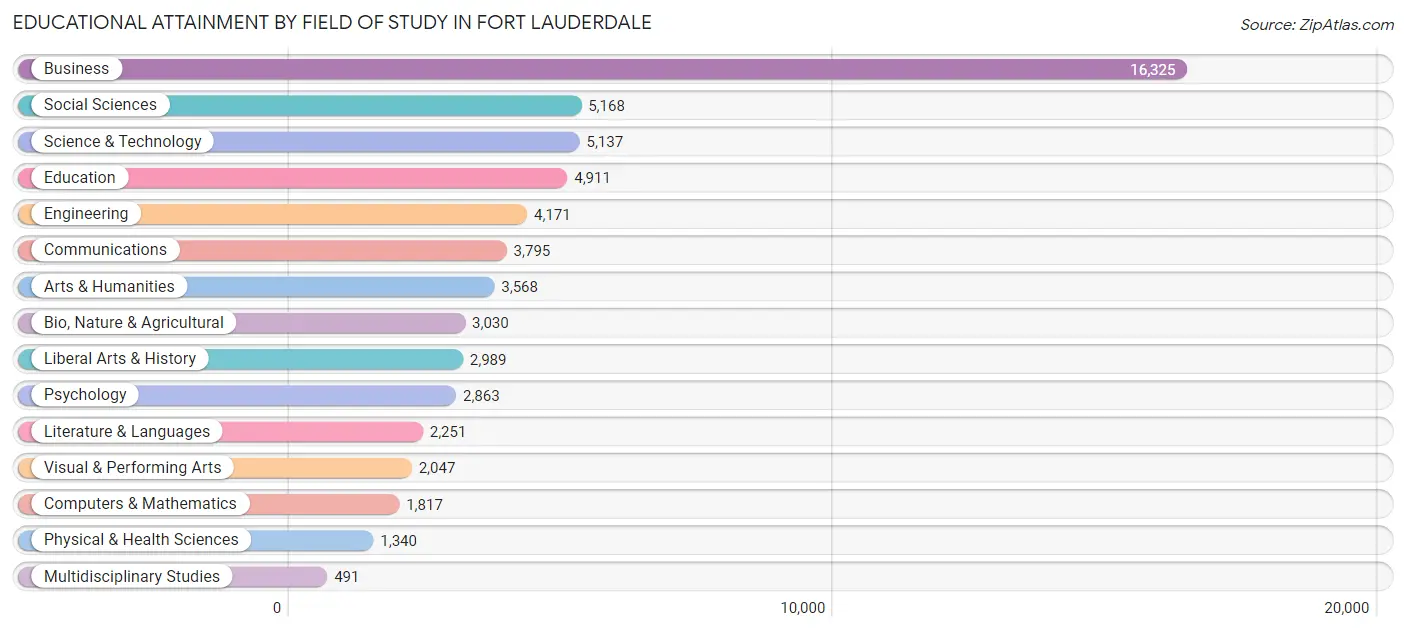
| Field of Study | # Graduates | % Graduates |
| Computers & Mathematics | 1,817 | 3.0% |
| Bio, Nature & Agricultural | 3,030 | 5.1% |
| Physical & Health Sciences | 1,340 | 2.2% |
| Psychology | 2,863 | 4.8% |
| Social Sciences | 5,168 | 8.6% |
| Engineering | 4,171 | 7.0% |
| Multidisciplinary Studies | 491 | 0.8% |
| Science & Technology | 5,137 | 8.6% |
| Business | 16,325 | 27.3% |
| Education | 4,911 | 8.2% |
| Literature & Languages | 2,251 | 3.8% |
| Liberal Arts & History | 2,989 | 5.0% |
| Visual & Performing Arts | 2,047 | 3.4% |
| Communications | 3,795 | 6.3% |
| Arts & Humanities | 3,568 | 6.0% |
| Total | 59,903 | 100.0% |
Transportation & Commute in Fort Lauderdale
Vehicle Availability by Sex in Fort Lauderdale
The most prevalent vehicle ownership categories in Fort Lauderdale are males with 2 vehicles (20,633, accounting for 39.5%) and females with 2 vehicles (16,434, making up 50.9%).
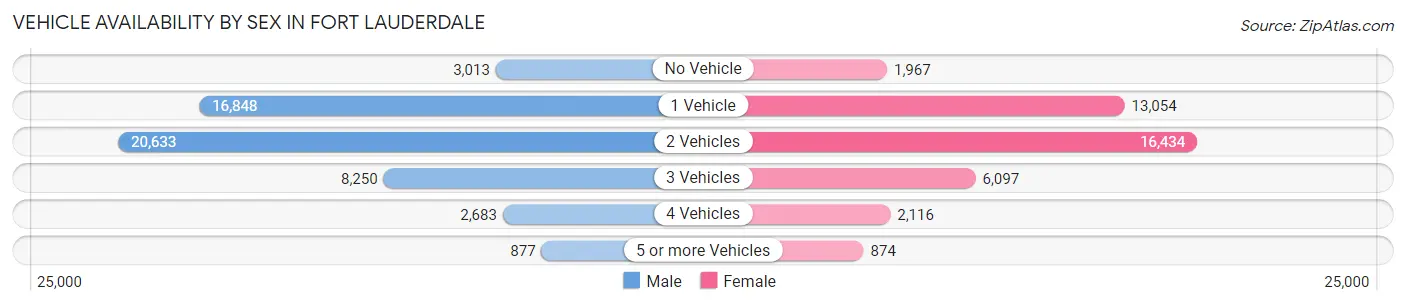
| Vehicles Available | Male | Female |
| No Vehicle | 3,013 (5.8%) | 1,967 (4.9%) |
| 1 Vehicle | 16,848 (32.2%) | 13,054 (32.2%) |
| 2 Vehicles | 20,633 (39.5%) | 16,434 (40.5%) |
| 3 Vehicles | 8,250 (15.8%) | 6,097 (15.0%) |
| 4 Vehicles | 2,683 (5.1%) | 2,116 (5.2%) |
| 5 or more Vehicles | 877 (1.7%) | 874 (2.2%) |
| Total | 52,304 (100.0%) | 40,542 (100.0%) |
Commute Time in Fort Lauderdale
The most frequently occuring commute durations in Fort Lauderdale are 15 to 19 minutes (13,703 commuters, 17.1%), 20 to 24 minutes (12,116 commuters, 15.1%), and 30 to 34 minutes (11,649 commuters, 14.5%).
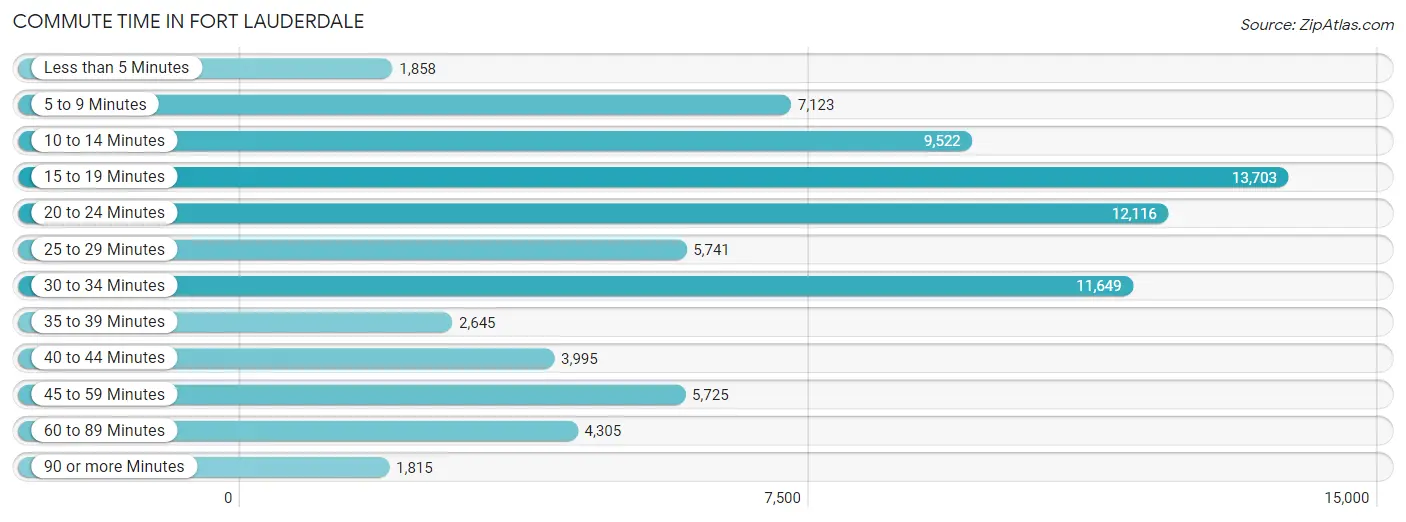
| Commute Time | # Commuters | % Commuters |
| Less than 5 Minutes | 1,858 | 2.3% |
| 5 to 9 Minutes | 7,123 | 8.9% |
| 10 to 14 Minutes | 9,522 | 11.9% |
| 15 to 19 Minutes | 13,703 | 17.1% |
| 20 to 24 Minutes | 12,116 | 15.1% |
| 25 to 29 Minutes | 5,741 | 7.2% |
| 30 to 34 Minutes | 11,649 | 14.5% |
| 35 to 39 Minutes | 2,645 | 3.3% |
| 40 to 44 Minutes | 3,995 | 5.0% |
| 45 to 59 Minutes | 5,725 | 7.1% |
| 60 to 89 Minutes | 4,305 | 5.4% |
| 90 or more Minutes | 1,815 | 2.3% |
Commute Time by Sex in Fort Lauderdale
The most common commute times in Fort Lauderdale are 15 to 19 minutes (7,675 commuters, 16.8%) for males and 15 to 19 minutes (6,028 commuters, 17.4%) for females.
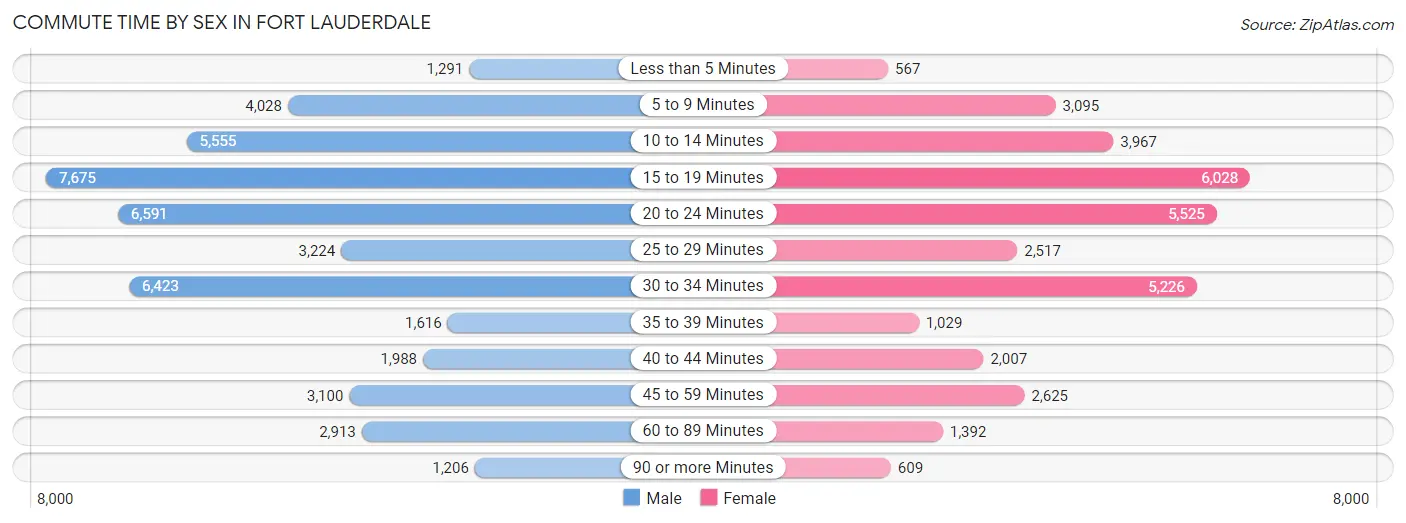
| Commute Time | Male | Female |
| Less than 5 Minutes | 1,291 (2.8%) | 567 (1.6%) |
| 5 to 9 Minutes | 4,028 (8.8%) | 3,095 (8.9%) |
| 10 to 14 Minutes | 5,555 (12.2%) | 3,967 (11.5%) |
| 15 to 19 Minutes | 7,675 (16.8%) | 6,028 (17.4%) |
| 20 to 24 Minutes | 6,591 (14.4%) | 5,525 (16.0%) |
| 25 to 29 Minutes | 3,224 (7.1%) | 2,517 (7.3%) |
| 30 to 34 Minutes | 6,423 (14.1%) | 5,226 (15.1%) |
| 35 to 39 Minutes | 1,616 (3.5%) | 1,029 (3.0%) |
| 40 to 44 Minutes | 1,988 (4.4%) | 2,007 (5.8%) |
| 45 to 59 Minutes | 3,100 (6.8%) | 2,625 (7.6%) |
| 60 to 89 Minutes | 2,913 (6.4%) | 1,392 (4.0%) |
| 90 or more Minutes | 1,206 (2.6%) | 609 (1.8%) |
Time of Departure to Work by Sex in Fort Lauderdale
The most frequent times of departure to work in Fort Lauderdale are 8:00 AM to 8:29 AM (7,189, 15.8%) for males and 8:00 AM to 8:29 AM (6,402, 18.5%) for females.
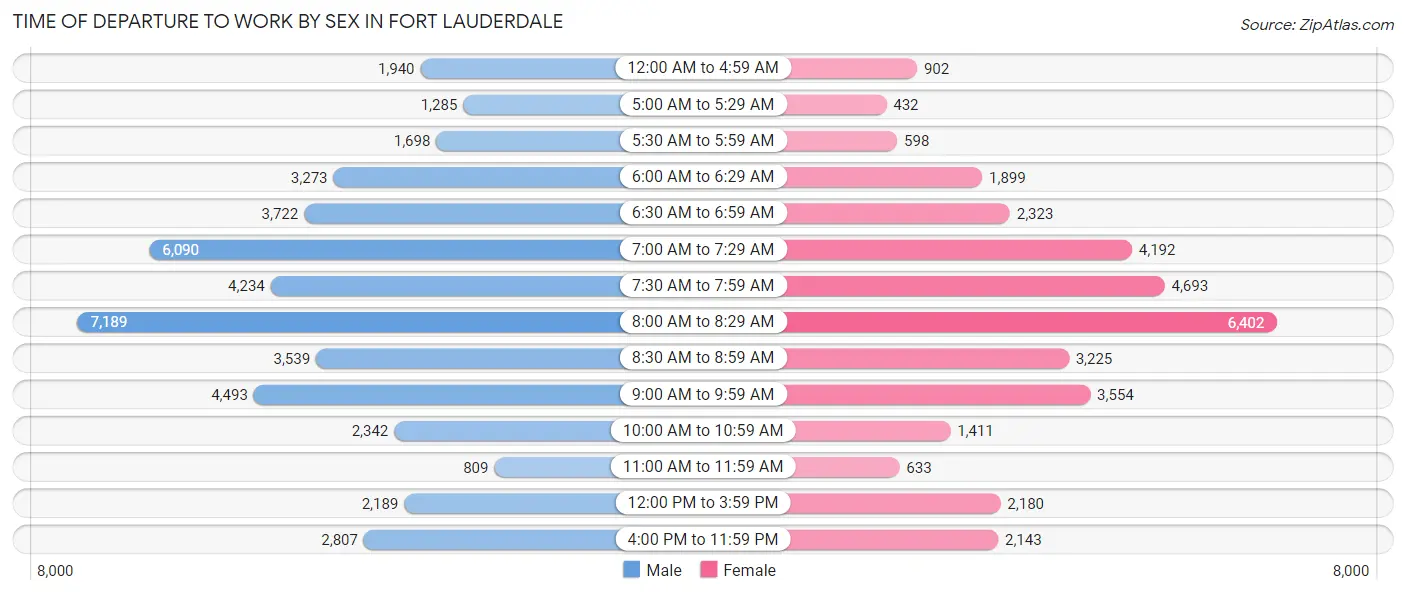
| Time of Departure | Male | Female |
| 12:00 AM to 4:59 AM | 1,940 (4.3%) | 902 (2.6%) |
| 5:00 AM to 5:29 AM | 1,285 (2.8%) | 432 (1.3%) |
| 5:30 AM to 5:59 AM | 1,698 (3.7%) | 598 (1.7%) |
| 6:00 AM to 6:29 AM | 3,273 (7.2%) | 1,899 (5.5%) |
| 6:30 AM to 6:59 AM | 3,722 (8.2%) | 2,323 (6.7%) |
| 7:00 AM to 7:29 AM | 6,090 (13.4%) | 4,192 (12.1%) |
| 7:30 AM to 7:59 AM | 4,234 (9.3%) | 4,693 (13.6%) |
| 8:00 AM to 8:29 AM | 7,189 (15.8%) | 6,402 (18.5%) |
| 8:30 AM to 8:59 AM | 3,539 (7.8%) | 3,225 (9.3%) |
| 9:00 AM to 9:59 AM | 4,493 (9.9%) | 3,554 (10.3%) |
| 10:00 AM to 10:59 AM | 2,342 (5.1%) | 1,411 (4.1%) |
| 11:00 AM to 11:59 AM | 809 (1.8%) | 633 (1.8%) |
| 12:00 PM to 3:59 PM | 2,189 (4.8%) | 2,180 (6.3%) |
| 4:00 PM to 11:59 PM | 2,807 (6.1%) | 2,143 (6.2%) |
| Total | 45,610 (100.0%) | 34,587 (100.0%) |
Housing Occupancy in Fort Lauderdale
Occupancy by Ownership in Fort Lauderdale
Of the total 80,031 dwellings in Fort Lauderdale, owner-occupied units account for 43,363 (54.2%), while renter-occupied units make up 36,668 (45.8%).
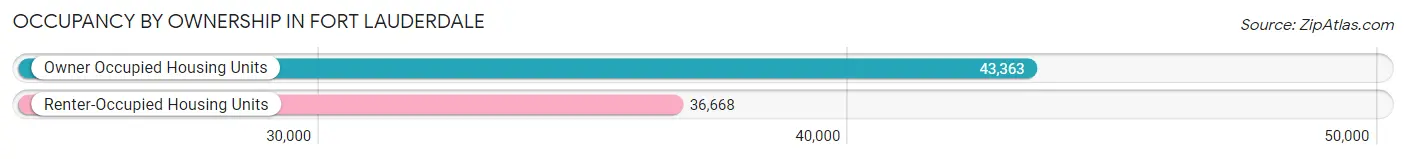
| Occupancy | # Housing Units | % Housing Units |
| Owner Occupied Housing Units | 43,363 | 54.2% |
| Renter-Occupied Housing Units | 36,668 | 45.8% |
| Total Occupied Housing Units | 80,031 | 100.0% |
Occupancy by Household Size in Fort Lauderdale
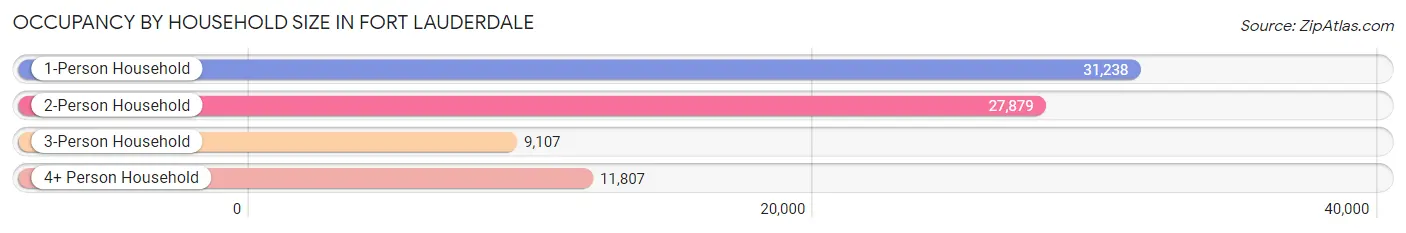
| Household Size | # Housing Units | % Housing Units |
| 1-Person Household | 31,238 | 39.0% |
| 2-Person Household | 27,879 | 34.8% |
| 3-Person Household | 9,107 | 11.4% |
| 4+ Person Household | 11,807 | 14.7% |
| Total Housing Units | 80,031 | 100.0% |
Occupancy by Ownership by Household Size in Fort Lauderdale
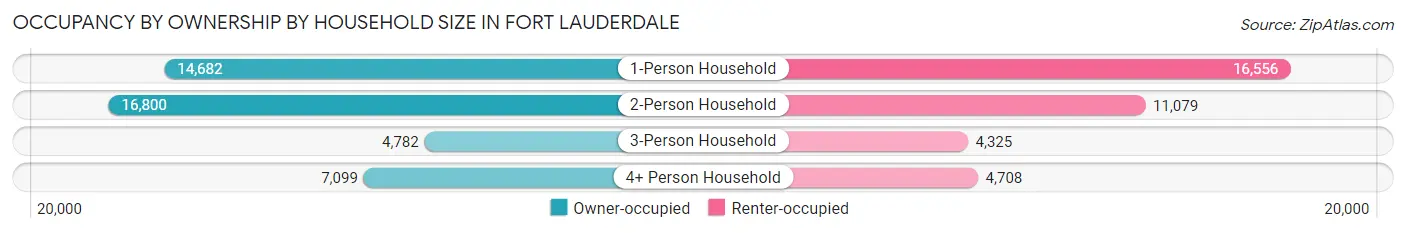
| Household Size | Owner-occupied | Renter-occupied |
| 1-Person Household | 14,682 (47.0%) | 16,556 (53.0%) |
| 2-Person Household | 16,800 (60.3%) | 11,079 (39.7%) |
| 3-Person Household | 4,782 (52.5%) | 4,325 (47.5%) |
| 4+ Person Household | 7,099 (60.1%) | 4,708 (39.9%) |
| Total Housing Units | 43,363 (54.2%) | 36,668 (45.8%) |
Occupancy by Educational Attainment in Fort Lauderdale
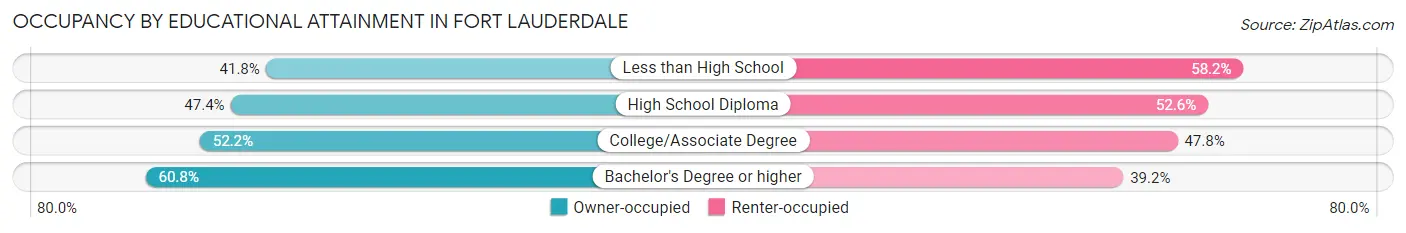
| Household Size | Owner-occupied | Renter-occupied |
| Less than High School | 2,708 (41.8%) | 3,775 (58.2%) |
| High School Diploma | 7,860 (47.4%) | 8,737 (52.6%) |
| College/Associate Degree | 11,154 (52.2%) | 10,208 (47.8%) |
| Bachelor's Degree or higher | 21,641 (60.8%) | 13,948 (39.2%) |
Occupancy by Age of Householder in Fort Lauderdale
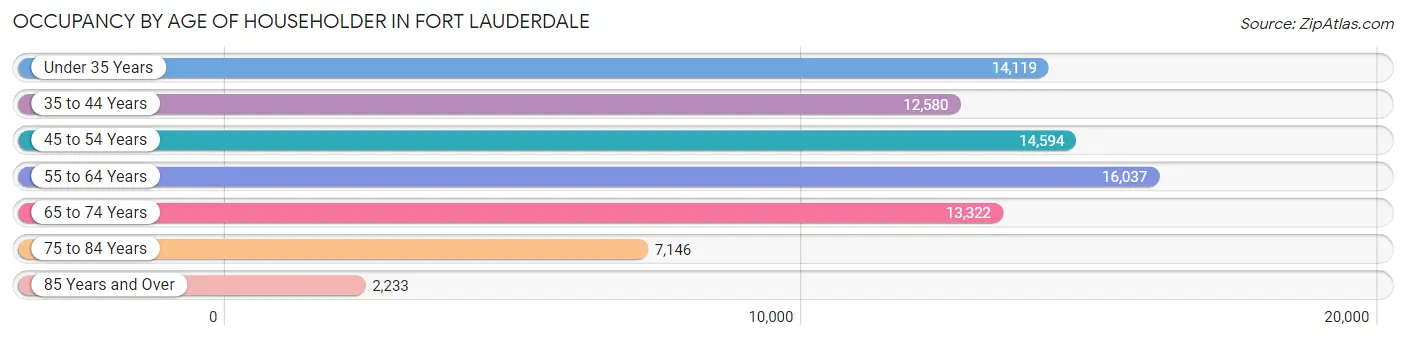
| Age Bracket | # Households | % Households |
| Under 35 Years | 14,119 | 17.6% |
| 35 to 44 Years | 12,580 | 15.7% |
| 45 to 54 Years | 14,594 | 18.2% |
| 55 to 64 Years | 16,037 | 20.0% |
| 65 to 74 Years | 13,322 | 16.7% |
| 75 to 84 Years | 7,146 | 8.9% |
| 85 Years and Over | 2,233 | 2.8% |
| Total | 80,031 | 100.0% |
Housing Finances in Fort Lauderdale
Median Income by Occupancy in Fort Lauderdale
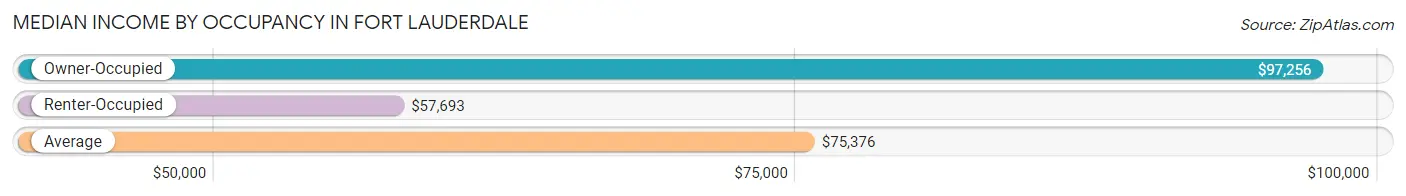
| Occupancy Type | # Households | Median Income |
| Owner-Occupied | 43,363 (54.2%) | $97,256 |
| Renter-Occupied | 36,668 (45.8%) | $57,693 |
| Average | 80,031 (100.0%) | $75,376 |
Occupancy by Householder Income Bracket in Fort Lauderdale
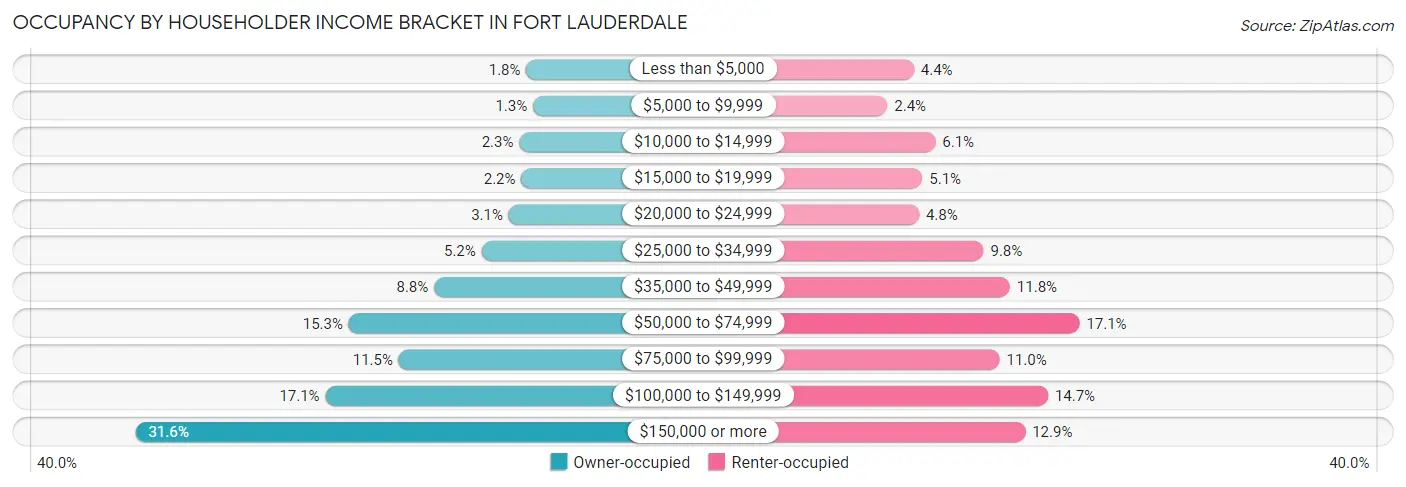
| Income Bracket | Owner-occupied | Renter-occupied |
| Less than $5,000 | 767 (1.8%) | 1,627 (4.4%) |
| $5,000 to $9,999 | 547 (1.3%) | 889 (2.4%) |
| $10,000 to $14,999 | 1,000 (2.3%) | 2,231 (6.1%) |
| $15,000 to $19,999 | 933 (2.1%) | 1,867 (5.1%) |
| $20,000 to $24,999 | 1,347 (3.1%) | 1,771 (4.8%) |
| $25,000 to $34,999 | 2,248 (5.2%) | 3,575 (9.8%) |
| $35,000 to $49,999 | 3,817 (8.8%) | 4,313 (11.8%) |
| $50,000 to $74,999 | 6,636 (15.3%) | 6,256 (17.1%) |
| $75,000 to $99,999 | 4,981 (11.5%) | 4,022 (11.0%) |
| $100,000 to $149,999 | 7,407 (17.1%) | 5,374 (14.7%) |
| $150,000 or more | 13,680 (31.6%) | 4,743 (12.9%) |
| Total | 43,363 (100.0%) | 36,668 (100.0%) |
Monthly Housing Cost Tiers in Fort Lauderdale
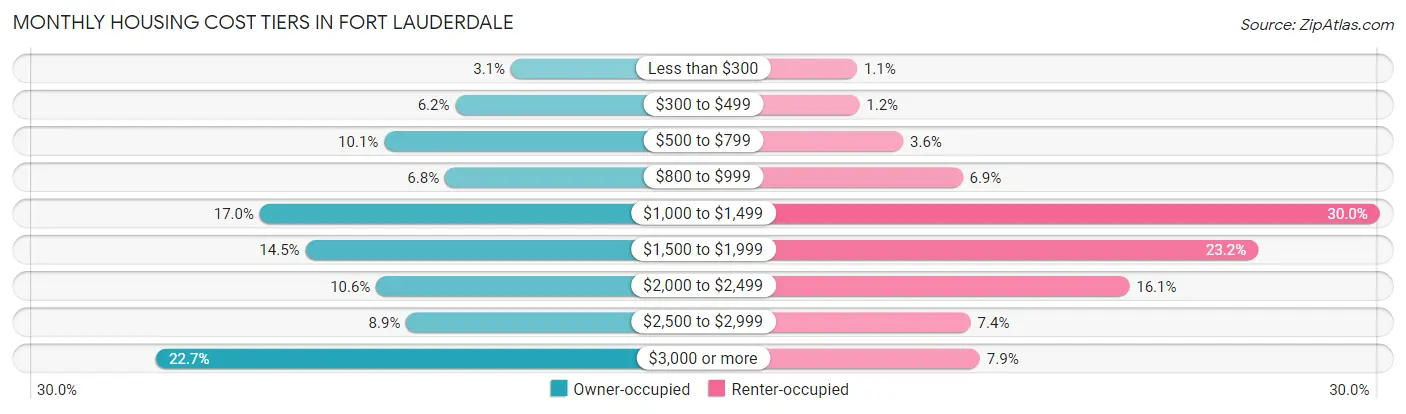
| Monthly Cost | Owner-occupied | Renter-occupied |
| Less than $300 | 1,360 (3.1%) | 397 (1.1%) |
| $300 to $499 | 2,693 (6.2%) | 445 (1.2%) |
| $500 to $799 | 4,395 (10.1%) | 1,330 (3.6%) |
| $800 to $999 | 2,941 (6.8%) | 2,534 (6.9%) |
| $1,000 to $1,499 | 7,375 (17.0%) | 10,983 (29.9%) |
| $1,500 to $1,999 | 6,285 (14.5%) | 8,519 (23.2%) |
| $2,000 to $2,499 | 4,586 (10.6%) | 5,910 (16.1%) |
| $2,500 to $2,999 | 3,866 (8.9%) | 2,697 (7.4%) |
| $3,000 or more | 9,862 (22.7%) | 2,887 (7.9%) |
| Total | 43,363 (100.0%) | 36,668 (100.0%) |
Physical Housing Characteristics in Fort Lauderdale
Housing Structures in Fort Lauderdale
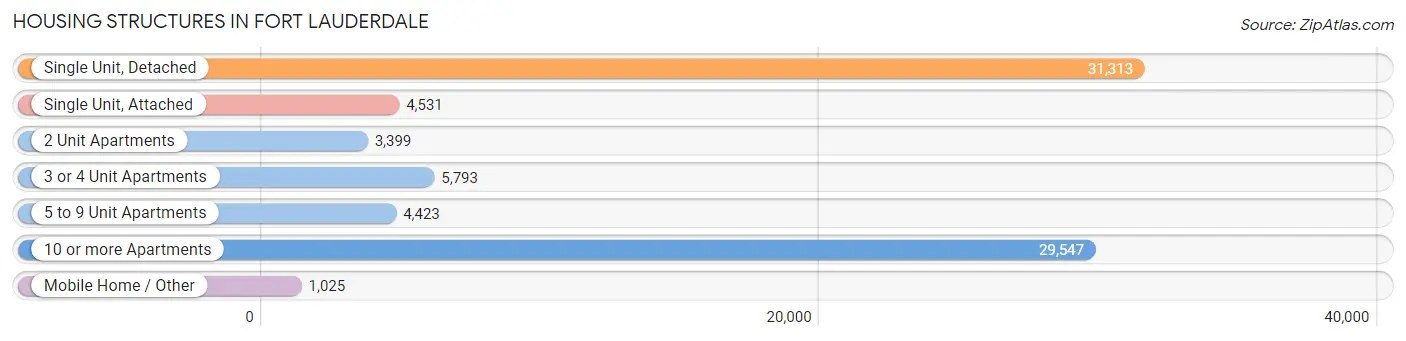
| Structure Type | # Housing Units | % Housing Units |
| Single Unit, Detached | 31,313 | 39.1% |
| Single Unit, Attached | 4,531 | 5.7% |
| 2 Unit Apartments | 3,399 | 4.3% |
| 3 or 4 Unit Apartments | 5,793 | 7.2% |
| 5 to 9 Unit Apartments | 4,423 | 5.5% |
| 10 or more Apartments | 29,547 | 36.9% |
| Mobile Home / Other | 1,025 | 1.3% |
| Total | 80,031 | 100.0% |
Housing Structures by Occupancy in Fort Lauderdale
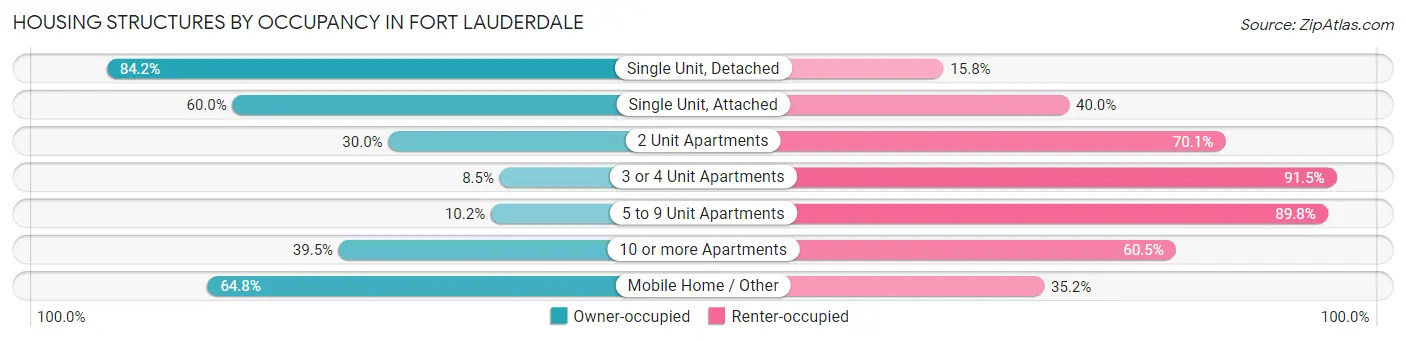
| Structure Type | Owner-occupied | Renter-occupied |
| Single Unit, Detached | 26,356 (84.2%) | 4,957 (15.8%) |
| Single Unit, Attached | 2,717 (60.0%) | 1,814 (40.0%) |
| 2 Unit Apartments | 1,018 (29.9%) | 2,381 (70.1%) |
| 3 or 4 Unit Apartments | 493 (8.5%) | 5,300 (91.5%) |
| 5 to 9 Unit Apartments | 451 (10.2%) | 3,972 (89.8%) |
| 10 or more Apartments | 11,664 (39.5%) | 17,883 (60.5%) |
| Mobile Home / Other | 664 (64.8%) | 361 (35.2%) |
| Total | 43,363 (54.2%) | 36,668 (45.8%) |
Housing Structures by Number of Rooms in Fort Lauderdale
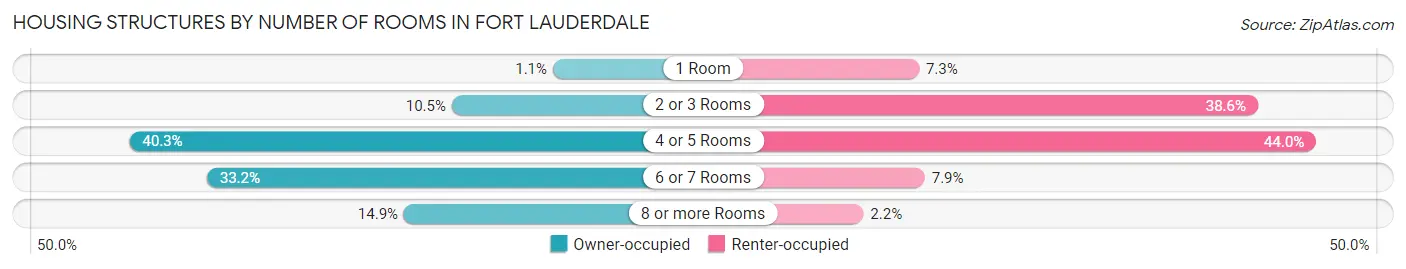
| Number of Rooms | Owner-occupied | Renter-occupied |
| 1 Room | 495 (1.1%) | 2,680 (7.3%) |
| 2 or 3 Rooms | 4,547 (10.5%) | 14,167 (38.6%) |
| 4 or 5 Rooms | 17,478 (40.3%) | 16,149 (44.0%) |
| 6 or 7 Rooms | 14,375 (33.2%) | 2,877 (7.9%) |
| 8 or more Rooms | 6,468 (14.9%) | 795 (2.2%) |
| Total | 43,363 (100.0%) | 36,668 (100.0%) |
Housing Structure by Heating Type in Fort Lauderdale
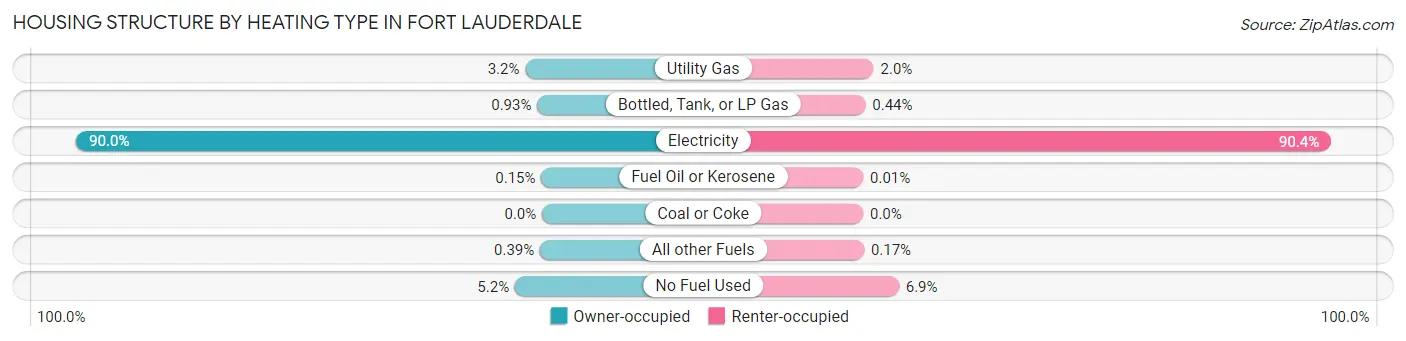
| Heating Type | Owner-occupied | Renter-occupied |
| Utility Gas | 1,407 (3.2%) | 747 (2.0%) |
| Bottled, Tank, or LP Gas | 404 (0.9%) | 163 (0.4%) |
| Electricity | 39,042 (90.0%) | 33,160 (90.4%) |
| Fuel Oil or Kerosene | 66 (0.2%) | 4 (0.0%) |
| Coal or Coke | 0 (0.0%) | 0 (0.0%) |
| All other Fuels | 170 (0.4%) | 62 (0.2%) |
| No Fuel Used | 2,274 (5.2%) | 2,532 (6.9%) |
| Total | 43,363 (100.0%) | 36,668 (100.0%) |
Household Vehicle Usage in Fort Lauderdale
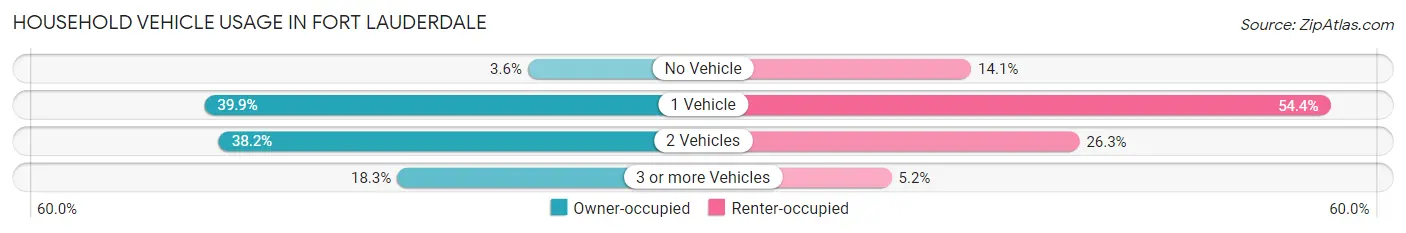
| Vehicles per Household | Owner-occupied | Renter-occupied |
| No Vehicle | 1,578 (3.6%) | 5,184 (14.1%) |
| 1 Vehicle | 17,283 (39.9%) | 19,934 (54.4%) |
| 2 Vehicles | 16,576 (38.2%) | 9,633 (26.3%) |
| 3 or more Vehicles | 7,926 (18.3%) | 1,917 (5.2%) |
| Total | 43,363 (100.0%) | 36,668 (100.0%) |
Real Estate & Mortgages in Fort Lauderdale
Real Estate and Mortgage Overview in Fort Lauderdale
| Characteristic | Without Mortgage | With Mortgage |
| Housing Units | 19,190 | 24,173 |
| Median Property Value | $386,000 | $439,000 |
| Median Household Income | $75,319 | $9,383 |
| Monthly Housing Costs | $923 | $8,511 |
| Real Estate Taxes | $3,557 | $335 |
Property Value by Mortgage Status in Fort Lauderdale
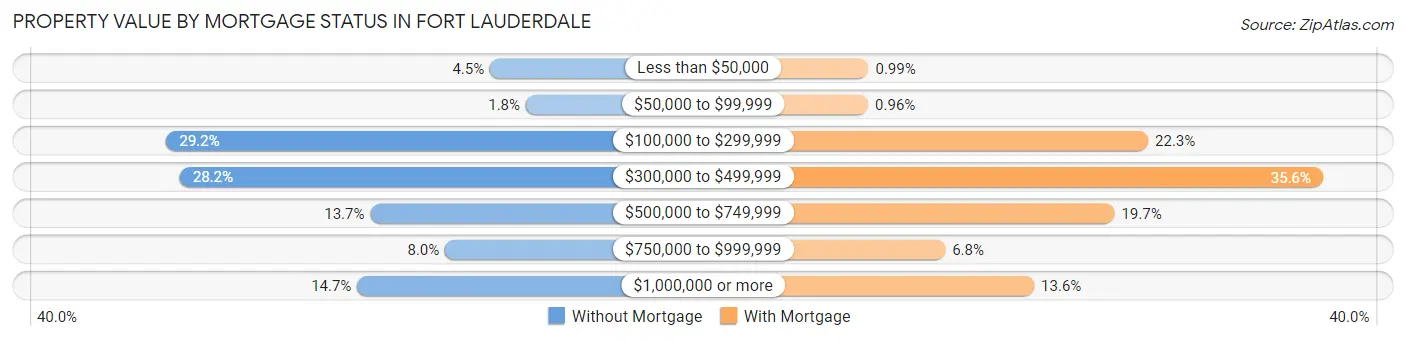
| Property Value | Without Mortgage | With Mortgage |
| Less than $50,000 | 871 (4.5%) | 239 (1.0%) |
| $50,000 to $99,999 | 347 (1.8%) | 232 (1.0%) |
| $100,000 to $299,999 | 5,603 (29.2%) | 5,387 (22.3%) |
| $300,000 to $499,999 | 5,406 (28.2%) | 8,606 (35.6%) |
| $500,000 to $749,999 | 2,622 (13.7%) | 4,769 (19.7%) |
| $750,000 to $999,999 | 1,528 (8.0%) | 1,651 (6.8%) |
| $1,000,000 or more | 2,813 (14.7%) | 3,289 (13.6%) |
| Total | 19,190 (100.0%) | 24,173 (100.0%) |
Household Income by Mortgage Status in Fort Lauderdale
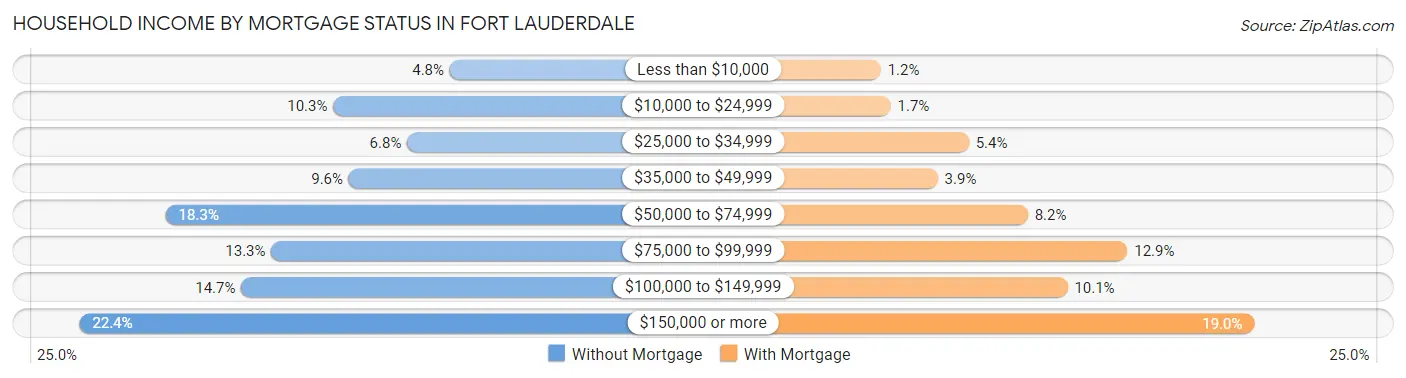
| Household Income | Without Mortgage | With Mortgage |
| Less than $10,000 | 911 (4.8%) | 291 (1.2%) |
| $10,000 to $24,999 | 1,977 (10.3%) | 403 (1.7%) |
| $25,000 to $34,999 | 1,302 (6.8%) | 1,303 (5.4%) |
| $35,000 to $49,999 | 1,834 (9.6%) | 946 (3.9%) |
| $50,000 to $74,999 | 3,509 (18.3%) | 1,983 (8.2%) |
| $75,000 to $99,999 | 2,543 (13.3%) | 3,127 (12.9%) |
| $100,000 to $149,999 | 2,817 (14.7%) | 2,438 (10.1%) |
| $150,000 or more | 4,297 (22.4%) | 4,590 (19.0%) |
| Total | 19,190 (100.0%) | 24,173 (100.0%) |
Property Value to Household Income Ratio in Fort Lauderdale
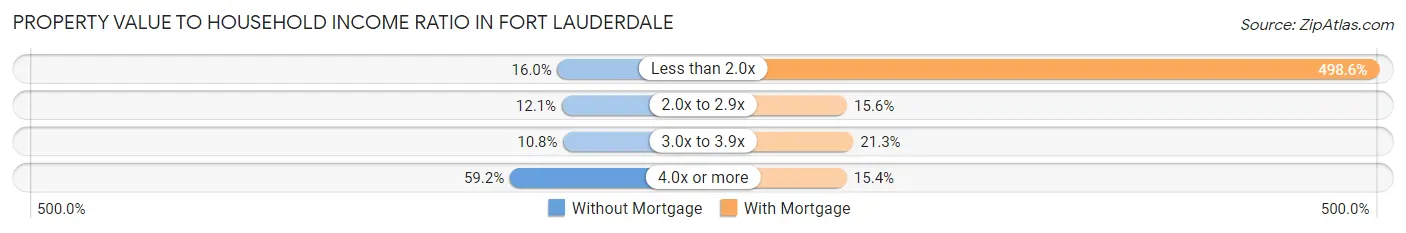
| Value-to-Income Ratio | Without Mortgage | With Mortgage |
| Less than 2.0x | 3,070 (16.0%) | 120,529 (498.6%) |
| 2.0x to 2.9x | 2,320 (12.1%) | 3,769 (15.6%) |
| 3.0x to 3.9x | 2,068 (10.8%) | 5,152 (21.3%) |
| 4.0x or more | 11,367 (59.2%) | 3,733 (15.4%) |
| Total | 19,190 (100.0%) | 24,173 (100.0%) |
Real Estate Taxes by Mortgage Status in Fort Lauderdale
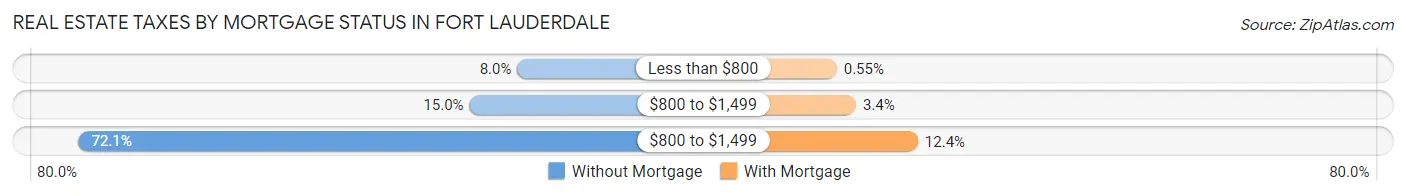
| Property Taxes | Without Mortgage | With Mortgage |
| Less than $800 | 1,538 (8.0%) | 132 (0.5%) |
| $800 to $1,499 | 2,878 (15.0%) | 813 (3.4%) |
| $800 to $1,499 | 13,840 (72.1%) | 2,998 (12.4%) |
| Total | 19,190 (100.0%) | 24,173 (100.0%) |
Health & Disability in Fort Lauderdale
Health Insurance Coverage by Age in Fort Lauderdale
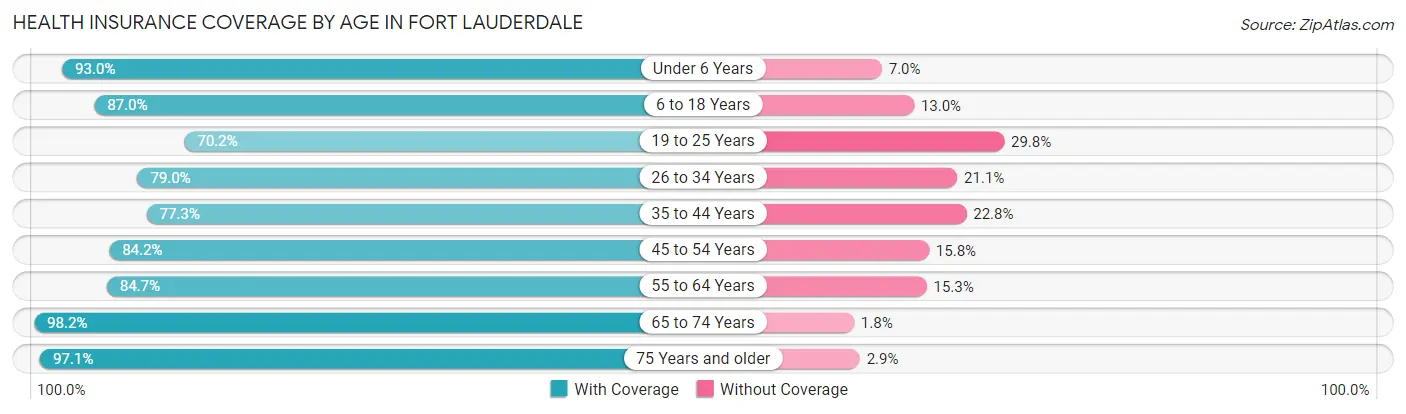
| Age Bracket | With Coverage | Without Coverage |
| Under 6 Years | 9,935 (93.0%) | 747 (7.0%) |
| 6 to 18 Years | 19,111 (87.0%) | 2,852 (13.0%) |
| 19 to 25 Years | 9,562 (70.2%) | 4,058 (29.8%) |
| 26 to 34 Years | 18,974 (78.9%) | 5,058 (21.0%) |
| 35 to 44 Years | 18,270 (77.2%) | 5,381 (22.8%) |
| 45 to 54 Years | 21,380 (84.2%) | 4,006 (15.8%) |
| 55 to 64 Years | 22,631 (84.7%) | 4,102 (15.3%) |
| 65 to 74 Years | 19,991 (98.2%) | 365 (1.8%) |
| 75 Years and older | 14,016 (97.1%) | 415 (2.9%) |
| Total | 153,870 (85.1%) | 26,984 (14.9%) |
Health Insurance Coverage by Citizenship Status in Fort Lauderdale
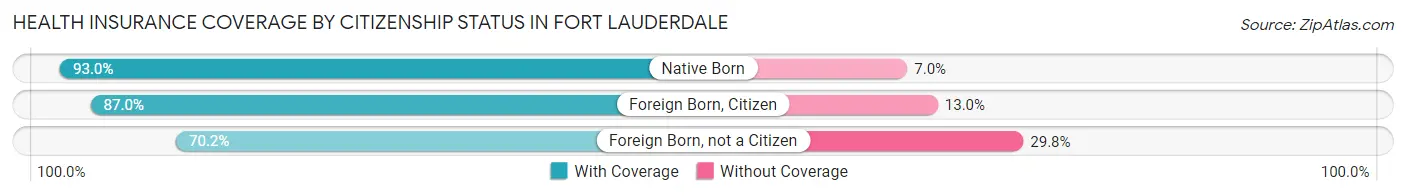
| Citizenship Status | With Coverage | Without Coverage |
| Native Born | 9,935 (93.0%) | 747 (7.0%) |
| Foreign Born, Citizen | 19,111 (87.0%) | 2,852 (13.0%) |
| Foreign Born, not a Citizen | 9,562 (70.2%) | 4,058 (29.8%) |
Health Insurance Coverage by Household Income in Fort Lauderdale
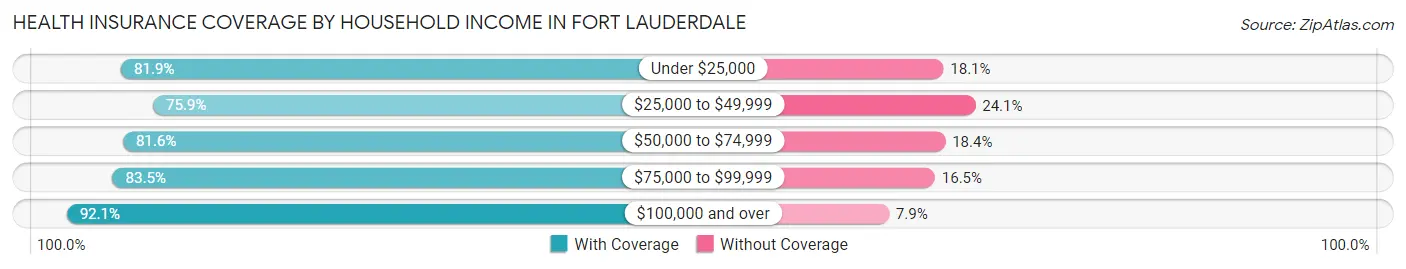
| Household Income | With Coverage | Without Coverage |
| Under $25,000 | 17,864 (81.9%) | 3,946 (18.1%) |
| $25,000 to $49,999 | 22,993 (75.9%) | 7,293 (24.1%) |
| $50,000 to $74,999 | 23,844 (81.6%) | 5,391 (18.4%) |
| $75,000 to $99,999 | 17,360 (83.5%) | 3,431 (16.5%) |
| $100,000 and over | 71,154 (92.1%) | 6,098 (7.9%) |
Public vs Private Health Insurance Coverage by Age in Fort Lauderdale
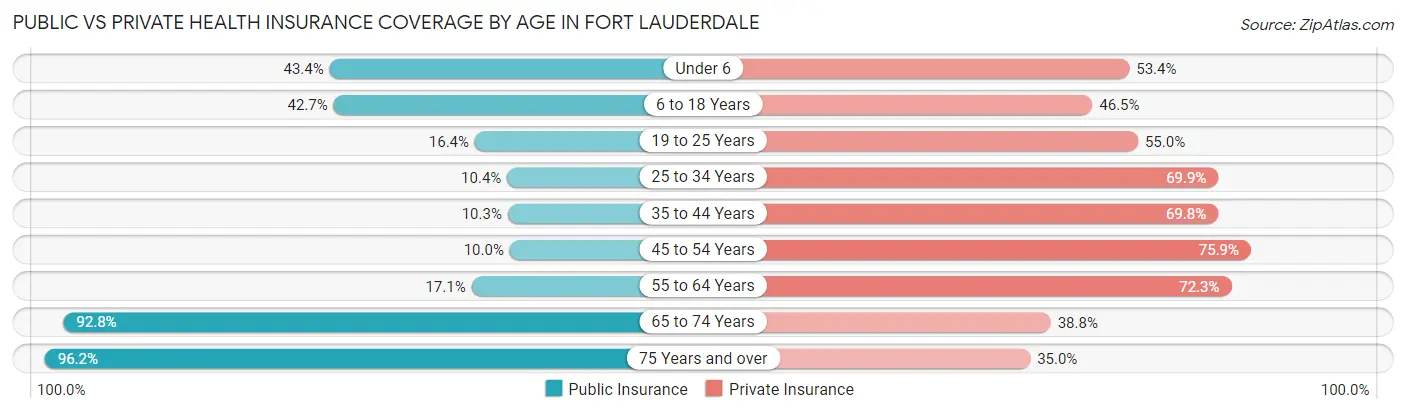
| Age Bracket | Public Insurance | Private Insurance |
| Under 6 | 4,636 (43.4%) | 5,700 (53.4%) |
| 6 to 18 Years | 9,368 (42.6%) | 10,216 (46.5%) |
| 19 to 25 Years | 2,236 (16.4%) | 7,488 (55.0%) |
| 25 to 34 Years | 2,507 (10.4%) | 16,789 (69.9%) |
| 35 to 44 Years | 2,441 (10.3%) | 16,514 (69.8%) |
| 45 to 54 Years | 2,527 (10.0%) | 19,274 (75.9%) |
| 55 to 64 Years | 4,557 (17.1%) | 19,329 (72.3%) |
| 65 to 74 Years | 18,888 (92.8%) | 7,894 (38.8%) |
| 75 Years and over | 13,889 (96.2%) | 5,047 (35.0%) |
| Total | 61,049 (33.8%) | 108,251 (59.9%) |
Disability Status by Sex by Age in Fort Lauderdale
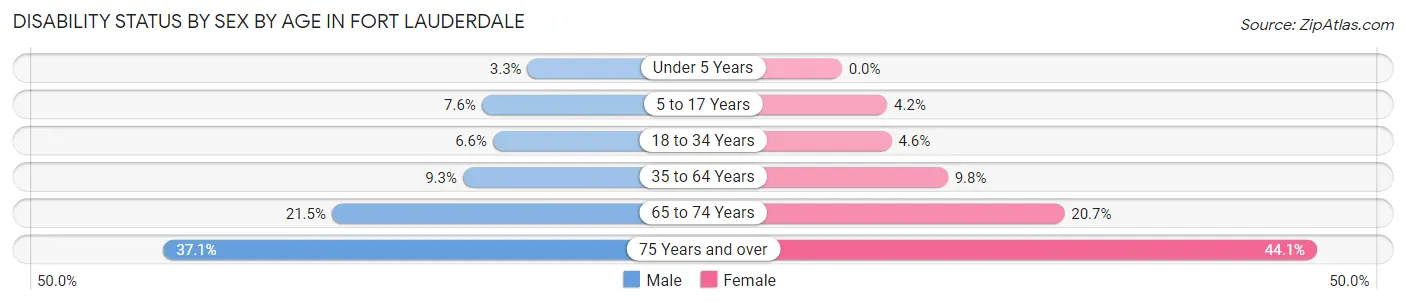
| Age Bracket | Male | Female |
| Under 5 Years | 158 (3.3%) | 0 (0.0%) |
| 5 to 17 Years | 783 (7.6%) | 492 (4.2%) |
| 18 to 34 Years | 1,353 (6.6%) | 867 (4.6%) |
| 35 to 64 Years | 3,747 (9.3%) | 3,500 (9.8%) |
| 65 to 74 Years | 2,461 (21.5%) | 1,839 (20.6%) |
| 75 Years and over | 2,450 (37.1%) | 3,452 (44.1%) |
Disability Class by Sex by Age in Fort Lauderdale
Disability Class: Hearing Difficulty
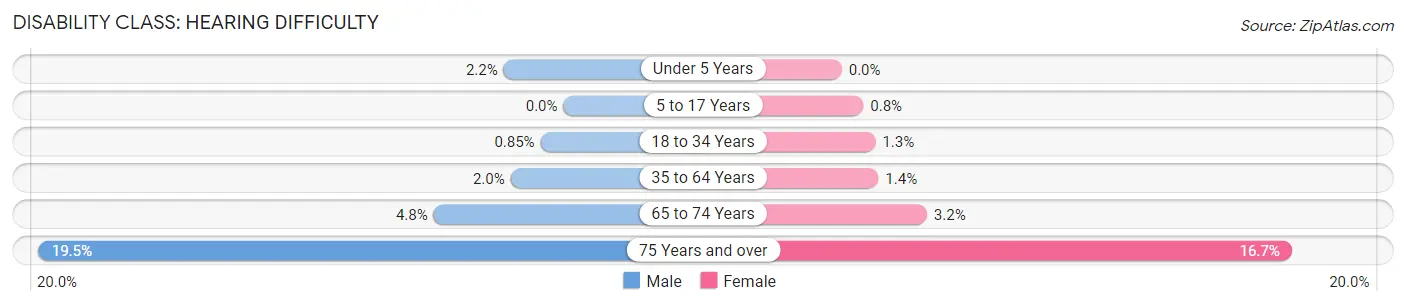
| Age Bracket | Male | Female |
| Under 5 Years | 105 (2.2%) | 0 (0.0%) |
| 5 to 17 Years | 0 (0.0%) | 93 (0.8%) |
| 18 to 34 Years | 176 (0.9%) | 235 (1.3%) |
| 35 to 64 Years | 787 (2.0%) | 485 (1.4%) |
| 65 to 74 Years | 552 (4.8%) | 281 (3.2%) |
| 75 Years and over | 1,285 (19.5%) | 1,308 (16.7%) |
Disability Class: Vision Difficulty
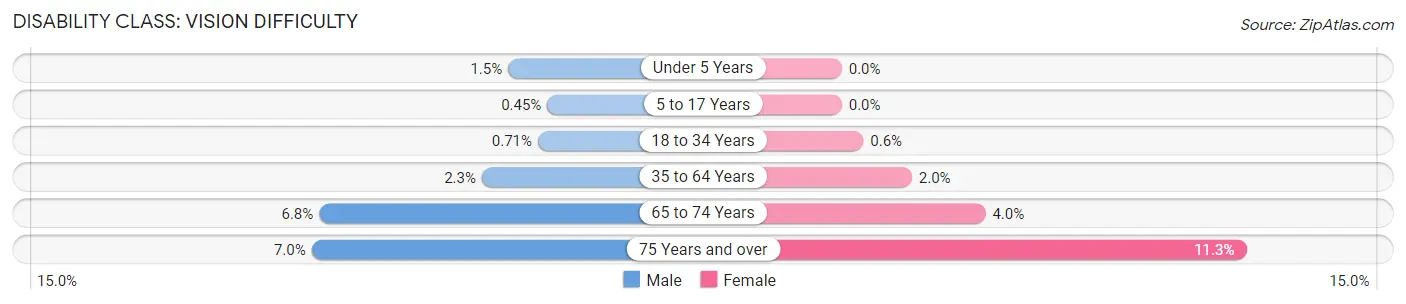
| Age Bracket | Male | Female |
| Under 5 Years | 73 (1.5%) | 0 (0.0%) |
| 5 to 17 Years | 46 (0.4%) | 0 (0.0%) |
| 18 to 34 Years | 146 (0.7%) | 113 (0.6%) |
| 35 to 64 Years | 912 (2.3%) | 693 (1.9%) |
| 65 to 74 Years | 779 (6.8%) | 356 (4.0%) |
| 75 Years and over | 463 (7.0%) | 882 (11.3%) |
Disability Class: Cognitive Difficulty
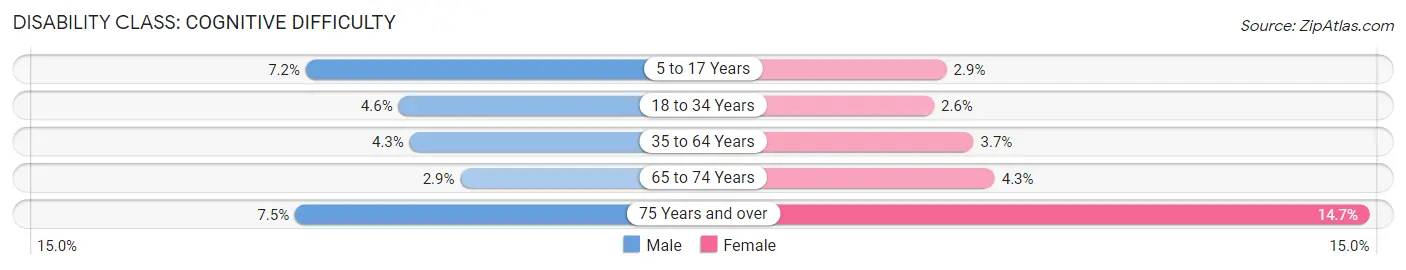
| Age Bracket | Male | Female |
| 5 to 17 Years | 741 (7.2%) | 341 (2.9%) |
| 18 to 34 Years | 947 (4.6%) | 483 (2.6%) |
| 35 to 64 Years | 1,720 (4.3%) | 1,305 (3.7%) |
| 65 to 74 Years | 329 (2.9%) | 379 (4.3%) |
| 75 Years and over | 493 (7.5%) | 1,151 (14.7%) |
Disability Class: Ambulatory Difficulty
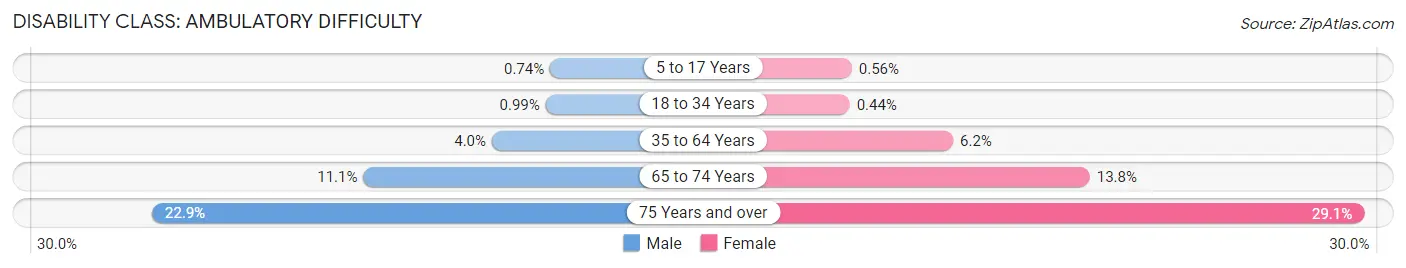
| Age Bracket | Male | Female |
| 5 to 17 Years | 76 (0.7%) | 65 (0.6%) |
| 18 to 34 Years | 204 (1.0%) | 82 (0.4%) |
| 35 to 64 Years | 1,597 (4.0%) | 2,207 (6.2%) |
| 65 to 74 Years | 1,275 (11.1%) | 1,230 (13.8%) |
| 75 Years and over | 1,512 (22.9%) | 2,277 (29.1%) |
Disability Class: Self-Care Difficulty
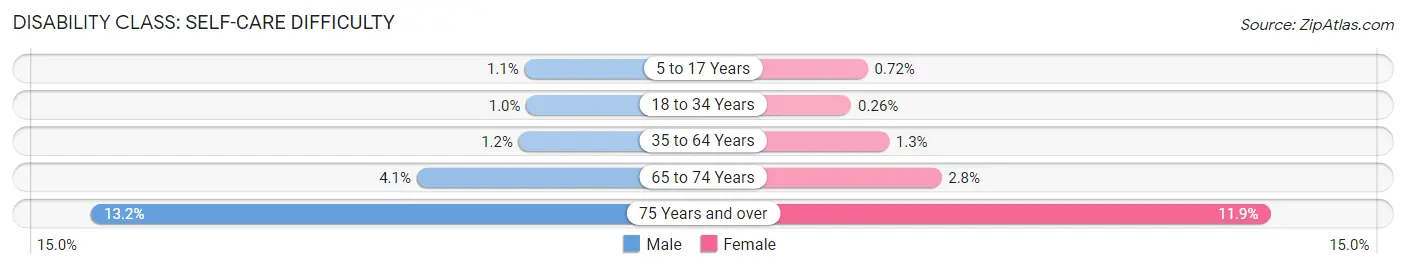
| Age Bracket | Male | Female |
| 5 to 17 Years | 112 (1.1%) | 84 (0.7%) |
| 18 to 34 Years | 212 (1.0%) | 48 (0.3%) |
| 35 to 64 Years | 500 (1.2%) | 467 (1.3%) |
| 65 to 74 Years | 467 (4.1%) | 247 (2.8%) |
| 75 Years and over | 868 (13.2%) | 934 (11.9%) |
Technology Access in Fort Lauderdale
Computing Device Access in Fort Lauderdale
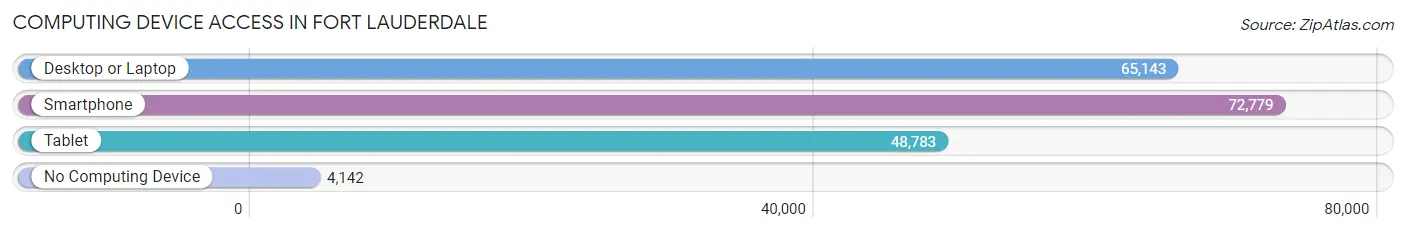
| Device Type | # Households | % Households |
| Desktop or Laptop | 65,143 | 81.4% |
| Smartphone | 72,779 | 90.9% |
| Tablet | 48,783 | 61.0% |
| No Computing Device | 4,142 | 5.2% |
| Total | 80,031 | 100.0% |
Internet Access in Fort Lauderdale
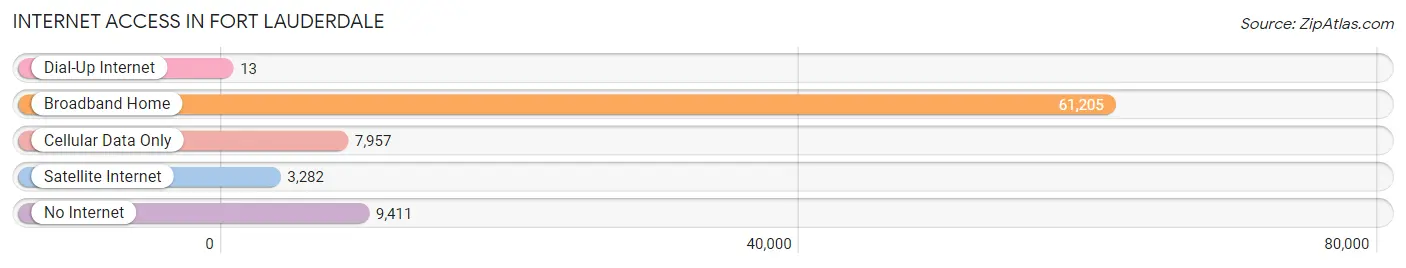
| Internet Type | # Households | % Households |
| Dial-Up Internet | 13 | 0.0% |
| Broadband Home | 61,205 | 76.5% |
| Cellular Data Only | 7,957 | 9.9% |
| Satellite Internet | 3,282 | 4.1% |
| No Internet | 9,411 | 11.8% |
| Total | 80,031 | 100.0% |
Fort Lauderdale Summary
Fort Lauderdale, Florida is a city located in the southeastern United States, in Broward County. It is the county seat and the largest city in the county. The city is situated on the Atlantic Ocean, 23 miles north of Miami. As of the 2010 census, the city had a population of 165,521.
History
Fort Lauderdale was founded in 1838 by William Cooley, a Tennessee native who had moved to the area in search of a better life. He named the settlement after a fort he had built nearby. The fort was used to protect settlers from Native American attacks. The settlement grew slowly, but by the late 19th century, it had become a popular destination for tourists.
In 1911, the city was incorporated and the population had grown to 1,500. The city was a popular destination for tourists, and by the 1920s, it had become known as the “Venice of America” due to its many canals and waterways.
In the 1950s, the city began to experience rapid growth due to the influx of retirees and snowbirds from the northern United States. This growth continued into the 1960s and 1970s, and by the 1980s, the city had become a major tourist destination.
Geography
Fort Lauderdale is located in southeastern Florida, in Broward County. It is situated on the Atlantic Ocean, 23 miles north of Miami. The city covers an area of 36.2 square miles, of which 34.2 square miles is land and 2.0 square miles is water.
The city is bordered by the cities of Hollywood and Pompano Beach to the north, Wilton Manors to the east, Davie to the west, and the Atlantic Ocean to the south. The city is located on the eastern edge of the Florida Everglades, and is home to several parks and nature preserves.
Economy
Fort Lauderdale is a major economic center in South Florida. The city’s economy is driven by tourism, international trade, finance, and manufacturing.
Tourism is the city’s largest industry, with over 10 million visitors each year. The city is home to several major attractions, including the Fort Lauderdale Beach, the International Swimming Hall of Fame, and the Museum of Discovery and Science.
The city is also a major center for international trade, with the Port Everglades serving as the second-busiest cruise port in the world. The port is also a major hub for cargo shipping, with over 4 million tons of cargo passing through each year.
The city is also home to several major financial institutions, including Bank of America, Citibank, and Wells Fargo. The city is also home to several major manufacturing companies, including Motorola, IBM, and Microsoft.
Demographics
As of the 2010 census, the city had a population of 165,521. The racial makeup of the city was 57.2% White, 28.3% African American, 0.4% Native American, 2.2% Asian, 0.1% Pacific Islander, 8.2% from other races, and 3.7% from two or more races. Hispanic or Latino of any race were 24.2% of the population.
The median income for a household in the city was $41,939, and the median income for a family was $50,898. The per capita income for the city was $27,837. About 15.2% of the population was below the poverty line.
Fort Lauderdale is a diverse city, with a variety of cultures and backgrounds. The city is home to a large number of immigrants from Latin America, the Caribbean, and Europe. The city is also home to a large number of retirees, and is a popular destination for snowbirds from the northern United States.
Common Questions
What is Per Capita Income in Fort Lauderdale?
Per Capita income in Fort Lauderdale is $55,060.
What is the Median Family Income in Fort Lauderdale?
Median Family Income in Fort Lauderdale is $87,676.
What is the Median Household income in Fort Lauderdale?
Median Household Income in Fort Lauderdale is $75,376.
What is Income or Wage Gap in Fort Lauderdale?
Income or Wage Gap in Fort Lauderdale is 21.0%.
Women in Fort Lauderdale earn 79.0 cents for every dollar earned by a man.
What is Family Income Deficit in Fort Lauderdale?
Family Income Deficit in Fort Lauderdale is $10,210.
Families that are below poverty line in Fort Lauderdale earn $10,210 less on average than the poverty threshold level.
What is Inequality or Gini Index in Fort Lauderdale?
Inequality or Gini Index in Fort Lauderdale is 0.54.
What is the Total Population of Fort Lauderdale?
Total Population of Fort Lauderdale is 182,673.
What is the Total Male Population of Fort Lauderdale?
Total Male Population of Fort Lauderdale is 95,334.
What is the Total Female Population of Fort Lauderdale?
Total Female Population of Fort Lauderdale is 87,339.
What is the Ratio of Males per 100 Females in Fort Lauderdale?
There are 109.15 Males per 100 Females in Fort Lauderdale.
What is the Ratio of Females per 100 Males in Fort Lauderdale?
There are 91.61 Females per 100 Males in Fort Lauderdale.
What is the Median Population Age in Fort Lauderdale?
Median Population Age in Fort Lauderdale is 43.2 Years.
What is the Average Family Size in Fort Lauderdale
Average Family Size in Fort Lauderdale is 3.1 People.
What is the Average Household Size in Fort Lauderdale
Average Household Size in Fort Lauderdale is 2.2 People.
How Large is the Labor Force in Fort Lauderdale?
There are 100,613 People in the Labor Forcein in Fort Lauderdale.
What is the Percentage of People in the Labor Force in Fort Lauderdale?
64.6% of People are in the Labor Force in Fort Lauderdale.
What is the Unemployment Rate in Fort Lauderdale?
Unemployment Rate in Fort Lauderdale is 5.4%.