Westmont, IL Map & Demographics
Westmont Map
Westmont Overview
$50,174
PER CAPITA INCOME
$118,926
AVG FAMILY INCOME
$82,519
AVG HOUSEHOLD INCOME
28.9%
WAGE / INCOME GAP [ % ]
71.1¢/ $1
WAGE / INCOME GAP [ $ ]
0.49
INEQUALITY / GINI INDEX
24,271
TOTAL POPULATION
11,168
MALE POPULATION
13,103
FEMALE POPULATION
85.23
MALES / 100 FEMALES
117.33
FEMALES / 100 MALES
40.6
MEDIAN AGE
3.0
AVG FAMILY SIZE
2.3
AVG HOUSEHOLD SIZE
12,931
LABOR FORCE [ PEOPLE ]
65.1%
PERCENT IN LABOR FORCE
3.4%
UNEMPLOYMENT RATE
Westmont Zip Codes
Westmont Area Codes
Income in Westmont
Income Overview in Westmont
Per Capita Income in Westmont is $50,174, while median incomes of families and households are $118,926 and $82,519 respectively.
| Characteristic | Number | Measure |
| Per Capita Income | 24,271 | $50,174 |
| Median Family Income | 6,238 | $118,926 |
| Mean Family Income | 6,238 | $151,358 |
| Median Household Income | 10,336 | $82,519 |
| Mean Household Income | 10,336 | $115,374 |
| Income Deficit | 6,238 | $0 |
| Wage / Income Gap (%) | 24,271 | 28.93% |
| Wage / Income Gap ($) | 24,271 | 71.07¢ per $1 |
| Gini / Inequality Index | 24,271 | 0.49 |
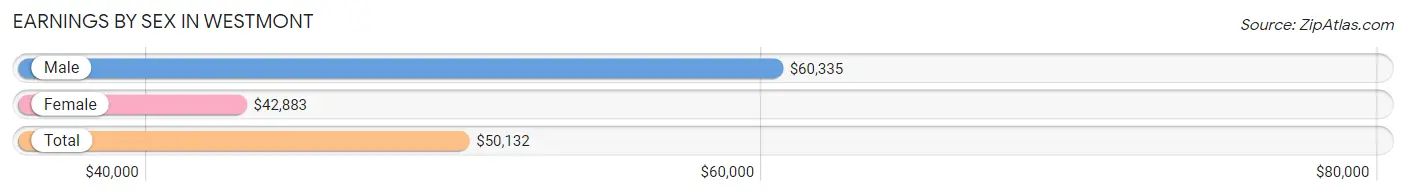
Earnings by Sex in Westmont
Average Earnings in Westmont are $50,132, $60,335 for men and $42,883 for women, a difference of 28.9%.
| Sex | Number | Average Earnings |
| Male | 6,861 (51.2%) | $60,335 |
| Female | 6,533 (48.8%) | $42,883 |
| Total | 13,394 (100.0%) | $50,132 |
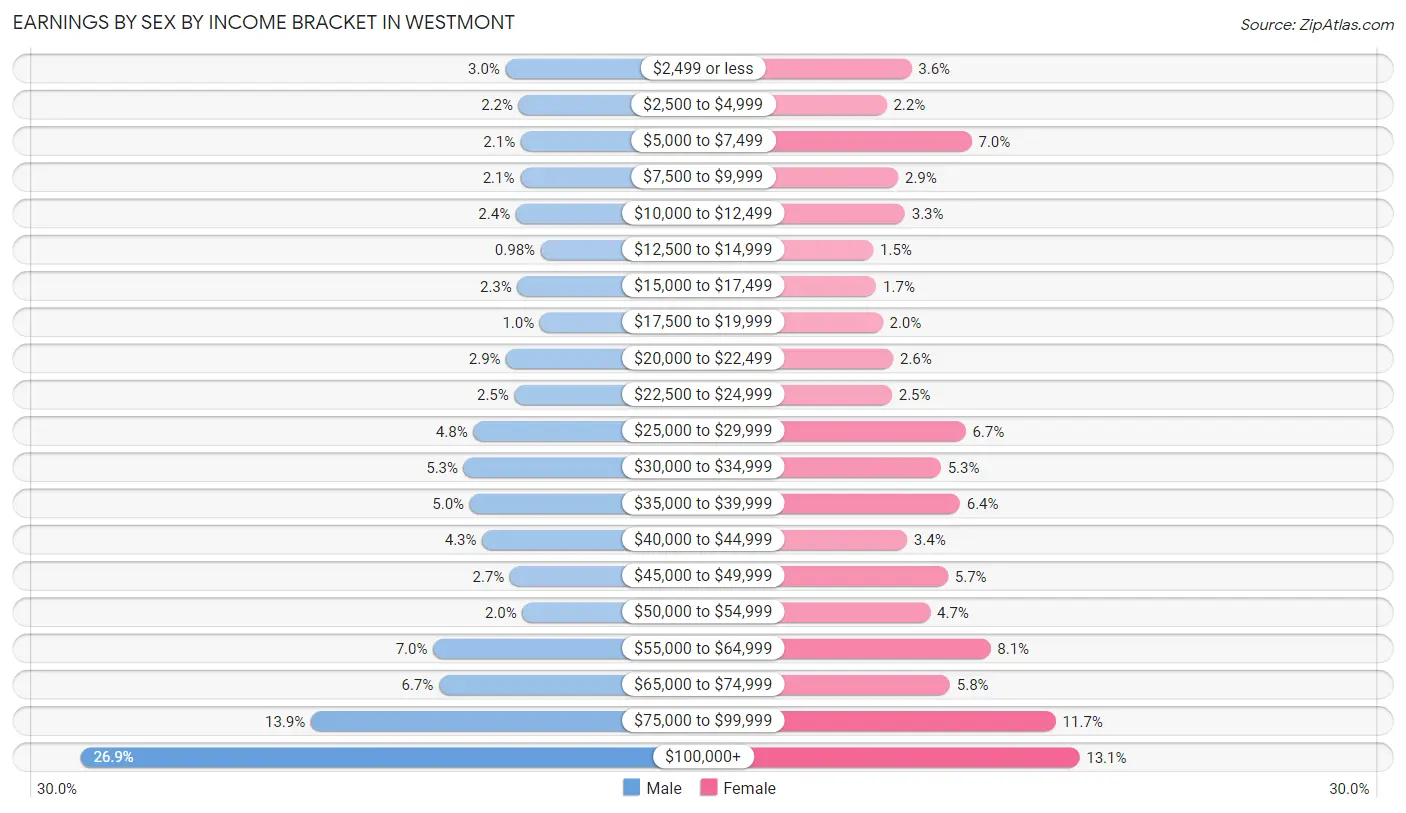
Earnings by Sex by Income Bracket in Westmont
The most common earnings brackets in Westmont are $100,000+ for men (1,843 | 26.9%) and $100,000+ for women (854 | 13.1%).
| Income | Male | Female |
| $2,499 or less | 203 (3.0%) | 237 (3.6%) |
| $2,500 to $4,999 | 152 (2.2%) | 146 (2.2%) |
| $5,000 to $7,499 | 144 (2.1%) | 458 (7.0%) |
| $7,500 to $9,999 | 147 (2.1%) | 188 (2.9%) |
| $10,000 to $12,499 | 163 (2.4%) | 213 (3.3%) |
| $12,500 to $14,999 | 67 (1.0%) | 97 (1.5%) |
| $15,000 to $17,499 | 157 (2.3%) | 108 (1.7%) |
| $17,500 to $19,999 | 71 (1.0%) | 131 (2.0%) |
| $20,000 to $22,499 | 200 (2.9%) | 170 (2.6%) |
| $22,500 to $24,999 | 169 (2.5%) | 165 (2.5%) |
| $25,000 to $29,999 | 327 (4.8%) | 436 (6.7%) |
| $30,000 to $34,999 | 364 (5.3%) | 345 (5.3%) |
| $35,000 to $39,999 | 341 (5.0%) | 415 (6.4%) |
| $40,000 to $44,999 | 293 (4.3%) | 221 (3.4%) |
| $45,000 to $49,999 | 186 (2.7%) | 371 (5.7%) |
| $50,000 to $54,999 | 138 (2.0%) | 306 (4.7%) |
| $55,000 to $64,999 | 482 (7.0%) | 527 (8.1%) |
| $65,000 to $74,999 | 460 (6.7%) | 378 (5.8%) |
| $75,000 to $99,999 | 954 (13.9%) | 767 (11.7%) |
| $100,000+ | 1,843 (26.9%) | 854 (13.1%) |
| Total | 6,861 (100.0%) | 6,533 (100.0%) |
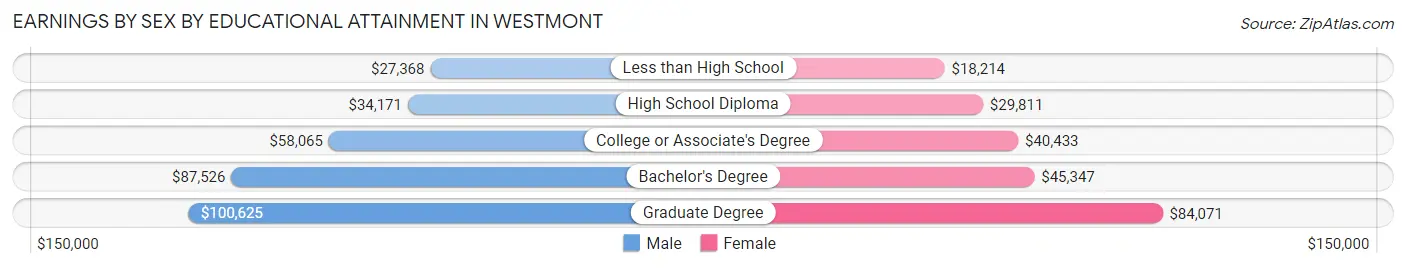
Earnings by Sex by Educational Attainment in Westmont
Average earnings in Westmont are $69,479 for men and $46,660 for women, a difference of 32.8%. Men with an educational attainment of graduate degree enjoy the highest average annual earnings of $100,625, while those with less than high school education earn the least with $27,368. Women with an educational attainment of graduate degree earn the most with the average annual earnings of $84,071, while those with less than high school education have the smallest earnings of $18,214.
| Educational Attainment | Male Income | Female Income |
| Less than High School | $27,368 | $18,214 |
| High School Diploma | $34,171 | $29,811 |
| College or Associate's Degree | $58,065 | $40,433 |
| Bachelor's Degree | $87,526 | $45,347 |
| Graduate Degree | $100,625 | $84,071 |
| Total | $69,479 | $46,660 |
Family Income in Westmont
Family Income Brackets in Westmont
According to the Westmont family income data, there are 1,410 families falling into the $100,000 to $149,999 income range, which is the most common income bracket and makes up 22.6% of all families. Conversely, the $10,000 to $14,999 income bracket is the least frequent group with only 119 families (1.9%) belonging to this category.
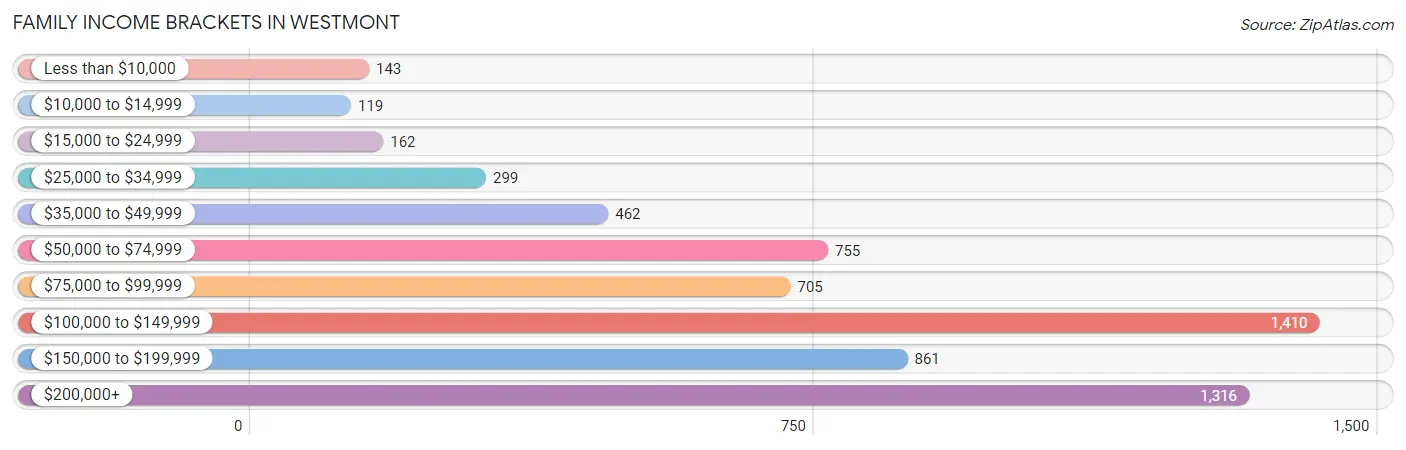
| Income Bracket | # Families | % Families |
| Less than $10,000 | 143 | 2.3% |
| $10,000 to $14,999 | 119 | 1.9% |
| $15,000 to $24,999 | 162 | 2.6% |
| $25,000 to $34,999 | 299 | 4.8% |
| $35,000 to $49,999 | 462 | 7.4% |
| $50,000 to $74,999 | 755 | 12.1% |
| $75,000 to $99,999 | 705 | 11.3% |
| $100,000 to $149,999 | 1,410 | 22.6% |
| $150,000 to $199,999 | 861 | 13.8% |
| $200,000+ | 1,316 | 21.1% |
Family Income by Famaliy Size in Westmont
6-person families (61 | 1.0%) account for the highest median family income in Westmont with $166,625 per family, while 2-person families (2,882 | 46.2%) have the highest median income of $56,546 per family member.
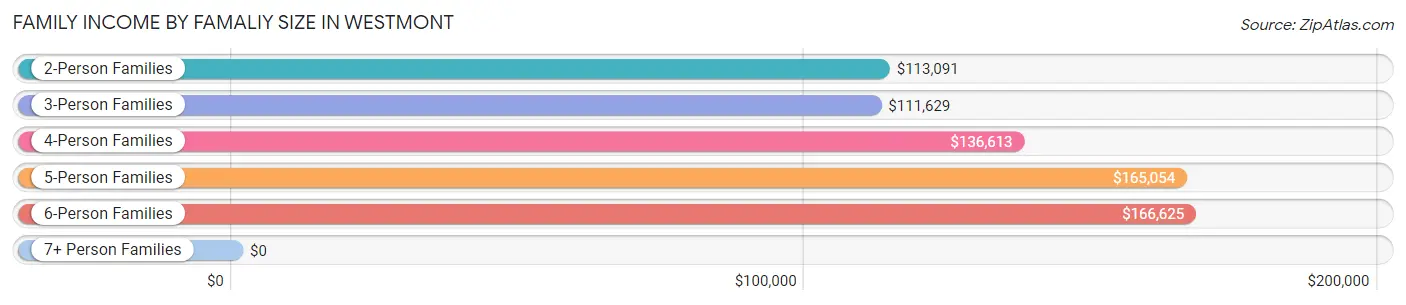
| Income Bracket | # Families | Median Income |
| 2-Person Families | 2,882 (46.2%) | $113,091 |
| 3-Person Families | 1,753 (28.1%) | $111,629 |
| 4-Person Families | 1,030 (16.5%) | $136,613 |
| 5-Person Families | 396 (6.4%) | $165,054 |
| 6-Person Families | 61 (1.0%) | $166,625 |
| 7+ Person Families | 116 (1.9%) | $0 |
| Total | 6,238 (100.0%) | $118,926 |
Family Income by Number of Earners in Westmont
The median family income in Westmont is $118,926, with families comprising 3+ earners (788) having the highest median family income of $150,167, while families with no earners (573) have the lowest median family income of $69,464, accounting for 12.6% and 9.2% of families, respectively.
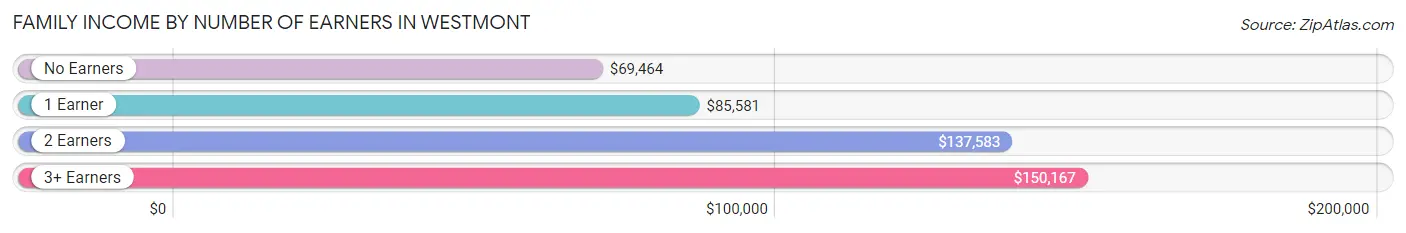
| Number of Earners | # Families | Median Income |
| No Earners | 573 (9.2%) | $69,464 |
| 1 Earner | 2,094 (33.6%) | $85,581 |
| 2 Earners | 2,783 (44.6%) | $137,583 |
| 3+ Earners | 788 (12.6%) | $150,167 |
| Total | 6,238 (100.0%) | $118,926 |
Household Income in Westmont
Household Income Brackets in Westmont
With 1,840 households falling in the category, the $100,000 to $149,999 income range is the most frequent in Westmont, accounting for 17.8% of all households. In contrast, only 320 households (3.1%) fall into the $10,000 to $14,999 income bracket, making it the least populous group.
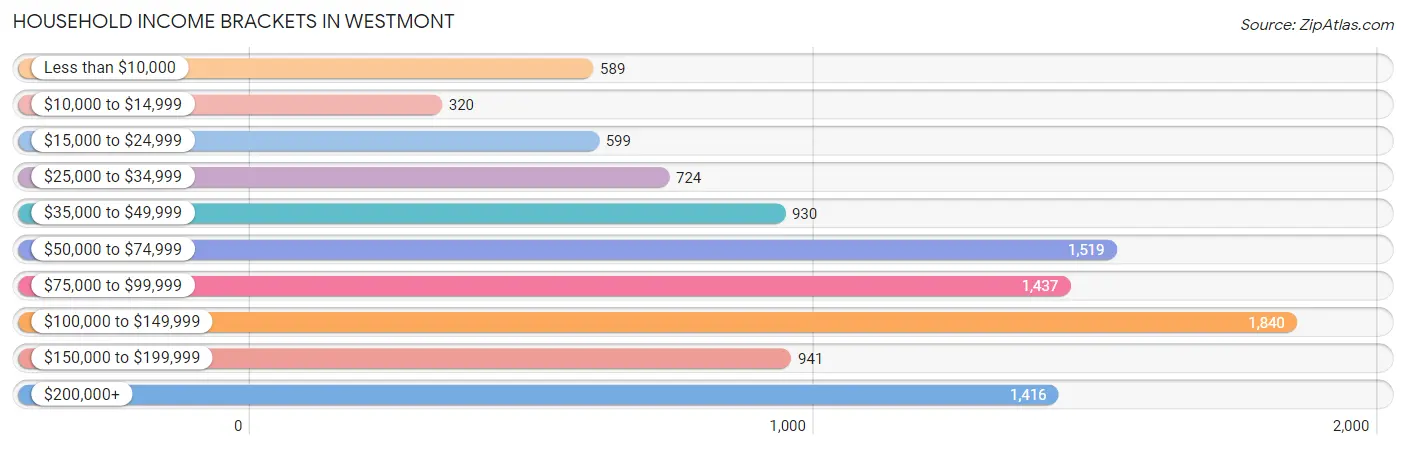
| Income Bracket | # Households | % Households |
| Less than $10,000 | 589 | 5.7% |
| $10,000 to $14,999 | 320 | 3.1% |
| $15,000 to $24,999 | 599 | 5.8% |
| $25,000 to $34,999 | 724 | 7.0% |
| $35,000 to $49,999 | 930 | 9.0% |
| $50,000 to $74,999 | 1,519 | 14.7% |
| $75,000 to $99,999 | 1,437 | 13.9% |
| $100,000 to $149,999 | 1,840 | 17.8% |
| $150,000 to $199,999 | 941 | 9.1% |
| $200,000+ | 1,416 | 13.7% |
Household Income by Householder Age in Westmont
The median household income in Westmont is $82,519, with the highest median household income of $102,083 found in the 45 to 64 years age bracket for the primary householder. A total of 3,653 households (35.3%) fall into this category. Meanwhile, the 15 to 24 years age bracket for the primary householder has the lowest median household income of $48,500, with 248 households (2.4%) in this group.
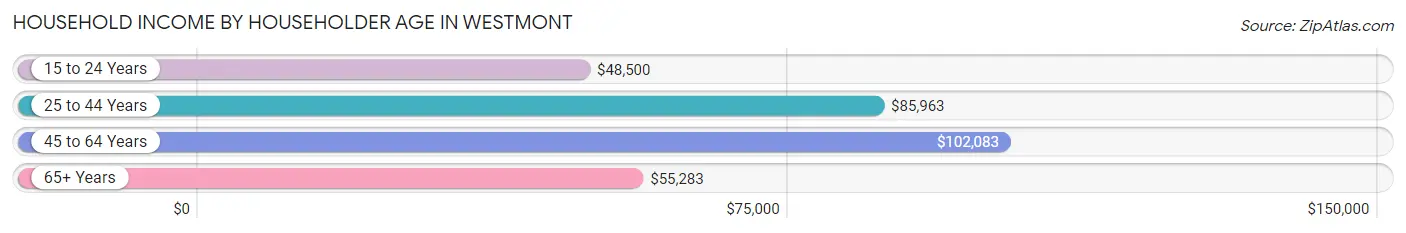
| Income Bracket | # Households | Median Income |
| 15 to 24 Years | 248 (2.4%) | $48,500 |
| 25 to 44 Years | 3,345 (32.4%) | $85,963 |
| 45 to 64 Years | 3,653 (35.3%) | $102,083 |
| 65+ Years | 3,090 (29.9%) | $55,283 |
| Total | 10,336 (100.0%) | $82,519 |
Poverty in Westmont
Income Below Poverty by Sex and Age in Westmont
With 10.5% poverty level for males and 11.7% for females among the residents of Westmont, 15 year old males and 16 and 17 year old females are the most vulnerable to poverty, with 94 males (64.8%) and 47 females (24.9%) in their respective age groups living below the poverty level.
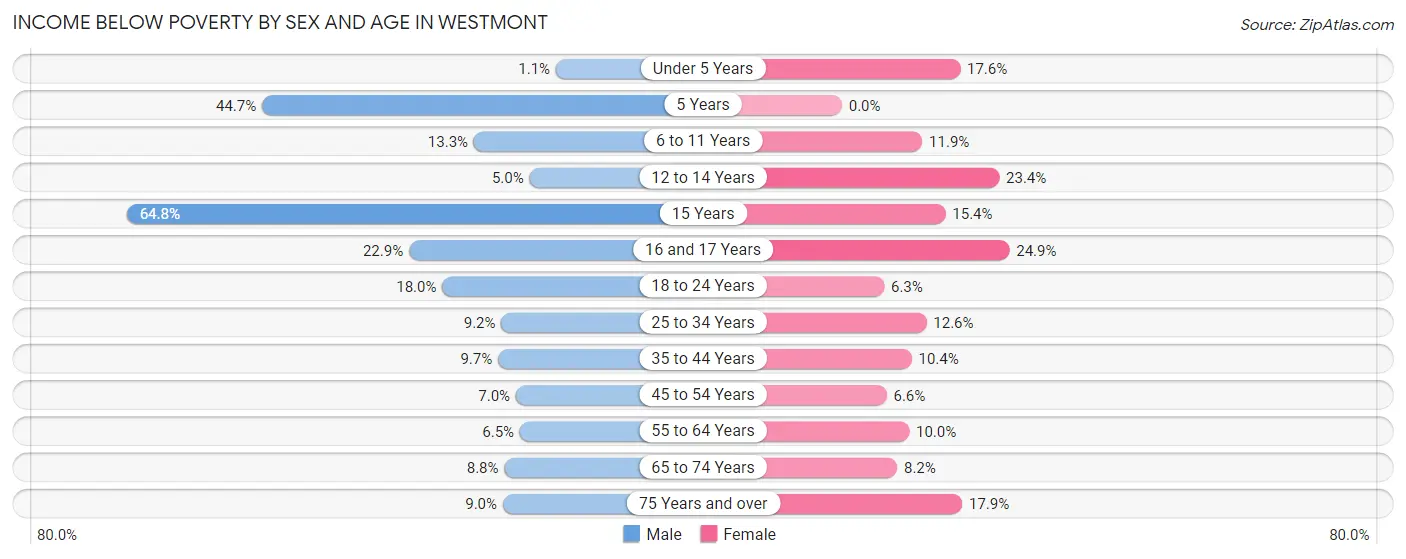
| Age Bracket | Male | Female |
| Under 5 Years | 8 (1.1%) | 141 (17.6%) |
| 5 Years | 85 (44.7%) | 0 (0.0%) |
| 6 to 11 Years | 92 (13.3%) | 108 (11.9%) |
| 12 to 14 Years | 16 (5.0%) | 100 (23.4%) |
| 15 Years | 94 (64.8%) | 26 (15.4%) |
| 16 and 17 Years | 44 (22.9%) | 47 (24.9%) |
| 18 to 24 Years | 173 (18.0%) | 48 (6.3%) |
| 25 to 34 Years | 132 (9.2%) | 241 (12.6%) |
| 35 to 44 Years | 163 (9.7%) | 170 (10.4%) |
| 45 to 54 Years | 92 (7.0%) | 92 (6.6%) |
| 55 to 64 Years | 103 (6.5%) | 204 (10.0%) |
| 65 to 74 Years | 100 (8.8%) | 110 (8.2%) |
| 75 Years and over | 61 (9.0%) | 214 (17.9%) |
| Total | 1,163 (10.5%) | 1,501 (11.7%) |
Income Above Poverty by Sex and Age in Westmont
According to the poverty statistics in Westmont, males aged under 5 years and females aged 5 years are the age groups that are most secure financially, with 98.9% of males and 100.0% of females in these age groups living above the poverty line.
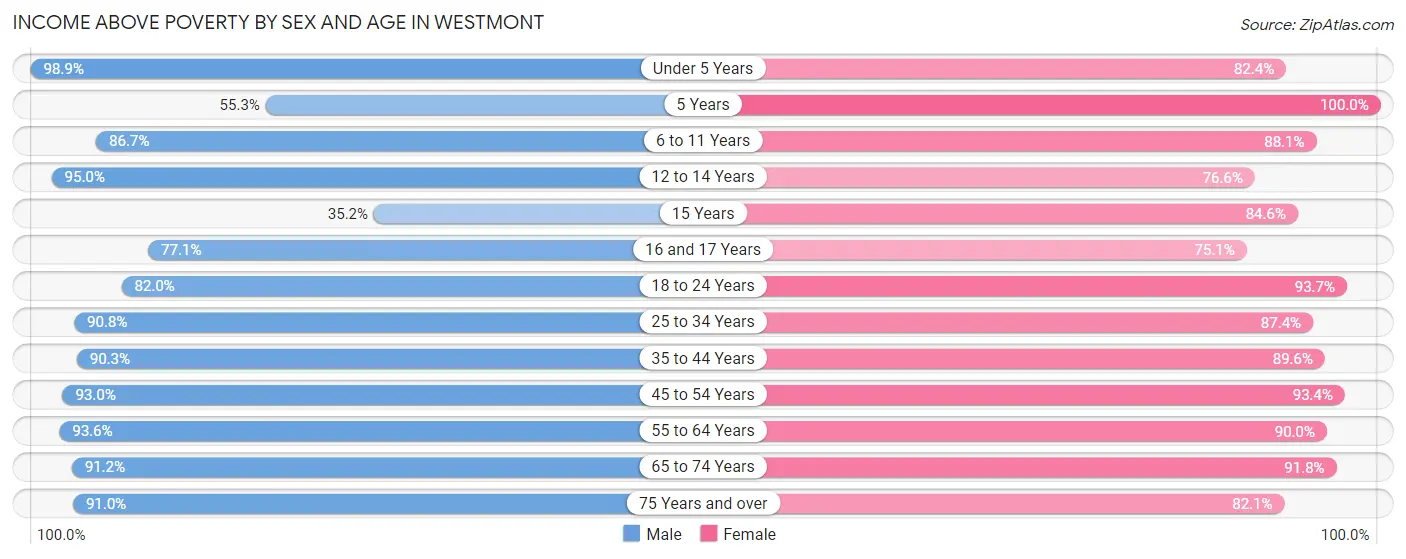
| Age Bracket | Male | Female |
| Under 5 Years | 721 (98.9%) | 662 (82.4%) |
| 5 Years | 105 (55.3%) | 16 (100.0%) |
| 6 to 11 Years | 601 (86.7%) | 797 (88.1%) |
| 12 to 14 Years | 303 (95.0%) | 328 (76.6%) |
| 15 Years | 51 (35.2%) | 143 (84.6%) |
| 16 and 17 Years | 148 (77.1%) | 142 (75.1%) |
| 18 to 24 Years | 789 (82.0%) | 718 (93.7%) |
| 25 to 34 Years | 1,303 (90.8%) | 1,678 (87.4%) |
| 35 to 44 Years | 1,517 (90.3%) | 1,471 (89.6%) |
| 45 to 54 Years | 1,215 (93.0%) | 1,293 (93.4%) |
| 55 to 64 Years | 1,494 (93.5%) | 1,841 (90.0%) |
| 65 to 74 Years | 1,041 (91.2%) | 1,232 (91.8%) |
| 75 Years and over | 618 (91.0%) | 984 (82.1%) |
| Total | 9,906 (89.5%) | 11,305 (88.3%) |
Income Below Poverty Among Married-Couple Families in Westmont
The poverty statistics for married-couple families in Westmont show that 5.7% or 275 of the total 4,865 families live below the poverty line. Families with 3 or 4 children have the highest poverty rate of 28.0%, comprising of 92 families. On the other hand, families with no children have the lowest poverty rate of 3.7%, which includes 114 families.
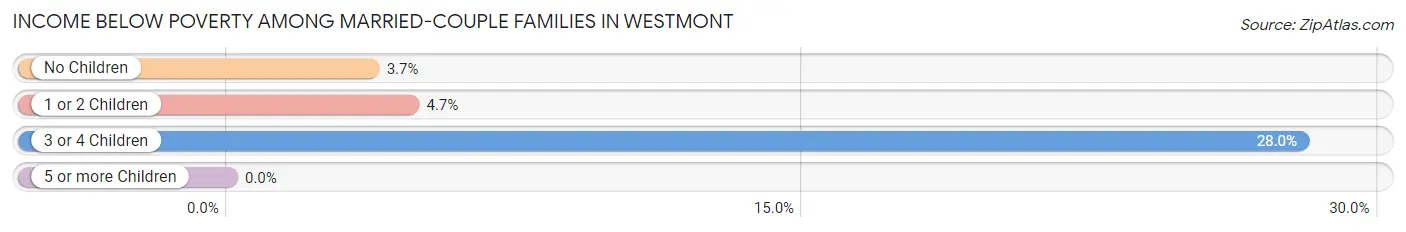
| Children | Above Poverty | Below Poverty |
| No Children | 2,967 (96.3%) | 114 (3.7%) |
| 1 or 2 Children | 1,386 (95.3%) | 69 (4.7%) |
| 3 or 4 Children | 237 (72.0%) | 92 (28.0%) |
| 5 or more Children | 0 (0.0%) | 0 (0.0%) |
| Total | 4,590 (94.4%) | 275 (5.7%) |
Income Below Poverty Among Single-Parent Households in Westmont
According to the poverty data in Westmont, 6.6% or 20 single-father households and 13.8% or 148 single-mother households are living below the poverty line. Among single-father households, those with no children have the highest poverty rate, with 11 households (8.8%) experiencing poverty. Likewise, among single-mother households, those with 5 or more children have the highest poverty rate, with 19 households (100.0%) falling below the poverty line.
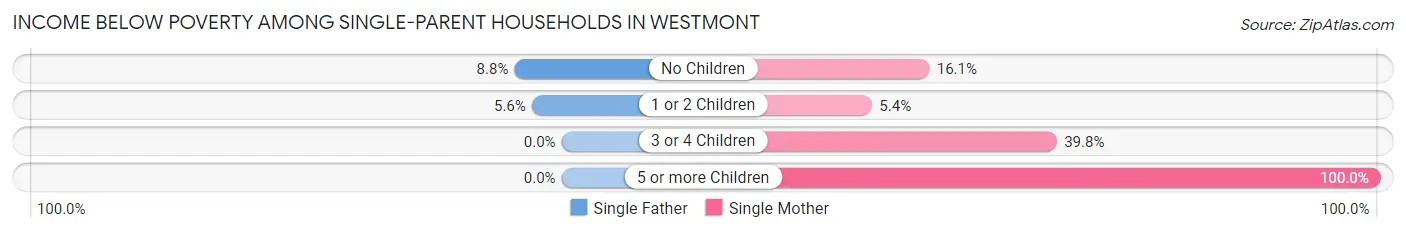
| Children | Single Father | Single Mother |
| No Children | 11 (8.8%) | 61 (16.1%) |
| 1 or 2 Children | 9 (5.6%) | 31 (5.3%) |
| 3 or 4 Children | 0 (0.0%) | 37 (39.8%) |
| 5 or more Children | 0 (0.0%) | 19 (100.0%) |
| Total | 20 (6.6%) | 148 (13.8%) |
Income Below Poverty Among Married-Couple vs Single-Parent Households in Westmont
The poverty data for Westmont shows that 275 of the married-couple family households (5.7%) and 168 of the single-parent households (12.2%) are living below the poverty level. Within the married-couple family households, those with 3 or 4 children have the highest poverty rate, with 92 households (28.0%) falling below the poverty line. Among the single-parent households, those with 5 or more children have the highest poverty rate, with 19 household (100.0%) living below poverty.
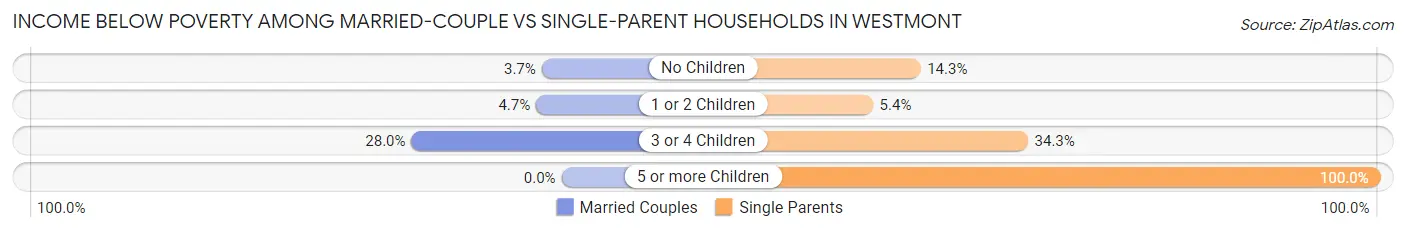
| Children | Married-Couple Families | Single-Parent Households |
| No Children | 114 (3.7%) | 72 (14.3%) |
| 1 or 2 Children | 69 (4.7%) | 40 (5.4%) |
| 3 or 4 Children | 92 (28.0%) | 37 (34.3%) |
| 5 or more Children | 0 (0.0%) | 19 (100.0%) |
| Total | 275 (5.7%) | 168 (12.2%) |
Race in Westmont
The most populous races in Westmont are White / Caucasian (16,836 | 69.4%), Asian (3,291 | 13.6%), and Hispanic or Latino (3,206 | 13.2%).
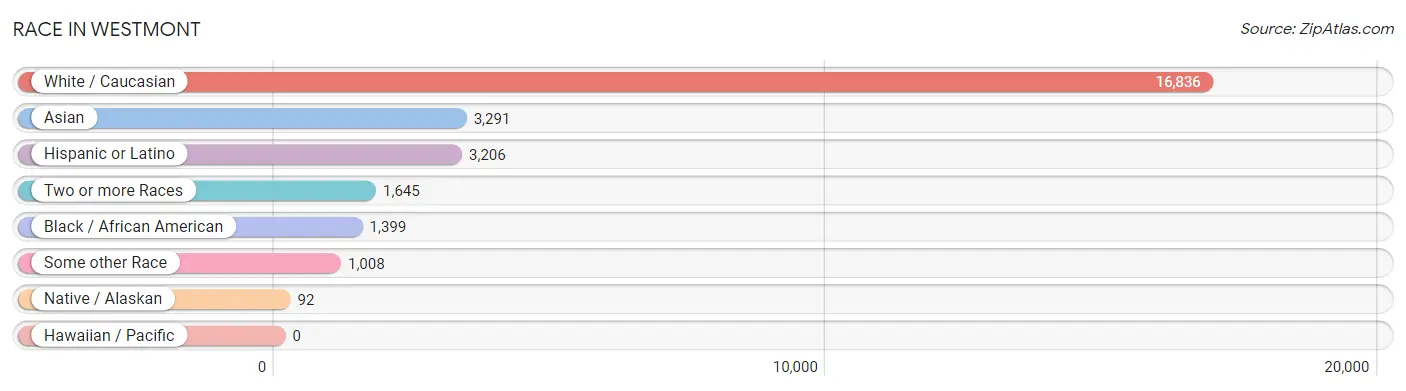
| Race | # Population | % Population |
| Asian | 3,291 | 13.6% |
| Black / African American | 1,399 | 5.8% |
| Hawaiian / Pacific | 0 | 0.0% |
| Hispanic or Latino | 3,206 | 13.2% |
| Native / Alaskan | 92 | 0.4% |
| White / Caucasian | 16,836 | 69.4% |
| Two or more Races | 1,645 | 6.8% |
| Some other Race | 1,008 | 4.2% |
| Total | 24,271 | 100.0% |
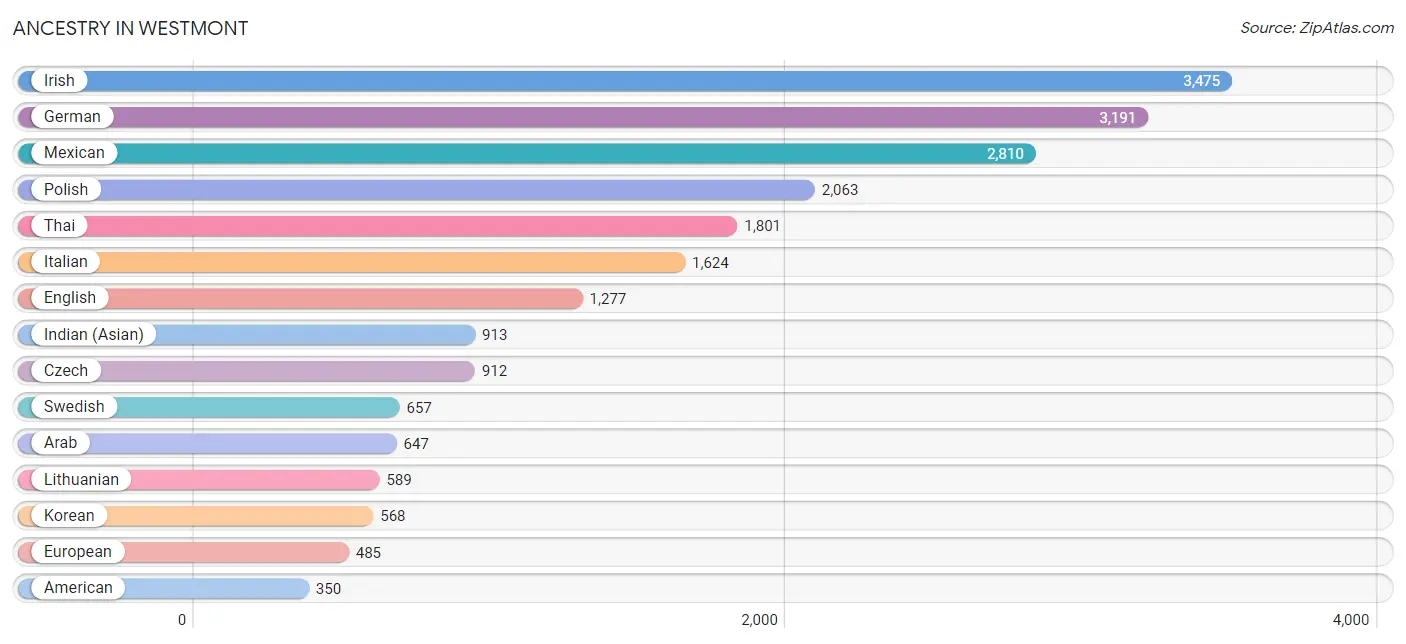
Ancestry in Westmont
The most populous ancestries reported in Westmont are Irish (3,475 | 14.3%), German (3,191 | 13.2%), Mexican (2,810 | 11.6%), Polish (2,063 | 8.5%), and Thai (1,801 | 7.4%), together accounting for 55.0% of all Westmont residents.
| Ancestry | # Population | % Population |
| African | 76 | 0.3% |
| Albanian | 60 | 0.3% |
| American | 350 | 1.4% |
| Arab | 647 | 2.7% |
| Australian | 14 | 0.1% |
| Austrian | 209 | 0.9% |
| Belgian | 50 | 0.2% |
| Bhutanese | 10 | 0.0% |
| Blackfeet | 36 | 0.2% |
| Bolivian | 6 | 0.0% |
| Brazilian | 10 | 0.0% |
| British | 82 | 0.3% |
| Bulgarian | 77 | 0.3% |
| Burmese | 78 | 0.3% |
| Canadian | 67 | 0.3% |
| Central American | 79 | 0.3% |
| Cherokee | 5 | 0.0% |
| Cheyenne | 32 | 0.1% |
| Chippewa | 3 | 0.0% |
| Colombian | 11 | 0.1% |
| Croatian | 215 | 0.9% |
| Cuban | 10 | 0.0% |
| Czech | 912 | 3.8% |
| Czechoslovakian | 78 | 0.3% |
| Danish | 22 | 0.1% |
| Dutch | 297 | 1.2% |
| Eastern European | 255 | 1.1% |
| Ecuadorian | 84 | 0.4% |
| Egyptian | 94 | 0.4% |
| English | 1,277 | 5.3% |
| Estonian | 13 | 0.1% |
| European | 485 | 2.0% |
| Filipino | 90 | 0.4% |
| Finnish | 36 | 0.2% |
| French | 300 | 1.2% |
| French Canadian | 61 | 0.3% |
| German | 3,191 | 13.2% |
| Greek | 190 | 0.8% |
| Guatemalan | 41 | 0.2% |
| Honduran | 38 | 0.2% |
| Hungarian | 254 | 1.1% |
| Indian (Asian) | 913 | 3.8% |
| Iranian | 32 | 0.1% |
| Irish | 3,475 | 14.3% |
| Israeli | 21 | 0.1% |
| Italian | 1,624 | 6.7% |
| Jamaican | 13 | 0.1% |
| Japanese | 9 | 0.0% |
| Jordanian | 245 | 1.0% |
| Korean | 568 | 2.3% |
| Laotian | 10 | 0.0% |
| Lebanese | 92 | 0.4% |
| Lithuanian | 589 | 2.4% |
| Luxembourger | 18 | 0.1% |
| Macedonian | 90 | 0.4% |
| Malaysian | 19 | 0.1% |
| Mexican | 2,810 | 11.6% |
| Mexican American Indian | 107 | 0.4% |
| Moroccan | 38 | 0.2% |
| Northern European | 16 | 0.1% |
| Norwegian | 187 | 0.8% |
| Pakistani | 43 | 0.2% |
| Palestinian | 71 | 0.3% |
| Peruvian | 17 | 0.1% |
| Polish | 2,063 | 8.5% |
| Portuguese | 11 | 0.1% |
| Puerto Rican | 168 | 0.7% |
| Romanian | 105 | 0.4% |
| Russian | 29 | 0.1% |
| Scandinavian | 113 | 0.5% |
| Scotch-Irish | 183 | 0.7% |
| Scottish | 183 | 0.7% |
| Serbian | 68 | 0.3% |
| Sioux | 9 | 0.0% |
| Slavic | 20 | 0.1% |
| Slovak | 112 | 0.5% |
| Slovene | 66 | 0.3% |
| South American | 118 | 0.5% |
| Spanish | 21 | 0.1% |
| Sri Lankan | 10 | 0.0% |
| Subsaharan African | 76 | 0.3% |
| Swedish | 657 | 2.7% |
| Swiss | 10 | 0.0% |
| Syrian | 67 | 0.3% |
| Thai | 1,801 | 7.4% |
| Turkish | 31 | 0.1% |
| Ukrainian | 89 | 0.4% |
| Welsh | 66 | 0.3% |
| Yugoslavian | 9 | 0.0% | View All 89 Rows |
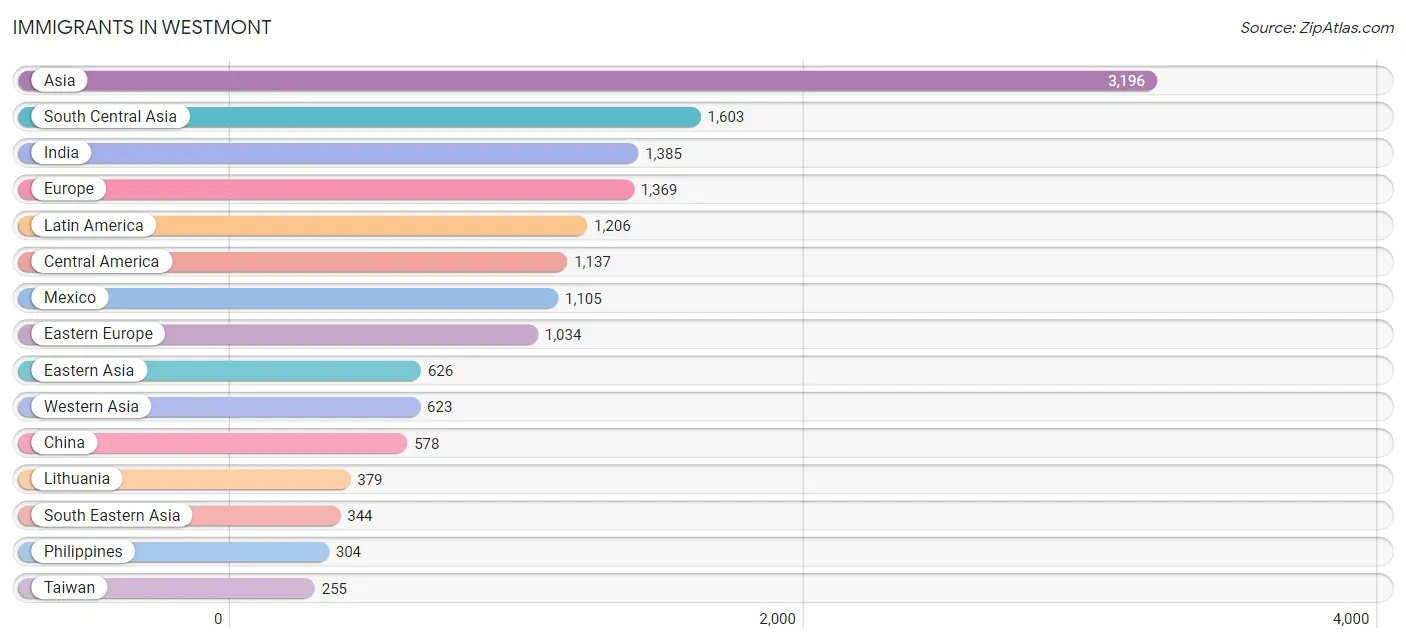
Immigrants in Westmont
The most numerous immigrant groups reported in Westmont came from Asia (3,196 | 13.2%), South Central Asia (1,603 | 6.6%), India (1,385 | 5.7%), Europe (1,369 | 5.6%), and Latin America (1,206 | 5.0%), together accounting for 36.1% of all Westmont residents.
| Immigration Origin | # Population | % Population |
| Afghanistan | 48 | 0.2% |
| Africa | 150 | 0.6% |
| Albania | 23 | 0.1% |
| Asia | 3,196 | 13.2% |
| Australia | 24 | 0.1% |
| Bangladesh | 18 | 0.1% |
| Belarus | 124 | 0.5% |
| Brazil | 14 | 0.1% |
| Bulgaria | 58 | 0.2% |
| Canada | 38 | 0.2% |
| Central America | 1,137 | 4.7% |
| China | 578 | 2.4% |
| Colombia | 11 | 0.1% |
| Czechoslovakia | 43 | 0.2% |
| Denmark | 12 | 0.1% |
| Eastern Africa | 56 | 0.2% |
| Eastern Asia | 626 | 2.6% |
| Eastern Europe | 1,034 | 4.3% |
| Ecuador | 44 | 0.2% |
| Egypt | 8 | 0.0% |
| England | 34 | 0.1% |
| Europe | 1,369 | 5.6% |
| Germany | 119 | 0.5% |
| Ghana | 48 | 0.2% |
| Greece | 24 | 0.1% |
| Guatemala | 19 | 0.1% |
| Hong Kong | 32 | 0.1% |
| India | 1,385 | 5.7% |
| Iran | 97 | 0.4% |
| Iraq | 38 | 0.2% |
| Ireland | 45 | 0.2% |
| Israel | 58 | 0.2% |
| Italy | 34 | 0.1% |
| Japan | 6 | 0.0% |
| Jordan | 40 | 0.2% |
| Kenya | 11 | 0.1% |
| Korea | 42 | 0.2% |
| Latin America | 1,206 | 5.0% |
| Lebanon | 213 | 0.9% |
| Lithuania | 379 | 1.6% |
| Malaysia | 9 | 0.0% |
| Mexico | 1,105 | 4.5% |
| Moldova | 10 | 0.0% |
| Morocco | 38 | 0.2% |
| North Macedonia | 120 | 0.5% |
| Northern Africa | 46 | 0.2% |
| Northern Europe | 130 | 0.5% |
| Oceania | 24 | 0.1% |
| Pakistan | 13 | 0.1% |
| Panama | 13 | 0.1% |
| Philippines | 304 | 1.3% |
| Poland | 124 | 0.5% |
| Romania | 37 | 0.2% |
| Russia | 9 | 0.0% |
| Serbia | 80 | 0.3% |
| South America | 69 | 0.3% |
| South Central Asia | 1,603 | 6.6% |
| South Eastern Asia | 344 | 1.4% |
| Southern Europe | 86 | 0.4% |
| Spain | 28 | 0.1% |
| Sri Lanka | 42 | 0.2% |
| Syria | 121 | 0.5% |
| Taiwan | 255 | 1.1% |
| Thailand | 30 | 0.1% |
| Turkey | 31 | 0.1% |
| Uganda | 33 | 0.1% |
| Ukraine | 27 | 0.1% |
| Western Africa | 48 | 0.2% |
| Western Asia | 623 | 2.6% |
| Western Europe | 119 | 0.5% | View All 70 Rows |
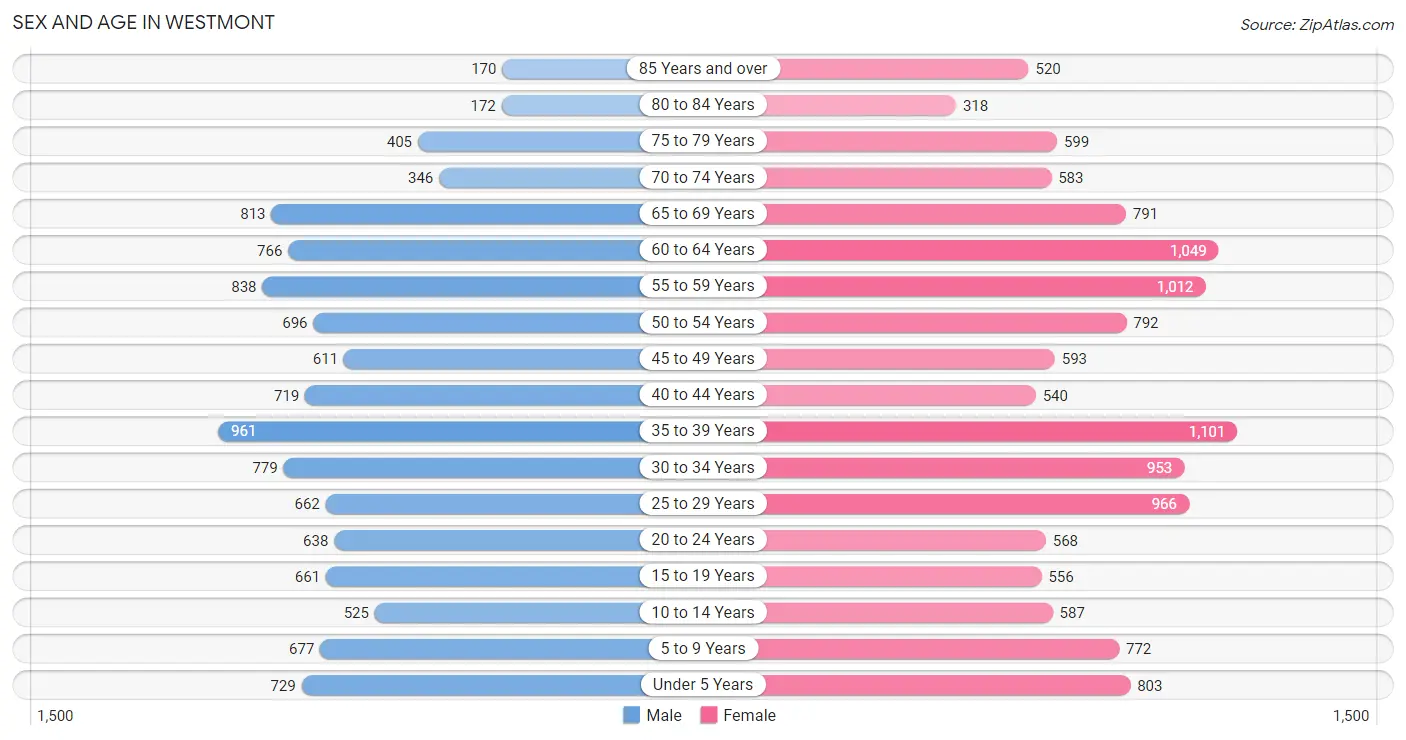
Sex and Age in Westmont
Sex and Age in Westmont
The most populous age groups in Westmont are 35 to 39 Years (961 | 8.6%) for men and 35 to 39 Years (1,101 | 8.4%) for women.
| Age Bracket | Male | Female |
| Under 5 Years | 729 (6.5%) | 803 (6.1%) |
| 5 to 9 Years | 677 (6.1%) | 772 (5.9%) |
| 10 to 14 Years | 525 (4.7%) | 587 (4.5%) |
| 15 to 19 Years | 661 (5.9%) | 556 (4.2%) |
| 20 to 24 Years | 638 (5.7%) | 568 (4.3%) |
| 25 to 29 Years | 662 (5.9%) | 966 (7.4%) |
| 30 to 34 Years | 779 (7.0%) | 953 (7.3%) |
| 35 to 39 Years | 961 (8.6%) | 1,101 (8.4%) |
| 40 to 44 Years | 719 (6.4%) | 540 (4.1%) |
| 45 to 49 Years | 611 (5.5%) | 593 (4.5%) |
| 50 to 54 Years | 696 (6.2%) | 792 (6.0%) |
| 55 to 59 Years | 838 (7.5%) | 1,012 (7.7%) |
| 60 to 64 Years | 766 (6.9%) | 1,049 (8.0%) |
| 65 to 69 Years | 813 (7.3%) | 791 (6.0%) |
| 70 to 74 Years | 346 (3.1%) | 583 (4.4%) |
| 75 to 79 Years | 405 (3.6%) | 599 (4.6%) |
| 80 to 84 Years | 172 (1.5%) | 318 (2.4%) |
| 85 Years and over | 170 (1.5%) | 520 (4.0%) |
| Total | 11,168 (100.0%) | 13,103 (100.0%) |
Families and Households in Westmont
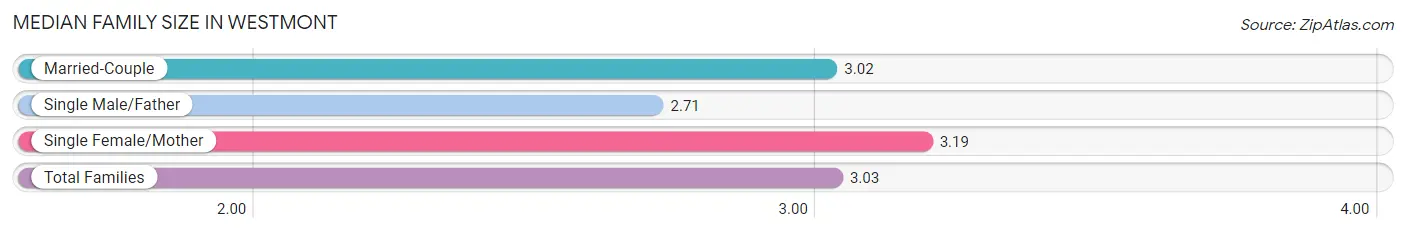
Median Family Size in Westmont
The median family size in Westmont is 3.03 persons per family, with single female/mother families (1,071 | 17.2%) accounting for the largest median family size of 3.19 persons per family. On the other hand, single male/father families (302 | 4.8%) represent the smallest median family size with 2.71 persons per family.
| Family Type | # Families | Family Size |
| Married-Couple | 4,865 (78.0%) | 3.02 |
| Single Male/Father | 302 (4.8%) | 2.71 |
| Single Female/Mother | 1,071 (17.2%) | 3.19 |
| Total Families | 6,238 (100.0%) | 3.03 |
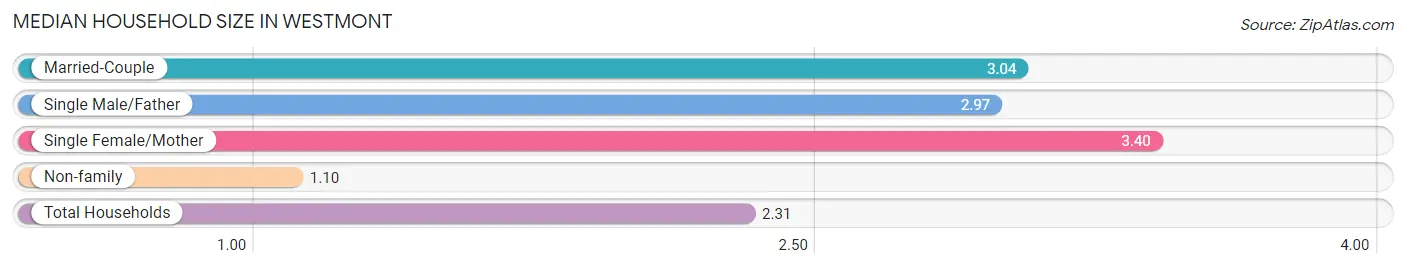
Median Household Size in Westmont
The median household size in Westmont is 2.31 persons per household, with single female/mother households (1,071 | 10.4%) accounting for the largest median household size of 3.4 persons per household. non-family households (4,098 | 39.7%) represent the smallest median household size with 1.10 persons per household.
| Household Type | # Households | Household Size |
| Married-Couple | 4,865 (47.1%) | 3.04 |
| Single Male/Father | 302 (2.9%) | 2.97 |
| Single Female/Mother | 1,071 (10.4%) | 3.40 |
| Non-family | 4,098 (39.7%) | 1.10 |
| Total Households | 10,336 (100.0%) | 2.31 |
Household Size by Marriage Status in Westmont
Out of a total of 10,336 households in Westmont, 6,238 (60.4%) are family households, while 4,098 (39.7%) are nonfamily households. The most numerous type of family households are 2-person households, comprising 2,772, and the most common type of nonfamily households are 1-person households, comprising 3,721.
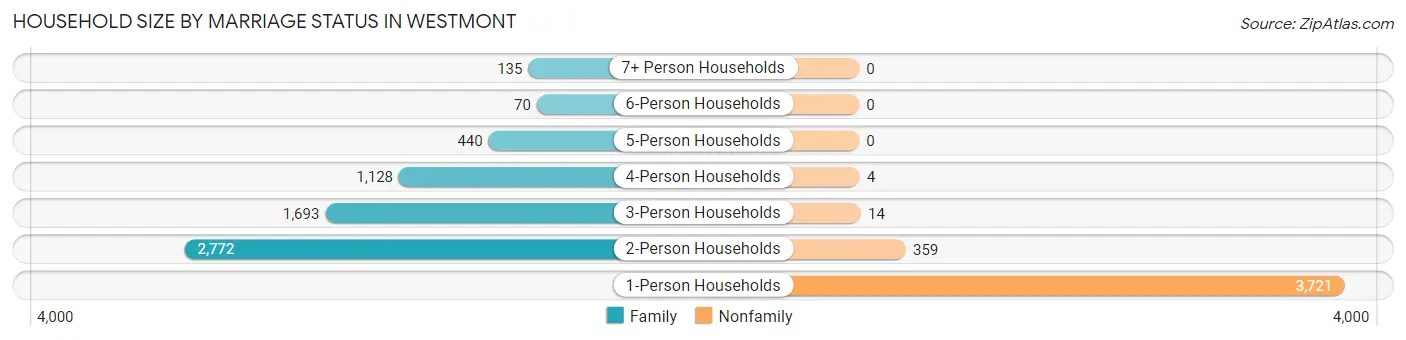
| Household Size | Family Households | Nonfamily Households |
| 1-Person Households | - | 3,721 (36.0%) |
| 2-Person Households | 2,772 (26.8%) | 359 (3.5%) |
| 3-Person Households | 1,693 (16.4%) | 14 (0.1%) |
| 4-Person Households | 1,128 (10.9%) | 4 (0.0%) |
| 5-Person Households | 440 (4.3%) | 0 (0.0%) |
| 6-Person Households | 70 (0.7%) | 0 (0.0%) |
| 7+ Person Households | 135 (1.3%) | 0 (0.0%) |
| Total | 6,238 (60.4%) | 4,098 (39.7%) |
Female Fertility in Westmont
Fertility by Age in Westmont
Average fertility rate in Westmont is 68.0 births per 1,000 women. Women in the age bracket of 20 to 34 years have the highest fertility rate with 88.0 births per 1,000 women. Women in the age bracket of 20 to 34 years acount for 58.8% of all women with births.
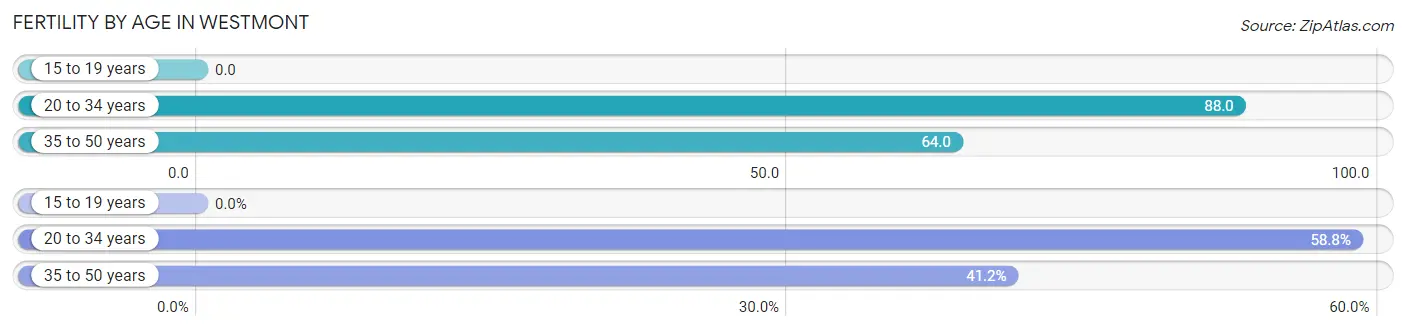
| Age Bracket | Women with Births | Births / 1,000 Women |
| 15 to 19 years | 0 (0.0%) | 0.0 |
| 20 to 34 years | 218 (58.8%) | 88.0 |
| 35 to 50 years | 153 (41.2%) | 64.0 |
| Total | 371 (100.0%) | 68.0 |
Fertility by Age by Marriage Status in Westmont
85.7% of women with births (371) in Westmont are married. The highest percentage of unmarried women with births falls into 20 to 34 years age bracket with 24.3% of them unmarried at the time of birth, while the lowest percentage of unmarried women with births belong to 35 to 50 years age bracket with 0.0% of them unmarried.
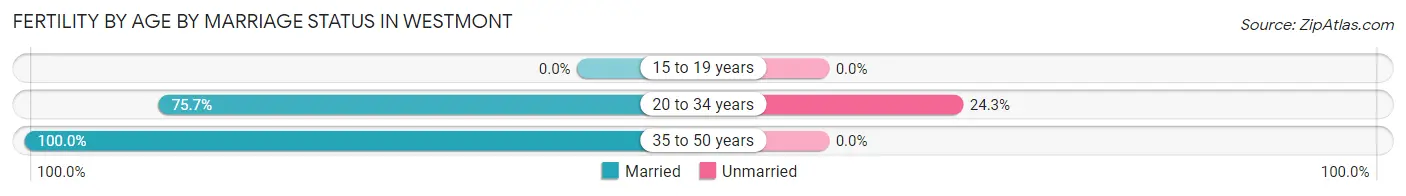
| Age Bracket | Married | Unmarried |
| 15 to 19 years | 0 (0.0%) | 0 (0.0%) |
| 20 to 34 years | 165 (75.7%) | 53 (24.3%) |
| 35 to 50 years | 153 (100.0%) | 0 (0.0%) |
| Total | 318 (85.7%) | 53 (14.3%) |
Fertility by Education in Westmont
Average fertility rate in Westmont is 68.0 births per 1,000 women. Women with the education attainment of bachelor's degree have the highest fertility rate of 120.0 births per 1,000 women, while women with the education attainment of graduate degree have the lowest fertility at 21.0 births per 1,000 women. Women with the education attainment of bachelor's degree represent 48.2% of all women with births.
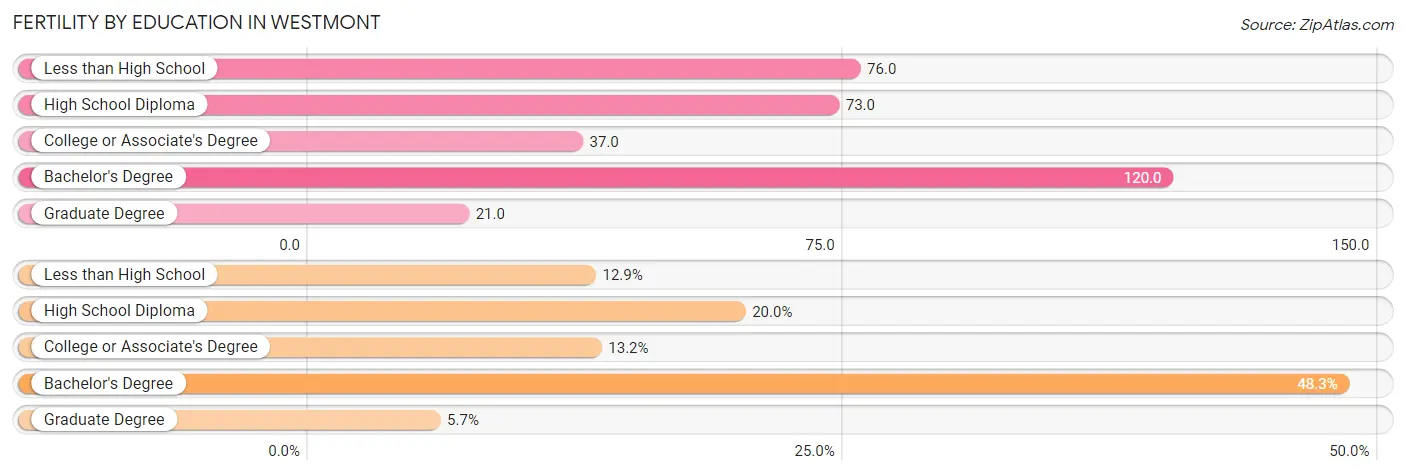
| Educational Attainment | Women with Births | Births / 1,000 Women |
| Less than High School | 48 (12.9%) | 76.0 |
| High School Diploma | 74 (20.0%) | 73.0 |
| College or Associate's Degree | 49 (13.2%) | 37.0 |
| Bachelor's Degree | 179 (48.2%) | 120.0 |
| Graduate Degree | 21 (5.7%) | 21.0 |
| Total | 371 (100.0%) | 68.0 |
Fertility by Education by Marriage Status in Westmont
14.3% of women with births in Westmont are unmarried. Women with the educational attainment of high school diploma are most likely to be married with 100.0% of them married at childbirth, while women with the educational attainment of college or associate's degree are least likely to be married with 57.1% of them unmarried at childbirth.
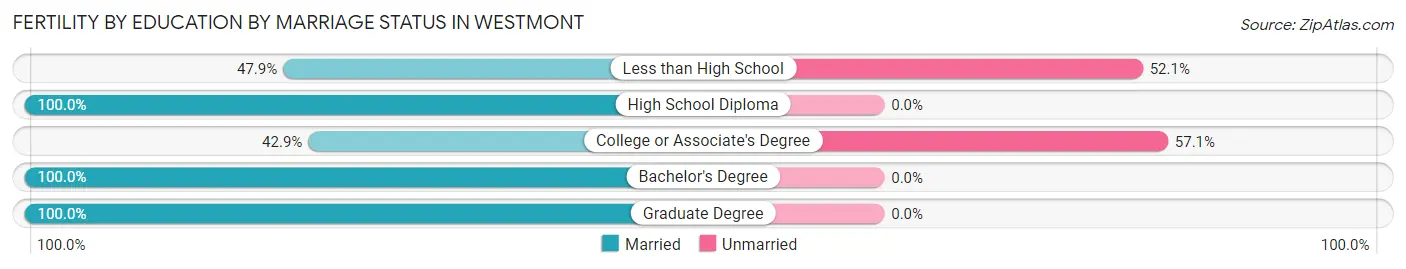
| Educational Attainment | Married | Unmarried |
| Less than High School | 23 (47.9%) | 25 (52.1%) |
| High School Diploma | 74 (100.0%) | 0 (0.0%) |
| College or Associate's Degree | 21 (42.9%) | 28 (57.1%) |
| Bachelor's Degree | 179 (100.0%) | 0 (0.0%) |
| Graduate Degree | 21 (100.0%) | 0 (0.0%) |
| Total | 318 (85.7%) | 53 (14.3%) |
Employment Characteristics in Westmont
Employment by Class of Employer in Westmont
Among the 12,330 employed individuals in Westmont, private company employees (8,579 | 69.6%), not-for-profit organizations (1,298 | 10.5%), and self-employed (incorporated) (775 | 6.3%) make up the most common classes of employment.
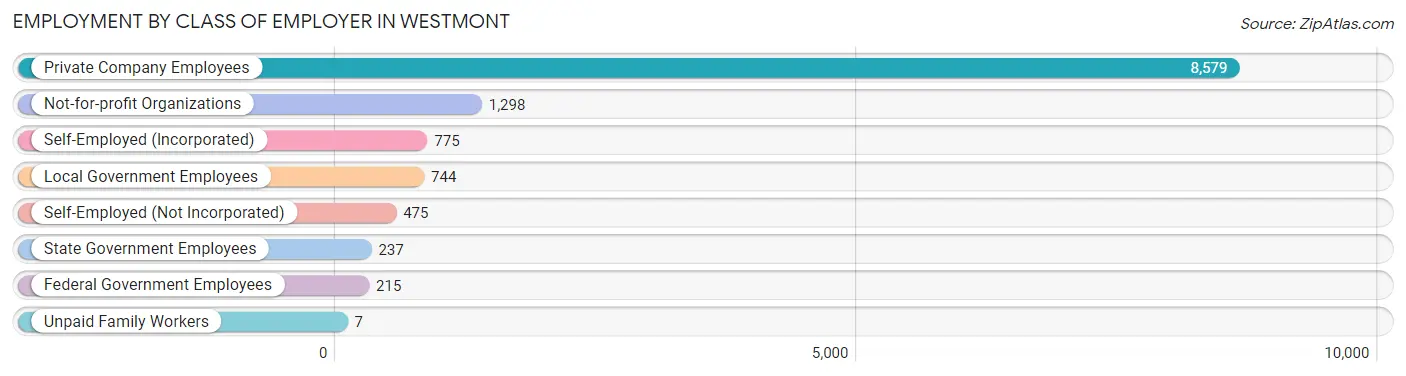
| Employer Class | # Employees | % Employees |
| Private Company Employees | 8,579 | 69.6% |
| Self-Employed (Incorporated) | 775 | 6.3% |
| Self-Employed (Not Incorporated) | 475 | 3.8% |
| Not-for-profit Organizations | 1,298 | 10.5% |
| Local Government Employees | 744 | 6.0% |
| State Government Employees | 237 | 1.9% |
| Federal Government Employees | 215 | 1.7% |
| Unpaid Family Workers | 7 | 0.1% |
| Total | 12,330 | 100.0% |
Employment Status by Age in Westmont
According to the labor force statistics for Westmont, out of the total population over 16 years of age (19,864), 65.1% or 12,931 individuals are in the labor force, with 3.4% or 440 of them unemployed. The age group with the highest labor force participation rate is 20 to 24 years, with 88.0% or 1,061 individuals in the labor force. Within the labor force, the 75 years and over age range has the highest percentage of unemployed individuals, with 11.3% or 11 of them being unemployed.
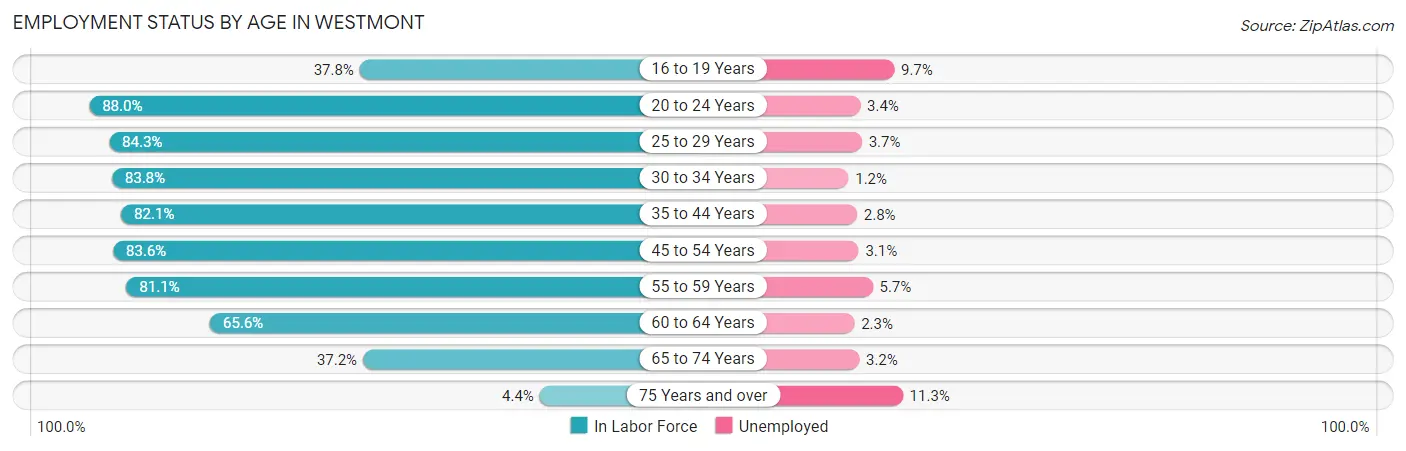
| Age Bracket | In Labor Force | Unemployed |
| 16 to 19 Years | 341 (37.8%) | 33 (9.7%) |
| 20 to 24 Years | 1,061 (88.0%) | 36 (3.4%) |
| 25 to 29 Years | 1,372 (84.3%) | 51 (3.7%) |
| 30 to 34 Years | 1,451 (83.8%) | 17 (1.2%) |
| 35 to 44 Years | 2,727 (82.1%) | 76 (2.8%) |
| 45 to 54 Years | 2,251 (83.6%) | 70 (3.1%) |
| 55 to 59 Years | 1,500 (81.1%) | 86 (5.7%) |
| 60 to 64 Years | 1,191 (65.6%) | 27 (2.3%) |
| 65 to 74 Years | 942 (37.2%) | 30 (3.2%) |
| 75 Years and over | 96 (4.4%) | 11 (11.3%) |
| Total | 12,931 (65.1%) | 440 (3.4%) |
Employment Status by Educational Attainment in Westmont
According to labor force statistics for Westmont, 80.5% of individuals (10,496) out of the total population between 25 and 64 years of age (13,038) are in the labor force, with 3.1% or 325 of them being unemployed. The group with the highest labor force participation rate are those with the educational attainment of bachelor's degree or higher, with 84.8% or 5,665 individuals in the labor force. Within the labor force, individuals with high school diploma education have the highest percentage of unemployment, with 7.8% or 133 of them being unemployed.
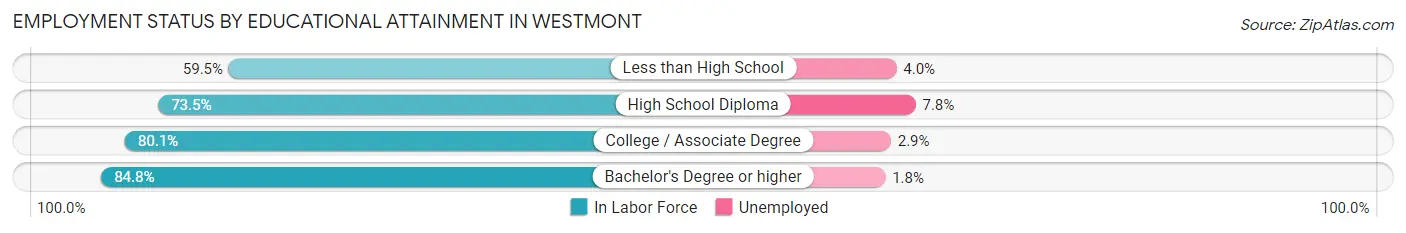
| Educational Attainment | In Labor Force | Unemployed |
| Less than High School | 322 (59.5%) | 22 (4.0%) |
| High School Diploma | 1,711 (73.5%) | 182 (7.8%) |
| College / Associate Degree | 2,794 (80.1%) | 101 (2.9%) |
| Bachelor's Degree or higher | 5,665 (84.8%) | 120 (1.8%) |
| Total | 10,496 (80.5%) | 404 (3.1%) |
Employment Occupations by Sex in Westmont
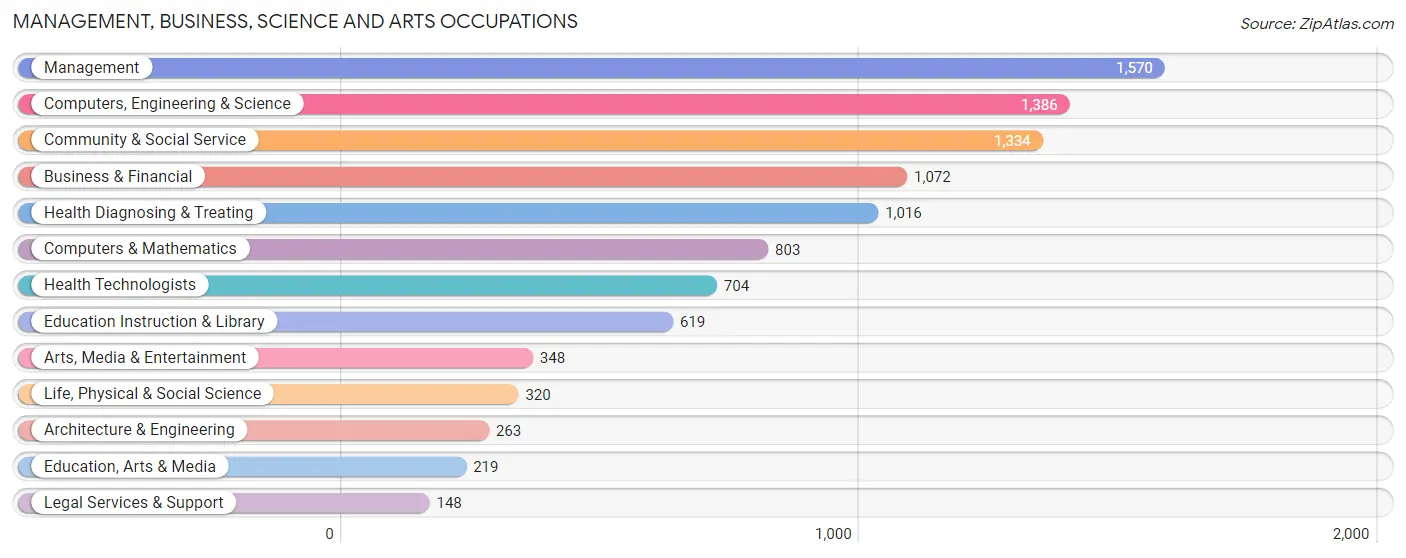
Management, Business, Science and Arts Occupations
The most common Management, Business, Science and Arts occupations in Westmont are Management (1,570 | 12.6%), Computers, Engineering & Science (1,386 | 11.1%), Community & Social Service (1,334 | 10.7%), Business & Financial (1,072 | 8.6%), and Health Diagnosing & Treating (1,016 | 8.1%).
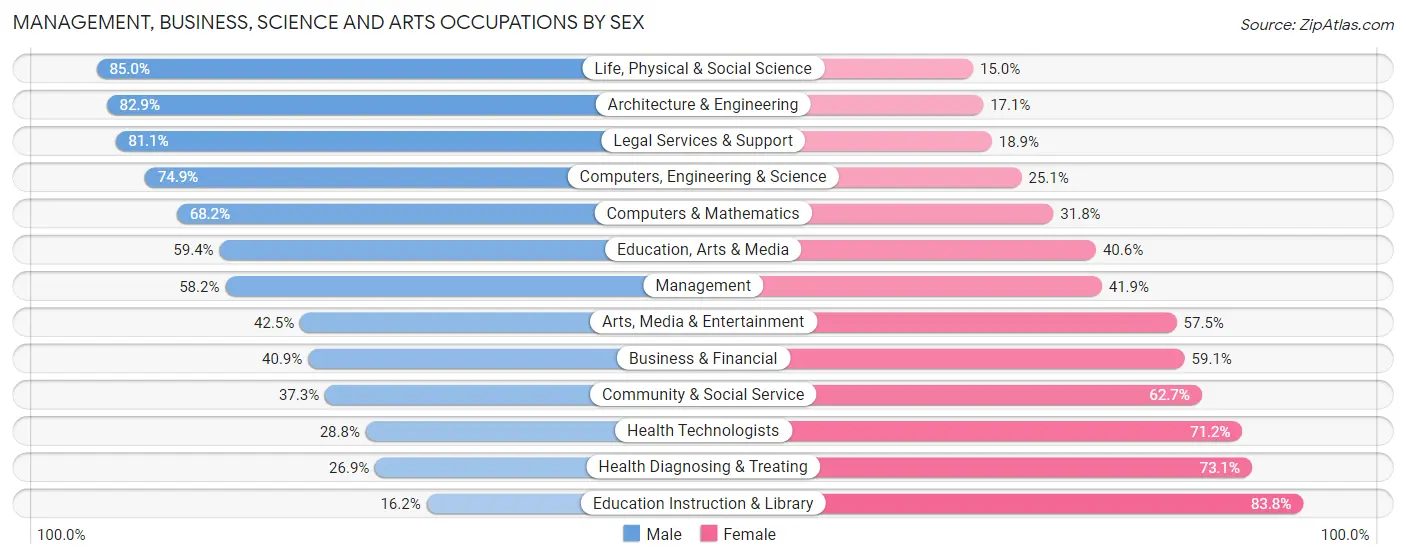
Management, Business, Science and Arts Occupations by Sex
Within the Management, Business, Science and Arts occupations in Westmont, the most male-oriented occupations are Life, Physical & Social Science (85.0%), Architecture & Engineering (82.9%), and Legal Services & Support (81.1%), while the most female-oriented occupations are Education Instruction & Library (83.8%), Health Diagnosing & Treating (73.1%), and Health Technologists (71.2%).
| Occupation | Male | Female |
| Management | 913 (58.2%) | 657 (41.8%) |
| Business & Financial | 438 (40.9%) | 634 (59.1%) |
| Computers, Engineering & Science | 1,038 (74.9%) | 348 (25.1%) |
| Computers & Mathematics | 548 (68.2%) | 255 (31.8%) |
| Architecture & Engineering | 218 (82.9%) | 45 (17.1%) |
| Life, Physical & Social Science | 272 (85.0%) | 48 (15.0%) |
| Community & Social Service | 498 (37.3%) | 836 (62.7%) |
| Education, Arts & Media | 130 (59.4%) | 89 (40.6%) |
| Legal Services & Support | 120 (81.1%) | 28 (18.9%) |
| Education Instruction & Library | 100 (16.2%) | 519 (83.8%) |
| Arts, Media & Entertainment | 148 (42.5%) | 200 (57.5%) |
| Health Diagnosing & Treating | 273 (26.9%) | 743 (73.1%) |
| Health Technologists | 203 (28.8%) | 501 (71.2%) |
| Total (Category) | 3,160 (49.5%) | 3,218 (50.4%) |
| Total (Overall) | 6,423 (51.4%) | 6,071 (48.6%) |
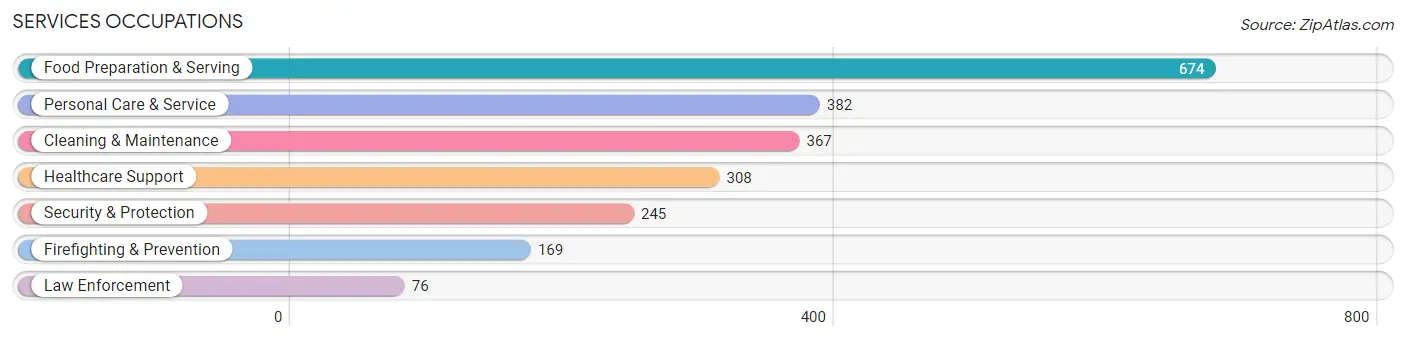
Services Occupations
The most common Services occupations in Westmont are Food Preparation & Serving (674 | 5.4%), Personal Care & Service (382 | 3.1%), Cleaning & Maintenance (367 | 2.9%), Healthcare Support (308 | 2.5%), and Security & Protection (245 | 2.0%).
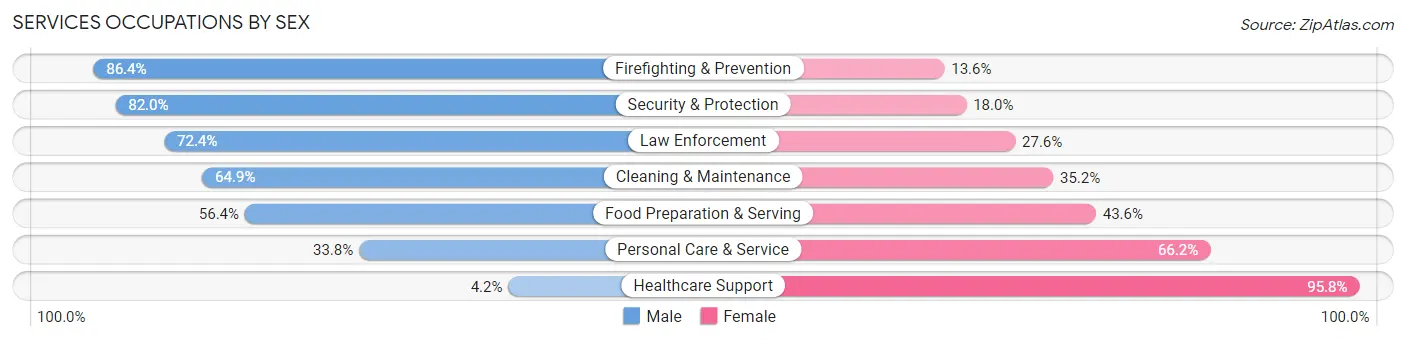
Services Occupations by Sex
Within the Services occupations in Westmont, the most male-oriented occupations are Firefighting & Prevention (86.4%), Security & Protection (82.0%), and Law Enforcement (72.4%), while the most female-oriented occupations are Healthcare Support (95.8%), Personal Care & Service (66.2%), and Food Preparation & Serving (43.6%).
| Occupation | Male | Female |
| Healthcare Support | 13 (4.2%) | 295 (95.8%) |
| Security & Protection | 201 (82.0%) | 44 (18.0%) |
| Firefighting & Prevention | 146 (86.4%) | 23 (13.6%) |
| Law Enforcement | 55 (72.4%) | 21 (27.6%) |
| Food Preparation & Serving | 380 (56.4%) | 294 (43.6%) |
| Cleaning & Maintenance | 238 (64.8%) | 129 (35.1%) |
| Personal Care & Service | 129 (33.8%) | 253 (66.2%) |
| Total (Category) | 961 (48.6%) | 1,015 (51.4%) |
| Total (Overall) | 6,423 (51.4%) | 6,071 (48.6%) |
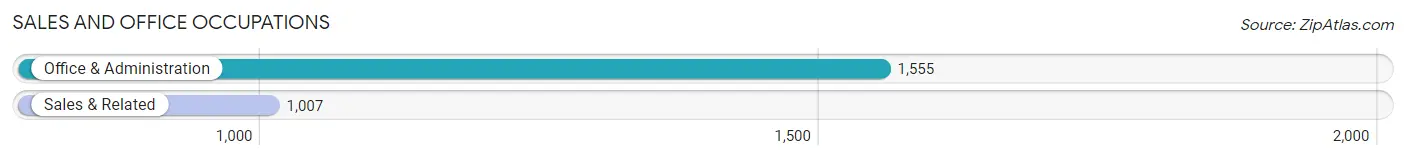
Sales and Office Occupations
The most common Sales and Office occupations in Westmont are Office & Administration (1,555 | 12.4%), and Sales & Related (1,007 | 8.1%).
Sales and Office Occupations by Sex
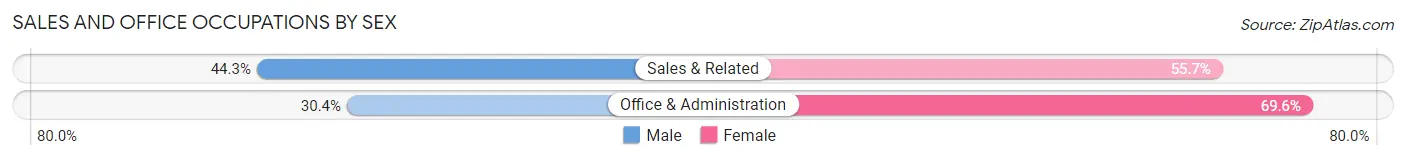
| Occupation | Male | Female |
| Sales & Related | 446 (44.3%) | 561 (55.7%) |
| Office & Administration | 473 (30.4%) | 1,082 (69.6%) |
| Total (Category) | 919 (35.9%) | 1,643 (64.1%) |
| Total (Overall) | 6,423 (51.4%) | 6,071 (48.6%) |
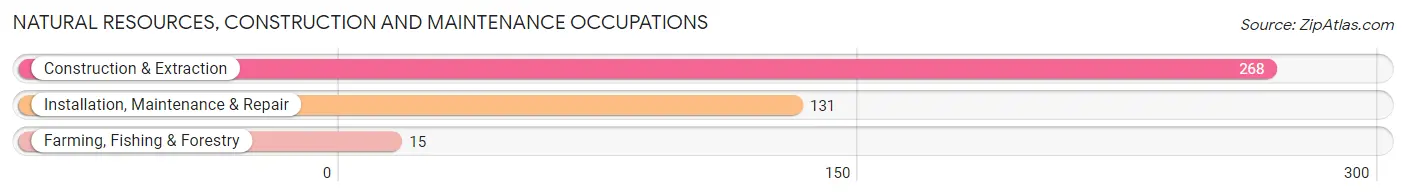
Natural Resources, Construction and Maintenance Occupations
The most common Natural Resources, Construction and Maintenance occupations in Westmont are Construction & Extraction (268 | 2.1%), Installation, Maintenance & Repair (131 | 1.1%), and Farming, Fishing & Forestry (15 | 0.1%).
Natural Resources, Construction and Maintenance Occupations by Sex
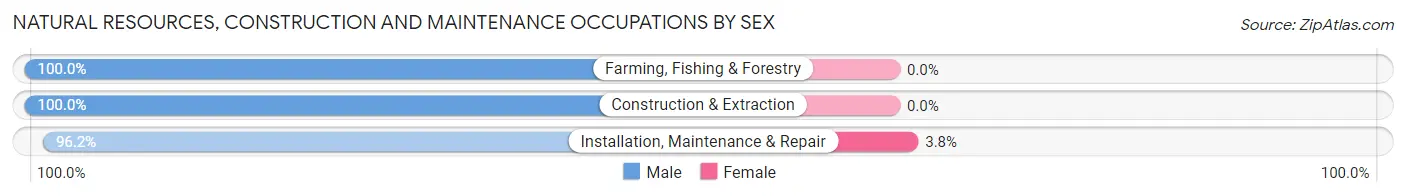
| Occupation | Male | Female |
| Farming, Fishing & Forestry | 15 (100.0%) | 0 (0.0%) |
| Construction & Extraction | 268 (100.0%) | 0 (0.0%) |
| Installation, Maintenance & Repair | 126 (96.2%) | 5 (3.8%) |
| Total (Category) | 409 (98.8%) | 5 (1.2%) |
| Total (Overall) | 6,423 (51.4%) | 6,071 (48.6%) |
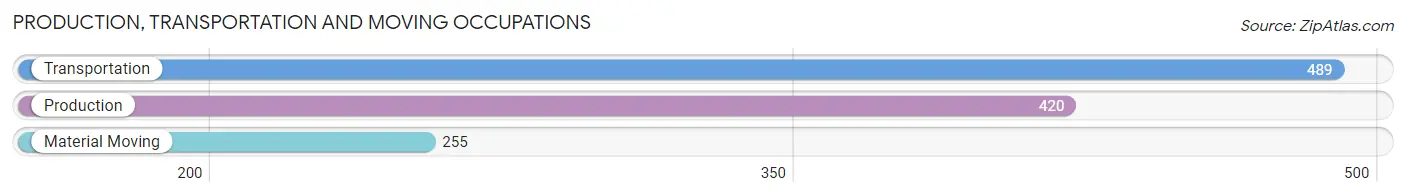
Production, Transportation and Moving Occupations
The most common Production, Transportation and Moving occupations in Westmont are Transportation (489 | 3.9%), Production (420 | 3.4%), and Material Moving (255 | 2.0%).
Production, Transportation and Moving Occupations by Sex
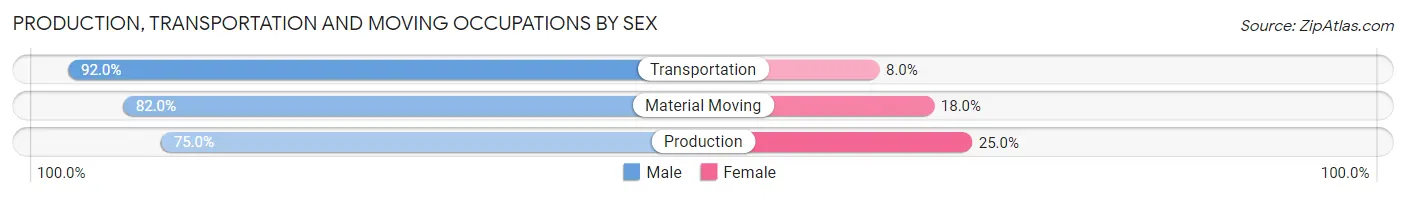
| Occupation | Male | Female |
| Production | 315 (75.0%) | 105 (25.0%) |
| Transportation | 450 (92.0%) | 39 (8.0%) |
| Material Moving | 209 (82.0%) | 46 (18.0%) |
| Total (Category) | 974 (83.7%) | 190 (16.3%) |
| Total (Overall) | 6,423 (51.4%) | 6,071 (48.6%) |
Employment Industries by Sex in Westmont
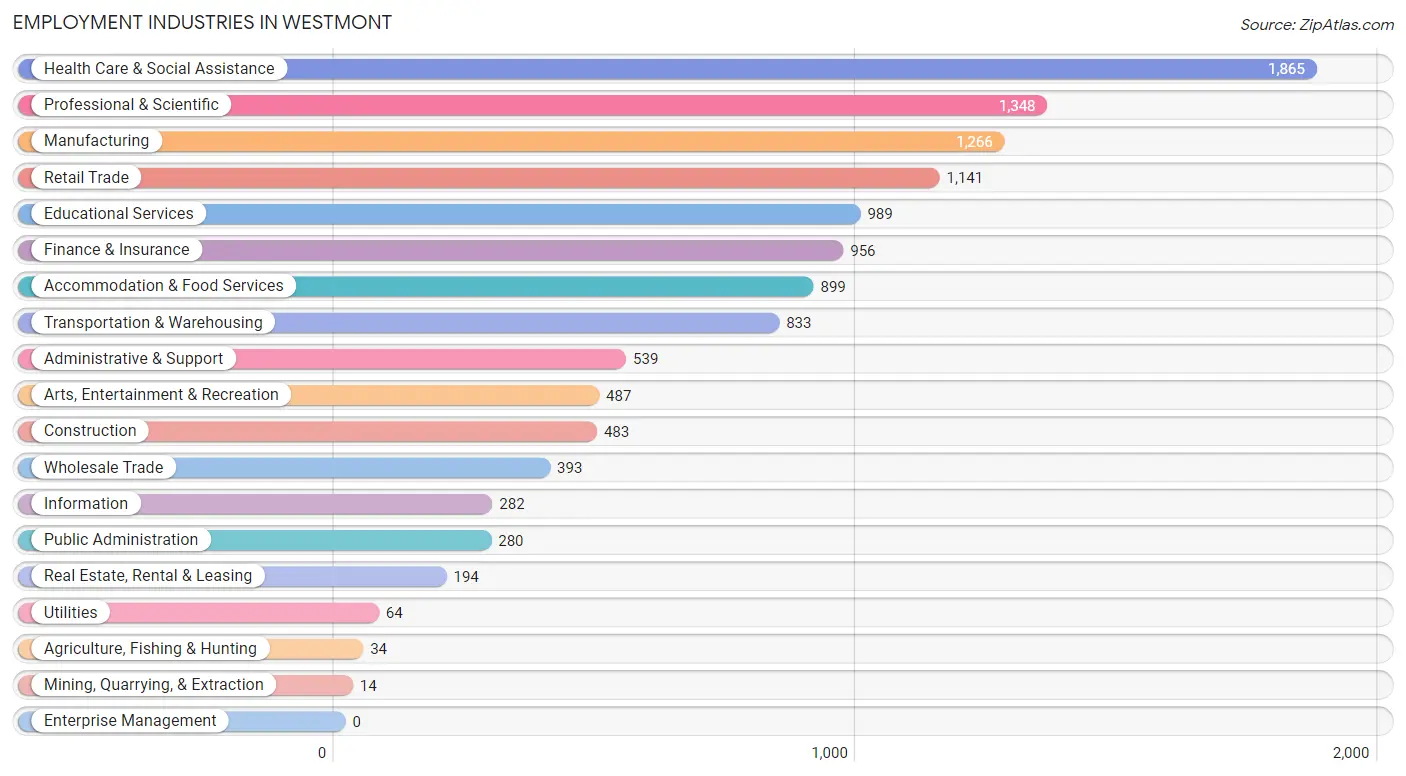
Employment Industries in Westmont
The major employment industries in Westmont include Health Care & Social Assistance (1,865 | 14.9%), Professional & Scientific (1,348 | 10.8%), Manufacturing (1,266 | 10.1%), Retail Trade (1,141 | 9.1%), and Educational Services (989 | 7.9%).
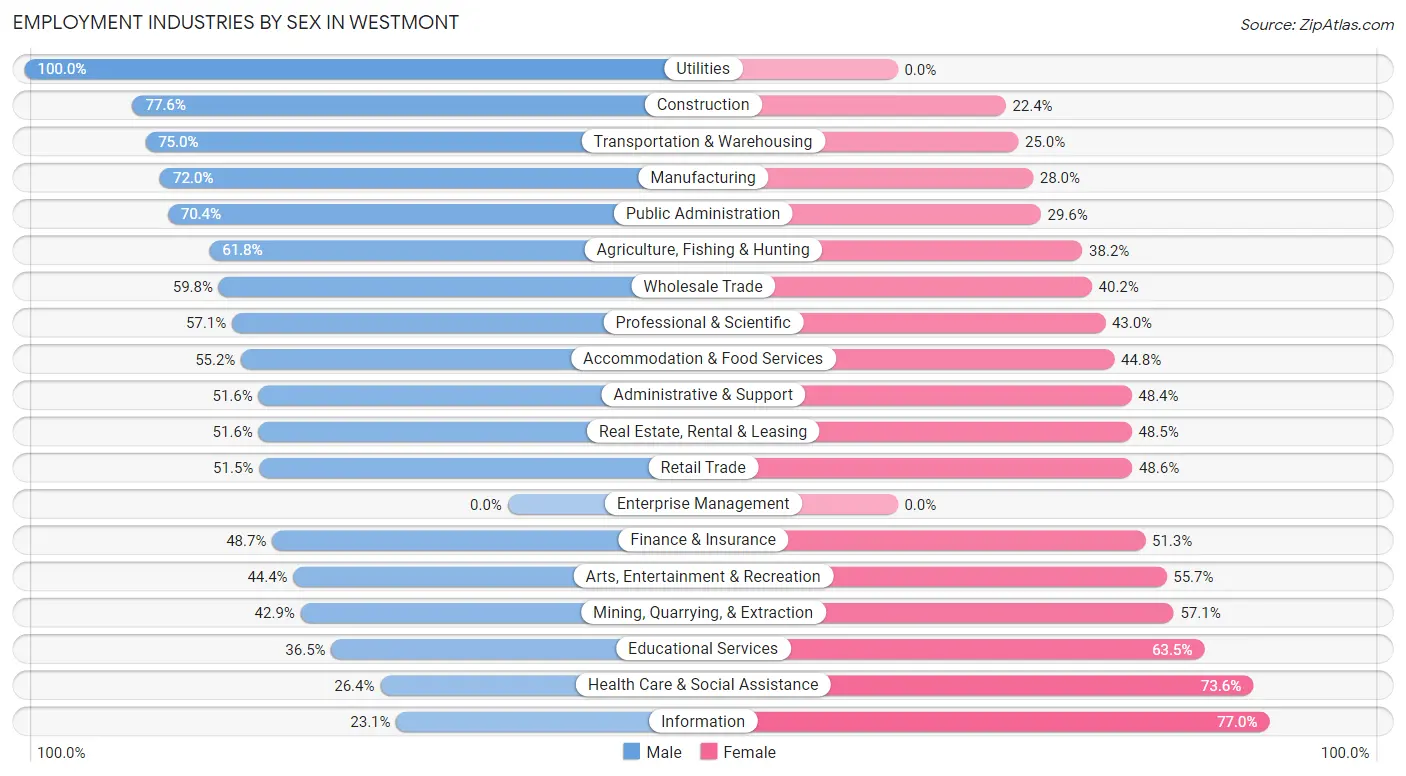
Employment Industries by Sex in Westmont
The Westmont industries that see more men than women are Utilities (100.0%), Construction (77.6%), and Transportation & Warehousing (75.0%), whereas the industries that tend to have a higher number of women are Information (76.9%), Health Care & Social Assistance (73.6%), and Educational Services (63.5%).
| Industry | Male | Female |
| Agriculture, Fishing & Hunting | 21 (61.8%) | 13 (38.2%) |
| Mining, Quarrying, & Extraction | 6 (42.9%) | 8 (57.1%) |
| Construction | 375 (77.6%) | 108 (22.4%) |
| Manufacturing | 911 (72.0%) | 355 (28.0%) |
| Wholesale Trade | 235 (59.8%) | 158 (40.2%) |
| Retail Trade | 587 (51.4%) | 554 (48.5%) |
| Transportation & Warehousing | 625 (75.0%) | 208 (25.0%) |
| Utilities | 64 (100.0%) | 0 (0.0%) |
| Information | 65 (23.1%) | 217 (76.9%) |
| Finance & Insurance | 466 (48.7%) | 490 (51.3%) |
| Real Estate, Rental & Leasing | 100 (51.5%) | 94 (48.4%) |
| Professional & Scientific | 769 (57.1%) | 579 (42.9%) |
| Enterprise Management | 0 (0.0%) | 0 (0.0%) |
| Administrative & Support | 278 (51.6%) | 261 (48.4%) |
| Educational Services | 361 (36.5%) | 628 (63.5%) |
| Health Care & Social Assistance | 492 (26.4%) | 1,373 (73.6%) |
| Arts, Entertainment & Recreation | 216 (44.4%) | 271 (55.6%) |
| Accommodation & Food Services | 496 (55.2%) | 403 (44.8%) |
| Public Administration | 197 (70.4%) | 83 (29.6%) |
| Total | 6,423 (51.4%) | 6,071 (48.6%) |
Education in Westmont
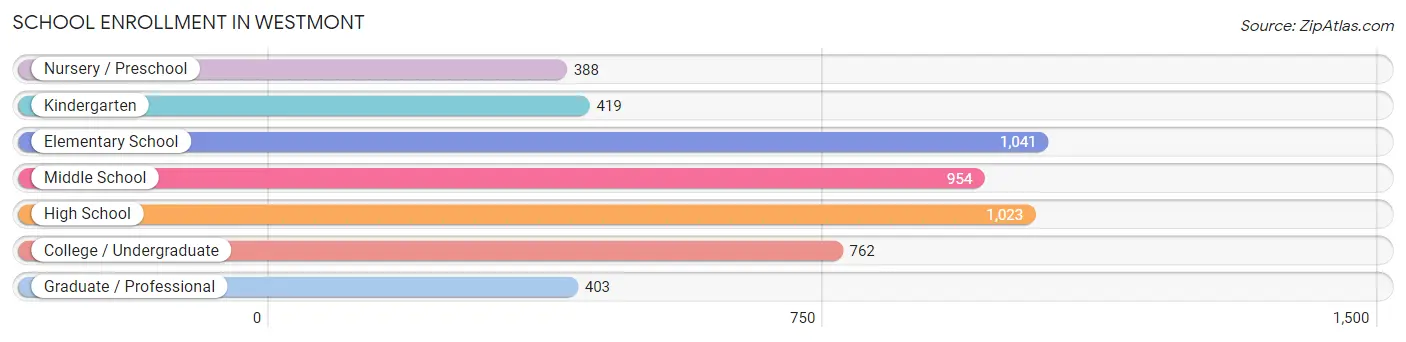
School Enrollment in Westmont
The most common levels of schooling among the 4,990 students in Westmont are elementary school (1,041 | 20.9%), high school (1,023 | 20.5%), and middle school (954 | 19.1%).
| School Level | # Students | % Students |
| Nursery / Preschool | 388 | 7.8% |
| Kindergarten | 419 | 8.4% |
| Elementary School | 1,041 | 20.9% |
| Middle School | 954 | 19.1% |
| High School | 1,023 | 20.5% |
| College / Undergraduate | 762 | 15.3% |
| Graduate / Professional | 403 | 8.1% |
| Total | 4,990 | 100.0% |
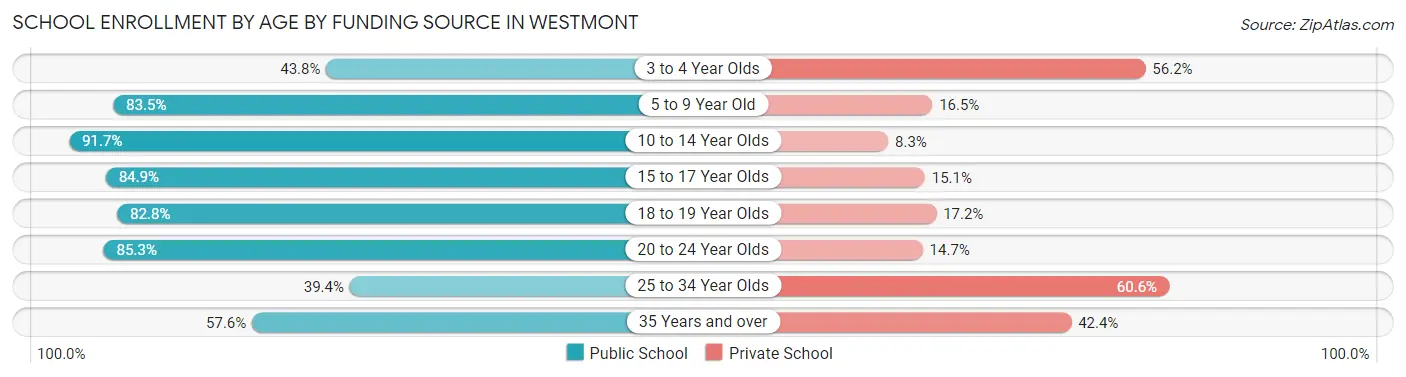
School Enrollment by Age by Funding Source in Westmont
Out of a total of 4,990 students who are enrolled in schools in Westmont, 1,123 (22.5%) attend a private institution, while the remaining 3,867 (77.5%) are enrolled in public schools. The age group of 25 to 34 year olds has the highest likelihood of being enrolled in private schools, with 255 (60.6% in the age bracket) enrolled. Conversely, the age group of 10 to 14 year olds has the lowest likelihood of being enrolled in a private school, with 1,020 (91.7% in the age bracket) attending a public institution.
| Age Bracket | Public School | Private School |
| 3 to 4 Year Olds | 166 (43.8%) | 213 (56.2%) |
| 5 to 9 Year Old | 1,190 (83.5%) | 235 (16.5%) |
| 10 to 14 Year Olds | 1,020 (91.7%) | 92 (8.3%) |
| 15 to 17 Year Olds | 590 (84.9%) | 105 (15.1%) |
| 18 to 19 Year Olds | 317 (82.8%) | 66 (17.2%) |
| 20 to 24 Year Olds | 261 (85.3%) | 45 (14.7%) |
| 25 to 34 Year Olds | 166 (39.4%) | 255 (60.6%) |
| 35 Years and over | 155 (57.6%) | 114 (42.4%) |
| Total | 3,867 (77.5%) | 1,123 (22.5%) |
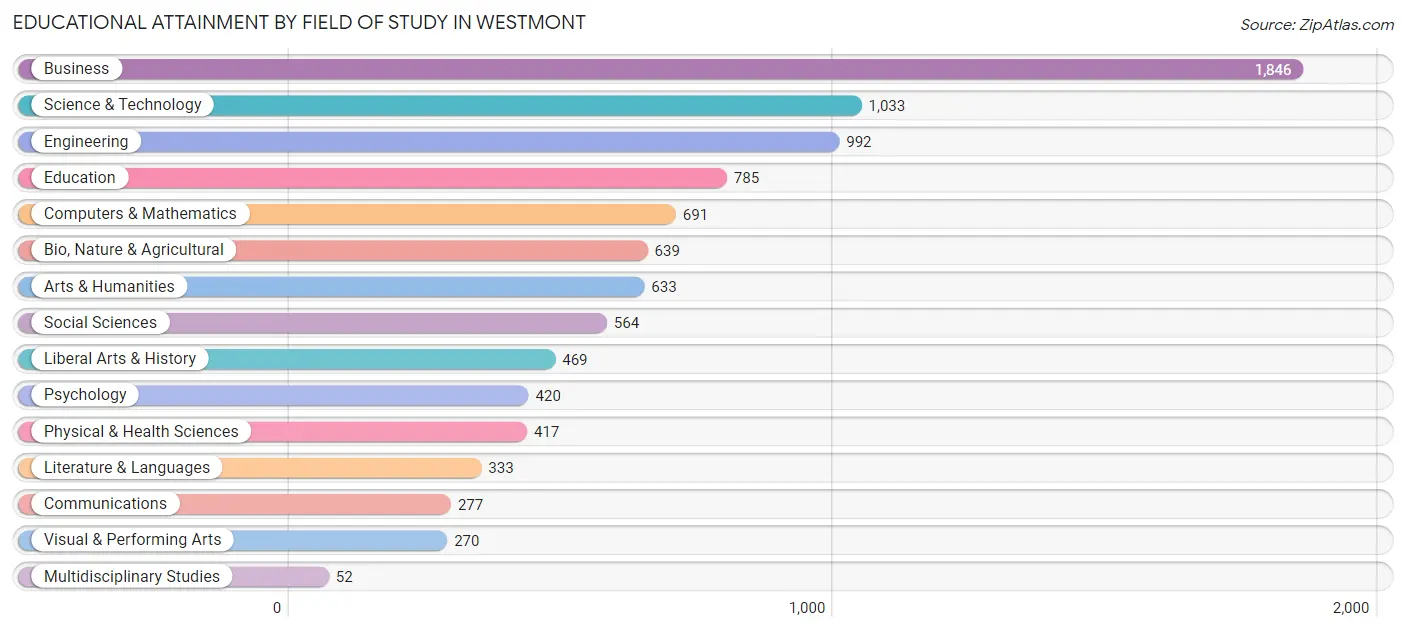
Educational Attainment by Field of Study in Westmont
Business (1,846 | 19.6%), science & technology (1,033 | 11.0%), engineering (992 | 10.5%), education (785 | 8.3%), and computers & mathematics (691 | 7.3%) are the most common fields of study among 9,421 individuals in Westmont who have obtained a bachelor's degree or higher.
| Field of Study | # Graduates | % Graduates |
| Computers & Mathematics | 691 | 7.3% |
| Bio, Nature & Agricultural | 639 | 6.8% |
| Physical & Health Sciences | 417 | 4.4% |
| Psychology | 420 | 4.5% |
| Social Sciences | 564 | 6.0% |
| Engineering | 992 | 10.5% |
| Multidisciplinary Studies | 52 | 0.5% |
| Science & Technology | 1,033 | 11.0% |
| Business | 1,846 | 19.6% |
| Education | 785 | 8.3% |
| Literature & Languages | 333 | 3.5% |
| Liberal Arts & History | 469 | 5.0% |
| Visual & Performing Arts | 270 | 2.9% |
| Communications | 277 | 2.9% |
| Arts & Humanities | 633 | 6.7% |
| Total | 9,421 | 100.0% |
Transportation & Commute in Westmont
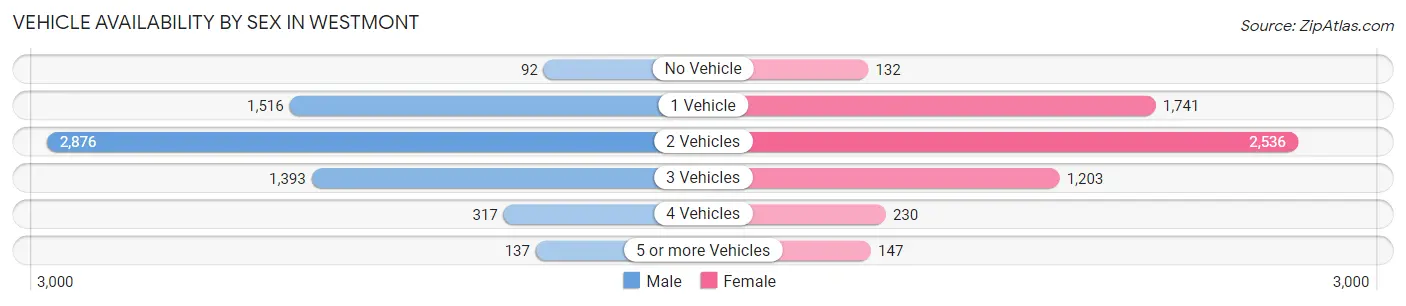
Vehicle Availability by Sex in Westmont
The most prevalent vehicle ownership categories in Westmont are males with 2 vehicles (2,876, accounting for 45.4%) and females with 2 vehicles (2,536, making up 48.0%).
| Vehicles Available | Male | Female |
| No Vehicle | 92 (1.5%) | 132 (2.2%) |
| 1 Vehicle | 1,516 (23.9%) | 1,741 (29.1%) |
| 2 Vehicles | 2,876 (45.4%) | 2,536 (42.3%) |
| 3 Vehicles | 1,393 (22.0%) | 1,203 (20.1%) |
| 4 Vehicles | 317 (5.0%) | 230 (3.8%) |
| 5 or more Vehicles | 137 (2.2%) | 147 (2.5%) |
| Total | 6,331 (100.0%) | 5,989 (100.0%) |
Commute Time in Westmont
The most frequently occuring commute durations in Westmont are 15 to 19 minutes (2,202 commuters, 21.4%), 30 to 34 minutes (1,615 commuters, 15.7%), and 20 to 24 minutes (1,167 commuters, 11.3%).
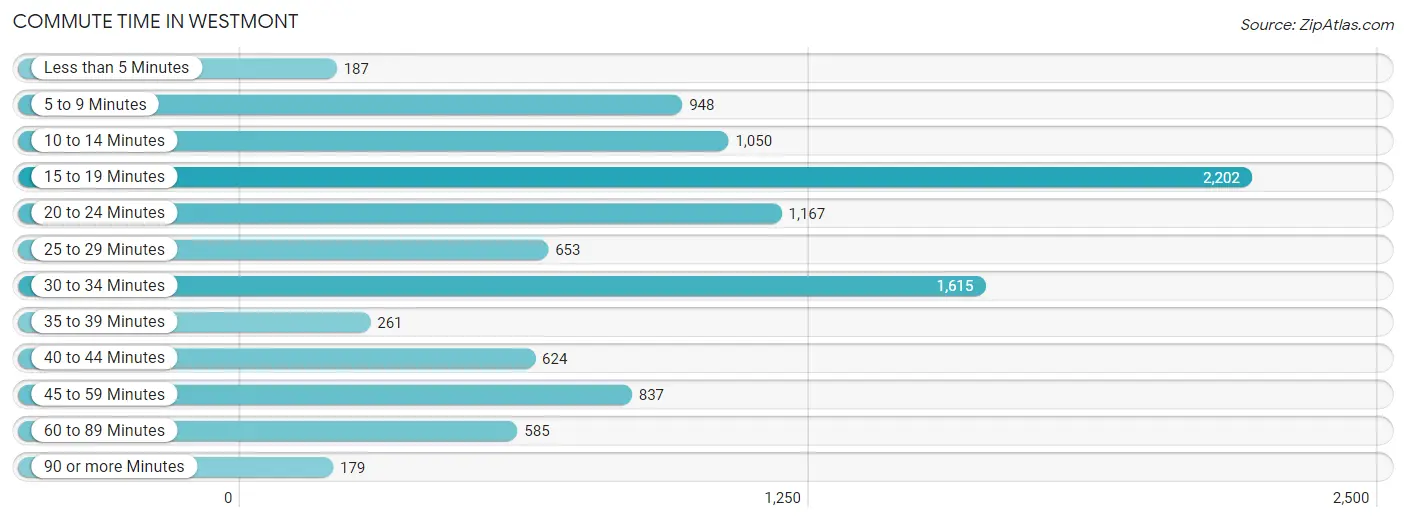
| Commute Time | # Commuters | % Commuters |
| Less than 5 Minutes | 187 | 1.8% |
| 5 to 9 Minutes | 948 | 9.2% |
| 10 to 14 Minutes | 1,050 | 10.2% |
| 15 to 19 Minutes | 2,202 | 21.4% |
| 20 to 24 Minutes | 1,167 | 11.3% |
| 25 to 29 Minutes | 653 | 6.3% |
| 30 to 34 Minutes | 1,615 | 15.7% |
| 35 to 39 Minutes | 261 | 2.5% |
| 40 to 44 Minutes | 624 | 6.0% |
| 45 to 59 Minutes | 837 | 8.1% |
| 60 to 89 Minutes | 585 | 5.7% |
| 90 or more Minutes | 179 | 1.7% |
Commute Time by Sex in Westmont
The most common commute times in Westmont are 30 to 34 minutes (964 commuters, 18.1%) for males and 15 to 19 minutes (1,369 commuters, 27.5%) for females.
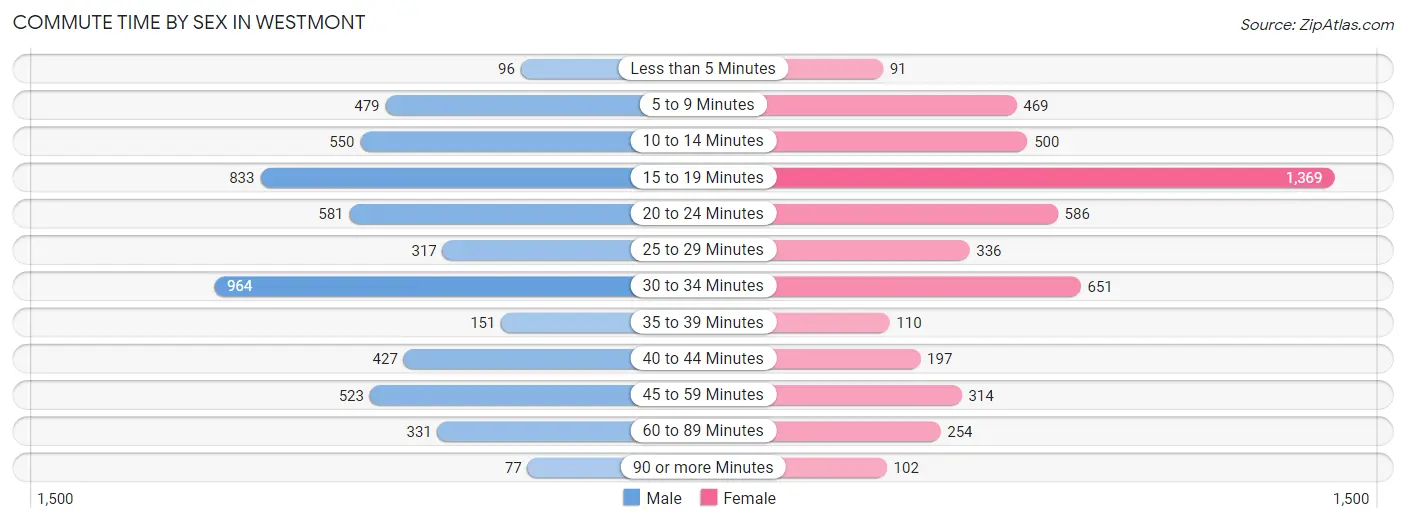
| Commute Time | Male | Female |
| Less than 5 Minutes | 96 (1.8%) | 91 (1.8%) |
| 5 to 9 Minutes | 479 (9.0%) | 469 (9.4%) |
| 10 to 14 Minutes | 550 (10.3%) | 500 (10.0%) |
| 15 to 19 Minutes | 833 (15.6%) | 1,369 (27.5%) |
| 20 to 24 Minutes | 581 (10.9%) | 586 (11.8%) |
| 25 to 29 Minutes | 317 (5.9%) | 336 (6.8%) |
| 30 to 34 Minutes | 964 (18.1%) | 651 (13.1%) |
| 35 to 39 Minutes | 151 (2.8%) | 110 (2.2%) |
| 40 to 44 Minutes | 427 (8.0%) | 197 (4.0%) |
| 45 to 59 Minutes | 523 (9.8%) | 314 (6.3%) |
| 60 to 89 Minutes | 331 (6.2%) | 254 (5.1%) |
| 90 or more Minutes | 77 (1.4%) | 102 (2.1%) |
Time of Departure to Work by Sex in Westmont
The most frequent times of departure to work in Westmont are 7:00 AM to 7:29 AM (822, 15.4%) for males and 7:00 AM to 7:29 AM (889, 17.8%) for females.
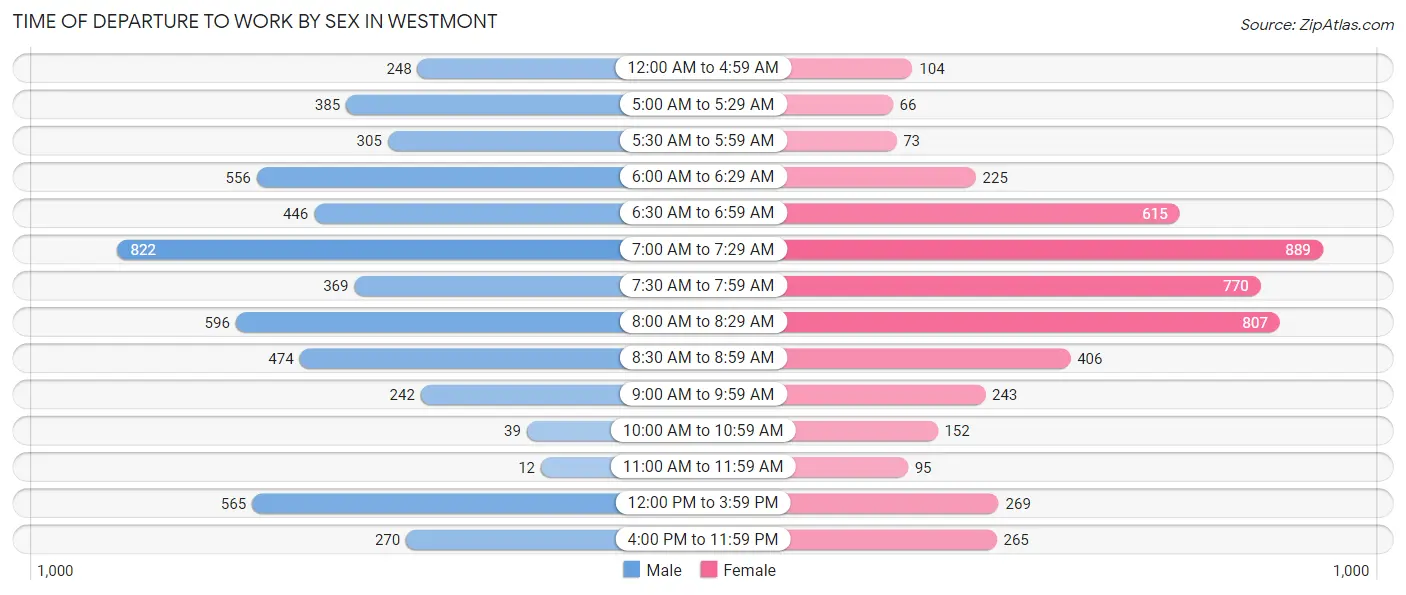
| Time of Departure | Male | Female |
| 12:00 AM to 4:59 AM | 248 (4.6%) | 104 (2.1%) |
| 5:00 AM to 5:29 AM | 385 (7.2%) | 66 (1.3%) |
| 5:30 AM to 5:59 AM | 305 (5.7%) | 73 (1.5%) |
| 6:00 AM to 6:29 AM | 556 (10.4%) | 225 (4.5%) |
| 6:30 AM to 6:59 AM | 446 (8.4%) | 615 (12.3%) |
| 7:00 AM to 7:29 AM | 822 (15.4%) | 889 (17.8%) |
| 7:30 AM to 7:59 AM | 369 (6.9%) | 770 (15.5%) |
| 8:00 AM to 8:29 AM | 596 (11.2%) | 807 (16.2%) |
| 8:30 AM to 8:59 AM | 474 (8.9%) | 406 (8.2%) |
| 9:00 AM to 9:59 AM | 242 (4.5%) | 243 (4.9%) |
| 10:00 AM to 10:59 AM | 39 (0.7%) | 152 (3.0%) |
| 11:00 AM to 11:59 AM | 12 (0.2%) | 95 (1.9%) |
| 12:00 PM to 3:59 PM | 565 (10.6%) | 269 (5.4%) |
| 4:00 PM to 11:59 PM | 270 (5.1%) | 265 (5.3%) |
| Total | 5,329 (100.0%) | 4,979 (100.0%) |
Housing Occupancy in Westmont
Occupancy by Ownership in Westmont
Of the total 10,336 dwellings in Westmont, owner-occupied units account for 5,404 (52.3%), while renter-occupied units make up 4,932 (47.7%).
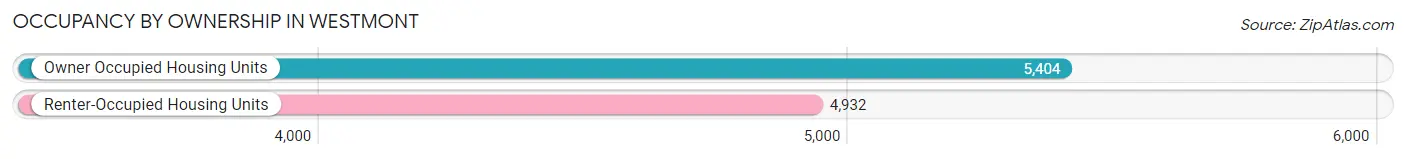
| Occupancy | # Housing Units | % Housing Units |
| Owner Occupied Housing Units | 5,404 | 52.3% |
| Renter-Occupied Housing Units | 4,932 | 47.7% |
| Total Occupied Housing Units | 10,336 | 100.0% |
Occupancy by Household Size in Westmont
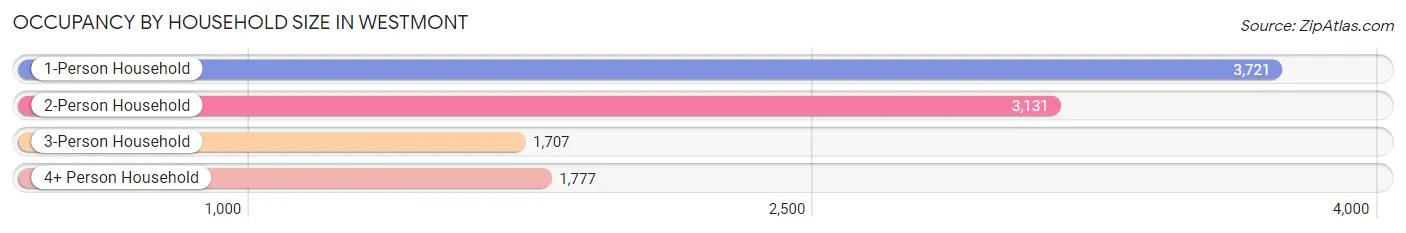
| Household Size | # Housing Units | % Housing Units |
| 1-Person Household | 3,721 | 36.0% |
| 2-Person Household | 3,131 | 30.3% |
| 3-Person Household | 1,707 | 16.5% |
| 4+ Person Household | 1,777 | 17.2% |
| Total Housing Units | 10,336 | 100.0% |
Occupancy by Ownership by Household Size in Westmont
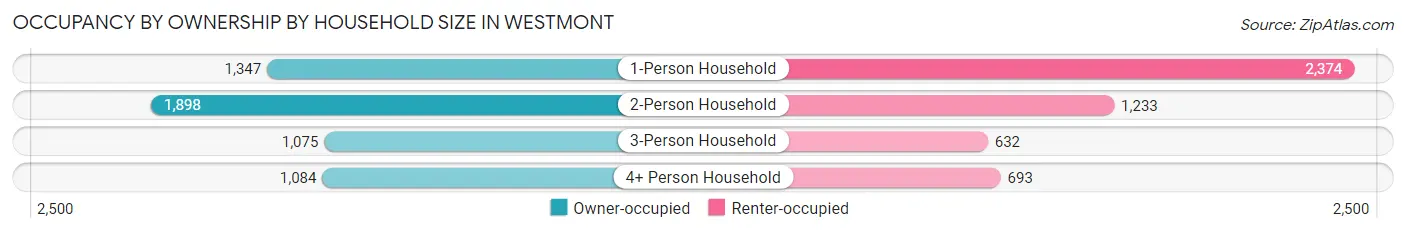
| Household Size | Owner-occupied | Renter-occupied |
| 1-Person Household | 1,347 (36.2%) | 2,374 (63.8%) |
| 2-Person Household | 1,898 (60.6%) | 1,233 (39.4%) |
| 3-Person Household | 1,075 (63.0%) | 632 (37.0%) |
| 4+ Person Household | 1,084 (61.0%) | 693 (39.0%) |
| Total Housing Units | 5,404 (52.3%) | 4,932 (47.7%) |
Occupancy by Educational Attainment in Westmont
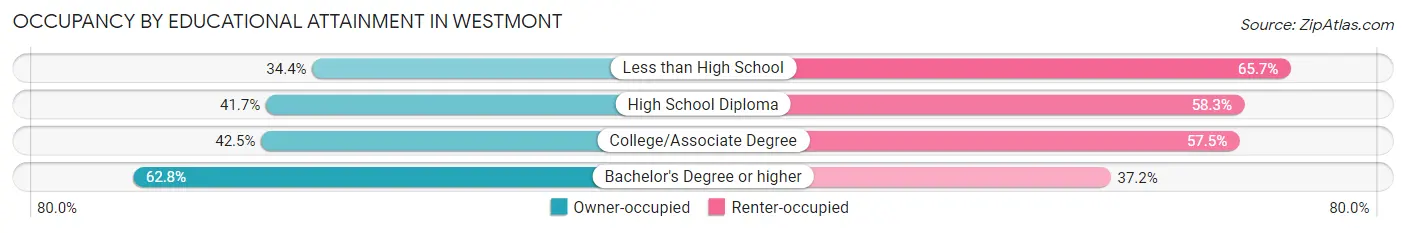
| Household Size | Owner-occupied | Renter-occupied |
| Less than High School | 146 (34.4%) | 279 (65.6%) |
| High School Diploma | 926 (41.7%) | 1,294 (58.3%) |
| College/Associate Degree | 1,041 (42.5%) | 1,411 (57.5%) |
| Bachelor's Degree or higher | 3,291 (62.8%) | 1,948 (37.2%) |
Occupancy by Age of Householder in Westmont
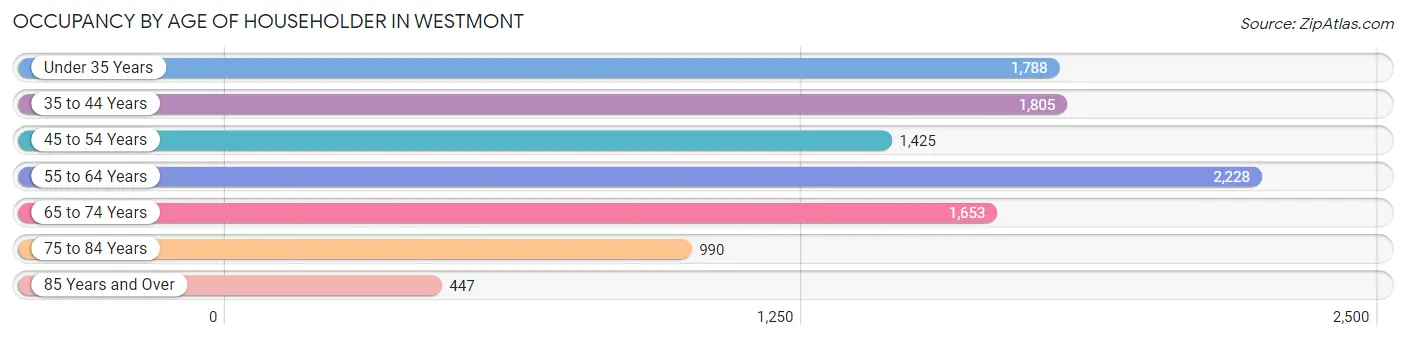
| Age Bracket | # Households | % Households |
| Under 35 Years | 1,788 | 17.3% |
| 35 to 44 Years | 1,805 | 17.5% |
| 45 to 54 Years | 1,425 | 13.8% |
| 55 to 64 Years | 2,228 | 21.6% |
| 65 to 74 Years | 1,653 | 16.0% |
| 75 to 84 Years | 990 | 9.6% |
| 85 Years and Over | 447 | 4.3% |
| Total | 10,336 | 100.0% |
Housing Finances in Westmont
Median Income by Occupancy in Westmont
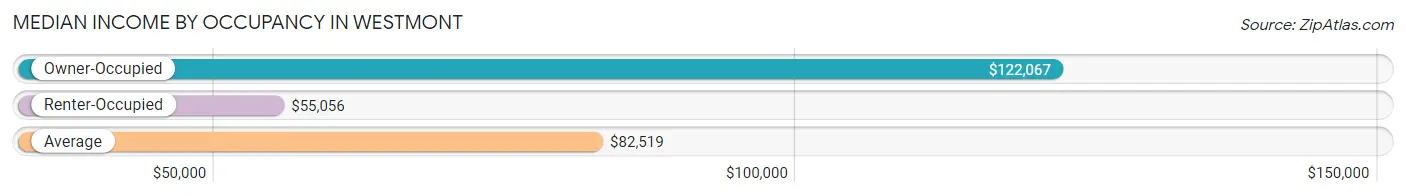
| Occupancy Type | # Households | Median Income |
| Owner-Occupied | 5,404 (52.3%) | $122,067 |
| Renter-Occupied | 4,932 (47.7%) | $55,056 |
| Average | 10,336 (100.0%) | $82,519 |
Occupancy by Householder Income Bracket in Westmont
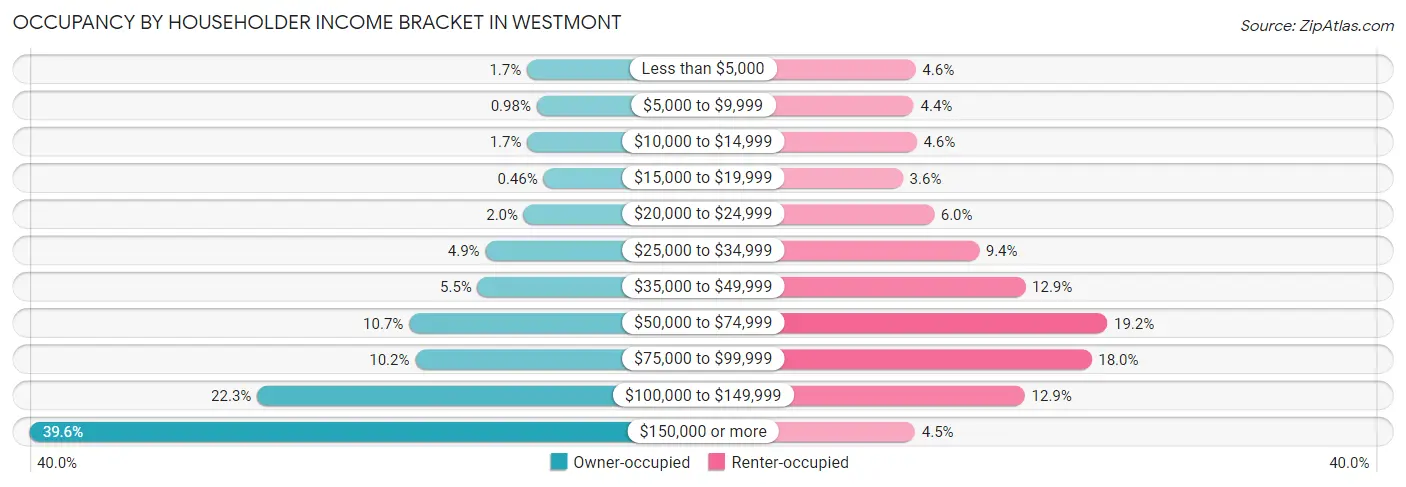
| Income Bracket | Owner-occupied | Renter-occupied |
| Less than $5,000 | 93 (1.7%) | 225 (4.6%) |
| $5,000 to $9,999 | 53 (1.0%) | 218 (4.4%) |
| $10,000 to $14,999 | 92 (1.7%) | 229 (4.6%) |
| $15,000 to $19,999 | 25 (0.5%) | 177 (3.6%) |
| $20,000 to $24,999 | 106 (2.0%) | 294 (6.0%) |
| $25,000 to $34,999 | 264 (4.9%) | 463 (9.4%) |
| $35,000 to $49,999 | 296 (5.5%) | 637 (12.9%) |
| $50,000 to $74,999 | 578 (10.7%) | 945 (19.2%) |
| $75,000 to $99,999 | 553 (10.2%) | 886 (18.0%) |
| $100,000 to $149,999 | 1,204 (22.3%) | 635 (12.9%) |
| $150,000 or more | 2,140 (39.6%) | 223 (4.5%) |
| Total | 5,404 (100.0%) | 4,932 (100.0%) |
Monthly Housing Cost Tiers in Westmont
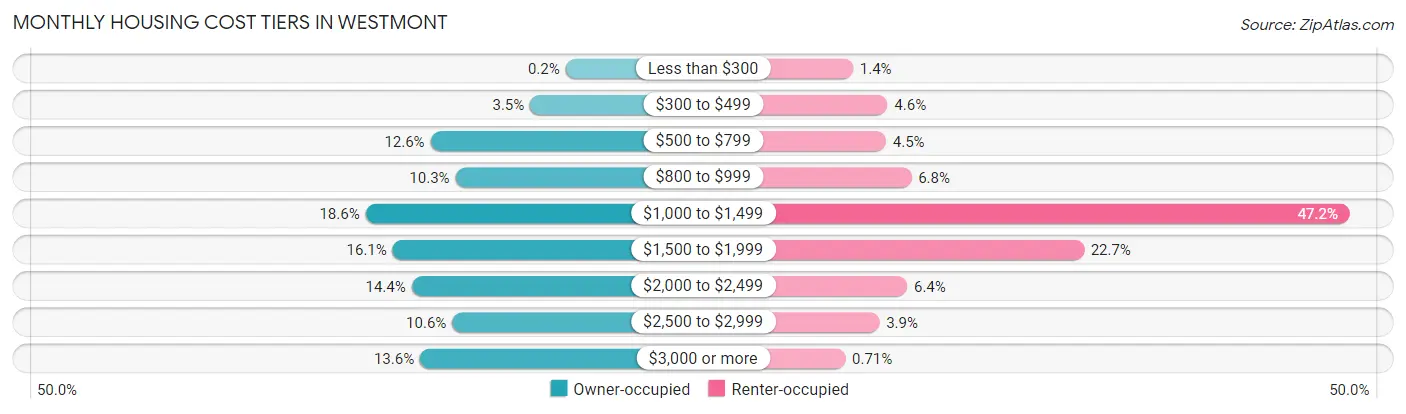
| Monthly Cost | Owner-occupied | Renter-occupied |
| Less than $300 | 11 (0.2%) | 70 (1.4%) |
| $300 to $499 | 187 (3.5%) | 227 (4.6%) |
| $500 to $799 | 683 (12.6%) | 220 (4.5%) |
| $800 to $999 | 559 (10.3%) | 335 (6.8%) |
| $1,000 to $1,499 | 1,006 (18.6%) | 2,326 (47.2%) |
| $1,500 to $1,999 | 871 (16.1%) | 1,118 (22.7%) |
| $2,000 to $2,499 | 777 (14.4%) | 316 (6.4%) |
| $2,500 to $2,999 | 575 (10.6%) | 190 (3.8%) |
| $3,000 or more | 735 (13.6%) | 35 (0.7%) |
| Total | 5,404 (100.0%) | 4,932 (100.0%) |
Physical Housing Characteristics in Westmont
Housing Structures in Westmont
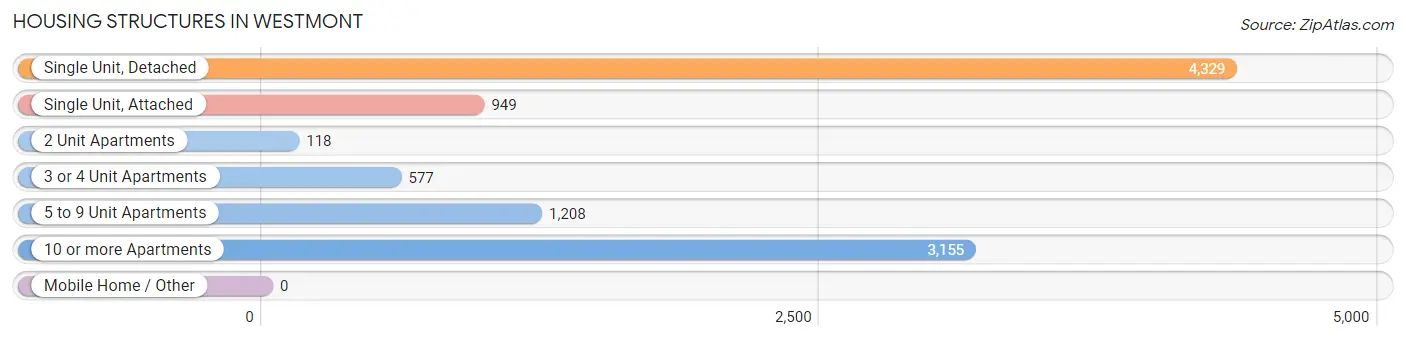
| Structure Type | # Housing Units | % Housing Units |
| Single Unit, Detached | 4,329 | 41.9% |
| Single Unit, Attached | 949 | 9.2% |
| 2 Unit Apartments | 118 | 1.1% |
| 3 or 4 Unit Apartments | 577 | 5.6% |
| 5 to 9 Unit Apartments | 1,208 | 11.7% |
| 10 or more Apartments | 3,155 | 30.5% |
| Mobile Home / Other | 0 | 0.0% |
| Total | 10,336 | 100.0% |
Housing Structures by Occupancy in Westmont
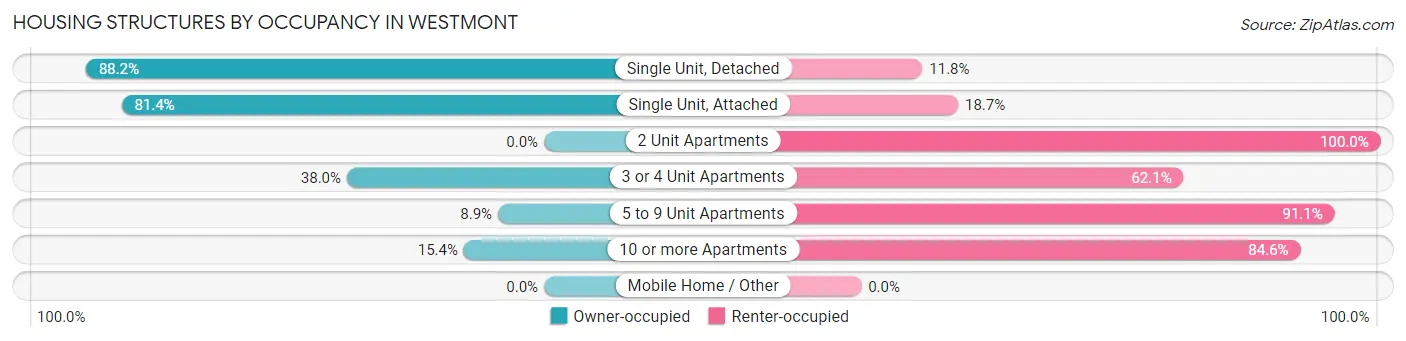
| Structure Type | Owner-occupied | Renter-occupied |
| Single Unit, Detached | 3,819 (88.2%) | 510 (11.8%) |
| Single Unit, Attached | 772 (81.4%) | 177 (18.6%) |
| 2 Unit Apartments | 0 (0.0%) | 118 (100.0%) |
| 3 or 4 Unit Apartments | 219 (38.0%) | 358 (62.1%) |
| 5 to 9 Unit Apartments | 107 (8.9%) | 1,101 (91.1%) |
| 10 or more Apartments | 487 (15.4%) | 2,668 (84.6%) |
| Mobile Home / Other | 0 (0.0%) | 0 (0.0%) |
| Total | 5,404 (52.3%) | 4,932 (47.7%) |
Housing Structures by Number of Rooms in Westmont
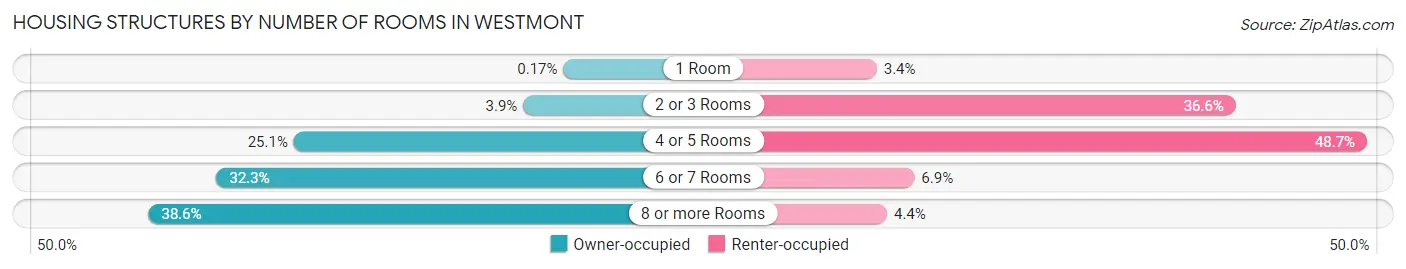
| Number of Rooms | Owner-occupied | Renter-occupied |
| 1 Room | 9 (0.2%) | 168 (3.4%) |
| 2 or 3 Rooms | 210 (3.9%) | 1,805 (36.6%) |
| 4 or 5 Rooms | 1,357 (25.1%) | 2,404 (48.7%) |
| 6 or 7 Rooms | 1,744 (32.3%) | 340 (6.9%) |
| 8 or more Rooms | 2,084 (38.6%) | 215 (4.4%) |
| Total | 5,404 (100.0%) | 4,932 (100.0%) |
Housing Structure by Heating Type in Westmont
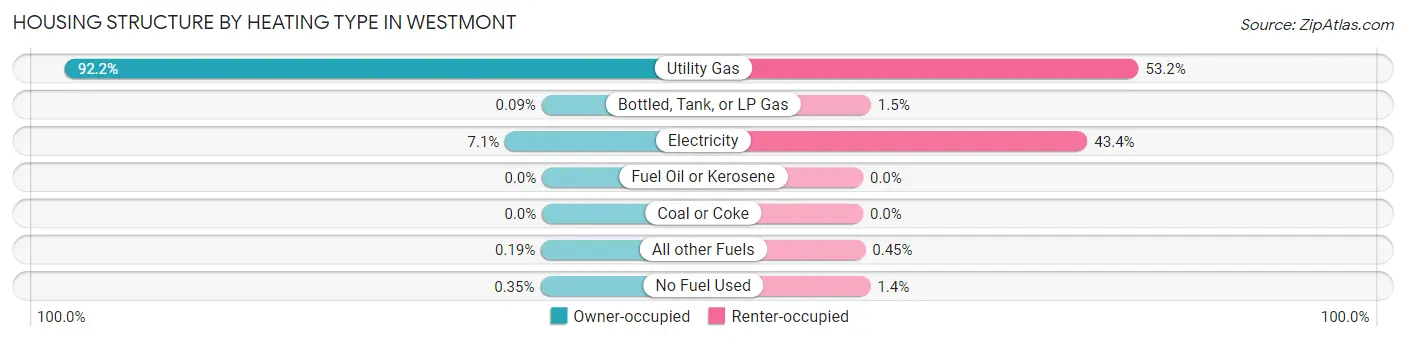
| Heating Type | Owner-occupied | Renter-occupied |
| Utility Gas | 4,984 (92.2%) | 2,626 (53.2%) |
| Bottled, Tank, or LP Gas | 5 (0.1%) | 75 (1.5%) |
| Electricity | 386 (7.1%) | 2,138 (43.3%) |
| Fuel Oil or Kerosene | 0 (0.0%) | 0 (0.0%) |
| Coal or Coke | 0 (0.0%) | 0 (0.0%) |
| All other Fuels | 10 (0.2%) | 22 (0.4%) |
| No Fuel Used | 19 (0.4%) | 71 (1.4%) |
| Total | 5,404 (100.0%) | 4,932 (100.0%) |
Household Vehicle Usage in Westmont
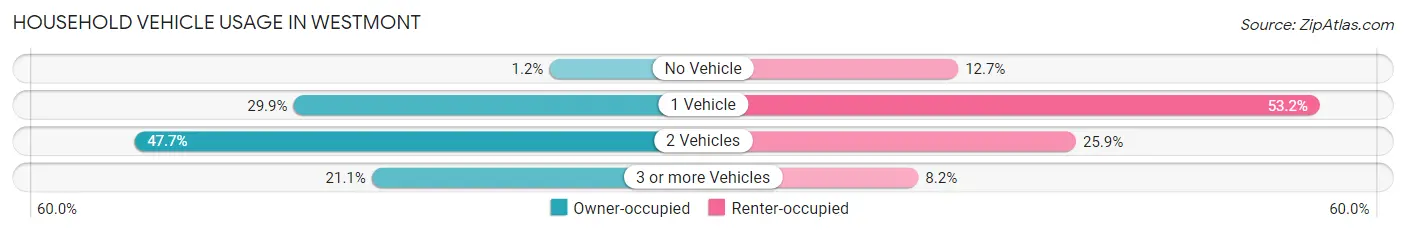
| Vehicles per Household | Owner-occupied | Renter-occupied |
| No Vehicle | 67 (1.2%) | 626 (12.7%) |
| 1 Vehicle | 1,616 (29.9%) | 2,623 (53.2%) |
| 2 Vehicles | 2,579 (47.7%) | 1,277 (25.9%) |
| 3 or more Vehicles | 1,142 (21.1%) | 406 (8.2%) |
| Total | 5,404 (100.0%) | 4,932 (100.0%) |
Real Estate & Mortgages in Westmont
Real Estate and Mortgage Overview in Westmont
| Characteristic | Without Mortgage | With Mortgage |
| Housing Units | 2,128 | 3,276 |
| Median Property Value | $328,400 | $382,900 |
| Median Household Income | $91,273 | $1,508 |
| Monthly Housing Costs | $876 | $728 |
| Real Estate Taxes | $6,137 | $48 |
Property Value by Mortgage Status in Westmont
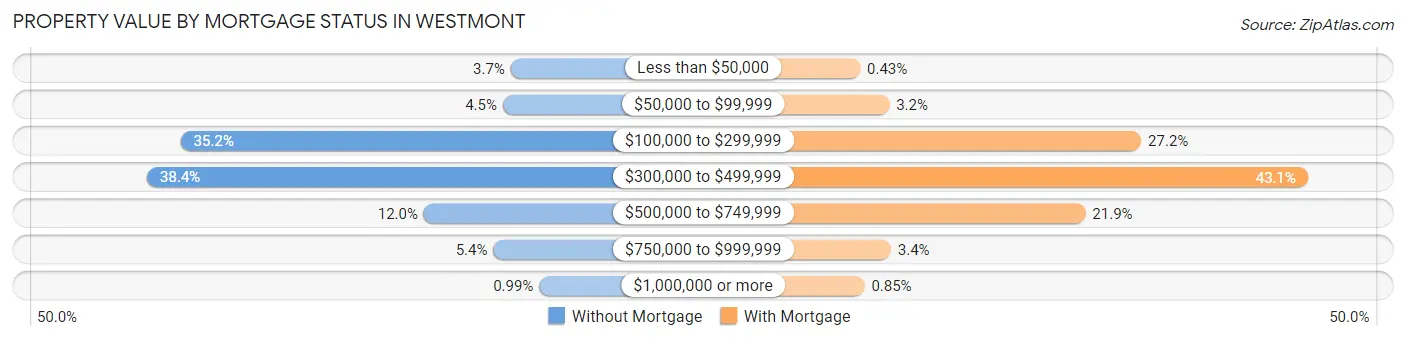
| Property Value | Without Mortgage | With Mortgage |
| Less than $50,000 | 79 (3.7%) | 14 (0.4%) |
| $50,000 to $99,999 | 95 (4.5%) | 105 (3.2%) |
| $100,000 to $299,999 | 748 (35.1%) | 891 (27.2%) |
| $300,000 to $499,999 | 816 (38.4%) | 1,411 (43.1%) |
| $500,000 to $749,999 | 255 (12.0%) | 717 (21.9%) |
| $750,000 to $999,999 | 114 (5.4%) | 110 (3.4%) |
| $1,000,000 or more | 21 (1.0%) | 28 (0.9%) |
| Total | 2,128 (100.0%) | 3,276 (100.0%) |
Household Income by Mortgage Status in Westmont
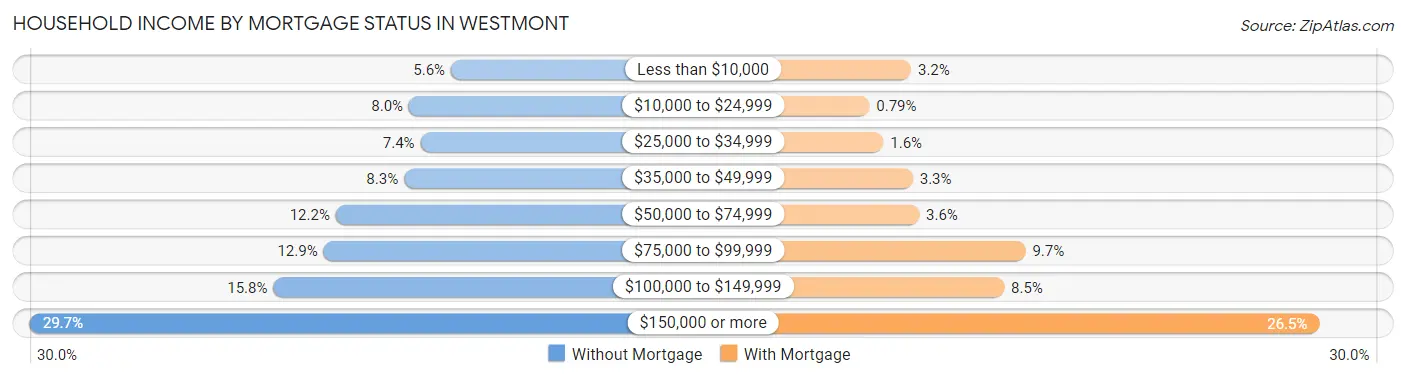
| Household Income | Without Mortgage | With Mortgage |
| Less than $10,000 | 120 (5.6%) | 104 (3.2%) |
| $10,000 to $24,999 | 171 (8.0%) | 26 (0.8%) |
| $25,000 to $34,999 | 157 (7.4%) | 52 (1.6%) |
| $35,000 to $49,999 | 177 (8.3%) | 107 (3.3%) |
| $50,000 to $74,999 | 260 (12.2%) | 119 (3.6%) |
| $75,000 to $99,999 | 275 (12.9%) | 318 (9.7%) |
| $100,000 to $149,999 | 336 (15.8%) | 278 (8.5%) |
| $150,000 or more | 632 (29.7%) | 868 (26.5%) |
| Total | 2,128 (100.0%) | 3,276 (100.0%) |
Property Value to Household Income Ratio in Westmont
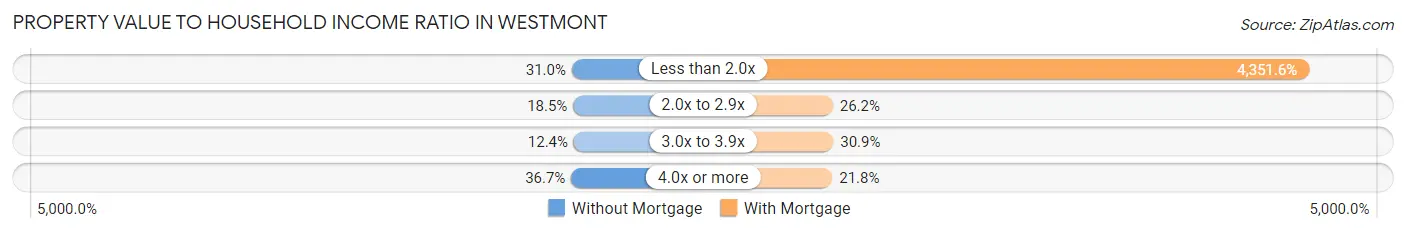
| Value-to-Income Ratio | Without Mortgage | With Mortgage |
| Less than 2.0x | 660 (31.0%) | 142,558 (4,351.6%) |
| 2.0x to 2.9x | 394 (18.5%) | 859 (26.2%) |
| 3.0x to 3.9x | 263 (12.4%) | 1,011 (30.9%) |
| 4.0x or more | 781 (36.7%) | 715 (21.8%) |
| Total | 2,128 (100.0%) | 3,276 (100.0%) |
Real Estate Taxes by Mortgage Status in Westmont
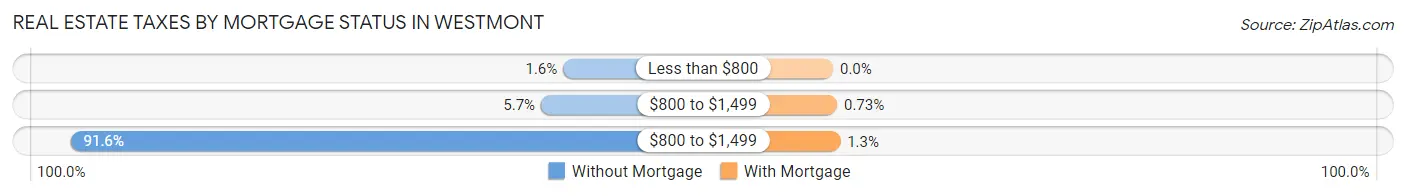
| Property Taxes | Without Mortgage | With Mortgage |
| Less than $800 | 35 (1.6%) | 0 (0.0%) |
| $800 to $1,499 | 121 (5.7%) | 24 (0.7%) |
| $800 to $1,499 | 1,949 (91.6%) | 43 (1.3%) |
| Total | 2,128 (100.0%) | 3,276 (100.0%) |
Health & Disability in Westmont
Health Insurance Coverage by Age in Westmont
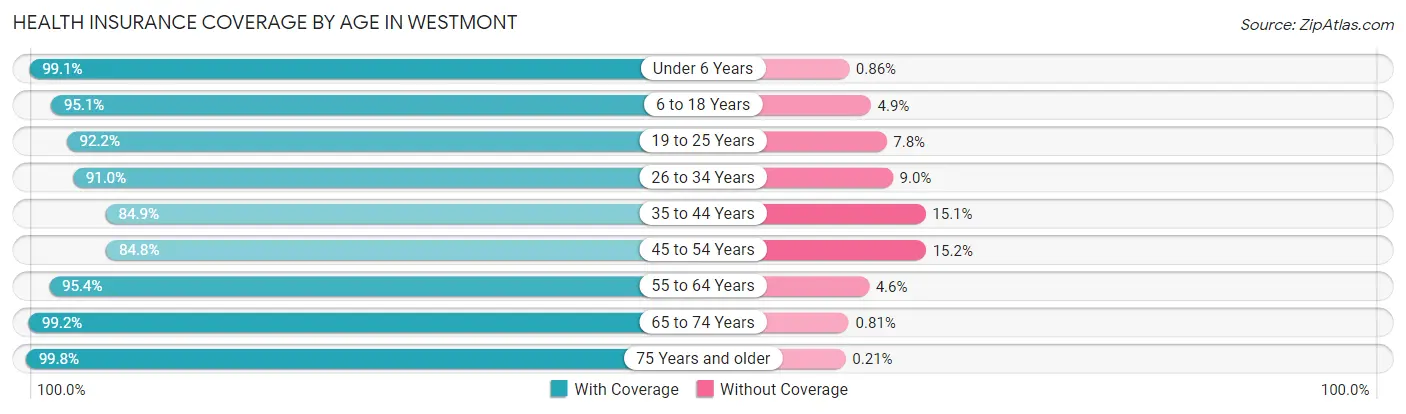
| Age Bracket | With Coverage | Without Coverage |
| Under 6 Years | 1,723 (99.1%) | 15 (0.9%) |
| 6 to 18 Years | 3,213 (95.1%) | 166 (4.9%) |
| 19 to 25 Years | 1,517 (92.2%) | 129 (7.8%) |
| 26 to 34 Years | 2,827 (91.0%) | 280 (9.0%) |
| 35 to 44 Years | 2,819 (84.9%) | 502 (15.1%) |
| 45 to 54 Years | 2,283 (84.8%) | 409 (15.2%) |
| 55 to 64 Years | 3,476 (95.4%) | 166 (4.6%) |
| 65 to 74 Years | 2,463 (99.2%) | 20 (0.8%) |
| 75 Years and older | 1,873 (99.8%) | 4 (0.2%) |
| Total | 22,194 (92.9%) | 1,691 (7.1%) |
Health Insurance Coverage by Citizenship Status in Westmont
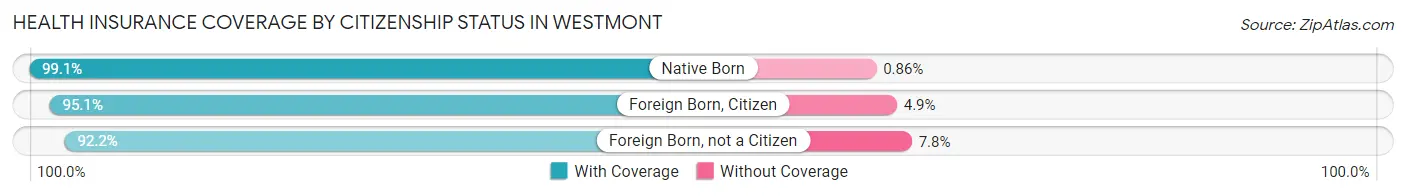
| Citizenship Status | With Coverage | Without Coverage |
| Native Born | 1,723 (99.1%) | 15 (0.9%) |
| Foreign Born, Citizen | 3,213 (95.1%) | 166 (4.9%) |
| Foreign Born, not a Citizen | 1,517 (92.2%) | 129 (7.8%) |
Health Insurance Coverage by Household Income in Westmont
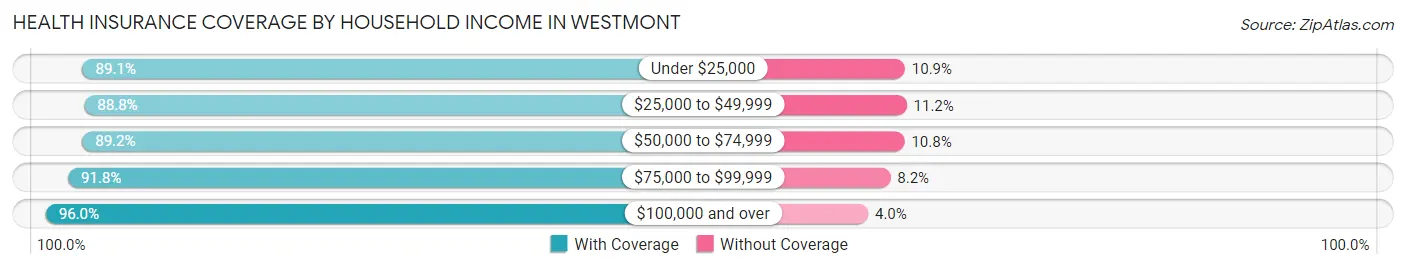
| Household Income | With Coverage | Without Coverage |
| Under $25,000 | 2,220 (89.1%) | 271 (10.9%) |
| $25,000 to $49,999 | 3,002 (88.8%) | 379 (11.2%) |
| $50,000 to $74,999 | 2,541 (89.2%) | 308 (10.8%) |
| $75,000 to $99,999 | 2,825 (91.8%) | 251 (8.2%) |
| $100,000 and over | 11,582 (96.0%) | 480 (4.0%) |
Public vs Private Health Insurance Coverage by Age in Westmont
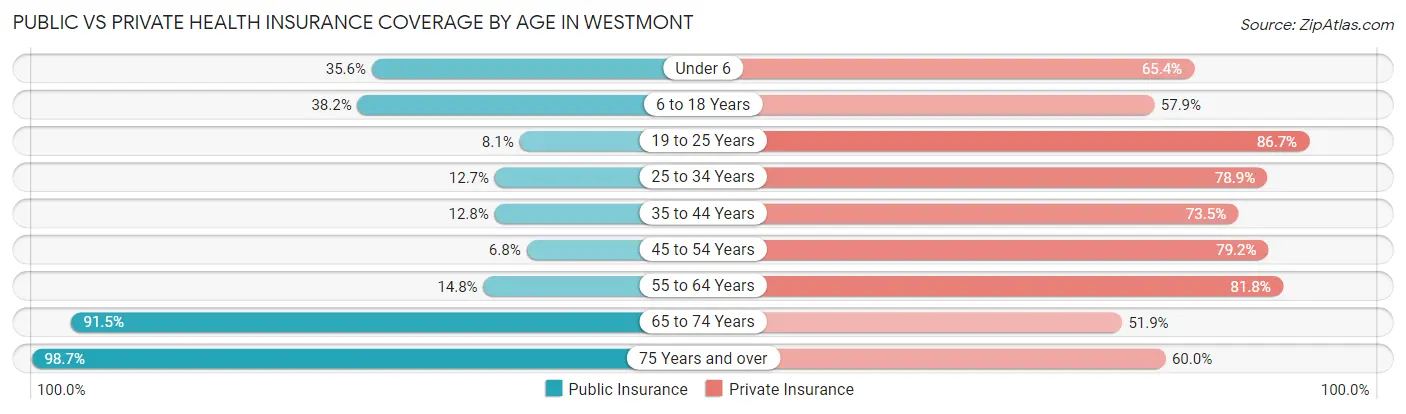
| Age Bracket | Public Insurance | Private Insurance |
| Under 6 | 618 (35.6%) | 1,136 (65.4%) |
| 6 to 18 Years | 1,291 (38.2%) | 1,957 (57.9%) |
| 19 to 25 Years | 134 (8.1%) | 1,427 (86.7%) |
| 25 to 34 Years | 395 (12.7%) | 2,452 (78.9%) |
| 35 to 44 Years | 424 (12.8%) | 2,442 (73.5%) |
| 45 to 54 Years | 184 (6.8%) | 2,131 (79.2%) |
| 55 to 64 Years | 540 (14.8%) | 2,980 (81.8%) |
| 65 to 74 Years | 2,271 (91.5%) | 1,289 (51.9%) |
| 75 Years and over | 1,853 (98.7%) | 1,126 (60.0%) |
| Total | 7,710 (32.3%) | 16,940 (70.9%) |
Disability Status by Sex by Age in Westmont
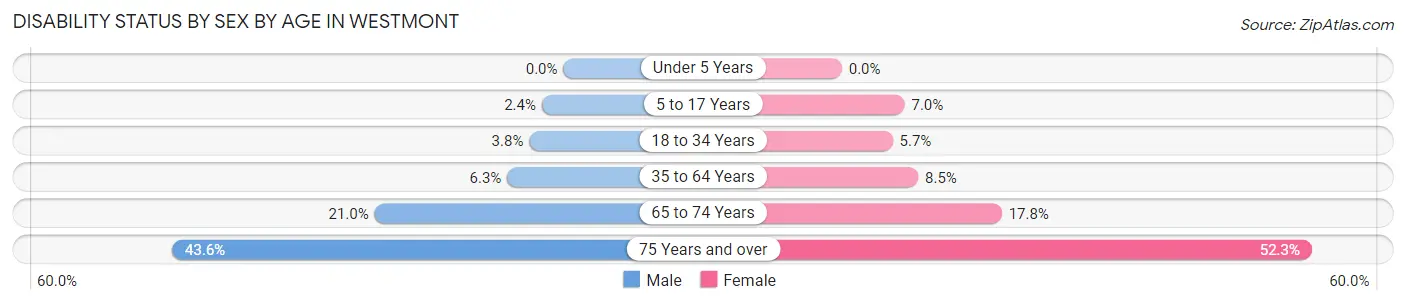
| Age Bracket | Male | Female |
| Under 5 Years | 0 (0.0%) | 0 (0.0%) |
| 5 to 17 Years | 37 (2.4%) | 120 (7.0%) |
| 18 to 34 Years | 91 (3.8%) | 152 (5.7%) |
| 35 to 64 Years | 287 (6.3%) | 431 (8.5%) |
| 65 to 74 Years | 240 (21.0%) | 239 (17.8%) |
| 75 Years and over | 296 (43.6%) | 627 (52.3%) |
Disability Class by Sex by Age in Westmont
Disability Class: Hearing Difficulty
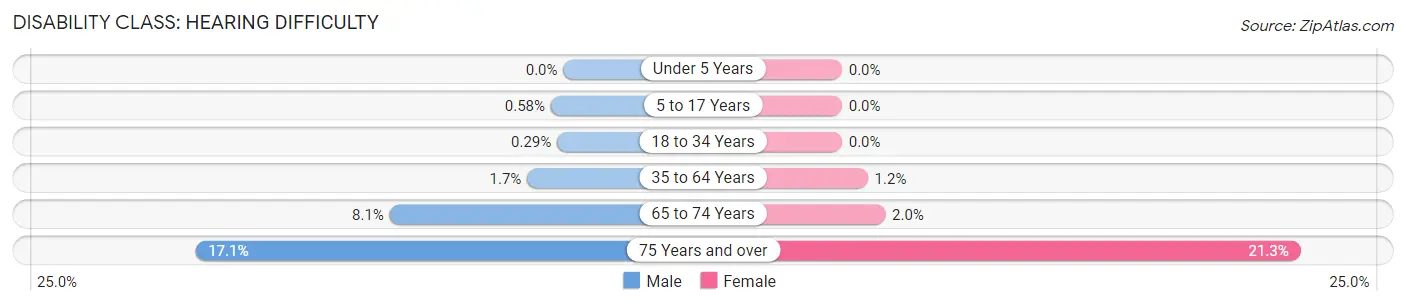
| Age Bracket | Male | Female |
| Under 5 Years | 0 (0.0%) | 0 (0.0%) |
| 5 to 17 Years | 9 (0.6%) | 0 (0.0%) |
| 18 to 34 Years | 7 (0.3%) | 0 (0.0%) |
| 35 to 64 Years | 77 (1.7%) | 61 (1.2%) |
| 65 to 74 Years | 92 (8.1%) | 27 (2.0%) |
| 75 Years and over | 116 (17.1%) | 255 (21.3%) |
Disability Class: Vision Difficulty
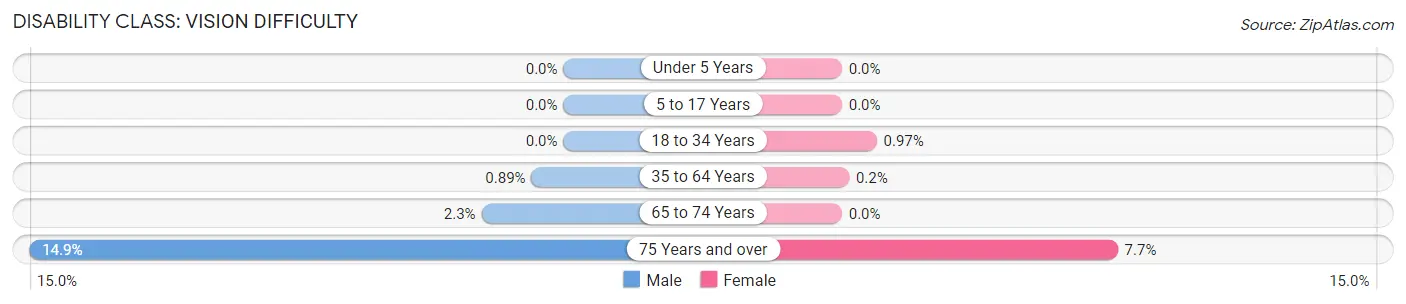
| Age Bracket | Male | Female |
| Under 5 Years | 0 (0.0%) | 0 (0.0%) |
| 5 to 17 Years | 0 (0.0%) | 0 (0.0%) |
| 18 to 34 Years | 0 (0.0%) | 26 (1.0%) |
| 35 to 64 Years | 41 (0.9%) | 10 (0.2%) |
| 65 to 74 Years | 26 (2.3%) | 0 (0.0%) |
| 75 Years and over | 101 (14.9%) | 92 (7.7%) |
Disability Class: Cognitive Difficulty
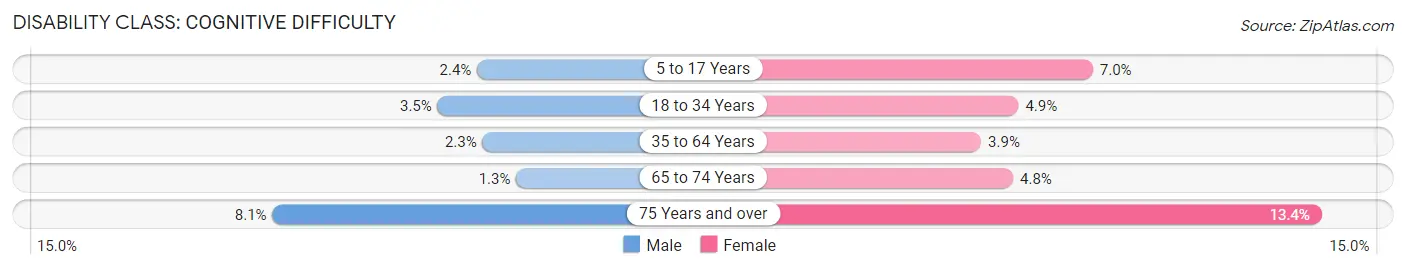
| Age Bracket | Male | Female |
| 5 to 17 Years | 37 (2.4%) | 120 (7.0%) |
| 18 to 34 Years | 84 (3.5%) | 132 (4.9%) |
| 35 to 64 Years | 103 (2.2%) | 197 (3.9%) |
| 65 to 74 Years | 15 (1.3%) | 64 (4.8%) |
| 75 Years and over | 55 (8.1%) | 160 (13.4%) |
Disability Class: Ambulatory Difficulty
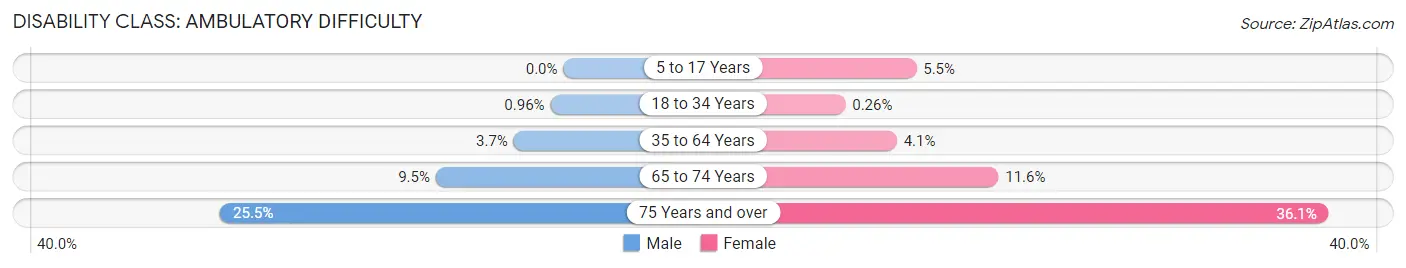
| Age Bracket | Male | Female |
| 5 to 17 Years | 0 (0.0%) | 95 (5.5%) |
| 18 to 34 Years | 23 (1.0%) | 7 (0.3%) |
| 35 to 64 Years | 169 (3.7%) | 207 (4.1%) |
| 65 to 74 Years | 108 (9.5%) | 156 (11.6%) |
| 75 Years and over | 173 (25.5%) | 433 (36.1%) |
Disability Class: Self-Care Difficulty
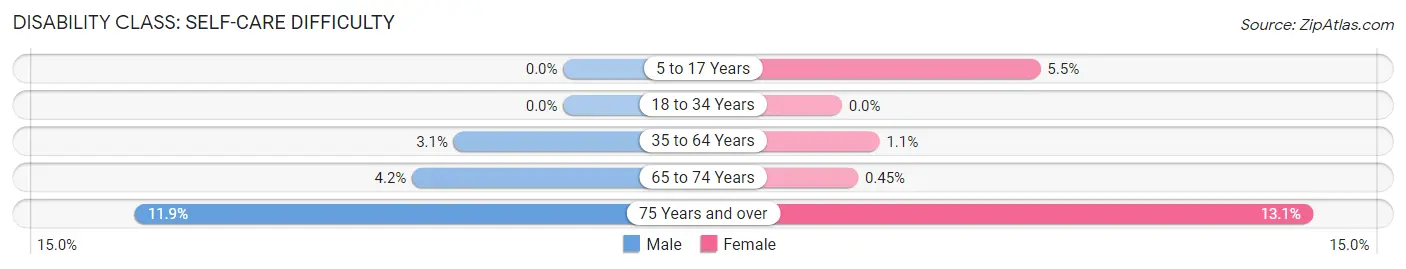
| Age Bracket | Male | Female |
| 5 to 17 Years | 0 (0.0%) | 95 (5.5%) |
| 18 to 34 Years | 0 (0.0%) | 0 (0.0%) |
| 35 to 64 Years | 140 (3.0%) | 53 (1.1%) |
| 65 to 74 Years | 48 (4.2%) | 6 (0.4%) |
| 75 Years and over | 81 (11.9%) | 157 (13.1%) |
Technology Access in Westmont
Computing Device Access in Westmont
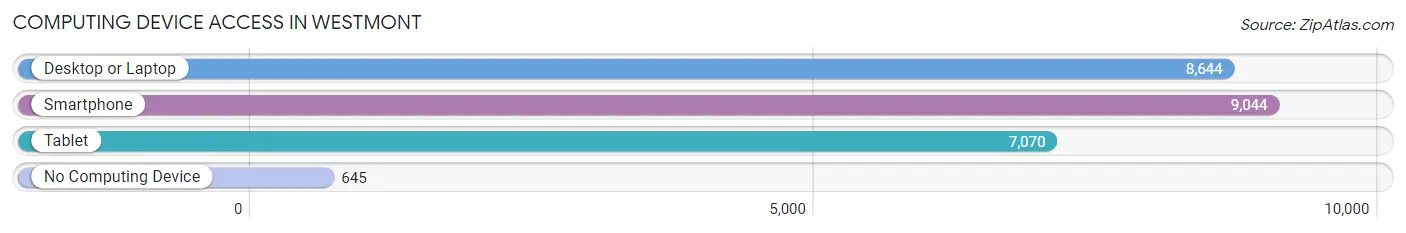
| Device Type | # Households | % Households |
| Desktop or Laptop | 8,644 | 83.6% |
| Smartphone | 9,044 | 87.5% |
| Tablet | 7,070 | 68.4% |
| No Computing Device | 645 | 6.2% |
| Total | 10,336 | 100.0% |
Internet Access in Westmont
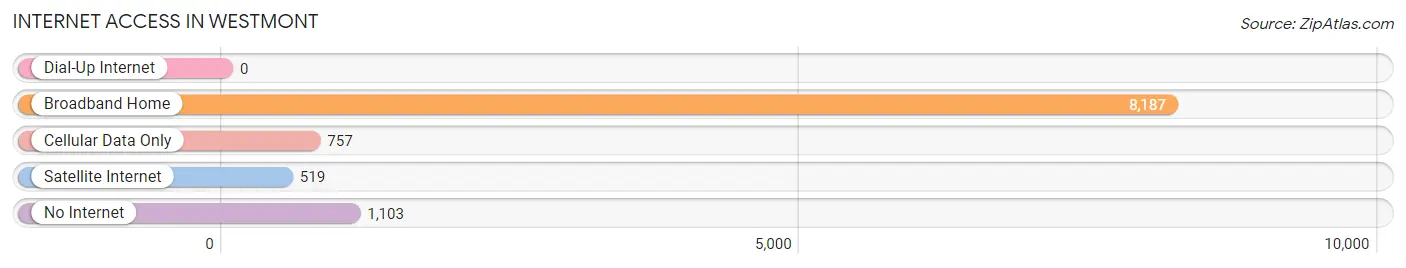
| Internet Type | # Households | % Households |
| Dial-Up Internet | 0 | 0.0% |
| Broadband Home | 8,187 | 79.2% |
| Cellular Data Only | 757 | 7.3% |
| Satellite Internet | 519 | 5.0% |
| No Internet | 1,103 | 10.7% |
| Total | 10,336 | 100.0% |
Westmont Summary
Westmont, Illinois is a village located in DuPage County, approximately 22 miles west of Chicago. The village is part of the Chicago metropolitan area and is home to a population of 24,685 people as of the 2010 census. Westmont is known for its small-town charm and is a popular destination for those looking to escape the hustle and bustle of the city.
History
Westmont was first settled in the 1830s by German immigrants who were attracted to the area by its fertile soil and abundant natural resources. The village was originally known as Cass, after the Cass family who owned much of the land in the area. In 1874, the village was renamed Westmont after the Westmont Land Company, which had purchased the land from the Cass family.
The village was officially incorporated in 1921 and experienced rapid growth in the following decades. The population of Westmont increased from 1,000 in 1930 to over 10,000 by 1960. The village continued to grow throughout the 1970s and 1980s, and by the 1990s, Westmont had become a popular destination for those looking to escape the hustle and bustle of the city.
Geography
Westmont is located in DuPage County, approximately 22 miles west of Chicago. The village is situated on the Des Plaines River and is bordered by the villages of Clarendon Hills, Downers Grove, and Willowbrook. The village covers an area of 4.2 square miles and has a population density of 5,845 people per square mile.
The village is located in the Chicago metropolitan area and is part of the Chicago-Naperville-Elgin metropolitan statistical area. The village is served by the Metra commuter rail system, which provides access to downtown Chicago.
Economy
Westmont is home to a variety of businesses and industries, including manufacturing, retail, and healthcare. The village is home to several large employers, including the Westmont-based Kraft Foods, which employs over 1,000 people. Other major employers in the village include the Westmont-based Advocate Health Care, which employs over 500 people, and the Westmont-based Walgreens, which employs over 400 people.
The village is also home to a variety of small businesses, including restaurants, shops, and professional services. The village is home to a variety of retail establishments, including the Westmont-based Jewel-Osco, which is one of the largest grocery stores in the area.
Demographics
As of the 2010 census, Westmont had a population of 24,685 people. The population is predominantly white (86.3%), with a small percentage of African Americans (4.2%), Asians (3.2%), and Hispanics (4.3%). The median household income in the village is $68,945, and the median home value is $269,400.
The village is served by the Westmont Community School District, which includes four elementary schools, one middle school, and one high school. The village is also home to a variety of private schools, including the Westmont Montessori School and the Westmont Christian Academy.
Conclusion
Westmont, Illinois is a village located in DuPage County, approximately 22 miles west of Chicago. The village is part of the Chicago metropolitan area and is home to a population of 24,685 people as of the 2010 census. Westmont is known for its small-town charm and is a popular destination for those looking to escape the hustle and bustle of the city. The village is home to a variety of businesses and industries, including manufacturing, retail, and healthcare. The village is served by the Westmont Community School District, and is home to a variety of private schools. The population of Westmont is predominantly white, with a small percentage of African Americans, Asians, and Hispanics. The median household income in the village is $68,945, and the median home value is $269,400.
Common Questions
What is Per Capita Income in Westmont?
Per Capita income in Westmont is $50,174.
What is the Median Family Income in Westmont?
Median Family Income in Westmont is $118,926.
What is the Median Household income in Westmont?
Median Household Income in Westmont is $82,519.
What is Income or Wage Gap in Westmont?
Income or Wage Gap in Westmont is 28.9%.
Women in Westmont earn 71.1 cents for every dollar earned by a man.
What is Inequality or Gini Index in Westmont?
Inequality or Gini Index in Westmont is 0.49.
What is the Total Population of Westmont?
Total Population of Westmont is 24,271.
What is the Total Male Population of Westmont?
Total Male Population of Westmont is 11,168.
What is the Total Female Population of Westmont?
Total Female Population of Westmont is 13,103.
What is the Ratio of Males per 100 Females in Westmont?
There are 85.23 Males per 100 Females in Westmont.
What is the Ratio of Females per 100 Males in Westmont?
There are 117.33 Females per 100 Males in Westmont.
What is the Median Population Age in Westmont?
Median Population Age in Westmont is 40.6 Years.
What is the Average Family Size in Westmont
Average Family Size in Westmont is 3.0 People.
What is the Average Household Size in Westmont
Average Household Size in Westmont is 2.3 People.
How Large is the Labor Force in Westmont?
There are 12,931 People in the Labor Forcein in Westmont.
What is the Percentage of People in the Labor Force in Westmont?
65.1% of People are in the Labor Force in Westmont.
What is the Unemployment Rate in Westmont?
Unemployment Rate in Westmont is 3.4%.