Oak Park, IL Map & Demographics
Oak Park Map
Oak Park Overview
$66,755
PER CAPITA INCOME
$159,422
AVG FAMILY INCOME
$103,264
AVG HOUSEHOLD INCOME
33.1%
WAGE / INCOME GAP [ % ]
66.9¢/ $1
WAGE / INCOME GAP [ $ ]
0.49
INEQUALITY / GINI INDEX
53,834
TOTAL POPULATION
24,751
MALE POPULATION
29,083
FEMALE POPULATION
85.10
MALES / 100 FEMALES
117.50
FEMALES / 100 MALES
40.3
MEDIAN AGE
3.1
AVG FAMILY SIZE
2.3
AVG HOUSEHOLD SIZE
29,962
LABOR FORCE [ PEOPLE ]
70.0%
PERCENT IN LABOR FORCE
4.9%
UNEMPLOYMENT RATE
Income in Oak Park
Income Overview in Oak Park
Per Capita Income in Oak Park is $66,755, while median incomes of families and households are $159,422 and $103,264 respectively.
| Characteristic | Number | Measure |
| Per Capita Income | 53,834 | $66,755 |
| Median Family Income | 12,988 | $159,422 |
| Mean Family Income | 12,988 | $207,338 |
| Median Household Income | 23,345 | $103,264 |
| Mean Household Income | 23,345 | $151,794 |
| Income Deficit | 12,988 | $0 |
| Wage / Income Gap (%) | 53,834 | 33.11% |
| Wage / Income Gap ($) | 53,834 | 66.89¢ per $1 |
| Gini / Inequality Index | 53,834 | 0.49 |
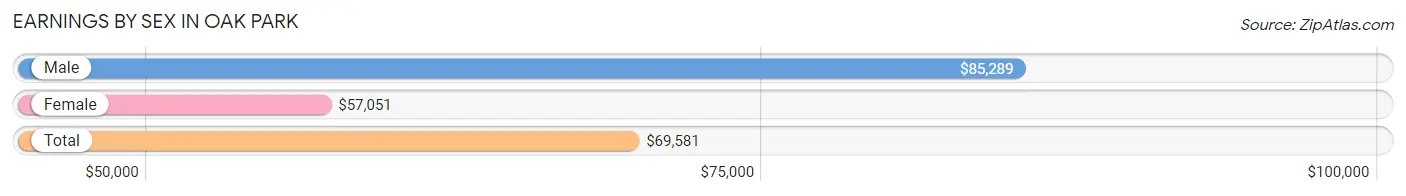
Earnings by Sex in Oak Park
Average Earnings in Oak Park are $69,581, $85,289 for men and $57,051 for women, a difference of 33.1%.
| Sex | Number | Average Earnings |
| Male | 14,232 (46.3%) | $85,289 |
| Female | 16,497 (53.7%) | $57,051 |
| Total | 30,729 (100.0%) | $69,581 |
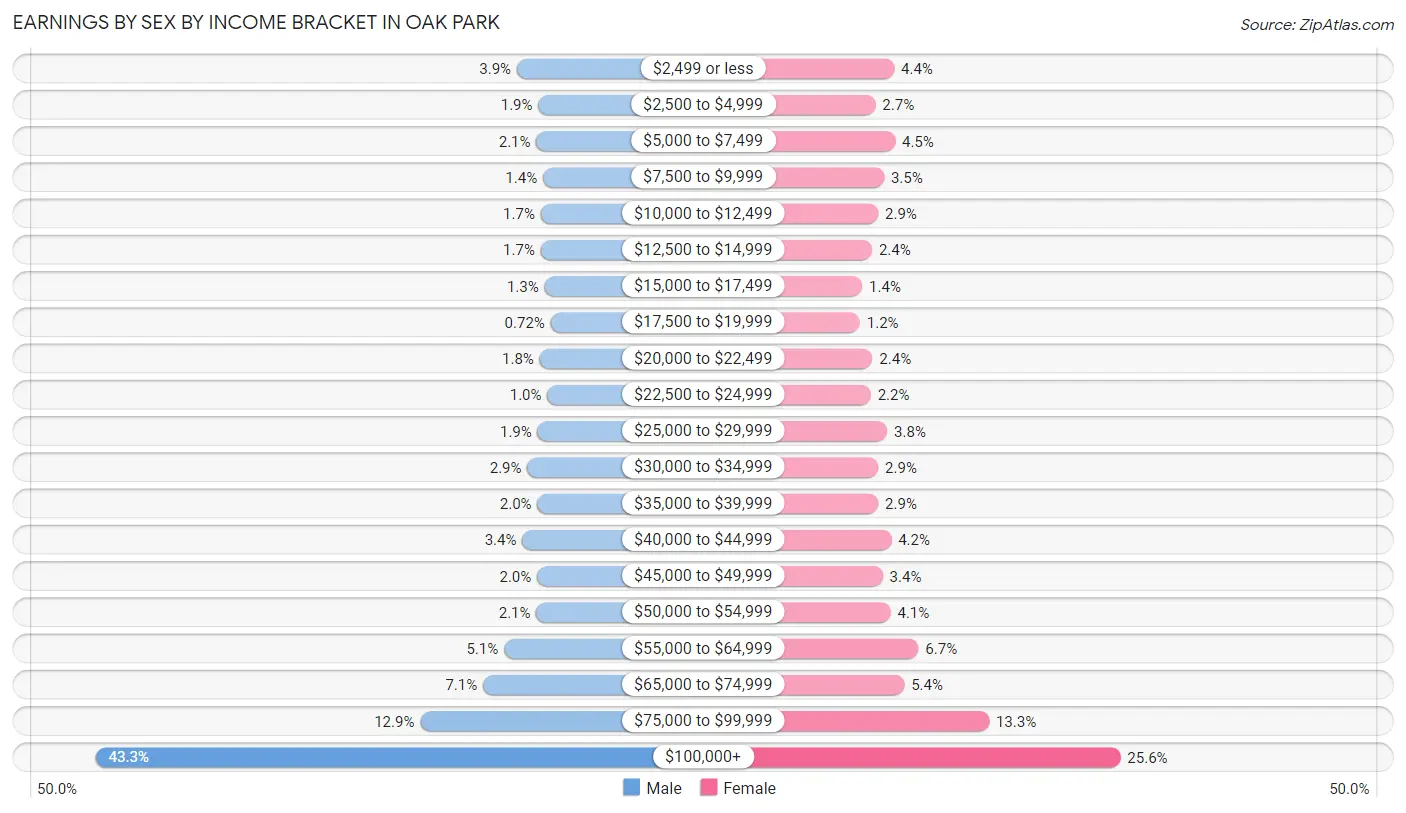
Earnings by Sex by Income Bracket in Oak Park
The most common earnings brackets in Oak Park are $100,000+ for men (6,168 | 43.3%) and $100,000+ for women (4,229 | 25.6%).
| Income | Male | Female |
| $2,499 or less | 552 (3.9%) | 730 (4.4%) |
| $2,500 to $4,999 | 266 (1.9%) | 442 (2.7%) |
| $5,000 to $7,499 | 293 (2.1%) | 745 (4.5%) |
| $7,500 to $9,999 | 205 (1.4%) | 574 (3.5%) |
| $10,000 to $12,499 | 235 (1.7%) | 483 (2.9%) |
| $12,500 to $14,999 | 235 (1.7%) | 389 (2.4%) |
| $15,000 to $17,499 | 183 (1.3%) | 238 (1.4%) |
| $17,500 to $19,999 | 103 (0.7%) | 202 (1.2%) |
| $20,000 to $22,499 | 249 (1.8%) | 396 (2.4%) |
| $22,500 to $24,999 | 147 (1.0%) | 369 (2.2%) |
| $25,000 to $29,999 | 276 (1.9%) | 623 (3.8%) |
| $30,000 to $34,999 | 413 (2.9%) | 485 (2.9%) |
| $35,000 to $39,999 | 279 (2.0%) | 485 (2.9%) |
| $40,000 to $44,999 | 481 (3.4%) | 686 (4.2%) |
| $45,000 to $49,999 | 283 (2.0%) | 554 (3.4%) |
| $50,000 to $54,999 | 293 (2.1%) | 676 (4.1%) |
| $55,000 to $64,999 | 725 (5.1%) | 1,107 (6.7%) |
| $65,000 to $74,999 | 1,004 (7.0%) | 887 (5.4%) |
| $75,000 to $99,999 | 1,842 (12.9%) | 2,197 (13.3%) |
| $100,000+ | 6,168 (43.3%) | 4,229 (25.6%) |
| Total | 14,232 (100.0%) | 16,497 (100.0%) |
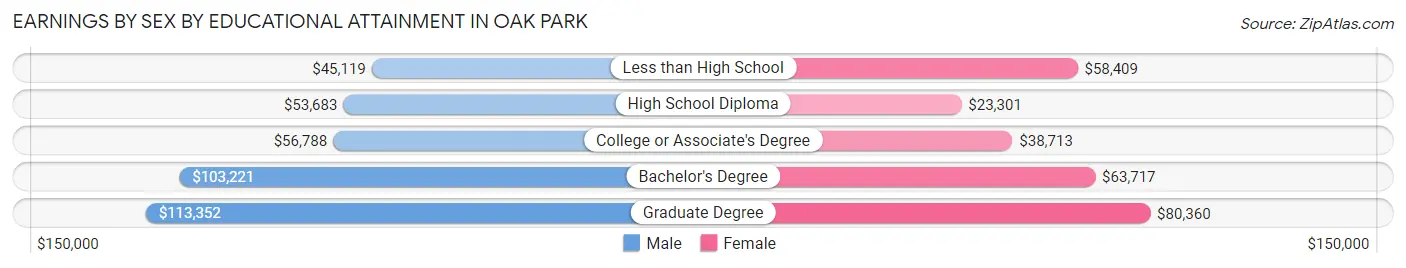
Earnings by Sex by Educational Attainment in Oak Park
Average earnings in Oak Park are $93,080 for men and $63,735 for women, a difference of 31.5%. Men with an educational attainment of graduate degree enjoy the highest average annual earnings of $113,352, while those with less than high school education earn the least with $45,119. Women with an educational attainment of graduate degree earn the most with the average annual earnings of $80,360, while those with high school diploma education have the smallest earnings of $23,301.
| Educational Attainment | Male Income | Female Income |
| Less than High School | $45,119 | $58,409 |
| High School Diploma | $53,683 | $23,301 |
| College or Associate's Degree | $56,788 | $38,713 |
| Bachelor's Degree | $103,221 | $63,717 |
| Graduate Degree | $113,352 | $80,360 |
| Total | $93,080 | $63,735 |
Family Income in Oak Park
Family Income Brackets in Oak Park
According to the Oak Park family income data, there are 4,754 families falling into the $200,000+ income range, which is the most common income bracket and makes up 36.6% of all families. Conversely, the less than $10,000 income bracket is the least frequent group with only 130 families (1.0%) belonging to this category.
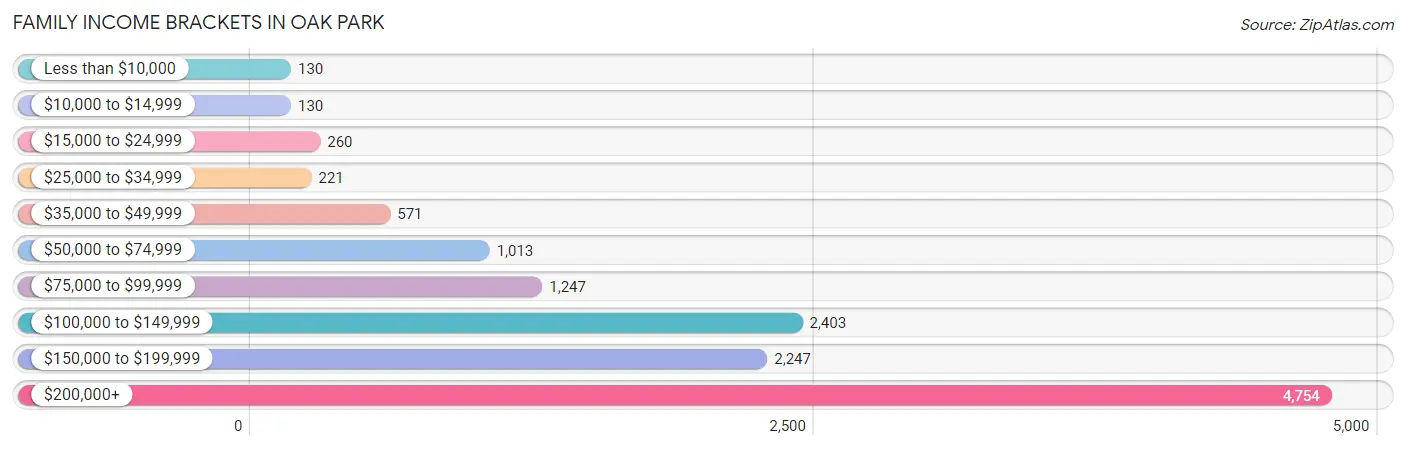
| Income Bracket | # Families | % Families |
| Less than $10,000 | 130 | 1.0% |
| $10,000 to $14,999 | 130 | 1.0% |
| $15,000 to $24,999 | 260 | 2.0% |
| $25,000 to $34,999 | 221 | 1.7% |
| $35,000 to $49,999 | 571 | 4.4% |
| $50,000 to $74,999 | 1,013 | 7.8% |
| $75,000 to $99,999 | 1,247 | 9.6% |
| $100,000 to $149,999 | 2,403 | 18.5% |
| $150,000 to $199,999 | 2,247 | 17.3% |
| $200,000+ | 4,754 | 36.6% |
Family Income by Famaliy Size in Oak Park
5-person families (888 | 6.8%) account for the highest median family income in Oak Park with $250,001 per family, while 2-person families (5,942 | 45.8%) have the highest median income of $55,968 per family member.
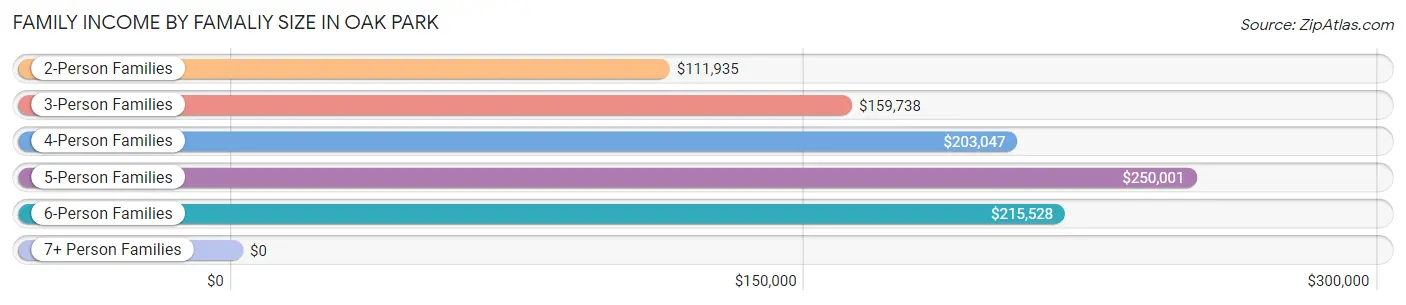
| Income Bracket | # Families | Median Income |
| 2-Person Families | 5,942 (45.8%) | $111,935 |
| 3-Person Families | 2,765 (21.3%) | $159,738 |
| 4-Person Families | 3,104 (23.9%) | $203,047 |
| 5-Person Families | 888 (6.8%) | $250,001 |
| 6-Person Families | 270 (2.1%) | $215,528 |
| 7+ Person Families | 19 (0.2%) | $0 |
| Total | 12,988 (100.0%) | $159,422 |
Family Income by Number of Earners in Oak Park
The median family income in Oak Park is $159,422, with families comprising 3+ earners (1,407) having the highest median family income of $217,337, while families with no earners (1,467) have the lowest median family income of $73,906, accounting for 10.8% and 11.3% of families, respectively.
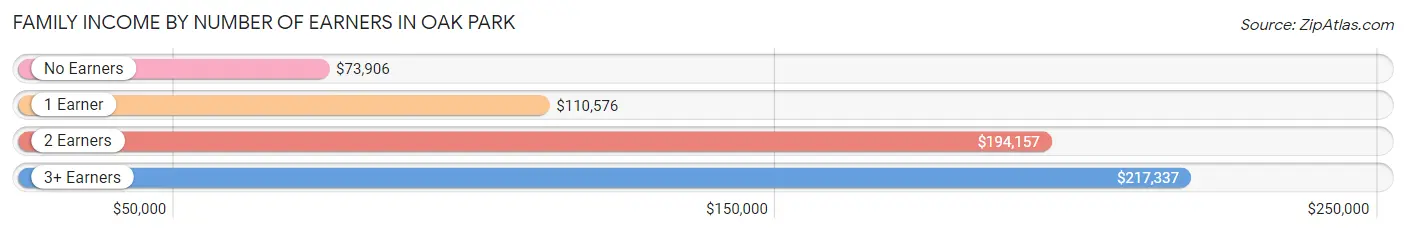
| Number of Earners | # Families | Median Income |
| No Earners | 1,467 (11.3%) | $73,906 |
| 1 Earner | 3,423 (26.4%) | $110,576 |
| 2 Earners | 6,691 (51.5%) | $194,157 |
| 3+ Earners | 1,407 (10.8%) | $217,337 |
| Total | 12,988 (100.0%) | $159,422 |
Household Income in Oak Park
Household Income Brackets in Oak Park
With 5,299 households falling in the category, the $200,000+ income range is the most frequent in Oak Park, accounting for 22.7% of all households. In contrast, only 700 households (3.0%) fall into the $10,000 to $14,999 income bracket, making it the least populous group.
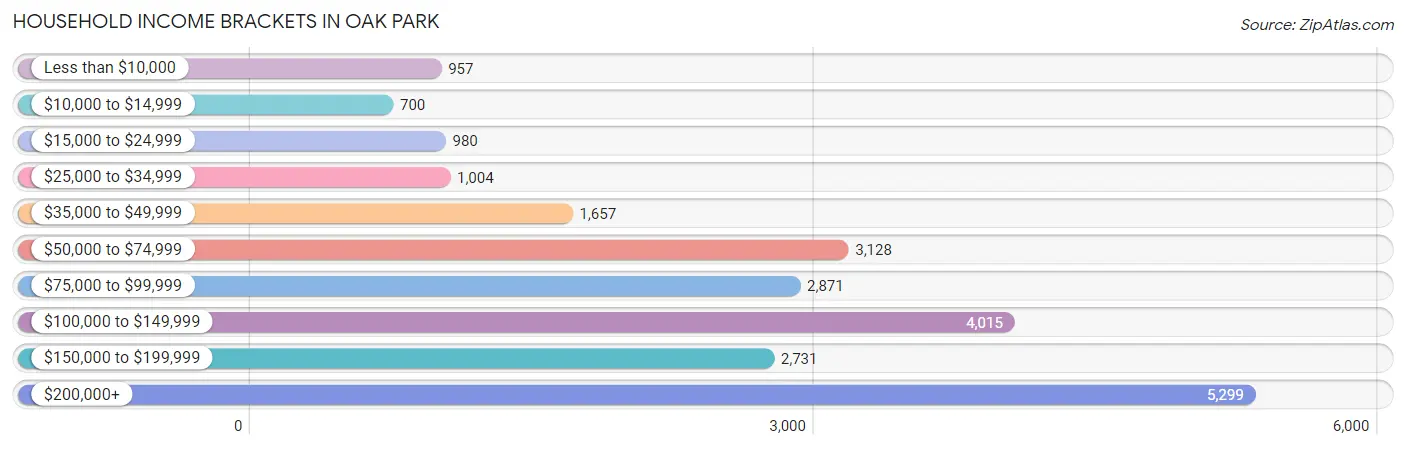
| Income Bracket | # Households | % Households |
| Less than $10,000 | 957 | 4.1% |
| $10,000 to $14,999 | 700 | 3.0% |
| $15,000 to $24,999 | 980 | 4.2% |
| $25,000 to $34,999 | 1,004 | 4.3% |
| $35,000 to $49,999 | 1,657 | 7.1% |
| $50,000 to $74,999 | 3,128 | 13.4% |
| $75,000 to $99,999 | 2,871 | 12.3% |
| $100,000 to $149,999 | 4,015 | 17.2% |
| $150,000 to $199,999 | 2,731 | 11.7% |
| $200,000+ | 5,299 | 22.7% |
Household Income by Householder Age in Oak Park
The median household income in Oak Park is $103,264, with the highest median household income of $140,806 found in the 45 to 64 years age bracket for the primary householder. A total of 8,555 households (36.6%) fall into this category. Meanwhile, the 15 to 24 years age bracket for the primary householder has the lowest median household income of $36,940, with 595 households (2.5%) in this group.
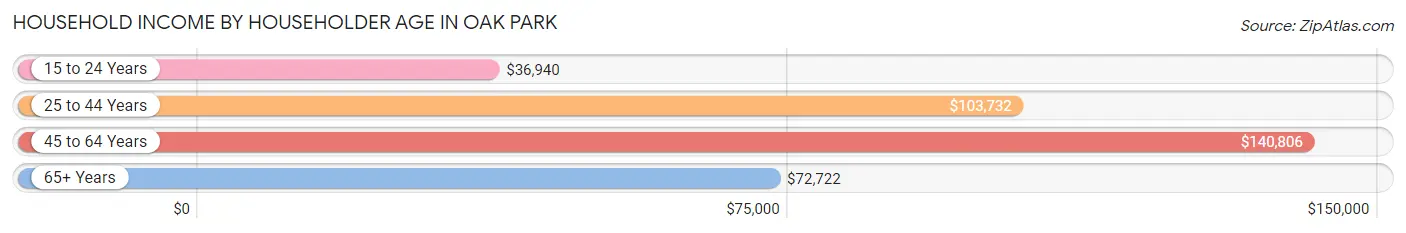
| Income Bracket | # Households | Median Income |
| 15 to 24 Years | 595 (2.5%) | $36,940 |
| 25 to 44 Years | 8,118 (34.8%) | $103,732 |
| 45 to 64 Years | 8,555 (36.6%) | $140,806 |
| 65+ Years | 6,077 (26.0%) | $72,722 |
| Total | 23,345 (100.0%) | $103,264 |
Poverty in Oak Park
Income Below Poverty by Sex and Age in Oak Park
With 5.5% poverty level for males and 8.1% for females among the residents of Oak Park, 18 to 24 year old males and 18 to 24 year old females are the most vulnerable to poverty, with 249 males (17.8%) and 304 females (15.6%) in their respective age groups living below the poverty level.
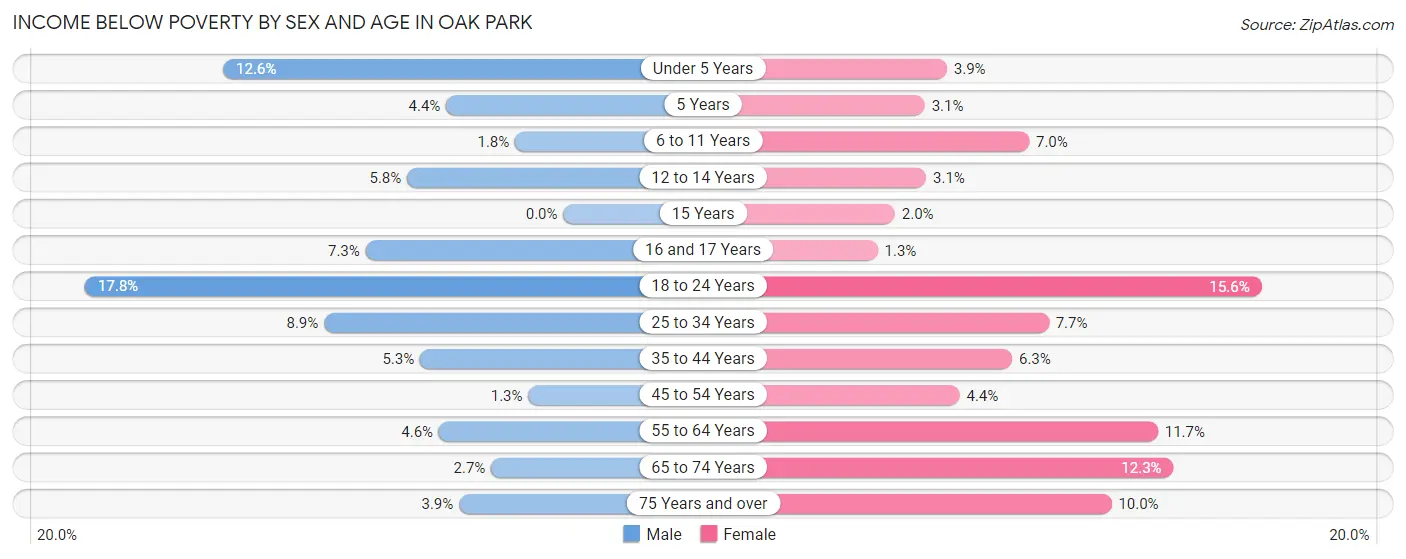
| Age Bracket | Male | Female |
| Under 5 Years | 170 (12.6%) | 63 (3.9%) |
| 5 Years | 19 (4.3%) | 11 (3.1%) |
| 6 to 11 Years | 45 (1.8%) | 140 (7.0%) |
| 12 to 14 Years | 57 (5.8%) | 34 (3.1%) |
| 15 Years | 0 (0.0%) | 6 (2.0%) |
| 16 and 17 Years | 54 (7.3%) | 9 (1.3%) |
| 18 to 24 Years | 249 (17.8%) | 304 (15.6%) |
| 25 to 34 Years | 247 (8.9%) | 290 (7.7%) |
| 35 to 44 Years | 222 (5.3%) | 261 (6.3%) |
| 45 to 54 Years | 44 (1.3%) | 173 (4.4%) |
| 55 to 64 Years | 128 (4.6%) | 425 (11.7%) |
| 65 to 74 Years | 63 (2.7%) | 414 (12.3%) |
| 75 Years and over | 56 (3.9%) | 199 (10.0%) |
| Total | 1,354 (5.5%) | 2,329 (8.1%) |
Income Above Poverty by Sex and Age in Oak Park
According to the poverty statistics in Oak Park, males aged 15 years and females aged 16 and 17 years are the age groups that are most secure financially, with 100.0% of males and 98.7% of females in these age groups living above the poverty line.
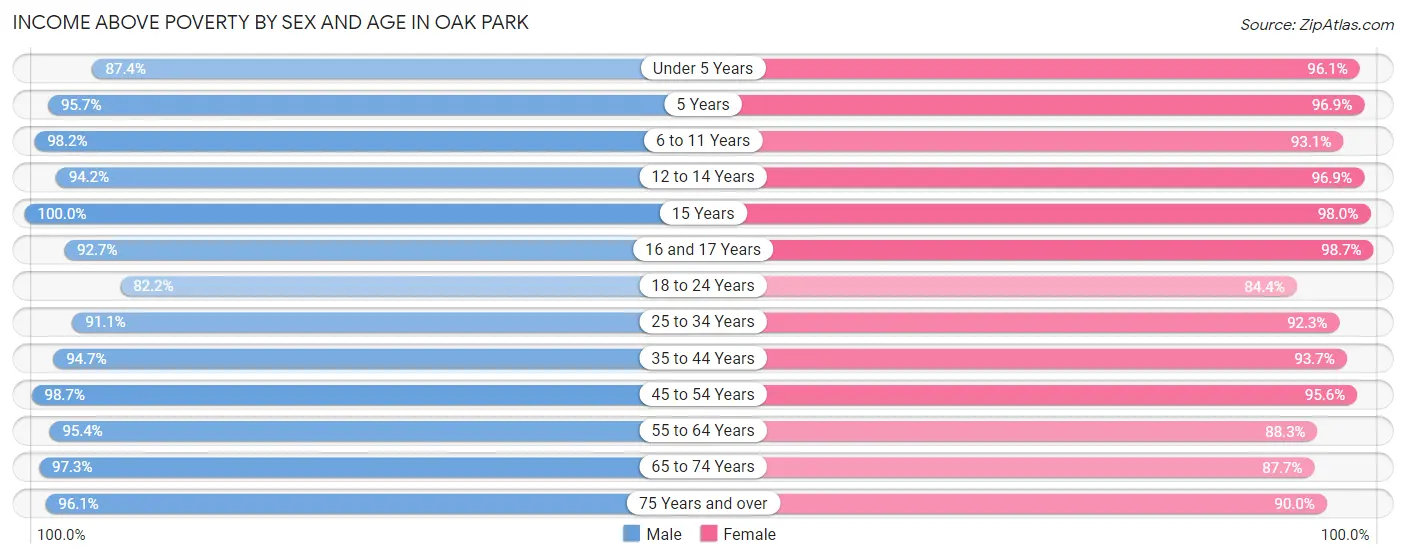
| Age Bracket | Male | Female |
| Under 5 Years | 1,176 (87.4%) | 1,553 (96.1%) |
| 5 Years | 418 (95.7%) | 346 (96.9%) |
| 6 to 11 Years | 2,474 (98.2%) | 1,874 (93.0%) |
| 12 to 14 Years | 926 (94.2%) | 1,051 (96.9%) |
| 15 Years | 297 (100.0%) | 299 (98.0%) |
| 16 and 17 Years | 682 (92.7%) | 670 (98.7%) |
| 18 to 24 Years | 1,153 (82.2%) | 1,647 (84.4%) |
| 25 to 34 Years | 2,534 (91.1%) | 3,484 (92.3%) |
| 35 to 44 Years | 3,953 (94.7%) | 3,872 (93.7%) |
| 45 to 54 Years | 3,346 (98.7%) | 3,784 (95.6%) |
| 55 to 64 Years | 2,643 (95.4%) | 3,197 (88.3%) |
| 65 to 74 Years | 2,290 (97.3%) | 2,948 (87.7%) |
| 75 Years and over | 1,392 (96.1%) | 1,790 (90.0%) |
| Total | 23,284 (94.5%) | 26,515 (91.9%) |
Income Below Poverty Among Married-Couple Families in Oak Park
The poverty statistics for married-couple families in Oak Park show that 1.3% or 134 of the total 9,951 families live below the poverty line. Families with no children have the highest poverty rate of 2.4%, comprising of 124 families. On the other hand, families with 1 or 2 children have the lowest poverty rate of 0.0%, which includes 0 families.
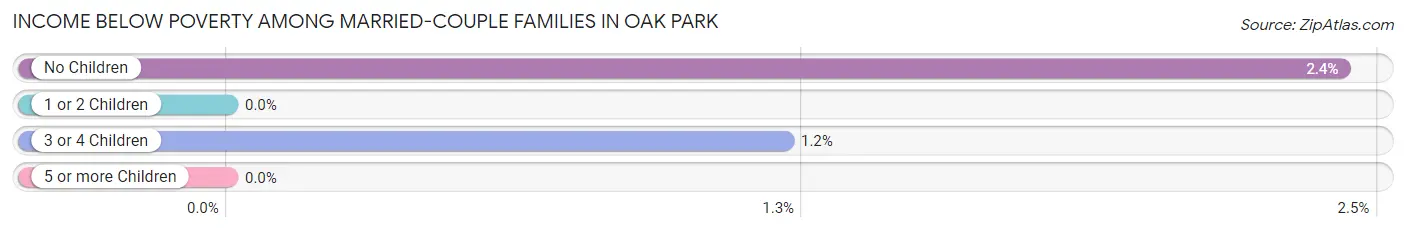
| Children | Above Poverty | Below Poverty |
| No Children | 5,006 (97.6%) | 124 (2.4%) |
| 1 or 2 Children | 3,988 (100.0%) | 0 (0.0%) |
| 3 or 4 Children | 815 (98.8%) | 10 (1.2%) |
| 5 or more Children | 8 (100.0%) | 0 (0.0%) |
| Total | 9,817 (98.7%) | 134 (1.3%) |
Income Below Poverty Among Single-Parent Households in Oak Park
According to the poverty data in Oak Park, 6.3% or 42 single-father households and 11.8% or 280 single-mother households are living below the poverty line. Among single-father households, those with 3 or 4 children have the highest poverty rate, with 29 households (67.4%) experiencing poverty. Likewise, among single-mother households, those with 1 or 2 children have the highest poverty rate, with 232 households (17.9%) falling below the poverty line.
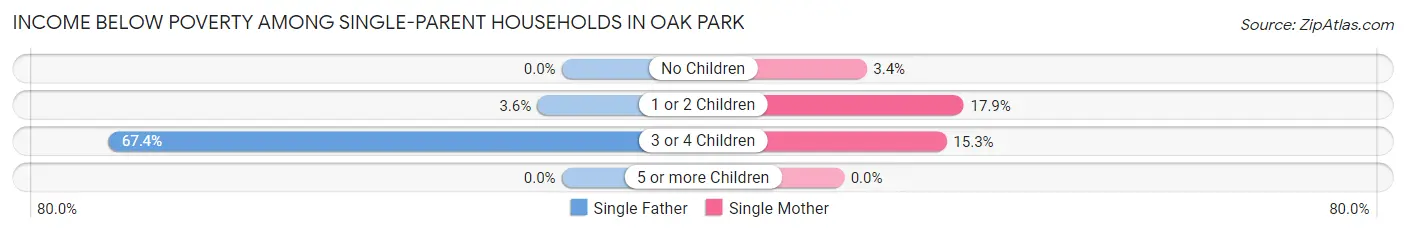
| Children | Single Father | Single Mother |
| No Children | 0 (0.0%) | 33 (3.4%) |
| 1 or 2 Children | 13 (3.6%) | 232 (17.9%) |
| 3 or 4 Children | 29 (67.4%) | 15 (15.3%) |
| 5 or more Children | 0 (0.0%) | 0 (0.0%) |
| Total | 42 (6.3%) | 280 (11.8%) |
Income Below Poverty Among Married-Couple vs Single-Parent Households in Oak Park
The poverty data for Oak Park shows that 134 of the married-couple family households (1.3%) and 322 of the single-parent households (10.6%) are living below the poverty level. Within the married-couple family households, those with no children have the highest poverty rate, with 124 households (2.4%) falling below the poverty line. Among the single-parent households, those with 3 or 4 children have the highest poverty rate, with 44 household (31.2%) living below poverty.
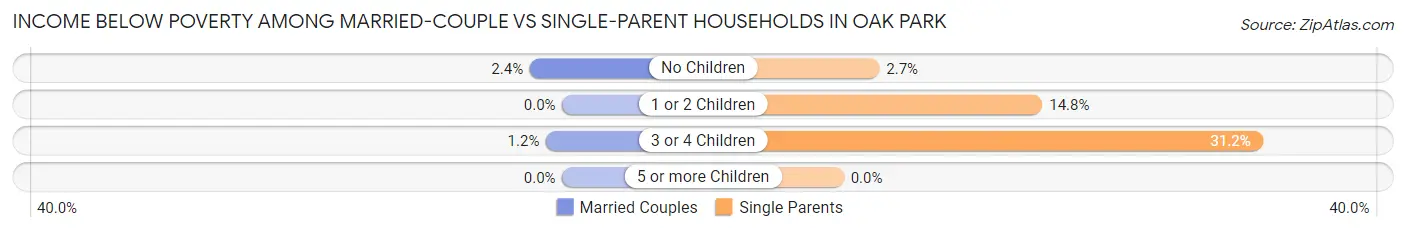
| Children | Married-Couple Families | Single-Parent Households |
| No Children | 124 (2.4%) | 33 (2.7%) |
| 1 or 2 Children | 0 (0.0%) | 245 (14.8%) |
| 3 or 4 Children | 10 (1.2%) | 44 (31.2%) |
| 5 or more Children | 0 (0.0%) | 0 (0.0%) |
| Total | 134 (1.3%) | 322 (10.6%) |
Race in Oak Park
The most populous races in Oak Park are White / Caucasian (33,958 | 63.1%), Black / African American (10,244 | 19.0%), and Hispanic or Latino (4,990 | 9.3%).
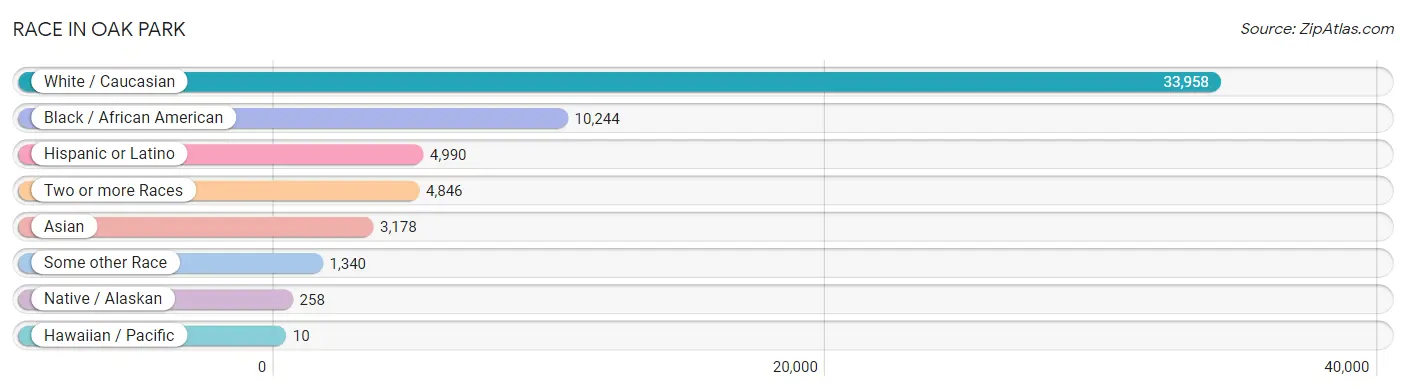
| Race | # Population | % Population |
| Asian | 3,178 | 5.9% |
| Black / African American | 10,244 | 19.0% |
| Hawaiian / Pacific | 10 | 0.0% |
| Hispanic or Latino | 4,990 | 9.3% |
| Native / Alaskan | 258 | 0.5% |
| White / Caucasian | 33,958 | 63.1% |
| Two or more Races | 4,846 | 9.0% |
| Some other Race | 1,340 | 2.5% |
| Total | 53,834 | 100.0% |
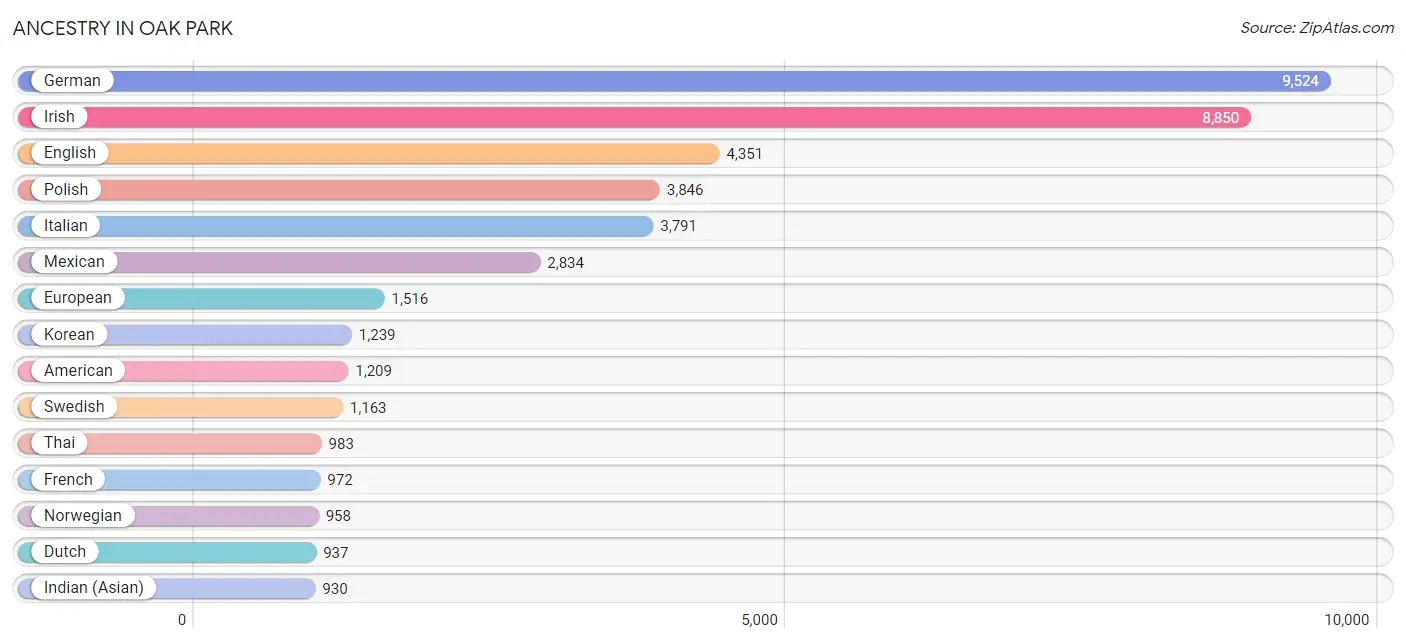
Ancestry in Oak Park
The most populous ancestries reported in Oak Park are German (9,524 | 17.7%), Irish (8,850 | 16.4%), English (4,351 | 8.1%), Polish (3,846 | 7.1%), and Italian (3,791 | 7.0%), together accounting for 56.4% of all Oak Park residents.
| Ancestry | # Population | % Population |
| African | 399 | 0.7% |
| Albanian | 72 | 0.1% |
| Alsatian | 12 | 0.0% |
| American | 1,209 | 2.2% |
| Arab | 123 | 0.2% |
| Argentinean | 6 | 0.0% |
| Armenian | 158 | 0.3% |
| Assyrian / Chaldean / Syriac | 26 | 0.1% |
| Austrian | 265 | 0.5% |
| Barbadian | 24 | 0.0% |
| Belgian | 129 | 0.2% |
| Bhutanese | 707 | 1.3% |
| Bolivian | 19 | 0.0% |
| Brazilian | 141 | 0.3% |
| British | 500 | 0.9% |
| Bulgarian | 5 | 0.0% |
| Burmese | 495 | 0.9% |
| Cajun | 17 | 0.0% |
| Canadian | 46 | 0.1% |
| Cape Verdean | 37 | 0.1% |
| Carpatho Rusyn | 10 | 0.0% |
| Central American | 351 | 0.6% |
| Central American Indian | 26 | 0.1% |
| Cherokee | 202 | 0.4% |
| Chickasaw | 48 | 0.1% |
| Chilean | 41 | 0.1% |
| Chippewa | 55 | 0.1% |
| Choctaw | 7 | 0.0% |
| Colombian | 230 | 0.4% |
| Costa Rican | 13 | 0.0% |
| Croatian | 179 | 0.3% |
| Cuban | 113 | 0.2% |
| Czech | 619 | 1.1% |
| Czechoslovakian | 34 | 0.1% |
| Danish | 287 | 0.5% |
| Dominican | 74 | 0.1% |
| Dutch | 937 | 1.7% |
| Eastern European | 296 | 0.5% |
| Ecuadorian | 31 | 0.1% |
| Egyptian | 18 | 0.0% |
| English | 4,351 | 8.1% |
| Estonian | 8 | 0.0% |
| European | 1,516 | 2.8% |
| Finnish | 47 | 0.1% |
| French | 972 | 1.8% |
| French Canadian | 176 | 0.3% |
| German | 9,524 | 17.7% |
| German Russian | 33 | 0.1% |
| Ghanaian | 42 | 0.1% |
| Greek | 417 | 0.8% |
| Guatemalan | 155 | 0.3% |
| Haitian | 21 | 0.0% |
| Honduran | 91 | 0.2% |
| Hungarian | 280 | 0.5% |
| Indian (Asian) | 930 | 1.7% |
| Iranian | 151 | 0.3% |
| Irish | 8,850 | 16.4% |
| Iroquois | 15 | 0.0% |
| Israeli | 57 | 0.1% |
| Italian | 3,791 | 7.0% |
| Jamaican | 153 | 0.3% |
| Korean | 1,239 | 2.3% |
| Latvian | 155 | 0.3% |
| Lebanese | 37 | 0.1% |
| Lithuanian | 670 | 1.2% |
| Luxembourger | 57 | 0.1% |
| Mexican | 2,834 | 5.3% |
| Mexican American Indian | 153 | 0.3% |
| Mongolian | 14 | 0.0% |
| Moroccan | 6 | 0.0% |
| Native Hawaiian | 42 | 0.1% |
| Nicaraguan | 24 | 0.0% |
| Nigerian | 128 | 0.2% |
| Northern European | 64 | 0.1% |
| Norwegian | 958 | 1.8% |
| Ottawa | 13 | 0.0% |
| Pakistani | 363 | 0.7% |
| Palestinian | 38 | 0.1% |
| Panamanian | 41 | 0.1% |
| Peruvian | 126 | 0.2% |
| Polish | 3,846 | 7.1% |
| Portuguese | 28 | 0.1% |
| Puerto Rican | 907 | 1.7% |
| Romanian | 83 | 0.2% |
| Russian | 804 | 1.5% |
| Salvadoran | 27 | 0.1% |
| Scandinavian | 185 | 0.3% |
| Scotch-Irish | 560 | 1.0% |
| Scottish | 760 | 1.4% |
| Serbian | 114 | 0.2% |
| Slavic | 28 | 0.1% |
| Slovak | 298 | 0.5% |
| Slovene | 134 | 0.3% |
| South American | 515 | 1.0% |
| Spaniard | 143 | 0.3% |
| Spanish | 34 | 0.1% |
| Sri Lankan | 78 | 0.1% |
| Subsaharan African | 714 | 1.3% |
| Swedish | 1,163 | 2.2% |
| Swiss | 302 | 0.6% |
| Syrian | 10 | 0.0% |
| Thai | 983 | 1.8% |
| Turkish | 59 | 0.1% |
| Ukrainian | 282 | 0.5% |
| Venezuelan | 62 | 0.1% |
| Welsh | 393 | 0.7% |
| West Indian | 64 | 0.1% | View All 107 Rows |
Immigrants in Oak Park
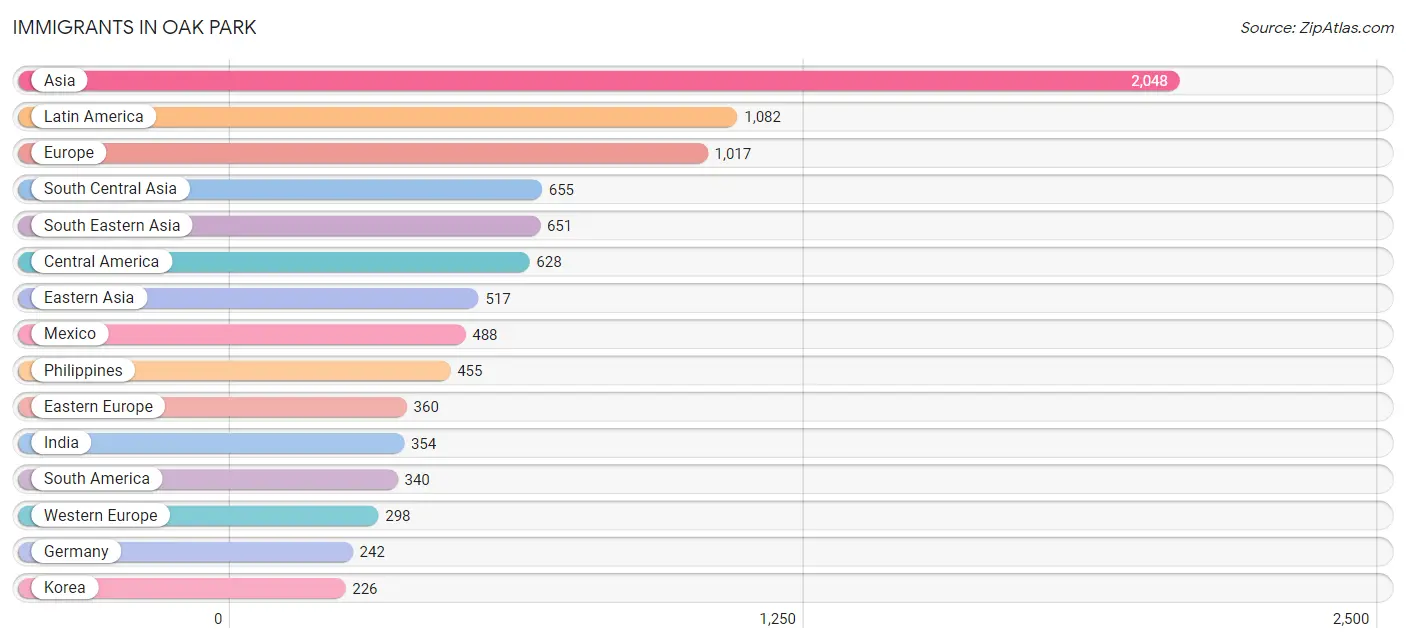
The most numerous immigrant groups reported in Oak Park came from Asia (2,048 | 3.8%), Latin America (1,082 | 2.0%), Europe (1,017 | 1.9%), South Central Asia (655 | 1.2%), and South Eastern Asia (651 | 1.2%), together accounting for 10.1% of all Oak Park residents.
| Immigration Origin | # Population | % Population |
| Afghanistan | 27 | 0.1% |
| Africa | 201 | 0.4% |
| Albania | 16 | 0.0% |
| Argentina | 26 | 0.1% |
| Asia | 2,048 | 3.8% |
| Barbados | 19 | 0.0% |
| Bolivia | 19 | 0.0% |
| Bosnia and Herzegovina | 18 | 0.0% |
| Brazil | 86 | 0.2% |
| Bulgaria | 5 | 0.0% |
| Cambodia | 57 | 0.1% |
| Cameroon | 16 | 0.0% |
| Canada | 74 | 0.1% |
| Caribbean | 114 | 0.2% |
| Central America | 628 | 1.2% |
| China | 169 | 0.3% |
| Colombia | 124 | 0.2% |
| Cuba | 23 | 0.0% |
| Eastern Africa | 60 | 0.1% |
| Eastern Asia | 517 | 1.0% |
| Eastern Europe | 360 | 0.7% |
| Ecuador | 19 | 0.0% |
| El Salvador | 9 | 0.0% |
| England | 33 | 0.1% |
| Europe | 1,017 | 1.9% |
| France | 20 | 0.0% |
| Germany | 242 | 0.4% |
| Ghana | 7 | 0.0% |
| Greece | 12 | 0.0% |
| Grenada | 5 | 0.0% |
| Guatemala | 86 | 0.2% |
| Haiti | 32 | 0.1% |
| Honduras | 21 | 0.0% |
| Hungary | 7 | 0.0% |
| India | 354 | 0.7% |
| Indonesia | 6 | 0.0% |
| Iran | 92 | 0.2% |
| Iraq | 9 | 0.0% |
| Ireland | 39 | 0.1% |
| Israel | 10 | 0.0% |
| Italy | 88 | 0.2% |
| Jamaica | 17 | 0.0% |
| Japan | 122 | 0.2% |
| Kazakhstan | 21 | 0.0% |
| Korea | 226 | 0.4% |
| Kuwait | 23 | 0.0% |
| Latin America | 1,082 | 2.0% |
| Latvia | 8 | 0.0% |
| Malaysia | 25 | 0.1% |
| Mexico | 488 | 0.9% |
| Middle Africa | 16 | 0.0% |
| Moldova | 18 | 0.0% |
| Nepal | 73 | 0.1% |
| Netherlands | 36 | 0.1% |
| Nicaragua | 24 | 0.0% |
| Nigeria | 33 | 0.1% |
| Northern Africa | 17 | 0.0% |
| Northern Europe | 144 | 0.3% |
| Pakistan | 78 | 0.1% |
| Peru | 51 | 0.1% |
| Philippines | 455 | 0.9% |
| Poland | 172 | 0.3% |
| Romania | 31 | 0.1% |
| Russia | 21 | 0.0% |
| Saudi Arabia | 12 | 0.0% |
| Scotland | 4 | 0.0% |
| Serbia | 26 | 0.1% |
| South Africa | 68 | 0.1% |
| South America | 340 | 0.6% |
| South Central Asia | 655 | 1.2% |
| South Eastern Asia | 651 | 1.2% |
| Southern Europe | 153 | 0.3% |
| Spain | 53 | 0.1% |
| Sri Lanka | 10 | 0.0% |
| Syria | 10 | 0.0% |
| Taiwan | 4 | 0.0% |
| Thailand | 76 | 0.1% |
| Trinidad and Tobago | 18 | 0.0% |
| Turkey | 52 | 0.1% |
| Ukraine | 30 | 0.1% |
| Venezuela | 15 | 0.0% |
| Vietnam | 32 | 0.1% |
| Western Africa | 40 | 0.1% |
| Western Asia | 178 | 0.3% |
| Western Europe | 298 | 0.5% |
| Zimbabwe | 40 | 0.1% | View All 86 Rows |
Sex and Age in Oak Park
Sex and Age in Oak Park
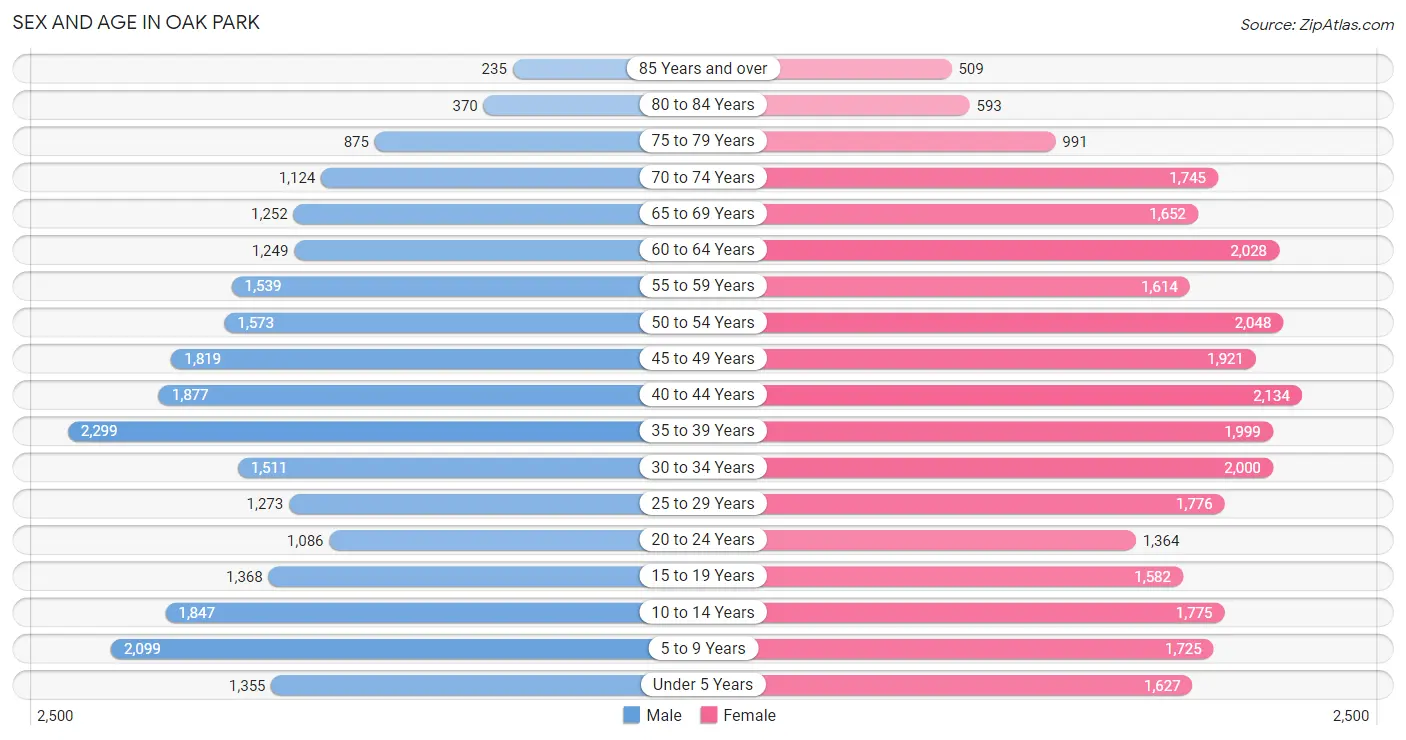
The most populous age groups in Oak Park are 35 to 39 Years (2,299 | 9.3%) for men and 40 to 44 Years (2,134 | 7.3%) for women.
| Age Bracket | Male | Female |
| Under 5 Years | 1,355 (5.5%) | 1,627 (5.6%) |
| 5 to 9 Years | 2,099 (8.5%) | 1,725 (5.9%) |
| 10 to 14 Years | 1,847 (7.5%) | 1,775 (6.1%) |
| 15 to 19 Years | 1,368 (5.5%) | 1,582 (5.4%) |
| 20 to 24 Years | 1,086 (4.4%) | 1,364 (4.7%) |
| 25 to 29 Years | 1,273 (5.1%) | 1,776 (6.1%) |
| 30 to 34 Years | 1,511 (6.1%) | 2,000 (6.9%) |
| 35 to 39 Years | 2,299 (9.3%) | 1,999 (6.9%) |
| 40 to 44 Years | 1,877 (7.6%) | 2,134 (7.3%) |
| 45 to 49 Years | 1,819 (7.3%) | 1,921 (6.6%) |
| 50 to 54 Years | 1,573 (6.4%) | 2,048 (7.0%) |
| 55 to 59 Years | 1,539 (6.2%) | 1,614 (5.6%) |
| 60 to 64 Years | 1,249 (5.1%) | 2,028 (7.0%) |
| 65 to 69 Years | 1,252 (5.1%) | 1,652 (5.7%) |
| 70 to 74 Years | 1,124 (4.5%) | 1,745 (6.0%) |
| 75 to 79 Years | 875 (3.5%) | 991 (3.4%) |
| 80 to 84 Years | 370 (1.5%) | 593 (2.0%) |
| 85 Years and over | 235 (0.9%) | 509 (1.8%) |
| Total | 24,751 (100.0%) | 29,083 (100.0%) |
Families and Households in Oak Park
Median Family Size in Oak Park
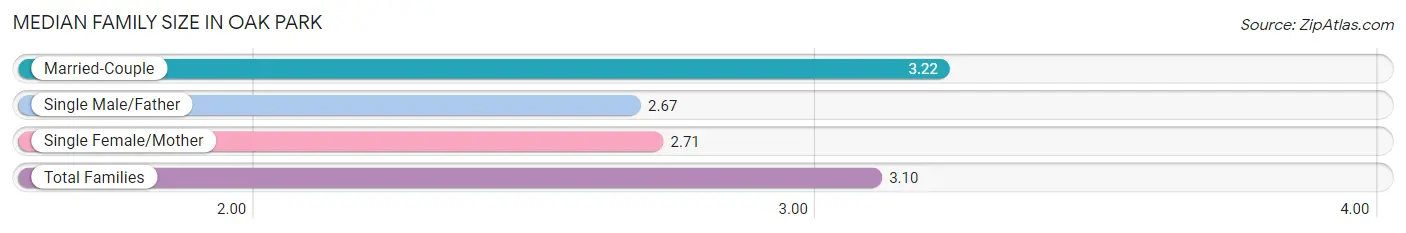
The median family size in Oak Park is 3.10 persons per family, with married-couple families (9,951 | 76.6%) accounting for the largest median family size of 3.22 persons per family. On the other hand, single male/father families (664 | 5.1%) represent the smallest median family size with 2.67 persons per family.
| Family Type | # Families | Family Size |
| Married-Couple | 9,951 (76.6%) | 3.22 |
| Single Male/Father | 664 (5.1%) | 2.67 |
| Single Female/Mother | 2,373 (18.3%) | 2.71 |
| Total Families | 12,988 (100.0%) | 3.10 |
Median Household Size in Oak Park
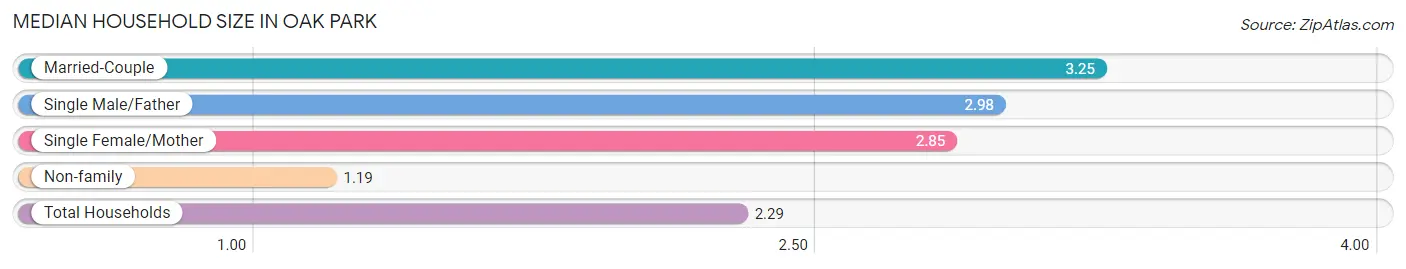
The median household size in Oak Park is 2.29 persons per household, with married-couple households (9,951 | 42.6%) accounting for the largest median household size of 3.25 persons per household. non-family households (10,357 | 44.4%) represent the smallest median household size with 1.19 persons per household.
| Household Type | # Households | Household Size |
| Married-Couple | 9,951 (42.6%) | 3.25 |
| Single Male/Father | 664 (2.8%) | 2.98 |
| Single Female/Mother | 2,373 (10.2%) | 2.85 |
| Non-family | 10,357 (44.4%) | 1.19 |
| Total Households | 23,345 (100.0%) | 2.29 |
Household Size by Marriage Status in Oak Park
Out of a total of 23,345 households in Oak Park, 12,988 (55.6%) are family households, while 10,357 (44.4%) are nonfamily households. The most numerous type of family households are 2-person households, comprising 5,640, and the most common type of nonfamily households are 1-person households, comprising 8,896.
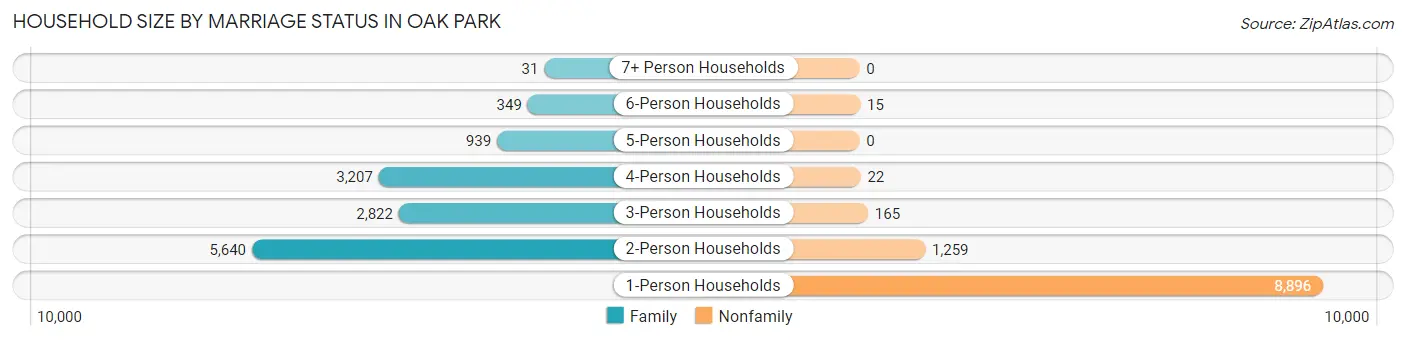
| Household Size | Family Households | Nonfamily Households |
| 1-Person Households | - | 8,896 (38.1%) |
| 2-Person Households | 5,640 (24.2%) | 1,259 (5.4%) |
| 3-Person Households | 2,822 (12.1%) | 165 (0.7%) |
| 4-Person Households | 3,207 (13.7%) | 22 (0.1%) |
| 5-Person Households | 939 (4.0%) | 0 (0.0%) |
| 6-Person Households | 349 (1.5%) | 15 (0.1%) |
| 7+ Person Households | 31 (0.1%) | 0 (0.0%) |
| Total | 12,988 (55.6%) | 10,357 (44.4%) |
Female Fertility in Oak Park
Fertility by Age in Oak Park
Average fertility rate in Oak Park is 39.0 births per 1,000 women. Women in the age bracket of 20 to 34 years have the highest fertility rate with 54.0 births per 1,000 women. Women in the age bracket of 20 to 34 years acount for 54.4% of all women with births.
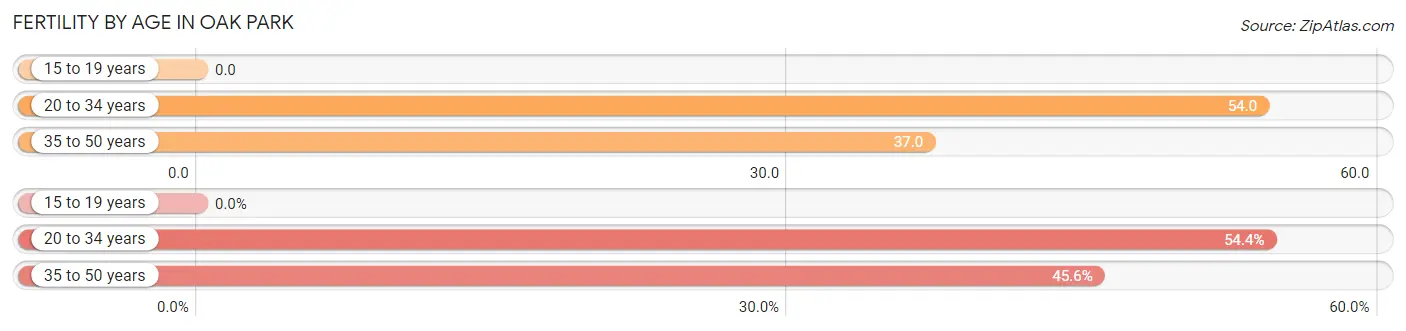
| Age Bracket | Women with Births | Births / 1,000 Women |
| 15 to 19 years | 0 (0.0%) | 0.0 |
| 20 to 34 years | 280 (54.4%) | 54.0 |
| 35 to 50 years | 235 (45.6%) | 37.0 |
| Total | 515 (100.0%) | 39.0 |
Fertility by Age by Marriage Status in Oak Park
60.0% of women with births (515) in Oak Park are married. The highest percentage of unmarried women with births falls into 20 to 34 years age bracket with 59.6% of them unmarried at the time of birth, while the lowest percentage of unmarried women with births belong to 35 to 50 years age bracket with 16.6% of them unmarried.
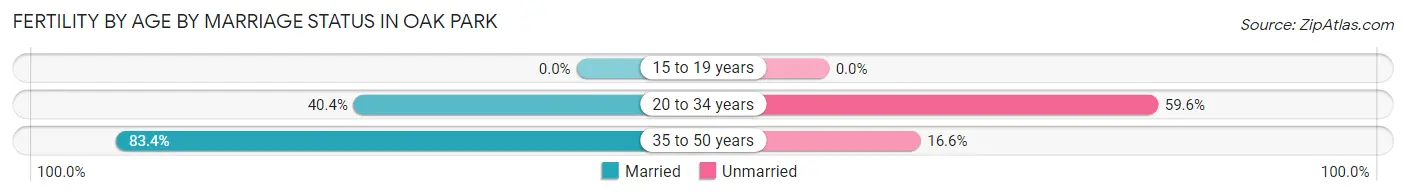
| Age Bracket | Married | Unmarried |
| 15 to 19 years | 0 (0.0%) | 0 (0.0%) |
| 20 to 34 years | 113 (40.4%) | 167 (59.6%) |
| 35 to 50 years | 196 (83.4%) | 39 (16.6%) |
| Total | 309 (60.0%) | 206 (40.0%) |
Fertility by Education in Oak Park
Average fertility rate in Oak Park is 39.0 births per 1,000 women. Women with the education attainment of graduate degree have the highest fertility rate of 66.0 births per 1,000 women, while women with the education attainment of less than high school have the lowest fertility at 5.0 births per 1,000 women. Women with the education attainment of graduate degree represent 56.5% of all women with births.
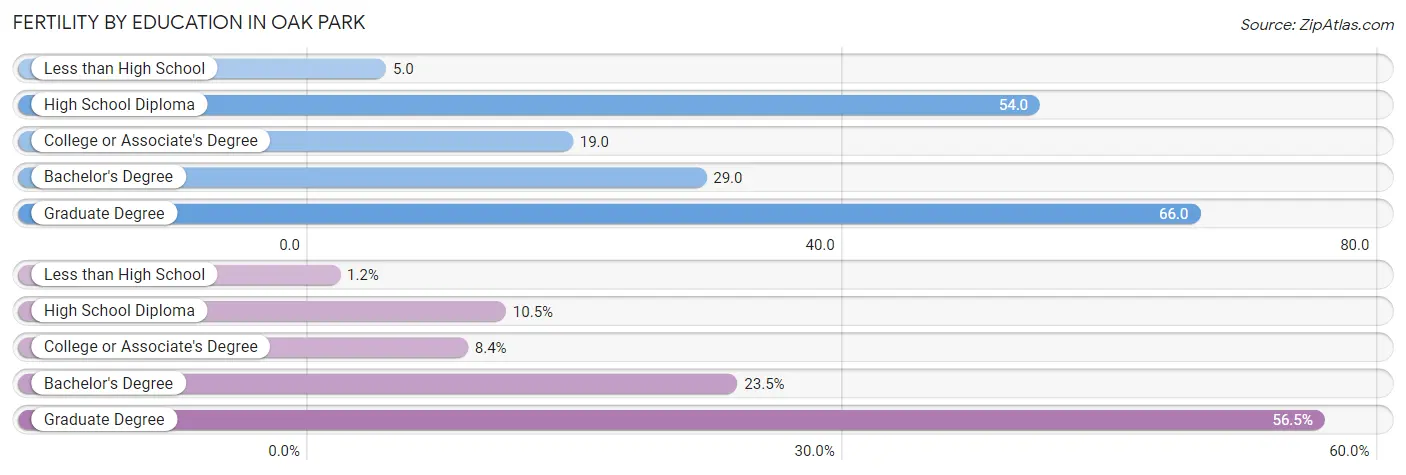
| Educational Attainment | Women with Births | Births / 1,000 Women |
| Less than High School | 6 (1.2%) | 5.0 |
| High School Diploma | 54 (10.5%) | 54.0 |
| College or Associate's Degree | 43 (8.4%) | 19.0 |
| Bachelor's Degree | 121 (23.5%) | 29.0 |
| Graduate Degree | 291 (56.5%) | 66.0 |
| Total | 515 (100.0%) | 39.0 |
Fertility by Education by Marriage Status in Oak Park
40.0% of women with births in Oak Park are unmarried. Women with the educational attainment of high school diploma are most likely to be married with 85.2% of them married at childbirth, while women with the educational attainment of less than high school are least likely to be married with 100.0% of them unmarried at childbirth.
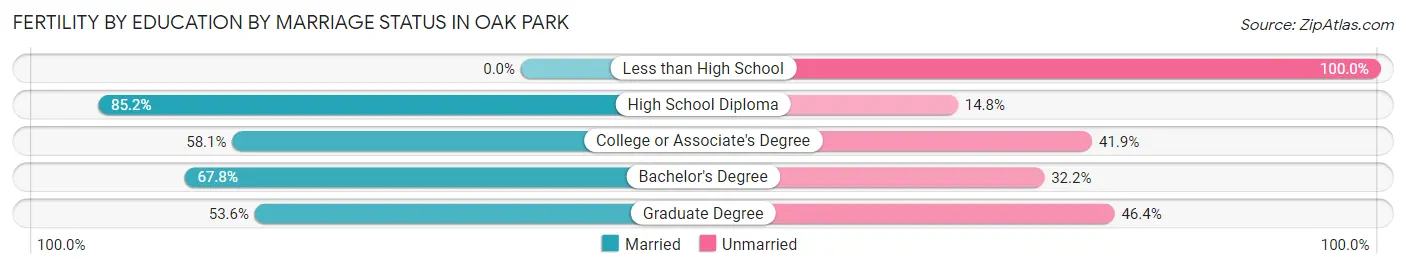
| Educational Attainment | Married | Unmarried |
| Less than High School | 0 (0.0%) | 6 (100.0%) |
| High School Diploma | 46 (85.2%) | 8 (14.8%) |
| College or Associate's Degree | 25 (58.1%) | 18 (41.9%) |
| Bachelor's Degree | 82 (67.8%) | 39 (32.2%) |
| Graduate Degree | 156 (53.6%) | 135 (46.4%) |
| Total | 309 (60.0%) | 206 (40.0%) |
Employment Characteristics in Oak Park
Employment by Class of Employer in Oak Park
Among the 27,916 employed individuals in Oak Park, private company employees (15,909 | 57.0%), not-for-profit organizations (4,913 | 17.6%), and local government employees (2,421 | 8.7%) make up the most common classes of employment.
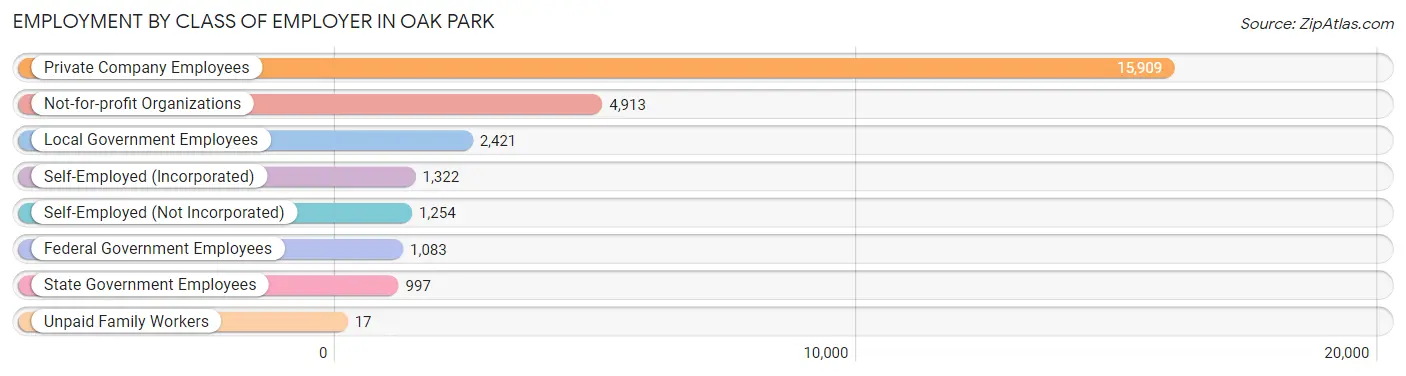
| Employer Class | # Employees | % Employees |
| Private Company Employees | 15,909 | 57.0% |
| Self-Employed (Incorporated) | 1,322 | 4.7% |
| Self-Employed (Not Incorporated) | 1,254 | 4.5% |
| Not-for-profit Organizations | 4,913 | 17.6% |
| Local Government Employees | 2,421 | 8.7% |
| State Government Employees | 997 | 3.6% |
| Federal Government Employees | 1,083 | 3.9% |
| Unpaid Family Workers | 17 | 0.1% |
| Total | 27,916 | 100.0% |
Employment Status by Age in Oak Park
According to the labor force statistics for Oak Park, out of the total population over 16 years of age (42,803), 70.0% or 29,962 individuals are in the labor force, with 4.9% or 1,468 of them unemployed. The age group with the highest labor force participation rate is 35 to 44 years, with 91.4% or 7,594 individuals in the labor force. Within the labor force, the 16 to 19 years age range has the highest percentage of unemployed individuals, with 13.1% or 85 of them being unemployed.
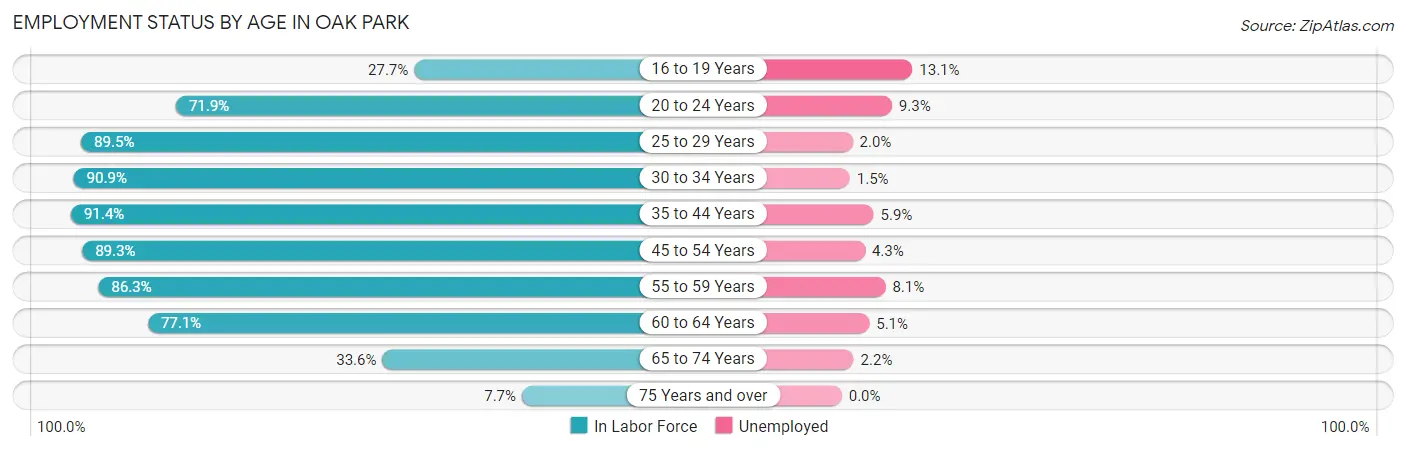
| Age Bracket | In Labor Force | Unemployed |
| 16 to 19 Years | 650 (27.7%) | 85 (13.1%) |
| 20 to 24 Years | 1,762 (71.9%) | 164 (9.3%) |
| 25 to 29 Years | 2,729 (89.5%) | 55 (2.0%) |
| 30 to 34 Years | 3,191 (90.9%) | 48 (1.5%) |
| 35 to 44 Years | 7,594 (91.4%) | 448 (5.9%) |
| 45 to 54 Years | 6,573 (89.3%) | 283 (4.3%) |
| 55 to 59 Years | 2,721 (86.3%) | 220 (8.1%) |
| 60 to 64 Years | 2,527 (77.1%) | 129 (5.1%) |
| 65 to 74 Years | 1,940 (33.6%) | 43 (2.2%) |
| 75 Years and over | 275 (7.7%) | 0 (0.0%) |
| Total | 29,962 (70.0%) | 1,468 (4.9%) |
Employment Status by Educational Attainment in Oak Park
According to labor force statistics for Oak Park, 88.4% of individuals (25,335) out of the total population between 25 and 64 years of age (28,660) are in the labor force, with 4.7% or 1,191 of them being unemployed. The group with the highest labor force participation rate are those with the educational attainment of bachelor's degree or higher, with 91.1% or 19,239 individuals in the labor force. Within the labor force, individuals with less than high school education have the highest percentage of unemployment, with 25.9% or 75 of them being unemployed.
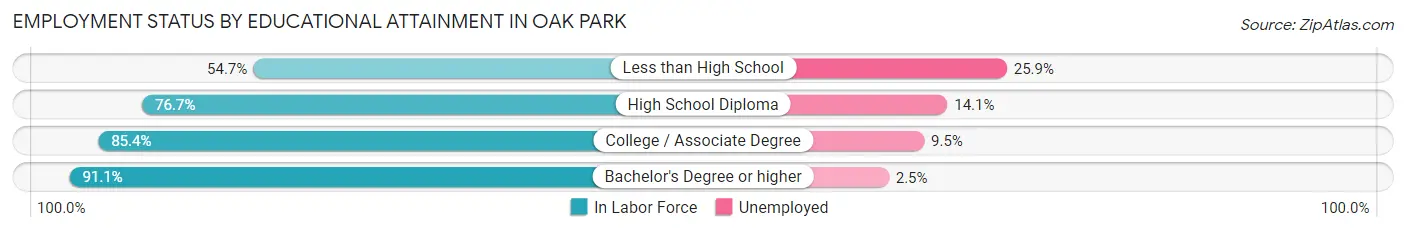
| Educational Attainment | In Labor Force | Unemployed |
| Less than High School | 290 (54.7%) | 137 (25.9%) |
| High School Diploma | 1,596 (76.7%) | 293 (14.1%) |
| College / Associate Degree | 4,210 (85.4%) | 468 (9.5%) |
| Bachelor's Degree or higher | 19,239 (91.1%) | 528 (2.5%) |
| Total | 25,335 (88.4%) | 1,347 (4.7%) |
Employment Occupations by Sex in Oak Park
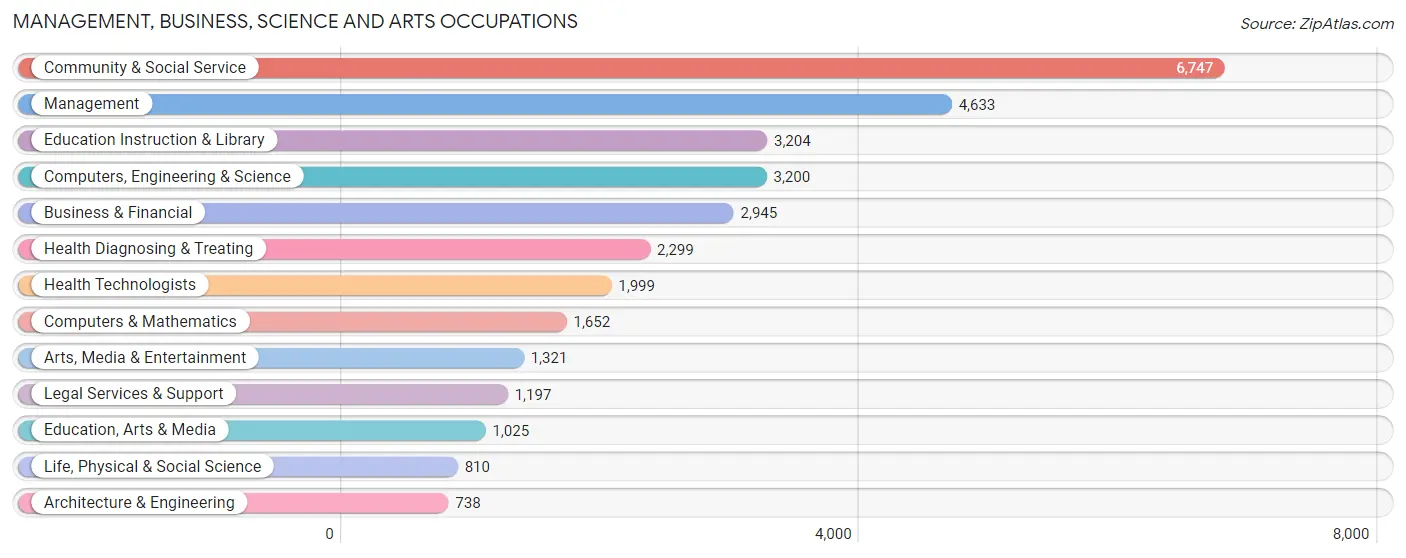
Management, Business, Science and Arts Occupations
The most common Management, Business, Science and Arts occupations in Oak Park are Community & Social Service (6,747 | 23.7%), Management (4,633 | 16.3%), Education Instruction & Library (3,204 | 11.3%), Computers, Engineering & Science (3,200 | 11.2%), and Business & Financial (2,945 | 10.3%).
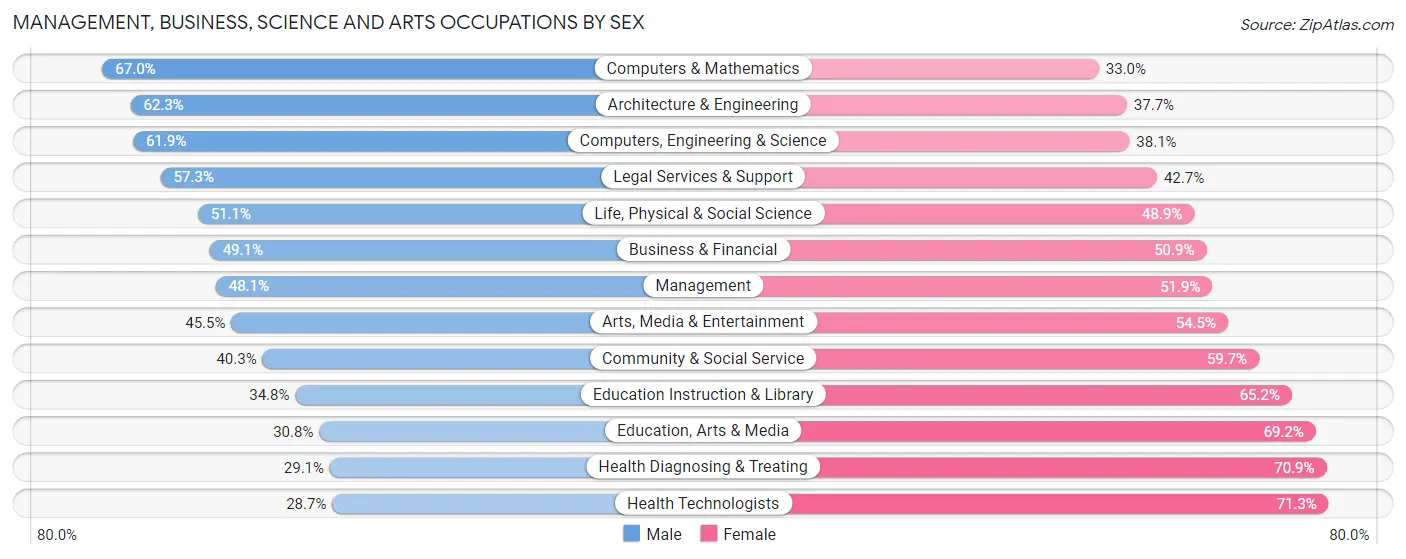
Management, Business, Science and Arts Occupations by Sex
Within the Management, Business, Science and Arts occupations in Oak Park, the most male-oriented occupations are Computers & Mathematics (67.0%), Architecture & Engineering (62.3%), and Computers, Engineering & Science (61.9%), while the most female-oriented occupations are Health Technologists (71.3%), Health Diagnosing & Treating (70.9%), and Education, Arts & Media (69.2%).
| Occupation | Male | Female |
| Management | 2,228 (48.1%) | 2,405 (51.9%) |
| Business & Financial | 1,446 (49.1%) | 1,499 (50.9%) |
| Computers, Engineering & Science | 1,981 (61.9%) | 1,219 (38.1%) |
| Computers & Mathematics | 1,107 (67.0%) | 545 (33.0%) |
| Architecture & Engineering | 460 (62.3%) | 278 (37.7%) |
| Life, Physical & Social Science | 414 (51.1%) | 396 (48.9%) |
| Community & Social Service | 2,719 (40.3%) | 4,028 (59.7%) |
| Education, Arts & Media | 316 (30.8%) | 709 (69.2%) |
| Legal Services & Support | 686 (57.3%) | 511 (42.7%) |
| Education Instruction & Library | 1,116 (34.8%) | 2,088 (65.2%) |
| Arts, Media & Entertainment | 601 (45.5%) | 720 (54.5%) |
| Health Diagnosing & Treating | 668 (29.1%) | 1,631 (70.9%) |
| Health Technologists | 573 (28.7%) | 1,426 (71.3%) |
| Total (Category) | 9,042 (45.6%) | 10,782 (54.4%) |
| Total (Overall) | 13,413 (47.1%) | 15,047 (52.9%) |
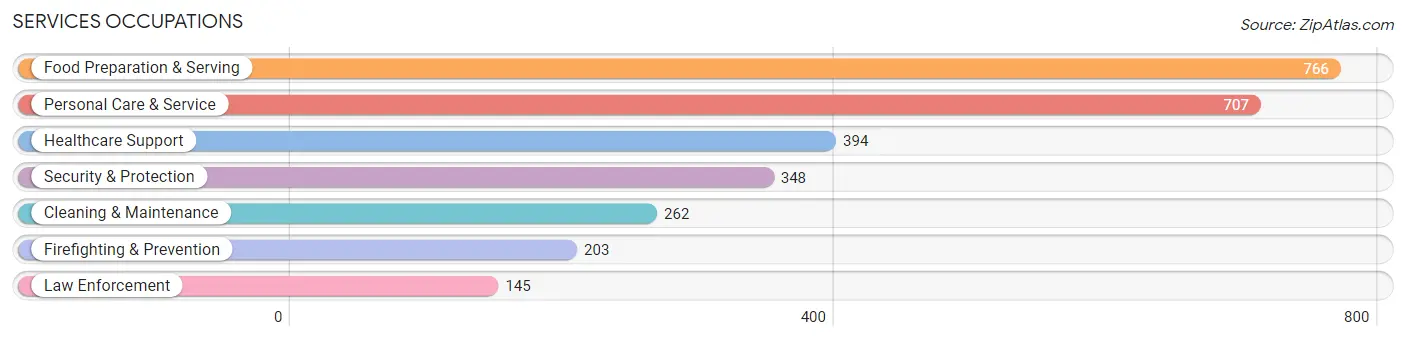
Services Occupations
The most common Services occupations in Oak Park are Food Preparation & Serving (766 | 2.7%), Personal Care & Service (707 | 2.5%), Healthcare Support (394 | 1.4%), Security & Protection (348 | 1.2%), and Cleaning & Maintenance (262 | 0.9%).
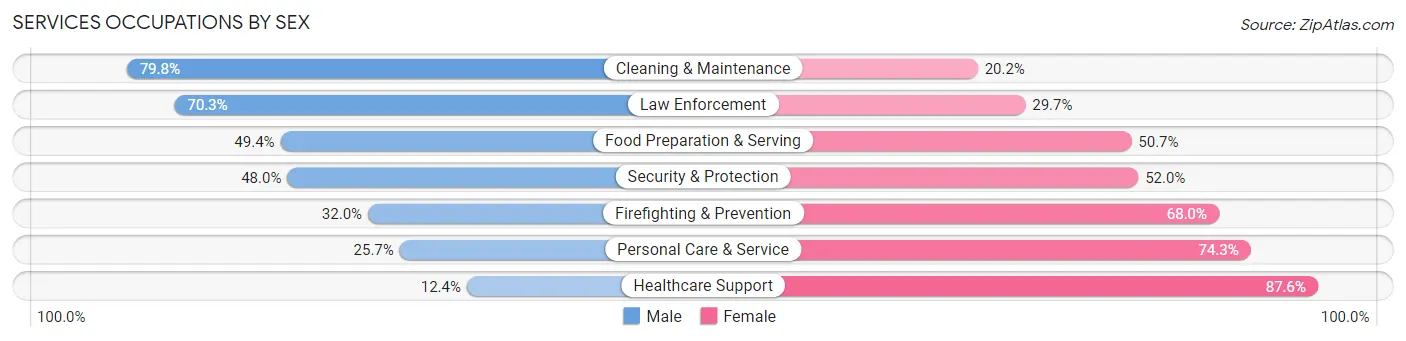
Services Occupations by Sex
Within the Services occupations in Oak Park, the most male-oriented occupations are Cleaning & Maintenance (79.8%), Law Enforcement (70.3%), and Food Preparation & Serving (49.3%), while the most female-oriented occupations are Healthcare Support (87.6%), Personal Care & Service (74.3%), and Firefighting & Prevention (68.0%).
| Occupation | Male | Female |
| Healthcare Support | 49 (12.4%) | 345 (87.6%) |
| Security & Protection | 167 (48.0%) | 181 (52.0%) |
| Firefighting & Prevention | 65 (32.0%) | 138 (68.0%) |
| Law Enforcement | 102 (70.3%) | 43 (29.7%) |
| Food Preparation & Serving | 378 (49.3%) | 388 (50.6%) |
| Cleaning & Maintenance | 209 (79.8%) | 53 (20.2%) |
| Personal Care & Service | 182 (25.7%) | 525 (74.3%) |
| Total (Category) | 985 (39.8%) | 1,492 (60.2%) |
| Total (Overall) | 13,413 (47.1%) | 15,047 (52.9%) |
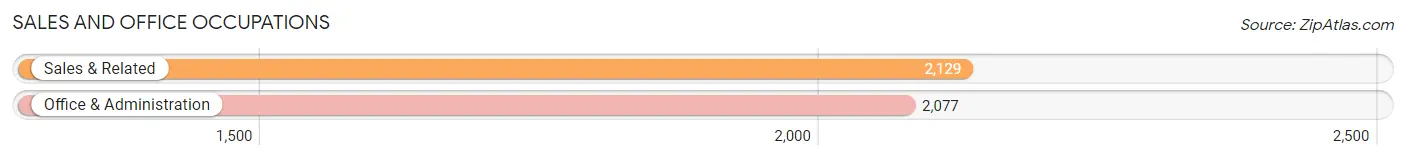
Sales and Office Occupations
The most common Sales and Office occupations in Oak Park are Sales & Related (2,129 | 7.5%), and Office & Administration (2,077 | 7.3%).
Sales and Office Occupations by Sex
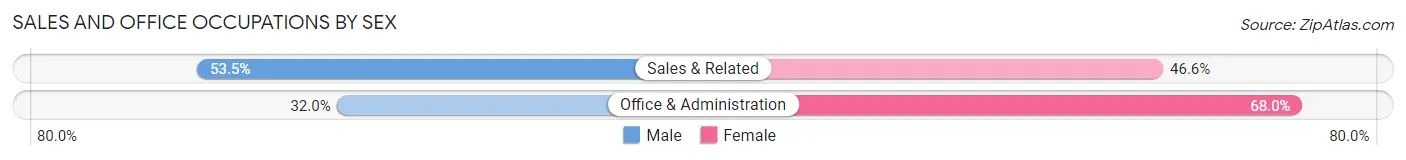
| Occupation | Male | Female |
| Sales & Related | 1,138 (53.4%) | 991 (46.6%) |
| Office & Administration | 665 (32.0%) | 1,412 (68.0%) |
| Total (Category) | 1,803 (42.9%) | 2,403 (57.1%) |
| Total (Overall) | 13,413 (47.1%) | 15,047 (52.9%) |
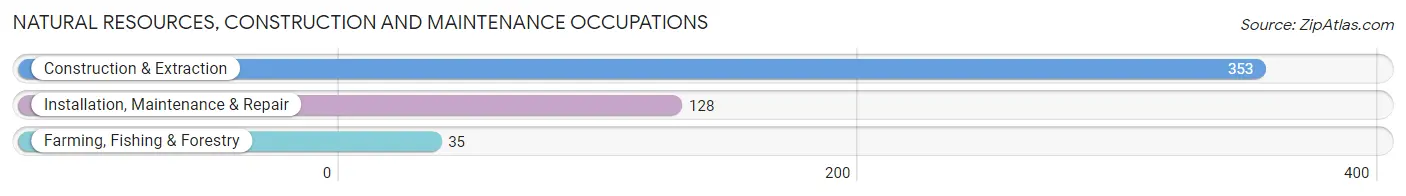
Natural Resources, Construction and Maintenance Occupations
The most common Natural Resources, Construction and Maintenance occupations in Oak Park are Construction & Extraction (353 | 1.2%), Installation, Maintenance & Repair (128 | 0.4%), and Farming, Fishing & Forestry (35 | 0.1%).
Natural Resources, Construction and Maintenance Occupations by Sex
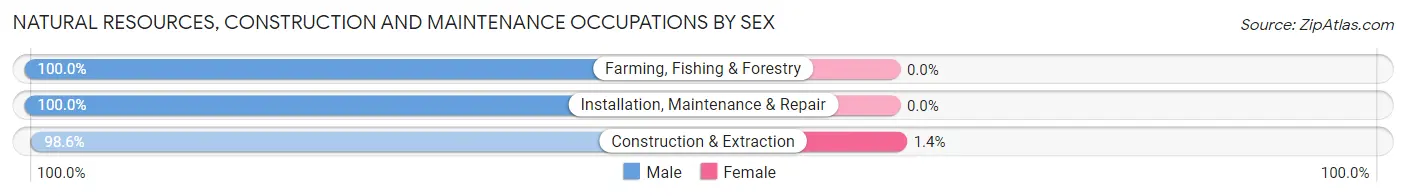
| Occupation | Male | Female |
| Farming, Fishing & Forestry | 35 (100.0%) | 0 (0.0%) |
| Construction & Extraction | 348 (98.6%) | 5 (1.4%) |
| Installation, Maintenance & Repair | 128 (100.0%) | 0 (0.0%) |
| Total (Category) | 511 (99.0%) | 5 (1.0%) |
| Total (Overall) | 13,413 (47.1%) | 15,047 (52.9%) |
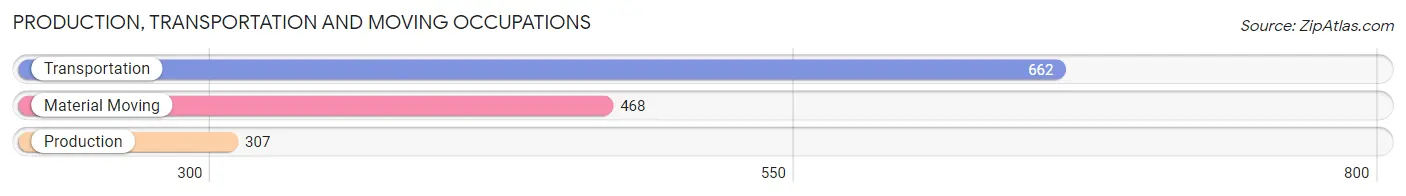
Production, Transportation and Moving Occupations
The most common Production, Transportation and Moving occupations in Oak Park are Transportation (662 | 2.3%), Material Moving (468 | 1.6%), and Production (307 | 1.1%).
Production, Transportation and Moving Occupations by Sex
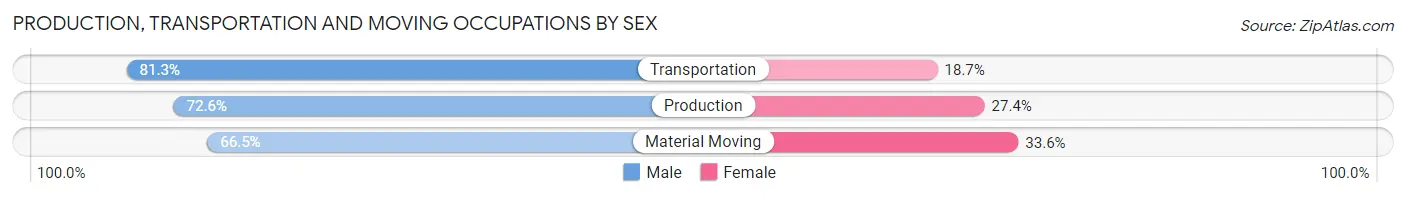
| Occupation | Male | Female |
| Production | 223 (72.6%) | 84 (27.4%) |
| Transportation | 538 (81.3%) | 124 (18.7%) |
| Material Moving | 311 (66.4%) | 157 (33.6%) |
| Total (Category) | 1,072 (74.6%) | 365 (25.4%) |
| Total (Overall) | 13,413 (47.1%) | 15,047 (52.9%) |
Employment Industries by Sex in Oak Park
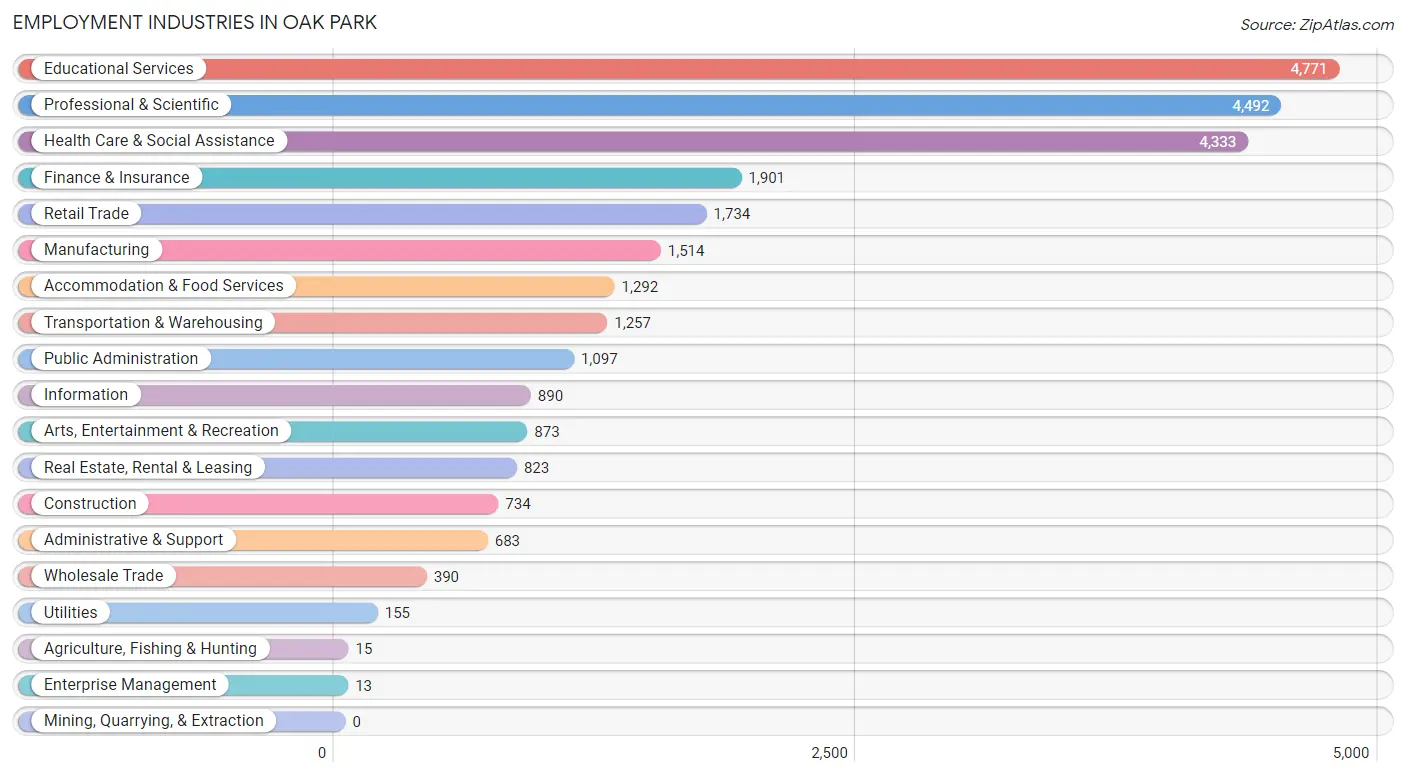
Employment Industries in Oak Park
The major employment industries in Oak Park include Educational Services (4,771 | 16.8%), Professional & Scientific (4,492 | 15.8%), Health Care & Social Assistance (4,333 | 15.2%), Finance & Insurance (1,901 | 6.7%), and Retail Trade (1,734 | 6.1%).
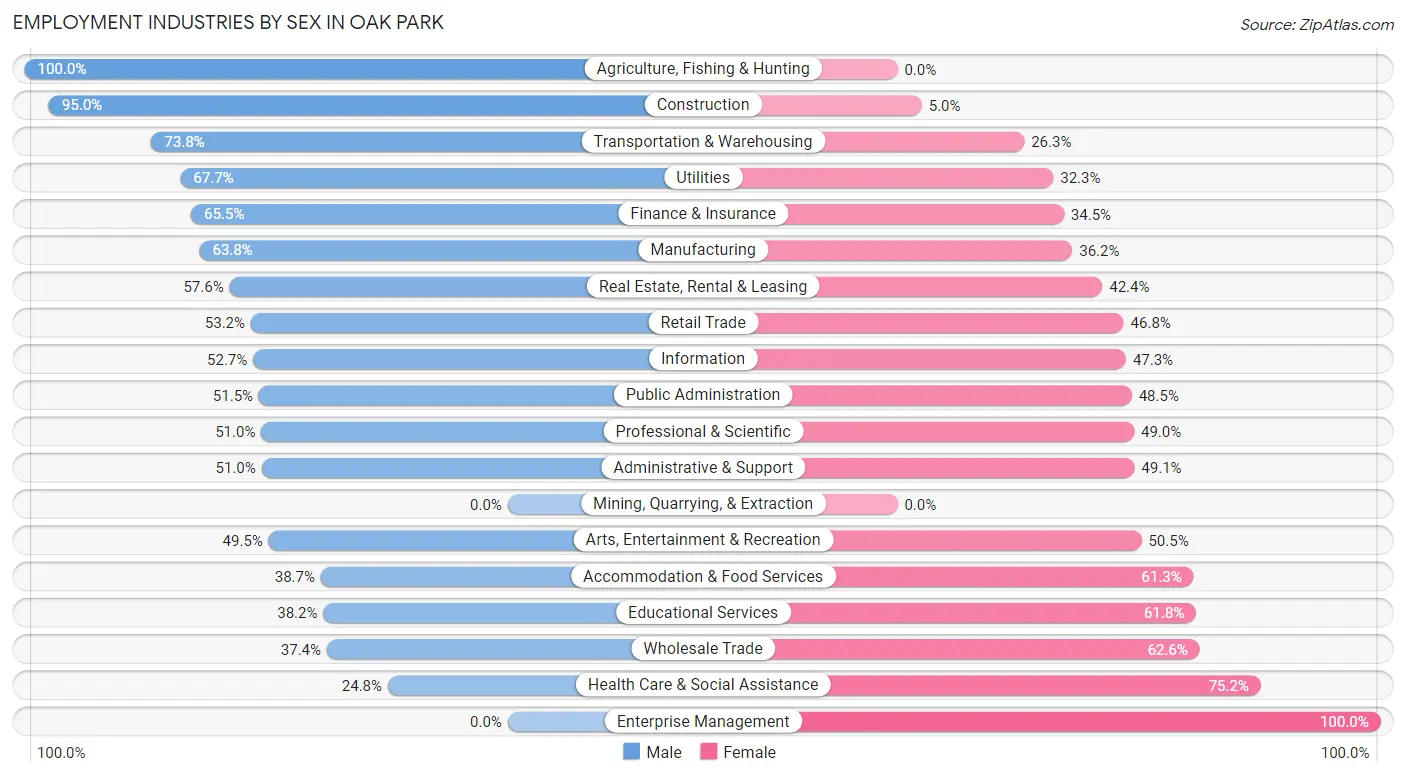
Employment Industries by Sex in Oak Park
The Oak Park industries that see more men than women are Agriculture, Fishing & Hunting (100.0%), Construction (95.0%), and Transportation & Warehousing (73.8%), whereas the industries that tend to have a higher number of women are Enterprise Management (100.0%), Health Care & Social Assistance (75.2%), and Wholesale Trade (62.6%).
| Industry | Male | Female |
| Agriculture, Fishing & Hunting | 15 (100.0%) | 0 (0.0%) |
| Mining, Quarrying, & Extraction | 0 (0.0%) | 0 (0.0%) |
| Construction | 697 (95.0%) | 37 (5.0%) |
| Manufacturing | 966 (63.8%) | 548 (36.2%) |
| Wholesale Trade | 146 (37.4%) | 244 (62.6%) |
| Retail Trade | 922 (53.2%) | 812 (46.8%) |
| Transportation & Warehousing | 927 (73.8%) | 330 (26.3%) |
| Utilities | 105 (67.7%) | 50 (32.3%) |
| Information | 469 (52.7%) | 421 (47.3%) |
| Finance & Insurance | 1,246 (65.5%) | 655 (34.5%) |
| Real Estate, Rental & Leasing | 474 (57.6%) | 349 (42.4%) |
| Professional & Scientific | 2,292 (51.0%) | 2,200 (49.0%) |
| Enterprise Management | 0 (0.0%) | 13 (100.0%) |
| Administrative & Support | 348 (50.9%) | 335 (49.0%) |
| Educational Services | 1,821 (38.2%) | 2,950 (61.8%) |
| Health Care & Social Assistance | 1,075 (24.8%) | 3,258 (75.2%) |
| Arts, Entertainment & Recreation | 432 (49.5%) | 441 (50.5%) |
| Accommodation & Food Services | 500 (38.7%) | 792 (61.3%) |
| Public Administration | 565 (51.5%) | 532 (48.5%) |
| Total | 13,413 (47.1%) | 15,047 (52.9%) |
Education in Oak Park
School Enrollment in Oak Park
The most common levels of schooling among the 14,575 students in Oak Park are middle school (2,956 | 20.3%), high school (2,899 | 19.9%), and elementary school (2,795 | 19.2%).
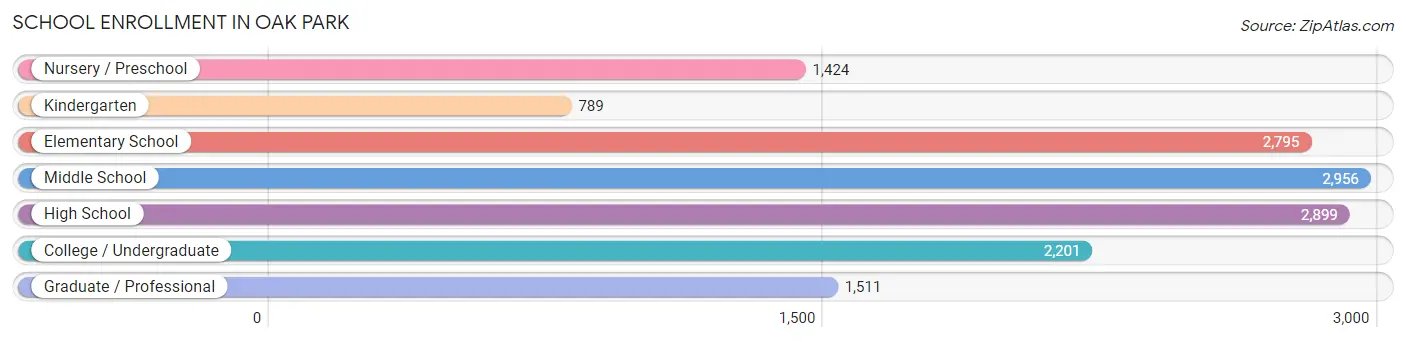
| School Level | # Students | % Students |
| Nursery / Preschool | 1,424 | 9.8% |
| Kindergarten | 789 | 5.4% |
| Elementary School | 2,795 | 19.2% |
| Middle School | 2,956 | 20.3% |
| High School | 2,899 | 19.9% |
| College / Undergraduate | 2,201 | 15.1% |
| Graduate / Professional | 1,511 | 10.4% |
| Total | 14,575 | 100.0% |
School Enrollment by Age by Funding Source in Oak Park
Out of a total of 14,575 students who are enrolled in schools in Oak Park, 3,527 (24.2%) attend a private institution, while the remaining 11,048 (75.8%) are enrolled in public schools. The age group of 3 to 4 year olds has the highest likelihood of being enrolled in private schools, with 686 (68.0% in the age bracket) enrolled. Conversely, the age group of 15 to 17 year olds has the lowest likelihood of being enrolled in a private school, with 1,937 (95.8% in the age bracket) attending a public institution.
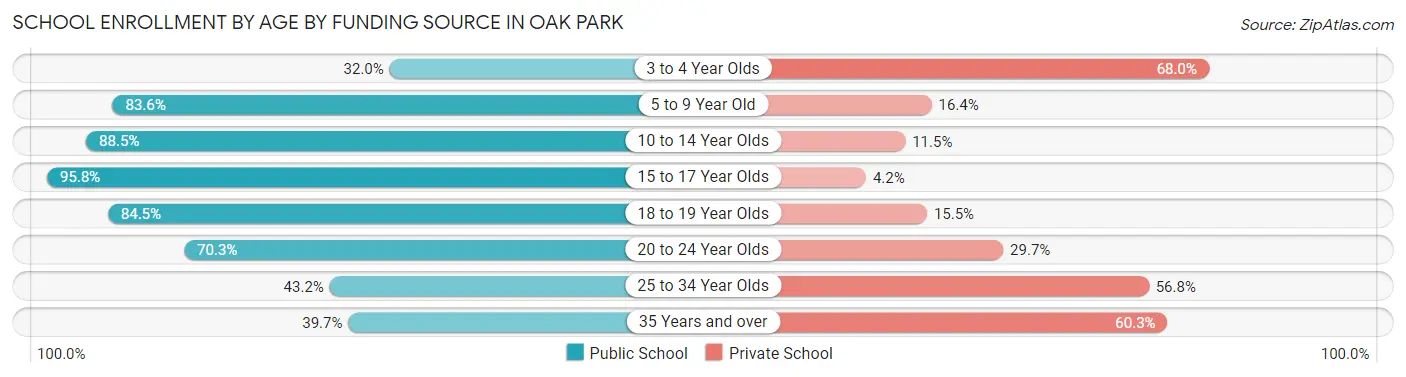
| Age Bracket | Public School | Private School |
| 3 to 4 Year Olds | 323 (32.0%) | 686 (68.0%) |
| 5 to 9 Year Old | 3,130 (83.6%) | 613 (16.4%) |
| 10 to 14 Year Olds | 3,165 (88.5%) | 410 (11.5%) |
| 15 to 17 Year Olds | 1,937 (95.8%) | 84 (4.2%) |
| 18 to 19 Year Olds | 692 (84.5%) | 127 (15.5%) |
| 20 to 24 Year Olds | 918 (70.3%) | 388 (29.7%) |
| 25 to 34 Year Olds | 576 (43.2%) | 758 (56.8%) |
| 35 Years and over | 305 (39.7%) | 463 (60.3%) |
| Total | 11,048 (75.8%) | 3,527 (24.2%) |
Educational Attainment by Field of Study in Oak Park
Business (4,174 | 14.0%), social sciences (3,177 | 10.7%), education (2,868 | 9.7%), literature & languages (2,399 | 8.1%), and communications (2,351 | 7.9%) are the most common fields of study among 29,733 individuals in Oak Park who have obtained a bachelor's degree or higher.
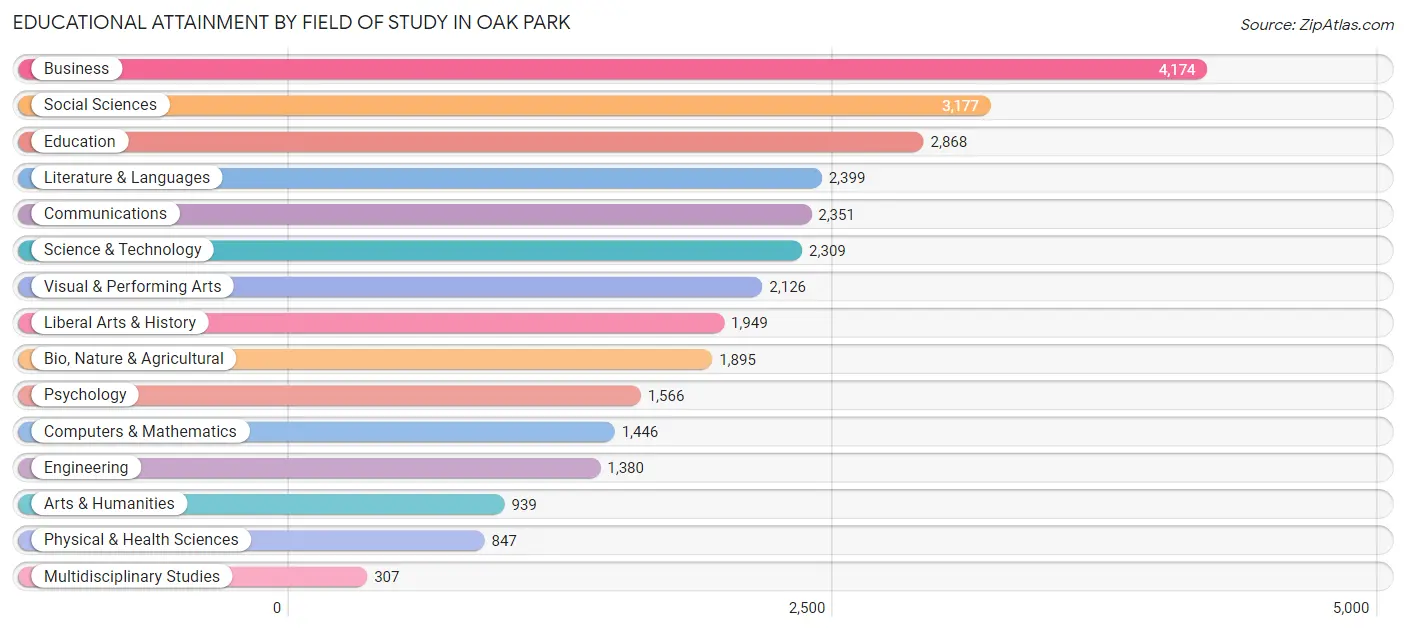
| Field of Study | # Graduates | % Graduates |
| Computers & Mathematics | 1,446 | 4.9% |
| Bio, Nature & Agricultural | 1,895 | 6.4% |
| Physical & Health Sciences | 847 | 2.9% |
| Psychology | 1,566 | 5.3% |
| Social Sciences | 3,177 | 10.7% |
| Engineering | 1,380 | 4.6% |
| Multidisciplinary Studies | 307 | 1.0% |
| Science & Technology | 2,309 | 7.8% |
| Business | 4,174 | 14.0% |
| Education | 2,868 | 9.7% |
| Literature & Languages | 2,399 | 8.1% |
| Liberal Arts & History | 1,949 | 6.6% |
| Visual & Performing Arts | 2,126 | 7.1% |
| Communications | 2,351 | 7.9% |
| Arts & Humanities | 939 | 3.2% |
| Total | 29,733 | 100.0% |
Transportation & Commute in Oak Park
Vehicle Availability by Sex in Oak Park
The most prevalent vehicle ownership categories in Oak Park are males with 2 vehicles (6,377, accounting for 48.4%) and females with 2 vehicles (5,839, making up 43.4%).
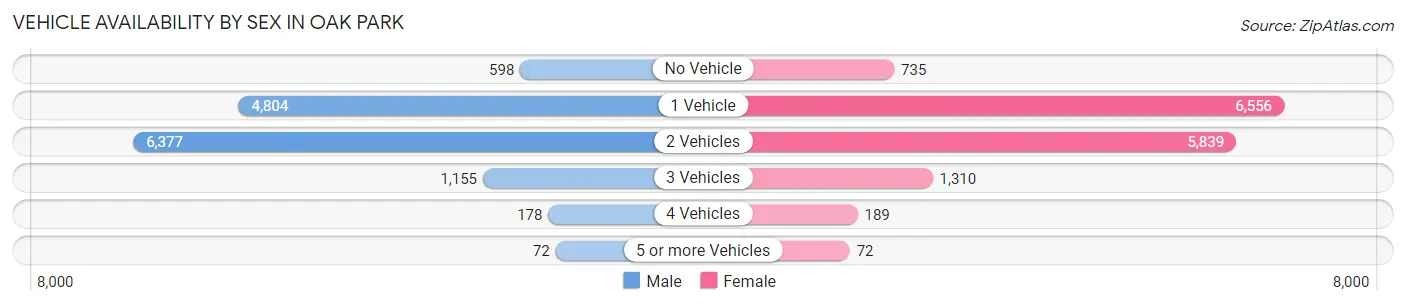
| Vehicles Available | Male | Female |
| No Vehicle | 598 (4.5%) | 735 (5.0%) |
| 1 Vehicle | 4,804 (36.4%) | 6,556 (44.6%) |
| 2 Vehicles | 6,377 (48.4%) | 5,839 (39.7%) |
| 3 Vehicles | 1,155 (8.8%) | 1,310 (8.9%) |
| 4 Vehicles | 178 (1.3%) | 189 (1.3%) |
| 5 or more Vehicles | 72 (0.5%) | 72 (0.5%) |
| Total | 13,184 (100.0%) | 14,701 (100.0%) |
Commute Time in Oak Park
The most frequently occuring commute durations in Oak Park are 45 to 59 minutes (4,454 commuters, 20.6%), 30 to 34 minutes (3,485 commuters, 16.1%), and 20 to 24 minutes (2,223 commuters, 10.3%).
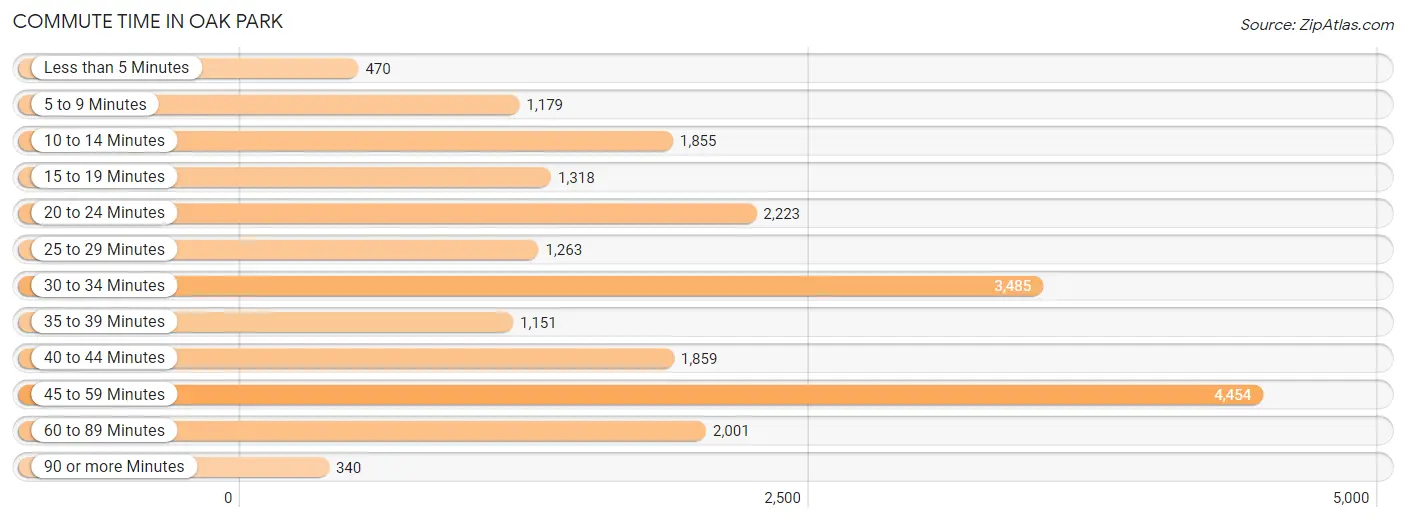
| Commute Time | # Commuters | % Commuters |
| Less than 5 Minutes | 470 | 2.2% |
| 5 to 9 Minutes | 1,179 | 5.5% |
| 10 to 14 Minutes | 1,855 | 8.6% |
| 15 to 19 Minutes | 1,318 | 6.1% |
| 20 to 24 Minutes | 2,223 | 10.3% |
| 25 to 29 Minutes | 1,263 | 5.9% |
| 30 to 34 Minutes | 3,485 | 16.1% |
| 35 to 39 Minutes | 1,151 | 5.3% |
| 40 to 44 Minutes | 1,859 | 8.6% |
| 45 to 59 Minutes | 4,454 | 20.6% |
| 60 to 89 Minutes | 2,001 | 9.3% |
| 90 or more Minutes | 340 | 1.6% |
Commute Time by Sex in Oak Park
The most common commute times in Oak Park are 45 to 59 minutes (2,397 commuters, 23.3%) for males and 45 to 59 minutes (2,057 commuters, 18.2%) for females.
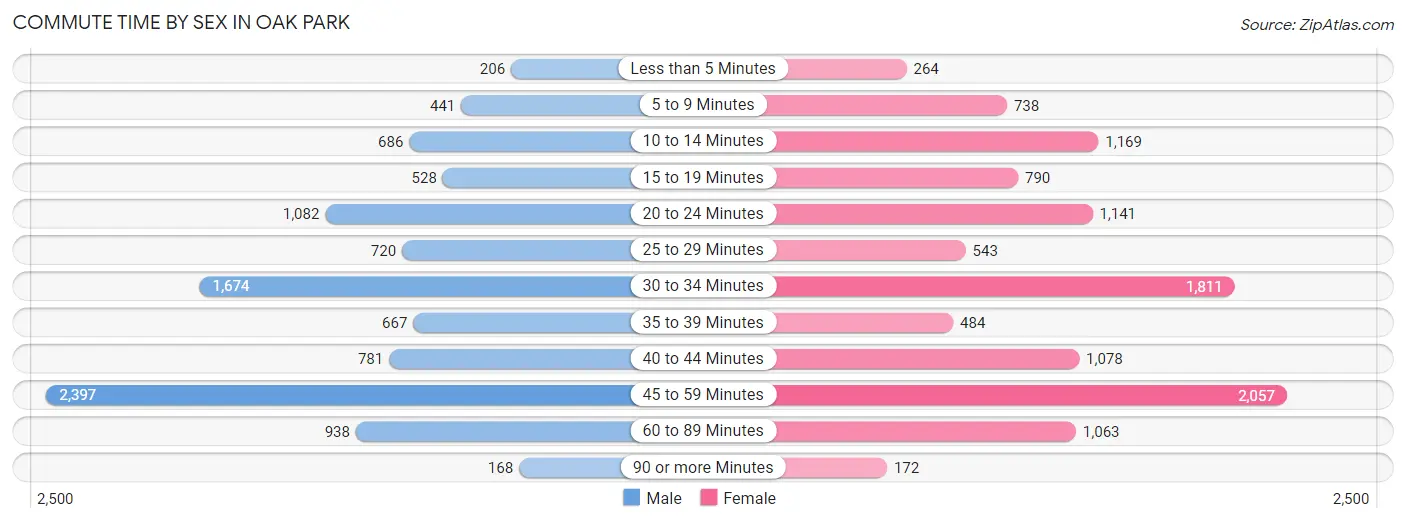
| Commute Time | Male | Female |
| Less than 5 Minutes | 206 (2.0%) | 264 (2.3%) |
| 5 to 9 Minutes | 441 (4.3%) | 738 (6.5%) |
| 10 to 14 Minutes | 686 (6.7%) | 1,169 (10.3%) |
| 15 to 19 Minutes | 528 (5.1%) | 790 (7.0%) |
| 20 to 24 Minutes | 1,082 (10.5%) | 1,141 (10.1%) |
| 25 to 29 Minutes | 720 (7.0%) | 543 (4.8%) |
| 30 to 34 Minutes | 1,674 (16.3%) | 1,811 (16.0%) |
| 35 to 39 Minutes | 667 (6.5%) | 484 (4.3%) |
| 40 to 44 Minutes | 781 (7.6%) | 1,078 (9.5%) |
| 45 to 59 Minutes | 2,397 (23.3%) | 2,057 (18.2%) |
| 60 to 89 Minutes | 938 (9.1%) | 1,063 (9.4%) |
| 90 or more Minutes | 168 (1.6%) | 172 (1.5%) |
Time of Departure to Work by Sex in Oak Park
The most frequent times of departure to work in Oak Park are 8:00 AM to 8:29 AM (2,113, 20.5%) for males and 8:00 AM to 8:29 AM (2,573, 22.8%) for females.
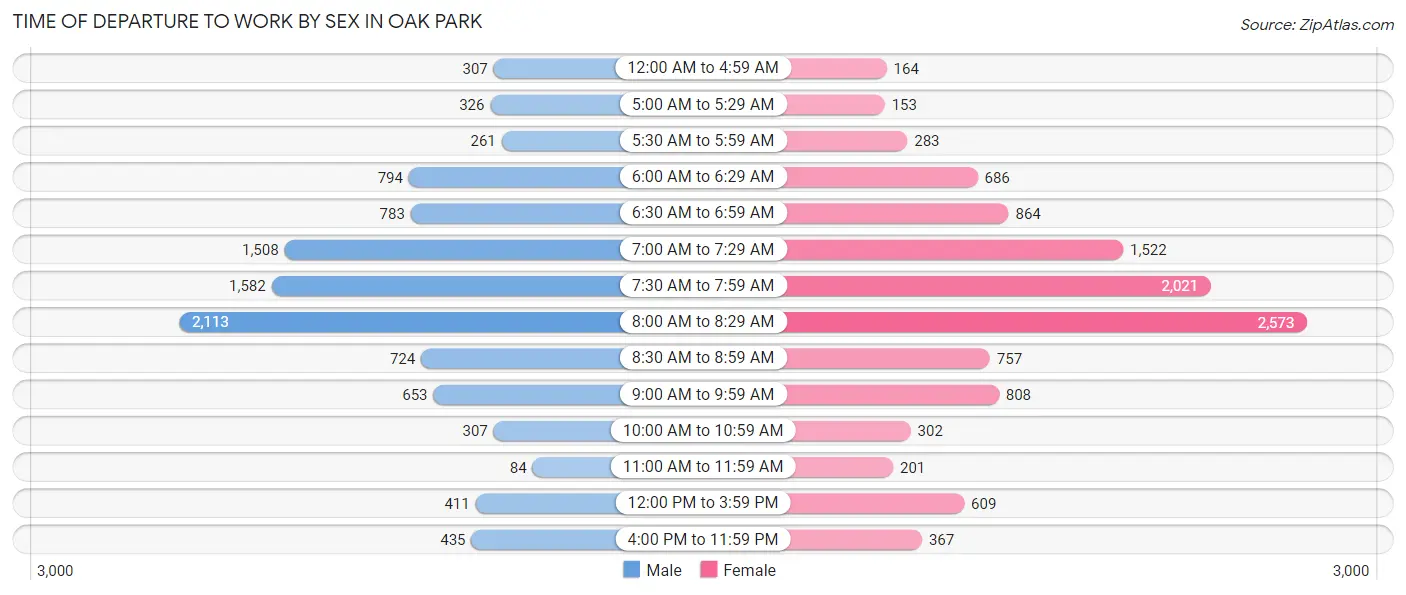
| Time of Departure | Male | Female |
| 12:00 AM to 4:59 AM | 307 (3.0%) | 164 (1.5%) |
| 5:00 AM to 5:29 AM | 326 (3.2%) | 153 (1.3%) |
| 5:30 AM to 5:59 AM | 261 (2.5%) | 283 (2.5%) |
| 6:00 AM to 6:29 AM | 794 (7.7%) | 686 (6.1%) |
| 6:30 AM to 6:59 AM | 783 (7.6%) | 864 (7.6%) |
| 7:00 AM to 7:29 AM | 1,508 (14.7%) | 1,522 (13.5%) |
| 7:30 AM to 7:59 AM | 1,582 (15.4%) | 2,021 (17.9%) |
| 8:00 AM to 8:29 AM | 2,113 (20.5%) | 2,573 (22.8%) |
| 8:30 AM to 8:59 AM | 724 (7.0%) | 757 (6.7%) |
| 9:00 AM to 9:59 AM | 653 (6.4%) | 808 (7.1%) |
| 10:00 AM to 10:59 AM | 307 (3.0%) | 302 (2.7%) |
| 11:00 AM to 11:59 AM | 84 (0.8%) | 201 (1.8%) |
| 12:00 PM to 3:59 PM | 411 (4.0%) | 609 (5.4%) |
| 4:00 PM to 11:59 PM | 435 (4.2%) | 367 (3.2%) |
| Total | 10,288 (100.0%) | 11,310 (100.0%) |
Housing Occupancy in Oak Park
Occupancy by Ownership in Oak Park
Of the total 23,345 dwellings in Oak Park, owner-occupied units account for 13,894 (59.5%), while renter-occupied units make up 9,451 (40.5%).
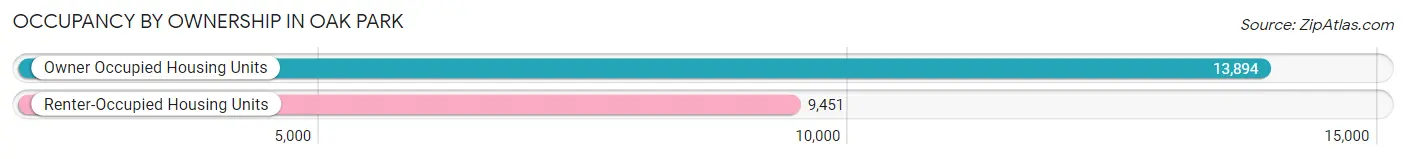
| Occupancy | # Housing Units | % Housing Units |
| Owner Occupied Housing Units | 13,894 | 59.5% |
| Renter-Occupied Housing Units | 9,451 | 40.5% |
| Total Occupied Housing Units | 23,345 | 100.0% |
Occupancy by Household Size in Oak Park
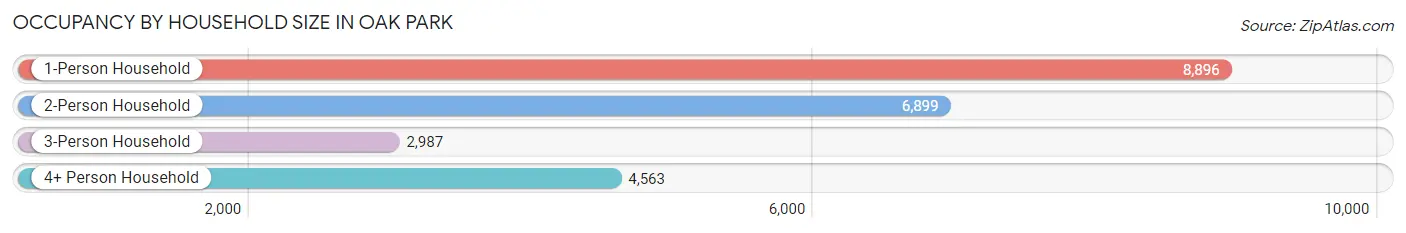
| Household Size | # Housing Units | % Housing Units |
| 1-Person Household | 8,896 | 38.1% |
| 2-Person Household | 6,899 | 29.5% |
| 3-Person Household | 2,987 | 12.8% |
| 4+ Person Household | 4,563 | 19.6% |
| Total Housing Units | 23,345 | 100.0% |
Occupancy by Ownership by Household Size in Oak Park
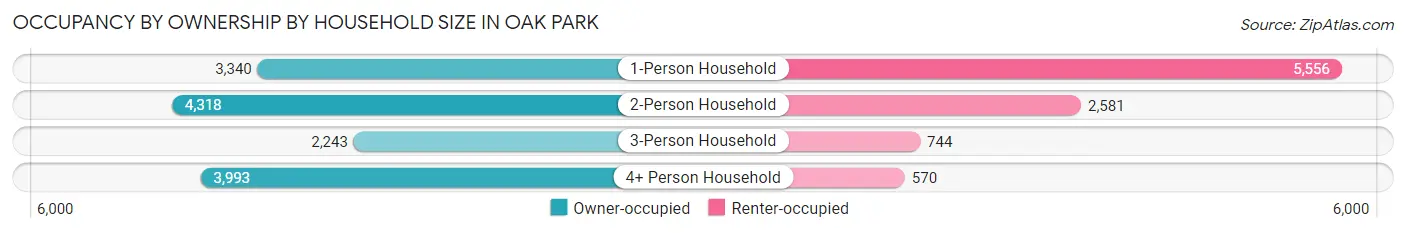
| Household Size | Owner-occupied | Renter-occupied |
| 1-Person Household | 3,340 (37.5%) | 5,556 (62.5%) |
| 2-Person Household | 4,318 (62.6%) | 2,581 (37.4%) |
| 3-Person Household | 2,243 (75.1%) | 744 (24.9%) |
| 4+ Person Household | 3,993 (87.5%) | 570 (12.5%) |
| Total Housing Units | 13,894 (59.5%) | 9,451 (40.5%) |
Occupancy by Educational Attainment in Oak Park
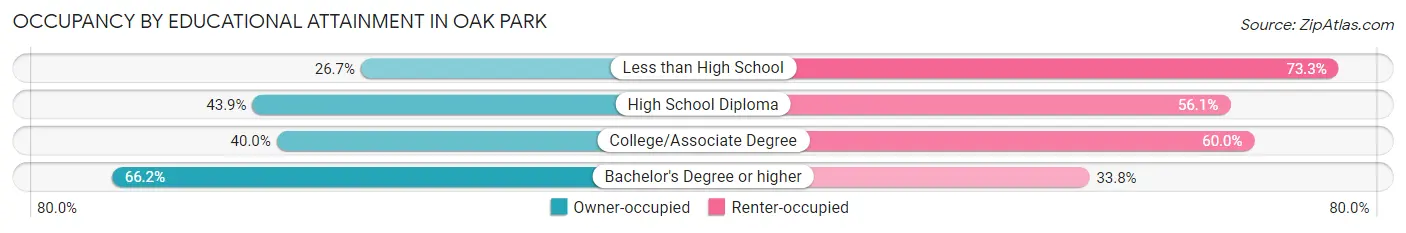
| Household Size | Owner-occupied | Renter-occupied |
| Less than High School | 152 (26.7%) | 418 (73.3%) |
| High School Diploma | 680 (43.9%) | 870 (56.1%) |
| College/Associate Degree | 1,504 (40.0%) | 2,253 (60.0%) |
| Bachelor's Degree or higher | 11,558 (66.2%) | 5,910 (33.8%) |
Occupancy by Age of Householder in Oak Park
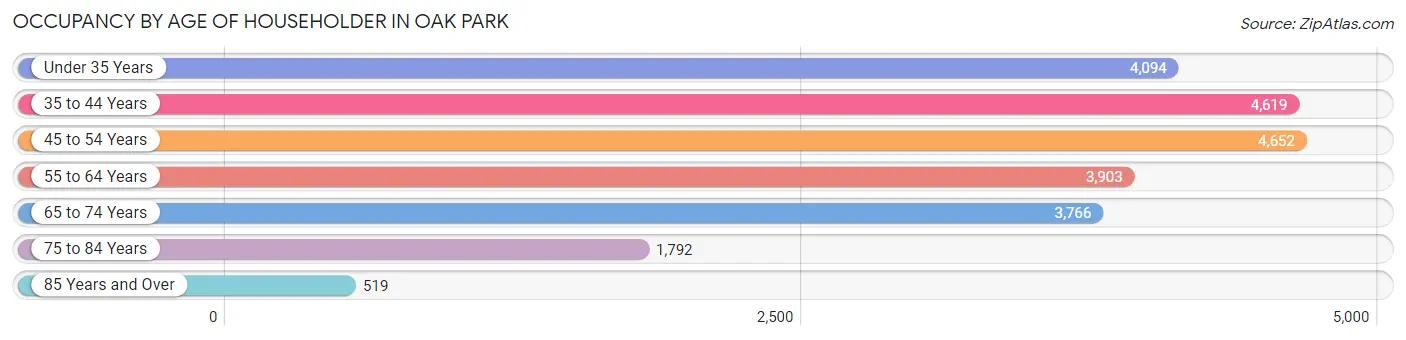
| Age Bracket | # Households | % Households |
| Under 35 Years | 4,094 | 17.5% |
| 35 to 44 Years | 4,619 | 19.8% |
| 45 to 54 Years | 4,652 | 19.9% |
| 55 to 64 Years | 3,903 | 16.7% |
| 65 to 74 Years | 3,766 | 16.1% |
| 75 to 84 Years | 1,792 | 7.7% |
| 85 Years and Over | 519 | 2.2% |
| Total | 23,345 | 100.0% |
Housing Finances in Oak Park
Median Income by Occupancy in Oak Park
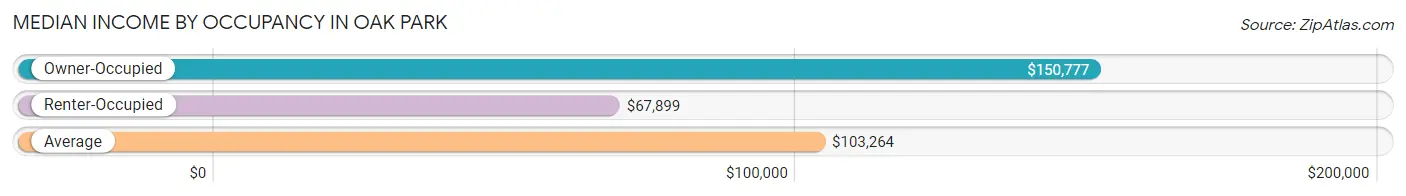
| Occupancy Type | # Households | Median Income |
| Owner-Occupied | 13,894 (59.5%) | $150,777 |
| Renter-Occupied | 9,451 (40.5%) | $67,899 |
| Average | 23,345 (100.0%) | $103,264 |
Occupancy by Householder Income Bracket in Oak Park
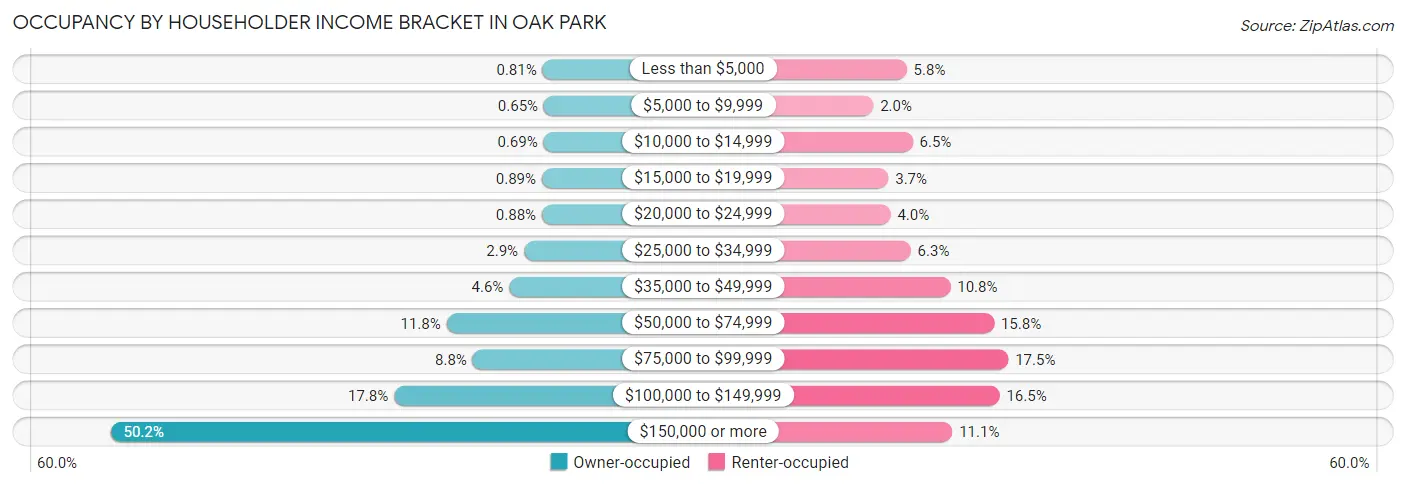
| Income Bracket | Owner-occupied | Renter-occupied |
| Less than $5,000 | 113 (0.8%) | 552 (5.8%) |
| $5,000 to $9,999 | 91 (0.6%) | 191 (2.0%) |
| $10,000 to $14,999 | 96 (0.7%) | 616 (6.5%) |
| $15,000 to $19,999 | 124 (0.9%) | 353 (3.7%) |
| $20,000 to $24,999 | 122 (0.9%) | 377 (4.0%) |
| $25,000 to $34,999 | 407 (2.9%) | 595 (6.3%) |
| $35,000 to $49,999 | 642 (4.6%) | 1,024 (10.8%) |
| $50,000 to $74,999 | 1,637 (11.8%) | 1,495 (15.8%) |
| $75,000 to $99,999 | 1,221 (8.8%) | 1,649 (17.4%) |
| $100,000 to $149,999 | 2,471 (17.8%) | 1,555 (16.5%) |
| $150,000 or more | 6,970 (50.2%) | 1,044 (11.1%) |
| Total | 13,894 (100.0%) | 9,451 (100.0%) |
Monthly Housing Cost Tiers in Oak Park
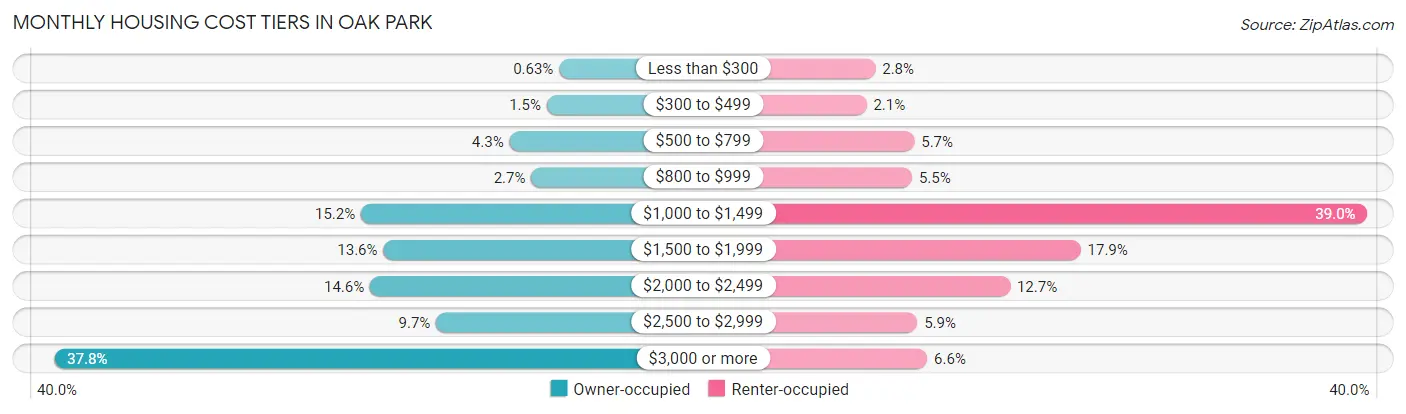
| Monthly Cost | Owner-occupied | Renter-occupied |
| Less than $300 | 87 (0.6%) | 264 (2.8%) |
| $300 to $499 | 214 (1.5%) | 202 (2.1%) |
| $500 to $799 | 596 (4.3%) | 535 (5.7%) |
| $800 to $999 | 372 (2.7%) | 519 (5.5%) |
| $1,000 to $1,499 | 2,114 (15.2%) | 3,689 (39.0%) |
| $1,500 to $1,999 | 1,887 (13.6%) | 1,693 (17.9%) |
| $2,000 to $2,499 | 2,023 (14.6%) | 1,201 (12.7%) |
| $2,500 to $2,999 | 1,346 (9.7%) | 556 (5.9%) |
| $3,000 or more | 5,255 (37.8%) | 625 (6.6%) |
| Total | 13,894 (100.0%) | 9,451 (100.0%) |
Physical Housing Characteristics in Oak Park
Housing Structures in Oak Park
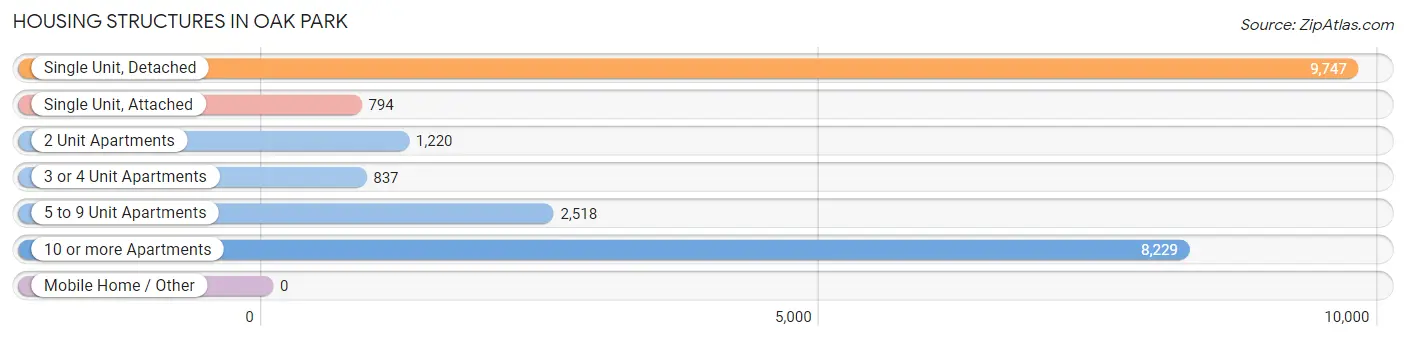
| Structure Type | # Housing Units | % Housing Units |
| Single Unit, Detached | 9,747 | 41.7% |
| Single Unit, Attached | 794 | 3.4% |
| 2 Unit Apartments | 1,220 | 5.2% |
| 3 or 4 Unit Apartments | 837 | 3.6% |
| 5 to 9 Unit Apartments | 2,518 | 10.8% |
| 10 or more Apartments | 8,229 | 35.2% |
| Mobile Home / Other | 0 | 0.0% |
| Total | 23,345 | 100.0% |
Housing Structures by Occupancy in Oak Park
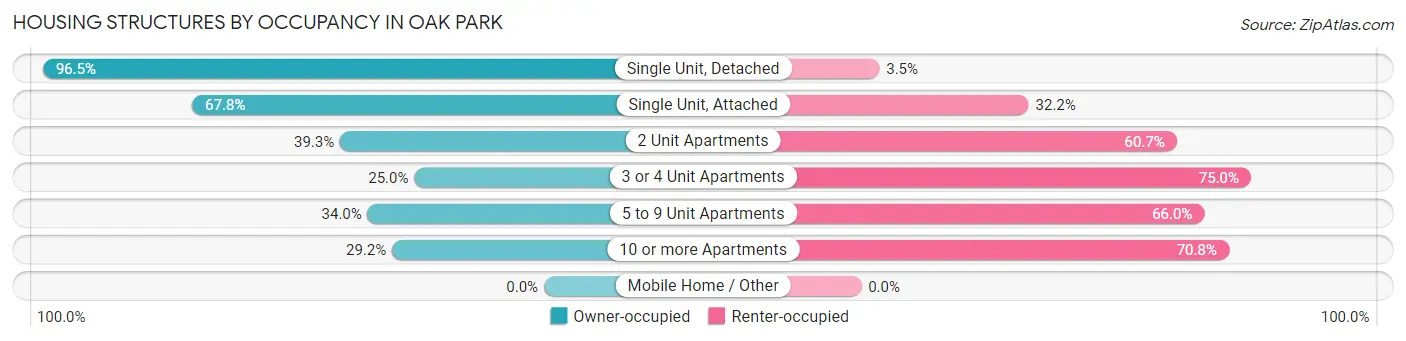
| Structure Type | Owner-occupied | Renter-occupied |
| Single Unit, Detached | 9,407 (96.5%) | 340 (3.5%) |
| Single Unit, Attached | 538 (67.8%) | 256 (32.2%) |
| 2 Unit Apartments | 479 (39.3%) | 741 (60.7%) |
| 3 or 4 Unit Apartments | 209 (25.0%) | 628 (75.0%) |
| 5 to 9 Unit Apartments | 855 (34.0%) | 1,663 (66.0%) |
| 10 or more Apartments | 2,406 (29.2%) | 5,823 (70.8%) |
| Mobile Home / Other | 0 (0.0%) | 0 (0.0%) |
| Total | 13,894 (59.5%) | 9,451 (40.5%) |
Housing Structures by Number of Rooms in Oak Park
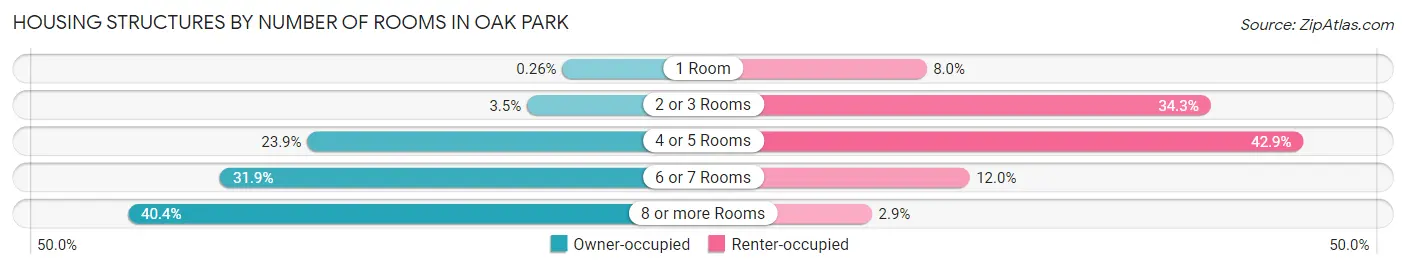
| Number of Rooms | Owner-occupied | Renter-occupied |
| 1 Room | 36 (0.3%) | 754 (8.0%) |
| 2 or 3 Rooms | 491 (3.5%) | 3,239 (34.3%) |
| 4 or 5 Rooms | 3,314 (23.8%) | 4,051 (42.9%) |
| 6 or 7 Rooms | 4,435 (31.9%) | 1,130 (12.0%) |
| 8 or more Rooms | 5,618 (40.4%) | 277 (2.9%) |
| Total | 13,894 (100.0%) | 9,451 (100.0%) |
Housing Structure by Heating Type in Oak Park
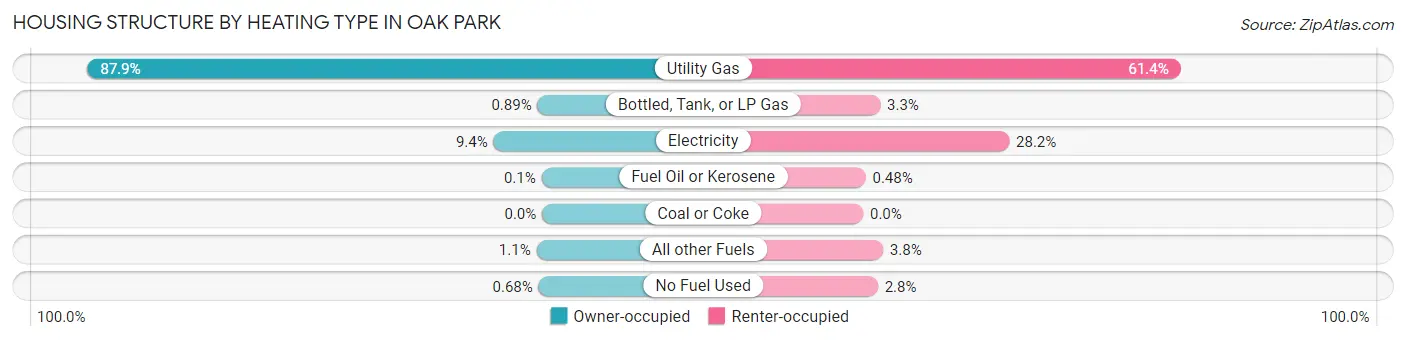
| Heating Type | Owner-occupied | Renter-occupied |
| Utility Gas | 12,208 (87.9%) | 5,798 (61.4%) |
| Bottled, Tank, or LP Gas | 123 (0.9%) | 311 (3.3%) |
| Electricity | 1,305 (9.4%) | 2,667 (28.2%) |
| Fuel Oil or Kerosene | 14 (0.1%) | 45 (0.5%) |
| Coal or Coke | 0 (0.0%) | 0 (0.0%) |
| All other Fuels | 150 (1.1%) | 363 (3.8%) |
| No Fuel Used | 94 (0.7%) | 267 (2.8%) |
| Total | 13,894 (100.0%) | 9,451 (100.0%) |
Household Vehicle Usage in Oak Park
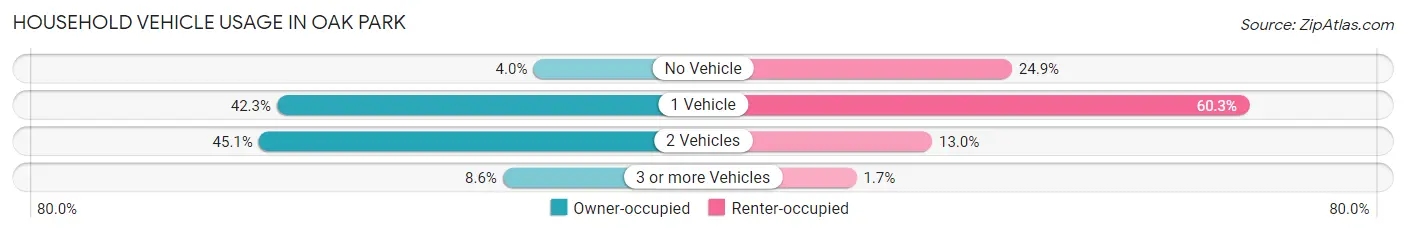
| Vehicles per Household | Owner-occupied | Renter-occupied |
| No Vehicle | 560 (4.0%) | 2,357 (24.9%) |
| 1 Vehicle | 5,882 (42.3%) | 5,701 (60.3%) |
| 2 Vehicles | 6,259 (45.1%) | 1,230 (13.0%) |
| 3 or more Vehicles | 1,193 (8.6%) | 163 (1.7%) |
| Total | 13,894 (100.0%) | 9,451 (100.0%) |
Real Estate & Mortgages in Oak Park
Real Estate and Mortgage Overview in Oak Park
| Characteristic | Without Mortgage | With Mortgage |
| Housing Units | 4,027 | 9,867 |
| Median Property Value | $396,500 | $453,600 |
| Median Household Income | $104,278 | $5,590 |
| Monthly Housing Costs | $1,312 | $5,145 |
| Real Estate Taxes | $10,001 | $72 |
Property Value by Mortgage Status in Oak Park
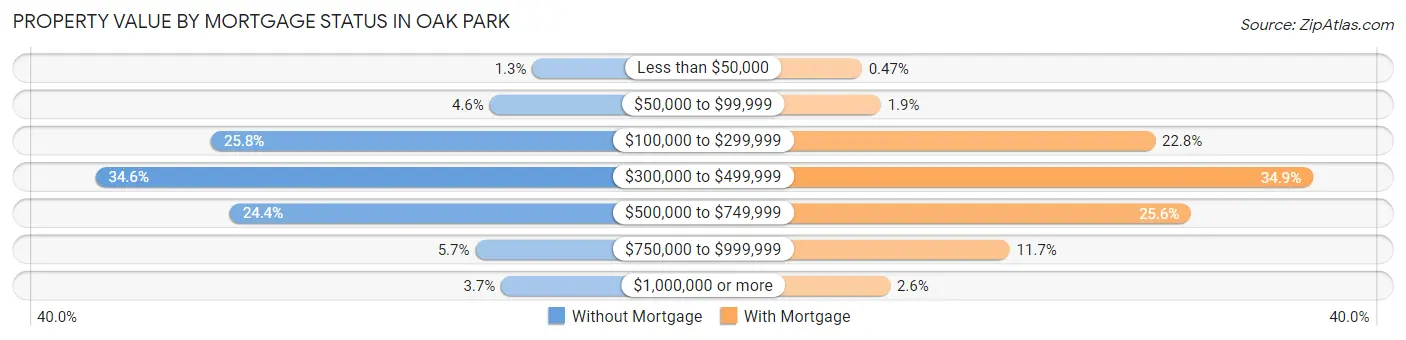
| Property Value | Without Mortgage | With Mortgage |
| Less than $50,000 | 53 (1.3%) | 46 (0.5%) |
| $50,000 to $99,999 | 184 (4.6%) | 189 (1.9%) |
| $100,000 to $299,999 | 1,039 (25.8%) | 2,252 (22.8%) |
| $300,000 to $499,999 | 1,393 (34.6%) | 3,440 (34.9%) |
| $500,000 to $749,999 | 981 (24.4%) | 2,523 (25.6%) |
| $750,000 to $999,999 | 228 (5.7%) | 1,158 (11.7%) |
| $1,000,000 or more | 149 (3.7%) | 259 (2.6%) |
| Total | 4,027 (100.0%) | 9,867 (100.0%) |
Household Income by Mortgage Status in Oak Park
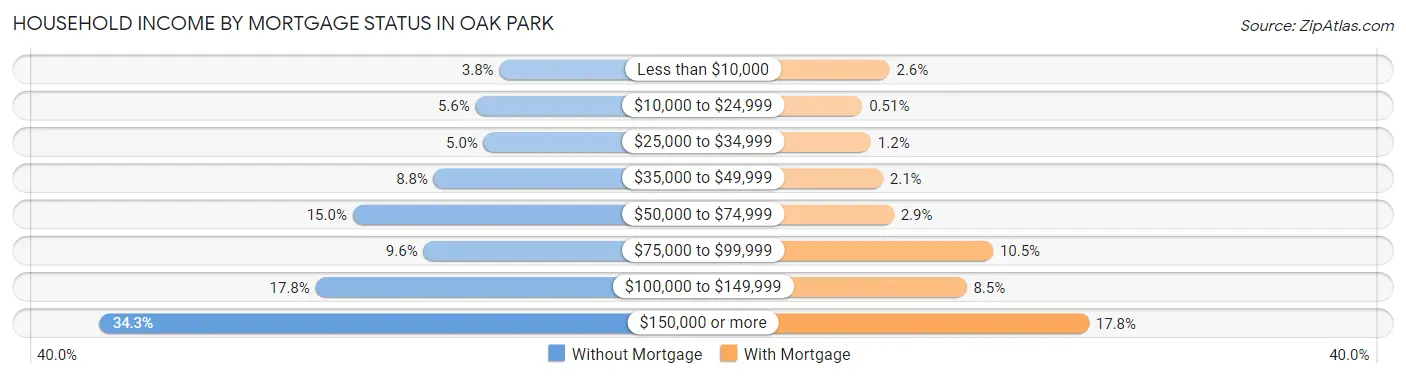
| Household Income | Without Mortgage | With Mortgage |
| Less than $10,000 | 154 (3.8%) | 256 (2.6%) |
| $10,000 to $24,999 | 227 (5.6%) | 50 (0.5%) |
| $25,000 to $34,999 | 202 (5.0%) | 115 (1.2%) |
| $35,000 to $49,999 | 355 (8.8%) | 205 (2.1%) |
| $50,000 to $74,999 | 604 (15.0%) | 287 (2.9%) |
| $75,000 to $99,999 | 387 (9.6%) | 1,033 (10.5%) |
| $100,000 to $149,999 | 718 (17.8%) | 834 (8.5%) |
| $150,000 or more | 1,380 (34.3%) | 1,753 (17.8%) |
| Total | 4,027 (100.0%) | 9,867 (100.0%) |
Property Value to Household Income Ratio in Oak Park
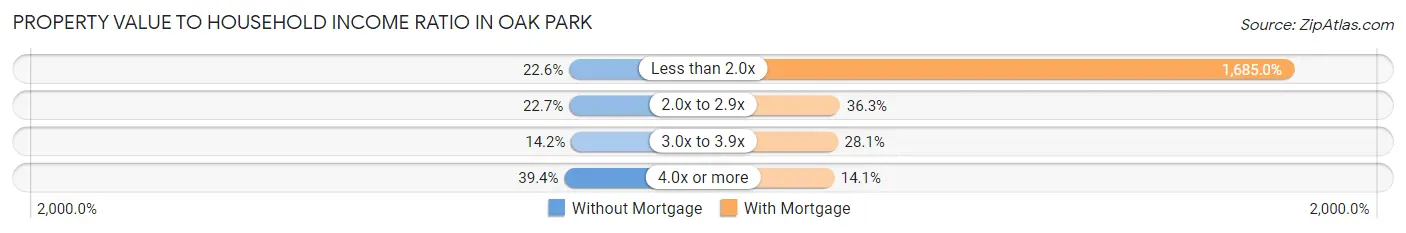
| Value-to-Income Ratio | Without Mortgage | With Mortgage |
| Less than 2.0x | 911 (22.6%) | 166,261 (1,685.0%) |
| 2.0x to 2.9x | 913 (22.7%) | 3,583 (36.3%) |
| 3.0x to 3.9x | 571 (14.2%) | 2,775 (28.1%) |
| 4.0x or more | 1,588 (39.4%) | 1,395 (14.1%) |
| Total | 4,027 (100.0%) | 9,867 (100.0%) |
Real Estate Taxes by Mortgage Status in Oak Park
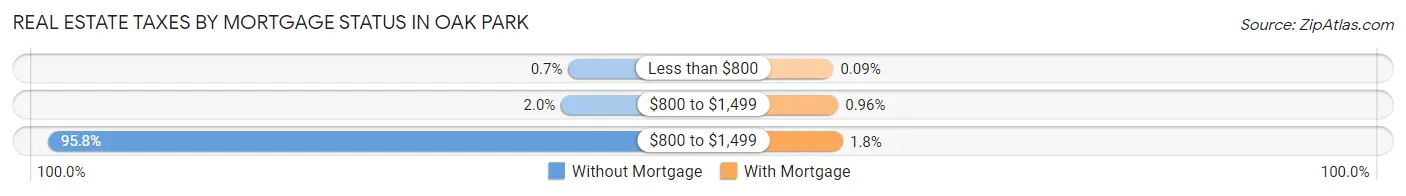
| Property Taxes | Without Mortgage | With Mortgage |
| Less than $800 | 28 (0.7%) | 9 (0.1%) |
| $800 to $1,499 | 80 (2.0%) | 95 (1.0%) |
| $800 to $1,499 | 3,856 (95.8%) | 180 (1.8%) |
| Total | 4,027 (100.0%) | 9,867 (100.0%) |
Health & Disability in Oak Park
Health Insurance Coverage by Age in Oak Park
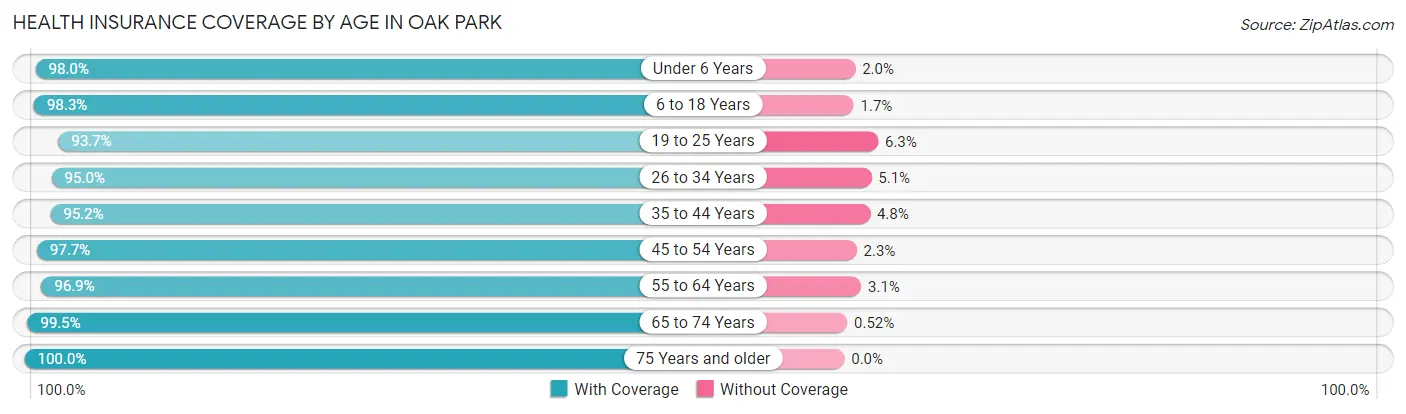
| Age Bracket | With Coverage | Without Coverage |
| Under 6 Years | 3,699 (98.0%) | 77 (2.0%) |
| 6 to 18 Years | 9,131 (98.3%) | 162 (1.7%) |
| 19 to 25 Years | 3,086 (93.7%) | 207 (6.3%) |
| 26 to 34 Years | 5,676 (95.0%) | 302 (5.1%) |
| 35 to 44 Years | 7,910 (95.2%) | 398 (4.8%) |
| 45 to 54 Years | 7,170 (97.7%) | 169 (2.3%) |
| 55 to 64 Years | 6,193 (96.9%) | 200 (3.1%) |
| 65 to 74 Years | 5,685 (99.5%) | 30 (0.5%) |
| 75 Years and older | 3,437 (100.0%) | 0 (0.0%) |
| Total | 51,987 (97.1%) | 1,545 (2.9%) |
Health Insurance Coverage by Citizenship Status in Oak Park
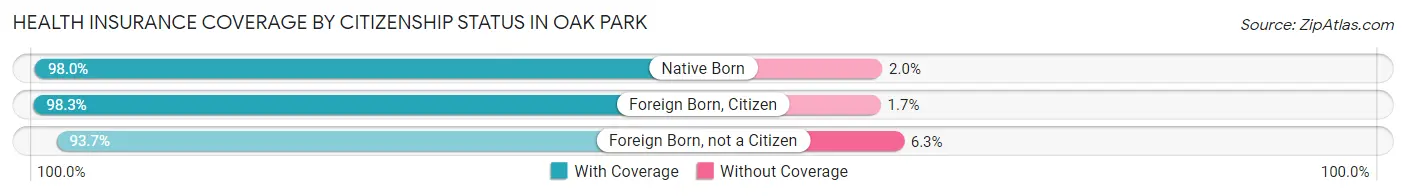
| Citizenship Status | With Coverage | Without Coverage |
| Native Born | 3,699 (98.0%) | 77 (2.0%) |
| Foreign Born, Citizen | 9,131 (98.3%) | 162 (1.7%) |
| Foreign Born, not a Citizen | 3,086 (93.7%) | 207 (6.3%) |
Health Insurance Coverage by Household Income in Oak Park
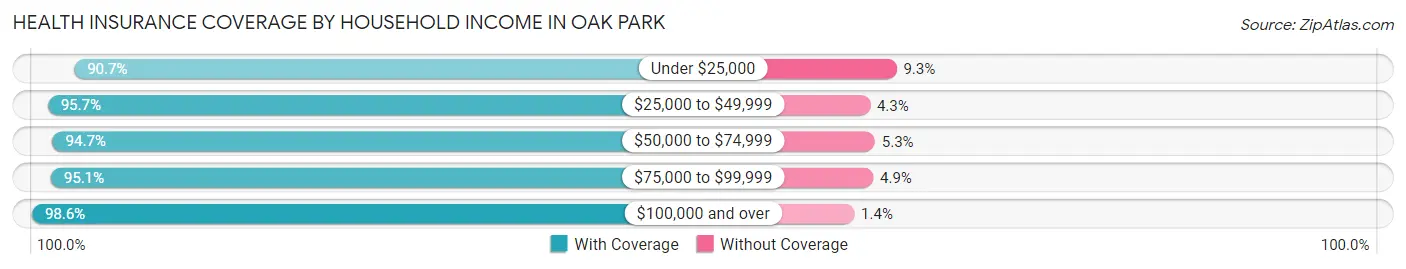
| Household Income | With Coverage | Without Coverage |
| Under $25,000 | 3,373 (90.7%) | 346 (9.3%) |
| $25,000 to $49,999 | 3,750 (95.7%) | 170 (4.3%) |
| $50,000 to $74,999 | 5,129 (94.7%) | 285 (5.3%) |
| $75,000 to $99,999 | 4,746 (95.1%) | 246 (4.9%) |
| $100,000 and over | 34,799 (98.6%) | 487 (1.4%) |
Public vs Private Health Insurance Coverage by Age in Oak Park
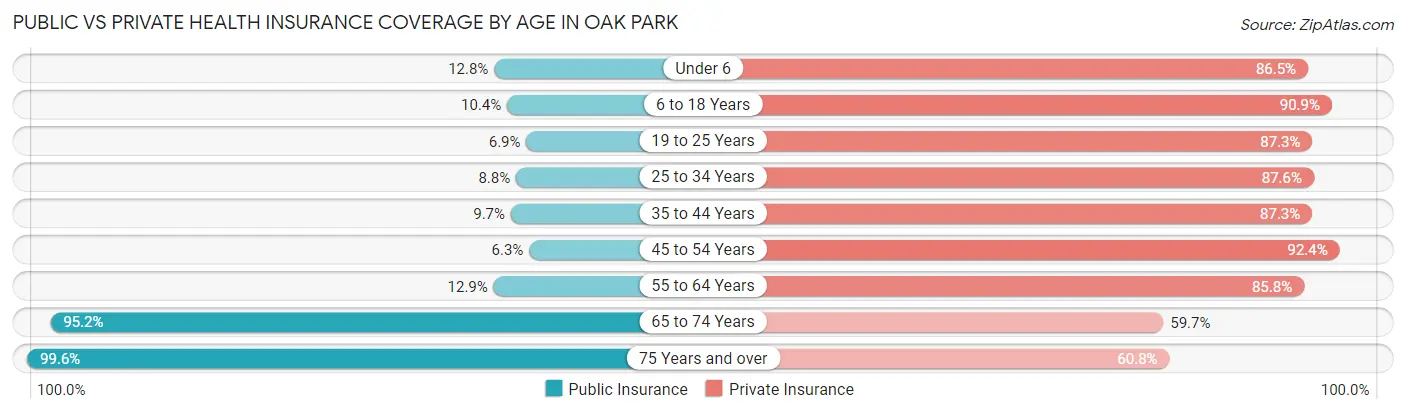
| Age Bracket | Public Insurance | Private Insurance |
| Under 6 | 485 (12.8%) | 3,267 (86.5%) |
| 6 to 18 Years | 970 (10.4%) | 8,451 (90.9%) |
| 19 to 25 Years | 226 (6.9%) | 2,876 (87.3%) |
| 25 to 34 Years | 525 (8.8%) | 5,237 (87.6%) |
| 35 to 44 Years | 809 (9.7%) | 7,252 (87.3%) |
| 45 to 54 Years | 465 (6.3%) | 6,780 (92.4%) |
| 55 to 64 Years | 827 (12.9%) | 5,484 (85.8%) |
| 65 to 74 Years | 5,443 (95.2%) | 3,410 (59.7%) |
| 75 Years and over | 3,422 (99.6%) | 2,090 (60.8%) |
| Total | 13,172 (24.6%) | 44,847 (83.8%) |
Disability Status by Sex by Age in Oak Park
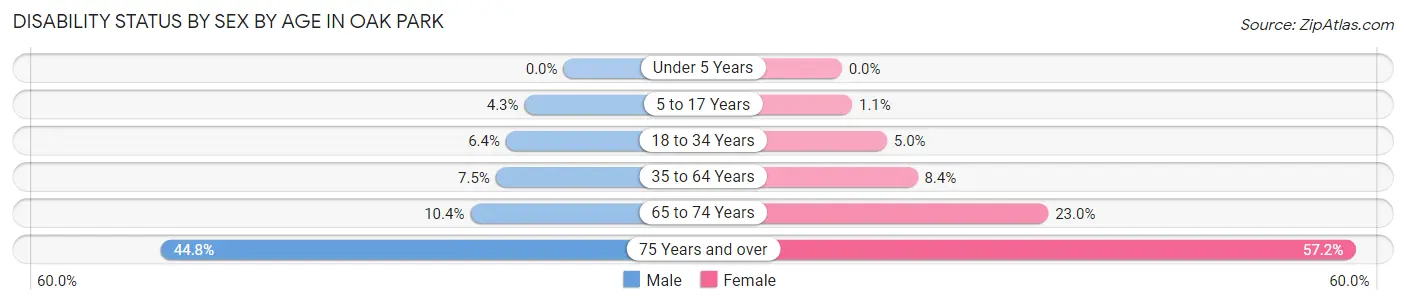
| Age Bracket | Male | Female |
| Under 5 Years | 0 (0.0%) | 0 (0.0%) |
| 5 to 17 Years | 216 (4.3%) | 51 (1.1%) |
| 18 to 34 Years | 267 (6.4%) | 288 (5.0%) |
| 35 to 64 Years | 779 (7.5%) | 987 (8.4%) |
| 65 to 74 Years | 244 (10.4%) | 773 (23.0%) |
| 75 Years and over | 649 (44.8%) | 1,137 (57.2%) |
Disability Class by Sex by Age in Oak Park
Disability Class: Hearing Difficulty
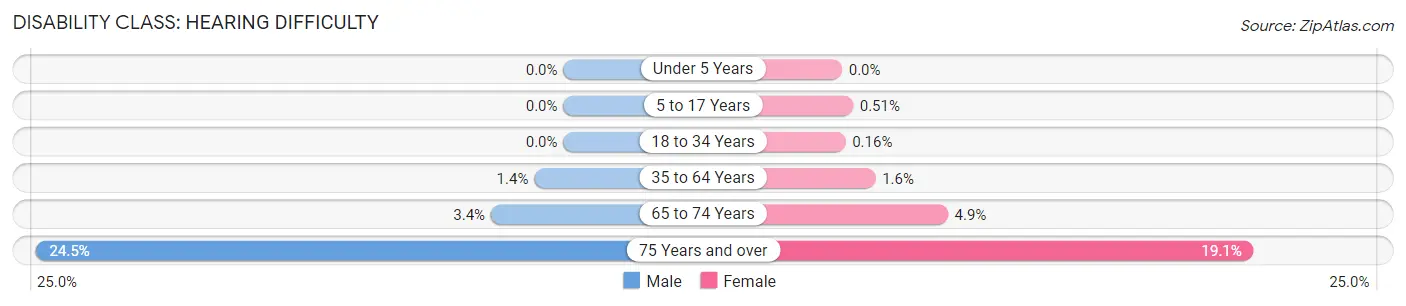
| Age Bracket | Male | Female |
| Under 5 Years | 0 (0.0%) | 0 (0.0%) |
| 5 to 17 Years | 0 (0.0%) | 23 (0.5%) |
| 18 to 34 Years | 0 (0.0%) | 9 (0.2%) |
| 35 to 64 Years | 139 (1.3%) | 181 (1.5%) |
| 65 to 74 Years | 79 (3.4%) | 165 (4.9%) |
| 75 Years and over | 354 (24.4%) | 380 (19.1%) |
Disability Class: Vision Difficulty
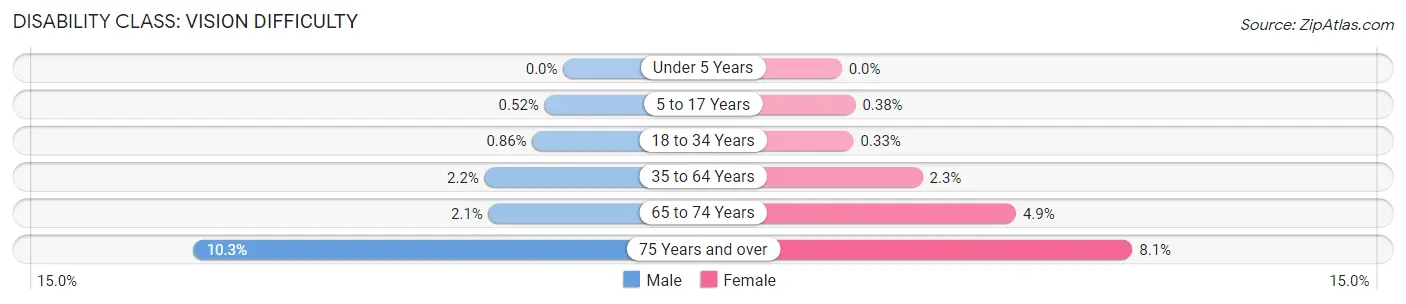
| Age Bracket | Male | Female |
| Under 5 Years | 0 (0.0%) | 0 (0.0%) |
| 5 to 17 Years | 26 (0.5%) | 17 (0.4%) |
| 18 to 34 Years | 36 (0.9%) | 19 (0.3%) |
| 35 to 64 Years | 226 (2.2%) | 264 (2.2%) |
| 65 to 74 Years | 49 (2.1%) | 163 (4.9%) |
| 75 Years and over | 149 (10.3%) | 161 (8.1%) |
Disability Class: Cognitive Difficulty
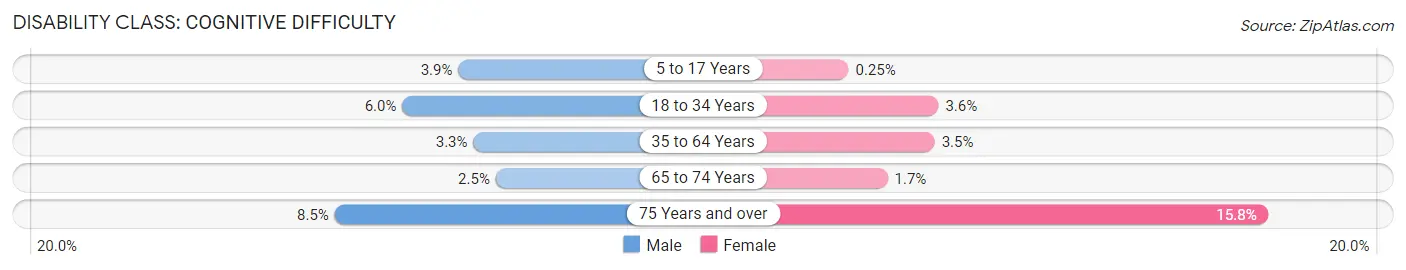
| Age Bracket | Male | Female |
| 5 to 17 Years | 194 (3.9%) | 11 (0.3%) |
| 18 to 34 Years | 249 (6.0%) | 206 (3.6%) |
| 35 to 64 Years | 345 (3.3%) | 404 (3.5%) |
| 65 to 74 Years | 59 (2.5%) | 57 (1.7%) |
| 75 Years and over | 123 (8.5%) | 315 (15.8%) |
Disability Class: Ambulatory Difficulty
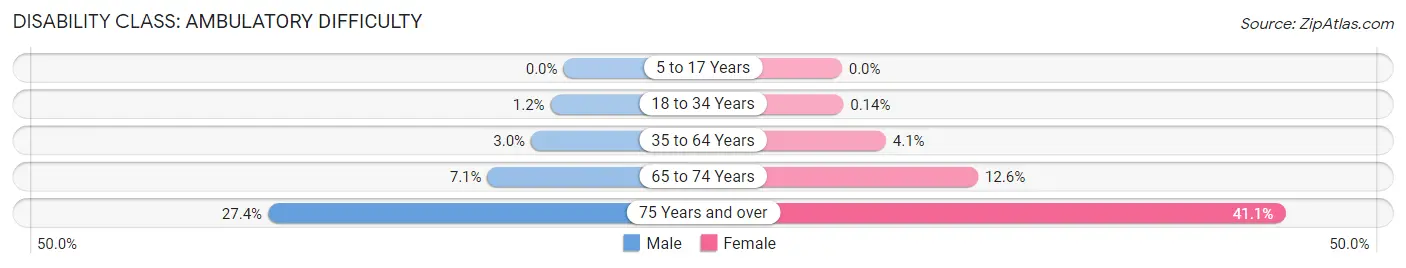
| Age Bracket | Male | Female |
| 5 to 17 Years | 0 (0.0%) | 0 (0.0%) |
| 18 to 34 Years | 50 (1.2%) | 8 (0.1%) |
| 35 to 64 Years | 311 (3.0%) | 479 (4.1%) |
| 65 to 74 Years | 166 (7.0%) | 425 (12.6%) |
| 75 Years and over | 397 (27.4%) | 818 (41.1%) |
Disability Class: Self-Care Difficulty
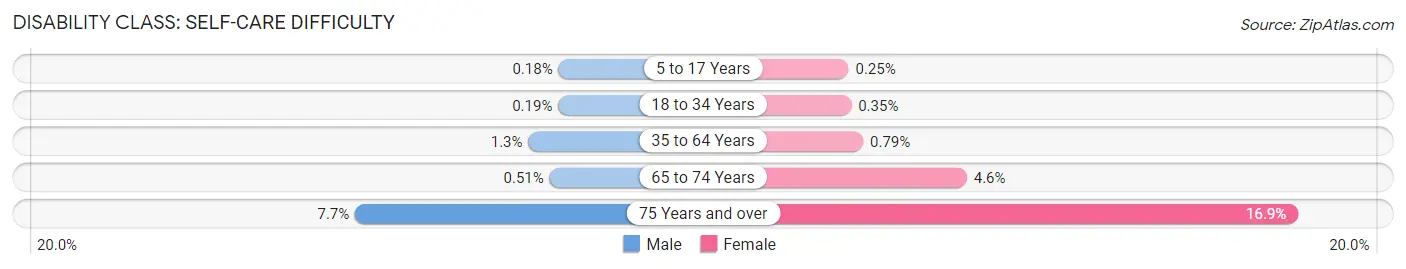
| Age Bracket | Male | Female |
| 5 to 17 Years | 9 (0.2%) | 11 (0.3%) |
| 18 to 34 Years | 8 (0.2%) | 20 (0.4%) |
| 35 to 64 Years | 134 (1.3%) | 92 (0.8%) |
| 65 to 74 Years | 12 (0.5%) | 156 (4.6%) |
| 75 Years and over | 112 (7.7%) | 337 (16.9%) |
Technology Access in Oak Park
Computing Device Access in Oak Park
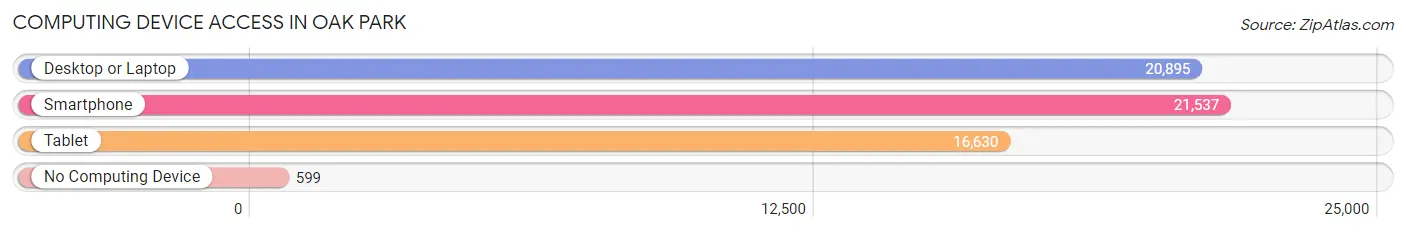
| Device Type | # Households | % Households |
| Desktop or Laptop | 20,895 | 89.5% |
| Smartphone | 21,537 | 92.3% |
| Tablet | 16,630 | 71.2% |
| No Computing Device | 599 | 2.6% |
| Total | 23,345 | 100.0% |
Internet Access in Oak Park
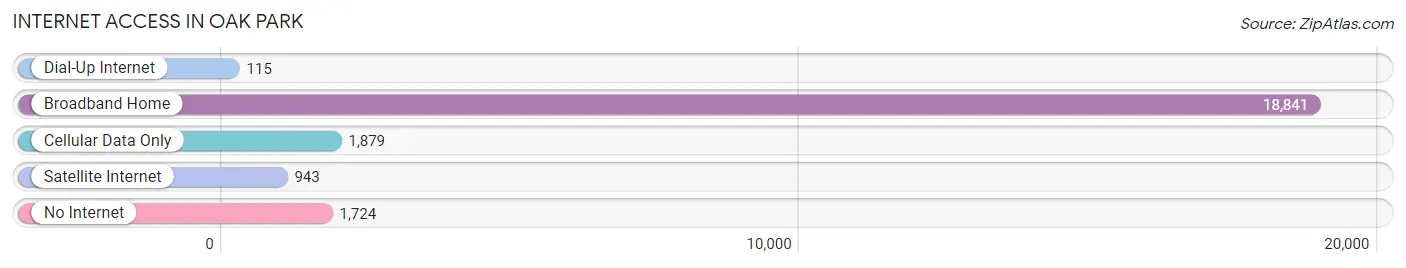
| Internet Type | # Households | % Households |
| Dial-Up Internet | 115 | 0.5% |
| Broadband Home | 18,841 | 80.7% |
| Cellular Data Only | 1,879 | 8.1% |
| Satellite Internet | 943 | 4.0% |
| No Internet | 1,724 | 7.4% |
| Total | 23,345 | 100.0% |
Oak Park Summary
Oak Park, Illinois is a village located in Cook County, just west of the city of Chicago. It is a vibrant and diverse community with a rich history, unique geography, and a strong economy.
History
Oak Park was first settled in the 1830s by a group of German immigrants. The village was incorporated in 1902 and was initially a farming community. In the late 19th century, Oak Park began to experience rapid growth due to its proximity to Chicago. The village was home to many of the city’s wealthy residents, and it was known for its grand homes and lush parks.
In the early 20th century, Oak Park was a center of the Arts and Crafts movement. The village was home to many of the movement’s leading figures, including Frank Lloyd Wright, who designed many of the area’s iconic buildings. Oak Park was also home to the world’s first skyscraper, the Home Insurance Building, which was designed by William Le Baron Jenney.
Oak Park was also a center of the civil rights movement. The village was home to many prominent African American leaders, including Ida B. Wells and W.E.B. Du Bois. In the 1950s, Oak Park was the site of the first sit-in protest in the United States.
Geography
Oak Park is located in Cook County, just west of the city of Chicago. The village is bordered by the Des Plaines River to the north, the Chicago River to the east, and the Eisenhower Expressway to the south. The village covers an area of 8.5 square miles and has a population of 52,000.
Oak Park is a densely populated area with a mix of residential and commercial buildings. The village is home to many historic buildings, including the Frank Lloyd Wright Home and Studio, the Unity Temple, and the Ernest Hemingway Birthplace. The village also has several parks, including Austin Gardens, Scoville Park, and Ridgeland Common.
Economy
Oak Park has a strong and diverse economy. The village is home to many corporate headquarters, including the headquarters of the McDonald’s Corporation. The village is also home to several hospitals, including Rush Oak Park Hospital and West Suburban Medical Center.
Oak Park is also home to many small businesses, including restaurants, shops, and galleries. The village is home to several cultural institutions, including the Oak Park Art League, the Oak Park Public Library, and the Ernest Hemingway Museum.
Demographics
Oak Park is a diverse community with a population of 52,000. The village is home to a large African American population, as well as a significant Hispanic population. The village also has a large Asian population, with the largest groups being Chinese, Indian, and Filipino.
The median household income in Oak Park is $68,000, and the median home value is $400,000. The village has a high rate of homeownership, with nearly 70% of residents owning their homes. The village also has a high rate of educational attainment, with nearly 90% of residents having a high school diploma or higher.
Common Questions
What is Per Capita Income in Oak Park?
Per Capita income in Oak Park is $66,755.
What is the Median Family Income in Oak Park?
Median Family Income in Oak Park is $159,422.
What is the Median Household income in Oak Park?
Median Household Income in Oak Park is $103,264.
What is Income or Wage Gap in Oak Park?
Income or Wage Gap in Oak Park is 33.1%.
Women in Oak Park earn 66.9 cents for every dollar earned by a man.
What is Inequality or Gini Index in Oak Park?
Inequality or Gini Index in Oak Park is 0.49.
What is the Total Population of Oak Park?
Total Population of Oak Park is 53,834.
What is the Total Male Population of Oak Park?
Total Male Population of Oak Park is 24,751.
What is the Total Female Population of Oak Park?
Total Female Population of Oak Park is 29,083.
What is the Ratio of Males per 100 Females in Oak Park?
There are 85.10 Males per 100 Females in Oak Park.
What is the Ratio of Females per 100 Males in Oak Park?
There are 117.50 Females per 100 Males in Oak Park.
What is the Median Population Age in Oak Park?
Median Population Age in Oak Park is 40.3 Years.
What is the Average Family Size in Oak Park
Average Family Size in Oak Park is 3.1 People.
What is the Average Household Size in Oak Park
Average Household Size in Oak Park is 2.3 People.
How Large is the Labor Force in Oak Park?
There are 29,962 People in the Labor Forcein in Oak Park.
What is the Percentage of People in the Labor Force in Oak Park?
70.0% of People are in the Labor Force in Oak Park.
What is the Unemployment Rate in Oak Park?
Unemployment Rate in Oak Park is 4.9%.