Scranton, PA Map & Demographics
Scranton Map
Scranton Overview
$27,830
PER CAPITA INCOME
$66,007
AVG FAMILY INCOME
$48,776
AVG HOUSEHOLD INCOME
19.7%
WAGE / INCOME GAP [ % ]
80.3¢/ $1
WAGE / INCOME GAP [ $ ]
$10,583
FAMILY INCOME DEFICIT
0.46
INEQUALITY / GINI INDEX
76,119
TOTAL POPULATION
37,819
MALE POPULATION
38,300
FEMALE POPULATION
98.74
MALES / 100 FEMALES
101.27
FEMALES / 100 MALES
37.3
MEDIAN AGE
3.1
AVG FAMILY SIZE
2.4
AVG HOUSEHOLD SIZE
36,361
LABOR FORCE [ PEOPLE ]
57.8%
PERCENT IN LABOR FORCE
5.6%
UNEMPLOYMENT RATE
Scranton Area Codes
Income in Scranton
Income Overview in Scranton
Per Capita Income in Scranton is $27,830, while median incomes of families and households are $66,007 and $48,776 respectively.
| Characteristic | Number | Measure |
| Per Capita Income | 76,119 | $27,830 |
| Median Family Income | 16,878 | $66,007 |
| Mean Family Income | 16,878 | $82,656 |
| Median Household Income | 29,947 | $48,776 |
| Mean Household Income | 29,947 | $68,304 |
| Income Deficit | 16,878 | $10,583 |
| Wage / Income Gap (%) | 76,119 | 19.74% |
| Wage / Income Gap ($) | 76,119 | 80.26¢ per $1 |
| Gini / Inequality Index | 76,119 | 0.46 |
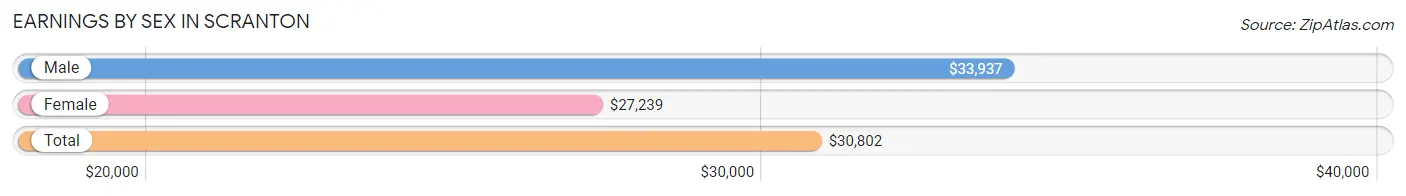
Earnings by Sex in Scranton
Average Earnings in Scranton are $30,802, $33,937 for men and $27,239 for women, a difference of 19.7%.
| Sex | Number | Average Earnings |
| Male | 20,618 (51.5%) | $33,937 |
| Female | 19,422 (48.5%) | $27,239 |
| Total | 40,040 (100.0%) | $30,802 |
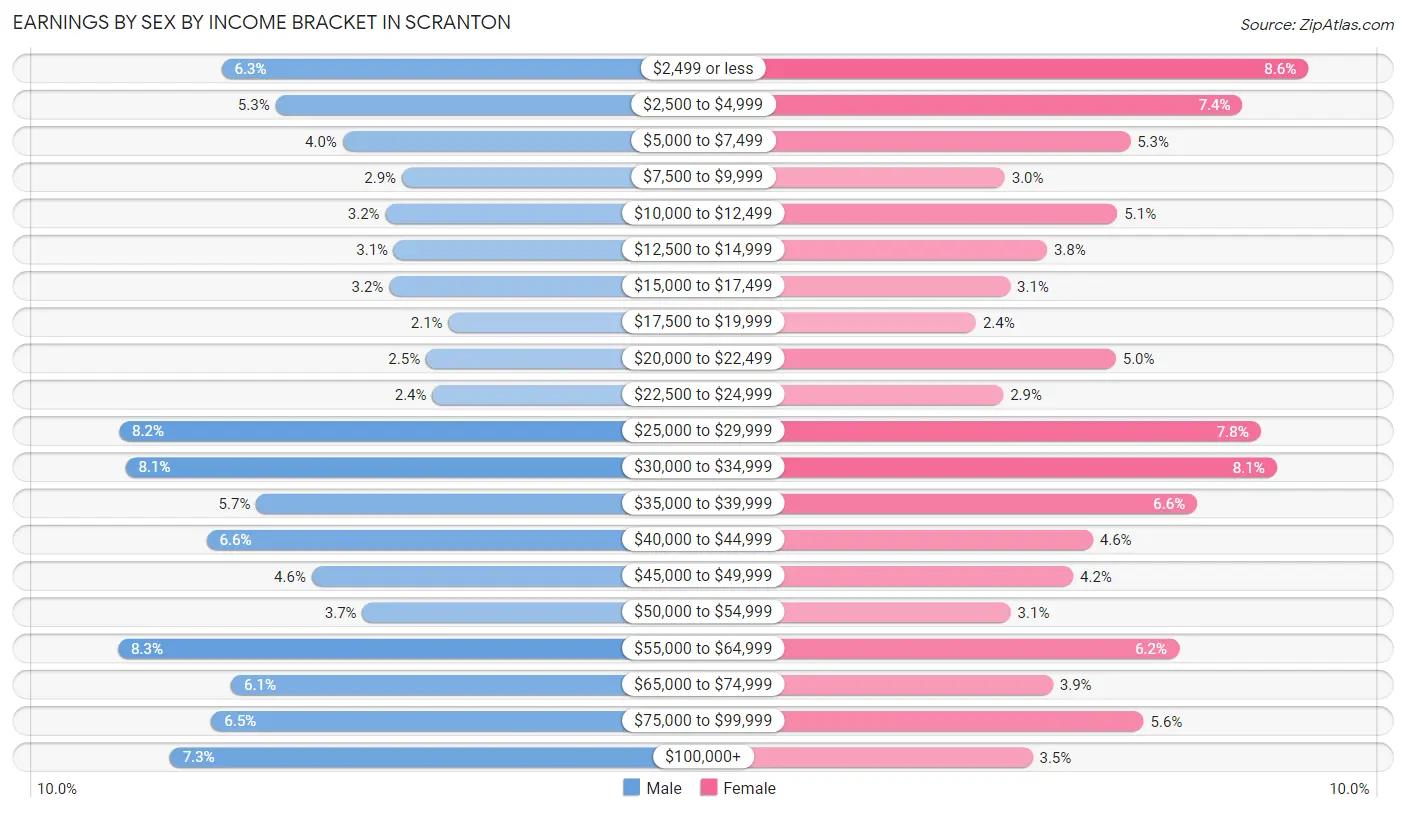
Earnings by Sex by Income Bracket in Scranton
The most common earnings brackets in Scranton are $55,000 to $64,999 for men (1,701 | 8.3%) and $2,499 or less for women (1,678 | 8.6%).
| Income | Male | Female |
| $2,499 or less | 1,300 (6.3%) | 1,678 (8.6%) |
| $2,500 to $4,999 | 1,092 (5.3%) | 1,440 (7.4%) |
| $5,000 to $7,499 | 832 (4.0%) | 1,032 (5.3%) |
| $7,500 to $9,999 | 605 (2.9%) | 575 (3.0%) |
| $10,000 to $12,499 | 667 (3.2%) | 984 (5.1%) |
| $12,500 to $14,999 | 636 (3.1%) | 729 (3.7%) |
| $15,000 to $17,499 | 654 (3.2%) | 594 (3.1%) |
| $17,500 to $19,999 | 424 (2.1%) | 470 (2.4%) |
| $20,000 to $22,499 | 512 (2.5%) | 979 (5.0%) |
| $22,500 to $24,999 | 486 (2.4%) | 569 (2.9%) |
| $25,000 to $29,999 | 1,696 (8.2%) | 1,505 (7.7%) |
| $30,000 to $34,999 | 1,673 (8.1%) | 1,563 (8.1%) |
| $35,000 to $39,999 | 1,166 (5.7%) | 1,275 (6.6%) |
| $40,000 to $44,999 | 1,358 (6.6%) | 896 (4.6%) |
| $45,000 to $49,999 | 953 (4.6%) | 824 (4.2%) |
| $50,000 to $54,999 | 757 (3.7%) | 597 (3.1%) |
| $55,000 to $64,999 | 1,701 (8.3%) | 1,208 (6.2%) |
| $65,000 to $74,999 | 1,264 (6.1%) | 749 (3.9%) |
| $75,000 to $99,999 | 1,341 (6.5%) | 1,080 (5.6%) |
| $100,000+ | 1,501 (7.3%) | 675 (3.5%) |
| Total | 20,618 (100.0%) | 19,422 (100.0%) |
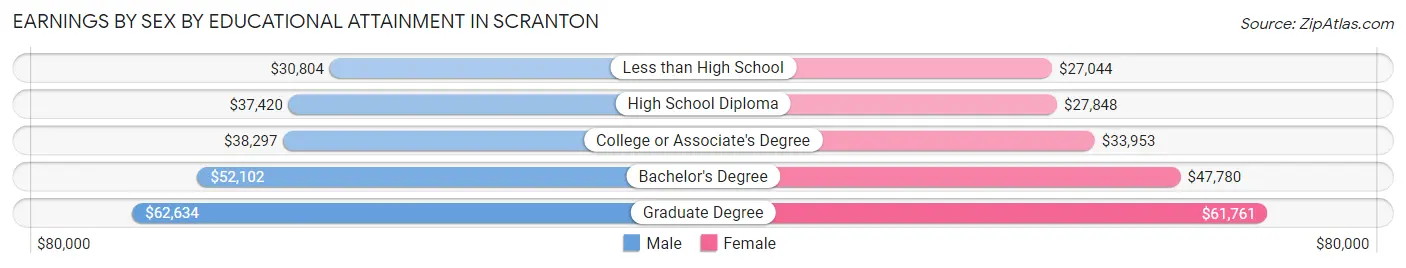
Earnings by Sex by Educational Attainment in Scranton
Average earnings in Scranton are $41,100 for men and $34,821 for women, a difference of 15.3%. Men with an educational attainment of graduate degree enjoy the highest average annual earnings of $62,634, while those with less than high school education earn the least with $30,804. Women with an educational attainment of graduate degree earn the most with the average annual earnings of $61,761, while those with less than high school education have the smallest earnings of $27,044.
| Educational Attainment | Male Income | Female Income |
| Less than High School | $30,804 | $27,044 |
| High School Diploma | $37,420 | $27,848 |
| College or Associate's Degree | $38,297 | $33,953 |
| Bachelor's Degree | $52,102 | $47,780 |
| Graduate Degree | $62,634 | $61,761 |
| Total | $41,100 | $34,821 |
Family Income in Scranton
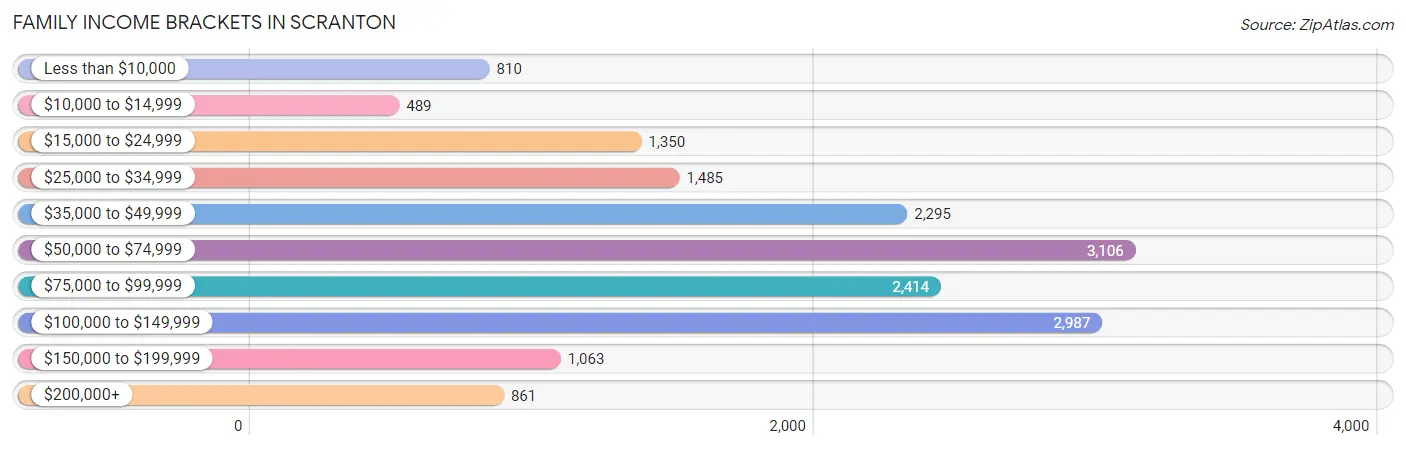
Family Income Brackets in Scranton
According to the Scranton family income data, there are 3,106 families falling into the $50,000 to $74,999 income range, which is the most common income bracket and makes up 18.4% of all families. Conversely, the $10,000 to $14,999 income bracket is the least frequent group with only 489 families (2.9%) belonging to this category.
| Income Bracket | # Families | % Families |
| Less than $10,000 | 810 | 4.8% |
| $10,000 to $14,999 | 489 | 2.9% |
| $15,000 to $24,999 | 1,350 | 8.0% |
| $25,000 to $34,999 | 1,485 | 8.8% |
| $35,000 to $49,999 | 2,295 | 13.6% |
| $50,000 to $74,999 | 3,106 | 18.4% |
| $75,000 to $99,999 | 2,414 | 14.3% |
| $100,000 to $149,999 | 2,987 | 17.7% |
| $150,000 to $199,999 | 1,063 | 6.3% |
| $200,000+ | 861 | 5.1% |
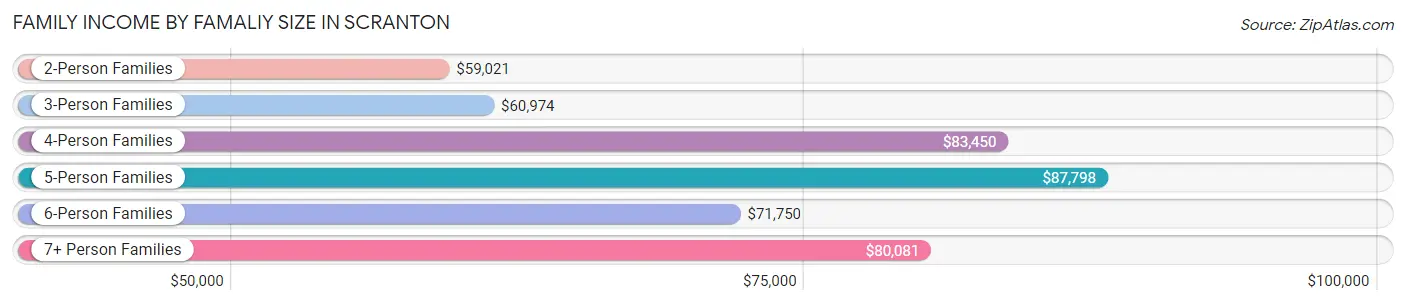
Family Income by Famaliy Size in Scranton
5-person families (1,002 | 5.9%) account for the highest median family income in Scranton with $87,798 per family, while 2-person families (7,961 | 47.2%) have the highest median income of $29,510 per family member.
| Income Bracket | # Families | Median Income |
| 2-Person Families | 7,961 (47.2%) | $59,021 |
| 3-Person Families | 4,007 (23.7%) | $60,974 |
| 4-Person Families | 2,943 (17.4%) | $83,450 |
| 5-Person Families | 1,002 (5.9%) | $87,798 |
| 6-Person Families | 547 (3.2%) | $71,750 |
| 7+ Person Families | 418 (2.5%) | $80,081 |
| Total | 16,878 (100.0%) | $66,007 |
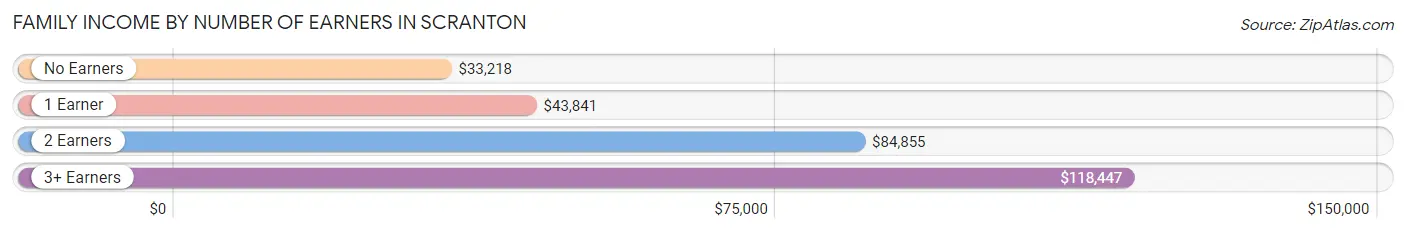
Family Income by Number of Earners in Scranton
The median family income in Scranton is $66,007, with families comprising 3+ earners (2,251) having the highest median family income of $118,447, while families with no earners (2,626) have the lowest median family income of $33,218, accounting for 13.3% and 15.6% of families, respectively.
| Number of Earners | # Families | Median Income |
| No Earners | 2,626 (15.6%) | $33,218 |
| 1 Earner | 5,816 (34.5%) | $43,841 |
| 2 Earners | 6,185 (36.6%) | $84,855 |
| 3+ Earners | 2,251 (13.3%) | $118,447 |
| Total | 16,878 (100.0%) | $66,007 |
Household Income in Scranton
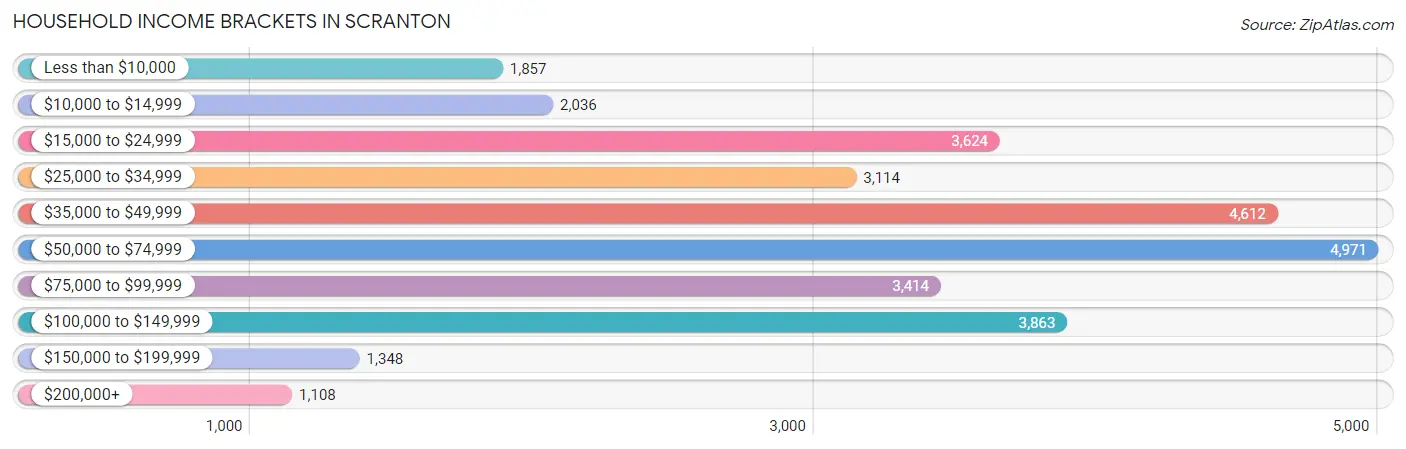
Household Income Brackets in Scranton
With 4,971 households falling in the category, the $50,000 to $74,999 income range is the most frequent in Scranton, accounting for 16.6% of all households. In contrast, only 1,108 households (3.7%) fall into the $200,000+ income bracket, making it the least populous group.
| Income Bracket | # Households | % Households |
| Less than $10,000 | 1,857 | 6.2% |
| $10,000 to $14,999 | 2,036 | 6.8% |
| $15,000 to $24,999 | 3,624 | 12.1% |
| $25,000 to $34,999 | 3,114 | 10.4% |
| $35,000 to $49,999 | 4,612 | 15.4% |
| $50,000 to $74,999 | 4,971 | 16.6% |
| $75,000 to $99,999 | 3,414 | 11.4% |
| $100,000 to $149,999 | 3,863 | 12.9% |
| $150,000 to $199,999 | 1,348 | 4.5% |
| $200,000+ | 1,108 | 3.7% |
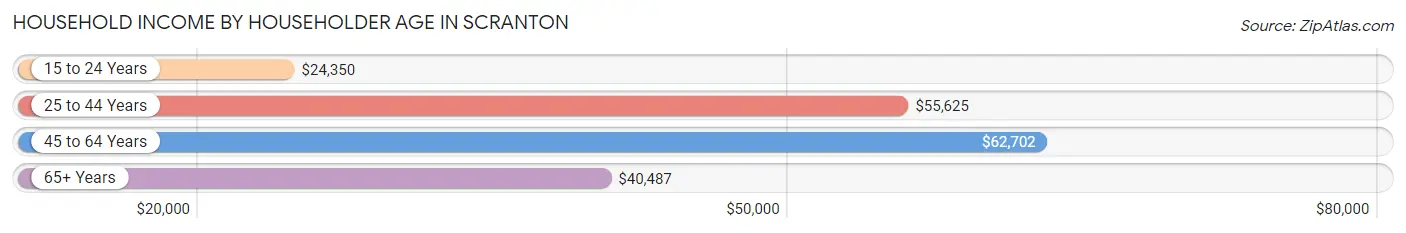
Household Income by Householder Age in Scranton
The median household income in Scranton is $48,776, with the highest median household income of $62,702 found in the 45 to 64 years age bracket for the primary householder. A total of 11,044 households (36.9%) fall into this category. Meanwhile, the 15 to 24 years age bracket for the primary householder has the lowest median household income of $24,350, with 1,469 households (4.9%) in this group.
| Income Bracket | # Households | Median Income |
| 15 to 24 Years | 1,469 (4.9%) | $24,350 |
| 25 to 44 Years | 9,095 (30.4%) | $55,625 |
| 45 to 64 Years | 11,044 (36.9%) | $62,702 |
| 65+ Years | 8,339 (27.9%) | $40,487 |
| Total | 29,947 (100.0%) | $48,776 |
Poverty in Scranton
Income Below Poverty by Sex and Age in Scranton
With 17.6% poverty level for males and 21.6% for females among the residents of Scranton, 5 year old males and under 5 year old females are the most vulnerable to poverty, with 177 males (43.3%) and 894 females (46.2%) in their respective age groups living below the poverty level.
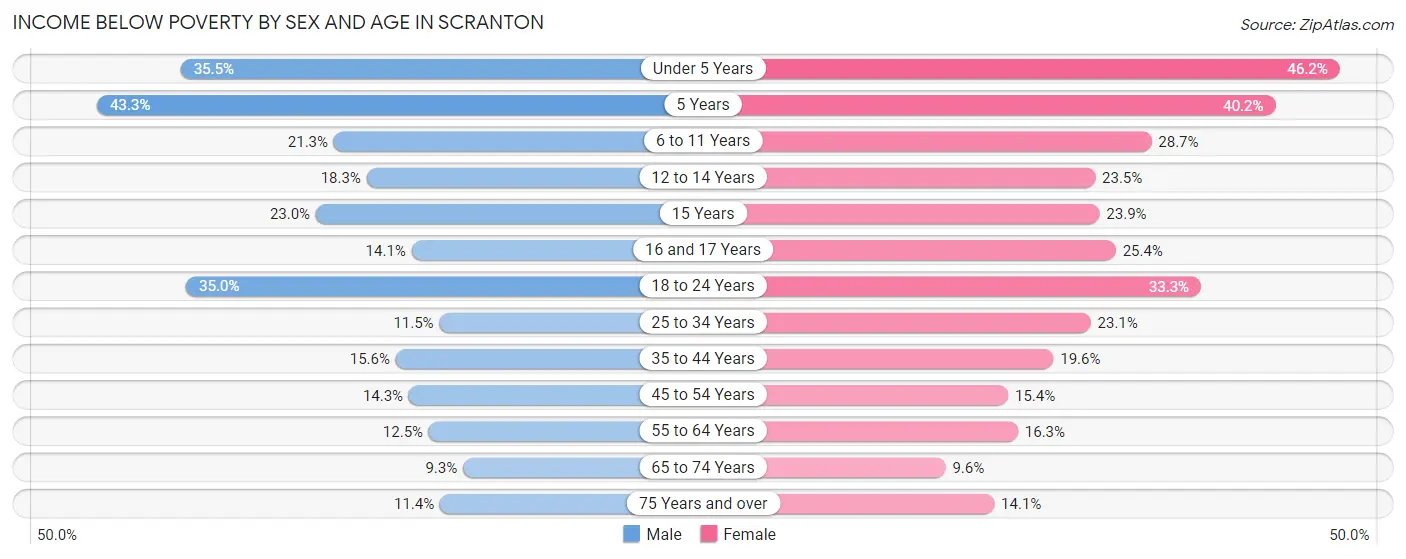
| Age Bracket | Male | Female |
| Under 5 Years | 680 (35.5%) | 894 (46.2%) |
| 5 Years | 177 (43.3%) | 103 (40.2%) |
| 6 to 11 Years | 598 (21.3%) | 724 (28.7%) |
| 12 to 14 Years | 229 (18.2%) | 284 (23.5%) |
| 15 Years | 62 (23.0%) | 82 (23.9%) |
| 16 and 17 Years | 209 (14.1%) | 241 (25.4%) |
| 18 to 24 Years | 1,287 (35.0%) | 1,290 (33.3%) |
| 25 to 34 Years | 544 (11.5%) | 1,029 (23.1%) |
| 35 to 44 Years | 657 (15.5%) | 826 (19.6%) |
| 45 to 54 Years | 618 (14.3%) | 678 (15.4%) |
| 55 to 64 Years | 547 (12.5%) | 775 (16.3%) |
| 65 to 74 Years | 358 (9.3%) | 379 (9.6%) |
| 75 Years and over | 210 (11.4%) | 382 (14.1%) |
| Total | 6,176 (17.6%) | 7,687 (21.6%) |
Income Above Poverty by Sex and Age in Scranton
According to the poverty statistics in Scranton, males aged 65 to 74 years and females aged 65 to 74 years are the age groups that are most secure financially, with 90.7% of males and 90.4% of females in these age groups living above the poverty line.
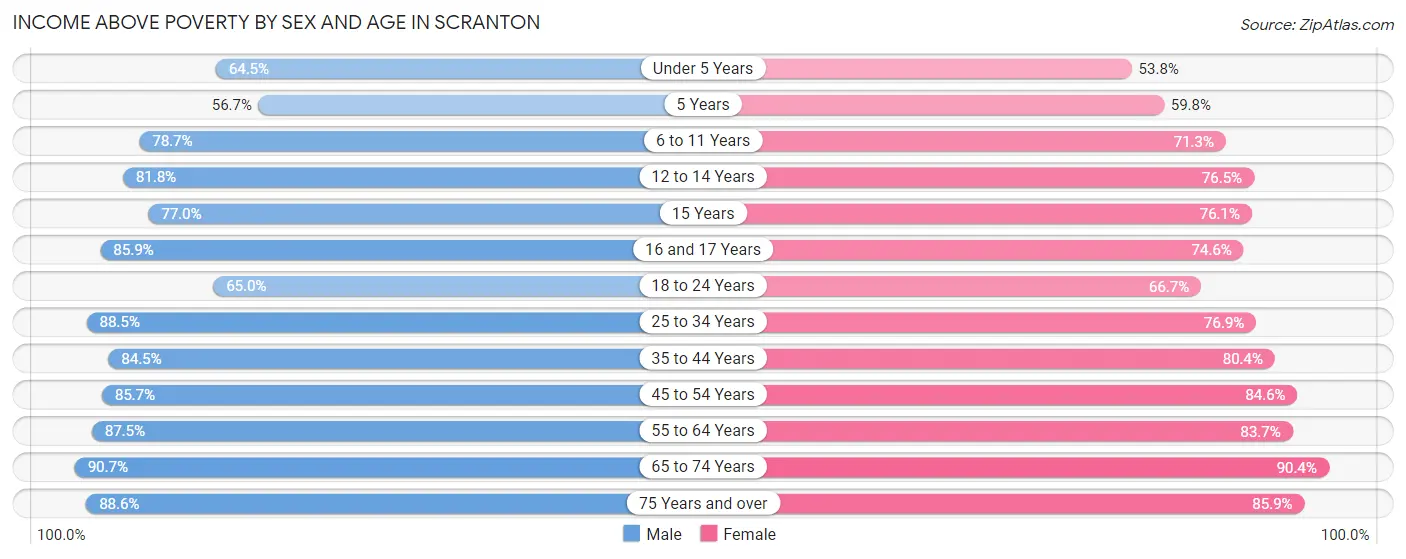
| Age Bracket | Male | Female |
| Under 5 Years | 1,235 (64.5%) | 1,041 (53.8%) |
| 5 Years | 232 (56.7%) | 153 (59.8%) |
| 6 to 11 Years | 2,209 (78.7%) | 1,796 (71.3%) |
| 12 to 14 Years | 1,026 (81.8%) | 924 (76.5%) |
| 15 Years | 208 (77.0%) | 261 (76.1%) |
| 16 and 17 Years | 1,275 (85.9%) | 707 (74.6%) |
| 18 to 24 Years | 2,389 (65.0%) | 2,580 (66.7%) |
| 25 to 34 Years | 4,187 (88.5%) | 3,428 (76.9%) |
| 35 to 44 Years | 3,569 (84.5%) | 3,381 (80.4%) |
| 45 to 54 Years | 3,694 (85.7%) | 3,717 (84.6%) |
| 55 to 64 Years | 3,837 (87.5%) | 3,967 (83.7%) |
| 65 to 74 Years | 3,486 (90.7%) | 3,559 (90.4%) |
| 75 Years and over | 1,625 (88.6%) | 2,319 (85.9%) |
| Total | 28,972 (82.4%) | 27,833 (78.4%) |
Income Below Poverty Among Married-Couple Families in Scranton
The poverty statistics for married-couple families in Scranton show that 5.7% or 604 of the total 10,569 families live below the poverty line. Families with 5 or more children have the highest poverty rate of 28.2%, comprising of 29 families. On the other hand, families with 1 or 2 children have the lowest poverty rate of 3.9%, which includes 116 families.
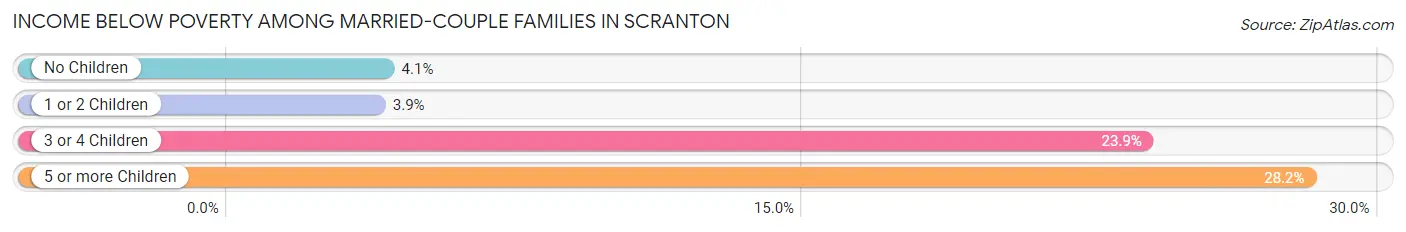
| Children | Above Poverty | Below Poverty |
| No Children | 6,408 (95.9%) | 273 (4.1%) |
| 1 or 2 Children | 2,891 (96.1%) | 116 (3.9%) |
| 3 or 4 Children | 592 (76.1%) | 186 (23.9%) |
| 5 or more Children | 74 (71.8%) | 29 (28.2%) |
| Total | 9,965 (94.3%) | 604 (5.7%) |
Income Below Poverty Among Single-Parent Households in Scranton
According to the poverty data in Scranton, 25.2% or 453 single-father households and 32.6% or 1,470 single-mother households are living below the poverty line. Among single-father households, those with 3 or 4 children have the highest poverty rate, with 95 households (66.4%) experiencing poverty. Likewise, among single-mother households, those with 3 or 4 children have the highest poverty rate, with 193 households (52.4%) falling below the poverty line.
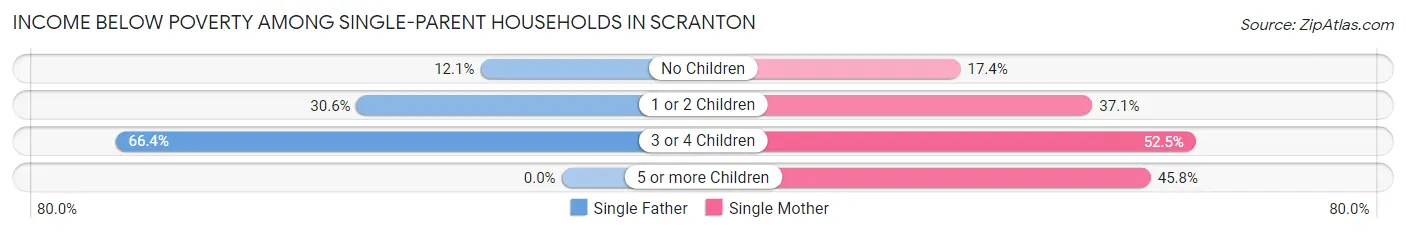
| Children | Single Father | Single Mother |
| No Children | 97 (12.1%) | 240 (17.4%) |
| 1 or 2 Children | 261 (30.6%) | 972 (37.1%) |
| 3 or 4 Children | 95 (66.4%) | 193 (52.4%) |
| 5 or more Children | 0 (0.0%) | 65 (45.8%) |
| Total | 453 (25.2%) | 1,470 (32.6%) |
Income Below Poverty Among Married-Couple vs Single-Parent Households in Scranton
The poverty data for Scranton shows that 604 of the married-couple family households (5.7%) and 1,923 of the single-parent households (30.5%) are living below the poverty level. Within the married-couple family households, those with 5 or more children have the highest poverty rate, with 29 households (28.2%) falling below the poverty line. Among the single-parent households, those with 3 or 4 children have the highest poverty rate, with 288 household (56.4%) living below poverty.
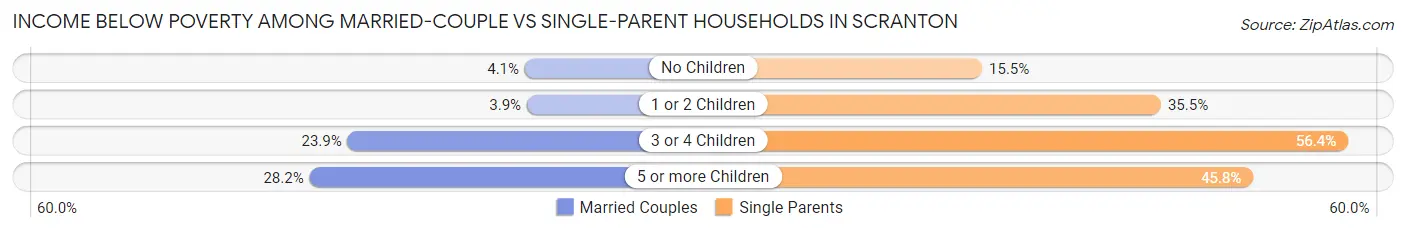
| Children | Married-Couple Families | Single-Parent Households |
| No Children | 273 (4.1%) | 337 (15.5%) |
| 1 or 2 Children | 116 (3.9%) | 1,233 (35.5%) |
| 3 or 4 Children | 186 (23.9%) | 288 (56.4%) |
| 5 or more Children | 29 (28.2%) | 65 (45.8%) |
| Total | 604 (5.7%) | 1,923 (30.5%) |
Race in Scranton
The most populous races in Scranton are White / Caucasian (56,535 | 74.3%), Hispanic or Latino (12,262 | 16.1%), and Two or more Races (8,053 | 10.6%).
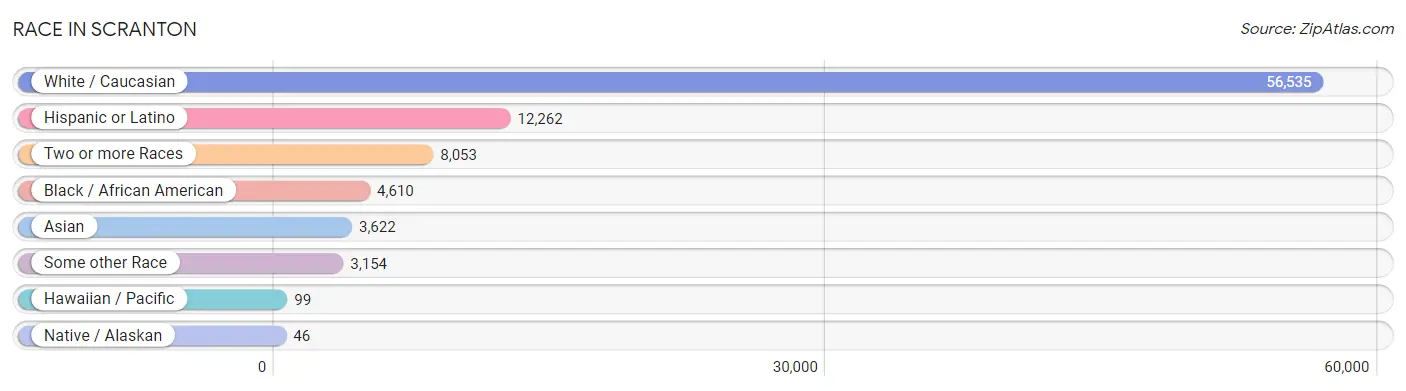
| Race | # Population | % Population |
| Asian | 3,622 | 4.8% |
| Black / African American | 4,610 | 6.1% |
| Hawaiian / Pacific | 99 | 0.1% |
| Hispanic or Latino | 12,262 | 16.1% |
| Native / Alaskan | 46 | 0.1% |
| White / Caucasian | 56,535 | 74.3% |
| Two or more Races | 8,053 | 10.6% |
| Some other Race | 3,154 | 4.1% |
| Total | 76,119 | 100.0% |
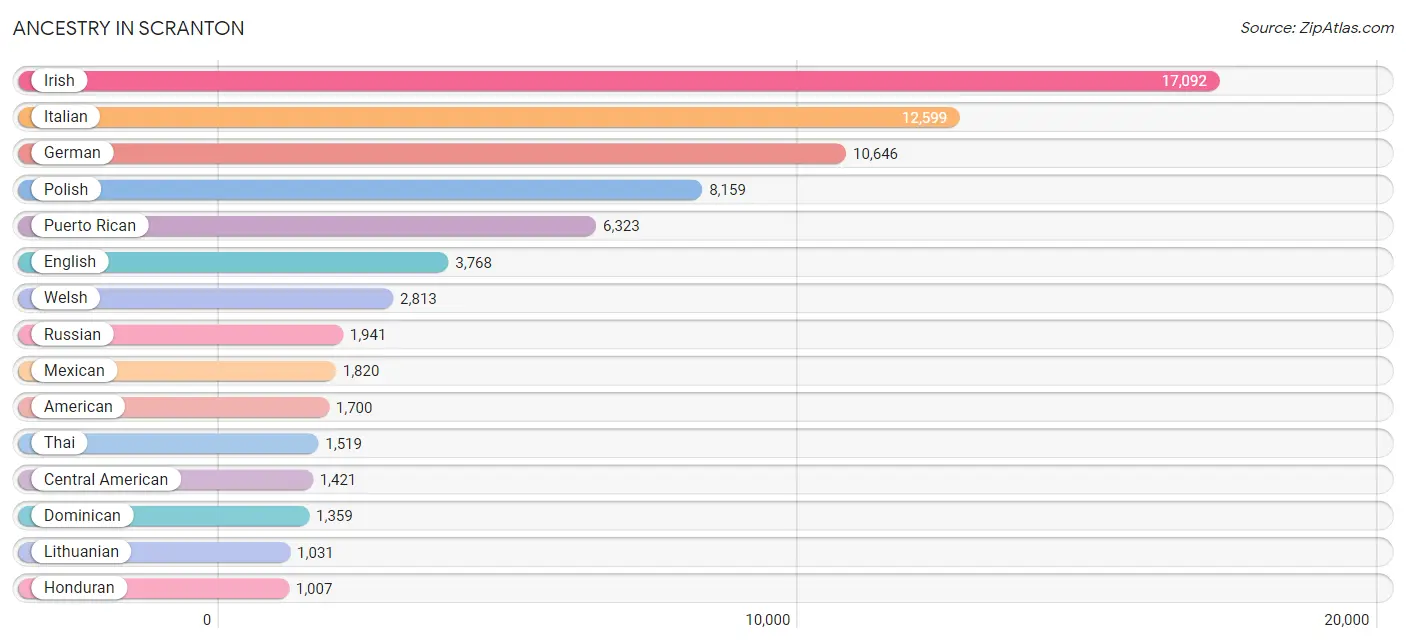
Ancestry in Scranton
The most populous ancestries reported in Scranton are Irish (17,092 | 22.5%), Italian (12,599 | 16.6%), German (10,646 | 14.0%), Polish (8,159 | 10.7%), and Puerto Rican (6,323 | 8.3%), together accounting for 72.0% of all Scranton residents.
| Ancestry | # Population | % Population |
| Afghan | 31 | 0.0% |
| African | 98 | 0.1% |
| Albanian | 40 | 0.1% |
| American | 1,700 | 2.2% |
| Arab | 281 | 0.4% |
| Argentinean | 21 | 0.0% |
| Armenian | 14 | 0.0% |
| Austrian | 229 | 0.3% |
| Barbadian | 37 | 0.1% |
| Bhutanese | 63 | 0.1% |
| Blackfeet | 16 | 0.0% |
| Brazilian | 156 | 0.2% |
| British | 163 | 0.2% |
| British West Indian | 5 | 0.0% |
| Bulgarian | 69 | 0.1% |
| Burmese | 93 | 0.1% |
| Cambodian | 6 | 0.0% |
| Cape Verdean | 21 | 0.0% |
| Carpatho Rusyn | 34 | 0.0% |
| Central American | 1,421 | 1.9% |
| Central American Indian | 137 | 0.2% |
| Cherokee | 175 | 0.2% |
| Chickasaw | 2 | 0.0% |
| Chilean | 57 | 0.1% |
| Choctaw | 3 | 0.0% |
| Colombian | 186 | 0.2% |
| Costa Rican | 27 | 0.0% |
| Cree | 4 | 0.0% |
| Croatian | 5 | 0.0% |
| Cuban | 301 | 0.4% |
| Czech | 158 | 0.2% |
| Czechoslovakian | 135 | 0.2% |
| Danish | 30 | 0.0% |
| Delaware | 6 | 0.0% |
| Dominican | 1,359 | 1.8% |
| Dutch | 610 | 0.8% |
| Eastern European | 251 | 0.3% |
| Ecuadorian | 266 | 0.4% |
| Egyptian | 11 | 0.0% |
| English | 3,768 | 5.0% |
| European | 384 | 0.5% |
| Finnish | 6 | 0.0% |
| French | 943 | 1.2% |
| French Canadian | 68 | 0.1% |
| German | 10,646 | 14.0% |
| Greek | 322 | 0.4% |
| Guatemalan | 79 | 0.1% |
| Guyanese | 89 | 0.1% |
| Haitian | 58 | 0.1% |
| Honduran | 1,007 | 1.3% |
| Hungarian | 299 | 0.4% |
| Icelander | 35 | 0.1% |
| Indian (Asian) | 424 | 0.6% |
| Iranian | 90 | 0.1% |
| Irish | 17,092 | 22.5% |
| Iroquois | 24 | 0.0% |
| Israeli | 52 | 0.1% |
| Italian | 12,599 | 16.6% |
| Jamaican | 182 | 0.2% |
| Japanese | 33 | 0.0% |
| Kenyan | 53 | 0.1% |
| Korean | 389 | 0.5% |
| Laotian | 21 | 0.0% |
| Lebanese | 232 | 0.3% |
| Lithuanian | 1,031 | 1.3% |
| Malaysian | 107 | 0.1% |
| Maltese | 77 | 0.1% |
| Mexican | 1,820 | 2.4% |
| Mexican American Indian | 12 | 0.0% |
| Native Hawaiian | 31 | 0.0% |
| Navajo | 6 | 0.0% |
| Nicaraguan | 50 | 0.1% |
| Nigerian | 9 | 0.0% |
| Northern European | 175 | 0.2% |
| Norwegian | 109 | 0.1% |
| Pakistani | 91 | 0.1% |
| Panamanian | 46 | 0.1% |
| Pennsylvania German | 117 | 0.2% |
| Peruvian | 74 | 0.1% |
| Polish | 8,159 | 10.7% |
| Portuguese | 309 | 0.4% |
| Puerto Rican | 6,323 | 8.3% |
| Romanian | 51 | 0.1% |
| Russian | 1,941 | 2.5% |
| Salvadoran | 212 | 0.3% |
| Samoan | 12 | 0.0% |
| Scandinavian | 57 | 0.1% |
| Scotch-Irish | 115 | 0.2% |
| Scottish | 329 | 0.4% |
| Sierra Leonean | 8 | 0.0% |
| Sioux | 23 | 0.0% |
| Slavic | 27 | 0.0% |
| Slovak | 888 | 1.2% |
| Slovene | 65 | 0.1% |
| South African | 6 | 0.0% |
| South American | 669 | 0.9% |
| Spaniard | 21 | 0.0% |
| Spanish | 88 | 0.1% |
| Sri Lankan | 84 | 0.1% |
| Subsaharan African | 630 | 0.8% |
| Swedish | 249 | 0.3% |
| Swiss | 108 | 0.1% |
| Syrian | 30 | 0.0% |
| Thai | 1,519 | 2.0% |
| Trinidadian and Tobagonian | 17 | 0.0% |
| Turkish | 195 | 0.3% |
| Ukrainian | 733 | 1.0% |
| Uruguayan | 17 | 0.0% |
| Venezuelan | 48 | 0.1% |
| Welsh | 2,813 | 3.7% |
| West Indian | 232 | 0.3% |
| Yugoslavian | 20 | 0.0% | View All 112 Rows |
Immigrants in Scranton
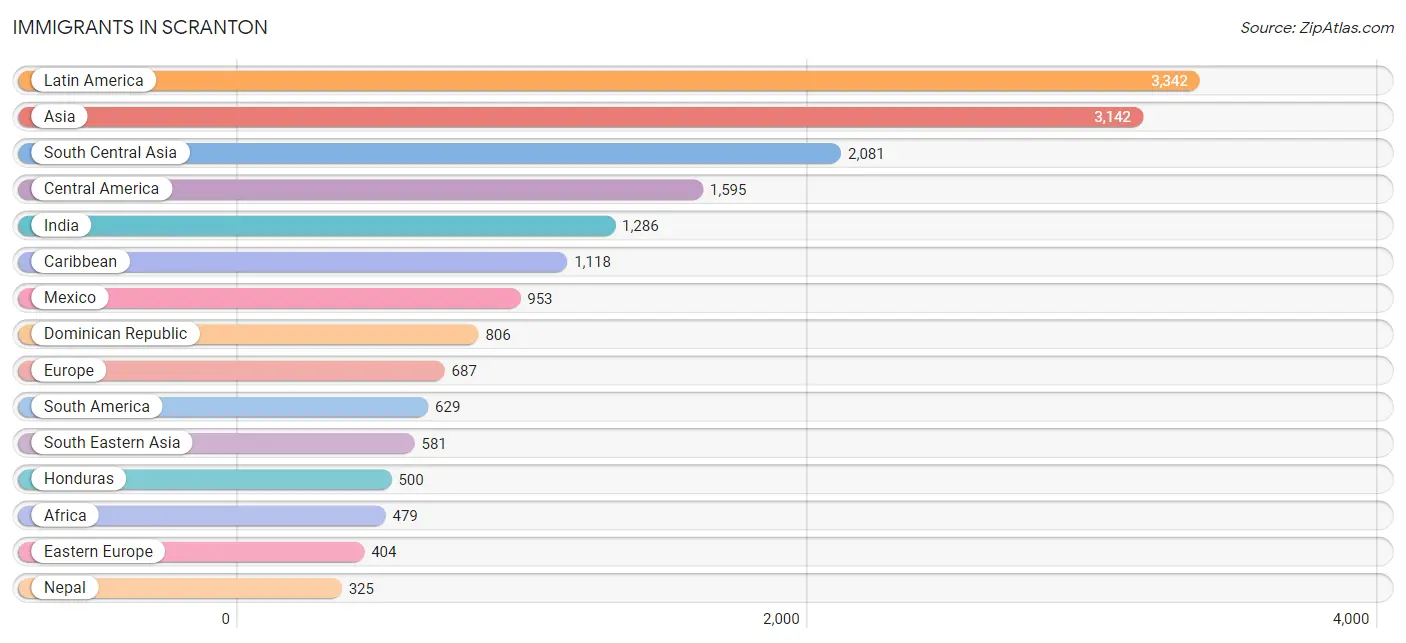
The most numerous immigrant groups reported in Scranton came from Latin America (3,342 | 4.4%), Asia (3,142 | 4.1%), South Central Asia (2,081 | 2.7%), Central America (1,595 | 2.1%), and India (1,286 | 1.7%), together accounting for 15.0% of all Scranton residents.
| Immigration Origin | # Population | % Population |
| Afghanistan | 100 | 0.1% |
| Africa | 479 | 0.6% |
| Albania | 11 | 0.0% |
| Argentina | 8 | 0.0% |
| Asia | 3,142 | 4.1% |
| Bahamas | 5 | 0.0% |
| Belarus | 33 | 0.0% |
| Bosnia and Herzegovina | 8 | 0.0% |
| Brazil | 205 | 0.3% |
| Bulgaria | 87 | 0.1% |
| Cabo Verde | 21 | 0.0% |
| Cambodia | 15 | 0.0% |
| Canada | 8 | 0.0% |
| Caribbean | 1,118 | 1.5% |
| Central America | 1,595 | 2.1% |
| Chile | 19 | 0.0% |
| China | 231 | 0.3% |
| Colombia | 100 | 0.1% |
| Cuba | 173 | 0.2% |
| Denmark | 6 | 0.0% |
| Dominican Republic | 806 | 1.1% |
| Eastern Africa | 243 | 0.3% |
| Eastern Asia | 303 | 0.4% |
| Eastern Europe | 404 | 0.5% |
| Ecuador | 153 | 0.2% |
| Egypt | 11 | 0.0% |
| El Salvador | 46 | 0.1% |
| England | 10 | 0.0% |
| Europe | 687 | 0.9% |
| France | 22 | 0.0% |
| Germany | 17 | 0.0% |
| Greece | 37 | 0.1% |
| Guatemala | 14 | 0.0% |
| Guyana | 76 | 0.1% |
| Honduras | 500 | 0.7% |
| Hong Kong | 26 | 0.0% |
| India | 1,286 | 1.7% |
| Indonesia | 115 | 0.2% |
| Iran | 19 | 0.0% |
| Ireland | 13 | 0.0% |
| Israel | 17 | 0.0% |
| Italy | 111 | 0.2% |
| Jamaica | 97 | 0.1% |
| Japan | 22 | 0.0% |
| Kenya | 40 | 0.1% |
| Korea | 50 | 0.1% |
| Laos | 57 | 0.1% |
| Latin America | 3,342 | 4.4% |
| Mexico | 953 | 1.3% |
| Micronesia | 13 | 0.0% |
| Middle Africa | 65 | 0.1% |
| Nepal | 325 | 0.4% |
| Netherlands | 15 | 0.0% |
| Nicaragua | 82 | 0.1% |
| Nigeria | 9 | 0.0% |
| Northern Africa | 11 | 0.0% |
| Northern Europe | 60 | 0.1% |
| Oceania | 13 | 0.0% |
| Pakistan | 32 | 0.0% |
| Peru | 47 | 0.1% |
| Philippines | 227 | 0.3% |
| Portugal | 8 | 0.0% |
| Romania | 14 | 0.0% |
| Russia | 251 | 0.3% |
| Sierra Leone | 8 | 0.0% |
| South Africa | 6 | 0.0% |
| South America | 629 | 0.8% |
| South Central Asia | 2,081 | 2.7% |
| South Eastern Asia | 581 | 0.8% |
| Southern Europe | 169 | 0.2% |
| Spain | 13 | 0.0% |
| Trinidad and Tobago | 22 | 0.0% |
| Turkey | 160 | 0.2% |
| Uruguay | 21 | 0.0% |
| Vietnam | 167 | 0.2% |
| Western Africa | 154 | 0.2% |
| Western Asia | 177 | 0.2% |
| Western Europe | 54 | 0.1% |
| Zaire | 65 | 0.1% | View All 79 Rows |
Sex and Age in Scranton
Sex and Age in Scranton
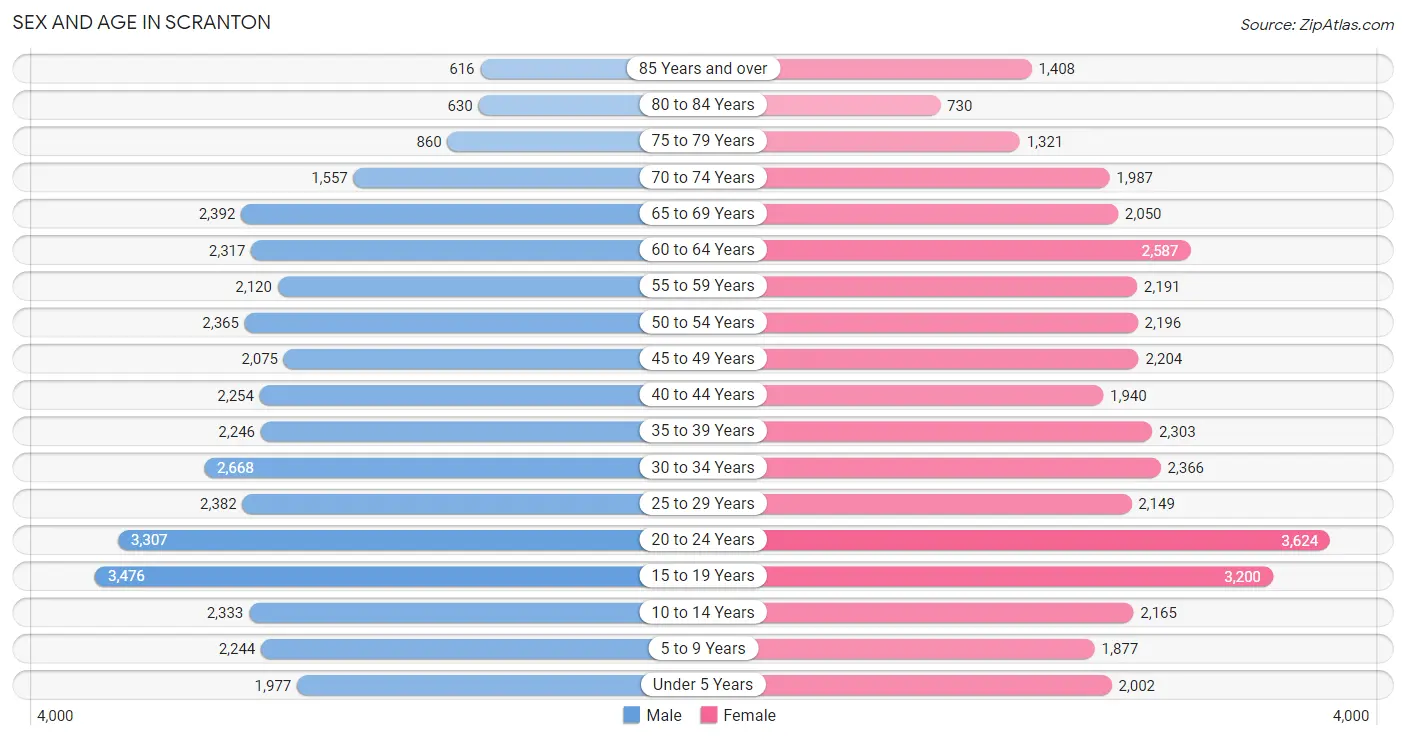
The most populous age groups in Scranton are 15 to 19 Years (3,476 | 9.2%) for men and 20 to 24 Years (3,624 | 9.5%) for women.
| Age Bracket | Male | Female |
| Under 5 Years | 1,977 (5.2%) | 2,002 (5.2%) |
| 5 to 9 Years | 2,244 (5.9%) | 1,877 (4.9%) |
| 10 to 14 Years | 2,333 (6.2%) | 2,165 (5.7%) |
| 15 to 19 Years | 3,476 (9.2%) | 3,200 (8.4%) |
| 20 to 24 Years | 3,307 (8.7%) | 3,624 (9.5%) |
| 25 to 29 Years | 2,382 (6.3%) | 2,149 (5.6%) |
| 30 to 34 Years | 2,668 (7.0%) | 2,366 (6.2%) |
| 35 to 39 Years | 2,246 (5.9%) | 2,303 (6.0%) |
| 40 to 44 Years | 2,254 (6.0%) | 1,940 (5.1%) |
| 45 to 49 Years | 2,075 (5.5%) | 2,204 (5.8%) |
| 50 to 54 Years | 2,365 (6.2%) | 2,196 (5.7%) |
| 55 to 59 Years | 2,120 (5.6%) | 2,191 (5.7%) |
| 60 to 64 Years | 2,317 (6.1%) | 2,587 (6.8%) |
| 65 to 69 Years | 2,392 (6.3%) | 2,050 (5.3%) |
| 70 to 74 Years | 1,557 (4.1%) | 1,987 (5.2%) |
| 75 to 79 Years | 860 (2.3%) | 1,321 (3.5%) |
| 80 to 84 Years | 630 (1.7%) | 730 (1.9%) |
| 85 Years and over | 616 (1.6%) | 1,408 (3.7%) |
| Total | 37,819 (100.0%) | 38,300 (100.0%) |
Families and Households in Scranton
Median Family Size in Scranton
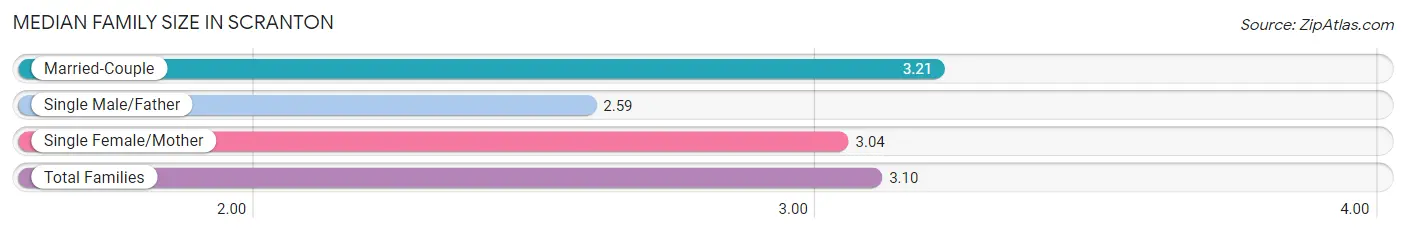
The median family size in Scranton is 3.10 persons per family, with married-couple families (10,569 | 62.6%) accounting for the largest median family size of 3.21 persons per family. On the other hand, single male/father families (1,798 | 10.6%) represent the smallest median family size with 2.59 persons per family.
| Family Type | # Families | Family Size |
| Married-Couple | 10,569 (62.6%) | 3.21 |
| Single Male/Father | 1,798 (10.6%) | 2.59 |
| Single Female/Mother | 4,511 (26.7%) | 3.04 |
| Total Families | 16,878 (100.0%) | 3.10 |
Median Household Size in Scranton
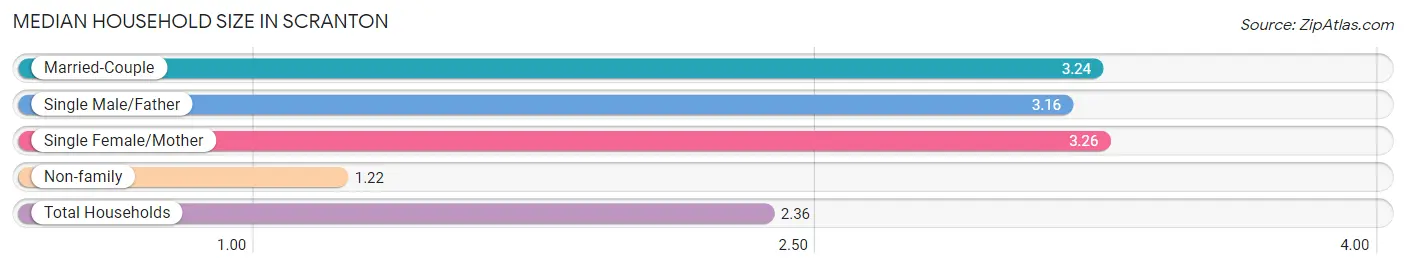
The median household size in Scranton is 2.36 persons per household, with single female/mother households (4,511 | 15.1%) accounting for the largest median household size of 3.26 persons per household. non-family households (13,069 | 43.6%) represent the smallest median household size with 1.22 persons per household.
| Household Type | # Households | Household Size |
| Married-Couple | 10,569 (35.3%) | 3.24 |
| Single Male/Father | 1,798 (6.0%) | 3.16 |
| Single Female/Mother | 4,511 (15.1%) | 3.26 |
| Non-family | 13,069 (43.6%) | 1.22 |
| Total Households | 29,947 (100.0%) | 2.36 |
Household Size by Marriage Status in Scranton
Out of a total of 29,947 households in Scranton, 16,878 (56.4%) are family households, while 13,069 (43.6%) are nonfamily households. The most numerous type of family households are 2-person households, comprising 7,015, and the most common type of nonfamily households are 1-person households, comprising 10,890.
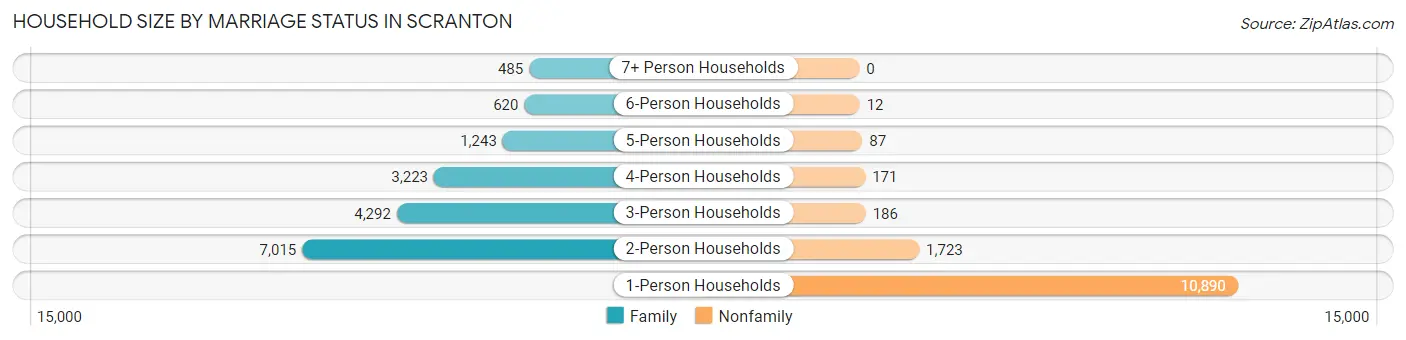
| Household Size | Family Households | Nonfamily Households |
| 1-Person Households | - | 10,890 (36.4%) |
| 2-Person Households | 7,015 (23.4%) | 1,723 (5.8%) |
| 3-Person Households | 4,292 (14.3%) | 186 (0.6%) |
| 4-Person Households | 3,223 (10.8%) | 171 (0.6%) |
| 5-Person Households | 1,243 (4.2%) | 87 (0.3%) |
| 6-Person Households | 620 (2.1%) | 12 (0.0%) |
| 7+ Person Households | 485 (1.6%) | 0 (0.0%) |
| Total | 16,878 (56.4%) | 13,069 (43.6%) |
Female Fertility in Scranton
Fertility by Age in Scranton
Average fertility rate in Scranton is 46.0 births per 1,000 women. Women in the age bracket of 20 to 34 years have the highest fertility rate with 74.0 births per 1,000 women. Women in the age bracket of 20 to 34 years acount for 72.5% of all women with births.
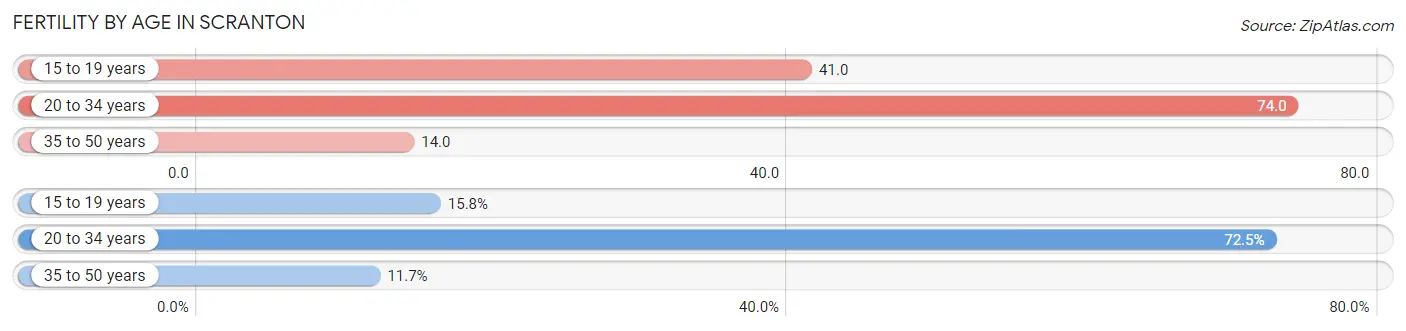
| Age Bracket | Women with Births | Births / 1,000 Women |
| 15 to 19 years | 131 (15.8%) | 41.0 |
| 20 to 34 years | 601 (72.5%) | 74.0 |
| 35 to 50 years | 97 (11.7%) | 14.0 |
| Total | 829 (100.0%) | 46.0 |
Fertility by Age by Marriage Status in Scranton
50.3% of women with births (829) in Scranton are married. The highest percentage of unmarried women with births falls into 15 to 19 years age bracket with 100.0% of them unmarried at the time of birth, while the lowest percentage of unmarried women with births belong to 35 to 50 years age bracket with 12.4% of them unmarried.
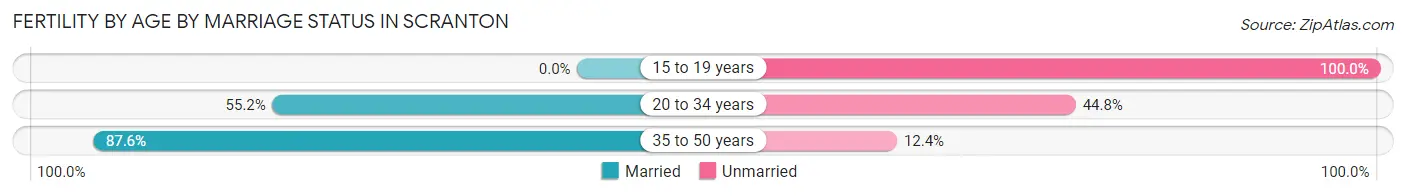
| Age Bracket | Married | Unmarried |
| 15 to 19 years | 0 (0.0%) | 131 (100.0%) |
| 20 to 34 years | 332 (55.2%) | 269 (44.8%) |
| 35 to 50 years | 85 (87.6%) | 12 (12.4%) |
| Total | 417 (50.3%) | 412 (49.7%) |
Fertility by Education in Scranton
Average fertility rate in Scranton is 46.0 births per 1,000 women. Women with the education attainment of less than high school have the highest fertility rate of 69.0 births per 1,000 women, while women with the education attainment of college or associate's degree have the lowest fertility at 13.0 births per 1,000 women. Women with the education attainment of high school diploma represent 35.5% of all women with births.
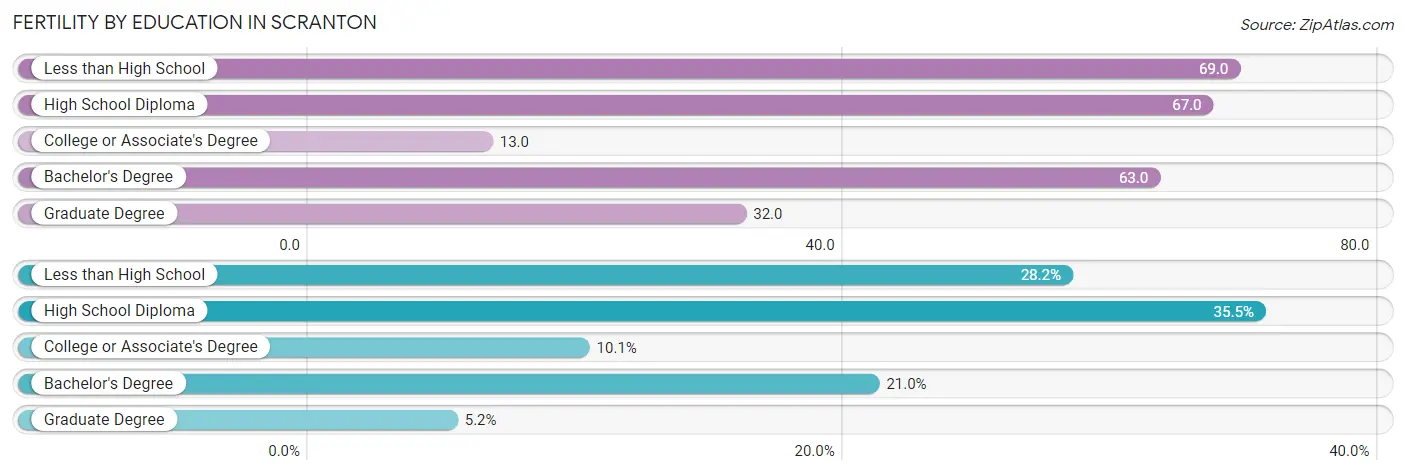
| Educational Attainment | Women with Births | Births / 1,000 Women |
| Less than High School | 234 (28.2%) | 69.0 |
| High School Diploma | 294 (35.5%) | 67.0 |
| College or Associate's Degree | 84 (10.1%) | 13.0 |
| Bachelor's Degree | 174 (21.0%) | 63.0 |
| Graduate Degree | 43 (5.2%) | 32.0 |
| Total | 829 (100.0%) | 46.0 |
Fertility by Education by Marriage Status in Scranton
49.7% of women with births in Scranton are unmarried. Women with the educational attainment of bachelor's degree are most likely to be married with 100.0% of them married at childbirth, while women with the educational attainment of less than high school are least likely to be married with 83.3% of them unmarried at childbirth.
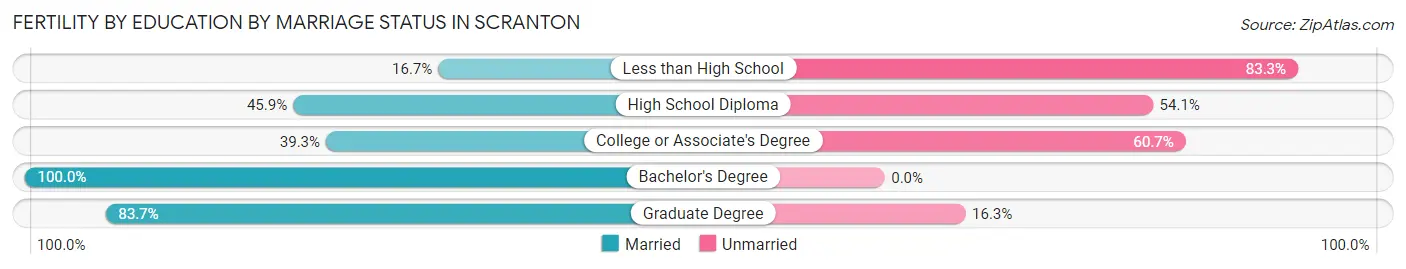
| Educational Attainment | Married | Unmarried |
| Less than High School | 39 (16.7%) | 195 (83.3%) |
| High School Diploma | 135 (45.9%) | 159 (54.1%) |
| College or Associate's Degree | 33 (39.3%) | 51 (60.7%) |
| Bachelor's Degree | 174 (100.0%) | 0 (0.0%) |
| Graduate Degree | 36 (83.7%) | 7 (16.3%) |
| Total | 417 (50.3%) | 412 (49.7%) |
Employment Characteristics in Scranton
Employment by Class of Employer in Scranton
Among the 33,624 employed individuals in Scranton, private company employees (23,636 | 70.3%), not-for-profit organizations (4,578 | 13.6%), and local government employees (1,775 | 5.3%) make up the most common classes of employment.
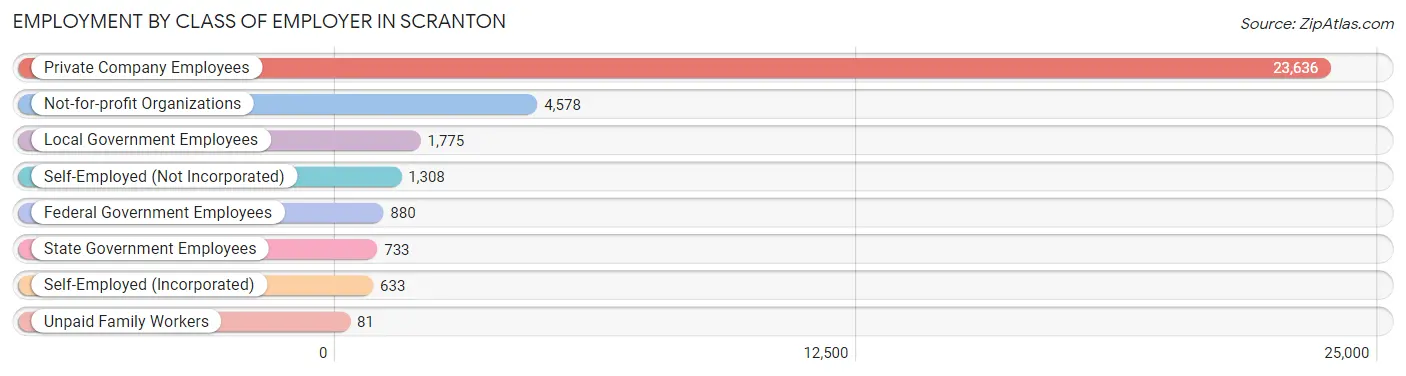
| Employer Class | # Employees | % Employees |
| Private Company Employees | 23,636 | 70.3% |
| Self-Employed (Incorporated) | 633 | 1.9% |
| Self-Employed (Not Incorporated) | 1,308 | 3.9% |
| Not-for-profit Organizations | 4,578 | 13.6% |
| Local Government Employees | 1,775 | 5.3% |
| State Government Employees | 733 | 2.2% |
| Federal Government Employees | 880 | 2.6% |
| Unpaid Family Workers | 81 | 0.2% |
| Total | 33,624 | 100.0% |
Employment Status by Age in Scranton
According to the labor force statistics for Scranton, out of the total population over 16 years of age (62,908), 57.8% or 36,361 individuals are in the labor force, with 5.6% or 2,036 of them unemployed. The age group with the highest labor force participation rate is 25 to 29 years, with 83.0% or 3,761 individuals in the labor force. Within the labor force, the 75 years and over age range has the highest percentage of unemployed individuals, with 13.6% or 36 of them being unemployed.
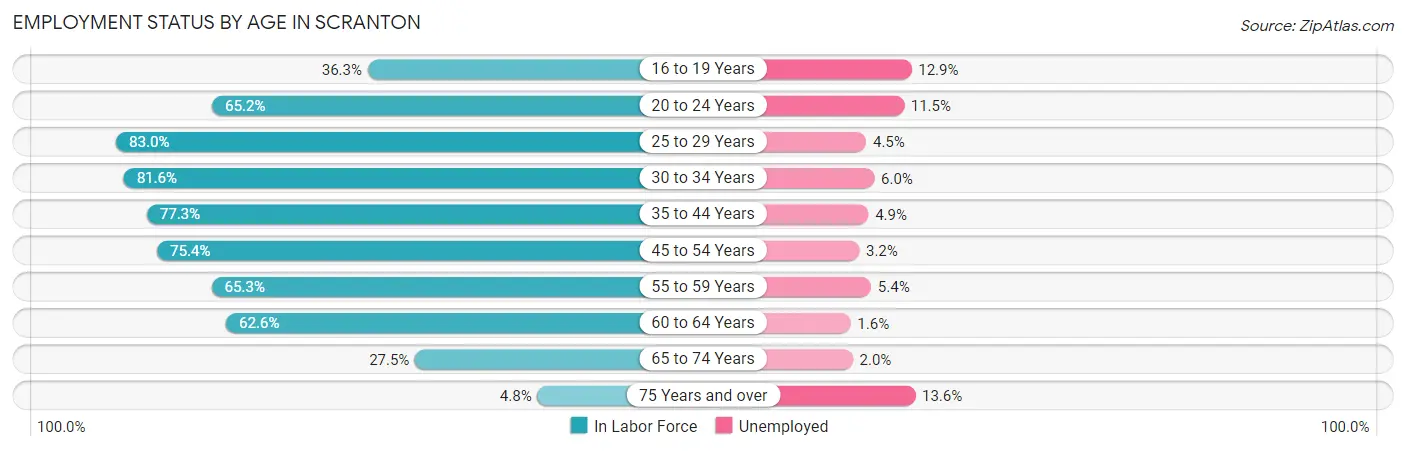
| Age Bracket | In Labor Force | Unemployed |
| 16 to 19 Years | 2,201 (36.3%) | 284 (12.9%) |
| 20 to 24 Years | 4,519 (65.2%) | 520 (11.5%) |
| 25 to 29 Years | 3,761 (83.0%) | 169 (4.5%) |
| 30 to 34 Years | 4,108 (81.6%) | 246 (6.0%) |
| 35 to 44 Years | 6,758 (77.3%) | 331 (4.9%) |
| 45 to 54 Years | 6,665 (75.4%) | 213 (3.2%) |
| 55 to 59 Years | 2,815 (65.3%) | 152 (5.4%) |
| 60 to 64 Years | 3,070 (62.6%) | 49 (1.6%) |
| 65 to 74 Years | 2,196 (27.5%) | 44 (2.0%) |
| 75 Years and over | 267 (4.8%) | 36 (13.6%) |
| Total | 36,361 (57.8%) | 2,036 (5.6%) |
Employment Status by Educational Attainment in Scranton
According to labor force statistics for Scranton, 74.7% of individuals (27,163) out of the total population between 25 and 64 years of age (36,363) are in the labor force, with 4.3% or 1,168 of them being unemployed. The group with the highest labor force participation rate are those with the educational attainment of bachelor's degree or higher, with 84.7% or 7,436 individuals in the labor force. Within the labor force, individuals with high school diploma education have the highest percentage of unemployment, with 7.0% or 666 of them being unemployed.
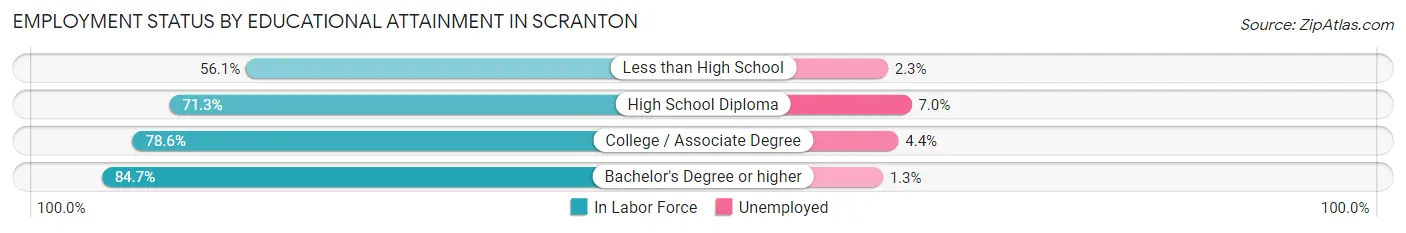
| Educational Attainment | In Labor Force | Unemployed |
| Less than High School | 2,444 (56.1%) | 100 (2.3%) |
| High School Diploma | 9,508 (71.3%) | 933 (7.0%) |
| College / Associate Degree | 7,775 (78.6%) | 435 (4.4%) |
| Bachelor's Degree or higher | 7,436 (84.7%) | 114 (1.3%) |
| Total | 27,163 (74.7%) | 1,564 (4.3%) |
Employment Occupations by Sex in Scranton
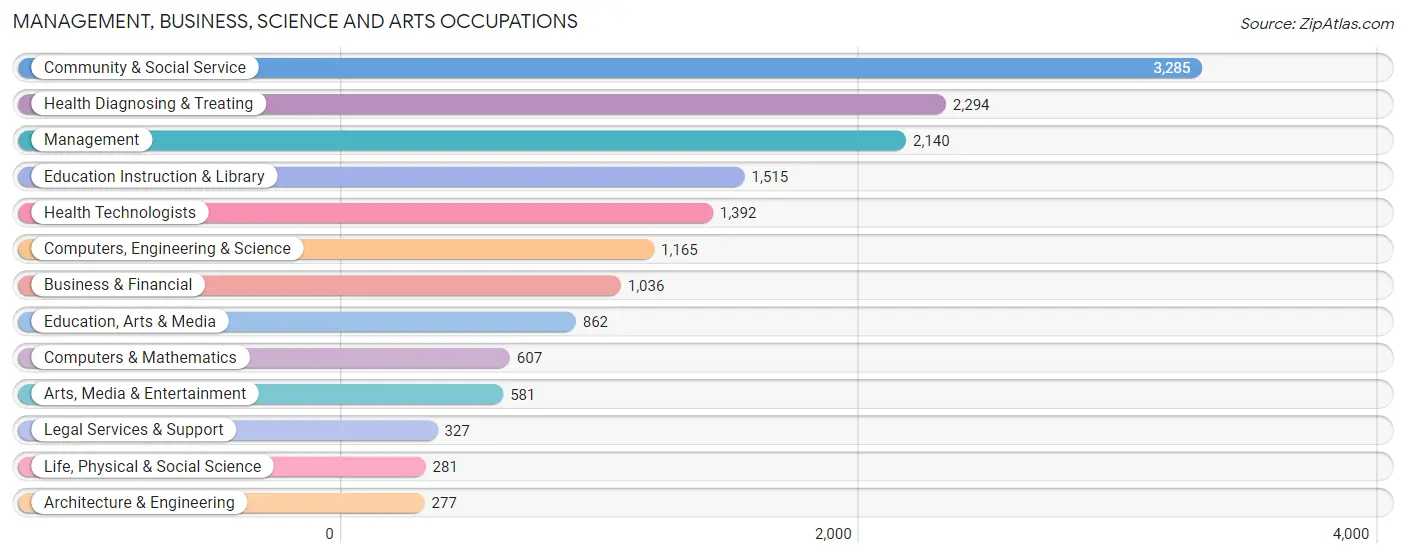
Management, Business, Science and Arts Occupations
The most common Management, Business, Science and Arts occupations in Scranton are Community & Social Service (3,285 | 9.6%), Health Diagnosing & Treating (2,294 | 6.7%), Management (2,140 | 6.2%), Education Instruction & Library (1,515 | 4.4%), and Health Technologists (1,392 | 4.1%).
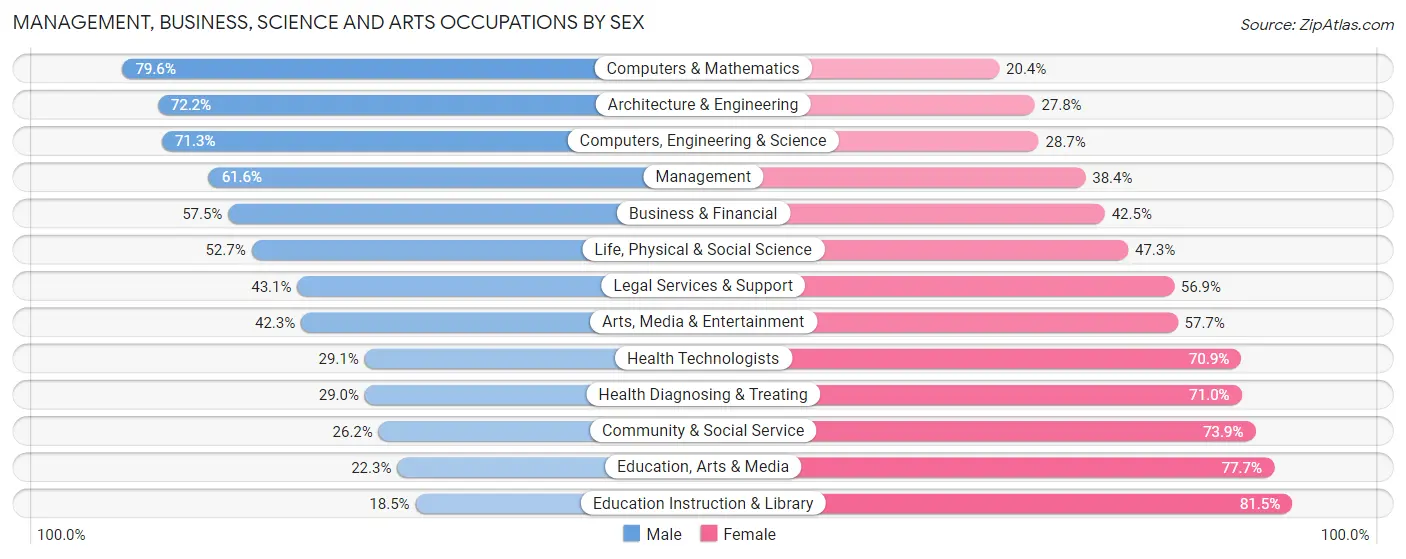
Management, Business, Science and Arts Occupations by Sex
Within the Management, Business, Science and Arts occupations in Scranton, the most male-oriented occupations are Computers & Mathematics (79.6%), Architecture & Engineering (72.2%), and Computers, Engineering & Science (71.3%), while the most female-oriented occupations are Education Instruction & Library (81.5%), Education, Arts & Media (77.7%), and Community & Social Service (73.9%).
| Occupation | Male | Female |
| Management | 1,318 (61.6%) | 822 (38.4%) |
| Business & Financial | 596 (57.5%) | 440 (42.5%) |
| Computers, Engineering & Science | 831 (71.3%) | 334 (28.7%) |
| Computers & Mathematics | 483 (79.6%) | 124 (20.4%) |
| Architecture & Engineering | 200 (72.2%) | 77 (27.8%) |
| Life, Physical & Social Science | 148 (52.7%) | 133 (47.3%) |
| Community & Social Service | 859 (26.2%) | 2,426 (73.9%) |
| Education, Arts & Media | 192 (22.3%) | 670 (77.7%) |
| Legal Services & Support | 141 (43.1%) | 186 (56.9%) |
| Education Instruction & Library | 280 (18.5%) | 1,235 (81.5%) |
| Arts, Media & Entertainment | 246 (42.3%) | 335 (57.7%) |
| Health Diagnosing & Treating | 666 (29.0%) | 1,628 (71.0%) |
| Health Technologists | 405 (29.1%) | 987 (70.9%) |
| Total (Category) | 4,270 (43.0%) | 5,650 (57.0%) |
| Total (Overall) | 17,689 (51.5%) | 16,622 (48.4%) |
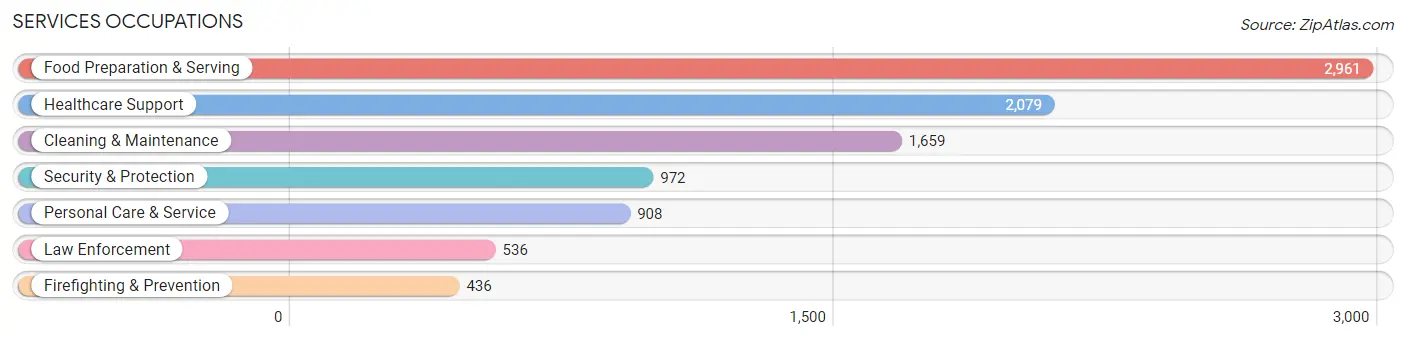
Services Occupations
The most common Services occupations in Scranton are Food Preparation & Serving (2,961 | 8.6%), Healthcare Support (2,079 | 6.1%), Cleaning & Maintenance (1,659 | 4.8%), Security & Protection (972 | 2.8%), and Personal Care & Service (908 | 2.6%).
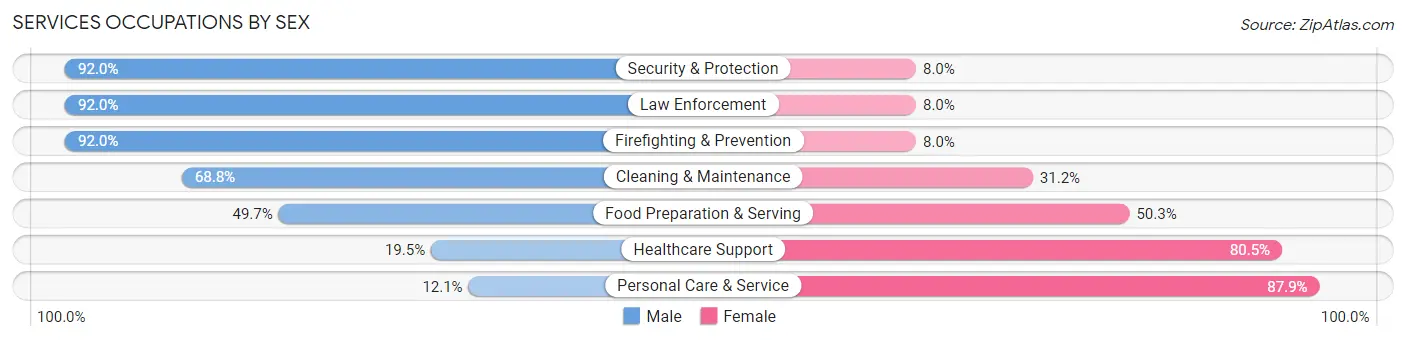
Services Occupations by Sex
Within the Services occupations in Scranton, the most male-oriented occupations are Security & Protection (92.0%), Law Enforcement (92.0%), and Firefighting & Prevention (92.0%), while the most female-oriented occupations are Personal Care & Service (87.9%), Healthcare Support (80.5%), and Food Preparation & Serving (50.3%).
| Occupation | Male | Female |
| Healthcare Support | 406 (19.5%) | 1,673 (80.5%) |
| Security & Protection | 894 (92.0%) | 78 (8.0%) |
| Firefighting & Prevention | 401 (92.0%) | 35 (8.0%) |
| Law Enforcement | 493 (92.0%) | 43 (8.0%) |
| Food Preparation & Serving | 1,472 (49.7%) | 1,489 (50.3%) |
| Cleaning & Maintenance | 1,142 (68.8%) | 517 (31.2%) |
| Personal Care & Service | 110 (12.1%) | 798 (87.9%) |
| Total (Category) | 4,024 (46.9%) | 4,555 (53.1%) |
| Total (Overall) | 17,689 (51.5%) | 16,622 (48.4%) |
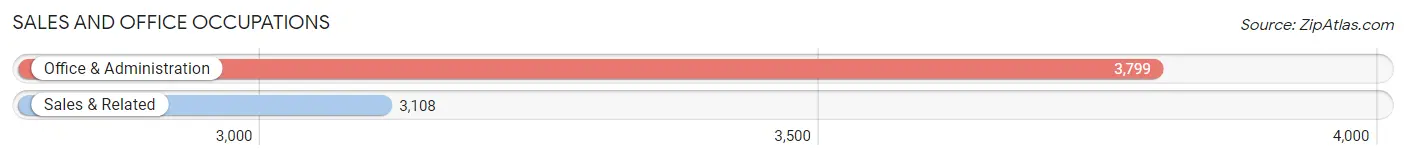
Sales and Office Occupations
The most common Sales and Office occupations in Scranton are Office & Administration (3,799 | 11.1%), and Sales & Related (3,108 | 9.1%).
Sales and Office Occupations by Sex
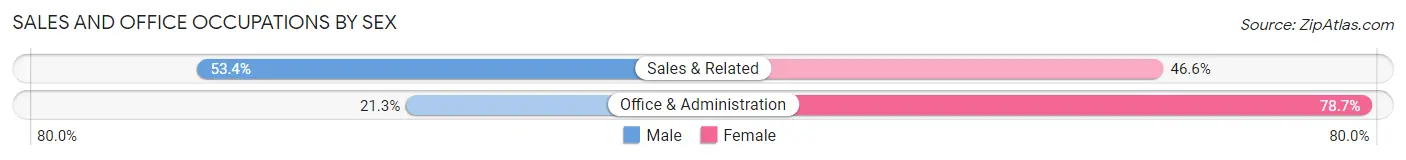
| Occupation | Male | Female |
| Sales & Related | 1,659 (53.4%) | 1,449 (46.6%) |
| Office & Administration | 810 (21.3%) | 2,989 (78.7%) |
| Total (Category) | 2,469 (35.7%) | 4,438 (64.2%) |
| Total (Overall) | 17,689 (51.5%) | 16,622 (48.4%) |
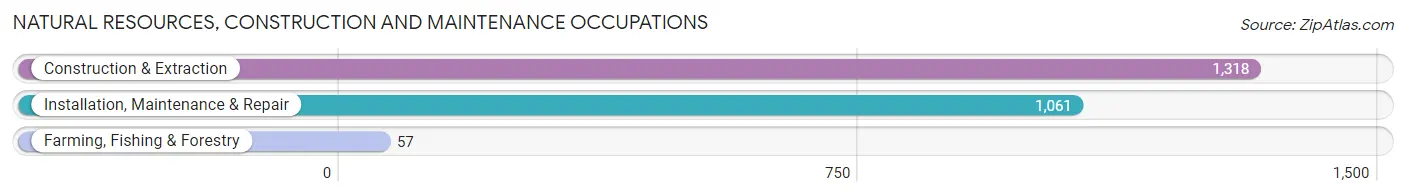
Natural Resources, Construction and Maintenance Occupations
The most common Natural Resources, Construction and Maintenance occupations in Scranton are Construction & Extraction (1,318 | 3.8%), Installation, Maintenance & Repair (1,061 | 3.1%), and Farming, Fishing & Forestry (57 | 0.2%).
Natural Resources, Construction and Maintenance Occupations by Sex
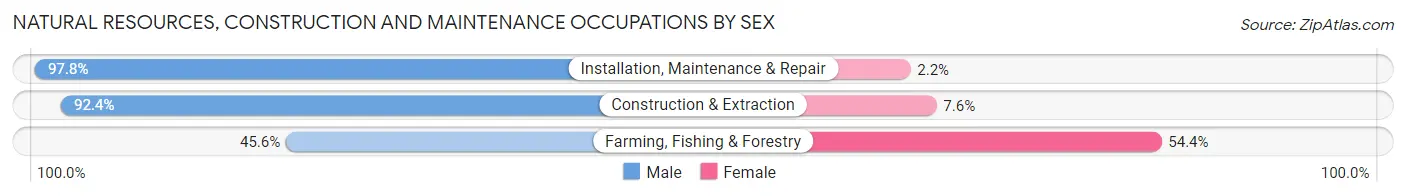
| Occupation | Male | Female |
| Farming, Fishing & Forestry | 26 (45.6%) | 31 (54.4%) |
| Construction & Extraction | 1,218 (92.4%) | 100 (7.6%) |
| Installation, Maintenance & Repair | 1,038 (97.8%) | 23 (2.2%) |
| Total (Category) | 2,282 (93.7%) | 154 (6.3%) |
| Total (Overall) | 17,689 (51.5%) | 16,622 (48.4%) |
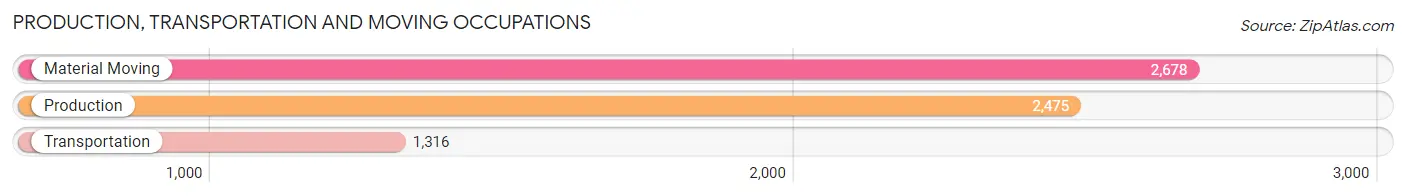
Production, Transportation and Moving Occupations
The most common Production, Transportation and Moving occupations in Scranton are Material Moving (2,678 | 7.8%), Production (2,475 | 7.2%), and Transportation (1,316 | 3.8%).
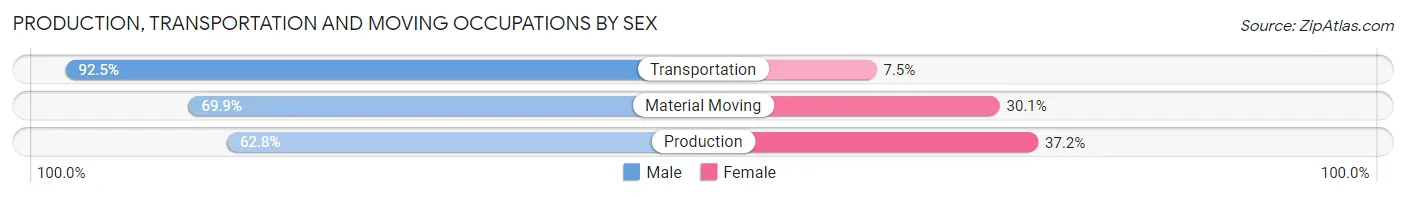
Production, Transportation and Moving Occupations by Sex
| Occupation | Male | Female |
| Production | 1,555 (62.8%) | 920 (37.2%) |
| Transportation | 1,217 (92.5%) | 99 (7.5%) |
| Material Moving | 1,872 (69.9%) | 806 (30.1%) |
| Total (Category) | 4,644 (71.8%) | 1,825 (28.2%) |
| Total (Overall) | 17,689 (51.5%) | 16,622 (48.4%) |
Employment Industries by Sex in Scranton
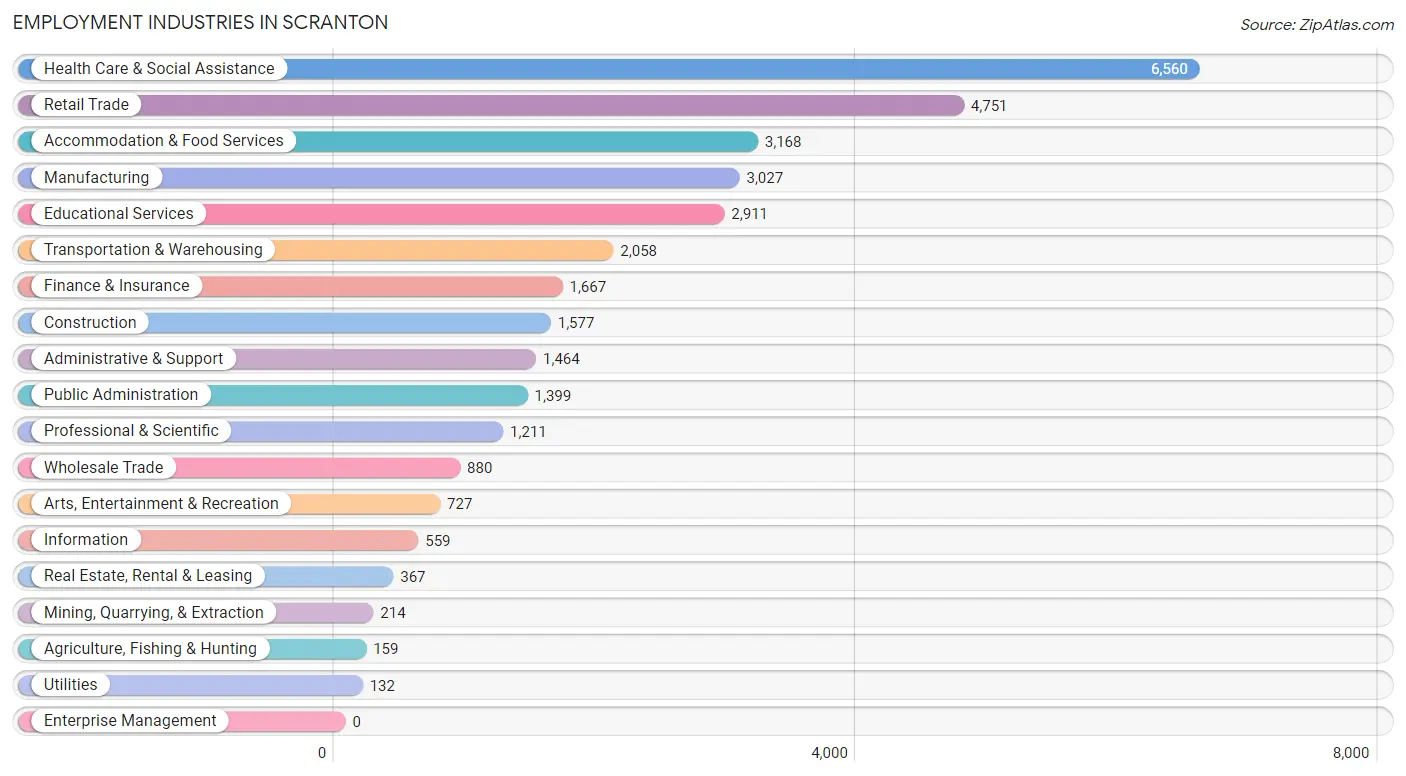
Employment Industries in Scranton
The major employment industries in Scranton include Health Care & Social Assistance (6,560 | 19.1%), Retail Trade (4,751 | 13.9%), Accommodation & Food Services (3,168 | 9.2%), Manufacturing (3,027 | 8.8%), and Educational Services (2,911 | 8.5%).
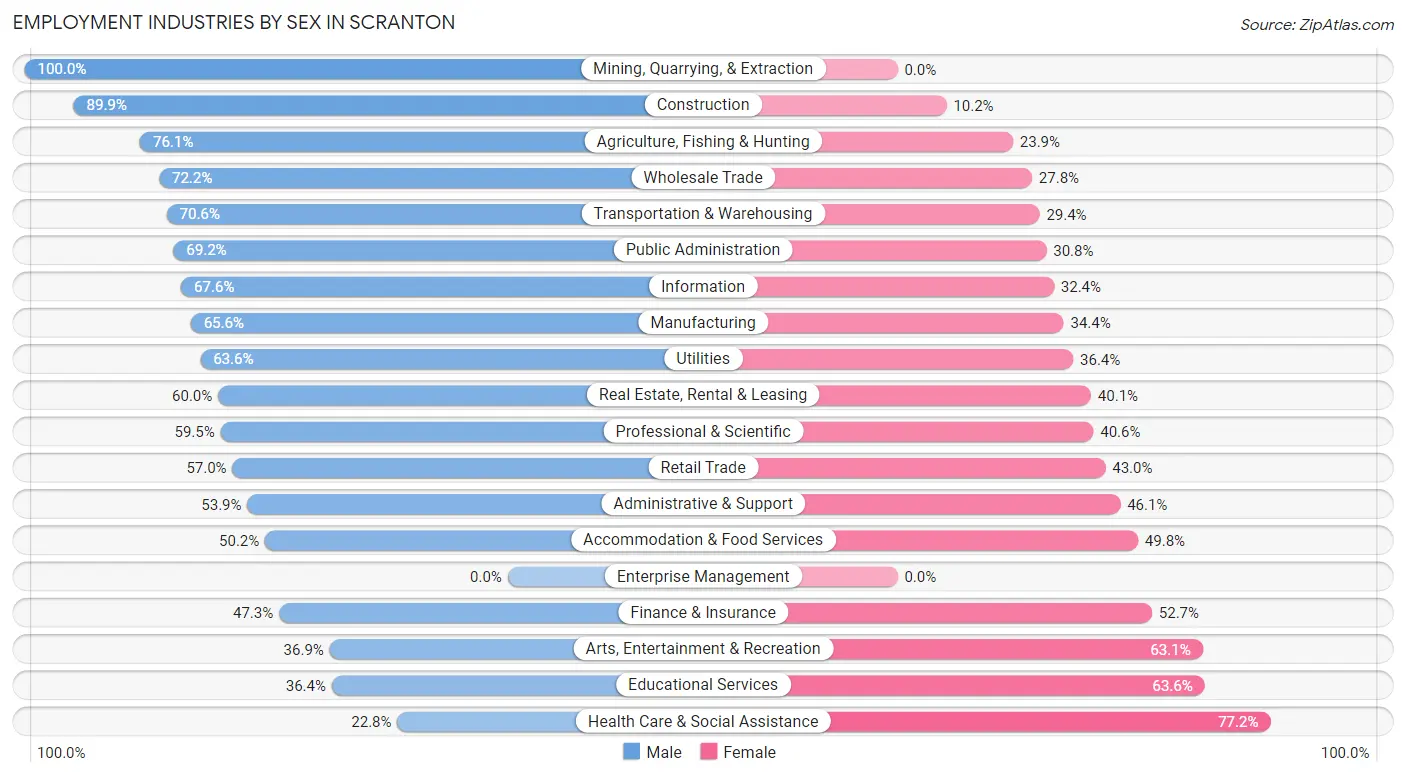
Employment Industries by Sex in Scranton
The Scranton industries that see more men than women are Mining, Quarrying, & Extraction (100.0%), Construction (89.8%), and Agriculture, Fishing & Hunting (76.1%), whereas the industries that tend to have a higher number of women are Health Care & Social Assistance (77.2%), Educational Services (63.6%), and Arts, Entertainment & Recreation (63.1%).
| Industry | Male | Female |
| Agriculture, Fishing & Hunting | 121 (76.1%) | 38 (23.9%) |
| Mining, Quarrying, & Extraction | 214 (100.0%) | 0 (0.0%) |
| Construction | 1,417 (89.8%) | 160 (10.2%) |
| Manufacturing | 1,986 (65.6%) | 1,041 (34.4%) |
| Wholesale Trade | 635 (72.2%) | 245 (27.8%) |
| Retail Trade | 2,707 (57.0%) | 2,044 (43.0%) |
| Transportation & Warehousing | 1,453 (70.6%) | 605 (29.4%) |
| Utilities | 84 (63.6%) | 48 (36.4%) |
| Information | 378 (67.6%) | 181 (32.4%) |
| Finance & Insurance | 789 (47.3%) | 878 (52.7%) |
| Real Estate, Rental & Leasing | 220 (60.0%) | 147 (40.1%) |
| Professional & Scientific | 720 (59.5%) | 491 (40.6%) |
| Enterprise Management | 0 (0.0%) | 0 (0.0%) |
| Administrative & Support | 789 (53.9%) | 675 (46.1%) |
| Educational Services | 1,060 (36.4%) | 1,851 (63.6%) |
| Health Care & Social Assistance | 1,498 (22.8%) | 5,062 (77.2%) |
| Arts, Entertainment & Recreation | 268 (36.9%) | 459 (63.1%) |
| Accommodation & Food Services | 1,591 (50.2%) | 1,577 (49.8%) |
| Public Administration | 968 (69.2%) | 431 (30.8%) |
| Total | 17,689 (51.5%) | 16,622 (48.4%) |
Education in Scranton
School Enrollment in Scranton
The most common levels of schooling among the 19,807 students in Scranton are college / undergraduate (6,542 | 33.0%), high school (4,054 | 20.5%), and middle school (3,510 | 17.7%).
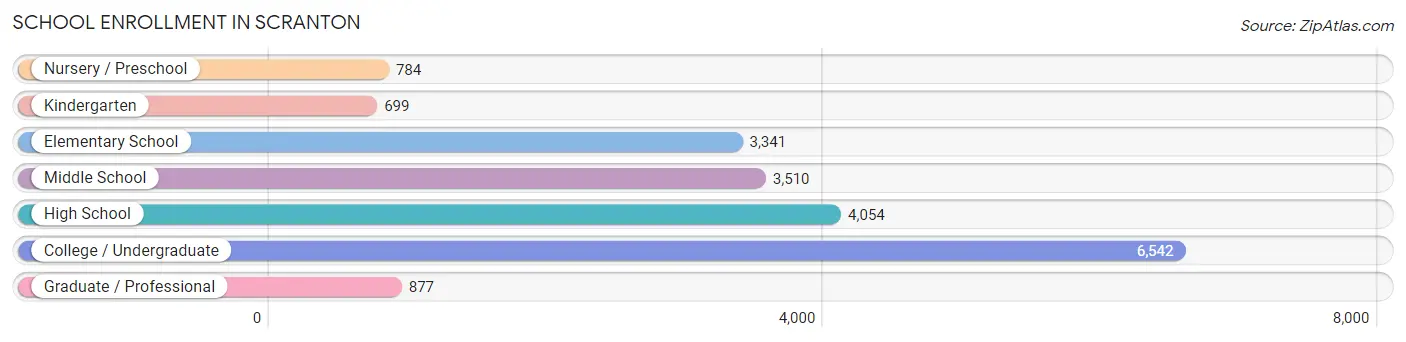
| School Level | # Students | % Students |
| Nursery / Preschool | 784 | 4.0% |
| Kindergarten | 699 | 3.5% |
| Elementary School | 3,341 | 16.9% |
| Middle School | 3,510 | 17.7% |
| High School | 4,054 | 20.5% |
| College / Undergraduate | 6,542 | 33.0% |
| Graduate / Professional | 877 | 4.4% |
| Total | 19,807 | 100.0% |
School Enrollment by Age by Funding Source in Scranton
Out of a total of 19,807 students who are enrolled in schools in Scranton, 7,150 (36.1%) attend a private institution, while the remaining 12,657 (63.9%) are enrolled in public schools. The age group of 20 to 24 year olds has the highest likelihood of being enrolled in private schools, with 2,866 (77.6% in the age bracket) enrolled. Conversely, the age group of 5 to 9 year old has the lowest likelihood of being enrolled in a private school, with 3,567 (91.8% in the age bracket) attending a public institution.
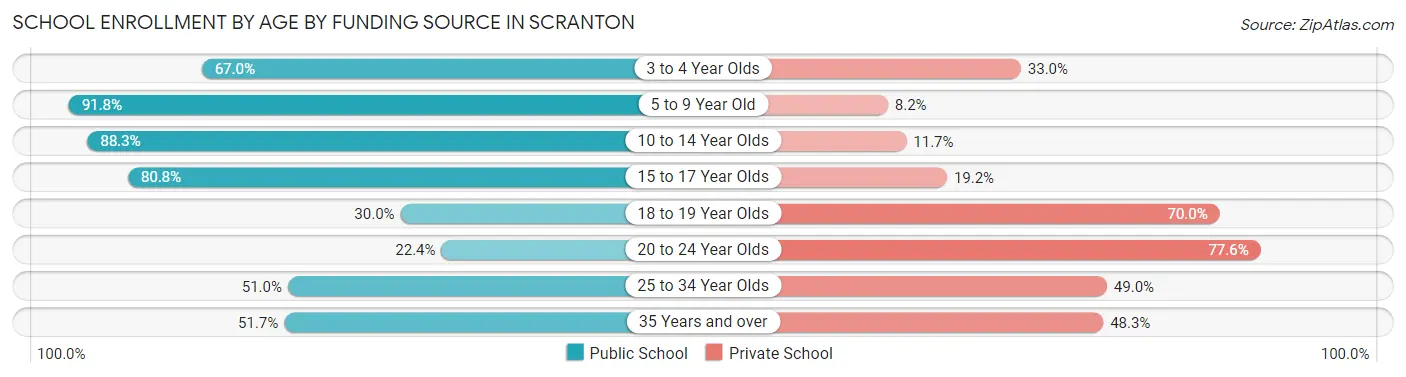
| Age Bracket | Public School | Private School |
| 3 to 4 Year Olds | 398 (67.0%) | 196 (33.0%) |
| 5 to 9 Year Old | 3,567 (91.8%) | 320 (8.2%) |
| 10 to 14 Year Olds | 3,787 (88.3%) | 501 (11.7%) |
| 15 to 17 Year Olds | 2,468 (80.8%) | 588 (19.2%) |
| 18 to 19 Year Olds | 842 (30.0%) | 1,965 (70.0%) |
| 20 to 24 Year Olds | 826 (22.4%) | 2,866 (77.6%) |
| 25 to 34 Year Olds | 448 (51.0%) | 431 (49.0%) |
| 35 Years and over | 312 (51.7%) | 292 (48.3%) |
| Total | 12,657 (63.9%) | 7,150 (36.1%) |
Educational Attainment by Field of Study in Scranton
Business (2,042 | 16.7%), education (1,886 | 15.4%), science & technology (1,527 | 12.5%), arts & humanities (1,223 | 10.0%), and social sciences (842 | 6.9%) are the most common fields of study among 12,219 individuals in Scranton who have obtained a bachelor's degree or higher.
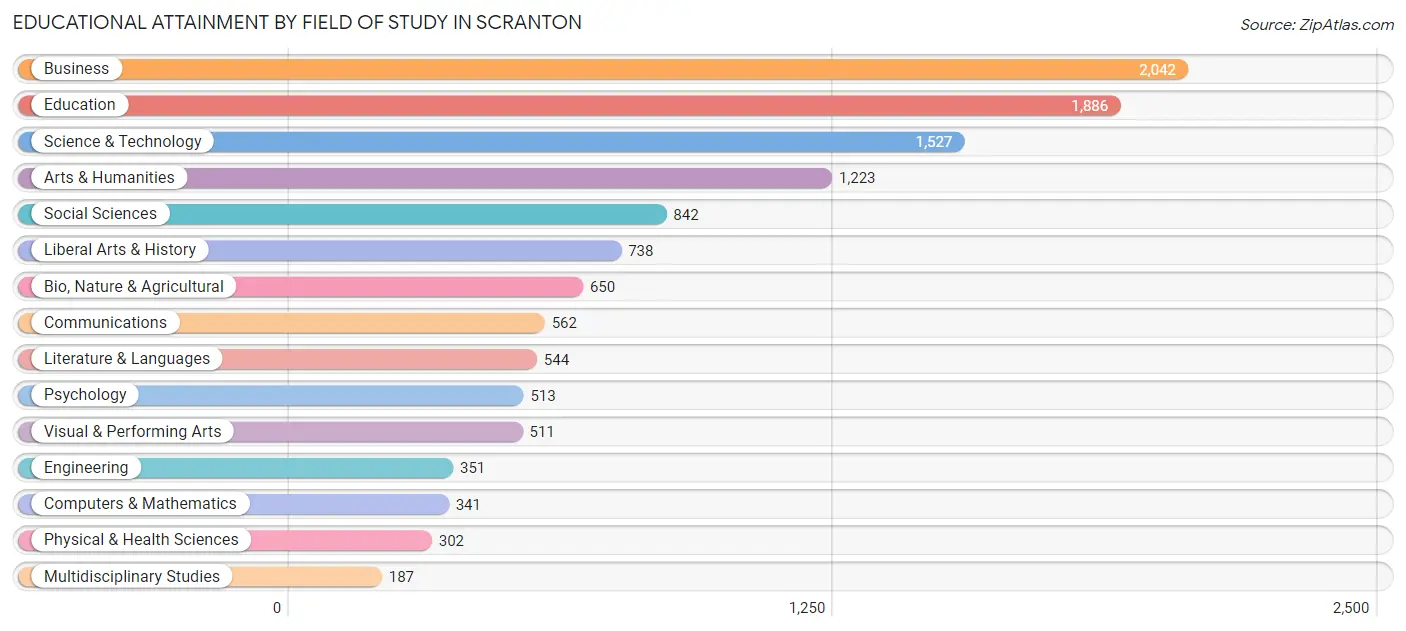
| Field of Study | # Graduates | % Graduates |
| Computers & Mathematics | 341 | 2.8% |
| Bio, Nature & Agricultural | 650 | 5.3% |
| Physical & Health Sciences | 302 | 2.5% |
| Psychology | 513 | 4.2% |
| Social Sciences | 842 | 6.9% |
| Engineering | 351 | 2.9% |
| Multidisciplinary Studies | 187 | 1.5% |
| Science & Technology | 1,527 | 12.5% |
| Business | 2,042 | 16.7% |
| Education | 1,886 | 15.4% |
| Literature & Languages | 544 | 4.4% |
| Liberal Arts & History | 738 | 6.0% |
| Visual & Performing Arts | 511 | 4.2% |
| Communications | 562 | 4.6% |
| Arts & Humanities | 1,223 | 10.0% |
| Total | 12,219 | 100.0% |
Transportation & Commute in Scranton
Vehicle Availability by Sex in Scranton
The most prevalent vehicle ownership categories in Scranton are males with 2 vehicles (6,960, accounting for 40.6%) and females with 2 vehicles (5,757, making up 44.1%).
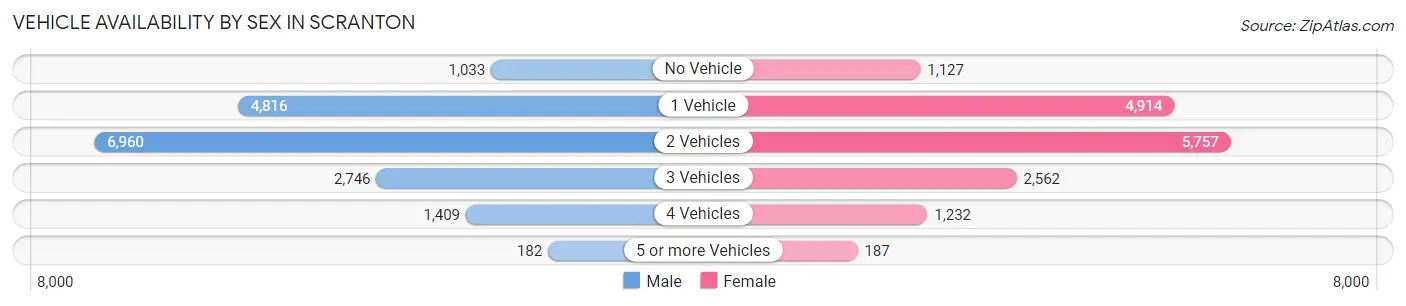
| Vehicles Available | Male | Female |
| No Vehicle | 1,033 (6.0%) | 1,127 (7.1%) |
| 1 Vehicle | 4,816 (28.1%) | 4,914 (31.1%) |
| 2 Vehicles | 6,960 (40.6%) | 5,757 (36.5%) |
| 3 Vehicles | 2,746 (16.0%) | 2,562 (16.2%) |
| 4 Vehicles | 1,409 (8.2%) | 1,232 (7.8%) |
| 5 or more Vehicles | 182 (1.1%) | 187 (1.2%) |
| Total | 17,146 (100.0%) | 15,779 (100.0%) |
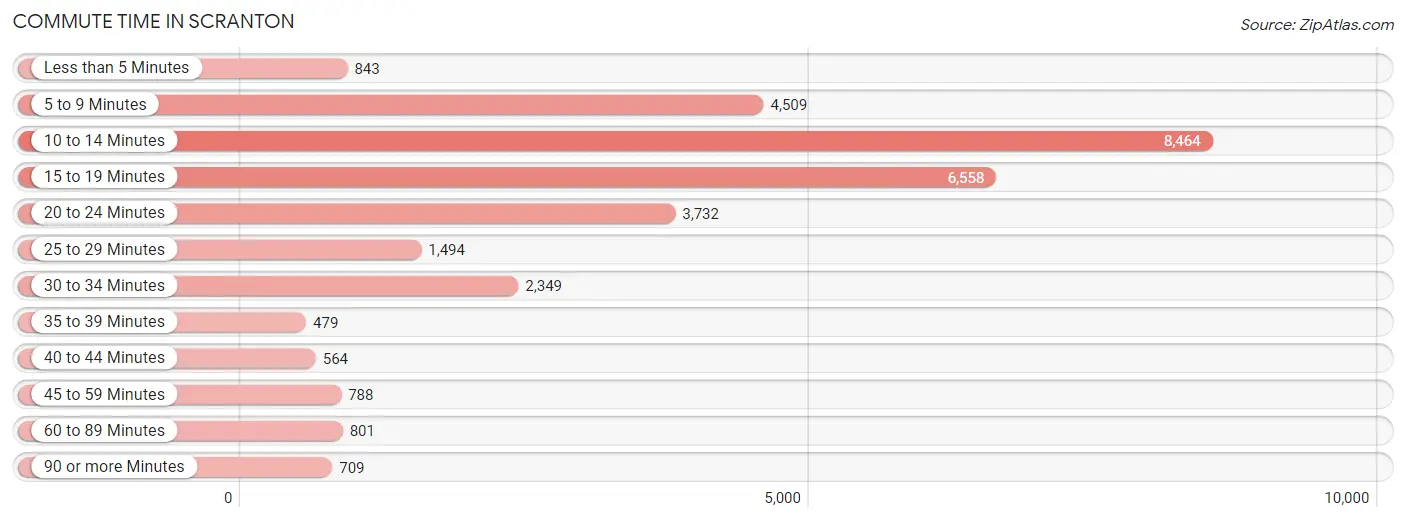
Commute Time in Scranton
The most frequently occuring commute durations in Scranton are 10 to 14 minutes (8,464 commuters, 27.1%), 15 to 19 minutes (6,558 commuters, 21.0%), and 5 to 9 minutes (4,509 commuters, 14.4%).
| Commute Time | # Commuters | % Commuters |
| Less than 5 Minutes | 843 | 2.7% |
| 5 to 9 Minutes | 4,509 | 14.4% |
| 10 to 14 Minutes | 8,464 | 27.1% |
| 15 to 19 Minutes | 6,558 | 21.0% |
| 20 to 24 Minutes | 3,732 | 11.9% |
| 25 to 29 Minutes | 1,494 | 4.8% |
| 30 to 34 Minutes | 2,349 | 7.5% |
| 35 to 39 Minutes | 479 | 1.5% |
| 40 to 44 Minutes | 564 | 1.8% |
| 45 to 59 Minutes | 788 | 2.5% |
| 60 to 89 Minutes | 801 | 2.6% |
| 90 or more Minutes | 709 | 2.3% |
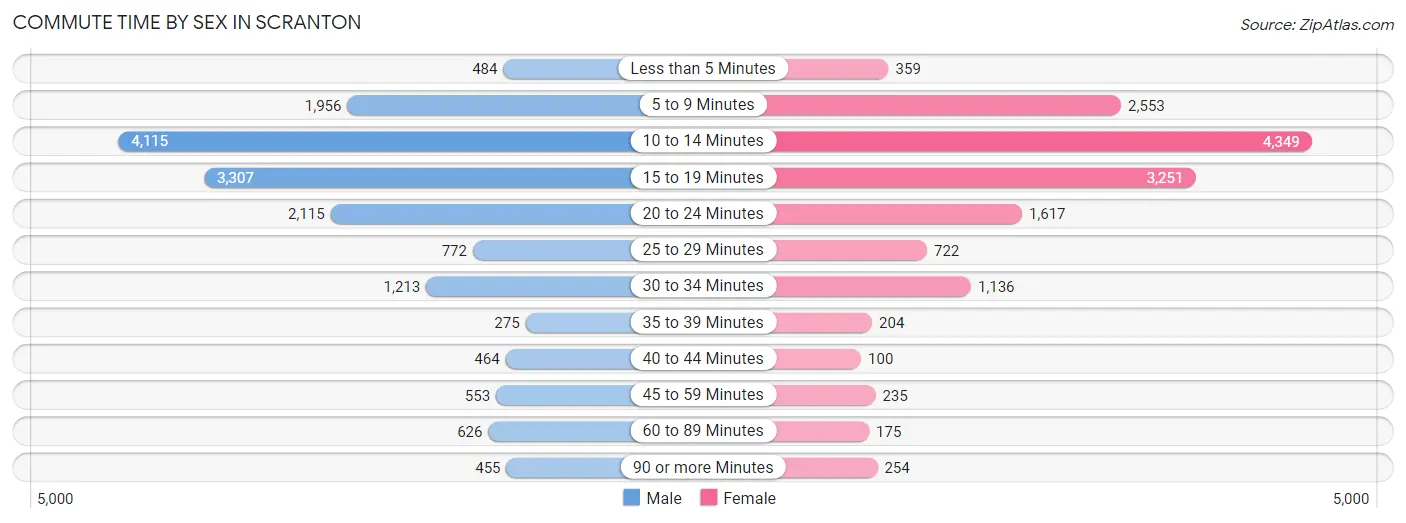
Commute Time by Sex in Scranton
The most common commute times in Scranton are 10 to 14 minutes (4,115 commuters, 25.2%) for males and 10 to 14 minutes (4,349 commuters, 29.1%) for females.
| Commute Time | Male | Female |
| Less than 5 Minutes | 484 (3.0%) | 359 (2.4%) |
| 5 to 9 Minutes | 1,956 (12.0%) | 2,553 (17.1%) |
| 10 to 14 Minutes | 4,115 (25.2%) | 4,349 (29.1%) |
| 15 to 19 Minutes | 3,307 (20.2%) | 3,251 (21.7%) |
| 20 to 24 Minutes | 2,115 (13.0%) | 1,617 (10.8%) |
| 25 to 29 Minutes | 772 (4.7%) | 722 (4.8%) |
| 30 to 34 Minutes | 1,213 (7.4%) | 1,136 (7.6%) |
| 35 to 39 Minutes | 275 (1.7%) | 204 (1.4%) |
| 40 to 44 Minutes | 464 (2.8%) | 100 (0.7%) |
| 45 to 59 Minutes | 553 (3.4%) | 235 (1.6%) |
| 60 to 89 Minutes | 626 (3.8%) | 175 (1.2%) |
| 90 or more Minutes | 455 (2.8%) | 254 (1.7%) |
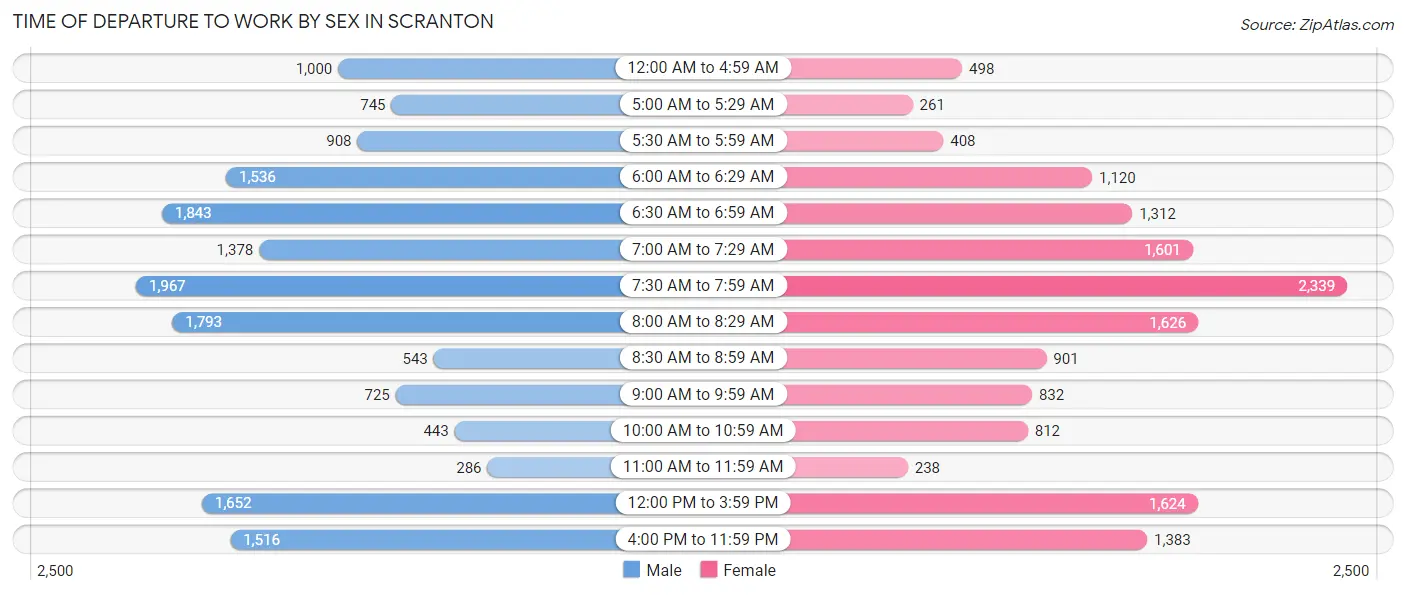
Time of Departure to Work by Sex in Scranton
The most frequent times of departure to work in Scranton are 7:30 AM to 7:59 AM (1,967, 12.0%) for males and 7:30 AM to 7:59 AM (2,339, 15.6%) for females.
| Time of Departure | Male | Female |
| 12:00 AM to 4:59 AM | 1,000 (6.1%) | 498 (3.3%) |
| 5:00 AM to 5:29 AM | 745 (4.6%) | 261 (1.8%) |
| 5:30 AM to 5:59 AM | 908 (5.6%) | 408 (2.7%) |
| 6:00 AM to 6:29 AM | 1,536 (9.4%) | 1,120 (7.5%) |
| 6:30 AM to 6:59 AM | 1,843 (11.3%) | 1,312 (8.8%) |
| 7:00 AM to 7:29 AM | 1,378 (8.4%) | 1,601 (10.7%) |
| 7:30 AM to 7:59 AM | 1,967 (12.0%) | 2,339 (15.6%) |
| 8:00 AM to 8:29 AM | 1,793 (11.0%) | 1,626 (10.9%) |
| 8:30 AM to 8:59 AM | 543 (3.3%) | 901 (6.0%) |
| 9:00 AM to 9:59 AM | 725 (4.4%) | 832 (5.6%) |
| 10:00 AM to 10:59 AM | 443 (2.7%) | 812 (5.4%) |
| 11:00 AM to 11:59 AM | 286 (1.8%) | 238 (1.6%) |
| 12:00 PM to 3:59 PM | 1,652 (10.1%) | 1,624 (10.9%) |
| 4:00 PM to 11:59 PM | 1,516 (9.3%) | 1,383 (9.2%) |
| Total | 16,335 (100.0%) | 14,955 (100.0%) |
Housing Occupancy in Scranton
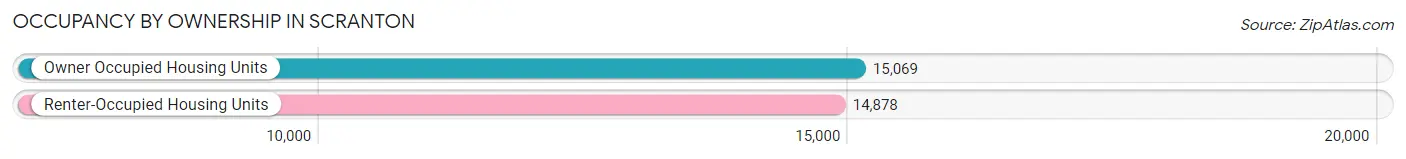
Occupancy by Ownership in Scranton
Of the total 29,947 dwellings in Scranton, owner-occupied units account for 15,069 (50.3%), while renter-occupied units make up 14,878 (49.7%).
| Occupancy | # Housing Units | % Housing Units |
| Owner Occupied Housing Units | 15,069 | 50.3% |
| Renter-Occupied Housing Units | 14,878 | 49.7% |
| Total Occupied Housing Units | 29,947 | 100.0% |
Occupancy by Household Size in Scranton
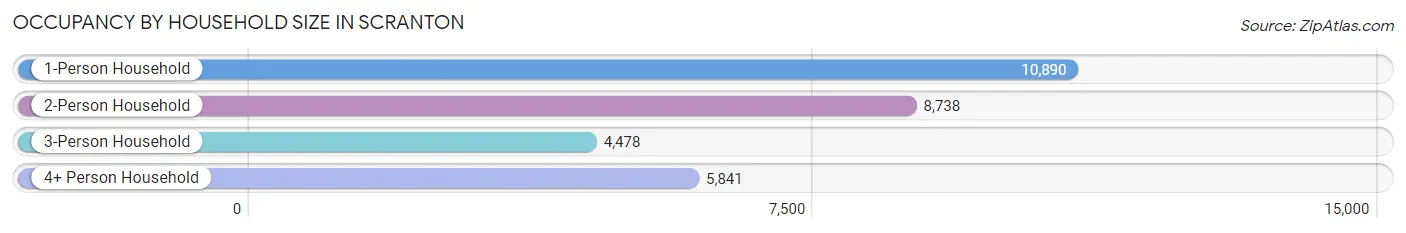
| Household Size | # Housing Units | % Housing Units |
| 1-Person Household | 10,890 | 36.4% |
| 2-Person Household | 8,738 | 29.2% |
| 3-Person Household | 4,478 | 14.9% |
| 4+ Person Household | 5,841 | 19.5% |
| Total Housing Units | 29,947 | 100.0% |
Occupancy by Ownership by Household Size in Scranton
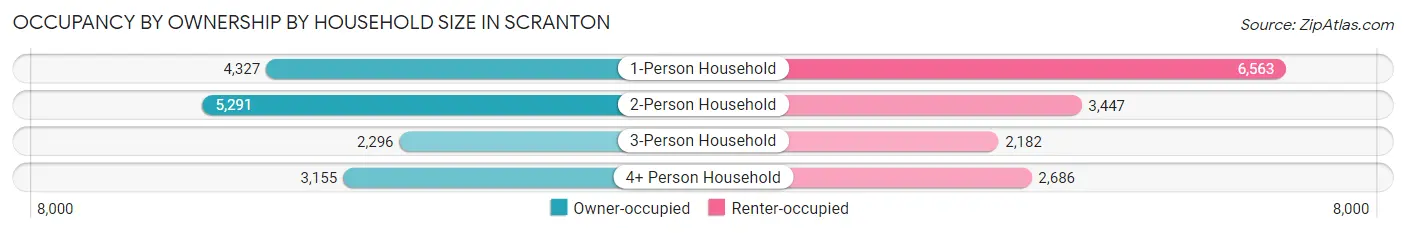
| Household Size | Owner-occupied | Renter-occupied |
| 1-Person Household | 4,327 (39.7%) | 6,563 (60.3%) |
| 2-Person Household | 5,291 (60.6%) | 3,447 (39.5%) |
| 3-Person Household | 2,296 (51.3%) | 2,182 (48.7%) |
| 4+ Person Household | 3,155 (54.0%) | 2,686 (46.0%) |
| Total Housing Units | 15,069 (50.3%) | 14,878 (49.7%) |
Occupancy by Educational Attainment in Scranton
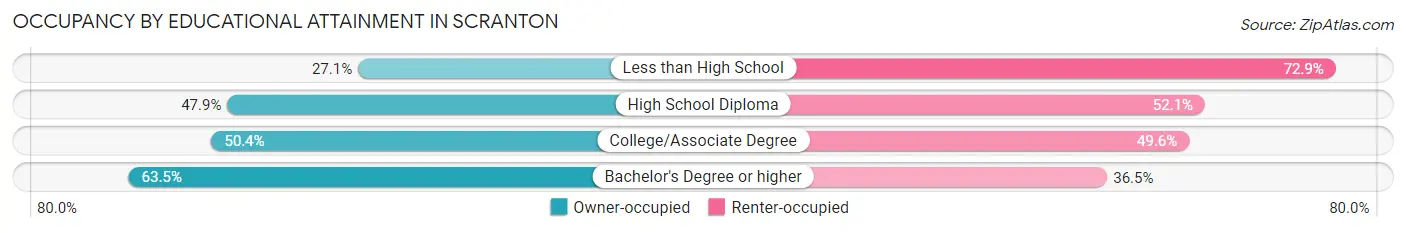
| Household Size | Owner-occupied | Renter-occupied |
| Less than High School | 828 (27.1%) | 2,225 (72.9%) |
| High School Diploma | 5,273 (47.9%) | 5,744 (52.1%) |
| College/Associate Degree | 4,272 (50.4%) | 4,210 (49.6%) |
| Bachelor's Degree or higher | 4,696 (63.5%) | 2,699 (36.5%) |
Occupancy by Age of Householder in Scranton
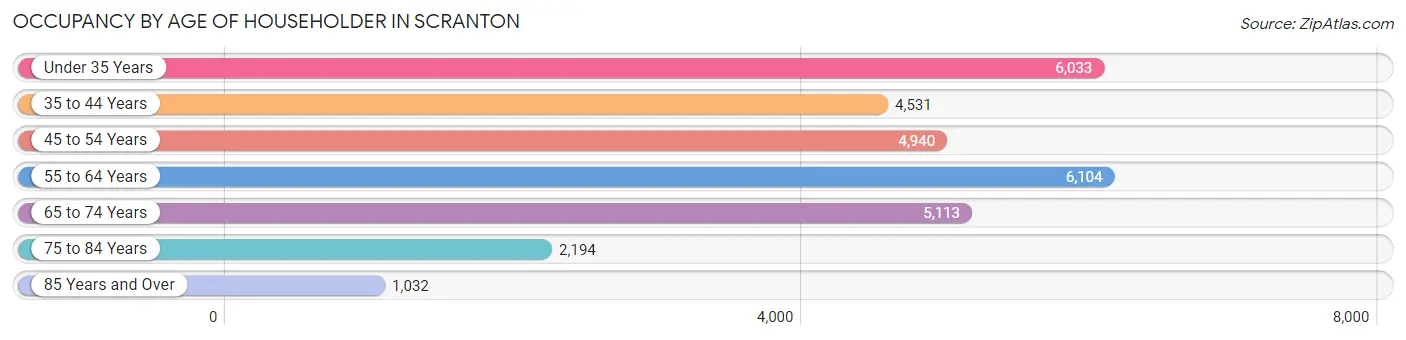
| Age Bracket | # Households | % Households |
| Under 35 Years | 6,033 | 20.2% |
| 35 to 44 Years | 4,531 | 15.1% |
| 45 to 54 Years | 4,940 | 16.5% |
| 55 to 64 Years | 6,104 | 20.4% |
| 65 to 74 Years | 5,113 | 17.1% |
| 75 to 84 Years | 2,194 | 7.3% |
| 85 Years and Over | 1,032 | 3.5% |
| Total | 29,947 | 100.0% |
Housing Finances in Scranton
Median Income by Occupancy in Scranton
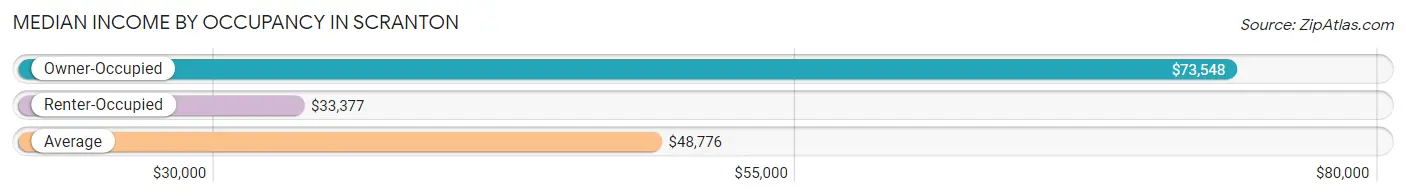
| Occupancy Type | # Households | Median Income |
| Owner-Occupied | 15,069 (50.3%) | $73,548 |
| Renter-Occupied | 14,878 (49.7%) | $33,377 |
| Average | 29,947 (100.0%) | $48,776 |
Occupancy by Householder Income Bracket in Scranton
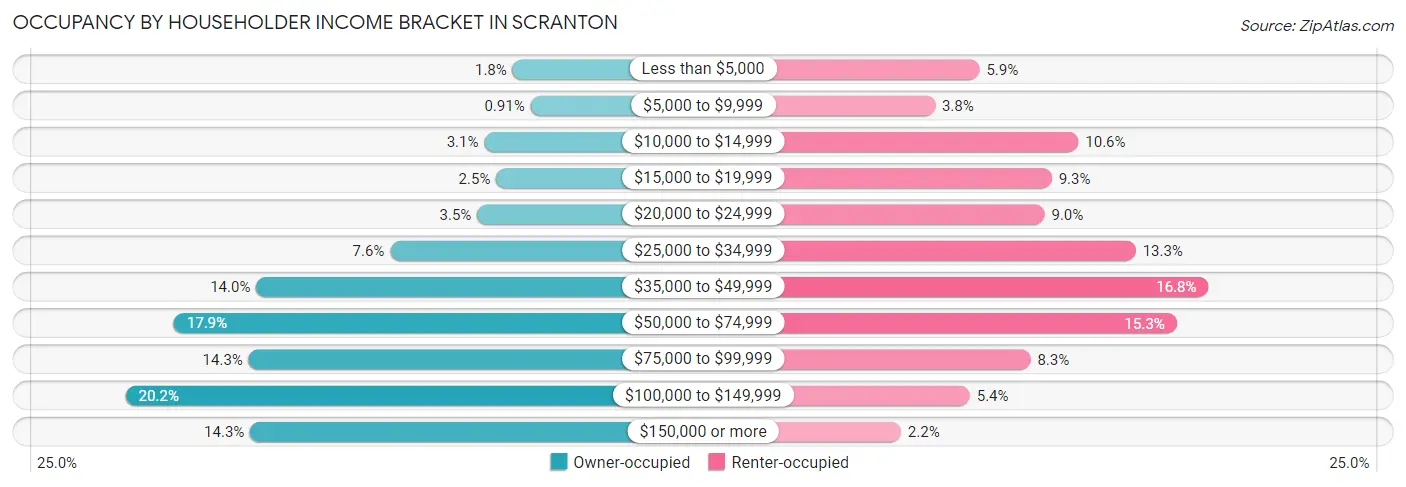
| Income Bracket | Owner-occupied | Renter-occupied |
| Less than $5,000 | 265 (1.8%) | 878 (5.9%) |
| $5,000 to $9,999 | 137 (0.9%) | 563 (3.8%) |
| $10,000 to $14,999 | 468 (3.1%) | 1,579 (10.6%) |
| $15,000 to $19,999 | 383 (2.5%) | 1,390 (9.3%) |
| $20,000 to $24,999 | 520 (3.5%) | 1,339 (9.0%) |
| $25,000 to $34,999 | 1,144 (7.6%) | 1,984 (13.3%) |
| $35,000 to $49,999 | 2,105 (14.0%) | 2,499 (16.8%) |
| $50,000 to $74,999 | 2,696 (17.9%) | 2,275 (15.3%) |
| $75,000 to $99,999 | 2,160 (14.3%) | 1,240 (8.3%) |
| $100,000 to $149,999 | 3,042 (20.2%) | 809 (5.4%) |
| $150,000 or more | 2,149 (14.3%) | 322 (2.2%) |
| Total | 15,069 (100.0%) | 14,878 (100.0%) |
Monthly Housing Cost Tiers in Scranton
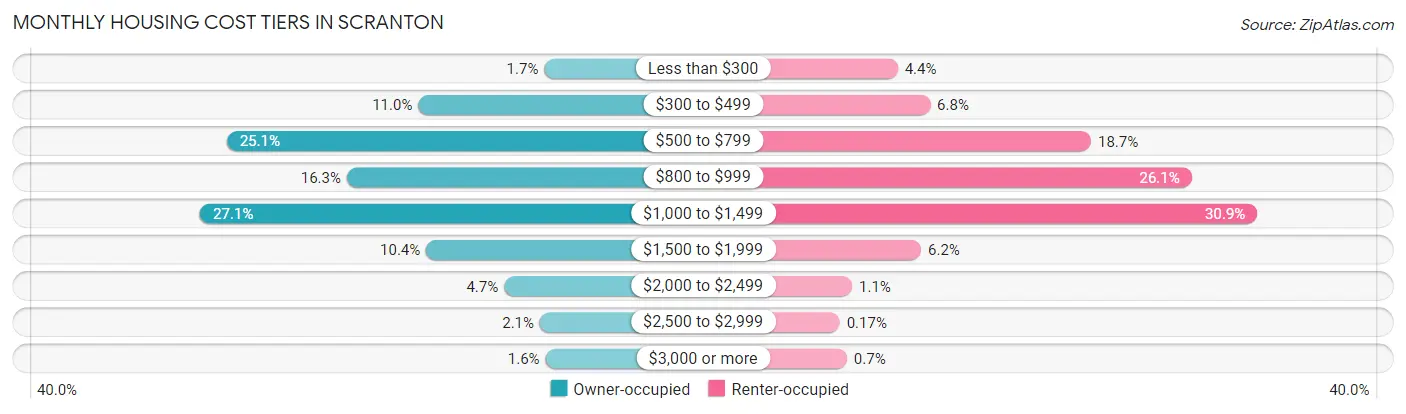
| Monthly Cost | Owner-occupied | Renter-occupied |
| Less than $300 | 260 (1.7%) | 660 (4.4%) |
| $300 to $499 | 1,659 (11.0%) | 1,016 (6.8%) |
| $500 to $799 | 3,784 (25.1%) | 2,779 (18.7%) |
| $800 to $999 | 2,451 (16.3%) | 3,880 (26.1%) |
| $1,000 to $1,499 | 4,081 (27.1%) | 4,599 (30.9%) |
| $1,500 to $1,999 | 1,572 (10.4%) | 916 (6.2%) |
| $2,000 to $2,499 | 706 (4.7%) | 161 (1.1%) |
| $2,500 to $2,999 | 309 (2.1%) | 25 (0.2%) |
| $3,000 or more | 247 (1.6%) | 104 (0.7%) |
| Total | 15,069 (100.0%) | 14,878 (100.0%) |
Physical Housing Characteristics in Scranton
Housing Structures in Scranton
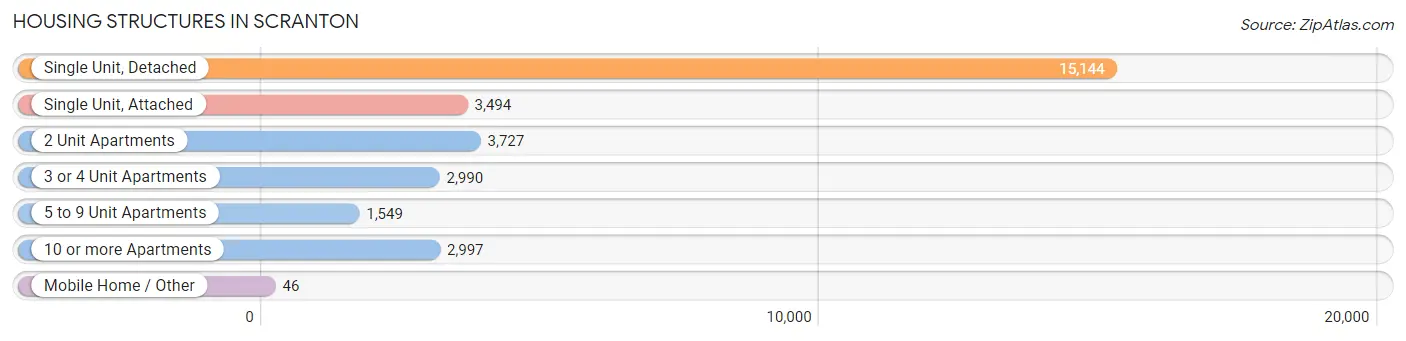
| Structure Type | # Housing Units | % Housing Units |
| Single Unit, Detached | 15,144 | 50.6% |
| Single Unit, Attached | 3,494 | 11.7% |
| 2 Unit Apartments | 3,727 | 12.4% |
| 3 or 4 Unit Apartments | 2,990 | 10.0% |
| 5 to 9 Unit Apartments | 1,549 | 5.2% |
| 10 or more Apartments | 2,997 | 10.0% |
| Mobile Home / Other | 46 | 0.2% |
| Total | 29,947 | 100.0% |
Housing Structures by Occupancy in Scranton
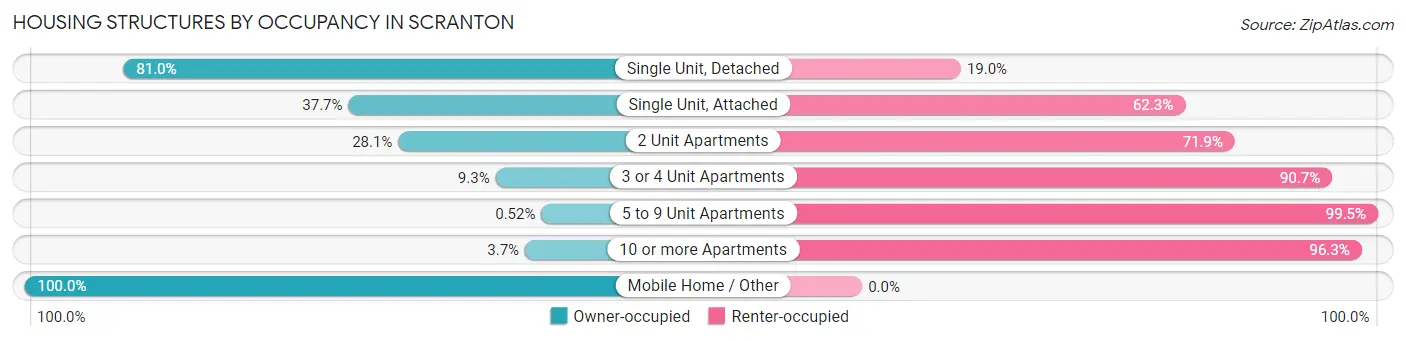
| Structure Type | Owner-occupied | Renter-occupied |
| Single Unit, Detached | 12,264 (81.0%) | 2,880 (19.0%) |
| Single Unit, Attached | 1,316 (37.7%) | 2,178 (62.3%) |
| 2 Unit Apartments | 1,046 (28.1%) | 2,681 (71.9%) |
| 3 or 4 Unit Apartments | 279 (9.3%) | 2,711 (90.7%) |
| 5 to 9 Unit Apartments | 8 (0.5%) | 1,541 (99.5%) |
| 10 or more Apartments | 110 (3.7%) | 2,887 (96.3%) |
| Mobile Home / Other | 46 (100.0%) | 0 (0.0%) |
| Total | 15,069 (50.3%) | 14,878 (49.7%) |
Housing Structures by Number of Rooms in Scranton
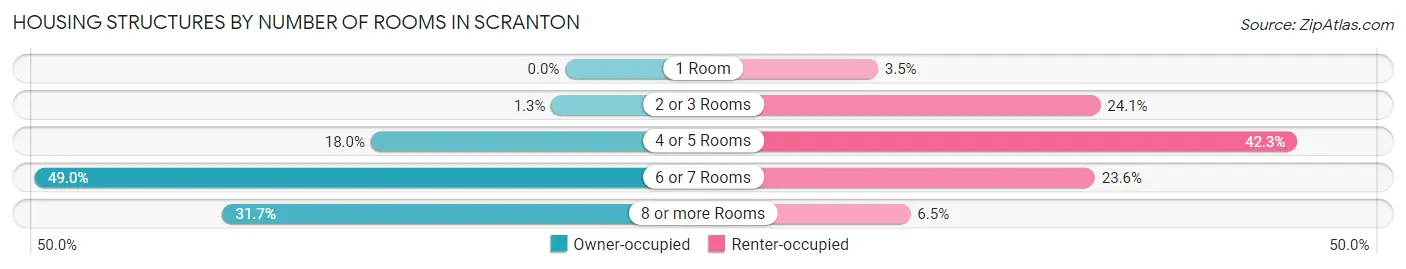
| Number of Rooms | Owner-occupied | Renter-occupied |
| 1 Room | 0 (0.0%) | 522 (3.5%) |
| 2 or 3 Rooms | 194 (1.3%) | 3,584 (24.1%) |
| 4 or 5 Rooms | 2,710 (18.0%) | 6,294 (42.3%) |
| 6 or 7 Rooms | 7,389 (49.0%) | 3,508 (23.6%) |
| 8 or more Rooms | 4,776 (31.7%) | 970 (6.5%) |
| Total | 15,069 (100.0%) | 14,878 (100.0%) |
Housing Structure by Heating Type in Scranton
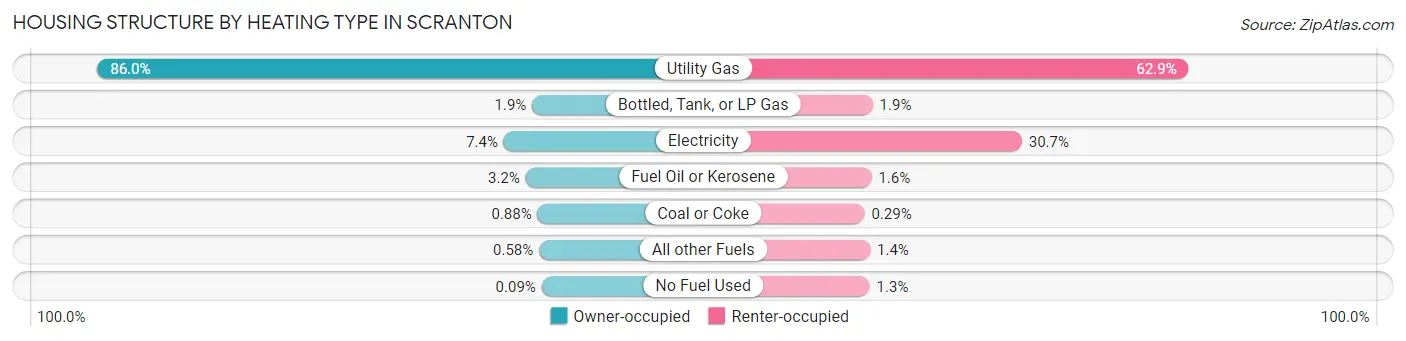
| Heating Type | Owner-occupied | Renter-occupied |
| Utility Gas | 12,952 (86.0%) | 9,357 (62.9%) |
| Bottled, Tank, or LP Gas | 289 (1.9%) | 277 (1.9%) |
| Electricity | 1,115 (7.4%) | 4,564 (30.7%) |
| Fuel Oil or Kerosene | 478 (3.2%) | 243 (1.6%) |
| Coal or Coke | 133 (0.9%) | 43 (0.3%) |
| All other Fuels | 88 (0.6%) | 203 (1.4%) |
| No Fuel Used | 14 (0.1%) | 191 (1.3%) |
| Total | 15,069 (100.0%) | 14,878 (100.0%) |
Household Vehicle Usage in Scranton
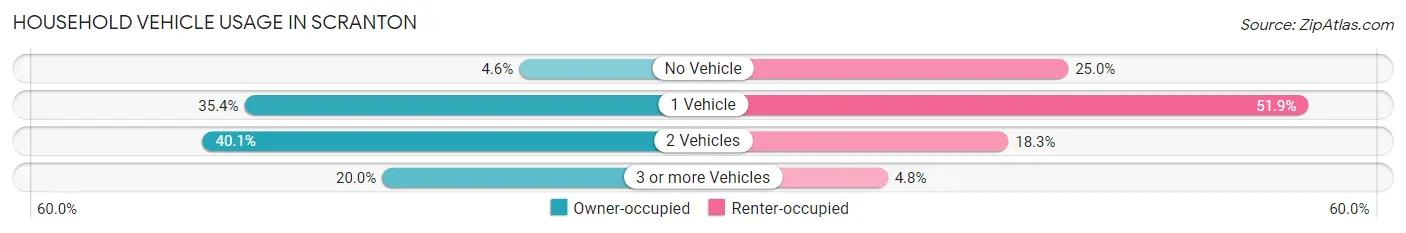
| Vehicles per Household | Owner-occupied | Renter-occupied |
| No Vehicle | 695 (4.6%) | 3,721 (25.0%) |
| 1 Vehicle | 5,331 (35.4%) | 7,722 (51.9%) |
| 2 Vehicles | 6,035 (40.1%) | 2,723 (18.3%) |
| 3 or more Vehicles | 3,008 (20.0%) | 712 (4.8%) |
| Total | 15,069 (100.0%) | 14,878 (100.0%) |
Real Estate & Mortgages in Scranton
Real Estate and Mortgage Overview in Scranton
| Characteristic | Without Mortgage | With Mortgage |
| Housing Units | 7,276 | 7,793 |
| Median Property Value | $117,800 | $136,000 |
| Median Household Income | $59,085 | $1,586 |
| Monthly Housing Costs | $643 | $228 |
| Real Estate Taxes | $2,787 | $133 |
Property Value by Mortgage Status in Scranton
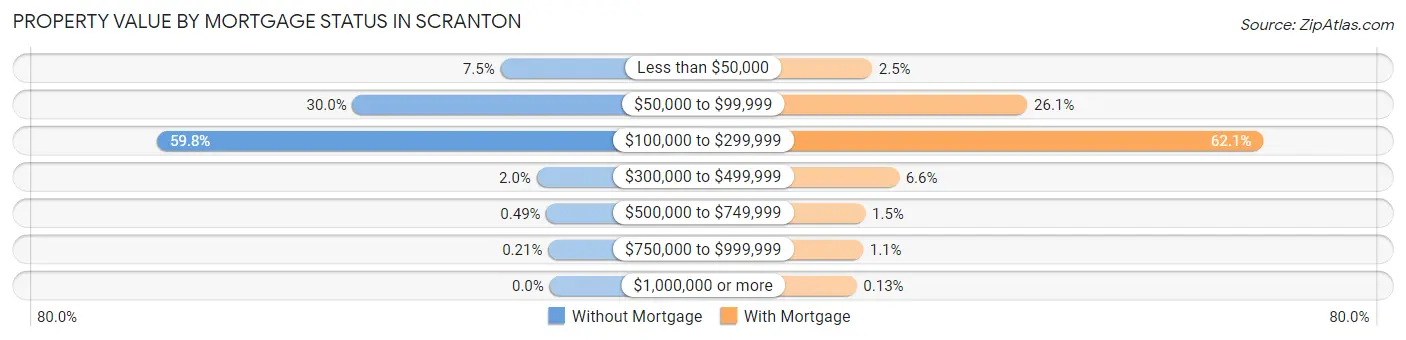
| Property Value | Without Mortgage | With Mortgage |
| Less than $50,000 | 544 (7.5%) | 194 (2.5%) |
| $50,000 to $99,999 | 2,185 (30.0%) | 2,037 (26.1%) |
| $100,000 to $299,999 | 4,353 (59.8%) | 4,840 (62.1%) |
| $300,000 to $499,999 | 143 (2.0%) | 513 (6.6%) |
| $500,000 to $749,999 | 36 (0.5%) | 113 (1.5%) |
| $750,000 to $999,999 | 15 (0.2%) | 86 (1.1%) |
| $1,000,000 or more | 0 (0.0%) | 10 (0.1%) |
| Total | 7,276 (100.0%) | 7,793 (100.0%) |
Household Income by Mortgage Status in Scranton
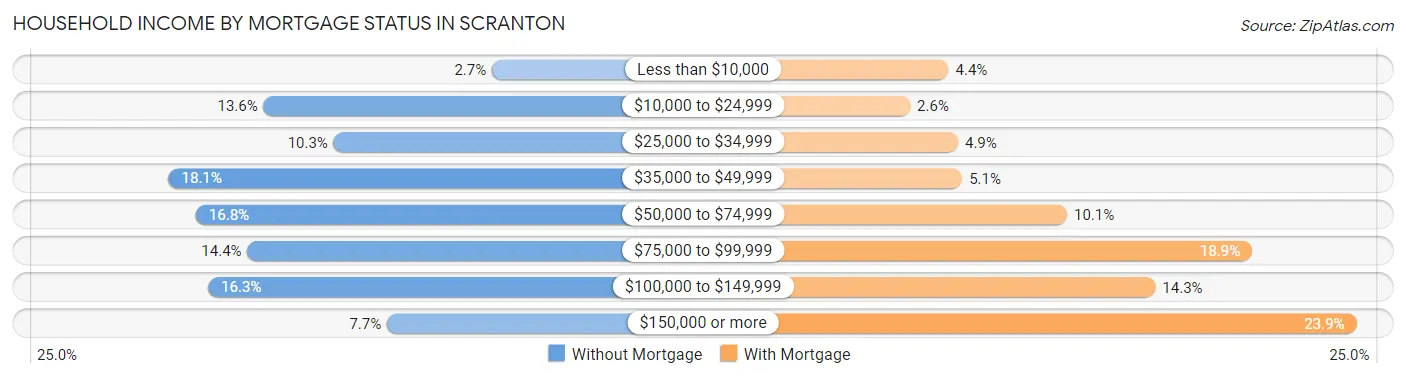
| Household Income | Without Mortgage | With Mortgage |
| Less than $10,000 | 199 (2.7%) | 345 (4.4%) |
| $10,000 to $24,999 | 991 (13.6%) | 203 (2.6%) |
| $25,000 to $34,999 | 748 (10.3%) | 380 (4.9%) |
| $35,000 to $49,999 | 1,320 (18.1%) | 396 (5.1%) |
| $50,000 to $74,999 | 1,225 (16.8%) | 785 (10.1%) |
| $75,000 to $99,999 | 1,047 (14.4%) | 1,471 (18.9%) |
| $100,000 to $149,999 | 1,183 (16.3%) | 1,113 (14.3%) |
| $150,000 or more | 563 (7.7%) | 1,859 (23.8%) |
| Total | 7,276 (100.0%) | 7,793 (100.0%) |
Property Value to Household Income Ratio in Scranton
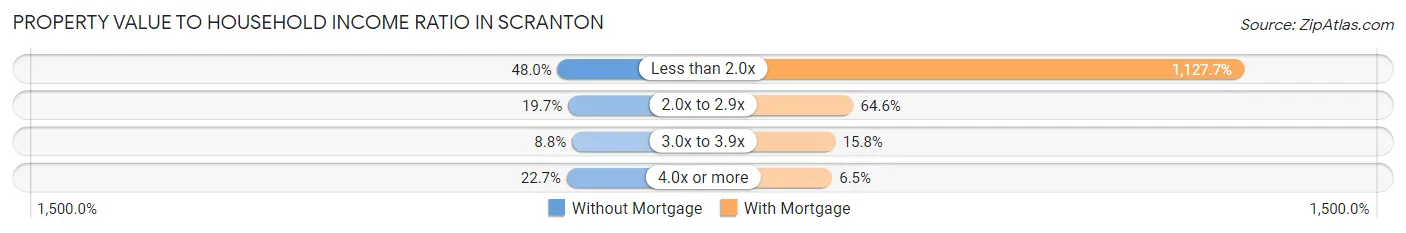
| Value-to-Income Ratio | Without Mortgage | With Mortgage |
| Less than 2.0x | 3,495 (48.0%) | 87,884 (1,127.7%) |
| 2.0x to 2.9x | 1,434 (19.7%) | 5,035 (64.6%) |
| 3.0x to 3.9x | 639 (8.8%) | 1,231 (15.8%) |
| 4.0x or more | 1,653 (22.7%) | 503 (6.5%) |
| Total | 7,276 (100.0%) | 7,793 (100.0%) |
Real Estate Taxes by Mortgage Status in Scranton
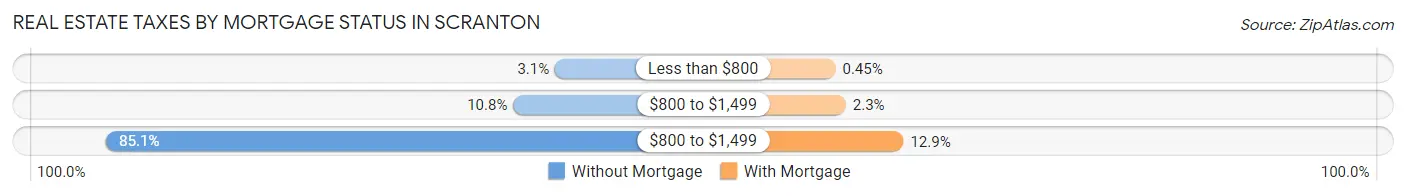
| Property Taxes | Without Mortgage | With Mortgage |
| Less than $800 | 226 (3.1%) | 35 (0.4%) |
| $800 to $1,499 | 782 (10.7%) | 182 (2.3%) |
| $800 to $1,499 | 6,192 (85.1%) | 1,003 (12.9%) |
| Total | 7,276 (100.0%) | 7,793 (100.0%) |
Health & Disability in Scranton
Health Insurance Coverage by Age in Scranton
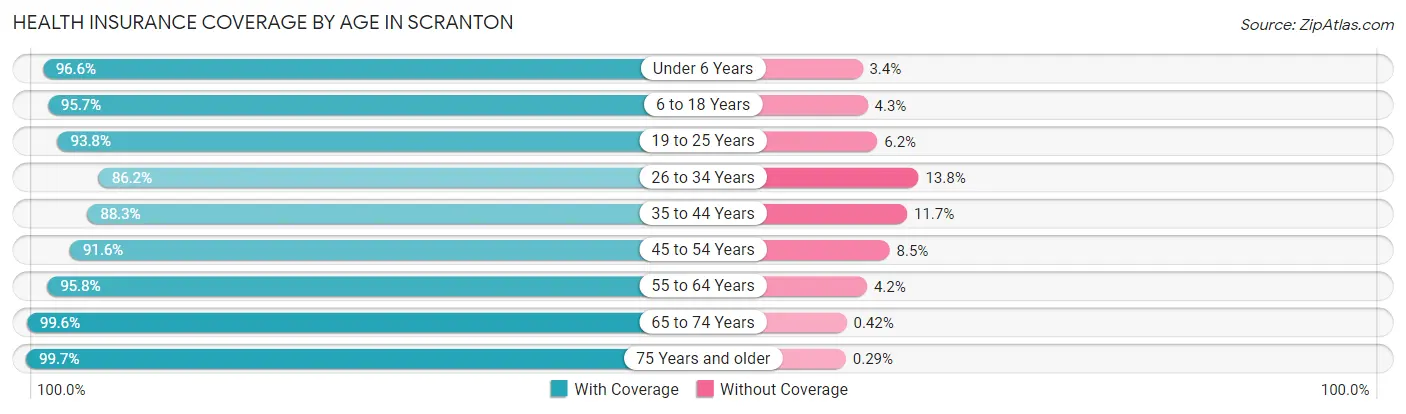
| Age Bracket | With Coverage | Without Coverage |
| Under 6 Years | 4,494 (96.6%) | 157 (3.4%) |
| 6 to 18 Years | 11,938 (95.7%) | 542 (4.3%) |
| 19 to 25 Years | 9,177 (93.8%) | 602 (6.2%) |
| 26 to 34 Years | 7,236 (86.2%) | 1,162 (13.8%) |
| 35 to 44 Years | 7,446 (88.3%) | 987 (11.7%) |
| 45 to 54 Years | 7,971 (91.5%) | 736 (8.5%) |
| 55 to 64 Years | 8,740 (95.8%) | 386 (4.2%) |
| 65 to 74 Years | 7,749 (99.6%) | 33 (0.4%) |
| 75 Years and older | 4,523 (99.7%) | 13 (0.3%) |
| Total | 69,274 (93.8%) | 4,618 (6.2%) |
Health Insurance Coverage by Citizenship Status in Scranton
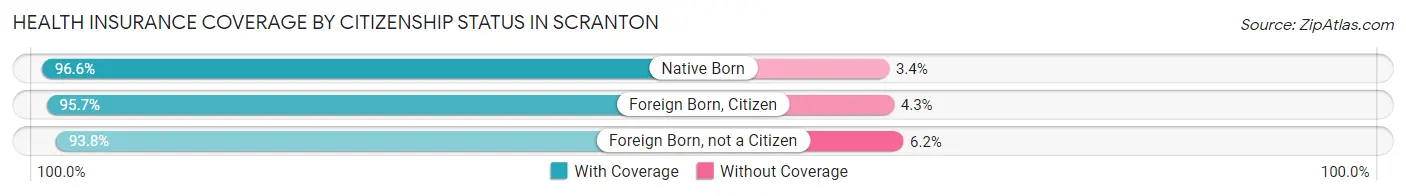
| Citizenship Status | With Coverage | Without Coverage |
| Native Born | 4,494 (96.6%) | 157 (3.4%) |
| Foreign Born, Citizen | 11,938 (95.7%) | 542 (4.3%) |
| Foreign Born, not a Citizen | 9,177 (93.8%) | 602 (6.2%) |
Health Insurance Coverage by Household Income in Scranton
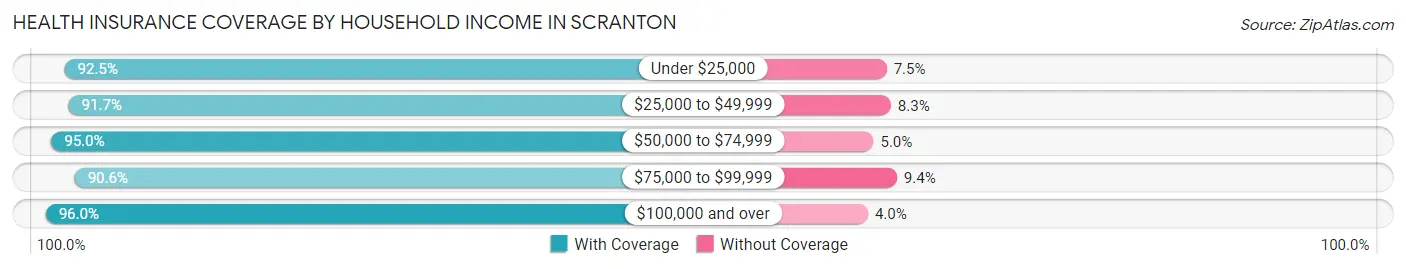
| Household Income | With Coverage | Without Coverage |
| Under $25,000 | 11,695 (92.5%) | 945 (7.5%) |
| $25,000 to $49,999 | 14,607 (91.7%) | 1,315 (8.3%) |
| $50,000 to $74,999 | 11,899 (95.0%) | 628 (5.0%) |
| $75,000 to $99,999 | 8,531 (90.6%) | 884 (9.4%) |
| $100,000 and over | 19,272 (96.0%) | 794 (4.0%) |
Public vs Private Health Insurance Coverage by Age in Scranton
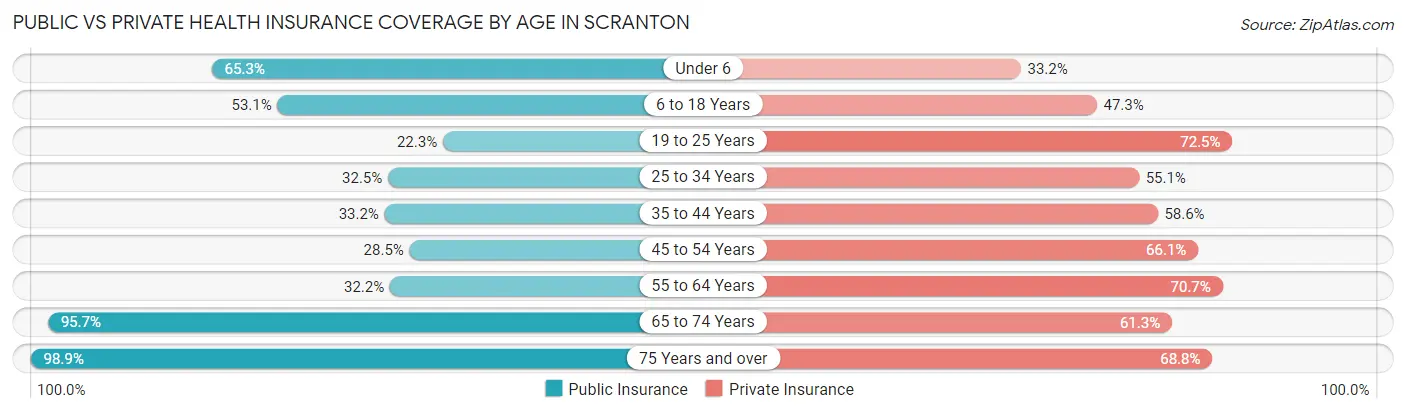
| Age Bracket | Public Insurance | Private Insurance |
| Under 6 | 3,037 (65.3%) | 1,543 (33.2%) |
| 6 to 18 Years | 6,621 (53.0%) | 5,901 (47.3%) |
| 19 to 25 Years | 2,185 (22.3%) | 7,089 (72.5%) |
| 25 to 34 Years | 2,732 (32.5%) | 4,628 (55.1%) |
| 35 to 44 Years | 2,796 (33.2%) | 4,941 (58.6%) |
| 45 to 54 Years | 2,484 (28.5%) | 5,759 (66.1%) |
| 55 to 64 Years | 2,936 (32.2%) | 6,450 (70.7%) |
| 65 to 74 Years | 7,448 (95.7%) | 4,769 (61.3%) |
| 75 Years and over | 4,486 (98.9%) | 3,119 (68.8%) |
| Total | 34,725 (47.0%) | 44,199 (59.8%) |
Disability Status by Sex by Age in Scranton
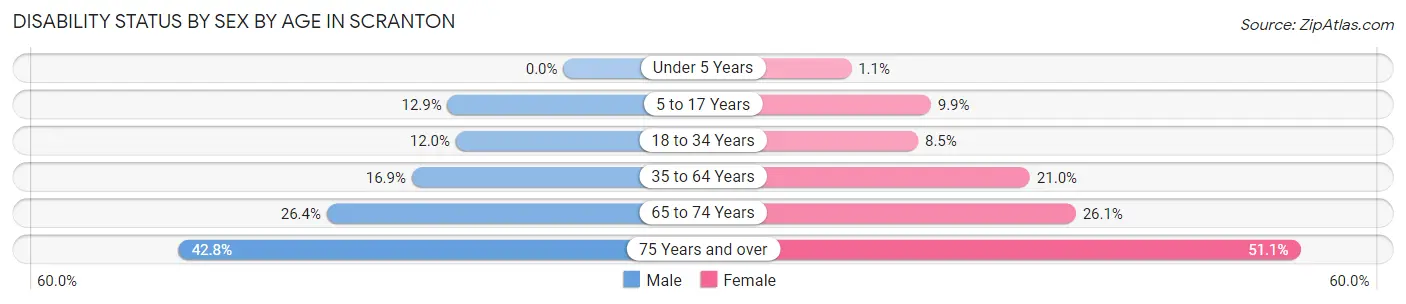
| Age Bracket | Male | Female |
| Under 5 Years | 0 (0.0%) | 21 (1.1%) |
| 5 to 17 Years | 818 (12.9%) | 534 (9.9%) |
| 18 to 34 Years | 1,157 (12.0%) | 844 (8.5%) |
| 35 to 64 Years | 2,181 (16.9%) | 2,795 (20.9%) |
| 65 to 74 Years | 1,013 (26.4%) | 1,026 (26.1%) |
| 75 Years and over | 786 (42.8%) | 1,379 (51.1%) |
Disability Class by Sex by Age in Scranton
Disability Class: Hearing Difficulty
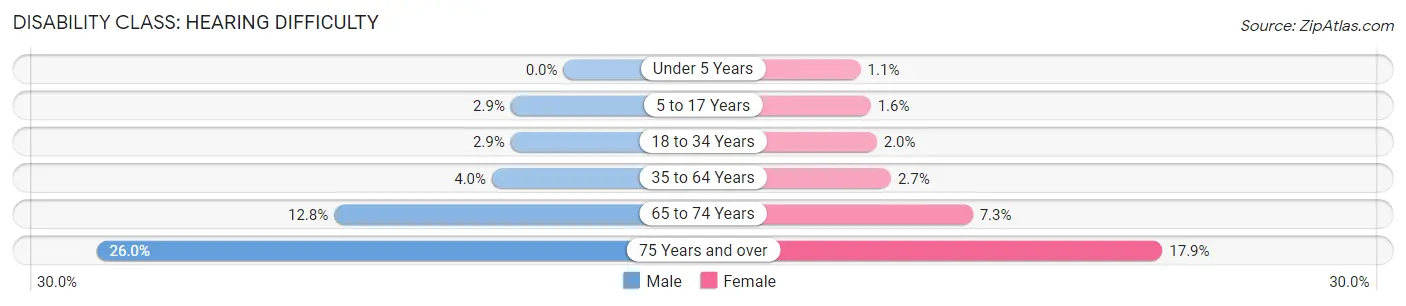
| Age Bracket | Male | Female |
| Under 5 Years | 0 (0.0%) | 21 (1.1%) |
| 5 to 17 Years | 186 (2.9%) | 87 (1.6%) |
| 18 to 34 Years | 284 (2.9%) | 194 (1.9%) |
| 35 to 64 Years | 514 (4.0%) | 365 (2.7%) |
| 65 to 74 Years | 491 (12.8%) | 287 (7.3%) |
| 75 Years and over | 477 (26.0%) | 482 (17.8%) |
Disability Class: Vision Difficulty
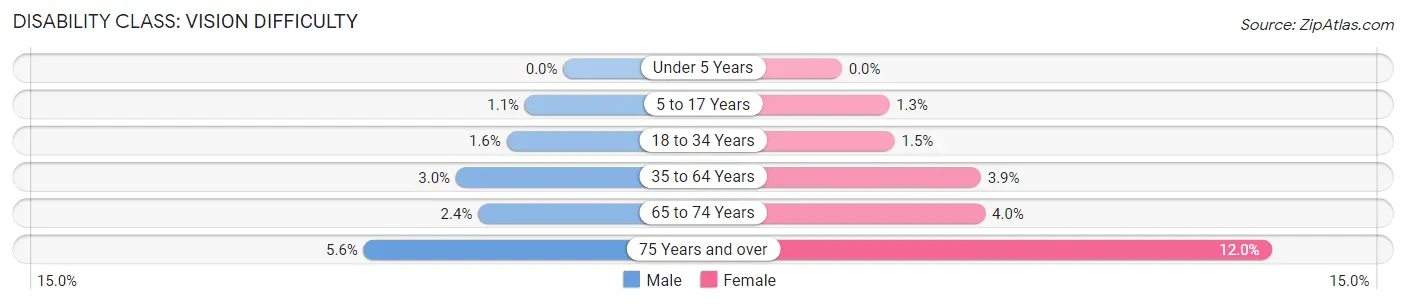
| Age Bracket | Male | Female |
| Under 5 Years | 0 (0.0%) | 0 (0.0%) |
| 5 to 17 Years | 68 (1.1%) | 71 (1.3%) |
| 18 to 34 Years | 153 (1.6%) | 146 (1.5%) |
| 35 to 64 Years | 387 (3.0%) | 516 (3.9%) |
| 65 to 74 Years | 91 (2.4%) | 157 (4.0%) |
| 75 Years and over | 102 (5.6%) | 323 (12.0%) |
Disability Class: Cognitive Difficulty
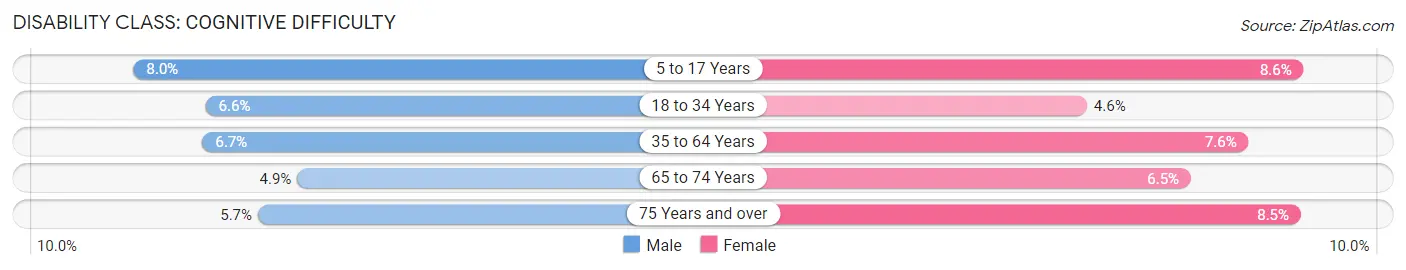
| Age Bracket | Male | Female |
| 5 to 17 Years | 506 (8.0%) | 462 (8.6%) |
| 18 to 34 Years | 642 (6.6%) | 452 (4.5%) |
| 35 to 64 Years | 866 (6.7%) | 1,008 (7.5%) |
| 65 to 74 Years | 190 (4.9%) | 255 (6.5%) |
| 75 Years and over | 104 (5.7%) | 230 (8.5%) |
Disability Class: Ambulatory Difficulty
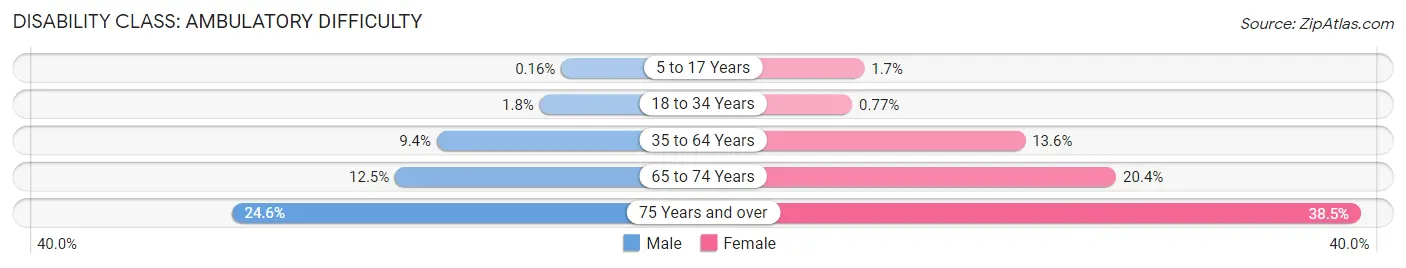
| Age Bracket | Male | Female |
| 5 to 17 Years | 10 (0.2%) | 90 (1.7%) |
| 18 to 34 Years | 170 (1.8%) | 77 (0.8%) |
| 35 to 64 Years | 1,213 (9.4%) | 1,817 (13.6%) |
| 65 to 74 Years | 480 (12.5%) | 802 (20.4%) |
| 75 Years and over | 452 (24.6%) | 1,041 (38.5%) |
Disability Class: Self-Care Difficulty
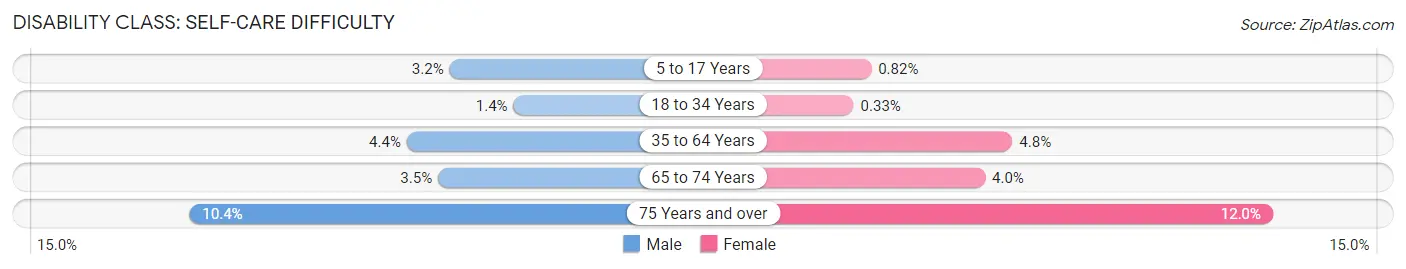
| Age Bracket | Male | Female |
| 5 to 17 Years | 201 (3.2%) | 44 (0.8%) |
| 18 to 34 Years | 134 (1.4%) | 33 (0.3%) |
| 35 to 64 Years | 563 (4.4%) | 634 (4.8%) |
| 65 to 74 Years | 134 (3.5%) | 157 (4.0%) |
| 75 Years and over | 191 (10.4%) | 324 (12.0%) |
Technology Access in Scranton
Computing Device Access in Scranton
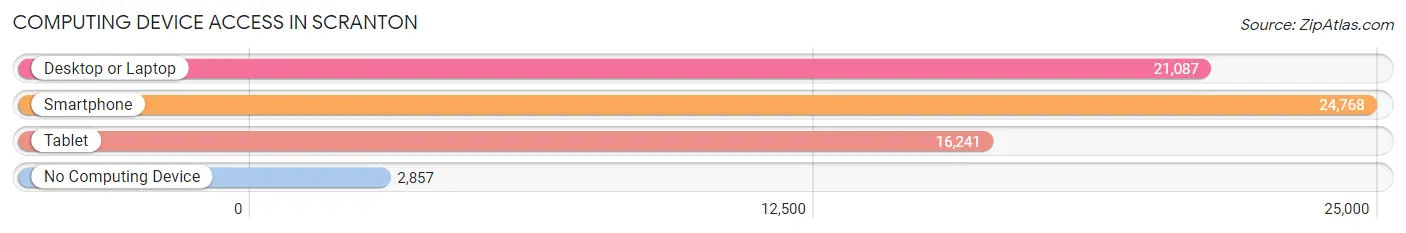
| Device Type | # Households | % Households |
| Desktop or Laptop | 21,087 | 70.4% |
| Smartphone | 24,768 | 82.7% |
| Tablet | 16,241 | 54.2% |
| No Computing Device | 2,857 | 9.5% |
| Total | 29,947 | 100.0% |
Internet Access in Scranton
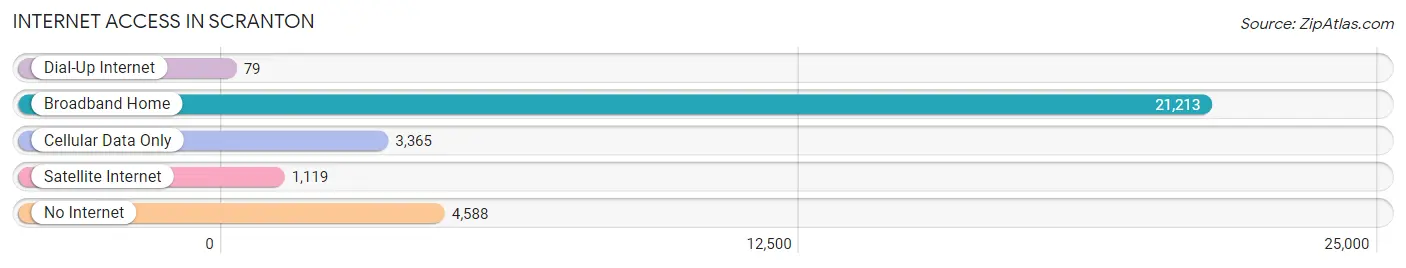
| Internet Type | # Households | % Households |
| Dial-Up Internet | 79 | 0.3% |
| Broadband Home | 21,213 | 70.8% |
| Cellular Data Only | 3,365 | 11.2% |
| Satellite Internet | 1,119 | 3.7% |
| No Internet | 4,588 | 15.3% |
| Total | 29,947 | 100.0% |
Scranton Summary
Scranton, Pennsylvania is a city located in Lackawanna County in the northeastern part of the state. It is the county seat and the sixth-largest city in Pennsylvania. The city is situated in the Pocono Mountains region and is part of the Scranton/Wilkes-Barre metropolitan area.
History
The area that is now Scranton was first settled in 1786 by a group of settlers from Connecticut. The city was officially incorporated in 1856 and was named after the city of Scranton in England. The city quickly grew in the late 19th century due to the coal mining industry. The city was a major hub for the coal industry and was home to several large coal companies. The city was also a major railroad hub and was home to the Delaware, Lackawanna and Western Railroad.
The city experienced a period of economic decline in the mid-20th century due to the decline of the coal industry. The city was also hit hard by the Great Recession of 2008. However, the city has since seen a resurgence in recent years due to the growth of the healthcare and education sectors.
Geography
Scranton is located in northeastern Pennsylvania in the Pocono Mountains region. The city is situated at the confluence of the Lackawanna and Susquehanna Rivers. The city has a total area of 24.7 square miles and is located at an elevation of 1,000 feet. The city is located approximately 80 miles northwest of Philadelphia and 90 miles northeast of Pittsburgh.
Climate
Scranton has a humid continental climate with cold, snowy winters and warm, humid summers. The average annual temperature is 46°F and the average annual precipitation is 43 inches.
Economy
Scranton’s economy is largely based on healthcare, education, and manufacturing. The city is home to several major healthcare providers, including Geisinger Health System, Commonwealth Health, and Moses Taylor Hospital. The city is also home to several higher education institutions, including the University of Scranton, Marywood University, and Lackawanna College.
The city is also home to several major manufacturing companies, including Procter & Gamble, Unilever, and Nestle. The city is also home to several major retail stores, including Walmart, Target, and Kohl’s.
Demographics
As of the 2010 census, the population of Scranton was 76,089. The racial makeup of the city was 87.3% White, 6.2% African American, 0.3% Native American, 1.2% Asian, and 4.9% from other races. The median household income was $35,945 and the median family income was $45,919. The per capita income was $20,945.
Common Questions
What is Per Capita Income in Scranton?
Per Capita income in Scranton is $27,830.
What is the Median Family Income in Scranton?
Median Family Income in Scranton is $66,007.
What is the Median Household income in Scranton?
Median Household Income in Scranton is $48,776.
What is Income or Wage Gap in Scranton?
Income or Wage Gap in Scranton is 19.7%.
Women in Scranton earn 80.3 cents for every dollar earned by a man.
What is Family Income Deficit in Scranton?
Family Income Deficit in Scranton is $10,583.
Families that are below poverty line in Scranton earn $10,583 less on average than the poverty threshold level.
What is Inequality or Gini Index in Scranton?
Inequality or Gini Index in Scranton is 0.46.
What is the Total Population of Scranton?
Total Population of Scranton is 76,119.
What is the Total Male Population of Scranton?
Total Male Population of Scranton is 37,819.
What is the Total Female Population of Scranton?
Total Female Population of Scranton is 38,300.
What is the Ratio of Males per 100 Females in Scranton?
There are 98.74 Males per 100 Females in Scranton.
What is the Ratio of Females per 100 Males in Scranton?
There are 101.27 Females per 100 Males in Scranton.
What is the Median Population Age in Scranton?
Median Population Age in Scranton is 37.3 Years.
What is the Average Family Size in Scranton
Average Family Size in Scranton is 3.1 People.
What is the Average Household Size in Scranton
Average Household Size in Scranton is 2.4 People.
How Large is the Labor Force in Scranton?
There are 36,361 People in the Labor Forcein in Scranton.
What is the Percentage of People in the Labor Force in Scranton?
57.8% of People are in the Labor Force in Scranton.
What is the Unemployment Rate in Scranton?
Unemployment Rate in Scranton is 5.6%.