Cambridge, MA Map & Demographics
Cambridge Map
Cambridge Overview
$72,975
PER CAPITA INCOME
$160,739
AVG FAMILY INCOME
$121,539
AVG HOUSEHOLD INCOME
19.4%
WAGE / INCOME GAP [ % ]
80.6¢/ $1
WAGE / INCOME GAP [ $ ]
$10,770
FAMILY INCOME DEFICIT
0.50
INEQUALITY / GINI INDEX
117,962
TOTAL POPULATION
59,133
MALE POPULATION
58,829
FEMALE POPULATION
100.52
MALES / 100 FEMALES
99.49
FEMALES / 100 MALES
30.6
MEDIAN AGE
2.8
AVG FAMILY SIZE
2.1
AVG HOUSEHOLD SIZE
73,471
LABOR FORCE [ PEOPLE ]
69.8%
PERCENT IN LABOR FORCE
3.3%
UNEMPLOYMENT RATE
Income in Cambridge
Income Overview in Cambridge
Per Capita Income in Cambridge is $72,975, while median incomes of families and households are $160,739 and $121,539 respectively.
| Characteristic | Number | Measure |
| Per Capita Income | 117,962 | $72,975 |
| Median Family Income | 19,842 | $160,739 |
| Mean Family Income | 19,842 | $226,541 |
| Median Household Income | 49,475 | $121,539 |
| Mean Household Income | 49,475 | $169,569 |
| Income Deficit | 19,842 | $10,770 |
| Wage / Income Gap (%) | 117,962 | 19.38% |
| Wage / Income Gap ($) | 117,962 | 80.62¢ per $1 |
| Gini / Inequality Index | 117,962 | 0.50 |
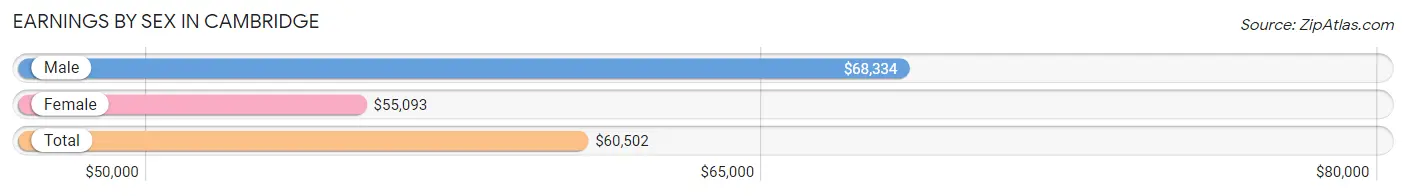
Earnings by Sex in Cambridge
Average Earnings in Cambridge are $60,502, $68,334 for men and $55,093 for women, a difference of 19.4%.
| Sex | Number | Average Earnings |
| Male | 42,551 (51.8%) | $68,334 |
| Female | 39,620 (48.2%) | $55,093 |
| Total | 82,171 (100.0%) | $60,502 |
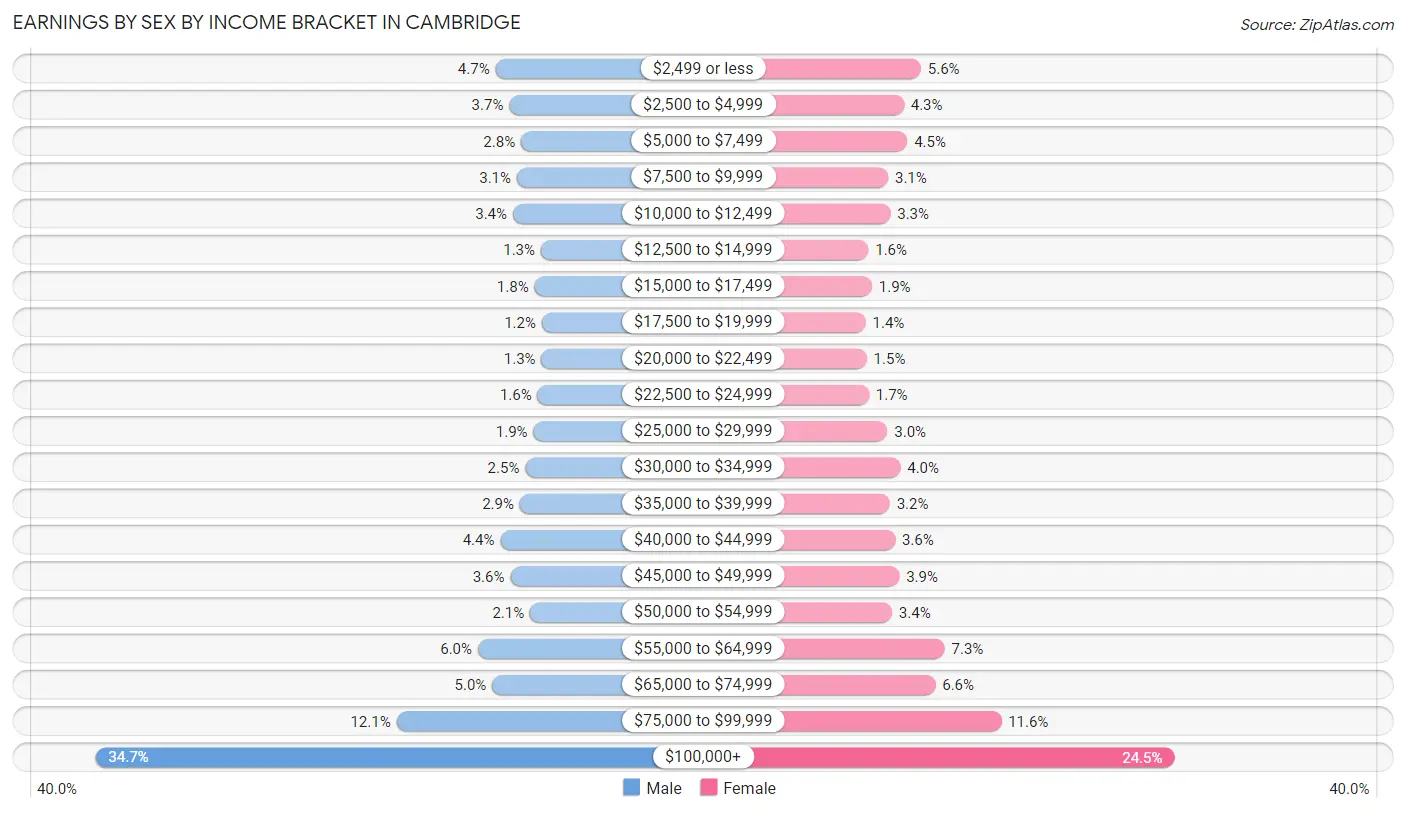
Earnings by Sex by Income Bracket in Cambridge
The most common earnings brackets in Cambridge are $100,000+ for men (14,761 | 34.7%) and $100,000+ for women (9,724 | 24.5%).
| Income | Male | Female |
| $2,499 or less | 2,004 (4.7%) | 2,199 (5.6%) |
| $2,500 to $4,999 | 1,567 (3.7%) | 1,691 (4.3%) |
| $5,000 to $7,499 | 1,191 (2.8%) | 1,793 (4.5%) |
| $7,500 to $9,999 | 1,323 (3.1%) | 1,224 (3.1%) |
| $10,000 to $12,499 | 1,450 (3.4%) | 1,293 (3.3%) |
| $12,500 to $14,999 | 559 (1.3%) | 639 (1.6%) |
| $15,000 to $17,499 | 760 (1.8%) | 746 (1.9%) |
| $17,500 to $19,999 | 528 (1.2%) | 560 (1.4%) |
| $20,000 to $22,499 | 540 (1.3%) | 590 (1.5%) |
| $22,500 to $24,999 | 665 (1.6%) | 652 (1.7%) |
| $25,000 to $29,999 | 796 (1.9%) | 1,206 (3.0%) |
| $30,000 to $34,999 | 1,055 (2.5%) | 1,587 (4.0%) |
| $35,000 to $39,999 | 1,230 (2.9%) | 1,274 (3.2%) |
| $40,000 to $44,999 | 1,851 (4.3%) | 1,432 (3.6%) |
| $45,000 to $49,999 | 1,531 (3.6%) | 1,558 (3.9%) |
| $50,000 to $54,999 | 901 (2.1%) | 1,341 (3.4%) |
| $55,000 to $64,999 | 2,564 (6.0%) | 2,903 (7.3%) |
| $65,000 to $74,999 | 2,112 (5.0%) | 2,625 (6.6%) |
| $75,000 to $99,999 | 5,163 (12.1%) | 4,583 (11.6%) |
| $100,000+ | 14,761 (34.7%) | 9,724 (24.5%) |
| Total | 42,551 (100.0%) | 39,620 (100.0%) |
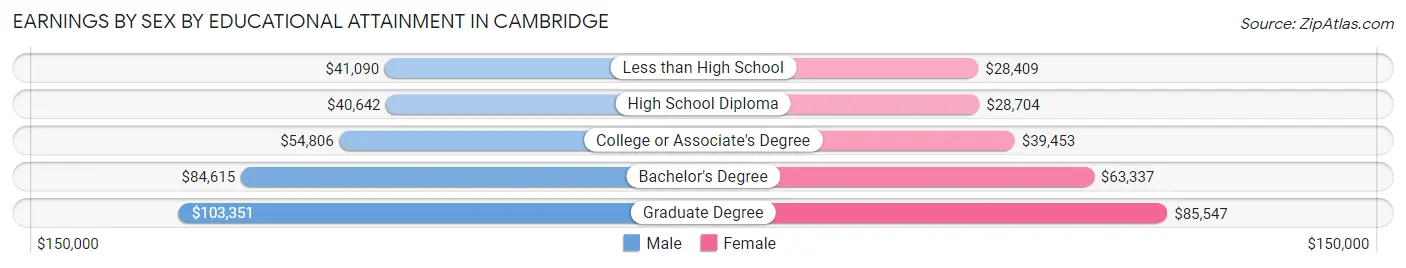
Earnings by Sex by Educational Attainment in Cambridge
Average earnings in Cambridge are $85,921 for men and $69,563 for women, a difference of 19.0%. Men with an educational attainment of graduate degree enjoy the highest average annual earnings of $103,351, while those with high school diploma education earn the least with $40,642. Women with an educational attainment of graduate degree earn the most with the average annual earnings of $85,547, while those with less than high school education have the smallest earnings of $28,409.
| Educational Attainment | Male Income | Female Income |
| Less than High School | $41,090 | $28,409 |
| High School Diploma | $40,642 | $28,704 |
| College or Associate's Degree | $54,806 | $39,453 |
| Bachelor's Degree | $84,615 | $63,337 |
| Graduate Degree | $103,351 | $85,547 |
| Total | $85,921 | $69,563 |
Family Income in Cambridge
Family Income Brackets in Cambridge
According to the Cambridge family income data, there are 7,976 families falling into the $200,000+ income range, which is the most common income bracket and makes up 40.2% of all families. Conversely, the $10,000 to $14,999 income bracket is the least frequent group with only 99 families (0.5%) belonging to this category.
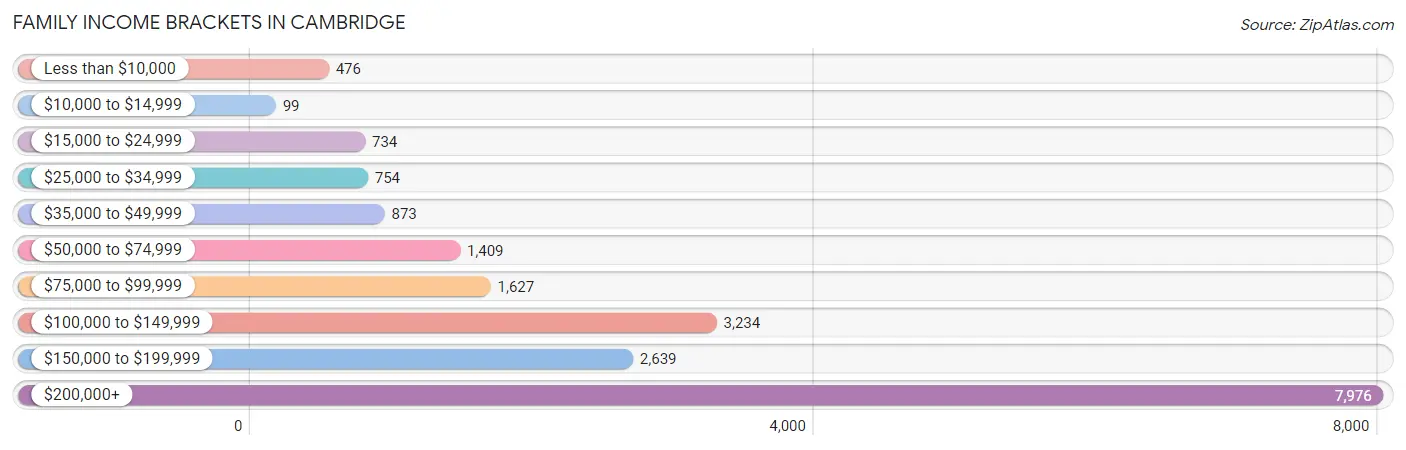
| Income Bracket | # Families | % Families |
| Less than $10,000 | 476 | 2.4% |
| $10,000 to $14,999 | 99 | 0.5% |
| $15,000 to $24,999 | 734 | 3.7% |
| $25,000 to $34,999 | 754 | 3.8% |
| $35,000 to $49,999 | 873 | 4.4% |
| $50,000 to $74,999 | 1,409 | 7.1% |
| $75,000 to $99,999 | 1,627 | 8.2% |
| $100,000 to $149,999 | 3,234 | 16.3% |
| $150,000 to $199,999 | 2,639 | 13.3% |
| $200,000+ | 7,976 | 40.2% |
Family Income by Famaliy Size in Cambridge
3-person families (4,756 | 24.0%) account for the highest median family income in Cambridge with $182,143 per family, while 2-person families (10,179 | 51.3%) have the highest median income of $75,956 per family member.
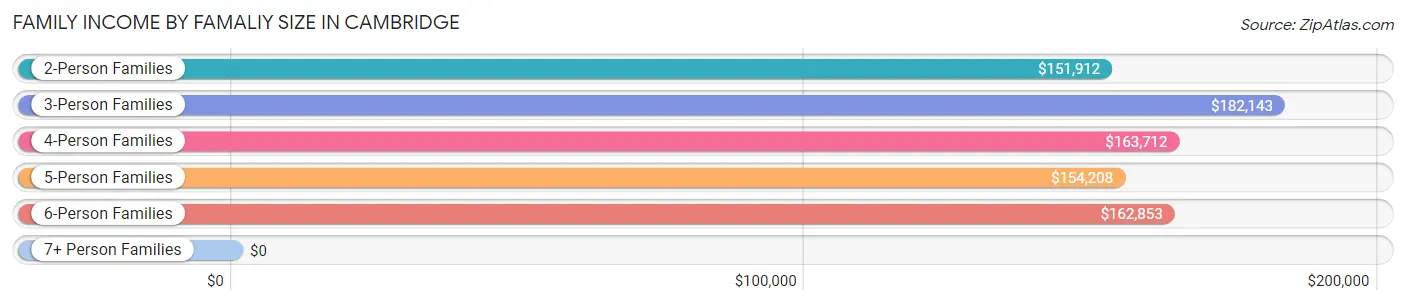
| Income Bracket | # Families | Median Income |
| 2-Person Families | 10,179 (51.3%) | $151,912 |
| 3-Person Families | 4,756 (24.0%) | $182,143 |
| 4-Person Families | 3,690 (18.6%) | $163,712 |
| 5-Person Families | 979 (4.9%) | $154,208 |
| 6-Person Families | 171 (0.9%) | $162,853 |
| 7+ Person Families | 67 (0.3%) | $0 |
| Total | 19,842 (100.0%) | $160,739 |
Family Income by Number of Earners in Cambridge
The median family income in Cambridge is $160,739, with families comprising 2 earners (10,961) having the highest median family income of $200,412, while families with no earners (1,749) have the lowest median family income of $59,940, accounting for 55.2% and 8.8% of families, respectively.
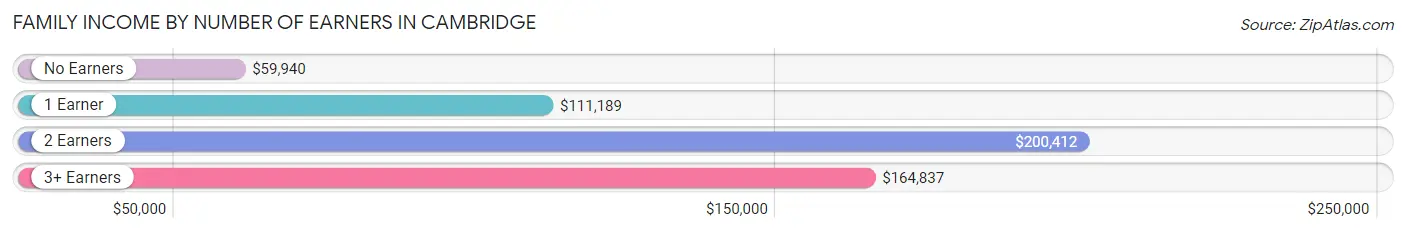
| Number of Earners | # Families | Median Income |
| No Earners | 1,749 (8.8%) | $59,940 |
| 1 Earner | 5,504 (27.7%) | $111,189 |
| 2 Earners | 10,961 (55.2%) | $200,412 |
| 3+ Earners | 1,628 (8.2%) | $164,837 |
| Total | 19,842 (100.0%) | $160,739 |
Household Income in Cambridge
Household Income Brackets in Cambridge
With 13,853 households falling in the category, the $200,000+ income range is the most frequent in Cambridge, accounting for 28.0% of all households. In contrast, only 1,385 households (2.8%) fall into the $10,000 to $14,999 income bracket, making it the least populous group.
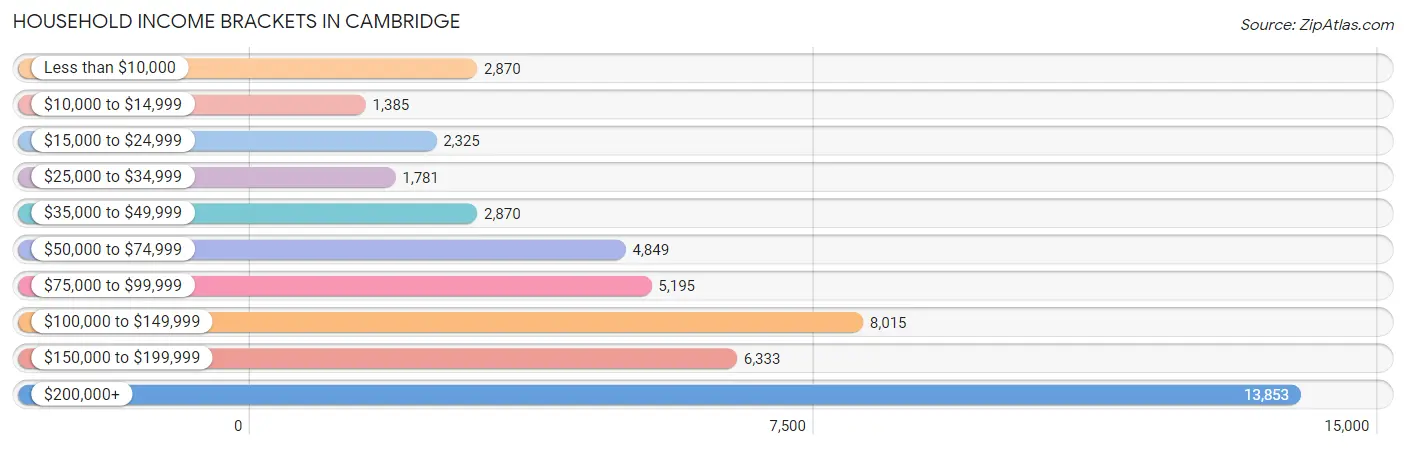
| Income Bracket | # Households | % Households |
| Less than $10,000 | 2,870 | 5.8% |
| $10,000 to $14,999 | 1,385 | 2.8% |
| $15,000 to $24,999 | 2,325 | 4.7% |
| $25,000 to $34,999 | 1,781 | 3.6% |
| $35,000 to $49,999 | 2,870 | 5.8% |
| $50,000 to $74,999 | 4,849 | 9.8% |
| $75,000 to $99,999 | 5,195 | 10.5% |
| $100,000 to $149,999 | 8,015 | 16.2% |
| $150,000 to $199,999 | 6,333 | 12.8% |
| $200,000+ | 13,853 | 28.0% |
Household Income by Householder Age in Cambridge
The median household income in Cambridge is $121,539, with the highest median household income of $139,677 found in the 45 to 64 years age bracket for the primary householder. A total of 11,030 households (22.3%) fall into this category. Meanwhile, the 15 to 24 years age bracket for the primary householder has the lowest median household income of $75,483, with 3,691 households (7.5%) in this group.
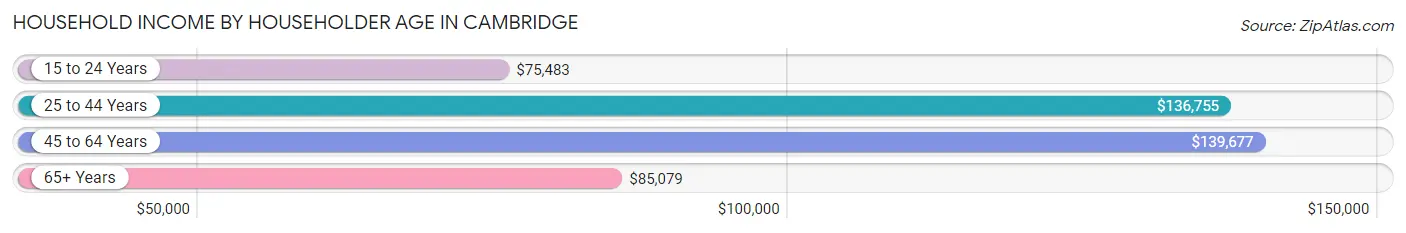
| Income Bracket | # Households | Median Income |
| 15 to 24 Years | 3,691 (7.5%) | $75,483 |
| 25 to 44 Years | 24,887 (50.3%) | $136,755 |
| 45 to 64 Years | 11,030 (22.3%) | $139,677 |
| 65+ Years | 9,867 (19.9%) | $85,079 |
| Total | 49,475 (100.0%) | $121,539 |
Poverty in Cambridge
Income Below Poverty by Sex and Age in Cambridge
With 11.6% poverty level for males and 12.7% for females among the residents of Cambridge, 18 to 24 year old males and 18 to 24 year old females are the most vulnerable to poverty, with 1,480 males (28.5%) and 1,828 females (28.8%) in their respective age groups living below the poverty level.
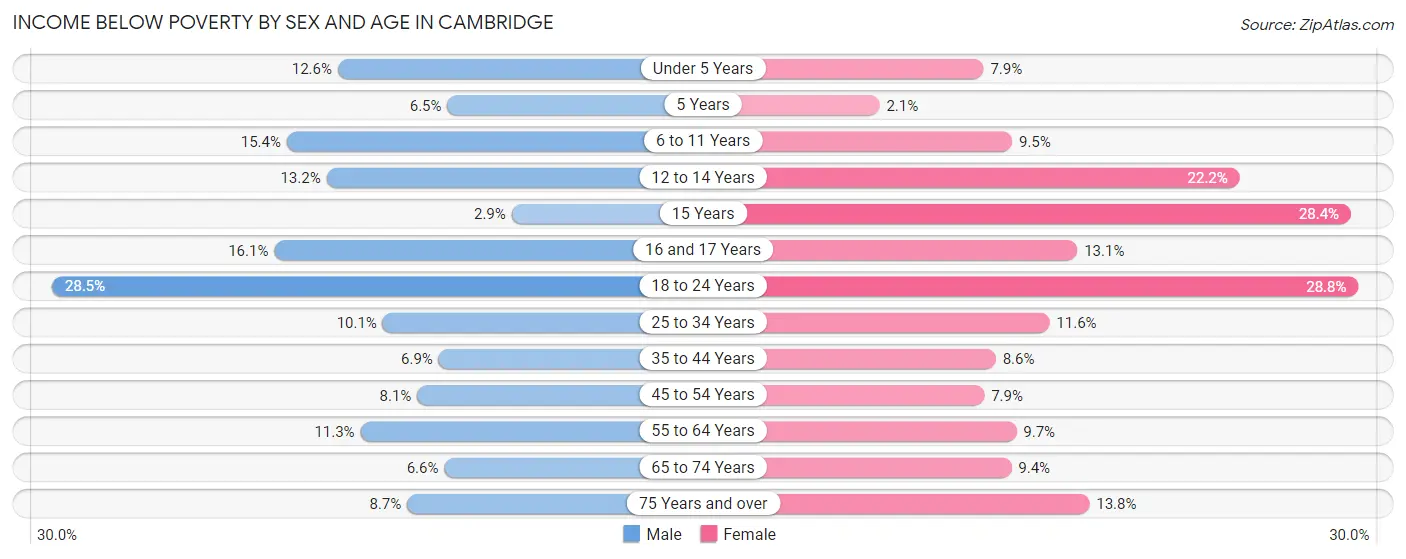
| Age Bracket | Male | Female |
| Under 5 Years | 360 (12.6%) | 155 (7.9%) |
| 5 Years | 21 (6.5%) | 7 (2.1%) |
| 6 to 11 Years | 371 (15.4%) | 192 (9.5%) |
| 12 to 14 Years | 134 (13.2%) | 206 (22.2%) |
| 15 Years | 7 (2.9%) | 108 (28.3%) |
| 16 and 17 Years | 128 (16.1%) | 94 (13.1%) |
| 18 to 24 Years | 1,480 (28.5%) | 1,828 (28.8%) |
| 25 to 34 Years | 1,598 (10.1%) | 1,676 (11.6%) |
| 35 to 44 Years | 546 (6.9%) | 650 (8.6%) |
| 45 to 54 Years | 390 (8.1%) | 396 (7.9%) |
| 55 to 64 Years | 478 (11.3%) | 410 (9.7%) |
| 65 to 74 Years | 248 (6.6%) | 449 (9.4%) |
| 75 Years and over | 187 (8.7%) | 437 (13.8%) |
| Total | 5,948 (11.6%) | 6,608 (12.7%) |
Income Above Poverty by Sex and Age in Cambridge
According to the poverty statistics in Cambridge, males aged 15 years and females aged 5 years are the age groups that are most secure financially, with 97.1% of males and 97.9% of females in these age groups living above the poverty line.
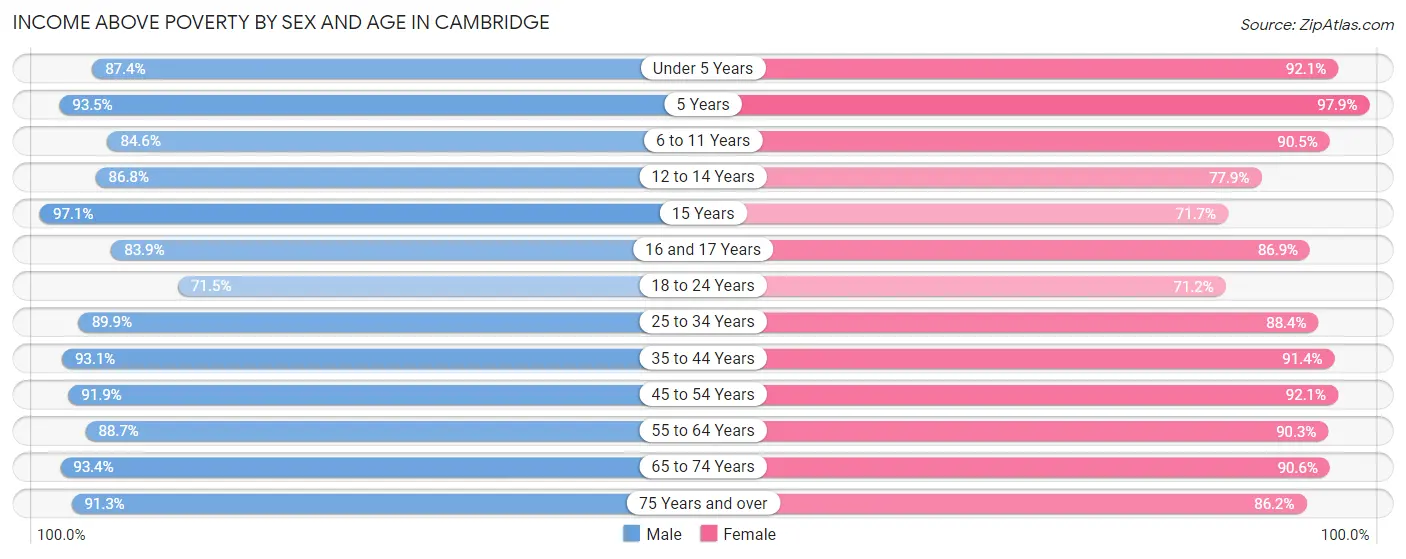
| Age Bracket | Male | Female |
| Under 5 Years | 2,507 (87.4%) | 1,809 (92.1%) |
| 5 Years | 304 (93.5%) | 326 (97.9%) |
| 6 to 11 Years | 2,038 (84.6%) | 1,834 (90.5%) |
| 12 to 14 Years | 882 (86.8%) | 724 (77.8%) |
| 15 Years | 236 (97.1%) | 273 (71.7%) |
| 16 and 17 Years | 667 (83.9%) | 623 (86.9%) |
| 18 to 24 Years | 3,716 (71.5%) | 4,527 (71.2%) |
| 25 to 34 Years | 14,289 (89.9%) | 12,826 (88.4%) |
| 35 to 44 Years | 7,325 (93.1%) | 6,932 (91.4%) |
| 45 to 54 Years | 4,400 (91.9%) | 4,600 (92.1%) |
| 55 to 64 Years | 3,753 (88.7%) | 3,806 (90.3%) |
| 65 to 74 Years | 3,490 (93.4%) | 4,307 (90.6%) |
| 75 Years and over | 1,962 (91.3%) | 2,735 (86.2%) |
| Total | 45,569 (88.4%) | 45,322 (87.3%) |
Income Below Poverty Among Married-Couple Families in Cambridge
The poverty statistics for married-couple families in Cambridge show that 3.5% or 539 of the total 15,393 families live below the poverty line. Families with 3 or 4 children have the highest poverty rate of 12.6%, comprising of 87 families. On the other hand, families with 5 or more children have the lowest poverty rate of 0.0%, which includes 0 families.
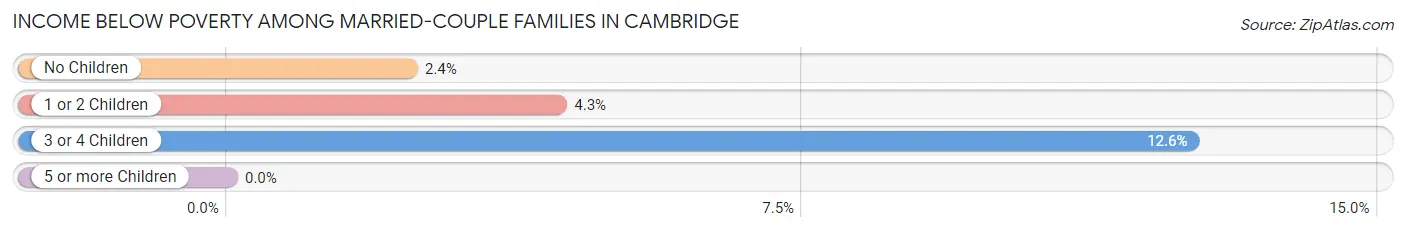
| Children | Above Poverty | Below Poverty |
| No Children | 8,988 (97.7%) | 216 (2.4%) |
| 1 or 2 Children | 5,255 (95.7%) | 236 (4.3%) |
| 3 or 4 Children | 606 (87.5%) | 87 (12.6%) |
| 5 or more Children | 5 (100.0%) | 0 (0.0%) |
| Total | 14,854 (96.5%) | 539 (3.5%) |
Income Below Poverty Among Single-Parent Households in Cambridge
According to the poverty data in Cambridge, 6.2% or 67 single-father households and 19.1% or 646 single-mother households are living below the poverty line. Among single-father households, those with no children have the highest poverty rate, with 54 households (6.8%) experiencing poverty. Likewise, among single-mother households, those with 3 or 4 children have the highest poverty rate, with 127 households (75.6%) falling below the poverty line.
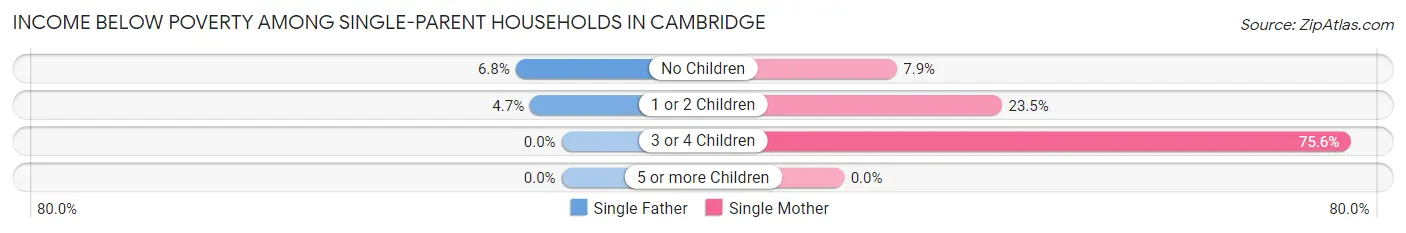
| Children | Single Father | Single Mother |
| No Children | 54 (6.8%) | 118 (7.9%) |
| 1 or 2 Children | 13 (4.7%) | 401 (23.5%) |
| 3 or 4 Children | 0 (0.0%) | 127 (75.6%) |
| 5 or more Children | 0 (0.0%) | 0 (0.0%) |
| Total | 67 (6.2%) | 646 (19.1%) |
Income Below Poverty Among Married-Couple vs Single-Parent Households in Cambridge
The poverty data for Cambridge shows that 539 of the married-couple family households (3.5%) and 713 of the single-parent households (16.0%) are living below the poverty level. Within the married-couple family households, those with 3 or 4 children have the highest poverty rate, with 87 households (12.6%) falling below the poverty line. Among the single-parent households, those with 3 or 4 children have the highest poverty rate, with 127 household (73.0%) living below poverty.
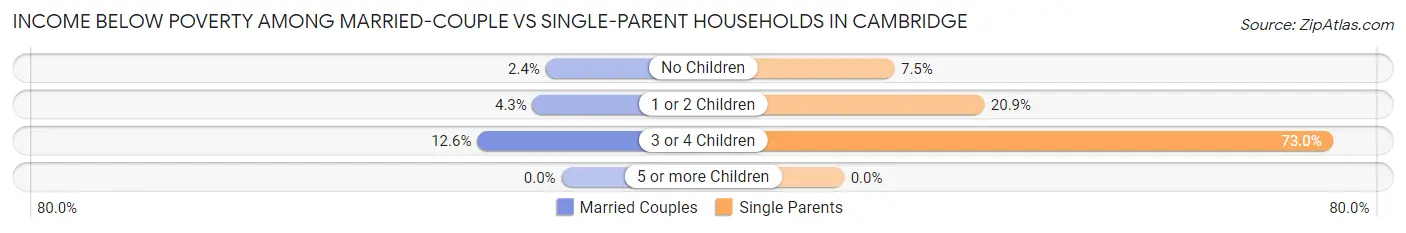
| Children | Married-Couple Families | Single-Parent Households |
| No Children | 216 (2.4%) | 172 (7.5%) |
| 1 or 2 Children | 236 (4.3%) | 414 (20.9%) |
| 3 or 4 Children | 87 (12.6%) | 127 (73.0%) |
| 5 or more Children | 0 (0.0%) | 0 (0.0%) |
| Total | 539 (3.5%) | 713 (16.0%) |
Race in Cambridge
The most populous races in Cambridge are White / Caucasian (69,984 | 59.3%), Asian (22,720 | 19.3%), and Black / African American (12,704 | 10.8%).
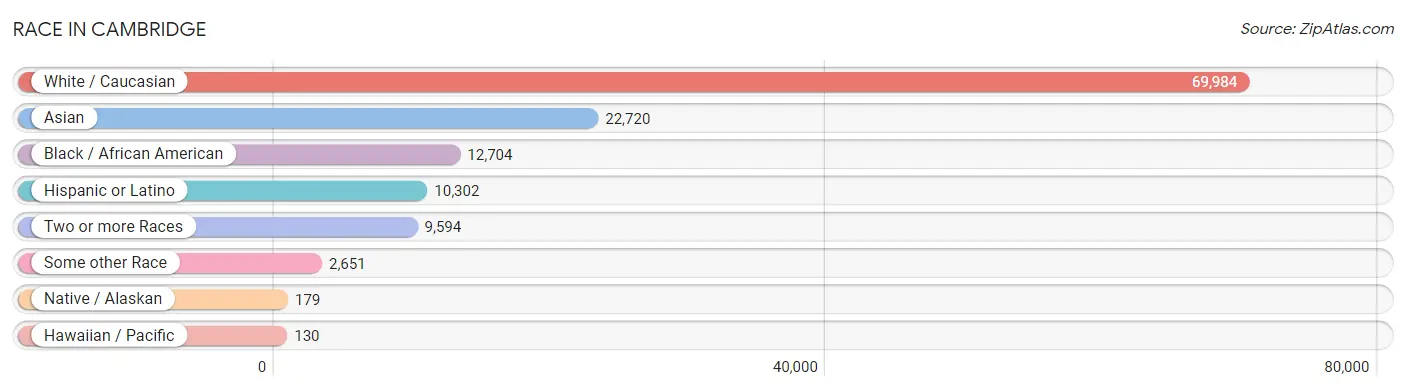
| Race | # Population | % Population |
| Asian | 22,720 | 19.3% |
| Black / African American | 12,704 | 10.8% |
| Hawaiian / Pacific | 130 | 0.1% |
| Hispanic or Latino | 10,302 | 8.7% |
| Native / Alaskan | 179 | 0.2% |
| White / Caucasian | 69,984 | 59.3% |
| Two or more Races | 9,594 | 8.1% |
| Some other Race | 2,651 | 2.2% |
| Total | 117,962 | 100.0% |
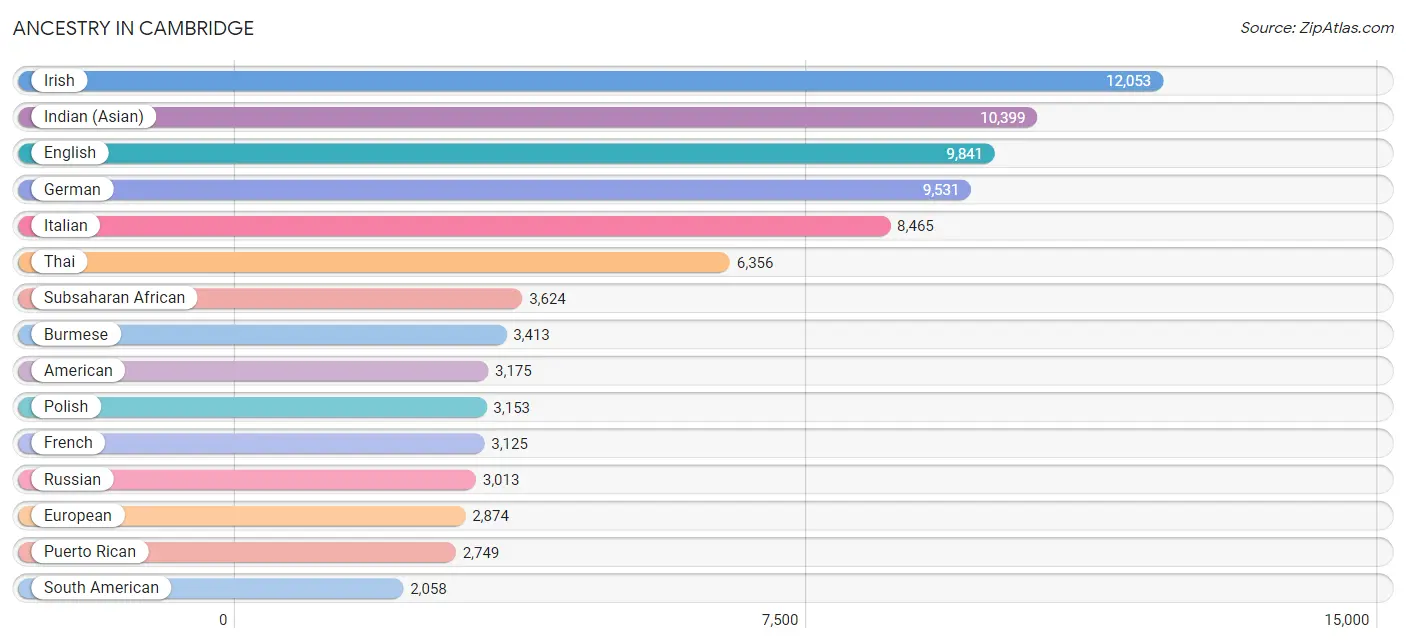
Ancestry in Cambridge
The most populous ancestries reported in Cambridge are Irish (12,053 | 10.2%), Indian (Asian) (10,399 | 8.8%), English (9,841 | 8.3%), German (9,531 | 8.1%), and Italian (8,465 | 7.2%), together accounting for 42.6% of all Cambridge residents.
| Ancestry | # Population | % Population |
| Afghan | 46 | 0.0% |
| African | 729 | 0.6% |
| Albanian | 174 | 0.2% |
| American | 3,175 | 2.7% |
| Arab | 2,053 | 1.7% |
| Argentinean | 553 | 0.5% |
| Armenian | 391 | 0.3% |
| Assyrian / Chaldean / Syriac | 5 | 0.0% |
| Australian | 40 | 0.0% |
| Austrian | 370 | 0.3% |
| Bahamian | 10 | 0.0% |
| Barbadian | 116 | 0.1% |
| Basque | 77 | 0.1% |
| Belgian | 153 | 0.1% |
| Bhutanese | 1,655 | 1.4% |
| Blackfeet | 71 | 0.1% |
| Bolivian | 20 | 0.0% |
| Brazilian | 440 | 0.4% |
| British | 1,349 | 1.1% |
| British West Indian | 20 | 0.0% |
| Bulgarian | 256 | 0.2% |
| Burmese | 3,413 | 2.9% |
| Cambodian | 1 | 0.0% |
| Canadian | 683 | 0.6% |
| Cape Verdean | 239 | 0.2% |
| Celtic | 8 | 0.0% |
| Central American | 1,494 | 1.3% |
| Central American Indian | 170 | 0.1% |
| Cherokee | 162 | 0.1% |
| Chilean | 197 | 0.2% |
| Choctaw | 13 | 0.0% |
| Colombian | 692 | 0.6% |
| Comanche | 9 | 0.0% |
| Cree | 11 | 0.0% |
| Creek | 7 | 0.0% |
| Croatian | 92 | 0.1% |
| Cuban | 342 | 0.3% |
| Cypriot | 29 | 0.0% |
| Czech | 572 | 0.5% |
| Czechoslovakian | 14 | 0.0% |
| Danish | 495 | 0.4% |
| Dominican | 761 | 0.6% |
| Dutch | 730 | 0.6% |
| Eastern European | 1,831 | 1.5% |
| Ecuadorian | 128 | 0.1% |
| Egyptian | 330 | 0.3% |
| English | 9,841 | 8.3% |
| Estonian | 6 | 0.0% |
| Ethiopian | 1,710 | 1.5% |
| European | 2,874 | 2.4% |
| Filipino | 724 | 0.6% |
| Finnish | 299 | 0.3% |
| French | 3,125 | 2.6% |
| French American Indian | 33 | 0.0% |
| French Canadian | 1,204 | 1.0% |
| German | 9,531 | 8.1% |
| Ghanaian | 86 | 0.1% |
| Greek | 1,106 | 0.9% |
| Guamanian / Chamorro | 77 | 0.1% |
| Guatemalan | 134 | 0.1% |
| Guyanese | 42 | 0.0% |
| Haitian | 1,525 | 1.3% |
| Honduran | 206 | 0.2% |
| Houma | 16 | 0.0% |
| Hungarian | 766 | 0.6% |
| Icelander | 33 | 0.0% |
| Indian (Asian) | 10,399 | 8.8% |
| Indonesian | 39 | 0.0% |
| Inupiat | 10 | 0.0% |
| Iranian | 653 | 0.5% |
| Iraqi | 60 | 0.1% |
| Irish | 12,053 | 10.2% |
| Iroquois | 10 | 0.0% |
| Israeli | 151 | 0.1% |
| Italian | 8,465 | 7.2% |
| Jamaican | 820 | 0.7% |
| Japanese | 11 | 0.0% |
| Jordanian | 26 | 0.0% |
| Kenyan | 100 | 0.1% |
| Korean | 615 | 0.5% |
| Laotian | 99 | 0.1% |
| Latvian | 160 | 0.1% |
| Lebanese | 604 | 0.5% |
| Lithuanian | 608 | 0.5% |
| Lumbee | 14 | 0.0% |
| Luxembourger | 44 | 0.0% |
| Macedonian | 31 | 0.0% |
| Malaysian | 113 | 0.1% |
| Mexican | 1,391 | 1.2% |
| Mexican American Indian | 163 | 0.1% |
| Mongolian | 127 | 0.1% |
| Moroccan | 196 | 0.2% |
| Native Hawaiian | 38 | 0.0% |
| New Zealander | 62 | 0.1% |
| Nicaraguan | 42 | 0.0% |
| Nigerian | 493 | 0.4% |
| Northern European | 469 | 0.4% |
| Norwegian | 775 | 0.7% |
| Okinawan | 114 | 0.1% |
| Pakistani | 106 | 0.1% |
| Palestinian | 104 | 0.1% |
| Panamanian | 102 | 0.1% |
| Pennsylvania German | 15 | 0.0% |
| Peruvian | 191 | 0.2% |
| Polish | 3,153 | 2.7% |
| Portuguese | 1,829 | 1.5% |
| Puerto Rican | 2,749 | 2.3% |
| Romanian | 322 | 0.3% |
| Russian | 3,013 | 2.5% |
| Salvadoran | 785 | 0.7% |
| Samoan | 57 | 0.1% |
| Scandinavian | 263 | 0.2% |
| Scotch-Irish | 601 | 0.5% |
| Scottish | 1,941 | 1.7% |
| Serbian | 182 | 0.2% |
| Sierra Leonean | 13 | 0.0% |
| Sioux | 11 | 0.0% |
| Slavic | 37 | 0.0% |
| Slovak | 198 | 0.2% |
| Slovene | 67 | 0.1% |
| Somali | 7 | 0.0% |
| South African | 100 | 0.1% |
| South American | 2,058 | 1.7% |
| South American Indian | 27 | 0.0% |
| Spaniard | 424 | 0.4% |
| Spanish | 307 | 0.3% |
| Sri Lankan | 993 | 0.8% |
| Subsaharan African | 3,624 | 3.1% |
| Swedish | 1,637 | 1.4% |
| Swiss | 514 | 0.4% |
| Syrian | 93 | 0.1% |
| Thai | 6,356 | 5.4% |
| Trinidadian and Tobagonian | 85 | 0.1% |
| Turkish | 702 | 0.6% |
| U.S. Virgin Islander | 15 | 0.0% |
| Ugandan | 68 | 0.1% |
| Ukrainian | 798 | 0.7% |
| Uruguayan | 61 | 0.1% |
| Venezuelan | 216 | 0.2% |
| Vietnamese | 268 | 0.2% |
| Welsh | 476 | 0.4% |
| West Indian | 188 | 0.2% |
| Yugoslavian | 66 | 0.1% |
| Zimbabwean | 31 | 0.0% | View All 144 Rows |
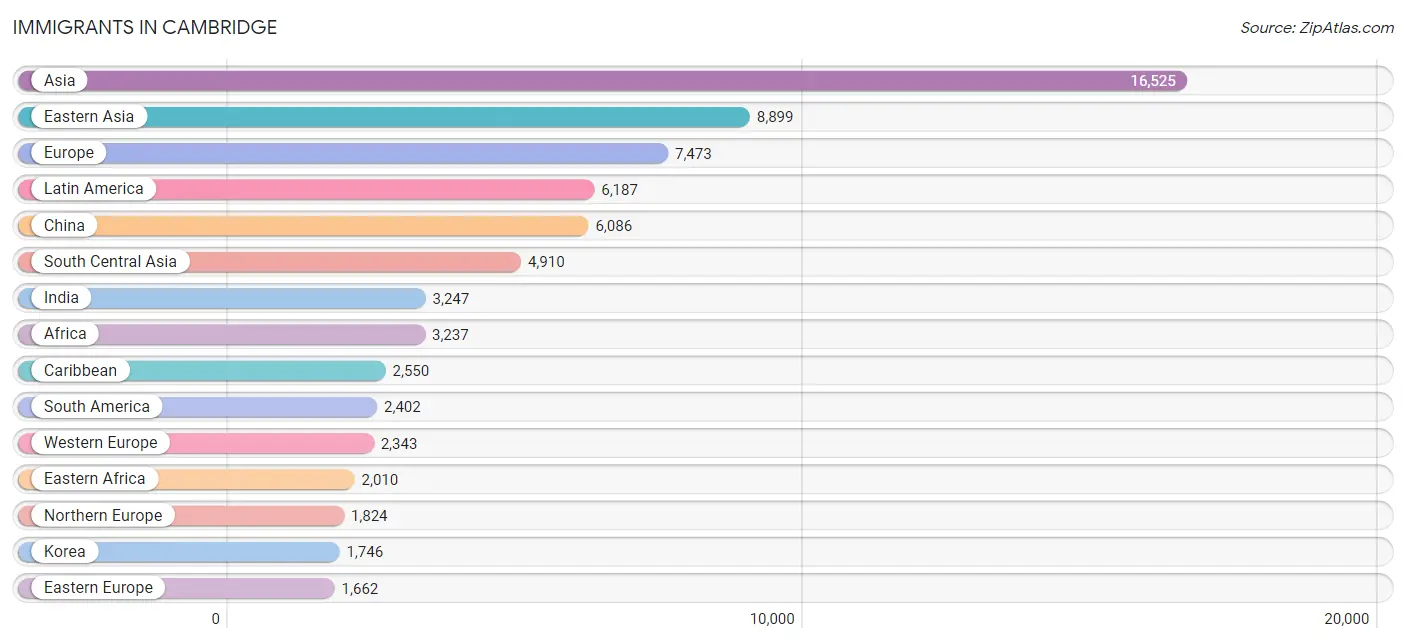
Immigrants in Cambridge
The most numerous immigrant groups reported in Cambridge came from Asia (16,525 | 14.0%), Eastern Asia (8,899 | 7.5%), Europe (7,473 | 6.3%), Latin America (6,187 | 5.2%), and China (6,086 | 5.2%), together accounting for 38.3% of all Cambridge residents.
| Immigration Origin | # Population | % Population |
| Afghanistan | 42 | 0.0% |
| Africa | 3,237 | 2.7% |
| Albania | 99 | 0.1% |
| Argentina | 444 | 0.4% |
| Armenia | 32 | 0.0% |
| Asia | 16,525 | 14.0% |
| Australia | 290 | 0.3% |
| Austria | 41 | 0.0% |
| Azores | 79 | 0.1% |
| Bangladesh | 484 | 0.4% |
| Barbados | 184 | 0.2% |
| Belarus | 29 | 0.0% |
| Belgium | 106 | 0.1% |
| Bosnia and Herzegovina | 16 | 0.0% |
| Brazil | 954 | 0.8% |
| Bulgaria | 177 | 0.2% |
| Cabo Verde | 86 | 0.1% |
| Cameroon | 17 | 0.0% |
| Canada | 920 | 0.8% |
| Caribbean | 2,550 | 2.2% |
| Central America | 1,235 | 1.1% |
| Chile | 201 | 0.2% |
| China | 6,086 | 5.2% |
| Colombia | 437 | 0.4% |
| Costa Rica | 24 | 0.0% |
| Croatia | 19 | 0.0% |
| Cuba | 71 | 0.1% |
| Czechoslovakia | 134 | 0.1% |
| Denmark | 147 | 0.1% |
| Dominican Republic | 356 | 0.3% |
| Eastern Africa | 2,010 | 1.7% |
| Eastern Asia | 8,899 | 7.5% |
| Eastern Europe | 1,662 | 1.4% |
| Ecuador | 77 | 0.1% |
| Egypt | 115 | 0.1% |
| El Salvador | 521 | 0.4% |
| England | 306 | 0.3% |
| Eritrea | 296 | 0.3% |
| Ethiopia | 1,490 | 1.3% |
| Europe | 7,473 | 6.3% |
| Fiji | 11 | 0.0% |
| France | 1,076 | 0.9% |
| Germany | 763 | 0.6% |
| Ghana | 194 | 0.2% |
| Greece | 182 | 0.2% |
| Guatemala | 88 | 0.1% |
| Guyana | 10 | 0.0% |
| Haiti | 1,402 | 1.2% |
| Honduras | 52 | 0.0% |
| Hong Kong | 229 | 0.2% |
| Hungary | 34 | 0.0% |
| India | 3,247 | 2.8% |
| Indonesia | 157 | 0.1% |
| Iran | 555 | 0.5% |
| Iraq | 41 | 0.0% |
| Ireland | 330 | 0.3% |
| Israel | 303 | 0.3% |
| Italy | 697 | 0.6% |
| Jamaica | 374 | 0.3% |
| Japan | 1,066 | 0.9% |
| Jordan | 124 | 0.1% |
| Kazakhstan | 34 | 0.0% |
| Kenya | 74 | 0.1% |
| Korea | 1,746 | 1.5% |
| Kuwait | 50 | 0.0% |
| Latin America | 6,187 | 5.2% |
| Latvia | 7 | 0.0% |
| Lebanon | 138 | 0.1% |
| Lithuania | 60 | 0.1% |
| Malaysia | 132 | 0.1% |
| Mexico | 371 | 0.3% |
| Middle Africa | 83 | 0.1% |
| Moldova | 61 | 0.1% |
| Morocco | 142 | 0.1% |
| Nepal | 248 | 0.2% |
| Netherlands | 86 | 0.1% |
| Nicaragua | 8 | 0.0% |
| Nigeria | 125 | 0.1% |
| North Macedonia | 9 | 0.0% |
| Northern Africa | 341 | 0.3% |
| Northern Europe | 1,824 | 1.5% |
| Norway | 24 | 0.0% |
| Oceania | 408 | 0.4% |
| Pakistan | 177 | 0.2% |
| Panama | 65 | 0.1% |
| Peru | 173 | 0.2% |
| Philippines | 143 | 0.1% |
| Poland | 136 | 0.1% |
| Portugal | 422 | 0.4% |
| Romania | 110 | 0.1% |
| Russia | 474 | 0.4% |
| Saudi Arabia | 37 | 0.0% |
| Scotland | 53 | 0.0% |
| Senegal | 20 | 0.0% |
| Serbia | 2 | 0.0% |
| Singapore | 259 | 0.2% |
| Somalia | 7 | 0.0% |
| South Africa | 187 | 0.2% |
| South America | 2,402 | 2.0% |
| South Central Asia | 4,910 | 4.2% |
| South Eastern Asia | 1,235 | 1.1% |
| Southern Europe | 1,621 | 1.4% |
| Spain | 320 | 0.3% |
| Sri Lanka | 123 | 0.1% |
| Sudan | 53 | 0.0% |
| Sweden | 141 | 0.1% |
| Switzerland | 271 | 0.2% |
| Syria | 70 | 0.1% |
| Taiwan | 601 | 0.5% |
| Thailand | 126 | 0.1% |
| Trinidad and Tobago | 82 | 0.1% |
| Turkey | 490 | 0.4% |
| Uganda | 63 | 0.1% |
| Ukraine | 214 | 0.2% |
| Uruguay | 20 | 0.0% |
| Venezuela | 65 | 0.1% |
| Vietnam | 403 | 0.3% |
| West Indies | 71 | 0.1% |
| Western Africa | 504 | 0.4% |
| Western Asia | 1,471 | 1.3% |
| Western Europe | 2,343 | 2.0% |
| Yemen | 23 | 0.0% |
| Zimbabwe | 38 | 0.0% | View All 123 Rows |
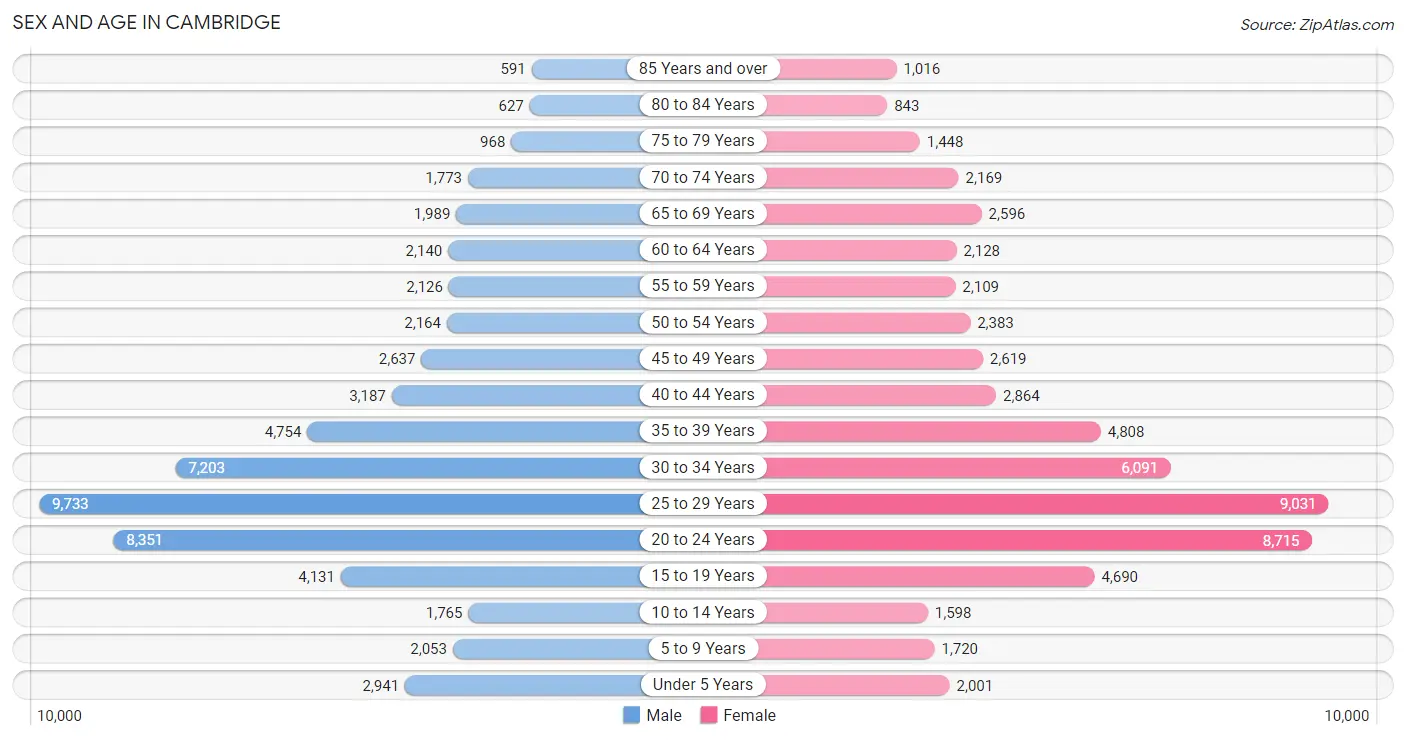
Sex and Age in Cambridge
Sex and Age in Cambridge
The most populous age groups in Cambridge are 25 to 29 Years (9,733 | 16.5%) for men and 25 to 29 Years (9,031 | 15.3%) for women.
| Age Bracket | Male | Female |
| Under 5 Years | 2,941 (5.0%) | 2,001 (3.4%) |
| 5 to 9 Years | 2,053 (3.5%) | 1,720 (2.9%) |
| 10 to 14 Years | 1,765 (3.0%) | 1,598 (2.7%) |
| 15 to 19 Years | 4,131 (7.0%) | 4,690 (8.0%) |
| 20 to 24 Years | 8,351 (14.1%) | 8,715 (14.8%) |
| 25 to 29 Years | 9,733 (16.5%) | 9,031 (15.3%) |
| 30 to 34 Years | 7,203 (12.2%) | 6,091 (10.3%) |
| 35 to 39 Years | 4,754 (8.0%) | 4,808 (8.2%) |
| 40 to 44 Years | 3,187 (5.4%) | 2,864 (4.9%) |
| 45 to 49 Years | 2,637 (4.5%) | 2,619 (4.4%) |
| 50 to 54 Years | 2,164 (3.7%) | 2,383 (4.1%) |
| 55 to 59 Years | 2,126 (3.6%) | 2,109 (3.6%) |
| 60 to 64 Years | 2,140 (3.6%) | 2,128 (3.6%) |
| 65 to 69 Years | 1,989 (3.4%) | 2,596 (4.4%) |
| 70 to 74 Years | 1,773 (3.0%) | 2,169 (3.7%) |
| 75 to 79 Years | 968 (1.6%) | 1,448 (2.5%) |
| 80 to 84 Years | 627 (1.1%) | 843 (1.4%) |
| 85 Years and over | 591 (1.0%) | 1,016 (1.7%) |
| Total | 59,133 (100.0%) | 58,829 (100.0%) |
Families and Households in Cambridge
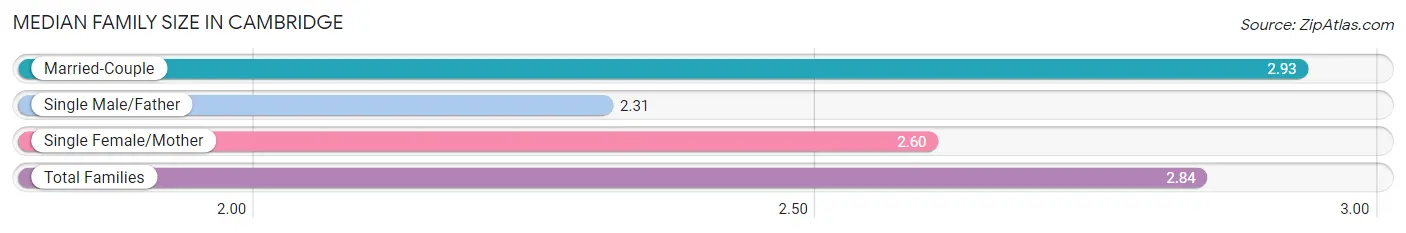
Median Family Size in Cambridge
The median family size in Cambridge is 2.84 persons per family, with married-couple families (15,393 | 77.6%) accounting for the largest median family size of 2.93 persons per family. On the other hand, single male/father families (1,073 | 5.4%) represent the smallest median family size with 2.31 persons per family.
| Family Type | # Families | Family Size |
| Married-Couple | 15,393 (77.6%) | 2.93 |
| Single Male/Father | 1,073 (5.4%) | 2.31 |
| Single Female/Mother | 3,376 (17.0%) | 2.60 |
| Total Families | 19,842 (100.0%) | 2.84 |
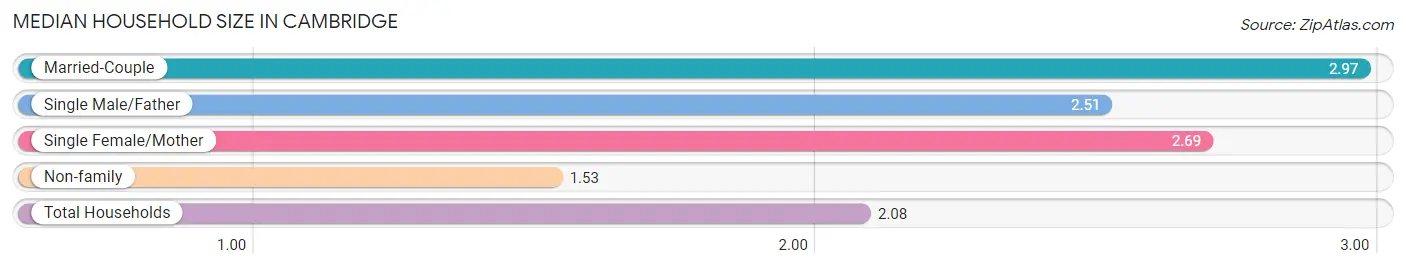
Median Household Size in Cambridge
The median household size in Cambridge is 2.08 persons per household, with married-couple households (15,393 | 31.1%) accounting for the largest median household size of 2.97 persons per household. non-family households (29,633 | 59.9%) represent the smallest median household size with 1.53 persons per household.
| Household Type | # Households | Household Size |
| Married-Couple | 15,393 (31.1%) | 2.97 |
| Single Male/Father | 1,073 (2.2%) | 2.51 |
| Single Female/Mother | 3,376 (6.8%) | 2.69 |
| Non-family | 29,633 (59.9%) | 1.53 |
| Total Households | 49,475 (100.0%) | 2.08 |
Household Size by Marriage Status in Cambridge
Out of a total of 49,475 households in Cambridge, 19,842 (40.1%) are family households, while 29,633 (59.9%) are nonfamily households. The most numerous type of family households are 2-person households, comprising 9,638, and the most common type of nonfamily households are 1-person households, comprising 18,083.
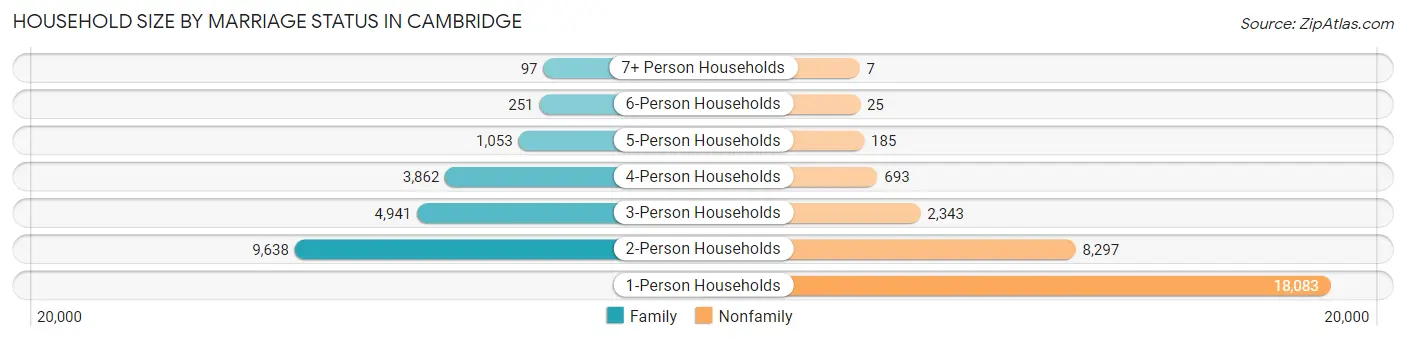
| Household Size | Family Households | Nonfamily Households |
| 1-Person Households | - | 18,083 (36.5%) |
| 2-Person Households | 9,638 (19.5%) | 8,297 (16.8%) |
| 3-Person Households | 4,941 (10.0%) | 2,343 (4.7%) |
| 4-Person Households | 3,862 (7.8%) | 693 (1.4%) |
| 5-Person Households | 1,053 (2.1%) | 185 (0.4%) |
| 6-Person Households | 251 (0.5%) | 25 (0.1%) |
| 7+ Person Households | 97 (0.2%) | 7 (0.0%) |
| Total | 19,842 (40.1%) | 29,633 (59.9%) |
Female Fertility in Cambridge
Fertility by Age in Cambridge
Average fertility rate in Cambridge is 27.0 births per 1,000 women. Women in the age bracket of 35 to 50 years have the highest fertility rate with 55.0 births per 1,000 women. Women in the age bracket of 35 to 50 years acount for 55.4% of all women with births.
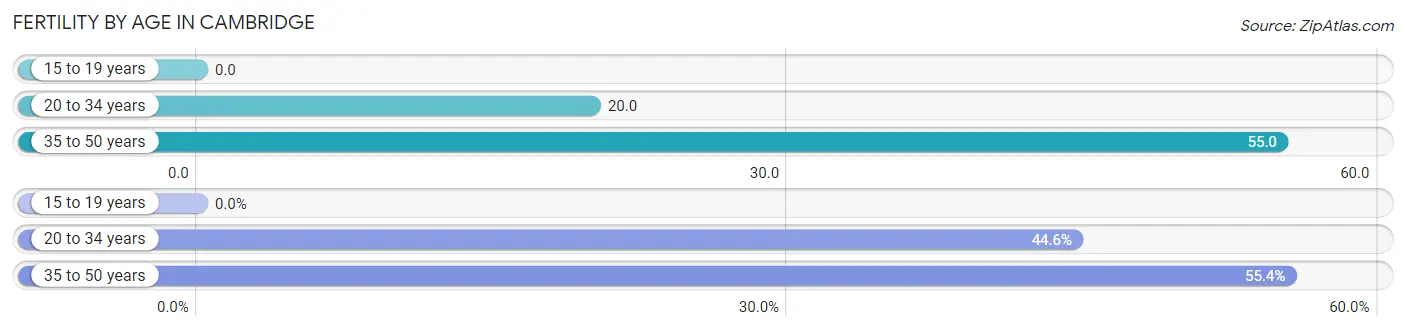
| Age Bracket | Women with Births | Births / 1,000 Women |
| 15 to 19 years | 0 (0.0%) | 0.0 |
| 20 to 34 years | 476 (44.6%) | 20.0 |
| 35 to 50 years | 592 (55.4%) | 55.0 |
| Total | 1,068 (100.0%) | 27.0 |
Fertility by Age by Marriage Status in Cambridge
78.6% of women with births (1,068) in Cambridge are married. The highest percentage of unmarried women with births falls into 35 to 50 years age bracket with 24.3% of them unmarried at the time of birth, while the lowest percentage of unmarried women with births belong to 20 to 34 years age bracket with 17.9% of them unmarried.
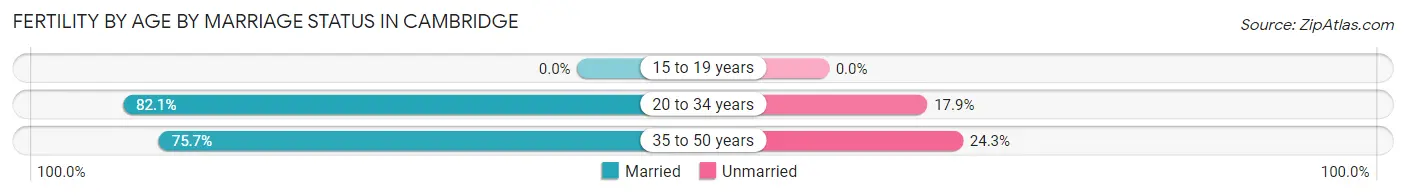
| Age Bracket | Married | Unmarried |
| 15 to 19 years | 0 (0.0%) | 0 (0.0%) |
| 20 to 34 years | 391 (82.1%) | 85 (17.9%) |
| 35 to 50 years | 448 (75.7%) | 144 (24.3%) |
| Total | 839 (78.6%) | 229 (21.4%) |
Fertility by Education in Cambridge
Average fertility rate in Cambridge is 27.0 births per 1,000 women. Women with the education attainment of high school diploma have the highest fertility rate of 48.0 births per 1,000 women, while women with the education attainment of college or associate's degree have the lowest fertility at 11.0 births per 1,000 women. Women with the education attainment of graduate degree represent 47.7% of all women with births.
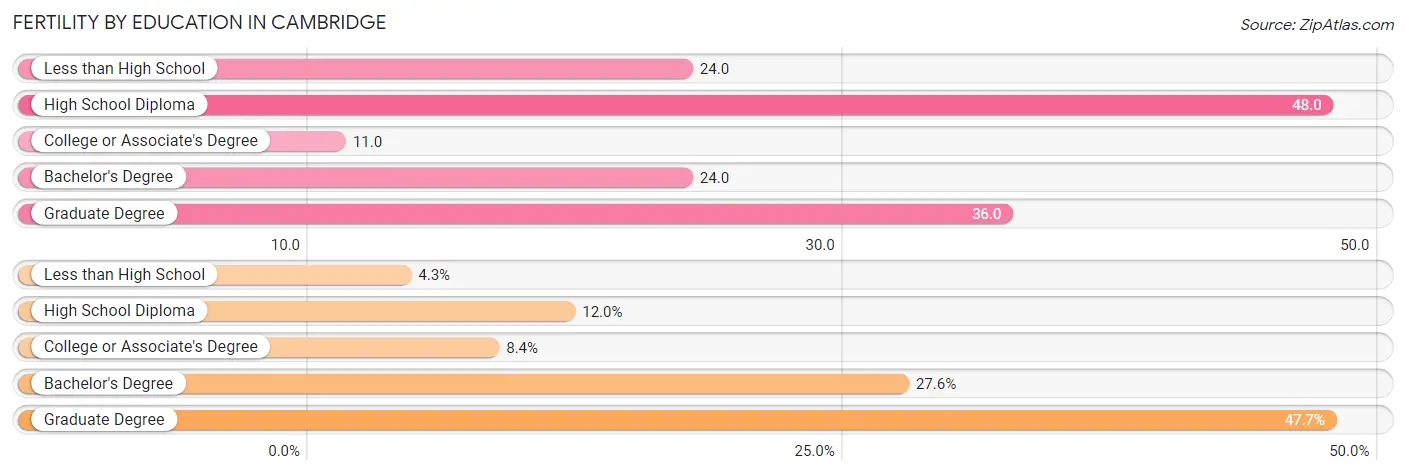
| Educational Attainment | Women with Births | Births / 1,000 Women |
| Less than High School | 46 (4.3%) | 24.0 |
| High School Diploma | 128 (12.0%) | 48.0 |
| College or Associate's Degree | 90 (8.4%) | 11.0 |
| Bachelor's Degree | 295 (27.6%) | 24.0 |
| Graduate Degree | 509 (47.7%) | 36.0 |
| Total | 1,068 (100.0%) | 27.0 |
Fertility by Education by Marriage Status in Cambridge
21.4% of women with births in Cambridge are unmarried. Women with the educational attainment of less than high school are most likely to be married with 100.0% of them married at childbirth, while women with the educational attainment of high school diploma are least likely to be married with 64.1% of them unmarried at childbirth.
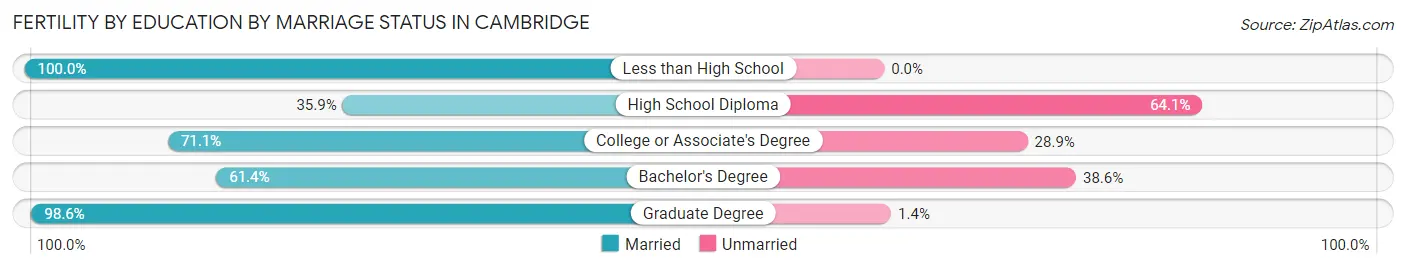
| Educational Attainment | Married | Unmarried |
| Less than High School | 46 (100.0%) | 0 (0.0%) |
| High School Diploma | 46 (35.9%) | 82 (64.1%) |
| College or Associate's Degree | 64 (71.1%) | 26 (28.9%) |
| Bachelor's Degree | 181 (61.4%) | 114 (38.6%) |
| Graduate Degree | 502 (98.6%) | 7 (1.4%) |
| Total | 839 (78.6%) | 229 (21.4%) |
Employment Characteristics in Cambridge
Employment by Class of Employer in Cambridge
Among the 70,129 employed individuals in Cambridge, private company employees (37,604 | 53.6%), not-for-profit organizations (21,534 | 30.7%), and local government employees (2,999 | 4.3%) make up the most common classes of employment.
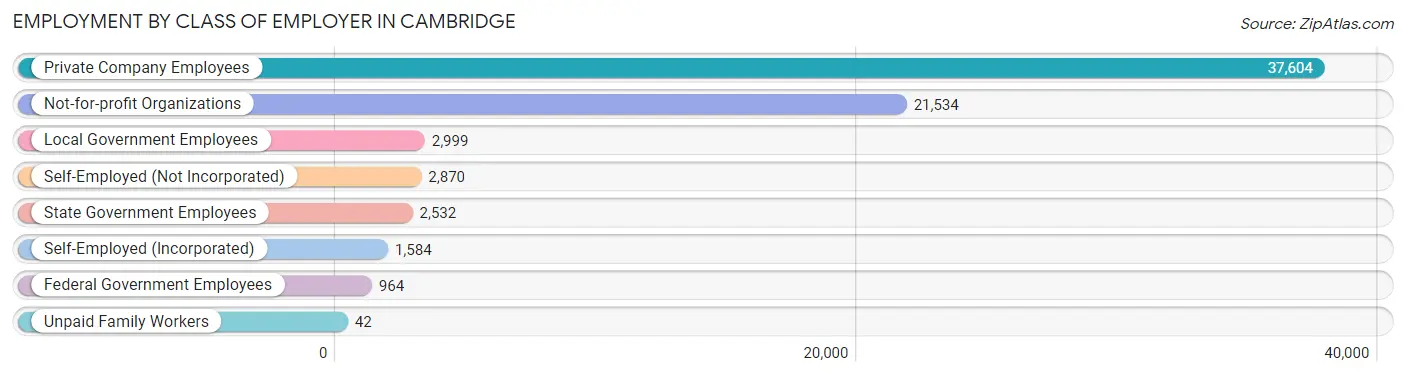
| Employer Class | # Employees | % Employees |
| Private Company Employees | 37,604 | 53.6% |
| Self-Employed (Incorporated) | 1,584 | 2.3% |
| Self-Employed (Not Incorporated) | 2,870 | 4.1% |
| Not-for-profit Organizations | 21,534 | 30.7% |
| Local Government Employees | 2,999 | 4.3% |
| State Government Employees | 2,532 | 3.6% |
| Federal Government Employees | 964 | 1.4% |
| Unpaid Family Workers | 42 | 0.1% |
| Total | 70,129 | 100.0% |
Employment Status by Age in Cambridge
According to the labor force statistics for Cambridge, out of the total population over 16 years of age (105,260), 69.8% or 73,471 individuals are in the labor force, with 3.3% or 2,425 of them unemployed. The age group with the highest labor force participation rate is 30 to 34 years, with 88.2% or 11,725 individuals in the labor force. Within the labor force, the 16 to 19 years age range has the highest percentage of unemployed individuals, with 12.8% or 302 of them being unemployed.
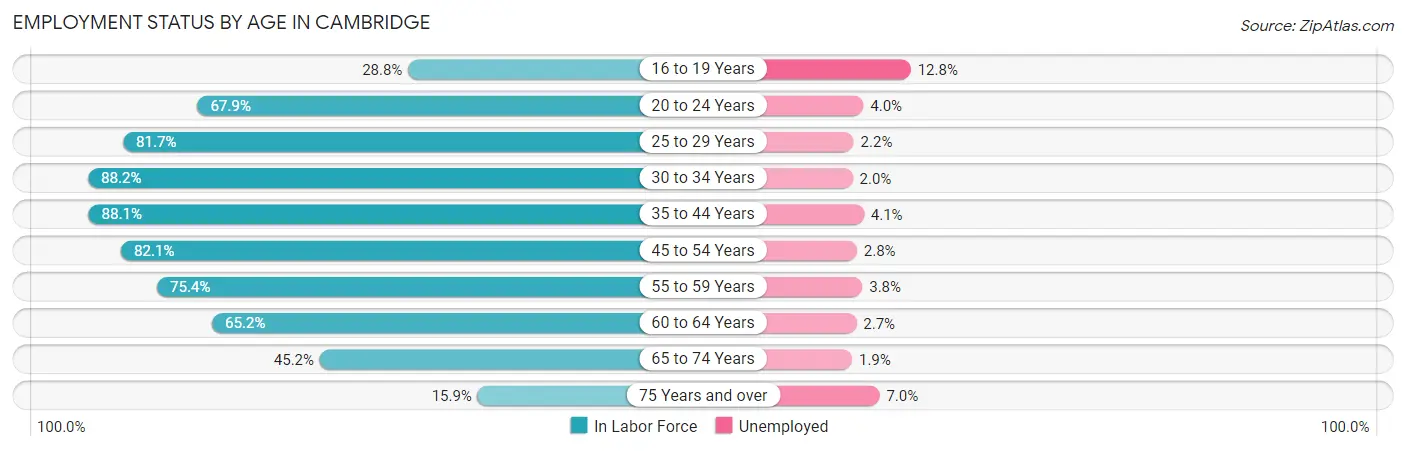
| Age Bracket | In Labor Force | Unemployed |
| 16 to 19 Years | 2,361 (28.8%) | 302 (12.8%) |
| 20 to 24 Years | 11,588 (67.9%) | 464 (4.0%) |
| 25 to 29 Years | 15,330 (81.7%) | 337 (2.2%) |
| 30 to 34 Years | 11,725 (88.2%) | 234 (2.0%) |
| 35 to 44 Years | 13,755 (88.1%) | 564 (4.1%) |
| 45 to 54 Years | 8,048 (82.1%) | 225 (2.8%) |
| 55 to 59 Years | 3,193 (75.4%) | 121 (3.8%) |
| 60 to 64 Years | 2,783 (65.2%) | 75 (2.7%) |
| 65 to 74 Years | 3,854 (45.2%) | 73 (1.9%) |
| 75 Years and over | 873 (15.9%) | 61 (7.0%) |
| Total | 73,471 (69.8%) | 2,425 (3.3%) |
Employment Status by Educational Attainment in Cambridge
According to labor force statistics for Cambridge, 83.1% of individuals (54,827) out of the total population between 25 and 64 years of age (65,977) are in the labor force, with 2.8% or 1,535 of them being unemployed. The group with the highest labor force participation rate are those with the educational attainment of bachelor's degree or higher, with 86.5% or 47,330 individuals in the labor force. Within the labor force, individuals with less than high school education have the highest percentage of unemployment, with 24.5% or 271 of them being unemployed.
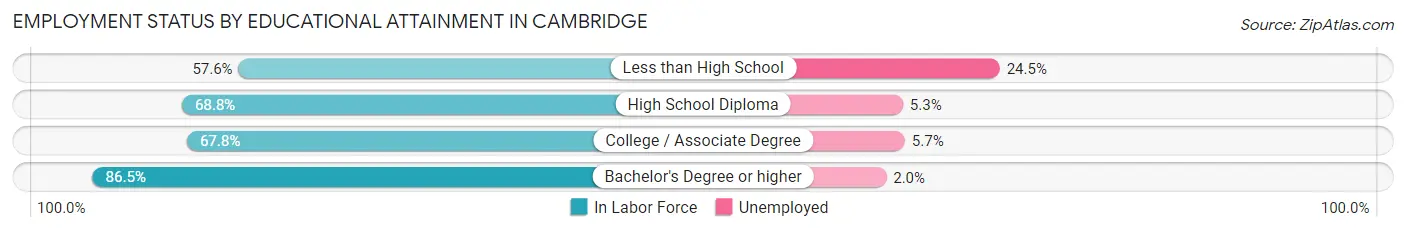
| Educational Attainment | In Labor Force | Unemployed |
| Less than High School | 1,106 (57.6%) | 471 (24.5%) |
| High School Diploma | 2,399 (68.8%) | 185 (5.3%) |
| College / Associate Degree | 3,968 (67.8%) | 334 (5.7%) |
| Bachelor's Degree or higher | 47,330 (86.5%) | 1,094 (2.0%) |
| Total | 54,827 (83.1%) | 1,847 (2.8%) |
Employment Occupations by Sex in Cambridge
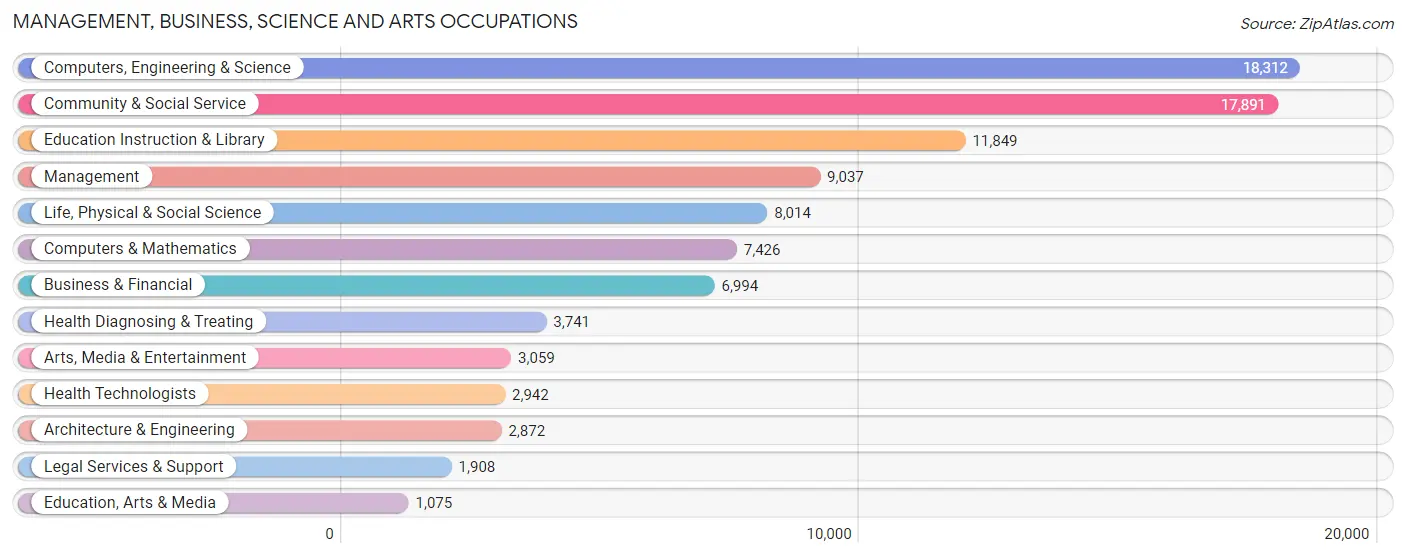
Management, Business, Science and Arts Occupations
The most common Management, Business, Science and Arts occupations in Cambridge are Computers, Engineering & Science (18,312 | 25.8%), Community & Social Service (17,891 | 25.2%), Education Instruction & Library (11,849 | 16.7%), Management (9,037 | 12.7%), and Life, Physical & Social Science (8,014 | 11.3%).
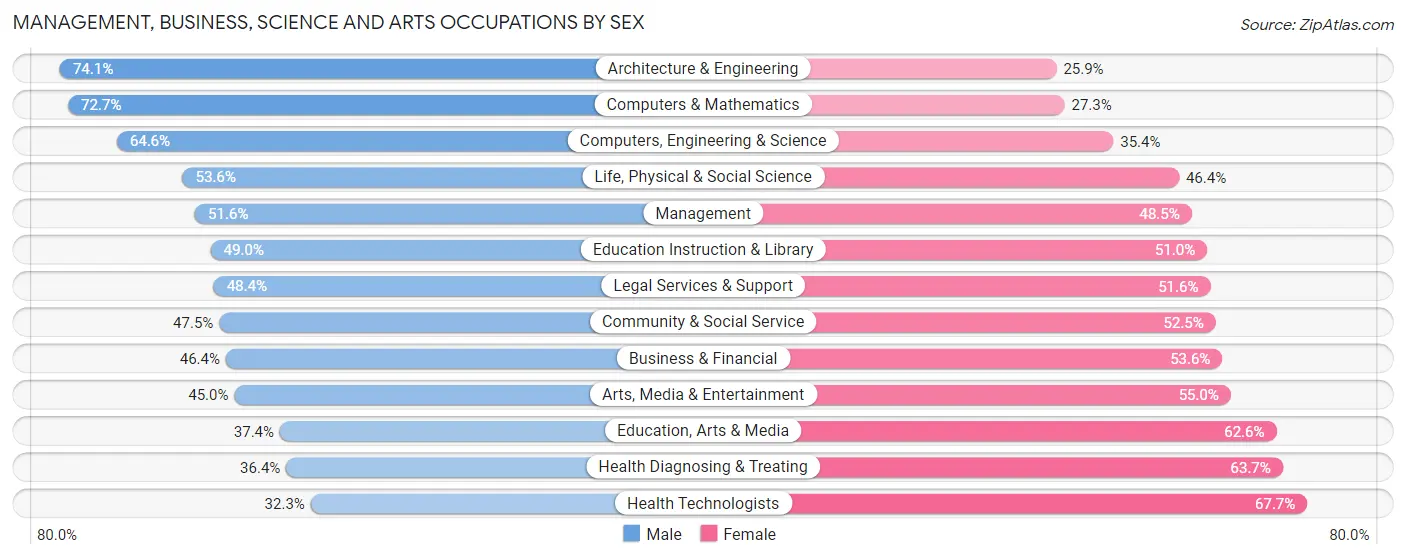
Management, Business, Science and Arts Occupations by Sex
Within the Management, Business, Science and Arts occupations in Cambridge, the most male-oriented occupations are Architecture & Engineering (74.1%), Computers & Mathematics (72.7%), and Computers, Engineering & Science (64.6%), while the most female-oriented occupations are Health Technologists (67.7%), Health Diagnosing & Treating (63.6%), and Education, Arts & Media (62.6%).
| Occupation | Male | Female |
| Management | 4,659 (51.5%) | 4,378 (48.4%) |
| Business & Financial | 3,247 (46.4%) | 3,747 (53.6%) |
| Computers, Engineering & Science | 11,829 (64.6%) | 6,483 (35.4%) |
| Computers & Mathematics | 5,402 (72.7%) | 2,024 (27.3%) |
| Architecture & Engineering | 2,128 (74.1%) | 744 (25.9%) |
| Life, Physical & Social Science | 4,299 (53.6%) | 3,715 (46.4%) |
| Community & Social Service | 8,504 (47.5%) | 9,387 (52.5%) |
| Education, Arts & Media | 402 (37.4%) | 673 (62.6%) |
| Legal Services & Support | 924 (48.4%) | 984 (51.6%) |
| Education Instruction & Library | 5,801 (49.0%) | 6,048 (51.0%) |
| Arts, Media & Entertainment | 1,377 (45.0%) | 1,682 (55.0%) |
| Health Diagnosing & Treating | 1,360 (36.3%) | 2,381 (63.6%) |
| Health Technologists | 949 (32.3%) | 1,993 (67.7%) |
| Total (Category) | 29,599 (52.9%) | 26,376 (47.1%) |
| Total (Overall) | 36,673 (51.7%) | 34,237 (48.3%) |
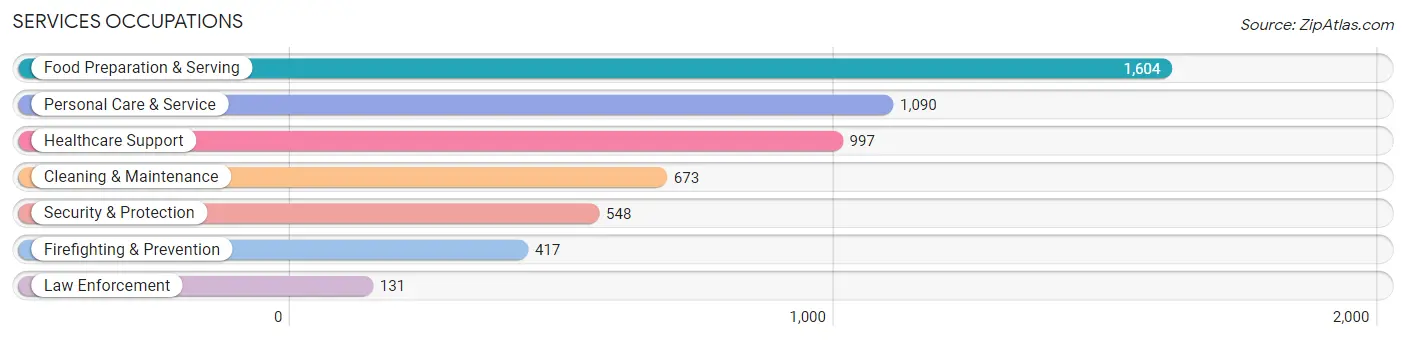
Services Occupations
The most common Services occupations in Cambridge are Food Preparation & Serving (1,604 | 2.3%), Personal Care & Service (1,090 | 1.5%), Healthcare Support (997 | 1.4%), Cleaning & Maintenance (673 | 0.9%), and Security & Protection (548 | 0.8%).
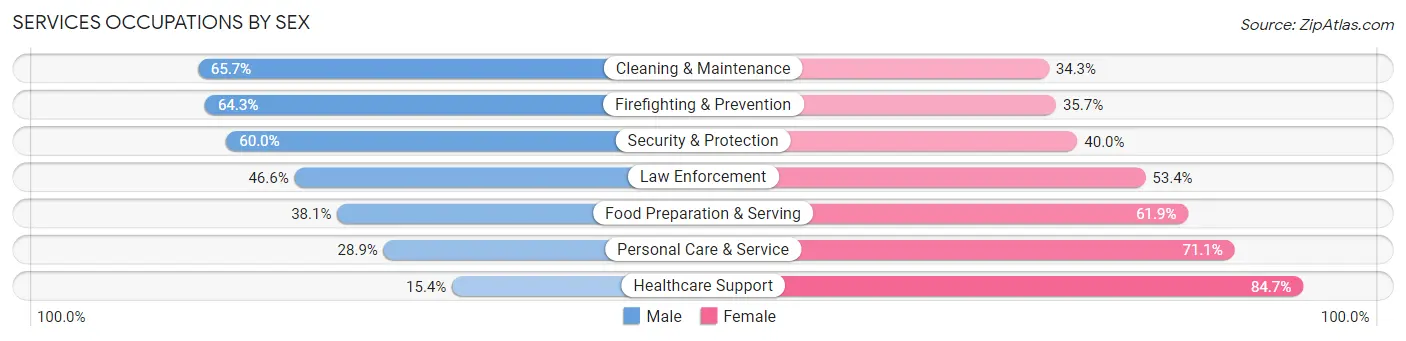
Services Occupations by Sex
Within the Services occupations in Cambridge, the most male-oriented occupations are Cleaning & Maintenance (65.7%), Firefighting & Prevention (64.3%), and Security & Protection (60.0%), while the most female-oriented occupations are Healthcare Support (84.7%), Personal Care & Service (71.1%), and Food Preparation & Serving (61.9%).
| Occupation | Male | Female |
| Healthcare Support | 153 (15.3%) | 844 (84.7%) |
| Security & Protection | 329 (60.0%) | 219 (40.0%) |
| Firefighting & Prevention | 268 (64.3%) | 149 (35.7%) |
| Law Enforcement | 61 (46.6%) | 70 (53.4%) |
| Food Preparation & Serving | 611 (38.1%) | 993 (61.9%) |
| Cleaning & Maintenance | 442 (65.7%) | 231 (34.3%) |
| Personal Care & Service | 315 (28.9%) | 775 (71.1%) |
| Total (Category) | 1,850 (37.7%) | 3,062 (62.3%) |
| Total (Overall) | 36,673 (51.7%) | 34,237 (48.3%) |
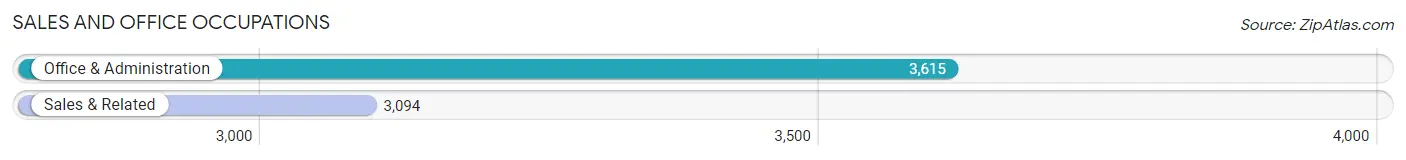
Sales and Office Occupations
The most common Sales and Office occupations in Cambridge are Office & Administration (3,615 | 5.1%), and Sales & Related (3,094 | 4.4%).
Sales and Office Occupations by Sex
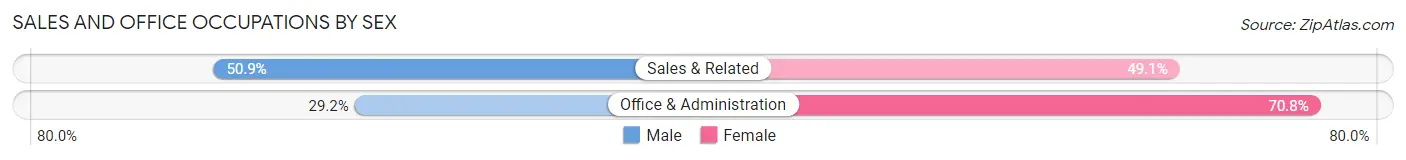
| Occupation | Male | Female |
| Sales & Related | 1,576 (50.9%) | 1,518 (49.1%) |
| Office & Administration | 1,057 (29.2%) | 2,558 (70.8%) |
| Total (Category) | 2,633 (39.3%) | 4,076 (60.8%) |
| Total (Overall) | 36,673 (51.7%) | 34,237 (48.3%) |
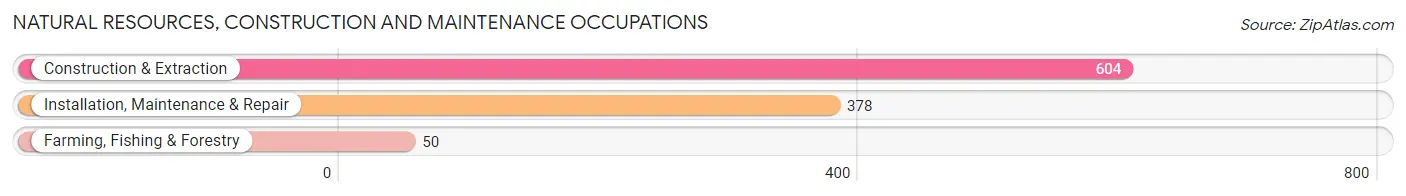
Natural Resources, Construction and Maintenance Occupations
The most common Natural Resources, Construction and Maintenance occupations in Cambridge are Construction & Extraction (604 | 0.9%), Installation, Maintenance & Repair (378 | 0.5%), and Farming, Fishing & Forestry (50 | 0.1%).
Natural Resources, Construction and Maintenance Occupations by Sex
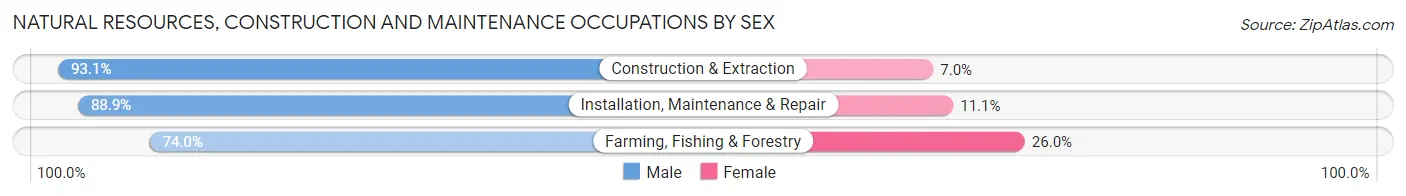
| Occupation | Male | Female |
| Farming, Fishing & Forestry | 37 (74.0%) | 13 (26.0%) |
| Construction & Extraction | 562 (93.0%) | 42 (7.0%) |
| Installation, Maintenance & Repair | 336 (88.9%) | 42 (11.1%) |
| Total (Category) | 935 (90.6%) | 97 (9.4%) |
| Total (Overall) | 36,673 (51.7%) | 34,237 (48.3%) |
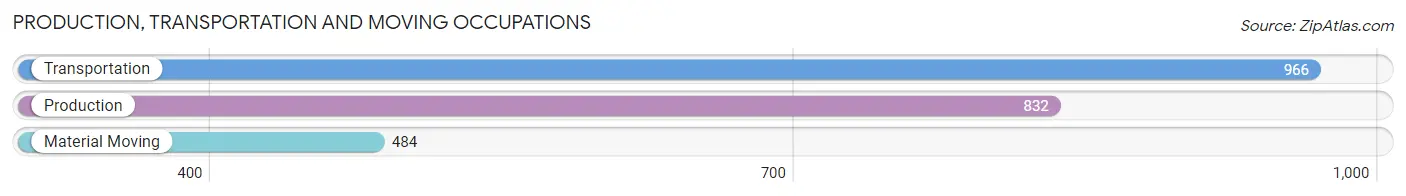
Production, Transportation and Moving Occupations
The most common Production, Transportation and Moving occupations in Cambridge are Transportation (966 | 1.4%), Production (832 | 1.2%), and Material Moving (484 | 0.7%).
Production, Transportation and Moving Occupations by Sex
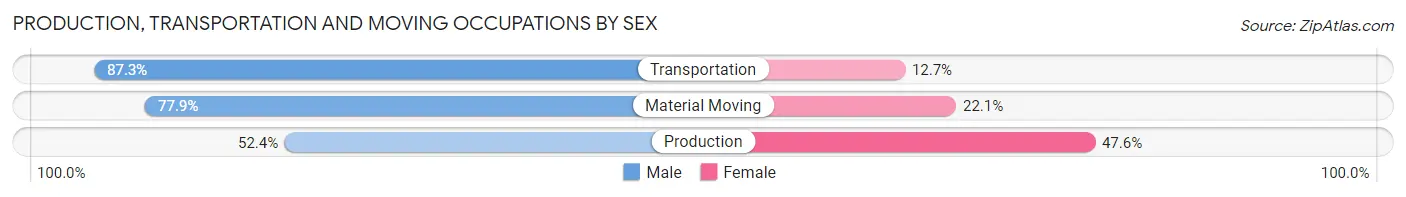
| Occupation | Male | Female |
| Production | 436 (52.4%) | 396 (47.6%) |
| Transportation | 843 (87.3%) | 123 (12.7%) |
| Material Moving | 377 (77.9%) | 107 (22.1%) |
| Total (Category) | 1,656 (72.6%) | 626 (27.4%) |
| Total (Overall) | 36,673 (51.7%) | 34,237 (48.3%) |
Employment Industries by Sex in Cambridge
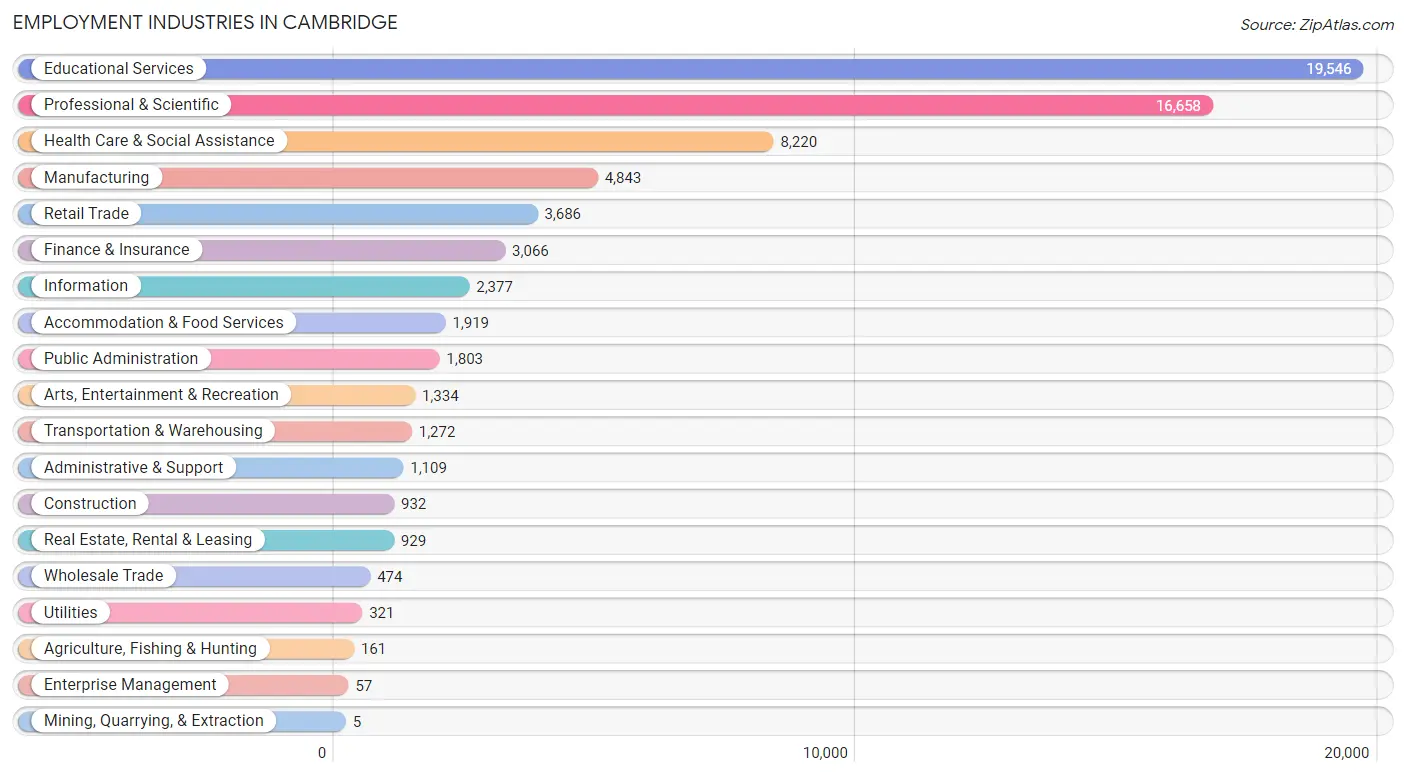
Employment Industries in Cambridge
The major employment industries in Cambridge include Educational Services (19,546 | 27.6%), Professional & Scientific (16,658 | 23.5%), Health Care & Social Assistance (8,220 | 11.6%), Manufacturing (4,843 | 6.8%), and Retail Trade (3,686 | 5.2%).
Employment Industries by Sex in Cambridge
The Cambridge industries that see more men than women are Mining, Quarrying, & Extraction (100.0%), Transportation & Warehousing (81.0%), and Construction (76.6%), whereas the industries that tend to have a higher number of women are Health Care & Social Assistance (71.3%), Enterprise Management (57.9%), and Accommodation & Food Services (55.6%).
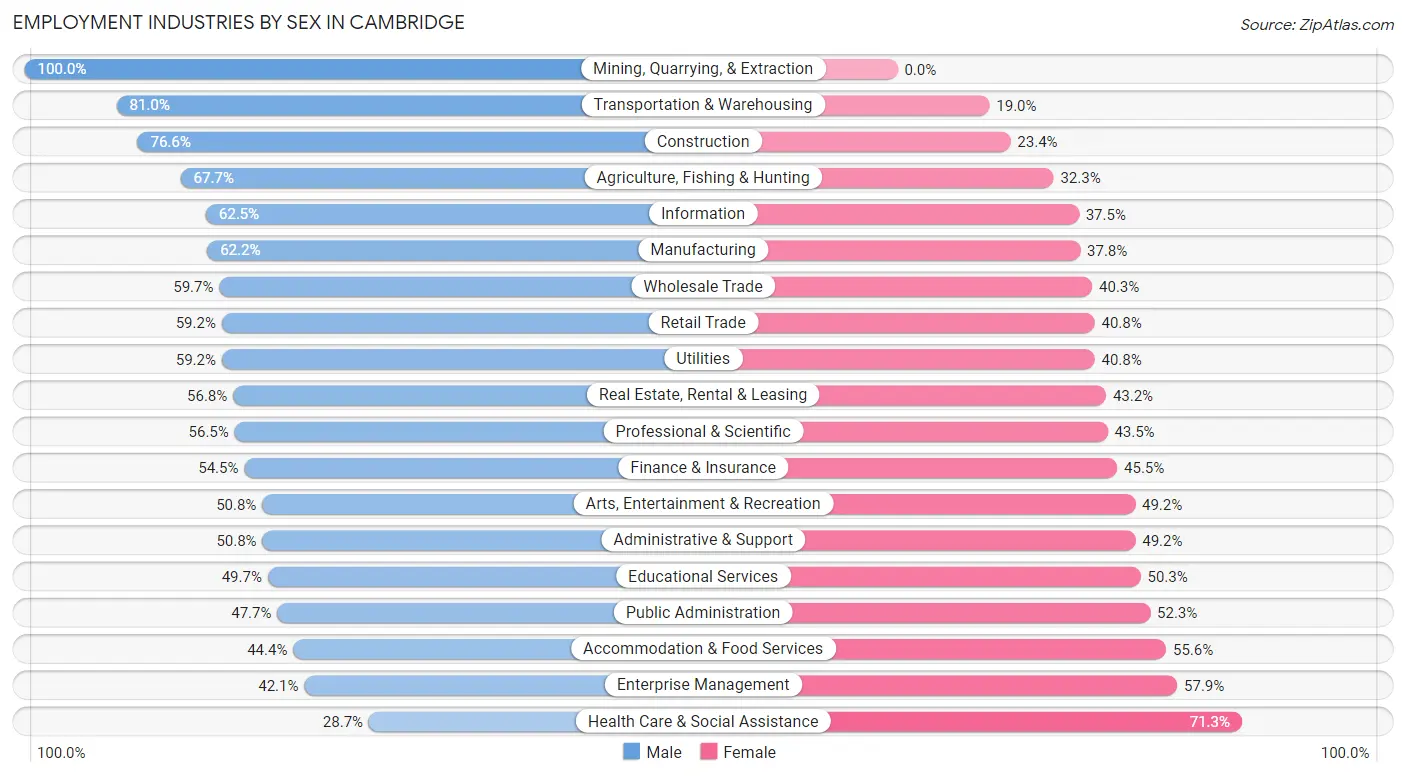
| Industry | Male | Female |
| Agriculture, Fishing & Hunting | 109 (67.7%) | 52 (32.3%) |
| Mining, Quarrying, & Extraction | 5 (100.0%) | 0 (0.0%) |
| Construction | 714 (76.6%) | 218 (23.4%) |
| Manufacturing | 3,012 (62.2%) | 1,831 (37.8%) |
| Wholesale Trade | 283 (59.7%) | 191 (40.3%) |
| Retail Trade | 2,182 (59.2%) | 1,504 (40.8%) |
| Transportation & Warehousing | 1,030 (81.0%) | 242 (19.0%) |
| Utilities | 190 (59.2%) | 131 (40.8%) |
| Information | 1,485 (62.5%) | 892 (37.5%) |
| Finance & Insurance | 1,672 (54.5%) | 1,394 (45.5%) |
| Real Estate, Rental & Leasing | 528 (56.8%) | 401 (43.2%) |
| Professional & Scientific | 9,416 (56.5%) | 7,242 (43.5%) |
| Enterprise Management | 24 (42.1%) | 33 (57.9%) |
| Administrative & Support | 563 (50.8%) | 546 (49.2%) |
| Educational Services | 9,709 (49.7%) | 9,837 (50.3%) |
| Health Care & Social Assistance | 2,362 (28.7%) | 5,858 (71.3%) |
| Arts, Entertainment & Recreation | 678 (50.8%) | 656 (49.2%) |
| Accommodation & Food Services | 852 (44.4%) | 1,067 (55.6%) |
| Public Administration | 860 (47.7%) | 943 (52.3%) |
| Total | 36,673 (51.7%) | 34,237 (48.3%) |
Education in Cambridge
School Enrollment in Cambridge
The most common levels of schooling among the 39,447 students in Cambridge are college / undergraduate (16,549 | 41.9%), graduate / professional (11,627 | 29.5%), and high school (3,043 | 7.7%).
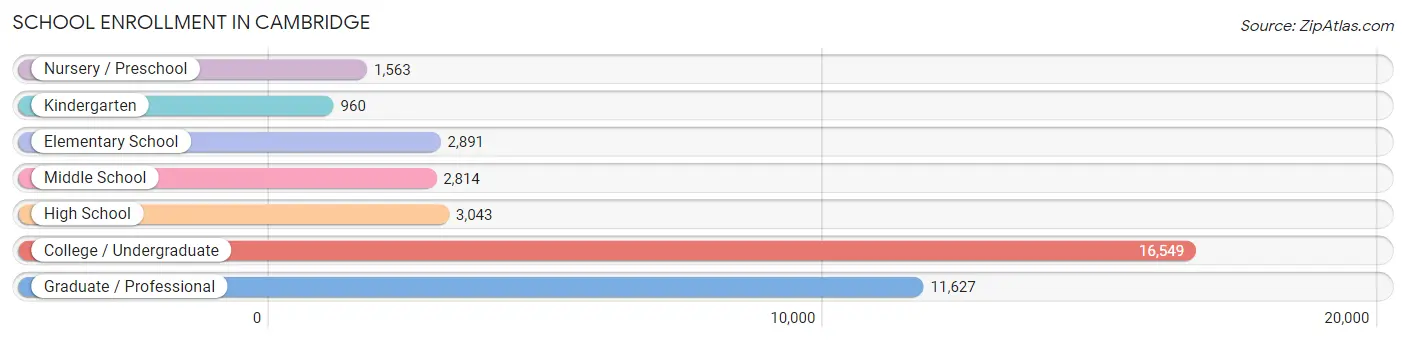
| School Level | # Students | % Students |
| Nursery / Preschool | 1,563 | 4.0% |
| Kindergarten | 960 | 2.4% |
| Elementary School | 2,891 | 7.3% |
| Middle School | 2,814 | 7.1% |
| High School | 3,043 | 7.7% |
| College / Undergraduate | 16,549 | 41.9% |
| Graduate / Professional | 11,627 | 29.5% |
| Total | 39,447 | 100.0% |
School Enrollment by Age by Funding Source in Cambridge
Out of a total of 39,447 students who are enrolled in schools in Cambridge, 26,745 (67.8%) attend a private institution, while the remaining 12,702 (32.2%) are enrolled in public schools. The age group of 25 to 34 year olds has the highest likelihood of being enrolled in private schools, with 7,699 (86.4% in the age bracket) enrolled. Conversely, the age group of 5 to 9 year old has the lowest likelihood of being enrolled in a private school, with 3,018 (81.7% in the age bracket) attending a public institution.
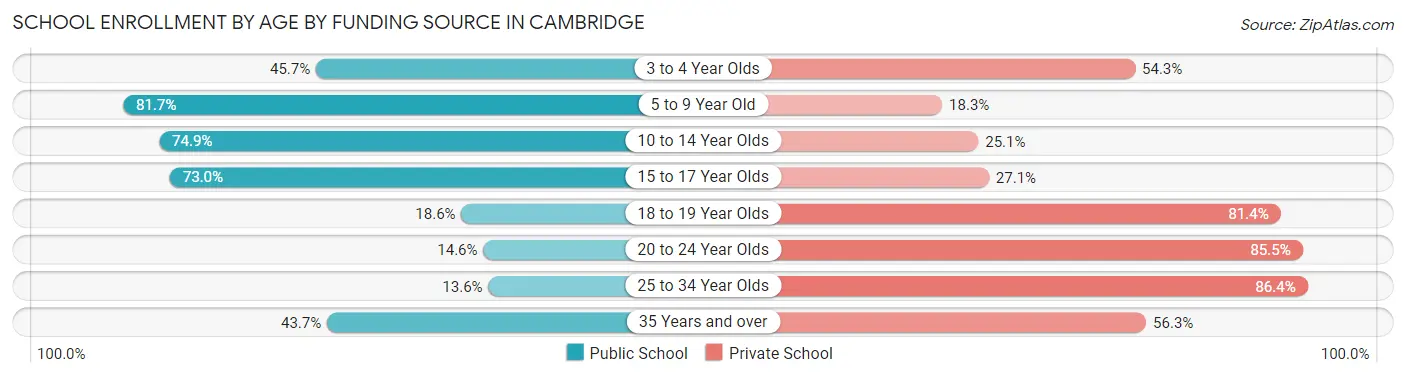
| Age Bracket | Public School | Private School |
| 3 to 4 Year Olds | 663 (45.7%) | 787 (54.3%) |
| 5 to 9 Year Old | 3,018 (81.7%) | 678 (18.3%) |
| 10 to 14 Year Olds | 2,490 (74.9%) | 833 (25.1%) |
| 15 to 17 Year Olds | 1,653 (73.0%) | 613 (27.1%) |
| 18 to 19 Year Olds | 1,192 (18.6%) | 5,202 (81.4%) |
| 20 to 24 Year Olds | 1,692 (14.5%) | 9,939 (85.5%) |
| 25 to 34 Year Olds | 1,213 (13.6%) | 7,699 (86.4%) |
| 35 Years and over | 775 (43.7%) | 1,000 (56.3%) |
| Total | 12,702 (32.2%) | 26,745 (67.8%) |
Educational Attainment by Field of Study in Cambridge
Social sciences (10,804 | 14.9%), engineering (8,354 | 11.5%), bio, nature & agricultural (7,384 | 10.2%), computers & mathematics (6,151 | 8.5%), and business (5,914 | 8.1%) are the most common fields of study among 72,675 individuals in Cambridge who have obtained a bachelor's degree or higher.
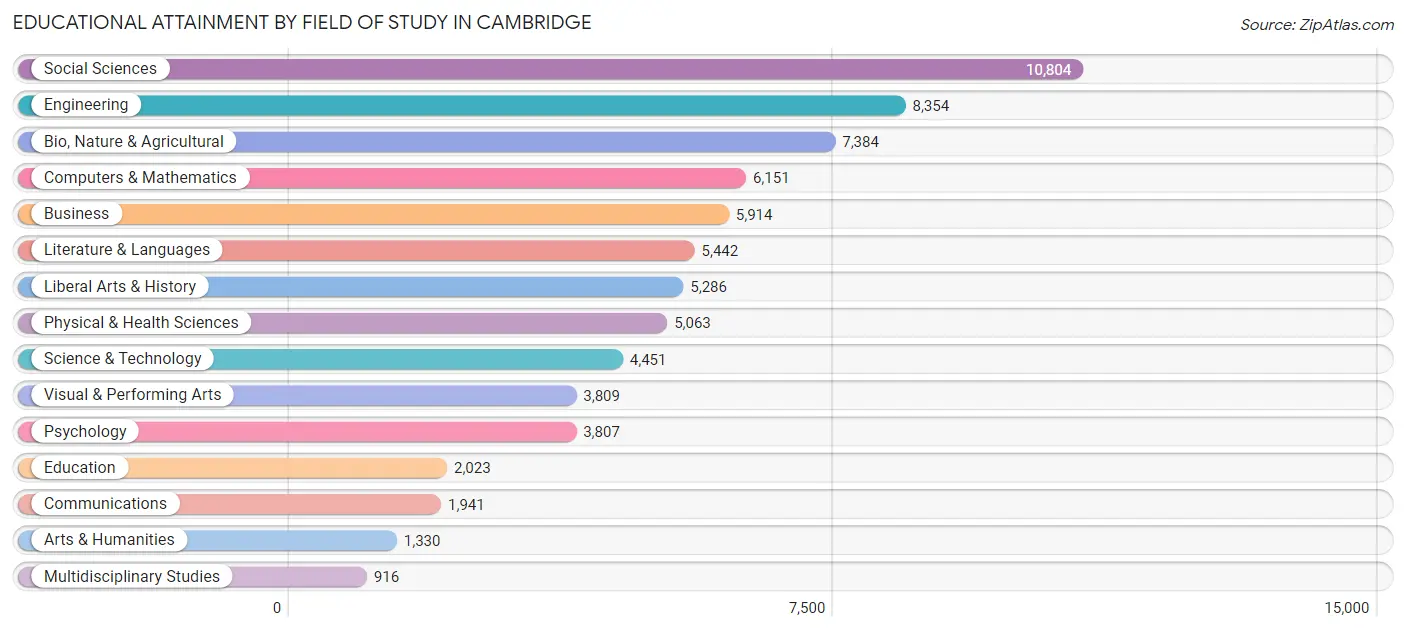
| Field of Study | # Graduates | % Graduates |
| Computers & Mathematics | 6,151 | 8.5% |
| Bio, Nature & Agricultural | 7,384 | 10.2% |
| Physical & Health Sciences | 5,063 | 7.0% |
| Psychology | 3,807 | 5.2% |
| Social Sciences | 10,804 | 14.9% |
| Engineering | 8,354 | 11.5% |
| Multidisciplinary Studies | 916 | 1.3% |
| Science & Technology | 4,451 | 6.1% |
| Business | 5,914 | 8.1% |
| Education | 2,023 | 2.8% |
| Literature & Languages | 5,442 | 7.5% |
| Liberal Arts & History | 5,286 | 7.3% |
| Visual & Performing Arts | 3,809 | 5.2% |
| Communications | 1,941 | 2.7% |
| Arts & Humanities | 1,330 | 1.8% |
| Total | 72,675 | 100.0% |
Transportation & Commute in Cambridge
Vehicle Availability by Sex in Cambridge
The most prevalent vehicle ownership categories in Cambridge are males with 1 vehicle (15,951, accounting for 48.3%) and females with 1 vehicle (14,528, making up 51.7%).
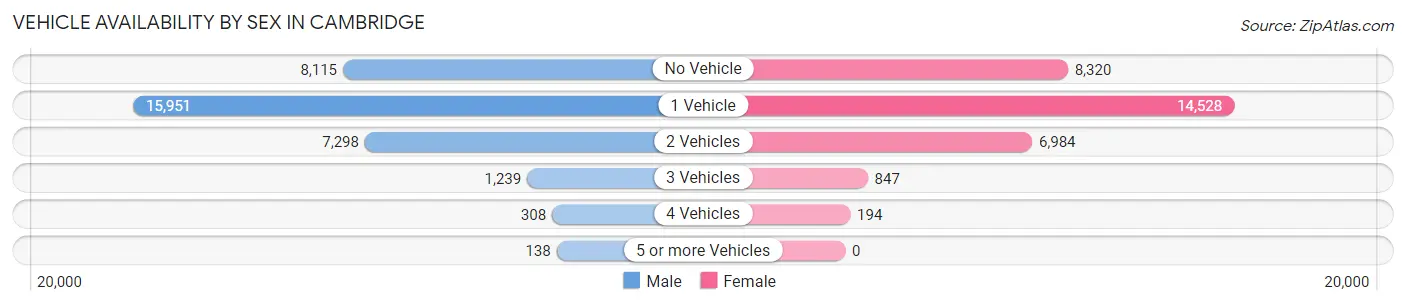
| Vehicles Available | Male | Female |
| No Vehicle | 8,115 (24.5%) | 8,320 (27.0%) |
| 1 Vehicle | 15,951 (48.3%) | 14,528 (47.1%) |
| 2 Vehicles | 7,298 (22.1%) | 6,984 (22.6%) |
| 3 Vehicles | 1,239 (3.7%) | 847 (2.7%) |
| 4 Vehicles | 308 (0.9%) | 194 (0.6%) |
| 5 or more Vehicles | 138 (0.4%) | 0 (0.0%) |
| Total | 33,049 (100.0%) | 30,873 (100.0%) |
Commute Time in Cambridge
The most frequently occuring commute durations in Cambridge are 30 to 34 minutes (8,459 commuters, 16.1%), 15 to 19 minutes (7,748 commuters, 14.8%), and 20 to 24 minutes (7,545 commuters, 14.4%).
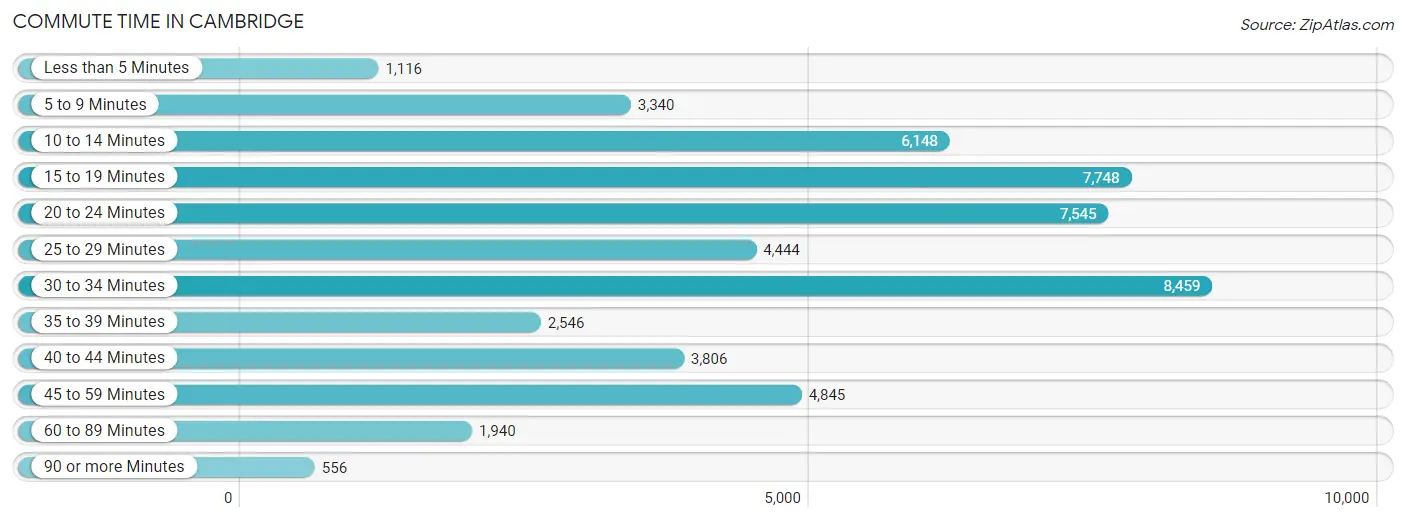
| Commute Time | # Commuters | % Commuters |
| Less than 5 Minutes | 1,116 | 2.1% |
| 5 to 9 Minutes | 3,340 | 6.4% |
| 10 to 14 Minutes | 6,148 | 11.7% |
| 15 to 19 Minutes | 7,748 | 14.8% |
| 20 to 24 Minutes | 7,545 | 14.4% |
| 25 to 29 Minutes | 4,444 | 8.5% |
| 30 to 34 Minutes | 8,459 | 16.1% |
| 35 to 39 Minutes | 2,546 | 4.9% |
| 40 to 44 Minutes | 3,806 | 7.2% |
| 45 to 59 Minutes | 4,845 | 9.2% |
| 60 to 89 Minutes | 1,940 | 3.7% |
| 90 or more Minutes | 556 | 1.1% |
Commute Time by Sex in Cambridge
The most common commute times in Cambridge are 30 to 34 minutes (4,399 commuters, 15.9%) for males and 30 to 34 minutes (4,060 commuters, 16.3%) for females.
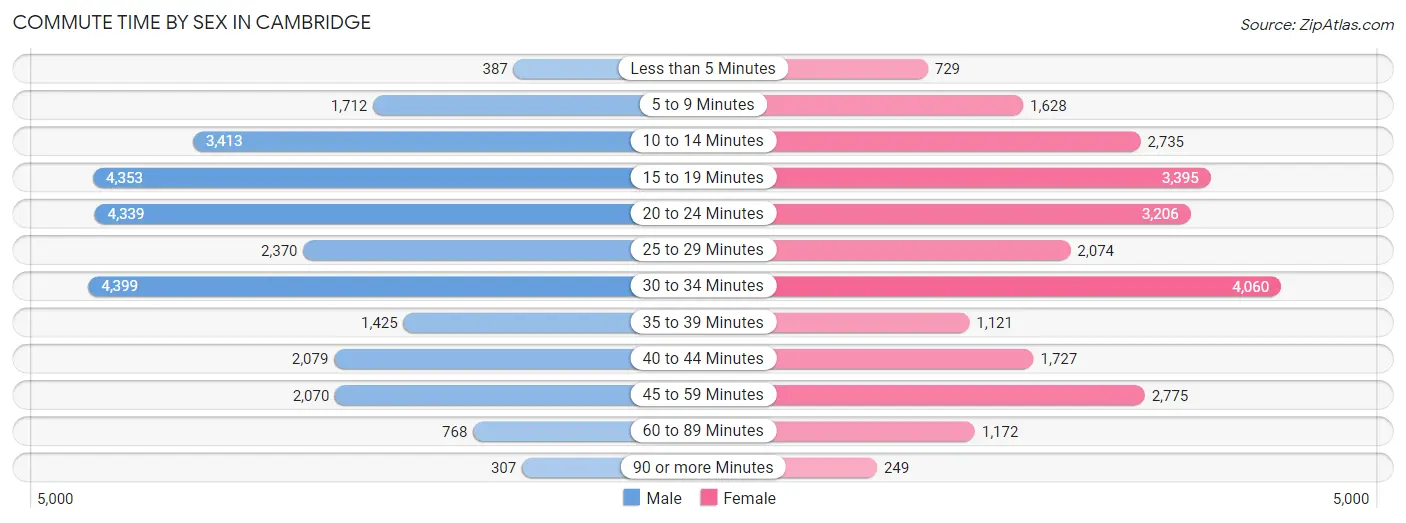
| Commute Time | Male | Female |
| Less than 5 Minutes | 387 (1.4%) | 729 (2.9%) |
| 5 to 9 Minutes | 1,712 (6.2%) | 1,628 (6.6%) |
| 10 to 14 Minutes | 3,413 (12.4%) | 2,735 (11.0%) |
| 15 to 19 Minutes | 4,353 (15.8%) | 3,395 (13.7%) |
| 20 to 24 Minutes | 4,339 (15.7%) | 3,206 (12.9%) |
| 25 to 29 Minutes | 2,370 (8.6%) | 2,074 (8.3%) |
| 30 to 34 Minutes | 4,399 (15.9%) | 4,060 (16.3%) |
| 35 to 39 Minutes | 1,425 (5.2%) | 1,121 (4.5%) |
| 40 to 44 Minutes | 2,079 (7.5%) | 1,727 (6.9%) |
| 45 to 59 Minutes | 2,070 (7.5%) | 2,775 (11.2%) |
| 60 to 89 Minutes | 768 (2.8%) | 1,172 (4.7%) |
| 90 or more Minutes | 307 (1.1%) | 249 (1.0%) |
Time of Departure to Work by Sex in Cambridge
The most frequent times of departure to work in Cambridge are 8:00 AM to 8:29 AM (5,532, 20.0%) for males and 8:00 AM to 8:29 AM (4,870, 19.6%) for females.
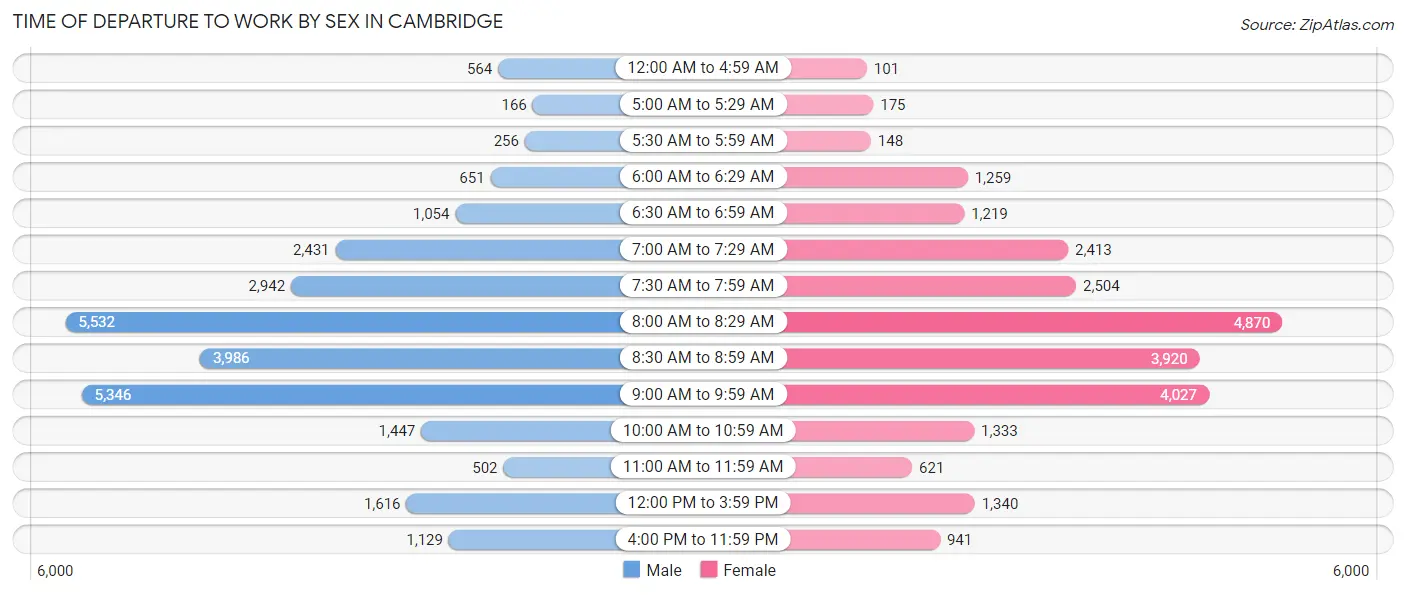
| Time of Departure | Male | Female |
| 12:00 AM to 4:59 AM | 564 (2.0%) | 101 (0.4%) |
| 5:00 AM to 5:29 AM | 166 (0.6%) | 175 (0.7%) |
| 5:30 AM to 5:59 AM | 256 (0.9%) | 148 (0.6%) |
| 6:00 AM to 6:29 AM | 651 (2.4%) | 1,259 (5.1%) |
| 6:30 AM to 6:59 AM | 1,054 (3.8%) | 1,219 (4.9%) |
| 7:00 AM to 7:29 AM | 2,431 (8.8%) | 2,413 (9.7%) |
| 7:30 AM to 7:59 AM | 2,942 (10.6%) | 2,504 (10.1%) |
| 8:00 AM to 8:29 AM | 5,532 (20.0%) | 4,870 (19.6%) |
| 8:30 AM to 8:59 AM | 3,986 (14.4%) | 3,920 (15.8%) |
| 9:00 AM to 9:59 AM | 5,346 (19.4%) | 4,027 (16.2%) |
| 10:00 AM to 10:59 AM | 1,447 (5.2%) | 1,333 (5.4%) |
| 11:00 AM to 11:59 AM | 502 (1.8%) | 621 (2.5%) |
| 12:00 PM to 3:59 PM | 1,616 (5.9%) | 1,340 (5.4%) |
| 4:00 PM to 11:59 PM | 1,129 (4.1%) | 941 (3.8%) |
| Total | 27,622 (100.0%) | 24,871 (100.0%) |
Housing Occupancy in Cambridge
Occupancy by Ownership in Cambridge
Of the total 49,475 dwellings in Cambridge, owner-occupied units account for 16,605 (33.6%), while renter-occupied units make up 32,870 (66.4%).
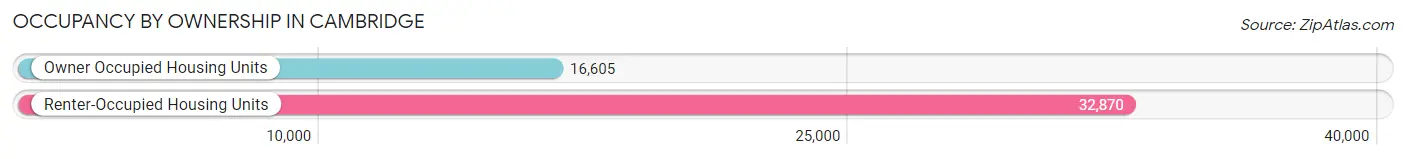
| Occupancy | # Housing Units | % Housing Units |
| Owner Occupied Housing Units | 16,605 | 33.6% |
| Renter-Occupied Housing Units | 32,870 | 66.4% |
| Total Occupied Housing Units | 49,475 | 100.0% |
Occupancy by Household Size in Cambridge
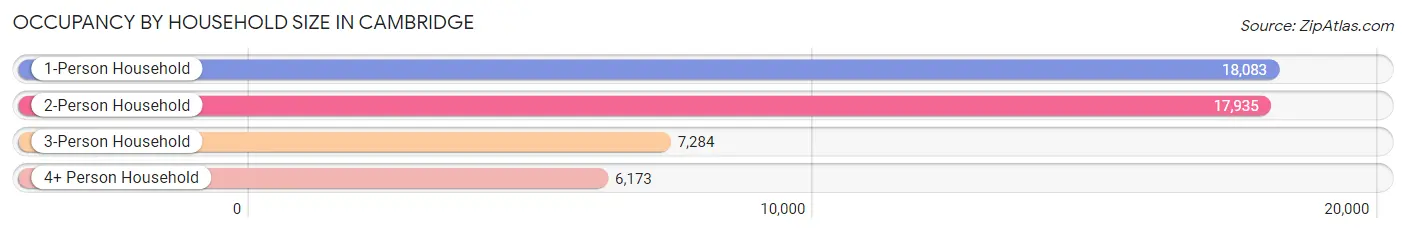
| Household Size | # Housing Units | % Housing Units |
| 1-Person Household | 18,083 | 36.5% |
| 2-Person Household | 17,935 | 36.2% |
| 3-Person Household | 7,284 | 14.7% |
| 4+ Person Household | 6,173 | 12.5% |
| Total Housing Units | 49,475 | 100.0% |
Occupancy by Ownership by Household Size in Cambridge
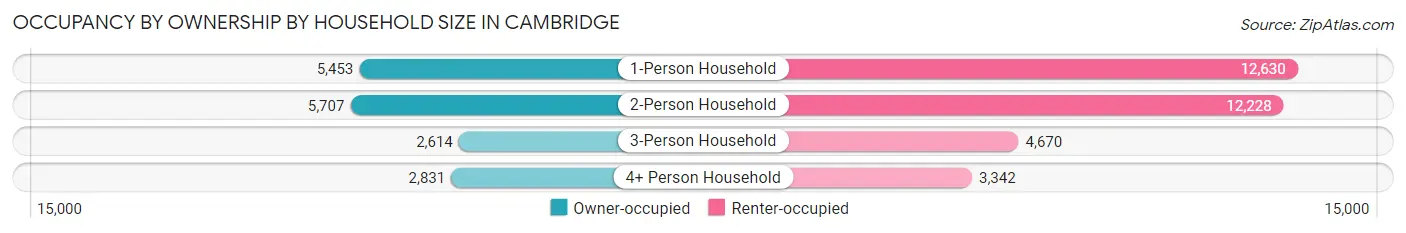
| Household Size | Owner-occupied | Renter-occupied |
| 1-Person Household | 5,453 (30.2%) | 12,630 (69.8%) |
| 2-Person Household | 5,707 (31.8%) | 12,228 (68.2%) |
| 3-Person Household | 2,614 (35.9%) | 4,670 (64.1%) |
| 4+ Person Household | 2,831 (45.9%) | 3,342 (54.1%) |
| Total Housing Units | 16,605 (33.6%) | 32,870 (66.4%) |
Occupancy by Educational Attainment in Cambridge
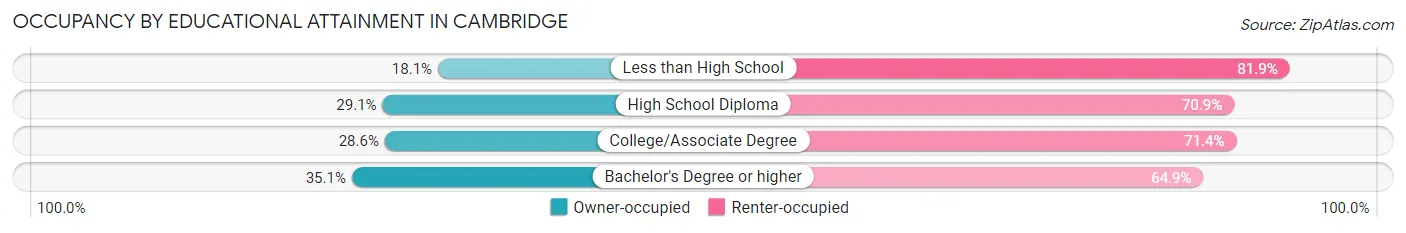
| Household Size | Owner-occupied | Renter-occupied |
| Less than High School | 324 (18.1%) | 1,470 (81.9%) |
| High School Diploma | 770 (29.1%) | 1,880 (70.9%) |
| College/Associate Degree | 1,366 (28.6%) | 3,411 (71.4%) |
| Bachelor's Degree or higher | 14,145 (35.1%) | 26,109 (64.9%) |
Occupancy by Age of Householder in Cambridge
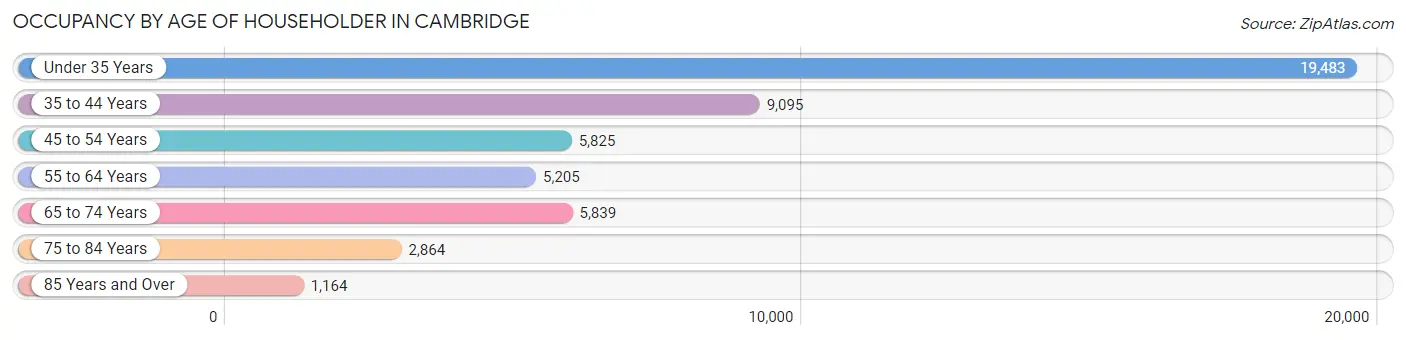
| Age Bracket | # Households | % Households |
| Under 35 Years | 19,483 | 39.4% |
| 35 to 44 Years | 9,095 | 18.4% |
| 45 to 54 Years | 5,825 | 11.8% |
| 55 to 64 Years | 5,205 | 10.5% |
| 65 to 74 Years | 5,839 | 11.8% |
| 75 to 84 Years | 2,864 | 5.8% |
| 85 Years and Over | 1,164 | 2.4% |
| Total | 49,475 | 100.0% |
Housing Finances in Cambridge
Median Income by Occupancy in Cambridge
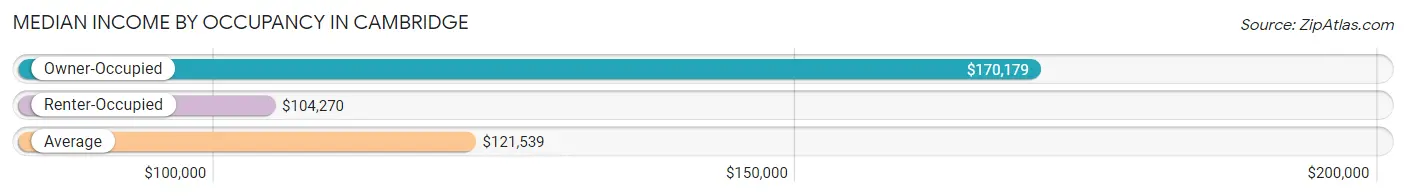
| Occupancy Type | # Households | Median Income |
| Owner-Occupied | 16,605 (33.6%) | $170,179 |
| Renter-Occupied | 32,870 (66.4%) | $104,270 |
| Average | 49,475 (100.0%) | $121,539 |
Occupancy by Householder Income Bracket in Cambridge
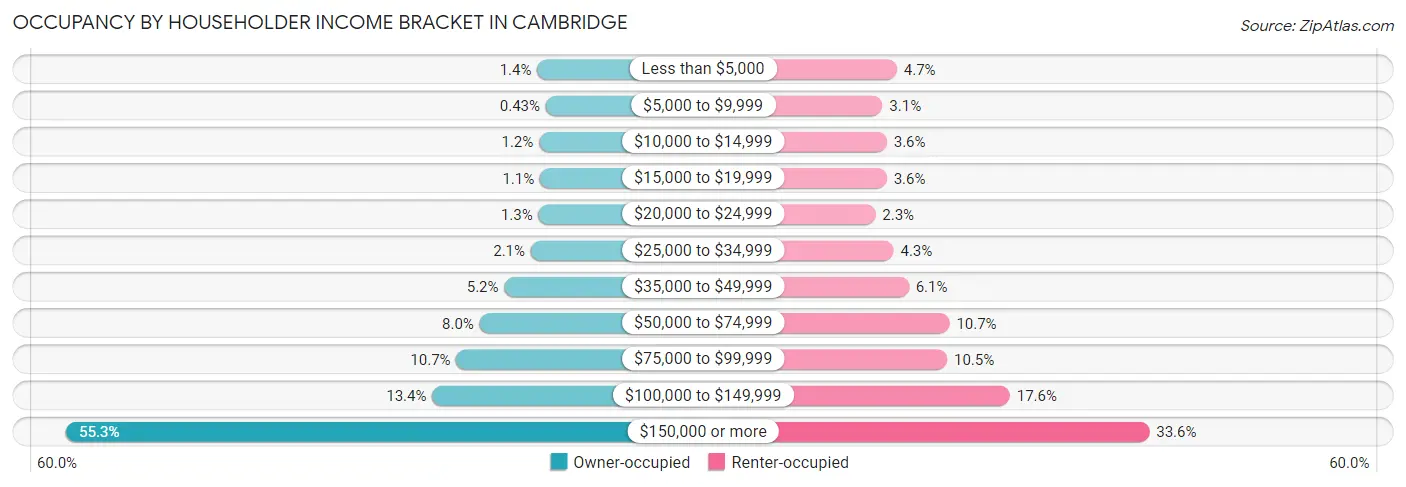
| Income Bracket | Owner-occupied | Renter-occupied |
| Less than $5,000 | 234 (1.4%) | 1,551 (4.7%) |
| $5,000 to $9,999 | 72 (0.4%) | 1,010 (3.1%) |
| $10,000 to $14,999 | 200 (1.2%) | 1,172 (3.6%) |
| $15,000 to $19,999 | 181 (1.1%) | 1,171 (3.6%) |
| $20,000 to $24,999 | 209 (1.3%) | 744 (2.3%) |
| $25,000 to $34,999 | 356 (2.1%) | 1,427 (4.3%) |
| $35,000 to $49,999 | 858 (5.2%) | 1,997 (6.1%) |
| $50,000 to $74,999 | 1,327 (8.0%) | 3,528 (10.7%) |
| $75,000 to $99,999 | 1,768 (10.6%) | 3,438 (10.5%) |
| $100,000 to $149,999 | 2,226 (13.4%) | 5,796 (17.6%) |
| $150,000 or more | 9,174 (55.2%) | 11,036 (33.6%) |
| Total | 16,605 (100.0%) | 32,870 (100.0%) |
Monthly Housing Cost Tiers in Cambridge
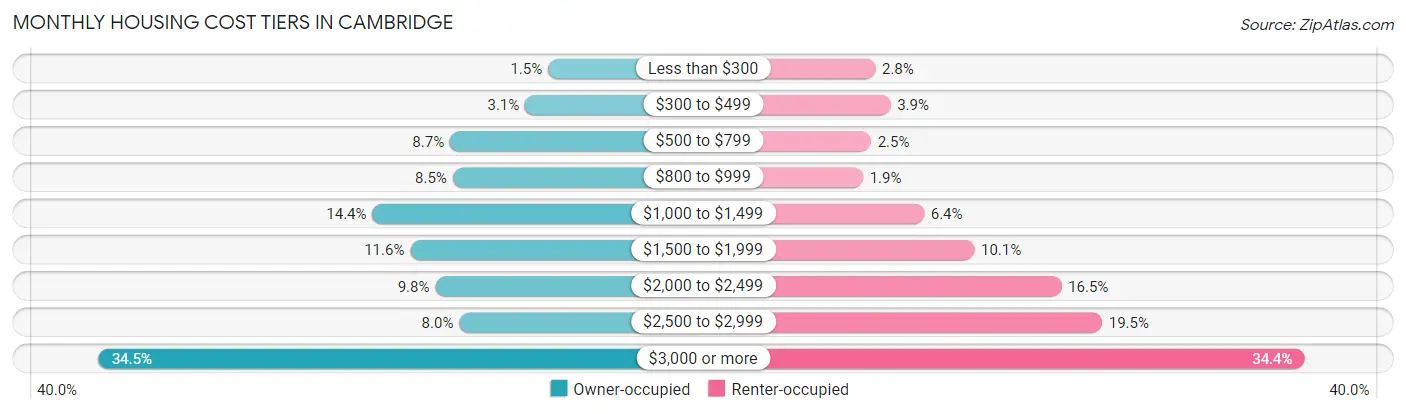
| Monthly Cost | Owner-occupied | Renter-occupied |
| Less than $300 | 240 (1.5%) | 909 (2.8%) |
| $300 to $499 | 521 (3.1%) | 1,280 (3.9%) |
| $500 to $799 | 1,440 (8.7%) | 806 (2.5%) |
| $800 to $999 | 1,406 (8.5%) | 612 (1.9%) |
| $1,000 to $1,499 | 2,390 (14.4%) | 2,089 (6.4%) |
| $1,500 to $1,999 | 1,926 (11.6%) | 3,307 (10.1%) |
| $2,000 to $2,499 | 1,619 (9.8%) | 5,418 (16.5%) |
| $2,500 to $2,999 | 1,327 (8.0%) | 6,399 (19.5%) |
| $3,000 or more | 5,736 (34.5%) | 11,301 (34.4%) |
| Total | 16,605 (100.0%) | 32,870 (100.0%) |
Physical Housing Characteristics in Cambridge
Housing Structures in Cambridge
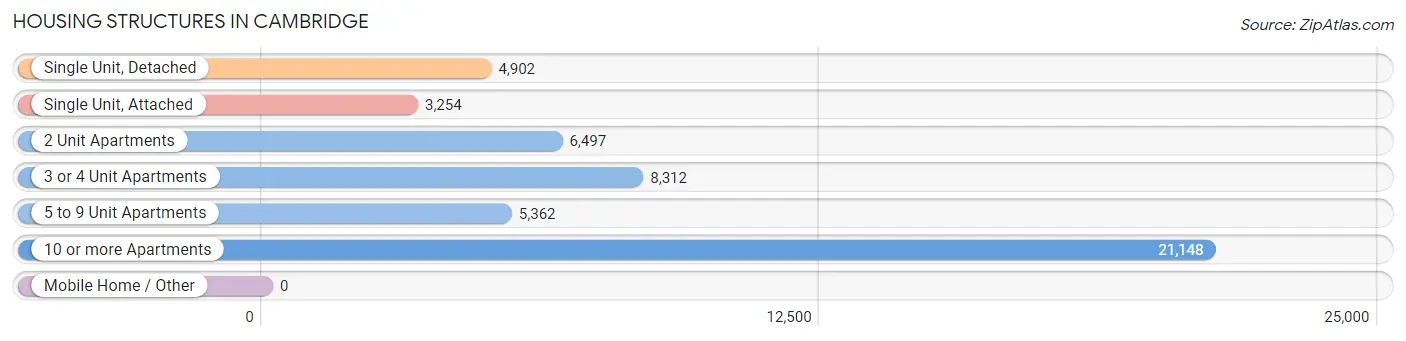
| Structure Type | # Housing Units | % Housing Units |
| Single Unit, Detached | 4,902 | 9.9% |
| Single Unit, Attached | 3,254 | 6.6% |
| 2 Unit Apartments | 6,497 | 13.1% |
| 3 or 4 Unit Apartments | 8,312 | 16.8% |
| 5 to 9 Unit Apartments | 5,362 | 10.8% |
| 10 or more Apartments | 21,148 | 42.7% |
| Mobile Home / Other | 0 | 0.0% |
| Total | 49,475 | 100.0% |
Housing Structures by Occupancy in Cambridge
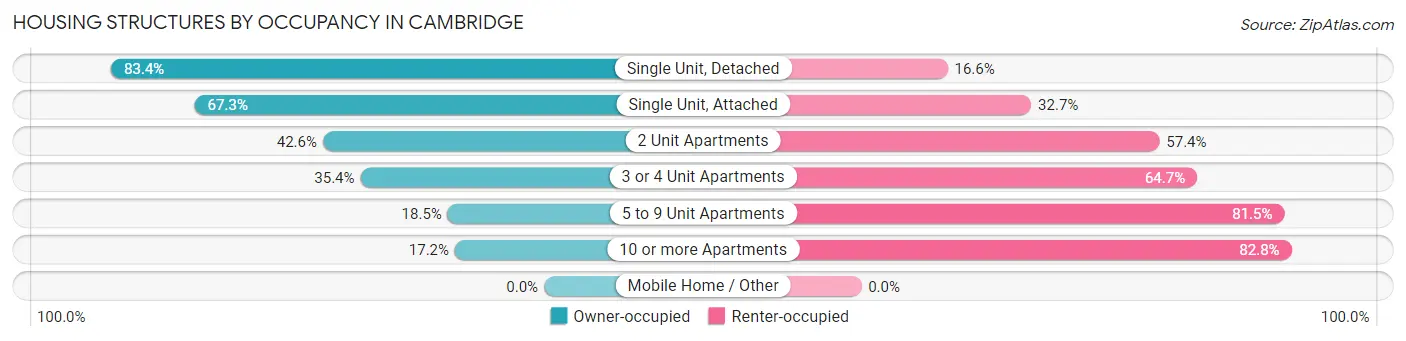
| Structure Type | Owner-occupied | Renter-occupied |
| Single Unit, Detached | 4,087 (83.4%) | 815 (16.6%) |
| Single Unit, Attached | 2,189 (67.3%) | 1,065 (32.7%) |
| 2 Unit Apartments | 2,767 (42.6%) | 3,730 (57.4%) |
| 3 or 4 Unit Apartments | 2,938 (35.3%) | 5,374 (64.6%) |
| 5 to 9 Unit Apartments | 994 (18.5%) | 4,368 (81.5%) |
| 10 or more Apartments | 3,630 (17.2%) | 17,518 (82.8%) |
| Mobile Home / Other | 0 (0.0%) | 0 (0.0%) |
| Total | 16,605 (33.6%) | 32,870 (66.4%) |
Housing Structures by Number of Rooms in Cambridge
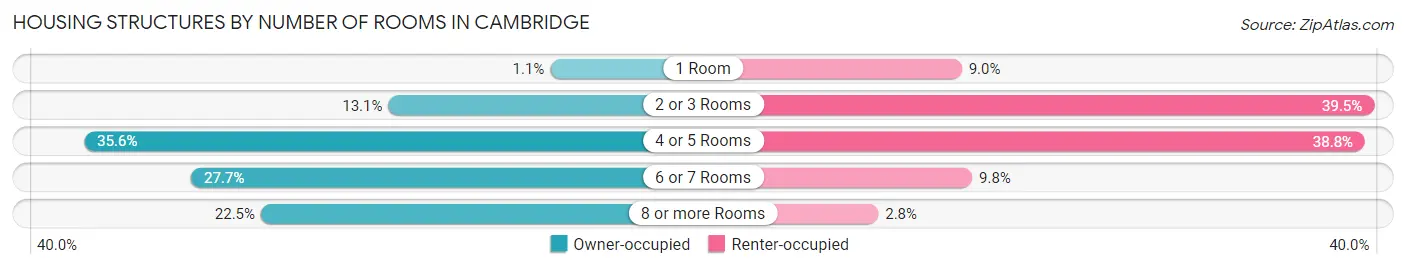
| Number of Rooms | Owner-occupied | Renter-occupied |
| 1 Room | 184 (1.1%) | 2,963 (9.0%) |
| 2 or 3 Rooms | 2,174 (13.1%) | 12,990 (39.5%) |
| 4 or 5 Rooms | 5,911 (35.6%) | 12,767 (38.8%) |
| 6 or 7 Rooms | 4,596 (27.7%) | 3,215 (9.8%) |
| 8 or more Rooms | 3,740 (22.5%) | 935 (2.8%) |
| Total | 16,605 (100.0%) | 32,870 (100.0%) |
Housing Structure by Heating Type in Cambridge
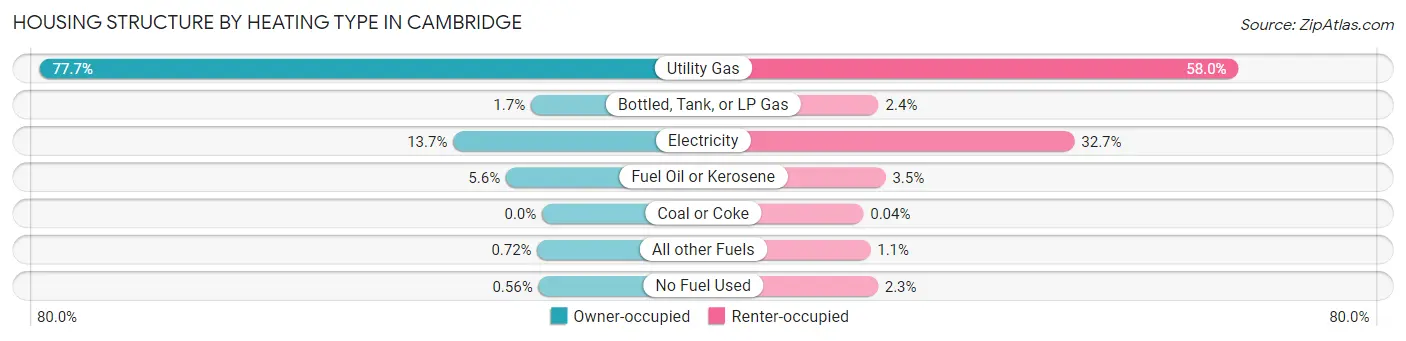
| Heating Type | Owner-occupied | Renter-occupied |
| Utility Gas | 12,898 (77.7%) | 19,072 (58.0%) |
| Bottled, Tank, or LP Gas | 286 (1.7%) | 791 (2.4%) |
| Electricity | 2,281 (13.7%) | 10,737 (32.7%) |
| Fuel Oil or Kerosene | 927 (5.6%) | 1,139 (3.5%) |
| Coal or Coke | 0 (0.0%) | 12 (0.0%) |
| All other Fuels | 120 (0.7%) | 368 (1.1%) |
| No Fuel Used | 93 (0.6%) | 751 (2.3%) |
| Total | 16,605 (100.0%) | 32,870 (100.0%) |
Household Vehicle Usage in Cambridge
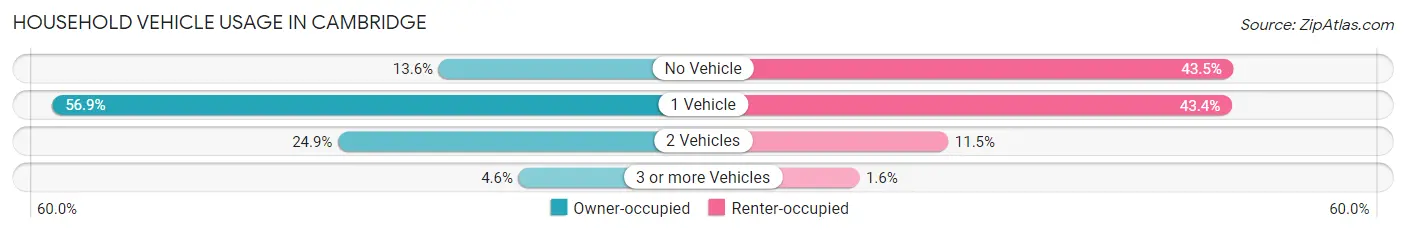
| Vehicles per Household | Owner-occupied | Renter-occupied |
| No Vehicle | 2,256 (13.6%) | 14,312 (43.5%) |
| 1 Vehicle | 9,449 (56.9%) | 14,252 (43.4%) |
| 2 Vehicles | 4,129 (24.9%) | 3,791 (11.5%) |
| 3 or more Vehicles | 771 (4.6%) | 515 (1.6%) |
| Total | 16,605 (100.0%) | 32,870 (100.0%) |
Real Estate & Mortgages in Cambridge
Real Estate and Mortgage Overview in Cambridge
| Characteristic | Without Mortgage | With Mortgage |
| Housing Units | 6,640 | 9,965 |
| Median Property Value | $980,200 | $1,010,200 |
| Median Household Income | $107,931 | $6,689 |
| Monthly Housing Costs | $987 | $5,505 |
| Real Estate Taxes | $4,772 | $25 |
Property Value by Mortgage Status in Cambridge
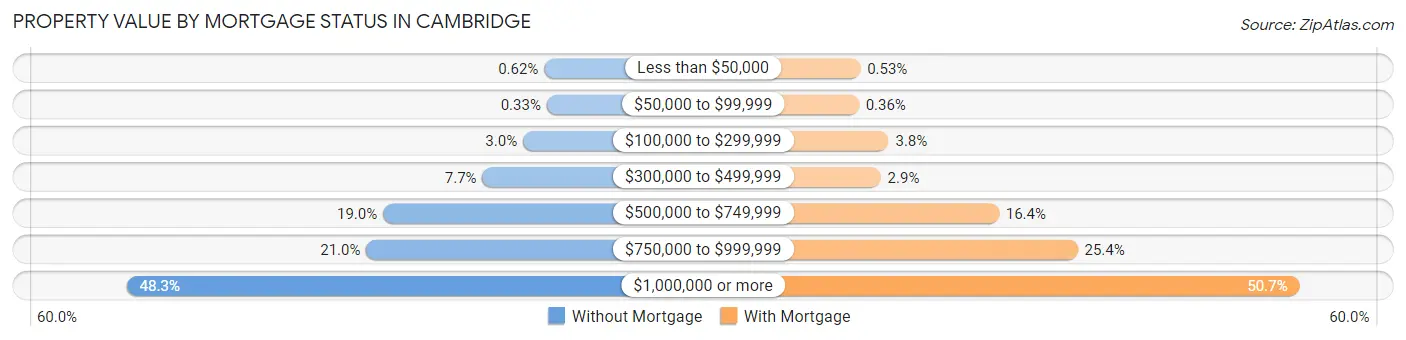
| Property Value | Without Mortgage | With Mortgage |
| Less than $50,000 | 41 (0.6%) | 53 (0.5%) |
| $50,000 to $99,999 | 22 (0.3%) | 36 (0.4%) |
| $100,000 to $299,999 | 202 (3.0%) | 376 (3.8%) |
| $300,000 to $499,999 | 510 (7.7%) | 286 (2.9%) |
| $500,000 to $749,999 | 1,264 (19.0%) | 1,631 (16.4%) |
| $750,000 to $999,999 | 1,391 (20.9%) | 2,528 (25.4%) |
| $1,000,000 or more | 3,210 (48.3%) | 5,055 (50.7%) |
| Total | 6,640 (100.0%) | 9,965 (100.0%) |
Household Income by Mortgage Status in Cambridge
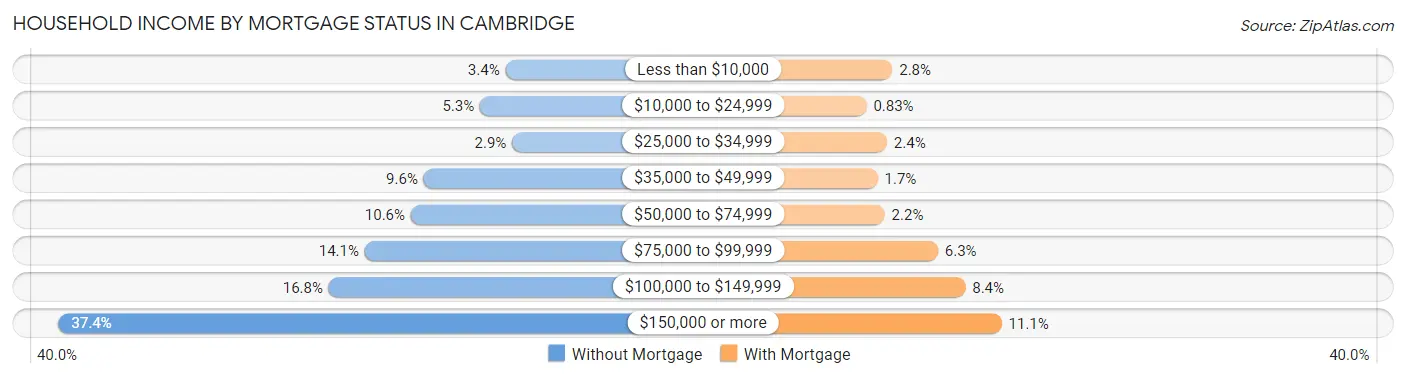
| Household Income | Without Mortgage | With Mortgage |
| Less than $10,000 | 223 (3.4%) | 279 (2.8%) |
| $10,000 to $24,999 | 352 (5.3%) | 83 (0.8%) |
| $25,000 to $34,999 | 189 (2.9%) | 238 (2.4%) |
| $35,000 to $49,999 | 637 (9.6%) | 167 (1.7%) |
| $50,000 to $74,999 | 702 (10.6%) | 221 (2.2%) |
| $75,000 to $99,999 | 935 (14.1%) | 625 (6.3%) |
| $100,000 to $149,999 | 1,117 (16.8%) | 833 (8.4%) |
| $150,000 or more | 2,485 (37.4%) | 1,109 (11.1%) |
| Total | 6,640 (100.0%) | 9,965 (100.0%) |
Property Value to Household Income Ratio in Cambridge
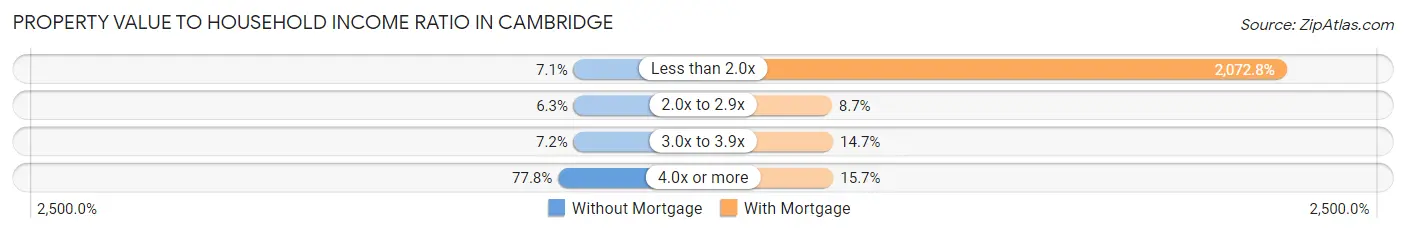
| Value-to-Income Ratio | Without Mortgage | With Mortgage |
| Less than 2.0x | 470 (7.1%) | 206,554 (2,072.8%) |
| 2.0x to 2.9x | 421 (6.3%) | 866 (8.7%) |
| 3.0x to 3.9x | 478 (7.2%) | 1,466 (14.7%) |
| 4.0x or more | 5,166 (77.8%) | 1,564 (15.7%) |
| Total | 6,640 (100.0%) | 9,965 (100.0%) |
Real Estate Taxes by Mortgage Status in Cambridge
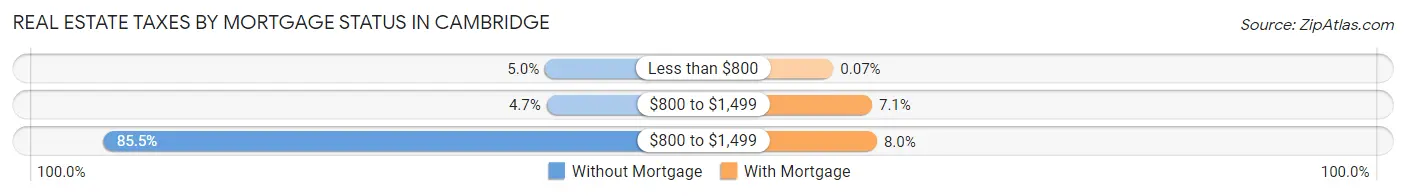
| Property Taxes | Without Mortgage | With Mortgage |
| Less than $800 | 329 (5.0%) | 7 (0.1%) |
| $800 to $1,499 | 310 (4.7%) | 710 (7.1%) |
| $800 to $1,499 | 5,678 (85.5%) | 800 (8.0%) |
| Total | 6,640 (100.0%) | 9,965 (100.0%) |
Health & Disability in Cambridge
Health Insurance Coverage by Age in Cambridge
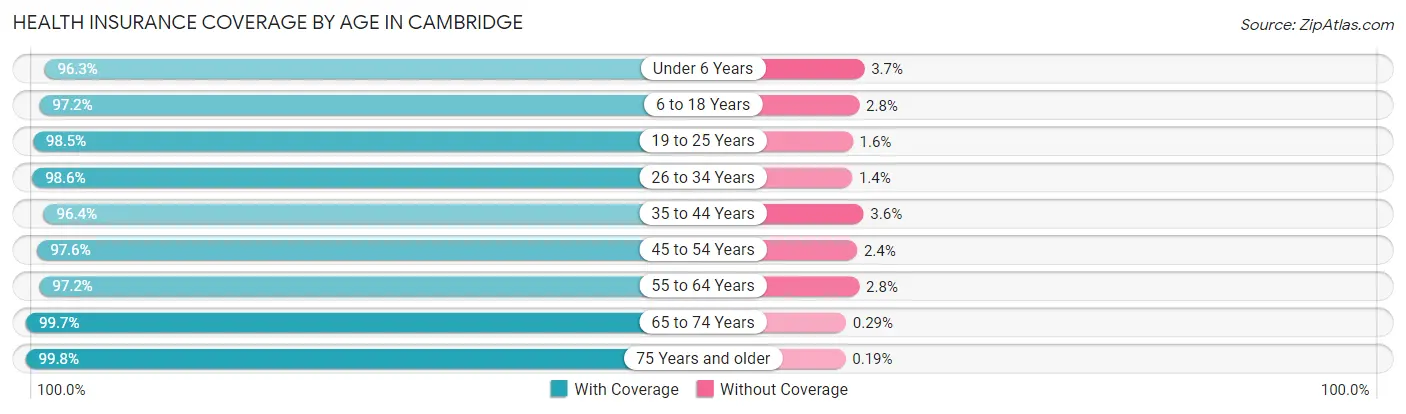
| Age Bracket | With Coverage | Without Coverage |
| Under 6 Years | 5,398 (96.3%) | 208 (3.7%) |
| 6 to 18 Years | 11,325 (97.2%) | 321 (2.8%) |
| 19 to 25 Years | 24,053 (98.5%) | 379 (1.5%) |
| 26 to 34 Years | 27,808 (98.6%) | 404 (1.4%) |
| 35 to 44 Years | 15,020 (96.4%) | 554 (3.6%) |
| 45 to 54 Years | 9,570 (97.6%) | 232 (2.4%) |
| 55 to 64 Years | 8,218 (97.2%) | 234 (2.8%) |
| 65 to 74 Years | 8,469 (99.7%) | 25 (0.3%) |
| 75 Years and older | 5,311 (99.8%) | 10 (0.2%) |
| Total | 115,172 (98.0%) | 2,367 (2.0%) |
Health Insurance Coverage by Citizenship Status in Cambridge
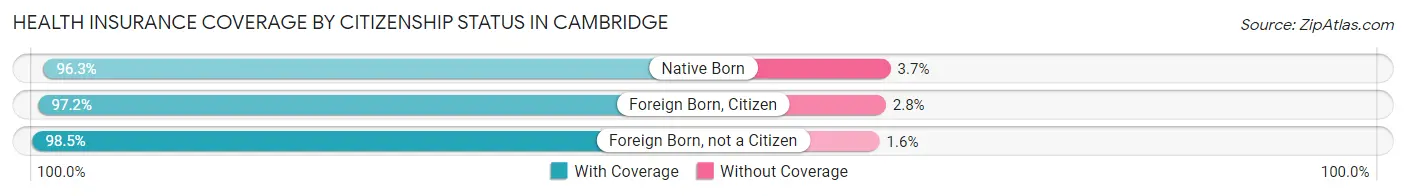
| Citizenship Status | With Coverage | Without Coverage |
| Native Born | 5,398 (96.3%) | 208 (3.7%) |
| Foreign Born, Citizen | 11,325 (97.2%) | 321 (2.8%) |
| Foreign Born, not a Citizen | 24,053 (98.5%) | 379 (1.5%) |
Health Insurance Coverage by Household Income in Cambridge
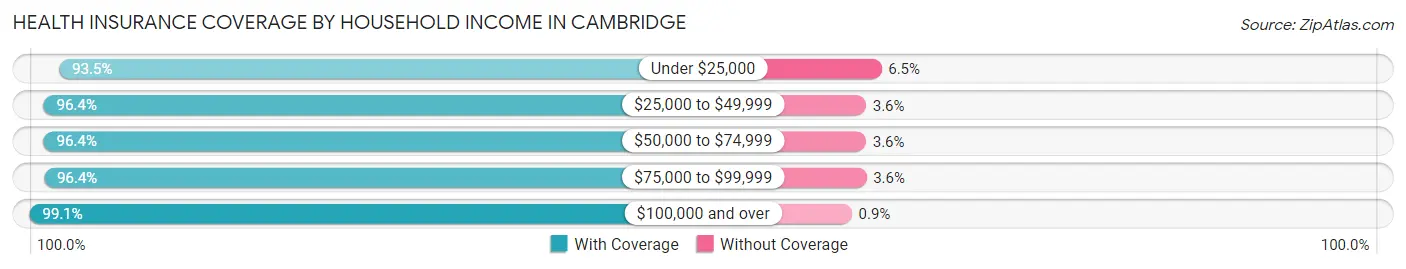
| Household Income | With Coverage | Without Coverage |
| Under $25,000 | 9,153 (93.5%) | 632 (6.5%) |
| $25,000 to $49,999 | 8,069 (96.4%) | 298 (3.6%) |
| $50,000 to $74,999 | 7,919 (96.4%) | 292 (3.6%) |
| $75,000 to $99,999 | 9,192 (96.4%) | 346 (3.6%) |
| $100,000 and over | 66,220 (99.1%) | 599 (0.9%) |
Public vs Private Health Insurance Coverage by Age in Cambridge
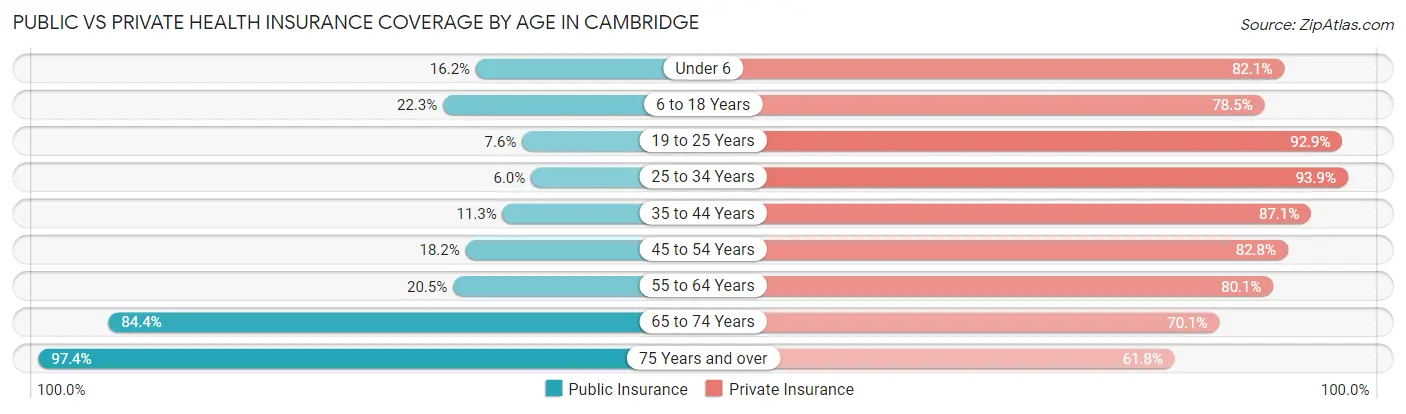
| Age Bracket | Public Insurance | Private Insurance |
| Under 6 | 910 (16.2%) | 4,603 (82.1%) |
| 6 to 18 Years | 2,601 (22.3%) | 9,136 (78.4%) |
| 19 to 25 Years | 1,863 (7.6%) | 22,696 (92.9%) |
| 25 to 34 Years | 1,688 (6.0%) | 26,490 (93.9%) |
| 35 to 44 Years | 1,759 (11.3%) | 13,565 (87.1%) |
| 45 to 54 Years | 1,779 (18.1%) | 8,113 (82.8%) |
| 55 to 64 Years | 1,730 (20.5%) | 6,768 (80.1%) |
| 65 to 74 Years | 7,172 (84.4%) | 5,951 (70.1%) |
| 75 Years and over | 5,185 (97.4%) | 3,289 (61.8%) |
| Total | 24,687 (21.0%) | 100,611 (85.6%) |
Disability Status by Sex by Age in Cambridge
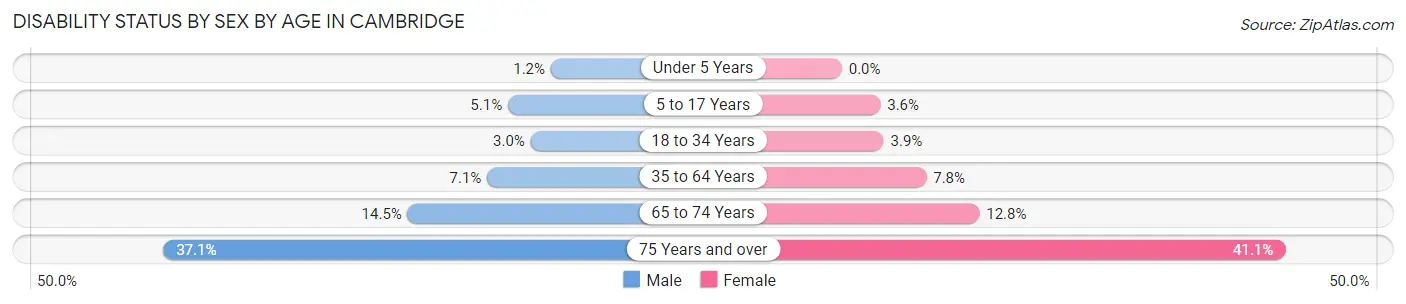
| Age Bracket | Male | Female |
| Under 5 Years | 34 (1.2%) | 0 (0.0%) |
| 5 to 17 Years | 252 (5.1%) | 161 (3.6%) |
| 18 to 34 Years | 856 (3.0%) | 1,059 (3.9%) |
| 35 to 64 Years | 1,199 (7.1%) | 1,321 (7.8%) |
| 65 to 74 Years | 540 (14.4%) | 607 (12.8%) |
| 75 Years and over | 798 (37.1%) | 1,305 (41.1%) |
Disability Class by Sex by Age in Cambridge
Disability Class: Hearing Difficulty
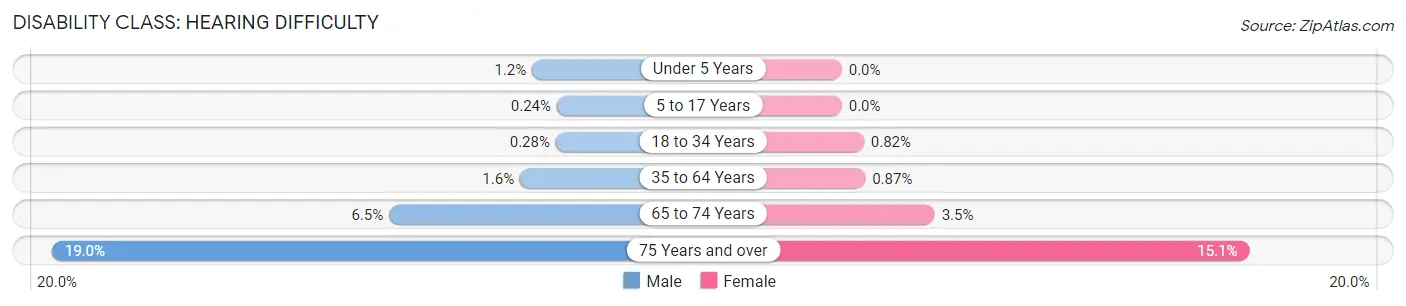
| Age Bracket | Male | Female |
| Under 5 Years | 34 (1.2%) | 0 (0.0%) |
| 5 to 17 Years | 12 (0.2%) | 0 (0.0%) |
| 18 to 34 Years | 80 (0.3%) | 223 (0.8%) |
| 35 to 64 Years | 274 (1.6%) | 146 (0.9%) |
| 65 to 74 Years | 242 (6.5%) | 164 (3.5%) |
| 75 Years and over | 408 (19.0%) | 480 (15.1%) |
Disability Class: Vision Difficulty
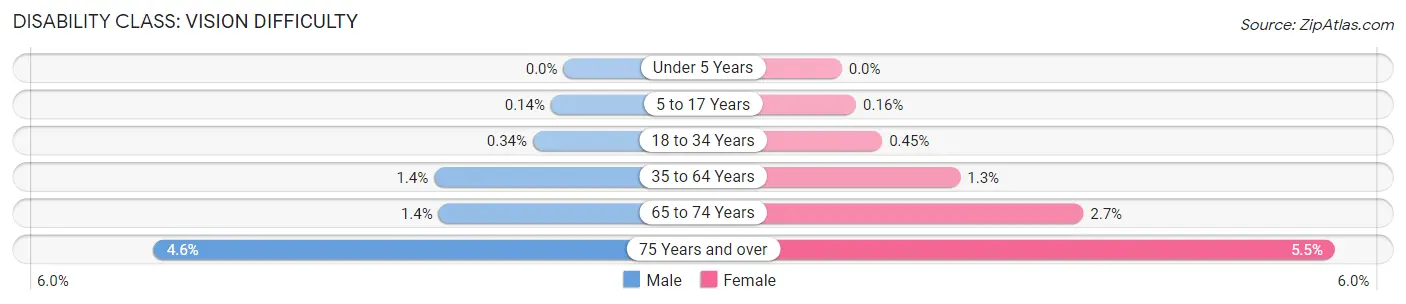
| Age Bracket | Male | Female |
| Under 5 Years | 0 (0.0%) | 0 (0.0%) |
| 5 to 17 Years | 7 (0.1%) | 7 (0.2%) |
| 18 to 34 Years | 96 (0.3%) | 124 (0.4%) |
| 35 to 64 Years | 245 (1.4%) | 223 (1.3%) |
| 65 to 74 Years | 52 (1.4%) | 128 (2.7%) |
| 75 Years and over | 98 (4.6%) | 174 (5.5%) |
Disability Class: Cognitive Difficulty
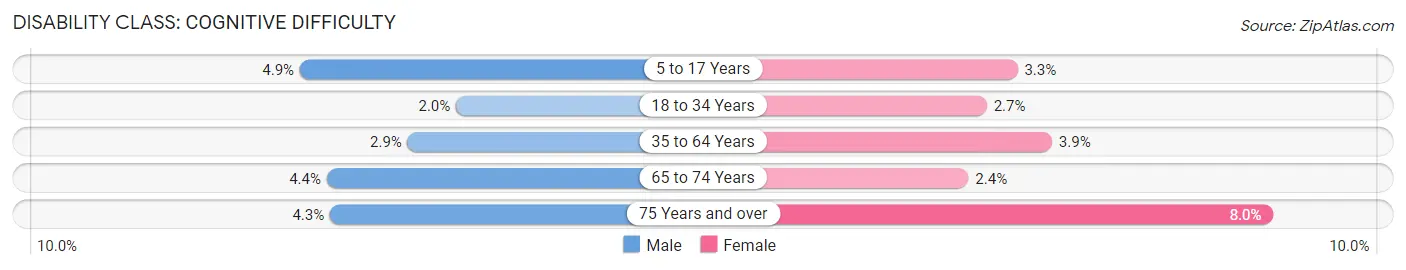
| Age Bracket | Male | Female |
| 5 to 17 Years | 240 (4.9%) | 147 (3.3%) |
| 18 to 34 Years | 563 (2.0%) | 734 (2.7%) |
| 35 to 64 Years | 491 (2.9%) | 657 (3.9%) |
| 65 to 74 Years | 164 (4.4%) | 112 (2.4%) |
| 75 Years and over | 93 (4.3%) | 254 (8.0%) |
Disability Class: Ambulatory Difficulty
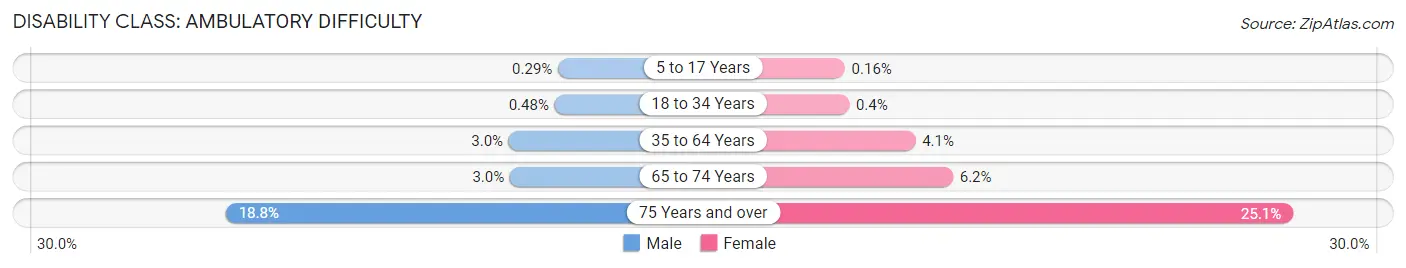
| Age Bracket | Male | Female |
| 5 to 17 Years | 14 (0.3%) | 7 (0.2%) |
| 18 to 34 Years | 136 (0.5%) | 109 (0.4%) |
| 35 to 64 Years | 514 (3.0%) | 690 (4.1%) |
| 65 to 74 Years | 111 (3.0%) | 294 (6.2%) |
| 75 Years and over | 404 (18.8%) | 797 (25.1%) |
Disability Class: Self-Care Difficulty
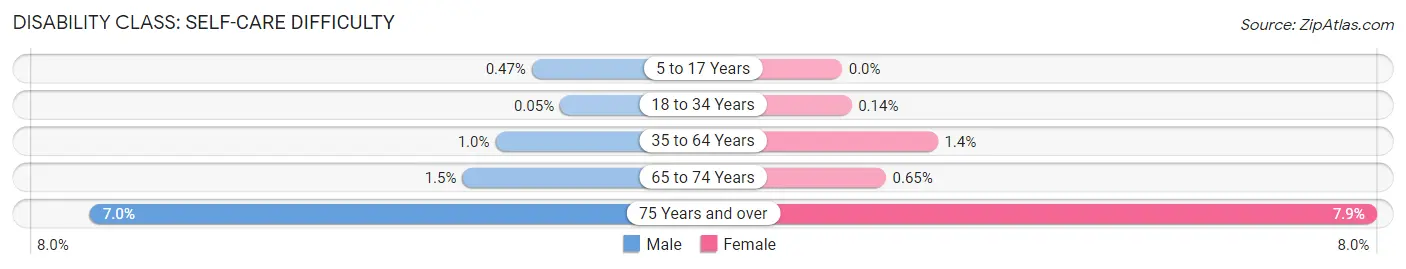
| Age Bracket | Male | Female |
| 5 to 17 Years | 23 (0.5%) | 0 (0.0%) |
| 18 to 34 Years | 13 (0.1%) | 39 (0.1%) |
| 35 to 64 Years | 172 (1.0%) | 239 (1.4%) |
| 65 to 74 Years | 56 (1.5%) | 31 (0.6%) |
| 75 Years and over | 151 (7.0%) | 252 (7.9%) |
Technology Access in Cambridge
Computing Device Access in Cambridge
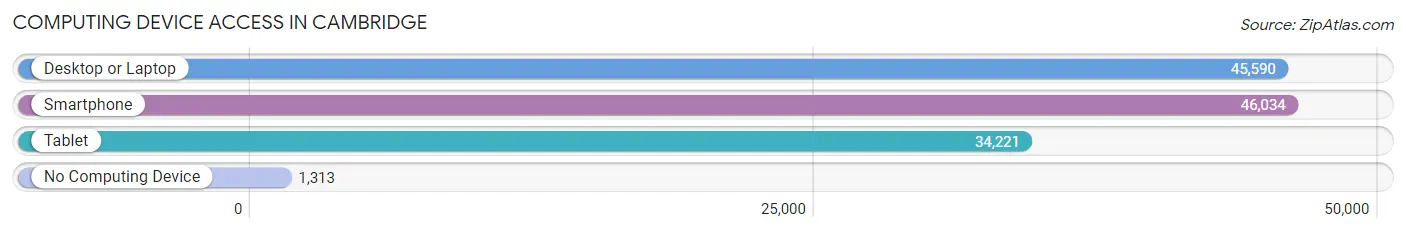
| Device Type | # Households | % Households |
| Desktop or Laptop | 45,590 | 92.1% |
| Smartphone | 46,034 | 93.0% |
| Tablet | 34,221 | 69.2% |
| No Computing Device | 1,313 | 2.6% |
| Total | 49,475 | 100.0% |
Internet Access in Cambridge
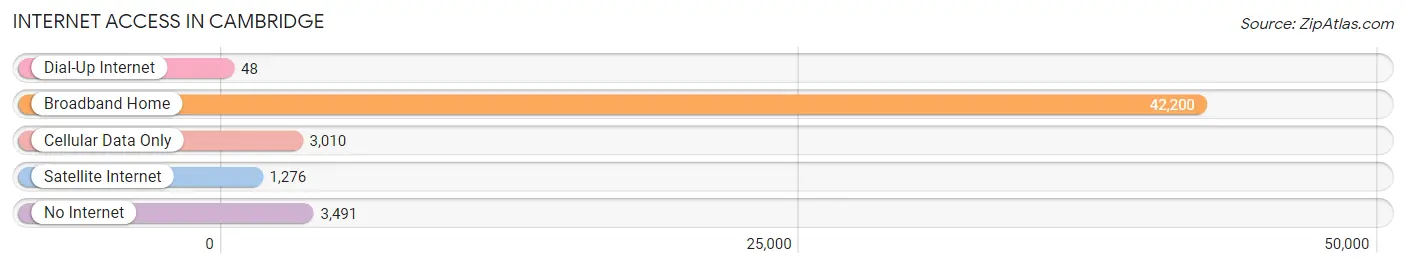
| Internet Type | # Households | % Households |
| Dial-Up Internet | 48 | 0.1% |
| Broadband Home | 42,200 | 85.3% |
| Cellular Data Only | 3,010 | 6.1% |
| Satellite Internet | 1,276 | 2.6% |
| No Internet | 3,491 | 7.1% |
| Total | 49,475 | 100.0% |
Cambridge Summary
Cambridge, Massachusetts is a city located in Middlesex County, Massachusetts, United States. It is a part of the Greater Boston metropolitan area and is located directly across the Charles River from Boston. As of the 2010 census, the population of Cambridge was 105,162.
History
The area that is now Cambridge was originally inhabited by the Massachusett people, a Native American tribe. The first European settlers arrived in 1630 and established the town of Newtowne, which was later renamed Cambridge in 1638. The town was named after the University of Cambridge in England.
In 1636, the first college in the United States, Harvard College, was founded in Cambridge. The college was initially located in what is now Harvard Square. In 1650, the town of Cambridge was incorporated.
In the late 18th century, Cambridge became an important center of the American Revolution. The Continental Army was headquartered in Cambridge and the Battle of Bunker Hill was fought nearby.
In the 19th century, Cambridge became an important center of industry and manufacturing. The city was home to several major companies, including the American Woolen Company, the Cambridge Machine Company, and the Cambridge Rubber Company.
Geography
Cambridge is located in eastern Massachusetts, about 4 miles (6.4 km) northwest of downtown Boston. It is bordered by the cities of Somerville and Medford to the north, Arlington to the west, and Belmont to the south. The Charles River forms the eastern boundary of the city.
The city has a total area of 6.3 square miles (16.3 km2), of which 5.7 square miles (14.8 km2) is land and 0.6 square miles (1.5 km2) is water.
Economy
Cambridge is home to a diverse economy. The city is a major center of education, technology, and biotechnology. Harvard University and the Massachusetts Institute of Technology (MIT) are both located in Cambridge, and the city is home to numerous biotechnology and pharmaceutical companies.
Cambridge is also home to a number of major corporations, including Microsoft, Google, Amazon, and Novartis. The city is also home to a number of smaller businesses, including restaurants, retail stores, and art galleries.
Demographics
As of the 2010 census, the population of Cambridge was 105,162. The racial makeup of the city was 68.3% White, 11.3% African American, 0.3% Native American, 14.2% Asian, 0.1% Pacific Islander, 3.2% from other races, and 2.6% from two or more races. Hispanic or Latino of any race were 8.3% of the population.
The median income for a household in Cambridge was $68,824, and the median income for a family was $90,856. The per capita income for the city was $41,845. About 11.3% of the population was below the poverty line.
Common Questions
What is Per Capita Income in Cambridge?
Per Capita income in Cambridge is $72,975.
What is the Median Family Income in Cambridge?
Median Family Income in Cambridge is $160,739.
What is the Median Household income in Cambridge?
Median Household Income in Cambridge is $121,539.
What is Income or Wage Gap in Cambridge?
Income or Wage Gap in Cambridge is 19.4%.
Women in Cambridge earn 80.6 cents for every dollar earned by a man.
What is Family Income Deficit in Cambridge?
Family Income Deficit in Cambridge is $10,770.
Families that are below poverty line in Cambridge earn $10,770 less on average than the poverty threshold level.
What is Inequality or Gini Index in Cambridge?
Inequality or Gini Index in Cambridge is 0.50.
What is the Total Population of Cambridge?
Total Population of Cambridge is 117,962.
What is the Total Male Population of Cambridge?
Total Male Population of Cambridge is 59,133.
What is the Total Female Population of Cambridge?
Total Female Population of Cambridge is 58,829.
What is the Ratio of Males per 100 Females in Cambridge?
There are 100.52 Males per 100 Females in Cambridge.
What is the Ratio of Females per 100 Males in Cambridge?
There are 99.49 Females per 100 Males in Cambridge.
What is the Median Population Age in Cambridge?
Median Population Age in Cambridge is 30.6 Years.
What is the Average Family Size in Cambridge
Average Family Size in Cambridge is 2.8 People.
What is the Average Household Size in Cambridge
Average Household Size in Cambridge is 2.1 People.
How Large is the Labor Force in Cambridge?
There are 73,471 People in the Labor Forcein in Cambridge.
What is the Percentage of People in the Labor Force in Cambridge?
69.8% of People are in the Labor Force in Cambridge.
What is the Unemployment Rate in Cambridge?
Unemployment Rate in Cambridge is 3.3%.