Somerville, MA Map & Demographics
Somerville Map
Somerville Overview
$65,100
PER CAPITA INCOME
$140,931
AVG FAMILY INCOME
$120,778
AVG HOUSEHOLD INCOME
21.0%
WAGE / INCOME GAP [ % ]
79.0¢/ $1
WAGE / INCOME GAP [ $ ]
$8,937
FAMILY INCOME DEFICIT
0.43
INEQUALITY / GINI INDEX
80,464
TOTAL POPULATION
40,143
MALE POPULATION
40,321
FEMALE POPULATION
99.56
MALES / 100 FEMALES
100.44
FEMALES / 100 MALES
32.1
MEDIAN AGE
2.9
AVG FAMILY SIZE
2.2
AVG HOUSEHOLD SIZE
57,663
LABOR FORCE [ PEOPLE ]
79.1%
PERCENT IN LABOR FORCE
2.8%
UNEMPLOYMENT RATE
Income in Somerville
Income Overview in Somerville
Per Capita Income in Somerville is $65,100, while median incomes of families and households are $140,931 and $120,778 respectively.
| Characteristic | Number | Measure |
| Per Capita Income | 80,464 | $65,100 |
| Median Family Income | 13,327 | $140,931 |
| Mean Family Income | 13,327 | $176,758 |
| Median Household Income | 35,035 | $120,778 |
| Mean Household Income | 35,035 | $148,971 |
| Income Deficit | 13,327 | $8,937 |
| Wage / Income Gap (%) | 80,464 | 21.03% |
| Wage / Income Gap ($) | 80,464 | 78.97¢ per $1 |
| Gini / Inequality Index | 80,464 | 0.43 |
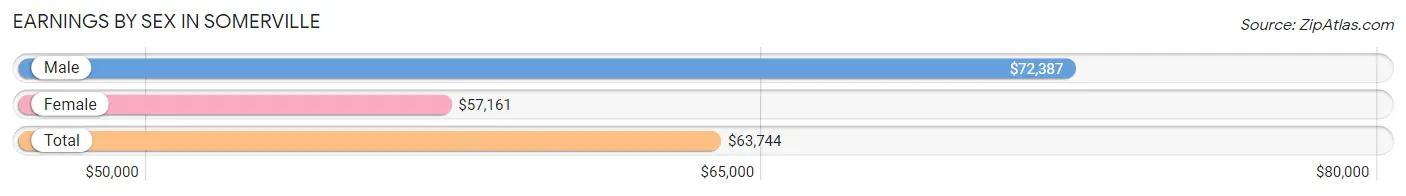
Earnings by Sex in Somerville
Average Earnings in Somerville are $63,744, $72,387 for men and $57,161 for women, a difference of 21.0%.
| Sex | Number | Average Earnings |
| Male | 31,095 (51.6%) | $72,387 |
| Female | 29,181 (48.4%) | $57,161 |
| Total | 60,276 (100.0%) | $63,744 |
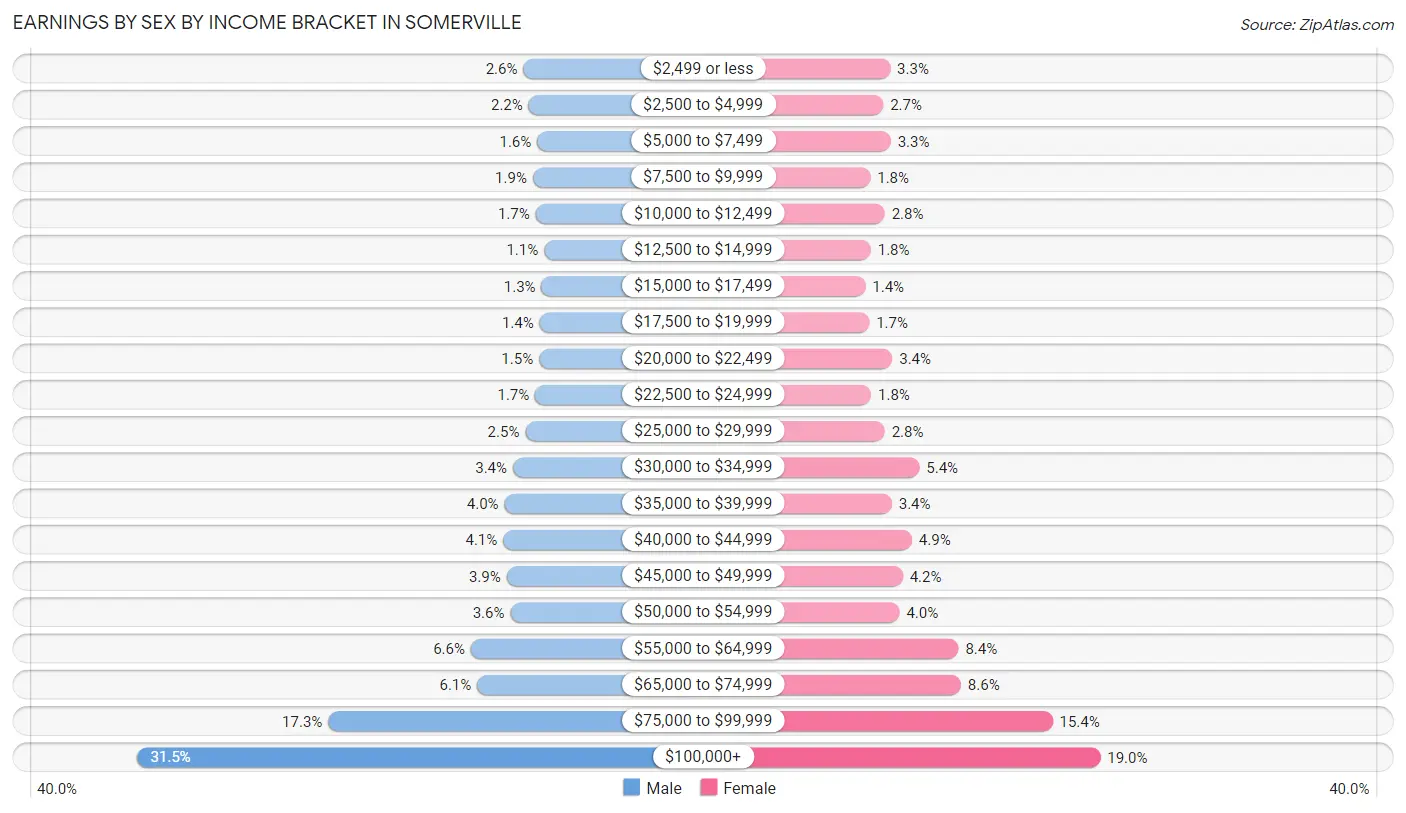
Earnings by Sex by Income Bracket in Somerville
The most common earnings brackets in Somerville are $100,000+ for men (9,806 | 31.5%) and $100,000+ for women (5,544 | 19.0%).
| Income | Male | Female |
| $2,499 or less | 818 (2.6%) | 947 (3.3%) |
| $2,500 to $4,999 | 694 (2.2%) | 797 (2.7%) |
| $5,000 to $7,499 | 493 (1.6%) | 960 (3.3%) |
| $7,500 to $9,999 | 596 (1.9%) | 514 (1.8%) |
| $10,000 to $12,499 | 532 (1.7%) | 830 (2.8%) |
| $12,500 to $14,999 | 333 (1.1%) | 526 (1.8%) |
| $15,000 to $17,499 | 395 (1.3%) | 407 (1.4%) |
| $17,500 to $19,999 | 438 (1.4%) | 490 (1.7%) |
| $20,000 to $22,499 | 452 (1.5%) | 996 (3.4%) |
| $22,500 to $24,999 | 541 (1.7%) | 530 (1.8%) |
| $25,000 to $29,999 | 770 (2.5%) | 830 (2.8%) |
| $30,000 to $34,999 | 1,059 (3.4%) | 1,588 (5.4%) |
| $35,000 to $39,999 | 1,257 (4.0%) | 984 (3.4%) |
| $40,000 to $44,999 | 1,287 (4.1%) | 1,423 (4.9%) |
| $45,000 to $49,999 | 1,208 (3.9%) | 1,224 (4.2%) |
| $50,000 to $54,999 | 1,118 (3.6%) | 1,153 (4.0%) |
| $55,000 to $64,999 | 2,039 (6.6%) | 2,443 (8.4%) |
| $65,000 to $74,999 | 1,894 (6.1%) | 2,496 (8.6%) |
| $75,000 to $99,999 | 5,365 (17.2%) | 4,499 (15.4%) |
| $100,000+ | 9,806 (31.5%) | 5,544 (19.0%) |
| Total | 31,095 (100.0%) | 29,181 (100.0%) |
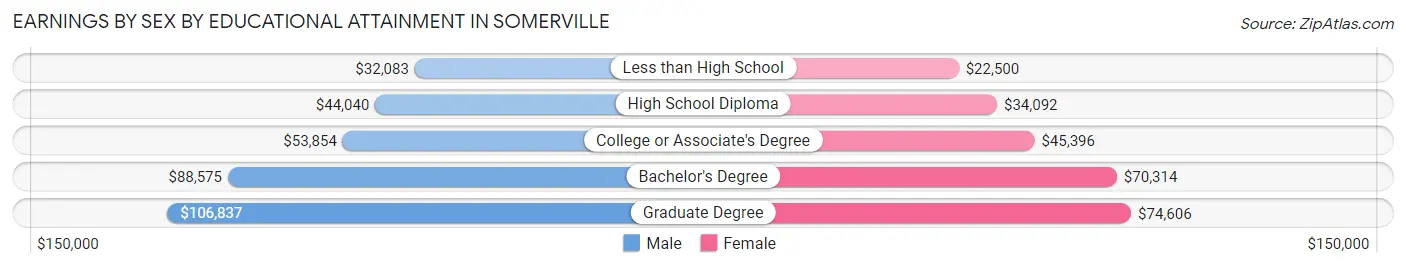
Earnings by Sex by Educational Attainment in Somerville
Average earnings in Somerville are $80,621 for men and $64,198 for women, a difference of 20.4%. Men with an educational attainment of graduate degree enjoy the highest average annual earnings of $106,837, while those with less than high school education earn the least with $32,083. Women with an educational attainment of graduate degree earn the most with the average annual earnings of $74,606, while those with less than high school education have the smallest earnings of $22,500.
| Educational Attainment | Male Income | Female Income |
| Less than High School | $32,083 | $22,500 |
| High School Diploma | $44,040 | $34,092 |
| College or Associate's Degree | $53,854 | $45,396 |
| Bachelor's Degree | $88,575 | $70,314 |
| Graduate Degree | $106,837 | $74,606 |
| Total | $80,621 | $64,198 |
Family Income in Somerville
Family Income Brackets in Somerville
According to the Somerville family income data, there are 4,438 families falling into the $200,000+ income range, which is the most common income bracket and makes up 33.3% of all families. Conversely, the $10,000 to $14,999 income bracket is the least frequent group with only 147 families (1.1%) belonging to this category.
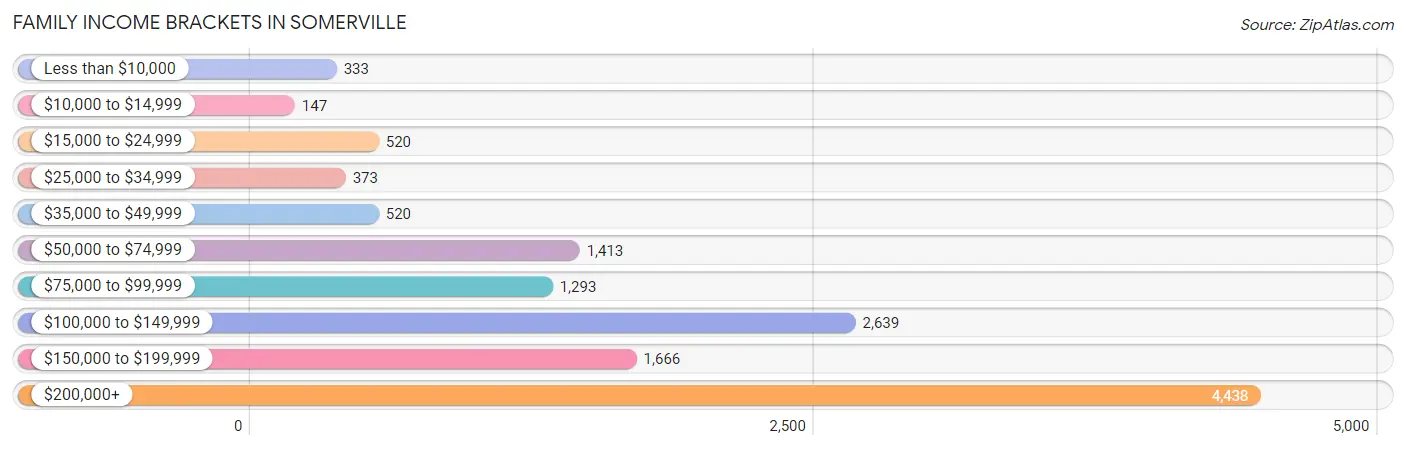
| Income Bracket | # Families | % Families |
| Less than $10,000 | 333 | 2.5% |
| $10,000 to $14,999 | 147 | 1.1% |
| $15,000 to $24,999 | 520 | 3.9% |
| $25,000 to $34,999 | 373 | 2.8% |
| $35,000 to $49,999 | 520 | 3.9% |
| $50,000 to $74,999 | 1,413 | 10.6% |
| $75,000 to $99,999 | 1,293 | 9.7% |
| $100,000 to $149,999 | 2,639 | 19.8% |
| $150,000 to $199,999 | 1,666 | 12.5% |
| $200,000+ | 4,438 | 33.3% |
Family Income by Famaliy Size in Somerville
3-person families (3,025 | 22.7%) account for the highest median family income in Somerville with $178,946 per family, while 2-person families (7,112 | 53.4%) have the highest median income of $61,360 per family member.
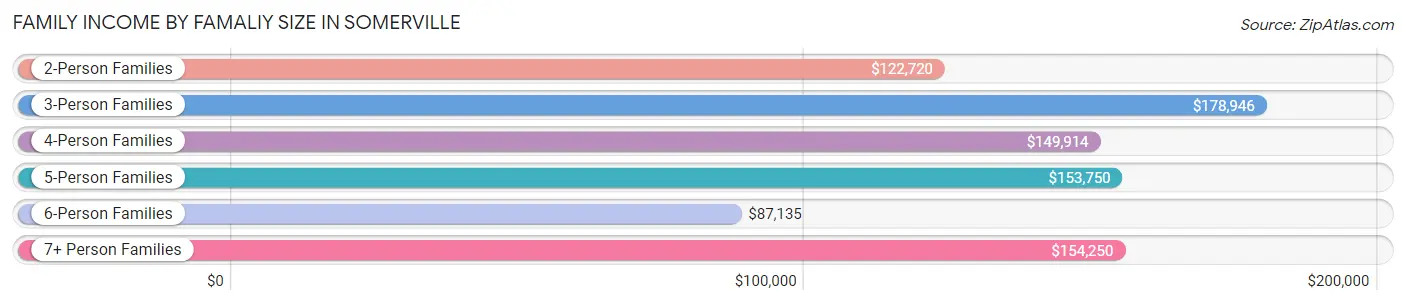
| Income Bracket | # Families | Median Income |
| 2-Person Families | 7,112 (53.4%) | $122,720 |
| 3-Person Families | 3,025 (22.7%) | $178,946 |
| 4-Person Families | 2,252 (16.9%) | $149,914 |
| 5-Person Families | 567 (4.3%) | $153,750 |
| 6-Person Families | 263 (2.0%) | $87,135 |
| 7+ Person Families | 108 (0.8%) | $154,250 |
| Total | 13,327 (100.0%) | $140,931 |
Family Income by Number of Earners in Somerville
The median family income in Somerville is $140,931, with families comprising 2 earners (7,846) having the highest median family income of $177,016, while families with no earners (1,285) have the lowest median family income of $30,164, accounting for 58.9% and 9.6% of families, respectively.
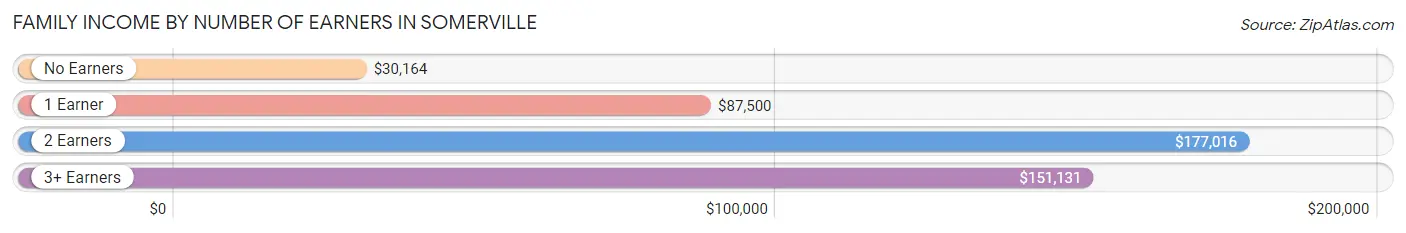
| Number of Earners | # Families | Median Income |
| No Earners | 1,285 (9.6%) | $30,164 |
| 1 Earner | 2,710 (20.3%) | $87,500 |
| 2 Earners | 7,846 (58.9%) | $177,016 |
| 3+ Earners | 1,486 (11.2%) | $151,131 |
| Total | 13,327 (100.0%) | $140,931 |
Household Income in Somerville
Household Income Brackets in Somerville
With 8,829 households falling in the category, the $200,000+ income range is the most frequent in Somerville, accounting for 25.2% of all households. In contrast, only 1,156 households (3.3%) fall into the $25,000 to $34,999 income bracket, making it the least populous group.
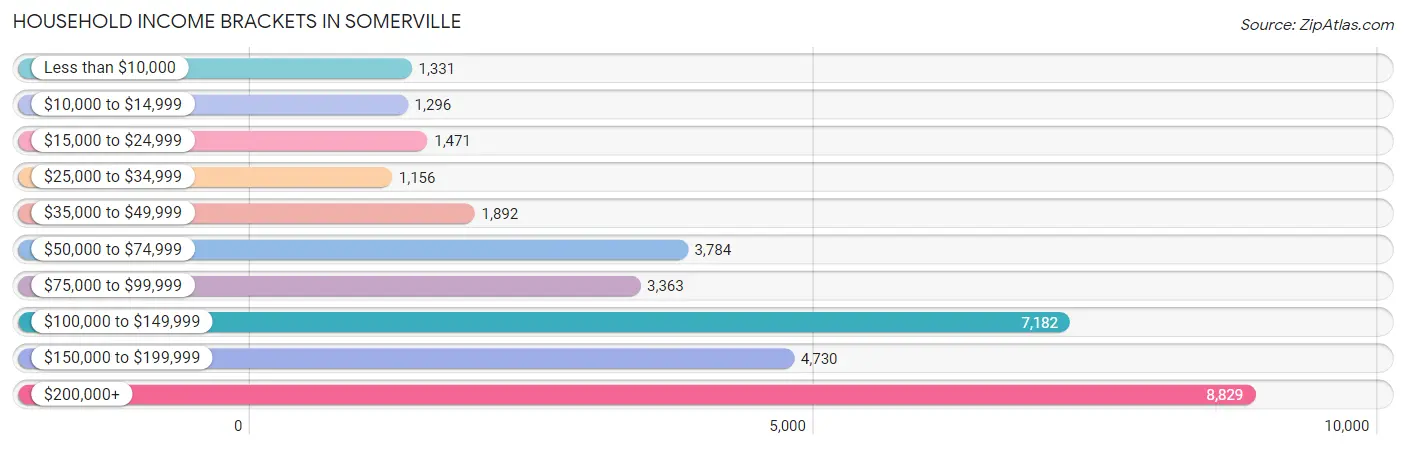
| Income Bracket | # Households | % Households |
| Less than $10,000 | 1,331 | 3.8% |
| $10,000 to $14,999 | 1,296 | 3.7% |
| $15,000 to $24,999 | 1,471 | 4.2% |
| $25,000 to $34,999 | 1,156 | 3.3% |
| $35,000 to $49,999 | 1,892 | 5.4% |
| $50,000 to $74,999 | 3,784 | 10.8% |
| $75,000 to $99,999 | 3,363 | 9.6% |
| $100,000 to $149,999 | 7,182 | 20.5% |
| $150,000 to $199,999 | 4,730 | 13.5% |
| $200,000+ | 8,829 | 25.2% |
Household Income by Householder Age in Somerville
The median household income in Somerville is $120,778, with the highest median household income of $147,880 found in the 25 to 44 years age bracket for the primary householder. A total of 18,341 households (52.3%) fall into this category. Meanwhile, the 65+ years age bracket for the primary householder has the lowest median household income of $41,630, with 5,223 households (14.9%) in this group.
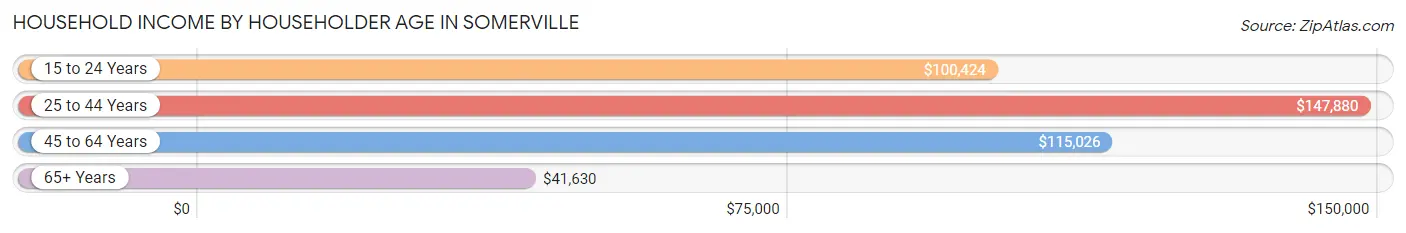
| Income Bracket | # Households | Median Income |
| 15 to 24 Years | 2,965 (8.5%) | $100,424 |
| 25 to 44 Years | 18,341 (52.3%) | $147,880 |
| 45 to 64 Years | 8,506 (24.3%) | $115,026 |
| 65+ Years | 5,223 (14.9%) | $41,630 |
| Total | 35,035 (100.0%) | $120,778 |
Poverty in Somerville
Income Below Poverty by Sex and Age in Somerville
With 8.4% poverty level for males and 11.9% for females among the residents of Somerville, 6 to 11 year old males and 16 and 17 year old females are the most vulnerable to poverty, with 249 males (20.8%) and 138 females (45.0%) in their respective age groups living below the poverty level.
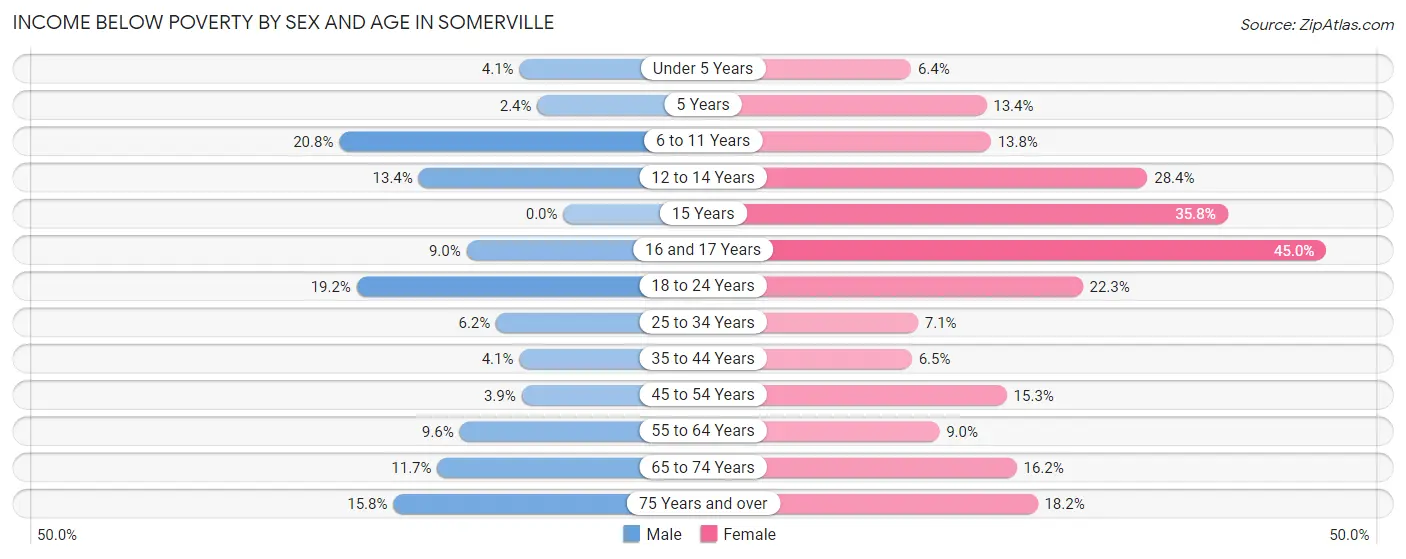
| Age Bracket | Male | Female |
| Under 5 Years | 58 (4.1%) | 102 (6.4%) |
| 5 Years | 7 (2.4%) | 37 (13.4%) |
| 6 to 11 Years | 249 (20.8%) | 174 (13.8%) |
| 12 to 14 Years | 87 (13.4%) | 129 (28.3%) |
| 15 Years | 0 (0.0%) | 34 (35.8%) |
| 16 and 17 Years | 44 (9.0%) | 138 (45.0%) |
| 18 to 24 Years | 868 (19.2%) | 1,110 (22.3%) |
| 25 to 34 Years | 814 (6.2%) | 918 (7.1%) |
| 35 to 44 Years | 279 (4.1%) | 347 (6.5%) |
| 45 to 54 Years | 154 (3.9%) | 532 (15.3%) |
| 55 to 64 Years | 311 (9.6%) | 317 (9.0%) |
| 65 to 74 Years | 237 (11.7%) | 438 (16.2%) |
| 75 Years and over | 166 (15.8%) | 370 (18.2%) |
| Total | 3,274 (8.4%) | 4,646 (11.9%) |
Income Above Poverty by Sex and Age in Somerville
According to the poverty statistics in Somerville, males aged 15 years and females aged under 5 years are the age groups that are most secure financially, with 100.0% of males and 93.6% of females in these age groups living above the poverty line.
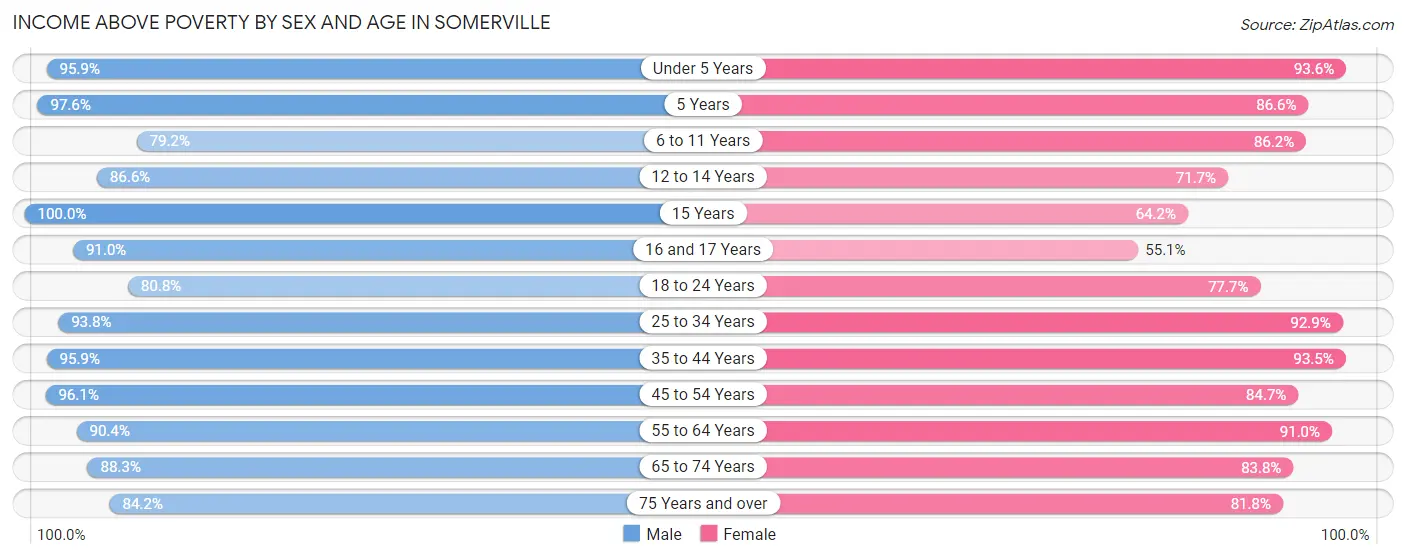
| Age Bracket | Male | Female |
| Under 5 Years | 1,363 (95.9%) | 1,486 (93.6%) |
| 5 Years | 284 (97.6%) | 239 (86.6%) |
| 6 to 11 Years | 948 (79.2%) | 1,085 (86.2%) |
| 12 to 14 Years | 561 (86.6%) | 326 (71.7%) |
| 15 Years | 175 (100.0%) | 61 (64.2%) |
| 16 and 17 Years | 446 (91.0%) | 169 (55.0%) |
| 18 to 24 Years | 3,657 (80.8%) | 3,858 (77.7%) |
| 25 to 34 Years | 12,229 (93.8%) | 12,081 (92.9%) |
| 35 to 44 Years | 6,541 (95.9%) | 4,999 (93.5%) |
| 45 to 54 Years | 3,817 (96.1%) | 2,945 (84.7%) |
| 55 to 64 Years | 2,915 (90.4%) | 3,190 (91.0%) |
| 65 to 74 Years | 1,791 (88.3%) | 2,263 (83.8%) |
| 75 Years and over | 886 (84.2%) | 1,668 (81.8%) |
| Total | 35,613 (91.6%) | 34,370 (88.1%) |
Income Below Poverty Among Married-Couple Families in Somerville
The poverty statistics for married-couple families in Somerville show that 2.5% or 269 of the total 10,625 families live below the poverty line. Families with 1 or 2 children have the highest poverty rate of 2.8%, comprising of 103 families. On the other hand, families with 3 or 4 children have the lowest poverty rate of 0.0%, which includes 0 families.
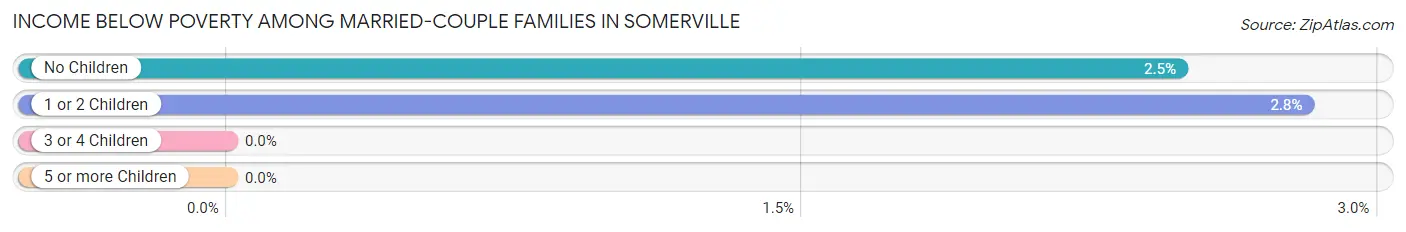
| Children | Above Poverty | Below Poverty |
| No Children | 6,529 (97.5%) | 166 (2.5%) |
| 1 or 2 Children | 3,561 (97.2%) | 103 (2.8%) |
| 3 or 4 Children | 263 (100.0%) | 0 (0.0%) |
| 5 or more Children | 3 (100.0%) | 0 (0.0%) |
| Total | 10,356 (97.5%) | 269 (2.5%) |
Income Below Poverty Among Single-Parent Households in Somerville
According to the poverty data in Somerville, 7.6% or 57 single-father households and 28.2% or 549 single-mother households are living below the poverty line. Among single-father households, those with no children have the highest poverty rate, with 57 households (10.7%) experiencing poverty. Likewise, among single-mother households, those with 3 or 4 children have the highest poverty rate, with 114 households (68.7%) falling below the poverty line.
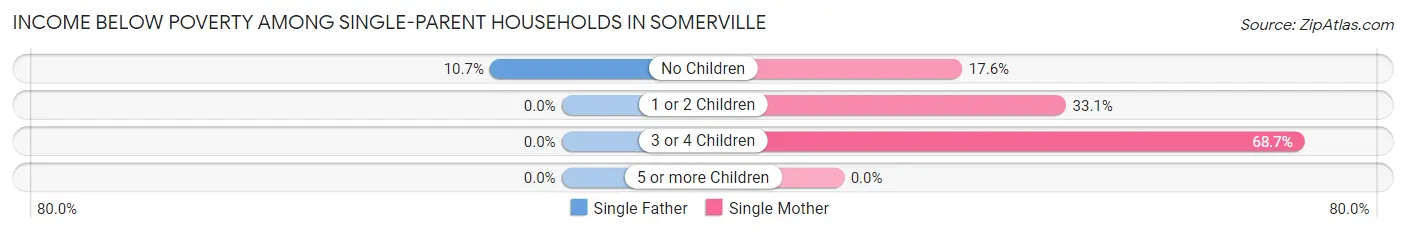
| Children | Single Father | Single Mother |
| No Children | 57 (10.7%) | 176 (17.6%) |
| 1 or 2 Children | 0 (0.0%) | 259 (33.1%) |
| 3 or 4 Children | 0 (0.0%) | 114 (68.7%) |
| 5 or more Children | 0 (0.0%) | 0 (0.0%) |
| Total | 57 (7.6%) | 549 (28.2%) |
Income Below Poverty Among Married-Couple vs Single-Parent Households in Somerville
The poverty data for Somerville shows that 269 of the married-couple family households (2.5%) and 606 of the single-parent households (22.4%) are living below the poverty level. Within the married-couple family households, those with 1 or 2 children have the highest poverty rate, with 103 households (2.8%) falling below the poverty line. Among the single-parent households, those with 3 or 4 children have the highest poverty rate, with 114 household (67.9%) living below poverty.
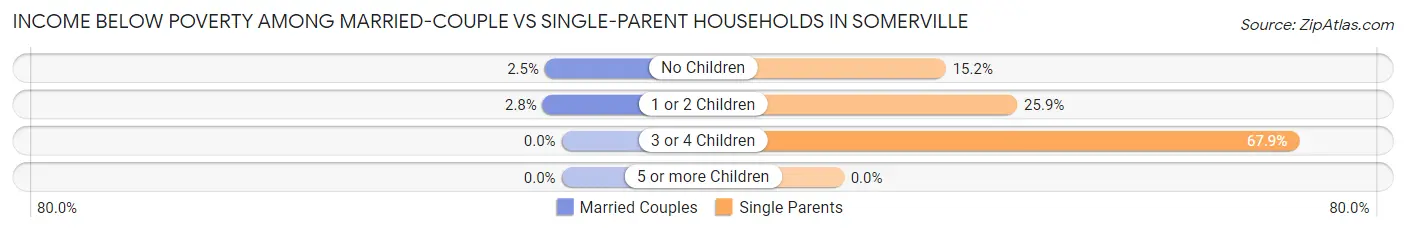
| Children | Married-Couple Families | Single-Parent Households |
| No Children | 166 (2.5%) | 233 (15.2%) |
| 1 or 2 Children | 103 (2.8%) | 259 (25.9%) |
| 3 or 4 Children | 0 (0.0%) | 114 (67.9%) |
| 5 or more Children | 0 (0.0%) | 0 (0.0%) |
| Total | 269 (2.5%) | 606 (22.4%) |
Race in Somerville
The most populous races in Somerville are White / Caucasian (58,336 | 72.5%), Hispanic or Latino (8,752 | 10.9%), and Asian (8,448 | 10.5%).
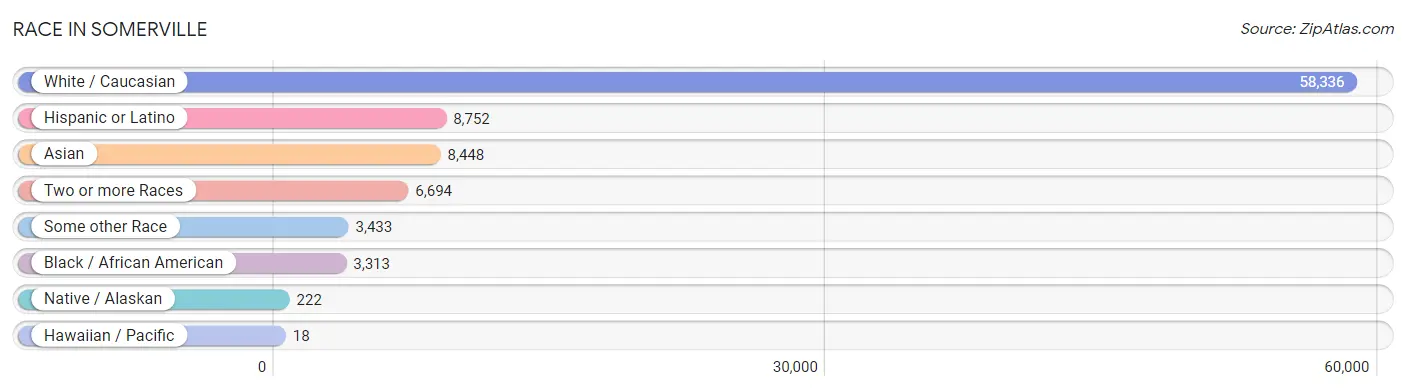
| Race | # Population | % Population |
| Asian | 8,448 | 10.5% |
| Black / African American | 3,313 | 4.1% |
| Hawaiian / Pacific | 18 | 0.0% |
| Hispanic or Latino | 8,752 | 10.9% |
| Native / Alaskan | 222 | 0.3% |
| White / Caucasian | 58,336 | 72.5% |
| Two or more Races | 6,694 | 8.3% |
| Some other Race | 3,433 | 4.3% |
| Total | 80,464 | 100.0% |
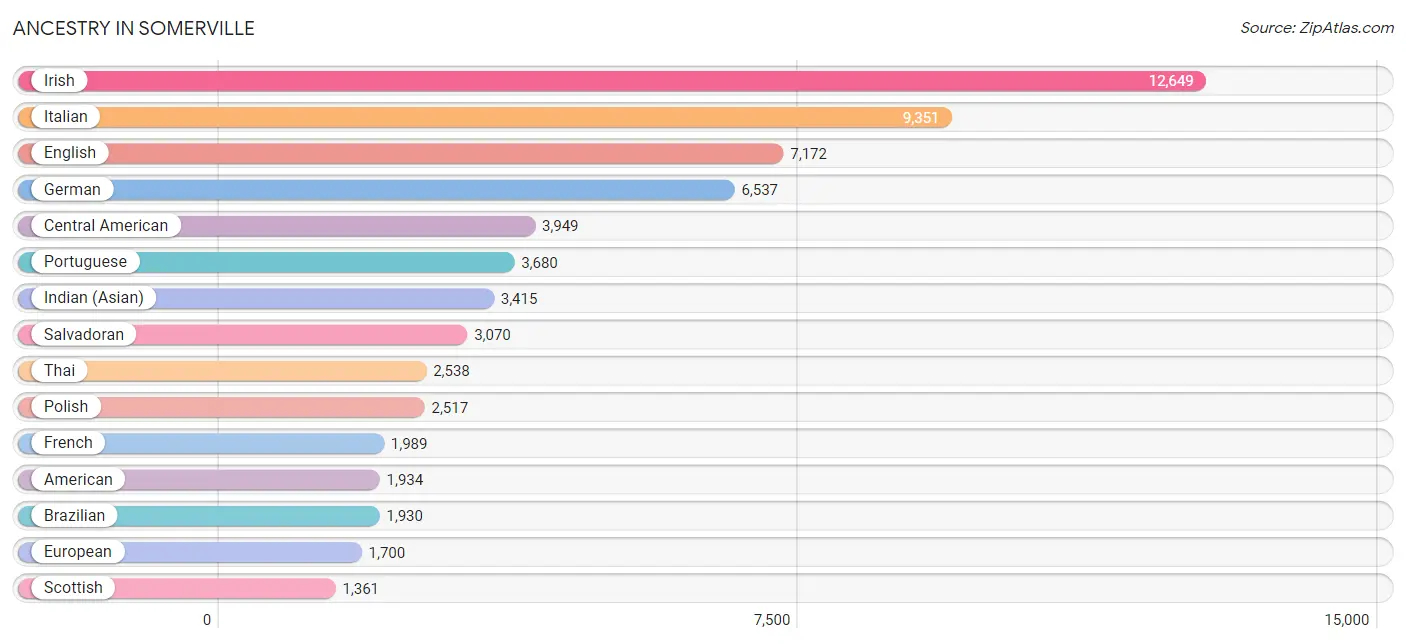
Ancestry in Somerville
The most populous ancestries reported in Somerville are Irish (12,649 | 15.7%), Italian (9,351 | 11.6%), English (7,172 | 8.9%), German (6,537 | 8.1%), and Central American (3,949 | 4.9%), together accounting for 49.3% of all Somerville residents.
| Ancestry | # Population | % Population |
| African | 389 | 0.5% |
| Albanian | 101 | 0.1% |
| Alsatian | 23 | 0.0% |
| American | 1,934 | 2.4% |
| Apache | 3 | 0.0% |
| Arab | 932 | 1.2% |
| Argentinean | 34 | 0.0% |
| Armenian | 459 | 0.6% |
| Australian | 109 | 0.1% |
| Austrian | 169 | 0.2% |
| Bahamian | 17 | 0.0% |
| Barbadian | 73 | 0.1% |
| Belgian | 129 | 0.2% |
| Belizean | 21 | 0.0% |
| Bhutanese | 476 | 0.6% |
| Blackfeet | 16 | 0.0% |
| Bolivian | 56 | 0.1% |
| Brazilian | 1,930 | 2.4% |
| British | 708 | 0.9% |
| British West Indian | 41 | 0.1% |
| Bulgarian | 261 | 0.3% |
| Burmese | 918 | 1.1% |
| Cambodian | 18 | 0.0% |
| Canadian | 399 | 0.5% |
| Cape Verdean | 143 | 0.2% |
| Carpatho Rusyn | 30 | 0.0% |
| Celtic | 32 | 0.0% |
| Central American | 3,949 | 4.9% |
| Central American Indian | 130 | 0.2% |
| Cherokee | 18 | 0.0% |
| Cheyenne | 22 | 0.0% |
| Chickasaw | 6 | 0.0% |
| Chilean | 93 | 0.1% |
| Chippewa | 24 | 0.0% |
| Colombian | 495 | 0.6% |
| Costa Rican | 76 | 0.1% |
| Creek | 21 | 0.0% |
| Croatian | 60 | 0.1% |
| Cuban | 376 | 0.5% |
| Cypriot | 20 | 0.0% |
| Czech | 244 | 0.3% |
| Czechoslovakian | 26 | 0.0% |
| Danish | 235 | 0.3% |
| Dominican | 507 | 0.6% |
| Dutch | 907 | 1.1% |
| Eastern European | 736 | 0.9% |
| Ecuadorian | 168 | 0.2% |
| Egyptian | 81 | 0.1% |
| English | 7,172 | 8.9% |
| Estonian | 14 | 0.0% |
| Ethiopian | 95 | 0.1% |
| European | 1,700 | 2.1% |
| Filipino | 137 | 0.2% |
| Finnish | 129 | 0.2% |
| French | 1,989 | 2.5% |
| French Canadian | 1,338 | 1.7% |
| German | 6,537 | 8.1% |
| Ghanaian | 135 | 0.2% |
| Greek | 589 | 0.7% |
| Guatemalan | 600 | 0.7% |
| Haitian | 934 | 1.2% |
| Honduran | 84 | 0.1% |
| Hungarian | 508 | 0.6% |
| Icelander | 21 | 0.0% |
| Indian (Asian) | 3,415 | 4.2% |
| Iranian | 112 | 0.1% |
| Iraqi | 4 | 0.0% |
| Irish | 12,649 | 15.7% |
| Iroquois | 24 | 0.0% |
| Israeli | 38 | 0.1% |
| Italian | 9,351 | 11.6% |
| Jamaican | 178 | 0.2% |
| Japanese | 86 | 0.1% |
| Kenyan | 30 | 0.0% |
| Korean | 623 | 0.8% |
| Laotian | 204 | 0.3% |
| Latvian | 121 | 0.2% |
| Lebanese | 340 | 0.4% |
| Liberian | 18 | 0.0% |
| Lithuanian | 564 | 0.7% |
| Malaysian | 30 | 0.0% |
| Maltese | 8 | 0.0% |
| Mexican | 1,131 | 1.4% |
| Mexican American Indian | 25 | 0.0% |
| Mongolian | 12 | 0.0% |
| Moroccan | 94 | 0.1% |
| Native Hawaiian | 34 | 0.0% |
| Navajo | 39 | 0.1% |
| New Zealander | 8 | 0.0% |
| Nicaraguan | 33 | 0.0% |
| Nigerian | 63 | 0.1% |
| Northern European | 171 | 0.2% |
| Norwegian | 524 | 0.6% |
| Okinawan | 19 | 0.0% |
| Pakistani | 99 | 0.1% |
| Palestinian | 19 | 0.0% |
| Panamanian | 8 | 0.0% |
| Paraguayan | 84 | 0.1% |
| Peruvian | 147 | 0.2% |
| Polish | 2,517 | 3.1% |
| Portuguese | 3,680 | 4.6% |
| Puerto Rican | 791 | 1.0% |
| Romanian | 188 | 0.2% |
| Russian | 1,343 | 1.7% |
| Salvadoran | 3,070 | 3.8% |
| Scandinavian | 125 | 0.2% |
| Scotch-Irish | 422 | 0.5% |
| Scottish | 1,361 | 1.7% |
| Senegalese | 23 | 0.0% |
| Serbian | 5 | 0.0% |
| Sioux | 32 | 0.0% |
| Slovak | 103 | 0.1% |
| Slovene | 71 | 0.1% |
| Somali | 2 | 0.0% |
| South African | 20 | 0.0% |
| South American | 1,343 | 1.7% |
| South American Indian | 34 | 0.0% |
| Spaniard | 188 | 0.2% |
| Spanish | 159 | 0.2% |
| Sri Lankan | 590 | 0.7% |
| Subsaharan African | 958 | 1.2% |
| Swedish | 823 | 1.0% |
| Swiss | 279 | 0.4% |
| Syrian | 145 | 0.2% |
| Thai | 2,538 | 3.2% |
| Tlingit-Haida | 42 | 0.1% |
| Turkish | 301 | 0.4% |
| Ukrainian | 434 | 0.5% |
| Uruguayan | 47 | 0.1% |
| Venezuelan | 205 | 0.3% |
| Vietnamese | 69 | 0.1% |
| Welsh | 293 | 0.4% |
| West Indian | 54 | 0.1% |
| Yugoslavian | 38 | 0.1% | View All 134 Rows |
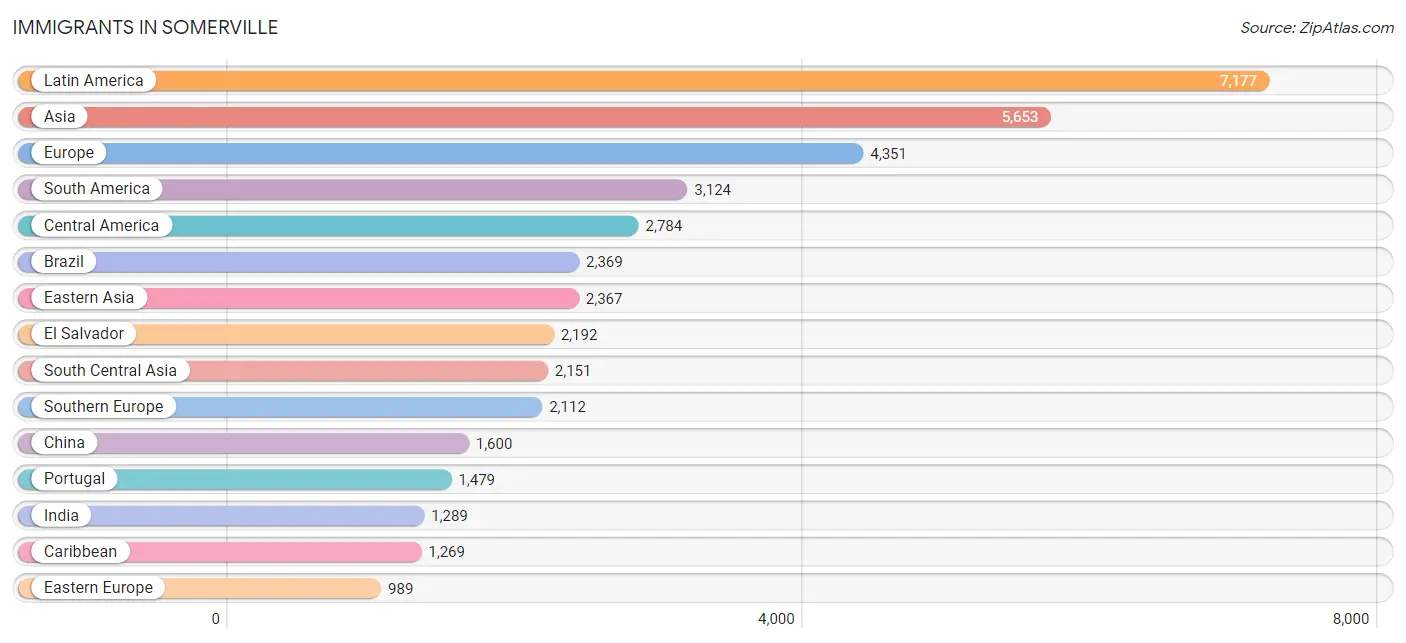
Immigrants in Somerville
The most numerous immigrant groups reported in Somerville came from Latin America (7,177 | 8.9%), Asia (5,653 | 7.0%), Europe (4,351 | 5.4%), South America (3,124 | 3.9%), and Central America (2,784 | 3.5%), together accounting for 28.7% of all Somerville residents.
| Immigration Origin | # Population | % Population |
| Africa | 709 | 0.9% |
| Albania | 26 | 0.0% |
| Armenia | 14 | 0.0% |
| Asia | 5,653 | 7.0% |
| Australia | 174 | 0.2% |
| Azores | 236 | 0.3% |
| Bangladesh | 84 | 0.1% |
| Barbados | 31 | 0.0% |
| Belarus | 40 | 0.1% |
| Belgium | 8 | 0.0% |
| Bolivia | 56 | 0.1% |
| Brazil | 2,369 | 2.9% |
| Bulgaria | 218 | 0.3% |
| Cabo Verde | 80 | 0.1% |
| Cameroon | 22 | 0.0% |
| Canada | 958 | 1.2% |
| Caribbean | 1,269 | 1.6% |
| Central America | 2,784 | 3.5% |
| Chile | 30 | 0.0% |
| China | 1,600 | 2.0% |
| Colombia | 240 | 0.3% |
| Costa Rica | 26 | 0.0% |
| Cuba | 12 | 0.0% |
| Czechoslovakia | 38 | 0.1% |
| Dominica | 30 | 0.0% |
| Dominican Republic | 420 | 0.5% |
| Eastern Africa | 153 | 0.2% |
| Eastern Asia | 2,367 | 2.9% |
| Eastern Europe | 989 | 1.2% |
| Ecuador | 67 | 0.1% |
| Egypt | 30 | 0.0% |
| El Salvador | 2,192 | 2.7% |
| England | 80 | 0.1% |
| Eritrea | 31 | 0.0% |
| Ethiopia | 46 | 0.1% |
| Europe | 4,351 | 5.4% |
| France | 194 | 0.2% |
| Germany | 234 | 0.3% |
| Ghana | 101 | 0.1% |
| Greece | 90 | 0.1% |
| Grenada | 10 | 0.0% |
| Guatemala | 359 | 0.4% |
| Guyana | 58 | 0.1% |
| Haiti | 564 | 0.7% |
| Honduras | 44 | 0.1% |
| Hong Kong | 86 | 0.1% |
| Hungary | 145 | 0.2% |
| India | 1,289 | 1.6% |
| Indonesia | 66 | 0.1% |
| Iran | 26 | 0.0% |
| Iraq | 12 | 0.0% |
| Ireland | 133 | 0.2% |
| Israel | 50 | 0.1% |
| Italy | 374 | 0.5% |
| Jamaica | 129 | 0.2% |
| Japan | 214 | 0.3% |
| Kazakhstan | 15 | 0.0% |
| Kenya | 30 | 0.0% |
| Korea | 535 | 0.7% |
| Latin America | 7,177 | 8.9% |
| Latvia | 68 | 0.1% |
| Lebanon | 9 | 0.0% |
| Malaysia | 33 | 0.0% |
| Mexico | 149 | 0.2% |
| Middle Africa | 22 | 0.0% |
| Moldova | 8 | 0.0% |
| Morocco | 87 | 0.1% |
| Nepal | 573 | 0.7% |
| Netherlands | 354 | 0.4% |
| Nicaragua | 14 | 0.0% |
| Nigeria | 67 | 0.1% |
| Northern Africa | 121 | 0.2% |
| Northern Europe | 443 | 0.5% |
| Norway | 10 | 0.0% |
| Oceania | 185 | 0.2% |
| Pakistan | 10 | 0.0% |
| Peru | 64 | 0.1% |
| Philippines | 219 | 0.3% |
| Poland | 92 | 0.1% |
| Portugal | 1,479 | 1.8% |
| Romania | 29 | 0.0% |
| Russia | 182 | 0.2% |
| Saudi Arabia | 134 | 0.2% |
| Singapore | 66 | 0.1% |
| Somalia | 2 | 0.0% |
| South Africa | 41 | 0.1% |
| South America | 3,124 | 3.9% |
| South Central Asia | 2,151 | 2.7% |
| South Eastern Asia | 683 | 0.9% |
| Southern Europe | 2,112 | 2.6% |
| Spain | 169 | 0.2% |
| Sri Lanka | 46 | 0.1% |
| Sweden | 5 | 0.0% |
| Switzerland | 17 | 0.0% |
| Taiwan | 91 | 0.1% |
| Thailand | 85 | 0.1% |
| Turkey | 148 | 0.2% |
| Ukraine | 62 | 0.1% |
| Uruguay | 34 | 0.0% |
| Uzbekistan | 30 | 0.0% |
| Venezuela | 118 | 0.2% |
| Vietnam | 214 | 0.3% |
| Western Africa | 268 | 0.3% |
| Western Asia | 452 | 0.6% |
| Western Europe | 807 | 1.0% | View All 105 Rows |
Sex and Age in Somerville
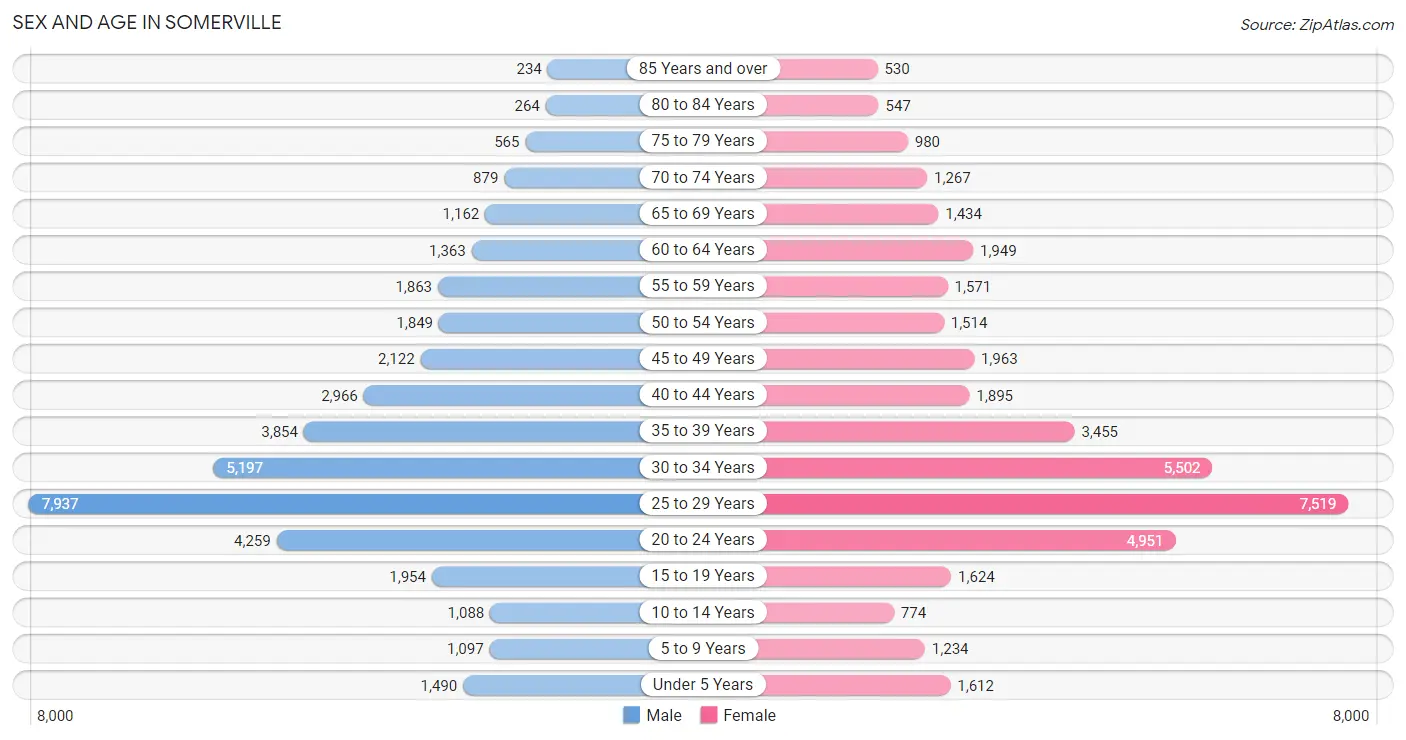
Sex and Age in Somerville
The most populous age groups in Somerville are 25 to 29 Years (7,937 | 19.8%) for men and 25 to 29 Years (7,519 | 18.6%) for women.
| Age Bracket | Male | Female |
| Under 5 Years | 1,490 (3.7%) | 1,612 (4.0%) |
| 5 to 9 Years | 1,097 (2.7%) | 1,234 (3.1%) |
| 10 to 14 Years | 1,088 (2.7%) | 774 (1.9%) |
| 15 to 19 Years | 1,954 (4.9%) | 1,624 (4.0%) |
| 20 to 24 Years | 4,259 (10.6%) | 4,951 (12.3%) |
| 25 to 29 Years | 7,937 (19.8%) | 7,519 (18.6%) |
| 30 to 34 Years | 5,197 (13.0%) | 5,502 (13.7%) |
| 35 to 39 Years | 3,854 (9.6%) | 3,455 (8.6%) |
| 40 to 44 Years | 2,966 (7.4%) | 1,895 (4.7%) |
| 45 to 49 Years | 2,122 (5.3%) | 1,963 (4.9%) |
| 50 to 54 Years | 1,849 (4.6%) | 1,514 (3.7%) |
| 55 to 59 Years | 1,863 (4.6%) | 1,571 (3.9%) |
| 60 to 64 Years | 1,363 (3.4%) | 1,949 (4.8%) |
| 65 to 69 Years | 1,162 (2.9%) | 1,434 (3.6%) |
| 70 to 74 Years | 879 (2.2%) | 1,267 (3.1%) |
| 75 to 79 Years | 565 (1.4%) | 980 (2.4%) |
| 80 to 84 Years | 264 (0.7%) | 547 (1.4%) |
| 85 Years and over | 234 (0.6%) | 530 (1.3%) |
| Total | 40,143 (100.0%) | 40,321 (100.0%) |
Families and Households in Somerville
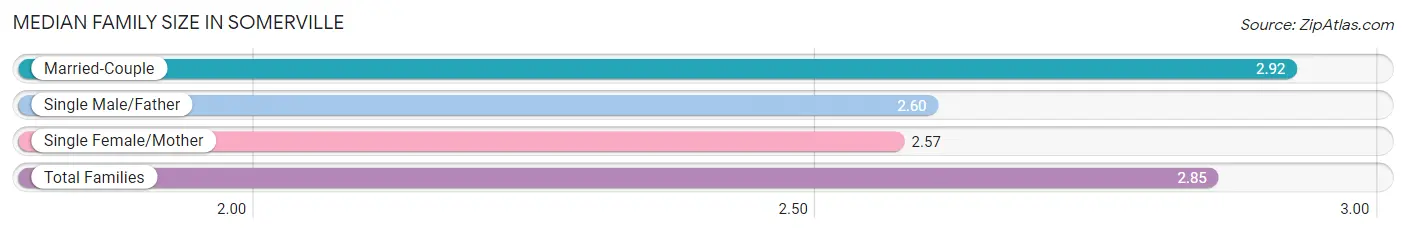
Median Family Size in Somerville
The median family size in Somerville is 2.85 persons per family, with married-couple families (10,625 | 79.7%) accounting for the largest median family size of 2.92 persons per family. On the other hand, single female/mother families (1,948 | 14.6%) represent the smallest median family size with 2.57 persons per family.
| Family Type | # Families | Family Size |
| Married-Couple | 10,625 (79.7%) | 2.92 |
| Single Male/Father | 754 (5.7%) | 2.60 |
| Single Female/Mother | 1,948 (14.6%) | 2.57 |
| Total Families | 13,327 (100.0%) | 2.85 |
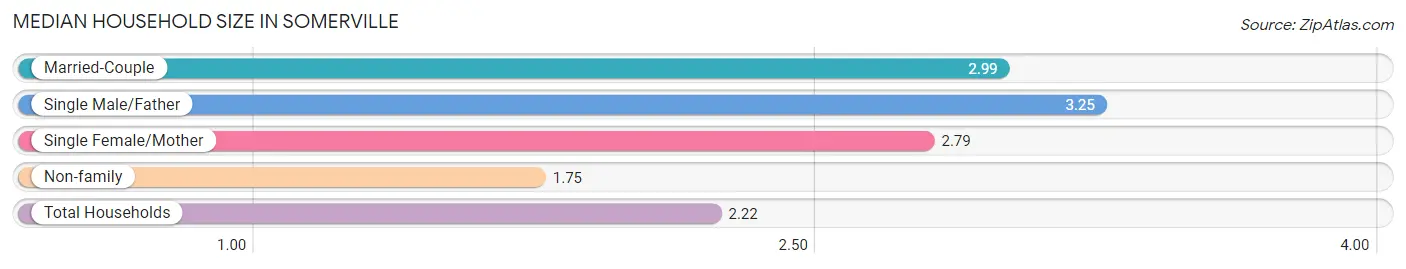
Median Household Size in Somerville
The median household size in Somerville is 2.22 persons per household, with single male/father households (754 | 2.1%) accounting for the largest median household size of 3.25 persons per household. non-family households (21,708 | 62.0%) represent the smallest median household size with 1.75 persons per household.
| Household Type | # Households | Household Size |
| Married-Couple | 10,625 (30.3%) | 2.99 |
| Single Male/Father | 754 (2.1%) | 3.25 |
| Single Female/Mother | 1,948 (5.6%) | 2.79 |
| Non-family | 21,708 (62.0%) | 1.75 |
| Total Households | 35,035 (100.0%) | 2.22 |
Household Size by Marriage Status in Somerville
Out of a total of 35,035 households in Somerville, 13,327 (38.0%) are family households, while 21,708 (62.0%) are nonfamily households. The most numerous type of family households are 2-person households, comprising 6,462, and the most common type of nonfamily households are 1-person households, comprising 11,238.
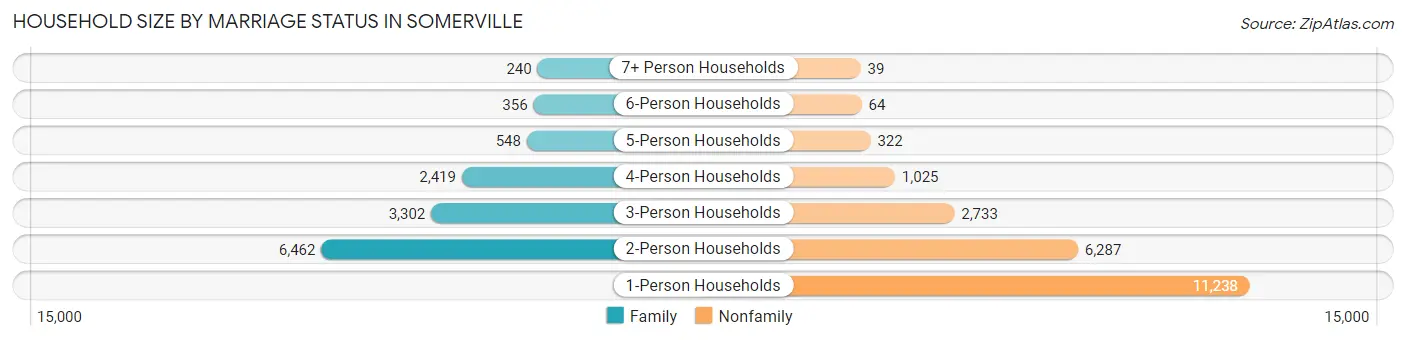
| Household Size | Family Households | Nonfamily Households |
| 1-Person Households | - | 11,238 (32.1%) |
| 2-Person Households | 6,462 (18.4%) | 6,287 (17.9%) |
| 3-Person Households | 3,302 (9.4%) | 2,733 (7.8%) |
| 4-Person Households | 2,419 (6.9%) | 1,025 (2.9%) |
| 5-Person Households | 548 (1.6%) | 322 (0.9%) |
| 6-Person Households | 356 (1.0%) | 64 (0.2%) |
| 7+ Person Households | 240 (0.7%) | 39 (0.1%) |
| Total | 13,327 (38.0%) | 21,708 (62.0%) |
Female Fertility in Somerville
Fertility by Age in Somerville
Average fertility rate in Somerville is 31.0 births per 1,000 women. Women in the age bracket of 35 to 50 years have the highest fertility rate with 60.0 births per 1,000 women. Women in the age bracket of 35 to 50 years acount for 54.4% of all women with births.
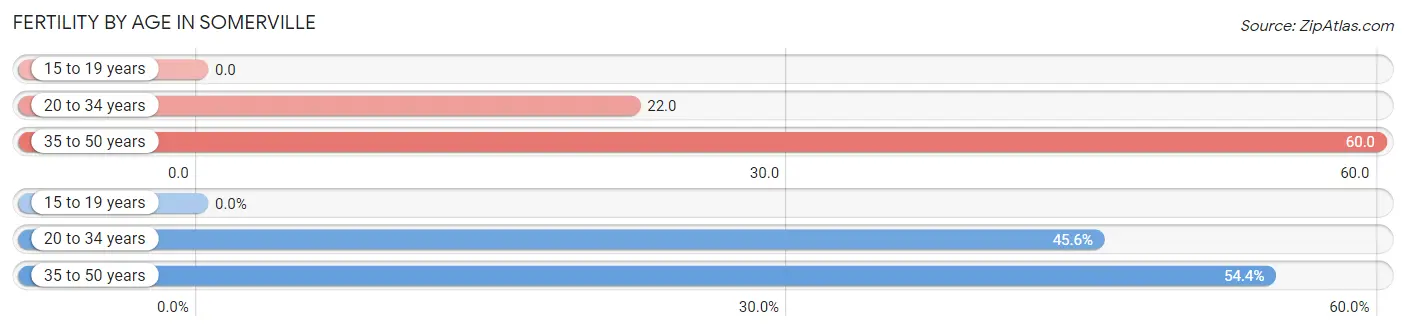
| Age Bracket | Women with Births | Births / 1,000 Women |
| 15 to 19 years | 0 (0.0%) | 0.0 |
| 20 to 34 years | 393 (45.6%) | 22.0 |
| 35 to 50 years | 468 (54.4%) | 60.0 |
| Total | 861 (100.0%) | 31.0 |
Fertility by Age by Marriage Status in Somerville
85.7% of women with births (861) in Somerville are married. The highest percentage of unmarried women with births falls into 35 to 50 years age bracket with 15.8% of them unmarried at the time of birth, while the lowest percentage of unmarried women with births belong to 20 to 34 years age bracket with 12.5% of them unmarried.
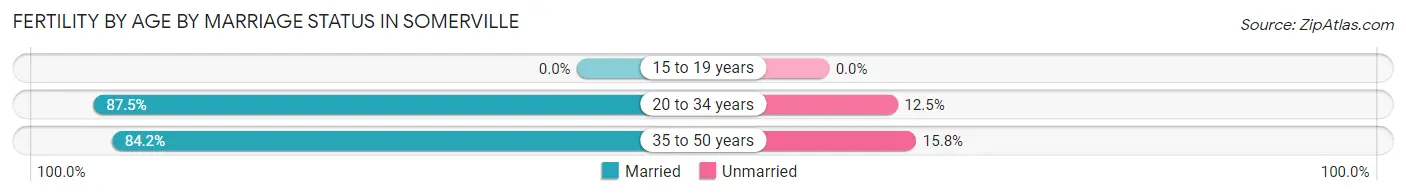
| Age Bracket | Married | Unmarried |
| 15 to 19 years | 0 (0.0%) | 0 (0.0%) |
| 20 to 34 years | 344 (87.5%) | 49 (12.5%) |
| 35 to 50 years | 394 (84.2%) | 74 (15.8%) |
| Total | 738 (85.7%) | 123 (14.3%) |
Fertility by Education in Somerville
Average fertility rate in Somerville is 31.0 births per 1,000 women. Women with the education attainment of high school diploma have the highest fertility rate of 38.0 births per 1,000 women, while women with the education attainment of less than high school have the lowest fertility at 16.0 births per 1,000 women. Women with the education attainment of graduate degree represent 39.7% of all women with births.
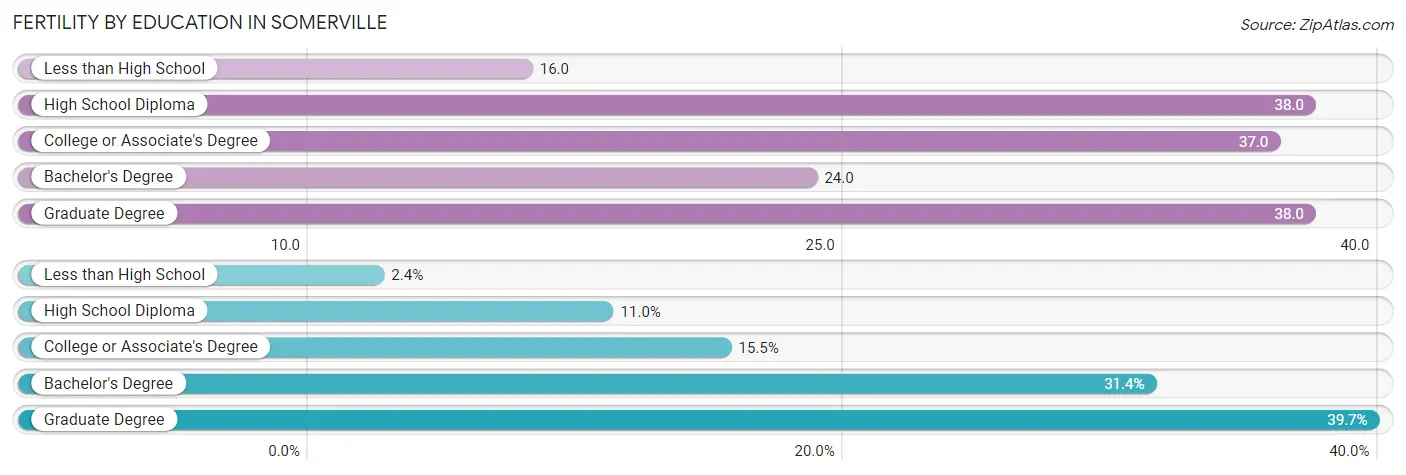
| Educational Attainment | Women with Births | Births / 1,000 Women |
| Less than High School | 21 (2.4%) | 16.0 |
| High School Diploma | 95 (11.0%) | 38.0 |
| College or Associate's Degree | 133 (15.4%) | 37.0 |
| Bachelor's Degree | 270 (31.4%) | 24.0 |
| Graduate Degree | 342 (39.7%) | 38.0 |
| Total | 861 (100.0%) | 31.0 |
Fertility by Education by Marriage Status in Somerville
14.3% of women with births in Somerville are unmarried. Women with the educational attainment of graduate degree are most likely to be married with 95.6% of them married at childbirth, while women with the educational attainment of less than high school are least likely to be married with 100.0% of them unmarried at childbirth.
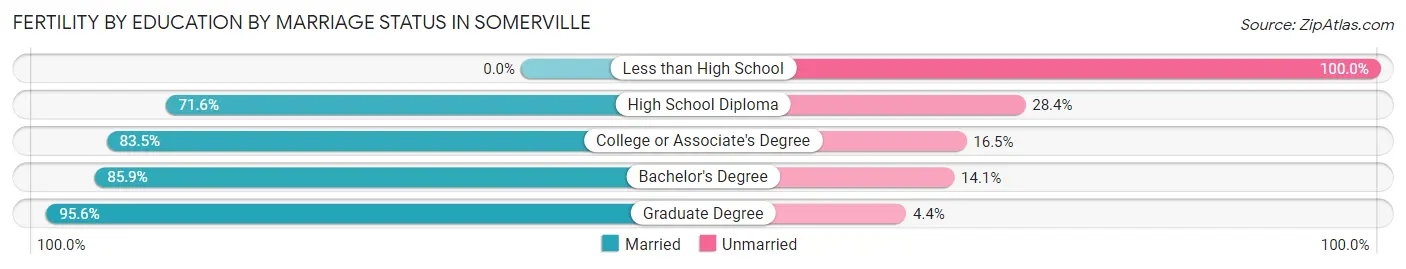
| Educational Attainment | Married | Unmarried |
| Less than High School | 0 (0.0%) | 21 (100.0%) |
| High School Diploma | 68 (71.6%) | 27 (28.4%) |
| College or Associate's Degree | 111 (83.5%) | 22 (16.5%) |
| Bachelor's Degree | 232 (85.9%) | 38 (14.1%) |
| Graduate Degree | 327 (95.6%) | 15 (4.4%) |
| Total | 738 (85.7%) | 123 (14.3%) |
Employment Characteristics in Somerville
Employment by Class of Employer in Somerville
Among the 55,323 employed individuals in Somerville, private company employees (34,705 | 62.7%), not-for-profit organizations (12,722 | 23.0%), and self-employed (not incorporated) (2,538 | 4.6%) make up the most common classes of employment.
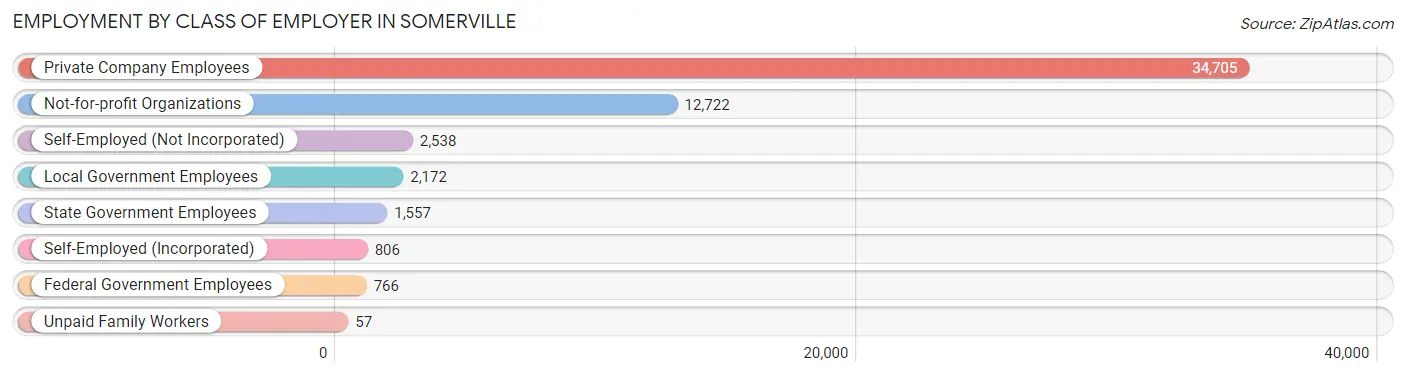
| Employer Class | # Employees | % Employees |
| Private Company Employees | 34,705 | 62.7% |
| Self-Employed (Incorporated) | 806 | 1.5% |
| Self-Employed (Not Incorporated) | 2,538 | 4.6% |
| Not-for-profit Organizations | 12,722 | 23.0% |
| Local Government Employees | 2,172 | 3.9% |
| State Government Employees | 1,557 | 2.8% |
| Federal Government Employees | 766 | 1.4% |
| Unpaid Family Workers | 57 | 0.1% |
| Total | 55,323 | 100.0% |
Employment Status by Age in Somerville
According to the labor force statistics for Somerville, out of the total population over 16 years of age (72,899), 79.1% or 57,663 individuals are in the labor force, with 2.8% or 1,615 of them unemployed. The age group with the highest labor force participation rate is 25 to 29 years, with 93.9% or 14,513 individuals in the labor force. Within the labor force, the 16 to 19 years age range has the highest percentage of unemployed individuals, with 13.5% or 164 of them being unemployed.
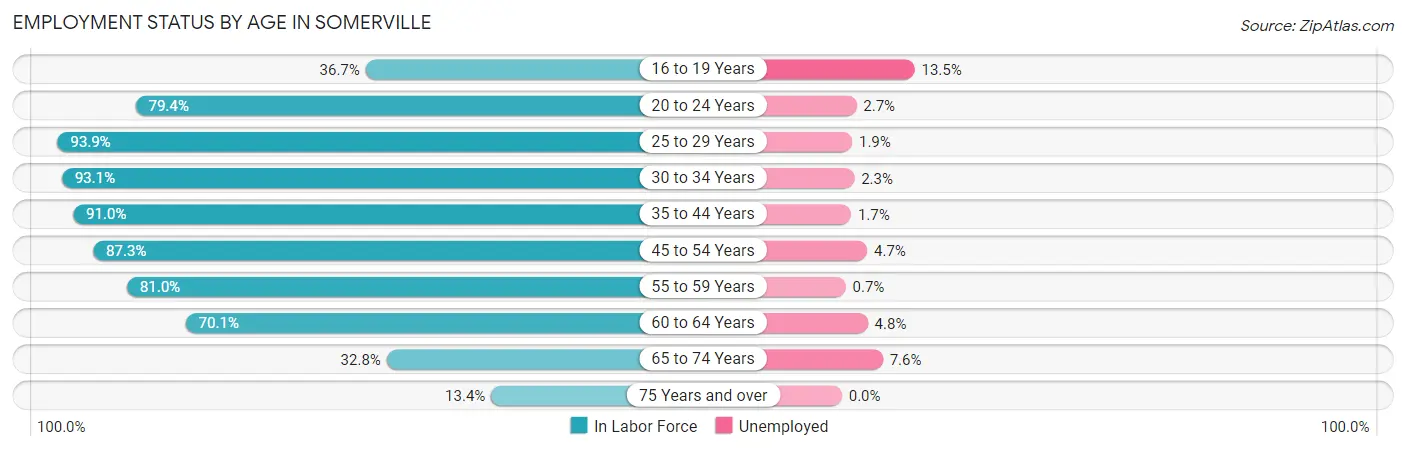
| Age Bracket | In Labor Force | Unemployed |
| 16 to 19 Years | 1,214 (36.7%) | 164 (13.5%) |
| 20 to 24 Years | 7,313 (79.4%) | 197 (2.7%) |
| 25 to 29 Years | 14,513 (93.9%) | 276 (1.9%) |
| 30 to 34 Years | 9,961 (93.1%) | 229 (2.3%) |
| 35 to 44 Years | 11,075 (91.0%) | 188 (1.7%) |
| 45 to 54 Years | 6,502 (87.3%) | 306 (4.7%) |
| 55 to 59 Years | 2,782 (81.0%) | 19 (0.7%) |
| 60 to 64 Years | 2,322 (70.1%) | 111 (4.8%) |
| 65 to 74 Years | 1,555 (32.8%) | 118 (7.6%) |
| 75 Years and over | 418 (13.4%) | 0 (0.0%) |
| Total | 57,663 (79.1%) | 1,615 (2.8%) |
Employment Status by Educational Attainment in Somerville
According to labor force statistics for Somerville, 89.8% of individuals (47,162) out of the total population between 25 and 64 years of age (52,519) are in the labor force, with 2.4% or 1,132 of them being unemployed. The group with the highest labor force participation rate are those with the educational attainment of bachelor's degree or higher, with 94.2% or 35,932 individuals in the labor force. Within the labor force, individuals with less than high school education have the highest percentage of unemployment, with 6.2% or 128 of them being unemployed.
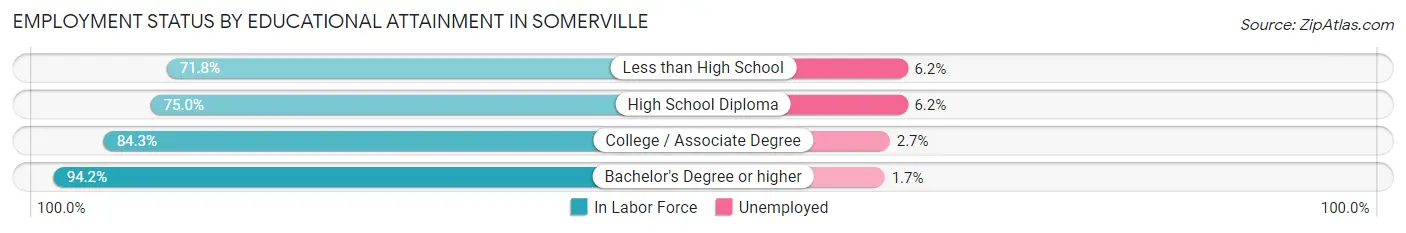
| Educational Attainment | In Labor Force | Unemployed |
| Less than High School | 2,066 (71.8%) | 178 (6.2%) |
| High School Diploma | 4,232 (75.0%) | 350 (6.2%) |
| College / Associate Degree | 4,936 (84.3%) | 158 (2.7%) |
| Bachelor's Degree or higher | 35,932 (94.2%) | 648 (1.7%) |
| Total | 47,162 (89.8%) | 1,260 (2.4%) |
Employment Occupations by Sex in Somerville
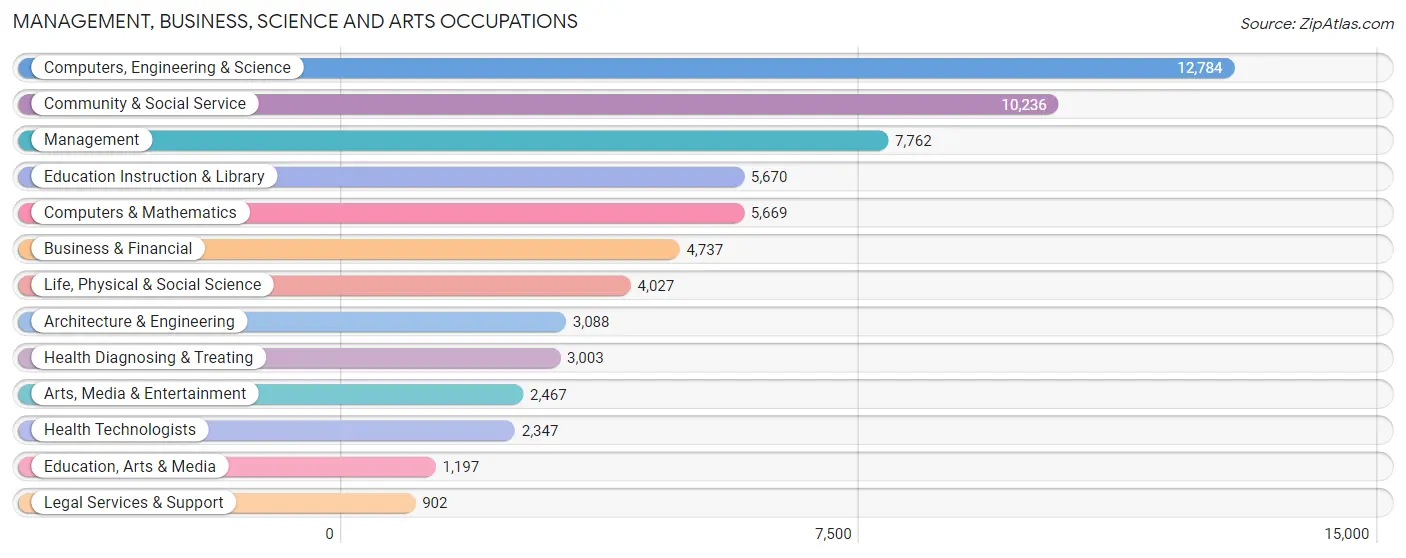
Management, Business, Science and Arts Occupations
The most common Management, Business, Science and Arts occupations in Somerville are Computers, Engineering & Science (12,784 | 22.8%), Community & Social Service (10,236 | 18.3%), Management (7,762 | 13.9%), Education Instruction & Library (5,670 | 10.1%), and Computers & Mathematics (5,669 | 10.1%).
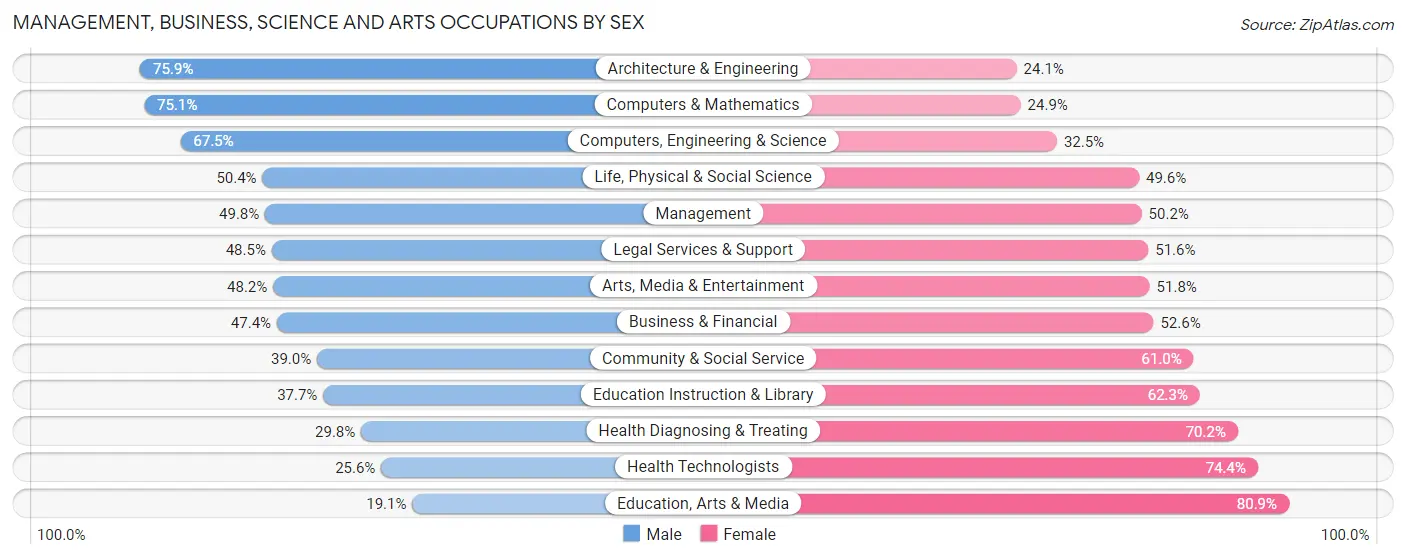
Management, Business, Science and Arts Occupations by Sex
Within the Management, Business, Science and Arts occupations in Somerville, the most male-oriented occupations are Architecture & Engineering (75.9%), Computers & Mathematics (75.1%), and Computers, Engineering & Science (67.5%), while the most female-oriented occupations are Education, Arts & Media (80.9%), Health Technologists (74.4%), and Health Diagnosing & Treating (70.2%).
| Occupation | Male | Female |
| Management | 3,868 (49.8%) | 3,894 (50.2%) |
| Business & Financial | 2,244 (47.4%) | 2,493 (52.6%) |
| Computers, Engineering & Science | 8,629 (67.5%) | 4,155 (32.5%) |
| Computers & Mathematics | 4,256 (75.1%) | 1,413 (24.9%) |
| Architecture & Engineering | 2,344 (75.9%) | 744 (24.1%) |
| Life, Physical & Social Science | 2,029 (50.4%) | 1,998 (49.6%) |
| Community & Social Service | 3,992 (39.0%) | 6,244 (61.0%) |
| Education, Arts & Media | 229 (19.1%) | 968 (80.9%) |
| Legal Services & Support | 437 (48.4%) | 465 (51.5%) |
| Education Instruction & Library | 2,138 (37.7%) | 3,532 (62.3%) |
| Arts, Media & Entertainment | 1,188 (48.2%) | 1,279 (51.8%) |
| Health Diagnosing & Treating | 895 (29.8%) | 2,108 (70.2%) |
| Health Technologists | 601 (25.6%) | 1,746 (74.4%) |
| Total (Category) | 19,628 (50.9%) | 18,894 (49.0%) |
| Total (Overall) | 28,989 (51.8%) | 26,993 (48.2%) |
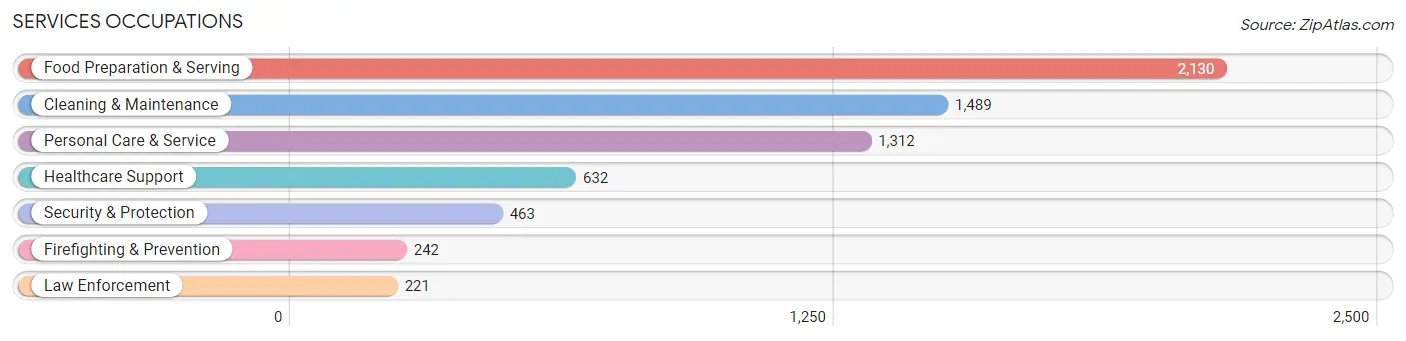
Services Occupations
The most common Services occupations in Somerville are Food Preparation & Serving (2,130 | 3.8%), Cleaning & Maintenance (1,489 | 2.7%), Personal Care & Service (1,312 | 2.3%), Healthcare Support (632 | 1.1%), and Security & Protection (463 | 0.8%).
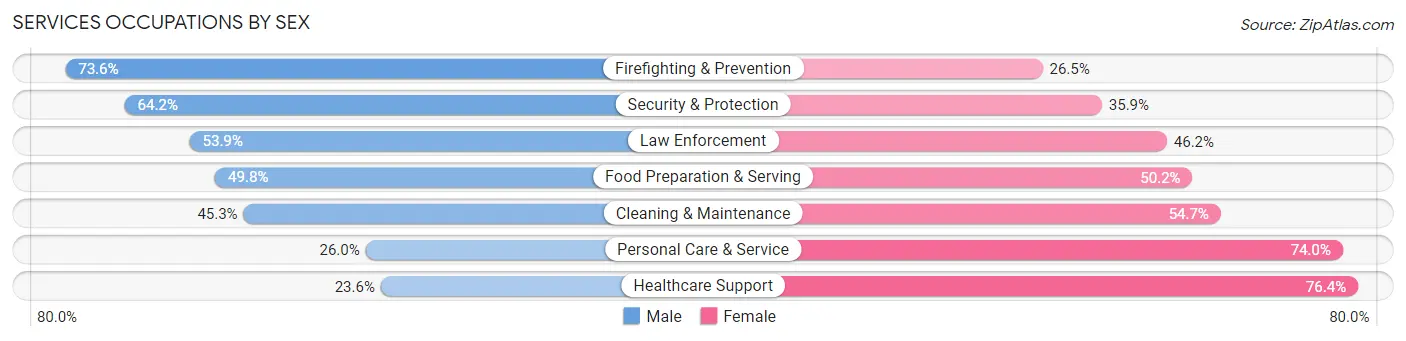
Services Occupations by Sex
Within the Services occupations in Somerville, the most male-oriented occupations are Firefighting & Prevention (73.6%), Security & Protection (64.1%), and Law Enforcement (53.8%), while the most female-oriented occupations are Healthcare Support (76.4%), Personal Care & Service (74.0%), and Cleaning & Maintenance (54.7%).
| Occupation | Male | Female |
| Healthcare Support | 149 (23.6%) | 483 (76.4%) |
| Security & Protection | 297 (64.1%) | 166 (35.8%) |
| Firefighting & Prevention | 178 (73.6%) | 64 (26.5%) |
| Law Enforcement | 119 (53.8%) | 102 (46.2%) |
| Food Preparation & Serving | 1,061 (49.8%) | 1,069 (50.2%) |
| Cleaning & Maintenance | 675 (45.3%) | 814 (54.7%) |
| Personal Care & Service | 341 (26.0%) | 971 (74.0%) |
| Total (Category) | 2,523 (41.9%) | 3,503 (58.1%) |
| Total (Overall) | 28,989 (51.8%) | 26,993 (48.2%) |
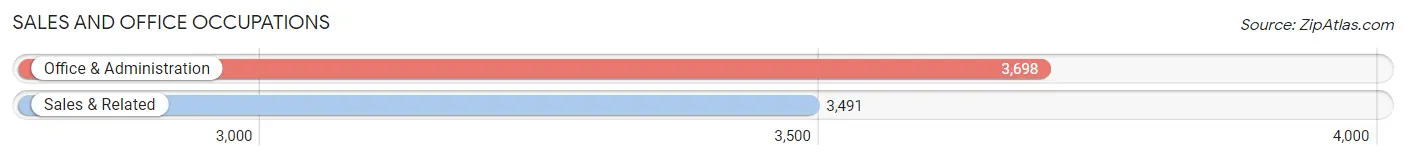
Sales and Office Occupations
The most common Sales and Office occupations in Somerville are Office & Administration (3,698 | 6.6%), and Sales & Related (3,491 | 6.2%).
Sales and Office Occupations by Sex
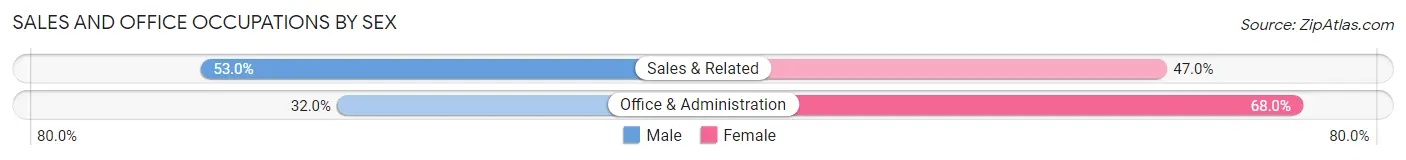
| Occupation | Male | Female |
| Sales & Related | 1,849 (53.0%) | 1,642 (47.0%) |
| Office & Administration | 1,182 (32.0%) | 2,516 (68.0%) |
| Total (Category) | 3,031 (42.2%) | 4,158 (57.8%) |
| Total (Overall) | 28,989 (51.8%) | 26,993 (48.2%) |
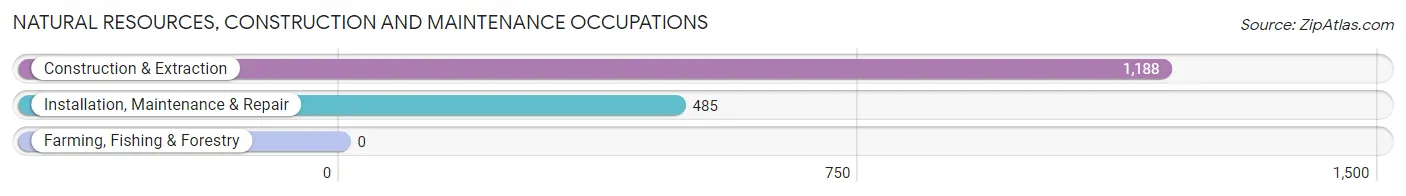
Natural Resources, Construction and Maintenance Occupations
The most common Natural Resources, Construction and Maintenance occupations in Somerville are Construction & Extraction (1,188 | 2.1%), and Installation, Maintenance & Repair (485 | 0.9%).
Natural Resources, Construction and Maintenance Occupations by Sex
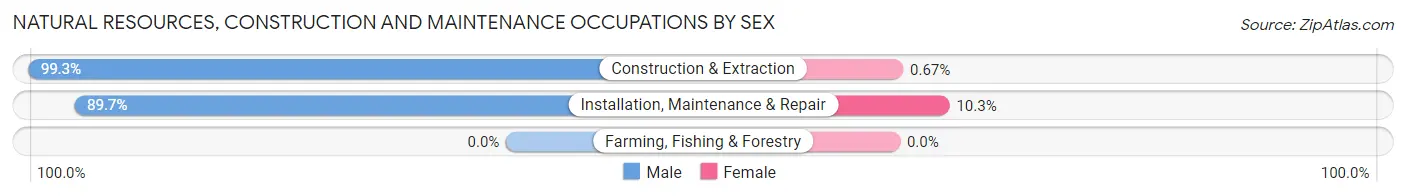
| Occupation | Male | Female |
| Farming, Fishing & Forestry | 0 (0.0%) | 0 (0.0%) |
| Construction & Extraction | 1,180 (99.3%) | 8 (0.7%) |
| Installation, Maintenance & Repair | 435 (89.7%) | 50 (10.3%) |
| Total (Category) | 1,615 (96.5%) | 58 (3.5%) |
| Total (Overall) | 28,989 (51.8%) | 26,993 (48.2%) |
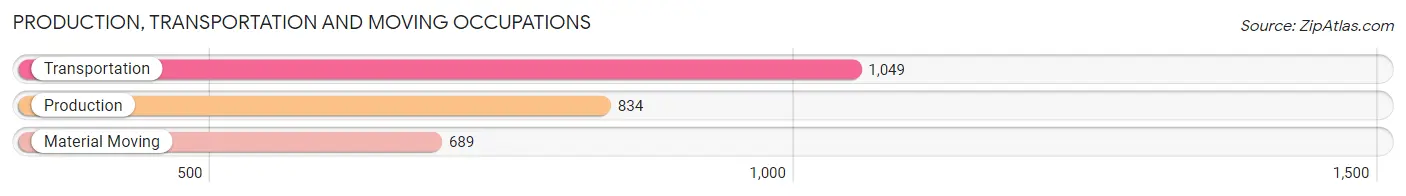
Production, Transportation and Moving Occupations
The most common Production, Transportation and Moving occupations in Somerville are Transportation (1,049 | 1.9%), Production (834 | 1.5%), and Material Moving (689 | 1.2%).
Production, Transportation and Moving Occupations by Sex
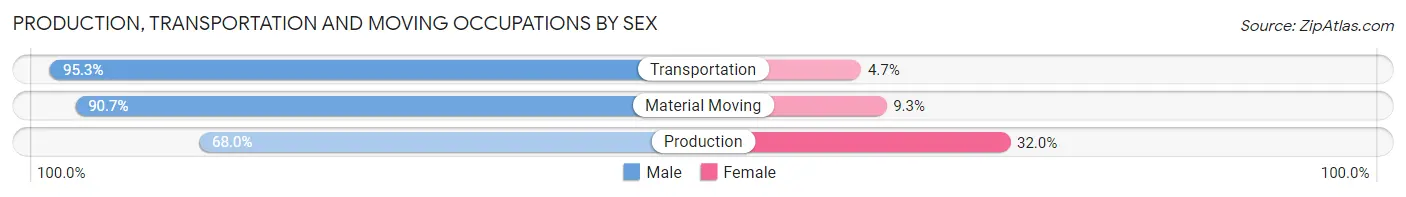
| Occupation | Male | Female |
| Production | 567 (68.0%) | 267 (32.0%) |
| Transportation | 1,000 (95.3%) | 49 (4.7%) |
| Material Moving | 625 (90.7%) | 64 (9.3%) |
| Total (Category) | 2,192 (85.2%) | 380 (14.8%) |
| Total (Overall) | 28,989 (51.8%) | 26,993 (48.2%) |
Employment Industries by Sex in Somerville
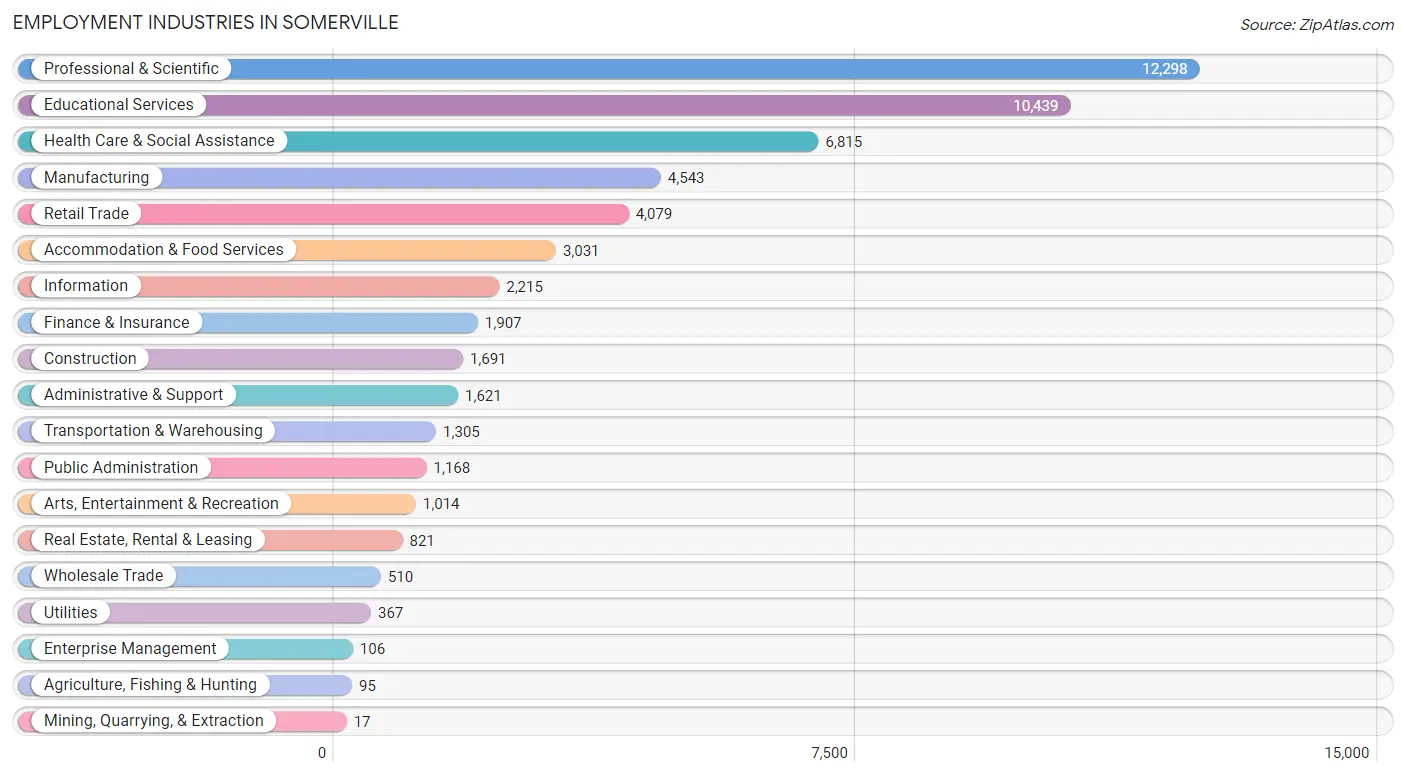
Employment Industries in Somerville
The major employment industries in Somerville include Professional & Scientific (12,298 | 22.0%), Educational Services (10,439 | 18.6%), Health Care & Social Assistance (6,815 | 12.2%), Manufacturing (4,543 | 8.1%), and Retail Trade (4,079 | 7.3%).
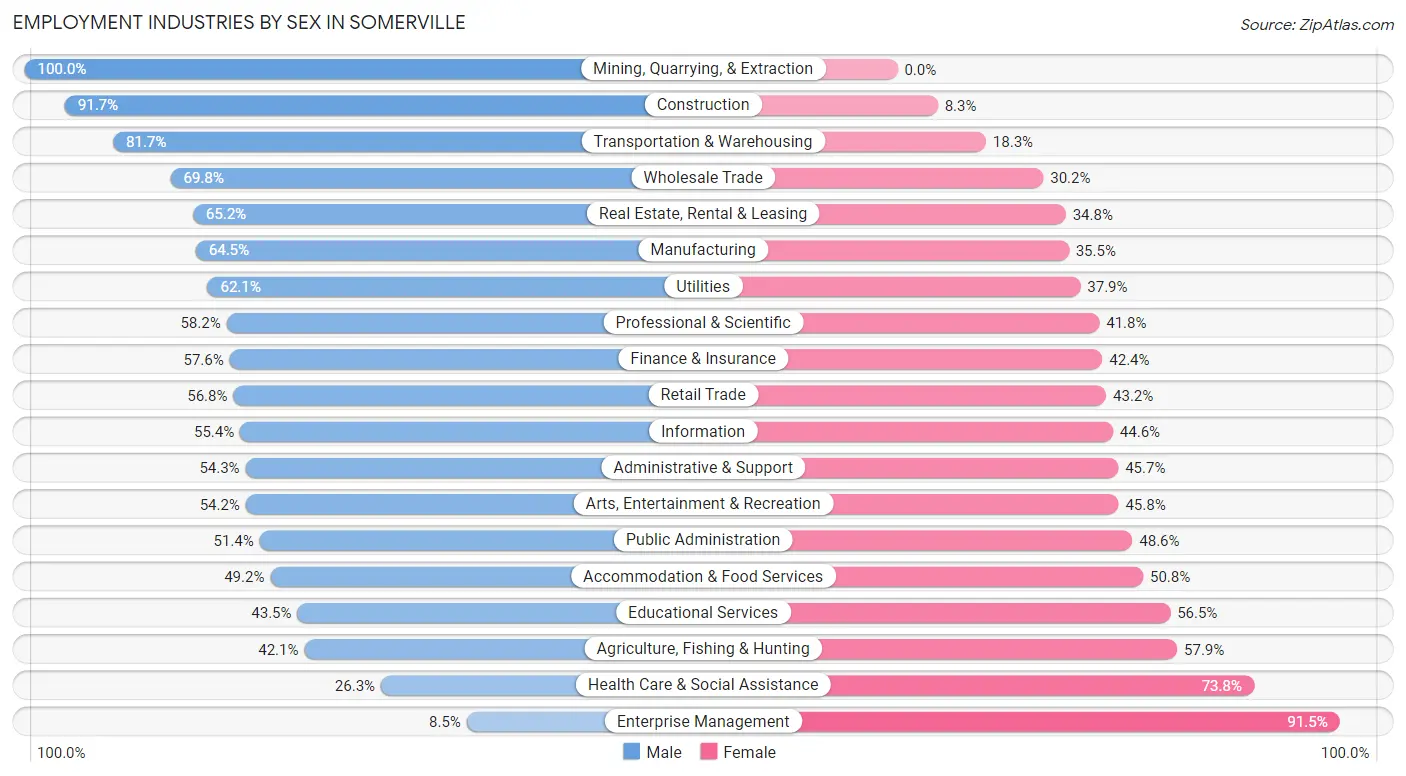
Employment Industries by Sex in Somerville
The Somerville industries that see more men than women are Mining, Quarrying, & Extraction (100.0%), Construction (91.7%), and Transportation & Warehousing (81.7%), whereas the industries that tend to have a higher number of women are Enterprise Management (91.5%), Health Care & Social Assistance (73.8%), and Agriculture, Fishing & Hunting (57.9%).
| Industry | Male | Female |
| Agriculture, Fishing & Hunting | 40 (42.1%) | 55 (57.9%) |
| Mining, Quarrying, & Extraction | 17 (100.0%) | 0 (0.0%) |
| Construction | 1,550 (91.7%) | 141 (8.3%) |
| Manufacturing | 2,932 (64.5%) | 1,611 (35.5%) |
| Wholesale Trade | 356 (69.8%) | 154 (30.2%) |
| Retail Trade | 2,317 (56.8%) | 1,762 (43.2%) |
| Transportation & Warehousing | 1,066 (81.7%) | 239 (18.3%) |
| Utilities | 228 (62.1%) | 139 (37.9%) |
| Information | 1,227 (55.4%) | 988 (44.6%) |
| Finance & Insurance | 1,098 (57.6%) | 809 (42.4%) |
| Real Estate, Rental & Leasing | 535 (65.2%) | 286 (34.8%) |
| Professional & Scientific | 7,159 (58.2%) | 5,139 (41.8%) |
| Enterprise Management | 9 (8.5%) | 97 (91.5%) |
| Administrative & Support | 880 (54.3%) | 741 (45.7%) |
| Educational Services | 4,545 (43.5%) | 5,894 (56.5%) |
| Health Care & Social Assistance | 1,789 (26.3%) | 5,026 (73.8%) |
| Arts, Entertainment & Recreation | 550 (54.2%) | 464 (45.8%) |
| Accommodation & Food Services | 1,490 (49.2%) | 1,541 (50.8%) |
| Public Administration | 600 (51.4%) | 568 (48.6%) |
| Total | 28,989 (51.8%) | 26,993 (48.2%) |
Education in Somerville
School Enrollment in Somerville
The most common levels of schooling among the 16,798 students in Somerville are college / undergraduate (5,470 | 32.6%), graduate / professional (5,024 | 29.9%), and elementary school (1,680 | 10.0%).
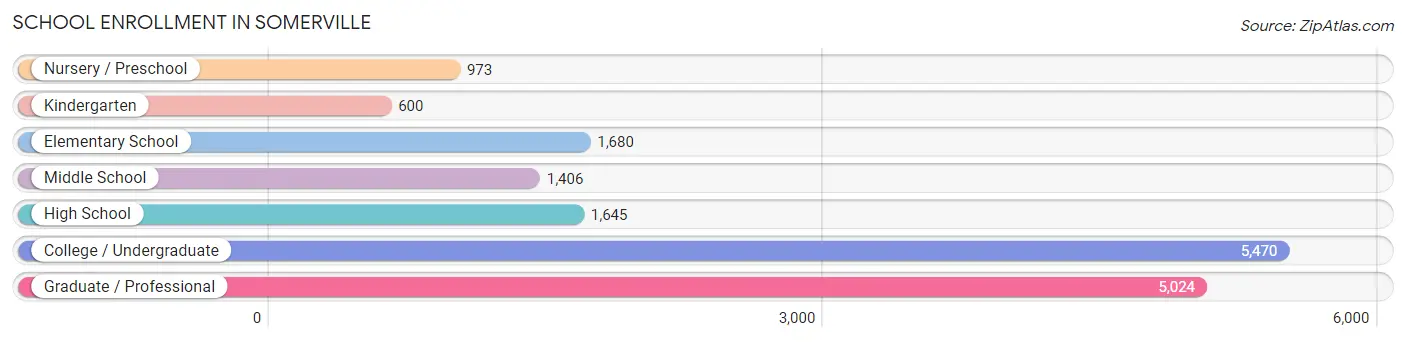
| School Level | # Students | % Students |
| Nursery / Preschool | 973 | 5.8% |
| Kindergarten | 600 | 3.6% |
| Elementary School | 1,680 | 10.0% |
| Middle School | 1,406 | 8.4% |
| High School | 1,645 | 9.8% |
| College / Undergraduate | 5,470 | 32.6% |
| Graduate / Professional | 5,024 | 29.9% |
| Total | 16,798 | 100.0% |
School Enrollment by Age by Funding Source in Somerville
Out of a total of 16,798 students who are enrolled in schools in Somerville, 9,625 (57.3%) attend a private institution, while the remaining 7,173 (42.7%) are enrolled in public schools. The age group of 25 to 34 year olds has the highest likelihood of being enrolled in private schools, with 3,222 (83.9% in the age bracket) enrolled. Conversely, the age group of 10 to 14 year olds has the lowest likelihood of being enrolled in a private school, with 1,750 (94.5% in the age bracket) attending a public institution.
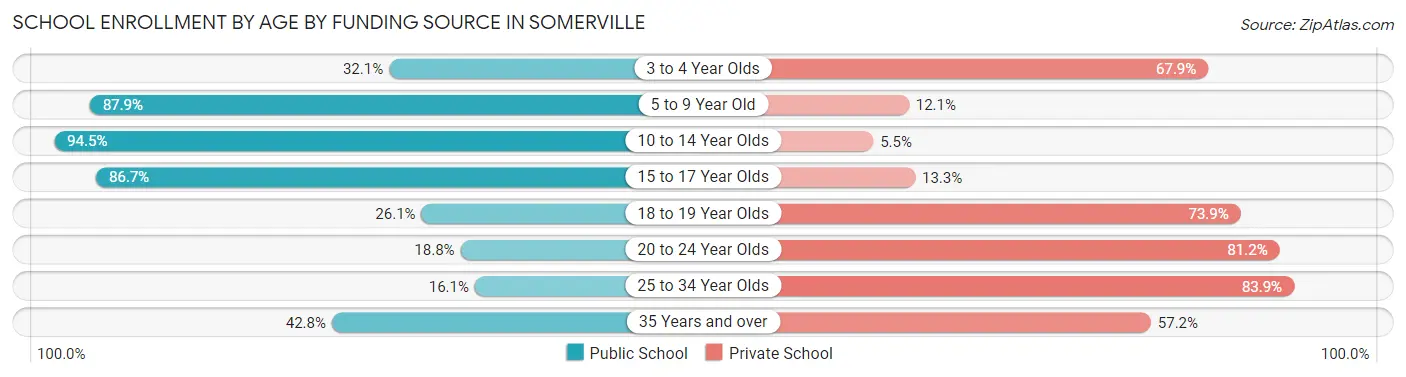
| Age Bracket | Public School | Private School |
| 3 to 4 Year Olds | 250 (32.1%) | 528 (67.9%) |
| 5 to 9 Year Old | 1,913 (87.9%) | 264 (12.1%) |
| 10 to 14 Year Olds | 1,750 (94.5%) | 102 (5.5%) |
| 15 to 17 Year Olds | 932 (86.7%) | 143 (13.3%) |
| 18 to 19 Year Olds | 592 (26.1%) | 1,677 (73.9%) |
| 20 to 24 Year Olds | 738 (18.8%) | 3,181 (81.2%) |
| 25 to 34 Year Olds | 620 (16.1%) | 3,222 (83.9%) |
| 35 Years and over | 379 (42.8%) | 507 (57.2%) |
| Total | 7,173 (42.7%) | 9,625 (57.3%) |
Educational Attainment by Field of Study in Somerville
Social sciences (5,619 | 12.1%), engineering (5,203 | 11.2%), business (4,696 | 10.1%), bio, nature & agricultural (4,687 | 10.1%), and literature & languages (3,405 | 7.3%) are the most common fields of study among 46,537 individuals in Somerville who have obtained a bachelor's degree or higher.
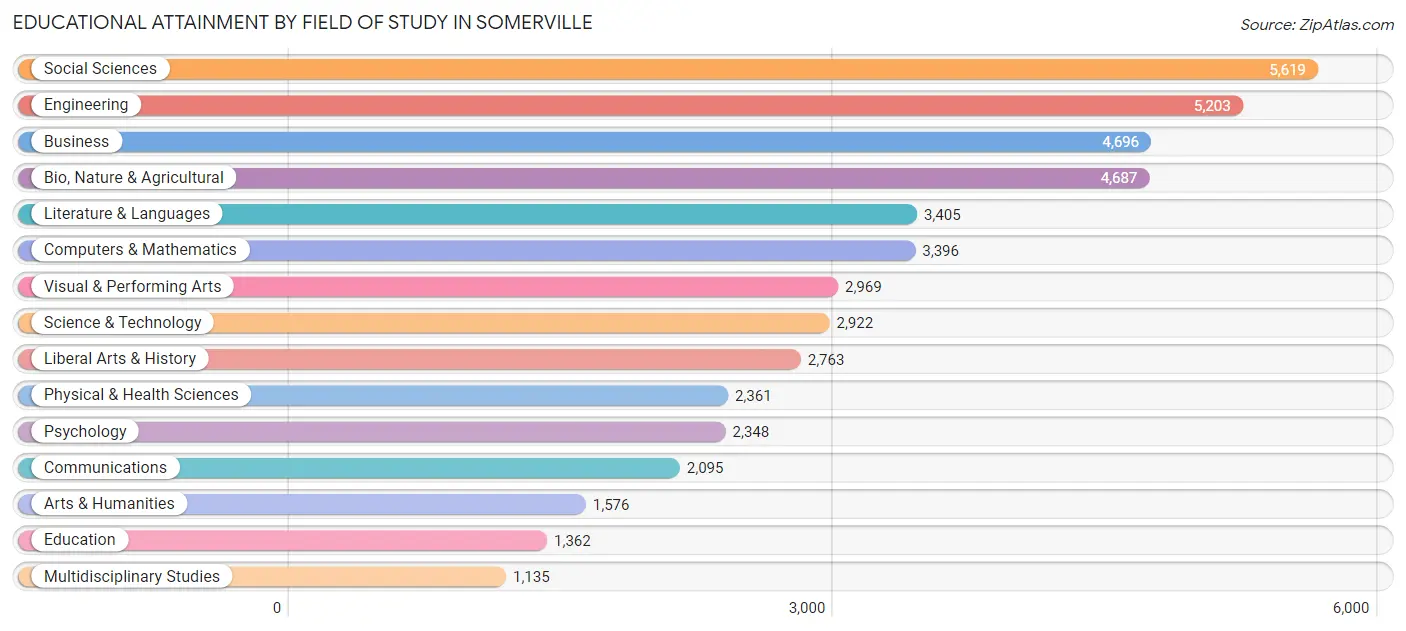
| Field of Study | # Graduates | % Graduates |
| Computers & Mathematics | 3,396 | 7.3% |
| Bio, Nature & Agricultural | 4,687 | 10.1% |
| Physical & Health Sciences | 2,361 | 5.1% |
| Psychology | 2,348 | 5.1% |
| Social Sciences | 5,619 | 12.1% |
| Engineering | 5,203 | 11.2% |
| Multidisciplinary Studies | 1,135 | 2.4% |
| Science & Technology | 2,922 | 6.3% |
| Business | 4,696 | 10.1% |
| Education | 1,362 | 2.9% |
| Literature & Languages | 3,405 | 7.3% |
| Liberal Arts & History | 2,763 | 5.9% |
| Visual & Performing Arts | 2,969 | 6.4% |
| Communications | 2,095 | 4.5% |
| Arts & Humanities | 1,576 | 3.4% |
| Total | 46,537 | 100.0% |
Transportation & Commute in Somerville
Vehicle Availability by Sex in Somerville
The most prevalent vehicle ownership categories in Somerville are males with 1 vehicle (12,406, accounting for 43.9%) and females with 1 vehicle (11,212, making up 47.3%).
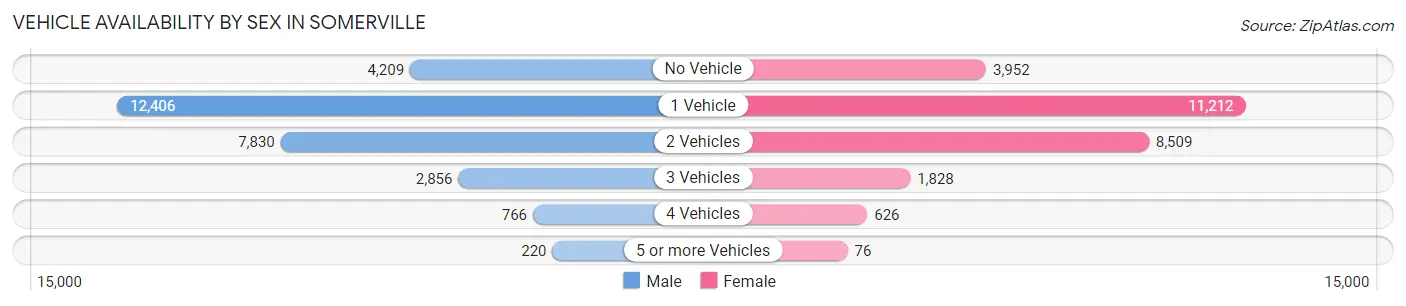
| Vehicles Available | Male | Female |
| No Vehicle | 4,209 (14.9%) | 3,952 (15.1%) |
| 1 Vehicle | 12,406 (43.9%) | 11,212 (42.8%) |
| 2 Vehicles | 7,830 (27.7%) | 8,509 (32.5%) |
| 3 Vehicles | 2,856 (10.1%) | 1,828 (7.0%) |
| 4 Vehicles | 766 (2.7%) | 626 (2.4%) |
| 5 or more Vehicles | 220 (0.8%) | 76 (0.3%) |
| Total | 28,287 (100.0%) | 26,203 (100.0%) |
Commute Time in Somerville
The most frequently occuring commute durations in Somerville are 30 to 34 minutes (7,670 commuters, 18.4%), 45 to 59 minutes (6,334 commuters, 15.2%), and 15 to 19 minutes (5,086 commuters, 12.2%).
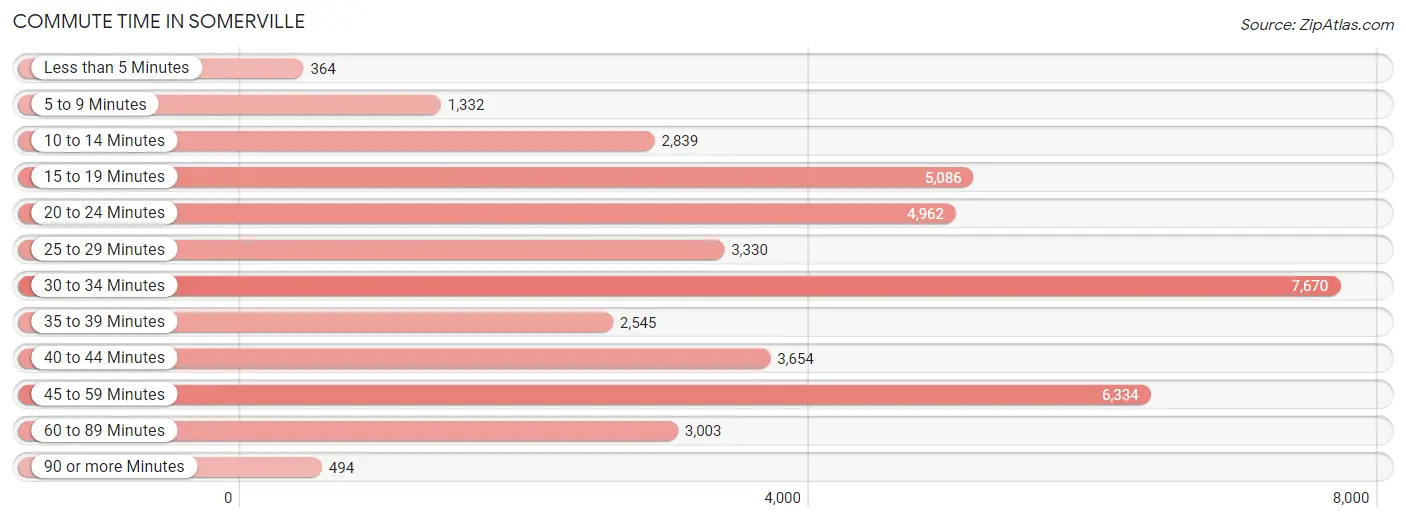
| Commute Time | # Commuters | % Commuters |
| Less than 5 Minutes | 364 | 0.9% |
| 5 to 9 Minutes | 1,332 | 3.2% |
| 10 to 14 Minutes | 2,839 | 6.8% |
| 15 to 19 Minutes | 5,086 | 12.2% |
| 20 to 24 Minutes | 4,962 | 11.9% |
| 25 to 29 Minutes | 3,330 | 8.0% |
| 30 to 34 Minutes | 7,670 | 18.4% |
| 35 to 39 Minutes | 2,545 | 6.1% |
| 40 to 44 Minutes | 3,654 | 8.8% |
| 45 to 59 Minutes | 6,334 | 15.2% |
| 60 to 89 Minutes | 3,003 | 7.2% |
| 90 or more Minutes | 494 | 1.2% |
Commute Time by Sex in Somerville
The most common commute times in Somerville are 30 to 34 minutes (4,133 commuters, 19.1%) for males and 30 to 34 minutes (3,537 commuters, 17.7%) for females.
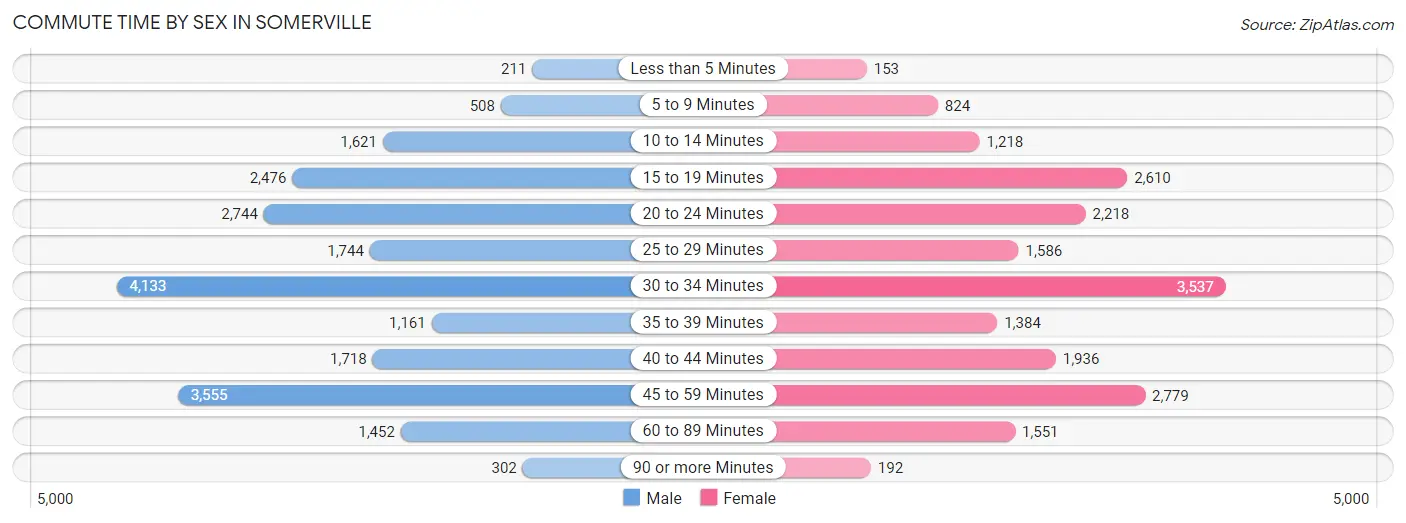
| Commute Time | Male | Female |
| Less than 5 Minutes | 211 (1.0%) | 153 (0.8%) |
| 5 to 9 Minutes | 508 (2.4%) | 824 (4.1%) |
| 10 to 14 Minutes | 1,621 (7.5%) | 1,218 (6.1%) |
| 15 to 19 Minutes | 2,476 (11.5%) | 2,610 (13.1%) |
| 20 to 24 Minutes | 2,744 (12.7%) | 2,218 (11.1%) |
| 25 to 29 Minutes | 1,744 (8.1%) | 1,586 (7.9%) |
| 30 to 34 Minutes | 4,133 (19.1%) | 3,537 (17.7%) |
| 35 to 39 Minutes | 1,161 (5.4%) | 1,384 (6.9%) |
| 40 to 44 Minutes | 1,718 (7.9%) | 1,936 (9.7%) |
| 45 to 59 Minutes | 3,555 (16.4%) | 2,779 (13.9%) |
| 60 to 89 Minutes | 1,452 (6.7%) | 1,551 (7.8%) |
| 90 or more Minutes | 302 (1.4%) | 192 (1.0%) |
Time of Departure to Work by Sex in Somerville
The most frequent times of departure to work in Somerville are 8:00 AM to 8:29 AM (3,986, 18.4%) for males and 8:00 AM to 8:29 AM (4,122, 20.6%) for females.
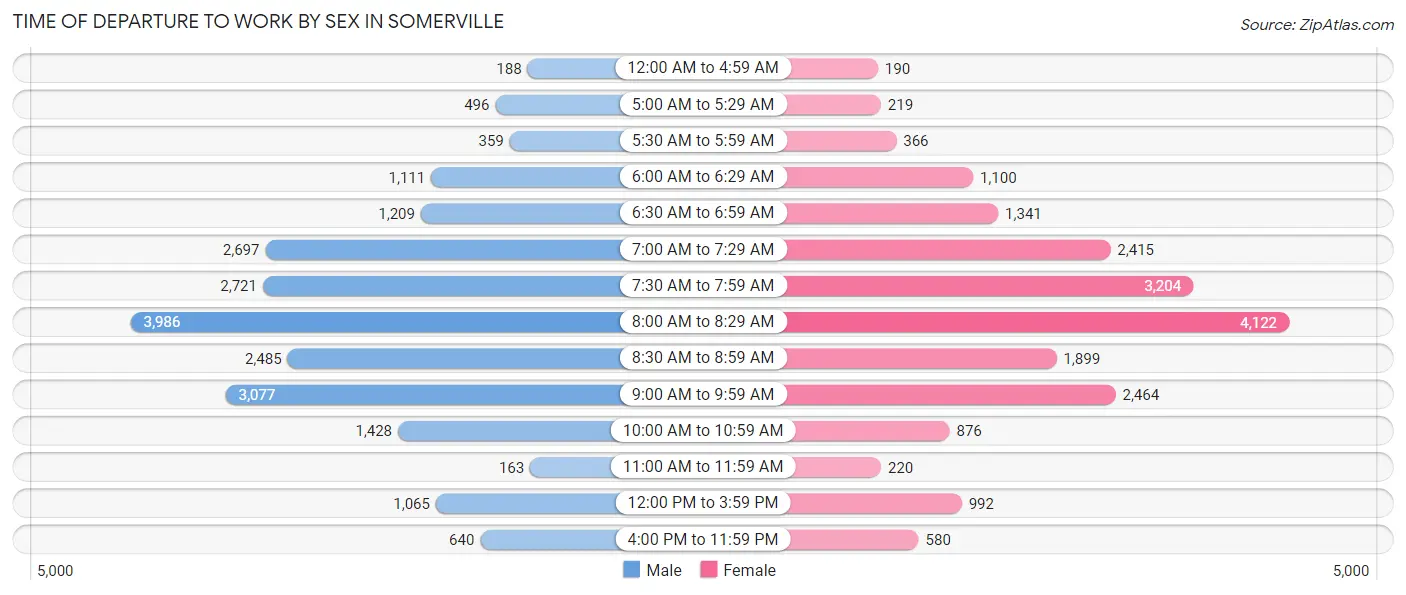
| Time of Departure | Male | Female |
| 12:00 AM to 4:59 AM | 188 (0.9%) | 190 (0.9%) |
| 5:00 AM to 5:29 AM | 496 (2.3%) | 219 (1.1%) |
| 5:30 AM to 5:59 AM | 359 (1.7%) | 366 (1.8%) |
| 6:00 AM to 6:29 AM | 1,111 (5.1%) | 1,100 (5.5%) |
| 6:30 AM to 6:59 AM | 1,209 (5.6%) | 1,341 (6.7%) |
| 7:00 AM to 7:29 AM | 2,697 (12.5%) | 2,415 (12.1%) |
| 7:30 AM to 7:59 AM | 2,721 (12.6%) | 3,204 (16.0%) |
| 8:00 AM to 8:29 AM | 3,986 (18.4%) | 4,122 (20.6%) |
| 8:30 AM to 8:59 AM | 2,485 (11.5%) | 1,899 (9.5%) |
| 9:00 AM to 9:59 AM | 3,077 (14.2%) | 2,464 (12.3%) |
| 10:00 AM to 10:59 AM | 1,428 (6.6%) | 876 (4.4%) |
| 11:00 AM to 11:59 AM | 163 (0.7%) | 220 (1.1%) |
| 12:00 PM to 3:59 PM | 1,065 (4.9%) | 992 (5.0%) |
| 4:00 PM to 11:59 PM | 640 (3.0%) | 580 (2.9%) |
| Total | 21,625 (100.0%) | 19,988 (100.0%) |
Housing Occupancy in Somerville
Occupancy by Ownership in Somerville
Of the total 35,035 dwellings in Somerville, owner-occupied units account for 11,783 (33.6%), while renter-occupied units make up 23,252 (66.4%).
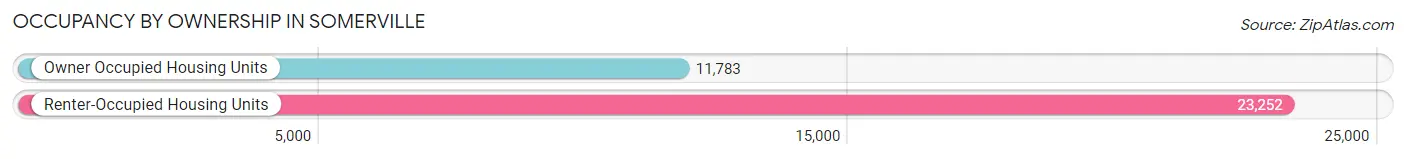
| Occupancy | # Housing Units | % Housing Units |
| Owner Occupied Housing Units | 11,783 | 33.6% |
| Renter-Occupied Housing Units | 23,252 | 66.4% |
| Total Occupied Housing Units | 35,035 | 100.0% |
Occupancy by Household Size in Somerville
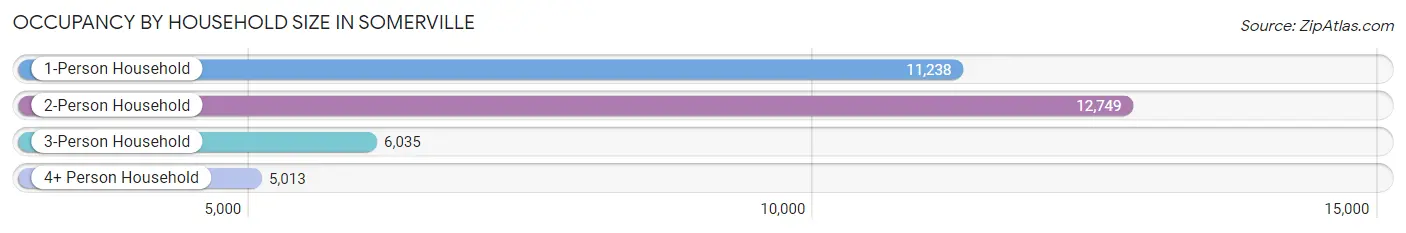
| Household Size | # Housing Units | % Housing Units |
| 1-Person Household | 11,238 | 32.1% |
| 2-Person Household | 12,749 | 36.4% |
| 3-Person Household | 6,035 | 17.2% |
| 4+ Person Household | 5,013 | 14.3% |
| Total Housing Units | 35,035 | 100.0% |
Occupancy by Ownership by Household Size in Somerville
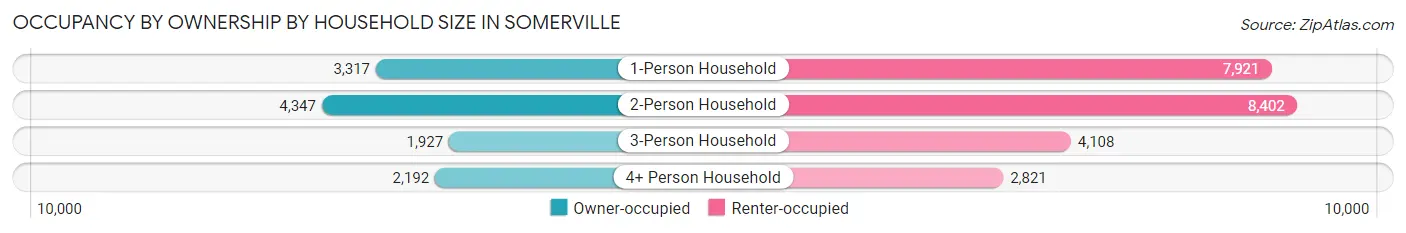
| Household Size | Owner-occupied | Renter-occupied |
| 1-Person Household | 3,317 (29.5%) | 7,921 (70.5%) |
| 2-Person Household | 4,347 (34.1%) | 8,402 (65.9%) |
| 3-Person Household | 1,927 (31.9%) | 4,108 (68.1%) |
| 4+ Person Household | 2,192 (43.7%) | 2,821 (56.3%) |
| Total Housing Units | 11,783 (33.6%) | 23,252 (66.4%) |
Occupancy by Educational Attainment in Somerville
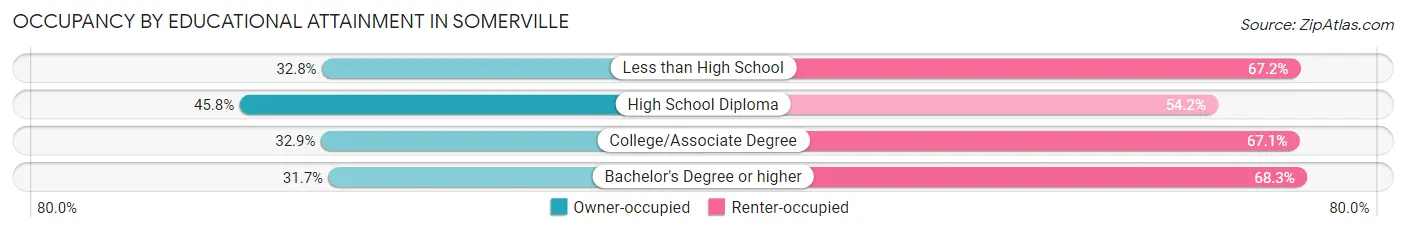
| Household Size | Owner-occupied | Renter-occupied |
| Less than High School | 815 (32.8%) | 1,673 (67.2%) |
| High School Diploma | 1,914 (45.8%) | 2,262 (54.2%) |
| College/Associate Degree | 1,434 (32.9%) | 2,920 (67.1%) |
| Bachelor's Degree or higher | 7,620 (31.7%) | 16,397 (68.3%) |
Occupancy by Age of Householder in Somerville
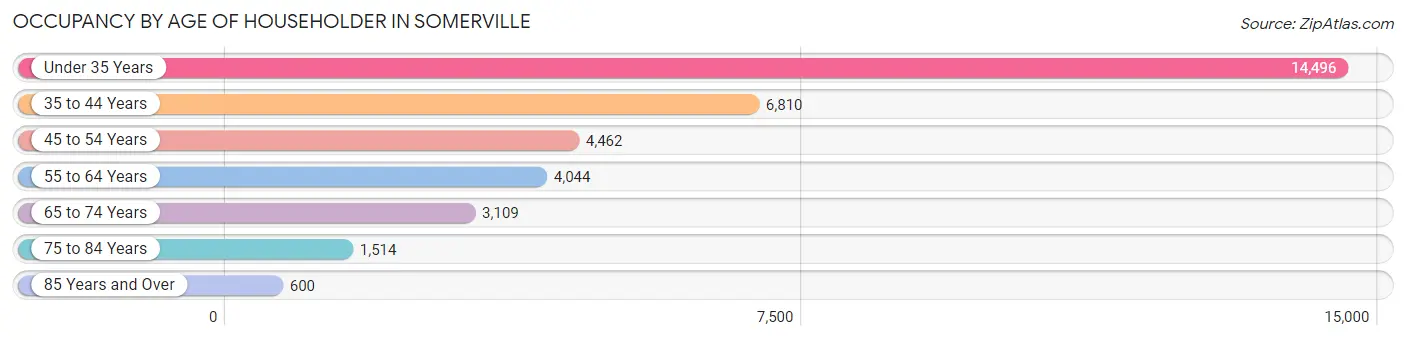
| Age Bracket | # Households | % Households |
| Under 35 Years | 14,496 | 41.4% |
| 35 to 44 Years | 6,810 | 19.4% |
| 45 to 54 Years | 4,462 | 12.7% |
| 55 to 64 Years | 4,044 | 11.5% |
| 65 to 74 Years | 3,109 | 8.9% |
| 75 to 84 Years | 1,514 | 4.3% |
| 85 Years and Over | 600 | 1.7% |
| Total | 35,035 | 100.0% |
Housing Finances in Somerville
Median Income by Occupancy in Somerville
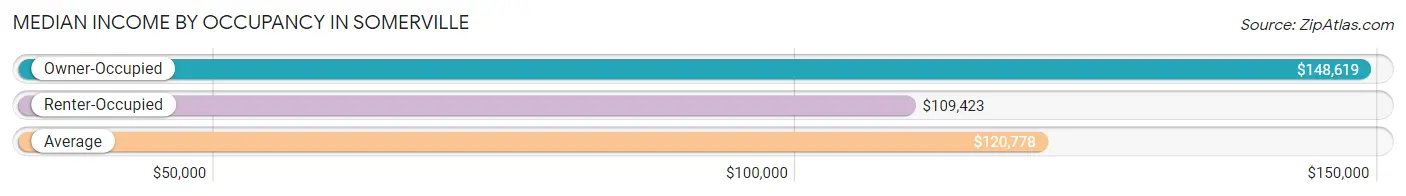
| Occupancy Type | # Households | Median Income |
| Owner-Occupied | 11,783 (33.6%) | $148,619 |
| Renter-Occupied | 23,252 (66.4%) | $109,423 |
| Average | 35,035 (100.0%) | $120,778 |
Occupancy by Householder Income Bracket in Somerville
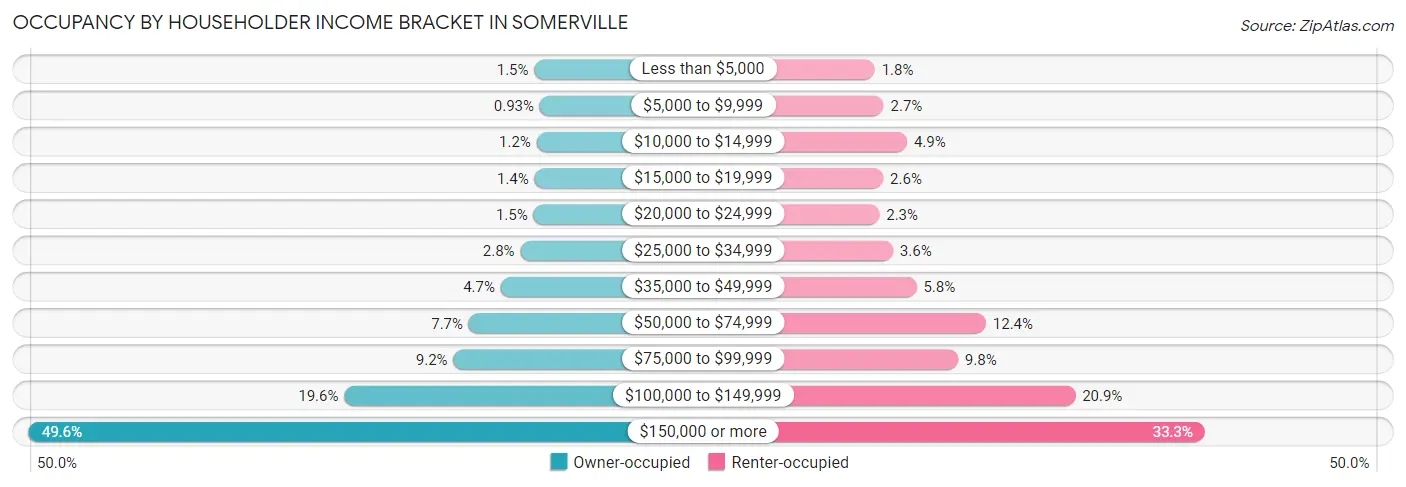
| Income Bracket | Owner-occupied | Renter-occupied |
| Less than $5,000 | 171 (1.5%) | 426 (1.8%) |
| $5,000 to $9,999 | 110 (0.9%) | 620 (2.7%) |
| $10,000 to $14,999 | 145 (1.2%) | 1,140 (4.9%) |
| $15,000 to $19,999 | 168 (1.4%) | 612 (2.6%) |
| $20,000 to $24,999 | 180 (1.5%) | 525 (2.3%) |
| $25,000 to $34,999 | 328 (2.8%) | 827 (3.6%) |
| $35,000 to $49,999 | 548 (4.6%) | 1,349 (5.8%) |
| $50,000 to $74,999 | 906 (7.7%) | 2,886 (12.4%) |
| $75,000 to $99,999 | 1,079 (9.2%) | 2,268 (9.8%) |
| $100,000 to $149,999 | 2,304 (19.6%) | 4,865 (20.9%) |
| $150,000 or more | 5,844 (49.6%) | 7,734 (33.3%) |
| Total | 11,783 (100.0%) | 23,252 (100.0%) |
Monthly Housing Cost Tiers in Somerville
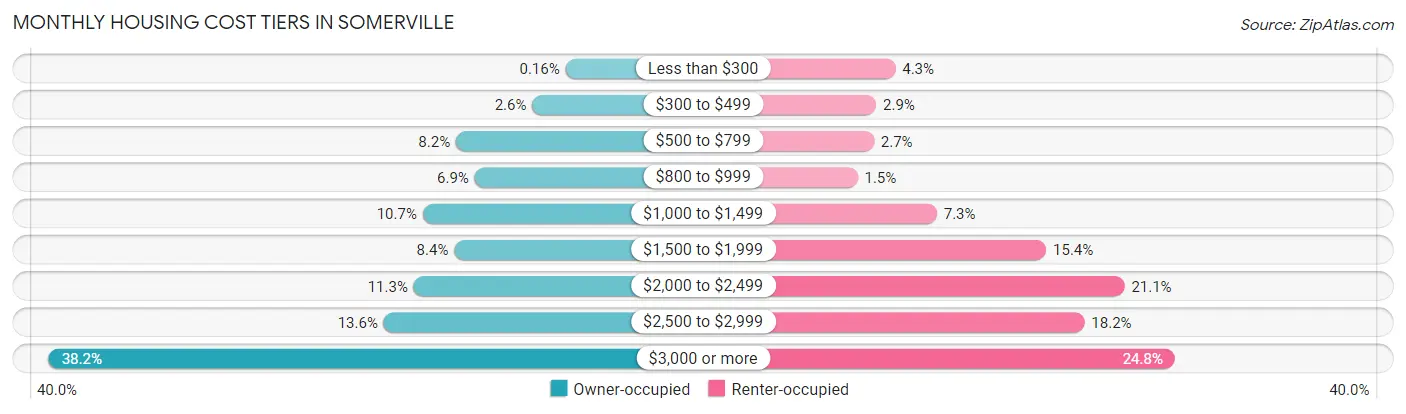
| Monthly Cost | Owner-occupied | Renter-occupied |
| Less than $300 | 19 (0.2%) | 990 (4.3%) |
| $300 to $499 | 307 (2.6%) | 662 (2.9%) |
| $500 to $799 | 970 (8.2%) | 624 (2.7%) |
| $800 to $999 | 807 (6.9%) | 343 (1.5%) |
| $1,000 to $1,499 | 1,258 (10.7%) | 1,702 (7.3%) |
| $1,500 to $1,999 | 985 (8.4%) | 3,573 (15.4%) |
| $2,000 to $2,499 | 1,336 (11.3%) | 4,915 (21.1%) |
| $2,500 to $2,999 | 1,597 (13.6%) | 4,229 (18.2%) |
| $3,000 or more | 4,504 (38.2%) | 5,775 (24.8%) |
| Total | 11,783 (100.0%) | 23,252 (100.0%) |
Physical Housing Characteristics in Somerville
Housing Structures in Somerville
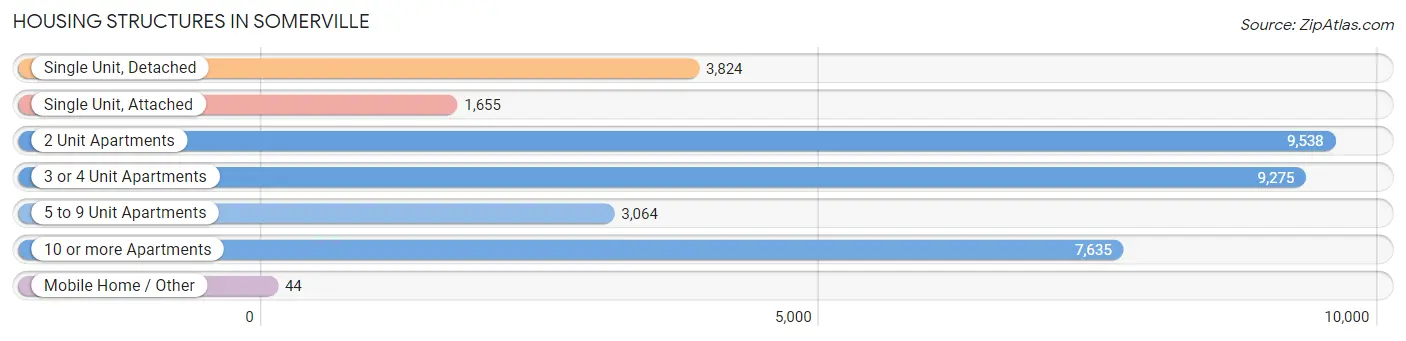
| Structure Type | # Housing Units | % Housing Units |
| Single Unit, Detached | 3,824 | 10.9% |
| Single Unit, Attached | 1,655 | 4.7% |
| 2 Unit Apartments | 9,538 | 27.2% |
| 3 or 4 Unit Apartments | 9,275 | 26.5% |
| 5 to 9 Unit Apartments | 3,064 | 8.7% |
| 10 or more Apartments | 7,635 | 21.8% |
| Mobile Home / Other | 44 | 0.1% |
| Total | 35,035 | 100.0% |
Housing Structures by Occupancy in Somerville
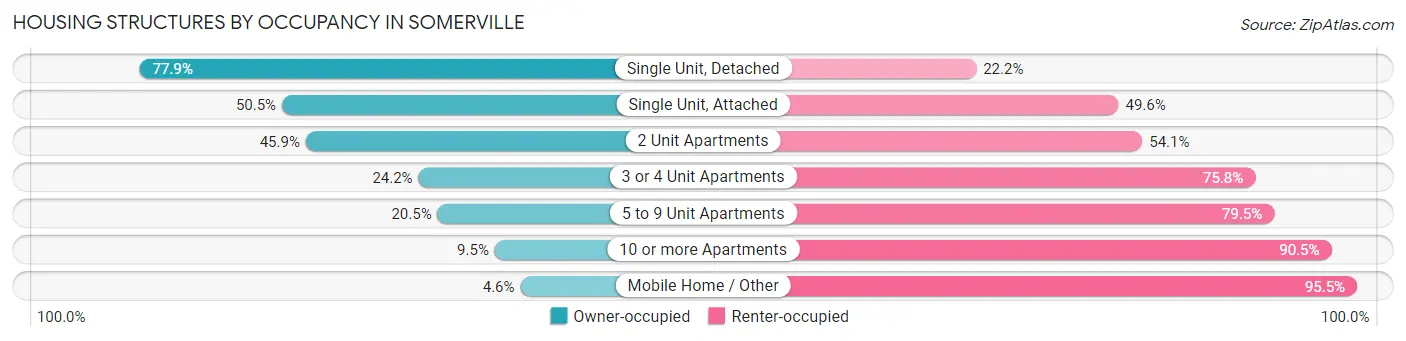
| Structure Type | Owner-occupied | Renter-occupied |
| Single Unit, Detached | 2,977 (77.8%) | 847 (22.2%) |
| Single Unit, Attached | 835 (50.4%) | 820 (49.5%) |
| 2 Unit Apartments | 4,375 (45.9%) | 5,163 (54.1%) |
| 3 or 4 Unit Apartments | 2,242 (24.2%) | 7,033 (75.8%) |
| 5 to 9 Unit Apartments | 628 (20.5%) | 2,436 (79.5%) |
| 10 or more Apartments | 724 (9.5%) | 6,911 (90.5%) |
| Mobile Home / Other | 2 (4.5%) | 42 (95.5%) |
| Total | 11,783 (33.6%) | 23,252 (66.4%) |
Housing Structures by Number of Rooms in Somerville
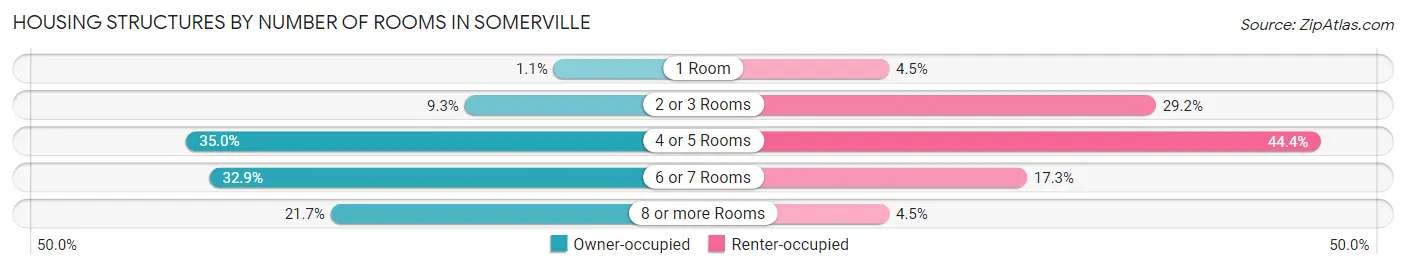
| Number of Rooms | Owner-occupied | Renter-occupied |
| 1 Room | 127 (1.1%) | 1,056 (4.5%) |
| 2 or 3 Rooms | 1,096 (9.3%) | 6,793 (29.2%) |
| 4 or 5 Rooms | 4,129 (35.0%) | 10,327 (44.4%) |
| 6 or 7 Rooms | 3,875 (32.9%) | 4,020 (17.3%) |
| 8 or more Rooms | 2,556 (21.7%) | 1,056 (4.5%) |
| Total | 11,783 (100.0%) | 23,252 (100.0%) |
Housing Structure by Heating Type in Somerville
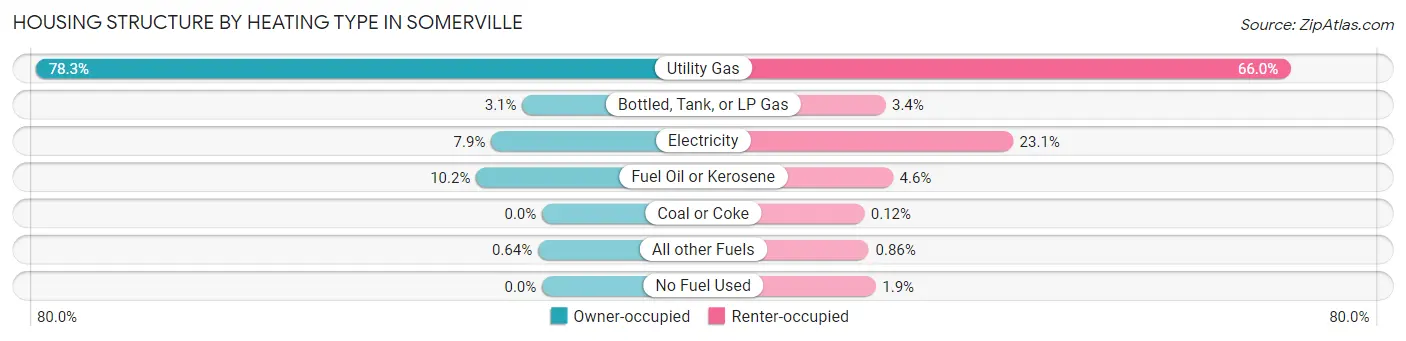
| Heating Type | Owner-occupied | Renter-occupied |
| Utility Gas | 9,224 (78.3%) | 15,349 (66.0%) |
| Bottled, Tank, or LP Gas | 359 (3.0%) | 791 (3.4%) |
| Electricity | 926 (7.9%) | 5,379 (23.1%) |
| Fuel Oil or Kerosene | 1,199 (10.2%) | 1,063 (4.6%) |
| Coal or Coke | 0 (0.0%) | 28 (0.1%) |
| All other Fuels | 75 (0.6%) | 200 (0.9%) |
| No Fuel Used | 0 (0.0%) | 442 (1.9%) |
| Total | 11,783 (100.0%) | 23,252 (100.0%) |
Household Vehicle Usage in Somerville
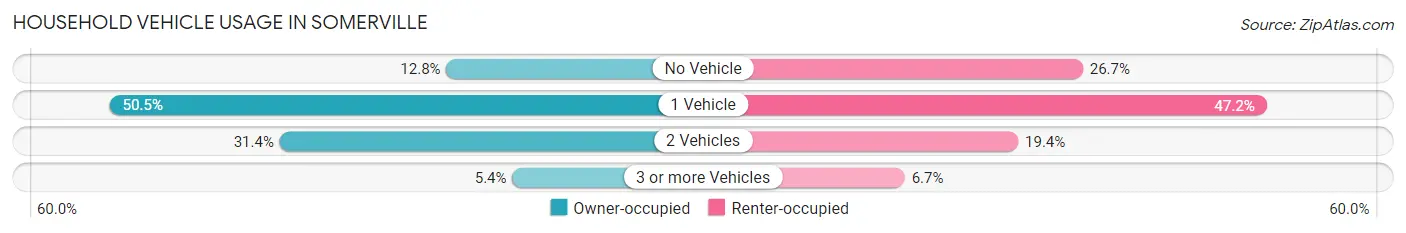
| Vehicles per Household | Owner-occupied | Renter-occupied |
| No Vehicle | 1,502 (12.8%) | 6,196 (26.7%) |
| 1 Vehicle | 5,948 (50.5%) | 10,985 (47.2%) |
| 2 Vehicles | 3,702 (31.4%) | 4,512 (19.4%) |
| 3 or more Vehicles | 631 (5.4%) | 1,559 (6.7%) |
| Total | 11,783 (100.0%) | 23,252 (100.0%) |
Real Estate & Mortgages in Somerville
Real Estate and Mortgage Overview in Somerville
| Characteristic | Without Mortgage | With Mortgage |
| Housing Units | 3,701 | 8,082 |
| Median Property Value | $892,600 | $845,700 |
| Median Household Income | $100,338 | $4,696 |
| Monthly Housing Costs | $973 | $4,487 |
| Real Estate Taxes | $5,759 | $76 |
Property Value by Mortgage Status in Somerville
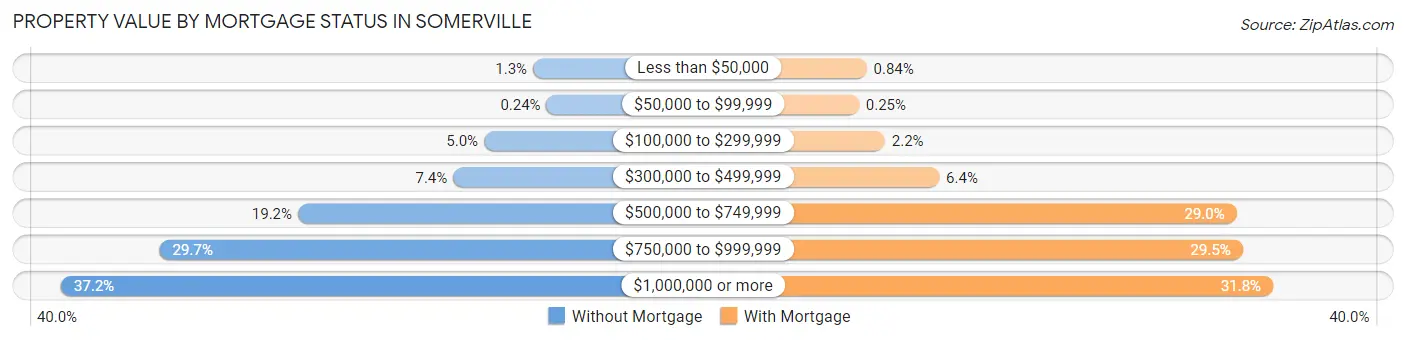
| Property Value | Without Mortgage | With Mortgage |
| Less than $50,000 | 47 (1.3%) | 68 (0.8%) |
| $50,000 to $99,999 | 9 (0.2%) | 20 (0.3%) |
| $100,000 to $299,999 | 185 (5.0%) | 180 (2.2%) |
| $300,000 to $499,999 | 272 (7.3%) | 515 (6.4%) |
| $500,000 to $749,999 | 710 (19.2%) | 2,346 (29.0%) |
| $750,000 to $999,999 | 1,100 (29.7%) | 2,383 (29.5%) |
| $1,000,000 or more | 1,378 (37.2%) | 2,570 (31.8%) |
| Total | 3,701 (100.0%) | 8,082 (100.0%) |
Household Income by Mortgage Status in Somerville
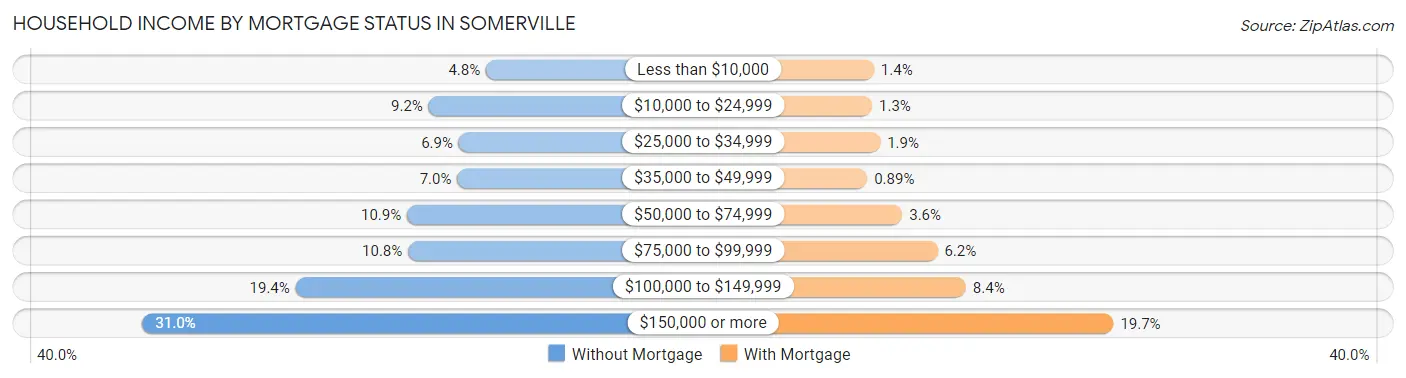
| Household Income | Without Mortgage | With Mortgage |
| Less than $10,000 | 179 (4.8%) | 113 (1.4%) |
| $10,000 to $24,999 | 341 (9.2%) | 102 (1.3%) |
| $25,000 to $34,999 | 256 (6.9%) | 152 (1.9%) |
| $35,000 to $49,999 | 260 (7.0%) | 72 (0.9%) |
| $50,000 to $74,999 | 402 (10.9%) | 288 (3.6%) |
| $75,000 to $99,999 | 399 (10.8%) | 504 (6.2%) |
| $100,000 to $149,999 | 716 (19.4%) | 680 (8.4%) |
| $150,000 or more | 1,148 (31.0%) | 1,588 (19.7%) |
| Total | 3,701 (100.0%) | 8,082 (100.0%) |
Property Value to Household Income Ratio in Somerville
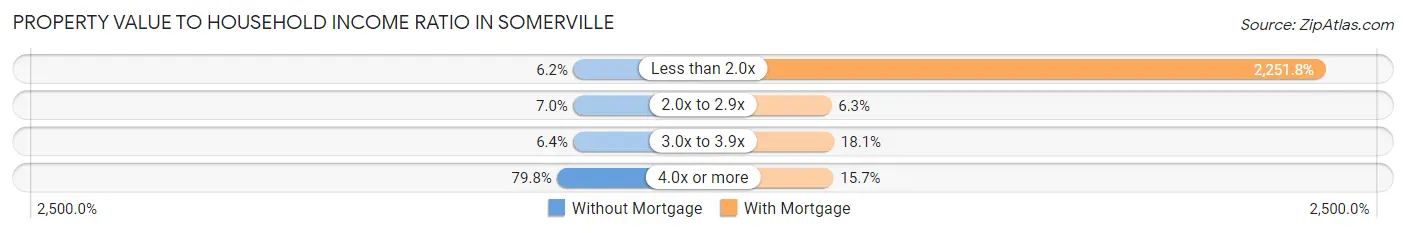
| Value-to-Income Ratio | Without Mortgage | With Mortgage |
| Less than 2.0x | 229 (6.2%) | 181,993 (2,251.8%) |
| 2.0x to 2.9x | 260 (7.0%) | 507 (6.3%) |
| 3.0x to 3.9x | 236 (6.4%) | 1,459 (18.0%) |
| 4.0x or more | 2,953 (79.8%) | 1,271 (15.7%) |
| Total | 3,701 (100.0%) | 8,082 (100.0%) |
Real Estate Taxes by Mortgage Status in Somerville
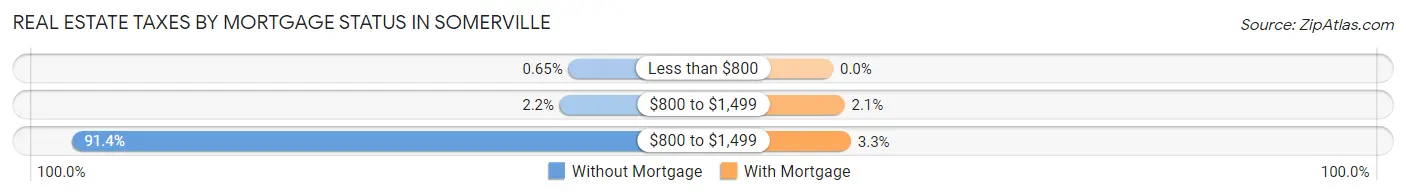
| Property Taxes | Without Mortgage | With Mortgage |
| Less than $800 | 24 (0.6%) | 0 (0.0%) |
| $800 to $1,499 | 83 (2.2%) | 170 (2.1%) |
| $800 to $1,499 | 3,384 (91.4%) | 263 (3.3%) |
| Total | 3,701 (100.0%) | 8,082 (100.0%) |
Health & Disability in Somerville
Health Insurance Coverage by Age in Somerville
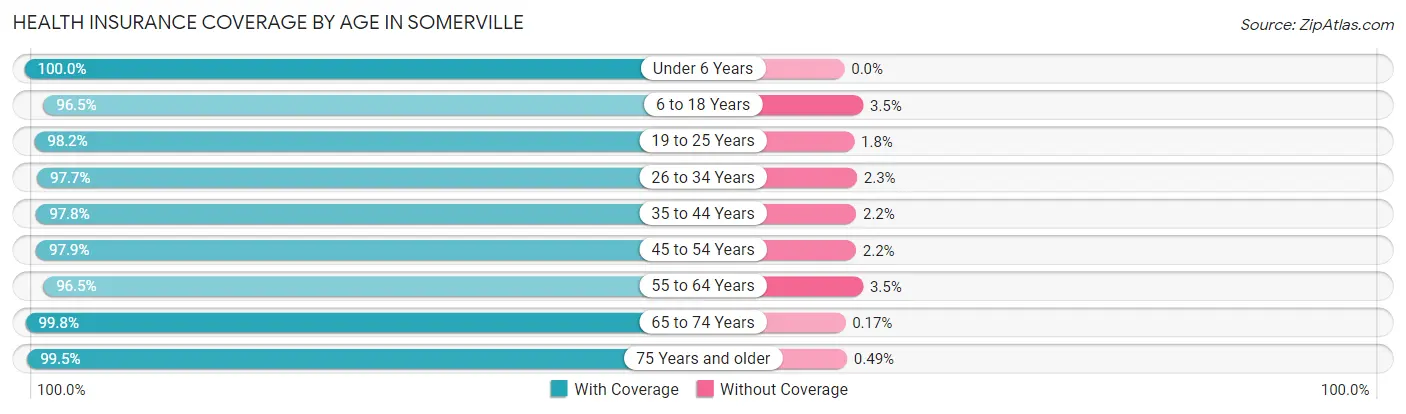
| Age Bracket | With Coverage | Without Coverage |
| Under 6 Years | 3,669 (100.0%) | 0 (0.0%) |
| 6 to 18 Years | 5,677 (96.5%) | 206 (3.5%) |
| 19 to 25 Years | 14,085 (98.2%) | 263 (1.8%) |
| 26 to 34 Years | 21,714 (97.7%) | 520 (2.3%) |
| 35 to 44 Years | 11,904 (97.8%) | 266 (2.2%) |
| 45 to 54 Years | 7,288 (97.9%) | 160 (2.1%) |
| 55 to 64 Years | 6,499 (96.5%) | 234 (3.5%) |
| 65 to 74 Years | 4,721 (99.8%) | 8 (0.2%) |
| 75 Years and older | 3,075 (99.5%) | 15 (0.5%) |
| Total | 78,632 (97.9%) | 1,672 (2.1%) |
Health Insurance Coverage by Citizenship Status in Somerville
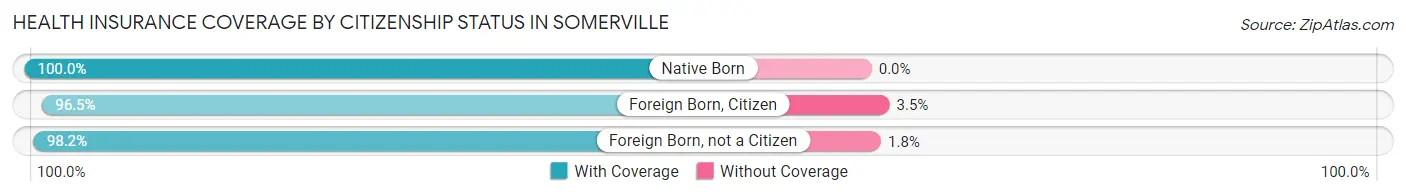
| Citizenship Status | With Coverage | Without Coverage |
| Native Born | 3,669 (100.0%) | 0 (0.0%) |
| Foreign Born, Citizen | 5,677 (96.5%) | 206 (3.5%) |
| Foreign Born, not a Citizen | 14,085 (98.2%) | 263 (1.8%) |
Health Insurance Coverage by Household Income in Somerville
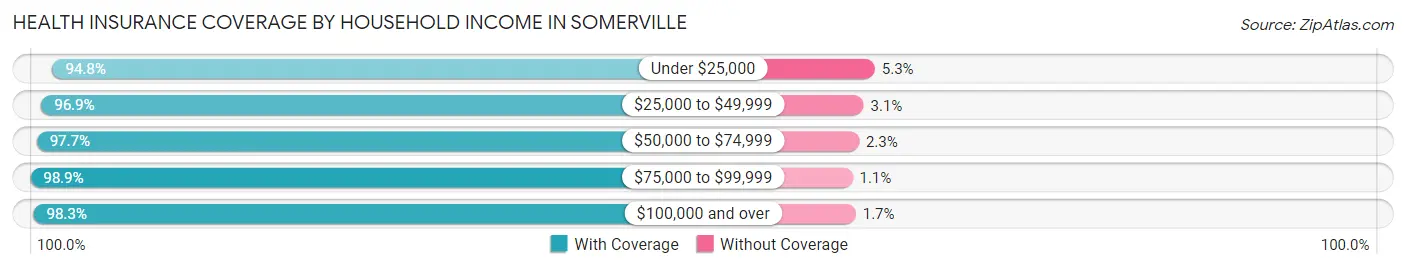
| Household Income | With Coverage | Without Coverage |
| Under $25,000 | 5,579 (94.8%) | 309 (5.2%) |
| $25,000 to $49,999 | 5,065 (96.9%) | 164 (3.1%) |
| $50,000 to $74,999 | 7,555 (97.7%) | 176 (2.3%) |
| $75,000 to $99,999 | 6,469 (98.9%) | 70 (1.1%) |
| $100,000 and over | 51,303 (98.3%) | 879 (1.7%) |
Public vs Private Health Insurance Coverage by Age in Somerville
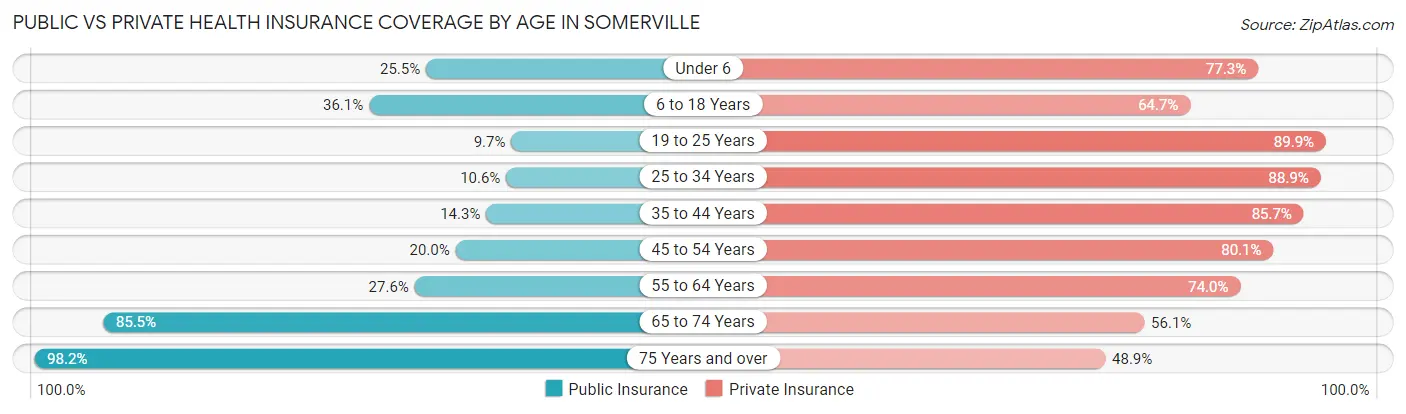
| Age Bracket | Public Insurance | Private Insurance |
| Under 6 | 935 (25.5%) | 2,835 (77.3%) |
| 6 to 18 Years | 2,122 (36.1%) | 3,804 (64.7%) |
| 19 to 25 Years | 1,386 (9.7%) | 12,891 (89.8%) |
| 25 to 34 Years | 2,358 (10.6%) | 19,761 (88.9%) |
| 35 to 44 Years | 1,741 (14.3%) | 10,433 (85.7%) |
| 45 to 54 Years | 1,490 (20.0%) | 5,966 (80.1%) |
| 55 to 64 Years | 1,858 (27.6%) | 4,980 (74.0%) |
| 65 to 74 Years | 4,042 (85.5%) | 2,654 (56.1%) |
| 75 Years and over | 3,035 (98.2%) | 1,510 (48.9%) |
| Total | 18,967 (23.6%) | 64,834 (80.7%) |
Disability Status by Sex by Age in Somerville
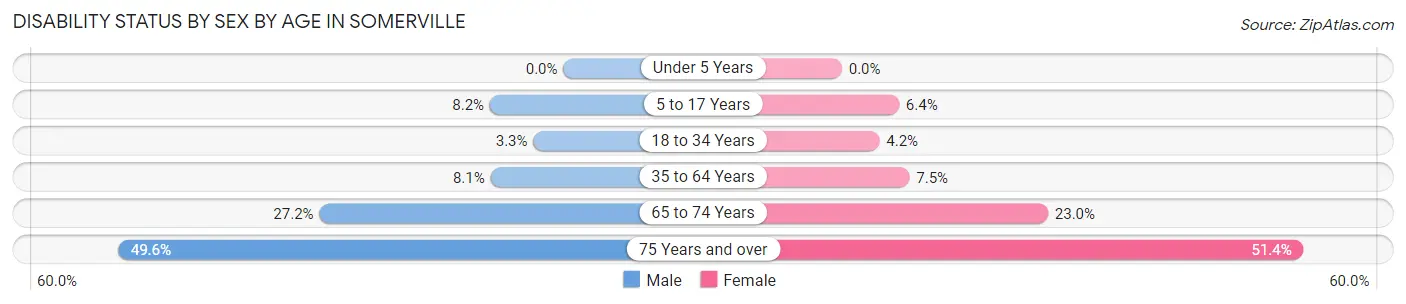
| Age Bracket | Male | Female |
| Under 5 Years | 0 (0.0%) | 0 (0.0%) |
| 5 to 17 Years | 232 (8.2%) | 154 (6.4%) |
| 18 to 34 Years | 622 (3.3%) | 802 (4.2%) |
| 35 to 64 Years | 1,137 (8.1%) | 928 (7.5%) |
| 65 to 74 Years | 551 (27.2%) | 620 (23.0%) |
| 75 Years and over | 522 (49.6%) | 1,048 (51.4%) |
Disability Class by Sex by Age in Somerville
Disability Class: Hearing Difficulty
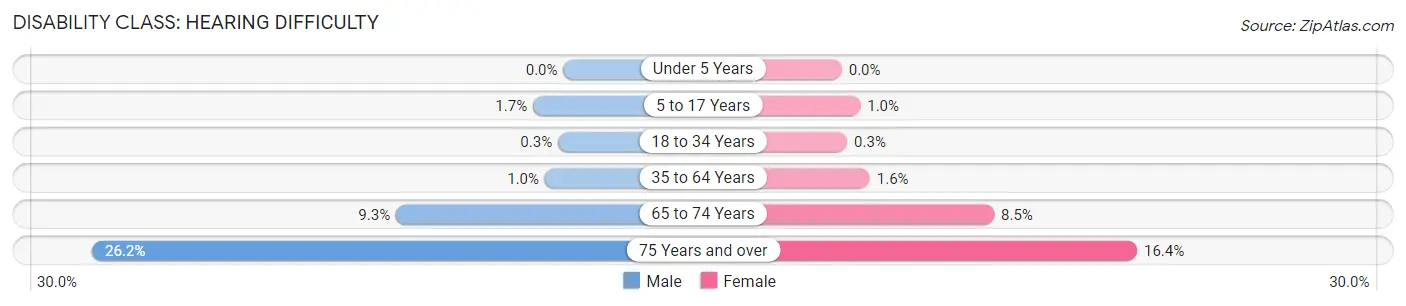
| Age Bracket | Male | Female |
| Under 5 Years | 0 (0.0%) | 0 (0.0%) |
| 5 to 17 Years | 48 (1.7%) | 25 (1.0%) |
| 18 to 34 Years | 56 (0.3%) | 58 (0.3%) |
| 35 to 64 Years | 144 (1.0%) | 192 (1.6%) |
| 65 to 74 Years | 189 (9.3%) | 229 (8.5%) |
| 75 Years and over | 276 (26.2%) | 335 (16.4%) |
Disability Class: Vision Difficulty
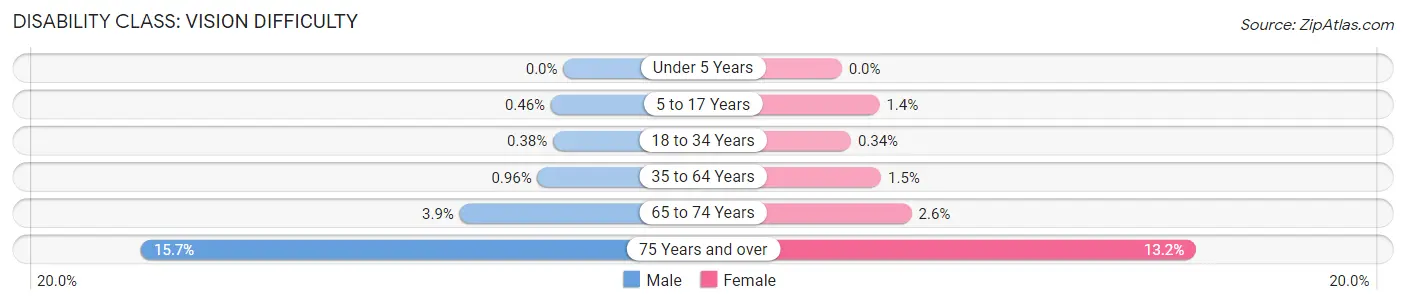
| Age Bracket | Male | Female |
| Under 5 Years | 0 (0.0%) | 0 (0.0%) |
| 5 to 17 Years | 13 (0.5%) | 34 (1.4%) |
| 18 to 34 Years | 71 (0.4%) | 66 (0.3%) |
| 35 to 64 Years | 134 (1.0%) | 180 (1.5%) |
| 65 to 74 Years | 78 (3.8%) | 70 (2.6%) |
| 75 Years and over | 165 (15.7%) | 268 (13.2%) |
Disability Class: Cognitive Difficulty
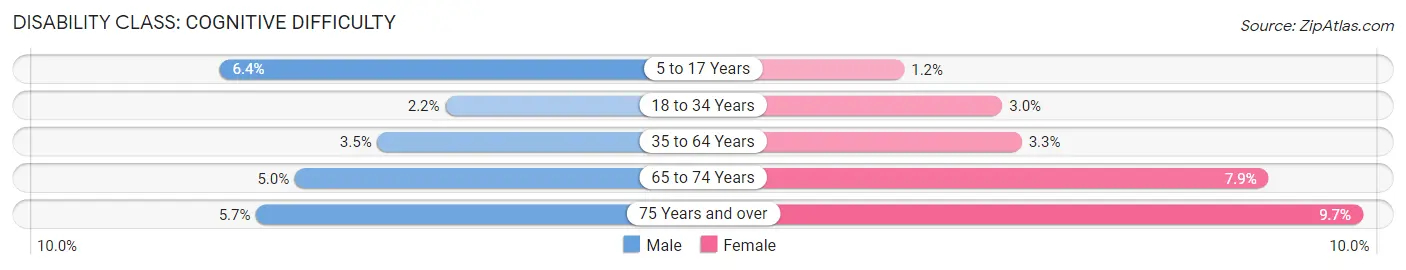
| Age Bracket | Male | Female |
| 5 to 17 Years | 181 (6.4%) | 28 (1.2%) |
| 18 to 34 Years | 408 (2.2%) | 572 (3.0%) |
| 35 to 64 Years | 484 (3.5%) | 412 (3.3%) |
| 65 to 74 Years | 101 (5.0%) | 214 (7.9%) |
| 75 Years and over | 60 (5.7%) | 197 (9.7%) |
Disability Class: Ambulatory Difficulty
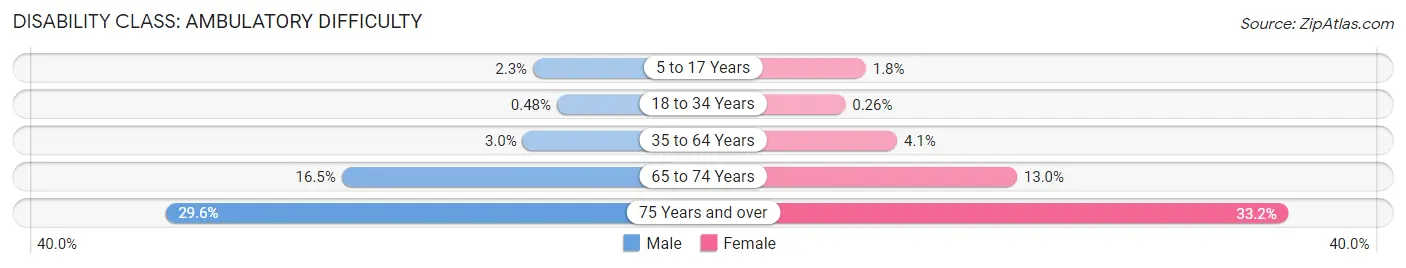
| Age Bracket | Male | Female |
| 5 to 17 Years | 64 (2.3%) | 43 (1.8%) |
| 18 to 34 Years | 89 (0.5%) | 50 (0.3%) |
| 35 to 64 Years | 425 (3.0%) | 506 (4.1%) |
| 65 to 74 Years | 334 (16.5%) | 351 (13.0%) |
| 75 Years and over | 311 (29.6%) | 676 (33.2%) |
Disability Class: Self-Care Difficulty
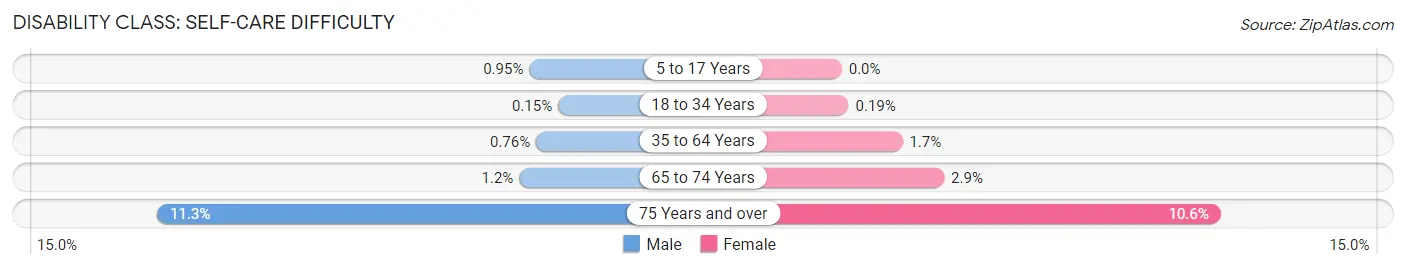
| Age Bracket | Male | Female |
| 5 to 17 Years | 27 (0.9%) | 0 (0.0%) |
| 18 to 34 Years | 27 (0.2%) | 37 (0.2%) |
| 35 to 64 Years | 106 (0.8%) | 209 (1.7%) |
| 65 to 74 Years | 25 (1.2%) | 77 (2.9%) |
| 75 Years and over | 119 (11.3%) | 215 (10.5%) |
Technology Access in Somerville
Computing Device Access in Somerville
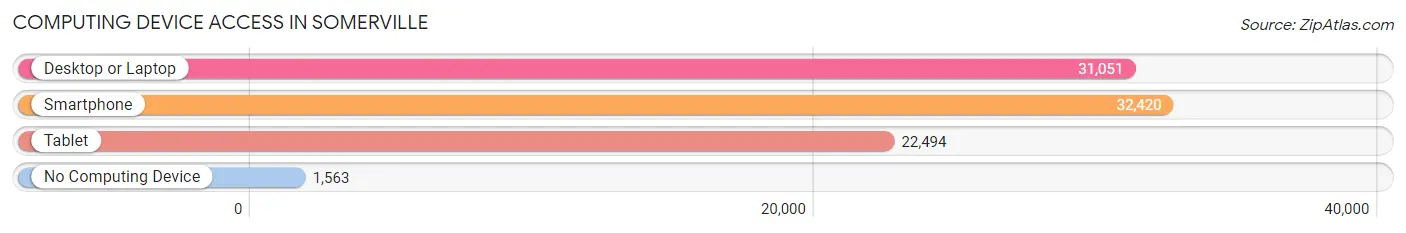
| Device Type | # Households | % Households |
| Desktop or Laptop | 31,051 | 88.6% |
| Smartphone | 32,420 | 92.5% |
| Tablet | 22,494 | 64.2% |
| No Computing Device | 1,563 | 4.5% |
| Total | 35,035 | 100.0% |
Internet Access in Somerville
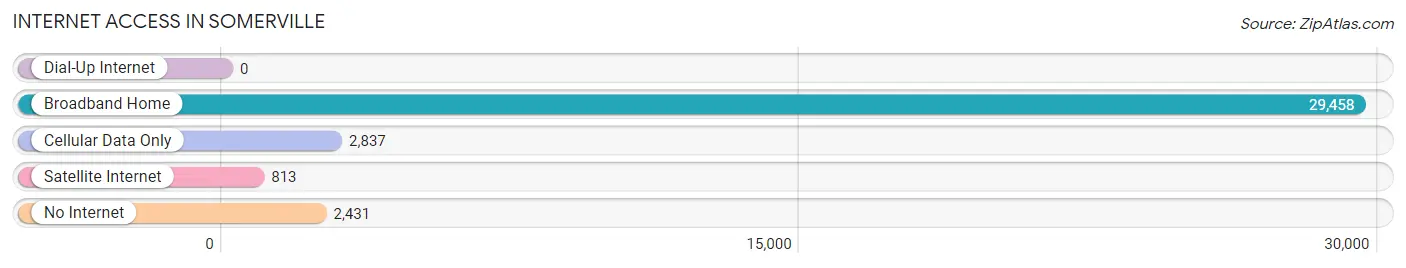
| Internet Type | # Households | % Households |
| Dial-Up Internet | 0 | 0.0% |
| Broadband Home | 29,458 | 84.1% |
| Cellular Data Only | 2,837 | 8.1% |
| Satellite Internet | 813 | 2.3% |
| No Internet | 2,431 | 6.9% |
| Total | 35,035 | 100.0% |
Somerville Summary
Somerville, Massachusetts is a city located in Middlesex County, just north of Boston. It is a densely populated city with a population of 75,754 as of the 2010 census. The city is known for its diverse population, vibrant culture, and its close proximity to Boston.
History
Somerville was first settled in 1630 and was originally part of Charlestown. It was officially incorporated as a town in 1842 and was named after Colonel Josiah Somerville, a Revolutionary War hero. In 1872, Somerville was annexed by the City of Boston, but it regained its independence in 1874.
In the late 19th century, Somerville was a major industrial center, with factories producing leather goods, rubber, and textiles. The city was also home to a large Irish-American population, and many of the city’s streets were named after Irish immigrants.
In the early 20th century, Somerville experienced a period of rapid growth and development. The city was home to a large Italian-American population, and many of the city’s streets were named after Italian immigrants. The city also became a major center for the arts, with many artists and writers living in the city.
Geography
Somerville is located in Middlesex County, just north of Boston. It is bordered by Cambridge to the east, Medford to the north, Arlington to the west, and Boston to the south. The city is located on the Mystic River, and is home to several parks and open spaces, including the Mystic River Reservation and the Somerville Community Path.
The city is divided into several neighborhoods, including Davis Square, Union Square, Teele Square, and Winter Hill. The city is also home to several colleges and universities, including Tufts University, Harvard University, and the Massachusetts Institute of Technology.
Economy
Somerville’s economy is largely based on education, healthcare, and technology. The city is home to several major employers, including Tufts University, Harvard University, and the Massachusetts Institute of Technology. The city is also home to several major healthcare providers, including Cambridge Health Alliance and Beth Israel Deaconess Medical Center.
The city is also home to several major technology companies, including Akamai Technologies, HubSpot, and Vertex Pharmaceuticals. The city is also home to several major retail stores, including Target, Best Buy, and Whole Foods.
Demographics
As of the 2010 census, Somerville had a population of 75,754. The city is racially and ethnically diverse, with the largest racial/ethnic groups being White (54.3%), Hispanic or Latino (19.2%), and Asian (14.2%). The city is also home to a large immigrant population, with the largest immigrant groups being from Brazil (7.2%), El Salvador (4.2%), and China (3.7%).
The median household income in Somerville is $68,845, and the median home value is $541,400. The city has a high rate of homeownership, with 63.3% of households owning their own homes. The city also has a high rate of educational attainment, with 87.2% of adults having at least a high school diploma and 44.2% having a bachelor’s degree or higher.
Common Questions
What is Per Capita Income in Somerville?
Per Capita income in Somerville is $65,100.
What is the Median Family Income in Somerville?
Median Family Income in Somerville is $140,931.
What is the Median Household income in Somerville?
Median Household Income in Somerville is $120,778.
What is Income or Wage Gap in Somerville?
Income or Wage Gap in Somerville is 21.0%.
Women in Somerville earn 79.0 cents for every dollar earned by a man.
What is Family Income Deficit in Somerville?
Family Income Deficit in Somerville is $8,937.
Families that are below poverty line in Somerville earn $8,937 less on average than the poverty threshold level.
What is Inequality or Gini Index in Somerville?
Inequality or Gini Index in Somerville is 0.43.
What is the Total Population of Somerville?
Total Population of Somerville is 80,464.
What is the Total Male Population of Somerville?
Total Male Population of Somerville is 40,143.
What is the Total Female Population of Somerville?
Total Female Population of Somerville is 40,321.
What is the Ratio of Males per 100 Females in Somerville?
There are 99.56 Males per 100 Females in Somerville.
What is the Ratio of Females per 100 Males in Somerville?
There are 100.44 Females per 100 Males in Somerville.
What is the Median Population Age in Somerville?
Median Population Age in Somerville is 32.1 Years.
What is the Average Family Size in Somerville
Average Family Size in Somerville is 2.9 People.
What is the Average Household Size in Somerville
Average Household Size in Somerville is 2.2 People.
How Large is the Labor Force in Somerville?
There are 57,663 People in the Labor Forcein in Somerville.
What is the Percentage of People in the Labor Force in Somerville?
79.1% of People are in the Labor Force in Somerville.
What is the Unemployment Rate in Somerville?
Unemployment Rate in Somerville is 2.8%.