Ann Arbor, MI Map & Demographics
Ann Arbor Map
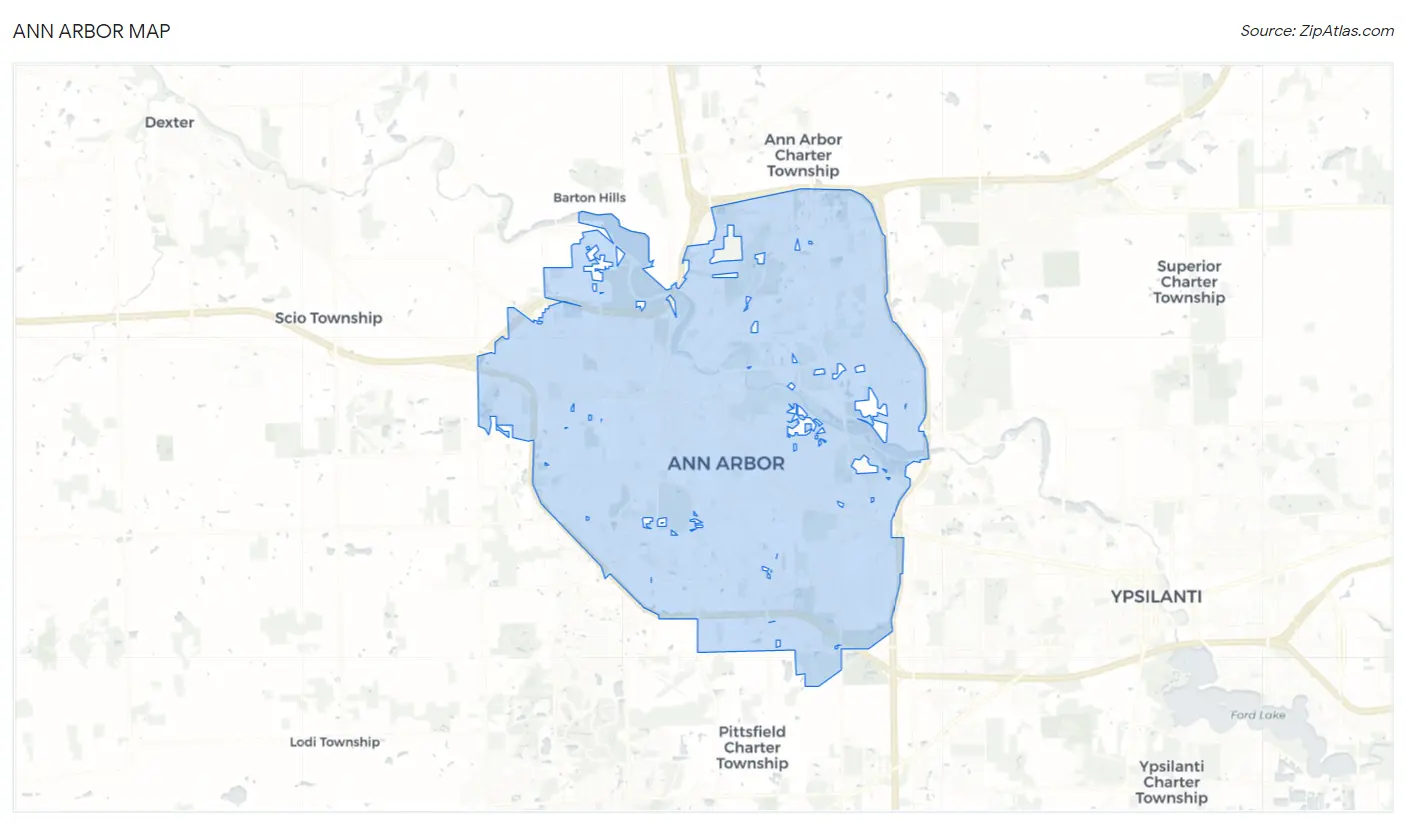
Ann Arbor Overview
$52,276
PER CAPITA INCOME
$134,056
AVG FAMILY INCOME
$78,546
AVG HOUSEHOLD INCOME
37.7%
WAGE / INCOME GAP [ % ]
62.3¢/ $1
WAGE / INCOME GAP [ $ ]
$11,523
FAMILY INCOME DEFICIT
0.53
INEQUALITY / GINI INDEX
122,216
TOTAL POPULATION
60,724
MALE POPULATION
61,492
FEMALE POPULATION
98.75
MALES / 100 FEMALES
101.26
FEMALES / 100 MALES
27.4
MEDIAN AGE
2.8
AVG FAMILY SIZE
2.2
AVG HOUSEHOLD SIZE
66,299
LABOR FORCE [ PEOPLE ]
60.9%
PERCENT IN LABOR FORCE
3.7%
UNEMPLOYMENT RATE
Ann Arbor Area Codes
Income in Ann Arbor
Income Overview in Ann Arbor
Per Capita Income in Ann Arbor is $52,276, while median incomes of families and households are $134,056 and $78,546 respectively.
| Characteristic | Number | Measure |
| Per Capita Income | 122,216 | $52,276 |
| Median Family Income | 21,698 | $134,056 |
| Mean Family Income | 21,698 | $174,846 |
| Median Household Income | 50,110 | $78,546 |
| Mean Household Income | 50,110 | $116,926 |
| Income Deficit | 21,698 | $11,523 |
| Wage / Income Gap (%) | 122,216 | 37.71% |
| Wage / Income Gap ($) | 122,216 | 62.29¢ per $1 |
| Gini / Inequality Index | 122,216 | 0.53 |
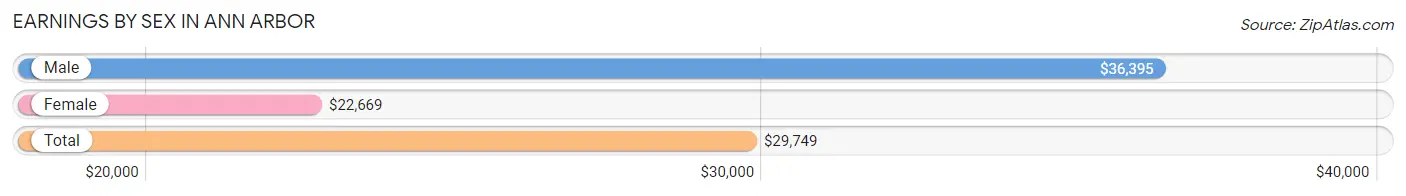
Earnings by Sex in Ann Arbor
Average Earnings in Ann Arbor are $29,749, $36,395 for men and $22,669 for women, a difference of 37.7%.
| Sex | Number | Average Earnings |
| Male | 41,831 (51.8%) | $36,395 |
| Female | 38,986 (48.2%) | $22,669 |
| Total | 80,817 (100.0%) | $29,749 |
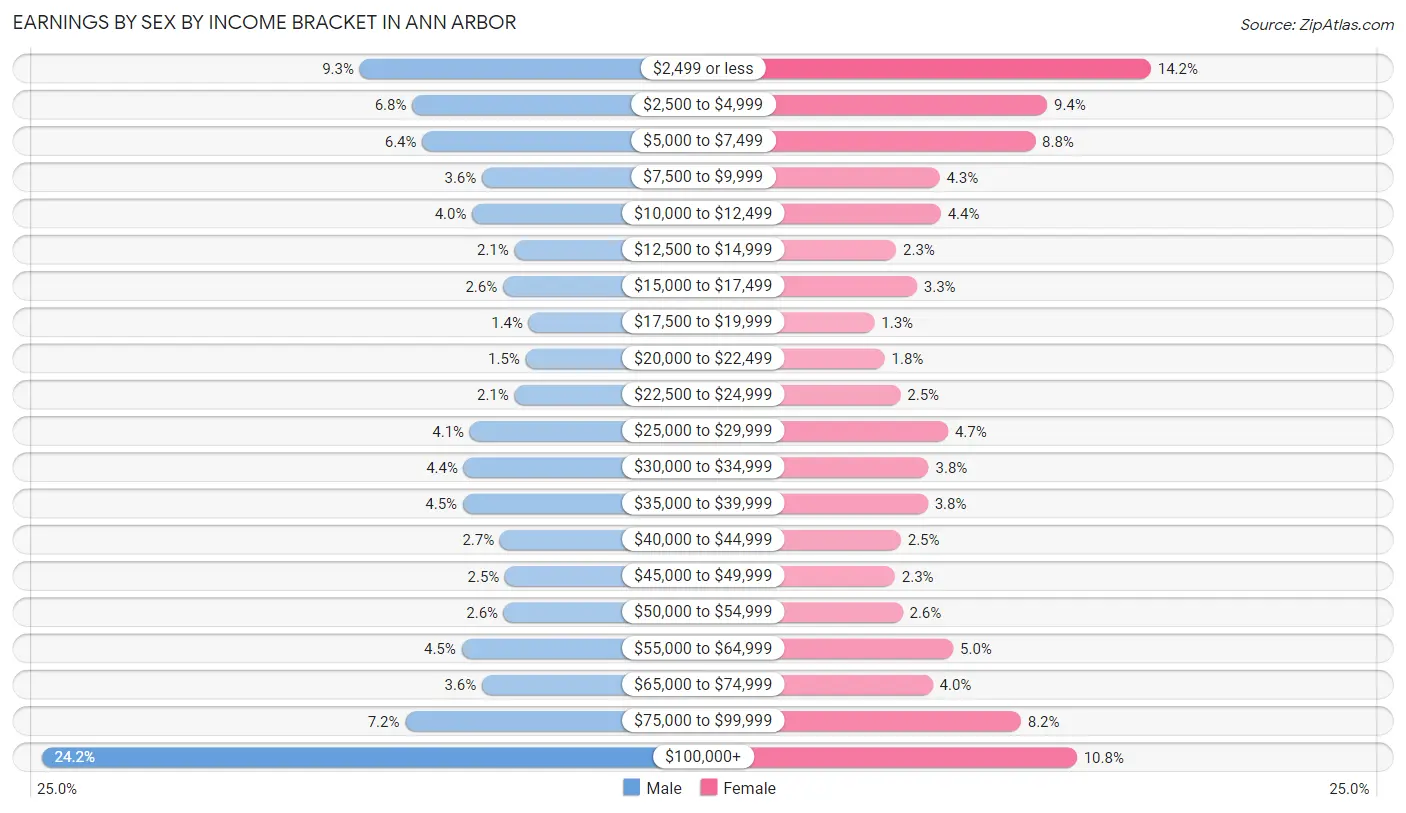
Earnings by Sex by Income Bracket in Ann Arbor
The most common earnings brackets in Ann Arbor are $100,000+ for men (10,123 | 24.2%) and $2,499 or less for women (5,553 | 14.2%).
| Income | Male | Female |
| $2,499 or less | 3,890 (9.3%) | 5,553 (14.2%) |
| $2,500 to $4,999 | 2,862 (6.8%) | 3,656 (9.4%) |
| $5,000 to $7,499 | 2,666 (6.4%) | 3,438 (8.8%) |
| $7,500 to $9,999 | 1,494 (3.6%) | 1,693 (4.3%) |
| $10,000 to $12,499 | 1,685 (4.0%) | 1,715 (4.4%) |
| $12,500 to $14,999 | 856 (2.1%) | 901 (2.3%) |
| $15,000 to $17,499 | 1,085 (2.6%) | 1,279 (3.3%) |
| $17,500 to $19,999 | 578 (1.4%) | 501 (1.3%) |
| $20,000 to $22,499 | 642 (1.5%) | 691 (1.8%) |
| $22,500 to $24,999 | 858 (2.1%) | 979 (2.5%) |
| $25,000 to $29,999 | 1,732 (4.1%) | 1,846 (4.7%) |
| $30,000 to $34,999 | 1,854 (4.4%) | 1,492 (3.8%) |
| $35,000 to $39,999 | 1,868 (4.5%) | 1,476 (3.8%) |
| $40,000 to $44,999 | 1,143 (2.7%) | 986 (2.5%) |
| $45,000 to $49,999 | 1,041 (2.5%) | 879 (2.2%) |
| $50,000 to $54,999 | 1,066 (2.5%) | 1,017 (2.6%) |
| $55,000 to $64,999 | 1,895 (4.5%) | 1,942 (5.0%) |
| $65,000 to $74,999 | 1,494 (3.6%) | 1,566 (4.0%) |
| $75,000 to $99,999 | 2,999 (7.2%) | 3,176 (8.2%) |
| $100,000+ | 10,123 (24.2%) | 4,200 (10.8%) |
| Total | 41,831 (100.0%) | 38,986 (100.0%) |
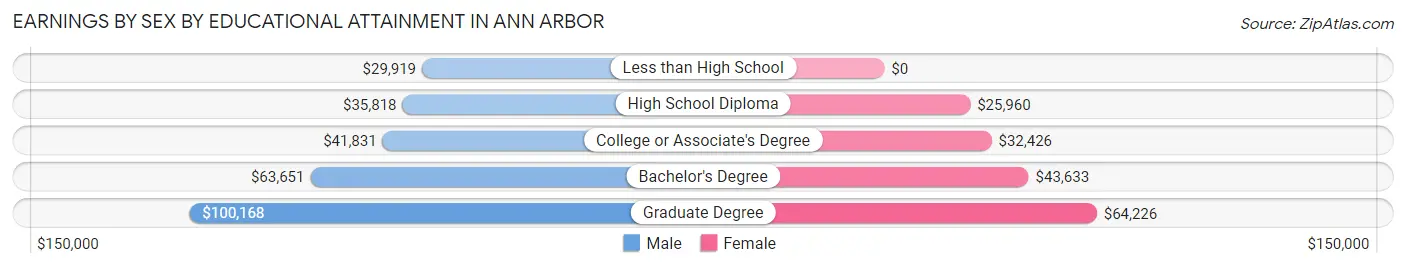
Earnings by Sex by Educational Attainment in Ann Arbor
Average earnings in Ann Arbor are $71,039 for men and $50,132 for women, a difference of 29.4%. Men with an educational attainment of graduate degree enjoy the highest average annual earnings of $100,168, while those with less than high school education earn the least with $29,919. Women with an educational attainment of graduate degree earn the most with the average annual earnings of $64,226, while those with high school diploma education have the smallest earnings of $25,960.
| Educational Attainment | Male Income | Female Income |
| Less than High School | $29,919 | $0 |
| High School Diploma | $35,818 | $25,960 |
| College or Associate's Degree | $41,831 | $32,426 |
| Bachelor's Degree | $63,651 | $43,633 |
| Graduate Degree | $100,168 | $64,226 |
| Total | $71,039 | $50,132 |
Family Income in Ann Arbor
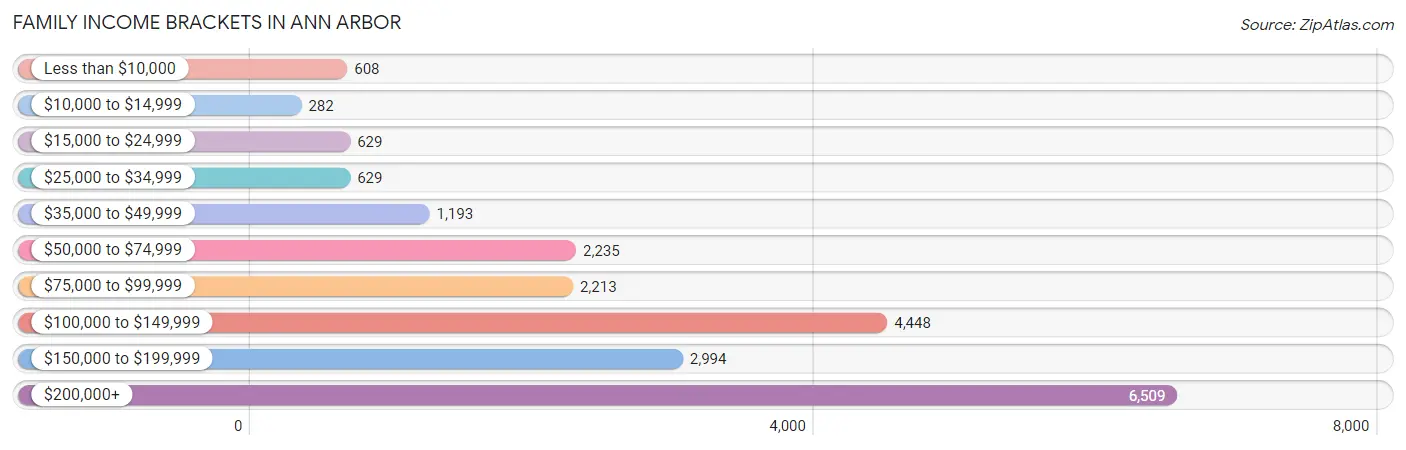
Family Income Brackets in Ann Arbor
According to the Ann Arbor family income data, there are 6,509 families falling into the $200,000+ income range, which is the most common income bracket and makes up 30.0% of all families. Conversely, the $10,000 to $14,999 income bracket is the least frequent group with only 282 families (1.3%) belonging to this category.
| Income Bracket | # Families | % Families |
| Less than $10,000 | 608 | 2.8% |
| $10,000 to $14,999 | 282 | 1.3% |
| $15,000 to $24,999 | 629 | 2.9% |
| $25,000 to $34,999 | 629 | 2.9% |
| $35,000 to $49,999 | 1,193 | 5.5% |
| $50,000 to $74,999 | 2,235 | 10.3% |
| $75,000 to $99,999 | 2,213 | 10.2% |
| $100,000 to $149,999 | 4,448 | 20.5% |
| $150,000 to $199,999 | 2,994 | 13.8% |
| $200,000+ | 6,509 | 30.0% |
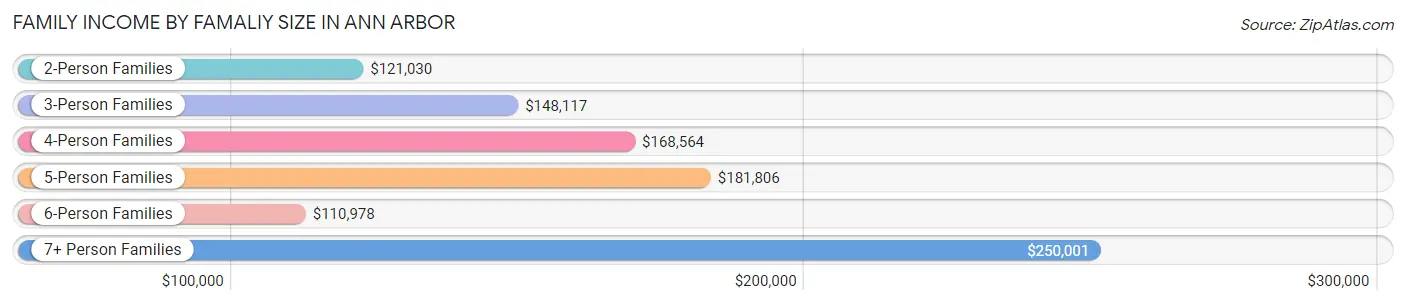
Family Income by Famaliy Size in Ann Arbor
7+ person families (79 | 0.4%) account for the highest median family income in Ann Arbor with $250,001 per family, while 2-person families (11,861 | 54.7%) have the highest median income of $60,515 per family member.
| Income Bracket | # Families | Median Income |
| 2-Person Families | 11,861 (54.7%) | $121,030 |
| 3-Person Families | 4,791 (22.1%) | $148,117 |
| 4-Person Families | 3,743 (17.2%) | $168,564 |
| 5-Person Families | 1,068 (4.9%) | $181,806 |
| 6-Person Families | 156 (0.7%) | $110,978 |
| 7+ Person Families | 79 (0.4%) | $250,001 |
| Total | 21,698 (100.0%) | $134,056 |
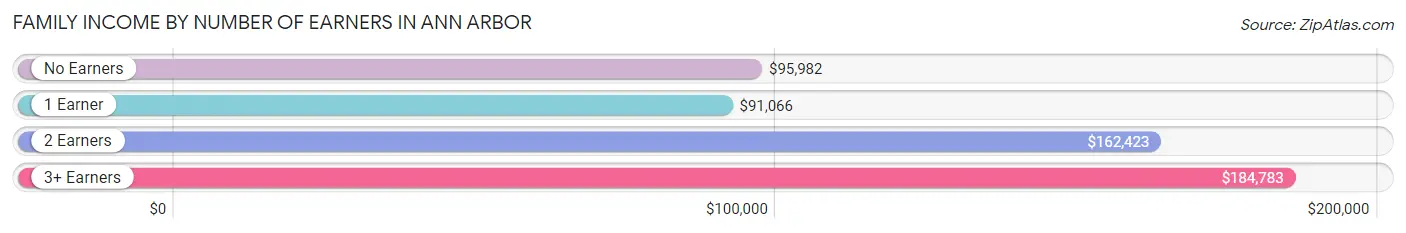
Family Income by Number of Earners in Ann Arbor
The median family income in Ann Arbor is $134,056, with families comprising 3+ earners (1,474) having the highest median family income of $184,783, while families with 1 earner (6,346) have the lowest median family income of $91,066, accounting for 6.8% and 29.2% of families, respectively.
| Number of Earners | # Families | Median Income |
| No Earners | 2,581 (11.9%) | $95,982 |
| 1 Earner | 6,346 (29.2%) | $91,066 |
| 2 Earners | 11,297 (52.1%) | $162,423 |
| 3+ Earners | 1,474 (6.8%) | $184,783 |
| Total | 21,698 (100.0%) | $134,056 |
Household Income in Ann Arbor
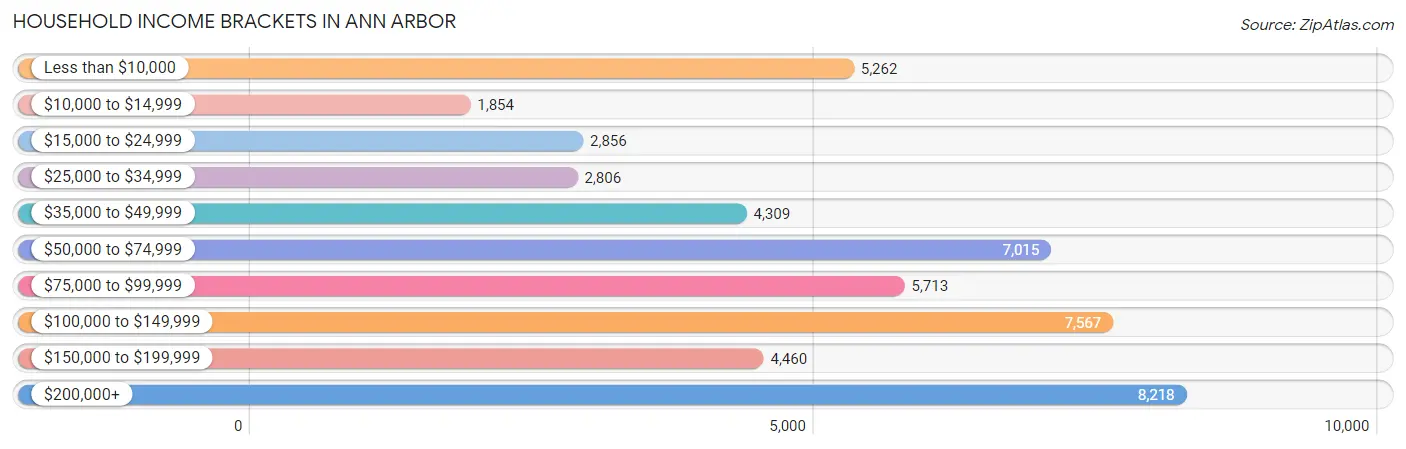
Household Income Brackets in Ann Arbor
With 8,218 households falling in the category, the $200,000+ income range is the most frequent in Ann Arbor, accounting for 16.4% of all households. In contrast, only 1,854 households (3.7%) fall into the $10,000 to $14,999 income bracket, making it the least populous group.
| Income Bracket | # Households | % Households |
| Less than $10,000 | 5,262 | 10.5% |
| $10,000 to $14,999 | 1,854 | 3.7% |
| $15,000 to $24,999 | 2,856 | 5.7% |
| $25,000 to $34,999 | 2,806 | 5.6% |
| $35,000 to $49,999 | 4,309 | 8.6% |
| $50,000 to $74,999 | 7,015 | 14.0% |
| $75,000 to $99,999 | 5,713 | 11.4% |
| $100,000 to $149,999 | 7,567 | 15.1% |
| $150,000 to $199,999 | 4,460 | 8.9% |
| $200,000+ | 8,218 | 16.4% |
Household Income by Householder Age in Ann Arbor
The median household income in Ann Arbor is $78,546, with the highest median household income of $126,229 found in the 45 to 64 years age bracket for the primary householder. A total of 11,618 households (23.2%) fall into this category. Meanwhile, the 15 to 24 years age bracket for the primary householder has the lowest median household income of $27,780, with 11,295 households (22.5%) in this group.
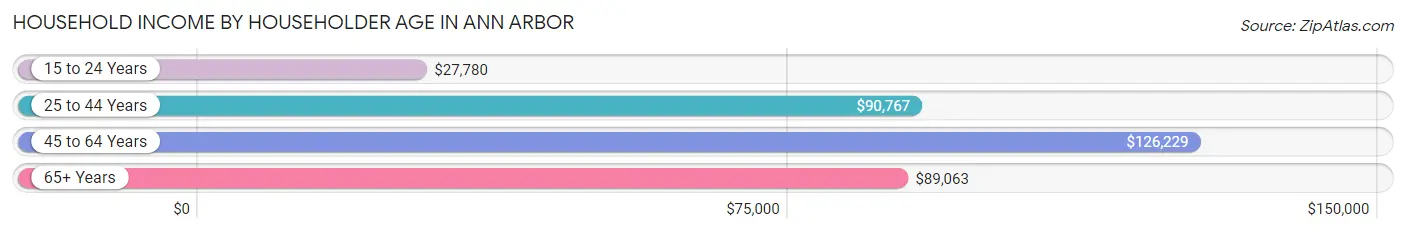
| Income Bracket | # Households | Median Income |
| 15 to 24 Years | 11,295 (22.5%) | $27,780 |
| 25 to 44 Years | 17,705 (35.3%) | $90,767 |
| 45 to 64 Years | 11,618 (23.2%) | $126,229 |
| 65+ Years | 9,492 (18.9%) | $89,063 |
| Total | 50,110 (100.0%) | $78,546 |
Poverty in Ann Arbor
Income Below Poverty by Sex and Age in Ann Arbor
With 22.9% poverty level for males and 23.8% for females among the residents of Ann Arbor, 18 to 24 year old males and 18 to 24 year old females are the most vulnerable to poverty, with 9,202 males (59.2%) and 9,318 females (62.9%) in their respective age groups living below the poverty level.
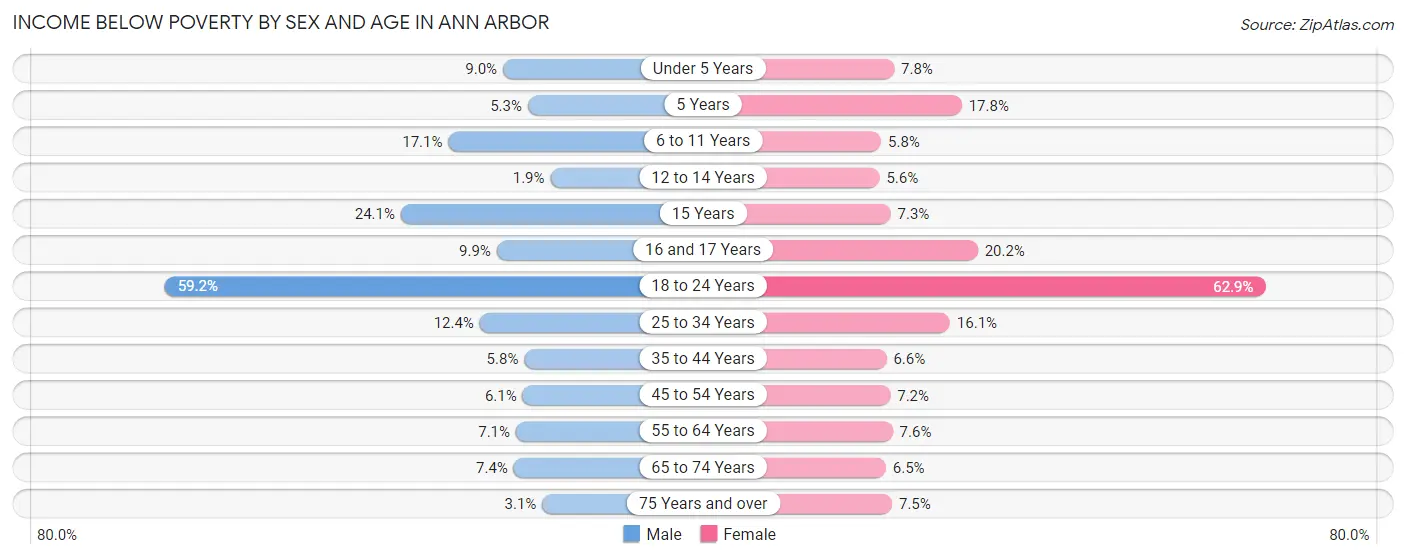
| Age Bracket | Male | Female |
| Under 5 Years | 225 (9.0%) | 177 (7.8%) |
| 5 Years | 22 (5.3%) | 44 (17.8%) |
| 6 to 11 Years | 374 (17.1%) | 137 (5.8%) |
| 12 to 14 Years | 24 (1.9%) | 75 (5.6%) |
| 15 Years | 120 (24.1%) | 20 (7.2%) |
| 16 and 17 Years | 68 (9.9%) | 158 (20.2%) |
| 18 to 24 Years | 9,202 (59.2%) | 9,318 (62.9%) |
| 25 to 34 Years | 1,266 (12.4%) | 1,463 (16.1%) |
| 35 to 44 Years | 356 (5.8%) | 383 (6.6%) |
| 45 to 54 Years | 304 (6.1%) | 336 (7.2%) |
| 55 to 64 Years | 308 (7.0%) | 384 (7.5%) |
| 65 to 74 Years | 281 (7.4%) | 286 (6.5%) |
| 75 Years and over | 83 (3.1%) | 280 (7.5%) |
| Total | 12,633 (22.9%) | 13,061 (23.8%) |
Income Above Poverty by Sex and Age in Ann Arbor
According to the poverty statistics in Ann Arbor, males aged 12 to 14 years and females aged 12 to 14 years are the age groups that are most secure financially, with 98.1% of males and 94.4% of females in these age groups living above the poverty line.
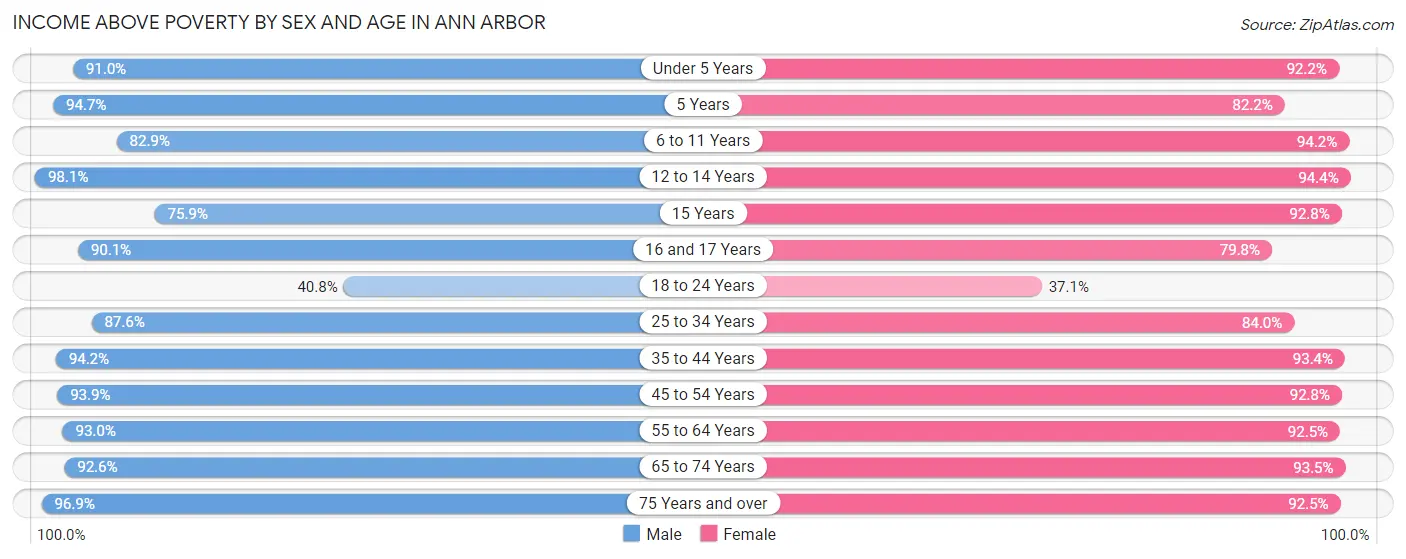
| Age Bracket | Male | Female |
| Under 5 Years | 2,284 (91.0%) | 2,102 (92.2%) |
| 5 Years | 395 (94.7%) | 203 (82.2%) |
| 6 to 11 Years | 1,816 (82.9%) | 2,207 (94.2%) |
| 12 to 14 Years | 1,219 (98.1%) | 1,267 (94.4%) |
| 15 Years | 377 (75.9%) | 256 (92.7%) |
| 16 and 17 Years | 619 (90.1%) | 625 (79.8%) |
| 18 to 24 Years | 6,345 (40.8%) | 5,498 (37.1%) |
| 25 to 34 Years | 8,929 (87.6%) | 7,653 (84.0%) |
| 35 to 44 Years | 5,769 (94.2%) | 5,390 (93.4%) |
| 45 to 54 Years | 4,715 (93.9%) | 4,329 (92.8%) |
| 55 to 64 Years | 4,061 (92.9%) | 4,705 (92.4%) |
| 65 to 74 Years | 3,530 (92.6%) | 4,085 (93.5%) |
| 75 Years and over | 2,562 (96.9%) | 3,473 (92.5%) |
| Total | 42,621 (77.1%) | 41,793 (76.2%) |
Income Below Poverty Among Married-Couple Families in Ann Arbor
The poverty statistics for married-couple families in Ann Arbor show that 3.4% or 596 of the total 17,726 families live below the poverty line. Families with 3 or 4 children have the highest poverty rate of 12.8%, comprising of 104 families. On the other hand, families with 5 or more children have the lowest poverty rate of 0.0%, which includes 0 families.
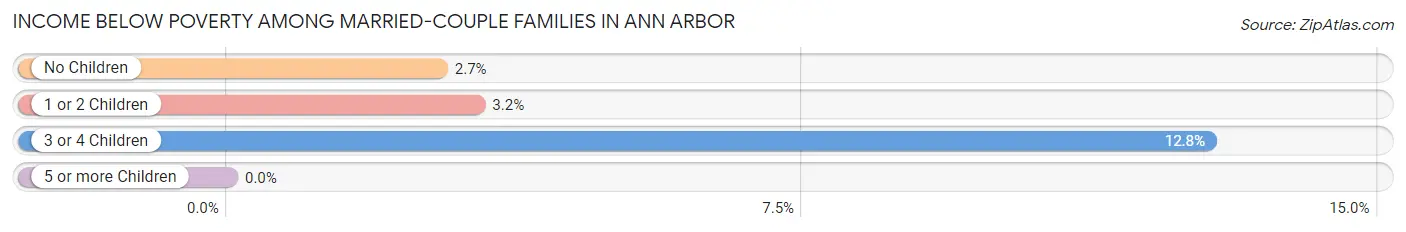
| Children | Above Poverty | Below Poverty |
| No Children | 10,497 (97.3%) | 296 (2.7%) |
| 1 or 2 Children | 5,864 (96.8%) | 196 (3.2%) |
| 3 or 4 Children | 710 (87.2%) | 104 (12.8%) |
| 5 or more Children | 59 (100.0%) | 0 (0.0%) |
| Total | 17,130 (96.6%) | 596 (3.4%) |
Income Below Poverty Among Single-Parent Households in Ann Arbor
According to the poverty data in Ann Arbor, 13.3% or 152 single-father households and 19.3% or 546 single-mother households are living below the poverty line. Among single-father households, those with 3 or 4 children have the highest poverty rate, with 23 households (34.8%) experiencing poverty. Likewise, among single-mother households, those with 5 or more children have the highest poverty rate, with 6 households (100.0%) falling below the poverty line.
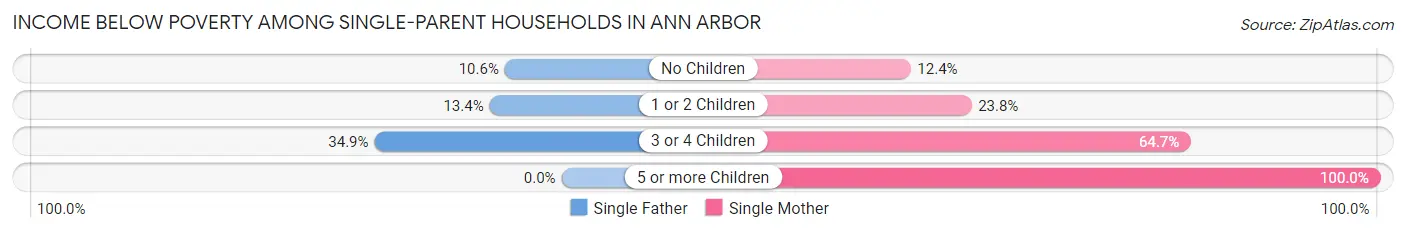
| Children | Single Father | Single Mother |
| No Children | 59 (10.6%) | 173 (12.4%) |
| 1 or 2 Children | 70 (13.4%) | 323 (23.7%) |
| 3 or 4 Children | 23 (34.8%) | 44 (64.7%) |
| 5 or more Children | 0 (0.0%) | 6 (100.0%) |
| Total | 152 (13.3%) | 546 (19.3%) |
Income Below Poverty Among Married-Couple vs Single-Parent Households in Ann Arbor
The poverty data for Ann Arbor shows that 596 of the married-couple family households (3.4%) and 698 of the single-parent households (17.6%) are living below the poverty level. Within the married-couple family households, those with 3 or 4 children have the highest poverty rate, with 104 households (12.8%) falling below the poverty line. Among the single-parent households, those with 5 or more children have the highest poverty rate, with 6 household (100.0%) living below poverty.
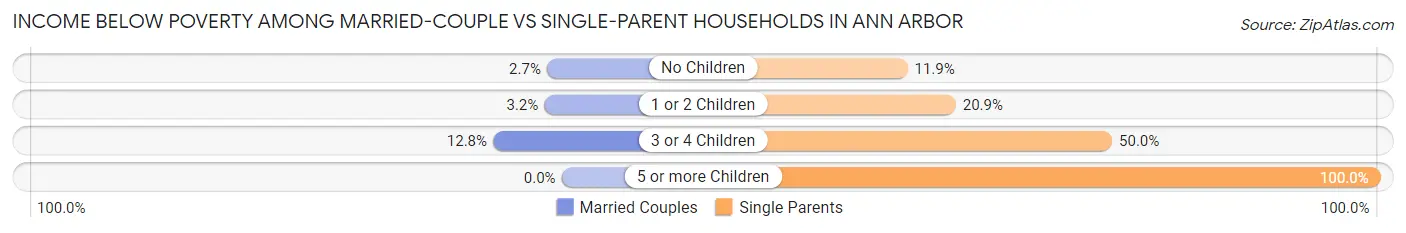
| Children | Married-Couple Families | Single-Parent Households |
| No Children | 296 (2.7%) | 232 (11.9%) |
| 1 or 2 Children | 196 (3.2%) | 393 (20.9%) |
| 3 or 4 Children | 104 (12.8%) | 67 (50.0%) |
| 5 or more Children | 0 (0.0%) | 6 (100.0%) |
| Total | 596 (3.4%) | 698 (17.6%) |
Race in Ann Arbor
The most populous races in Ann Arbor are White / Caucasian (85,371 | 69.9%), Asian (19,715 | 16.1%), and Black / African American (8,047 | 6.6%).
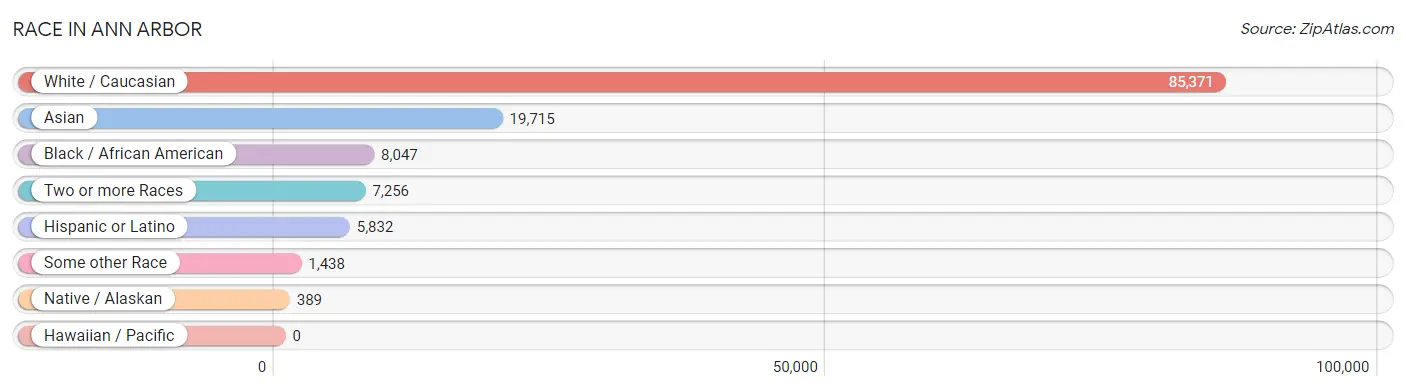
| Race | # Population | % Population |
| Asian | 19,715 | 16.1% |
| Black / African American | 8,047 | 6.6% |
| Hawaiian / Pacific | 0 | 0.0% |
| Hispanic or Latino | 5,832 | 4.8% |
| Native / Alaskan | 389 | 0.3% |
| White / Caucasian | 85,371 | 69.9% |
| Two or more Races | 7,256 | 5.9% |
| Some other Race | 1,438 | 1.2% |
| Total | 122,216 | 100.0% |
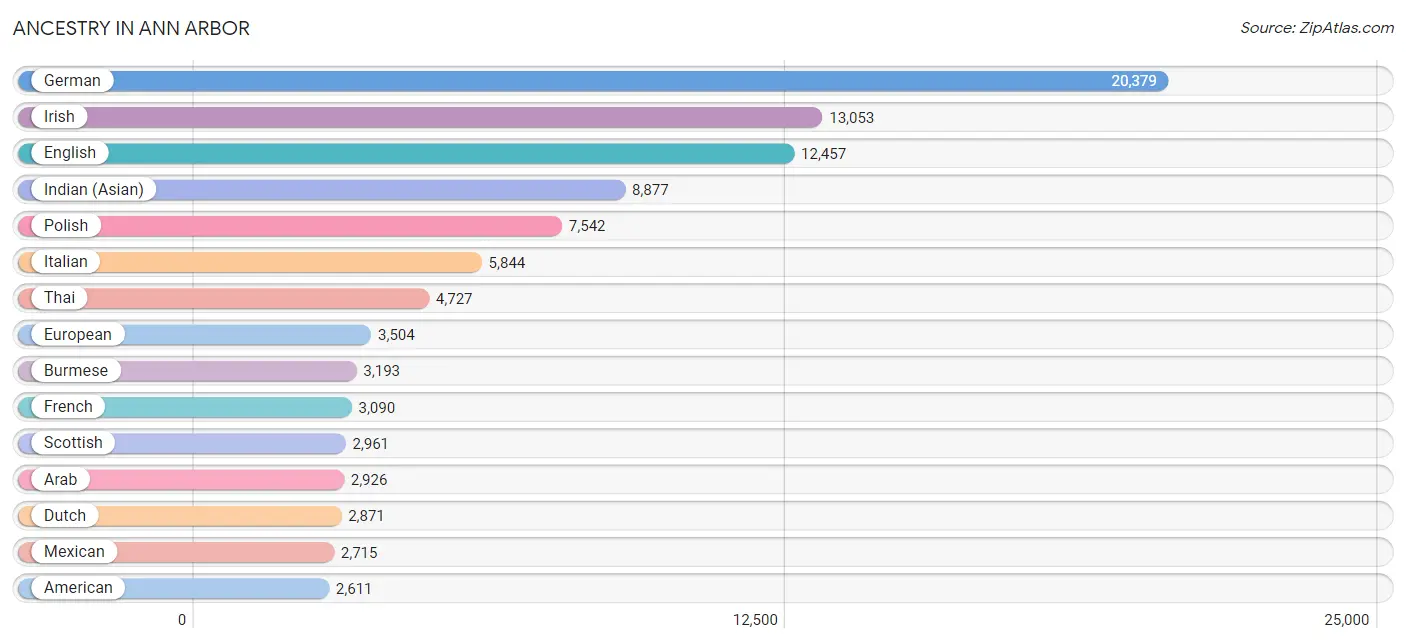
Ancestry in Ann Arbor
The most populous ancestries reported in Ann Arbor are German (20,379 | 16.7%), Irish (13,053 | 10.7%), English (12,457 | 10.2%), Indian (Asian) (8,877 | 7.3%), and Polish (7,542 | 6.2%), together accounting for 51.0% of all Ann Arbor residents.
| Ancestry | # Population | % Population |
| Afghan | 27 | 0.0% |
| African | 391 | 0.3% |
| Albanian | 84 | 0.1% |
| American | 2,611 | 2.1% |
| Arab | 2,926 | 2.4% |
| Argentinean | 26 | 0.0% |
| Armenian | 423 | 0.4% |
| Assyrian / Chaldean / Syriac | 88 | 0.1% |
| Australian | 69 | 0.1% |
| Austrian | 600 | 0.5% |
| Bangladeshi | 15 | 0.0% |
| Belgian | 540 | 0.4% |
| Bhutanese | 1,281 | 1.1% |
| Blackfeet | 56 | 0.1% |
| Bolivian | 61 | 0.1% |
| Brazilian | 146 | 0.1% |
| British | 1,221 | 1.0% |
| Bulgarian | 47 | 0.0% |
| Burmese | 3,193 | 2.6% |
| Cambodian | 26 | 0.0% |
| Canadian | 455 | 0.4% |
| Carpatho Rusyn | 127 | 0.1% |
| Celtic | 112 | 0.1% |
| Central American | 358 | 0.3% |
| Central American Indian | 38 | 0.0% |
| Cherokee | 247 | 0.2% |
| Chilean | 93 | 0.1% |
| Chinese | 2 | 0.0% |
| Chippewa | 355 | 0.3% |
| Choctaw | 38 | 0.0% |
| Colombian | 487 | 0.4% |
| Costa Rican | 47 | 0.0% |
| Croatian | 166 | 0.1% |
| Cuban | 282 | 0.2% |
| Cypriot | 23 | 0.0% |
| Czech | 541 | 0.4% |
| Czechoslovakian | 125 | 0.1% |
| Danish | 518 | 0.4% |
| Dominican | 51 | 0.0% |
| Dutch | 2,871 | 2.4% |
| Eastern European | 1,599 | 1.3% |
| Ecuadorian | 54 | 0.0% |
| Egyptian | 406 | 0.3% |
| English | 12,457 | 10.2% |
| Estonian | 8 | 0.0% |
| Ethiopian | 105 | 0.1% |
| European | 3,504 | 2.9% |
| Filipino | 928 | 0.8% |
| Finnish | 834 | 0.7% |
| French | 3,090 | 2.5% |
| French Canadian | 1,040 | 0.9% |
| German | 20,379 | 16.7% |
| Ghanaian | 271 | 0.2% |
| Greek | 698 | 0.6% |
| Guatemalan | 97 | 0.1% |
| Haitian | 61 | 0.1% |
| Honduran | 13 | 0.0% |
| Hungarian | 1,230 | 1.0% |
| Icelander | 34 | 0.0% |
| Indian (Asian) | 8,877 | 7.3% |
| Indonesian | 107 | 0.1% |
| Iranian | 592 | 0.5% |
| Iraqi | 347 | 0.3% |
| Irish | 13,053 | 10.7% |
| Iroquois | 19 | 0.0% |
| Israeli | 147 | 0.1% |
| Italian | 5,844 | 4.8% |
| Jamaican | 94 | 0.1% |
| Japanese | 56 | 0.1% |
| Jordanian | 461 | 0.4% |
| Kenyan | 4 | 0.0% |
| Korean | 994 | 0.8% |
| Laotian | 83 | 0.1% |
| Latvian | 113 | 0.1% |
| Lebanese | 419 | 0.3% |
| Liberian | 35 | 0.0% |
| Lithuanian | 849 | 0.7% |
| Lumbee | 9 | 0.0% |
| Luxembourger | 17 | 0.0% |
| Macedonian | 25 | 0.0% |
| Malaysian | 2 | 0.0% |
| Maltese | 175 | 0.1% |
| Mexican | 2,715 | 2.2% |
| Mexican American Indian | 96 | 0.1% |
| Mongolian | 121 | 0.1% |
| Moroccan | 59 | 0.1% |
| Native Hawaiian | 10 | 0.0% |
| Navajo | 47 | 0.0% |
| Nicaraguan | 8 | 0.0% |
| Nigerian | 600 | 0.5% |
| Northern European | 242 | 0.2% |
| Norwegian | 1,676 | 1.4% |
| Okinawan | 84 | 0.1% |
| Ottawa | 40 | 0.0% |
| Pakistani | 274 | 0.2% |
| Palestinian | 187 | 0.2% |
| Panamanian | 68 | 0.1% |
| Paraguayan | 36 | 0.0% |
| Pennsylvania German | 55 | 0.1% |
| Peruvian | 280 | 0.2% |
| Polish | 7,542 | 6.2% |
| Portuguese | 108 | 0.1% |
| Pueblo | 13 | 0.0% |
| Puerto Rican | 561 | 0.5% |
| Romanian | 773 | 0.6% |
| Russian | 2,261 | 1.8% |
| Salvadoran | 125 | 0.1% |
| Samoan | 56 | 0.1% |
| Scandinavian | 289 | 0.2% |
| Scotch-Irish | 694 | 0.6% |
| Scottish | 2,961 | 2.4% |
| Senegalese | 48 | 0.0% |
| Serbian | 86 | 0.1% |
| Sioux | 4 | 0.0% |
| Slavic | 78 | 0.1% |
| Slovak | 354 | 0.3% |
| Slovene | 85 | 0.1% |
| Somali | 34 | 0.0% |
| South African | 31 | 0.0% |
| South American | 1,266 | 1.0% |
| South American Indian | 14 | 0.0% |
| Spaniard | 387 | 0.3% |
| Spanish | 74 | 0.1% |
| Sri Lankan | 612 | 0.5% |
| Subsaharan African | 1,666 | 1.4% |
| Swedish | 1,770 | 1.5% |
| Swiss | 674 | 0.5% |
| Syrian | 258 | 0.2% |
| Thai | 4,727 | 3.9% |
| Trinidadian and Tobagonian | 21 | 0.0% |
| Turkish | 312 | 0.3% |
| Ukrainian | 811 | 0.7% |
| Uruguayan | 13 | 0.0% |
| Venezuelan | 202 | 0.2% |
| Vietnamese | 72 | 0.1% |
| Welsh | 857 | 0.7% |
| West Indian | 27 | 0.0% |
| Yugoslavian | 41 | 0.0% |
| Zimbabwean | 28 | 0.0% | View All 139 Rows |
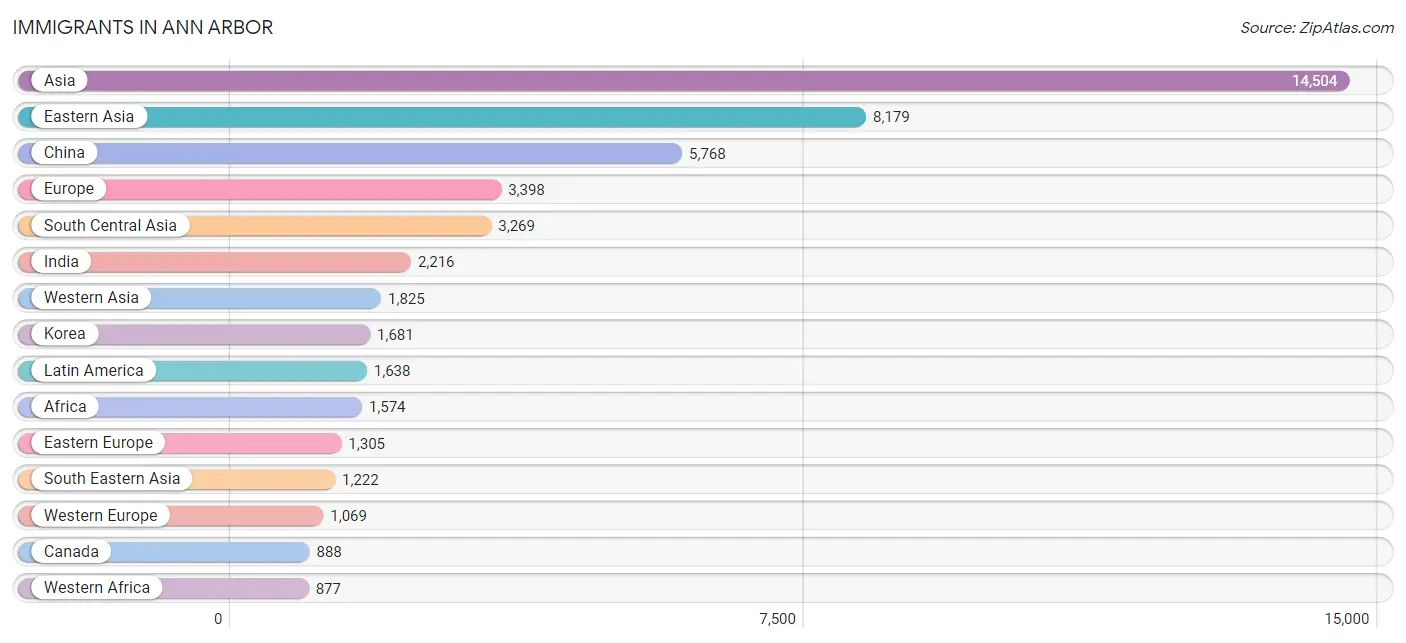
Immigrants in Ann Arbor
The most numerous immigrant groups reported in Ann Arbor came from Asia (14,504 | 11.9%), Eastern Asia (8,179 | 6.7%), China (5,768 | 4.7%), Europe (3,398 | 2.8%), and South Central Asia (3,269 | 2.7%), together accounting for 28.7% of all Ann Arbor residents.
| Immigration Origin | # Population | % Population |
| Afghanistan | 15 | 0.0% |
| Africa | 1,574 | 1.3% |
| Albania | 44 | 0.0% |
| Argentina | 26 | 0.0% |
| Armenia | 42 | 0.0% |
| Asia | 14,504 | 11.9% |
| Australia | 163 | 0.1% |
| Austria | 55 | 0.1% |
| Bangladesh | 91 | 0.1% |
| Belarus | 34 | 0.0% |
| Belgium | 20 | 0.0% |
| Bolivia | 10 | 0.0% |
| Bosnia and Herzegovina | 6 | 0.0% |
| Brazil | 209 | 0.2% |
| Canada | 888 | 0.7% |
| Caribbean | 110 | 0.1% |
| Central America | 794 | 0.6% |
| Chile | 92 | 0.1% |
| China | 5,768 | 4.7% |
| Colombia | 179 | 0.2% |
| Costa Rica | 20 | 0.0% |
| Cuba | 48 | 0.0% |
| Czechoslovakia | 66 | 0.1% |
| Denmark | 8 | 0.0% |
| Dominican Republic | 47 | 0.0% |
| Eastern Africa | 196 | 0.2% |
| Eastern Asia | 8,179 | 6.7% |
| Eastern Europe | 1,305 | 1.1% |
| Ecuador | 16 | 0.0% |
| Egypt | 319 | 0.3% |
| El Salvador | 116 | 0.1% |
| England | 244 | 0.2% |
| Ethiopia | 41 | 0.0% |
| Europe | 3,398 | 2.8% |
| France | 182 | 0.2% |
| Germany | 707 | 0.6% |
| Ghana | 216 | 0.2% |
| Greece | 27 | 0.0% |
| Guatemala | 43 | 0.0% |
| Honduras | 8 | 0.0% |
| Hong Kong | 63 | 0.1% |
| Hungary | 6 | 0.0% |
| India | 2,216 | 1.8% |
| Indonesia | 111 | 0.1% |
| Iran | 403 | 0.3% |
| Iraq | 407 | 0.3% |
| Ireland | 23 | 0.0% |
| Israel | 174 | 0.1% |
| Italy | 63 | 0.1% |
| Japan | 704 | 0.6% |
| Jordan | 337 | 0.3% |
| Kazakhstan | 61 | 0.1% |
| Kenya | 51 | 0.0% |
| Korea | 1,681 | 1.4% |
| Kuwait | 36 | 0.0% |
| Latin America | 1,638 | 1.3% |
| Latvia | 58 | 0.1% |
| Lebanon | 173 | 0.1% |
| Liberia | 36 | 0.0% |
| Lithuania | 98 | 0.1% |
| Malaysia | 169 | 0.1% |
| Mexico | 607 | 0.5% |
| Middle Africa | 23 | 0.0% |
| Moldova | 10 | 0.0% |
| Morocco | 8 | 0.0% |
| Nepal | 65 | 0.1% |
| Netherlands | 93 | 0.1% |
| Nigeria | 317 | 0.3% |
| Northern Africa | 367 | 0.3% |
| Northern Europe | 734 | 0.6% |
| Norway | 17 | 0.0% |
| Oceania | 163 | 0.1% |
| Pakistan | 384 | 0.3% |
| Peru | 14 | 0.0% |
| Philippines | 303 | 0.3% |
| Poland | 91 | 0.1% |
| Romania | 306 | 0.3% |
| Russia | 355 | 0.3% |
| Saudi Arabia | 234 | 0.2% |
| Scotland | 17 | 0.0% |
| Senegal | 79 | 0.1% |
| Serbia | 45 | 0.0% |
| Singapore | 76 | 0.1% |
| Somalia | 35 | 0.0% |
| South Africa | 83 | 0.1% |
| South America | 734 | 0.6% |
| South Central Asia | 3,269 | 2.7% |
| South Eastern Asia | 1,222 | 1.0% |
| Southern Europe | 244 | 0.2% |
| Spain | 154 | 0.1% |
| Sri Lanka | 34 | 0.0% |
| Sudan | 7 | 0.0% |
| Sweden | 4 | 0.0% |
| Switzerland | 12 | 0.0% |
| Syria | 75 | 0.1% |
| Taiwan | 874 | 0.7% |
| Thailand | 154 | 0.1% |
| Trinidad and Tobago | 12 | 0.0% |
| Turkey | 217 | 0.2% |
| Ukraine | 47 | 0.0% |
| Uruguay | 10 | 0.0% |
| Venezuela | 178 | 0.2% |
| Vietnam | 315 | 0.3% |
| West Indies | 3 | 0.0% |
| Western Africa | 877 | 0.7% |
| Western Asia | 1,825 | 1.5% |
| Western Europe | 1,069 | 0.9% |
| Yemen | 107 | 0.1% |
| Zaire | 23 | 0.0% |
| Zimbabwe | 7 | 0.0% | View All 110 Rows |
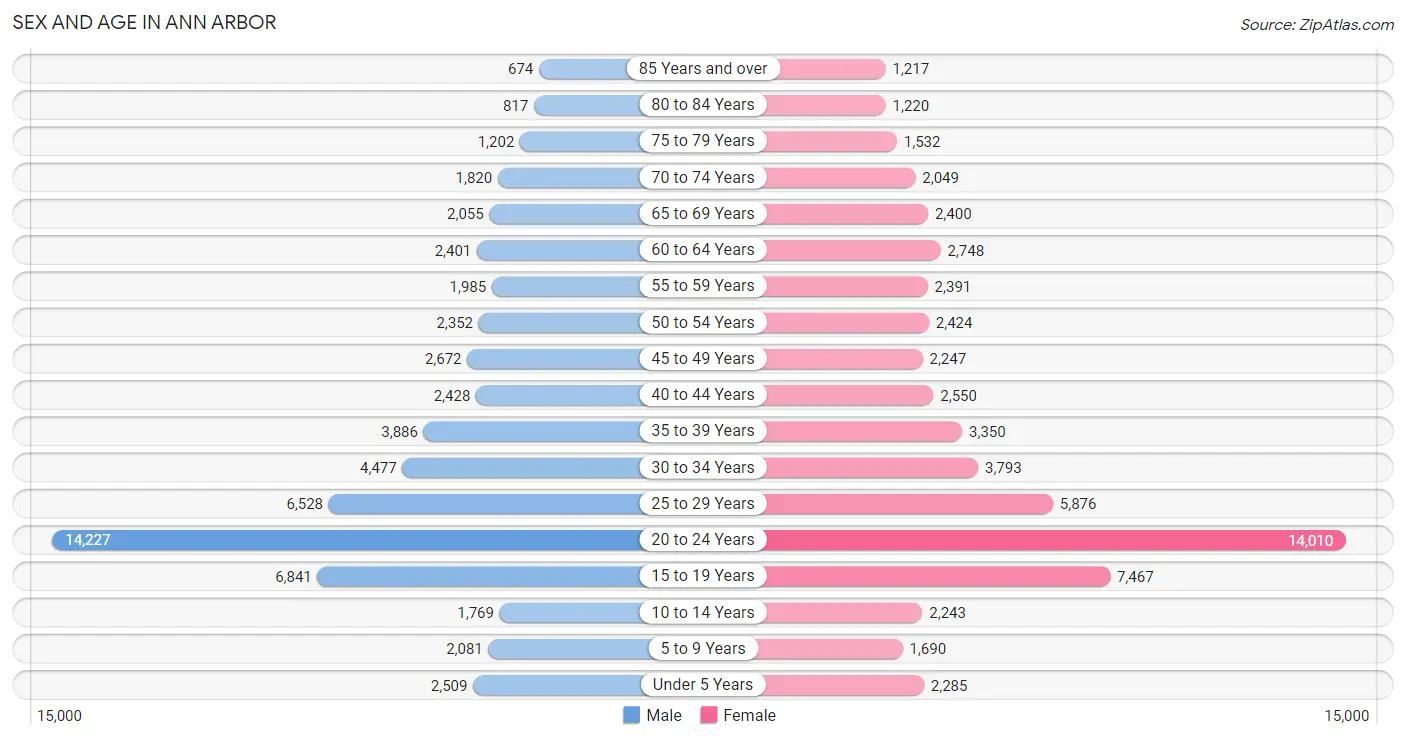
Sex and Age in Ann Arbor
Sex and Age in Ann Arbor
The most populous age groups in Ann Arbor are 20 to 24 Years (14,227 | 23.4%) for men and 20 to 24 Years (14,010 | 22.8%) for women.
| Age Bracket | Male | Female |
| Under 5 Years | 2,509 (4.1%) | 2,285 (3.7%) |
| 5 to 9 Years | 2,081 (3.4%) | 1,690 (2.8%) |
| 10 to 14 Years | 1,769 (2.9%) | 2,243 (3.6%) |
| 15 to 19 Years | 6,841 (11.3%) | 7,467 (12.1%) |
| 20 to 24 Years | 14,227 (23.4%) | 14,010 (22.8%) |
| 25 to 29 Years | 6,528 (10.7%) | 5,876 (9.6%) |
| 30 to 34 Years | 4,477 (7.4%) | 3,793 (6.2%) |
| 35 to 39 Years | 3,886 (6.4%) | 3,350 (5.4%) |
| 40 to 44 Years | 2,428 (4.0%) | 2,550 (4.2%) |
| 45 to 49 Years | 2,672 (4.4%) | 2,247 (3.6%) |
| 50 to 54 Years | 2,352 (3.9%) | 2,424 (3.9%) |
| 55 to 59 Years | 1,985 (3.3%) | 2,391 (3.9%) |
| 60 to 64 Years | 2,401 (4.0%) | 2,748 (4.5%) |
| 65 to 69 Years | 2,055 (3.4%) | 2,400 (3.9%) |
| 70 to 74 Years | 1,820 (3.0%) | 2,049 (3.3%) |
| 75 to 79 Years | 1,202 (2.0%) | 1,532 (2.5%) |
| 80 to 84 Years | 817 (1.3%) | 1,220 (2.0%) |
| 85 Years and over | 674 (1.1%) | 1,217 (2.0%) |
| Total | 60,724 (100.0%) | 61,492 (100.0%) |
Families and Households in Ann Arbor
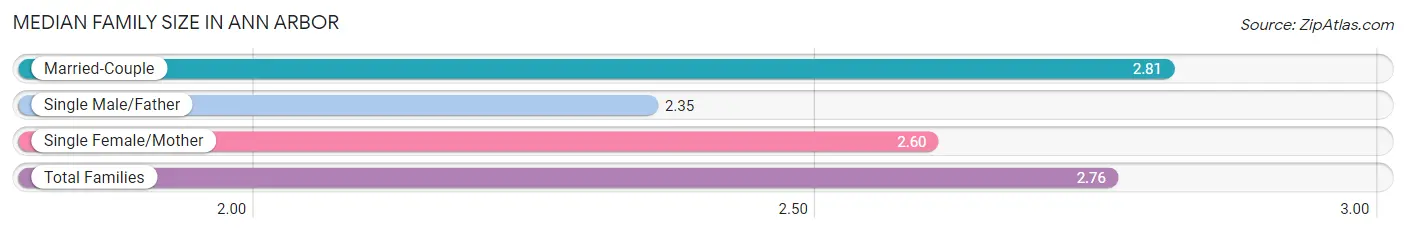
Median Family Size in Ann Arbor
The median family size in Ann Arbor is 2.76 persons per family, with married-couple families (17,726 | 81.7%) accounting for the largest median family size of 2.81 persons per family. On the other hand, single male/father families (1,146 | 5.3%) represent the smallest median family size with 2.35 persons per family.
| Family Type | # Families | Family Size |
| Married-Couple | 17,726 (81.7%) | 2.81 |
| Single Male/Father | 1,146 (5.3%) | 2.35 |
| Single Female/Mother | 2,826 (13.0%) | 2.60 |
| Total Families | 21,698 (100.0%) | 2.76 |
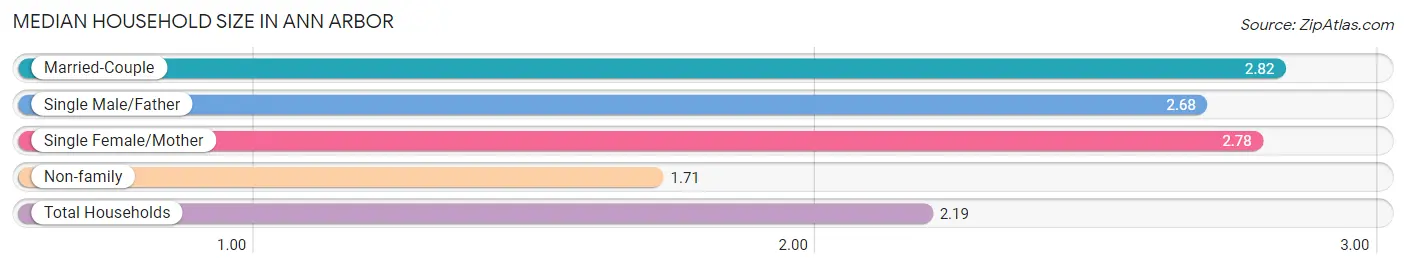
Median Household Size in Ann Arbor
The median household size in Ann Arbor is 2.19 persons per household, with married-couple households (17,726 | 35.4%) accounting for the largest median household size of 2.82 persons per household. non-family households (28,412 | 56.7%) represent the smallest median household size with 1.71 persons per household.
| Household Type | # Households | Household Size |
| Married-Couple | 17,726 (35.4%) | 2.82 |
| Single Male/Father | 1,146 (2.3%) | 2.68 |
| Single Female/Mother | 2,826 (5.6%) | 2.78 |
| Non-family | 28,412 (56.7%) | 1.71 |
| Total Households | 50,110 (100.0%) | 2.19 |
Household Size by Marriage Status in Ann Arbor
Out of a total of 50,110 households in Ann Arbor, 21,698 (43.3%) are family households, while 28,412 (56.7%) are nonfamily households. The most numerous type of family households are 2-person households, comprising 11,174, and the most common type of nonfamily households are 1-person households, comprising 16,612.
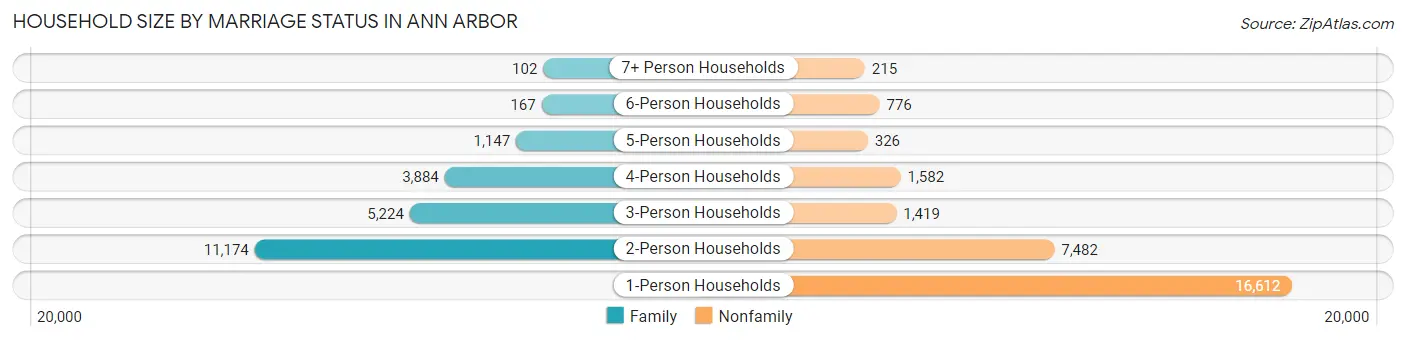
| Household Size | Family Households | Nonfamily Households |
| 1-Person Households | - | 16,612 (33.2%) |
| 2-Person Households | 11,174 (22.3%) | 7,482 (14.9%) |
| 3-Person Households | 5,224 (10.4%) | 1,419 (2.8%) |
| 4-Person Households | 3,884 (7.7%) | 1,582 (3.2%) |
| 5-Person Households | 1,147 (2.3%) | 326 (0.6%) |
| 6-Person Households | 167 (0.3%) | 776 (1.5%) |
| 7+ Person Households | 102 (0.2%) | 215 (0.4%) |
| Total | 21,698 (43.3%) | 28,412 (56.7%) |
Female Fertility in Ann Arbor
Fertility by Age in Ann Arbor
Average fertility rate in Ann Arbor is 35.0 births per 1,000 women. Women in the age bracket of 35 to 50 years have the highest fertility rate with 44.0 births per 1,000 women. Women in the age bracket of 20 to 34 years acount for 70.0% of all women with births.
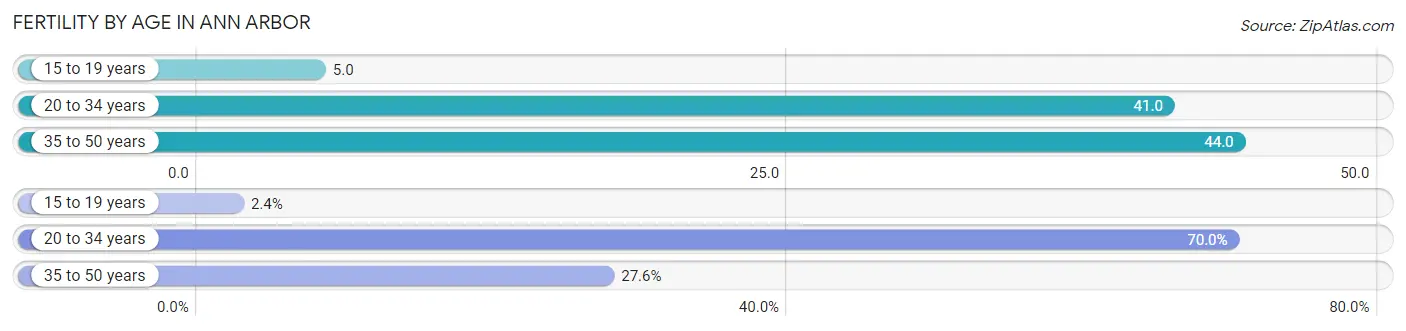
| Age Bracket | Women with Births | Births / 1,000 Women |
| 15 to 19 years | 34 (2.4%) | 5.0 |
| 20 to 34 years | 975 (70.0%) | 41.0 |
| 35 to 50 years | 384 (27.6%) | 44.0 |
| Total | 1,393 (100.0%) | 35.0 |
Fertility by Age by Marriage Status in Ann Arbor
79.3% of women with births (1,393) in Ann Arbor are married. The highest percentage of unmarried women with births falls into 15 to 19 years age bracket with 100.0% of them unmarried at the time of birth, while the lowest percentage of unmarried women with births belong to 35 to 50 years age bracket with 7.8% of them unmarried.
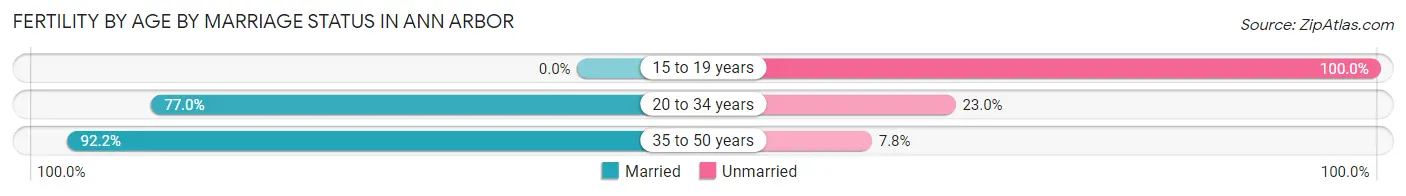
| Age Bracket | Married | Unmarried |
| 15 to 19 years | 0 (0.0%) | 34 (100.0%) |
| 20 to 34 years | 751 (77.0%) | 224 (23.0%) |
| 35 to 50 years | 354 (92.2%) | 30 (7.8%) |
| Total | 1,105 (79.3%) | 288 (20.7%) |
Fertility by Education in Ann Arbor
Average fertility rate in Ann Arbor is 35.0 births per 1,000 women. Women with the education attainment of graduate degree have the highest fertility rate of 72.0 births per 1,000 women, while women with the education attainment of college or associate's degree have the lowest fertility at 18.0 births per 1,000 women. Women with the education attainment of graduate degree represent 49.4% of all women with births.
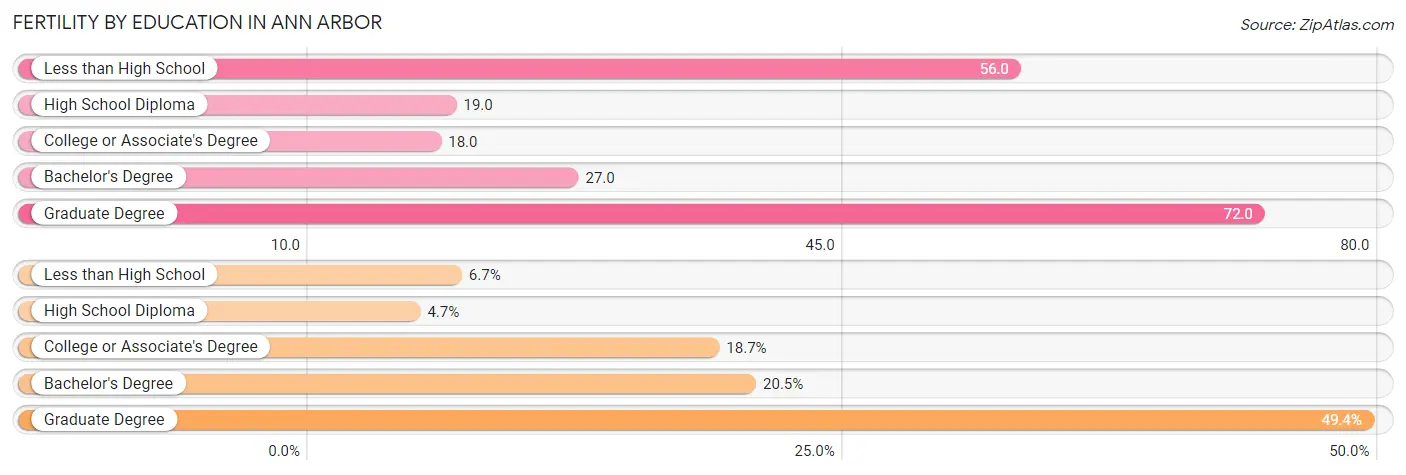
| Educational Attainment | Women with Births | Births / 1,000 Women |
| Less than High School | 93 (6.7%) | 56.0 |
| High School Diploma | 66 (4.7%) | 19.0 |
| College or Associate's Degree | 261 (18.7%) | 18.0 |
| Bachelor's Degree | 285 (20.5%) | 27.0 |
| Graduate Degree | 688 (49.4%) | 72.0 |
| Total | 1,393 (100.0%) | 35.0 |
Fertility by Education by Marriage Status in Ann Arbor
20.7% of women with births in Ann Arbor are unmarried. Women with the educational attainment of graduate degree are most likely to be married with 97.0% of them married at childbirth, while women with the educational attainment of high school diploma are least likely to be married with 87.9% of them unmarried at childbirth.
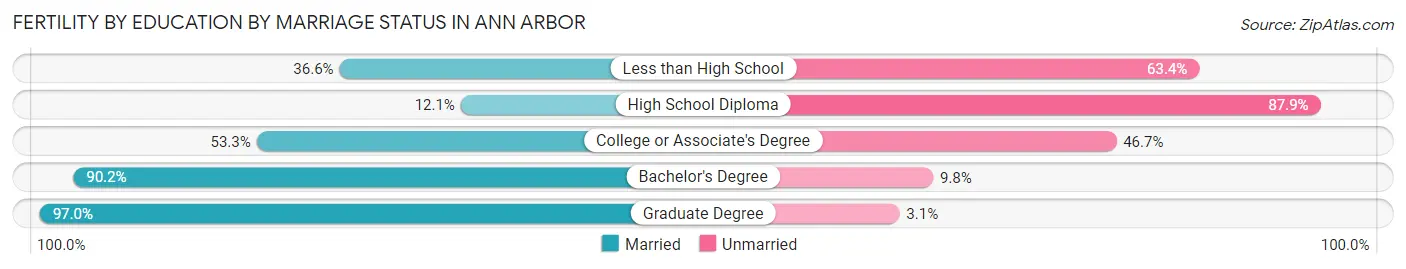
| Educational Attainment | Married | Unmarried |
| Less than High School | 34 (36.6%) | 59 (63.4%) |
| High School Diploma | 8 (12.1%) | 58 (87.9%) |
| College or Associate's Degree | 139 (53.3%) | 122 (46.7%) |
| Bachelor's Degree | 257 (90.2%) | 28 (9.8%) |
| Graduate Degree | 667 (97.0%) | 21 (3.0%) |
| Total | 1,105 (79.3%) | 288 (20.7%) |
Employment Characteristics in Ann Arbor
Employment by Class of Employer in Ann Arbor
Among the 62,467 employed individuals in Ann Arbor, private company employees (30,850 | 49.4%), state government employees (12,768 | 20.4%), and not-for-profit organizations (11,037 | 17.7%) make up the most common classes of employment.
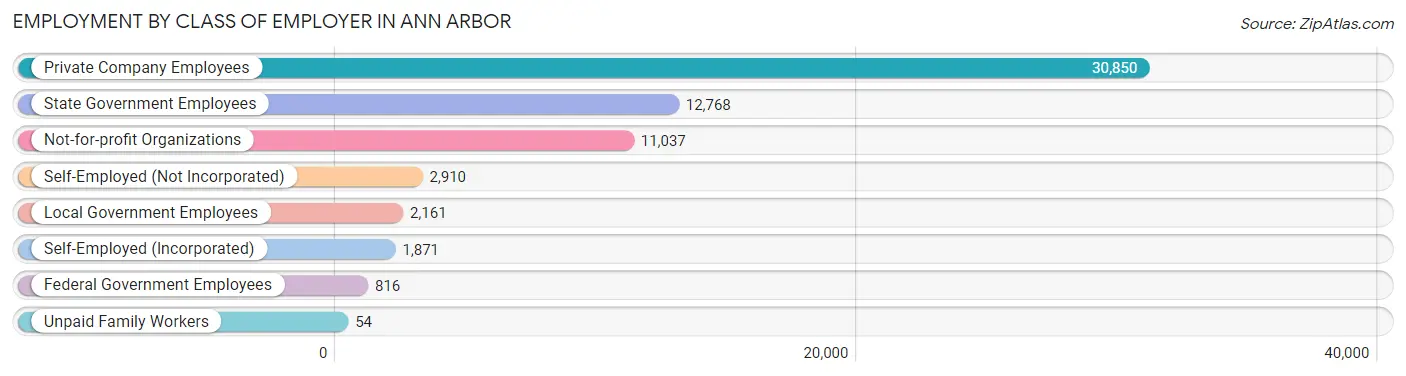
| Employer Class | # Employees | % Employees |
| Private Company Employees | 30,850 | 49.4% |
| Self-Employed (Incorporated) | 1,871 | 3.0% |
| Self-Employed (Not Incorporated) | 2,910 | 4.7% |
| Not-for-profit Organizations | 11,037 | 17.7% |
| Local Government Employees | 2,161 | 3.5% |
| State Government Employees | 12,768 | 20.4% |
| Federal Government Employees | 816 | 1.3% |
| Unpaid Family Workers | 54 | 0.1% |
| Total | 62,467 | 100.0% |
Employment Status by Age in Ann Arbor
According to the labor force statistics for Ann Arbor, out of the total population over 16 years of age (108,865), 60.9% or 66,299 individuals are in the labor force, with 3.7% or 2,453 of them unemployed. The age group with the highest labor force participation rate is 45 to 54 years, with 87.7% or 8,503 individuals in the labor force. Within the labor force, the 16 to 19 years age range has the highest percentage of unemployed individuals, with 11.6% or 488 of them being unemployed.
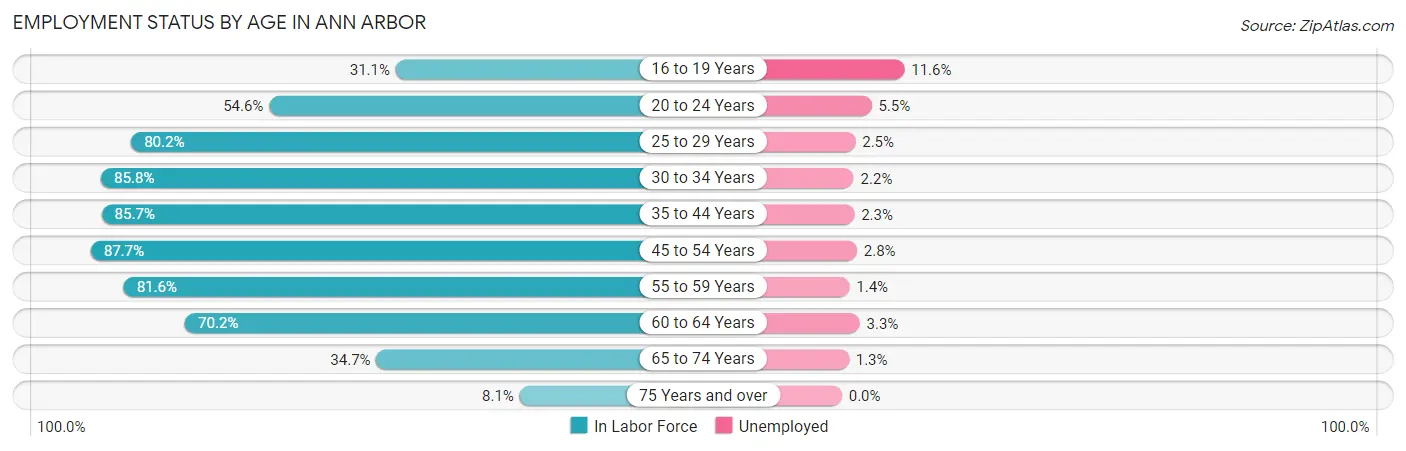
| Age Bracket | In Labor Force | Unemployed |
| 16 to 19 Years | 4,209 (31.1%) | 488 (11.6%) |
| 20 to 24 Years | 15,417 (54.6%) | 848 (5.5%) |
| 25 to 29 Years | 9,948 (80.2%) | 249 (2.5%) |
| 30 to 34 Years | 7,096 (85.8%) | 156 (2.2%) |
| 35 to 44 Years | 10,467 (85.7%) | 241 (2.3%) |
| 45 to 54 Years | 8,503 (87.7%) | 238 (2.8%) |
| 55 to 59 Years | 3,571 (81.6%) | 50 (1.4%) |
| 60 to 64 Years | 3,615 (70.2%) | 119 (3.3%) |
| 65 to 74 Years | 2,888 (34.7%) | 38 (1.3%) |
| 75 Years and over | 540 (8.1%) | 0 (0.0%) |
| Total | 66,299 (60.9%) | 2,453 (3.7%) |
Employment Status by Educational Attainment in Ann Arbor
According to labor force statistics for Ann Arbor, 82.9% of individuals (43,198) out of the total population between 25 and 64 years of age (52,108) are in the labor force, with 2.4% or 1,037 of them being unemployed. The group with the highest labor force participation rate are those with the educational attainment of bachelor's degree or higher, with 85.5% or 35,877 individuals in the labor force. Within the labor force, individuals with less than high school education have the highest percentage of unemployment, with 10.4% or 56 of them being unemployed.
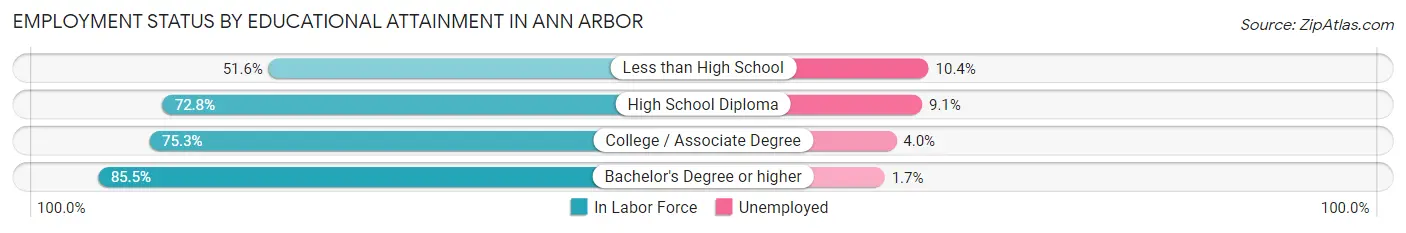
| Educational Attainment | In Labor Force | Unemployed |
| Less than High School | 540 (51.6%) | 109 (10.4%) |
| High School Diploma | 2,150 (72.8%) | 269 (9.1%) |
| College / Associate Degree | 4,629 (75.3%) | 246 (4.0%) |
| Bachelor's Degree or higher | 35,877 (85.5%) | 713 (1.7%) |
| Total | 43,198 (82.9%) | 1,251 (2.4%) |
Employment Occupations by Sex in Ann Arbor
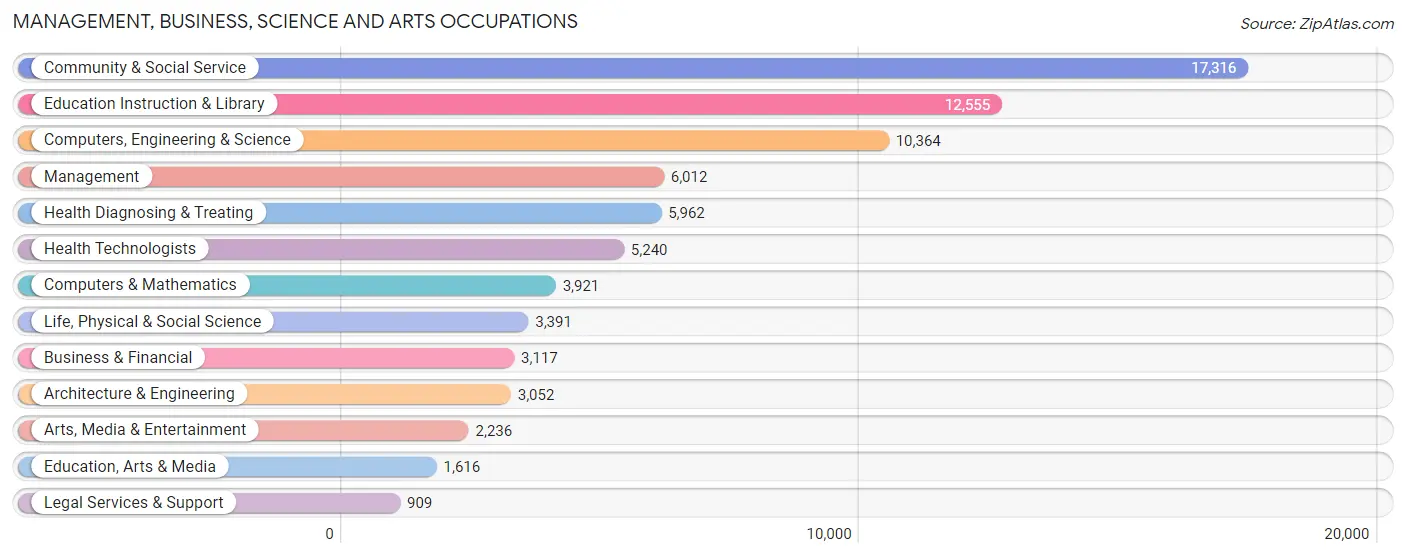
Management, Business, Science and Arts Occupations
The most common Management, Business, Science and Arts occupations in Ann Arbor are Community & Social Service (17,316 | 27.2%), Education Instruction & Library (12,555 | 19.7%), Computers, Engineering & Science (10,364 | 16.3%), Management (6,012 | 9.4%), and Health Diagnosing & Treating (5,962 | 9.4%).
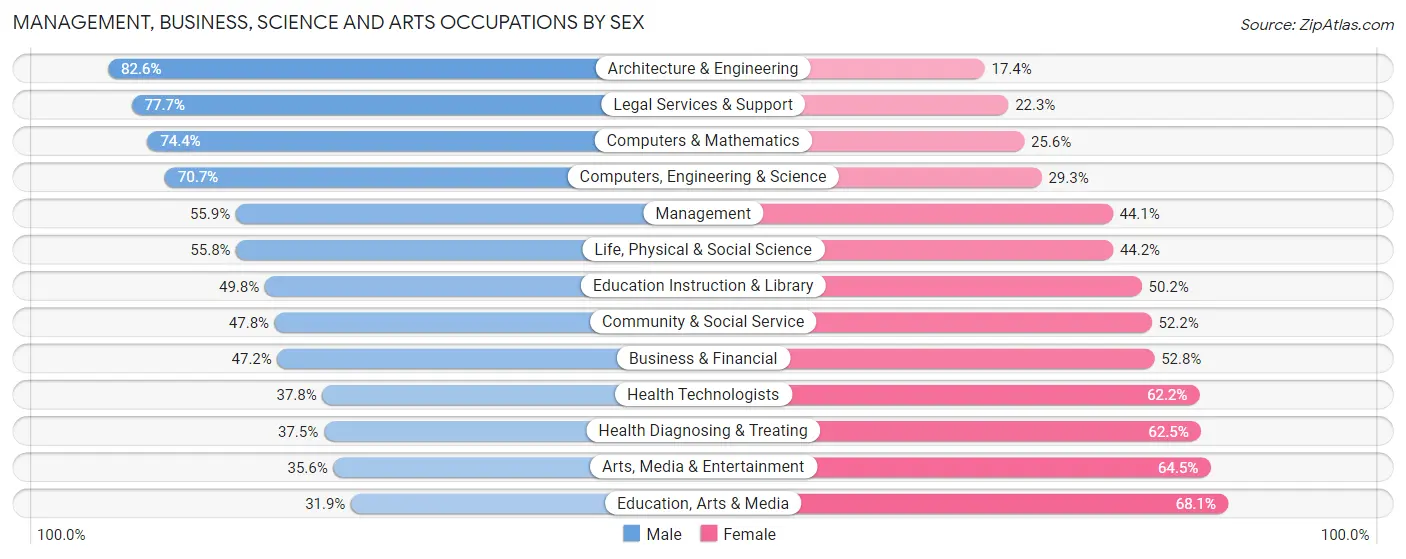
Management, Business, Science and Arts Occupations by Sex
Within the Management, Business, Science and Arts occupations in Ann Arbor, the most male-oriented occupations are Architecture & Engineering (82.6%), Legal Services & Support (77.7%), and Computers & Mathematics (74.4%), while the most female-oriented occupations are Education, Arts & Media (68.1%), Arts, Media & Entertainment (64.4%), and Health Diagnosing & Treating (62.5%).
| Occupation | Male | Female |
| Management | 3,361 (55.9%) | 2,651 (44.1%) |
| Business & Financial | 1,472 (47.2%) | 1,645 (52.8%) |
| Computers, Engineering & Science | 7,330 (70.7%) | 3,034 (29.3%) |
| Computers & Mathematics | 2,916 (74.4%) | 1,005 (25.6%) |
| Architecture & Engineering | 2,521 (82.6%) | 531 (17.4%) |
| Life, Physical & Social Science | 1,893 (55.8%) | 1,498 (44.2%) |
| Community & Social Service | 8,274 (47.8%) | 9,042 (52.2%) |
| Education, Arts & Media | 515 (31.9%) | 1,101 (68.1%) |
| Legal Services & Support | 706 (77.7%) | 203 (22.3%) |
| Education Instruction & Library | 6,258 (49.8%) | 6,297 (50.2%) |
| Arts, Media & Entertainment | 795 (35.5%) | 1,441 (64.4%) |
| Health Diagnosing & Treating | 2,238 (37.5%) | 3,724 (62.5%) |
| Health Technologists | 1,983 (37.8%) | 3,257 (62.2%) |
| Total (Category) | 22,675 (53.0%) | 20,096 (47.0%) |
| Total (Overall) | 32,516 (51.0%) | 31,177 (48.9%) |
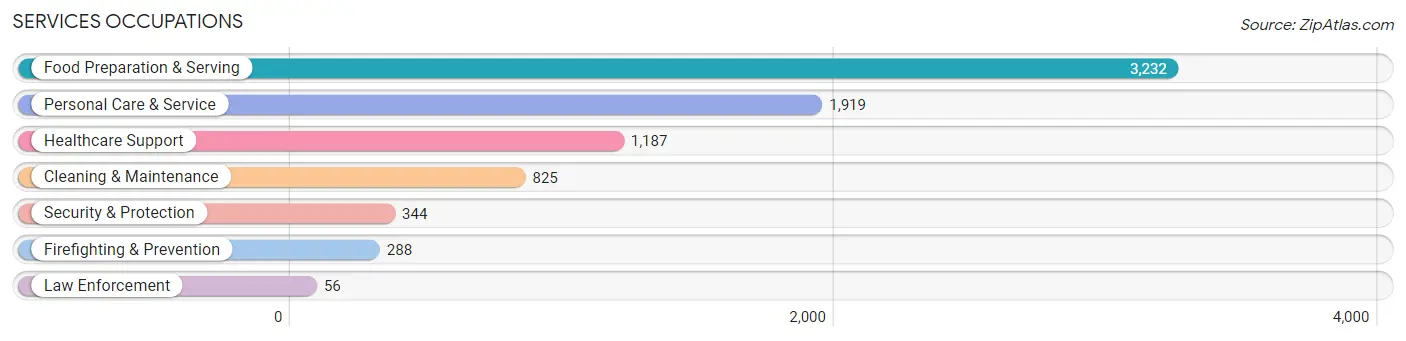
Services Occupations
The most common Services occupations in Ann Arbor are Food Preparation & Serving (3,232 | 5.1%), Personal Care & Service (1,919 | 3.0%), Healthcare Support (1,187 | 1.9%), Cleaning & Maintenance (825 | 1.3%), and Security & Protection (344 | 0.5%).
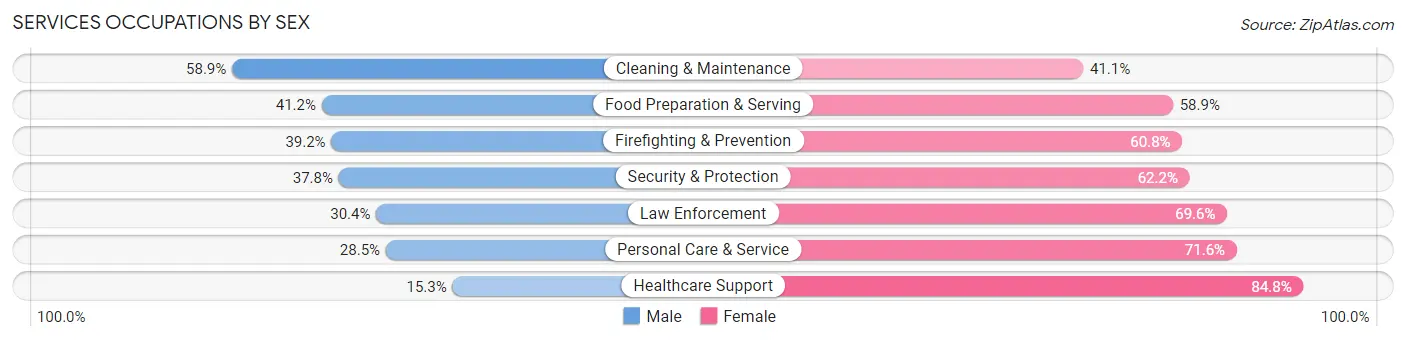
Services Occupations by Sex
Within the Services occupations in Ann Arbor, the most male-oriented occupations are Cleaning & Maintenance (58.9%), Food Preparation & Serving (41.1%), and Firefighting & Prevention (39.2%), while the most female-oriented occupations are Healthcare Support (84.8%), Personal Care & Service (71.6%), and Law Enforcement (69.6%).
| Occupation | Male | Female |
| Healthcare Support | 181 (15.2%) | 1,006 (84.8%) |
| Security & Protection | 130 (37.8%) | 214 (62.2%) |
| Firefighting & Prevention | 113 (39.2%) | 175 (60.8%) |
| Law Enforcement | 17 (30.4%) | 39 (69.6%) |
| Food Preparation & Serving | 1,330 (41.1%) | 1,902 (58.9%) |
| Cleaning & Maintenance | 486 (58.9%) | 339 (41.1%) |
| Personal Care & Service | 546 (28.4%) | 1,373 (71.6%) |
| Total (Category) | 2,673 (35.6%) | 4,834 (64.4%) |
| Total (Overall) | 32,516 (51.0%) | 31,177 (48.9%) |
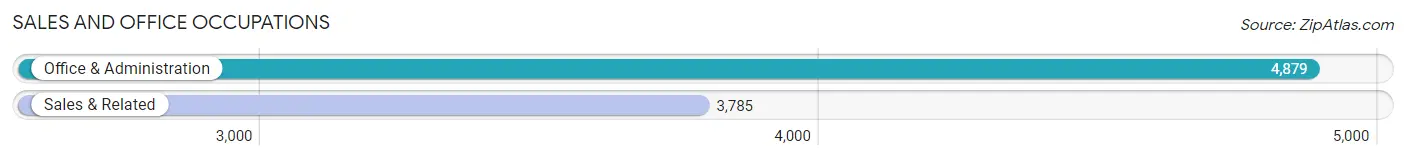
Sales and Office Occupations
The most common Sales and Office occupations in Ann Arbor are Office & Administration (4,879 | 7.7%), and Sales & Related (3,785 | 5.9%).
Sales and Office Occupations by Sex
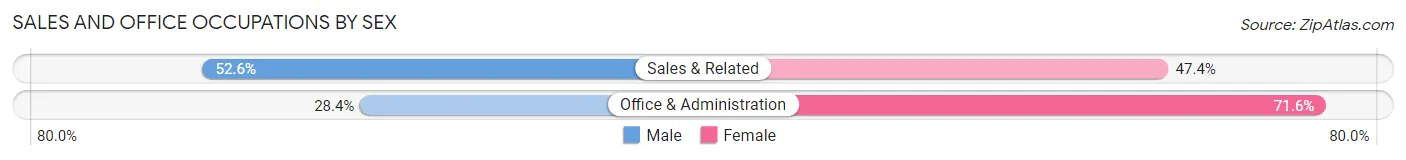
| Occupation | Male | Female |
| Sales & Related | 1,991 (52.6%) | 1,794 (47.4%) |
| Office & Administration | 1,384 (28.4%) | 3,495 (71.6%) |
| Total (Category) | 3,375 (39.0%) | 5,289 (61.1%) |
| Total (Overall) | 32,516 (51.0%) | 31,177 (48.9%) |
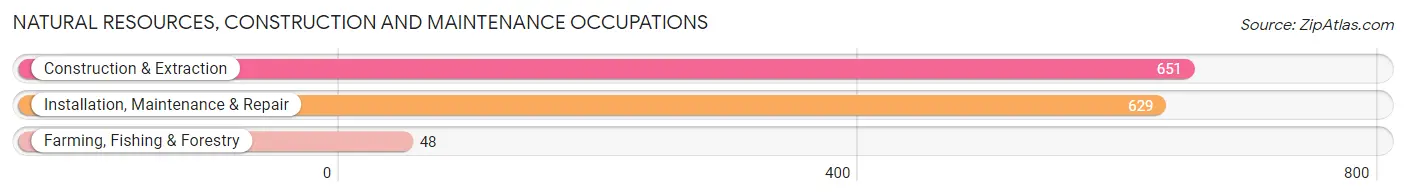
Natural Resources, Construction and Maintenance Occupations
The most common Natural Resources, Construction and Maintenance occupations in Ann Arbor are Construction & Extraction (651 | 1.0%), Installation, Maintenance & Repair (629 | 1.0%), and Farming, Fishing & Forestry (48 | 0.1%).
Natural Resources, Construction and Maintenance Occupations by Sex
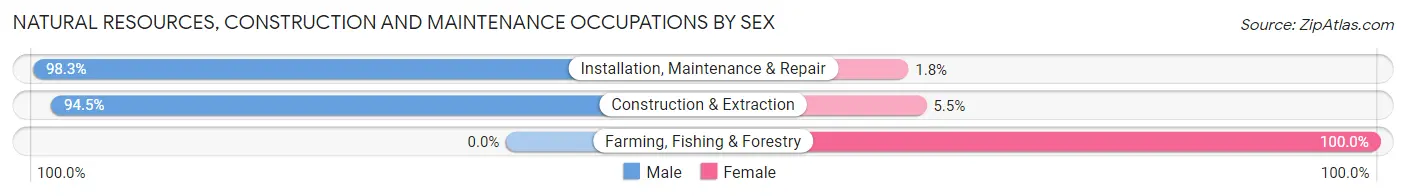
| Occupation | Male | Female |
| Farming, Fishing & Forestry | 0 (0.0%) | 48 (100.0%) |
| Construction & Extraction | 615 (94.5%) | 36 (5.5%) |
| Installation, Maintenance & Repair | 618 (98.3%) | 11 (1.8%) |
| Total (Category) | 1,233 (92.8%) | 95 (7.1%) |
| Total (Overall) | 32,516 (51.0%) | 31,177 (48.9%) |
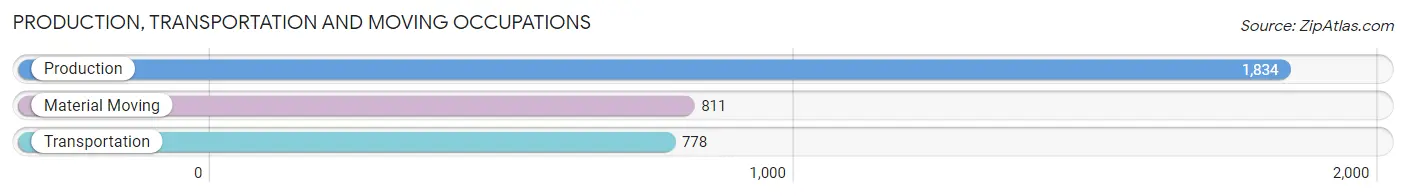
Production, Transportation and Moving Occupations
The most common Production, Transportation and Moving occupations in Ann Arbor are Production (1,834 | 2.9%), Material Moving (811 | 1.3%), and Transportation (778 | 1.2%).
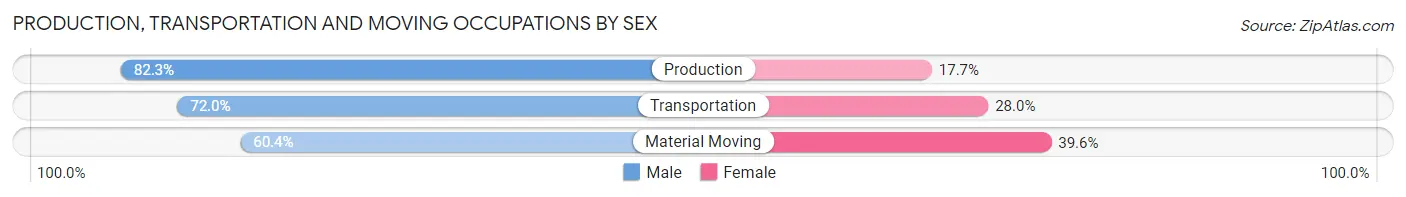
Production, Transportation and Moving Occupations by Sex
| Occupation | Male | Female |
| Production | 1,510 (82.3%) | 324 (17.7%) |
| Transportation | 560 (72.0%) | 218 (28.0%) |
| Material Moving | 490 (60.4%) | 321 (39.6%) |
| Total (Category) | 2,560 (74.8%) | 863 (25.2%) |
| Total (Overall) | 32,516 (51.0%) | 31,177 (48.9%) |
Employment Industries by Sex in Ann Arbor
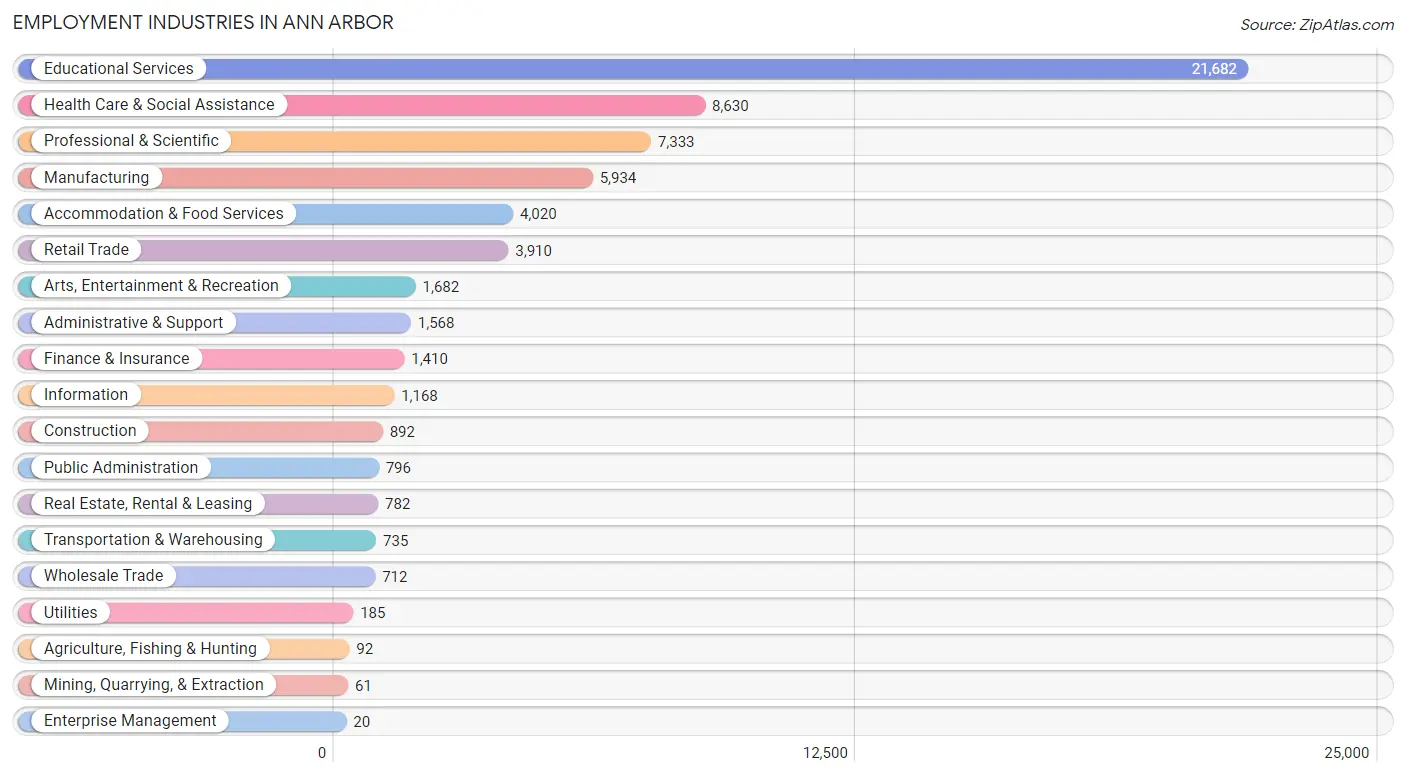
Employment Industries in Ann Arbor
The major employment industries in Ann Arbor include Educational Services (21,682 | 34.0%), Health Care & Social Assistance (8,630 | 13.6%), Professional & Scientific (7,333 | 11.5%), Manufacturing (5,934 | 9.3%), and Accommodation & Food Services (4,020 | 6.3%).
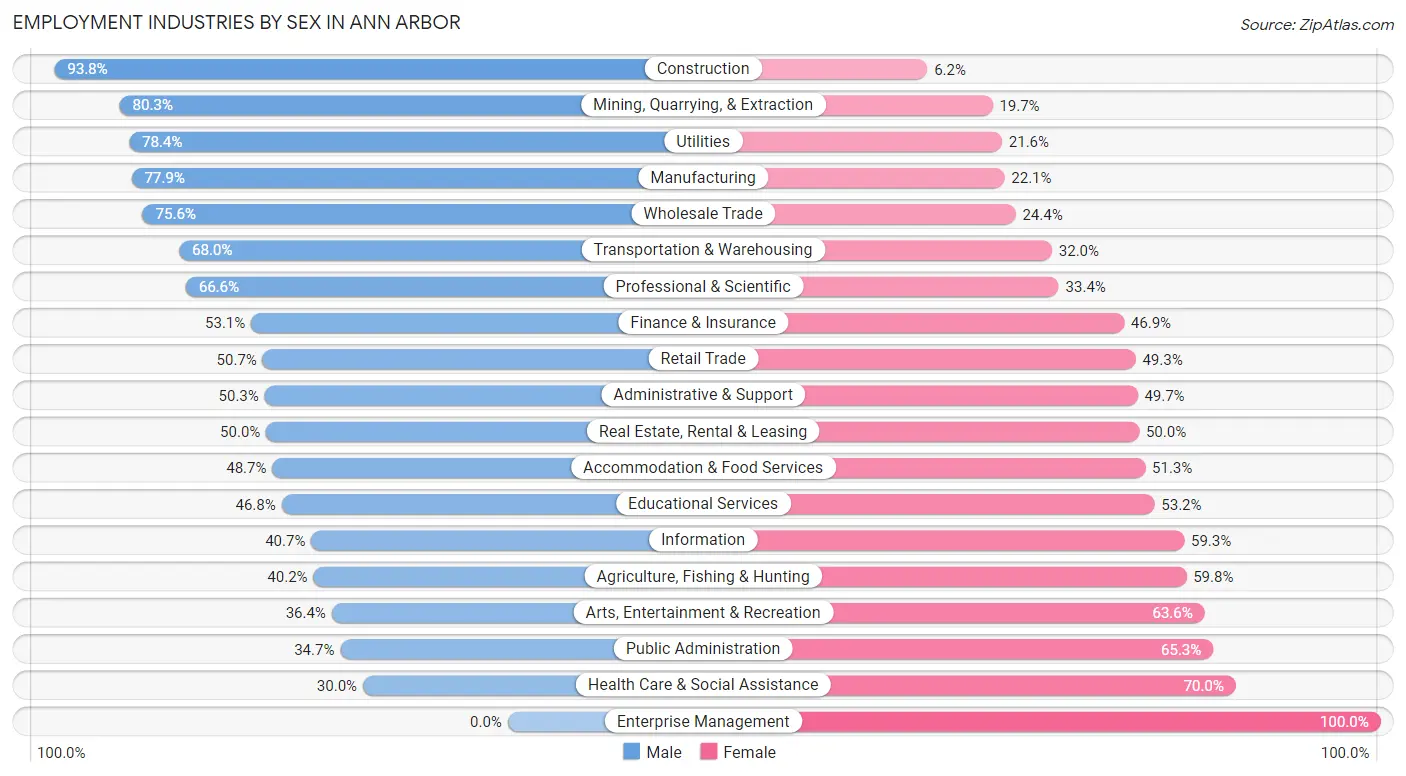
Employment Industries by Sex in Ann Arbor
The Ann Arbor industries that see more men than women are Construction (93.8%), Mining, Quarrying, & Extraction (80.3%), and Utilities (78.4%), whereas the industries that tend to have a higher number of women are Enterprise Management (100.0%), Health Care & Social Assistance (70.0%), and Public Administration (65.3%).
| Industry | Male | Female |
| Agriculture, Fishing & Hunting | 37 (40.2%) | 55 (59.8%) |
| Mining, Quarrying, & Extraction | 49 (80.3%) | 12 (19.7%) |
| Construction | 837 (93.8%) | 55 (6.2%) |
| Manufacturing | 4,621 (77.9%) | 1,313 (22.1%) |
| Wholesale Trade | 538 (75.6%) | 174 (24.4%) |
| Retail Trade | 1,983 (50.7%) | 1,927 (49.3%) |
| Transportation & Warehousing | 500 (68.0%) | 235 (32.0%) |
| Utilities | 145 (78.4%) | 40 (21.6%) |
| Information | 475 (40.7%) | 693 (59.3%) |
| Finance & Insurance | 749 (53.1%) | 661 (46.9%) |
| Real Estate, Rental & Leasing | 391 (50.0%) | 391 (50.0%) |
| Professional & Scientific | 4,886 (66.6%) | 2,447 (33.4%) |
| Enterprise Management | 0 (0.0%) | 20 (100.0%) |
| Administrative & Support | 789 (50.3%) | 779 (49.7%) |
| Educational Services | 10,151 (46.8%) | 11,531 (53.2%) |
| Health Care & Social Assistance | 2,587 (30.0%) | 6,043 (70.0%) |
| Arts, Entertainment & Recreation | 613 (36.4%) | 1,069 (63.6%) |
| Accommodation & Food Services | 1,959 (48.7%) | 2,061 (51.3%) |
| Public Administration | 276 (34.7%) | 520 (65.3%) |
| Total | 32,516 (51.0%) | 31,177 (48.9%) |
Education in Ann Arbor
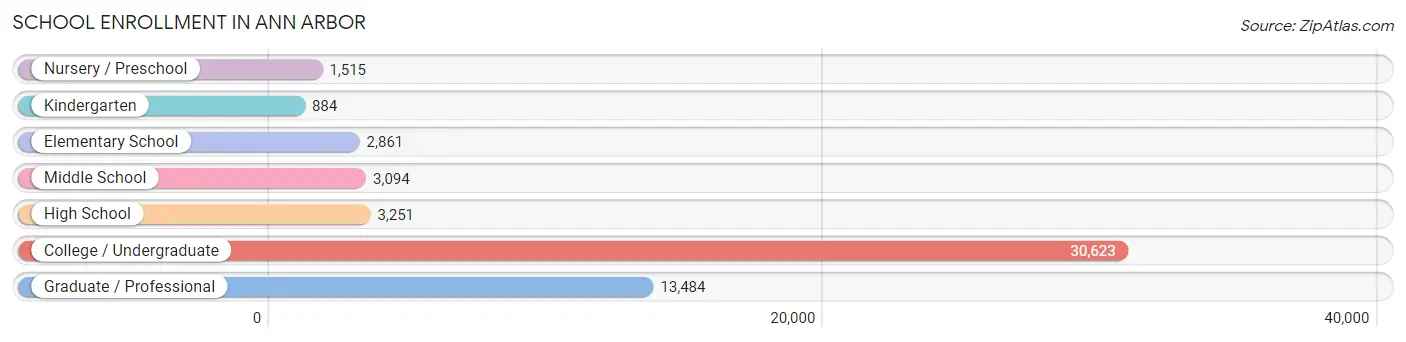
School Enrollment in Ann Arbor
The most common levels of schooling among the 55,712 students in Ann Arbor are college / undergraduate (30,623 | 55.0%), graduate / professional (13,484 | 24.2%), and high school (3,251 | 5.8%).
| School Level | # Students | % Students |
| Nursery / Preschool | 1,515 | 2.7% |
| Kindergarten | 884 | 1.6% |
| Elementary School | 2,861 | 5.1% |
| Middle School | 3,094 | 5.6% |
| High School | 3,251 | 5.8% |
| College / Undergraduate | 30,623 | 55.0% |
| Graduate / Professional | 13,484 | 24.2% |
| Total | 55,712 | 100.0% |
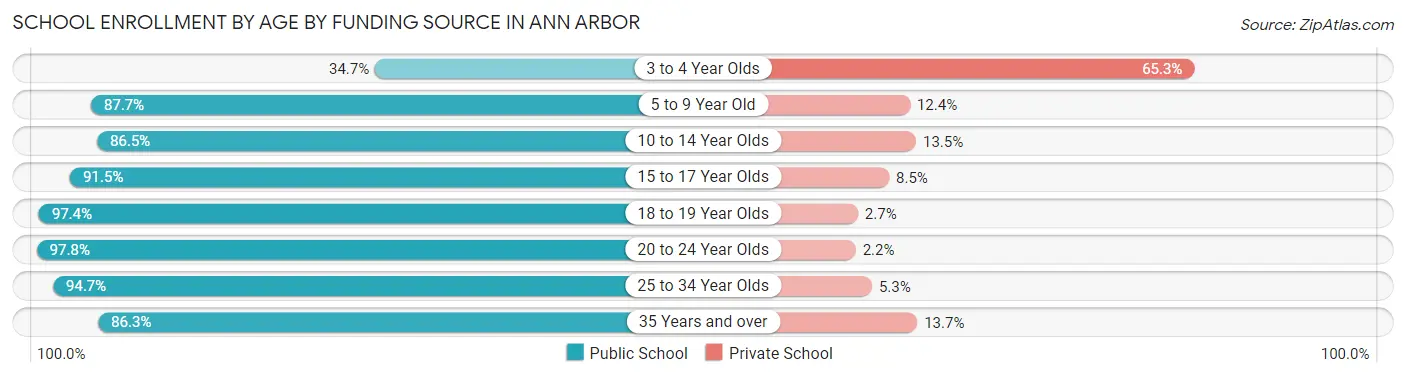
School Enrollment by Age by Funding Source in Ann Arbor
Out of a total of 55,712 students who are enrolled in schools in Ann Arbor, 3,454 (6.2%) attend a private institution, while the remaining 52,258 (93.8%) are enrolled in public schools. The age group of 3 to 4 year olds has the highest likelihood of being enrolled in private schools, with 865 (65.3% in the age bracket) enrolled. Conversely, the age group of 20 to 24 year olds has the lowest likelihood of being enrolled in a private school, with 23,526 (97.8% in the age bracket) attending a public institution.
| Age Bracket | Public School | Private School |
| 3 to 4 Year Olds | 460 (34.7%) | 865 (65.3%) |
| 5 to 9 Year Old | 3,158 (87.6%) | 445 (12.3%) |
| 10 to 14 Year Olds | 3,369 (86.5%) | 525 (13.5%) |
| 15 to 17 Year Olds | 2,120 (91.5%) | 196 (8.5%) |
| 18 to 19 Year Olds | 11,200 (97.4%) | 305 (2.6%) |
| 20 to 24 Year Olds | 23,526 (97.8%) | 539 (2.2%) |
| 25 to 34 Year Olds | 7,098 (94.7%) | 395 (5.3%) |
| 35 Years and over | 1,304 (86.3%) | 207 (13.7%) |
| Total | 52,258 (93.8%) | 3,454 (6.2%) |
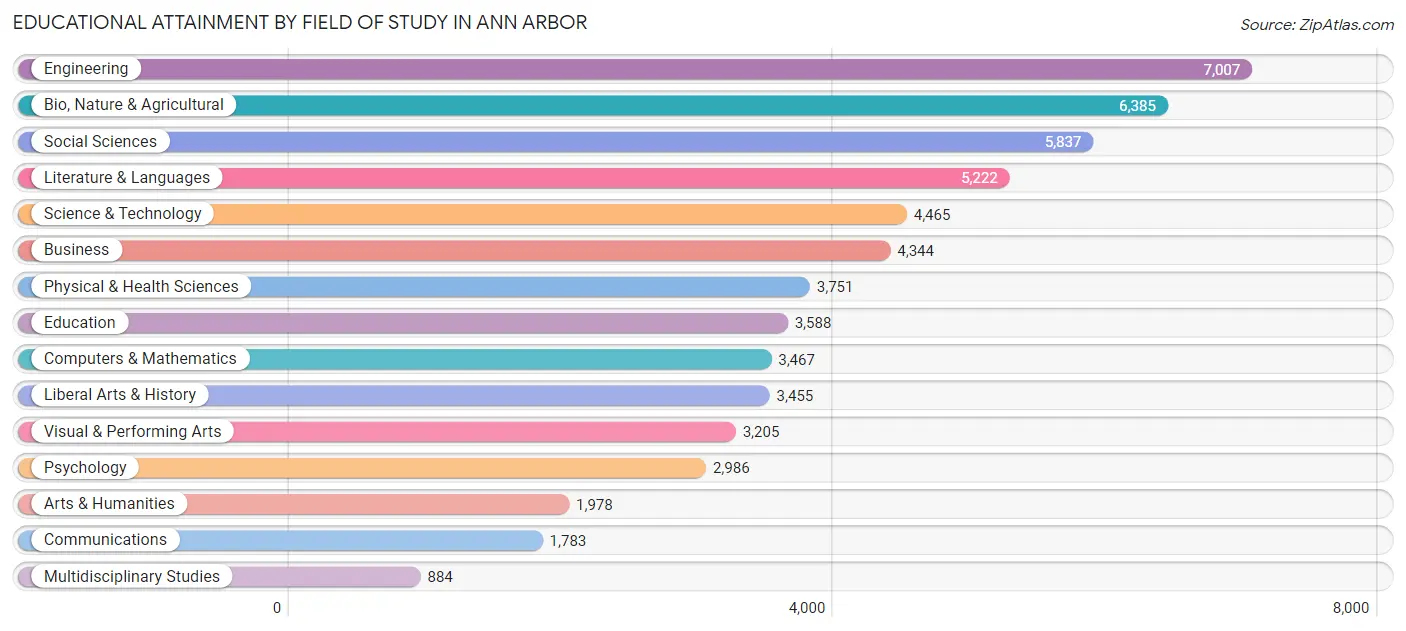
Educational Attainment by Field of Study in Ann Arbor
Engineering (7,007 | 12.0%), bio, nature & agricultural (6,385 | 10.9%), social sciences (5,837 | 10.0%), literature & languages (5,222 | 8.9%), and science & technology (4,465 | 7.6%) are the most common fields of study among 58,357 individuals in Ann Arbor who have obtained a bachelor's degree or higher.
| Field of Study | # Graduates | % Graduates |
| Computers & Mathematics | 3,467 | 5.9% |
| Bio, Nature & Agricultural | 6,385 | 10.9% |
| Physical & Health Sciences | 3,751 | 6.4% |
| Psychology | 2,986 | 5.1% |
| Social Sciences | 5,837 | 10.0% |
| Engineering | 7,007 | 12.0% |
| Multidisciplinary Studies | 884 | 1.5% |
| Science & Technology | 4,465 | 7.6% |
| Business | 4,344 | 7.4% |
| Education | 3,588 | 6.1% |
| Literature & Languages | 5,222 | 8.9% |
| Liberal Arts & History | 3,455 | 5.9% |
| Visual & Performing Arts | 3,205 | 5.5% |
| Communications | 1,783 | 3.1% |
| Arts & Humanities | 1,978 | 3.4% |
| Total | 58,357 | 100.0% |
Transportation & Commute in Ann Arbor
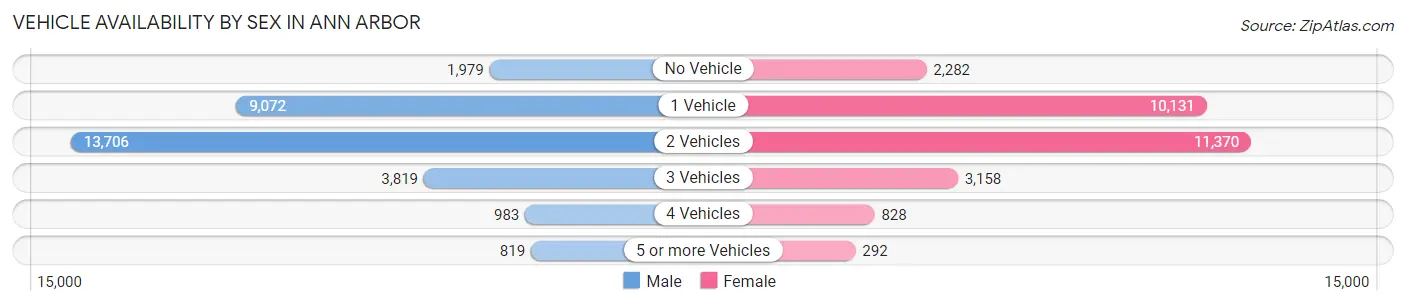
Vehicle Availability by Sex in Ann Arbor
The most prevalent vehicle ownership categories in Ann Arbor are males with 2 vehicles (13,706, accounting for 45.1%) and females with 2 vehicles (11,370, making up 48.8%).
| Vehicles Available | Male | Female |
| No Vehicle | 1,979 (6.5%) | 2,282 (8.1%) |
| 1 Vehicle | 9,072 (29.9%) | 10,131 (36.1%) |
| 2 Vehicles | 13,706 (45.1%) | 11,370 (40.5%) |
| 3 Vehicles | 3,819 (12.6%) | 3,158 (11.3%) |
| 4 Vehicles | 983 (3.2%) | 828 (2.9%) |
| 5 or more Vehicles | 819 (2.7%) | 292 (1.0%) |
| Total | 30,378 (100.0%) | 28,061 (100.0%) |
Commute Time in Ann Arbor
The most frequently occuring commute durations in Ann Arbor are 10 to 14 minutes (11,234 commuters, 23.4%), 15 to 19 minutes (10,987 commuters, 22.9%), and 20 to 24 minutes (6,759 commuters, 14.1%).
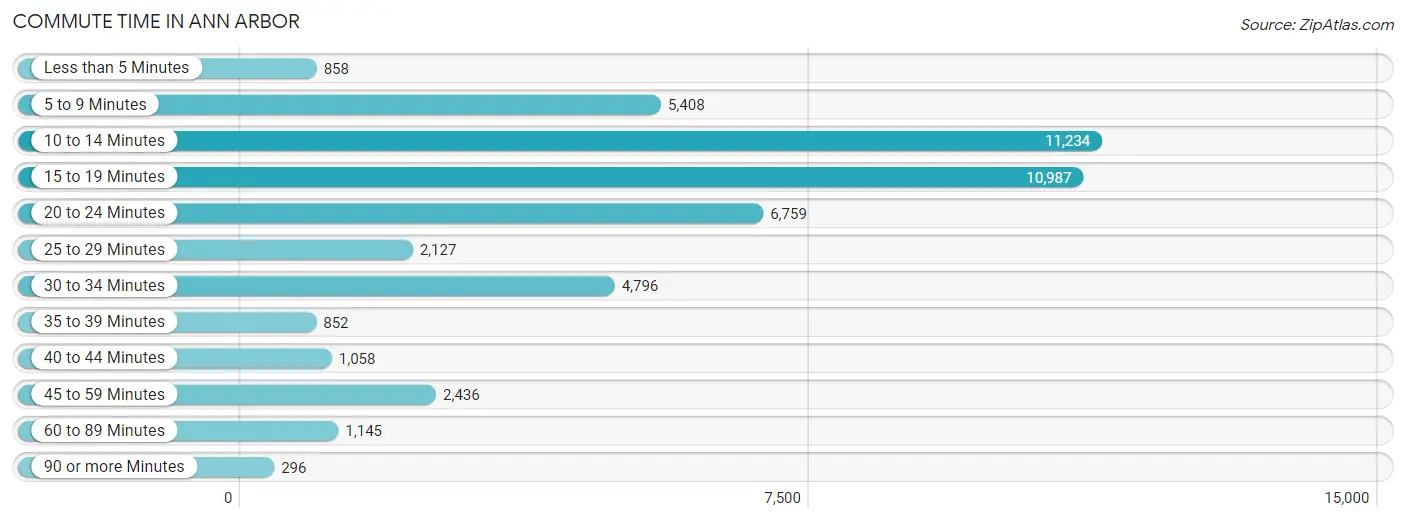
| Commute Time | # Commuters | % Commuters |
| Less than 5 Minutes | 858 | 1.8% |
| 5 to 9 Minutes | 5,408 | 11.3% |
| 10 to 14 Minutes | 11,234 | 23.4% |
| 15 to 19 Minutes | 10,987 | 22.9% |
| 20 to 24 Minutes | 6,759 | 14.1% |
| 25 to 29 Minutes | 2,127 | 4.4% |
| 30 to 34 Minutes | 4,796 | 10.0% |
| 35 to 39 Minutes | 852 | 1.8% |
| 40 to 44 Minutes | 1,058 | 2.2% |
| 45 to 59 Minutes | 2,436 | 5.1% |
| 60 to 89 Minutes | 1,145 | 2.4% |
| 90 or more Minutes | 296 | 0.6% |
Commute Time by Sex in Ann Arbor
The most common commute times in Ann Arbor are 10 to 14 minutes (5,788 commuters, 23.9%) for males and 10 to 14 minutes (5,446 commuters, 23.0%) for females.
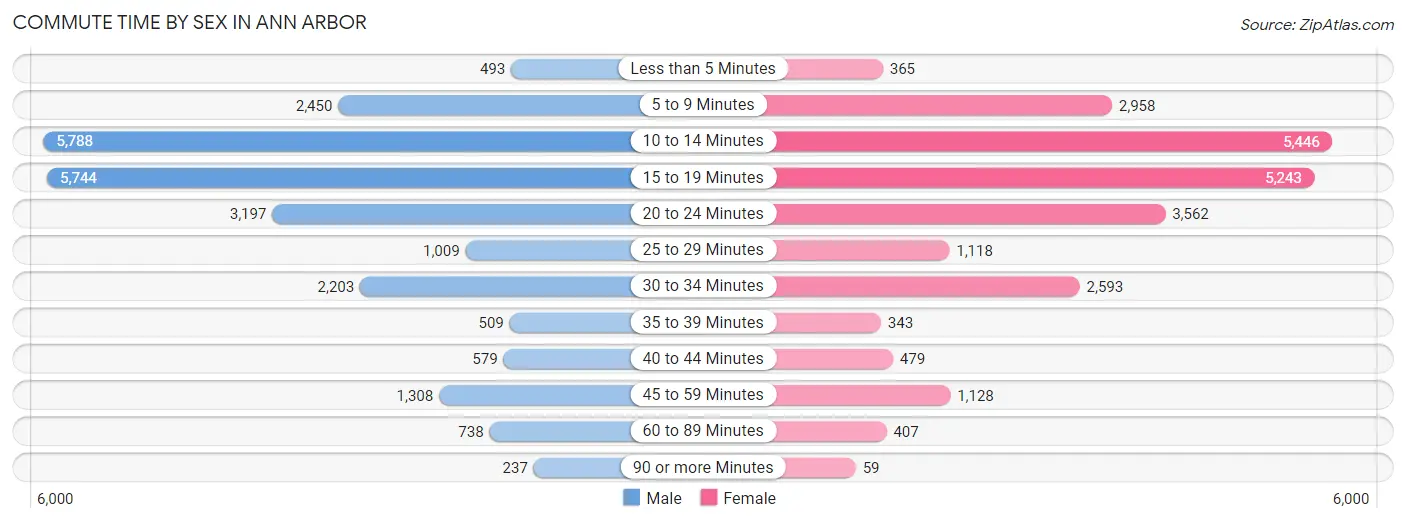
| Commute Time | Male | Female |
| Less than 5 Minutes | 493 (2.0%) | 365 (1.5%) |
| 5 to 9 Minutes | 2,450 (10.1%) | 2,958 (12.5%) |
| 10 to 14 Minutes | 5,788 (23.9%) | 5,446 (23.0%) |
| 15 to 19 Minutes | 5,744 (23.7%) | 5,243 (22.1%) |
| 20 to 24 Minutes | 3,197 (13.2%) | 3,562 (15.0%) |
| 25 to 29 Minutes | 1,009 (4.2%) | 1,118 (4.7%) |
| 30 to 34 Minutes | 2,203 (9.1%) | 2,593 (10.9%) |
| 35 to 39 Minutes | 509 (2.1%) | 343 (1.5%) |
| 40 to 44 Minutes | 579 (2.4%) | 479 (2.0%) |
| 45 to 59 Minutes | 1,308 (5.4%) | 1,128 (4.8%) |
| 60 to 89 Minutes | 738 (3.0%) | 407 (1.7%) |
| 90 or more Minutes | 237 (1.0%) | 59 (0.3%) |
Time of Departure to Work by Sex in Ann Arbor
The most frequent times of departure to work in Ann Arbor are 8:00 AM to 8:29 AM (3,442, 14.2%) for males and 9:00 AM to 9:59 AM (3,284, 13.9%) for females.
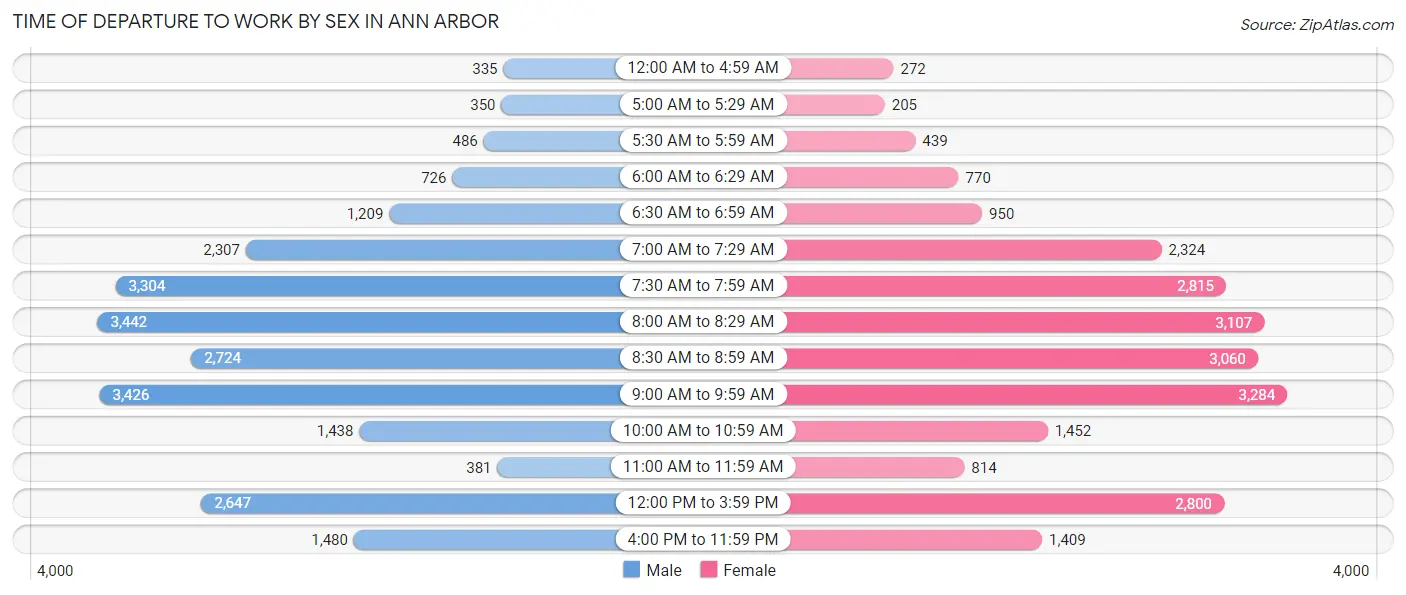
| Time of Departure | Male | Female |
| 12:00 AM to 4:59 AM | 335 (1.4%) | 272 (1.1%) |
| 5:00 AM to 5:29 AM | 350 (1.4%) | 205 (0.9%) |
| 5:30 AM to 5:59 AM | 486 (2.0%) | 439 (1.8%) |
| 6:00 AM to 6:29 AM | 726 (3.0%) | 770 (3.3%) |
| 6:30 AM to 6:59 AM | 1,209 (5.0%) | 950 (4.0%) |
| 7:00 AM to 7:29 AM | 2,307 (9.5%) | 2,324 (9.8%) |
| 7:30 AM to 7:59 AM | 3,304 (13.6%) | 2,815 (11.9%) |
| 8:00 AM to 8:29 AM | 3,442 (14.2%) | 3,107 (13.1%) |
| 8:30 AM to 8:59 AM | 2,724 (11.2%) | 3,060 (12.9%) |
| 9:00 AM to 9:59 AM | 3,426 (14.1%) | 3,284 (13.9%) |
| 10:00 AM to 10:59 AM | 1,438 (5.9%) | 1,452 (6.1%) |
| 11:00 AM to 11:59 AM | 381 (1.6%) | 814 (3.4%) |
| 12:00 PM to 3:59 PM | 2,647 (10.9%) | 2,800 (11.8%) |
| 4:00 PM to 11:59 PM | 1,480 (6.1%) | 1,409 (5.9%) |
| Total | 24,255 (100.0%) | 23,701 (100.0%) |
Housing Occupancy in Ann Arbor
Occupancy by Ownership in Ann Arbor
Of the total 50,110 dwellings in Ann Arbor, owner-occupied units account for 22,529 (45.0%), while renter-occupied units make up 27,581 (55.0%).
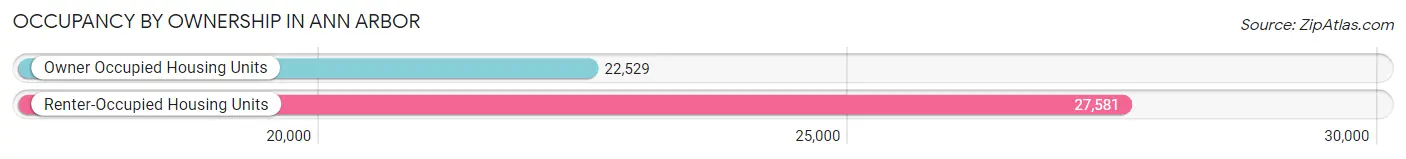
| Occupancy | # Housing Units | % Housing Units |
| Owner Occupied Housing Units | 22,529 | 45.0% |
| Renter-Occupied Housing Units | 27,581 | 55.0% |
| Total Occupied Housing Units | 50,110 | 100.0% |
Occupancy by Household Size in Ann Arbor
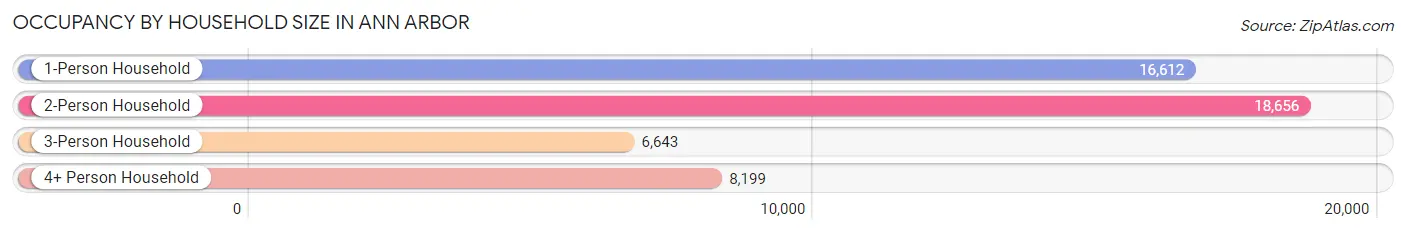
| Household Size | # Housing Units | % Housing Units |
| 1-Person Household | 16,612 | 33.2% |
| 2-Person Household | 18,656 | 37.2% |
| 3-Person Household | 6,643 | 13.3% |
| 4+ Person Household | 8,199 | 16.4% |
| Total Housing Units | 50,110 | 100.0% |
Occupancy by Ownership by Household Size in Ann Arbor
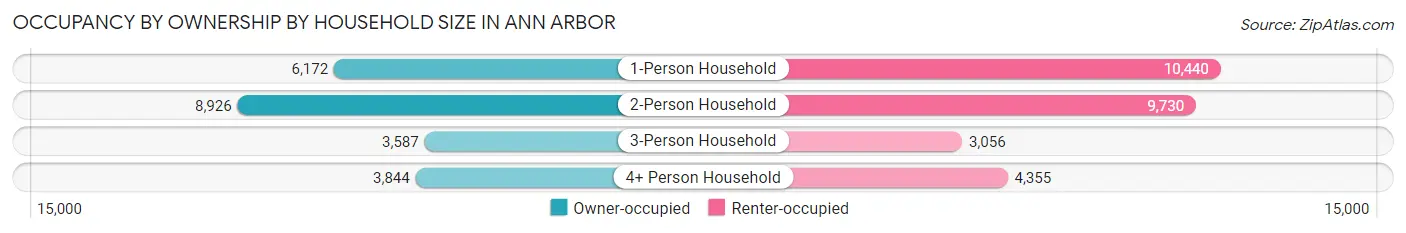
| Household Size | Owner-occupied | Renter-occupied |
| 1-Person Household | 6,172 (37.1%) | 10,440 (62.8%) |
| 2-Person Household | 8,926 (47.8%) | 9,730 (52.1%) |
| 3-Person Household | 3,587 (54.0%) | 3,056 (46.0%) |
| 4+ Person Household | 3,844 (46.9%) | 4,355 (53.1%) |
| Total Housing Units | 22,529 (45.0%) | 27,581 (55.0%) |
Occupancy by Educational Attainment in Ann Arbor
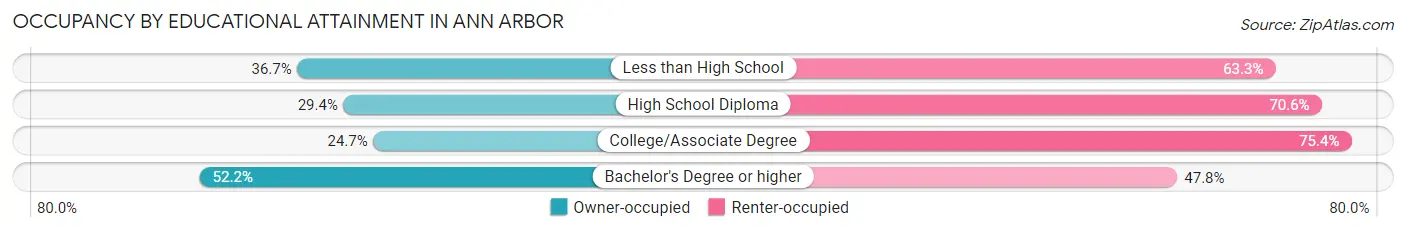
| Household Size | Owner-occupied | Renter-occupied |
| Less than High School | 232 (36.7%) | 400 (63.3%) |
| High School Diploma | 1,118 (29.4%) | 2,687 (70.6%) |
| College/Associate Degree | 2,390 (24.6%) | 7,306 (75.3%) |
| Bachelor's Degree or higher | 18,789 (52.2%) | 17,188 (47.8%) |
Occupancy by Age of Householder in Ann Arbor
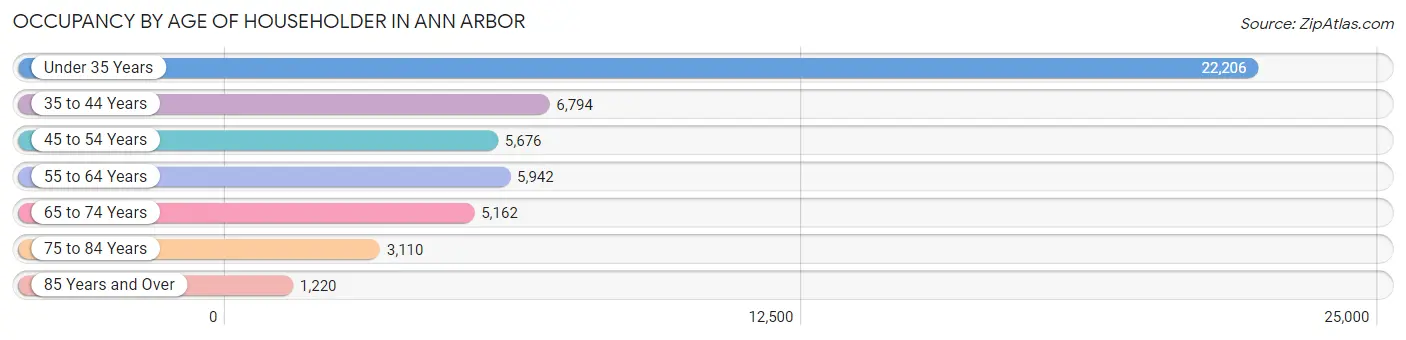
| Age Bracket | # Households | % Households |
| Under 35 Years | 22,206 | 44.3% |
| 35 to 44 Years | 6,794 | 13.6% |
| 45 to 54 Years | 5,676 | 11.3% |
| 55 to 64 Years | 5,942 | 11.9% |
| 65 to 74 Years | 5,162 | 10.3% |
| 75 to 84 Years | 3,110 | 6.2% |
| 85 Years and Over | 1,220 | 2.4% |
| Total | 50,110 | 100.0% |
Housing Finances in Ann Arbor
Median Income by Occupancy in Ann Arbor
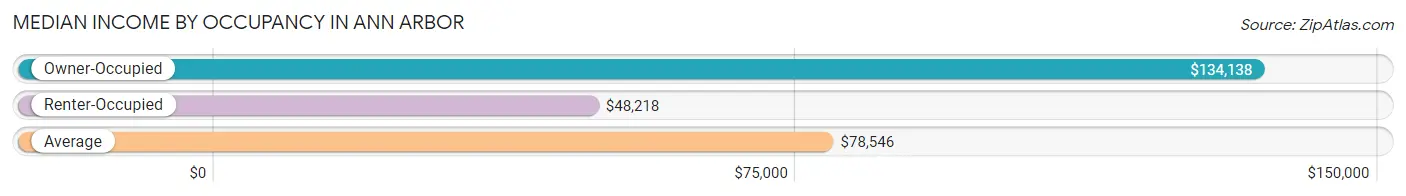
| Occupancy Type | # Households | Median Income |
| Owner-Occupied | 22,529 (45.0%) | $134,138 |
| Renter-Occupied | 27,581 (55.0%) | $48,218 |
| Average | 50,110 (100.0%) | $78,546 |
Occupancy by Householder Income Bracket in Ann Arbor
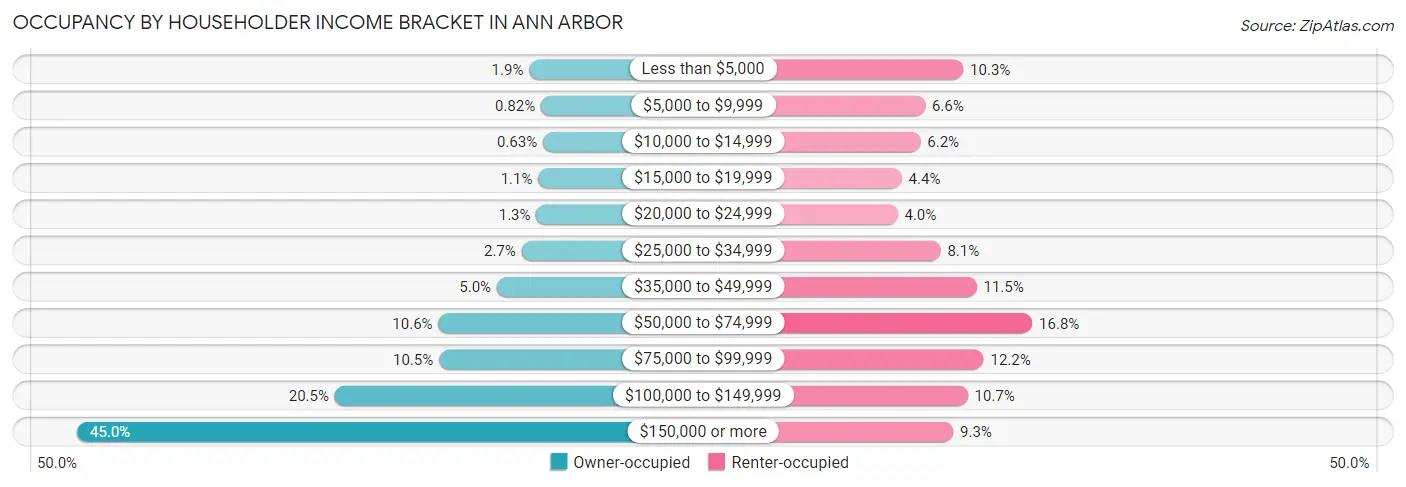
| Income Bracket | Owner-occupied | Renter-occupied |
| Less than $5,000 | 437 (1.9%) | 2,826 (10.2%) |
| $5,000 to $9,999 | 184 (0.8%) | 1,823 (6.6%) |
| $10,000 to $14,999 | 141 (0.6%) | 1,701 (6.2%) |
| $15,000 to $19,999 | 244 (1.1%) | 1,211 (4.4%) |
| $20,000 to $24,999 | 283 (1.3%) | 1,103 (4.0%) |
| $25,000 to $34,999 | 600 (2.7%) | 2,231 (8.1%) |
| $35,000 to $49,999 | 1,132 (5.0%) | 3,177 (11.5%) |
| $50,000 to $74,999 | 2,385 (10.6%) | 4,640 (16.8%) |
| $75,000 to $99,999 | 2,373 (10.5%) | 3,363 (12.2%) |
| $100,000 to $149,999 | 4,610 (20.5%) | 2,943 (10.7%) |
| $150,000 or more | 10,140 (45.0%) | 2,563 (9.3%) |
| Total | 22,529 (100.0%) | 27,581 (100.0%) |
Monthly Housing Cost Tiers in Ann Arbor
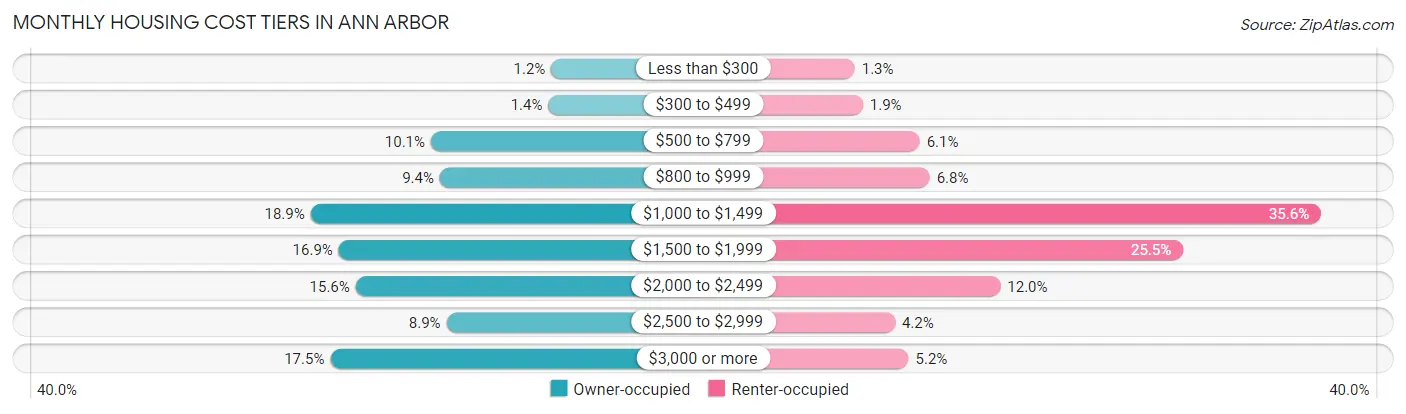
| Monthly Cost | Owner-occupied | Renter-occupied |
| Less than $300 | 275 (1.2%) | 353 (1.3%) |
| $300 to $499 | 322 (1.4%) | 516 (1.9%) |
| $500 to $799 | 2,271 (10.1%) | 1,671 (6.1%) |
| $800 to $999 | 2,122 (9.4%) | 1,875 (6.8%) |
| $1,000 to $1,499 | 4,268 (18.9%) | 9,821 (35.6%) |
| $1,500 to $1,999 | 3,800 (16.9%) | 7,020 (25.5%) |
| $2,000 to $2,499 | 3,518 (15.6%) | 3,309 (12.0%) |
| $2,500 to $2,999 | 2,012 (8.9%) | 1,170 (4.2%) |
| $3,000 or more | 3,941 (17.5%) | 1,445 (5.2%) |
| Total | 22,529 (100.0%) | 27,581 (100.0%) |
Physical Housing Characteristics in Ann Arbor
Housing Structures in Ann Arbor
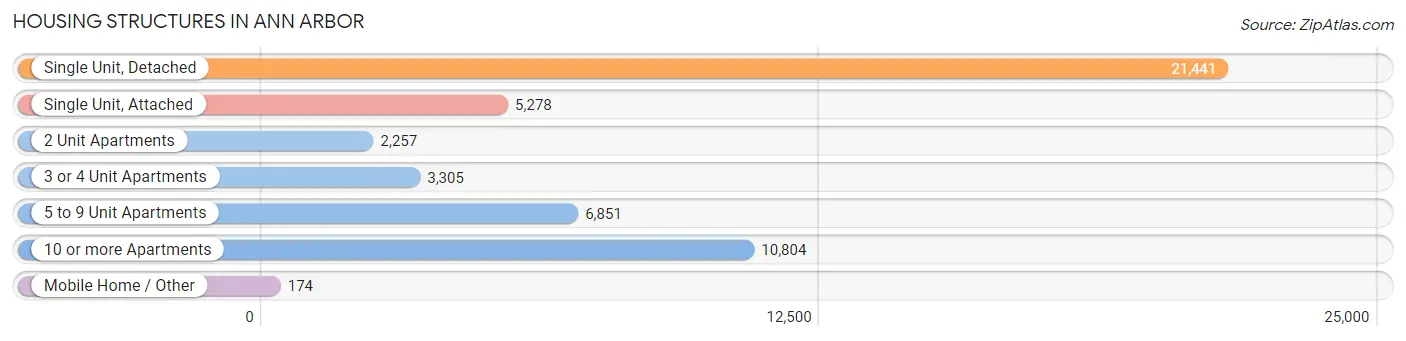
| Structure Type | # Housing Units | % Housing Units |
| Single Unit, Detached | 21,441 | 42.8% |
| Single Unit, Attached | 5,278 | 10.5% |
| 2 Unit Apartments | 2,257 | 4.5% |
| 3 or 4 Unit Apartments | 3,305 | 6.6% |
| 5 to 9 Unit Apartments | 6,851 | 13.7% |
| 10 or more Apartments | 10,804 | 21.6% |
| Mobile Home / Other | 174 | 0.4% |
| Total | 50,110 | 100.0% |
Housing Structures by Occupancy in Ann Arbor
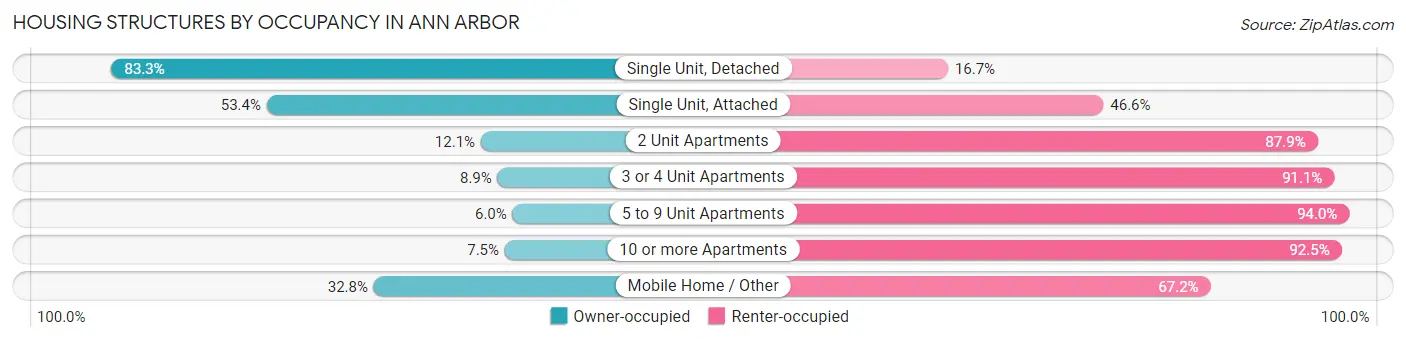
| Structure Type | Owner-occupied | Renter-occupied |
| Single Unit, Detached | 17,858 (83.3%) | 3,583 (16.7%) |
| Single Unit, Attached | 2,817 (53.4%) | 2,461 (46.6%) |
| 2 Unit Apartments | 274 (12.1%) | 1,983 (87.9%) |
| 3 or 4 Unit Apartments | 295 (8.9%) | 3,010 (91.1%) |
| 5 to 9 Unit Apartments | 414 (6.0%) | 6,437 (94.0%) |
| 10 or more Apartments | 814 (7.5%) | 9,990 (92.5%) |
| Mobile Home / Other | 57 (32.8%) | 117 (67.2%) |
| Total | 22,529 (45.0%) | 27,581 (55.0%) |
Housing Structures by Number of Rooms in Ann Arbor
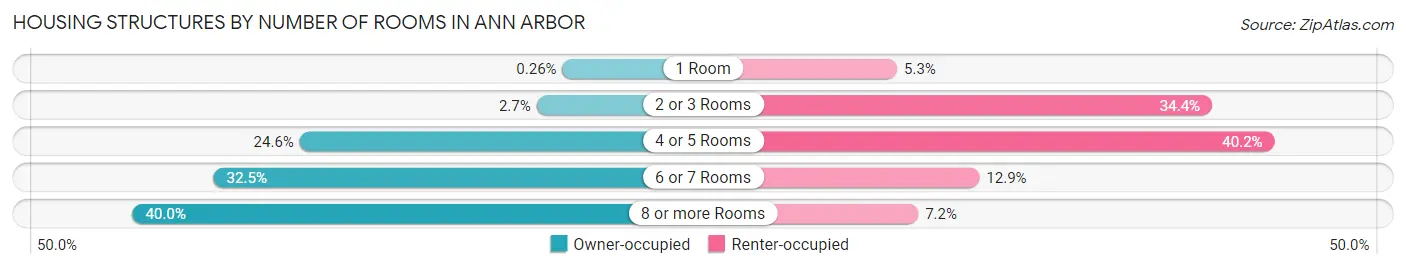
| Number of Rooms | Owner-occupied | Renter-occupied |
| 1 Room | 58 (0.3%) | 1,458 (5.3%) |
| 2 or 3 Rooms | 598 (2.6%) | 9,487 (34.4%) |
| 4 or 5 Rooms | 5,532 (24.6%) | 11,081 (40.2%) |
| 6 or 7 Rooms | 7,324 (32.5%) | 3,557 (12.9%) |
| 8 or more Rooms | 9,017 (40.0%) | 1,998 (7.2%) |
| Total | 22,529 (100.0%) | 27,581 (100.0%) |
Housing Structure by Heating Type in Ann Arbor
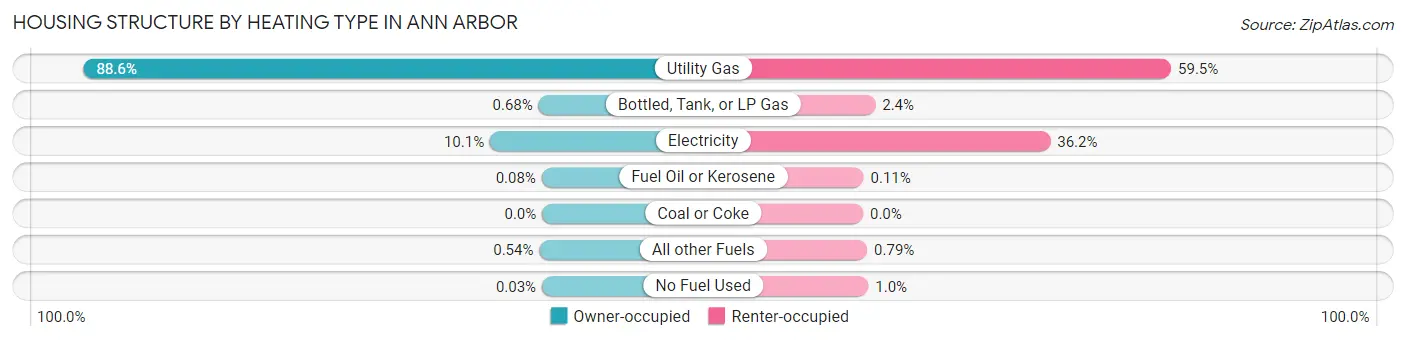
| Heating Type | Owner-occupied | Renter-occupied |
| Utility Gas | 19,962 (88.6%) | 16,420 (59.5%) |
| Bottled, Tank, or LP Gas | 153 (0.7%) | 651 (2.4%) |
| Electricity | 2,268 (10.1%) | 9,980 (36.2%) |
| Fuel Oil or Kerosene | 18 (0.1%) | 31 (0.1%) |
| Coal or Coke | 0 (0.0%) | 0 (0.0%) |
| All other Fuels | 121 (0.5%) | 217 (0.8%) |
| No Fuel Used | 7 (0.0%) | 282 (1.0%) |
| Total | 22,529 (100.0%) | 27,581 (100.0%) |
Household Vehicle Usage in Ann Arbor
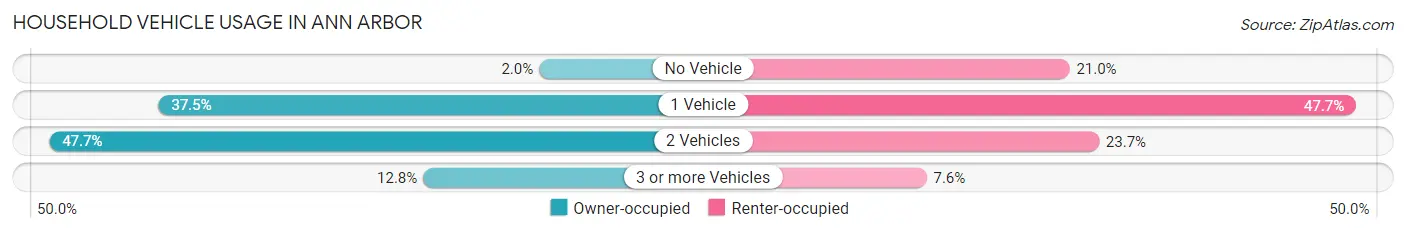
| Vehicles per Household | Owner-occupied | Renter-occupied |
| No Vehicle | 446 (2.0%) | 5,782 (21.0%) |
| 1 Vehicle | 8,454 (37.5%) | 13,159 (47.7%) |
| 2 Vehicles | 10,746 (47.7%) | 6,539 (23.7%) |
| 3 or more Vehicles | 2,883 (12.8%) | 2,101 (7.6%) |
| Total | 22,529 (100.0%) | 27,581 (100.0%) |
Real Estate & Mortgages in Ann Arbor
Real Estate and Mortgage Overview in Ann Arbor
| Characteristic | Without Mortgage | With Mortgage |
| Housing Units | 8,586 | 13,943 |
| Median Property Value | $394,200 | $430,300 |
| Median Household Income | $108,319 | $7,369 |
| Monthly Housing Costs | $944 | $3,883 |
| Real Estate Taxes | $6,525 | $151 |
Property Value by Mortgage Status in Ann Arbor
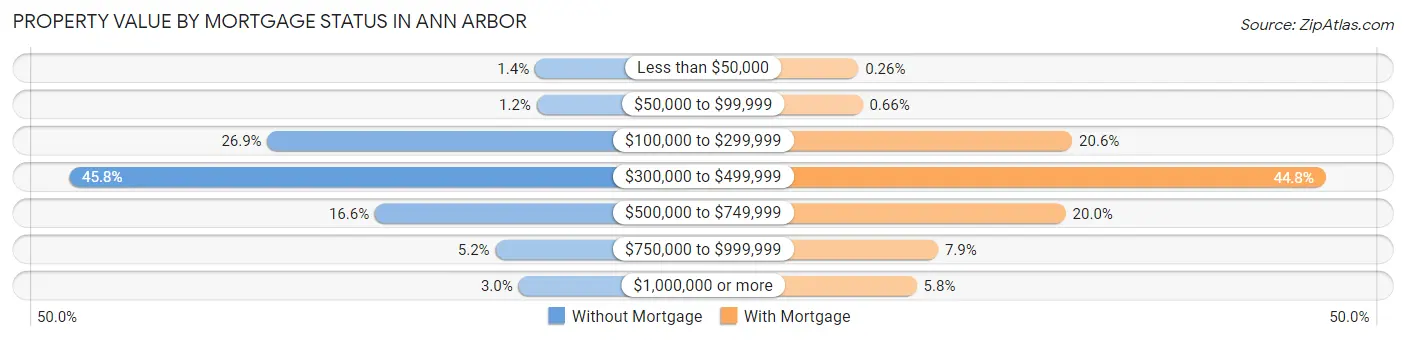
| Property Value | Without Mortgage | With Mortgage |
| Less than $50,000 | 119 (1.4%) | 36 (0.3%) |
| $50,000 to $99,999 | 106 (1.2%) | 92 (0.7%) |
| $100,000 to $299,999 | 2,307 (26.9%) | 2,877 (20.6%) |
| $300,000 to $499,999 | 3,929 (45.8%) | 6,243 (44.8%) |
| $500,000 to $749,999 | 1,428 (16.6%) | 2,790 (20.0%) |
| $750,000 to $999,999 | 443 (5.2%) | 1,094 (7.9%) |
| $1,000,000 or more | 254 (3.0%) | 811 (5.8%) |
| Total | 8,586 (100.0%) | 13,943 (100.0%) |
Household Income by Mortgage Status in Ann Arbor
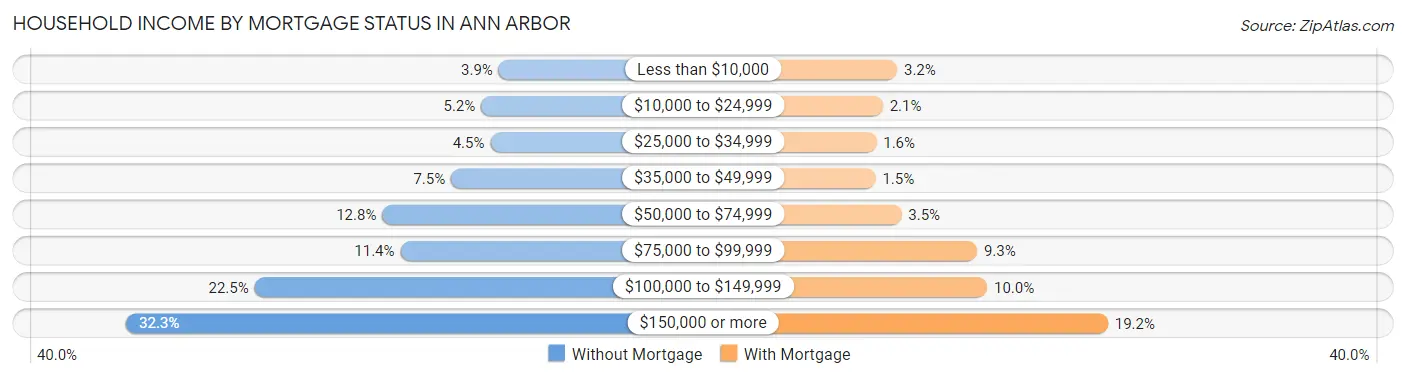
| Household Income | Without Mortgage | With Mortgage |
| Less than $10,000 | 333 (3.9%) | 441 (3.2%) |
| $10,000 to $24,999 | 448 (5.2%) | 288 (2.1%) |
| $25,000 to $34,999 | 388 (4.5%) | 220 (1.6%) |
| $35,000 to $49,999 | 645 (7.5%) | 212 (1.5%) |
| $50,000 to $74,999 | 1,095 (12.8%) | 487 (3.5%) |
| $75,000 to $99,999 | 976 (11.4%) | 1,290 (9.2%) |
| $100,000 to $149,999 | 1,930 (22.5%) | 1,397 (10.0%) |
| $150,000 or more | 2,771 (32.3%) | 2,680 (19.2%) |
| Total | 8,586 (100.0%) | 13,943 (100.0%) |
Property Value to Household Income Ratio in Ann Arbor
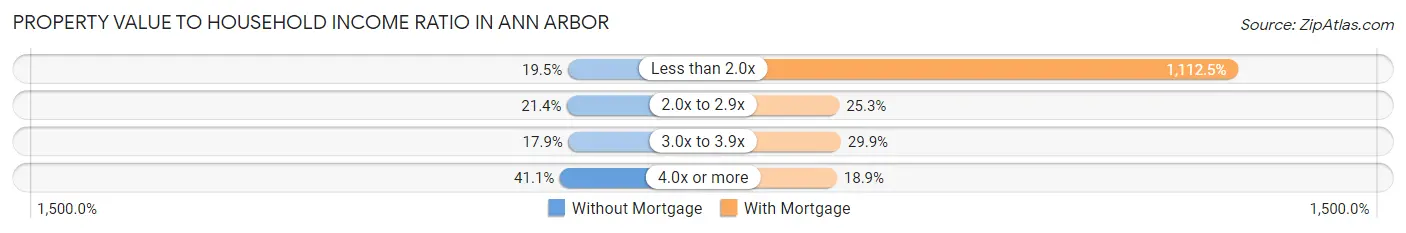
| Value-to-Income Ratio | Without Mortgage | With Mortgage |
| Less than 2.0x | 1,673 (19.5%) | 155,122 (1,112.5%) |
| 2.0x to 2.9x | 1,833 (21.3%) | 3,524 (25.3%) |
| 3.0x to 3.9x | 1,539 (17.9%) | 4,171 (29.9%) |
| 4.0x or more | 3,526 (41.1%) | 2,629 (18.9%) |
| Total | 8,586 (100.0%) | 13,943 (100.0%) |
Real Estate Taxes by Mortgage Status in Ann Arbor
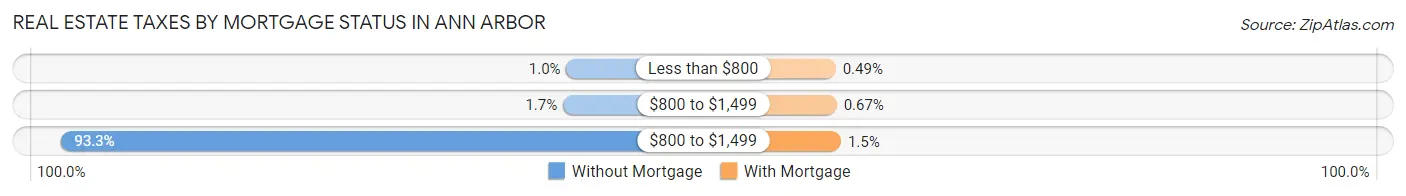
| Property Taxes | Without Mortgage | With Mortgage |
| Less than $800 | 89 (1.0%) | 68 (0.5%) |
| $800 to $1,499 | 142 (1.7%) | 94 (0.7%) |
| $800 to $1,499 | 8,009 (93.3%) | 202 (1.5%) |
| Total | 8,586 (100.0%) | 13,943 (100.0%) |
Health & Disability in Ann Arbor
Health Insurance Coverage by Age in Ann Arbor
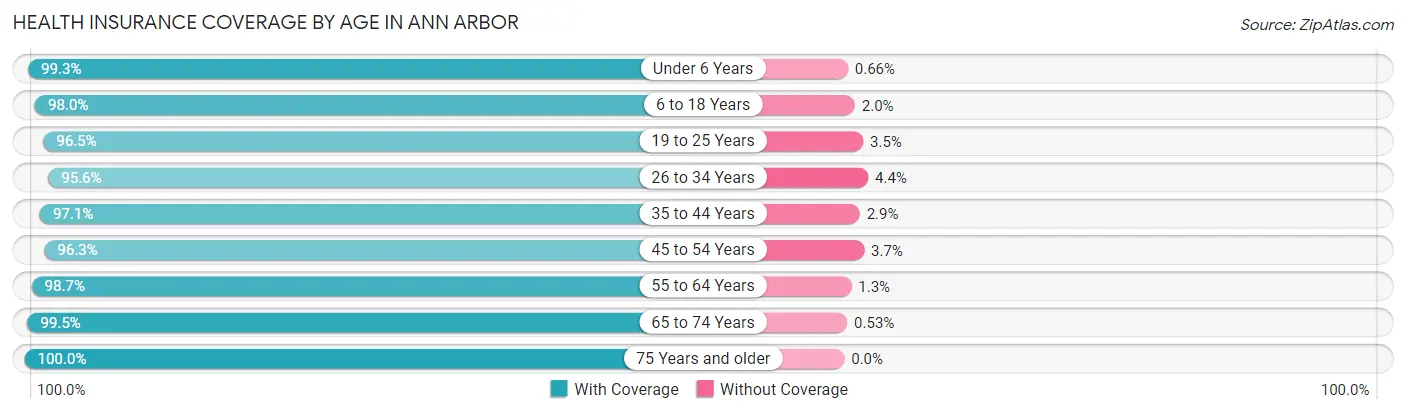
| Age Bracket | With Coverage | Without Coverage |
| Under 6 Years | 5,422 (99.3%) | 36 (0.7%) |
| 6 to 18 Years | 14,526 (98.0%) | 292 (2.0%) |
| 19 to 25 Years | 36,018 (96.5%) | 1,310 (3.5%) |
| 26 to 34 Years | 17,228 (95.6%) | 801 (4.4%) |
| 35 to 44 Years | 11,841 (97.1%) | 351 (2.9%) |
| 45 to 54 Years | 9,337 (96.3%) | 358 (3.7%) |
| 55 to 64 Years | 9,392 (98.7%) | 125 (1.3%) |
| 65 to 74 Years | 8,139 (99.5%) | 43 (0.5%) |
| 75 Years and older | 6,398 (100.0%) | 0 (0.0%) |
| Total | 118,301 (97.3%) | 3,316 (2.7%) |
Health Insurance Coverage by Citizenship Status in Ann Arbor
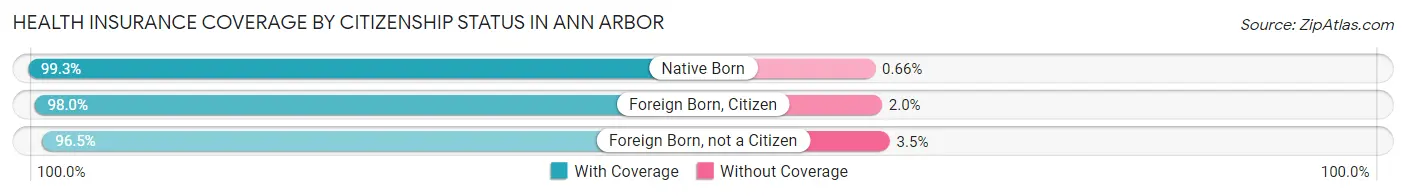
| Citizenship Status | With Coverage | Without Coverage |
| Native Born | 5,422 (99.3%) | 36 (0.7%) |
| Foreign Born, Citizen | 14,526 (98.0%) | 292 (2.0%) |
| Foreign Born, not a Citizen | 36,018 (96.5%) | 1,310 (3.5%) |
Health Insurance Coverage by Household Income in Ann Arbor
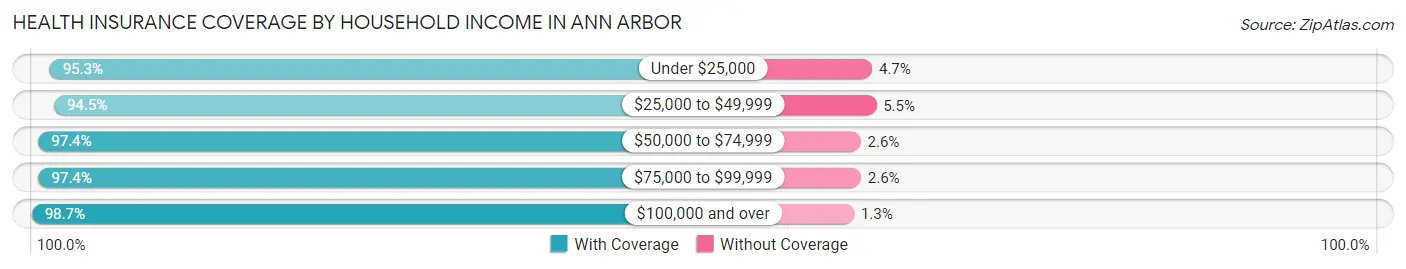
| Household Income | With Coverage | Without Coverage |
| Under $25,000 | 17,112 (95.3%) | 845 (4.7%) |
| $25,000 to $49,999 | 13,313 (94.5%) | 776 (5.5%) |
| $50,000 to $74,999 | 13,144 (97.4%) | 349 (2.6%) |
| $75,000 to $99,999 | 11,783 (97.4%) | 318 (2.6%) |
| $100,000 and over | 51,149 (98.7%) | 697 (1.3%) |
Public vs Private Health Insurance Coverage by Age in Ann Arbor
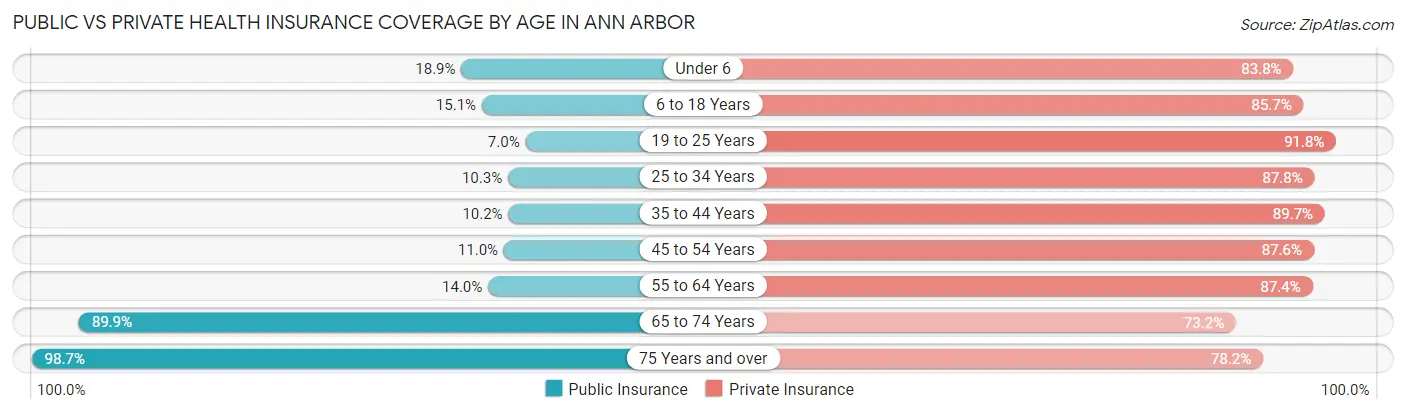
| Age Bracket | Public Insurance | Private Insurance |
| Under 6 | 1,033 (18.9%) | 4,575 (83.8%) |
| 6 to 18 Years | 2,241 (15.1%) | 12,699 (85.7%) |
| 19 to 25 Years | 2,626 (7.0%) | 34,254 (91.8%) |
| 25 to 34 Years | 1,853 (10.3%) | 15,821 (87.7%) |
| 35 to 44 Years | 1,242 (10.2%) | 10,933 (89.7%) |
| 45 to 54 Years | 1,069 (11.0%) | 8,494 (87.6%) |
| 55 to 64 Years | 1,330 (14.0%) | 8,316 (87.4%) |
| 65 to 74 Years | 7,358 (89.9%) | 5,986 (73.2%) |
| 75 Years and over | 6,314 (98.7%) | 5,003 (78.2%) |
| Total | 25,066 (20.6%) | 106,081 (87.2%) |
Disability Status by Sex by Age in Ann Arbor
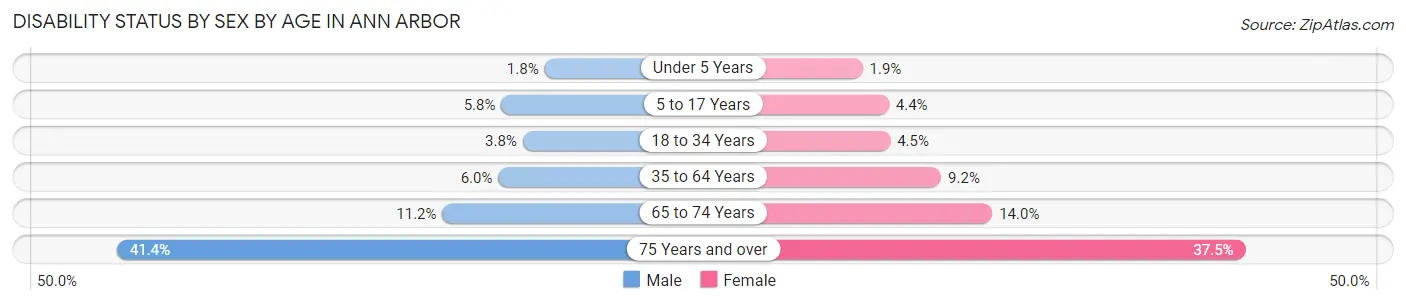
| Age Bracket | Male | Female |
| Under 5 Years | 44 (1.8%) | 44 (1.9%) |
| 5 to 17 Years | 295 (5.8%) | 220 (4.4%) |
| 18 to 34 Years | 1,157 (3.8%) | 1,348 (4.5%) |
| 35 to 64 Years | 949 (6.0%) | 1,448 (9.2%) |
| 65 to 74 Years | 428 (11.2%) | 610 (14.0%) |
| 75 Years and over | 1,096 (41.4%) | 1,406 (37.5%) |
Disability Class by Sex by Age in Ann Arbor
Disability Class: Hearing Difficulty
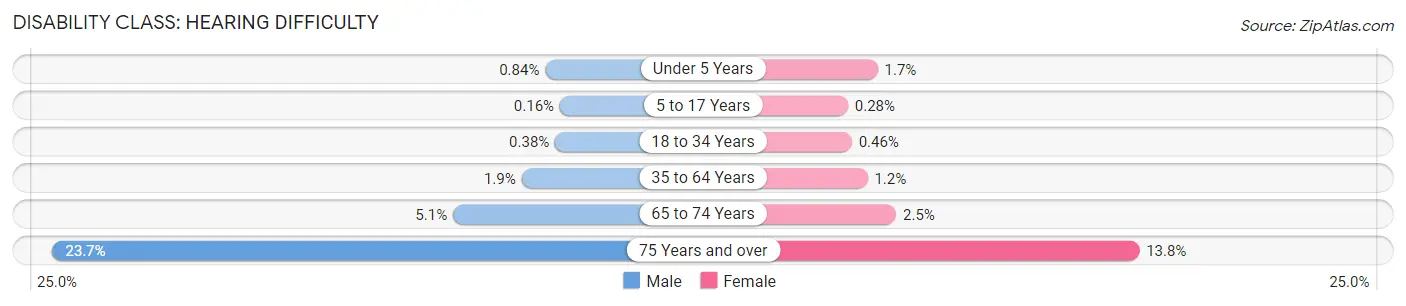
| Age Bracket | Male | Female |
| Under 5 Years | 21 (0.8%) | 38 (1.7%) |
| 5 to 17 Years | 8 (0.2%) | 14 (0.3%) |
| 18 to 34 Years | 118 (0.4%) | 138 (0.5%) |
| 35 to 64 Years | 305 (1.9%) | 187 (1.2%) |
| 65 to 74 Years | 195 (5.1%) | 110 (2.5%) |
| 75 Years and over | 627 (23.7%) | 518 (13.8%) |
Disability Class: Vision Difficulty
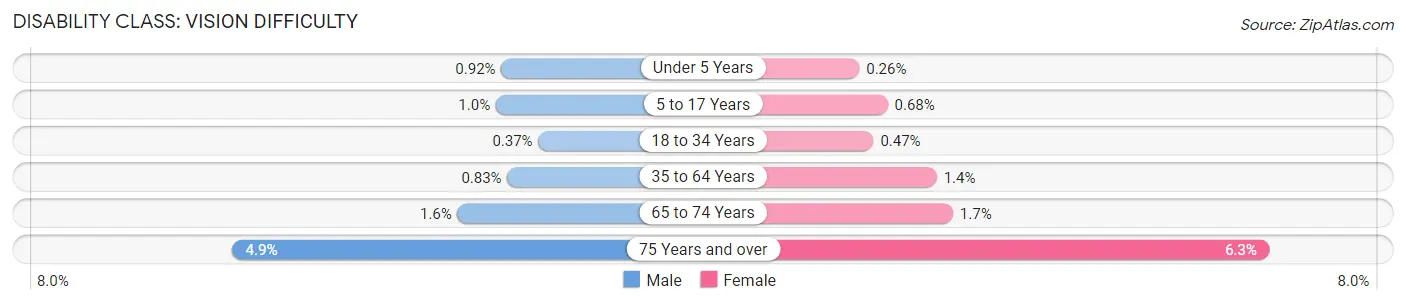
| Age Bracket | Male | Female |
| Under 5 Years | 23 (0.9%) | 6 (0.3%) |
| 5 to 17 Years | 51 (1.0%) | 34 (0.7%) |
| 18 to 34 Years | 112 (0.4%) | 142 (0.5%) |
| 35 to 64 Years | 131 (0.8%) | 221 (1.4%) |
| 65 to 74 Years | 60 (1.6%) | 72 (1.7%) |
| 75 Years and over | 130 (4.9%) | 238 (6.3%) |
Disability Class: Cognitive Difficulty
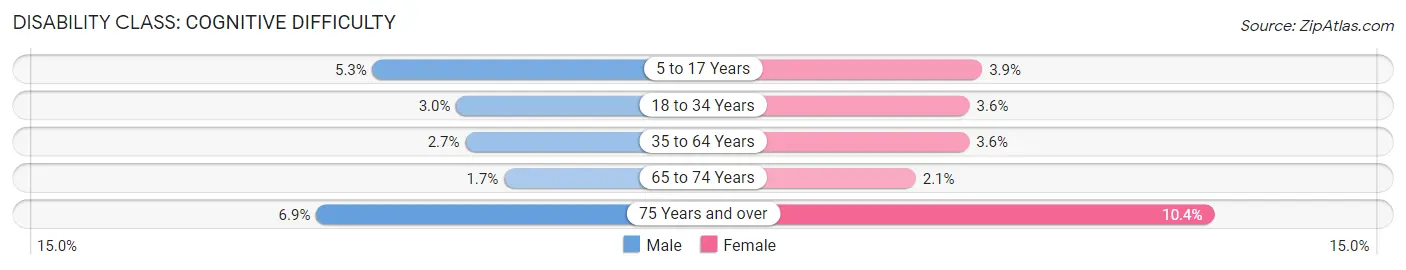
| Age Bracket | Male | Female |
| 5 to 17 Years | 272 (5.3%) | 197 (3.9%) |
| 18 to 34 Years | 914 (3.0%) | 1,069 (3.6%) |
| 35 to 64 Years | 428 (2.7%) | 557 (3.5%) |
| 65 to 74 Years | 63 (1.7%) | 90 (2.1%) |
| 75 Years and over | 182 (6.9%) | 389 (10.4%) |
Disability Class: Ambulatory Difficulty
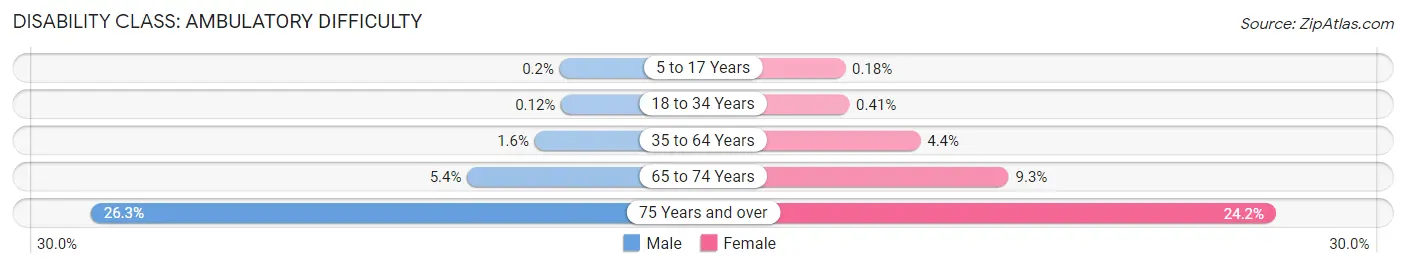
| Age Bracket | Male | Female |
| 5 to 17 Years | 10 (0.2%) | 9 (0.2%) |
| 18 to 34 Years | 38 (0.1%) | 123 (0.4%) |
| 35 to 64 Years | 249 (1.6%) | 686 (4.4%) |
| 65 to 74 Years | 204 (5.3%) | 406 (9.3%) |
| 75 Years and over | 696 (26.3%) | 907 (24.2%) |
Disability Class: Self-Care Difficulty
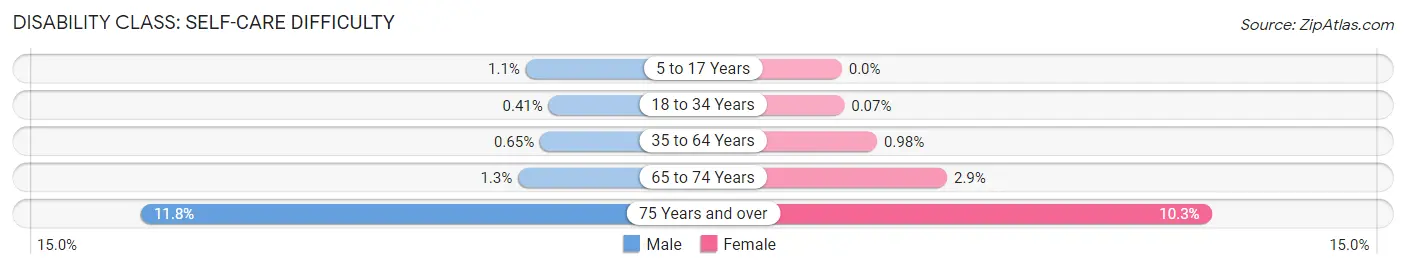
| Age Bracket | Male | Female |
| 5 to 17 Years | 54 (1.1%) | 0 (0.0%) |
| 18 to 34 Years | 125 (0.4%) | 20 (0.1%) |
| 35 to 64 Years | 102 (0.6%) | 154 (1.0%) |
| 65 to 74 Years | 48 (1.3%) | 128 (2.9%) |
| 75 Years and over | 311 (11.8%) | 386 (10.3%) |
Technology Access in Ann Arbor
Computing Device Access in Ann Arbor
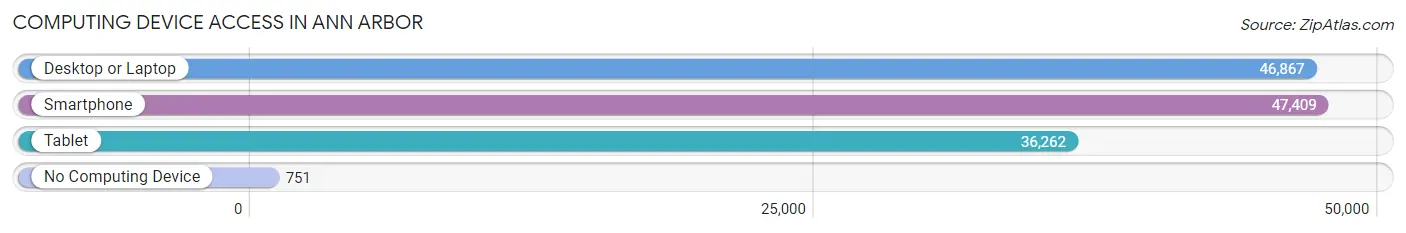
| Device Type | # Households | % Households |
| Desktop or Laptop | 46,867 | 93.5% |
| Smartphone | 47,409 | 94.6% |
| Tablet | 36,262 | 72.4% |
| No Computing Device | 751 | 1.5% |
| Total | 50,110 | 100.0% |
Internet Access in Ann Arbor
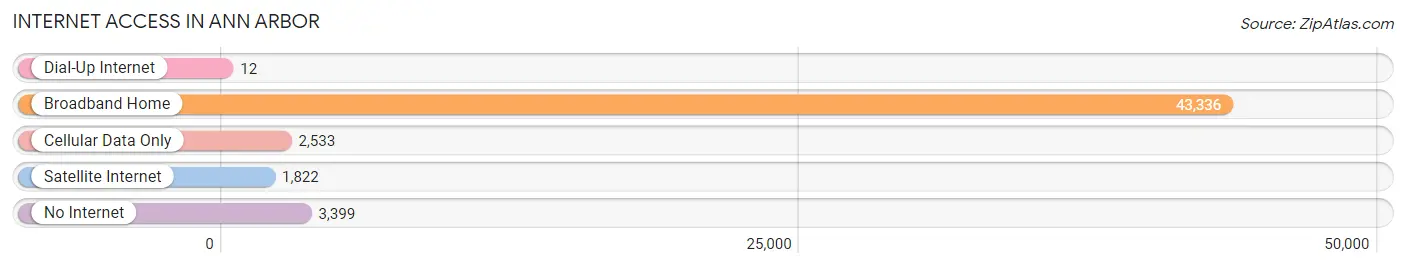
| Internet Type | # Households | % Households |
| Dial-Up Internet | 12 | 0.0% |
| Broadband Home | 43,336 | 86.5% |
| Cellular Data Only | 2,533 | 5.1% |
| Satellite Internet | 1,822 | 3.6% |
| No Internet | 3,399 | 6.8% |
| Total | 50,110 | 100.0% |
Ann Arbor Summary
Ann Arbor, Michigan is a city located in the southeastern corner of the state, in Washtenaw County. It is the county seat and the largest city in the county, with a population of 113,934 as of the 2010 census. Ann Arbor is home to the University of Michigan, one of the largest universities in the United States. The city is known for its vibrant cultural and intellectual life, and is home to a variety of museums, galleries, and theaters.
History
The area that is now Ann Arbor was first settled in 1824 by John Allen and Elisha Walker Rumsey. The two men purchased the land from the federal government and named it Annarbour, after their wives, both of whom were named Ann. The city was incorporated in 1833, and the name was changed to Ann Arbor.
In 1837, the University of Michigan was founded in Ann Arbor, making it the oldest university in the state. The university has grown to become one of the largest in the country, and is a major economic and cultural force in the city.
Geography
Ann Arbor is located in southeastern Michigan, in Washtenaw County. It is situated on the Huron River, about 35 miles west of Detroit. The city covers an area of 28.7 square miles, and has an elevation of 830 feet.
The city is divided into several distinct neighborhoods, including downtown, the Old West Side, the Old Fourth Ward, and the University of Michigan campus. Ann Arbor is surrounded by several smaller towns and villages, including Ypsilanti, Saline, and Dexter.
Economy
Ann Arbor is home to a diverse economy, with a variety of industries represented. The city is a major center for research and development, and is home to several large corporations, including Google, Toyota, and Pfizer. The University of Michigan is the largest employer in the city, with over 30,000 employees.
The city is also home to a thriving arts and culture scene, with numerous galleries, museums, and theaters. Ann Arbor is also home to a vibrant music scene, with several venues hosting live music.
Demographics
As of the 2010 census, Ann Arbor had a population of 113,934. The population is fairly diverse, with a mix of races and ethnicities. The largest racial group is White (77.2%), followed by African American (7.7%), Asian (7.2%), and Hispanic or Latino (4.3%).
The median household income in Ann Arbor is $54,717, and the median home value is $250,000. The city has a high rate of college graduates, with over 50% of the population having a bachelor's degree or higher.
Ann Arbor is a vibrant and diverse city, with a rich history and a thriving economy. It is home to a variety of industries, and is a major center for research and development. The city is also home to a vibrant arts and culture scene, and is a popular destination for tourists and students alike.
Common Questions
What is Per Capita Income in Ann Arbor?
Per Capita income in Ann Arbor is $52,276.
What is the Median Family Income in Ann Arbor?
Median Family Income in Ann Arbor is $134,056.
What is the Median Household income in Ann Arbor?
Median Household Income in Ann Arbor is $78,546.
What is Income or Wage Gap in Ann Arbor?
Income or Wage Gap in Ann Arbor is 37.7%.
Women in Ann Arbor earn 62.3 cents for every dollar earned by a man.
What is Family Income Deficit in Ann Arbor?
Family Income Deficit in Ann Arbor is $11,523.
Families that are below poverty line in Ann Arbor earn $11,523 less on average than the poverty threshold level.
What is Inequality or Gini Index in Ann Arbor?
Inequality or Gini Index in Ann Arbor is 0.53.
What is the Total Population of Ann Arbor?
Total Population of Ann Arbor is 122,216.
What is the Total Male Population of Ann Arbor?
Total Male Population of Ann Arbor is 60,724.
What is the Total Female Population of Ann Arbor?
Total Female Population of Ann Arbor is 61,492.
What is the Ratio of Males per 100 Females in Ann Arbor?
There are 98.75 Males per 100 Females in Ann Arbor.
What is the Ratio of Females per 100 Males in Ann Arbor?
There are 101.26 Females per 100 Males in Ann Arbor.
What is the Median Population Age in Ann Arbor?
Median Population Age in Ann Arbor is 27.4 Years.
What is the Average Family Size in Ann Arbor
Average Family Size in Ann Arbor is 2.8 People.
What is the Average Household Size in Ann Arbor
Average Household Size in Ann Arbor is 2.2 People.
How Large is the Labor Force in Ann Arbor?
There are 66,299 People in the Labor Forcein in Ann Arbor.
What is the Percentage of People in the Labor Force in Ann Arbor?
60.9% of People are in the Labor Force in Ann Arbor.
What is the Unemployment Rate in Ann Arbor?
Unemployment Rate in Ann Arbor is 3.7%.