Carlsbad, CA Map & Demographics
Carlsbad Map
Carlsbad Overview
$66,944
PER CAPITA INCOME
$161,322
AVG FAMILY INCOME
$134,139
AVG HOUSEHOLD INCOME
41.4%
WAGE / INCOME GAP [ % ]
58.6¢/ $1
WAGE / INCOME GAP [ $ ]
$11,000
FAMILY INCOME DEFICIT
0.45
INEQUALITY / GINI INDEX
114,745
TOTAL POPULATION
57,284
MALE POPULATION
57,461
FEMALE POPULATION
99.69
MALES / 100 FEMALES
100.31
FEMALES / 100 MALES
42.4
MEDIAN AGE
3.1
AVG FAMILY SIZE
2.6
AVG HOUSEHOLD SIZE
59,759
LABOR FORCE [ PEOPLE ]
65.2%
PERCENT IN LABOR FORCE
6.0%
UNEMPLOYMENT RATE
Income in Carlsbad
Income Overview in Carlsbad
Per Capita Income in Carlsbad is $66,944, while median incomes of families and households are $161,322 and $134,139 respectively.
| Characteristic | Number | Measure |
| Per Capita Income | 114,745 | $66,944 |
| Median Family Income | 30,989 | $161,322 |
| Mean Family Income | 30,989 | $197,416 |
| Median Household Income | 43,912 | $134,139 |
| Mean Household Income | 43,912 | $172,430 |
| Income Deficit | 30,989 | $11,000 |
| Wage / Income Gap (%) | 114,745 | 41.44% |
| Wage / Income Gap ($) | 114,745 | 58.56¢ per $1 |
| Gini / Inequality Index | 114,745 | 0.45 |
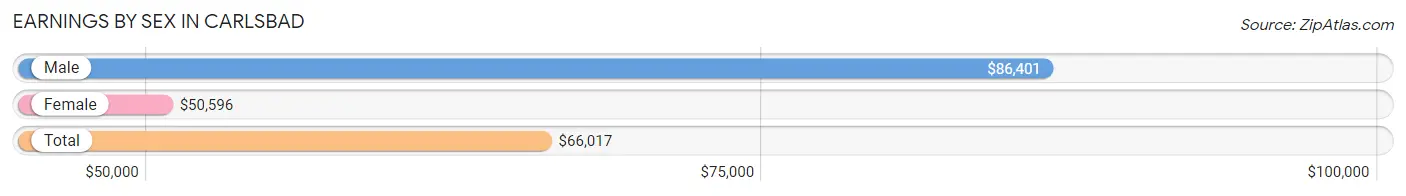
Earnings by Sex in Carlsbad
Average Earnings in Carlsbad are $66,017, $86,401 for men and $50,596 for women, a difference of 41.4%.
| Sex | Number | Average Earnings |
| Male | 33,293 (54.4%) | $86,401 |
| Female | 27,955 (45.6%) | $50,596 |
| Total | 61,248 (100.0%) | $66,017 |
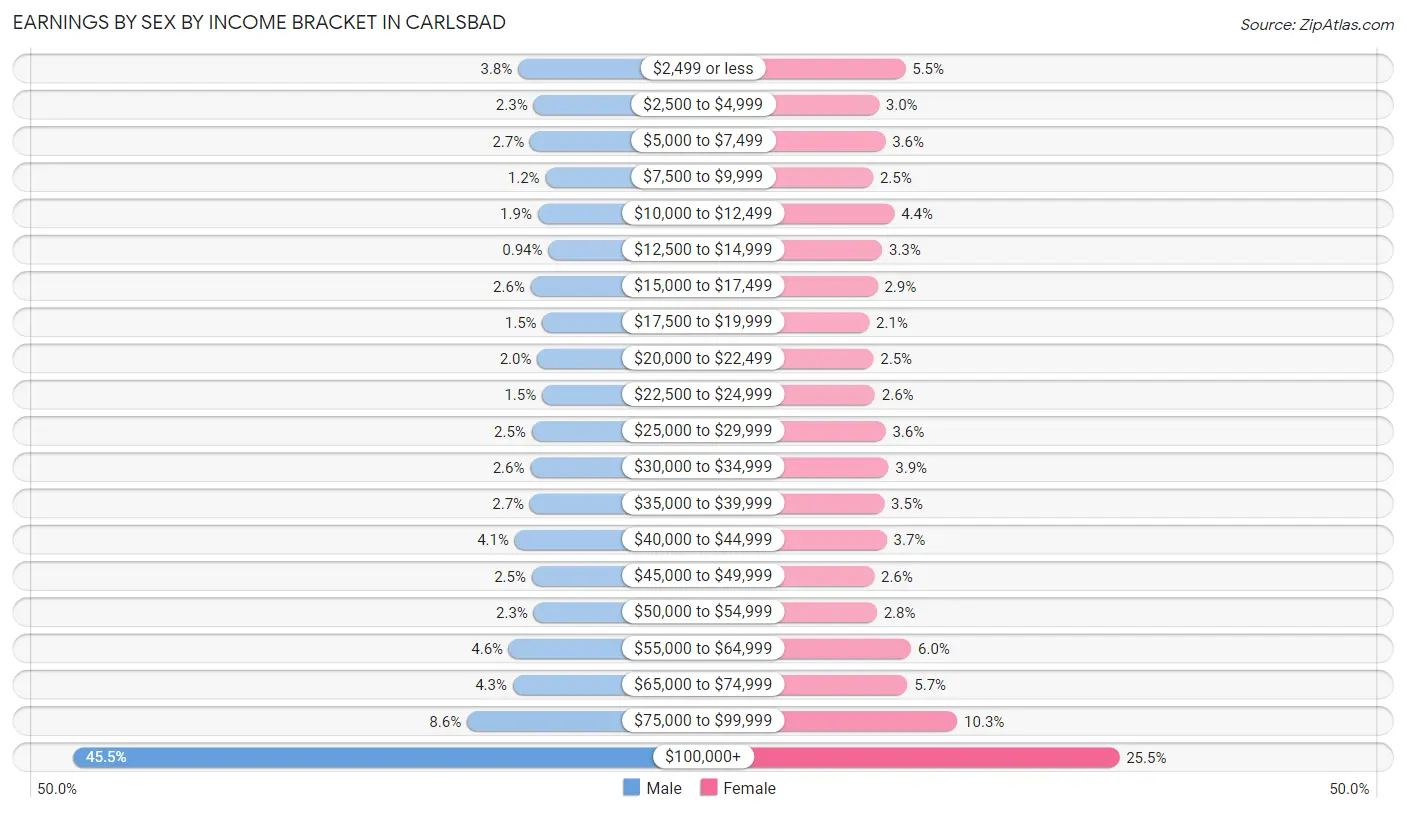
Earnings by Sex by Income Bracket in Carlsbad
The most common earnings brackets in Carlsbad are $100,000+ for men (15,132 | 45.5%) and $100,000+ for women (7,134 | 25.5%).
| Income | Male | Female |
| $2,499 or less | 1,255 (3.8%) | 1,532 (5.5%) |
| $2,500 to $4,999 | 775 (2.3%) | 840 (3.0%) |
| $5,000 to $7,499 | 882 (2.6%) | 1,007 (3.6%) |
| $7,500 to $9,999 | 402 (1.2%) | 685 (2.5%) |
| $10,000 to $12,499 | 644 (1.9%) | 1,240 (4.4%) |
| $12,500 to $14,999 | 313 (0.9%) | 923 (3.3%) |
| $15,000 to $17,499 | 862 (2.6%) | 802 (2.9%) |
| $17,500 to $19,999 | 497 (1.5%) | 585 (2.1%) |
| $20,000 to $22,499 | 657 (2.0%) | 695 (2.5%) |
| $22,500 to $24,999 | 510 (1.5%) | 735 (2.6%) |
| $25,000 to $29,999 | 831 (2.5%) | 1,013 (3.6%) |
| $30,000 to $34,999 | 876 (2.6%) | 1,088 (3.9%) |
| $35,000 to $39,999 | 887 (2.7%) | 979 (3.5%) |
| $40,000 to $44,999 | 1,360 (4.1%) | 1,042 (3.7%) |
| $45,000 to $49,999 | 829 (2.5%) | 714 (2.5%) |
| $50,000 to $54,999 | 769 (2.3%) | 783 (2.8%) |
| $55,000 to $64,999 | 1,540 (4.6%) | 1,682 (6.0%) |
| $65,000 to $74,999 | 1,422 (4.3%) | 1,585 (5.7%) |
| $75,000 to $99,999 | 2,850 (8.6%) | 2,891 (10.3%) |
| $100,000+ | 15,132 (45.5%) | 7,134 (25.5%) |
| Total | 33,293 (100.0%) | 27,955 (100.0%) |
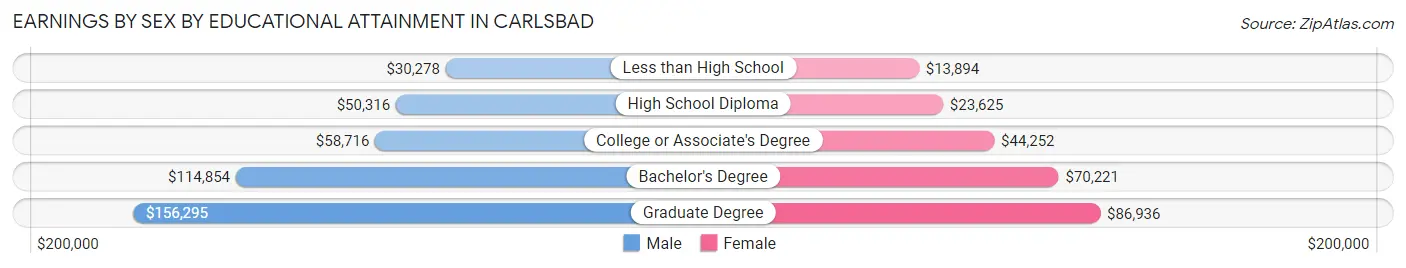
Earnings by Sex by Educational Attainment in Carlsbad
Average earnings in Carlsbad are $102,092 for men and $60,007 for women, a difference of 41.2%. Men with an educational attainment of graduate degree enjoy the highest average annual earnings of $156,295, while those with less than high school education earn the least with $30,278. Women with an educational attainment of graduate degree earn the most with the average annual earnings of $86,936, while those with less than high school education have the smallest earnings of $13,894.
| Educational Attainment | Male Income | Female Income |
| Less than High School | $30,278 | $13,894 |
| High School Diploma | $50,316 | $23,625 |
| College or Associate's Degree | $58,716 | $44,252 |
| Bachelor's Degree | $114,854 | $70,221 |
| Graduate Degree | $156,295 | $86,936 |
| Total | $102,092 | $60,007 |
Family Income in Carlsbad
Family Income Brackets in Carlsbad
According to the Carlsbad family income data, there are 11,869 families falling into the $200,000+ income range, which is the most common income bracket and makes up 38.3% of all families. Conversely, the $10,000 to $14,999 income bracket is the least frequent group with only 248 families (0.8%) belonging to this category.
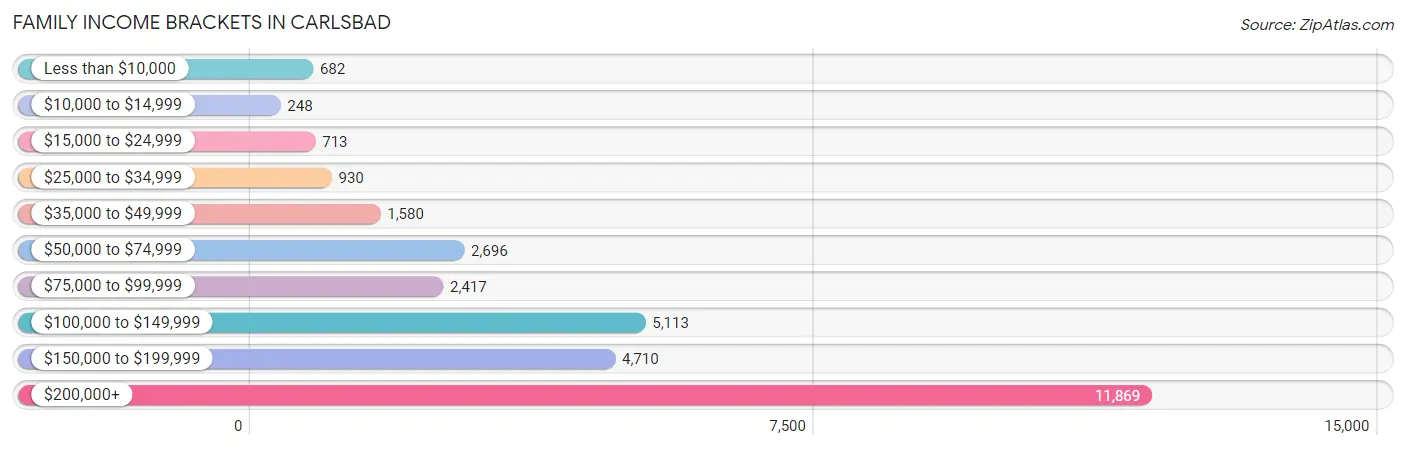
| Income Bracket | # Families | % Families |
| Less than $10,000 | 682 | 2.2% |
| $10,000 to $14,999 | 248 | 0.8% |
| $15,000 to $24,999 | 713 | 2.3% |
| $25,000 to $34,999 | 930 | 3.0% |
| $35,000 to $49,999 | 1,580 | 5.1% |
| $50,000 to $74,999 | 2,696 | 8.7% |
| $75,000 to $99,999 | 2,417 | 7.8% |
| $100,000 to $149,999 | 5,113 | 16.5% |
| $150,000 to $199,999 | 4,710 | 15.2% |
| $200,000+ | 11,869 | 38.3% |
Family Income by Famaliy Size in Carlsbad
6-person families (462 | 1.5%) account for the highest median family income in Carlsbad with $250,001 per family, while 2-person families (14,700 | 47.4%) have the highest median income of $69,724 per family member.
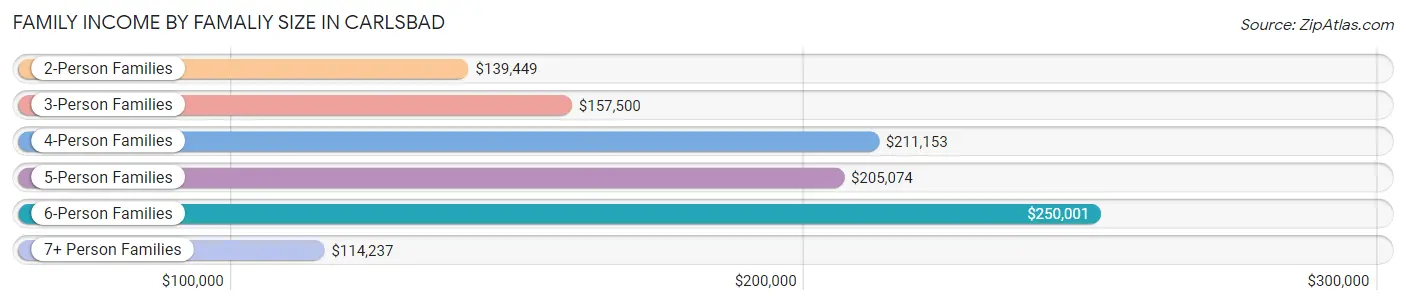
| Income Bracket | # Families | Median Income |
| 2-Person Families | 14,700 (47.4%) | $139,449 |
| 3-Person Families | 6,454 (20.8%) | $157,500 |
| 4-Person Families | 6,539 (21.1%) | $211,153 |
| 5-Person Families | 2,752 (8.9%) | $205,074 |
| 6-Person Families | 462 (1.5%) | $250,001 |
| 7+ Person Families | 82 (0.3%) | $114,237 |
| Total | 30,989 (100.0%) | $161,322 |
Family Income by Number of Earners in Carlsbad
The median family income in Carlsbad is $161,322, with families comprising 3+ earners (2,869) having the highest median family income of $200,264, while families with no earners (4,802) have the lowest median family income of $90,882, accounting for 9.3% and 15.5% of families, respectively.
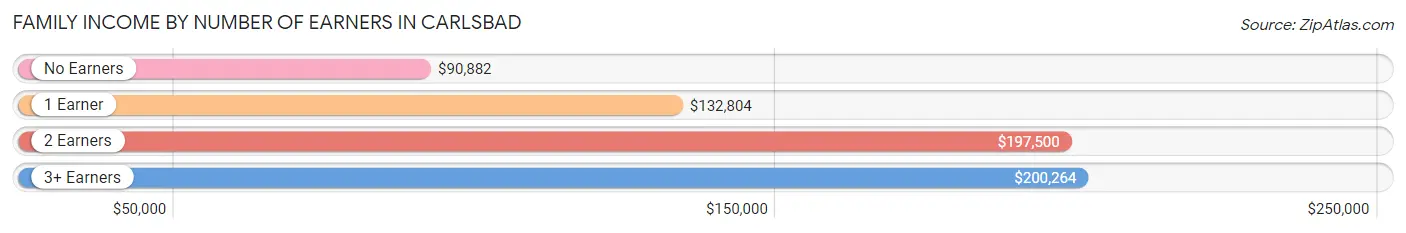
| Number of Earners | # Families | Median Income |
| No Earners | 4,802 (15.5%) | $90,882 |
| 1 Earner | 8,794 (28.4%) | $132,804 |
| 2 Earners | 14,524 (46.9%) | $197,500 |
| 3+ Earners | 2,869 (9.3%) | $200,264 |
| Total | 30,989 (100.0%) | $161,322 |
Household Income in Carlsbad
Household Income Brackets in Carlsbad
With 13,437 households falling in the category, the $200,000+ income range is the most frequent in Carlsbad, accounting for 30.6% of all households. In contrast, only 878 households (2.0%) fall into the $10,000 to $14,999 income bracket, making it the least populous group.
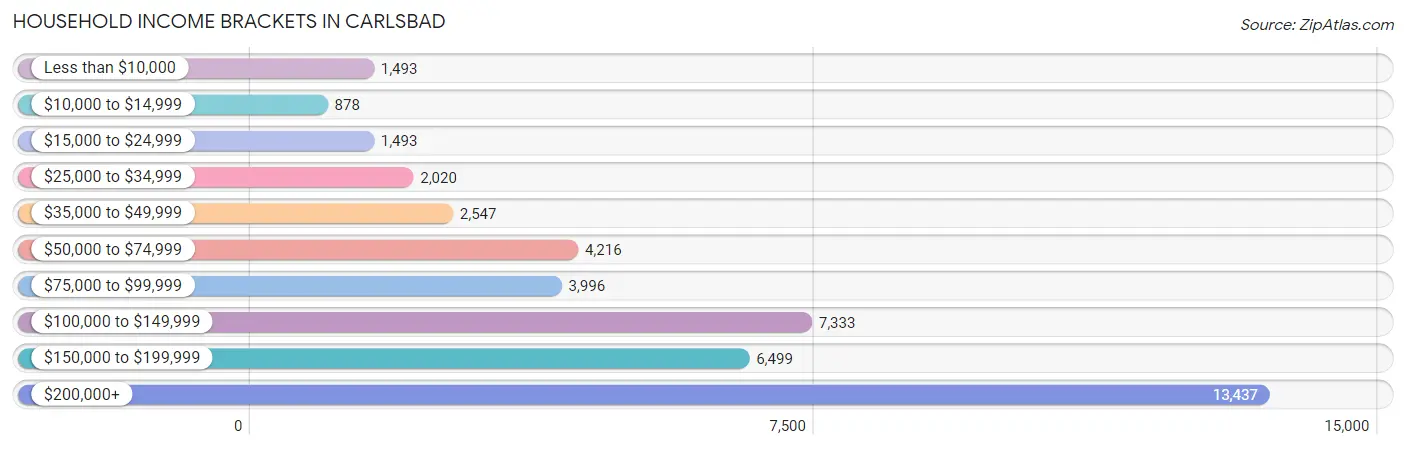
| Income Bracket | # Households | % Households |
| Less than $10,000 | 1,493 | 3.4% |
| $10,000 to $14,999 | 878 | 2.0% |
| $15,000 to $24,999 | 1,493 | 3.4% |
| $25,000 to $34,999 | 2,020 | 4.6% |
| $35,000 to $49,999 | 2,547 | 5.8% |
| $50,000 to $74,999 | 4,216 | 9.6% |
| $75,000 to $99,999 | 3,996 | 9.1% |
| $100,000 to $149,999 | 7,333 | 16.7% |
| $150,000 to $199,999 | 6,499 | 14.8% |
| $200,000+ | 13,437 | 30.6% |
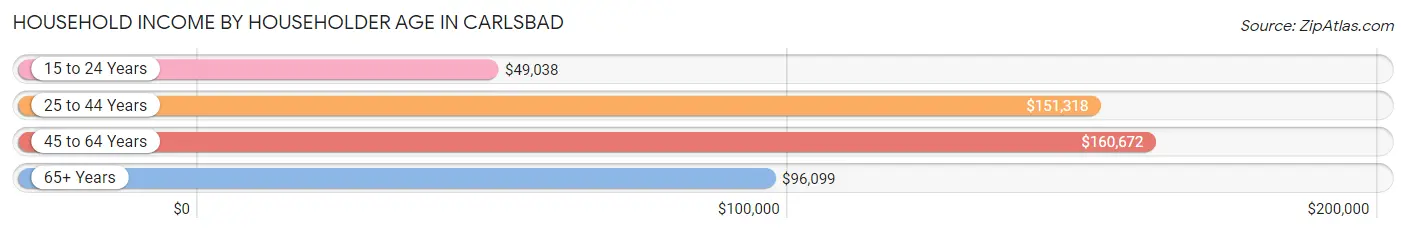
Household Income by Householder Age in Carlsbad
The median household income in Carlsbad is $134,139, with the highest median household income of $160,672 found in the 45 to 64 years age bracket for the primary householder. A total of 17,822 households (40.6%) fall into this category. Meanwhile, the 15 to 24 years age bracket for the primary householder has the lowest median household income of $49,038, with 632 households (1.4%) in this group.
| Income Bracket | # Households | Median Income |
| 15 to 24 Years | 632 (1.4%) | $49,038 |
| 25 to 44 Years | 13,188 (30.0%) | $151,318 |
| 45 to 64 Years | 17,822 (40.6%) | $160,672 |
| 65+ Years | 12,270 (27.9%) | $96,099 |
| Total | 43,912 (100.0%) | $134,139 |
Poverty in Carlsbad
Income Below Poverty by Sex and Age in Carlsbad
With 5.9% poverty level for males and 7.9% for females among the residents of Carlsbad, 18 to 24 year old males and 15 year old females are the most vulnerable to poverty, with 495 males (12.5%) and 166 females (13.6%) in their respective age groups living below the poverty level.
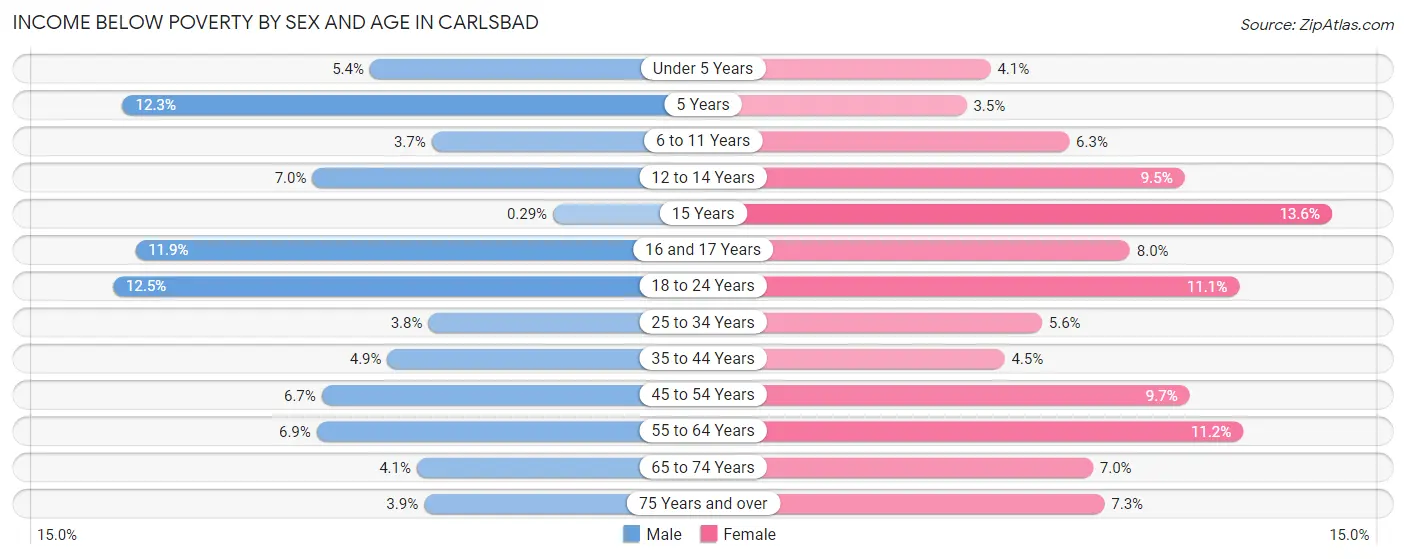
| Age Bracket | Male | Female |
| Under 5 Years | 130 (5.4%) | 93 (4.1%) |
| 5 Years | 100 (12.3%) | 23 (3.5%) |
| 6 to 11 Years | 172 (3.7%) | 299 (6.3%) |
| 12 to 14 Years | 193 (7.0%) | 194 (9.5%) |
| 15 Years | 4 (0.3%) | 166 (13.6%) |
| 16 and 17 Years | 198 (11.9%) | 109 (8.0%) |
| 18 to 24 Years | 495 (12.5%) | 386 (11.1%) |
| 25 to 34 Years | 248 (3.8%) | 328 (5.6%) |
| 35 to 44 Years | 399 (4.9%) | 340 (4.5%) |
| 45 to 54 Years | 540 (6.7%) | 830 (9.7%) |
| 55 to 64 Years | 495 (6.9%) | 974 (11.2%) |
| 65 to 74 Years | 219 (4.1%) | 387 (7.0%) |
| 75 Years and over | 157 (3.9%) | 379 (7.3%) |
| Total | 3,350 (5.9%) | 4,508 (7.9%) |
Income Above Poverty by Sex and Age in Carlsbad
According to the poverty statistics in Carlsbad, males aged 15 years and females aged 5 years are the age groups that are most secure financially, with 99.7% of males and 96.5% of females in these age groups living above the poverty line.
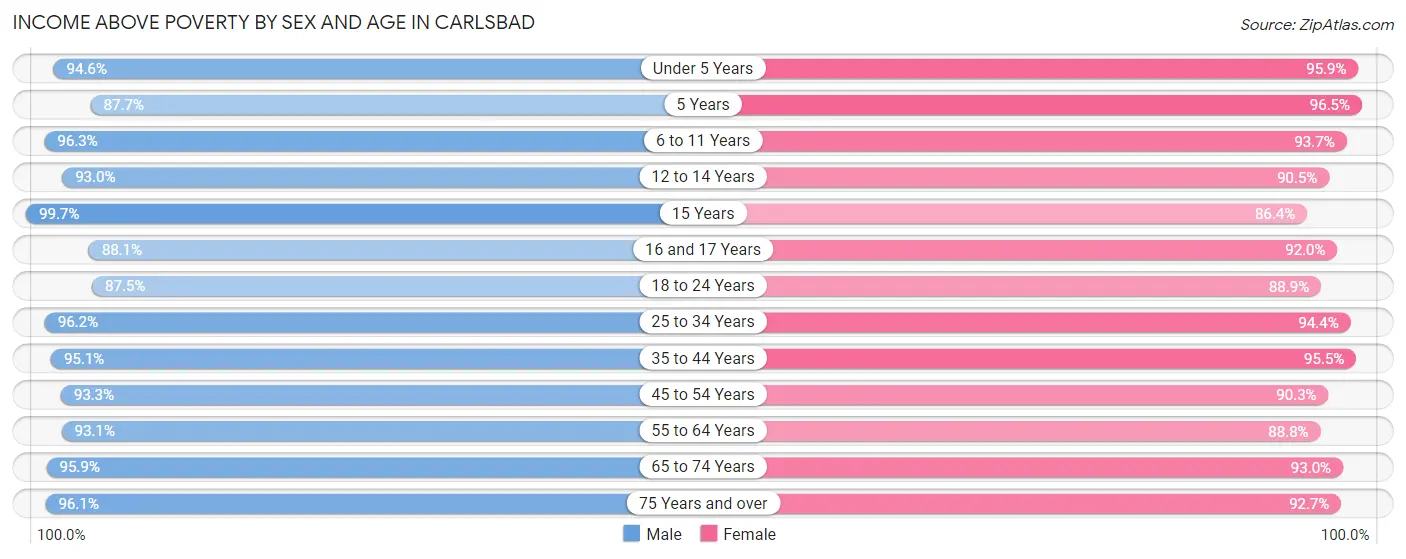
| Age Bracket | Male | Female |
| Under 5 Years | 2,281 (94.6%) | 2,155 (95.9%) |
| 5 Years | 715 (87.7%) | 639 (96.5%) |
| 6 to 11 Years | 4,516 (96.3%) | 4,428 (93.7%) |
| 12 to 14 Years | 2,567 (93.0%) | 1,840 (90.5%) |
| 15 Years | 1,372 (99.7%) | 1,051 (86.4%) |
| 16 and 17 Years | 1,463 (88.1%) | 1,250 (92.0%) |
| 18 to 24 Years | 3,451 (87.5%) | 3,103 (88.9%) |
| 25 to 34 Years | 6,354 (96.2%) | 5,560 (94.4%) |
| 35 to 44 Years | 7,751 (95.1%) | 7,172 (95.5%) |
| 45 to 54 Years | 7,484 (93.3%) | 7,741 (90.3%) |
| 55 to 64 Years | 6,712 (93.1%) | 7,742 (88.8%) |
| 65 to 74 Years | 5,147 (95.9%) | 5,152 (93.0%) |
| 75 Years and over | 3,893 (96.1%) | 4,807 (92.7%) |
| Total | 53,706 (94.1%) | 52,640 (92.1%) |
Income Below Poverty Among Married-Couple Families in Carlsbad
The poverty statistics for married-couple families in Carlsbad show that 2.0% or 510 of the total 25,625 families live below the poverty line. Families with 1 or 2 children have the highest poverty rate of 2.9%, comprising of 263 families. On the other hand, families with 3 or 4 children have the lowest poverty rate of 1.1%, which includes 21 families.
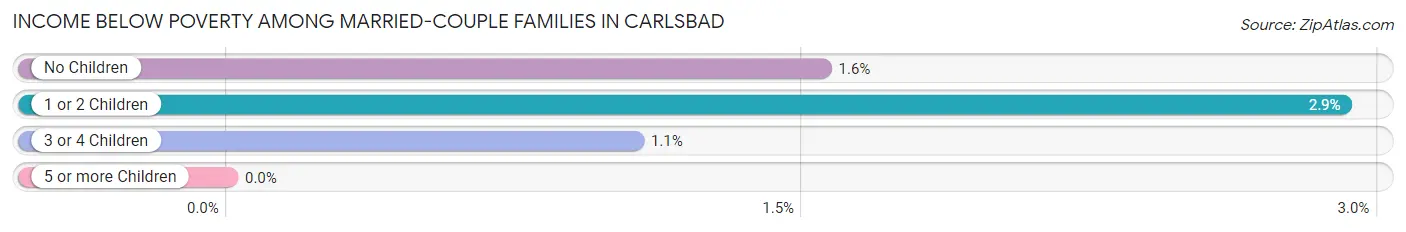
| Children | Above Poverty | Below Poverty |
| No Children | 14,371 (98.5%) | 226 (1.5%) |
| 1 or 2 Children | 8,782 (97.1%) | 263 (2.9%) |
| 3 or 4 Children | 1,962 (98.9%) | 21 (1.1%) |
| 5 or more Children | 0 (0.0%) | 0 (0.0%) |
| Total | 25,115 (98.0%) | 510 (2.0%) |
Income Below Poverty Among Single-Parent Households in Carlsbad
According to the poverty data in Carlsbad, 19.2% or 268 single-father households and 18.3% or 728 single-mother households are living below the poverty line. Among single-father households, those with no children have the highest poverty rate, with 255 households (31.9%) experiencing poverty. Likewise, among single-mother households, those with 3 or 4 children have the highest poverty rate, with 121 households (34.0%) falling below the poverty line.
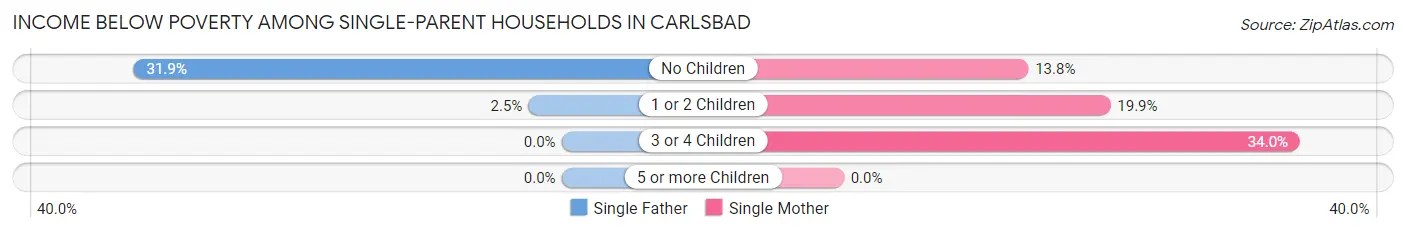
| Children | Single Father | Single Mother |
| No Children | 255 (31.9%) | 248 (13.8%) |
| 1 or 2 Children | 13 (2.5%) | 359 (19.9%) |
| 3 or 4 Children | 0 (0.0%) | 121 (34.0%) |
| 5 or more Children | 0 (0.0%) | 0 (0.0%) |
| Total | 268 (19.2%) | 728 (18.3%) |
Income Below Poverty Among Married-Couple vs Single-Parent Households in Carlsbad
The poverty data for Carlsbad shows that 510 of the married-couple family households (2.0%) and 996 of the single-parent households (18.6%) are living below the poverty level. Within the married-couple family households, those with 1 or 2 children have the highest poverty rate, with 263 households (2.9%) falling below the poverty line. Among the single-parent households, those with 3 or 4 children have the highest poverty rate, with 121 household (28.2%) living below poverty.
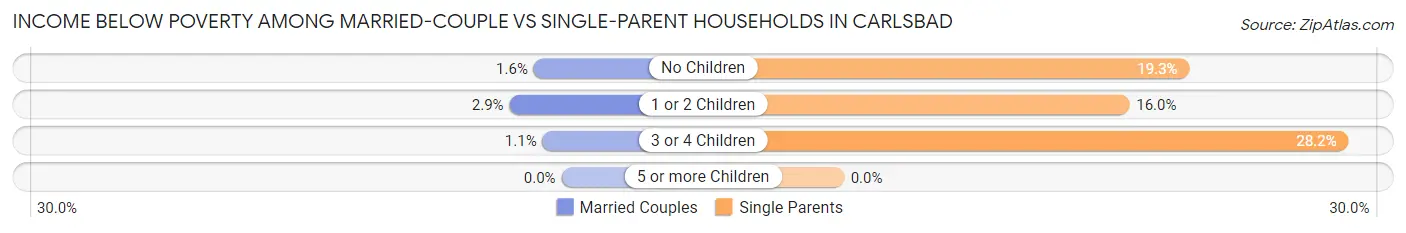
| Children | Married-Couple Families | Single-Parent Households |
| No Children | 226 (1.5%) | 503 (19.3%) |
| 1 or 2 Children | 263 (2.9%) | 372 (16.0%) |
| 3 or 4 Children | 21 (1.1%) | 121 (28.2%) |
| 5 or more Children | 0 (0.0%) | 0 (0.0%) |
| Total | 510 (2.0%) | 996 (18.6%) |
Race in Carlsbad
The most populous races in Carlsbad are White / Caucasian (85,150 | 74.2%), Hispanic or Latino (19,053 | 16.6%), and Two or more Races (12,616 | 11.0%).
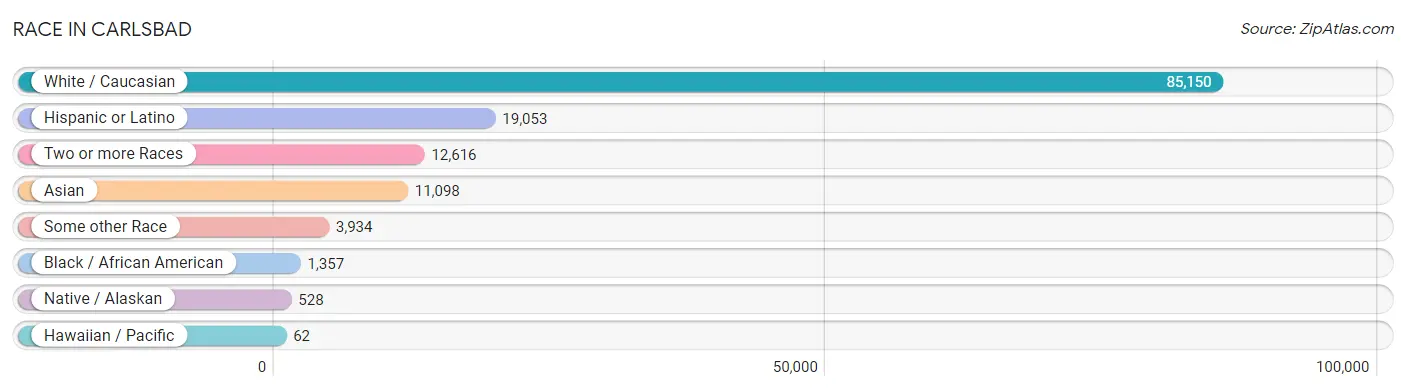
| Race | # Population | % Population |
| Asian | 11,098 | 9.7% |
| Black / African American | 1,357 | 1.2% |
| Hawaiian / Pacific | 62 | 0.1% |
| Hispanic or Latino | 19,053 | 16.6% |
| Native / Alaskan | 528 | 0.5% |
| White / Caucasian | 85,150 | 74.2% |
| Two or more Races | 12,616 | 11.0% |
| Some other Race | 3,934 | 3.4% |
| Total | 114,745 | 100.0% |
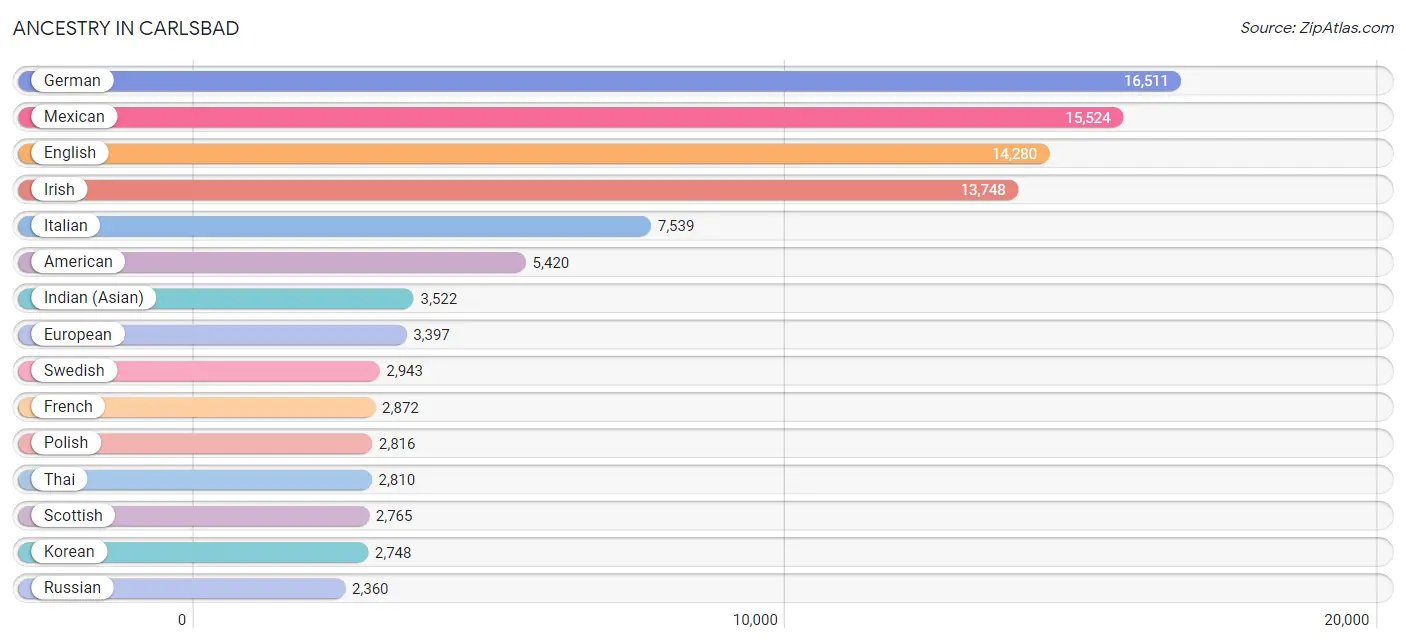
Ancestry in Carlsbad
The most populous ancestries reported in Carlsbad are German (16,511 | 14.4%), Mexican (15,524 | 13.5%), English (14,280 | 12.4%), Irish (13,748 | 12.0%), and Italian (7,539 | 6.6%), together accounting for 58.9% of all Carlsbad residents.
| Ancestry | # Population | % Population |
| Afghan | 371 | 0.3% |
| African | 73 | 0.1% |
| Albanian | 14 | 0.0% |
| Aleut | 11 | 0.0% |
| Alsatian | 14 | 0.0% |
| American | 5,420 | 4.7% |
| Apache | 42 | 0.0% |
| Arab | 787 | 0.7% |
| Argentinean | 41 | 0.0% |
| Armenian | 538 | 0.5% |
| Assyrian / Chaldean / Syriac | 48 | 0.0% |
| Australian | 91 | 0.1% |
| Austrian | 343 | 0.3% |
| Bangladeshi | 8 | 0.0% |
| Basque | 32 | 0.0% |
| Belgian | 309 | 0.3% |
| Bhutanese | 2,119 | 1.8% |
| Blackfeet | 50 | 0.0% |
| Brazilian | 93 | 0.1% |
| British | 1,542 | 1.3% |
| Bulgarian | 188 | 0.2% |
| Burmese | 1,225 | 1.1% |
| Cajun | 21 | 0.0% |
| Canadian | 245 | 0.2% |
| Celtic | 44 | 0.0% |
| Central American | 493 | 0.4% |
| Central American Indian | 37 | 0.0% |
| Cherokee | 299 | 0.3% |
| Chilean | 162 | 0.1% |
| Choctaw | 16 | 0.0% |
| Colombian | 270 | 0.2% |
| Croatian | 263 | 0.2% |
| Crow | 45 | 0.0% |
| Cuban | 214 | 0.2% |
| Cypriot | 10 | 0.0% |
| Czech | 409 | 0.4% |
| Czechoslovakian | 251 | 0.2% |
| Danish | 1,567 | 1.4% |
| Dominican | 69 | 0.1% |
| Dutch | 1,268 | 1.1% |
| Eastern European | 799 | 0.7% |
| Ecuadorian | 90 | 0.1% |
| Egyptian | 143 | 0.1% |
| English | 14,280 | 12.4% |
| European | 3,397 | 3.0% |
| Filipino | 330 | 0.3% |
| Finnish | 402 | 0.4% |
| French | 2,872 | 2.5% |
| French Canadian | 495 | 0.4% |
| German | 16,511 | 14.4% |
| Greek | 879 | 0.8% |
| Guamanian / Chamorro | 138 | 0.1% |
| Guatemalan | 23 | 0.0% |
| Haitian | 33 | 0.0% |
| Honduran | 55 | 0.1% |
| Hungarian | 912 | 0.8% |
| Icelander | 18 | 0.0% |
| Indian (Asian) | 3,522 | 3.1% |
| Indonesian | 81 | 0.1% |
| Iranian | 802 | 0.7% |
| Iraqi | 13 | 0.0% |
| Irish | 13,748 | 12.0% |
| Iroquois | 17 | 0.0% |
| Israeli | 30 | 0.0% |
| Italian | 7,539 | 6.6% |
| Jamaican | 85 | 0.1% |
| Japanese | 36 | 0.0% |
| Korean | 2,748 | 2.4% |
| Laotian | 185 | 0.2% |
| Latvian | 111 | 0.1% |
| Lebanese | 393 | 0.3% |
| Lithuanian | 794 | 0.7% |
| Luxembourger | 35 | 0.0% |
| Macedonian | 34 | 0.0% |
| Malaysian | 82 | 0.1% |
| Maltese | 43 | 0.0% |
| Mexican | 15,524 | 13.5% |
| Mexican American Indian | 225 | 0.2% |
| Moroccan | 58 | 0.1% |
| Native Hawaiian | 475 | 0.4% |
| Navajo | 6 | 0.0% |
| New Zealander | 65 | 0.1% |
| Nicaraguan | 17 | 0.0% |
| Nigerian | 267 | 0.2% |
| Northern European | 293 | 0.3% |
| Norwegian | 1,958 | 1.7% |
| Okinawan | 120 | 0.1% |
| Osage | 22 | 0.0% |
| Pakistani | 113 | 0.1% |
| Palestinian | 9 | 0.0% |
| Panamanian | 40 | 0.0% |
| Paraguayan | 23 | 0.0% |
| Pennsylvania German | 57 | 0.1% |
| Peruvian | 698 | 0.6% |
| Polish | 2,816 | 2.5% |
| Portuguese | 455 | 0.4% |
| Potawatomi | 13 | 0.0% |
| Puerto Rican | 407 | 0.4% |
| Romanian | 293 | 0.3% |
| Russian | 2,360 | 2.1% |
| Salvadoran | 298 | 0.3% |
| Samoan | 66 | 0.1% |
| Scandinavian | 590 | 0.5% |
| Scotch-Irish | 954 | 0.8% |
| Scottish | 2,765 | 2.4% |
| Serbian | 156 | 0.1% |
| Shoshone | 19 | 0.0% |
| Sioux | 112 | 0.1% |
| Slavic | 38 | 0.0% |
| Slovak | 98 | 0.1% |
| Slovene | 56 | 0.1% |
| South African | 225 | 0.2% |
| South American | 1,377 | 1.2% |
| Spaniard | 269 | 0.2% |
| Spanish | 334 | 0.3% |
| Sri Lankan | 1,511 | 1.3% |
| Subsaharan African | 582 | 0.5% |
| Swedish | 2,943 | 2.6% |
| Swiss | 517 | 0.4% |
| Syrian | 77 | 0.1% |
| Thai | 2,810 | 2.5% |
| Turkish | 211 | 0.2% |
| Ukrainian | 966 | 0.8% |
| Venezuelan | 93 | 0.1% |
| Welsh | 799 | 0.7% |
| Yugoslavian | 179 | 0.2% | View All 126 Rows |
Immigrants in Carlsbad
The most numerous immigrant groups reported in Carlsbad came from Asia (6,764 | 5.9%), Latin America (5,443 | 4.7%), Central America (4,591 | 4.0%), Mexico (4,394 | 3.8%), and Europe (4,235 | 3.7%), together accounting for 22.2% of all Carlsbad residents.
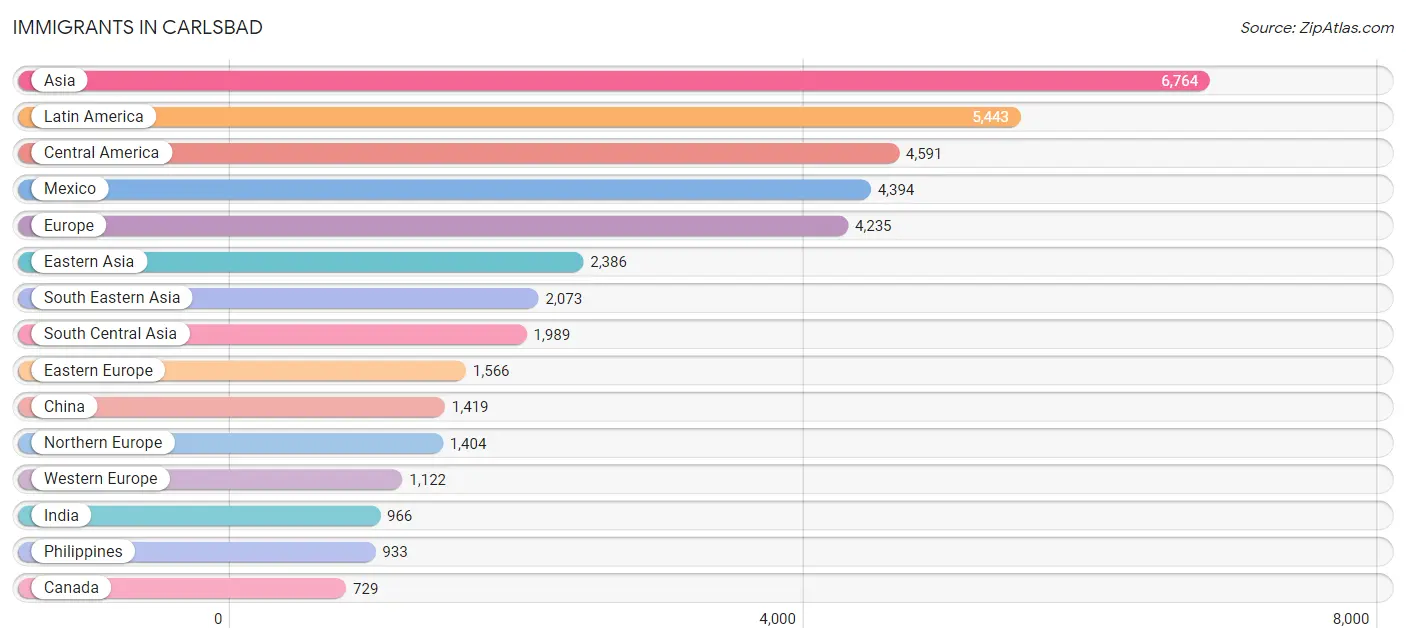
| Immigration Origin | # Population | % Population |
| Afghanistan | 428 | 0.4% |
| Africa | 493 | 0.4% |
| Argentina | 24 | 0.0% |
| Armenia | 13 | 0.0% |
| Asia | 6,764 | 5.9% |
| Australia | 55 | 0.1% |
| Austria | 5 | 0.0% |
| Belarus | 236 | 0.2% |
| Belgium | 55 | 0.1% |
| Brazil | 57 | 0.1% |
| Bulgaria | 101 | 0.1% |
| Cambodia | 52 | 0.1% |
| Canada | 729 | 0.6% |
| Caribbean | 157 | 0.1% |
| Central America | 4,591 | 4.0% |
| Chile | 33 | 0.0% |
| China | 1,419 | 1.2% |
| Colombia | 126 | 0.1% |
| Cuba | 73 | 0.1% |
| Czechoslovakia | 25 | 0.0% |
| Denmark | 299 | 0.3% |
| Dominican Republic | 21 | 0.0% |
| Eastern Africa | 70 | 0.1% |
| Eastern Asia | 2,386 | 2.1% |
| Eastern Europe | 1,566 | 1.4% |
| Ecuador | 42 | 0.0% |
| Egypt | 92 | 0.1% |
| El Salvador | 81 | 0.1% |
| England | 442 | 0.4% |
| Europe | 4,235 | 3.7% |
| France | 267 | 0.2% |
| Germany | 659 | 0.6% |
| Greece | 33 | 0.0% |
| Guatemala | 29 | 0.0% |
| Guyana | 96 | 0.1% |
| Honduras | 42 | 0.0% |
| Hong Kong | 80 | 0.1% |
| Hungary | 87 | 0.1% |
| India | 966 | 0.8% |
| Indonesia | 168 | 0.2% |
| Iran | 510 | 0.4% |
| Iraq | 13 | 0.0% |
| Ireland | 8 | 0.0% |
| Israel | 66 | 0.1% |
| Italy | 62 | 0.1% |
| Jamaica | 28 | 0.0% |
| Japan | 277 | 0.2% |
| Kazakhstan | 42 | 0.0% |
| Kenya | 20 | 0.0% |
| Korea | 690 | 0.6% |
| Laos | 90 | 0.1% |
| Latin America | 5,443 | 4.7% |
| Latvia | 63 | 0.1% |
| Lebanon | 89 | 0.1% |
| Lithuania | 133 | 0.1% |
| Malaysia | 71 | 0.1% |
| Mexico | 4,394 | 3.8% |
| Middle Africa | 11 | 0.0% |
| Morocco | 38 | 0.0% |
| Nepal | 24 | 0.0% |
| Netherlands | 98 | 0.1% |
| Northern Africa | 149 | 0.1% |
| Northern Europe | 1,404 | 1.2% |
| Norway | 20 | 0.0% |
| Oceania | 134 | 0.1% |
| Panama | 20 | 0.0% |
| Peru | 259 | 0.2% |
| Philippines | 933 | 0.8% |
| Poland | 62 | 0.1% |
| Portugal | 15 | 0.0% |
| Romania | 134 | 0.1% |
| Russia | 186 | 0.2% |
| Saudi Arabia | 1 | 0.0% |
| Scotland | 73 | 0.1% |
| Serbia | 36 | 0.0% |
| Singapore | 162 | 0.1% |
| South Africa | 263 | 0.2% |
| South America | 695 | 0.6% |
| South Central Asia | 1,989 | 1.7% |
| South Eastern Asia | 2,073 | 1.8% |
| Southern Europe | 143 | 0.1% |
| Spain | 21 | 0.0% |
| Sudan | 19 | 0.0% |
| Sweden | 252 | 0.2% |
| Switzerland | 38 | 0.0% |
| Syria | 41 | 0.0% |
| Taiwan | 469 | 0.4% |
| Thailand | 51 | 0.0% |
| Trinidad and Tobago | 35 | 0.0% |
| Turkey | 73 | 0.1% |
| Uganda | 14 | 0.0% |
| Ukraine | 212 | 0.2% |
| Uzbekistan | 19 | 0.0% |
| Venezuela | 35 | 0.0% |
| Vietnam | 478 | 0.4% |
| Western Asia | 316 | 0.3% |
| Western Europe | 1,122 | 1.0% |
| Zaire | 11 | 0.0% | View All 98 Rows |
Sex and Age in Carlsbad
Sex and Age in Carlsbad
The most populous age groups in Carlsbad are 10 to 14 Years (4,730 | 8.3%) for men and 55 to 59 Years (5,025 | 8.7%) for women.
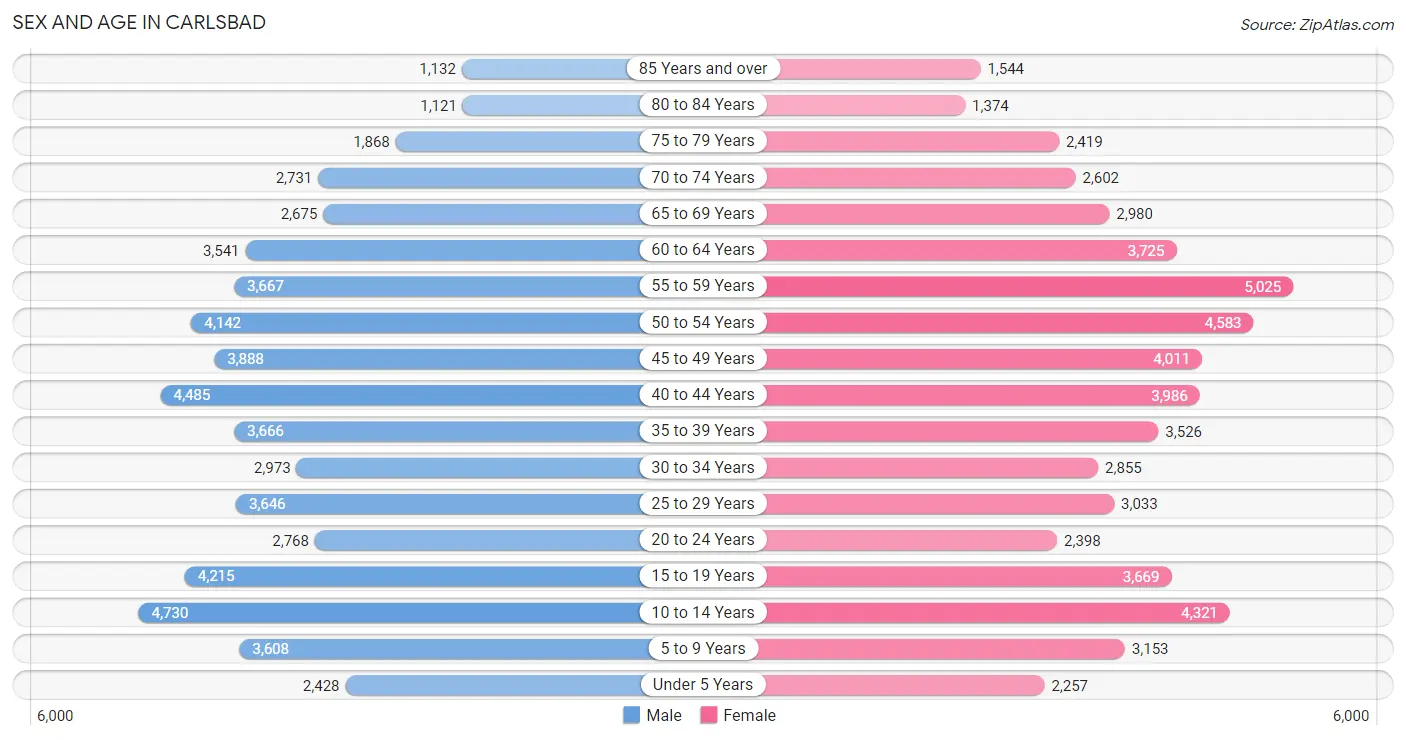
| Age Bracket | Male | Female |
| Under 5 Years | 2,428 (4.2%) | 2,257 (3.9%) |
| 5 to 9 Years | 3,608 (6.3%) | 3,153 (5.5%) |
| 10 to 14 Years | 4,730 (8.3%) | 4,321 (7.5%) |
| 15 to 19 Years | 4,215 (7.4%) | 3,669 (6.4%) |
| 20 to 24 Years | 2,768 (4.8%) | 2,398 (4.2%) |
| 25 to 29 Years | 3,646 (6.4%) | 3,033 (5.3%) |
| 30 to 34 Years | 2,973 (5.2%) | 2,855 (5.0%) |
| 35 to 39 Years | 3,666 (6.4%) | 3,526 (6.1%) |
| 40 to 44 Years | 4,485 (7.8%) | 3,986 (6.9%) |
| 45 to 49 Years | 3,888 (6.8%) | 4,011 (7.0%) |
| 50 to 54 Years | 4,142 (7.2%) | 4,583 (8.0%) |
| 55 to 59 Years | 3,667 (6.4%) | 5,025 (8.7%) |
| 60 to 64 Years | 3,541 (6.2%) | 3,725 (6.5%) |
| 65 to 69 Years | 2,675 (4.7%) | 2,980 (5.2%) |
| 70 to 74 Years | 2,731 (4.8%) | 2,602 (4.5%) |
| 75 to 79 Years | 1,868 (3.3%) | 2,419 (4.2%) |
| 80 to 84 Years | 1,121 (2.0%) | 1,374 (2.4%) |
| 85 Years and over | 1,132 (2.0%) | 1,544 (2.7%) |
| Total | 57,284 (100.0%) | 57,461 (100.0%) |
Families and Households in Carlsbad
Median Family Size in Carlsbad
The median family size in Carlsbad is 3.08 persons per family, with married-couple families (25,625 | 82.7%) accounting for the largest median family size of 3.11 persons per family. On the other hand, single male/father families (1,397 | 4.5%) represent the smallest median family size with 2.78 persons per family.
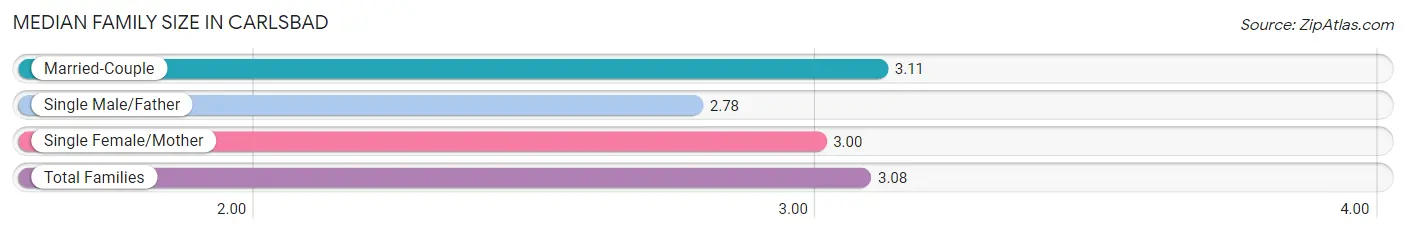
| Family Type | # Families | Family Size |
| Married-Couple | 25,625 (82.7%) | 3.11 |
| Single Male/Father | 1,397 (4.5%) | 2.78 |
| Single Female/Mother | 3,967 (12.8%) | 3.00 |
| Total Families | 30,989 (100.0%) | 3.08 |
Median Household Size in Carlsbad
The median household size in Carlsbad is 2.60 persons per household, with single female/mother households (3,967 | 9.0%) accounting for the largest median household size of 3.2 persons per household. non-family households (12,923 | 29.4%) represent the smallest median household size with 1.30 persons per household.
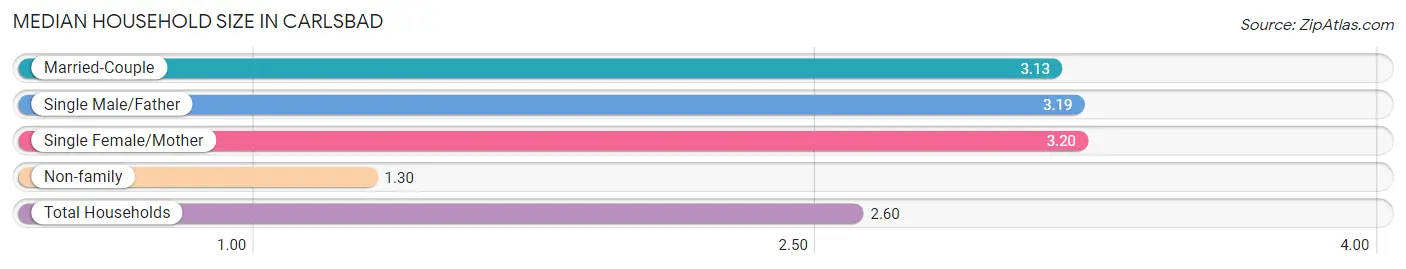
| Household Type | # Households | Household Size |
| Married-Couple | 25,625 (58.4%) | 3.13 |
| Single Male/Father | 1,397 (3.2%) | 3.19 |
| Single Female/Mother | 3,967 (9.0%) | 3.20 |
| Non-family | 12,923 (29.4%) | 1.30 |
| Total Households | 43,912 (100.0%) | 2.60 |
Household Size by Marriage Status in Carlsbad
Out of a total of 43,912 households in Carlsbad, 30,989 (70.6%) are family households, while 12,923 (29.4%) are nonfamily households. The most numerous type of family households are 2-person households, comprising 13,821, and the most common type of nonfamily households are 1-person households, comprising 9,998.
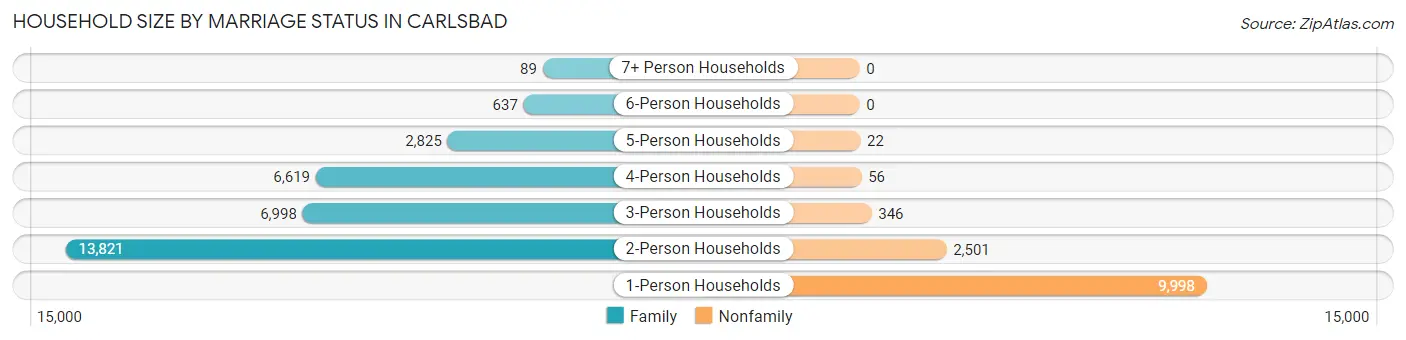
| Household Size | Family Households | Nonfamily Households |
| 1-Person Households | - | 9,998 (22.8%) |
| 2-Person Households | 13,821 (31.5%) | 2,501 (5.7%) |
| 3-Person Households | 6,998 (15.9%) | 346 (0.8%) |
| 4-Person Households | 6,619 (15.1%) | 56 (0.1%) |
| 5-Person Households | 2,825 (6.4%) | 22 (0.1%) |
| 6-Person Households | 637 (1.5%) | 0 (0.0%) |
| 7+ Person Households | 89 (0.2%) | 0 (0.0%) |
| Total | 30,989 (70.6%) | 12,923 (29.4%) |
Female Fertility in Carlsbad
Fertility by Age in Carlsbad
Average fertility rate in Carlsbad is 53.0 births per 1,000 women. Women in the age bracket of 20 to 34 years have the highest fertility rate with 90.0 births per 1,000 women. Women in the age bracket of 20 to 34 years acount for 58.1% of all women with births.
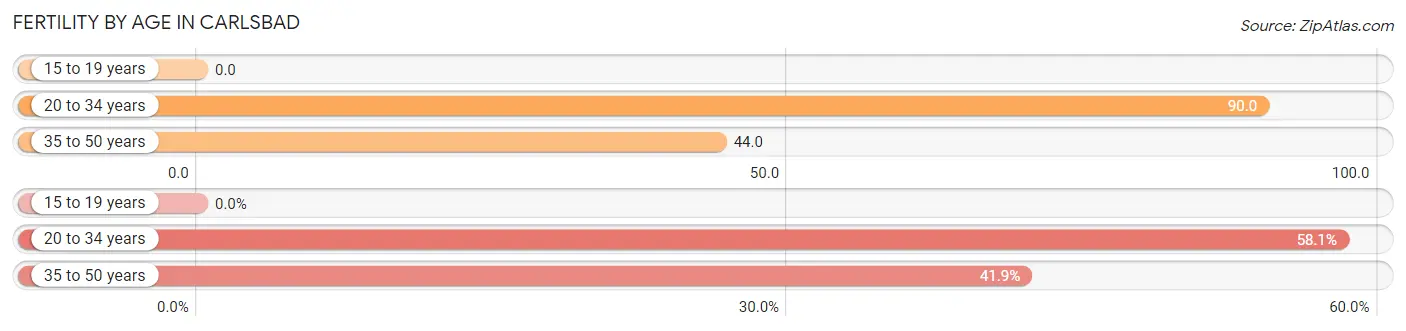
| Age Bracket | Women with Births | Births / 1,000 Women |
| 15 to 19 years | 0 (0.0%) | 0.0 |
| 20 to 34 years | 749 (58.1%) | 90.0 |
| 35 to 50 years | 541 (41.9%) | 44.0 |
| Total | 1,290 (100.0%) | 53.0 |
Fertility by Age by Marriage Status in Carlsbad
87.5% of women with births (1,290) in Carlsbad are married. The highest percentage of unmarried women with births falls into 20 to 34 years age bracket with 13.1% of them unmarried at the time of birth, while the lowest percentage of unmarried women with births belong to 35 to 50 years age bracket with 11.7% of them unmarried.
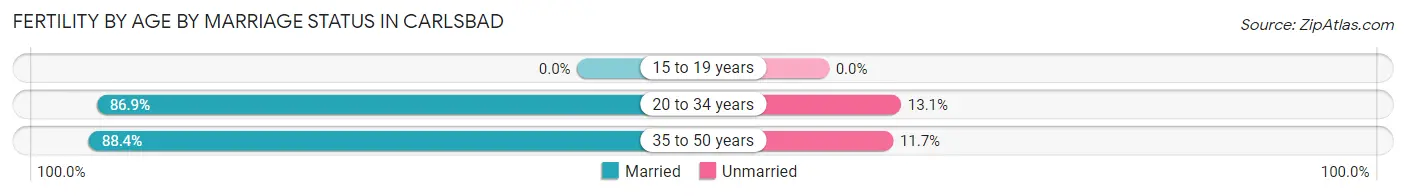
| Age Bracket | Married | Unmarried |
| 15 to 19 years | 0 (0.0%) | 0 (0.0%) |
| 20 to 34 years | 651 (86.9%) | 98 (13.1%) |
| 35 to 50 years | 478 (88.3%) | 63 (11.7%) |
| Total | 1,129 (87.5%) | 161 (12.5%) |
Fertility by Education in Carlsbad
Average fertility rate in Carlsbad is 53.0 births per 1,000 women. Women with the education attainment of college or associate's degree have the highest fertility rate of 82.0 births per 1,000 women, while women with the education attainment of less than high school have the lowest fertility at 4.0 births per 1,000 women. Women with the education attainment of bachelor's degree represent 38.1% of all women with births.
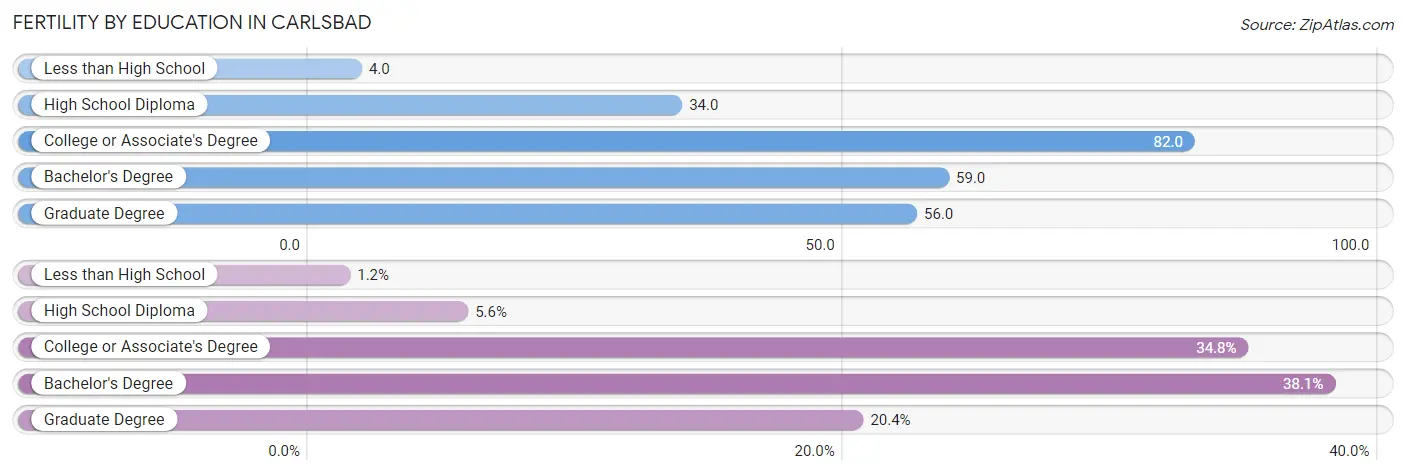
| Educational Attainment | Women with Births | Births / 1,000 Women |
| Less than High School | 15 (1.2%) | 4.0 |
| High School Diploma | 72 (5.6%) | 34.0 |
| College or Associate's Degree | 449 (34.8%) | 82.0 |
| Bachelor's Degree | 491 (38.1%) | 59.0 |
| Graduate Degree | 263 (20.4%) | 56.0 |
| Total | 1,290 (100.0%) | 53.0 |
Fertility by Education by Marriage Status in Carlsbad
12.5% of women with births in Carlsbad are unmarried. Women with the educational attainment of less than high school are most likely to be married with 100.0% of them married at childbirth, while women with the educational attainment of high school diploma are least likely to be married with 100.0% of them unmarried at childbirth.
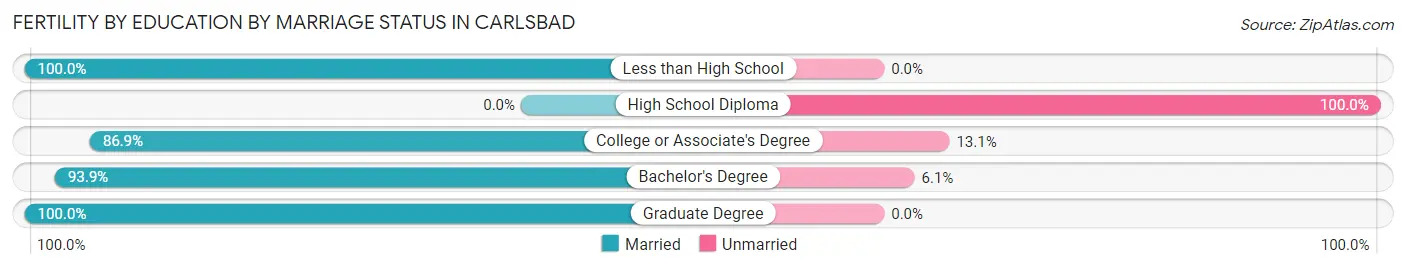
| Educational Attainment | Married | Unmarried |
| Less than High School | 15 (100.0%) | 0 (0.0%) |
| High School Diploma | 0 (0.0%) | 72 (100.0%) |
| College or Associate's Degree | 390 (86.9%) | 59 (13.1%) |
| Bachelor's Degree | 461 (93.9%) | 30 (6.1%) |
| Graduate Degree | 263 (100.0%) | 0 (0.0%) |
| Total | 1,129 (87.5%) | 161 (12.5%) |
Employment Characteristics in Carlsbad
Employment by Class of Employer in Carlsbad
Among the 55,326 employed individuals in Carlsbad, private company employees (36,679 | 66.3%), self-employed (not incorporated) (5,145 | 9.3%), and self-employed (incorporated) (3,690 | 6.7%) make up the most common classes of employment.
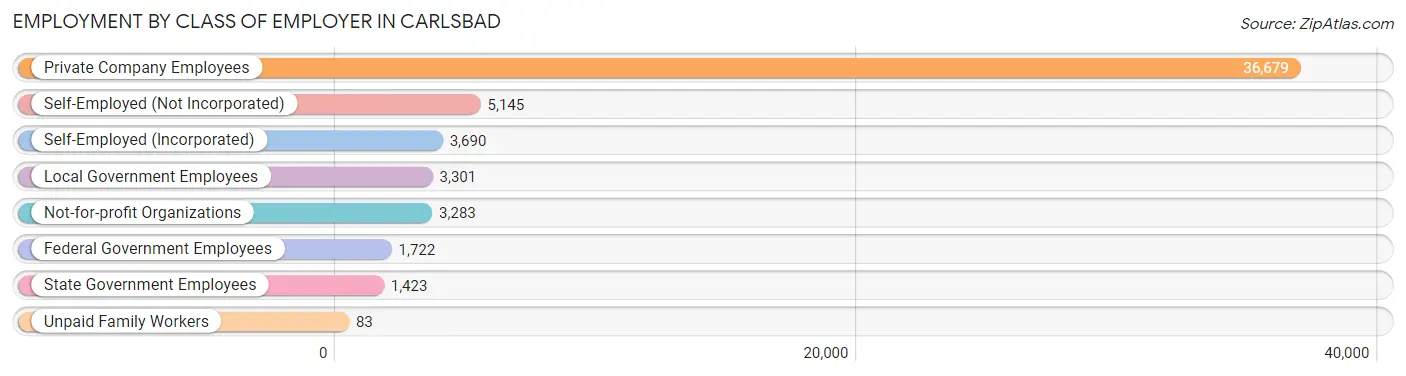
| Employer Class | # Employees | % Employees |
| Private Company Employees | 36,679 | 66.3% |
| Self-Employed (Incorporated) | 3,690 | 6.7% |
| Self-Employed (Not Incorporated) | 5,145 | 9.3% |
| Not-for-profit Organizations | 3,283 | 5.9% |
| Local Government Employees | 3,301 | 6.0% |
| State Government Employees | 1,423 | 2.6% |
| Federal Government Employees | 1,722 | 3.1% |
| Unpaid Family Workers | 83 | 0.2% |
| Total | 55,326 | 100.0% |
Employment Status by Age in Carlsbad
According to the labor force statistics for Carlsbad, out of the total population over 16 years of age (91,655), 65.2% or 59,759 individuals are in the labor force, with 6.0% or 3,586 of them unemployed. The age group with the highest labor force participation rate is 25 to 29 years, with 88.6% or 5,918 individuals in the labor force. Within the labor force, the 20 to 24 years age range has the highest percentage of unemployed individuals, with 13.9% or 587 of them being unemployed.
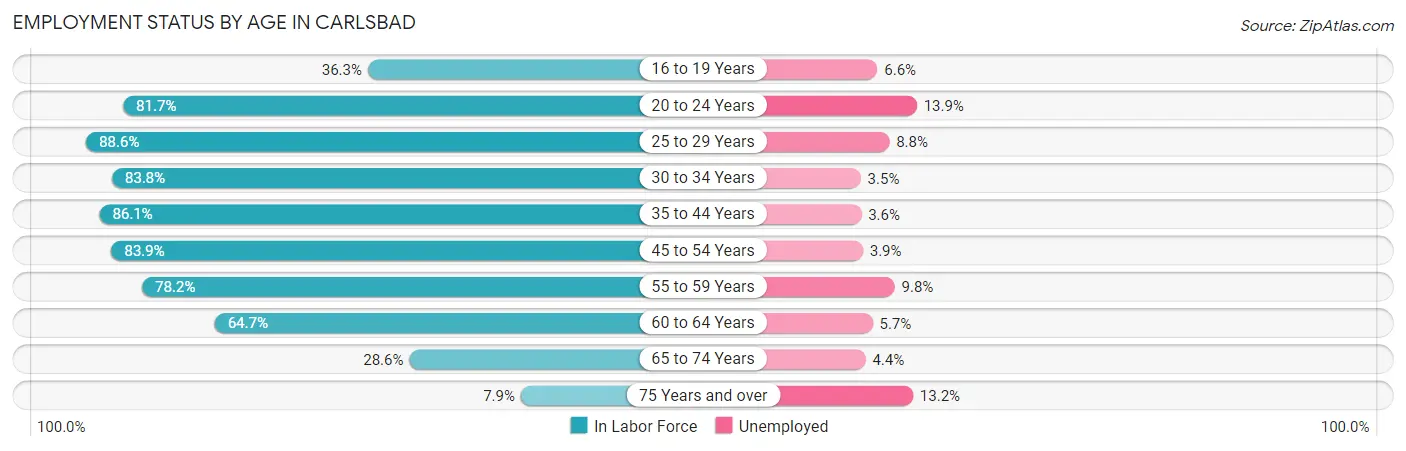
| Age Bracket | In Labor Force | Unemployed |
| 16 to 19 Years | 1,921 (36.3%) | 127 (6.6%) |
| 20 to 24 Years | 4,221 (81.7%) | 587 (13.9%) |
| 25 to 29 Years | 5,918 (88.6%) | 521 (8.8%) |
| 30 to 34 Years | 4,884 (83.8%) | 171 (3.5%) |
| 35 to 44 Years | 13,486 (86.1%) | 485 (3.6%) |
| 45 to 54 Years | 13,948 (83.9%) | 544 (3.9%) |
| 55 to 59 Years | 6,797 (78.2%) | 666 (9.8%) |
| 60 to 64 Years | 4,701 (64.7%) | 268 (5.7%) |
| 65 to 74 Years | 3,143 (28.6%) | 138 (4.4%) |
| 75 Years and over | 747 (7.9%) | 99 (13.2%) |
| Total | 59,759 (65.2%) | 3,586 (6.0%) |
Employment Status by Educational Attainment in Carlsbad
According to labor force statistics for Carlsbad, 81.9% of individuals (49,756) out of the total population between 25 and 64 years of age (60,752) are in the labor force, with 5.3% or 2,637 of them being unemployed. The group with the highest labor force participation rate are those with the educational attainment of bachelor's degree or higher, with 85.8% or 32,606 individuals in the labor force. Within the labor force, individuals with less than high school education have the highest percentage of unemployment, with 12.6% or 208 of them being unemployed.
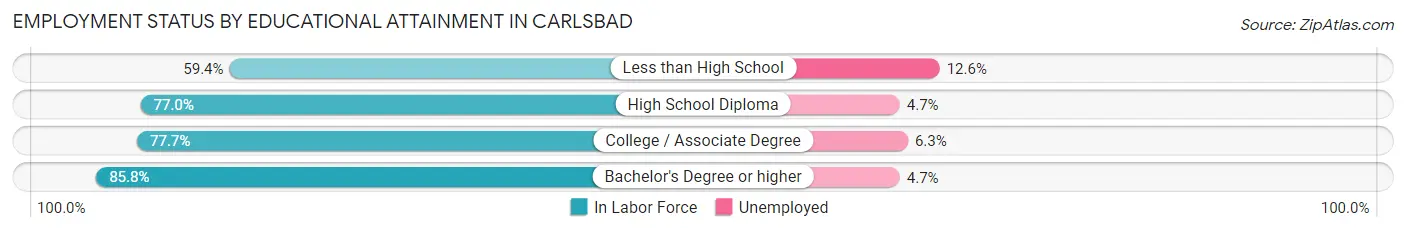
| Educational Attainment | In Labor Force | Unemployed |
| Less than High School | 1,650 (59.4%) | 350 (12.6%) |
| High School Diploma | 4,093 (77.0%) | 250 (4.7%) |
| College / Associate Degree | 11,388 (77.7%) | 923 (6.3%) |
| Bachelor's Degree or higher | 32,606 (85.8%) | 1,786 (4.7%) |
| Total | 49,756 (81.9%) | 3,220 (5.3%) |
Employment Occupations by Sex in Carlsbad
Management, Business, Science and Arts Occupations
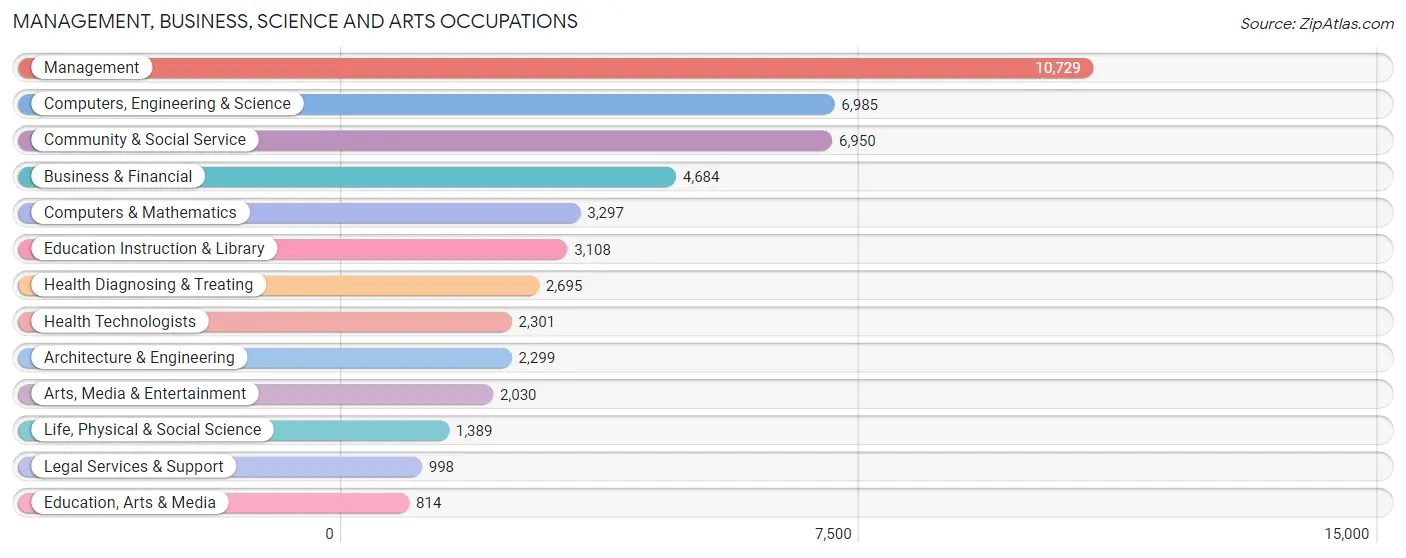
The most common Management, Business, Science and Arts occupations in Carlsbad are Management (10,729 | 19.4%), Computers, Engineering & Science (6,985 | 12.6%), Community & Social Service (6,950 | 12.6%), Business & Financial (4,684 | 8.5%), and Computers & Mathematics (3,297 | 6.0%).
Management, Business, Science and Arts Occupations by Sex
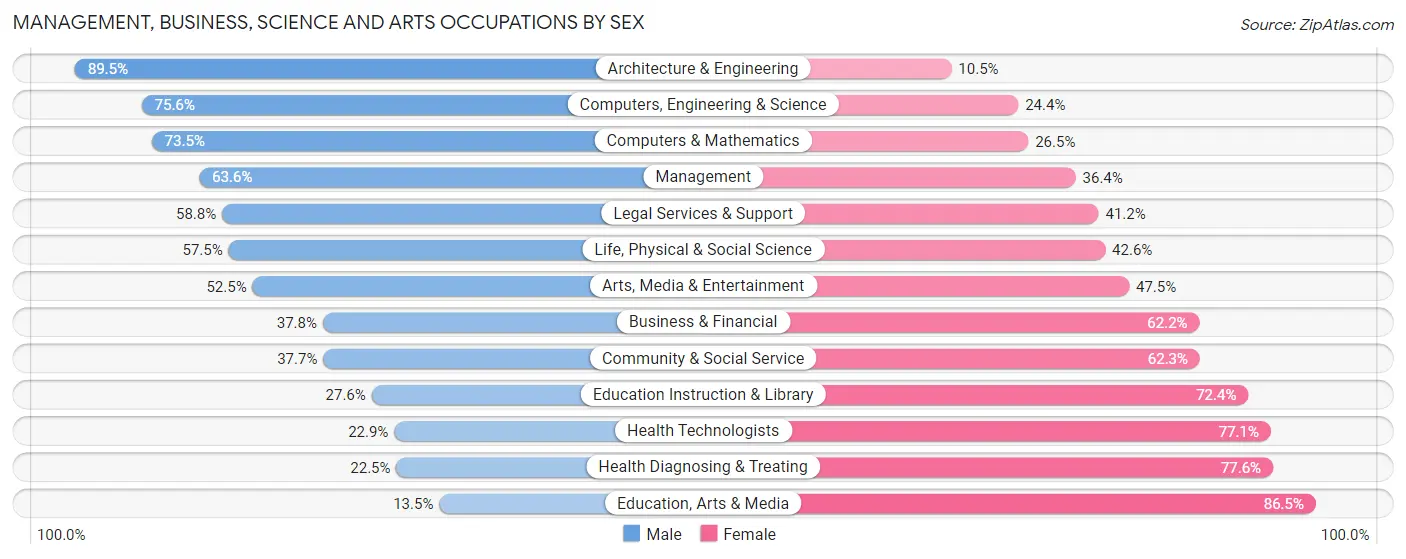
Within the Management, Business, Science and Arts occupations in Carlsbad, the most male-oriented occupations are Architecture & Engineering (89.5%), Computers, Engineering & Science (75.6%), and Computers & Mathematics (73.5%), while the most female-oriented occupations are Education, Arts & Media (86.5%), Health Diagnosing & Treating (77.5%), and Health Technologists (77.1%).
| Occupation | Male | Female |
| Management | 6,825 (63.6%) | 3,904 (36.4%) |
| Business & Financial | 1,770 (37.8%) | 2,914 (62.2%) |
| Computers, Engineering & Science | 5,279 (75.6%) | 1,706 (24.4%) |
| Computers & Mathematics | 2,423 (73.5%) | 874 (26.5%) |
| Architecture & Engineering | 2,058 (89.5%) | 241 (10.5%) |
| Life, Physical & Social Science | 798 (57.5%) | 591 (42.5%) |
| Community & Social Service | 2,620 (37.7%) | 4,330 (62.3%) |
| Education, Arts & Media | 110 (13.5%) | 704 (86.5%) |
| Legal Services & Support | 587 (58.8%) | 411 (41.2%) |
| Education Instruction & Library | 858 (27.6%) | 2,250 (72.4%) |
| Arts, Media & Entertainment | 1,065 (52.5%) | 965 (47.5%) |
| Health Diagnosing & Treating | 605 (22.5%) | 2,090 (77.5%) |
| Health Technologists | 527 (22.9%) | 1,774 (77.1%) |
| Total (Category) | 17,099 (53.4%) | 14,944 (46.6%) |
| Total (Overall) | 30,155 (54.5%) | 25,142 (45.5%) |
Services Occupations
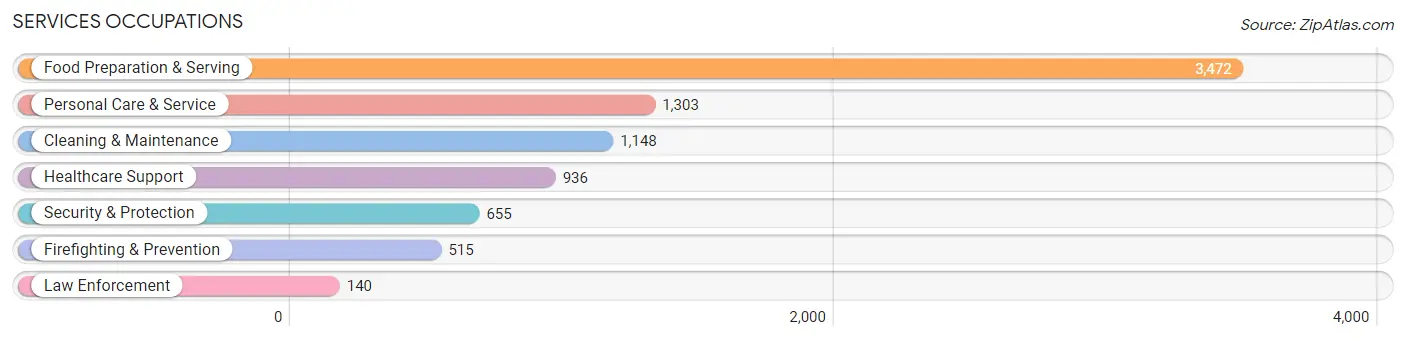
The most common Services occupations in Carlsbad are Food Preparation & Serving (3,472 | 6.3%), Personal Care & Service (1,303 | 2.4%), Cleaning & Maintenance (1,148 | 2.1%), Healthcare Support (936 | 1.7%), and Security & Protection (655 | 1.2%).
Services Occupations by Sex
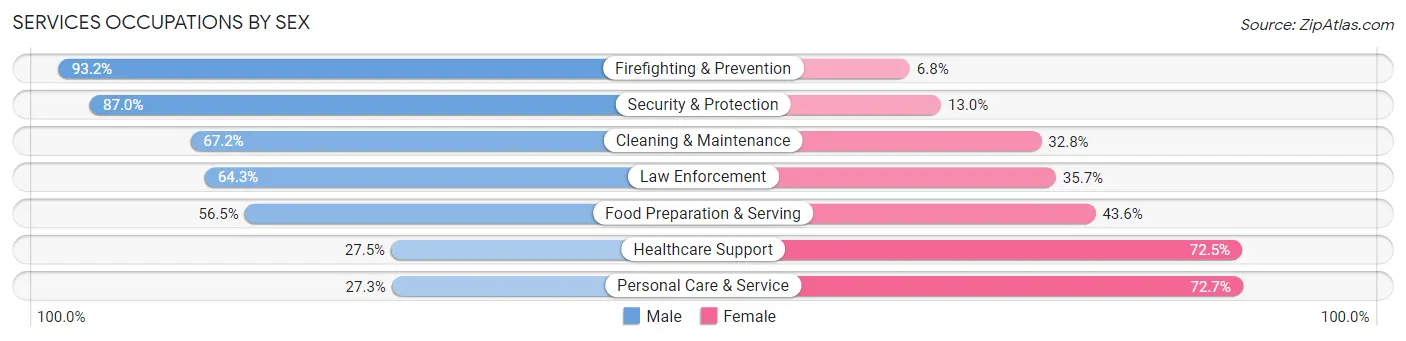
Within the Services occupations in Carlsbad, the most male-oriented occupations are Firefighting & Prevention (93.2%), Security & Protection (87.0%), and Cleaning & Maintenance (67.2%), while the most female-oriented occupations are Personal Care & Service (72.7%), Healthcare Support (72.5%), and Food Preparation & Serving (43.5%).
| Occupation | Male | Female |
| Healthcare Support | 257 (27.5%) | 679 (72.5%) |
| Security & Protection | 570 (87.0%) | 85 (13.0%) |
| Firefighting & Prevention | 480 (93.2%) | 35 (6.8%) |
| Law Enforcement | 90 (64.3%) | 50 (35.7%) |
| Food Preparation & Serving | 1,960 (56.5%) | 1,512 (43.5%) |
| Cleaning & Maintenance | 771 (67.2%) | 377 (32.8%) |
| Personal Care & Service | 356 (27.3%) | 947 (72.7%) |
| Total (Category) | 3,914 (52.1%) | 3,600 (47.9%) |
| Total (Overall) | 30,155 (54.5%) | 25,142 (45.5%) |
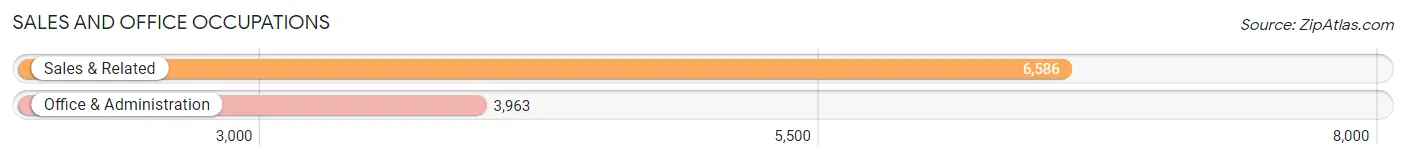
Sales and Office Occupations
The most common Sales and Office occupations in Carlsbad are Sales & Related (6,586 | 11.9%), and Office & Administration (3,963 | 7.2%).
Sales and Office Occupations by Sex
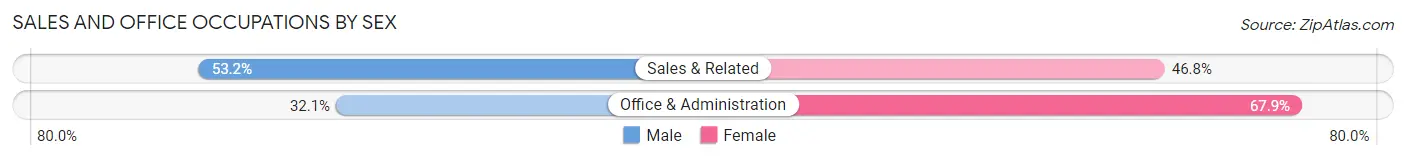
| Occupation | Male | Female |
| Sales & Related | 3,503 (53.2%) | 3,083 (46.8%) |
| Office & Administration | 1,272 (32.1%) | 2,691 (67.9%) |
| Total (Category) | 4,775 (45.3%) | 5,774 (54.7%) |
| Total (Overall) | 30,155 (54.5%) | 25,142 (45.5%) |
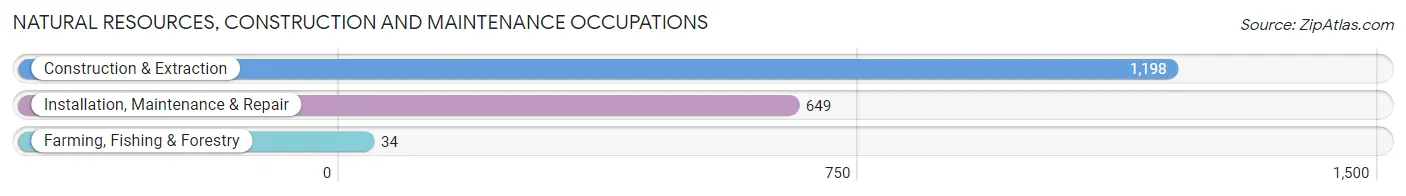
Natural Resources, Construction and Maintenance Occupations
The most common Natural Resources, Construction and Maintenance occupations in Carlsbad are Construction & Extraction (1,198 | 2.2%), Installation, Maintenance & Repair (649 | 1.2%), and Farming, Fishing & Forestry (34 | 0.1%).
Natural Resources, Construction and Maintenance Occupations by Sex
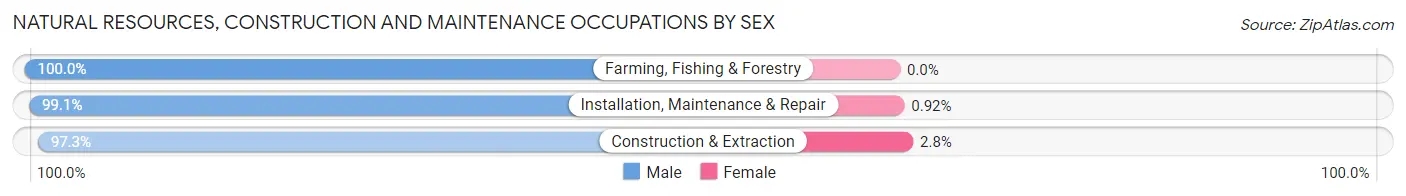
| Occupation | Male | Female |
| Farming, Fishing & Forestry | 34 (100.0%) | 0 (0.0%) |
| Construction & Extraction | 1,165 (97.3%) | 33 (2.8%) |
| Installation, Maintenance & Repair | 643 (99.1%) | 6 (0.9%) |
| Total (Category) | 1,842 (97.9%) | 39 (2.1%) |
| Total (Overall) | 30,155 (54.5%) | 25,142 (45.5%) |
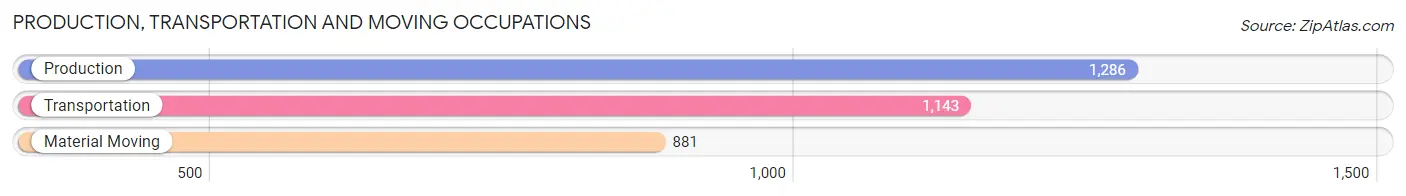
Production, Transportation and Moving Occupations
The most common Production, Transportation and Moving occupations in Carlsbad are Production (1,286 | 2.3%), Transportation (1,143 | 2.1%), and Material Moving (881 | 1.6%).
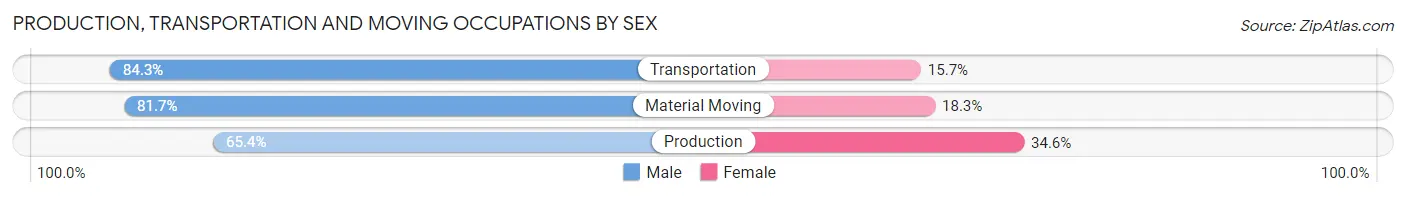
Production, Transportation and Moving Occupations by Sex
| Occupation | Male | Female |
| Production | 841 (65.4%) | 445 (34.6%) |
| Transportation | 964 (84.3%) | 179 (15.7%) |
| Material Moving | 720 (81.7%) | 161 (18.3%) |
| Total (Category) | 2,525 (76.3%) | 785 (23.7%) |
| Total (Overall) | 30,155 (54.5%) | 25,142 (45.5%) |
Employment Industries by Sex in Carlsbad
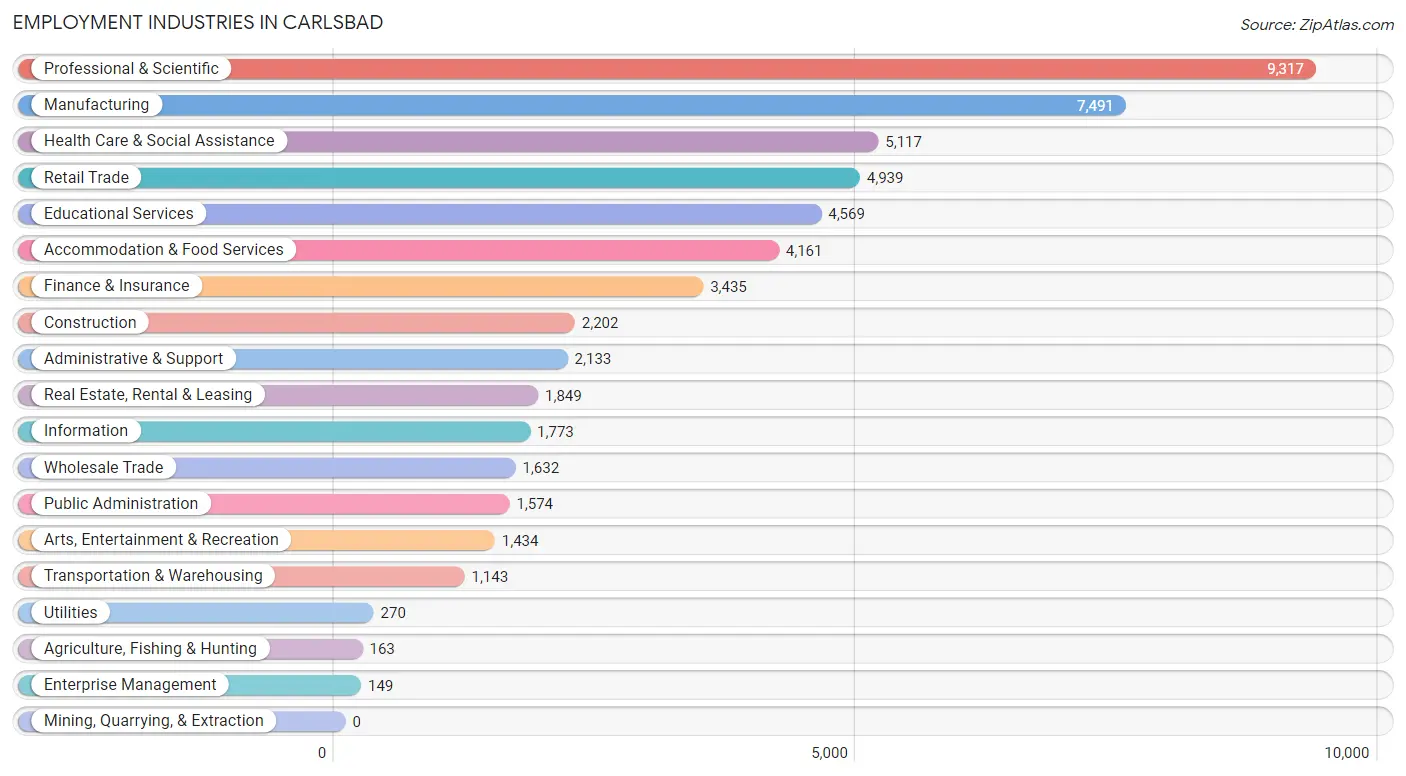
Employment Industries in Carlsbad
The major employment industries in Carlsbad include Professional & Scientific (9,317 | 16.9%), Manufacturing (7,491 | 13.6%), Health Care & Social Assistance (5,117 | 9.2%), Retail Trade (4,939 | 8.9%), and Educational Services (4,569 | 8.3%).
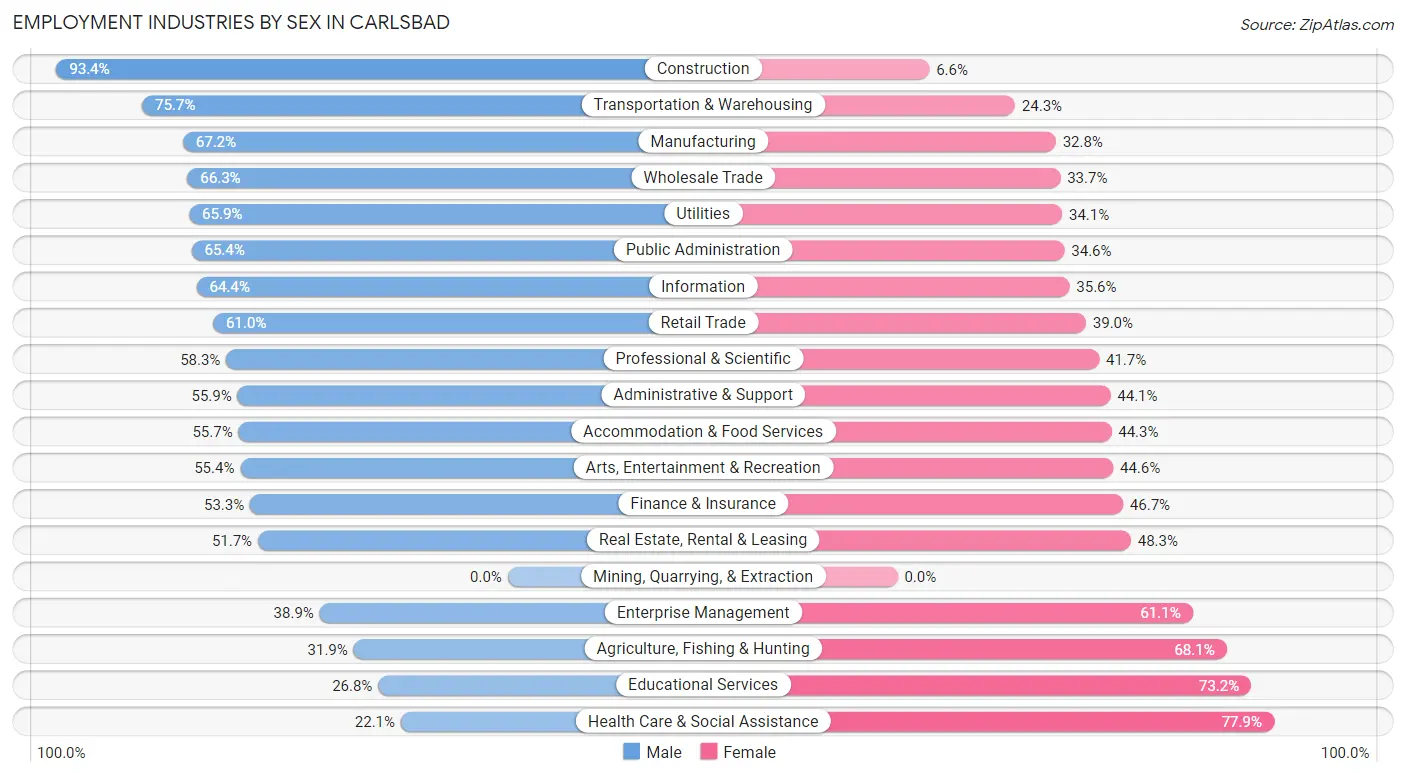
Employment Industries by Sex in Carlsbad
The Carlsbad industries that see more men than women are Construction (93.4%), Transportation & Warehousing (75.7%), and Manufacturing (67.2%), whereas the industries that tend to have a higher number of women are Health Care & Social Assistance (77.9%), Educational Services (73.2%), and Agriculture, Fishing & Hunting (68.1%).
| Industry | Male | Female |
| Agriculture, Fishing & Hunting | 52 (31.9%) | 111 (68.1%) |
| Mining, Quarrying, & Extraction | 0 (0.0%) | 0 (0.0%) |
| Construction | 2,057 (93.4%) | 145 (6.6%) |
| Manufacturing | 5,037 (67.2%) | 2,454 (32.8%) |
| Wholesale Trade | 1,082 (66.3%) | 550 (33.7%) |
| Retail Trade | 3,013 (61.0%) | 1,926 (39.0%) |
| Transportation & Warehousing | 865 (75.7%) | 278 (24.3%) |
| Utilities | 178 (65.9%) | 92 (34.1%) |
| Information | 1,142 (64.4%) | 631 (35.6%) |
| Finance & Insurance | 1,832 (53.3%) | 1,603 (46.7%) |
| Real Estate, Rental & Leasing | 956 (51.7%) | 893 (48.3%) |
| Professional & Scientific | 5,429 (58.3%) | 3,888 (41.7%) |
| Enterprise Management | 58 (38.9%) | 91 (61.1%) |
| Administrative & Support | 1,193 (55.9%) | 940 (44.1%) |
| Educational Services | 1,225 (26.8%) | 3,344 (73.2%) |
| Health Care & Social Assistance | 1,132 (22.1%) | 3,985 (77.9%) |
| Arts, Entertainment & Recreation | 794 (55.4%) | 640 (44.6%) |
| Accommodation & Food Services | 2,319 (55.7%) | 1,842 (44.3%) |
| Public Administration | 1,030 (65.4%) | 544 (34.6%) |
| Total | 30,155 (54.5%) | 25,142 (45.5%) |
Education in Carlsbad
School Enrollment in Carlsbad
The most common levels of schooling among the 29,579 students in Carlsbad are high school (7,357 | 24.9%), middle school (7,086 | 24.0%), and elementary school (5,428 | 18.3%).
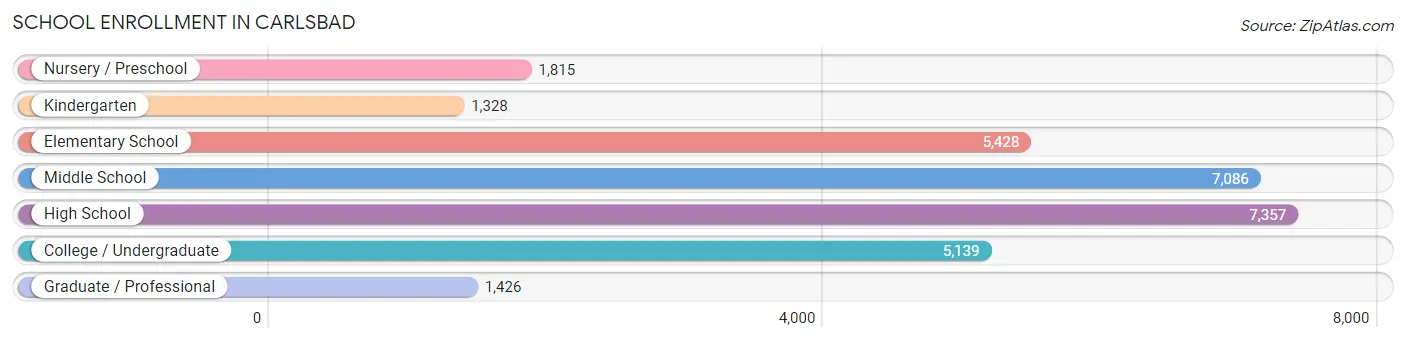
| School Level | # Students | % Students |
| Nursery / Preschool | 1,815 | 6.1% |
| Kindergarten | 1,328 | 4.5% |
| Elementary School | 5,428 | 18.3% |
| Middle School | 7,086 | 24.0% |
| High School | 7,357 | 24.9% |
| College / Undergraduate | 5,139 | 17.4% |
| Graduate / Professional | 1,426 | 4.8% |
| Total | 29,579 | 100.0% |
School Enrollment by Age by Funding Source in Carlsbad
Out of a total of 29,579 students who are enrolled in schools in Carlsbad, 5,088 (17.2%) attend a private institution, while the remaining 24,491 (82.8%) are enrolled in public schools. The age group of 3 to 4 year olds has the highest likelihood of being enrolled in private schools, with 884 (72.3% in the age bracket) enrolled. Conversely, the age group of 15 to 17 year olds has the lowest likelihood of being enrolled in a private school, with 4,954 (89.5% in the age bracket) attending a public institution.
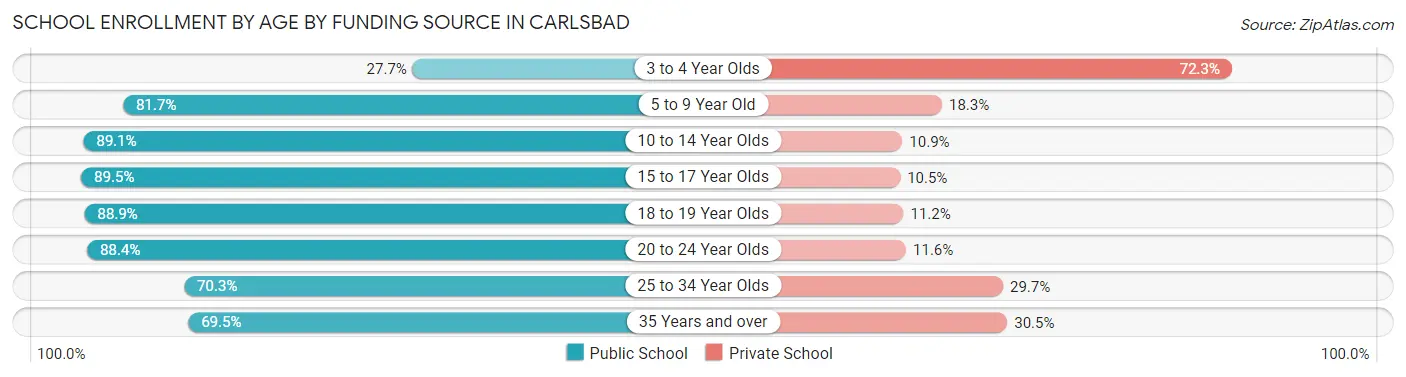
| Age Bracket | Public School | Private School |
| 3 to 4 Year Olds | 339 (27.7%) | 884 (72.3%) |
| 5 to 9 Year Old | 5,205 (81.7%) | 1,168 (18.3%) |
| 10 to 14 Year Olds | 8,007 (89.1%) | 984 (10.9%) |
| 15 to 17 Year Olds | 4,954 (89.5%) | 583 (10.5%) |
| 18 to 19 Year Olds | 1,793 (88.8%) | 225 (11.2%) |
| 20 to 24 Year Olds | 1,945 (88.4%) | 256 (11.6%) |
| 25 to 34 Year Olds | 1,011 (70.3%) | 427 (29.7%) |
| 35 Years and over | 1,250 (69.5%) | 548 (30.5%) |
| Total | 24,491 (82.8%) | 5,088 (17.2%) |
Educational Attainment by Field of Study in Carlsbad
Business (10,181 | 19.7%), engineering (5,185 | 10.1%), social sciences (5,109 | 9.9%), bio, nature & agricultural (3,968 | 7.7%), and science & technology (3,203 | 6.2%) are the most common fields of study among 51,599 individuals in Carlsbad who have obtained a bachelor's degree or higher.
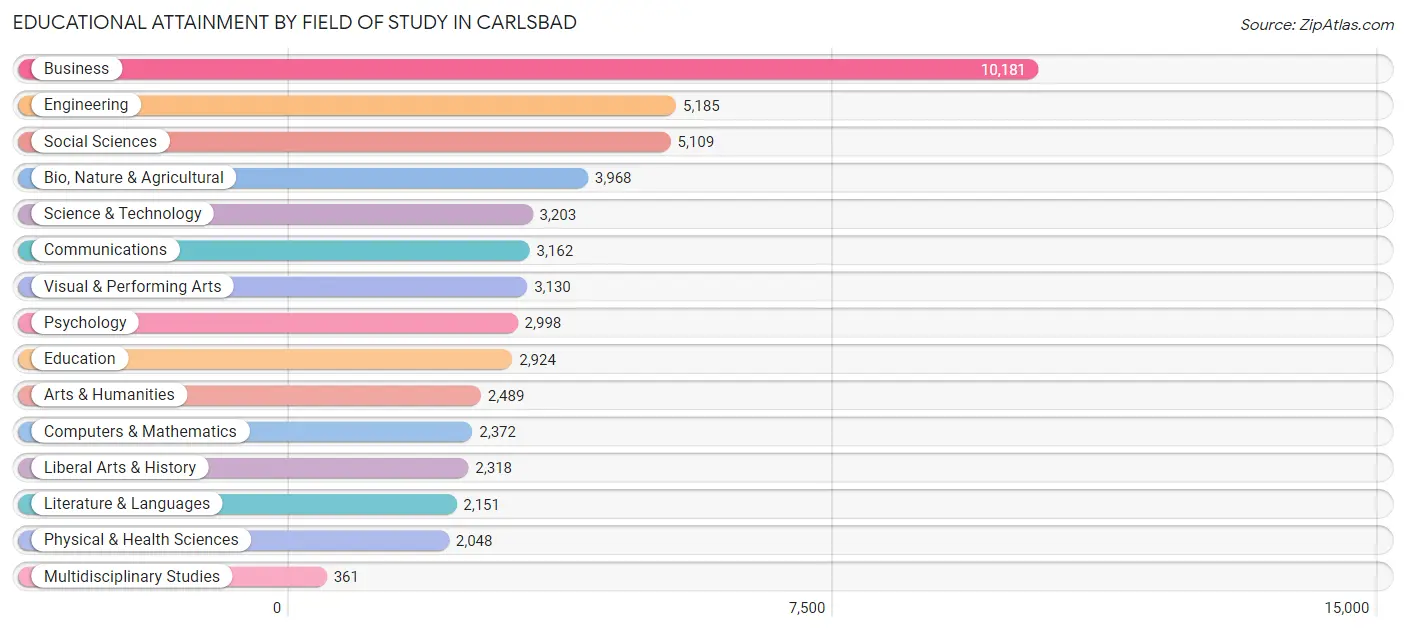
| Field of Study | # Graduates | % Graduates |
| Computers & Mathematics | 2,372 | 4.6% |
| Bio, Nature & Agricultural | 3,968 | 7.7% |
| Physical & Health Sciences | 2,048 | 4.0% |
| Psychology | 2,998 | 5.8% |
| Social Sciences | 5,109 | 9.9% |
| Engineering | 5,185 | 10.1% |
| Multidisciplinary Studies | 361 | 0.7% |
| Science & Technology | 3,203 | 6.2% |
| Business | 10,181 | 19.7% |
| Education | 2,924 | 5.7% |
| Literature & Languages | 2,151 | 4.2% |
| Liberal Arts & History | 2,318 | 4.5% |
| Visual & Performing Arts | 3,130 | 6.1% |
| Communications | 3,162 | 6.1% |
| Arts & Humanities | 2,489 | 4.8% |
| Total | 51,599 | 100.0% |
Transportation & Commute in Carlsbad
Vehicle Availability by Sex in Carlsbad
The most prevalent vehicle ownership categories in Carlsbad are males with 2 vehicles (15,355, accounting for 50.0%) and females with 2 vehicles (11,618, making up 62.5%).
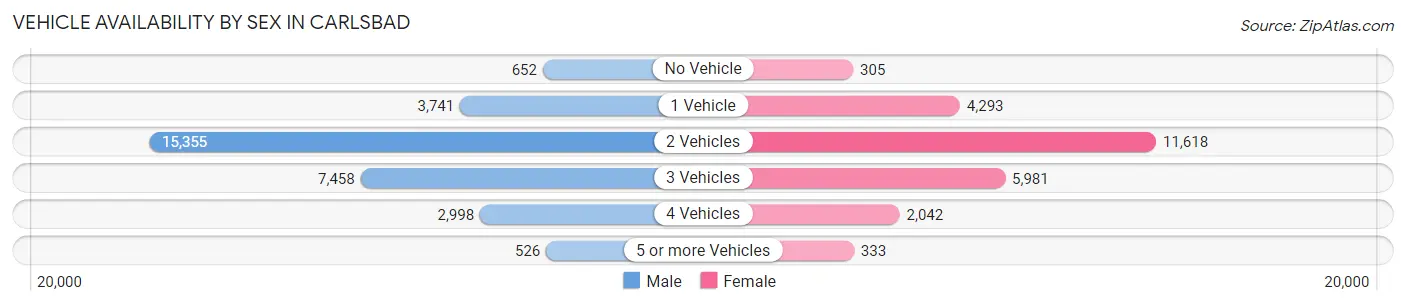
| Vehicles Available | Male | Female |
| No Vehicle | 652 (2.1%) | 305 (1.2%) |
| 1 Vehicle | 3,741 (12.2%) | 4,293 (17.5%) |
| 2 Vehicles | 15,355 (50.0%) | 11,618 (47.3%) |
| 3 Vehicles | 7,458 (24.3%) | 5,981 (24.3%) |
| 4 Vehicles | 2,998 (9.8%) | 2,042 (8.3%) |
| 5 or more Vehicles | 526 (1.7%) | 333 (1.4%) |
| Total | 30,730 (100.0%) | 24,572 (100.0%) |
Commute Time in Carlsbad
The most frequently occuring commute durations in Carlsbad are 15 to 19 minutes (8,119 commuters, 19.5%), 10 to 14 minutes (5,738 commuters, 13.8%), and 20 to 24 minutes (5,200 commuters, 12.5%).
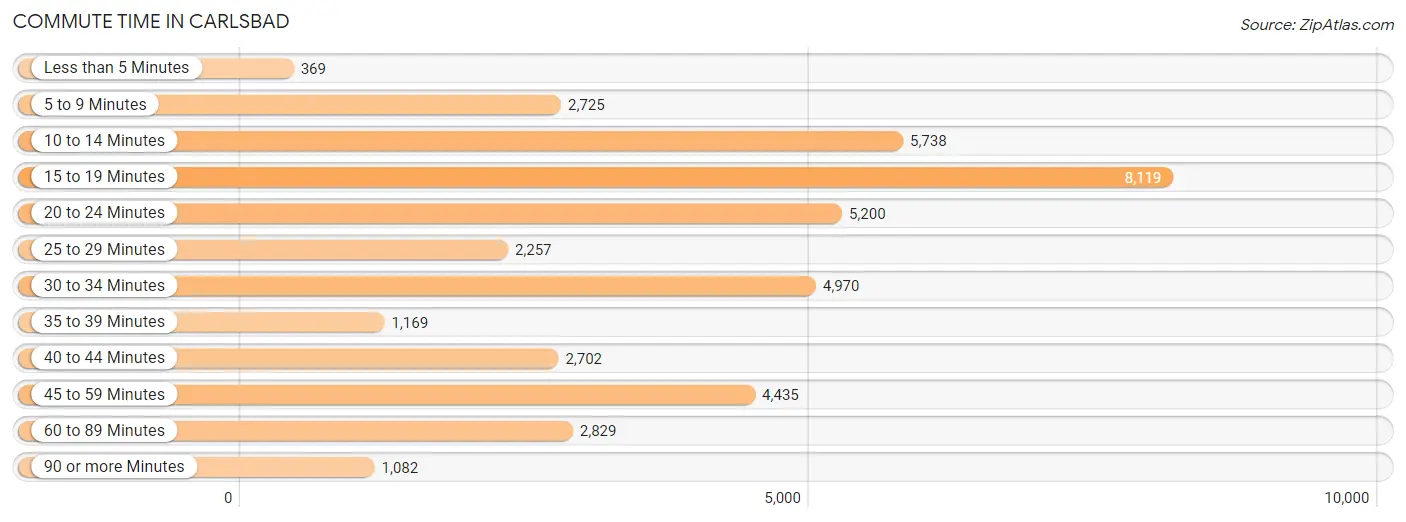
| Commute Time | # Commuters | % Commuters |
| Less than 5 Minutes | 369 | 0.9% |
| 5 to 9 Minutes | 2,725 | 6.6% |
| 10 to 14 Minutes | 5,738 | 13.8% |
| 15 to 19 Minutes | 8,119 | 19.5% |
| 20 to 24 Minutes | 5,200 | 12.5% |
| 25 to 29 Minutes | 2,257 | 5.4% |
| 30 to 34 Minutes | 4,970 | 11.9% |
| 35 to 39 Minutes | 1,169 | 2.8% |
| 40 to 44 Minutes | 2,702 | 6.5% |
| 45 to 59 Minutes | 4,435 | 10.7% |
| 60 to 89 Minutes | 2,829 | 6.8% |
| 90 or more Minutes | 1,082 | 2.6% |
Commute Time by Sex in Carlsbad
The most common commute times in Carlsbad are 15 to 19 minutes (4,607 commuters, 19.5%) for males and 15 to 19 minutes (3,512 commuters, 19.5%) for females.
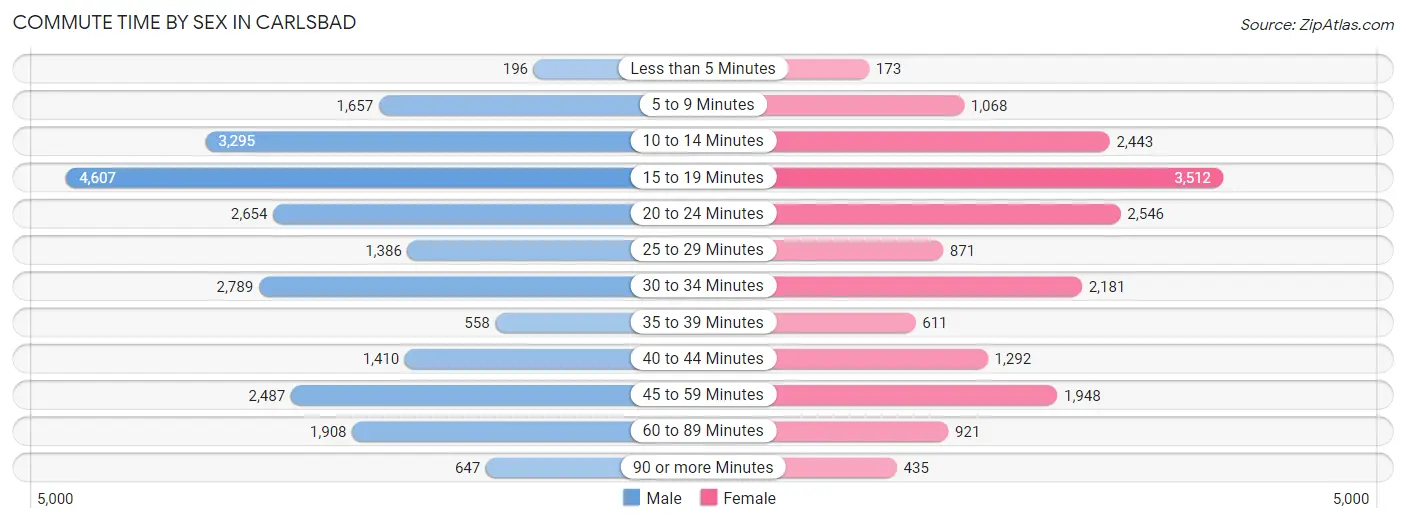
| Commute Time | Male | Female |
| Less than 5 Minutes | 196 (0.8%) | 173 (1.0%) |
| 5 to 9 Minutes | 1,657 (7.0%) | 1,068 (5.9%) |
| 10 to 14 Minutes | 3,295 (14.0%) | 2,443 (13.6%) |
| 15 to 19 Minutes | 4,607 (19.5%) | 3,512 (19.5%) |
| 20 to 24 Minutes | 2,654 (11.3%) | 2,546 (14.1%) |
| 25 to 29 Minutes | 1,386 (5.9%) | 871 (4.8%) |
| 30 to 34 Minutes | 2,789 (11.8%) | 2,181 (12.1%) |
| 35 to 39 Minutes | 558 (2.4%) | 611 (3.4%) |
| 40 to 44 Minutes | 1,410 (6.0%) | 1,292 (7.2%) |
| 45 to 59 Minutes | 2,487 (10.5%) | 1,948 (10.8%) |
| 60 to 89 Minutes | 1,908 (8.1%) | 921 (5.1%) |
| 90 or more Minutes | 647 (2.7%) | 435 (2.4%) |
Time of Departure to Work by Sex in Carlsbad
The most frequent times of departure to work in Carlsbad are 7:00 AM to 7:29 AM (3,718, 15.8%) for males and 8:00 AM to 8:29 AM (3,292, 18.3%) for females.
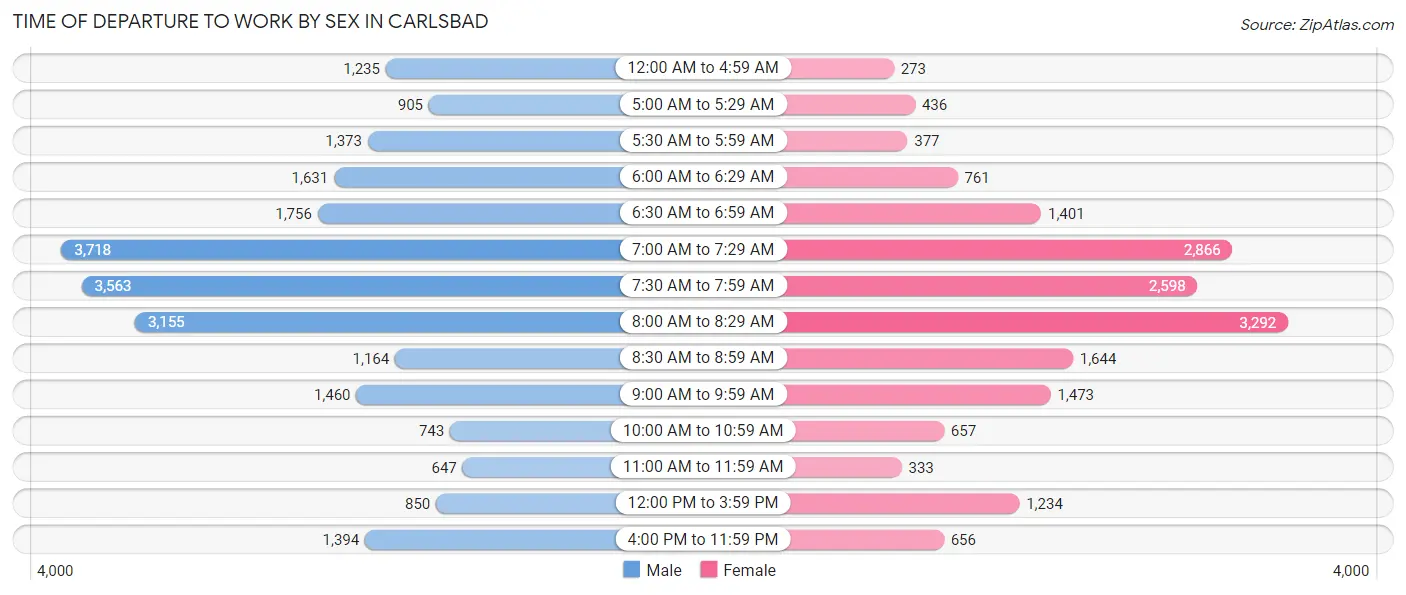
| Time of Departure | Male | Female |
| 12:00 AM to 4:59 AM | 1,235 (5.2%) | 273 (1.5%) |
| 5:00 AM to 5:29 AM | 905 (3.8%) | 436 (2.4%) |
| 5:30 AM to 5:59 AM | 1,373 (5.8%) | 377 (2.1%) |
| 6:00 AM to 6:29 AM | 1,631 (6.9%) | 761 (4.2%) |
| 6:30 AM to 6:59 AM | 1,756 (7.4%) | 1,401 (7.8%) |
| 7:00 AM to 7:29 AM | 3,718 (15.8%) | 2,866 (15.9%) |
| 7:30 AM to 7:59 AM | 3,563 (15.1%) | 2,598 (14.4%) |
| 8:00 AM to 8:29 AM | 3,155 (13.4%) | 3,292 (18.3%) |
| 8:30 AM to 8:59 AM | 1,164 (4.9%) | 1,644 (9.1%) |
| 9:00 AM to 9:59 AM | 1,460 (6.2%) | 1,473 (8.2%) |
| 10:00 AM to 10:59 AM | 743 (3.2%) | 657 (3.6%) |
| 11:00 AM to 11:59 AM | 647 (2.7%) | 333 (1.8%) |
| 12:00 PM to 3:59 PM | 850 (3.6%) | 1,234 (6.9%) |
| 4:00 PM to 11:59 PM | 1,394 (5.9%) | 656 (3.6%) |
| Total | 23,594 (100.0%) | 18,001 (100.0%) |
Housing Occupancy in Carlsbad
Occupancy by Ownership in Carlsbad
Of the total 43,912 dwellings in Carlsbad, owner-occupied units account for 27,304 (62.2%), while renter-occupied units make up 16,608 (37.8%).
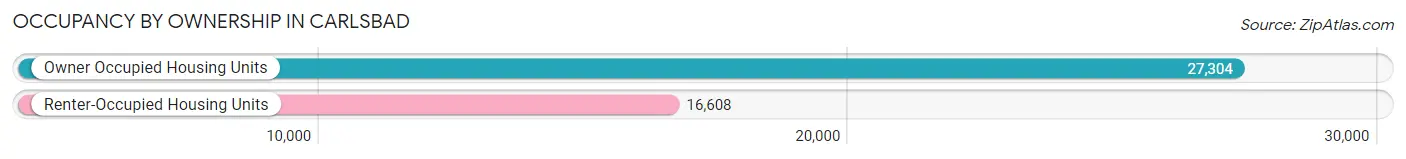
| Occupancy | # Housing Units | % Housing Units |
| Owner Occupied Housing Units | 27,304 | 62.2% |
| Renter-Occupied Housing Units | 16,608 | 37.8% |
| Total Occupied Housing Units | 43,912 | 100.0% |
Occupancy by Household Size in Carlsbad
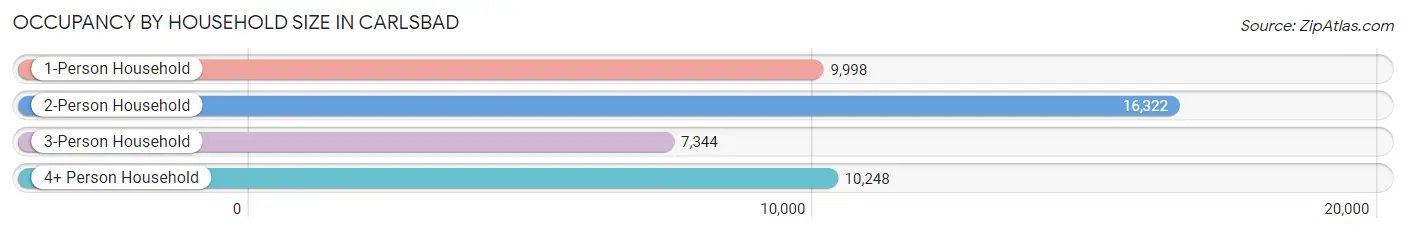
| Household Size | # Housing Units | % Housing Units |
| 1-Person Household | 9,998 | 22.8% |
| 2-Person Household | 16,322 | 37.2% |
| 3-Person Household | 7,344 | 16.7% |
| 4+ Person Household | 10,248 | 23.3% |
| Total Housing Units | 43,912 | 100.0% |
Occupancy by Ownership by Household Size in Carlsbad
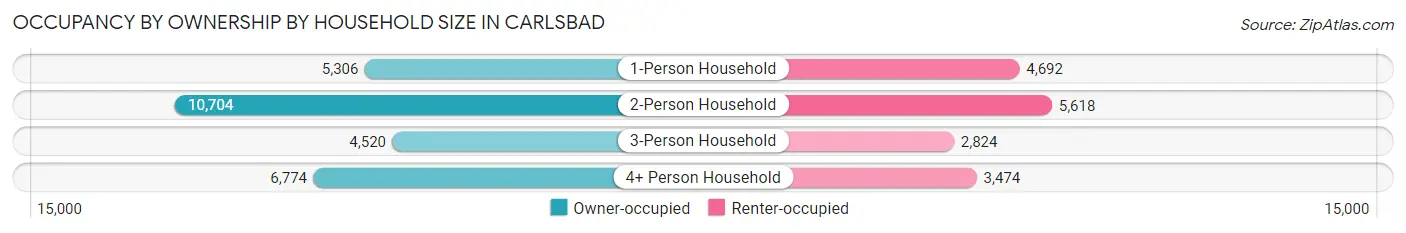
| Household Size | Owner-occupied | Renter-occupied |
| 1-Person Household | 5,306 (53.1%) | 4,692 (46.9%) |
| 2-Person Household | 10,704 (65.6%) | 5,618 (34.4%) |
| 3-Person Household | 4,520 (61.6%) | 2,824 (38.5%) |
| 4+ Person Household | 6,774 (66.1%) | 3,474 (33.9%) |
| Total Housing Units | 27,304 (62.2%) | 16,608 (37.8%) |
Occupancy by Educational Attainment in Carlsbad
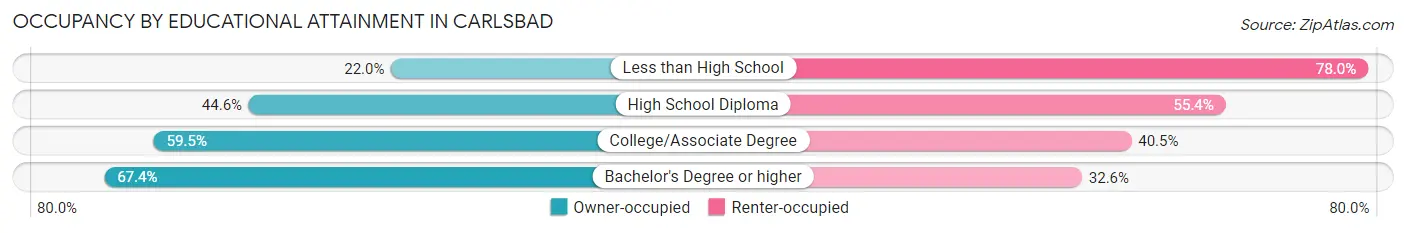
| Household Size | Owner-occupied | Renter-occupied |
| Less than High School | 327 (22.0%) | 1,160 (78.0%) |
| High School Diploma | 1,490 (44.6%) | 1,852 (55.4%) |
| College/Associate Degree | 6,403 (59.5%) | 4,352 (40.5%) |
| Bachelor's Degree or higher | 19,084 (67.4%) | 9,244 (32.6%) |
Occupancy by Age of Householder in Carlsbad
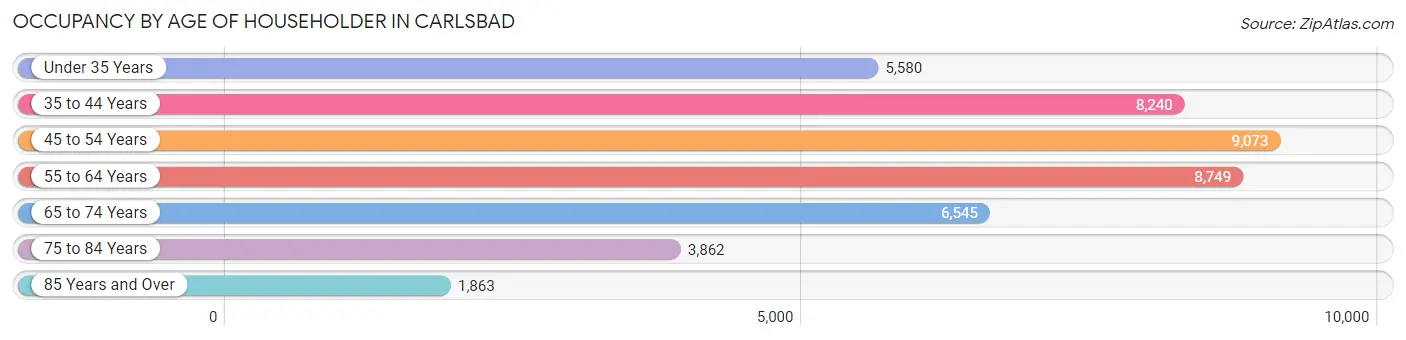
| Age Bracket | # Households | % Households |
| Under 35 Years | 5,580 | 12.7% |
| 35 to 44 Years | 8,240 | 18.8% |
| 45 to 54 Years | 9,073 | 20.7% |
| 55 to 64 Years | 8,749 | 19.9% |
| 65 to 74 Years | 6,545 | 14.9% |
| 75 to 84 Years | 3,862 | 8.8% |
| 85 Years and Over | 1,863 | 4.2% |
| Total | 43,912 | 100.0% |
Housing Finances in Carlsbad
Median Income by Occupancy in Carlsbad
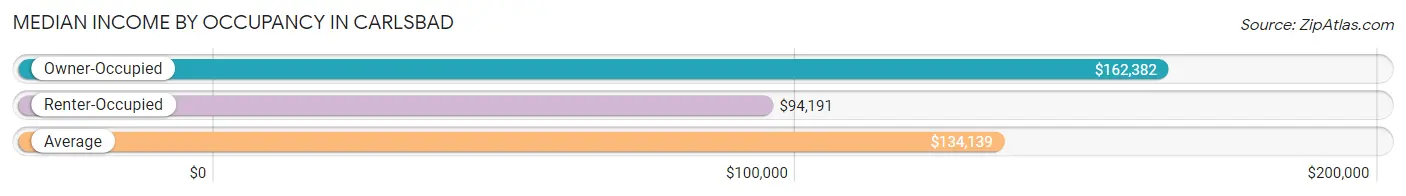
| Occupancy Type | # Households | Median Income |
| Owner-Occupied | 27,304 (62.2%) | $162,382 |
| Renter-Occupied | 16,608 (37.8%) | $94,191 |
| Average | 43,912 (100.0%) | $134,139 |
Occupancy by Householder Income Bracket in Carlsbad
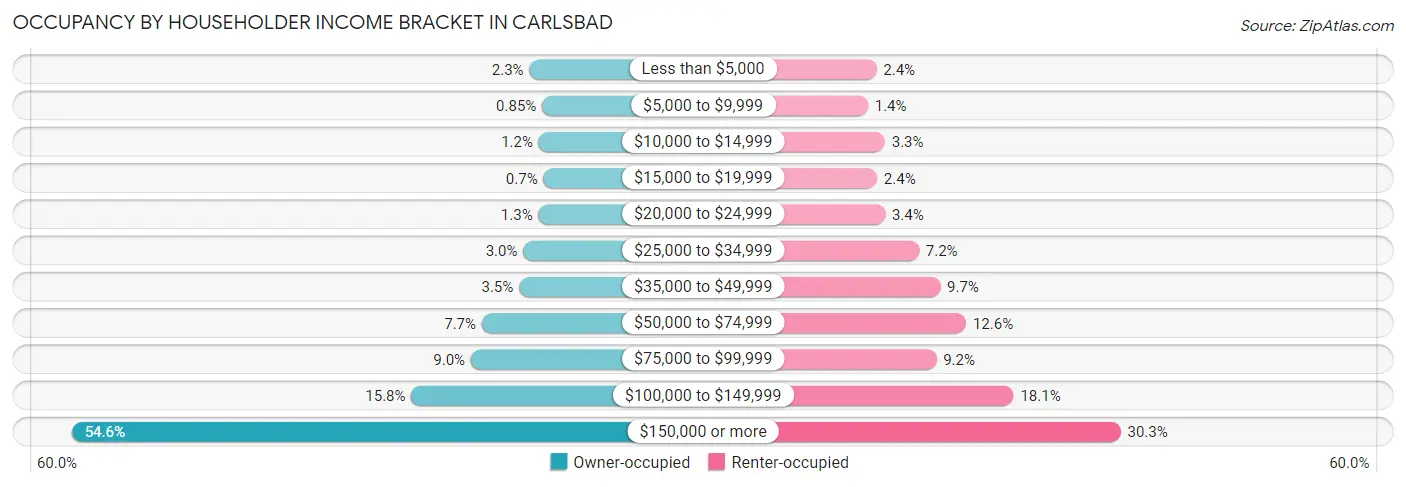
| Income Bracket | Owner-occupied | Renter-occupied |
| Less than $5,000 | 630 (2.3%) | 395 (2.4%) |
| $5,000 to $9,999 | 232 (0.9%) | 233 (1.4%) |
| $10,000 to $14,999 | 337 (1.2%) | 554 (3.3%) |
| $15,000 to $19,999 | 192 (0.7%) | 406 (2.4%) |
| $20,000 to $24,999 | 346 (1.3%) | 558 (3.4%) |
| $25,000 to $34,999 | 821 (3.0%) | 1,201 (7.2%) |
| $35,000 to $49,999 | 951 (3.5%) | 1,605 (9.7%) |
| $50,000 to $74,999 | 2,114 (7.7%) | 2,096 (12.6%) |
| $75,000 to $99,999 | 2,455 (9.0%) | 1,531 (9.2%) |
| $100,000 to $149,999 | 4,315 (15.8%) | 2,998 (18.0%) |
| $150,000 or more | 14,911 (54.6%) | 5,031 (30.3%) |
| Total | 27,304 (100.0%) | 16,608 (100.0%) |
Monthly Housing Cost Tiers in Carlsbad
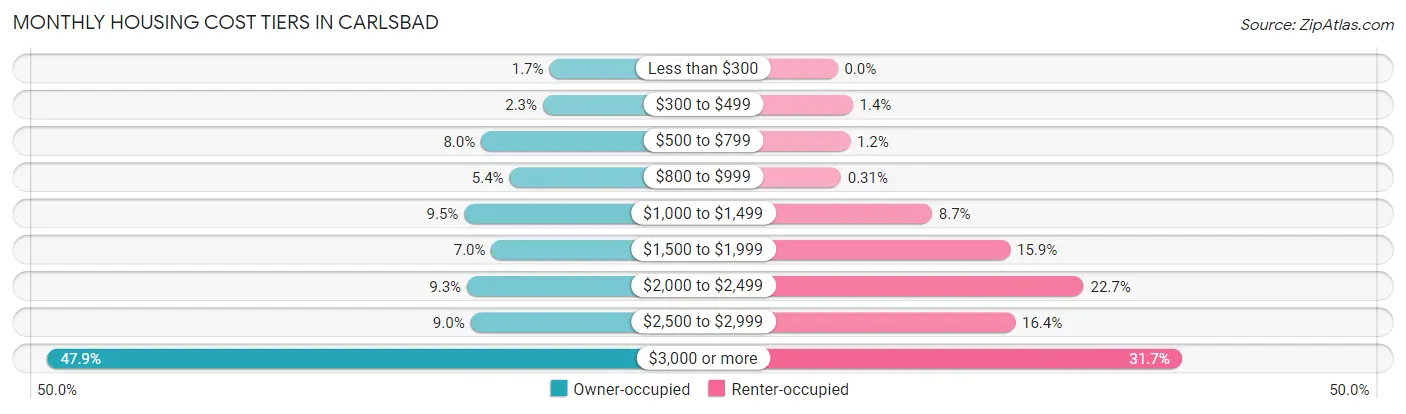
| Monthly Cost | Owner-occupied | Renter-occupied |
| Less than $300 | 461 (1.7%) | 0 (0.0%) |
| $300 to $499 | 626 (2.3%) | 233 (1.4%) |
| $500 to $799 | 2,180 (8.0%) | 192 (1.2%) |
| $800 to $999 | 1,465 (5.4%) | 51 (0.3%) |
| $1,000 to $1,499 | 2,603 (9.5%) | 1,444 (8.7%) |
| $1,500 to $1,999 | 1,920 (7.0%) | 2,641 (15.9%) |
| $2,000 to $2,499 | 2,533 (9.3%) | 3,763 (22.7%) |
| $2,500 to $2,999 | 2,444 (8.9%) | 2,715 (16.4%) |
| $3,000 or more | 13,072 (47.9%) | 5,261 (31.7%) |
| Total | 27,304 (100.0%) | 16,608 (100.0%) |
Physical Housing Characteristics in Carlsbad
Housing Structures in Carlsbad
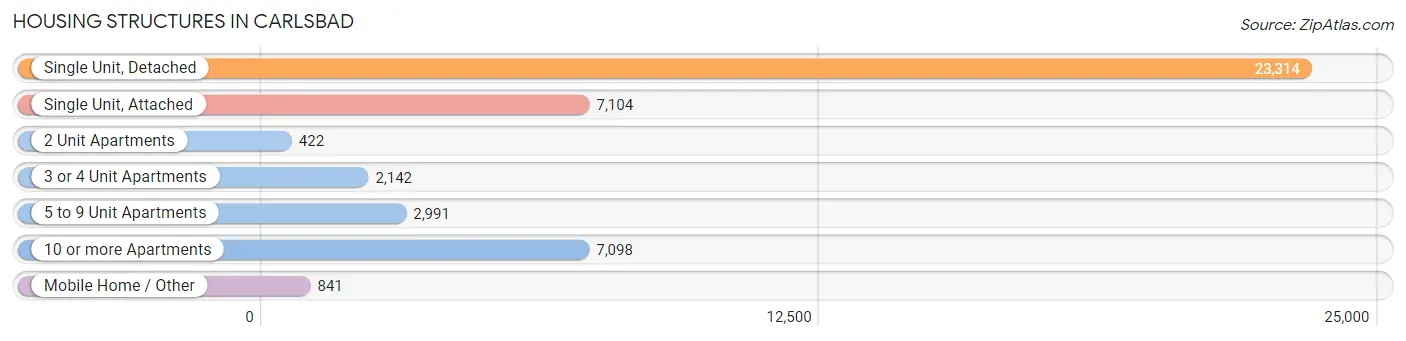
| Structure Type | # Housing Units | % Housing Units |
| Single Unit, Detached | 23,314 | 53.1% |
| Single Unit, Attached | 7,104 | 16.2% |
| 2 Unit Apartments | 422 | 1.0% |
| 3 or 4 Unit Apartments | 2,142 | 4.9% |
| 5 to 9 Unit Apartments | 2,991 | 6.8% |
| 10 or more Apartments | 7,098 | 16.2% |
| Mobile Home / Other | 841 | 1.9% |
| Total | 43,912 | 100.0% |
Housing Structures by Occupancy in Carlsbad
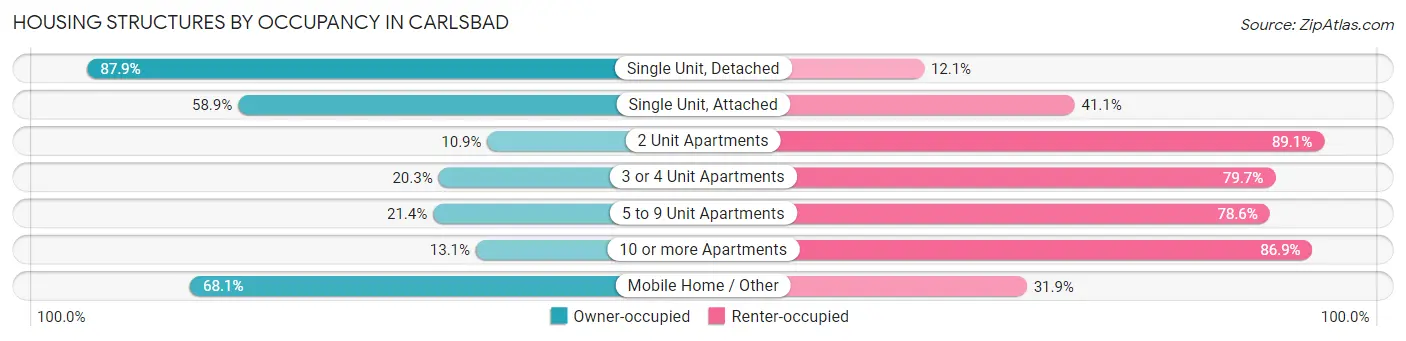
| Structure Type | Owner-occupied | Renter-occupied |
| Single Unit, Detached | 20,495 (87.9%) | 2,819 (12.1%) |
| Single Unit, Attached | 4,185 (58.9%) | 2,919 (41.1%) |
| 2 Unit Apartments | 46 (10.9%) | 376 (89.1%) |
| 3 or 4 Unit Apartments | 435 (20.3%) | 1,707 (79.7%) |
| 5 to 9 Unit Apartments | 639 (21.4%) | 2,352 (78.6%) |
| 10 or more Apartments | 931 (13.1%) | 6,167 (86.9%) |
| Mobile Home / Other | 573 (68.1%) | 268 (31.9%) |
| Total | 27,304 (62.2%) | 16,608 (37.8%) |
Housing Structures by Number of Rooms in Carlsbad
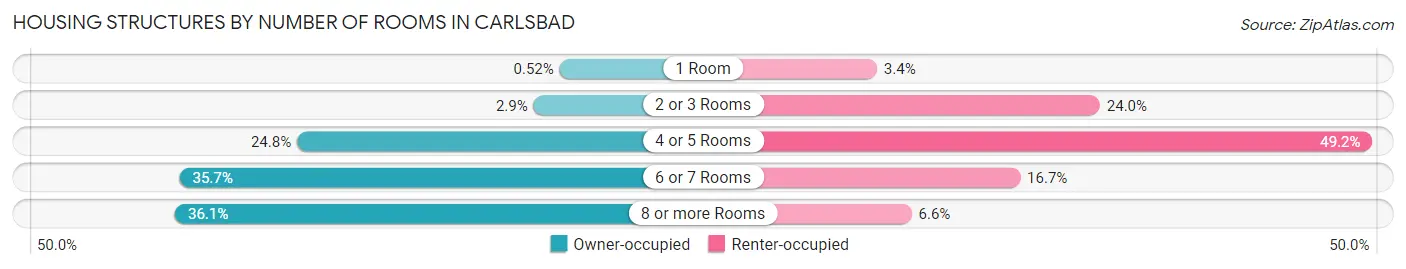
| Number of Rooms | Owner-occupied | Renter-occupied |
| 1 Room | 142 (0.5%) | 568 (3.4%) |
| 2 or 3 Rooms | 799 (2.9%) | 3,993 (24.0%) |
| 4 or 5 Rooms | 6,775 (24.8%) | 8,178 (49.2%) |
| 6 or 7 Rooms | 9,738 (35.7%) | 2,768 (16.7%) |
| 8 or more Rooms | 9,850 (36.1%) | 1,101 (6.6%) |
| Total | 27,304 (100.0%) | 16,608 (100.0%) |
Housing Structure by Heating Type in Carlsbad
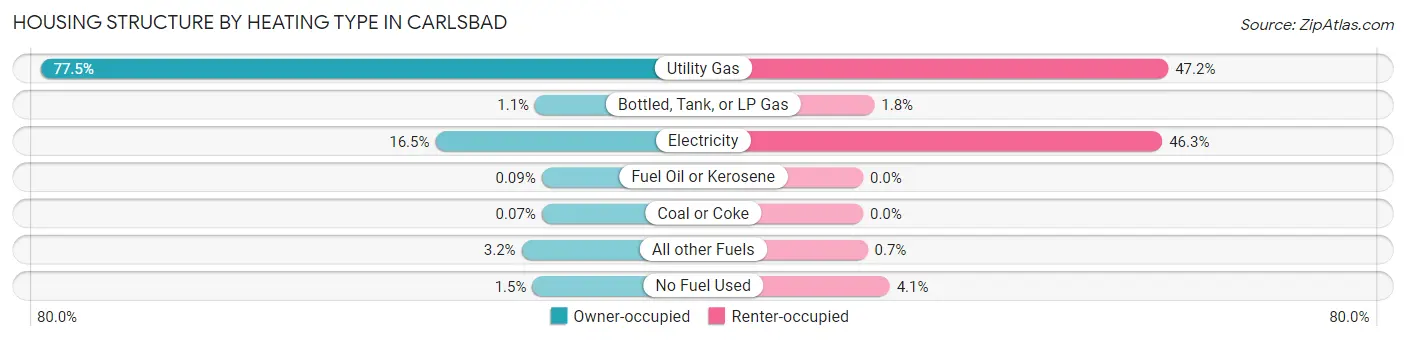
| Heating Type | Owner-occupied | Renter-occupied |
| Utility Gas | 21,170 (77.5%) | 7,835 (47.2%) |
| Bottled, Tank, or LP Gas | 303 (1.1%) | 291 (1.8%) |
| Electricity | 4,507 (16.5%) | 7,682 (46.3%) |
| Fuel Oil or Kerosene | 24 (0.1%) | 0 (0.0%) |
| Coal or Coke | 18 (0.1%) | 0 (0.0%) |
| All other Fuels | 871 (3.2%) | 116 (0.7%) |
| No Fuel Used | 411 (1.5%) | 684 (4.1%) |
| Total | 27,304 (100.0%) | 16,608 (100.0%) |
Household Vehicle Usage in Carlsbad
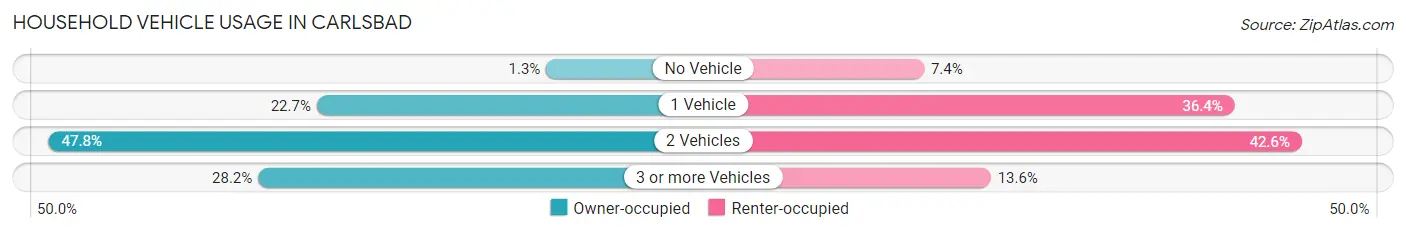
| Vehicles per Household | Owner-occupied | Renter-occupied |
| No Vehicle | 357 (1.3%) | 1,225 (7.4%) |
| 1 Vehicle | 6,207 (22.7%) | 6,042 (36.4%) |
| 2 Vehicles | 13,039 (47.7%) | 7,081 (42.6%) |
| 3 or more Vehicles | 7,701 (28.2%) | 2,260 (13.6%) |
| Total | 27,304 (100.0%) | 16,608 (100.0%) |
Real Estate & Mortgages in Carlsbad
Real Estate and Mortgage Overview in Carlsbad
| Characteristic | Without Mortgage | With Mortgage |
| Housing Units | 7,846 | 19,458 |
| Median Property Value | $973,200 | $1,105,900 |
| Median Household Income | $105,102 | $12,267 |
| Monthly Housing Costs | $919 | $13,017 |
| Real Estate Taxes | $5,029 | $109 |
Property Value by Mortgage Status in Carlsbad
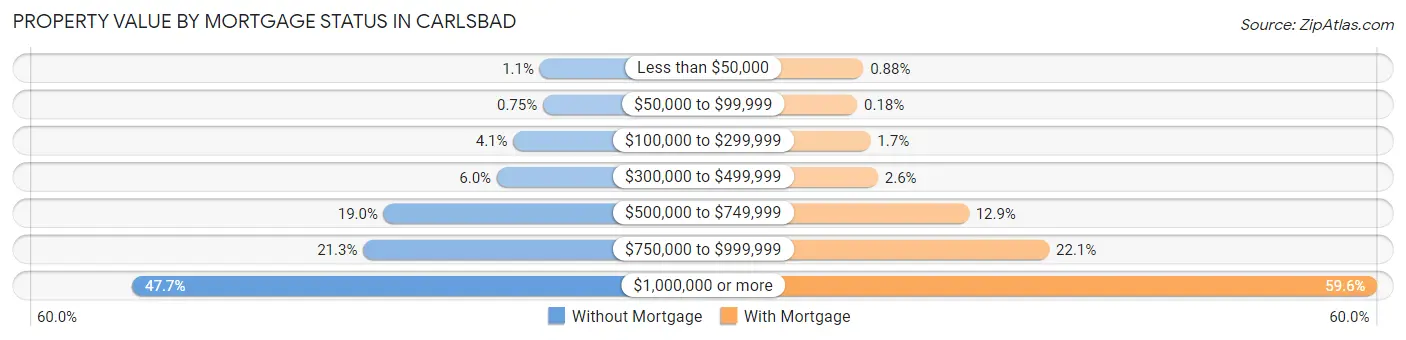
| Property Value | Without Mortgage | With Mortgage |
| Less than $50,000 | 88 (1.1%) | 172 (0.9%) |
| $50,000 to $99,999 | 59 (0.7%) | 35 (0.2%) |
| $100,000 to $299,999 | 325 (4.1%) | 331 (1.7%) |
| $300,000 to $499,999 | 472 (6.0%) | 496 (2.5%) |
| $500,000 to $749,999 | 1,487 (19.0%) | 2,516 (12.9%) |
| $750,000 to $999,999 | 1,671 (21.3%) | 4,304 (22.1%) |
| $1,000,000 or more | 3,744 (47.7%) | 11,604 (59.6%) |
| Total | 7,846 (100.0%) | 19,458 (100.0%) |
Household Income by Mortgage Status in Carlsbad
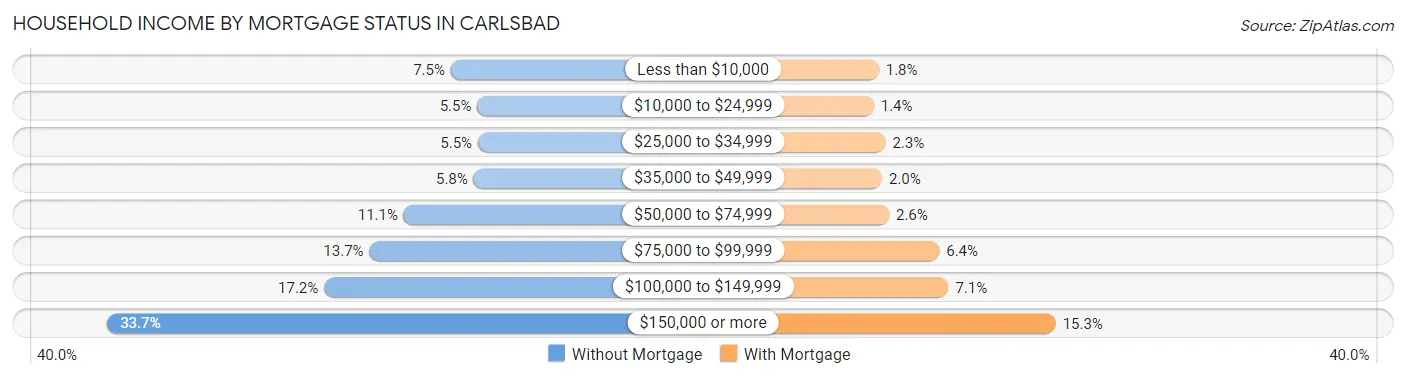
| Household Income | Without Mortgage | With Mortgage |
| Less than $10,000 | 591 (7.5%) | 345 (1.8%) |
| $10,000 to $24,999 | 432 (5.5%) | 271 (1.4%) |
| $25,000 to $34,999 | 428 (5.5%) | 443 (2.3%) |
| $35,000 to $49,999 | 454 (5.8%) | 393 (2.0%) |
| $50,000 to $74,999 | 872 (11.1%) | 497 (2.5%) |
| $75,000 to $99,999 | 1,077 (13.7%) | 1,242 (6.4%) |
| $100,000 to $149,999 | 1,348 (17.2%) | 1,378 (7.1%) |
| $150,000 or more | 2,644 (33.7%) | 2,967 (15.2%) |
| Total | 7,846 (100.0%) | 19,458 (100.0%) |
Property Value to Household Income Ratio in Carlsbad
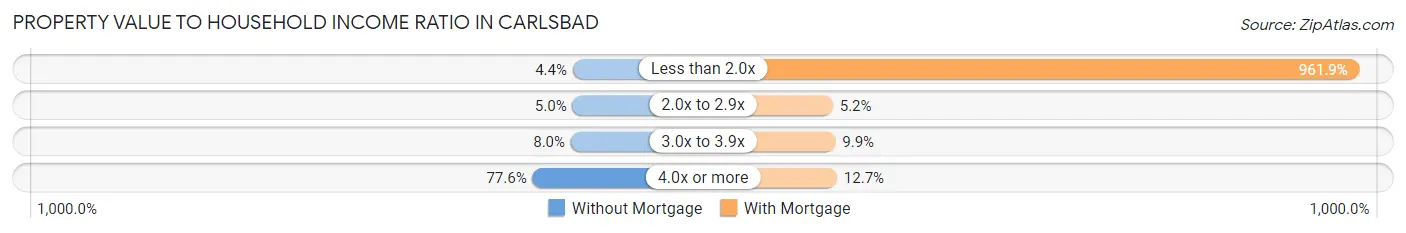
| Value-to-Income Ratio | Without Mortgage | With Mortgage |
| Less than 2.0x | 348 (4.4%) | 187,160 (961.9%) |
| 2.0x to 2.9x | 389 (5.0%) | 1,002 (5.1%) |
| 3.0x to 3.9x | 625 (8.0%) | 1,926 (9.9%) |
| 4.0x or more | 6,090 (77.6%) | 2,475 (12.7%) |
| Total | 7,846 (100.0%) | 19,458 (100.0%) |
Real Estate Taxes by Mortgage Status in Carlsbad
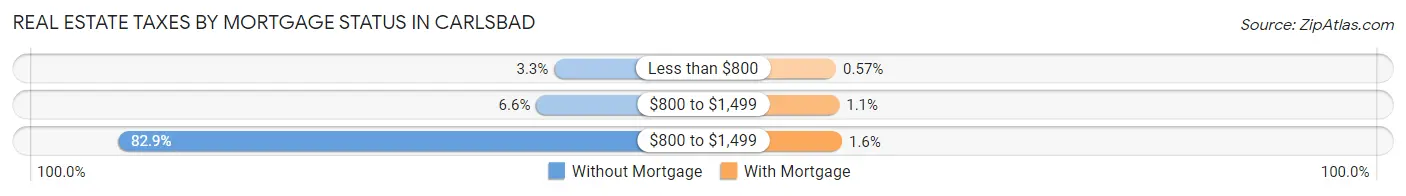
| Property Taxes | Without Mortgage | With Mortgage |
| Less than $800 | 257 (3.3%) | 111 (0.6%) |
| $800 to $1,499 | 514 (6.6%) | 222 (1.1%) |
| $800 to $1,499 | 6,507 (82.9%) | 320 (1.6%) |
| Total | 7,846 (100.0%) | 19,458 (100.0%) |
Health & Disability in Carlsbad
Health Insurance Coverage by Age in Carlsbad
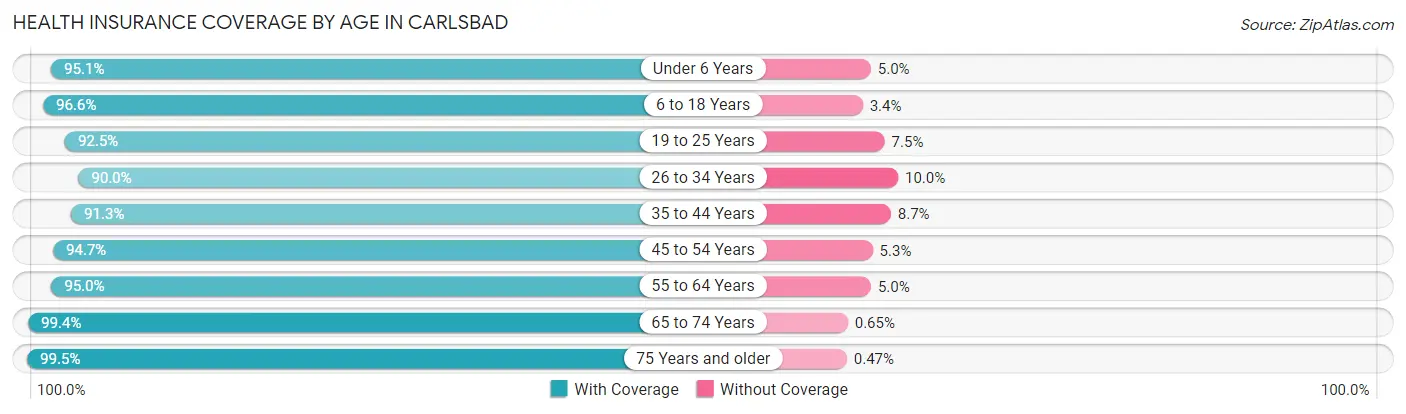
| Age Bracket | With Coverage | Without Coverage |
| Under 6 Years | 5,857 (95.1%) | 305 (5.0%) |
| 6 to 18 Years | 20,612 (96.6%) | 734 (3.4%) |
| 19 to 25 Years | 6,333 (92.5%) | 516 (7.5%) |
| 26 to 34 Years | 9,845 (90.0%) | 1,097 (10.0%) |
| 35 to 44 Years | 14,142 (91.3%) | 1,344 (8.7%) |
| 45 to 54 Years | 15,682 (94.7%) | 876 (5.3%) |
| 55 to 64 Years | 15,130 (95.0%) | 793 (5.0%) |
| 65 to 74 Years | 10,834 (99.4%) | 71 (0.6%) |
| 75 Years and older | 9,193 (99.5%) | 43 (0.5%) |
| Total | 107,628 (94.9%) | 5,779 (5.1%) |
Health Insurance Coverage by Citizenship Status in Carlsbad
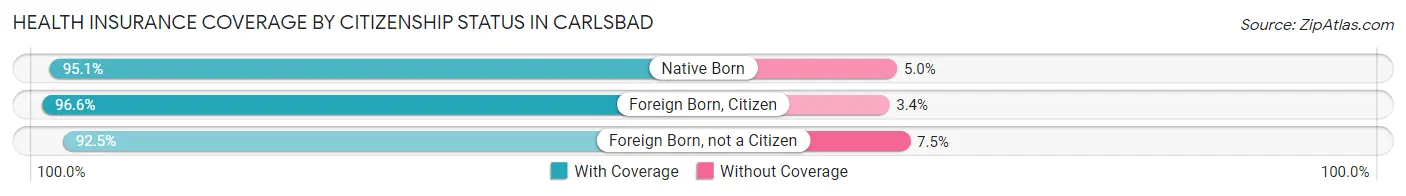
| Citizenship Status | With Coverage | Without Coverage |
| Native Born | 5,857 (95.1%) | 305 (5.0%) |
| Foreign Born, Citizen | 20,612 (96.6%) | 734 (3.4%) |
| Foreign Born, not a Citizen | 6,333 (92.5%) | 516 (7.5%) |
Health Insurance Coverage by Household Income in Carlsbad
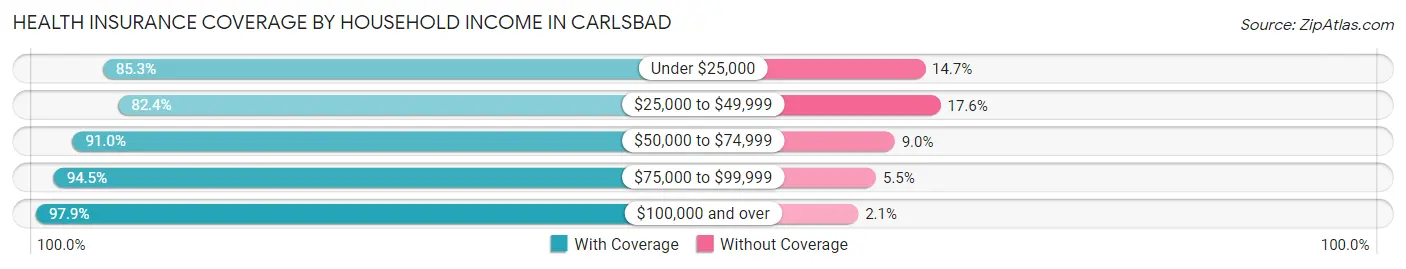
| Household Income | With Coverage | Without Coverage |
| Under $25,000 | 5,746 (85.3%) | 987 (14.7%) |
| $25,000 to $49,999 | 8,495 (82.4%) | 1,809 (17.6%) |
| $50,000 to $74,999 | 8,577 (91.0%) | 846 (9.0%) |
| $75,000 to $99,999 | 7,611 (94.5%) | 441 (5.5%) |
| $100,000 and over | 76,960 (97.9%) | 1,685 (2.1%) |
Public vs Private Health Insurance Coverage by Age in Carlsbad
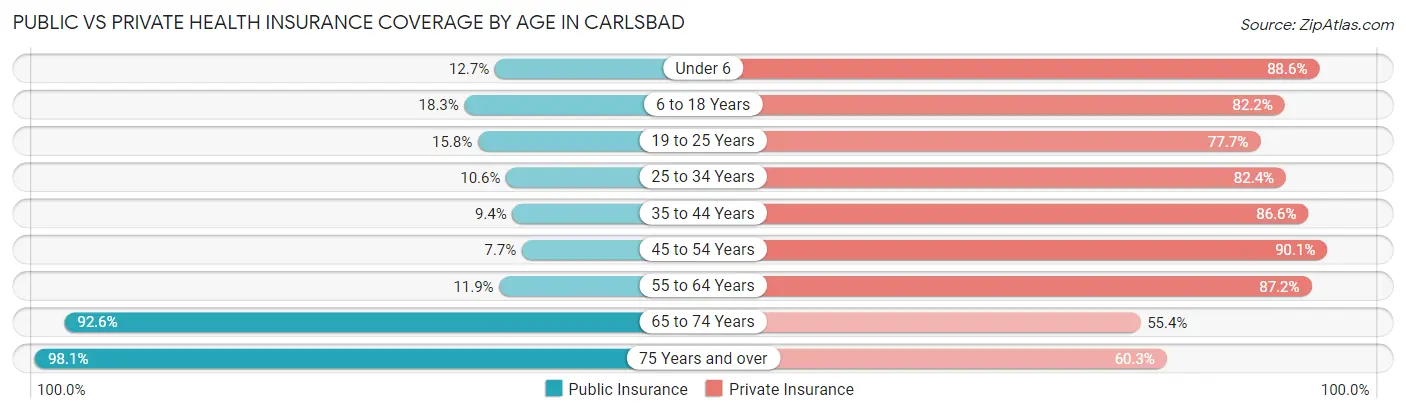
| Age Bracket | Public Insurance | Private Insurance |
| Under 6 | 782 (12.7%) | 5,460 (88.6%) |
| 6 to 18 Years | 3,913 (18.3%) | 17,544 (82.2%) |
| 19 to 25 Years | 1,084 (15.8%) | 5,318 (77.6%) |
| 25 to 34 Years | 1,159 (10.6%) | 9,019 (82.4%) |
| 35 to 44 Years | 1,461 (9.4%) | 13,411 (86.6%) |
| 45 to 54 Years | 1,268 (7.7%) | 14,918 (90.1%) |
| 55 to 64 Years | 1,888 (11.9%) | 13,877 (87.2%) |
| 65 to 74 Years | 10,101 (92.6%) | 6,040 (55.4%) |
| 75 Years and over | 9,058 (98.1%) | 5,569 (60.3%) |
| Total | 30,714 (27.1%) | 91,156 (80.4%) |
Disability Status by Sex by Age in Carlsbad
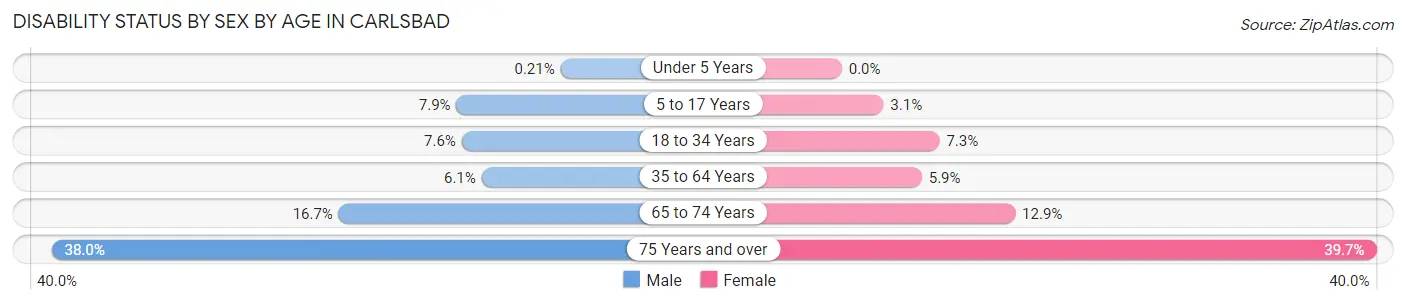
| Age Bracket | Male | Female |
| Under 5 Years | 5 (0.2%) | 0 (0.0%) |
| 5 to 17 Years | 903 (7.9%) | 311 (3.1%) |
| 18 to 34 Years | 748 (7.5%) | 673 (7.2%) |
| 35 to 64 Years | 1,409 (6.1%) | 1,470 (5.9%) |
| 65 to 74 Years | 895 (16.7%) | 713 (12.9%) |
| 75 Years and over | 1,539 (38.0%) | 2,058 (39.7%) |
Disability Class by Sex by Age in Carlsbad
Disability Class: Hearing Difficulty
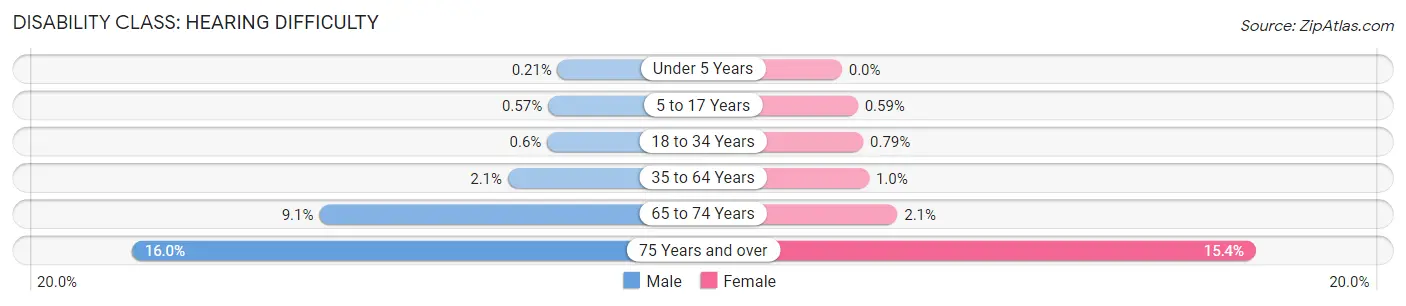
| Age Bracket | Male | Female |
| Under 5 Years | 5 (0.2%) | 0 (0.0%) |
| 5 to 17 Years | 65 (0.6%) | 59 (0.6%) |
| 18 to 34 Years | 59 (0.6%) | 73 (0.8%) |
| 35 to 64 Years | 479 (2.1%) | 251 (1.0%) |
| 65 to 74 Years | 486 (9.1%) | 114 (2.1%) |
| 75 Years and over | 649 (16.0%) | 797 (15.4%) |
Disability Class: Vision Difficulty
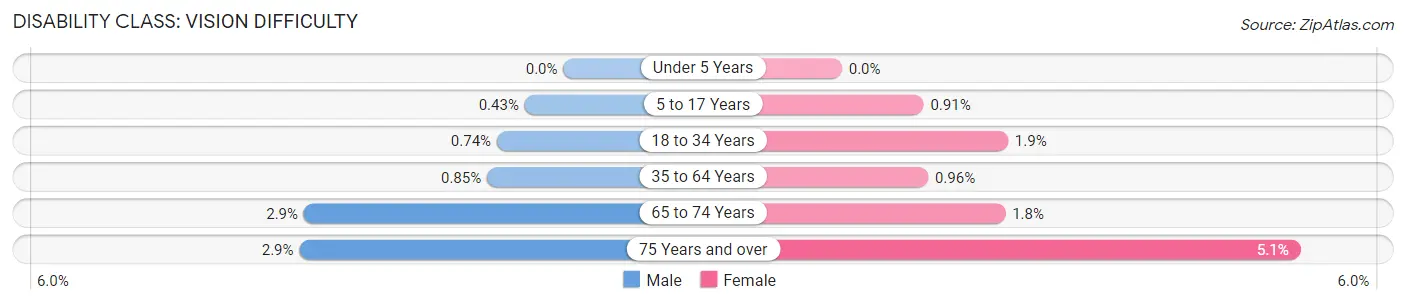
| Age Bracket | Male | Female |
| Under 5 Years | 0 (0.0%) | 0 (0.0%) |
| 5 to 17 Years | 49 (0.4%) | 91 (0.9%) |
| 18 to 34 Years | 73 (0.7%) | 172 (1.8%) |
| 35 to 64 Years | 198 (0.9%) | 237 (1.0%) |
| 65 to 74 Years | 155 (2.9%) | 101 (1.8%) |
| 75 Years and over | 119 (2.9%) | 265 (5.1%) |
Disability Class: Cognitive Difficulty
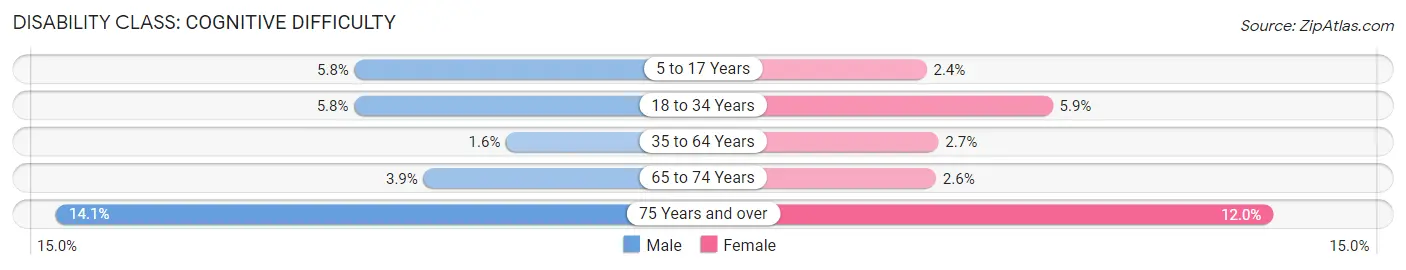
| Age Bracket | Male | Female |
| 5 to 17 Years | 661 (5.8%) | 237 (2.4%) |
| 18 to 34 Years | 576 (5.8%) | 545 (5.9%) |
| 35 to 64 Years | 370 (1.6%) | 665 (2.7%) |
| 65 to 74 Years | 209 (3.9%) | 145 (2.6%) |
| 75 Years and over | 572 (14.1%) | 623 (12.0%) |
Disability Class: Ambulatory Difficulty
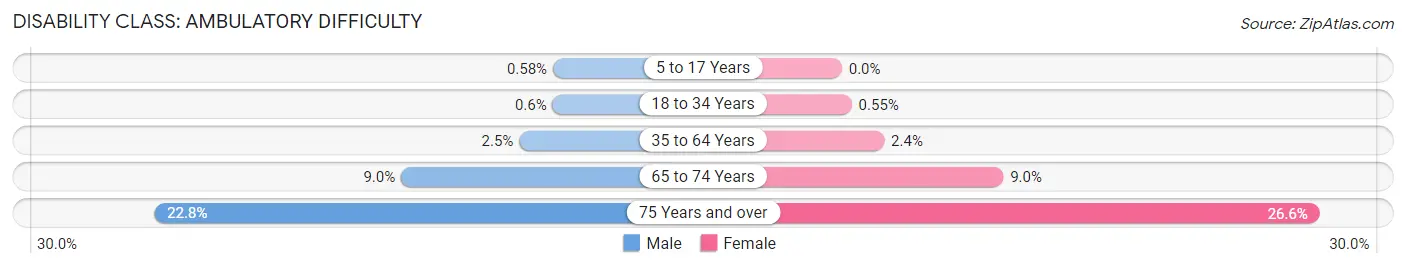
| Age Bracket | Male | Female |
| 5 to 17 Years | 66 (0.6%) | 0 (0.0%) |
| 18 to 34 Years | 59 (0.6%) | 51 (0.5%) |
| 35 to 64 Years | 570 (2.5%) | 584 (2.4%) |
| 65 to 74 Years | 485 (9.0%) | 498 (9.0%) |
| 75 Years and over | 923 (22.8%) | 1,380 (26.6%) |
Disability Class: Self-Care Difficulty
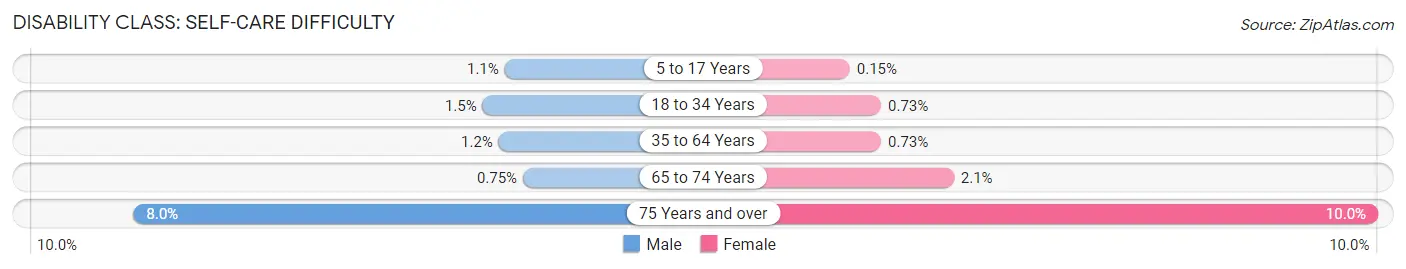
| Age Bracket | Male | Female |
| 5 to 17 Years | 124 (1.1%) | 15 (0.2%) |
| 18 to 34 Years | 149 (1.5%) | 68 (0.7%) |
| 35 to 64 Years | 279 (1.2%) | 181 (0.7%) |
| 65 to 74 Years | 40 (0.7%) | 115 (2.1%) |
| 75 Years and over | 323 (8.0%) | 516 (10.0%) |
Technology Access in Carlsbad
Computing Device Access in Carlsbad
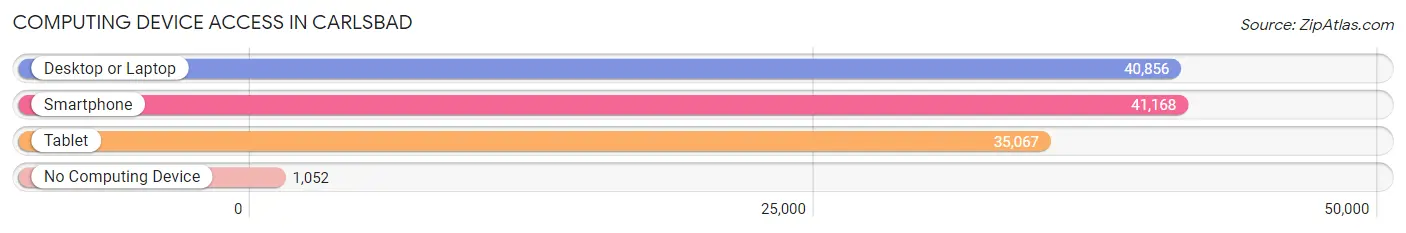
| Device Type | # Households | % Households |
| Desktop or Laptop | 40,856 | 93.0% |
| Smartphone | 41,168 | 93.8% |
| Tablet | 35,067 | 79.9% |
| No Computing Device | 1,052 | 2.4% |
| Total | 43,912 | 100.0% |
Internet Access in Carlsbad
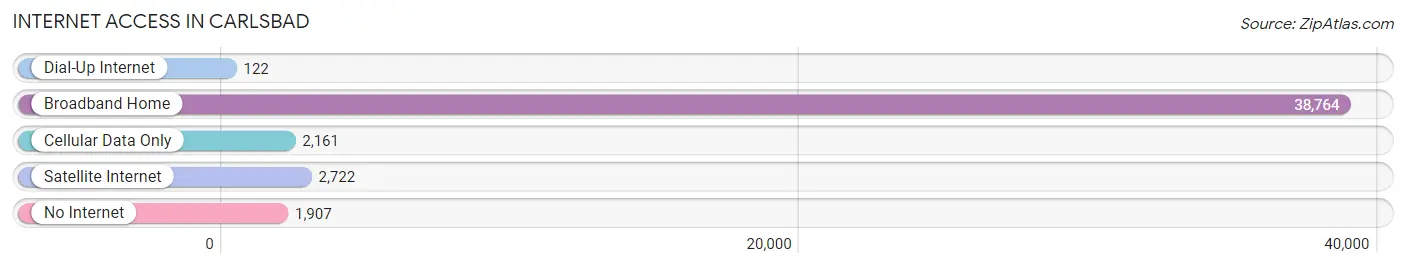
| Internet Type | # Households | % Households |
| Dial-Up Internet | 122 | 0.3% |
| Broadband Home | 38,764 | 88.3% |
| Cellular Data Only | 2,161 | 4.9% |
| Satellite Internet | 2,722 | 6.2% |
| No Internet | 1,907 | 4.3% |
| Total | 43,912 | 100.0% |
Carlsbad Summary
Carlsbad, California is a coastal city located in San Diego County, California. It is situated along the Pacific Ocean, just north of San Diego and south of Orange County. The city is known for its beautiful beaches, its quaint downtown area, and its many attractions.
History
The area that is now Carlsbad was originally inhabited by the Luiseño people, who were part of the Shoshonean tribe. The first European to explore the area was Juan Rodriguez Cabrillo, who sailed up the coast in 1542. The area was later explored by Gaspar de Portola in 1769, and the first mission was established in 1798.
In the mid-1800s, the area was settled by farmers and ranchers, and the town of Carlsbad was founded in 1887. The town was named after the famous spa town of Carlsbad, Czech Republic. The town grew quickly, and by the early 1900s, it had become a popular tourist destination.
In the 1950s, the city began to expand rapidly, and by the 1970s, it had become a major resort destination. The city has continued to grow and develop, and today it is a thriving city with a population of over 110,000.
Geography
Carlsbad is located in San Diego County, California, along the Pacific Ocean. It is situated just north of San Diego and south of Orange County. The city is bordered by the cities of Oceanside to the north, Vista to the east, and Encinitas to the south.
The city has a total area of 39.3 square miles, of which 37.2 square miles is land and 2.1 square miles is water. The city is located on a coastal plain, and is surrounded by hills and mountains. The highest point in the city is Cerro de la Calavera, which has an elevation of 1,073 feet.
Economy
Carlsbad has a strong and diverse economy. The city is home to many large companies, including Legoland California, the Carlsbad Premium Outlets, and the Carlsbad Village Shopping Center. The city is also home to several technology companies, including Sony, Panasonic, and Qualcomm.
The city is also home to several educational institutions, including California State University San Marcos, MiraCosta College, and the University of California San Diego.
Demographics
As of the 2010 census, the population of Carlsbad was 105,328. The racial makeup of the city was 77.3% White, 8.2% Asian, 6.2% Hispanic or Latino, 4.2% African American, and 2.7% from other races.
The median household income in Carlsbad was $90,845, and the median family income was $103,845. The per capita income was $41,845. The city has a high cost of living, with a median home value of $637,000.
Conclusion
Carlsbad, California is a beautiful coastal city located in San Diego County. The city is known for its beautiful beaches, its quaint downtown area, and its many attractions. The city has a strong and diverse economy, and is home to many large companies, educational institutions, and technology companies. The population of Carlsbad is diverse, with a median household income of $90,845 and a median home value of $637,000.
Common Questions
What is Per Capita Income in Carlsbad?
Per Capita income in Carlsbad is $66,944.
What is the Median Family Income in Carlsbad?
Median Family Income in Carlsbad is $161,322.
What is the Median Household income in Carlsbad?
Median Household Income in Carlsbad is $134,139.
What is Income or Wage Gap in Carlsbad?
Income or Wage Gap in Carlsbad is 41.4%.
Women in Carlsbad earn 58.6 cents for every dollar earned by a man.
What is Family Income Deficit in Carlsbad?
Family Income Deficit in Carlsbad is $11,000.
Families that are below poverty line in Carlsbad earn $11,000 less on average than the poverty threshold level.
What is Inequality or Gini Index in Carlsbad?
Inequality or Gini Index in Carlsbad is 0.45.
What is the Total Population of Carlsbad?
Total Population of Carlsbad is 114,745.
What is the Total Male Population of Carlsbad?
Total Male Population of Carlsbad is 57,284.
What is the Total Female Population of Carlsbad?
Total Female Population of Carlsbad is 57,461.
What is the Ratio of Males per 100 Females in Carlsbad?
There are 99.69 Males per 100 Females in Carlsbad.
What is the Ratio of Females per 100 Males in Carlsbad?
There are 100.31 Females per 100 Males in Carlsbad.
What is the Median Population Age in Carlsbad?
Median Population Age in Carlsbad is 42.4 Years.
What is the Average Family Size in Carlsbad
Average Family Size in Carlsbad is 3.1 People.
What is the Average Household Size in Carlsbad
Average Household Size in Carlsbad is 2.6 People.
How Large is the Labor Force in Carlsbad?
There are 59,759 People in the Labor Forcein in Carlsbad.
What is the Percentage of People in the Labor Force in Carlsbad?
65.2% of People are in the Labor Force in Carlsbad.
What is the Unemployment Rate in Carlsbad?
Unemployment Rate in Carlsbad is 6.0%.