Dearborn, MI Map & Demographics
Dearborn Map
Dearborn Overview
$29,174
PER CAPITA INCOME
$74,751
AVG FAMILY INCOME
$64,600
AVG HOUSEHOLD INCOME
18.0%
WAGE / INCOME GAP [ % ]
82.0¢/ $1
WAGE / INCOME GAP [ $ ]
$13,803
FAMILY INCOME DEFICIT
0.46
INEQUALITY / GINI INDEX
108,414
TOTAL POPULATION
54,070
MALE POPULATION
54,344
FEMALE POPULATION
99.50
MALES / 100 FEMALES
100.51
FEMALES / 100 MALES
32.3
MEDIAN AGE
3.9
AVG FAMILY SIZE
3.0
AVG HOUSEHOLD SIZE
46,214
LABOR FORCE [ PEOPLE ]
56.7%
PERCENT IN LABOR FORCE
6.8%
UNEMPLOYMENT RATE
Dearborn Area Codes
Income in Dearborn
Income Overview in Dearborn
Per Capita Income in Dearborn is $29,174, while median incomes of families and households are $74,751 and $64,600 respectively.
| Characteristic | Number | Measure |
| Per Capita Income | 108,414 | $29,174 |
| Median Family Income | 23,816 | $74,751 |
| Mean Family Income | 23,816 | $97,402 |
| Median Household Income | 35,968 | $64,600 |
| Mean Household Income | 35,968 | $85,201 |
| Income Deficit | 23,816 | $13,803 |
| Wage / Income Gap (%) | 108,414 | 17.95% |
| Wage / Income Gap ($) | 108,414 | 82.05¢ per $1 |
| Gini / Inequality Index | 108,414 | 0.46 |
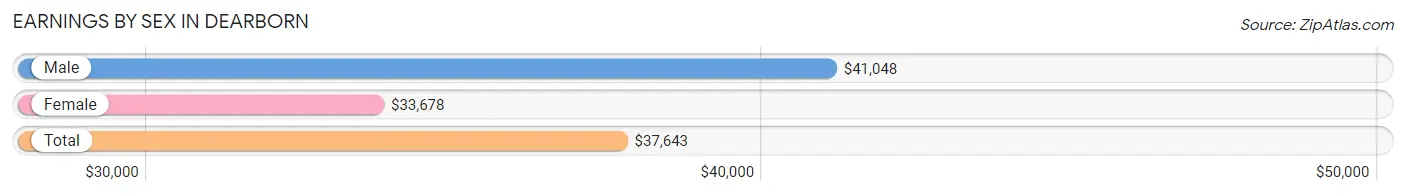
Earnings by Sex in Dearborn
Average Earnings in Dearborn are $37,643, $41,048 for men and $33,678 for women, a difference of 17.9%.
| Sex | Number | Average Earnings |
| Male | 28,000 (58.5%) | $41,048 |
| Female | 19,873 (41.5%) | $33,678 |
| Total | 47,873 (100.0%) | $37,643 |
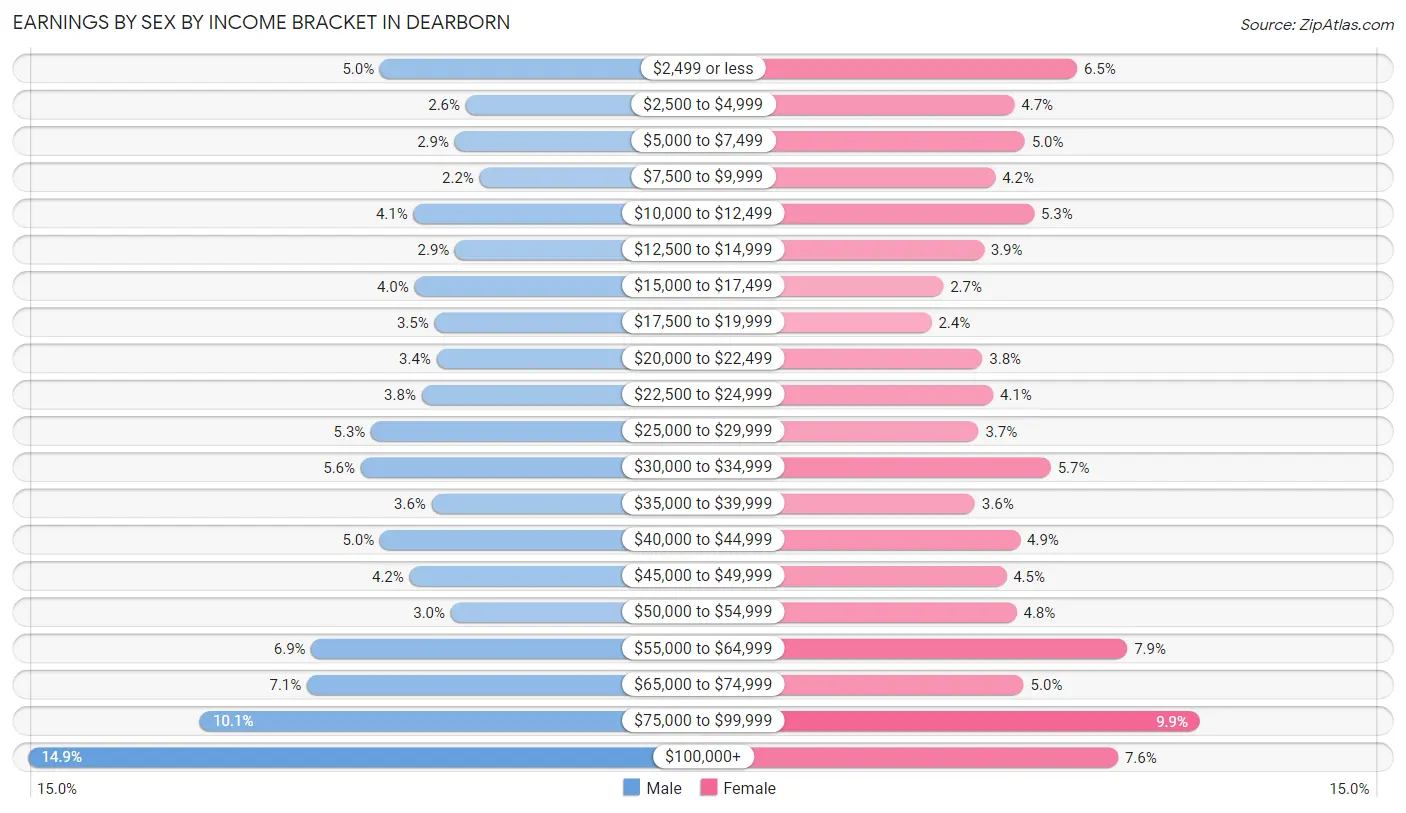
Earnings by Sex by Income Bracket in Dearborn
The most common earnings brackets in Dearborn are $100,000+ for men (4,169 | 14.9%) and $75,000 to $99,999 for women (1,971 | 9.9%).
| Income | Male | Female |
| $2,499 or less | 1,402 (5.0%) | 1,286 (6.5%) |
| $2,500 to $4,999 | 729 (2.6%) | 936 (4.7%) |
| $5,000 to $7,499 | 814 (2.9%) | 993 (5.0%) |
| $7,500 to $9,999 | 620 (2.2%) | 828 (4.2%) |
| $10,000 to $12,499 | 1,139 (4.1%) | 1,045 (5.3%) |
| $12,500 to $14,999 | 811 (2.9%) | 766 (3.8%) |
| $15,000 to $17,499 | 1,131 (4.0%) | 539 (2.7%) |
| $17,500 to $19,999 | 974 (3.5%) | 473 (2.4%) |
| $20,000 to $22,499 | 957 (3.4%) | 757 (3.8%) |
| $22,500 to $24,999 | 1,074 (3.8%) | 816 (4.1%) |
| $25,000 to $29,999 | 1,472 (5.3%) | 736 (3.7%) |
| $30,000 to $34,999 | 1,553 (5.6%) | 1,139 (5.7%) |
| $35,000 to $39,999 | 997 (3.6%) | 716 (3.6%) |
| $40,000 to $44,999 | 1,403 (5.0%) | 968 (4.9%) |
| $45,000 to $49,999 | 1,170 (4.2%) | 890 (4.5%) |
| $50,000 to $54,999 | 845 (3.0%) | 947 (4.8%) |
| $55,000 to $64,999 | 1,944 (6.9%) | 1,565 (7.9%) |
| $65,000 to $74,999 | 1,976 (7.1%) | 988 (5.0%) |
| $75,000 to $99,999 | 2,820 (10.1%) | 1,971 (9.9%) |
| $100,000+ | 4,169 (14.9%) | 1,514 (7.6%) |
| Total | 28,000 (100.0%) | 19,873 (100.0%) |
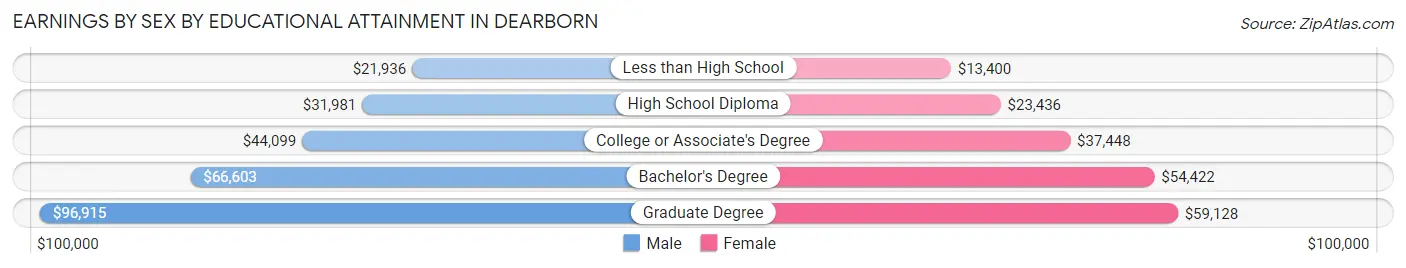
Earnings by Sex by Educational Attainment in Dearborn
Average earnings in Dearborn are $47,886 for men and $41,942 for women, a difference of 12.4%. Men with an educational attainment of graduate degree enjoy the highest average annual earnings of $96,915, while those with less than high school education earn the least with $21,936. Women with an educational attainment of graduate degree earn the most with the average annual earnings of $59,128, while those with less than high school education have the smallest earnings of $13,400.
| Educational Attainment | Male Income | Female Income |
| Less than High School | $21,936 | $13,400 |
| High School Diploma | $31,981 | $23,436 |
| College or Associate's Degree | $44,099 | $37,448 |
| Bachelor's Degree | $66,603 | $54,422 |
| Graduate Degree | $96,915 | $59,128 |
| Total | $47,886 | $41,942 |
Family Income in Dearborn
Family Income Brackets in Dearborn
According to the Dearborn family income data, there are 4,120 families falling into the $100,000 to $149,999 income range, which is the most common income bracket and makes up 17.3% of all families. Conversely, the $10,000 to $14,999 income bracket is the least frequent group with only 619 families (2.6%) belonging to this category.
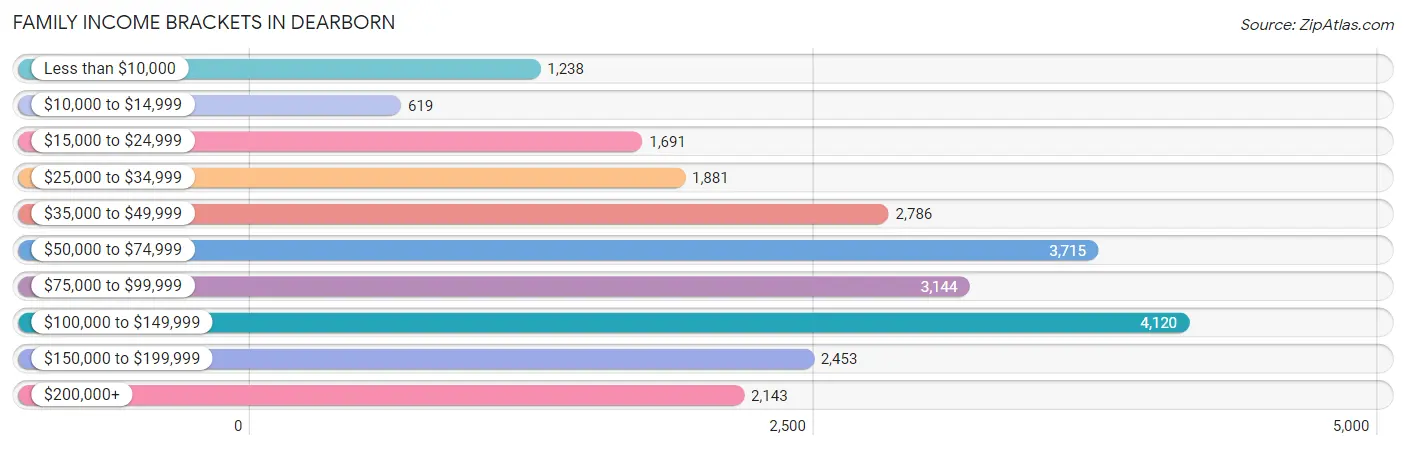
| Income Bracket | # Families | % Families |
| Less than $10,000 | 1,238 | 5.2% |
| $10,000 to $14,999 | 619 | 2.6% |
| $15,000 to $24,999 | 1,691 | 7.1% |
| $25,000 to $34,999 | 1,881 | 7.9% |
| $35,000 to $49,999 | 2,786 | 11.7% |
| $50,000 to $74,999 | 3,715 | 15.6% |
| $75,000 to $99,999 | 3,144 | 13.2% |
| $100,000 to $149,999 | 4,120 | 17.3% |
| $150,000 to $199,999 | 2,453 | 10.3% |
| $200,000+ | 2,143 | 9.0% |
Family Income by Famaliy Size in Dearborn
3-person families (4,820 | 20.2%) account for the highest median family income in Dearborn with $85,317 per family, while 2-person families (7,992 | 33.6%) have the highest median income of $40,786 per family member.
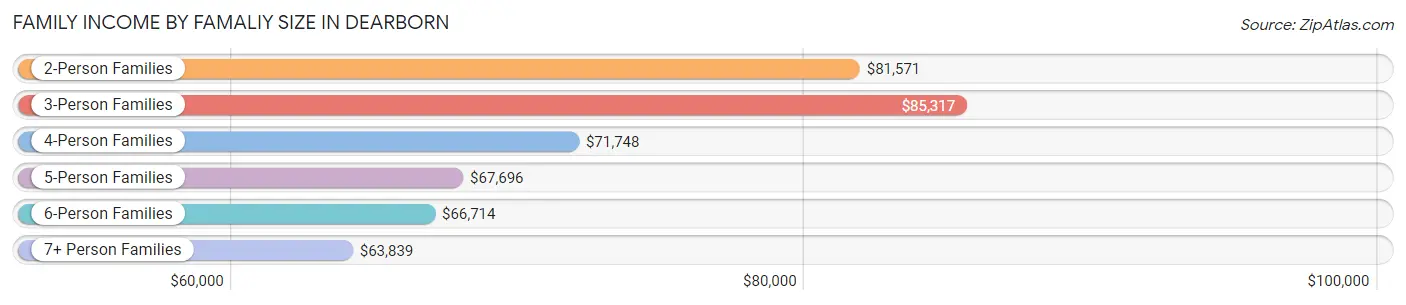
| Income Bracket | # Families | Median Income |
| 2-Person Families | 7,992 (33.6%) | $81,571 |
| 3-Person Families | 4,820 (20.2%) | $85,317 |
| 4-Person Families | 4,034 (16.9%) | $71,748 |
| 5-Person Families | 3,164 (13.3%) | $67,696 |
| 6-Person Families | 2,104 (8.8%) | $66,714 |
| 7+ Person Families | 1,702 (7.1%) | $63,839 |
| Total | 23,816 (100.0%) | $74,751 |
Family Income by Number of Earners in Dearborn
The median family income in Dearborn is $74,751, with families comprising 3+ earners (3,271) having the highest median family income of $136,955, while families with no earners (3,160) have the lowest median family income of $39,231, accounting for 13.7% and 13.3% of families, respectively.
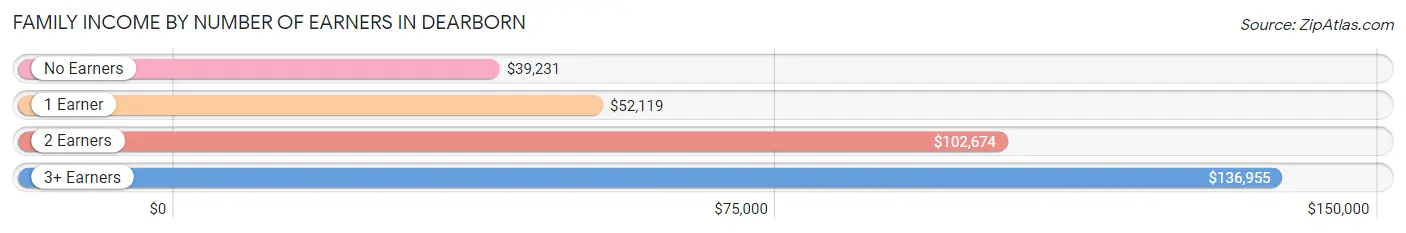
| Number of Earners | # Families | Median Income |
| No Earners | 3,160 (13.3%) | $39,231 |
| 1 Earner | 9,406 (39.5%) | $52,119 |
| 2 Earners | 7,979 (33.5%) | $102,674 |
| 3+ Earners | 3,271 (13.7%) | $136,955 |
| Total | 23,816 (100.0%) | $74,751 |
Household Income in Dearborn
Household Income Brackets in Dearborn
With 5,863 households falling in the category, the $50,000 to $74,999 income range is the most frequent in Dearborn, accounting for 16.3% of all households. In contrast, only 1,511 households (4.2%) fall into the $10,000 to $14,999 income bracket, making it the least populous group.
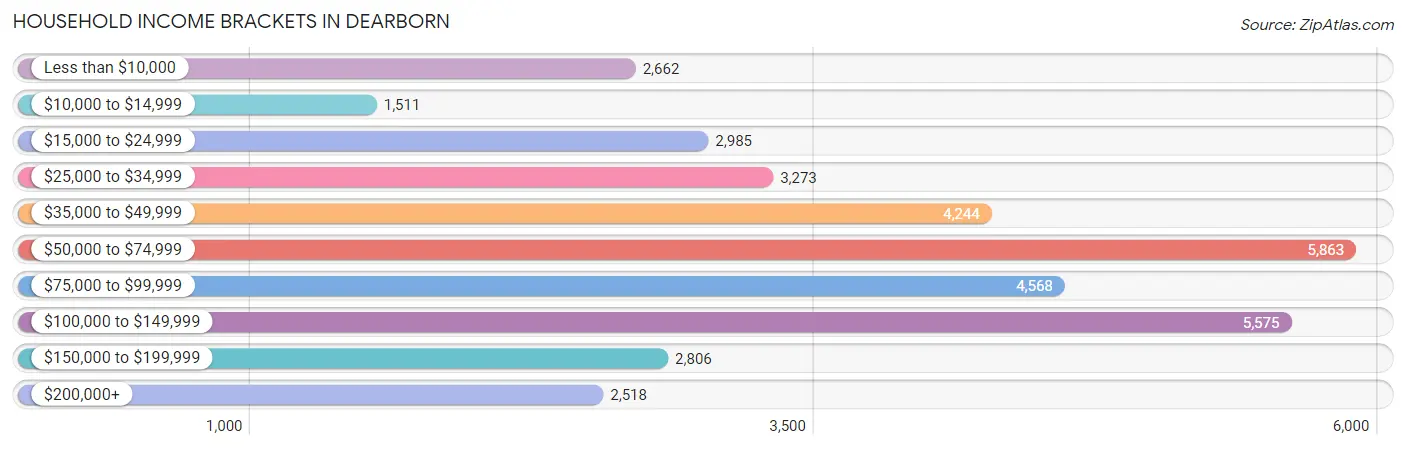
| Income Bracket | # Households | % Households |
| Less than $10,000 | 2,662 | 7.4% |
| $10,000 to $14,999 | 1,511 | 4.2% |
| $15,000 to $24,999 | 2,985 | 8.3% |
| $25,000 to $34,999 | 3,273 | 9.1% |
| $35,000 to $49,999 | 4,244 | 11.8% |
| $50,000 to $74,999 | 5,863 | 16.3% |
| $75,000 to $99,999 | 4,568 | 12.7% |
| $100,000 to $149,999 | 5,575 | 15.5% |
| $150,000 to $199,999 | 2,806 | 7.8% |
| $200,000+ | 2,518 | 7.0% |
Household Income by Householder Age in Dearborn
The median household income in Dearborn is $64,600, with the highest median household income of $80,202 found in the 45 to 64 years age bracket for the primary householder. A total of 13,678 households (38.0%) fall into this category. Meanwhile, the 15 to 24 years age bracket for the primary householder has the lowest median household income of $18,790, with 1,254 households (3.5%) in this group.
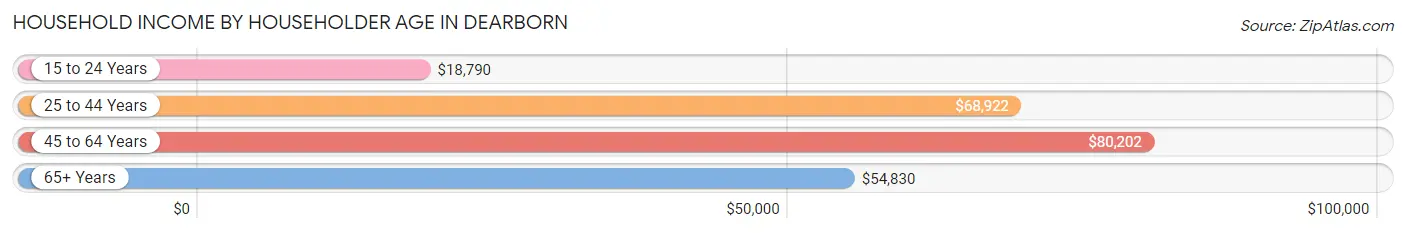
| Income Bracket | # Households | Median Income |
| 15 to 24 Years | 1,254 (3.5%) | $18,790 |
| 25 to 44 Years | 12,029 (33.4%) | $68,922 |
| 45 to 64 Years | 13,678 (38.0%) | $80,202 |
| 65+ Years | 9,007 (25.0%) | $54,830 |
| Total | 35,968 (100.0%) | $64,600 |
Poverty in Dearborn
Income Below Poverty by Sex and Age in Dearborn
With 22.6% poverty level for males and 24.7% for females among the residents of Dearborn, 12 to 14 year old males and 15 year old females are the most vulnerable to poverty, with 1,725 males (47.4%) and 438 females (48.8%) in their respective age groups living below the poverty level.
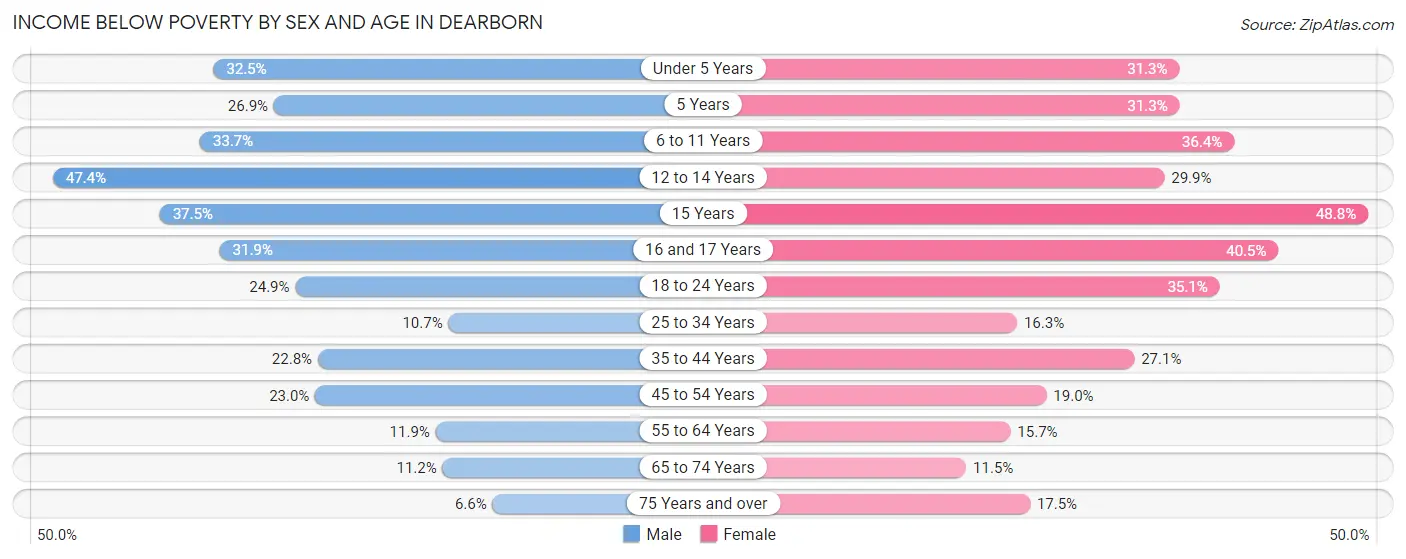
| Age Bracket | Male | Female |
| Under 5 Years | 1,140 (32.5%) | 1,169 (31.3%) |
| 5 Years | 199 (26.9%) | 220 (31.3%) |
| 6 to 11 Years | 1,739 (33.7%) | 1,783 (36.4%) |
| 12 to 14 Years | 1,725 (47.4%) | 774 (29.9%) |
| 15 Years | 363 (37.5%) | 438 (48.8%) |
| 16 and 17 Years | 588 (31.9%) | 916 (40.5%) |
| 18 to 24 Years | 1,500 (24.9%) | 1,887 (35.1%) |
| 25 to 34 Years | 881 (10.7%) | 1,208 (16.3%) |
| 35 to 44 Years | 1,316 (22.8%) | 1,933 (27.1%) |
| 45 to 54 Years | 1,495 (23.0%) | 1,112 (19.0%) |
| 55 to 64 Years | 652 (11.8%) | 864 (15.7%) |
| 65 to 74 Years | 430 (11.2%) | 536 (11.5%) |
| 75 Years and over | 139 (6.6%) | 551 (17.5%) |
| Total | 12,167 (22.6%) | 13,391 (24.7%) |
Income Above Poverty by Sex and Age in Dearborn
According to the poverty statistics in Dearborn, males aged 75 years and over and females aged 65 to 74 years are the age groups that are most secure financially, with 93.4% of males and 88.5% of females in these age groups living above the poverty line.
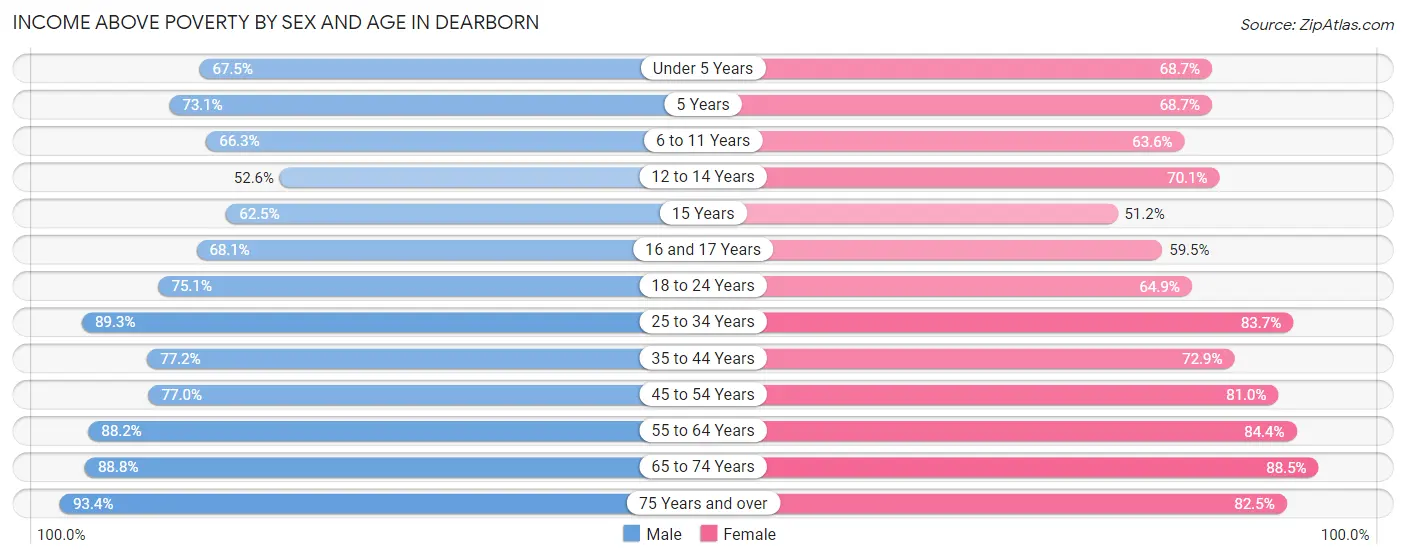
| Age Bracket | Male | Female |
| Under 5 Years | 2,370 (67.5%) | 2,563 (68.7%) |
| 5 Years | 542 (73.1%) | 482 (68.7%) |
| 6 to 11 Years | 3,417 (66.3%) | 3,114 (63.6%) |
| 12 to 14 Years | 1,916 (52.6%) | 1,812 (70.1%) |
| 15 Years | 606 (62.5%) | 459 (51.2%) |
| 16 and 17 Years | 1,255 (68.1%) | 1,345 (59.5%) |
| 18 to 24 Years | 4,531 (75.1%) | 3,494 (64.9%) |
| 25 to 34 Years | 7,384 (89.3%) | 6,220 (83.7%) |
| 35 to 44 Years | 4,461 (77.2%) | 5,190 (72.9%) |
| 45 to 54 Years | 4,996 (77.0%) | 4,745 (81.0%) |
| 55 to 64 Years | 4,851 (88.1%) | 4,658 (84.4%) |
| 65 to 74 Years | 3,405 (88.8%) | 4,108 (88.5%) |
| 75 Years and over | 1,976 (93.4%) | 2,605 (82.5%) |
| Total | 41,710 (77.4%) | 40,795 (75.3%) |
Income Below Poverty Among Married-Couple Families in Dearborn
The poverty statistics for married-couple families in Dearborn show that 17.5% or 3,259 of the total 18,568 families live below the poverty line. Families with 5 or more children have the highest poverty rate of 56.2%, comprising of 363 families. On the other hand, families with no children have the lowest poverty rate of 5.7%, which includes 479 families.
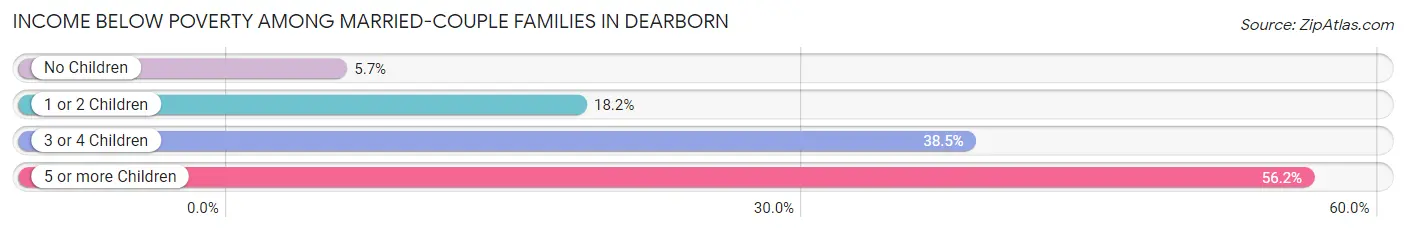
| Children | Above Poverty | Below Poverty |
| No Children | 7,907 (94.3%) | 479 (5.7%) |
| 1 or 2 Children | 5,061 (81.8%) | 1,128 (18.2%) |
| 3 or 4 Children | 2,058 (61.5%) | 1,289 (38.5%) |
| 5 or more Children | 283 (43.8%) | 363 (56.2%) |
| Total | 15,309 (82.5%) | 3,259 (17.5%) |
Income Below Poverty Among Single-Parent Households in Dearborn
According to the poverty data in Dearborn, 15.1% or 261 single-father households and 26.7% or 940 single-mother households are living below the poverty line. Among single-father households, those with 3 or 4 children have the highest poverty rate, with 77 households (58.8%) experiencing poverty. Likewise, among single-mother households, those with 5 or more children have the highest poverty rate, with 49 households (77.8%) falling below the poverty line.
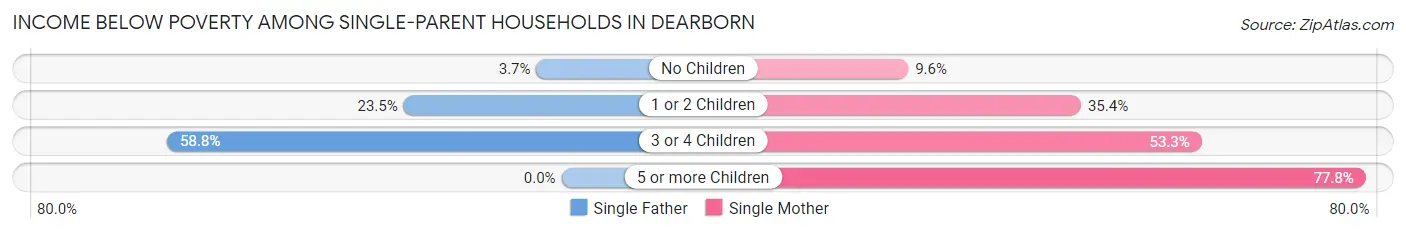
| Children | Single Father | Single Mother |
| No Children | 36 (3.7%) | 153 (9.6%) |
| 1 or 2 Children | 148 (23.5%) | 506 (35.4%) |
| 3 or 4 Children | 77 (58.8%) | 232 (53.3%) |
| 5 or more Children | 0 (0.0%) | 49 (77.8%) |
| Total | 261 (15.1%) | 940 (26.7%) |
Income Below Poverty Among Married-Couple vs Single-Parent Households in Dearborn
The poverty data for Dearborn shows that 3,259 of the married-couple family households (17.5%) and 1,201 of the single-parent households (22.9%) are living below the poverty level. Within the married-couple family households, those with 5 or more children have the highest poverty rate, with 363 households (56.2%) falling below the poverty line. Among the single-parent households, those with 5 or more children have the highest poverty rate, with 49 household (72.1%) living below poverty.
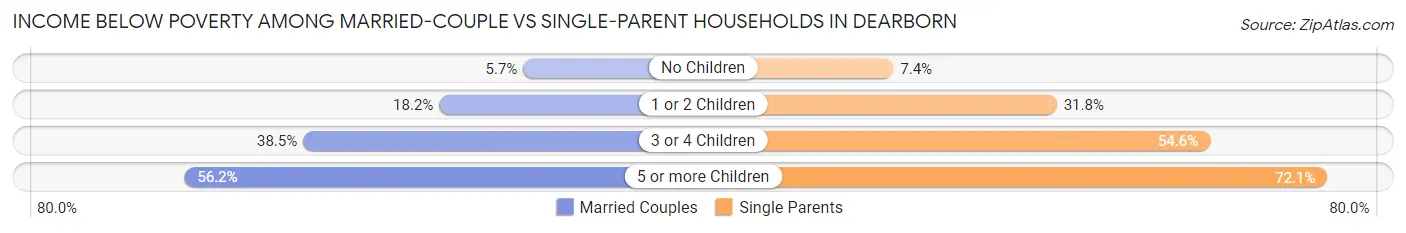
| Children | Married-Couple Families | Single-Parent Households |
| No Children | 479 (5.7%) | 189 (7.4%) |
| 1 or 2 Children | 1,128 (18.2%) | 654 (31.8%) |
| 3 or 4 Children | 1,289 (38.5%) | 309 (54.6%) |
| 5 or more Children | 363 (56.2%) | 49 (72.1%) |
| Total | 3,259 (17.5%) | 1,201 (22.9%) |
Race in Dearborn
The most populous races in Dearborn are White / Caucasian (95,356 | 88.0%), Two or more Races (5,587 | 5.1%), and Black / African American (3,558 | 3.3%).
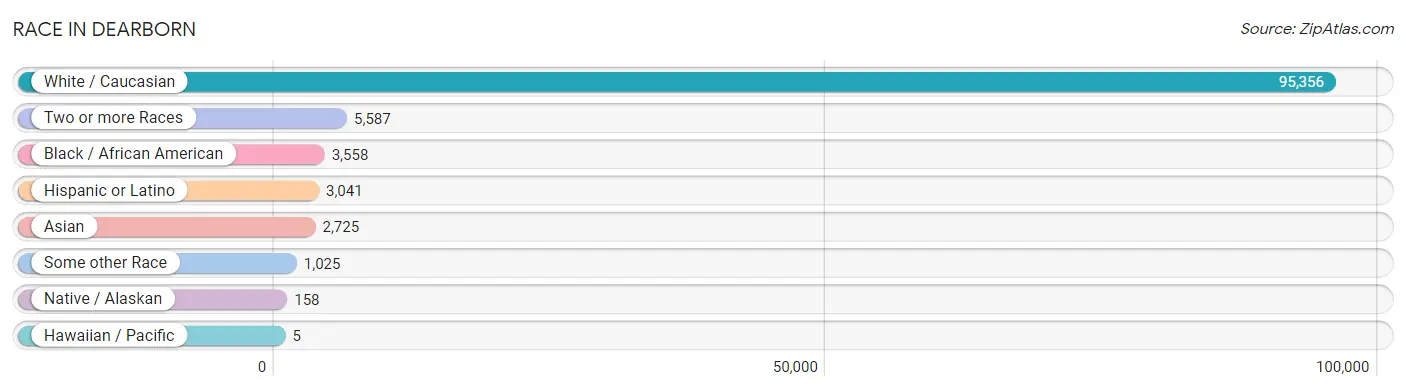
| Race | # Population | % Population |
| Asian | 2,725 | 2.5% |
| Black / African American | 3,558 | 3.3% |
| Hawaiian / Pacific | 5 | 0.0% |
| Hispanic or Latino | 3,041 | 2.8% |
| Native / Alaskan | 158 | 0.2% |
| White / Caucasian | 95,356 | 88.0% |
| Two or more Races | 5,587 | 5.1% |
| Some other Race | 1,025 | 0.9% |
| Total | 108,414 | 100.0% |
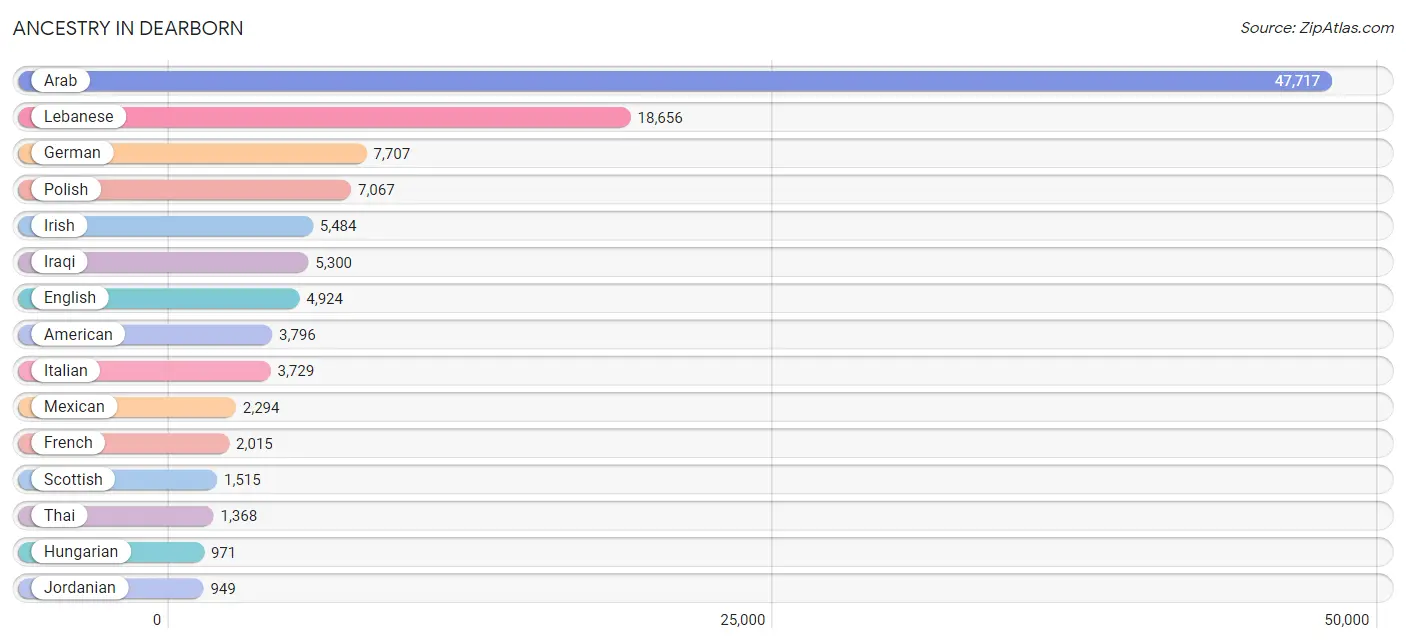
Ancestry in Dearborn
The most populous ancestries reported in Dearborn are Arab (47,717 | 44.0%), Lebanese (18,656 | 17.2%), German (7,707 | 7.1%), Polish (7,067 | 6.5%), and Irish (5,484 | 5.1%), together accounting for 79.9% of all Dearborn residents.
| Ancestry | # Population | % Population |
| Afghan | 74 | 0.1% |
| African | 182 | 0.2% |
| Albanian | 379 | 0.4% |
| American | 3,796 | 3.5% |
| Arab | 47,717 | 44.0% |
| Armenian | 244 | 0.2% |
| Assyrian / Chaldean / Syriac | 25 | 0.0% |
| Austrian | 115 | 0.1% |
| Belgian | 121 | 0.1% |
| Bhutanese | 44 | 0.0% |
| Blackfeet | 35 | 0.0% |
| Brazilian | 11 | 0.0% |
| British | 368 | 0.3% |
| Bulgarian | 21 | 0.0% |
| Burmese | 177 | 0.2% |
| Canadian | 171 | 0.2% |
| Carpatho Rusyn | 10 | 0.0% |
| Celtic | 40 | 0.0% |
| Central American | 9 | 0.0% |
| Cherokee | 39 | 0.0% |
| Chippewa | 150 | 0.1% |
| Colombian | 78 | 0.1% |
| Croatian | 258 | 0.2% |
| Cuban | 104 | 0.1% |
| Czech | 134 | 0.1% |
| Czechoslovakian | 67 | 0.1% |
| Danish | 125 | 0.1% |
| Dominican | 177 | 0.2% |
| Dutch | 530 | 0.5% |
| Dutch West Indian | 10 | 0.0% |
| Eastern European | 169 | 0.2% |
| Egyptian | 58 | 0.1% |
| English | 4,924 | 4.5% |
| Ethiopian | 151 | 0.1% |
| European | 575 | 0.5% |
| Filipino | 66 | 0.1% |
| Finnish | 230 | 0.2% |
| French | 2,015 | 1.9% |
| French American Indian | 11 | 0.0% |
| French Canadian | 841 | 0.8% |
| German | 7,707 | 7.1% |
| Ghanaian | 19 | 0.0% |
| Greek | 467 | 0.4% |
| Guamanian / Chamorro | 25 | 0.0% |
| Haitian | 4 | 0.0% |
| Honduran | 9 | 0.0% |
| Hungarian | 971 | 0.9% |
| Icelander | 13 | 0.0% |
| Indian (Asian) | 625 | 0.6% |
| Inupiat | 9 | 0.0% |
| Iranian | 100 | 0.1% |
| Iraqi | 5,300 | 4.9% |
| Irish | 5,484 | 5.1% |
| Iroquois | 22 | 0.0% |
| Israeli | 34 | 0.0% |
| Italian | 3,729 | 3.4% |
| Jamaican | 7 | 0.0% |
| Japanese | 26 | 0.0% |
| Jordanian | 949 | 0.9% |
| Korean | 263 | 0.2% |
| Lebanese | 18,656 | 17.2% |
| Lithuanian | 833 | 0.8% |
| Lumbee | 38 | 0.0% |
| Luxembourger | 5 | 0.0% |
| Macedonian | 215 | 0.2% |
| Malaysian | 12 | 0.0% |
| Maltese | 434 | 0.4% |
| Menominee | 124 | 0.1% |
| Mexican | 2,294 | 2.1% |
| Mexican American Indian | 45 | 0.0% |
| Mongolian | 5 | 0.0% |
| Moroccan | 310 | 0.3% |
| Native Hawaiian | 25 | 0.0% |
| Navajo | 46 | 0.0% |
| Nigerian | 117 | 0.1% |
| Northern European | 87 | 0.1% |
| Norwegian | 430 | 0.4% |
| Ottawa | 75 | 0.1% |
| Palestinian | 939 | 0.9% |
| Peruvian | 16 | 0.0% |
| Polish | 7,067 | 6.5% |
| Portuguese | 63 | 0.1% |
| Potawatomi | 12 | 0.0% |
| Pueblo | 17 | 0.0% |
| Puerto Rican | 206 | 0.2% |
| Romanian | 114 | 0.1% |
| Russian | 247 | 0.2% |
| Samoan | 25 | 0.0% |
| Scandinavian | 94 | 0.1% |
| Scotch-Irish | 331 | 0.3% |
| Scottish | 1,515 | 1.4% |
| Serbian | 35 | 0.0% |
| Slavic | 32 | 0.0% |
| Slovak | 120 | 0.1% |
| Slovene | 9 | 0.0% |
| South American | 103 | 0.1% |
| South American Indian | 8 | 0.0% |
| Spaniard | 72 | 0.1% |
| Spanish | 52 | 0.1% |
| Sri Lankan | 166 | 0.2% |
| Subsaharan African | 513 | 0.5% |
| Sudanese | 8 | 0.0% |
| Swedish | 389 | 0.4% |
| Swiss | 133 | 0.1% |
| Syrian | 820 | 0.8% |
| Thai | 1,368 | 1.3% |
| Tongan | 19 | 0.0% |
| Turkish | 17 | 0.0% |
| Ukrainian | 532 | 0.5% |
| Venezuelan | 5 | 0.0% |
| Vietnamese | 66 | 0.1% |
| Welsh | 182 | 0.2% |
| Yugoslavian | 67 | 0.1% | View All 113 Rows |
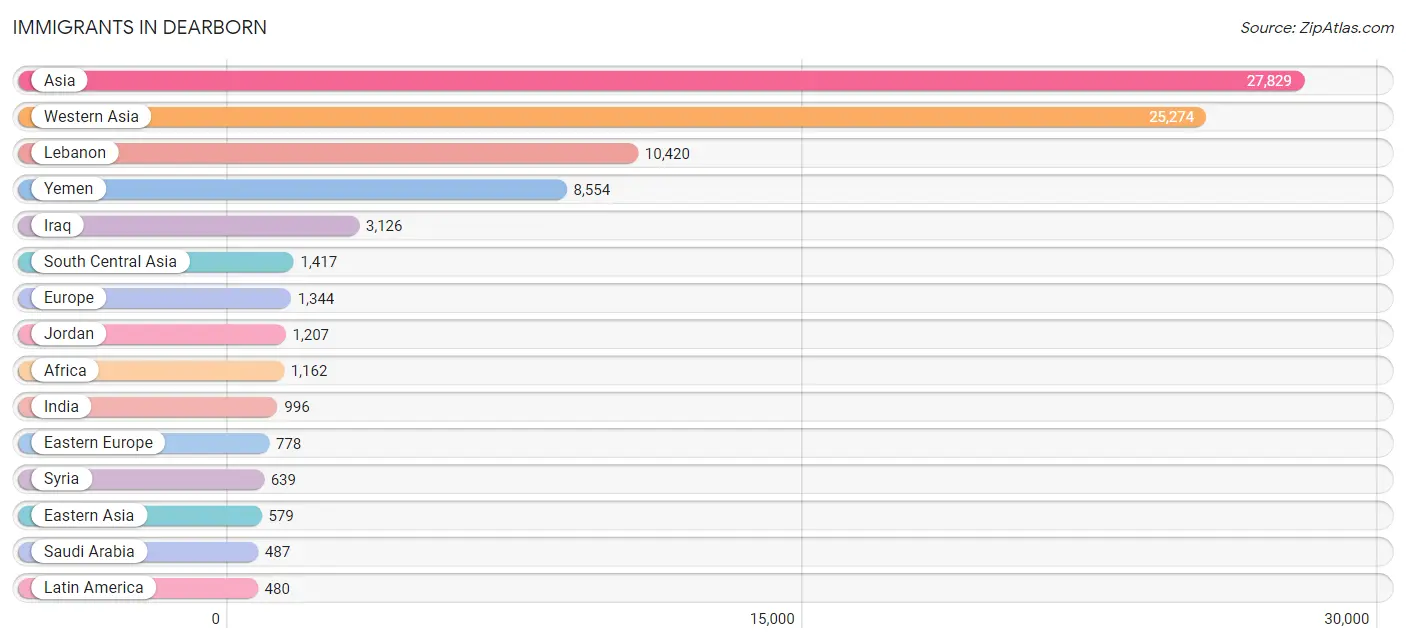
Immigrants in Dearborn
The most numerous immigrant groups reported in Dearborn came from Asia (27,829 | 25.7%), Western Asia (25,274 | 23.3%), Lebanon (10,420 | 9.6%), Yemen (8,554 | 7.9%), and Iraq (3,126 | 2.9%), together accounting for 69.4% of all Dearborn residents.
| Immigration Origin | # Population | % Population |
| Afghanistan | 48 | 0.0% |
| Africa | 1,162 | 1.1% |
| Albania | 99 | 0.1% |
| Asia | 27,829 | 25.7% |
| Australia | 48 | 0.0% |
| Austria | 69 | 0.1% |
| Bangladesh | 36 | 0.0% |
| Bosnia and Herzegovina | 49 | 0.1% |
| Brazil | 17 | 0.0% |
| Bulgaria | 21 | 0.0% |
| Cameroon | 18 | 0.0% |
| Canada | 444 | 0.4% |
| Caribbean | 67 | 0.1% |
| Central America | 349 | 0.3% |
| China | 374 | 0.3% |
| Colombia | 33 | 0.0% |
| Congo | 7 | 0.0% |
| Cuba | 10 | 0.0% |
| Czechoslovakia | 134 | 0.1% |
| Dominican Republic | 50 | 0.1% |
| Eastern Africa | 169 | 0.2% |
| Eastern Asia | 579 | 0.5% |
| Eastern Europe | 778 | 0.7% |
| Egypt | 35 | 0.0% |
| Ethiopia | 151 | 0.1% |
| Europe | 1,344 | 1.2% |
| Fiji | 5 | 0.0% |
| France | 24 | 0.0% |
| Germany | 155 | 0.1% |
| Ghana | 1 | 0.0% |
| Greece | 35 | 0.0% |
| Guatemala | 34 | 0.0% |
| Hong Kong | 7 | 0.0% |
| India | 996 | 0.9% |
| Iran | 117 | 0.1% |
| Iraq | 3,126 | 2.9% |
| Ireland | 5 | 0.0% |
| Israel | 154 | 0.1% |
| Italy | 164 | 0.2% |
| Jamaica | 7 | 0.0% |
| Japan | 14 | 0.0% |
| Jordan | 1,207 | 1.1% |
| Korea | 191 | 0.2% |
| Kuwait | 363 | 0.3% |
| Latin America | 480 | 0.4% |
| Lebanon | 10,420 | 9.6% |
| Liberia | 115 | 0.1% |
| Mexico | 315 | 0.3% |
| Middle Africa | 25 | 0.0% |
| Morocco | 146 | 0.1% |
| Nepal | 8 | 0.0% |
| Netherlands | 26 | 0.0% |
| Nigeria | 85 | 0.1% |
| Northern Africa | 431 | 0.4% |
| Northern Europe | 34 | 0.0% |
| Oceania | 53 | 0.1% |
| Pakistan | 212 | 0.2% |
| Poland | 265 | 0.2% |
| Romania | 73 | 0.1% |
| Russia | 93 | 0.1% |
| Saudi Arabia | 487 | 0.4% |
| Scotland | 15 | 0.0% |
| Senegal | 15 | 0.0% |
| Sierra Leone | 138 | 0.1% |
| South America | 64 | 0.1% |
| South Central Asia | 1,417 | 1.3% |
| South Eastern Asia | 32 | 0.0% |
| Southern Europe | 258 | 0.2% |
| Spain | 20 | 0.0% |
| Sudan | 8 | 0.0% |
| Syria | 639 | 0.6% |
| Taiwan | 104 | 0.1% |
| Venezuela | 14 | 0.0% |
| Vietnam | 32 | 0.0% |
| Western Africa | 413 | 0.4% |
| Western Asia | 25,274 | 23.3% |
| Western Europe | 274 | 0.3% |
| Yemen | 8,554 | 7.9% | View All 78 Rows |
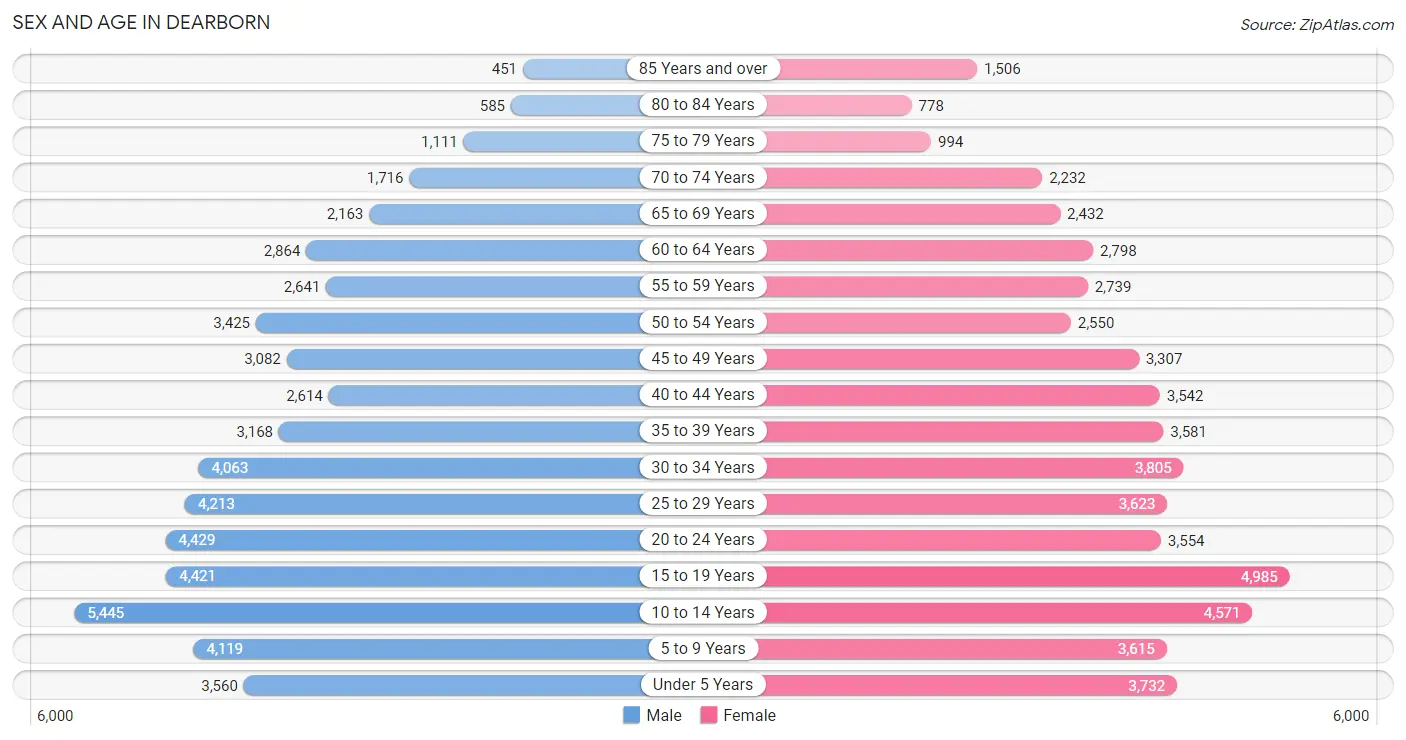
Sex and Age in Dearborn
Sex and Age in Dearborn
The most populous age groups in Dearborn are 10 to 14 Years (5,445 | 10.1%) for men and 15 to 19 Years (4,985 | 9.2%) for women.
| Age Bracket | Male | Female |
| Under 5 Years | 3,560 (6.6%) | 3,732 (6.9%) |
| 5 to 9 Years | 4,119 (7.6%) | 3,615 (6.7%) |
| 10 to 14 Years | 5,445 (10.1%) | 4,571 (8.4%) |
| 15 to 19 Years | 4,421 (8.2%) | 4,985 (9.2%) |
| 20 to 24 Years | 4,429 (8.2%) | 3,554 (6.5%) |
| 25 to 29 Years | 4,213 (7.8%) | 3,623 (6.7%) |
| 30 to 34 Years | 4,063 (7.5%) | 3,805 (7.0%) |
| 35 to 39 Years | 3,168 (5.9%) | 3,581 (6.6%) |
| 40 to 44 Years | 2,614 (4.8%) | 3,542 (6.5%) |
| 45 to 49 Years | 3,082 (5.7%) | 3,307 (6.1%) |
| 50 to 54 Years | 3,425 (6.3%) | 2,550 (4.7%) |
| 55 to 59 Years | 2,641 (4.9%) | 2,739 (5.0%) |
| 60 to 64 Years | 2,864 (5.3%) | 2,798 (5.1%) |
| 65 to 69 Years | 2,163 (4.0%) | 2,432 (4.5%) |
| 70 to 74 Years | 1,716 (3.2%) | 2,232 (4.1%) |
| 75 to 79 Years | 1,111 (2.1%) | 994 (1.8%) |
| 80 to 84 Years | 585 (1.1%) | 778 (1.4%) |
| 85 Years and over | 451 (0.8%) | 1,506 (2.8%) |
| Total | 54,070 (100.0%) | 54,344 (100.0%) |
Families and Households in Dearborn
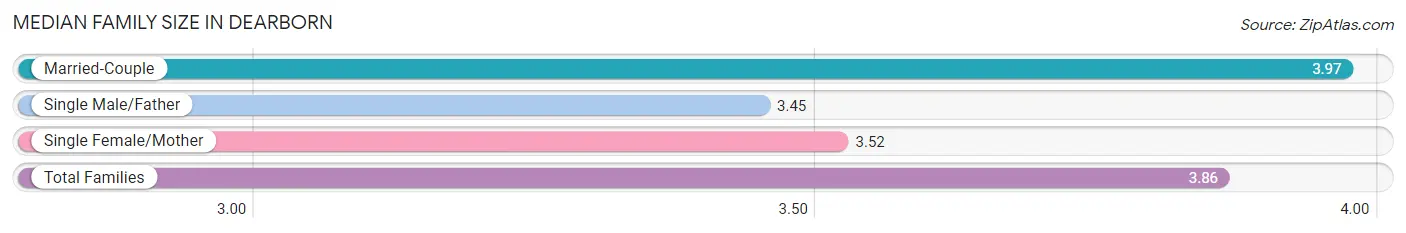
Median Family Size in Dearborn
The median family size in Dearborn is 3.86 persons per family, with married-couple families (18,568 | 78.0%) accounting for the largest median family size of 3.97 persons per family. On the other hand, single male/father families (1,728 | 7.3%) represent the smallest median family size with 3.45 persons per family.
| Family Type | # Families | Family Size |
| Married-Couple | 18,568 (78.0%) | 3.97 |
| Single Male/Father | 1,728 (7.3%) | 3.45 |
| Single Female/Mother | 3,520 (14.8%) | 3.52 |
| Total Families | 23,816 (100.0%) | 3.86 |
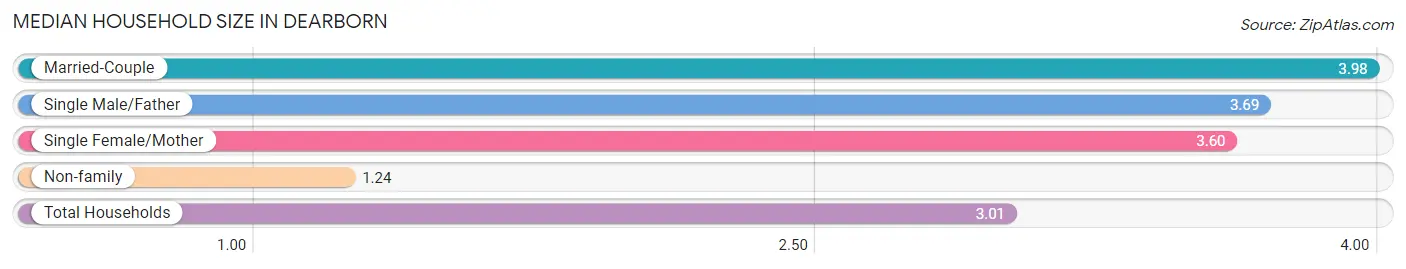
Median Household Size in Dearborn
The median household size in Dearborn is 3.01 persons per household, with married-couple households (18,568 | 51.6%) accounting for the largest median household size of 3.98 persons per household. non-family households (12,152 | 33.8%) represent the smallest median household size with 1.24 persons per household.
| Household Type | # Households | Household Size |
| Married-Couple | 18,568 (51.6%) | 3.98 |
| Single Male/Father | 1,728 (4.8%) | 3.69 |
| Single Female/Mother | 3,520 (9.8%) | 3.60 |
| Non-family | 12,152 (33.8%) | 1.24 |
| Total Households | 35,968 (100.0%) | 3.01 |
Household Size by Marriage Status in Dearborn
Out of a total of 35,968 households in Dearborn, 23,816 (66.2%) are family households, while 12,152 (33.8%) are nonfamily households. The most numerous type of family households are 2-person households, comprising 7,724, and the most common type of nonfamily households are 1-person households, comprising 10,330.
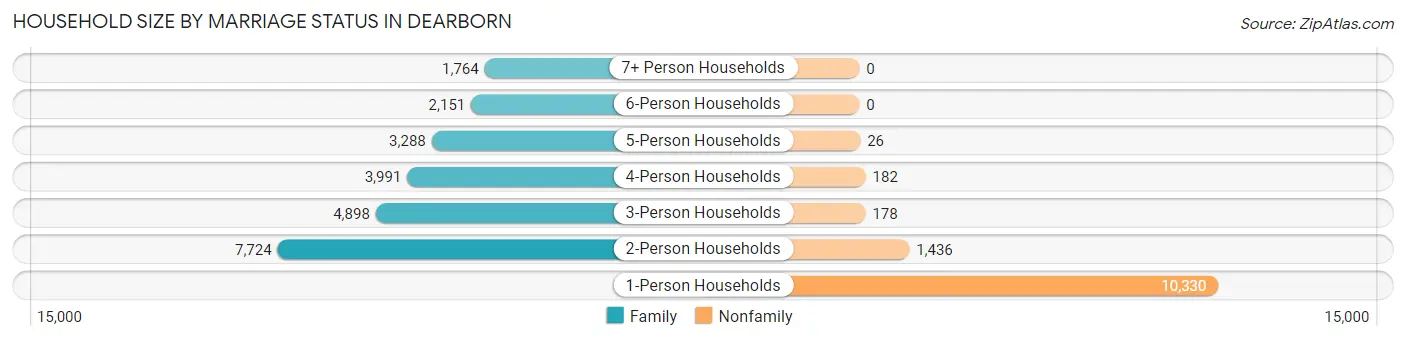
| Household Size | Family Households | Nonfamily Households |
| 1-Person Households | - | 10,330 (28.7%) |
| 2-Person Households | 7,724 (21.5%) | 1,436 (4.0%) |
| 3-Person Households | 4,898 (13.6%) | 178 (0.5%) |
| 4-Person Households | 3,991 (11.1%) | 182 (0.5%) |
| 5-Person Households | 3,288 (9.1%) | 26 (0.1%) |
| 6-Person Households | 2,151 (6.0%) | 0 (0.0%) |
| 7+ Person Households | 1,764 (4.9%) | 0 (0.0%) |
| Total | 23,816 (66.2%) | 12,152 (33.8%) |
Female Fertility in Dearborn
Fertility by Age in Dearborn
Average fertility rate in Dearborn is 60.0 births per 1,000 women. Women in the age bracket of 20 to 34 years have the highest fertility rate with 96.0 births per 1,000 women. Women in the age bracket of 20 to 34 years acount for 64.9% of all women with births.
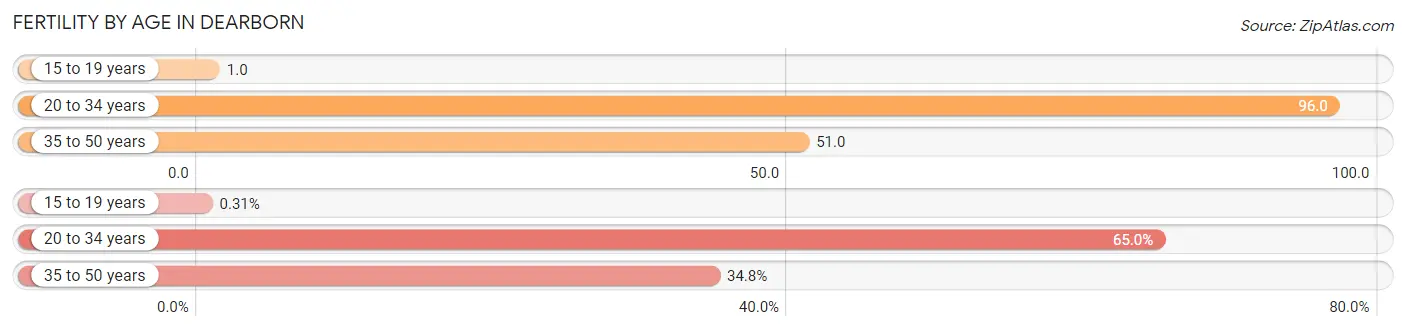
| Age Bracket | Women with Births | Births / 1,000 Women |
| 15 to 19 years | 5 (0.3%) | 1.0 |
| 20 to 34 years | 1,058 (64.9%) | 96.0 |
| 35 to 50 years | 566 (34.7%) | 51.0 |
| Total | 1,629 (100.0%) | 60.0 |
Fertility by Age by Marriage Status in Dearborn
87.8% of women with births (1,629) in Dearborn are married. The highest percentage of unmarried women with births falls into 35 to 50 years age bracket with 21.0% of them unmarried at the time of birth, while the lowest percentage of unmarried women with births belong to 15 to 19 years age bracket with 0.0% of them unmarried.
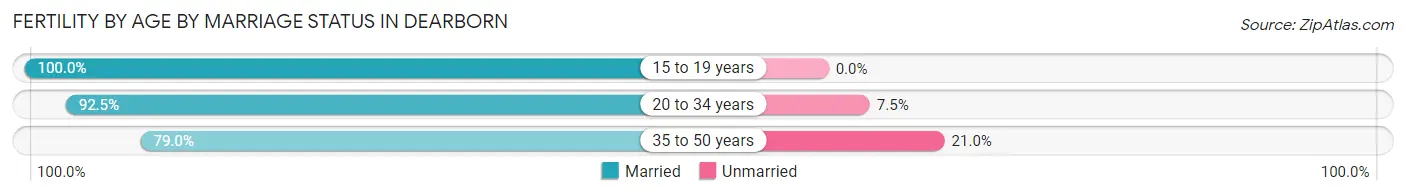
| Age Bracket | Married | Unmarried |
| 15 to 19 years | 5 (100.0%) | 0 (0.0%) |
| 20 to 34 years | 979 (92.5%) | 79 (7.5%) |
| 35 to 50 years | 447 (79.0%) | 119 (21.0%) |
| Total | 1,430 (87.8%) | 199 (12.2%) |
Fertility by Education in Dearborn
Average fertility rate in Dearborn is 60.0 births per 1,000 women. Women with the education attainment of graduate degree have the highest fertility rate of 75.0 births per 1,000 women, while women with the education attainment of less than high school have the lowest fertility at 46.0 births per 1,000 women. Women with the education attainment of college or associate's degree represent 32.3% of all women with births.
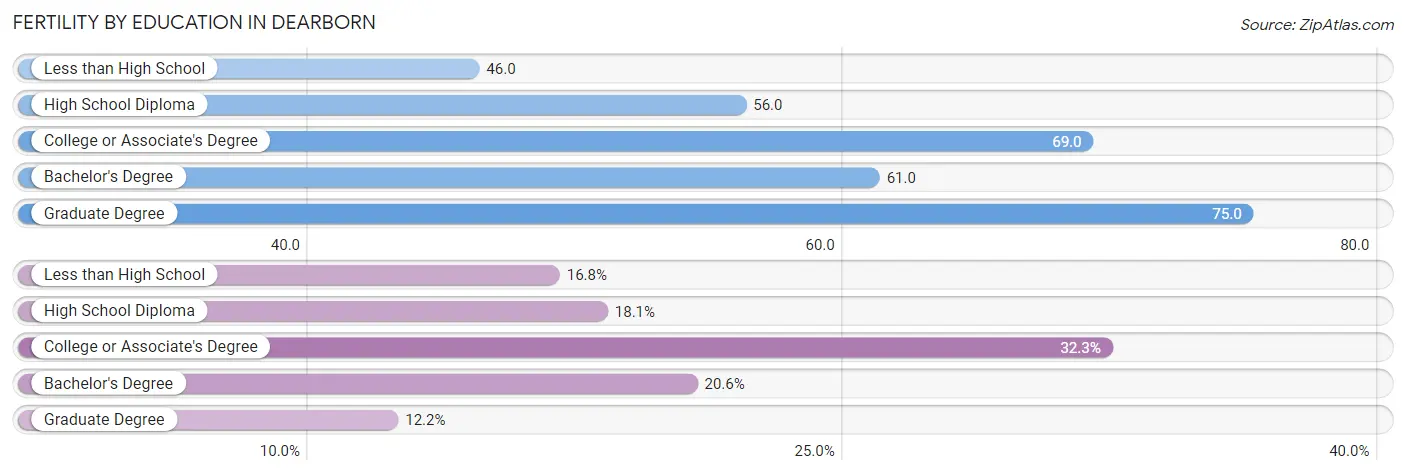
| Educational Attainment | Women with Births | Births / 1,000 Women |
| Less than High School | 273 (16.8%) | 46.0 |
| High School Diploma | 295 (18.1%) | 56.0 |
| College or Associate's Degree | 526 (32.3%) | 69.0 |
| Bachelor's Degree | 336 (20.6%) | 61.0 |
| Graduate Degree | 199 (12.2%) | 75.0 |
| Total | 1,629 (100.0%) | 60.0 |
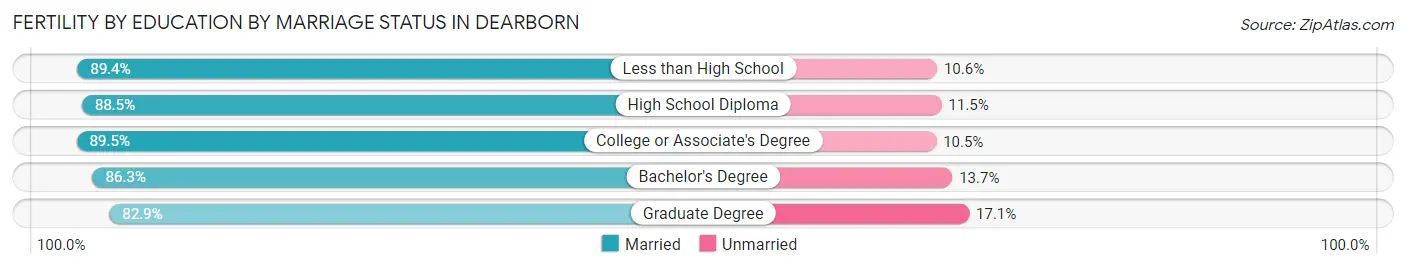
Fertility by Education by Marriage Status in Dearborn
12.2% of women with births in Dearborn are unmarried. Women with the educational attainment of college or associate's degree are most likely to be married with 89.5% of them married at childbirth, while women with the educational attainment of graduate degree are least likely to be married with 17.1% of them unmarried at childbirth.
| Educational Attainment | Married | Unmarried |
| Less than High School | 244 (89.4%) | 29 (10.6%) |
| High School Diploma | 261 (88.5%) | 34 (11.5%) |
| College or Associate's Degree | 471 (89.5%) | 55 (10.5%) |
| Bachelor's Degree | 290 (86.3%) | 46 (13.7%) |
| Graduate Degree | 165 (82.9%) | 34 (17.1%) |
| Total | 1,430 (87.8%) | 199 (12.2%) |
Employment Characteristics in Dearborn
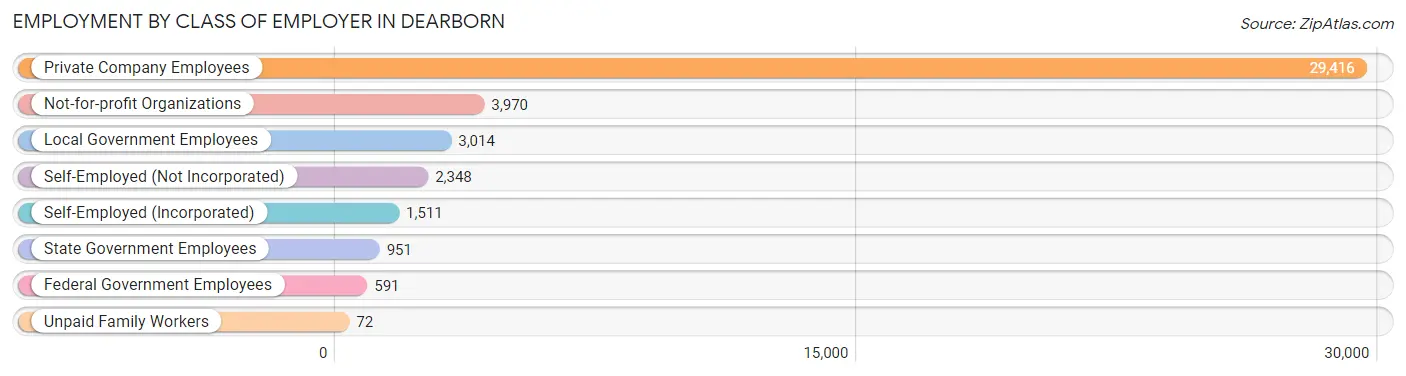
Employment by Class of Employer in Dearborn
Among the 41,873 employed individuals in Dearborn, private company employees (29,416 | 70.3%), not-for-profit organizations (3,970 | 9.5%), and local government employees (3,014 | 7.2%) make up the most common classes of employment.
| Employer Class | # Employees | % Employees |
| Private Company Employees | 29,416 | 70.3% |
| Self-Employed (Incorporated) | 1,511 | 3.6% |
| Self-Employed (Not Incorporated) | 2,348 | 5.6% |
| Not-for-profit Organizations | 3,970 | 9.5% |
| Local Government Employees | 3,014 | 7.2% |
| State Government Employees | 951 | 2.3% |
| Federal Government Employees | 591 | 1.4% |
| Unpaid Family Workers | 72 | 0.2% |
| Total | 41,873 | 100.0% |
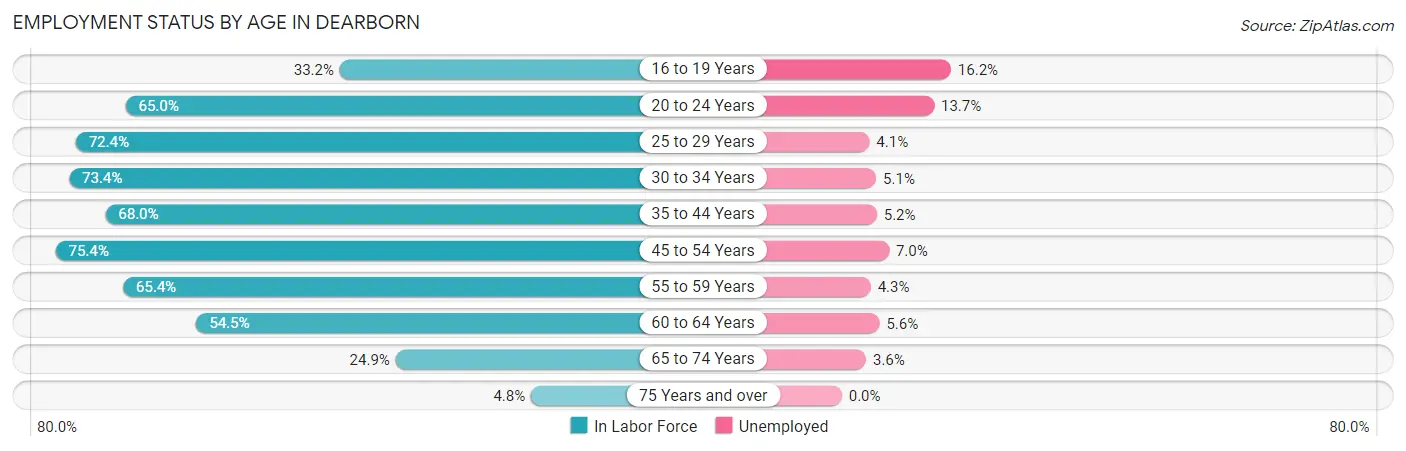
Employment Status by Age in Dearborn
According to the labor force statistics for Dearborn, out of the total population over 16 years of age (81,506), 56.7% or 46,214 individuals are in the labor force, with 6.8% or 3,143 of them unemployed. The age group with the highest labor force participation rate is 45 to 54 years, with 75.4% or 9,322 individuals in the labor force. Within the labor force, the 16 to 19 years age range has the highest percentage of unemployed individuals, with 16.2% or 405 of them being unemployed.
| Age Bracket | In Labor Force | Unemployed |
| 16 to 19 Years | 2,503 (33.2%) | 405 (16.2%) |
| 20 to 24 Years | 5,189 (65.0%) | 711 (13.7%) |
| 25 to 29 Years | 5,673 (72.4%) | 233 (4.1%) |
| 30 to 34 Years | 5,775 (73.4%) | 295 (5.1%) |
| 35 to 44 Years | 8,775 (68.0%) | 456 (5.2%) |
| 45 to 54 Years | 9,322 (75.4%) | 653 (7.0%) |
| 55 to 59 Years | 3,519 (65.4%) | 151 (4.3%) |
| 60 to 64 Years | 3,086 (54.5%) | 173 (5.6%) |
| 65 to 74 Years | 2,127 (24.9%) | 77 (3.6%) |
| 75 Years and over | 260 (4.8%) | 0 (0.0%) |
| Total | 46,214 (56.7%) | 3,143 (6.8%) |
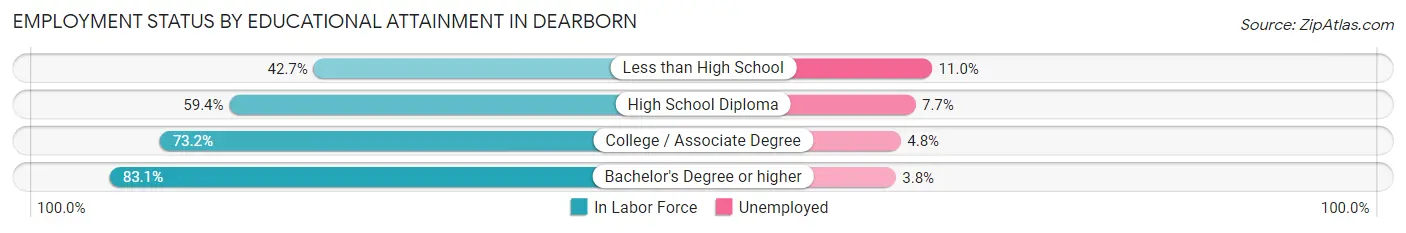
Employment Status by Educational Attainment in Dearborn
According to labor force statistics for Dearborn, 69.5% of individuals (36,150) out of the total population between 25 and 64 years of age (52,015) are in the labor force, with 5.4% or 1,952 of them being unemployed. The group with the highest labor force participation rate are those with the educational attainment of bachelor's degree or higher, with 83.1% or 15,623 individuals in the labor force. Within the labor force, individuals with less than high school education have the highest percentage of unemployment, with 11.0% or 338 of them being unemployed.
| Educational Attainment | In Labor Force | Unemployed |
| Less than High School | 3,076 (42.7%) | 792 (11.0%) |
| High School Diploma | 6,854 (59.4%) | 889 (7.7%) |
| College / Associate Degree | 10,594 (73.2%) | 695 (4.8%) |
| Bachelor's Degree or higher | 15,623 (83.1%) | 714 (3.8%) |
| Total | 36,150 (69.5%) | 2,809 (5.4%) |
Employment Occupations by Sex in Dearborn
Management, Business, Science and Arts Occupations
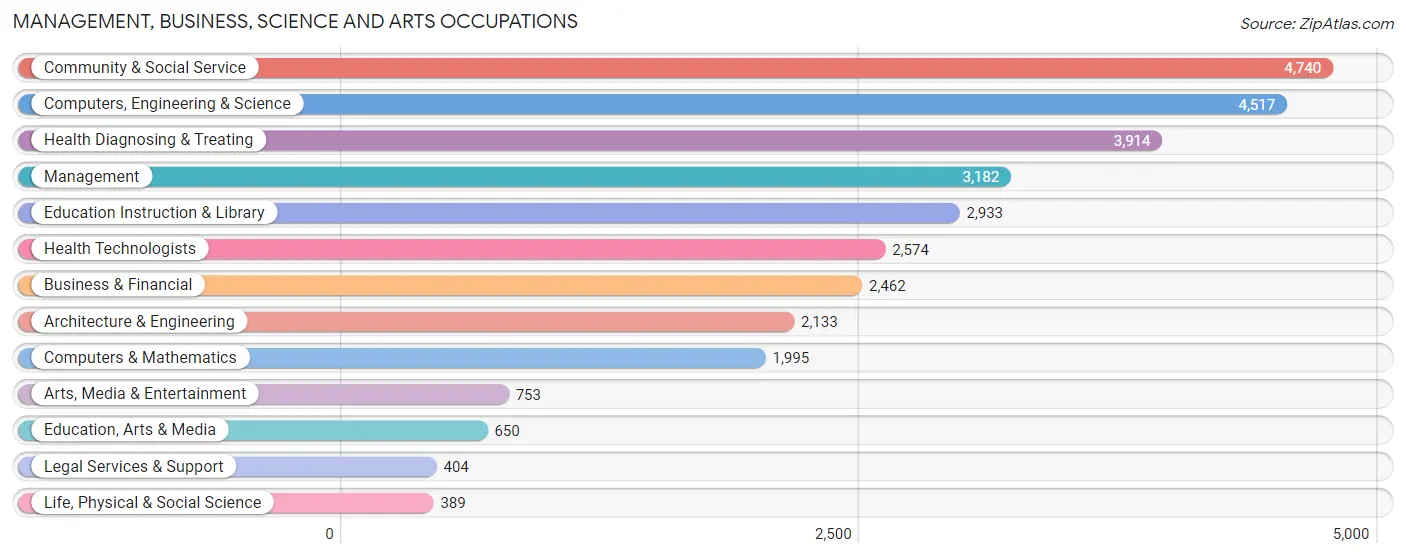
The most common Management, Business, Science and Arts occupations in Dearborn are Community & Social Service (4,740 | 11.0%), Computers, Engineering & Science (4,517 | 10.5%), Health Diagnosing & Treating (3,914 | 9.1%), Management (3,182 | 7.4%), and Education Instruction & Library (2,933 | 6.8%).
Management, Business, Science and Arts Occupations by Sex
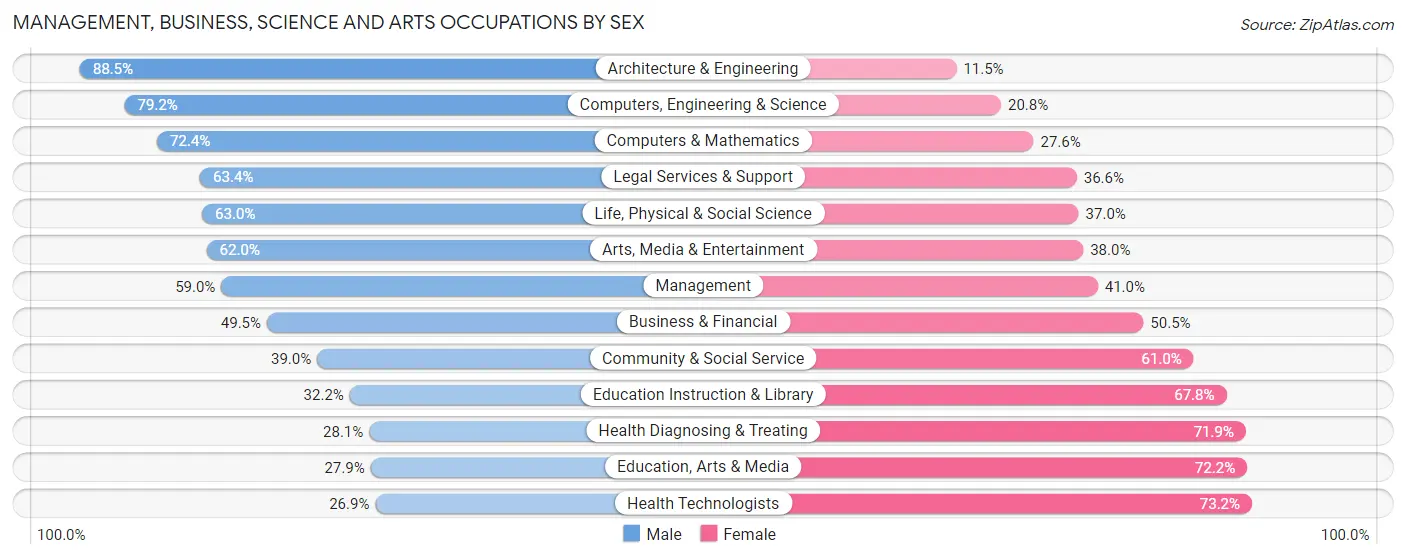
Within the Management, Business, Science and Arts occupations in Dearborn, the most male-oriented occupations are Architecture & Engineering (88.5%), Computers, Engineering & Science (79.2%), and Computers & Mathematics (72.4%), while the most female-oriented occupations are Health Technologists (73.2%), Education, Arts & Media (72.2%), and Health Diagnosing & Treating (71.9%).
| Occupation | Male | Female |
| Management | 1,877 (59.0%) | 1,305 (41.0%) |
| Business & Financial | 1,218 (49.5%) | 1,244 (50.5%) |
| Computers, Engineering & Science | 3,576 (79.2%) | 941 (20.8%) |
| Computers & Mathematics | 1,444 (72.4%) | 551 (27.6%) |
| Architecture & Engineering | 1,887 (88.5%) | 246 (11.5%) |
| Life, Physical & Social Science | 245 (63.0%) | 144 (37.0%) |
| Community & Social Service | 1,848 (39.0%) | 2,892 (61.0%) |
| Education, Arts & Media | 181 (27.9%) | 469 (72.2%) |
| Legal Services & Support | 256 (63.4%) | 148 (36.6%) |
| Education Instruction & Library | 944 (32.2%) | 1,989 (67.8%) |
| Arts, Media & Entertainment | 467 (62.0%) | 286 (38.0%) |
| Health Diagnosing & Treating | 1,101 (28.1%) | 2,813 (71.9%) |
| Health Technologists | 691 (26.9%) | 1,883 (73.2%) |
| Total (Category) | 9,620 (51.1%) | 9,195 (48.9%) |
| Total (Overall) | 25,138 (58.4%) | 17,934 (41.6%) |
Services Occupations
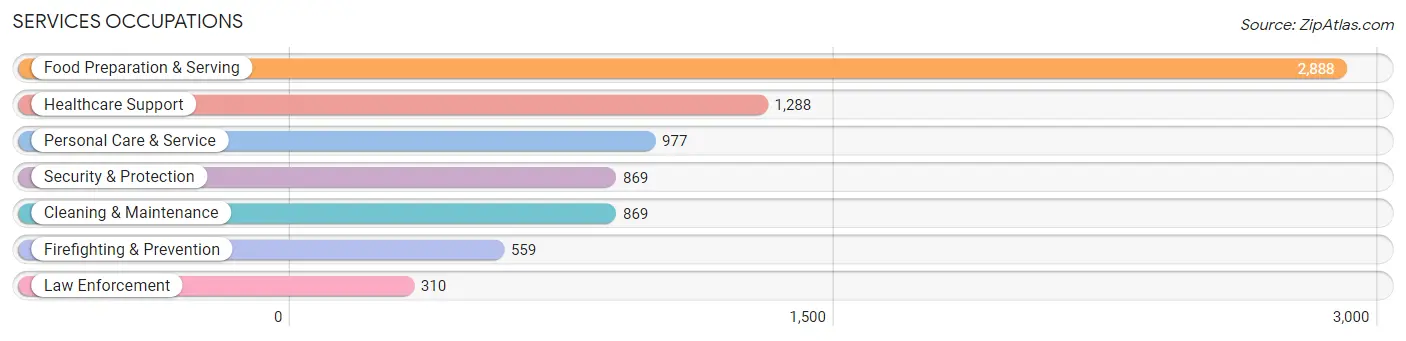
The most common Services occupations in Dearborn are Food Preparation & Serving (2,888 | 6.7%), Healthcare Support (1,288 | 3.0%), Personal Care & Service (977 | 2.3%), Security & Protection (869 | 2.0%), and Cleaning & Maintenance (869 | 2.0%).
Services Occupations by Sex
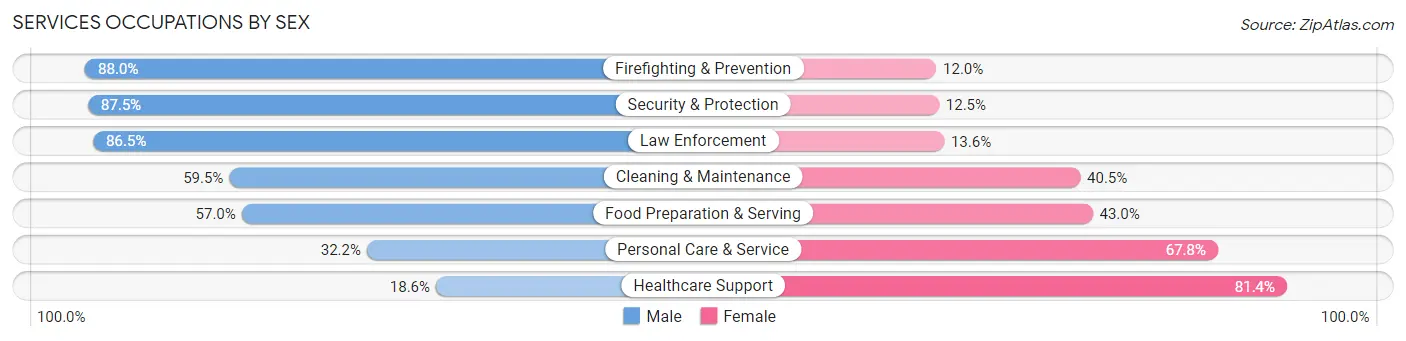
Within the Services occupations in Dearborn, the most male-oriented occupations are Firefighting & Prevention (88.0%), Security & Protection (87.5%), and Law Enforcement (86.5%), while the most female-oriented occupations are Healthcare Support (81.4%), Personal Care & Service (67.8%), and Food Preparation & Serving (43.0%).
| Occupation | Male | Female |
| Healthcare Support | 239 (18.6%) | 1,049 (81.4%) |
| Security & Protection | 760 (87.5%) | 109 (12.5%) |
| Firefighting & Prevention | 492 (88.0%) | 67 (12.0%) |
| Law Enforcement | 268 (86.5%) | 42 (13.6%) |
| Food Preparation & Serving | 1,647 (57.0%) | 1,241 (43.0%) |
| Cleaning & Maintenance | 517 (59.5%) | 352 (40.5%) |
| Personal Care & Service | 315 (32.2%) | 662 (67.8%) |
| Total (Category) | 3,478 (50.5%) | 3,413 (49.5%) |
| Total (Overall) | 25,138 (58.4%) | 17,934 (41.6%) |
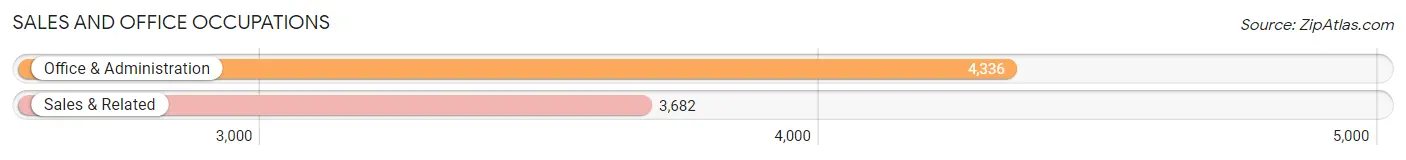
Sales and Office Occupations
The most common Sales and Office occupations in Dearborn are Office & Administration (4,336 | 10.1%), and Sales & Related (3,682 | 8.6%).
Sales and Office Occupations by Sex
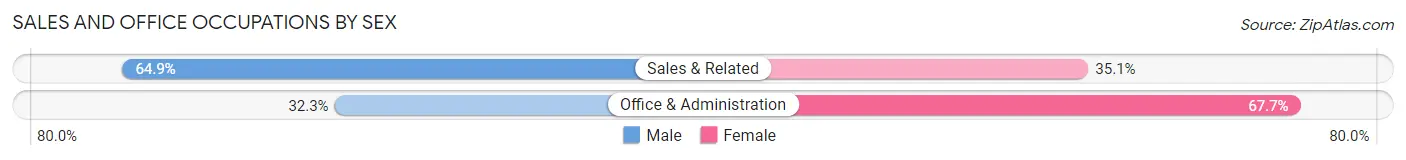
| Occupation | Male | Female |
| Sales & Related | 2,391 (64.9%) | 1,291 (35.1%) |
| Office & Administration | 1,402 (32.3%) | 2,934 (67.7%) |
| Total (Category) | 3,793 (47.3%) | 4,225 (52.7%) |
| Total (Overall) | 25,138 (58.4%) | 17,934 (41.6%) |
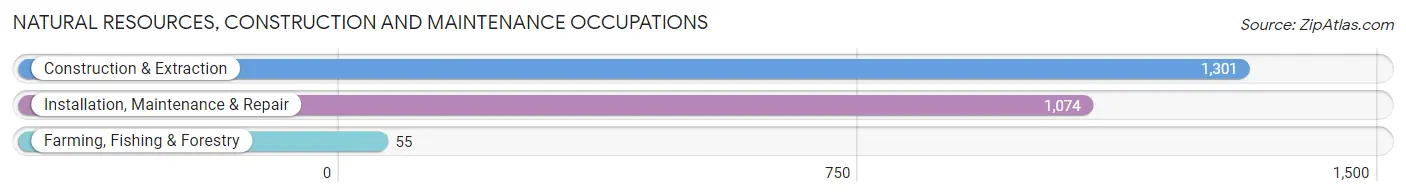
Natural Resources, Construction and Maintenance Occupations
The most common Natural Resources, Construction and Maintenance occupations in Dearborn are Construction & Extraction (1,301 | 3.0%), Installation, Maintenance & Repair (1,074 | 2.5%), and Farming, Fishing & Forestry (55 | 0.1%).
Natural Resources, Construction and Maintenance Occupations by Sex
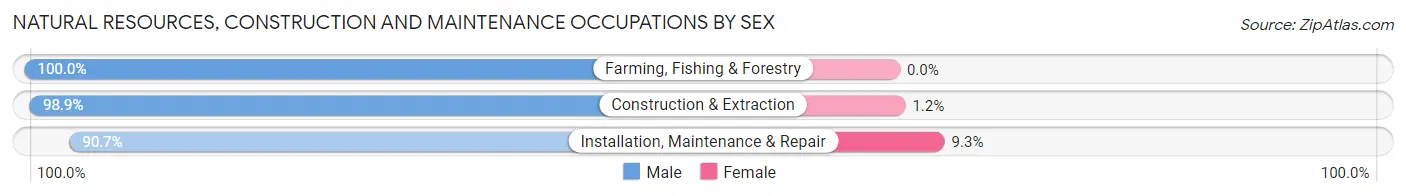
| Occupation | Male | Female |
| Farming, Fishing & Forestry | 55 (100.0%) | 0 (0.0%) |
| Construction & Extraction | 1,286 (98.9%) | 15 (1.1%) |
| Installation, Maintenance & Repair | 974 (90.7%) | 100 (9.3%) |
| Total (Category) | 2,315 (95.3%) | 115 (4.7%) |
| Total (Overall) | 25,138 (58.4%) | 17,934 (41.6%) |
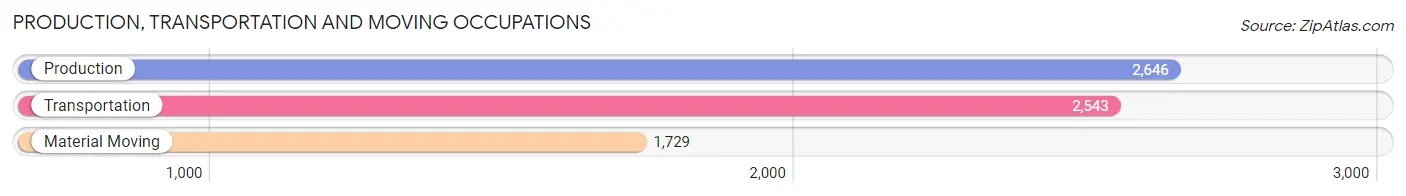
Production, Transportation and Moving Occupations
The most common Production, Transportation and Moving occupations in Dearborn are Production (2,646 | 6.1%), Transportation (2,543 | 5.9%), and Material Moving (1,729 | 4.0%).
Production, Transportation and Moving Occupations by Sex
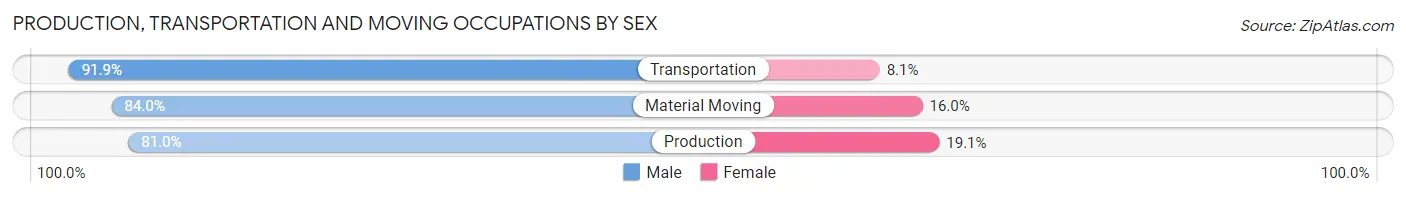
| Occupation | Male | Female |
| Production | 2,142 (80.9%) | 504 (19.1%) |
| Transportation | 2,337 (91.9%) | 206 (8.1%) |
| Material Moving | 1,453 (84.0%) | 276 (16.0%) |
| Total (Category) | 5,932 (85.8%) | 986 (14.2%) |
| Total (Overall) | 25,138 (58.4%) | 17,934 (41.6%) |
Employment Industries by Sex in Dearborn
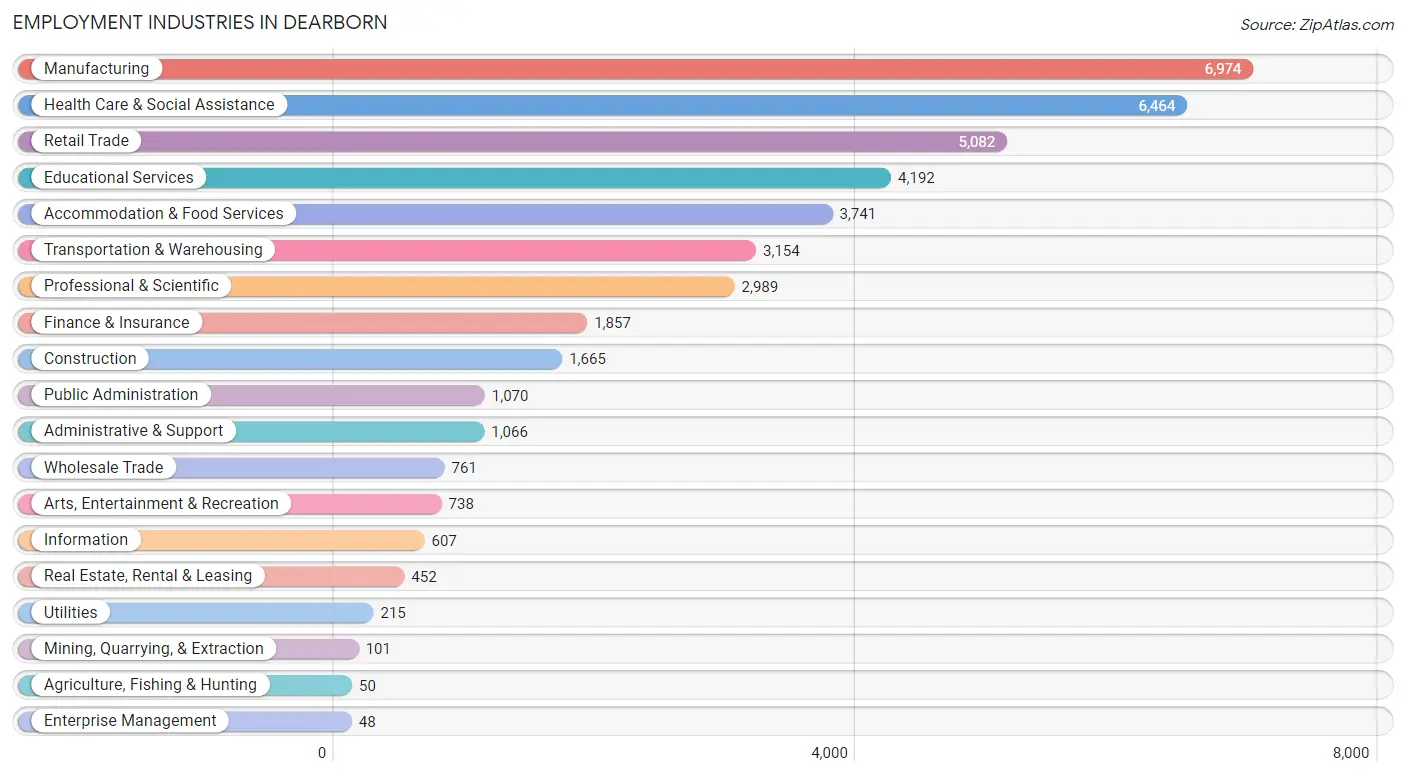
Employment Industries in Dearborn
The major employment industries in Dearborn include Manufacturing (6,974 | 16.2%), Health Care & Social Assistance (6,464 | 15.0%), Retail Trade (5,082 | 11.8%), Educational Services (4,192 | 9.7%), and Accommodation & Food Services (3,741 | 8.7%).
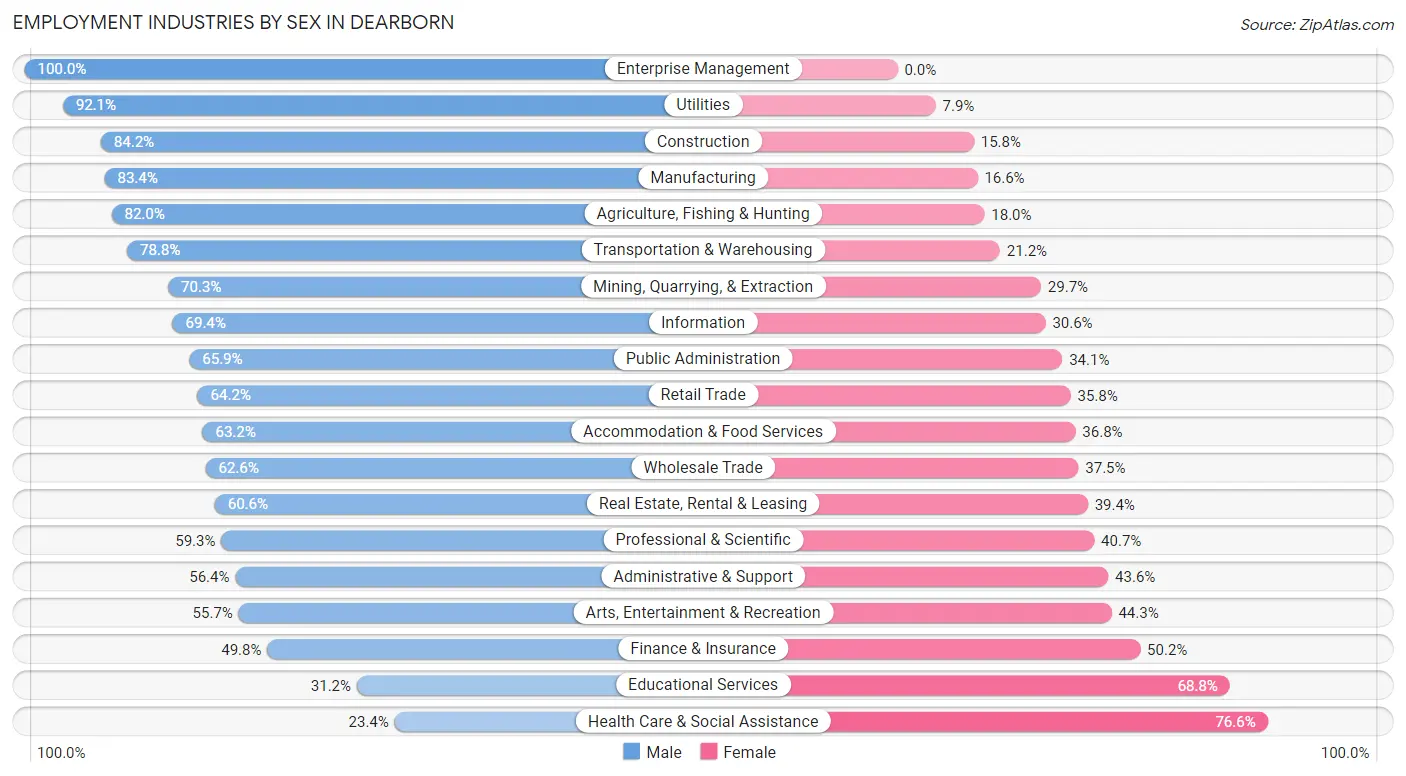
Employment Industries by Sex in Dearborn
The Dearborn industries that see more men than women are Enterprise Management (100.0%), Utilities (92.1%), and Construction (84.2%), whereas the industries that tend to have a higher number of women are Health Care & Social Assistance (76.6%), Educational Services (68.8%), and Finance & Insurance (50.2%).
| Industry | Male | Female |
| Agriculture, Fishing & Hunting | 41 (82.0%) | 9 (18.0%) |
| Mining, Quarrying, & Extraction | 71 (70.3%) | 30 (29.7%) |
| Construction | 1,402 (84.2%) | 263 (15.8%) |
| Manufacturing | 5,819 (83.4%) | 1,155 (16.6%) |
| Wholesale Trade | 476 (62.5%) | 285 (37.4%) |
| Retail Trade | 3,261 (64.2%) | 1,821 (35.8%) |
| Transportation & Warehousing | 2,485 (78.8%) | 669 (21.2%) |
| Utilities | 198 (92.1%) | 17 (7.9%) |
| Information | 421 (69.4%) | 186 (30.6%) |
| Finance & Insurance | 924 (49.8%) | 933 (50.2%) |
| Real Estate, Rental & Leasing | 274 (60.6%) | 178 (39.4%) |
| Professional & Scientific | 1,772 (59.3%) | 1,217 (40.7%) |
| Enterprise Management | 48 (100.0%) | 0 (0.0%) |
| Administrative & Support | 601 (56.4%) | 465 (43.6%) |
| Educational Services | 1,309 (31.2%) | 2,883 (68.8%) |
| Health Care & Social Assistance | 1,513 (23.4%) | 4,951 (76.6%) |
| Arts, Entertainment & Recreation | 411 (55.7%) | 327 (44.3%) |
| Accommodation & Food Services | 2,363 (63.2%) | 1,378 (36.8%) |
| Public Administration | 705 (65.9%) | 365 (34.1%) |
| Total | 25,138 (58.4%) | 17,934 (41.6%) |
Education in Dearborn
School Enrollment in Dearborn
The most common levels of schooling among the 35,261 students in Dearborn are college / undergraduate (8,168 | 23.2%), high school (8,095 | 23.0%), and middle school (7,897 | 22.4%).
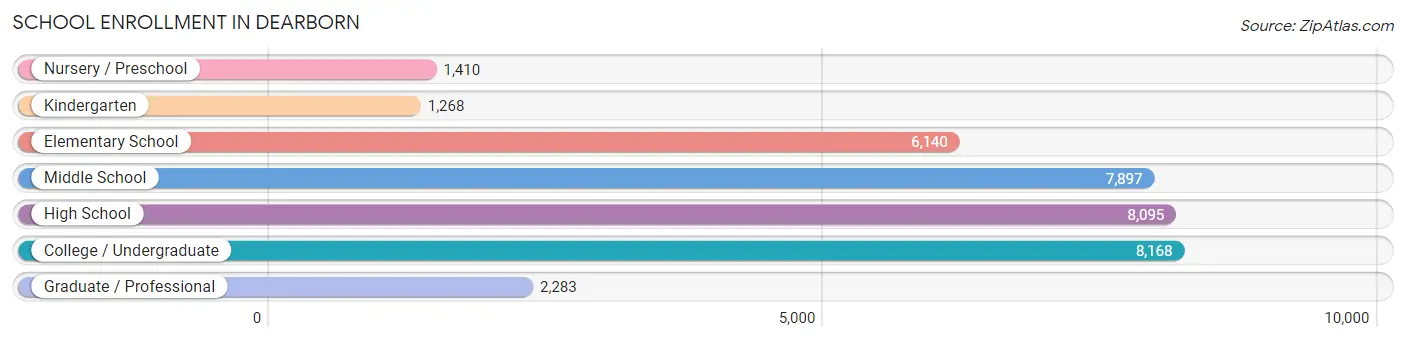
| School Level | # Students | % Students |
| Nursery / Preschool | 1,410 | 4.0% |
| Kindergarten | 1,268 | 3.6% |
| Elementary School | 6,140 | 17.4% |
| Middle School | 7,897 | 22.4% |
| High School | 8,095 | 23.0% |
| College / Undergraduate | 8,168 | 23.2% |
| Graduate / Professional | 2,283 | 6.5% |
| Total | 35,261 | 100.0% |
School Enrollment by Age by Funding Source in Dearborn
Out of a total of 35,261 students who are enrolled in schools in Dearborn, 4,337 (12.3%) attend a private institution, while the remaining 30,924 (87.7%) are enrolled in public schools. The age group of 3 to 4 year olds has the highest likelihood of being enrolled in private schools, with 504 (43.3% in the age bracket) enrolled. Conversely, the age group of 18 to 19 year olds has the lowest likelihood of being enrolled in a private school, with 2,607 (92.9% in the age bracket) attending a public institution.
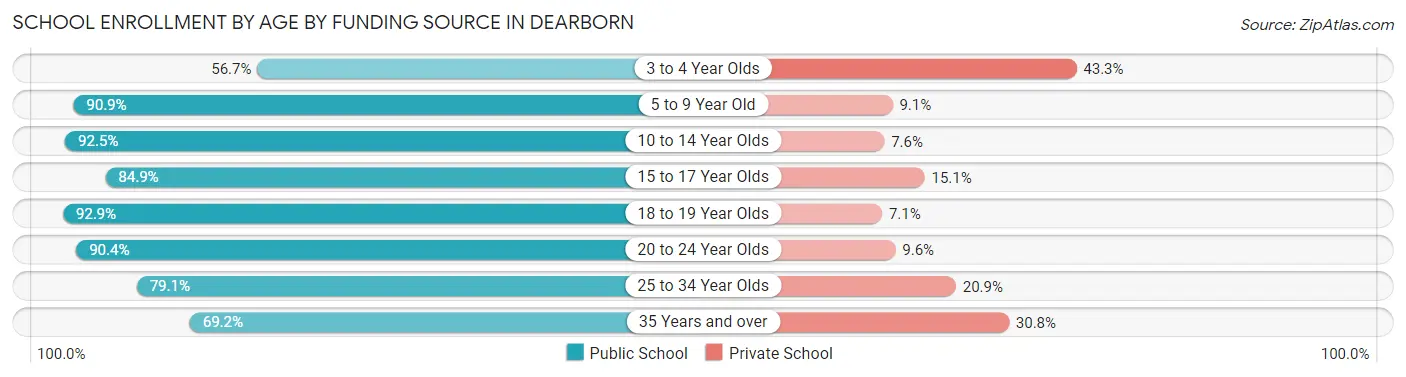
| Age Bracket | Public School | Private School |
| 3 to 4 Year Olds | 659 (56.7%) | 504 (43.3%) |
| 5 to 9 Year Old | 6,577 (90.9%) | 658 (9.1%) |
| 10 to 14 Year Olds | 9,042 (92.4%) | 738 (7.5%) |
| 15 to 17 Year Olds | 4,987 (84.9%) | 884 (15.1%) |
| 18 to 19 Year Olds | 2,607 (92.9%) | 200 (7.1%) |
| 20 to 24 Year Olds | 4,312 (90.4%) | 459 (9.6%) |
| 25 to 34 Year Olds | 1,772 (79.1%) | 468 (20.9%) |
| 35 Years and over | 965 (69.2%) | 429 (30.8%) |
| Total | 30,924 (87.7%) | 4,337 (12.3%) |
Educational Attainment by Field of Study in Dearborn
Business (4,572 | 18.5%), engineering (3,221 | 13.0%), science & technology (3,217 | 13.0%), education (2,711 | 11.0%), and bio, nature & agricultural (1,722 | 7.0%) are the most common fields of study among 24,720 individuals in Dearborn who have obtained a bachelor's degree or higher.
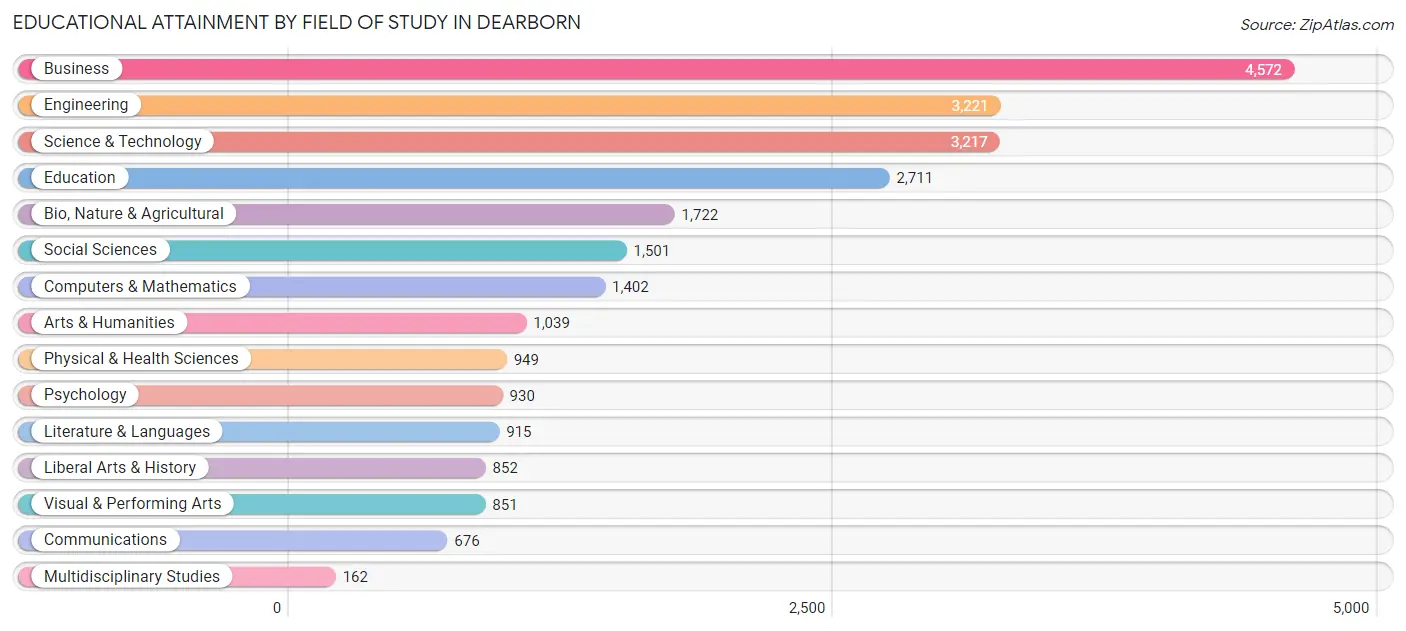
| Field of Study | # Graduates | % Graduates |
| Computers & Mathematics | 1,402 | 5.7% |
| Bio, Nature & Agricultural | 1,722 | 7.0% |
| Physical & Health Sciences | 949 | 3.8% |
| Psychology | 930 | 3.8% |
| Social Sciences | 1,501 | 6.1% |
| Engineering | 3,221 | 13.0% |
| Multidisciplinary Studies | 162 | 0.7% |
| Science & Technology | 3,217 | 13.0% |
| Business | 4,572 | 18.5% |
| Education | 2,711 | 11.0% |
| Literature & Languages | 915 | 3.7% |
| Liberal Arts & History | 852 | 3.5% |
| Visual & Performing Arts | 851 | 3.4% |
| Communications | 676 | 2.7% |
| Arts & Humanities | 1,039 | 4.2% |
| Total | 24,720 | 100.0% |
Transportation & Commute in Dearborn
Vehicle Availability by Sex in Dearborn
The most prevalent vehicle ownership categories in Dearborn are males with 2 vehicles (10,643, accounting for 43.4%) and females with 2 vehicles (7,344, making up 61.3%).
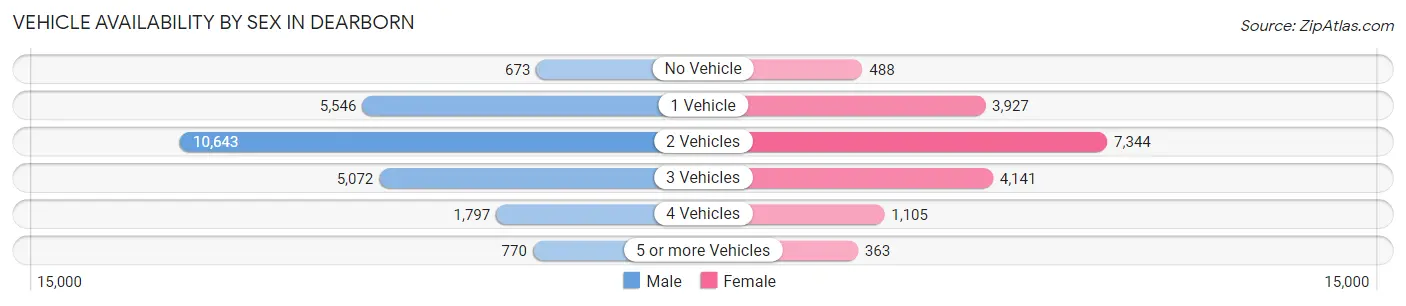
| Vehicles Available | Male | Female |
| No Vehicle | 673 (2.8%) | 488 (2.8%) |
| 1 Vehicle | 5,546 (22.6%) | 3,927 (22.6%) |
| 2 Vehicles | 10,643 (43.4%) | 7,344 (42.3%) |
| 3 Vehicles | 5,072 (20.7%) | 4,141 (23.8%) |
| 4 Vehicles | 1,797 (7.3%) | 1,105 (6.4%) |
| 5 or more Vehicles | 770 (3.1%) | 363 (2.1%) |
| Total | 24,501 (100.0%) | 17,368 (100.0%) |
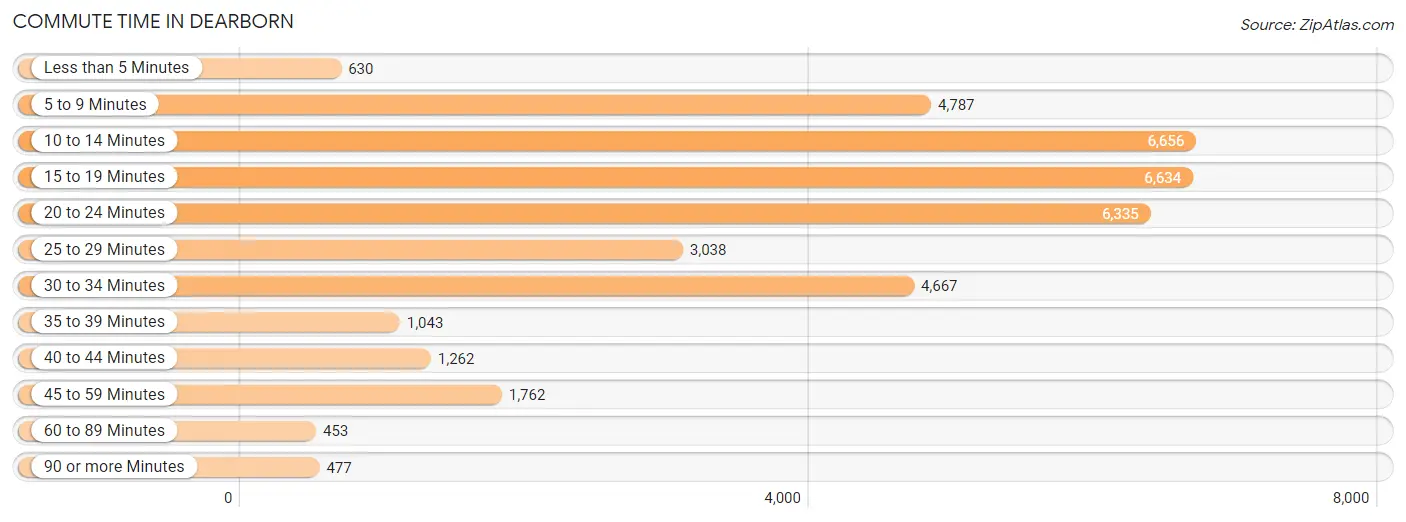
Commute Time in Dearborn
The most frequently occuring commute durations in Dearborn are 10 to 14 minutes (6,656 commuters, 17.6%), 15 to 19 minutes (6,634 commuters, 17.6%), and 20 to 24 minutes (6,335 commuters, 16.8%).
| Commute Time | # Commuters | % Commuters |
| Less than 5 Minutes | 630 | 1.7% |
| 5 to 9 Minutes | 4,787 | 12.7% |
| 10 to 14 Minutes | 6,656 | 17.6% |
| 15 to 19 Minutes | 6,634 | 17.6% |
| 20 to 24 Minutes | 6,335 | 16.8% |
| 25 to 29 Minutes | 3,038 | 8.1% |
| 30 to 34 Minutes | 4,667 | 12.4% |
| 35 to 39 Minutes | 1,043 | 2.8% |
| 40 to 44 Minutes | 1,262 | 3.3% |
| 45 to 59 Minutes | 1,762 | 4.7% |
| 60 to 89 Minutes | 453 | 1.2% |
| 90 or more Minutes | 477 | 1.3% |
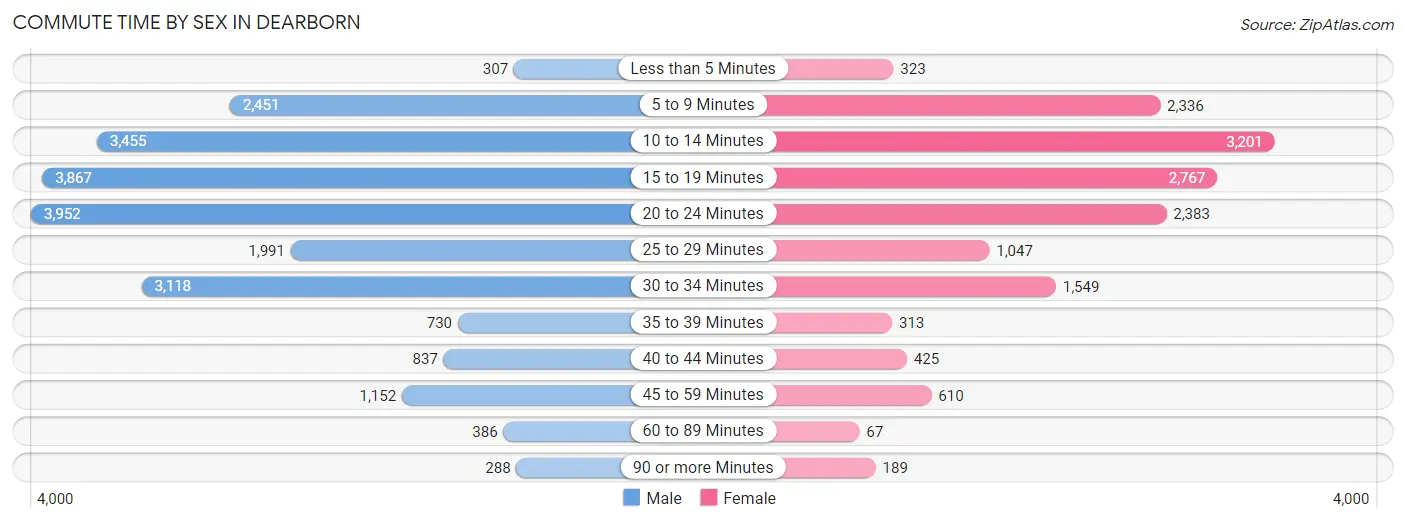
Commute Time by Sex in Dearborn
The most common commute times in Dearborn are 20 to 24 minutes (3,952 commuters, 17.5%) for males and 10 to 14 minutes (3,201 commuters, 21.0%) for females.
| Commute Time | Male | Female |
| Less than 5 Minutes | 307 (1.4%) | 323 (2.1%) |
| 5 to 9 Minutes | 2,451 (10.9%) | 2,336 (15.4%) |
| 10 to 14 Minutes | 3,455 (15.3%) | 3,201 (21.0%) |
| 15 to 19 Minutes | 3,867 (17.2%) | 2,767 (18.2%) |
| 20 to 24 Minutes | 3,952 (17.5%) | 2,383 (15.7%) |
| 25 to 29 Minutes | 1,991 (8.8%) | 1,047 (6.9%) |
| 30 to 34 Minutes | 3,118 (13.8%) | 1,549 (10.2%) |
| 35 to 39 Minutes | 730 (3.2%) | 313 (2.1%) |
| 40 to 44 Minutes | 837 (3.7%) | 425 (2.8%) |
| 45 to 59 Minutes | 1,152 (5.1%) | 610 (4.0%) |
| 60 to 89 Minutes | 386 (1.7%) | 67 (0.4%) |
| 90 or more Minutes | 288 (1.3%) | 189 (1.2%) |
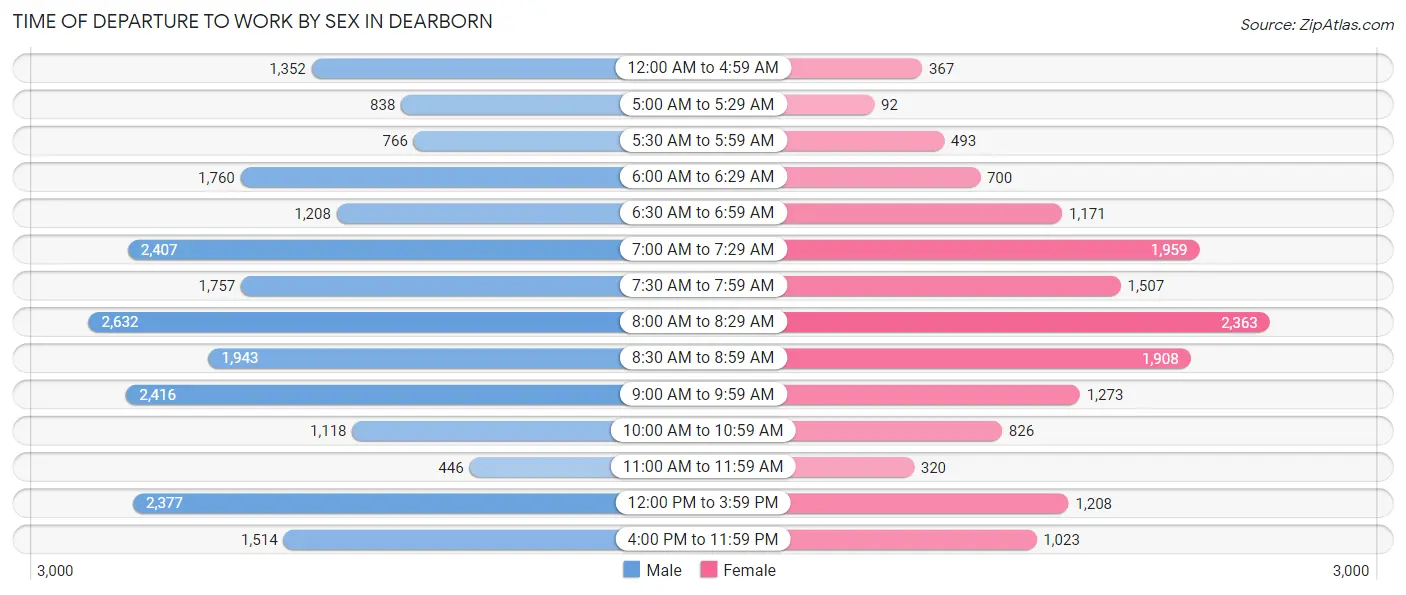
Time of Departure to Work by Sex in Dearborn
The most frequent times of departure to work in Dearborn are 8:00 AM to 8:29 AM (2,632, 11.7%) for males and 8:00 AM to 8:29 AM (2,363, 15.5%) for females.
| Time of Departure | Male | Female |
| 12:00 AM to 4:59 AM | 1,352 (6.0%) | 367 (2.4%) |
| 5:00 AM to 5:29 AM | 838 (3.7%) | 92 (0.6%) |
| 5:30 AM to 5:59 AM | 766 (3.4%) | 493 (3.2%) |
| 6:00 AM to 6:29 AM | 1,760 (7.8%) | 700 (4.6%) |
| 6:30 AM to 6:59 AM | 1,208 (5.4%) | 1,171 (7.7%) |
| 7:00 AM to 7:29 AM | 2,407 (10.7%) | 1,959 (12.9%) |
| 7:30 AM to 7:59 AM | 1,757 (7.8%) | 1,507 (9.9%) |
| 8:00 AM to 8:29 AM | 2,632 (11.7%) | 2,363 (15.5%) |
| 8:30 AM to 8:59 AM | 1,943 (8.6%) | 1,908 (12.5%) |
| 9:00 AM to 9:59 AM | 2,416 (10.7%) | 1,273 (8.4%) |
| 10:00 AM to 10:59 AM | 1,118 (5.0%) | 826 (5.4%) |
| 11:00 AM to 11:59 AM | 446 (2.0%) | 320 (2.1%) |
| 12:00 PM to 3:59 PM | 2,377 (10.5%) | 1,208 (7.9%) |
| 4:00 PM to 11:59 PM | 1,514 (6.7%) | 1,023 (6.7%) |
| Total | 22,534 (100.0%) | 15,210 (100.0%) |
Housing Occupancy in Dearborn
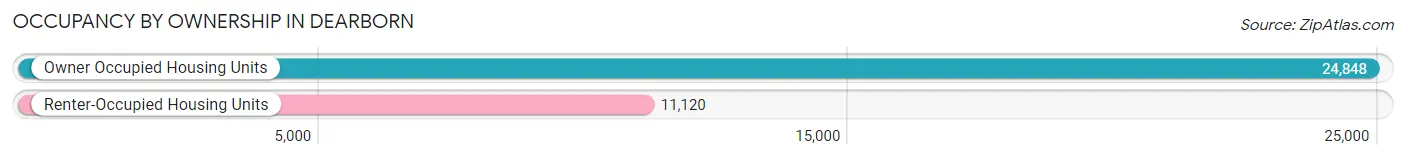
Occupancy by Ownership in Dearborn
Of the total 35,968 dwellings in Dearborn, owner-occupied units account for 24,848 (69.1%), while renter-occupied units make up 11,120 (30.9%).
| Occupancy | # Housing Units | % Housing Units |
| Owner Occupied Housing Units | 24,848 | 69.1% |
| Renter-Occupied Housing Units | 11,120 | 30.9% |
| Total Occupied Housing Units | 35,968 | 100.0% |
Occupancy by Household Size in Dearborn
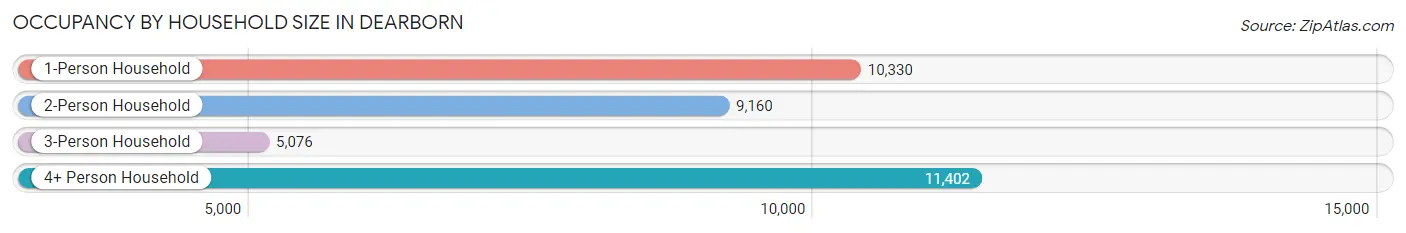
| Household Size | # Housing Units | % Housing Units |
| 1-Person Household | 10,330 | 28.7% |
| 2-Person Household | 9,160 | 25.5% |
| 3-Person Household | 5,076 | 14.1% |
| 4+ Person Household | 11,402 | 31.7% |
| Total Housing Units | 35,968 | 100.0% |
Occupancy by Ownership by Household Size in Dearborn
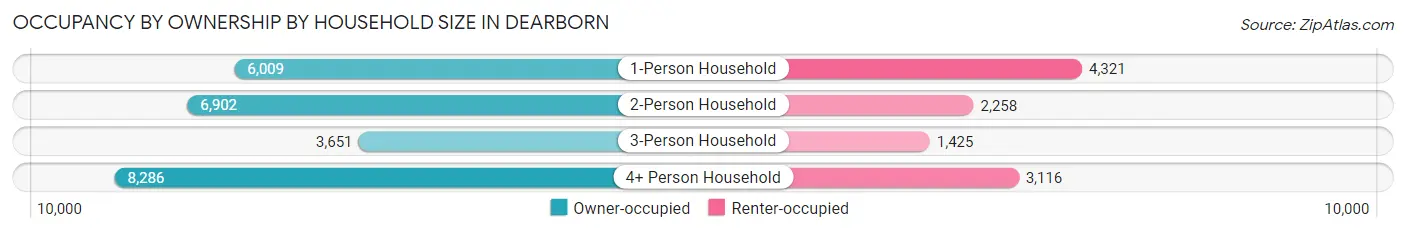
| Household Size | Owner-occupied | Renter-occupied |
| 1-Person Household | 6,009 (58.2%) | 4,321 (41.8%) |
| 2-Person Household | 6,902 (75.3%) | 2,258 (24.6%) |
| 3-Person Household | 3,651 (71.9%) | 1,425 (28.1%) |
| 4+ Person Household | 8,286 (72.7%) | 3,116 (27.3%) |
| Total Housing Units | 24,848 (69.1%) | 11,120 (30.9%) |
Occupancy by Educational Attainment in Dearborn
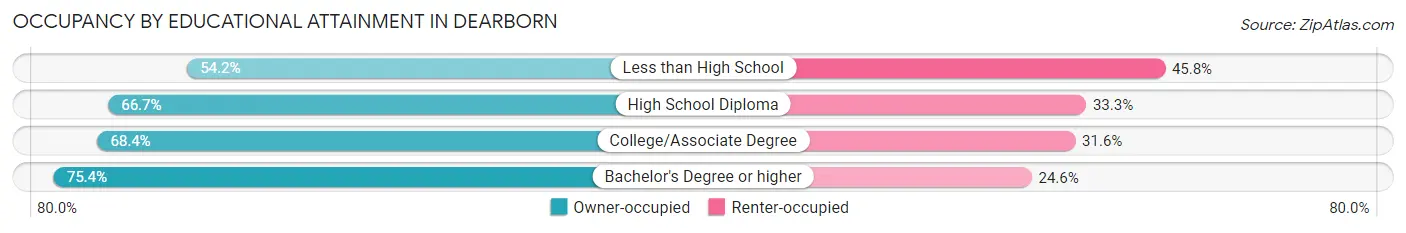
| Household Size | Owner-occupied | Renter-occupied |
| Less than High School | 2,266 (54.2%) | 1,915 (45.8%) |
| High School Diploma | 4,920 (66.7%) | 2,454 (33.3%) |
| College/Associate Degree | 7,277 (68.4%) | 3,355 (31.6%) |
| Bachelor's Degree or higher | 10,385 (75.4%) | 3,396 (24.6%) |
Occupancy by Age of Householder in Dearborn
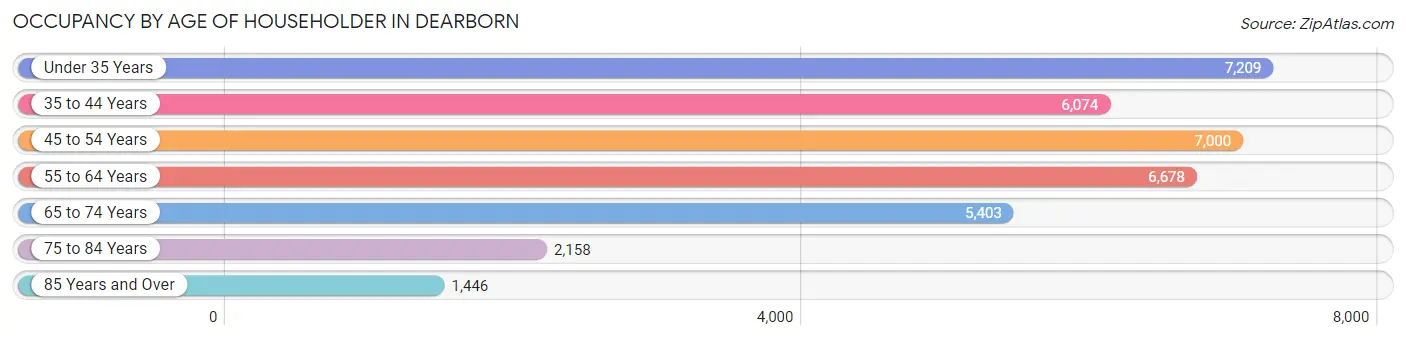
| Age Bracket | # Households | % Households |
| Under 35 Years | 7,209 | 20.0% |
| 35 to 44 Years | 6,074 | 16.9% |
| 45 to 54 Years | 7,000 | 19.5% |
| 55 to 64 Years | 6,678 | 18.6% |
| 65 to 74 Years | 5,403 | 15.0% |
| 75 to 84 Years | 2,158 | 6.0% |
| 85 Years and Over | 1,446 | 4.0% |
| Total | 35,968 | 100.0% |
Housing Finances in Dearborn
Median Income by Occupancy in Dearborn
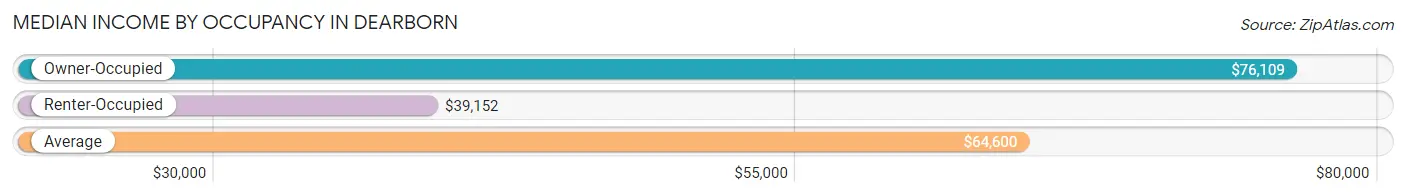
| Occupancy Type | # Households | Median Income |
| Owner-Occupied | 24,848 (69.1%) | $76,109 |
| Renter-Occupied | 11,120 (30.9%) | $39,152 |
| Average | 35,968 (100.0%) | $64,600 |
Occupancy by Householder Income Bracket in Dearborn
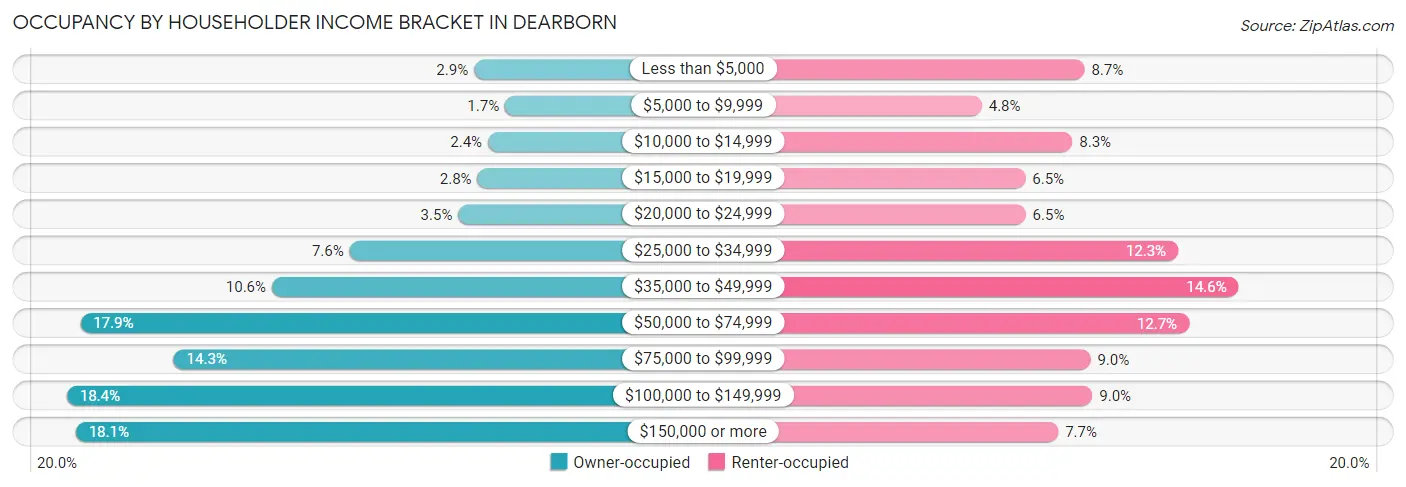
| Income Bracket | Owner-occupied | Renter-occupied |
| Less than $5,000 | 716 (2.9%) | 970 (8.7%) |
| $5,000 to $9,999 | 423 (1.7%) | 535 (4.8%) |
| $10,000 to $14,999 | 583 (2.4%) | 919 (8.3%) |
| $15,000 to $19,999 | 684 (2.8%) | 719 (6.5%) |
| $20,000 to $24,999 | 864 (3.5%) | 721 (6.5%) |
| $25,000 to $34,999 | 1,893 (7.6%) | 1,366 (12.3%) |
| $35,000 to $49,999 | 2,630 (10.6%) | 1,622 (14.6%) |
| $50,000 to $74,999 | 4,442 (17.9%) | 1,412 (12.7%) |
| $75,000 to $99,999 | 3,558 (14.3%) | 995 (8.9%) |
| $100,000 to $149,999 | 4,569 (18.4%) | 1,003 (9.0%) |
| $150,000 or more | 4,486 (18.0%) | 858 (7.7%) |
| Total | 24,848 (100.0%) | 11,120 (100.0%) |
Monthly Housing Cost Tiers in Dearborn
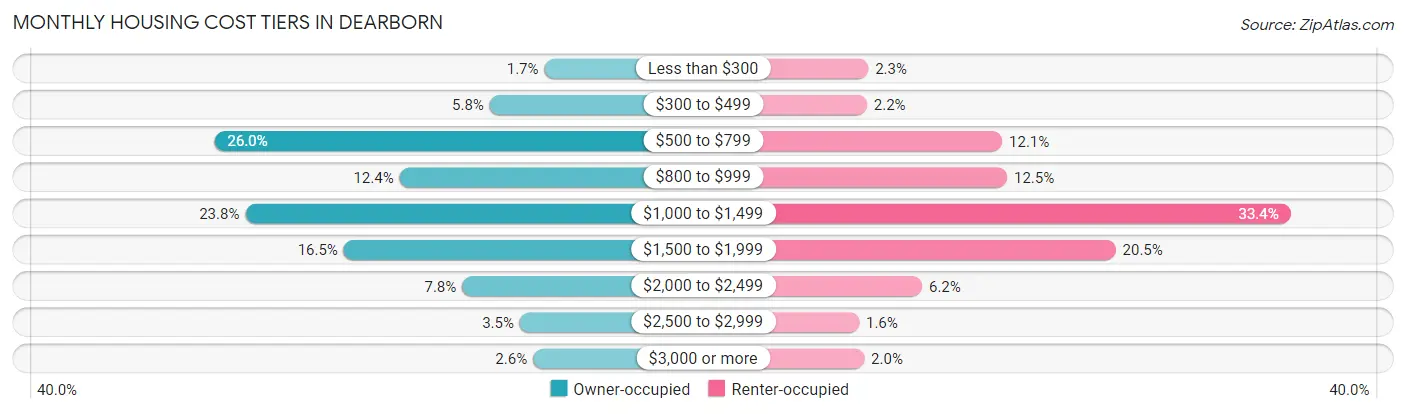
| Monthly Cost | Owner-occupied | Renter-occupied |
| Less than $300 | 428 (1.7%) | 252 (2.3%) |
| $300 to $499 | 1,429 (5.8%) | 241 (2.2%) |
| $500 to $799 | 6,466 (26.0%) | 1,349 (12.1%) |
| $800 to $999 | 3,079 (12.4%) | 1,389 (12.5%) |
| $1,000 to $1,499 | 5,901 (23.7%) | 3,711 (33.4%) |
| $1,500 to $1,999 | 4,101 (16.5%) | 2,278 (20.5%) |
| $2,000 to $2,499 | 1,932 (7.8%) | 693 (6.2%) |
| $2,500 to $2,999 | 876 (3.5%) | 177 (1.6%) |
| $3,000 or more | 636 (2.6%) | 219 (2.0%) |
| Total | 24,848 (100.0%) | 11,120 (100.0%) |
Physical Housing Characteristics in Dearborn
Housing Structures in Dearborn
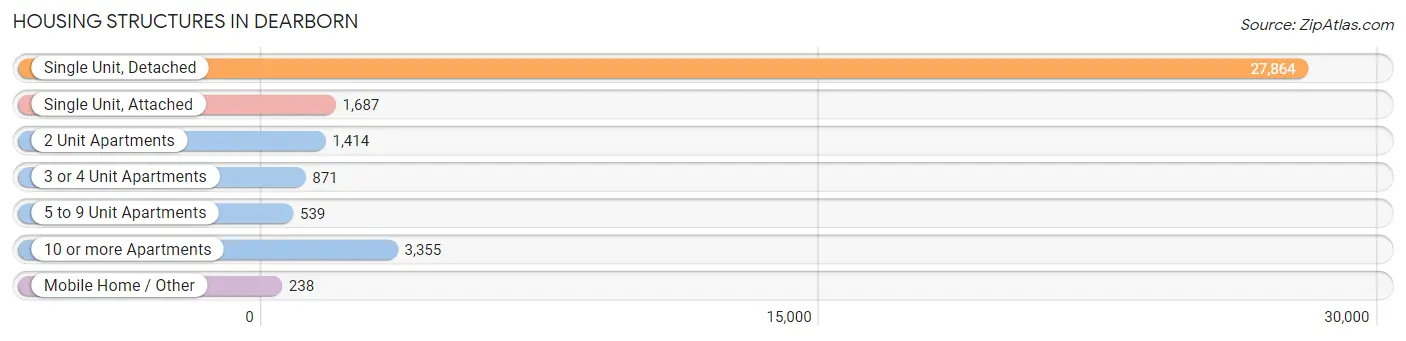
| Structure Type | # Housing Units | % Housing Units |
| Single Unit, Detached | 27,864 | 77.5% |
| Single Unit, Attached | 1,687 | 4.7% |
| 2 Unit Apartments | 1,414 | 3.9% |
| 3 or 4 Unit Apartments | 871 | 2.4% |
| 5 to 9 Unit Apartments | 539 | 1.5% |
| 10 or more Apartments | 3,355 | 9.3% |
| Mobile Home / Other | 238 | 0.7% |
| Total | 35,968 | 100.0% |
Housing Structures by Occupancy in Dearborn
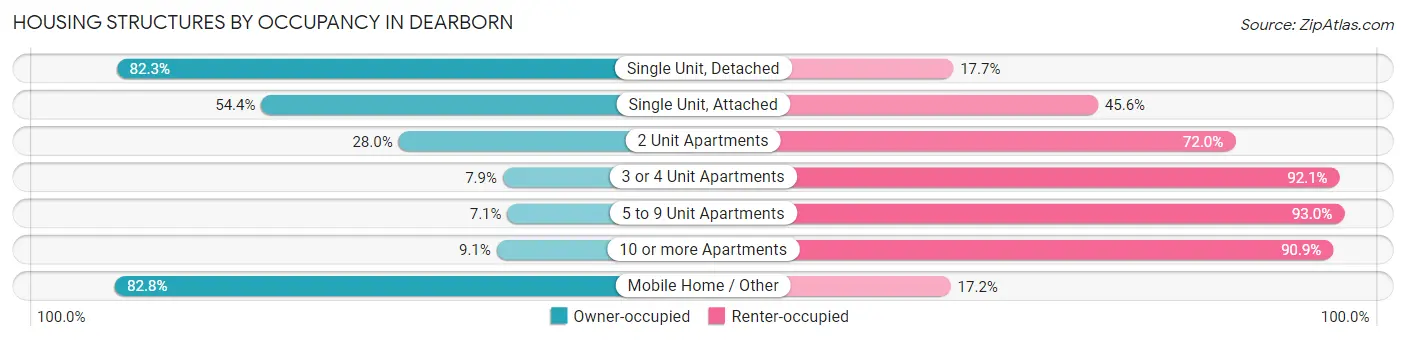
| Structure Type | Owner-occupied | Renter-occupied |
| Single Unit, Detached | 22,924 (82.3%) | 4,940 (17.7%) |
| Single Unit, Attached | 918 (54.4%) | 769 (45.6%) |
| 2 Unit Apartments | 396 (28.0%) | 1,018 (72.0%) |
| 3 or 4 Unit Apartments | 69 (7.9%) | 802 (92.1%) |
| 5 to 9 Unit Apartments | 38 (7.0%) | 501 (92.9%) |
| 10 or more Apartments | 306 (9.1%) | 3,049 (90.9%) |
| Mobile Home / Other | 197 (82.8%) | 41 (17.2%) |
| Total | 24,848 (69.1%) | 11,120 (30.9%) |
Housing Structures by Number of Rooms in Dearborn
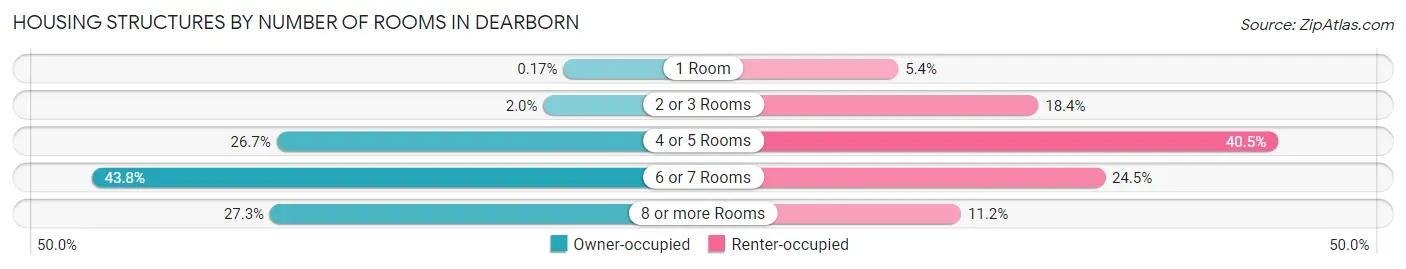
| Number of Rooms | Owner-occupied | Renter-occupied |
| 1 Room | 41 (0.2%) | 600 (5.4%) |
| 2 or 3 Rooms | 502 (2.0%) | 2,041 (18.3%) |
| 4 or 5 Rooms | 6,635 (26.7%) | 4,505 (40.5%) |
| 6 or 7 Rooms | 10,884 (43.8%) | 2,727 (24.5%) |
| 8 or more Rooms | 6,786 (27.3%) | 1,247 (11.2%) |
| Total | 24,848 (100.0%) | 11,120 (100.0%) |
Housing Structure by Heating Type in Dearborn
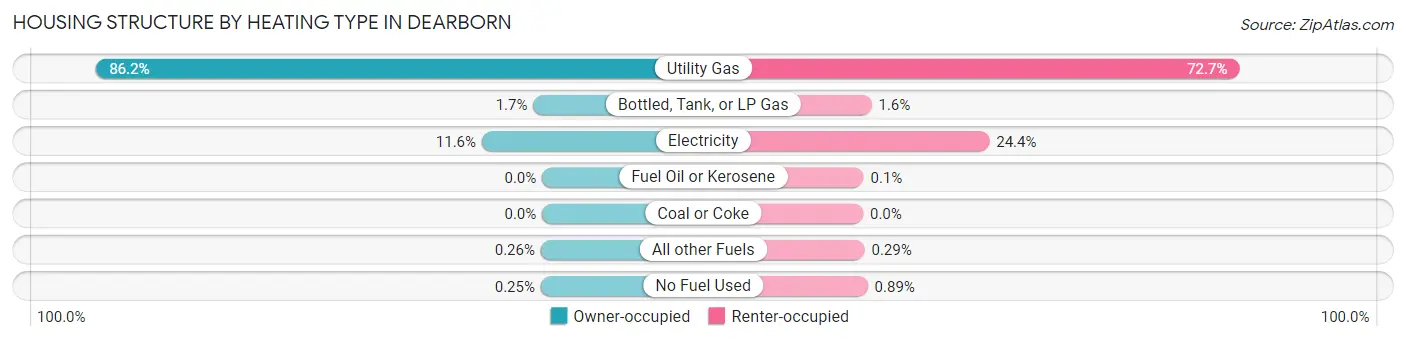
| Heating Type | Owner-occupied | Renter-occupied |
| Utility Gas | 21,406 (86.2%) | 8,083 (72.7%) |
| Bottled, Tank, or LP Gas | 422 (1.7%) | 182 (1.6%) |
| Electricity | 2,893 (11.6%) | 2,713 (24.4%) |
| Fuel Oil or Kerosene | 0 (0.0%) | 11 (0.1%) |
| Coal or Coke | 0 (0.0%) | 0 (0.0%) |
| All other Fuels | 64 (0.3%) | 32 (0.3%) |
| No Fuel Used | 63 (0.3%) | 99 (0.9%) |
| Total | 24,848 (100.0%) | 11,120 (100.0%) |
Household Vehicle Usage in Dearborn
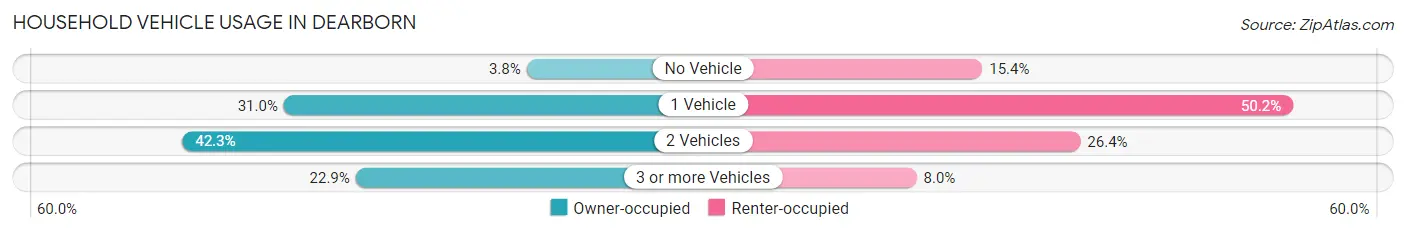
| Vehicles per Household | Owner-occupied | Renter-occupied |
| No Vehicle | 938 (3.8%) | 1,711 (15.4%) |
| 1 Vehicle | 7,695 (31.0%) | 5,582 (50.2%) |
| 2 Vehicles | 10,519 (42.3%) | 2,934 (26.4%) |
| 3 or more Vehicles | 5,696 (22.9%) | 893 (8.0%) |
| Total | 24,848 (100.0%) | 11,120 (100.0%) |
Real Estate & Mortgages in Dearborn
Real Estate and Mortgage Overview in Dearborn
| Characteristic | Without Mortgage | With Mortgage |
| Housing Units | 12,091 | 12,757 |
| Median Property Value | $179,400 | $201,300 |
| Median Household Income | $64,389 | $2,866 |
| Monthly Housing Costs | $708 | $572 |
| Real Estate Taxes | $3,524 | $292 |
Property Value by Mortgage Status in Dearborn
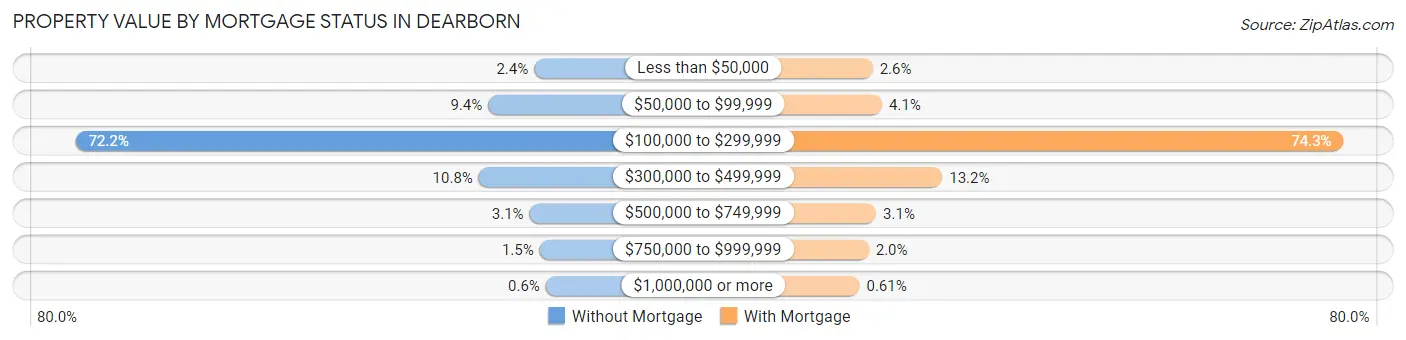
| Property Value | Without Mortgage | With Mortgage |
| Less than $50,000 | 287 (2.4%) | 334 (2.6%) |
| $50,000 to $99,999 | 1,134 (9.4%) | 517 (4.1%) |
| $100,000 to $299,999 | 8,734 (72.2%) | 9,484 (74.3%) |
| $300,000 to $499,999 | 1,307 (10.8%) | 1,686 (13.2%) |
| $500,000 to $749,999 | 371 (3.1%) | 400 (3.1%) |
| $750,000 to $999,999 | 185 (1.5%) | 258 (2.0%) |
| $1,000,000 or more | 73 (0.6%) | 78 (0.6%) |
| Total | 12,091 (100.0%) | 12,757 (100.0%) |
Household Income by Mortgage Status in Dearborn
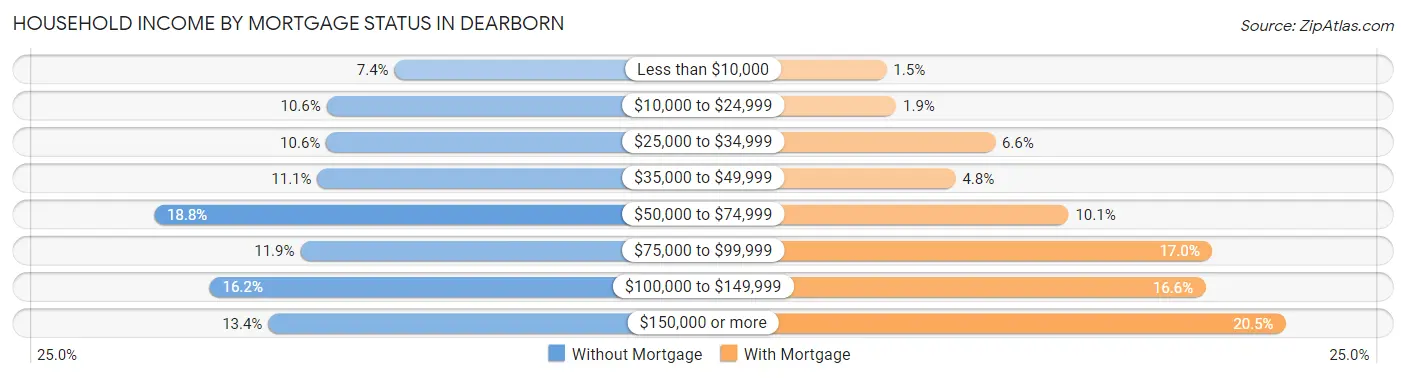
| Household Income | Without Mortgage | With Mortgage |
| Less than $10,000 | 893 (7.4%) | 188 (1.5%) |
| $10,000 to $24,999 | 1,284 (10.6%) | 246 (1.9%) |
| $25,000 to $34,999 | 1,286 (10.6%) | 847 (6.6%) |
| $35,000 to $49,999 | 1,337 (11.1%) | 607 (4.8%) |
| $50,000 to $74,999 | 2,278 (18.8%) | 1,293 (10.1%) |
| $75,000 to $99,999 | 1,435 (11.9%) | 2,164 (17.0%) |
| $100,000 to $149,999 | 1,958 (16.2%) | 2,123 (16.6%) |
| $150,000 or more | 1,620 (13.4%) | 2,611 (20.5%) |
| Total | 12,091 (100.0%) | 12,757 (100.0%) |
Property Value to Household Income Ratio in Dearborn
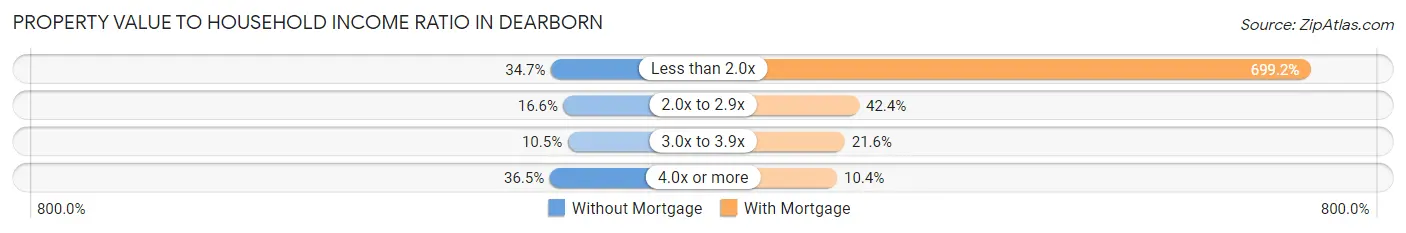
| Value-to-Income Ratio | Without Mortgage | With Mortgage |
| Less than 2.0x | 4,201 (34.7%) | 89,195 (699.2%) |
| 2.0x to 2.9x | 2,006 (16.6%) | 5,403 (42.3%) |
| 3.0x to 3.9x | 1,273 (10.5%) | 2,760 (21.6%) |
| 4.0x or more | 4,417 (36.5%) | 1,323 (10.4%) |
| Total | 12,091 (100.0%) | 12,757 (100.0%) |
Real Estate Taxes by Mortgage Status in Dearborn
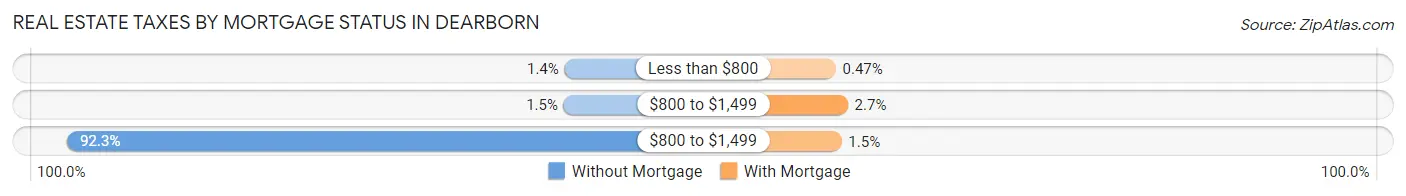
| Property Taxes | Without Mortgage | With Mortgage |
| Less than $800 | 166 (1.4%) | 60 (0.5%) |
| $800 to $1,499 | 183 (1.5%) | 340 (2.7%) |
| $800 to $1,499 | 11,154 (92.2%) | 195 (1.5%) |
| Total | 12,091 (100.0%) | 12,757 (100.0%) |
Health & Disability in Dearborn
Health Insurance Coverage by Age in Dearborn
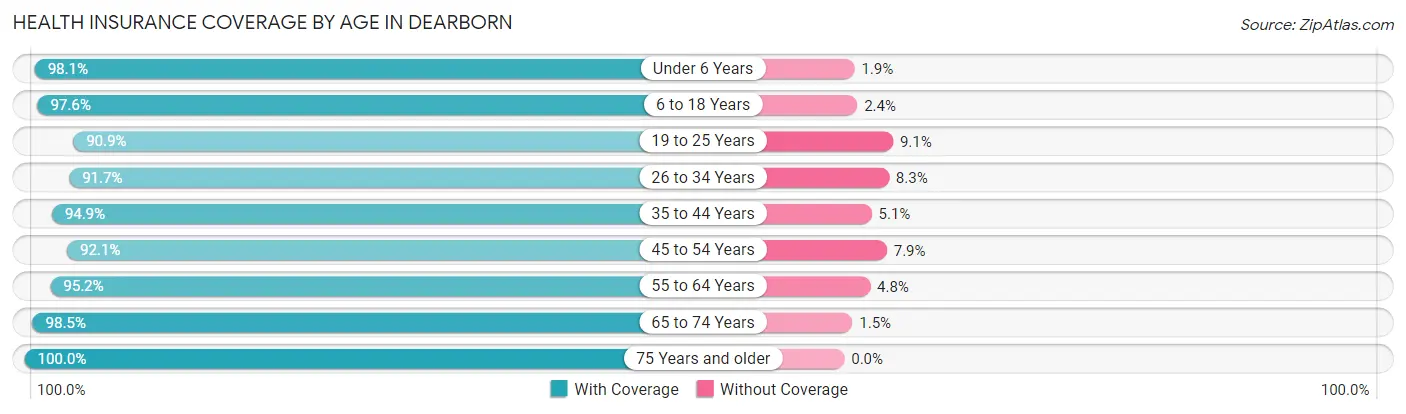
| Age Bracket | With Coverage | Without Coverage |
| Under 6 Years | 8,573 (98.1%) | 166 (1.9%) |
| 6 to 18 Years | 23,495 (97.6%) | 581 (2.4%) |
| 19 to 25 Years | 10,190 (90.9%) | 1,017 (9.1%) |
| 26 to 34 Years | 12,922 (91.7%) | 1,173 (8.3%) |
| 35 to 44 Years | 12,243 (94.9%) | 657 (5.1%) |
| 45 to 54 Years | 11,370 (92.1%) | 978 (7.9%) |
| 55 to 64 Years | 10,495 (95.2%) | 530 (4.8%) |
| 65 to 74 Years | 8,352 (98.5%) | 127 (1.5%) |
| 75 Years and older | 5,271 (100.0%) | 0 (0.0%) |
| Total | 102,911 (95.2%) | 5,229 (4.8%) |
Health Insurance Coverage by Citizenship Status in Dearborn
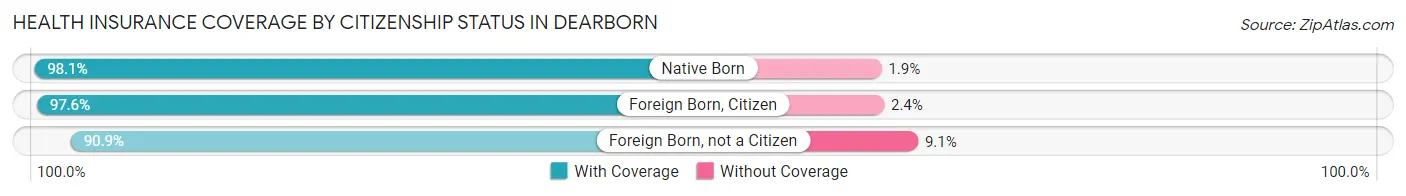
| Citizenship Status | With Coverage | Without Coverage |
| Native Born | 8,573 (98.1%) | 166 (1.9%) |
| Foreign Born, Citizen | 23,495 (97.6%) | 581 (2.4%) |
| Foreign Born, not a Citizen | 10,190 (90.9%) | 1,017 (9.1%) |
Health Insurance Coverage by Household Income in Dearborn
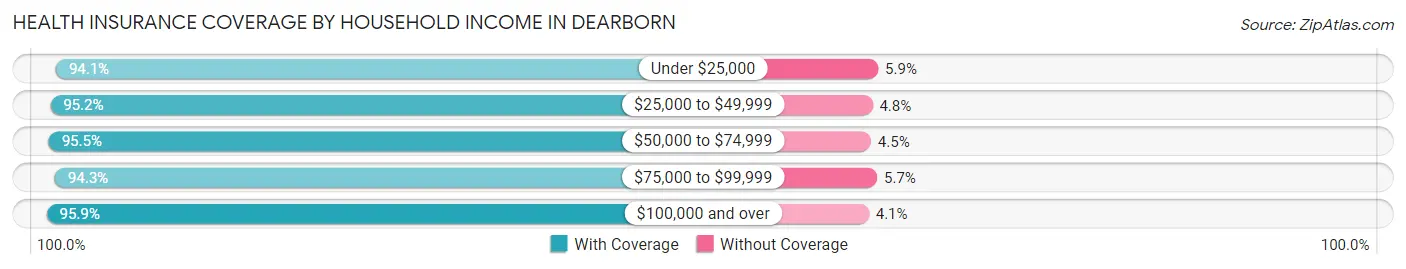
| Household Income | With Coverage | Without Coverage |
| Under $25,000 | 17,035 (94.1%) | 1,064 (5.9%) |
| $25,000 to $49,999 | 21,829 (95.2%) | 1,103 (4.8%) |
| $50,000 to $74,999 | 15,665 (95.5%) | 742 (4.5%) |
| $75,000 to $99,999 | 13,980 (94.3%) | 842 (5.7%) |
| $100,000 and over | 34,371 (95.9%) | 1,477 (4.1%) |
Public vs Private Health Insurance Coverage by Age in Dearborn
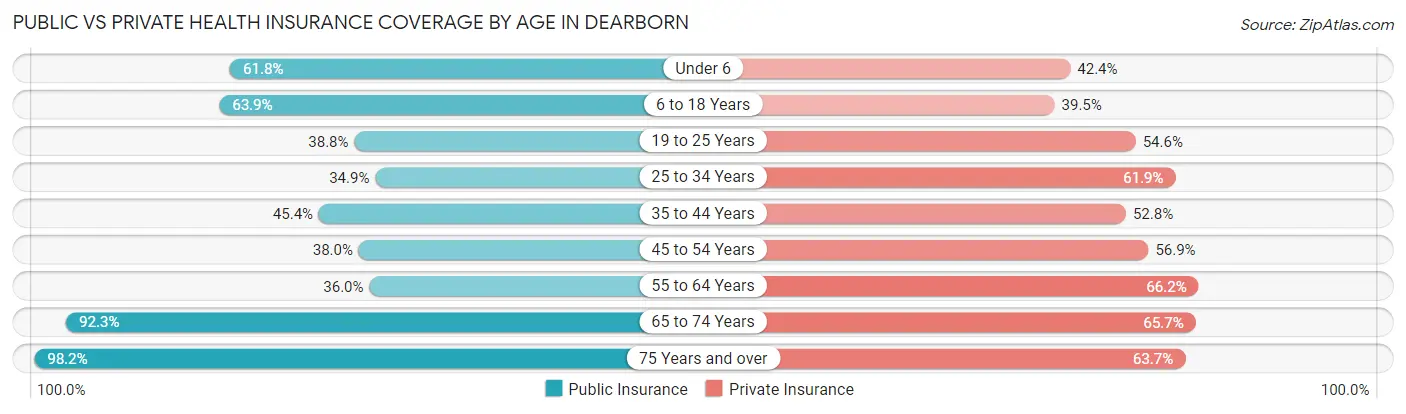
| Age Bracket | Public Insurance | Private Insurance |
| Under 6 | 5,404 (61.8%) | 3,707 (42.4%) |
| 6 to 18 Years | 15,374 (63.9%) | 9,511 (39.5%) |
| 19 to 25 Years | 4,347 (38.8%) | 6,115 (54.6%) |
| 25 to 34 Years | 4,922 (34.9%) | 8,726 (61.9%) |
| 35 to 44 Years | 5,853 (45.4%) | 6,805 (52.7%) |
| 45 to 54 Years | 4,688 (38.0%) | 7,029 (56.9%) |
| 55 to 64 Years | 3,970 (36.0%) | 7,299 (66.2%) |
| 65 to 74 Years | 7,826 (92.3%) | 5,567 (65.7%) |
| 75 Years and over | 5,176 (98.2%) | 3,358 (63.7%) |
| Total | 57,560 (53.2%) | 58,117 (53.7%) |
Disability Status by Sex by Age in Dearborn
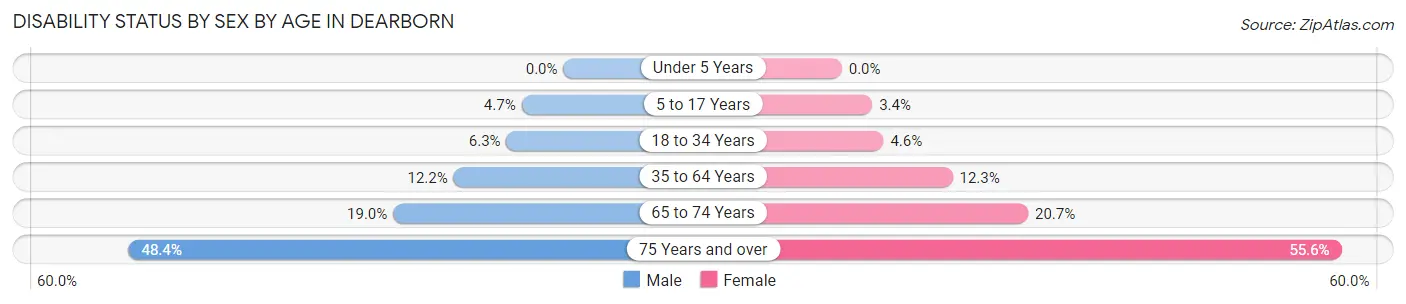
| Age Bracket | Male | Female |
| Under 5 Years | 0 (0.0%) | 0 (0.0%) |
| 5 to 17 Years | 577 (4.7%) | 384 (3.4%) |
| 18 to 34 Years | 907 (6.3%) | 594 (4.6%) |
| 35 to 64 Years | 2,174 (12.2%) | 2,281 (12.3%) |
| 65 to 74 Years | 727 (19.0%) | 963 (20.7%) |
| 75 Years and over | 1,024 (48.4%) | 1,756 (55.6%) |
Disability Class by Sex by Age in Dearborn
Disability Class: Hearing Difficulty
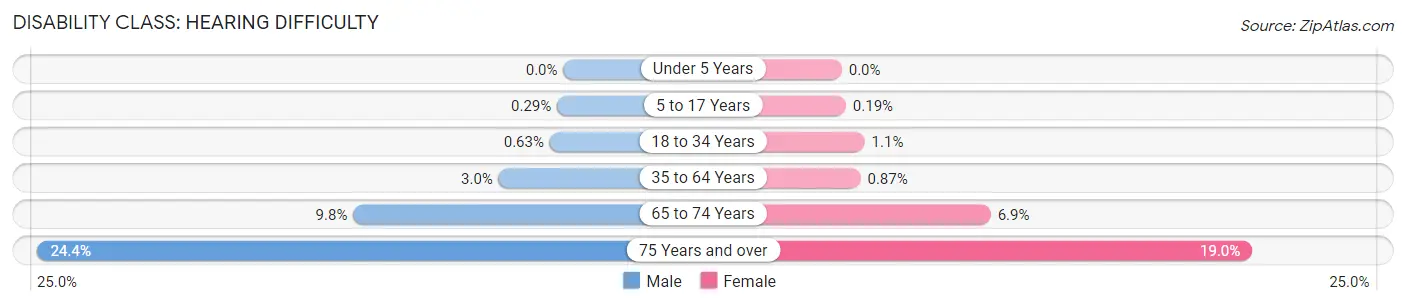
| Age Bracket | Male | Female |
| Under 5 Years | 0 (0.0%) | 0 (0.0%) |
| 5 to 17 Years | 36 (0.3%) | 22 (0.2%) |
| 18 to 34 Years | 90 (0.6%) | 136 (1.1%) |
| 35 to 64 Years | 533 (3.0%) | 161 (0.9%) |
| 65 to 74 Years | 374 (9.8%) | 321 (6.9%) |
| 75 Years and over | 516 (24.4%) | 601 (19.0%) |
Disability Class: Vision Difficulty
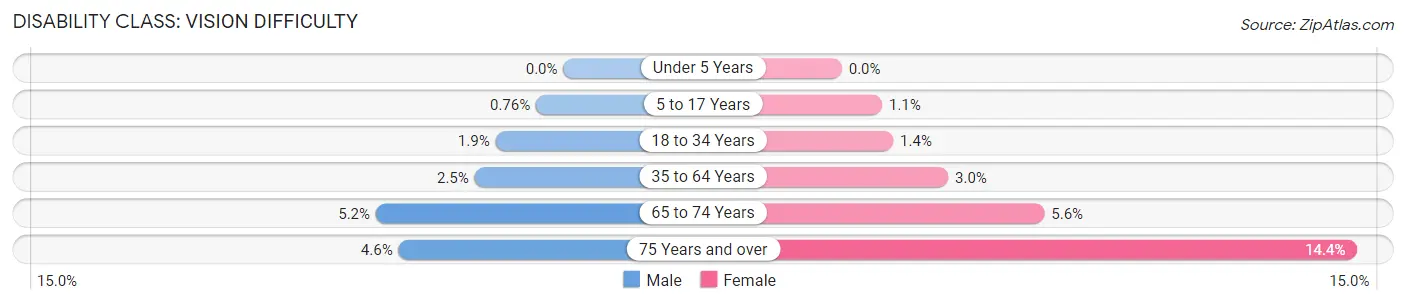
| Age Bracket | Male | Female |
| Under 5 Years | 0 (0.0%) | 0 (0.0%) |
| 5 to 17 Years | 94 (0.8%) | 127 (1.1%) |
| 18 to 34 Years | 270 (1.9%) | 183 (1.4%) |
| 35 to 64 Years | 439 (2.5%) | 548 (3.0%) |
| 65 to 74 Years | 200 (5.2%) | 262 (5.6%) |
| 75 Years and over | 97 (4.6%) | 453 (14.3%) |
Disability Class: Cognitive Difficulty
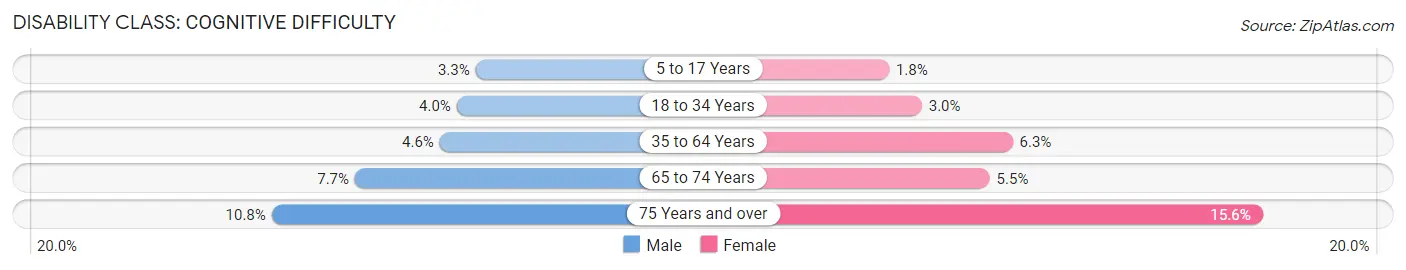
| Age Bracket | Male | Female |
| 5 to 17 Years | 404 (3.3%) | 198 (1.8%) |
| 18 to 34 Years | 566 (4.0%) | 380 (3.0%) |
| 35 to 64 Years | 815 (4.6%) | 1,173 (6.3%) |
| 65 to 74 Years | 297 (7.7%) | 255 (5.5%) |
| 75 Years and over | 229 (10.8%) | 493 (15.6%) |
Disability Class: Ambulatory Difficulty
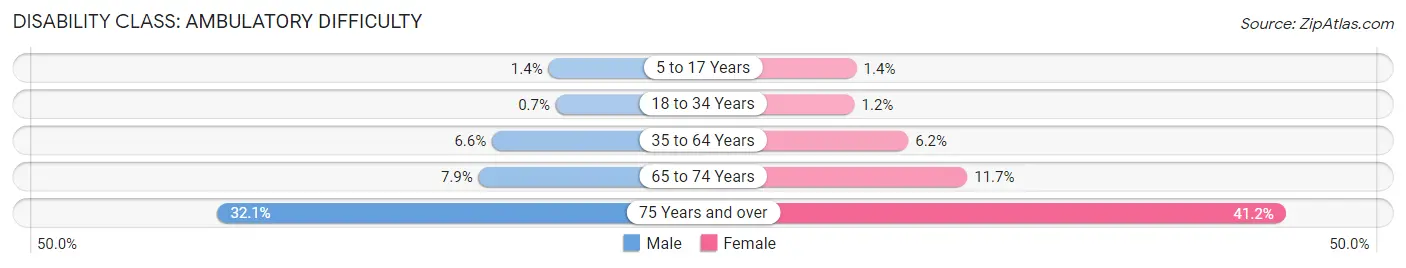
| Age Bracket | Male | Female |
| 5 to 17 Years | 171 (1.4%) | 156 (1.4%) |
| 18 to 34 Years | 100 (0.7%) | 152 (1.2%) |
| 35 to 64 Years | 1,176 (6.6%) | 1,142 (6.2%) |
| 65 to 74 Years | 302 (7.9%) | 541 (11.7%) |
| 75 Years and over | 679 (32.1%) | 1,300 (41.2%) |
Disability Class: Self-Care Difficulty
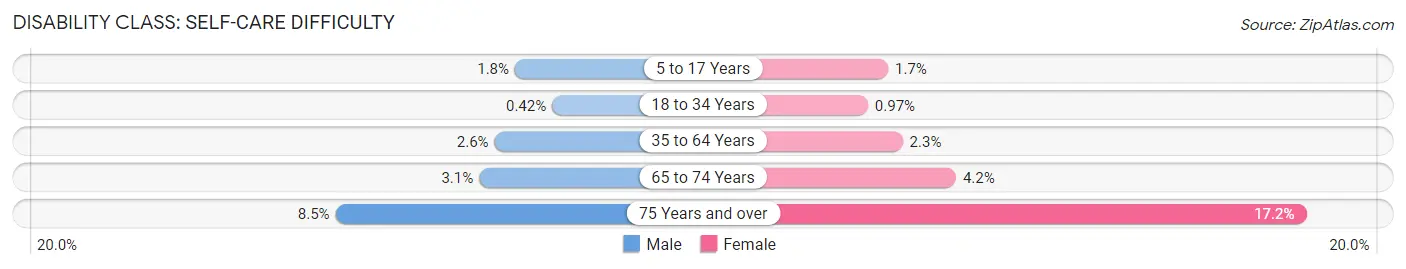
| Age Bracket | Male | Female |
| 5 to 17 Years | 223 (1.8%) | 195 (1.7%) |
| 18 to 34 Years | 60 (0.4%) | 124 (1.0%) |
| 35 to 64 Years | 455 (2.6%) | 418 (2.3%) |
| 65 to 74 Years | 120 (3.1%) | 197 (4.2%) |
| 75 Years and over | 179 (8.5%) | 544 (17.2%) |
Technology Access in Dearborn
Computing Device Access in Dearborn
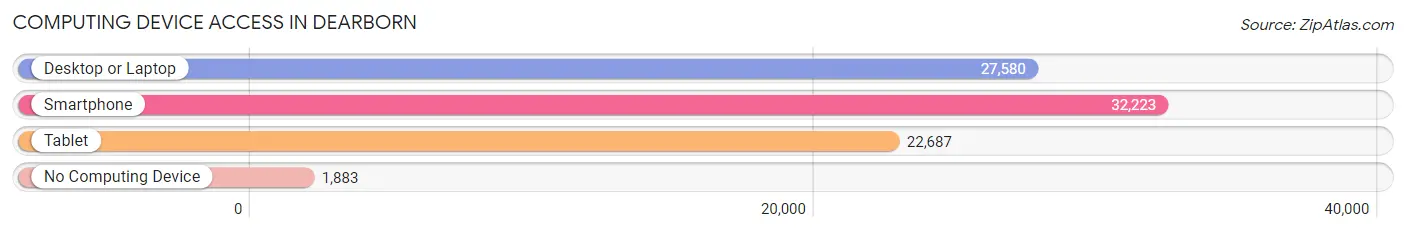
| Device Type | # Households | % Households |
| Desktop or Laptop | 27,580 | 76.7% |
| Smartphone | 32,223 | 89.6% |
| Tablet | 22,687 | 63.1% |
| No Computing Device | 1,883 | 5.2% |
| Total | 35,968 | 100.0% |
Internet Access in Dearborn
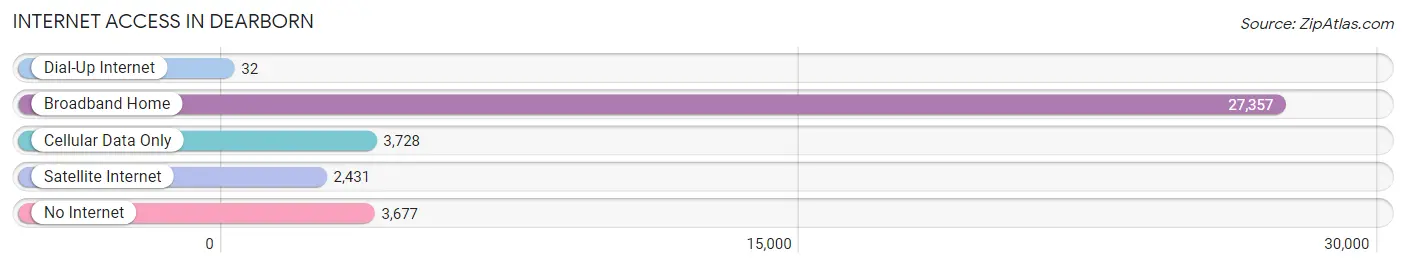
| Internet Type | # Households | % Households |
| Dial-Up Internet | 32 | 0.1% |
| Broadband Home | 27,357 | 76.1% |
| Cellular Data Only | 3,728 | 10.4% |
| Satellite Internet | 2,431 | 6.8% |
| No Internet | 3,677 | 10.2% |
| Total | 35,968 | 100.0% |
Dearborn Summary
Dearborn, Michigan is a city located in Wayne County, Michigan, United States. It is part of the Detroit metropolitan area and is the eighth largest city in the state. The city is home to the world headquarters of the Ford Motor Company and the Henry Ford Museum and Greenfield Village.
History
The area that is now Dearborn was first settled in the late 18th century by French-Canadian farmers. The city was officially founded in 1836 by a group of settlers from New York and named after Henry Dearborn, a Revolutionary War hero and the Secretary of War under President Thomas Jefferson.
In the early 20th century, Dearborn became a major industrial center, with the Ford Motor Company establishing its world headquarters in the city in 1903. The city experienced a population boom in the 1950s and 1960s, as many people moved to the area to take advantage of the economic opportunities provided by the auto industry.
Geography
Dearborn is located in southeastern Michigan, about 15 miles west of Detroit. It is situated on the Rouge River, which flows into the Detroit River. The city covers an area of 24.2 square miles and has a population of 97,775 as of the 2020 census.
The city is divided into several distinct neighborhoods, including the historic West Dearborn, the industrial East Dearborn, and the residential South Dearborn. The city is also home to the University of Michigan-Dearborn, which is located in the northern part of the city.
Economy
Dearborn is home to the world headquarters of the Ford Motor Company, which is the city’s largest employer. The company employs over 30,000 people in the city and has a major impact on the local economy. Other major employers in the city include the University of Michigan-Dearborn, the Henry Ford Health System, and the Dearborn Public Schools.
The city is also home to several shopping centers, including the Fairlane Town Center and the Westland Center. The city is also home to several museums, including the Henry Ford Museum and Greenfield Village, the Arab American National Museum, and the Automotive Hall of Fame.
Demographics
As of the 2020 census, the population of Dearborn was 97,775, making it the eighth largest city in Michigan. The city has a diverse population, with the largest ethnic groups being White (63.2%), African American (25.2%), and Arab American (7.2%). The median household income in the city is $50,945, and the median home value is $133,400.
The city is served by the Dearborn Public Schools, which includes 19 elementary schools, five middle schools, and three high schools. The city is also home to the University of Michigan-Dearborn, which has an enrollment of over 8,000 students.
Conclusion
Dearborn, Michigan is a city located in Wayne County, Michigan, United States. It is part of the Detroit metropolitan area and is the eighth largest city in the state. The city is home to the world headquarters of the Ford Motor Company and the Henry Ford Museum and Greenfield Village. The city has a diverse population, with the largest ethnic groups being White (63.2%), African American (25.2%), and Arab American (7.2%). The city is served by the Dearborn Public Schools and is home to the University of Michigan-Dearborn. The city is also home to several shopping centers and museums, and is a major industrial center, with the Ford Motor Company being the city’s largest employer.
Common Questions
What is Per Capita Income in Dearborn?
Per Capita income in Dearborn is $29,174.
What is the Median Family Income in Dearborn?
Median Family Income in Dearborn is $74,751.
What is the Median Household income in Dearborn?
Median Household Income in Dearborn is $64,600.
What is Income or Wage Gap in Dearborn?
Income or Wage Gap in Dearborn is 18.0%.
Women in Dearborn earn 82.0 cents for every dollar earned by a man.
What is Family Income Deficit in Dearborn?
Family Income Deficit in Dearborn is $13,803.
Families that are below poverty line in Dearborn earn $13,803 less on average than the poverty threshold level.
What is Inequality or Gini Index in Dearborn?
Inequality or Gini Index in Dearborn is 0.46.
What is the Total Population of Dearborn?
Total Population of Dearborn is 108,414.
What is the Total Male Population of Dearborn?
Total Male Population of Dearborn is 54,070.
What is the Total Female Population of Dearborn?
Total Female Population of Dearborn is 54,344.
What is the Ratio of Males per 100 Females in Dearborn?
There are 99.50 Males per 100 Females in Dearborn.
What is the Ratio of Females per 100 Males in Dearborn?
There are 100.51 Females per 100 Males in Dearborn.
What is the Median Population Age in Dearborn?
Median Population Age in Dearborn is 32.3 Years.
What is the Average Family Size in Dearborn
Average Family Size in Dearborn is 3.9 People.
What is the Average Household Size in Dearborn
Average Household Size in Dearborn is 3.0 People.
How Large is the Labor Force in Dearborn?
There are 46,214 People in the Labor Forcein in Dearborn.
What is the Percentage of People in the Labor Force in Dearborn?
56.7% of People are in the Labor Force in Dearborn.
What is the Unemployment Rate in Dearborn?
Unemployment Rate in Dearborn is 6.8%.