Kenosha, WI Map & Demographics
Kenosha Map
Kenosha Overview
$33,894
PER CAPITA INCOME
$81,270
AVG FAMILY INCOME
$64,963
AVG HOUSEHOLD INCOME
26.3%
WAGE / INCOME GAP [ % ]
73.7¢/ $1
WAGE / INCOME GAP [ $ ]
$9,799
FAMILY INCOME DEFICIT
0.43
INEQUALITY / GINI INDEX
99,493
TOTAL POPULATION
48,454
MALE POPULATION
51,039
FEMALE POPULATION
94.94
MALES / 100 FEMALES
105.33
FEMALES / 100 MALES
36.3
MEDIAN AGE
3.1
AVG FAMILY SIZE
2.5
AVG HOUSEHOLD SIZE
53,397
LABOR FORCE [ PEOPLE ]
67.8%
PERCENT IN LABOR FORCE
5.4%
UNEMPLOYMENT RATE
Kenosha Area Codes
Income in Kenosha
Income Overview in Kenosha
Per Capita Income in Kenosha is $33,894, while median incomes of families and households are $81,270 and $64,963 respectively.
| Characteristic | Number | Measure |
| Per Capita Income | 99,493 | $33,894 |
| Median Family Income | 24,138 | $81,270 |
| Mean Family Income | 24,138 | $99,351 |
| Median Household Income | 38,893 | $64,963 |
| Mean Household Income | 38,893 | $84,037 |
| Income Deficit | 24,138 | $9,799 |
| Wage / Income Gap (%) | 99,493 | 26.30% |
| Wage / Income Gap ($) | 99,493 | 73.70¢ per $1 |
| Gini / Inequality Index | 99,493 | 0.43 |
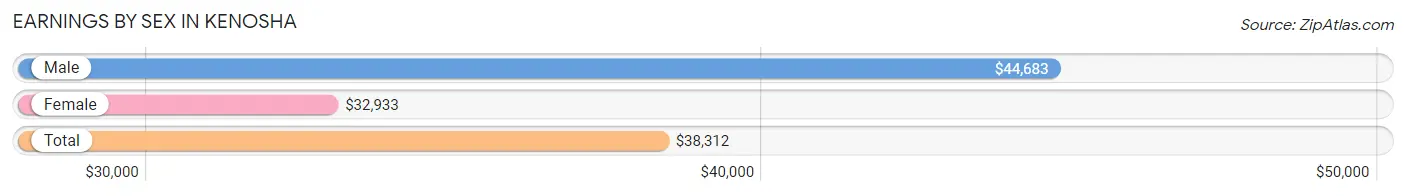
Earnings by Sex in Kenosha
Average Earnings in Kenosha are $38,312, $44,683 for men and $32,933 for women, a difference of 26.3%.
| Sex | Number | Average Earnings |
| Male | 28,410 (51.1%) | $44,683 |
| Female | 27,170 (48.9%) | $32,933 |
| Total | 55,580 (100.0%) | $38,312 |
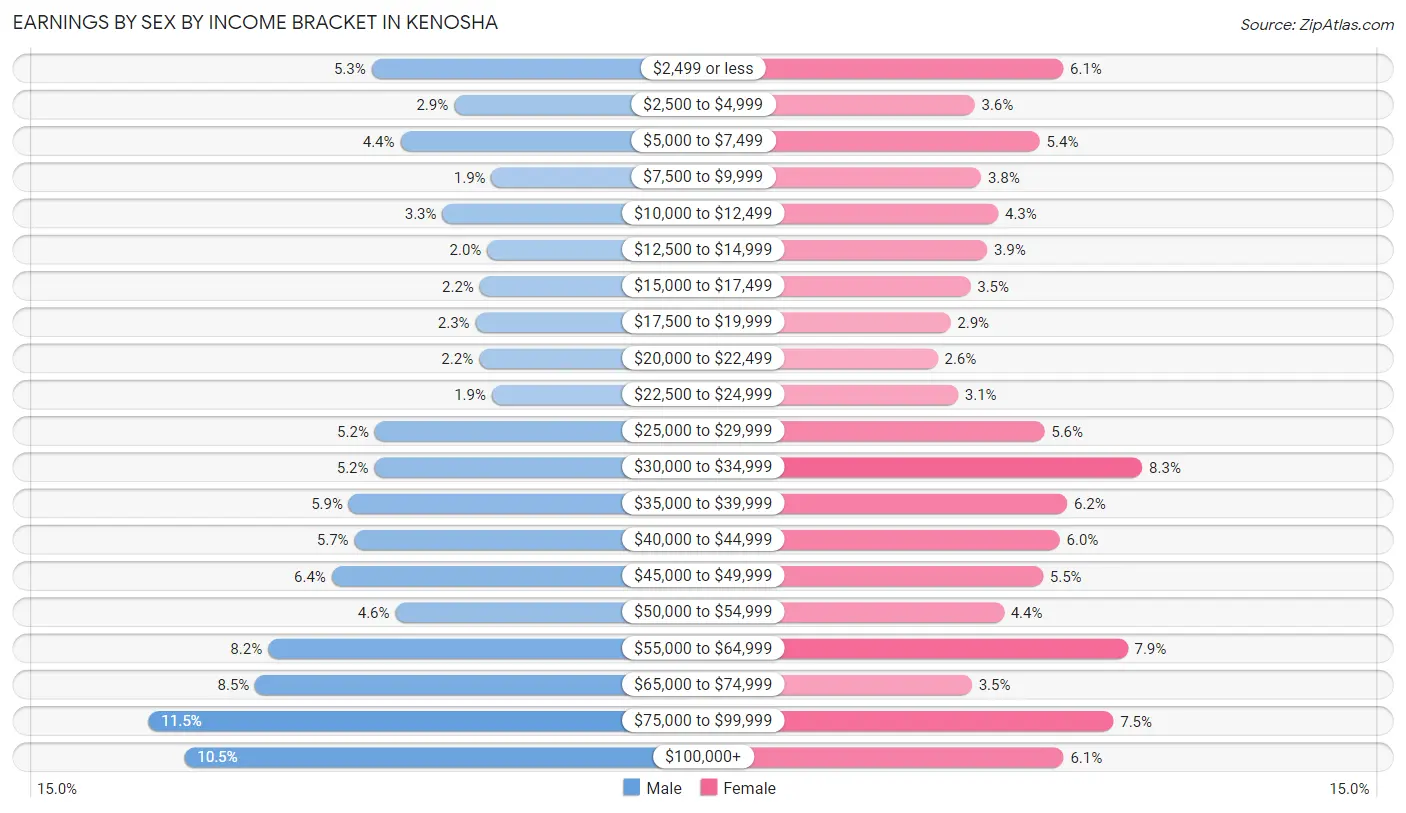
Earnings by Sex by Income Bracket in Kenosha
The most common earnings brackets in Kenosha are $75,000 to $99,999 for men (3,274 | 11.5%) and $30,000 to $34,999 for women (2,254 | 8.3%).
| Income | Male | Female |
| $2,499 or less | 1,492 (5.2%) | 1,653 (6.1%) |
| $2,500 to $4,999 | 833 (2.9%) | 976 (3.6%) |
| $5,000 to $7,499 | 1,260 (4.4%) | 1,472 (5.4%) |
| $7,500 to $9,999 | 533 (1.9%) | 1,023 (3.8%) |
| $10,000 to $12,499 | 926 (3.3%) | 1,154 (4.3%) |
| $12,500 to $14,999 | 569 (2.0%) | 1,071 (3.9%) |
| $15,000 to $17,499 | 629 (2.2%) | 942 (3.5%) |
| $17,500 to $19,999 | 661 (2.3%) | 791 (2.9%) |
| $20,000 to $22,499 | 633 (2.2%) | 692 (2.5%) |
| $22,500 to $24,999 | 531 (1.9%) | 847 (3.1%) |
| $25,000 to $29,999 | 1,465 (5.2%) | 1,507 (5.6%) |
| $30,000 to $34,999 | 1,470 (5.2%) | 2,254 (8.3%) |
| $35,000 to $39,999 | 1,672 (5.9%) | 1,682 (6.2%) |
| $40,000 to $44,999 | 1,628 (5.7%) | 1,624 (6.0%) |
| $45,000 to $49,999 | 1,810 (6.4%) | 1,496 (5.5%) |
| $50,000 to $54,999 | 1,301 (4.6%) | 1,197 (4.4%) |
| $55,000 to $64,999 | 2,317 (8.2%) | 2,144 (7.9%) |
| $65,000 to $74,999 | 2,421 (8.5%) | 954 (3.5%) |
| $75,000 to $99,999 | 3,274 (11.5%) | 2,035 (7.5%) |
| $100,000+ | 2,985 (10.5%) | 1,656 (6.1%) |
| Total | 28,410 (100.0%) | 27,170 (100.0%) |
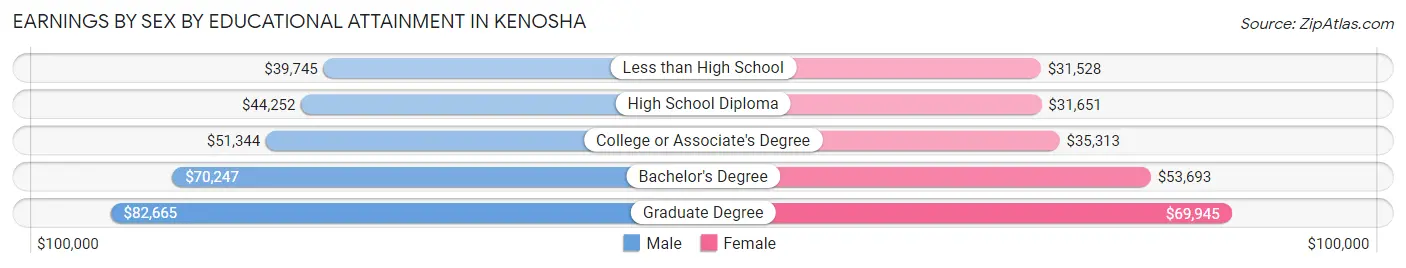
Earnings by Sex by Educational Attainment in Kenosha
Average earnings in Kenosha are $51,710 for men and $39,434 for women, a difference of 23.7%. Men with an educational attainment of graduate degree enjoy the highest average annual earnings of $82,665, while those with less than high school education earn the least with $39,745. Women with an educational attainment of graduate degree earn the most with the average annual earnings of $69,945, while those with less than high school education have the smallest earnings of $31,528.
| Educational Attainment | Male Income | Female Income |
| Less than High School | $39,745 | $31,528 |
| High School Diploma | $44,252 | $31,651 |
| College or Associate's Degree | $51,344 | $35,313 |
| Bachelor's Degree | $70,247 | $53,693 |
| Graduate Degree | $82,665 | $69,945 |
| Total | $51,710 | $39,434 |
Family Income in Kenosha
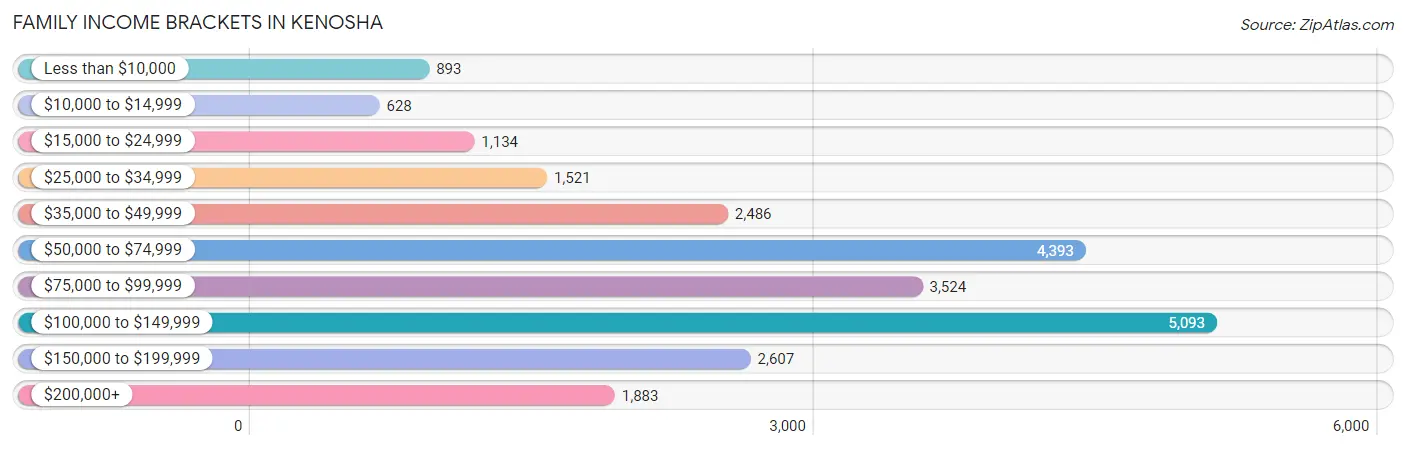
Family Income Brackets in Kenosha
According to the Kenosha family income data, there are 5,093 families falling into the $100,000 to $149,999 income range, which is the most common income bracket and makes up 21.1% of all families. Conversely, the $10,000 to $14,999 income bracket is the least frequent group with only 628 families (2.6%) belonging to this category.
| Income Bracket | # Families | % Families |
| Less than $10,000 | 893 | 3.7% |
| $10,000 to $14,999 | 628 | 2.6% |
| $15,000 to $24,999 | 1,134 | 4.7% |
| $25,000 to $34,999 | 1,521 | 6.3% |
| $35,000 to $49,999 | 2,486 | 10.3% |
| $50,000 to $74,999 | 4,393 | 18.2% |
| $75,000 to $99,999 | 3,524 | 14.6% |
| $100,000 to $149,999 | 5,093 | 21.1% |
| $150,000 to $199,999 | 2,607 | 10.8% |
| $200,000+ | 1,883 | 7.8% |
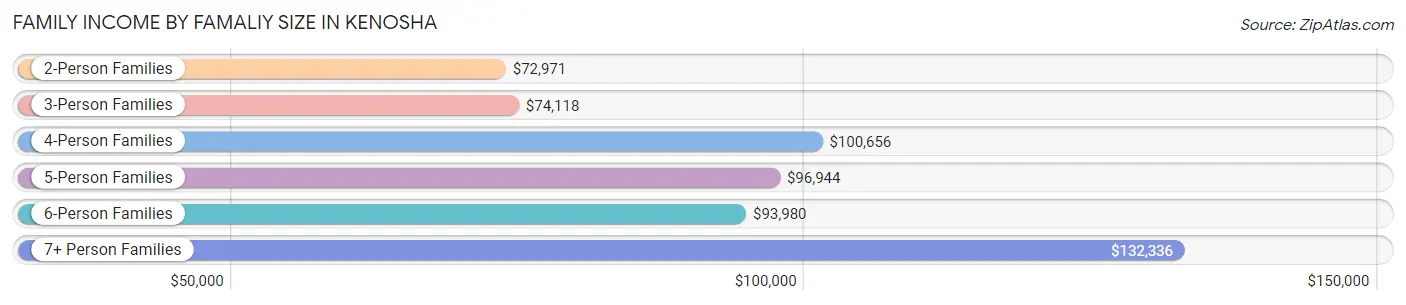
Family Income by Famaliy Size in Kenosha
7+ person families (394 | 1.6%) account for the highest median family income in Kenosha with $132,336 per family, while 2-person families (10,650 | 44.1%) have the highest median income of $36,486 per family member.
| Income Bracket | # Families | Median Income |
| 2-Person Families | 10,650 (44.1%) | $72,971 |
| 3-Person Families | 5,857 (24.3%) | $74,118 |
| 4-Person Families | 4,579 (19.0%) | $100,656 |
| 5-Person Families | 2,154 (8.9%) | $96,944 |
| 6-Person Families | 504 (2.1%) | $93,980 |
| 7+ Person Families | 394 (1.6%) | $132,336 |
| Total | 24,138 (100.0%) | $81,270 |
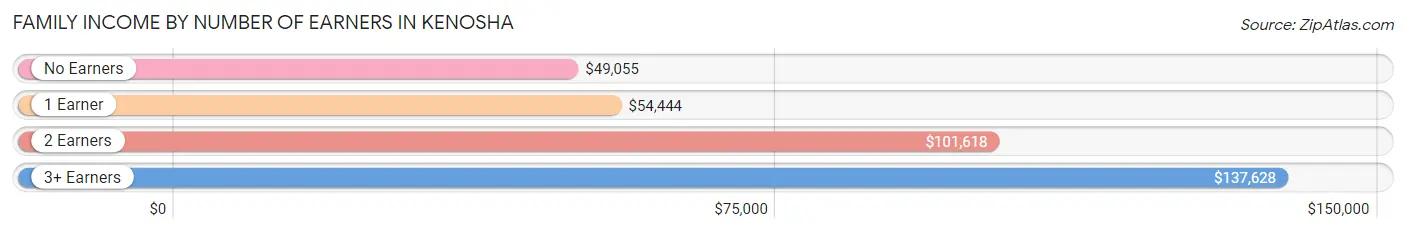
Family Income by Number of Earners in Kenosha
The median family income in Kenosha is $81,270, with families comprising 3+ earners (3,096) having the highest median family income of $137,628, while families with no earners (3,091) have the lowest median family income of $49,055, accounting for 12.8% and 12.8% of families, respectively.
| Number of Earners | # Families | Median Income |
| No Earners | 3,091 (12.8%) | $49,055 |
| 1 Earner | 8,126 (33.7%) | $54,444 |
| 2 Earners | 9,825 (40.7%) | $101,618 |
| 3+ Earners | 3,096 (12.8%) | $137,628 |
| Total | 24,138 (100.0%) | $81,270 |
Household Income in Kenosha
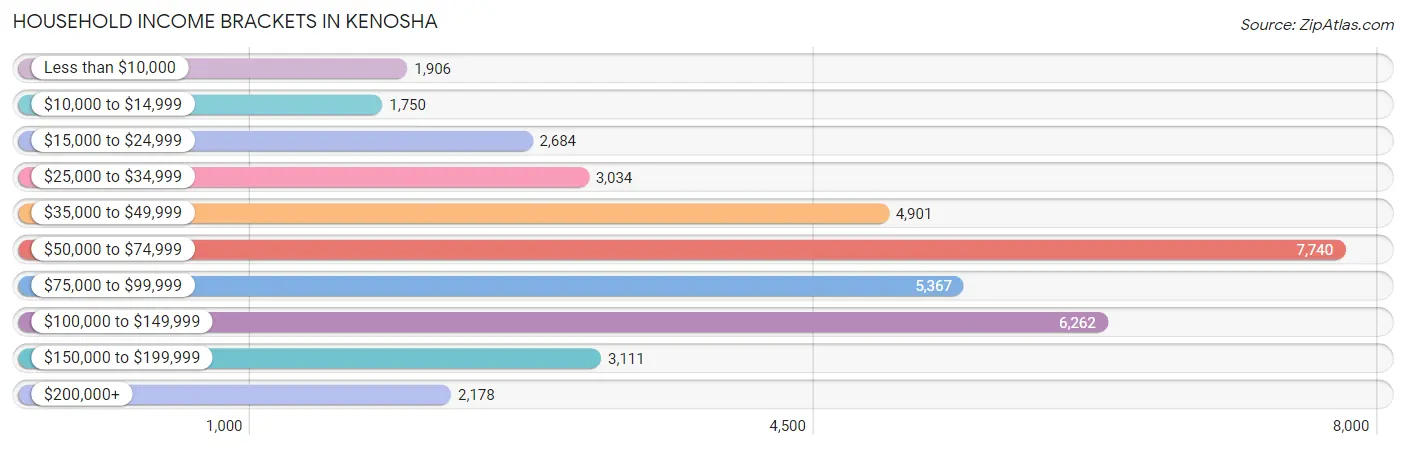
Household Income Brackets in Kenosha
With 7,740 households falling in the category, the $50,000 to $74,999 income range is the most frequent in Kenosha, accounting for 19.9% of all households. In contrast, only 1,750 households (4.5%) fall into the $10,000 to $14,999 income bracket, making it the least populous group.
| Income Bracket | # Households | % Households |
| Less than $10,000 | 1,906 | 4.9% |
| $10,000 to $14,999 | 1,750 | 4.5% |
| $15,000 to $24,999 | 2,684 | 6.9% |
| $25,000 to $34,999 | 3,034 | 7.8% |
| $35,000 to $49,999 | 4,901 | 12.6% |
| $50,000 to $74,999 | 7,740 | 19.9% |
| $75,000 to $99,999 | 5,367 | 13.8% |
| $100,000 to $149,999 | 6,262 | 16.1% |
| $150,000 to $199,999 | 3,111 | 8.0% |
| $200,000+ | 2,178 | 5.6% |
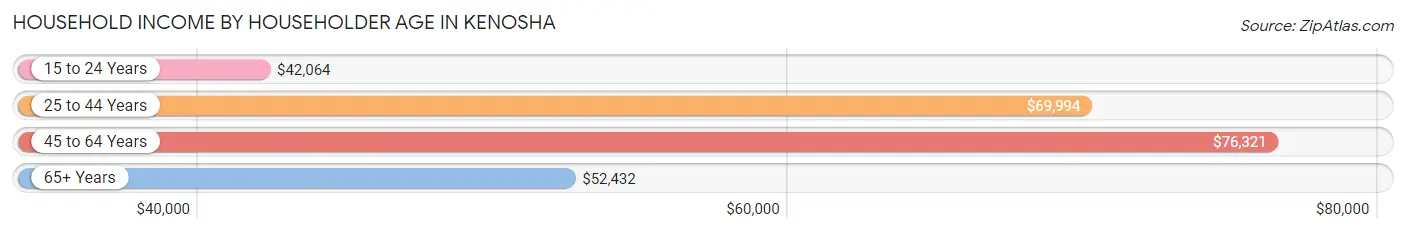
Household Income by Householder Age in Kenosha
The median household income in Kenosha is $64,963, with the highest median household income of $76,321 found in the 45 to 64 years age bracket for the primary householder. A total of 14,882 households (38.3%) fall into this category. Meanwhile, the 15 to 24 years age bracket for the primary householder has the lowest median household income of $42,064, with 1,844 households (4.7%) in this group.
| Income Bracket | # Households | Median Income |
| 15 to 24 Years | 1,844 (4.7%) | $42,064 |
| 25 to 44 Years | 13,501 (34.7%) | $69,994 |
| 45 to 64 Years | 14,882 (38.3%) | $76,321 |
| 65+ Years | 8,666 (22.3%) | $52,432 |
| Total | 38,893 (100.0%) | $64,963 |
Poverty in Kenosha
Income Below Poverty by Sex and Age in Kenosha
With 13.0% poverty level for males and 16.2% for females among the residents of Kenosha, 5 year old males and under 5 year old females are the most vulnerable to poverty, with 265 males (36.0%) and 844 females (29.7%) in their respective age groups living below the poverty level.
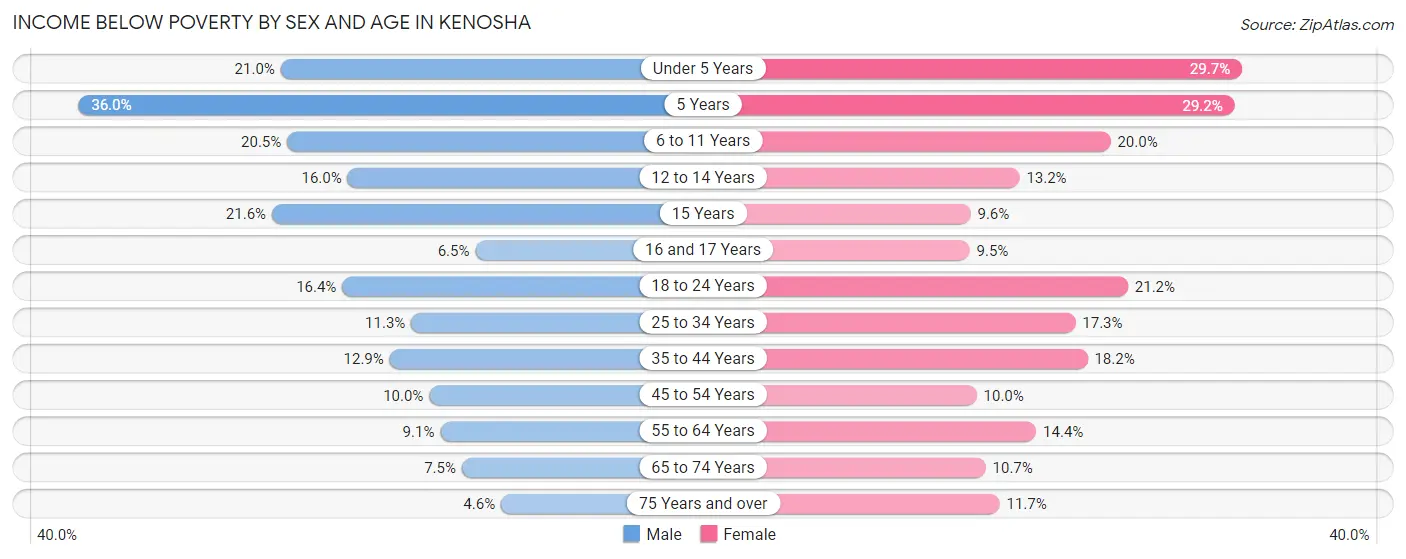
| Age Bracket | Male | Female |
| Under 5 Years | 589 (21.0%) | 844 (29.7%) |
| 5 Years | 265 (36.0%) | 170 (29.2%) |
| 6 to 11 Years | 775 (20.5%) | 800 (20.0%) |
| 12 to 14 Years | 336 (16.0%) | 264 (13.2%) |
| 15 Years | 166 (21.6%) | 76 (9.6%) |
| 16 and 17 Years | 83 (6.5%) | 144 (9.5%) |
| 18 to 24 Years | 791 (16.4%) | 954 (21.2%) |
| 25 to 34 Years | 733 (11.3%) | 1,171 (17.3%) |
| 35 to 44 Years | 848 (12.9%) | 1,271 (18.2%) |
| 45 to 54 Years | 620 (10.0%) | 618 (10.0%) |
| 55 to 64 Years | 533 (9.1%) | 880 (14.4%) |
| 65 to 74 Years | 246 (7.5%) | 423 (10.7%) |
| 75 Years and over | 101 (4.6%) | 396 (11.7%) |
| Total | 6,086 (13.0%) | 8,011 (16.2%) |
Income Above Poverty by Sex and Age in Kenosha
According to the poverty statistics in Kenosha, males aged 75 years and over and females aged 16 and 17 years are the age groups that are most secure financially, with 95.4% of males and 90.5% of females in these age groups living above the poverty line.
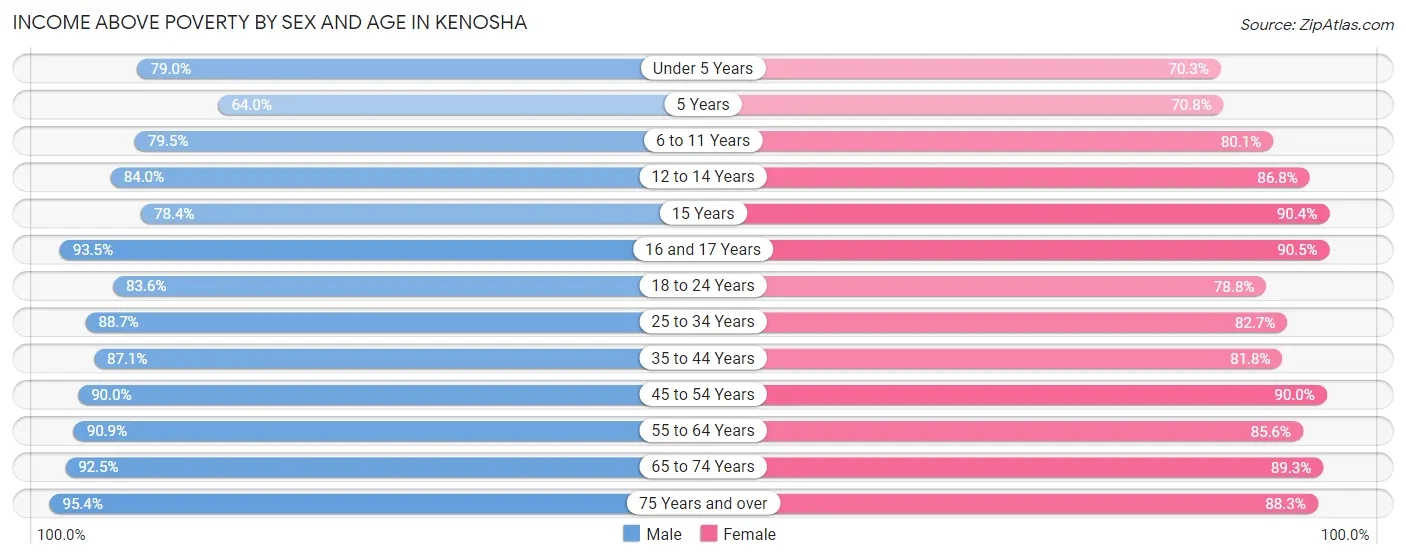
| Age Bracket | Male | Female |
| Under 5 Years | 2,217 (79.0%) | 1,997 (70.3%) |
| 5 Years | 471 (64.0%) | 413 (70.8%) |
| 6 to 11 Years | 3,004 (79.5%) | 3,210 (80.0%) |
| 12 to 14 Years | 1,761 (84.0%) | 1,737 (86.8%) |
| 15 Years | 601 (78.4%) | 719 (90.4%) |
| 16 and 17 Years | 1,187 (93.5%) | 1,374 (90.5%) |
| 18 to 24 Years | 4,025 (83.6%) | 3,538 (78.8%) |
| 25 to 34 Years | 5,756 (88.7%) | 5,581 (82.7%) |
| 35 to 44 Years | 5,725 (87.1%) | 5,696 (81.8%) |
| 45 to 54 Years | 5,602 (90.0%) | 5,556 (90.0%) |
| 55 to 64 Years | 5,300 (90.9%) | 5,218 (85.6%) |
| 65 to 74 Years | 3,015 (92.5%) | 3,538 (89.3%) |
| 75 Years and over | 2,080 (95.4%) | 2,986 (88.3%) |
| Total | 40,744 (87.0%) | 41,563 (83.8%) |
Income Below Poverty Among Married-Couple Families in Kenosha
The poverty statistics for married-couple families in Kenosha show that 6.2% or 1,003 of the total 16,133 families live below the poverty line. Families with 5 or more children have the highest poverty rate of 43.2%, comprising of 54 families. On the other hand, families with no children have the lowest poverty rate of 4.7%, which includes 426 families.
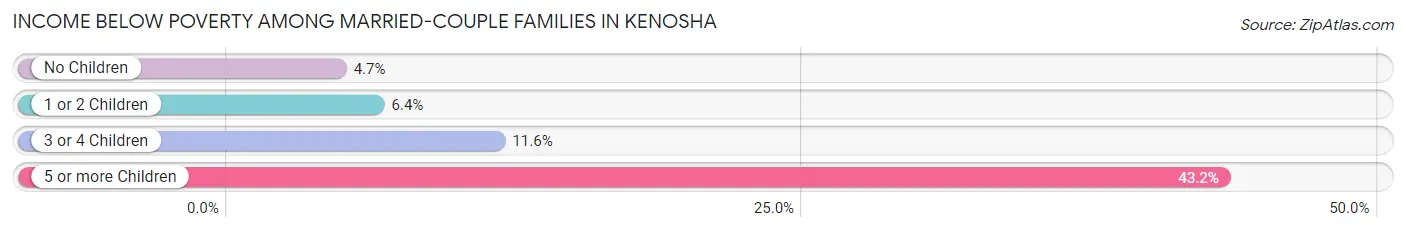
| Children | Above Poverty | Below Poverty |
| No Children | 8,581 (95.3%) | 426 (4.7%) |
| 1 or 2 Children | 5,195 (93.6%) | 354 (6.4%) |
| 3 or 4 Children | 1,283 (88.4%) | 169 (11.6%) |
| 5 or more Children | 71 (56.8%) | 54 (43.2%) |
| Total | 15,130 (93.8%) | 1,003 (6.2%) |
Income Below Poverty Among Single-Parent Households in Kenosha
According to the poverty data in Kenosha, 14.9% or 367 single-father households and 25.5% or 1,412 single-mother households are living below the poverty line. Among single-father households, those with 3 or 4 children have the highest poverty rate, with 59 households (29.5%) experiencing poverty. Likewise, among single-mother households, those with 5 or more children have the highest poverty rate, with 37 households (78.7%) falling below the poverty line.
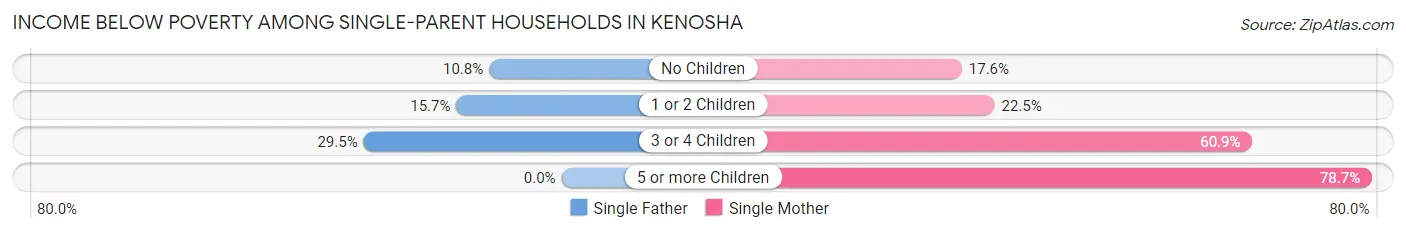
| Children | Single Father | Single Mother |
| No Children | 90 (10.8%) | 310 (17.6%) |
| 1 or 2 Children | 218 (15.7%) | 710 (22.5%) |
| 3 or 4 Children | 59 (29.5%) | 355 (60.9%) |
| 5 or more Children | 0 (0.0%) | 37 (78.7%) |
| Total | 367 (14.9%) | 1,412 (25.5%) |
Income Below Poverty Among Married-Couple vs Single-Parent Households in Kenosha
The poverty data for Kenosha shows that 1,003 of the married-couple family households (6.2%) and 1,779 of the single-parent households (22.2%) are living below the poverty level. Within the married-couple family households, those with 5 or more children have the highest poverty rate, with 54 households (43.2%) falling below the poverty line. Among the single-parent households, those with 3 or 4 children have the highest poverty rate, with 414 household (52.9%) living below poverty.
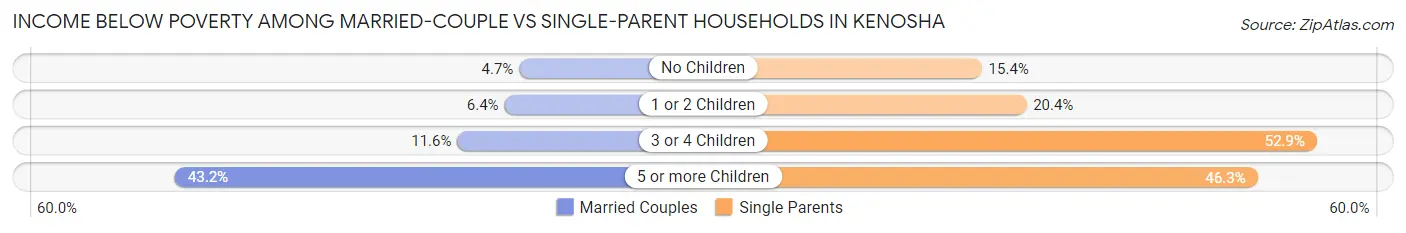
| Children | Married-Couple Families | Single-Parent Households |
| No Children | 426 (4.7%) | 400 (15.4%) |
| 1 or 2 Children | 354 (6.4%) | 928 (20.4%) |
| 3 or 4 Children | 169 (11.6%) | 414 (52.9%) |
| 5 or more Children | 54 (43.2%) | 37 (46.3%) |
| Total | 1,003 (6.2%) | 1,779 (22.2%) |
Race in Kenosha
The most populous races in Kenosha are White / Caucasian (71,068 | 71.4%), Hispanic or Latino (18,169 | 18.3%), and Two or more Races (11,971 | 12.0%).
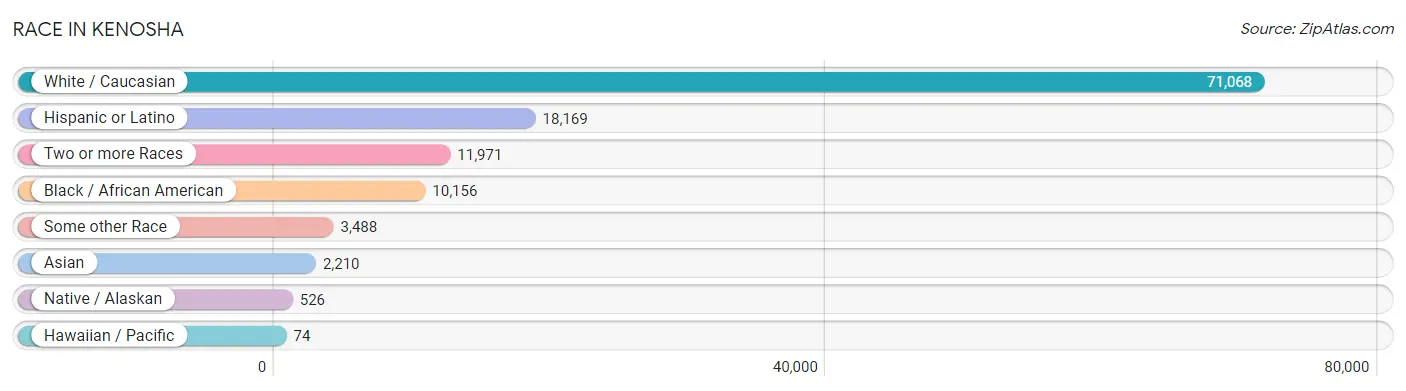
| Race | # Population | % Population |
| Asian | 2,210 | 2.2% |
| Black / African American | 10,156 | 10.2% |
| Hawaiian / Pacific | 74 | 0.1% |
| Hispanic or Latino | 18,169 | 18.3% |
| Native / Alaskan | 526 | 0.5% |
| White / Caucasian | 71,068 | 71.4% |
| Two or more Races | 11,971 | 12.0% |
| Some other Race | 3,488 | 3.5% |
| Total | 99,493 | 100.0% |
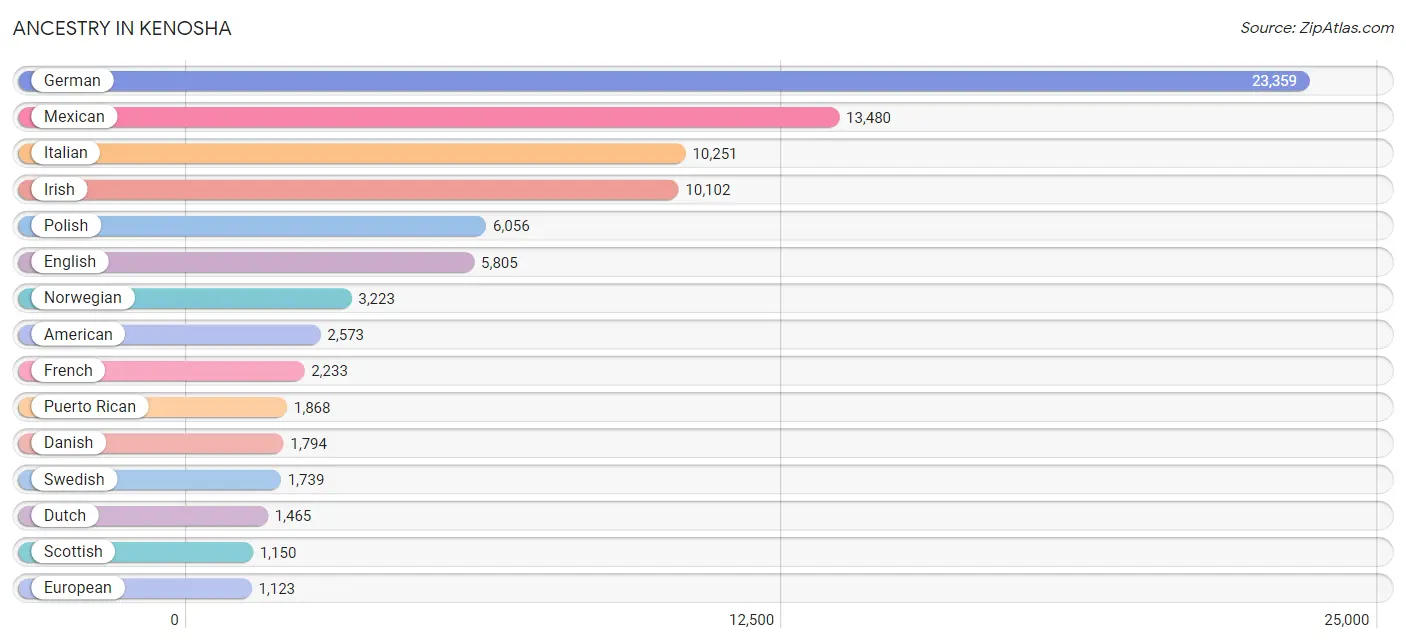
Ancestry in Kenosha
The most populous ancestries reported in Kenosha are German (23,359 | 23.5%), Mexican (13,480 | 13.6%), Italian (10,251 | 10.3%), Irish (10,102 | 10.2%), and Polish (6,056 | 6.1%), together accounting for 63.6% of all Kenosha residents.
| Ancestry | # Population | % Population |
| African | 339 | 0.3% |
| Albanian | 674 | 0.7% |
| American | 2,573 | 2.6% |
| Apache | 18 | 0.0% |
| Arab | 220 | 0.2% |
| Argentinean | 83 | 0.1% |
| Armenian | 105 | 0.1% |
| Australian | 62 | 0.1% |
| Austrian | 206 | 0.2% |
| Bangladeshi | 345 | 0.4% |
| Belgian | 119 | 0.1% |
| Belizean | 19 | 0.0% |
| Bhutanese | 208 | 0.2% |
| Blackfeet | 32 | 0.0% |
| Bolivian | 3 | 0.0% |
| Brazilian | 59 | 0.1% |
| British | 205 | 0.2% |
| Bulgarian | 24 | 0.0% |
| Burmese | 157 | 0.2% |
| Cajun | 54 | 0.1% |
| Cambodian | 30 | 0.0% |
| Canadian | 93 | 0.1% |
| Central American | 1,001 | 1.0% |
| Central American Indian | 97 | 0.1% |
| Cherokee | 385 | 0.4% |
| Chickasaw | 35 | 0.0% |
| Chilean | 28 | 0.0% |
| Chinese | 23 | 0.0% |
| Chippewa | 81 | 0.1% |
| Choctaw | 16 | 0.0% |
| Colombian | 313 | 0.3% |
| Comanche | 144 | 0.1% |
| Cree | 25 | 0.0% |
| Croatian | 134 | 0.1% |
| Crow | 2 | 0.0% |
| Cuban | 113 | 0.1% |
| Czech | 534 | 0.5% |
| Czechoslovakian | 166 | 0.2% |
| Danish | 1,794 | 1.8% |
| Dominican | 306 | 0.3% |
| Dutch | 1,465 | 1.5% |
| Eastern European | 83 | 0.1% |
| Egyptian | 20 | 0.0% |
| English | 5,805 | 5.8% |
| European | 1,123 | 1.1% |
| Finnish | 638 | 0.6% |
| French | 2,233 | 2.2% |
| French Canadian | 573 | 0.6% |
| German | 23,359 | 23.5% |
| Greek | 444 | 0.4% |
| Guamanian / Chamorro | 10 | 0.0% |
| Guatemalan | 455 | 0.5% |
| Haitian | 80 | 0.1% |
| Honduran | 297 | 0.3% |
| Hungarian | 587 | 0.6% |
| Icelander | 27 | 0.0% |
| Indian (Asian) | 511 | 0.5% |
| Inupiat | 39 | 0.0% |
| Iranian | 68 | 0.1% |
| Irish | 10,102 | 10.2% |
| Iroquois | 17 | 0.0% |
| Italian | 10,251 | 10.3% |
| Jamaican | 118 | 0.1% |
| Japanese | 39 | 0.0% |
| Jordanian | 57 | 0.1% |
| Korean | 717 | 0.7% |
| Latvian | 8 | 0.0% |
| Lebanese | 66 | 0.1% |
| Lithuanian | 652 | 0.7% |
| Luxembourger | 123 | 0.1% |
| Macedonian | 21 | 0.0% |
| Menominee | 137 | 0.1% |
| Mexican | 13,480 | 13.6% |
| Mexican American Indian | 494 | 0.5% |
| Native Hawaiian | 63 | 0.1% |
| Navajo | 33 | 0.0% |
| New Zealander | 12 | 0.0% |
| Nicaraguan | 80 | 0.1% |
| Nigerian | 260 | 0.3% |
| Northern European | 158 | 0.2% |
| Norwegian | 3,223 | 3.2% |
| Osage | 12 | 0.0% |
| Panamanian | 151 | 0.2% |
| Pennsylvania German | 13 | 0.0% |
| Peruvian | 28 | 0.0% |
| Polish | 6,056 | 6.1% |
| Portuguese | 23 | 0.0% |
| Potawatomi | 25 | 0.0% |
| Pueblo | 19 | 0.0% |
| Puerto Rican | 1,868 | 1.9% |
| Romanian | 59 | 0.1% |
| Russian | 719 | 0.7% |
| Salvadoran | 18 | 0.0% |
| Samoan | 18 | 0.0% |
| Scandinavian | 678 | 0.7% |
| Scotch-Irish | 373 | 0.4% |
| Scottish | 1,150 | 1.2% |
| Seminole | 12 | 0.0% |
| Serbian | 215 | 0.2% |
| Sioux | 78 | 0.1% |
| Slavic | 105 | 0.1% |
| Slovak | 362 | 0.4% |
| Slovene | 115 | 0.1% |
| South African | 8 | 0.0% |
| South American | 539 | 0.5% |
| Spaniard | 278 | 0.3% |
| Spanish | 142 | 0.1% |
| Spanish American | 21 | 0.0% |
| Sri Lankan | 348 | 0.4% |
| Subsaharan African | 633 | 0.6% |
| Swedish | 1,739 | 1.8% |
| Swiss | 103 | 0.1% |
| Thai | 444 | 0.4% |
| Turkish | 42 | 0.0% |
| Ugandan | 6 | 0.0% |
| Ukrainian | 130 | 0.1% |
| Uruguayan | 51 | 0.1% |
| Venezuelan | 33 | 0.0% |
| Welsh | 226 | 0.2% |
| West Indian | 22 | 0.0% |
| Yugoslavian | 56 | 0.1% |
| Yuman | 33 | 0.0% | View All 122 Rows |
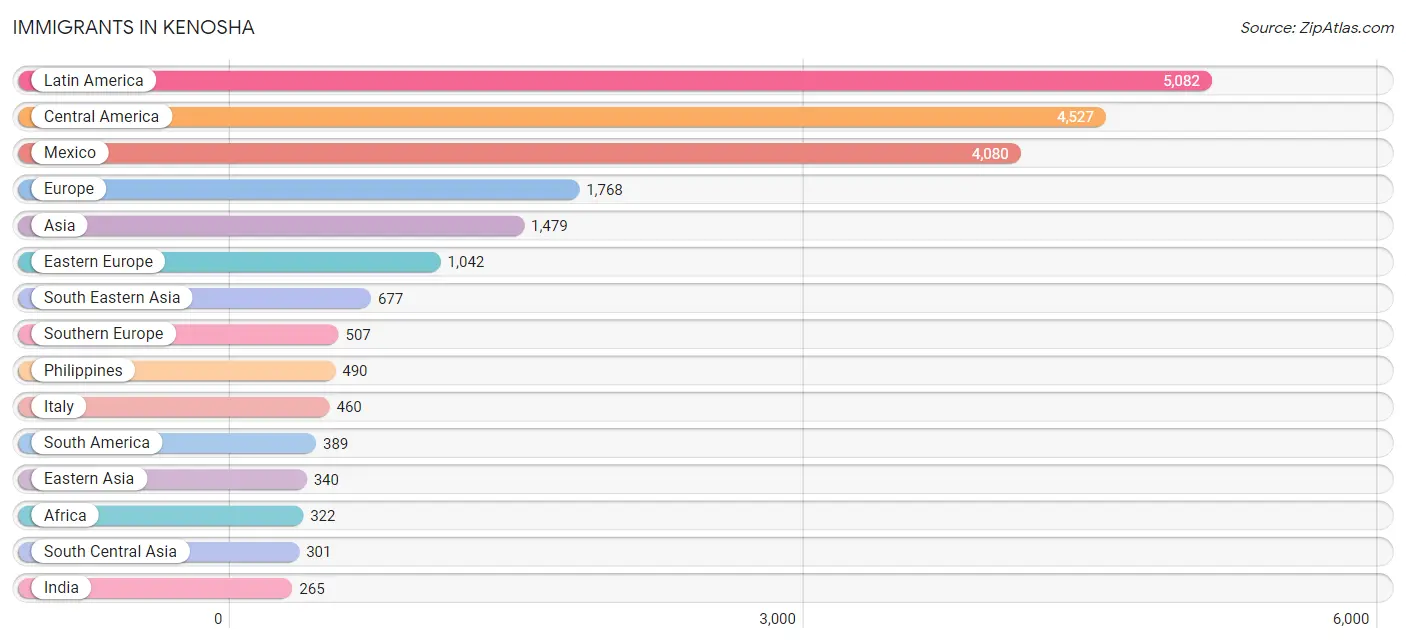
Immigrants in Kenosha
The most numerous immigrant groups reported in Kenosha came from Latin America (5,082 | 5.1%), Central America (4,527 | 4.5%), Mexico (4,080 | 4.1%), Europe (1,768 | 1.8%), and Asia (1,479 | 1.5%), together accounting for 17.0% of all Kenosha residents.
| Immigration Origin | # Population | % Population |
| Africa | 322 | 0.3% |
| Argentina | 54 | 0.1% |
| Armenia | 50 | 0.1% |
| Asia | 1,479 | 1.5% |
| Australia | 12 | 0.0% |
| Belize | 19 | 0.0% |
| Brazil | 61 | 0.1% |
| Bulgaria | 24 | 0.0% |
| Cambodia | 39 | 0.0% |
| Canada | 100 | 0.1% |
| Caribbean | 166 | 0.2% |
| Central America | 4,527 | 4.5% |
| Chile | 28 | 0.0% |
| China | 196 | 0.2% |
| Colombia | 100 | 0.1% |
| Dominican Republic | 53 | 0.1% |
| Eastern Africa | 18 | 0.0% |
| Eastern Asia | 340 | 0.3% |
| Eastern Europe | 1,042 | 1.1% |
| Egypt | 20 | 0.0% |
| England | 14 | 0.0% |
| Europe | 1,768 | 1.8% |
| France | 16 | 0.0% |
| Germany | 102 | 0.1% |
| Greece | 33 | 0.0% |
| Guatemala | 87 | 0.1% |
| Haiti | 77 | 0.1% |
| Honduras | 175 | 0.2% |
| Hungary | 13 | 0.0% |
| India | 265 | 0.3% |
| Iran | 11 | 0.0% |
| Israel | 6 | 0.0% |
| Italy | 460 | 0.5% |
| Jamaica | 36 | 0.0% |
| Japan | 36 | 0.0% |
| Jordan | 47 | 0.1% |
| Kenya | 1 | 0.0% |
| Korea | 108 | 0.1% |
| Kuwait | 31 | 0.0% |
| Laos | 78 | 0.1% |
| Latin America | 5,082 | 5.1% |
| Latvia | 10 | 0.0% |
| Liberia | 63 | 0.1% |
| Lithuania | 28 | 0.0% |
| Malaysia | 5 | 0.0% |
| Mexico | 4,080 | 4.1% |
| Middle Africa | 9 | 0.0% |
| Nepal | 25 | 0.0% |
| Netherlands | 11 | 0.0% |
| Nicaragua | 117 | 0.1% |
| Nigeria | 199 | 0.2% |
| Northern Africa | 33 | 0.0% |
| Northern Europe | 90 | 0.1% |
| Oceania | 37 | 0.0% |
| Panama | 49 | 0.1% |
| Peru | 62 | 0.1% |
| Philippines | 490 | 0.5% |
| Poland | 240 | 0.2% |
| Romania | 155 | 0.2% |
| Russia | 34 | 0.0% |
| Scotland | 39 | 0.0% |
| Serbia | 21 | 0.0% |
| South America | 389 | 0.4% |
| South Central Asia | 301 | 0.3% |
| South Eastern Asia | 677 | 0.7% |
| Southern Europe | 507 | 0.5% |
| Spain | 14 | 0.0% |
| Thailand | 35 | 0.0% |
| Turkey | 15 | 0.0% |
| Uganda | 6 | 0.0% |
| Ukraine | 8 | 0.0% |
| Uruguay | 51 | 0.1% |
| Venezuela | 33 | 0.0% |
| Vietnam | 30 | 0.0% |
| Western Africa | 262 | 0.3% |
| Western Asia | 161 | 0.2% |
| Western Europe | 129 | 0.1% |
| Yemen | 12 | 0.0% |
| Zaire | 9 | 0.0% | View All 79 Rows |
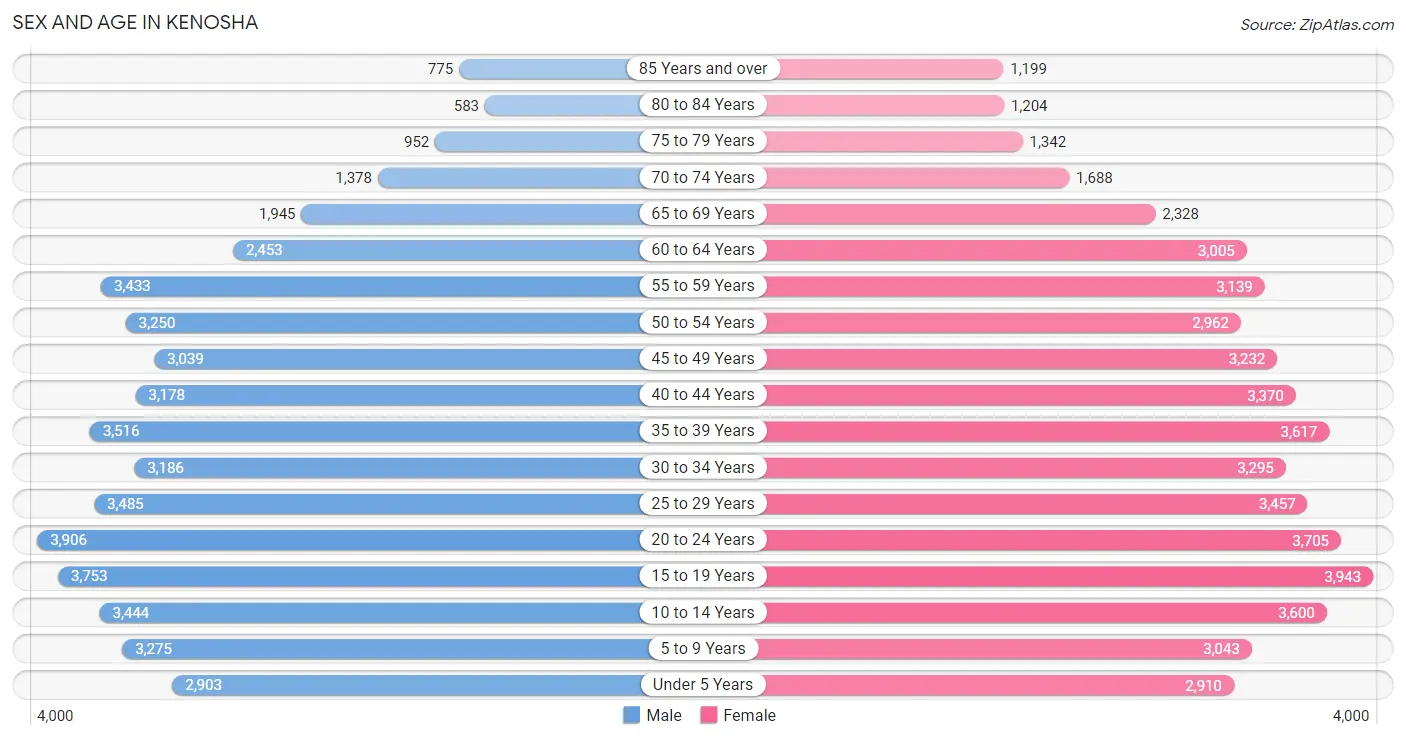
Sex and Age in Kenosha
Sex and Age in Kenosha
The most populous age groups in Kenosha are 20 to 24 Years (3,906 | 8.1%) for men and 15 to 19 Years (3,943 | 7.7%) for women.
| Age Bracket | Male | Female |
| Under 5 Years | 2,903 (6.0%) | 2,910 (5.7%) |
| 5 to 9 Years | 3,275 (6.8%) | 3,043 (6.0%) |
| 10 to 14 Years | 3,444 (7.1%) | 3,600 (7.0%) |
| 15 to 19 Years | 3,753 (7.7%) | 3,943 (7.7%) |
| 20 to 24 Years | 3,906 (8.1%) | 3,705 (7.3%) |
| 25 to 29 Years | 3,485 (7.2%) | 3,457 (6.8%) |
| 30 to 34 Years | 3,186 (6.6%) | 3,295 (6.5%) |
| 35 to 39 Years | 3,516 (7.3%) | 3,617 (7.1%) |
| 40 to 44 Years | 3,178 (6.6%) | 3,370 (6.6%) |
| 45 to 49 Years | 3,039 (6.3%) | 3,232 (6.3%) |
| 50 to 54 Years | 3,250 (6.7%) | 2,962 (5.8%) |
| 55 to 59 Years | 3,433 (7.1%) | 3,139 (6.1%) |
| 60 to 64 Years | 2,453 (5.1%) | 3,005 (5.9%) |
| 65 to 69 Years | 1,945 (4.0%) | 2,328 (4.6%) |
| 70 to 74 Years | 1,378 (2.8%) | 1,688 (3.3%) |
| 75 to 79 Years | 952 (2.0%) | 1,342 (2.6%) |
| 80 to 84 Years | 583 (1.2%) | 1,204 (2.4%) |
| 85 Years and over | 775 (1.6%) | 1,199 (2.4%) |
| Total | 48,454 (100.0%) | 51,039 (100.0%) |
Families and Households in Kenosha
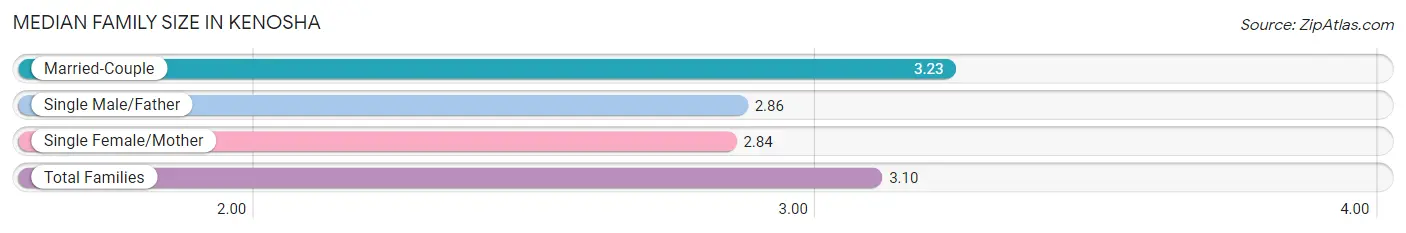
Median Family Size in Kenosha
The median family size in Kenosha is 3.10 persons per family, with married-couple families (16,133 | 66.8%) accounting for the largest median family size of 3.23 persons per family. On the other hand, single female/mother families (5,547 | 23.0%) represent the smallest median family size with 2.84 persons per family.
| Family Type | # Families | Family Size |
| Married-Couple | 16,133 (66.8%) | 3.23 |
| Single Male/Father | 2,458 (10.2%) | 2.86 |
| Single Female/Mother | 5,547 (23.0%) | 2.84 |
| Total Families | 24,138 (100.0%) | 3.10 |
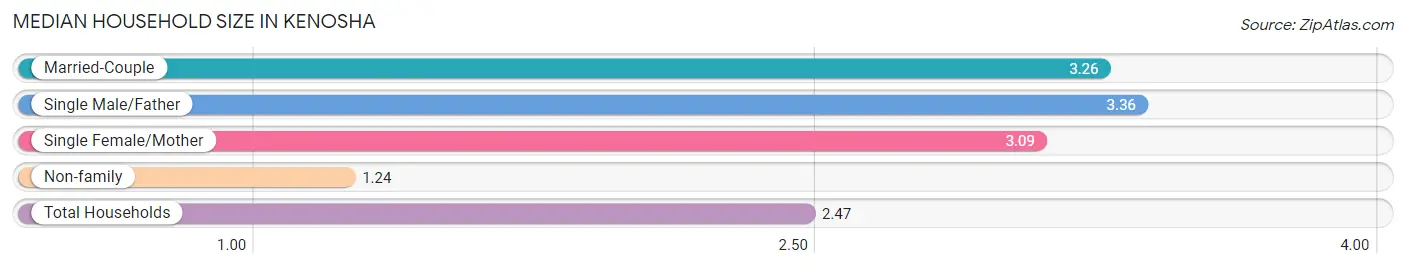
Median Household Size in Kenosha
The median household size in Kenosha is 2.47 persons per household, with single male/father households (2,458 | 6.3%) accounting for the largest median household size of 3.36 persons per household. non-family households (14,755 | 37.9%) represent the smallest median household size with 1.24 persons per household.
| Household Type | # Households | Household Size |
| Married-Couple | 16,133 (41.5%) | 3.26 |
| Single Male/Father | 2,458 (6.3%) | 3.36 |
| Single Female/Mother | 5,547 (14.3%) | 3.09 |
| Non-family | 14,755 (37.9%) | 1.24 |
| Total Households | 38,893 (100.0%) | 2.47 |
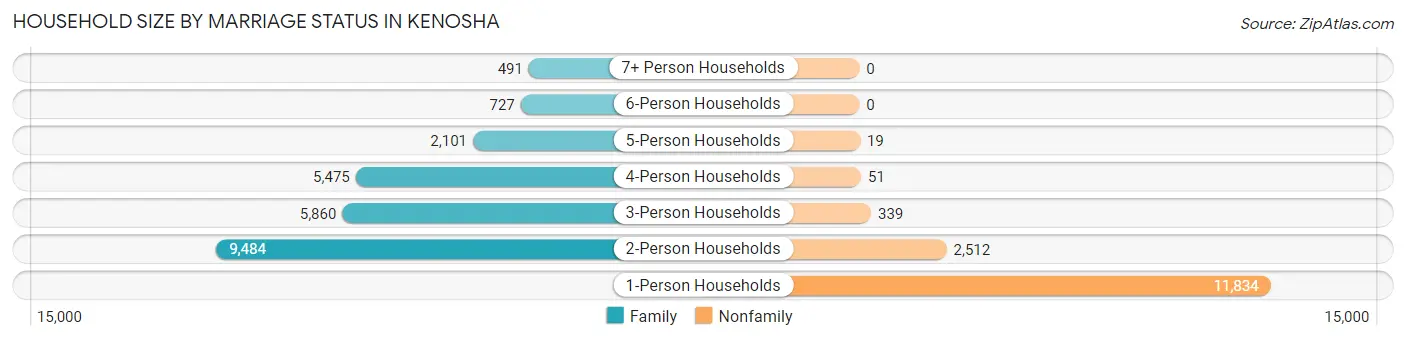
Household Size by Marriage Status in Kenosha
Out of a total of 38,893 households in Kenosha, 24,138 (62.1%) are family households, while 14,755 (37.9%) are nonfamily households. The most numerous type of family households are 2-person households, comprising 9,484, and the most common type of nonfamily households are 1-person households, comprising 11,834.
| Household Size | Family Households | Nonfamily Households |
| 1-Person Households | - | 11,834 (30.4%) |
| 2-Person Households | 9,484 (24.4%) | 2,512 (6.5%) |
| 3-Person Households | 5,860 (15.1%) | 339 (0.9%) |
| 4-Person Households | 5,475 (14.1%) | 51 (0.1%) |
| 5-Person Households | 2,101 (5.4%) | 19 (0.1%) |
| 6-Person Households | 727 (1.9%) | 0 (0.0%) |
| 7+ Person Households | 491 (1.3%) | 0 (0.0%) |
| Total | 24,138 (62.1%) | 14,755 (37.9%) |
Female Fertility in Kenosha
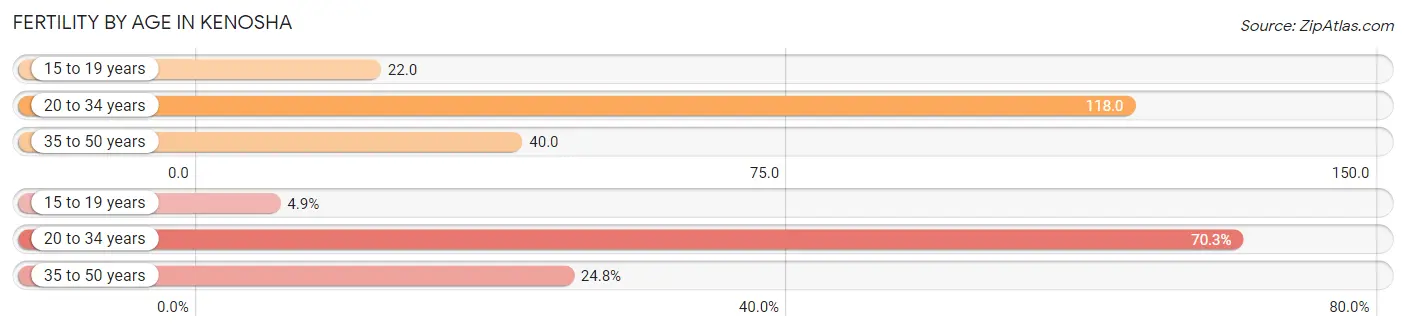
Fertility by Age in Kenosha
Average fertility rate in Kenosha is 70.0 births per 1,000 women. Women in the age bracket of 20 to 34 years have the highest fertility rate with 118.0 births per 1,000 women. Women in the age bracket of 20 to 34 years acount for 70.3% of all women with births.
| Age Bracket | Women with Births | Births / 1,000 Women |
| 15 to 19 years | 86 (4.9%) | 22.0 |
| 20 to 34 years | 1,231 (70.3%) | 118.0 |
| 35 to 50 years | 435 (24.8%) | 40.0 |
| Total | 1,752 (100.0%) | 70.0 |
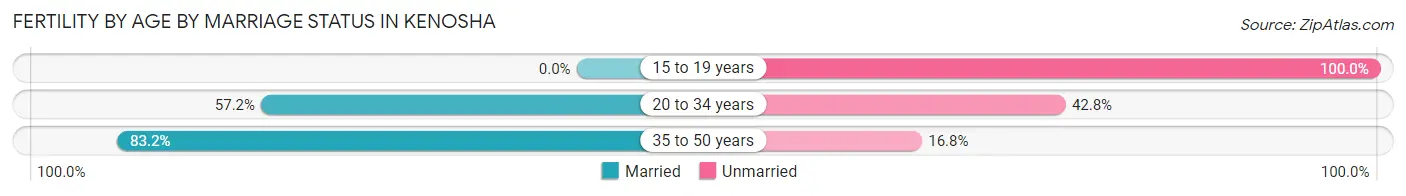
Fertility by Age by Marriage Status in Kenosha
60.8% of women with births (1,752) in Kenosha are married. The highest percentage of unmarried women with births falls into 15 to 19 years age bracket with 100.0% of them unmarried at the time of birth, while the lowest percentage of unmarried women with births belong to 35 to 50 years age bracket with 16.8% of them unmarried.
| Age Bracket | Married | Unmarried |
| 15 to 19 years | 0 (0.0%) | 86 (100.0%) |
| 20 to 34 years | 704 (57.2%) | 527 (42.8%) |
| 35 to 50 years | 362 (83.2%) | 73 (16.8%) |
| Total | 1,065 (60.8%) | 687 (39.2%) |
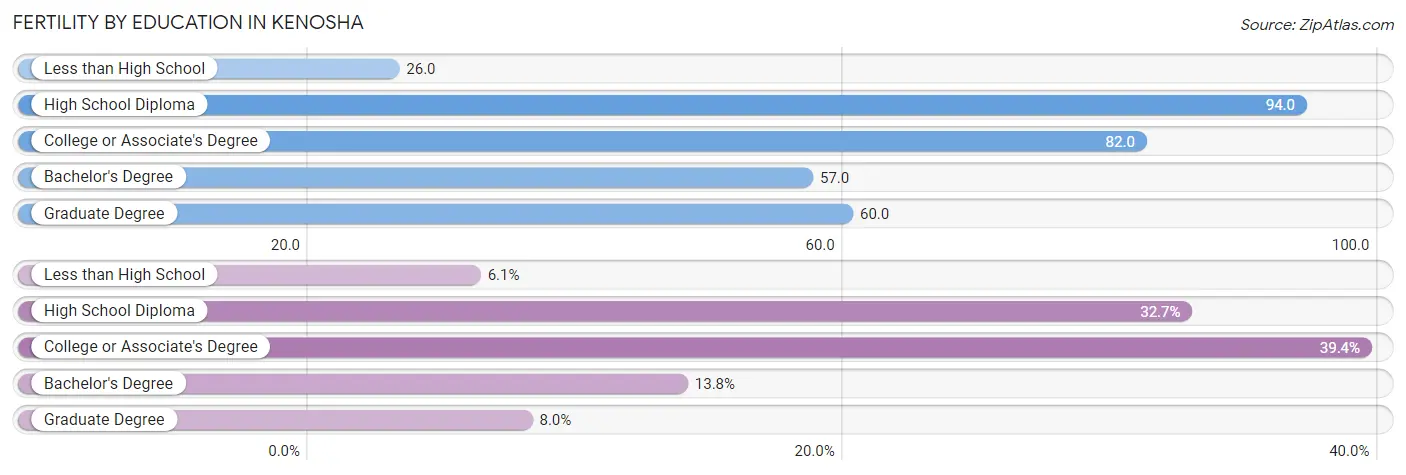
Fertility by Education in Kenosha
Average fertility rate in Kenosha is 70.0 births per 1,000 women. Women with the education attainment of high school diploma have the highest fertility rate of 94.0 births per 1,000 women, while women with the education attainment of less than high school have the lowest fertility at 26.0 births per 1,000 women. Women with the education attainment of college or associate's degree represent 39.4% of all women with births.
| Educational Attainment | Women with Births | Births / 1,000 Women |
| Less than High School | 106 (6.0%) | 26.0 |
| High School Diploma | 573 (32.7%) | 94.0 |
| College or Associate's Degree | 691 (39.4%) | 82.0 |
| Bachelor's Degree | 242 (13.8%) | 57.0 |
| Graduate Degree | 140 (8.0%) | 60.0 |
| Total | 1,752 (100.0%) | 70.0 |
Fertility by Education by Marriage Status in Kenosha
39.2% of women with births in Kenosha are unmarried. Women with the educational attainment of bachelor's degree are most likely to be married with 100.0% of them married at childbirth, while women with the educational attainment of high school diploma are least likely to be married with 50.8% of them unmarried at childbirth.
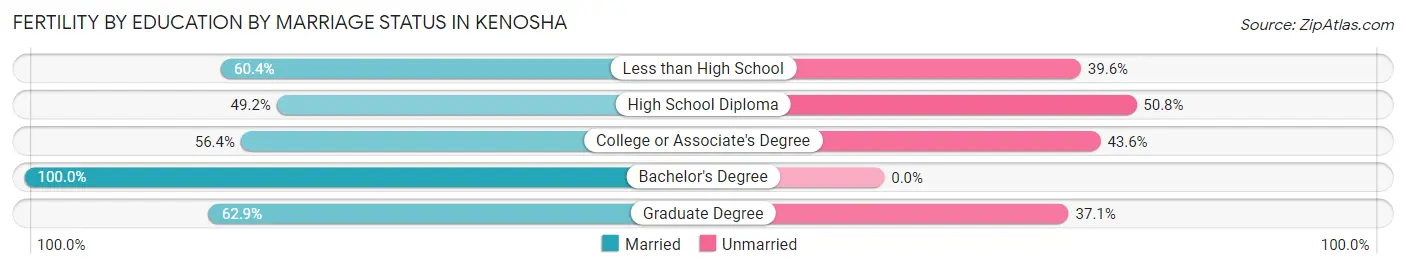
| Educational Attainment | Married | Unmarried |
| Less than High School | 64 (60.4%) | 42 (39.6%) |
| High School Diploma | 282 (49.2%) | 291 (50.8%) |
| College or Associate's Degree | 390 (56.4%) | 301 (43.6%) |
| Bachelor's Degree | 242 (100.0%) | 0 (0.0%) |
| Graduate Degree | 88 (62.9%) | 52 (37.1%) |
| Total | 1,065 (60.8%) | 687 (39.2%) |
Employment Characteristics in Kenosha
Employment by Class of Employer in Kenosha
Among the 49,707 employed individuals in Kenosha, private company employees (36,051 | 72.5%), not-for-profit organizations (4,177 | 8.4%), and local government employees (3,866 | 7.8%) make up the most common classes of employment.
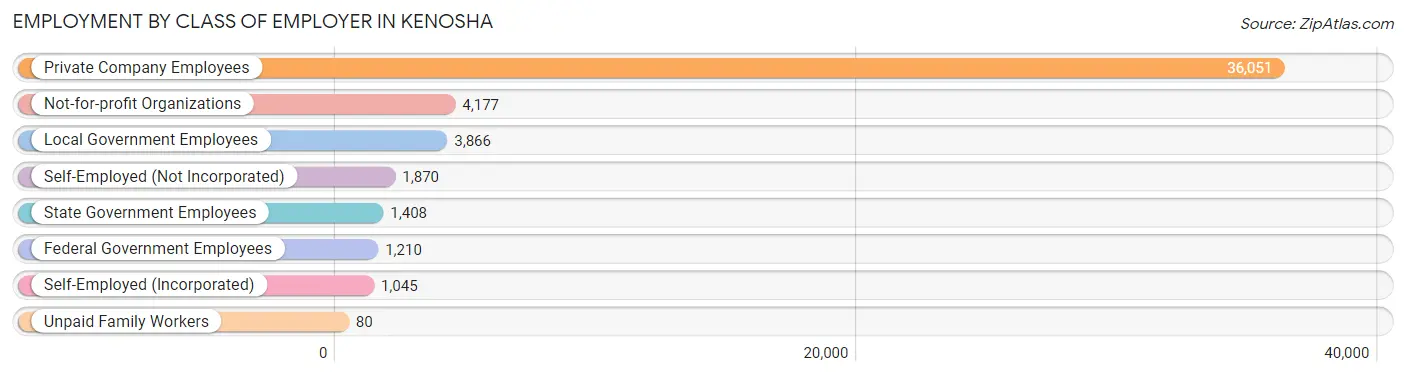
| Employer Class | # Employees | % Employees |
| Private Company Employees | 36,051 | 72.5% |
| Self-Employed (Incorporated) | 1,045 | 2.1% |
| Self-Employed (Not Incorporated) | 1,870 | 3.8% |
| Not-for-profit Organizations | 4,177 | 8.4% |
| Local Government Employees | 3,866 | 7.8% |
| State Government Employees | 1,408 | 2.8% |
| Federal Government Employees | 1,210 | 2.4% |
| Unpaid Family Workers | 80 | 0.2% |
| Total | 49,707 | 100.0% |
Employment Status by Age in Kenosha
According to the labor force statistics for Kenosha, out of the total population over 16 years of age (78,756), 67.8% or 53,397 individuals are in the labor force, with 5.4% or 2,883 of them unemployed. The age group with the highest labor force participation rate is 25 to 29 years, with 87.5% or 6,074 individuals in the labor force. Within the labor force, the 16 to 19 years age range has the highest percentage of unemployed individuals, with 15.2% or 483 of them being unemployed.
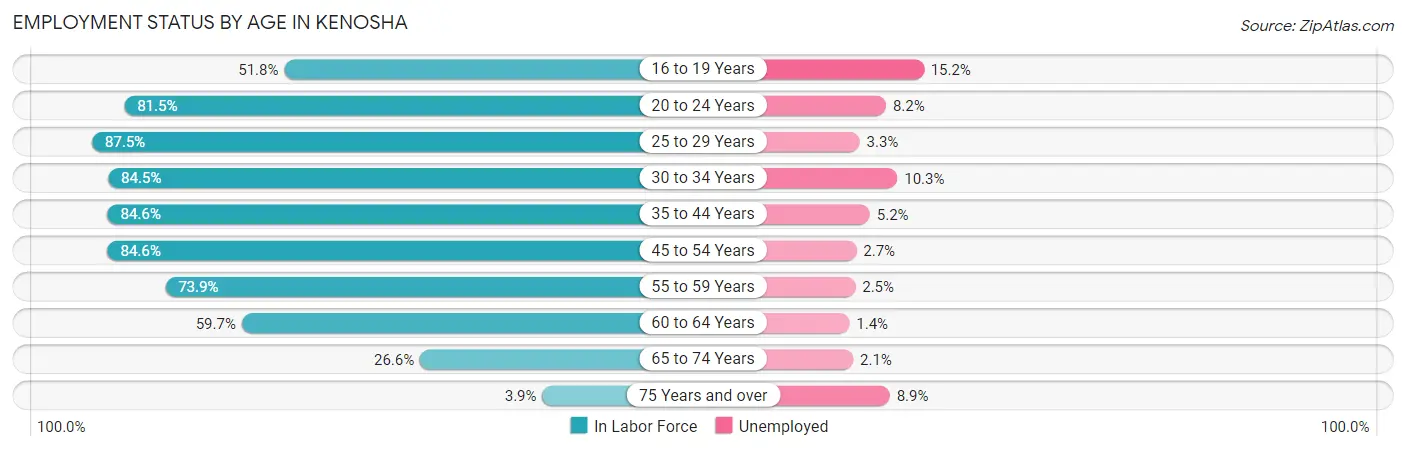
| Age Bracket | In Labor Force | Unemployed |
| 16 to 19 Years | 3,177 (51.8%) | 483 (15.2%) |
| 20 to 24 Years | 6,203 (81.5%) | 509 (8.2%) |
| 25 to 29 Years | 6,074 (87.5%) | 200 (3.3%) |
| 30 to 34 Years | 5,476 (84.5%) | 564 (10.3%) |
| 35 to 44 Years | 11,574 (84.6%) | 602 (5.2%) |
| 45 to 54 Years | 10,561 (84.6%) | 285 (2.7%) |
| 55 to 59 Years | 4,857 (73.9%) | 121 (2.5%) |
| 60 to 64 Years | 3,258 (59.7%) | 46 (1.4%) |
| 65 to 74 Years | 1,952 (26.6%) | 41 (2.1%) |
| 75 Years and over | 236 (3.9%) | 21 (8.9%) |
| Total | 53,397 (67.8%) | 2,883 (5.4%) |
Employment Status by Educational Attainment in Kenosha
According to labor force statistics for Kenosha, 81.0% of individuals (41,810) out of the total population between 25 and 64 years of age (51,617) are in the labor force, with 4.3% or 1,798 of them being unemployed. The group with the highest labor force participation rate are those with the educational attainment of bachelor's degree or higher, with 89.5% or 13,284 individuals in the labor force. Within the labor force, individuals with less than high school education have the highest percentage of unemployment, with 11.6% or 403 of them being unemployed.
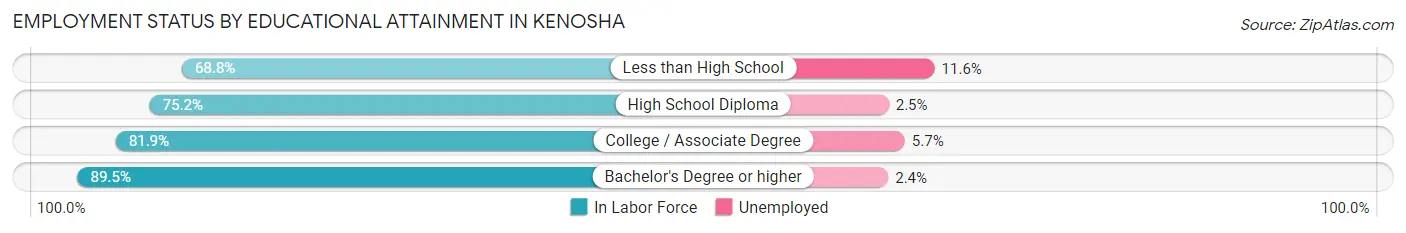
| Educational Attainment | In Labor Force | Unemployed |
| Less than High School | 3,472 (68.8%) | 585 (11.6%) |
| High School Diploma | 10,606 (75.2%) | 353 (2.5%) |
| College / Associate Degree | 14,435 (81.9%) | 1,005 (5.7%) |
| Bachelor's Degree or higher | 13,284 (89.5%) | 356 (2.4%) |
| Total | 41,810 (81.0%) | 2,220 (4.3%) |
Employment Occupations by Sex in Kenosha
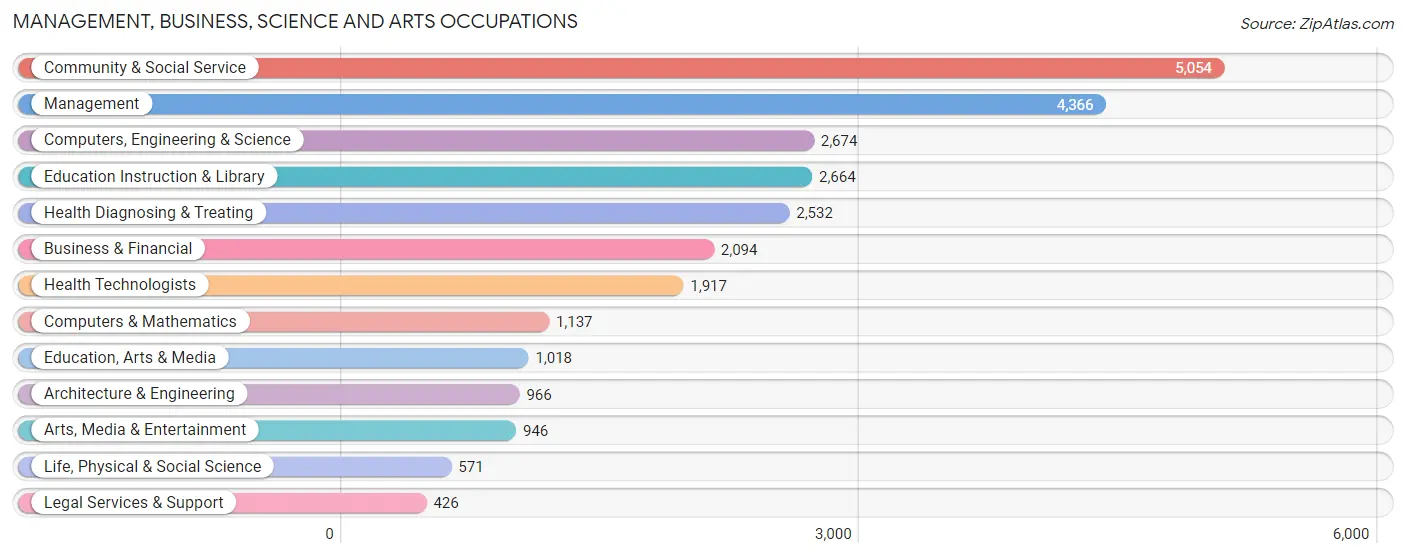
Management, Business, Science and Arts Occupations
The most common Management, Business, Science and Arts occupations in Kenosha are Community & Social Service (5,054 | 10.1%), Management (4,366 | 8.7%), Computers, Engineering & Science (2,674 | 5.3%), Education Instruction & Library (2,664 | 5.3%), and Health Diagnosing & Treating (2,532 | 5.0%).
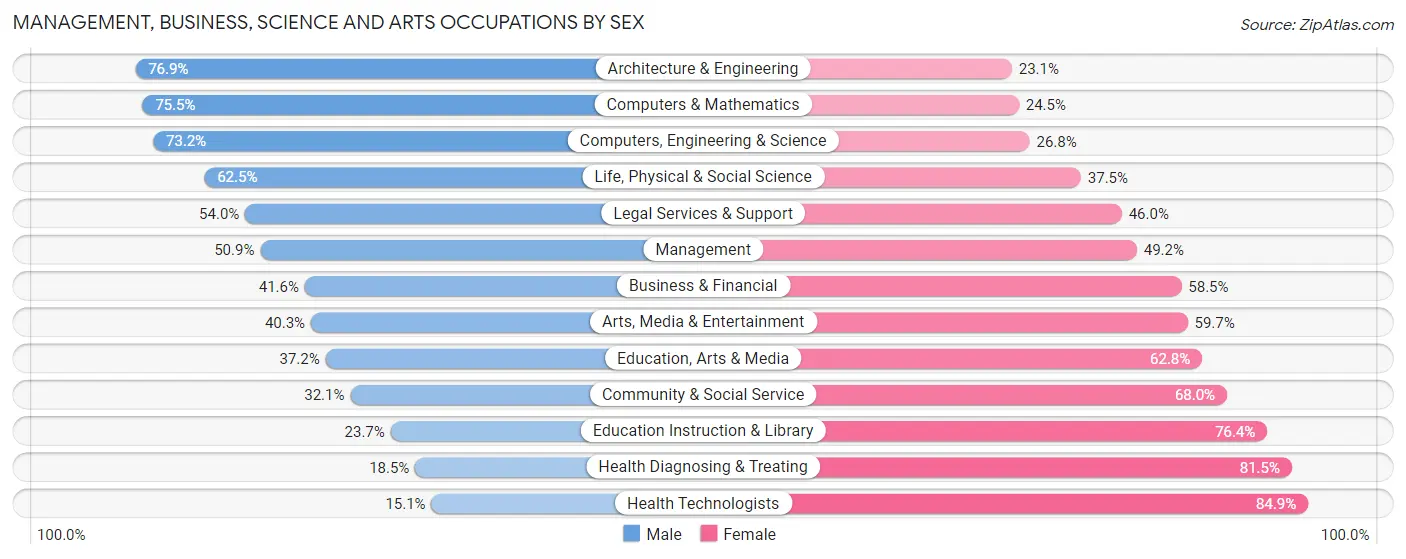
Management, Business, Science and Arts Occupations by Sex
Within the Management, Business, Science and Arts occupations in Kenosha, the most male-oriented occupations are Architecture & Engineering (76.9%), Computers & Mathematics (75.5%), and Computers, Engineering & Science (73.2%), while the most female-oriented occupations are Health Technologists (84.9%), Health Diagnosing & Treating (81.5%), and Education Instruction & Library (76.3%).
| Occupation | Male | Female |
| Management | 2,220 (50.8%) | 2,146 (49.1%) |
| Business & Financial | 870 (41.5%) | 1,224 (58.5%) |
| Computers, Engineering & Science | 1,958 (73.2%) | 716 (26.8%) |
| Computers & Mathematics | 858 (75.5%) | 279 (24.5%) |
| Architecture & Engineering | 743 (76.9%) | 223 (23.1%) |
| Life, Physical & Social Science | 357 (62.5%) | 214 (37.5%) |
| Community & Social Service | 1,620 (32.1%) | 3,434 (67.9%) |
| Education, Arts & Media | 379 (37.2%) | 639 (62.8%) |
| Legal Services & Support | 230 (54.0%) | 196 (46.0%) |
| Education Instruction & Library | 630 (23.6%) | 2,034 (76.3%) |
| Arts, Media & Entertainment | 381 (40.3%) | 565 (59.7%) |
| Health Diagnosing & Treating | 469 (18.5%) | 2,063 (81.5%) |
| Health Technologists | 290 (15.1%) | 1,627 (84.9%) |
| Total (Category) | 7,137 (42.7%) | 9,583 (57.3%) |
| Total (Overall) | 25,491 (50.7%) | 24,800 (49.3%) |
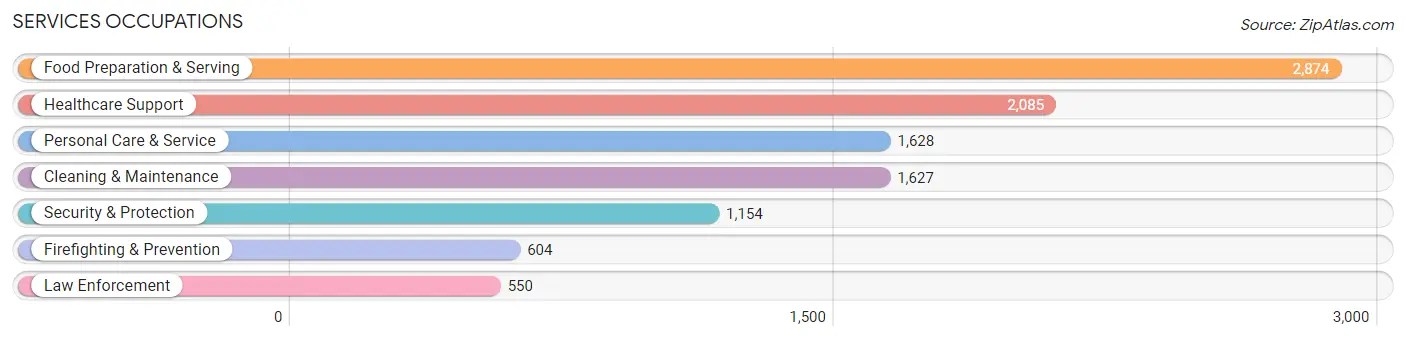
Services Occupations
The most common Services occupations in Kenosha are Food Preparation & Serving (2,874 | 5.7%), Healthcare Support (2,085 | 4.2%), Personal Care & Service (1,628 | 3.2%), Cleaning & Maintenance (1,627 | 3.2%), and Security & Protection (1,154 | 2.3%).
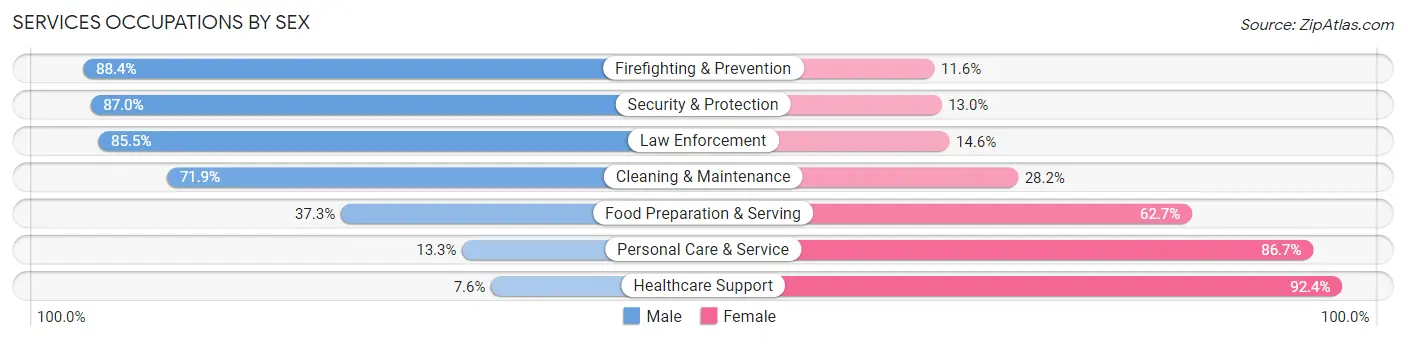
Services Occupations by Sex
Within the Services occupations in Kenosha, the most male-oriented occupations are Firefighting & Prevention (88.4%), Security & Protection (87.0%), and Law Enforcement (85.5%), while the most female-oriented occupations are Healthcare Support (92.4%), Personal Care & Service (86.7%), and Food Preparation & Serving (62.7%).
| Occupation | Male | Female |
| Healthcare Support | 158 (7.6%) | 1,927 (92.4%) |
| Security & Protection | 1,004 (87.0%) | 150 (13.0%) |
| Firefighting & Prevention | 534 (88.4%) | 70 (11.6%) |
| Law Enforcement | 470 (85.5%) | 80 (14.5%) |
| Food Preparation & Serving | 1,073 (37.3%) | 1,801 (62.7%) |
| Cleaning & Maintenance | 1,169 (71.9%) | 458 (28.1%) |
| Personal Care & Service | 217 (13.3%) | 1,411 (86.7%) |
| Total (Category) | 3,621 (38.7%) | 5,747 (61.4%) |
| Total (Overall) | 25,491 (50.7%) | 24,800 (49.3%) |
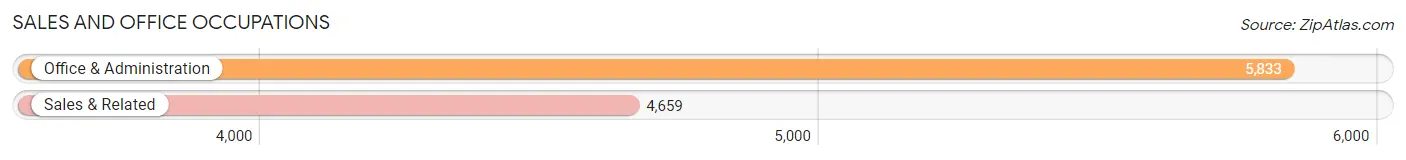
Sales and Office Occupations
The most common Sales and Office occupations in Kenosha are Office & Administration (5,833 | 11.6%), and Sales & Related (4,659 | 9.3%).
Sales and Office Occupations by Sex
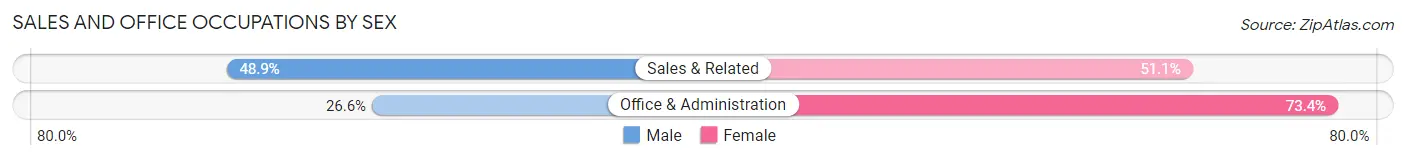
| Occupation | Male | Female |
| Sales & Related | 2,280 (48.9%) | 2,379 (51.1%) |
| Office & Administration | 1,549 (26.6%) | 4,284 (73.4%) |
| Total (Category) | 3,829 (36.5%) | 6,663 (63.5%) |
| Total (Overall) | 25,491 (50.7%) | 24,800 (49.3%) |
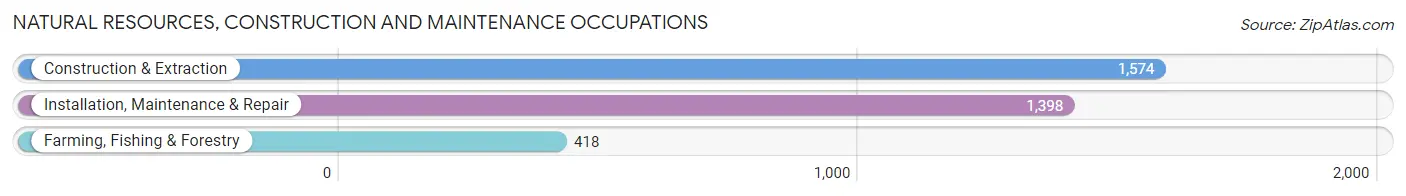
Natural Resources, Construction and Maintenance Occupations
The most common Natural Resources, Construction and Maintenance occupations in Kenosha are Construction & Extraction (1,574 | 3.1%), Installation, Maintenance & Repair (1,398 | 2.8%), and Farming, Fishing & Forestry (418 | 0.8%).
Natural Resources, Construction and Maintenance Occupations by Sex
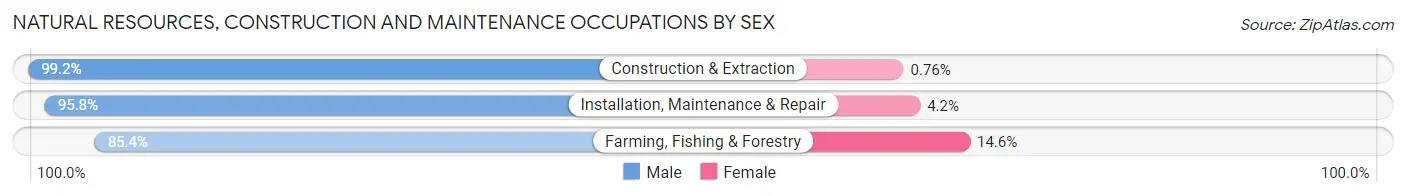
| Occupation | Male | Female |
| Farming, Fishing & Forestry | 357 (85.4%) | 61 (14.6%) |
| Construction & Extraction | 1,562 (99.2%) | 12 (0.8%) |
| Installation, Maintenance & Repair | 1,339 (95.8%) | 59 (4.2%) |
| Total (Category) | 3,258 (96.1%) | 132 (3.9%) |
| Total (Overall) | 25,491 (50.7%) | 24,800 (49.3%) |
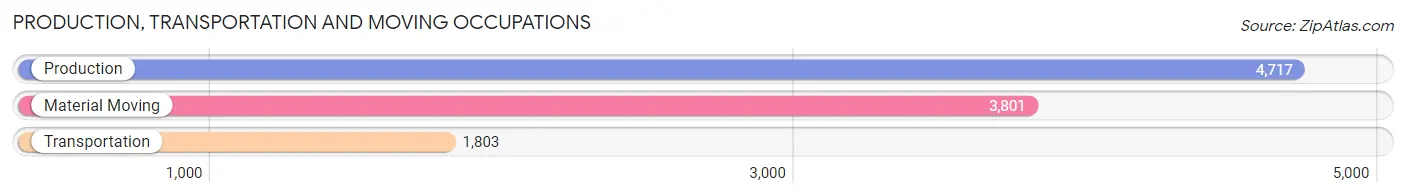
Production, Transportation and Moving Occupations
The most common Production, Transportation and Moving occupations in Kenosha are Production (4,717 | 9.4%), Material Moving (3,801 | 7.6%), and Transportation (1,803 | 3.6%).
Production, Transportation and Moving Occupations by Sex
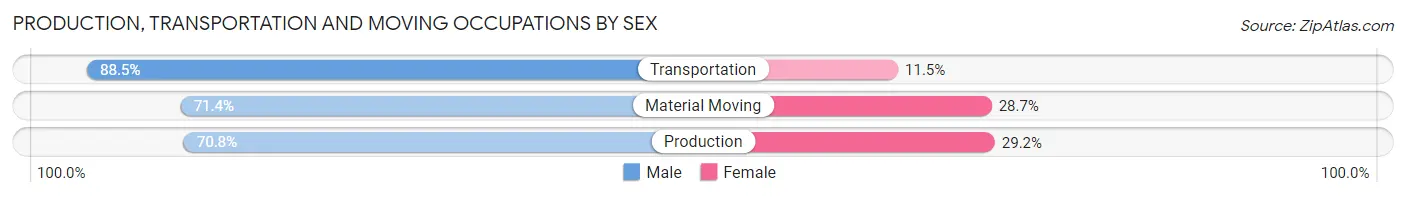
| Occupation | Male | Female |
| Production | 3,338 (70.8%) | 1,379 (29.2%) |
| Transportation | 1,596 (88.5%) | 207 (11.5%) |
| Material Moving | 2,712 (71.4%) | 1,089 (28.6%) |
| Total (Category) | 7,646 (74.1%) | 2,675 (25.9%) |
| Total (Overall) | 25,491 (50.7%) | 24,800 (49.3%) |
Employment Industries by Sex in Kenosha
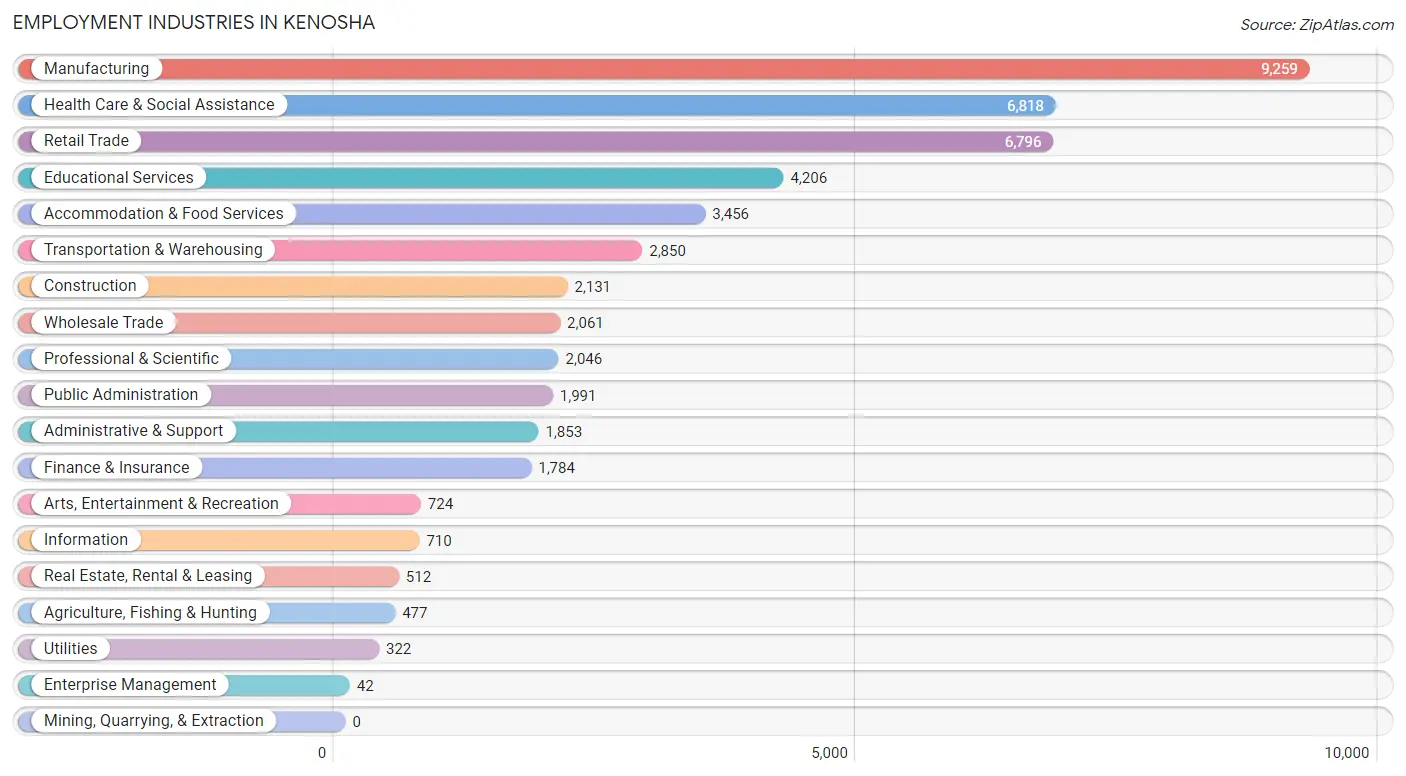
Employment Industries in Kenosha
The major employment industries in Kenosha include Manufacturing (9,259 | 18.4%), Health Care & Social Assistance (6,818 | 13.6%), Retail Trade (6,796 | 13.5%), Educational Services (4,206 | 8.4%), and Accommodation & Food Services (3,456 | 6.9%).
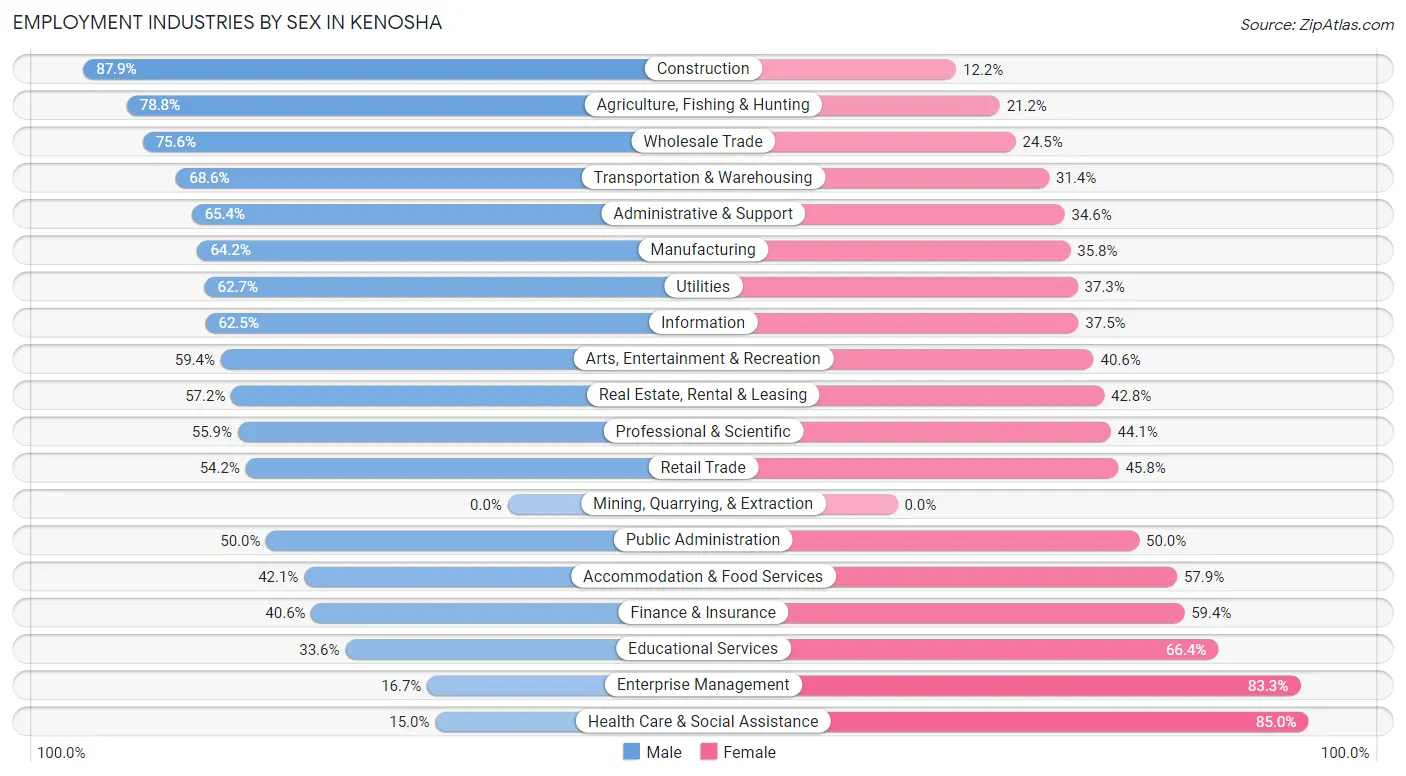
Employment Industries by Sex in Kenosha
The Kenosha industries that see more men than women are Construction (87.8%), Agriculture, Fishing & Hunting (78.8%), and Wholesale Trade (75.5%), whereas the industries that tend to have a higher number of women are Health Care & Social Assistance (85.0%), Enterprise Management (83.3%), and Educational Services (66.4%).
| Industry | Male | Female |
| Agriculture, Fishing & Hunting | 376 (78.8%) | 101 (21.2%) |
| Mining, Quarrying, & Extraction | 0 (0.0%) | 0 (0.0%) |
| Construction | 1,872 (87.8%) | 259 (12.1%) |
| Manufacturing | 5,945 (64.2%) | 3,314 (35.8%) |
| Wholesale Trade | 1,557 (75.5%) | 504 (24.4%) |
| Retail Trade | 3,686 (54.2%) | 3,110 (45.8%) |
| Transportation & Warehousing | 1,955 (68.6%) | 895 (31.4%) |
| Utilities | 202 (62.7%) | 120 (37.3%) |
| Information | 444 (62.5%) | 266 (37.5%) |
| Finance & Insurance | 725 (40.6%) | 1,059 (59.4%) |
| Real Estate, Rental & Leasing | 293 (57.2%) | 219 (42.8%) |
| Professional & Scientific | 1,143 (55.9%) | 903 (44.1%) |
| Enterprise Management | 7 (16.7%) | 35 (83.3%) |
| Administrative & Support | 1,212 (65.4%) | 641 (34.6%) |
| Educational Services | 1,414 (33.6%) | 2,792 (66.4%) |
| Health Care & Social Assistance | 1,022 (15.0%) | 5,796 (85.0%) |
| Arts, Entertainment & Recreation | 430 (59.4%) | 294 (40.6%) |
| Accommodation & Food Services | 1,456 (42.1%) | 2,000 (57.9%) |
| Public Administration | 995 (50.0%) | 996 (50.0%) |
| Total | 25,491 (50.7%) | 24,800 (49.3%) |
Education in Kenosha
School Enrollment in Kenosha
The most common levels of schooling among the 25,641 students in Kenosha are college / undergraduate (5,765 | 22.5%), high school (5,526 | 21.5%), and middle school (5,470 | 21.3%).
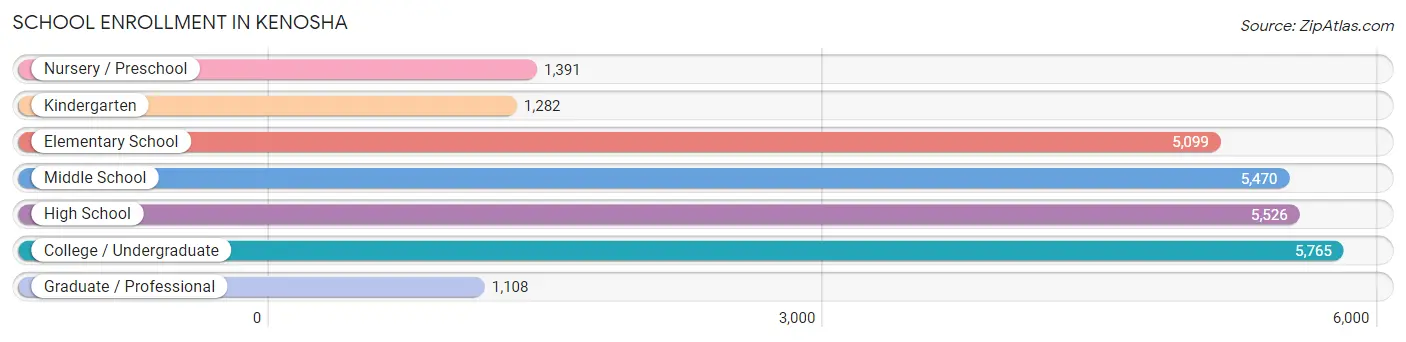
| School Level | # Students | % Students |
| Nursery / Preschool | 1,391 | 5.4% |
| Kindergarten | 1,282 | 5.0% |
| Elementary School | 5,099 | 19.9% |
| Middle School | 5,470 | 21.3% |
| High School | 5,526 | 21.5% |
| College / Undergraduate | 5,765 | 22.5% |
| Graduate / Professional | 1,108 | 4.3% |
| Total | 25,641 | 100.0% |
School Enrollment by Age by Funding Source in Kenosha
Out of a total of 25,641 students who are enrolled in schools in Kenosha, 4,051 (15.8%) attend a private institution, while the remaining 21,590 (84.2%) are enrolled in public schools. The age group of 20 to 24 year olds has the highest likelihood of being enrolled in private schools, with 975 (34.8% in the age bracket) enrolled. Conversely, the age group of 15 to 17 year olds has the lowest likelihood of being enrolled in a private school, with 3,954 (92.8% in the age bracket) attending a public institution.
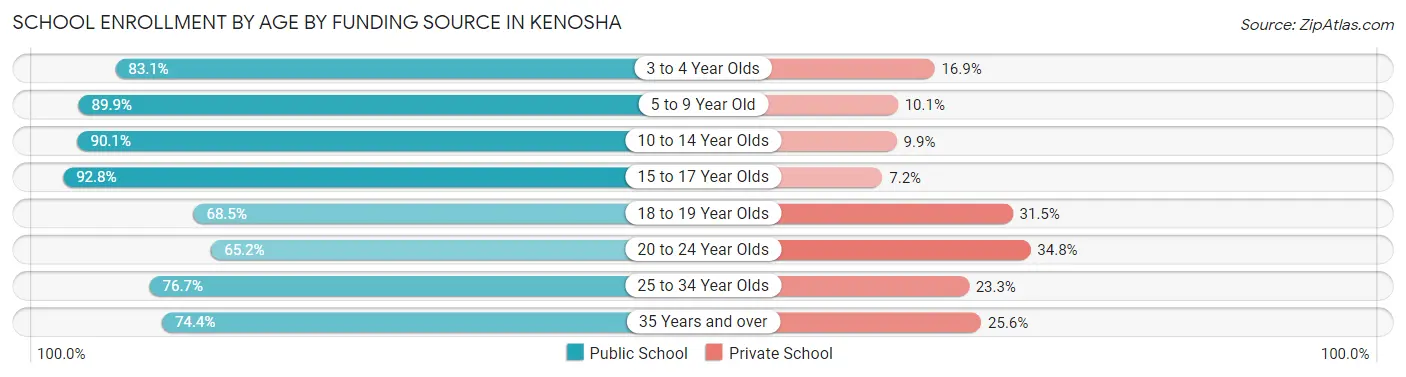
| Age Bracket | Public School | Private School |
| 3 to 4 Year Olds | 766 (83.1%) | 156 (16.9%) |
| 5 to 9 Year Old | 5,413 (89.9%) | 606 (10.1%) |
| 10 to 14 Year Olds | 6,111 (90.1%) | 669 (9.9%) |
| 15 to 17 Year Olds | 3,954 (92.8%) | 307 (7.2%) |
| 18 to 19 Year Olds | 1,459 (68.5%) | 670 (31.5%) |
| 20 to 24 Year Olds | 1,828 (65.2%) | 975 (34.8%) |
| 25 to 34 Year Olds | 1,235 (76.7%) | 375 (23.3%) |
| 35 Years and over | 831 (74.4%) | 286 (25.6%) |
| Total | 21,590 (84.2%) | 4,051 (15.8%) |
Educational Attainment by Field of Study in Kenosha
Business (3,993 | 20.6%), education (2,413 | 12.4%), science & technology (2,350 | 12.1%), arts & humanities (1,419 | 7.3%), and psychology (1,275 | 6.6%) are the most common fields of study among 19,397 individuals in Kenosha who have obtained a bachelor's degree or higher.
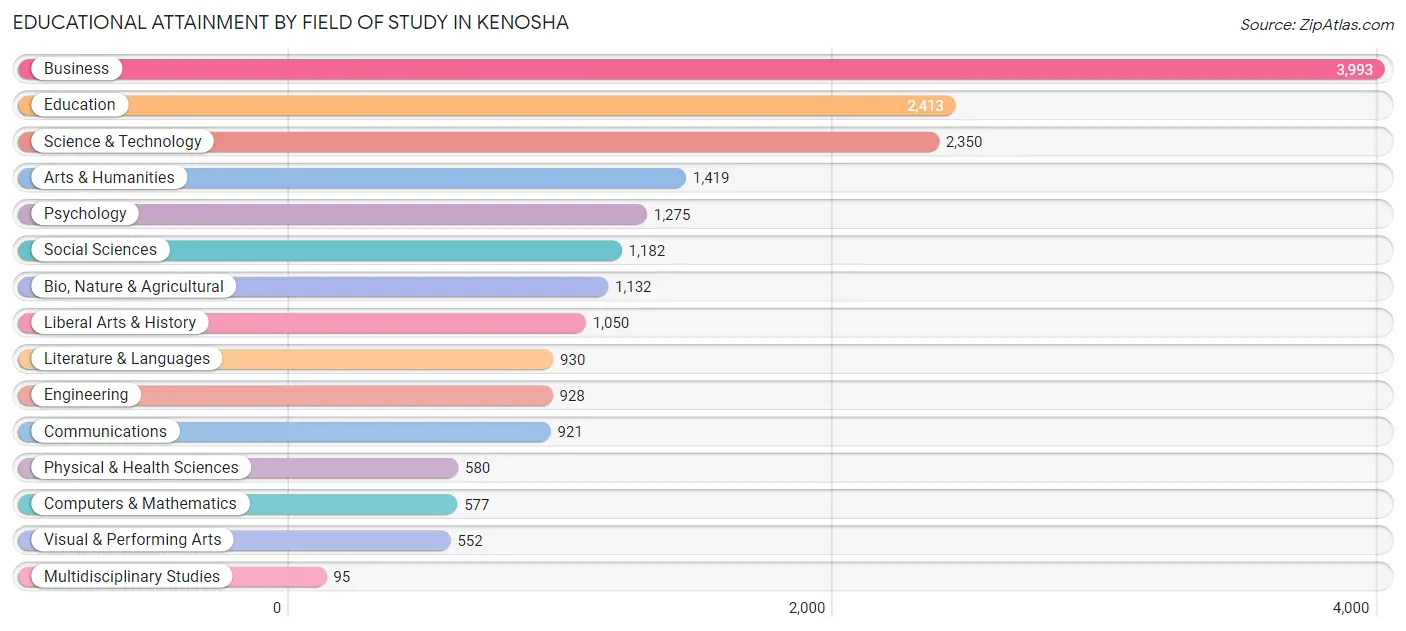
| Field of Study | # Graduates | % Graduates |
| Computers & Mathematics | 577 | 3.0% |
| Bio, Nature & Agricultural | 1,132 | 5.8% |
| Physical & Health Sciences | 580 | 3.0% |
| Psychology | 1,275 | 6.6% |
| Social Sciences | 1,182 | 6.1% |
| Engineering | 928 | 4.8% |
| Multidisciplinary Studies | 95 | 0.5% |
| Science & Technology | 2,350 | 12.1% |
| Business | 3,993 | 20.6% |
| Education | 2,413 | 12.4% |
| Literature & Languages | 930 | 4.8% |
| Liberal Arts & History | 1,050 | 5.4% |
| Visual & Performing Arts | 552 | 2.9% |
| Communications | 921 | 4.8% |
| Arts & Humanities | 1,419 | 7.3% |
| Total | 19,397 | 100.0% |
Transportation & Commute in Kenosha
Vehicle Availability by Sex in Kenosha
The most prevalent vehicle ownership categories in Kenosha are males with 2 vehicles (12,083, accounting for 48.4%) and females with 2 vehicles (10,429, making up 50.3%).
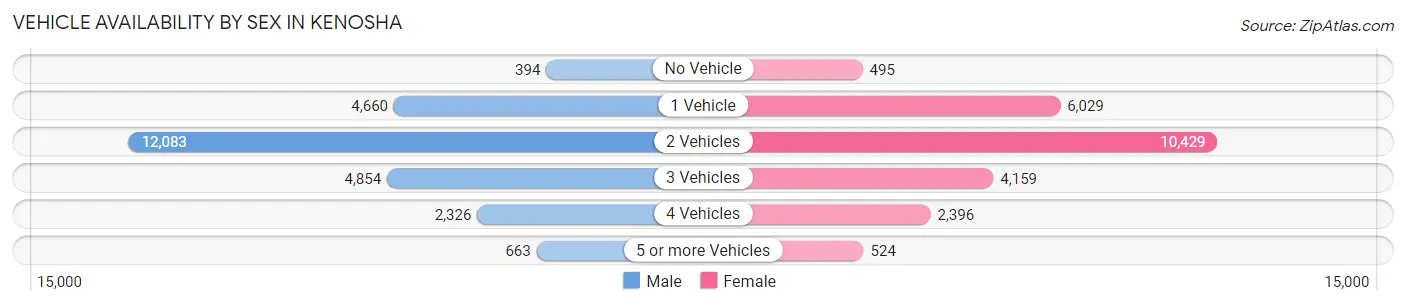
| Vehicles Available | Male | Female |
| No Vehicle | 394 (1.6%) | 495 (2.1%) |
| 1 Vehicle | 4,660 (18.6%) | 6,029 (25.1%) |
| 2 Vehicles | 12,083 (48.4%) | 10,429 (43.4%) |
| 3 Vehicles | 4,854 (19.4%) | 4,159 (17.3%) |
| 4 Vehicles | 2,326 (9.3%) | 2,396 (10.0%) |
| 5 or more Vehicles | 663 (2.6%) | 524 (2.2%) |
| Total | 24,980 (100.0%) | 24,032 (100.0%) |
Commute Time in Kenosha
The most frequently occuring commute durations in Kenosha are 10 to 14 minutes (8,375 commuters, 18.0%), 15 to 19 minutes (7,784 commuters, 16.7%), and 5 to 9 minutes (6,148 commuters, 13.2%).
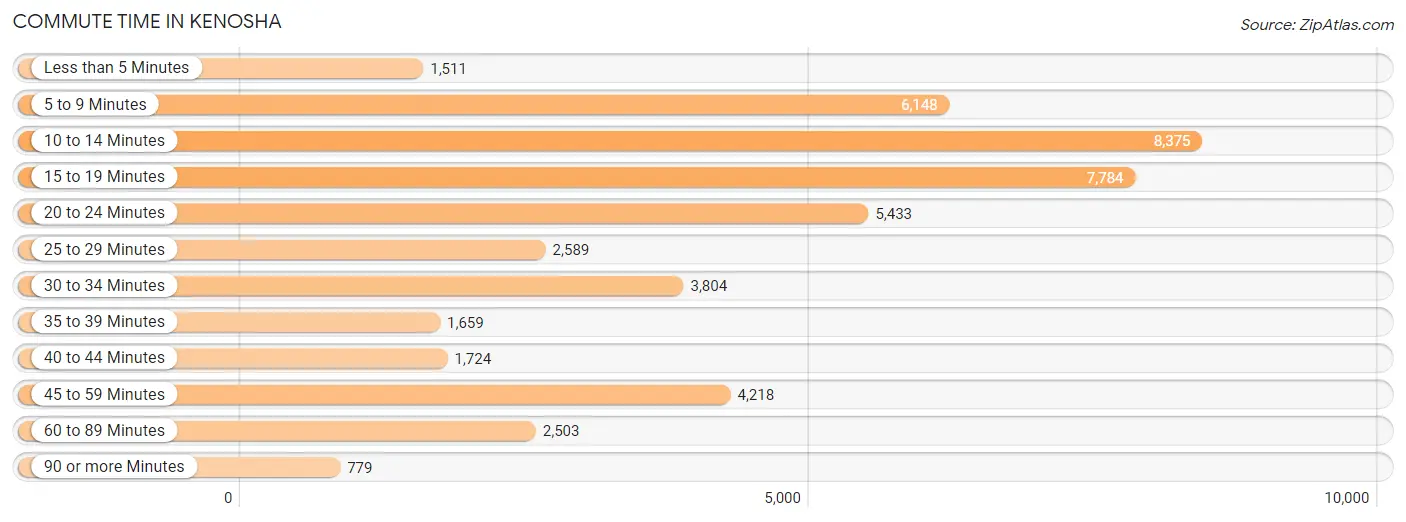
| Commute Time | # Commuters | % Commuters |
| Less than 5 Minutes | 1,511 | 3.3% |
| 5 to 9 Minutes | 6,148 | 13.2% |
| 10 to 14 Minutes | 8,375 | 18.0% |
| 15 to 19 Minutes | 7,784 | 16.7% |
| 20 to 24 Minutes | 5,433 | 11.7% |
| 25 to 29 Minutes | 2,589 | 5.6% |
| 30 to 34 Minutes | 3,804 | 8.2% |
| 35 to 39 Minutes | 1,659 | 3.6% |
| 40 to 44 Minutes | 1,724 | 3.7% |
| 45 to 59 Minutes | 4,218 | 9.1% |
| 60 to 89 Minutes | 2,503 | 5.4% |
| 90 or more Minutes | 779 | 1.7% |
Commute Time by Sex in Kenosha
The most common commute times in Kenosha are 10 to 14 minutes (4,102 commuters, 17.1%) for males and 10 to 14 minutes (4,273 commuters, 18.9%) for females.
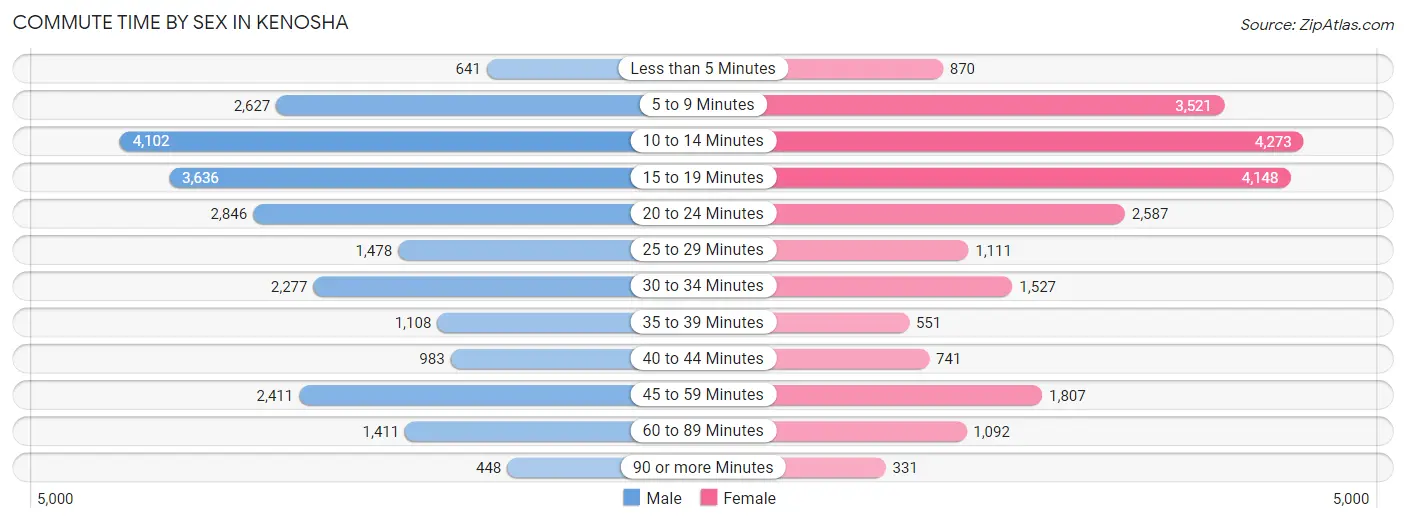
| Commute Time | Male | Female |
| Less than 5 Minutes | 641 (2.7%) | 870 (3.9%) |
| 5 to 9 Minutes | 2,627 (11.0%) | 3,521 (15.6%) |
| 10 to 14 Minutes | 4,102 (17.1%) | 4,273 (18.9%) |
| 15 to 19 Minutes | 3,636 (15.2%) | 4,148 (18.4%) |
| 20 to 24 Minutes | 2,846 (11.9%) | 2,587 (11.5%) |
| 25 to 29 Minutes | 1,478 (6.2%) | 1,111 (4.9%) |
| 30 to 34 Minutes | 2,277 (9.5%) | 1,527 (6.8%) |
| 35 to 39 Minutes | 1,108 (4.6%) | 551 (2.4%) |
| 40 to 44 Minutes | 983 (4.1%) | 741 (3.3%) |
| 45 to 59 Minutes | 2,411 (10.1%) | 1,807 (8.0%) |
| 60 to 89 Minutes | 1,411 (5.9%) | 1,092 (4.8%) |
| 90 or more Minutes | 448 (1.9%) | 331 (1.5%) |
Time of Departure to Work by Sex in Kenosha
The most frequent times of departure to work in Kenosha are 12:00 PM to 3:59 PM (2,925, 12.2%) for males and 7:00 AM to 7:29 AM (3,311, 14.7%) for females.
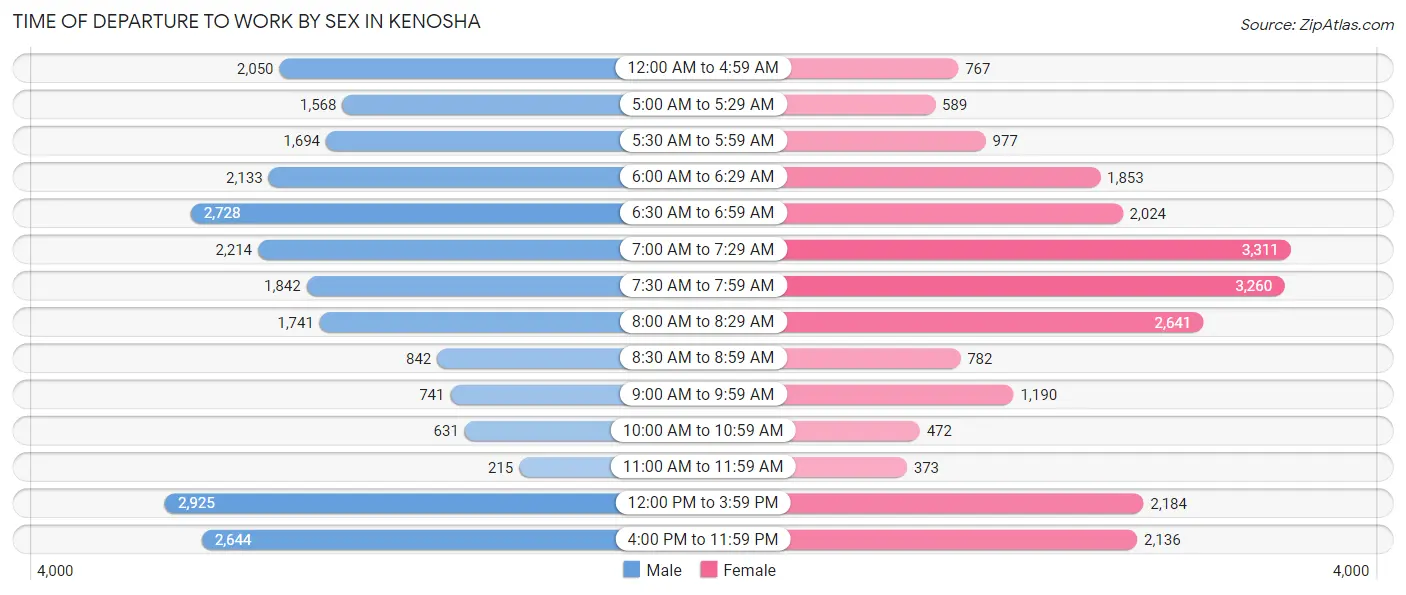
| Time of Departure | Male | Female |
| 12:00 AM to 4:59 AM | 2,050 (8.6%) | 767 (3.4%) |
| 5:00 AM to 5:29 AM | 1,568 (6.5%) | 589 (2.6%) |
| 5:30 AM to 5:59 AM | 1,694 (7.1%) | 977 (4.3%) |
| 6:00 AM to 6:29 AM | 2,133 (8.9%) | 1,853 (8.2%) |
| 6:30 AM to 6:59 AM | 2,728 (11.4%) | 2,024 (9.0%) |
| 7:00 AM to 7:29 AM | 2,214 (9.2%) | 3,311 (14.7%) |
| 7:30 AM to 7:59 AM | 1,842 (7.7%) | 3,260 (14.4%) |
| 8:00 AM to 8:29 AM | 1,741 (7.3%) | 2,641 (11.7%) |
| 8:30 AM to 8:59 AM | 842 (3.5%) | 782 (3.5%) |
| 9:00 AM to 9:59 AM | 741 (3.1%) | 1,190 (5.3%) |
| 10:00 AM to 10:59 AM | 631 (2.6%) | 472 (2.1%) |
| 11:00 AM to 11:59 AM | 215 (0.9%) | 373 (1.7%) |
| 12:00 PM to 3:59 PM | 2,925 (12.2%) | 2,184 (9.7%) |
| 4:00 PM to 11:59 PM | 2,644 (11.0%) | 2,136 (9.5%) |
| Total | 23,968 (100.0%) | 22,559 (100.0%) |
Housing Occupancy in Kenosha
Occupancy by Ownership in Kenosha
Of the total 38,893 dwellings in Kenosha, owner-occupied units account for 22,836 (58.7%), while renter-occupied units make up 16,057 (41.3%).
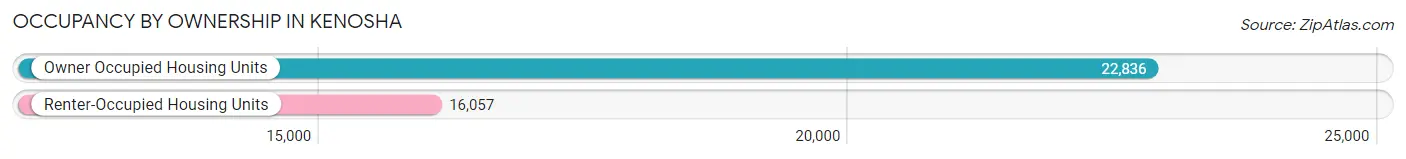
| Occupancy | # Housing Units | % Housing Units |
| Owner Occupied Housing Units | 22,836 | 58.7% |
| Renter-Occupied Housing Units | 16,057 | 41.3% |
| Total Occupied Housing Units | 38,893 | 100.0% |
Occupancy by Household Size in Kenosha

| Household Size | # Housing Units | % Housing Units |
| 1-Person Household | 11,834 | 30.4% |
| 2-Person Household | 11,996 | 30.8% |
| 3-Person Household | 6,199 | 15.9% |
| 4+ Person Household | 8,864 | 22.8% |
| Total Housing Units | 38,893 | 100.0% |
Occupancy by Ownership by Household Size in Kenosha
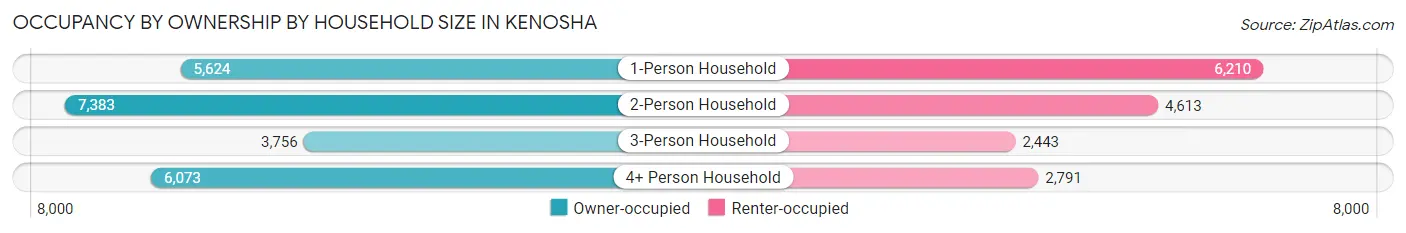
| Household Size | Owner-occupied | Renter-occupied |
| 1-Person Household | 5,624 (47.5%) | 6,210 (52.5%) |
| 2-Person Household | 7,383 (61.6%) | 4,613 (38.5%) |
| 3-Person Household | 3,756 (60.6%) | 2,443 (39.4%) |
| 4+ Person Household | 6,073 (68.5%) | 2,791 (31.5%) |
| Total Housing Units | 22,836 (58.7%) | 16,057 (41.3%) |
Occupancy by Educational Attainment in Kenosha
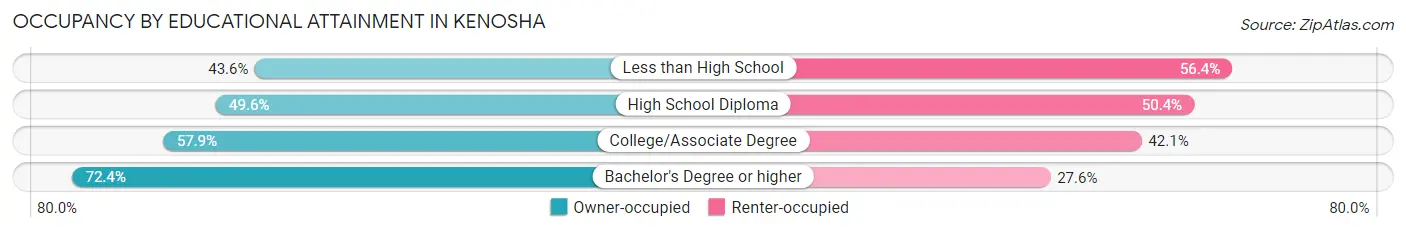
| Household Size | Owner-occupied | Renter-occupied |
| Less than High School | 1,457 (43.6%) | 1,887 (56.4%) |
| High School Diploma | 4,985 (49.6%) | 5,063 (50.4%) |
| College/Associate Degree | 8,275 (57.9%) | 6,011 (42.1%) |
| Bachelor's Degree or higher | 8,119 (72.4%) | 3,096 (27.6%) |
Occupancy by Age of Householder in Kenosha
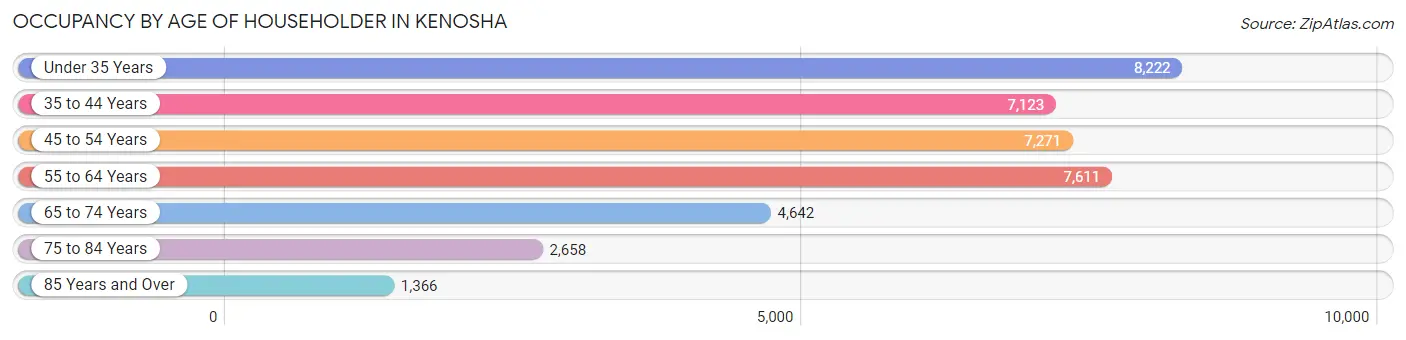
| Age Bracket | # Households | % Households |
| Under 35 Years | 8,222 | 21.1% |
| 35 to 44 Years | 7,123 | 18.3% |
| 45 to 54 Years | 7,271 | 18.7% |
| 55 to 64 Years | 7,611 | 19.6% |
| 65 to 74 Years | 4,642 | 11.9% |
| 75 to 84 Years | 2,658 | 6.8% |
| 85 Years and Over | 1,366 | 3.5% |
| Total | 38,893 | 100.0% |
Housing Finances in Kenosha
Median Income by Occupancy in Kenosha
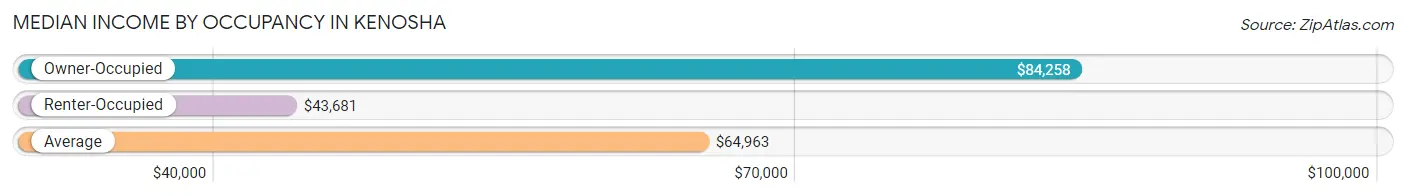
| Occupancy Type | # Households | Median Income |
| Owner-Occupied | 22,836 (58.7%) | $84,258 |
| Renter-Occupied | 16,057 (41.3%) | $43,681 |
| Average | 38,893 (100.0%) | $64,963 |
Occupancy by Householder Income Bracket in Kenosha
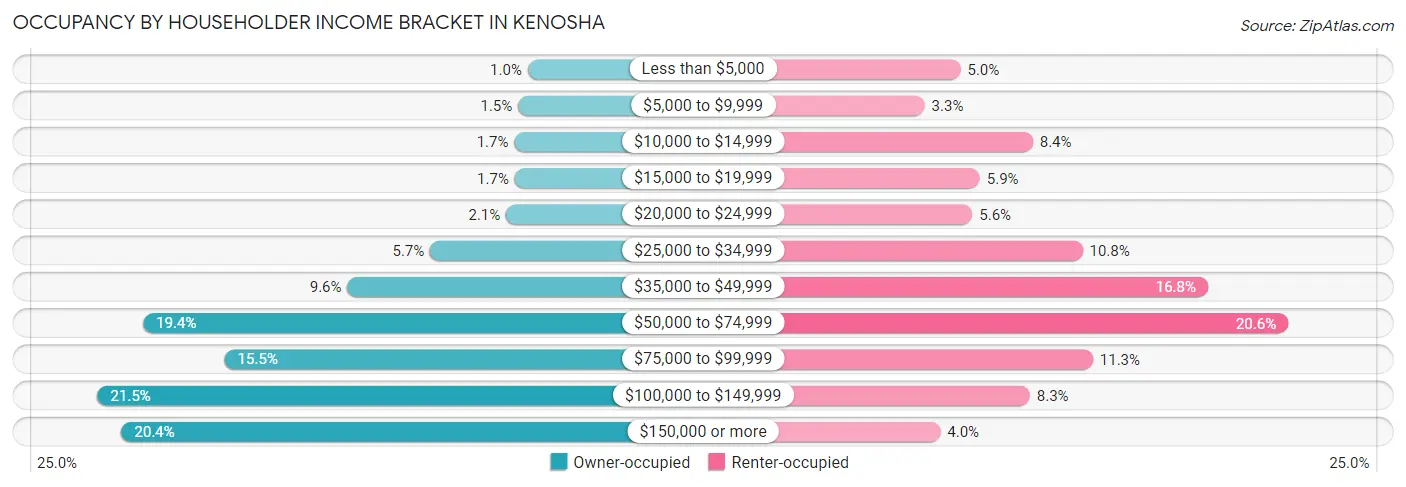
| Income Bracket | Owner-occupied | Renter-occupied |
| Less than $5,000 | 237 (1.0%) | 803 (5.0%) |
| $5,000 to $9,999 | 342 (1.5%) | 528 (3.3%) |
| $10,000 to $14,999 | 384 (1.7%) | 1,355 (8.4%) |
| $15,000 to $19,999 | 378 (1.7%) | 950 (5.9%) |
| $20,000 to $24,999 | 472 (2.1%) | 893 (5.6%) |
| $25,000 to $34,999 | 1,299 (5.7%) | 1,735 (10.8%) |
| $35,000 to $49,999 | 2,198 (9.6%) | 2,692 (16.8%) |
| $50,000 to $74,999 | 4,420 (19.4%) | 3,306 (20.6%) |
| $75,000 to $99,999 | 3,534 (15.5%) | 1,815 (11.3%) |
| $100,000 to $149,999 | 4,916 (21.5%) | 1,332 (8.3%) |
| $150,000 or more | 4,656 (20.4%) | 648 (4.0%) |
| Total | 22,836 (100.0%) | 16,057 (100.0%) |
Monthly Housing Cost Tiers in Kenosha
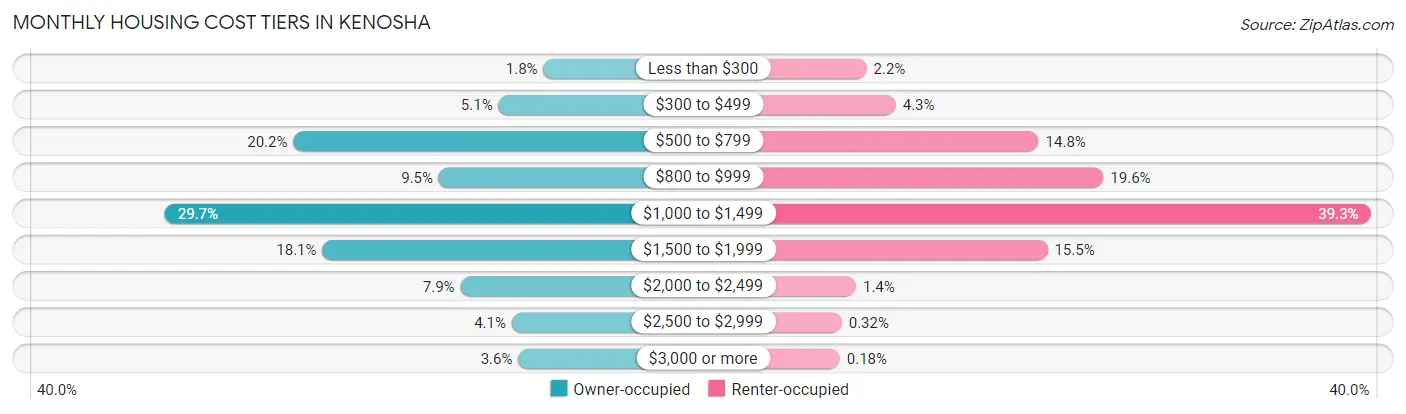
| Monthly Cost | Owner-occupied | Renter-occupied |
| Less than $300 | 409 (1.8%) | 345 (2.1%) |
| $300 to $499 | 1,165 (5.1%) | 690 (4.3%) |
| $500 to $799 | 4,616 (20.2%) | 2,379 (14.8%) |
| $800 to $999 | 2,168 (9.5%) | 3,146 (19.6%) |
| $1,000 to $1,499 | 6,776 (29.7%) | 6,302 (39.3%) |
| $1,500 to $1,999 | 4,127 (18.1%) | 2,484 (15.5%) |
| $2,000 to $2,499 | 1,803 (7.9%) | 220 (1.4%) |
| $2,500 to $2,999 | 941 (4.1%) | 51 (0.3%) |
| $3,000 or more | 831 (3.6%) | 29 (0.2%) |
| Total | 22,836 (100.0%) | 16,057 (100.0%) |
Physical Housing Characteristics in Kenosha
Housing Structures in Kenosha
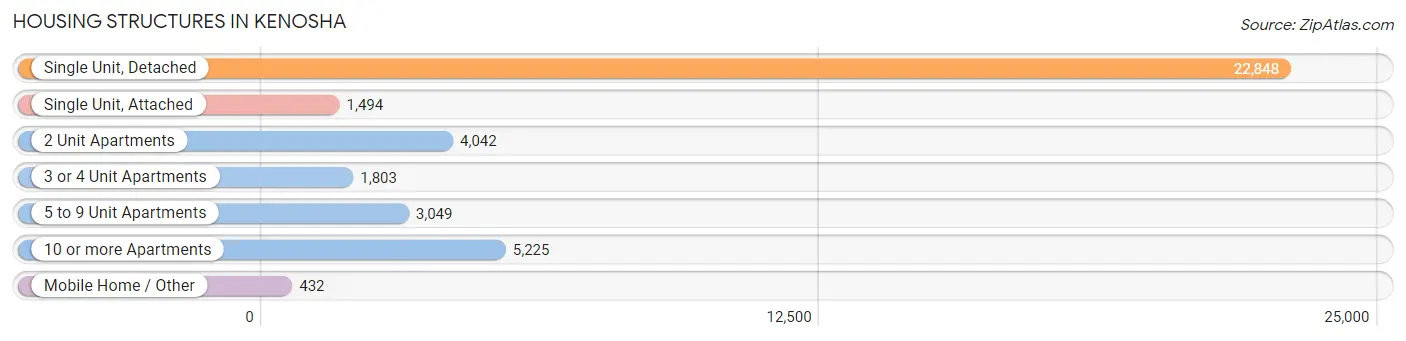
| Structure Type | # Housing Units | % Housing Units |
| Single Unit, Detached | 22,848 | 58.8% |
| Single Unit, Attached | 1,494 | 3.8% |
| 2 Unit Apartments | 4,042 | 10.4% |
| 3 or 4 Unit Apartments | 1,803 | 4.6% |
| 5 to 9 Unit Apartments | 3,049 | 7.8% |
| 10 or more Apartments | 5,225 | 13.4% |
| Mobile Home / Other | 432 | 1.1% |
| Total | 38,893 | 100.0% |
Housing Structures by Occupancy in Kenosha
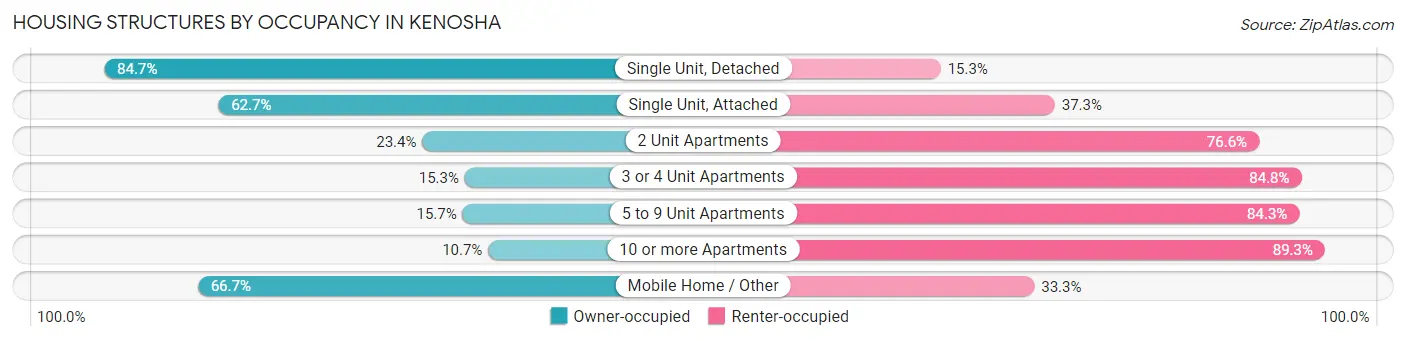
| Structure Type | Owner-occupied | Renter-occupied |
| Single Unit, Detached | 19,350 (84.7%) | 3,498 (15.3%) |
| Single Unit, Attached | 937 (62.7%) | 557 (37.3%) |
| 2 Unit Apartments | 947 (23.4%) | 3,095 (76.6%) |
| 3 or 4 Unit Apartments | 275 (15.2%) | 1,528 (84.8%) |
| 5 to 9 Unit Apartments | 478 (15.7%) | 2,571 (84.3%) |
| 10 or more Apartments | 561 (10.7%) | 4,664 (89.3%) |
| Mobile Home / Other | 288 (66.7%) | 144 (33.3%) |
| Total | 22,836 (58.7%) | 16,057 (41.3%) |
Housing Structures by Number of Rooms in Kenosha
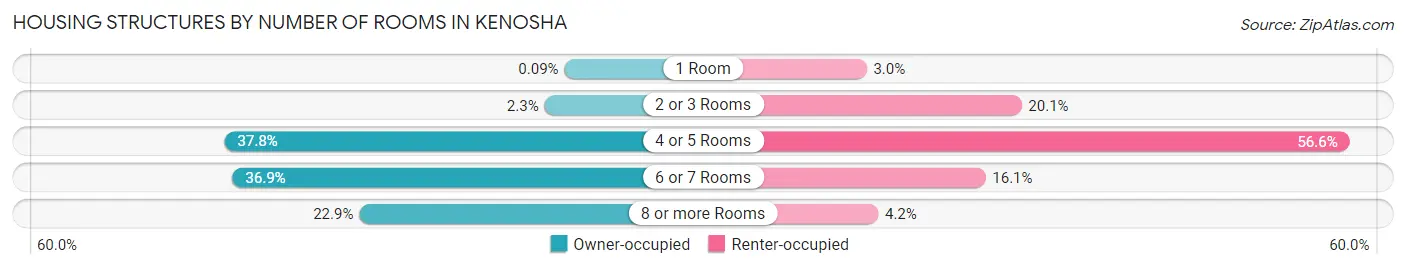
| Number of Rooms | Owner-occupied | Renter-occupied |
| 1 Room | 21 (0.1%) | 473 (2.9%) |
| 2 or 3 Rooms | 525 (2.3%) | 3,234 (20.1%) |
| 4 or 5 Rooms | 8,637 (37.8%) | 9,080 (56.6%) |
| 6 or 7 Rooms | 8,433 (36.9%) | 2,591 (16.1%) |
| 8 or more Rooms | 5,220 (22.9%) | 679 (4.2%) |
| Total | 22,836 (100.0%) | 16,057 (100.0%) |
Housing Structure by Heating Type in Kenosha
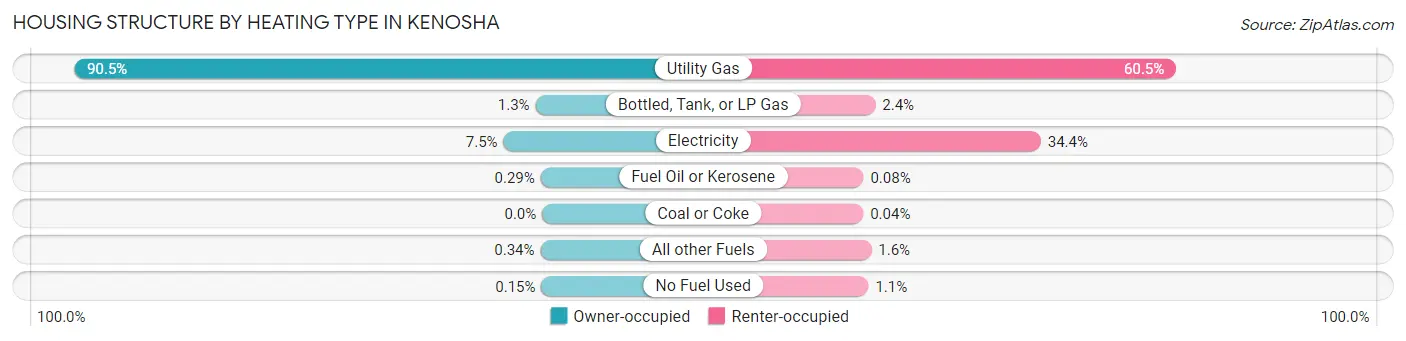
| Heating Type | Owner-occupied | Renter-occupied |
| Utility Gas | 20,658 (90.5%) | 9,713 (60.5%) |
| Bottled, Tank, or LP Gas | 294 (1.3%) | 382 (2.4%) |
| Electricity | 1,706 (7.5%) | 5,516 (34.4%) |
| Fuel Oil or Kerosene | 66 (0.3%) | 13 (0.1%) |
| Coal or Coke | 0 (0.0%) | 7 (0.0%) |
| All other Fuels | 78 (0.3%) | 258 (1.6%) |
| No Fuel Used | 34 (0.2%) | 168 (1.1%) |
| Total | 22,836 (100.0%) | 16,057 (100.0%) |
Household Vehicle Usage in Kenosha
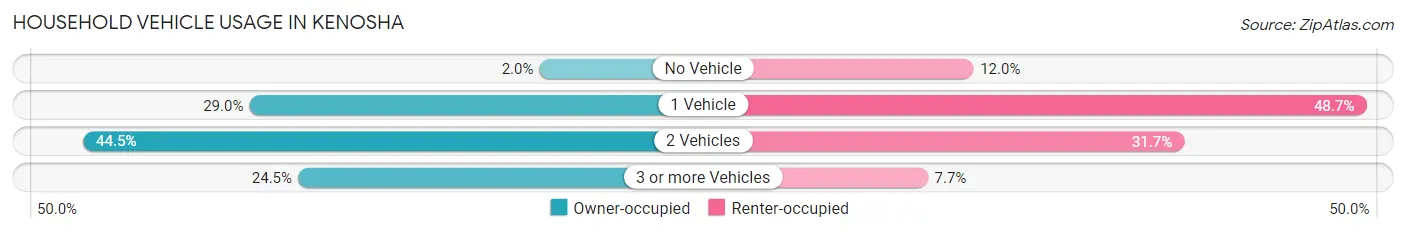
| Vehicles per Household | Owner-occupied | Renter-occupied |
| No Vehicle | 445 (1.9%) | 1,923 (12.0%) |
| 1 Vehicle | 6,629 (29.0%) | 7,813 (48.7%) |
| 2 Vehicles | 10,170 (44.5%) | 5,082 (31.7%) |
| 3 or more Vehicles | 5,592 (24.5%) | 1,239 (7.7%) |
| Total | 22,836 (100.0%) | 16,057 (100.0%) |
Real Estate & Mortgages in Kenosha
Real Estate and Mortgage Overview in Kenosha
| Characteristic | Without Mortgage | With Mortgage |
| Housing Units | 7,725 | 15,111 |
| Median Property Value | $184,400 | $198,500 |
| Median Household Income | $65,864 | $3,322 |
| Monthly Housing Costs | $668 | $831 |
| Real Estate Taxes | $3,796 | $125 |
Property Value by Mortgage Status in Kenosha
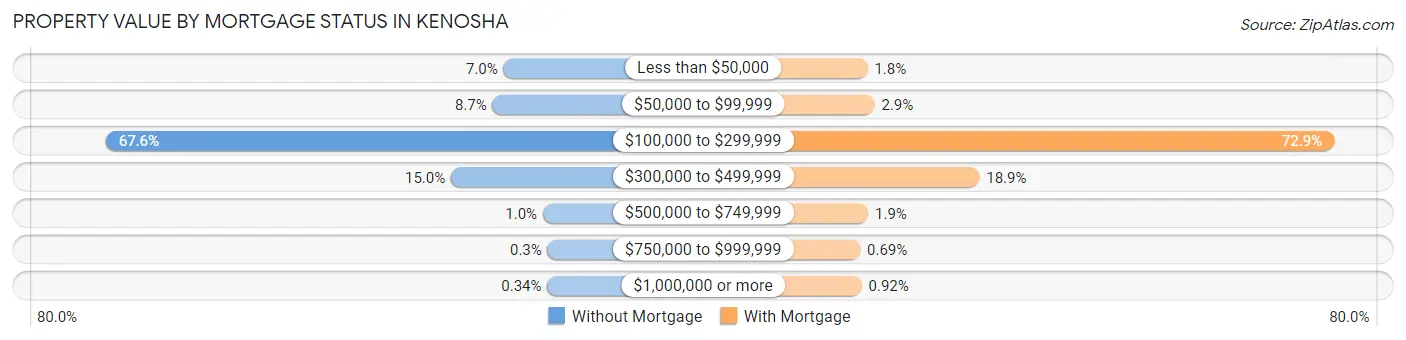
| Property Value | Without Mortgage | With Mortgage |
| Less than $50,000 | 542 (7.0%) | 275 (1.8%) |
| $50,000 to $99,999 | 671 (8.7%) | 437 (2.9%) |
| $100,000 to $299,999 | 5,224 (67.6%) | 11,016 (72.9%) |
| $300,000 to $499,999 | 1,160 (15.0%) | 2,850 (18.9%) |
| $500,000 to $749,999 | 79 (1.0%) | 289 (1.9%) |
| $750,000 to $999,999 | 23 (0.3%) | 105 (0.7%) |
| $1,000,000 or more | 26 (0.3%) | 139 (0.9%) |
| Total | 7,725 (100.0%) | 15,111 (100.0%) |
Household Income by Mortgage Status in Kenosha
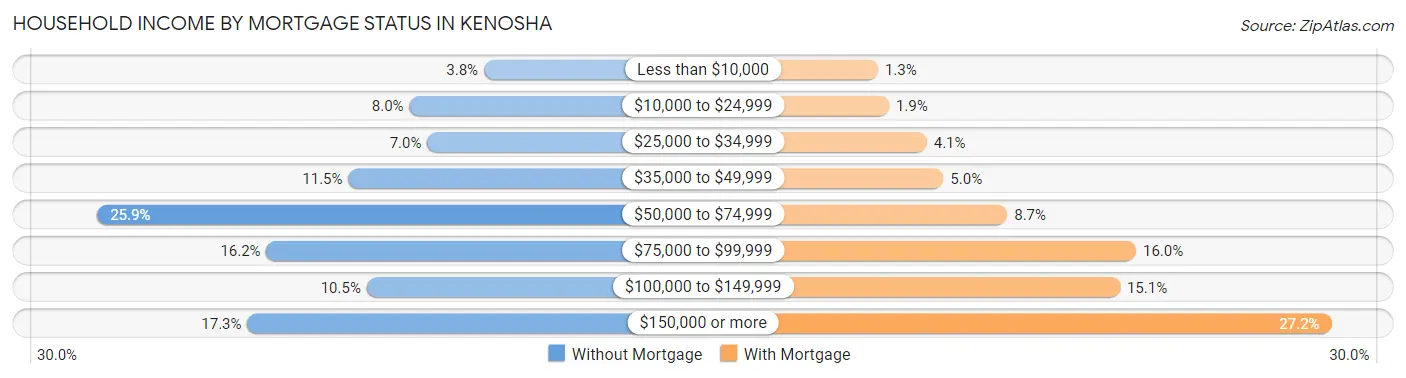
| Household Income | Without Mortgage | With Mortgage |
| Less than $10,000 | 290 (3.7%) | 193 (1.3%) |
| $10,000 to $24,999 | 619 (8.0%) | 289 (1.9%) |
| $25,000 to $34,999 | 540 (7.0%) | 615 (4.1%) |
| $35,000 to $49,999 | 888 (11.5%) | 759 (5.0%) |
| $50,000 to $74,999 | 1,997 (25.9%) | 1,310 (8.7%) |
| $75,000 to $99,999 | 1,250 (16.2%) | 2,423 (16.0%) |
| $100,000 to $149,999 | 807 (10.4%) | 2,284 (15.1%) |
| $150,000 or more | 1,334 (17.3%) | 4,109 (27.2%) |
| Total | 7,725 (100.0%) | 15,111 (100.0%) |
Property Value to Household Income Ratio in Kenosha
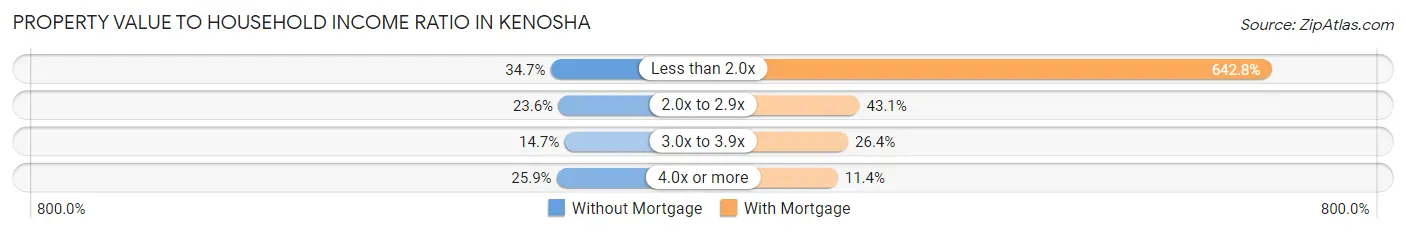
| Value-to-Income Ratio | Without Mortgage | With Mortgage |
| Less than 2.0x | 2,684 (34.7%) | 97,126 (642.8%) |
| 2.0x to 2.9x | 1,826 (23.6%) | 6,517 (43.1%) |
| 3.0x to 3.9x | 1,137 (14.7%) | 3,989 (26.4%) |
| 4.0x or more | 2,000 (25.9%) | 1,729 (11.4%) |
| Total | 7,725 (100.0%) | 15,111 (100.0%) |
Real Estate Taxes by Mortgage Status in Kenosha
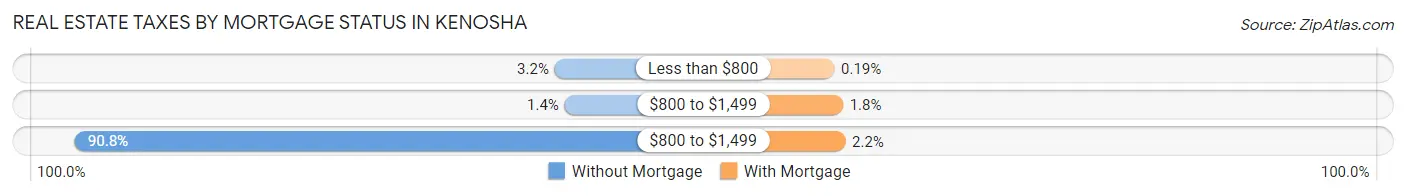
| Property Taxes | Without Mortgage | With Mortgage |
| Less than $800 | 245 (3.2%) | 28 (0.2%) |
| $800 to $1,499 | 104 (1.3%) | 266 (1.8%) |
| $800 to $1,499 | 7,015 (90.8%) | 333 (2.2%) |
| Total | 7,725 (100.0%) | 15,111 (100.0%) |
Health & Disability in Kenosha
Health Insurance Coverage by Age in Kenosha
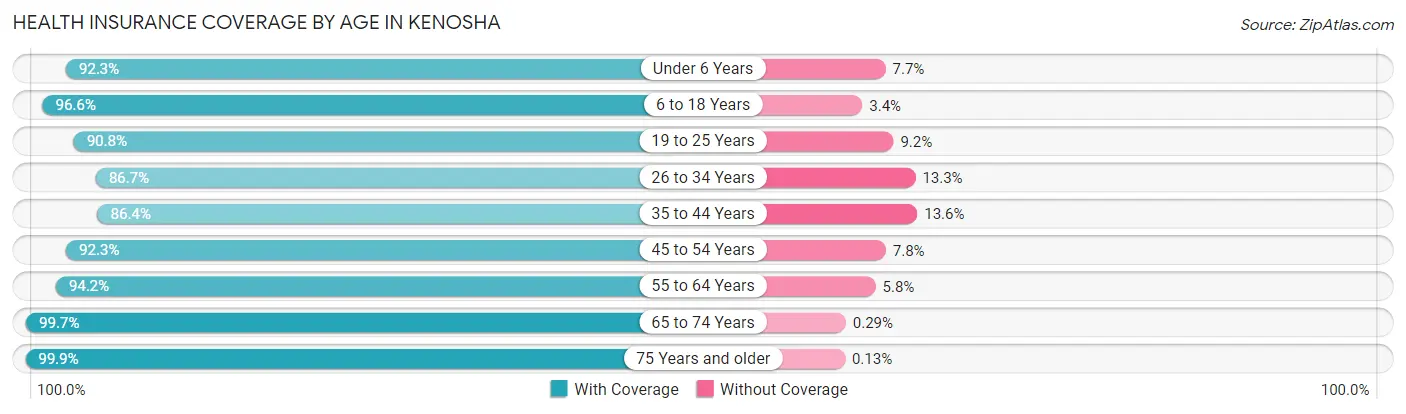
| Age Bracket | With Coverage | Without Coverage |
| Under 6 Years | 6,592 (92.3%) | 550 (7.7%) |
| 6 to 18 Years | 17,330 (96.6%) | 602 (3.4%) |
| 19 to 25 Years | 9,556 (90.8%) | 965 (9.2%) |
| 26 to 34 Years | 10,283 (86.7%) | 1,573 (13.3%) |
| 35 to 44 Years | 11,655 (86.4%) | 1,837 (13.6%) |
| 45 to 54 Years | 11,435 (92.2%) | 961 (7.7%) |
| 55 to 64 Years | 11,234 (94.2%) | 697 (5.8%) |
| 65 to 74 Years | 7,201 (99.7%) | 21 (0.3%) |
| 75 Years and older | 5,556 (99.9%) | 7 (0.1%) |
| Total | 90,842 (92.6%) | 7,213 (7.4%) |
Health Insurance Coverage by Citizenship Status in Kenosha
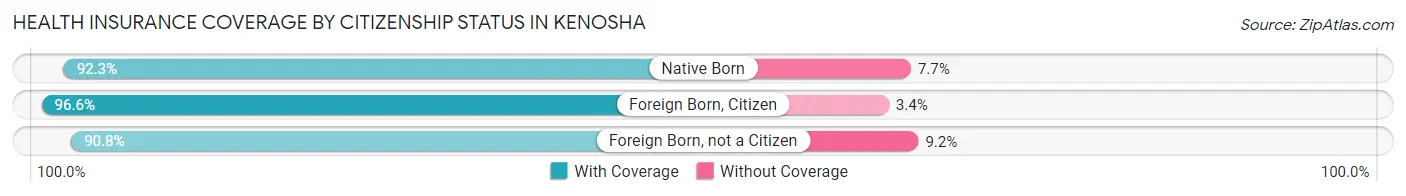
| Citizenship Status | With Coverage | Without Coverage |
| Native Born | 6,592 (92.3%) | 550 (7.7%) |
| Foreign Born, Citizen | 17,330 (96.6%) | 602 (3.4%) |
| Foreign Born, not a Citizen | 9,556 (90.8%) | 965 (9.2%) |
Health Insurance Coverage by Household Income in Kenosha
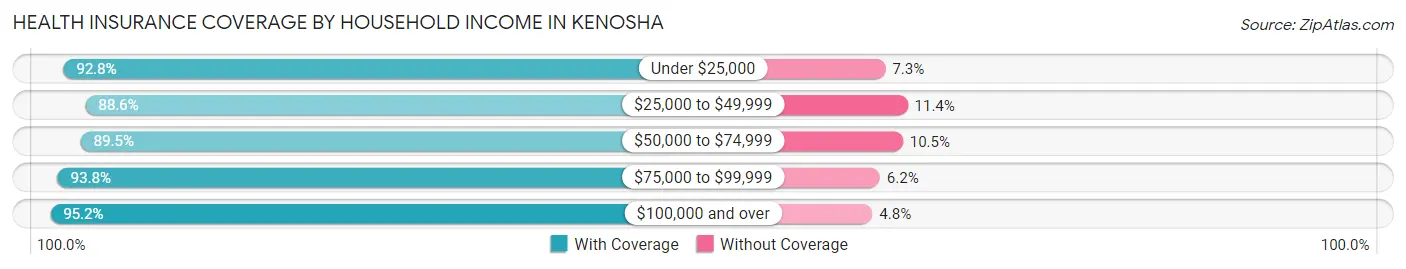
| Household Income | With Coverage | Without Coverage |
| Under $25,000 | 10,305 (92.7%) | 805 (7.2%) |
| $25,000 to $49,999 | 14,213 (88.6%) | 1,827 (11.4%) |
| $50,000 to $74,999 | 15,939 (89.5%) | 1,868 (10.5%) |
| $75,000 to $99,999 | 13,412 (93.8%) | 886 (6.2%) |
| $100,000 and over | 34,994 (95.2%) | 1,764 (4.8%) |
Public vs Private Health Insurance Coverage by Age in Kenosha
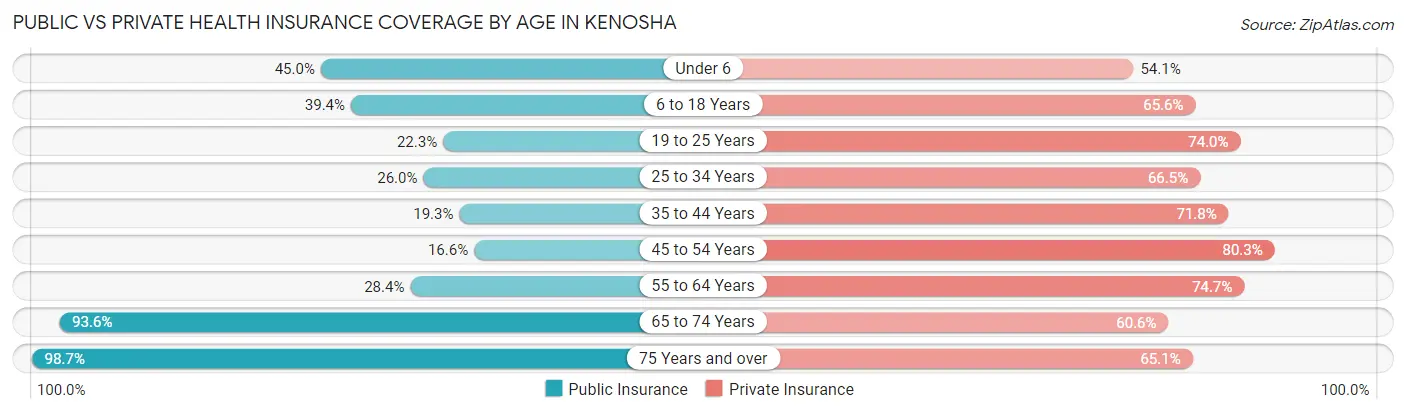
| Age Bracket | Public Insurance | Private Insurance |
| Under 6 | 3,216 (45.0%) | 3,867 (54.1%) |
| 6 to 18 Years | 7,073 (39.4%) | 11,766 (65.6%) |
| 19 to 25 Years | 2,350 (22.3%) | 7,782 (74.0%) |
| 25 to 34 Years | 3,081 (26.0%) | 7,882 (66.5%) |
| 35 to 44 Years | 2,607 (19.3%) | 9,685 (71.8%) |
| 45 to 54 Years | 2,057 (16.6%) | 9,957 (80.3%) |
| 55 to 64 Years | 3,391 (28.4%) | 8,911 (74.7%) |
| 65 to 74 Years | 6,760 (93.6%) | 4,377 (60.6%) |
| 75 Years and over | 5,491 (98.7%) | 3,621 (65.1%) |
| Total | 36,026 (36.7%) | 67,848 (69.2%) |
Disability Status by Sex by Age in Kenosha
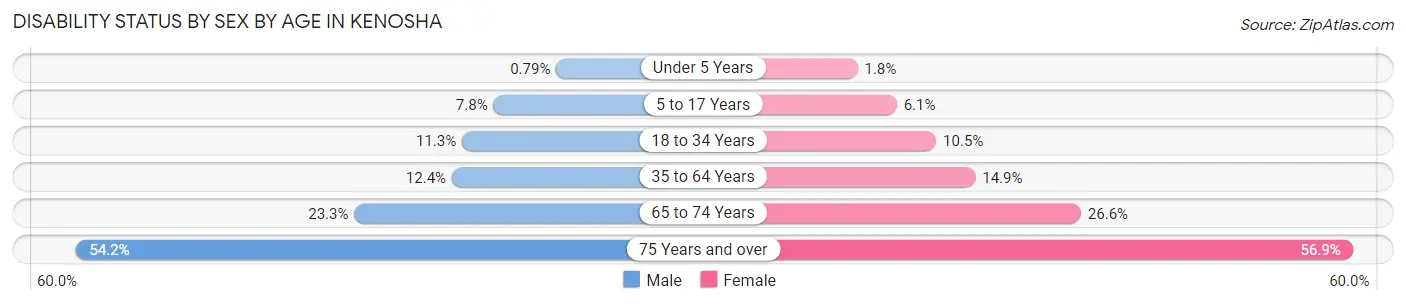
| Age Bracket | Male | Female |
| Under 5 Years | 23 (0.8%) | 51 (1.8%) |
| 5 to 17 Years | 682 (7.8%) | 548 (6.1%) |
| 18 to 34 Years | 1,339 (11.3%) | 1,266 (10.5%) |
| 35 to 64 Years | 2,305 (12.4%) | 2,860 (14.9%) |
| 65 to 74 Years | 759 (23.3%) | 1,055 (26.6%) |
| 75 Years and over | 1,183 (54.2%) | 1,924 (56.9%) |
Disability Class by Sex by Age in Kenosha
Disability Class: Hearing Difficulty
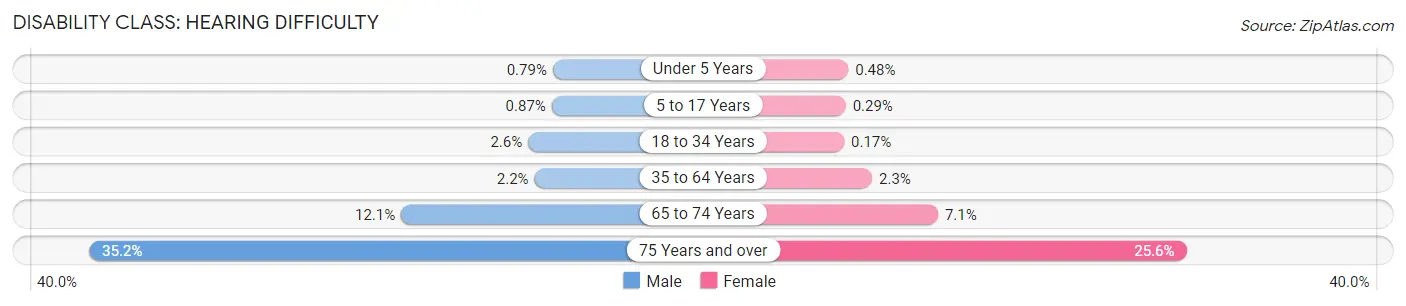
| Age Bracket | Male | Female |
| Under 5 Years | 23 (0.8%) | 14 (0.5%) |
| 5 to 17 Years | 76 (0.9%) | 26 (0.3%) |
| 18 to 34 Years | 311 (2.6%) | 21 (0.2%) |
| 35 to 64 Years | 400 (2.1%) | 433 (2.2%) |
| 65 to 74 Years | 393 (12.0%) | 283 (7.1%) |
| 75 Years and over | 768 (35.2%) | 865 (25.6%) |
Disability Class: Vision Difficulty
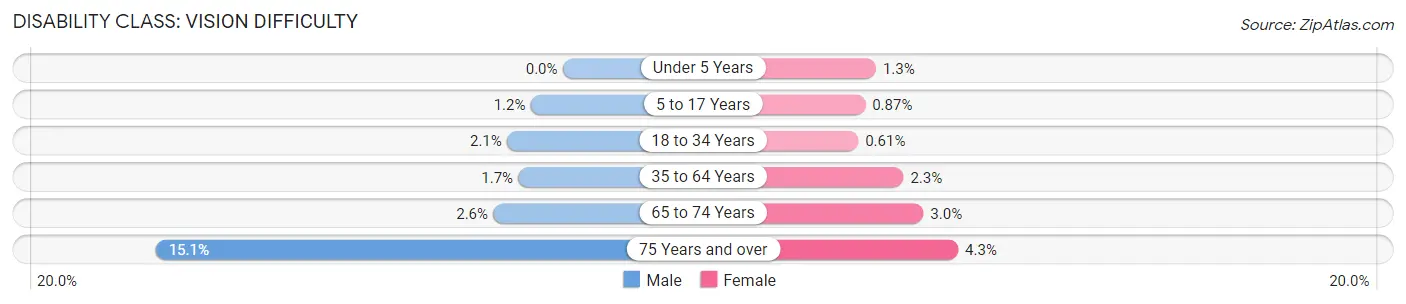
| Age Bracket | Male | Female |
| Under 5 Years | 0 (0.0%) | 37 (1.3%) |
| 5 to 17 Years | 104 (1.2%) | 78 (0.9%) |
| 18 to 34 Years | 246 (2.1%) | 74 (0.6%) |
| 35 to 64 Years | 306 (1.7%) | 441 (2.3%) |
| 65 to 74 Years | 84 (2.6%) | 120 (3.0%) |
| 75 Years and over | 330 (15.1%) | 146 (4.3%) |
Disability Class: Cognitive Difficulty
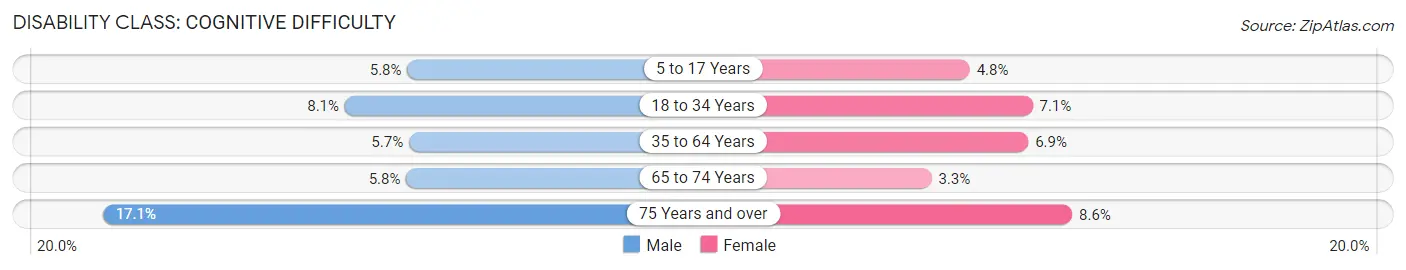
| Age Bracket | Male | Female |
| 5 to 17 Years | 507 (5.8%) | 425 (4.8%) |
| 18 to 34 Years | 963 (8.1%) | 853 (7.1%) |
| 35 to 64 Years | 1,065 (5.7%) | 1,331 (6.9%) |
| 65 to 74 Years | 190 (5.8%) | 132 (3.3%) |
| 75 Years and over | 373 (17.1%) | 289 (8.6%) |
Disability Class: Ambulatory Difficulty
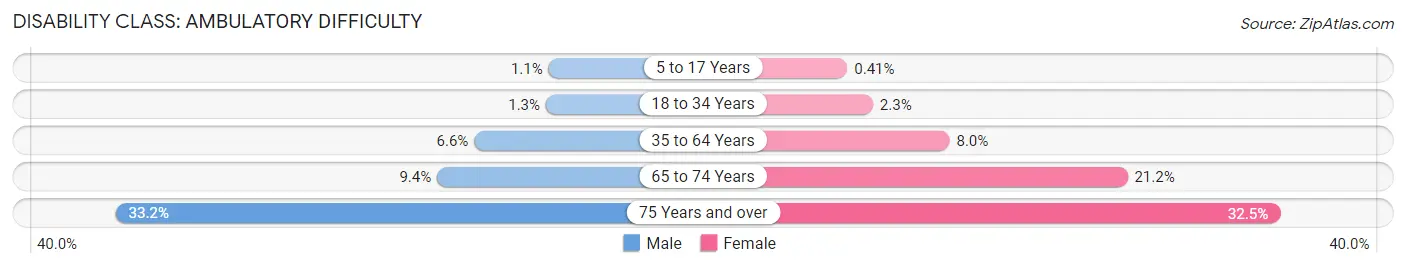
| Age Bracket | Male | Female |
| 5 to 17 Years | 96 (1.1%) | 37 (0.4%) |
| 18 to 34 Years | 154 (1.3%) | 278 (2.3%) |
| 35 to 64 Years | 1,230 (6.6%) | 1,539 (8.0%) |
| 65 to 74 Years | 306 (9.4%) | 840 (21.2%) |
| 75 Years and over | 725 (33.2%) | 1,100 (32.5%) |
Disability Class: Self-Care Difficulty
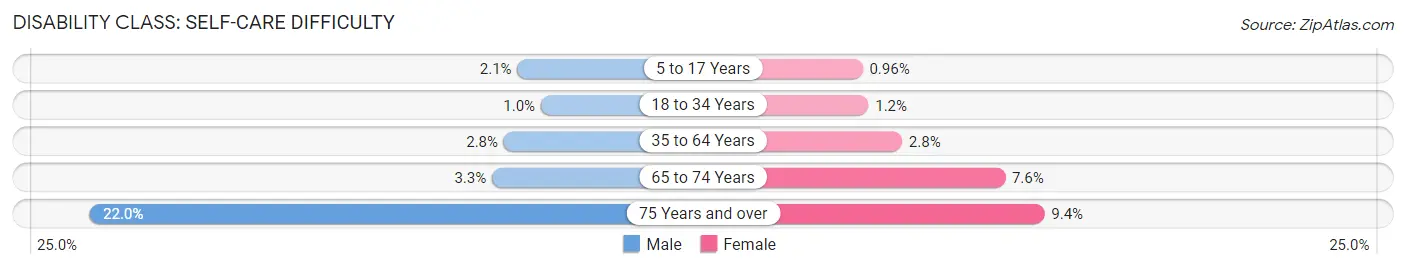
| Age Bracket | Male | Female |
| 5 to 17 Years | 187 (2.1%) | 86 (1.0%) |
| 18 to 34 Years | 123 (1.0%) | 148 (1.2%) |
| 35 to 64 Years | 512 (2.8%) | 537 (2.8%) |
| 65 to 74 Years | 108 (3.3%) | 300 (7.6%) |
| 75 Years and over | 479 (22.0%) | 318 (9.4%) |
Technology Access in Kenosha
Computing Device Access in Kenosha
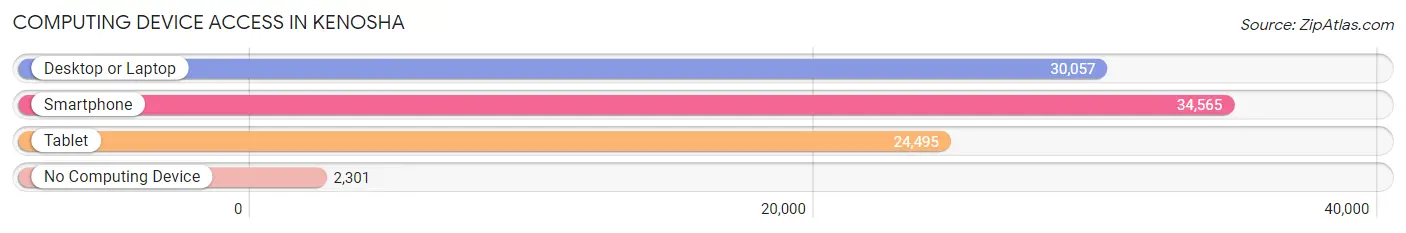
| Device Type | # Households | % Households |
| Desktop or Laptop | 30,057 | 77.3% |
| Smartphone | 34,565 | 88.9% |
| Tablet | 24,495 | 63.0% |
| No Computing Device | 2,301 | 5.9% |
| Total | 38,893 | 100.0% |
Internet Access in Kenosha
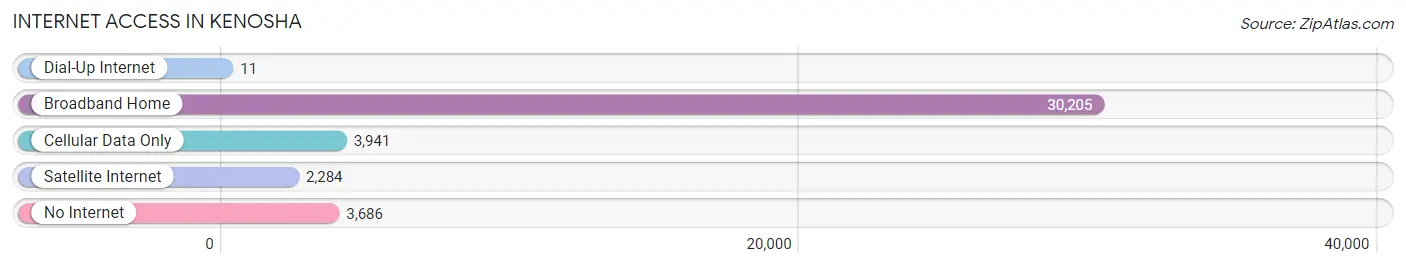
| Internet Type | # Households | % Households |
| Dial-Up Internet | 11 | 0.0% |
| Broadband Home | 30,205 | 77.7% |
| Cellular Data Only | 3,941 | 10.1% |
| Satellite Internet | 2,284 | 5.9% |
| No Internet | 3,686 | 9.5% |
| Total | 38,893 | 100.0% |
Kenosha Summary
Kenosha, Wisconsin is a city located in the southeastern corner of the state, on the shores of Lake Michigan. It is the fourth-largest city in Wisconsin, with a population of 99,218 as of the 2019 census. The city is part of the Milwaukee-Racine-Waukesha metropolitan area, and is located about halfway between Milwaukee and Chicago.
History
The area that is now Kenosha was first inhabited by the Potawatomi people, who had a settlement in the area. The first Europeans to settle in the area were French fur traders, who established a trading post in the area in the late 18th century. The first permanent settlers were settlers from New England, who arrived in the early 19th century.
In 1835, the area was incorporated as the Town of Southport, and in 1850, it was renamed to the City of Kenosha. The city was named after the Potawatomi word for "pike," which was a type of fish found in the area.
The city grew rapidly in the late 19th century, due to its location on the shores of Lake Michigan and its proximity to Chicago. The city was a major center for the production of automobiles, and was home to several major automobile manufacturers, including Nash Motors, American Motors, and Chrysler.
Geography
Kenosha is located in southeastern Wisconsin, on the shores of Lake Michigan. It is located about halfway between Milwaukee and Chicago, and is part of the Milwaukee-Racine-Waukesha metropolitan area.
The city has a total area of 24.3 square miles, of which 22.7 square miles is land and 1.6 square miles is water. The city is located on the western shore of Lake Michigan, and is bordered by the cities of Racine and Pleasant Prairie to the south, and the towns of Somers and Brighton to the north.
Economy
Kenosha's economy is largely based on manufacturing, with several major companies located in the city. The city is home to several automotive manufacturers, including Chrysler, American Motors, and Nash Motors. The city is also home to several other major companies, including Snap-on Tools, Uline, and Jockey International.
The city is also home to several educational institutions, including the University of Wisconsin-Parkside, Carthage College, and Gateway Technical College.
Demographics
As of the 2019 census, the population of Kenosha was 99,218. The racial makeup of the city was 79.2% White, 11.3% African American, 0.7% Native American, 2.2% Asian, 0.1% Pacific Islander, 4.2% from other races, and 2.4% from two or more races. Hispanic or Latino of any race were 10.2% of the population.
The median household income in the city was $50,845, and the median family income was $60,945. The per capita income in the city was $25,845. About 11.3% of the population was below the poverty line.
Common Questions
What is Per Capita Income in Kenosha?
Per Capita income in Kenosha is $33,894.
What is the Median Family Income in Kenosha?
Median Family Income in Kenosha is $81,270.
What is the Median Household income in Kenosha?
Median Household Income in Kenosha is $64,963.
What is Income or Wage Gap in Kenosha?
Income or Wage Gap in Kenosha is 26.3%.
Women in Kenosha earn 73.7 cents for every dollar earned by a man.
What is Family Income Deficit in Kenosha?
Family Income Deficit in Kenosha is $9,799.
Families that are below poverty line in Kenosha earn $9,799 less on average than the poverty threshold level.
What is Inequality or Gini Index in Kenosha?
Inequality or Gini Index in Kenosha is 0.43.
What is the Total Population of Kenosha?
Total Population of Kenosha is 99,493.
What is the Total Male Population of Kenosha?
Total Male Population of Kenosha is 48,454.
What is the Total Female Population of Kenosha?
Total Female Population of Kenosha is 51,039.
What is the Ratio of Males per 100 Females in Kenosha?
There are 94.94 Males per 100 Females in Kenosha.
What is the Ratio of Females per 100 Males in Kenosha?
There are 105.33 Females per 100 Males in Kenosha.
What is the Median Population Age in Kenosha?
Median Population Age in Kenosha is 36.3 Years.
What is the Average Family Size in Kenosha
Average Family Size in Kenosha is 3.1 People.
What is the Average Household Size in Kenosha
Average Household Size in Kenosha is 2.5 People.
How Large is the Labor Force in Kenosha?
There are 53,397 People in the Labor Forcein in Kenosha.
What is the Percentage of People in the Labor Force in Kenosha?
67.8% of People are in the Labor Force in Kenosha.
What is the Unemployment Rate in Kenosha?
Unemployment Rate in Kenosha is 5.4%.