Naperville, IL Map & Demographics
Naperville Map
Naperville Overview
$67,706
PER CAPITA INCOME
$170,228
AVG FAMILY INCOME
$143,754
AVG HOUSEHOLD INCOME
46.7%
WAGE / INCOME GAP [ % ]
53.3¢/ $1
WAGE / INCOME GAP [ $ ]
$11,506
FAMILY INCOME DEFICIT
0.44
INEQUALITY / GINI INDEX
149,089
TOTAL POPULATION
73,888
MALE POPULATION
75,201
FEMALE POPULATION
98.25
MALES / 100 FEMALES
101.78
FEMALES / 100 MALES
39.5
MEDIAN AGE
3.2
AVG FAMILY SIZE
2.7
AVG HOUSEHOLD SIZE
80,320
LABOR FORCE [ PEOPLE ]
68.6%
PERCENT IN LABOR FORCE
4.5%
UNEMPLOYMENT RATE
Income in Naperville
Income Overview in Naperville
Per Capita Income in Naperville is $67,706, while median incomes of families and households are $170,228 and $143,754 respectively.
| Characteristic | Number | Measure |
| Per Capita Income | 149,089 | $67,706 |
| Median Family Income | 40,286 | $170,228 |
| Mean Family Income | 40,286 | $212,167 |
| Median Household Income | 53,815 | $143,754 |
| Mean Household Income | 53,815 | $184,743 |
| Income Deficit | 40,286 | $11,506 |
| Wage / Income Gap (%) | 149,089 | 46.73% |
| Wage / Income Gap ($) | 149,089 | 53.27¢ per $1 |
| Gini / Inequality Index | 149,089 | 0.44 |
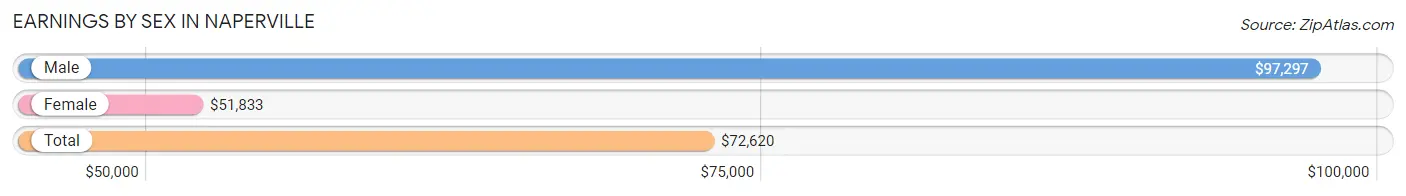
Earnings by Sex in Naperville
Average Earnings in Naperville are $72,620, $97,297 for men and $51,833 for women, a difference of 46.7%.
| Sex | Number | Average Earnings |
| Male | 45,733 (54.8%) | $97,297 |
| Female | 37,697 (45.2%) | $51,833 |
| Total | 83,430 (100.0%) | $72,620 |
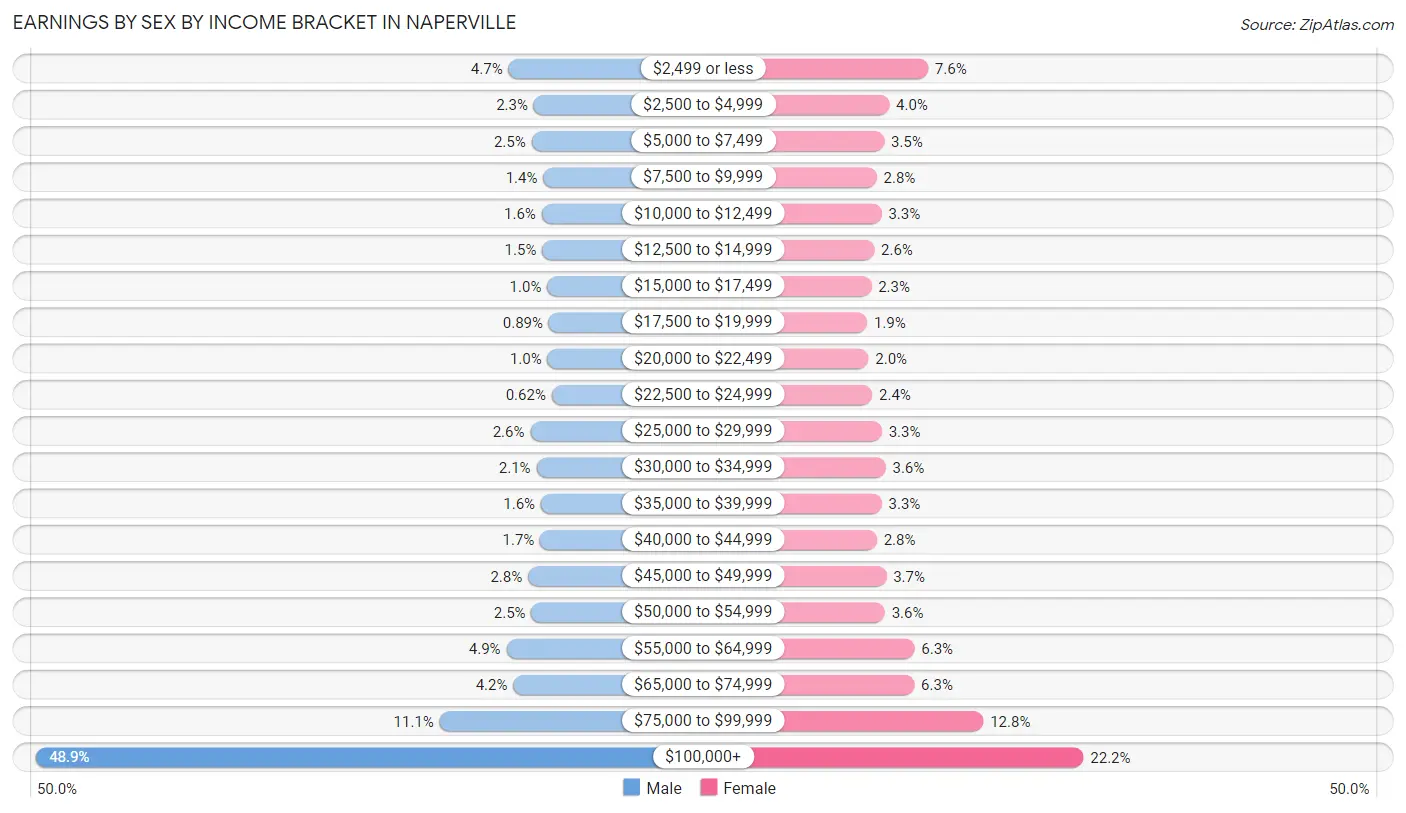
Earnings by Sex by Income Bracket in Naperville
The most common earnings brackets in Naperville are $100,000+ for men (22,367 | 48.9%) and $100,000+ for women (8,352 | 22.2%).
| Income | Male | Female |
| $2,499 or less | 2,135 (4.7%) | 2,865 (7.6%) |
| $2,500 to $4,999 | 1,054 (2.3%) | 1,494 (4.0%) |
| $5,000 to $7,499 | 1,150 (2.5%) | 1,316 (3.5%) |
| $7,500 to $9,999 | 646 (1.4%) | 1,052 (2.8%) |
| $10,000 to $12,499 | 714 (1.6%) | 1,225 (3.3%) |
| $12,500 to $14,999 | 689 (1.5%) | 965 (2.6%) |
| $15,000 to $17,499 | 475 (1.0%) | 865 (2.3%) |
| $17,500 to $19,999 | 405 (0.9%) | 711 (1.9%) |
| $20,000 to $22,499 | 462 (1.0%) | 761 (2.0%) |
| $22,500 to $24,999 | 283 (0.6%) | 892 (2.4%) |
| $25,000 to $29,999 | 1,201 (2.6%) | 1,232 (3.3%) |
| $30,000 to $34,999 | 936 (2.1%) | 1,367 (3.6%) |
| $35,000 to $39,999 | 747 (1.6%) | 1,228 (3.3%) |
| $40,000 to $44,999 | 777 (1.7%) | 1,057 (2.8%) |
| $45,000 to $49,999 | 1,299 (2.8%) | 1,391 (3.7%) |
| $50,000 to $54,999 | 1,154 (2.5%) | 1,338 (3.5%) |
| $55,000 to $64,999 | 2,223 (4.9%) | 2,387 (6.3%) |
| $65,000 to $74,999 | 1,931 (4.2%) | 2,380 (6.3%) |
| $75,000 to $99,999 | 5,085 (11.1%) | 4,819 (12.8%) |
| $100,000+ | 22,367 (48.9%) | 8,352 (22.2%) |
| Total | 45,733 (100.0%) | 37,697 (100.0%) |
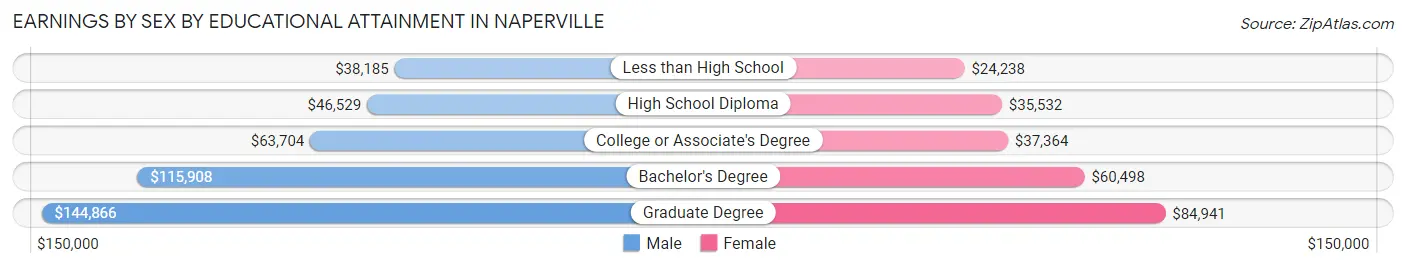
Earnings by Sex by Educational Attainment in Naperville
Average earnings in Naperville are $111,686 for men and $60,811 for women, a difference of 45.6%. Men with an educational attainment of graduate degree enjoy the highest average annual earnings of $144,866, while those with less than high school education earn the least with $38,185. Women with an educational attainment of graduate degree earn the most with the average annual earnings of $84,941, while those with less than high school education have the smallest earnings of $24,238.
| Educational Attainment | Male Income | Female Income |
| Less than High School | $38,185 | $24,238 |
| High School Diploma | $46,529 | $35,532 |
| College or Associate's Degree | $63,704 | $37,364 |
| Bachelor's Degree | $115,908 | $60,498 |
| Graduate Degree | $144,866 | $84,941 |
| Total | $111,686 | $60,811 |
Family Income in Naperville
Family Income Brackets in Naperville
According to the Naperville family income data, there are 16,235 families falling into the $200,000+ income range, which is the most common income bracket and makes up 40.3% of all families. Conversely, the $10,000 to $14,999 income bracket is the least frequent group with only 322 families (0.8%) belonging to this category.
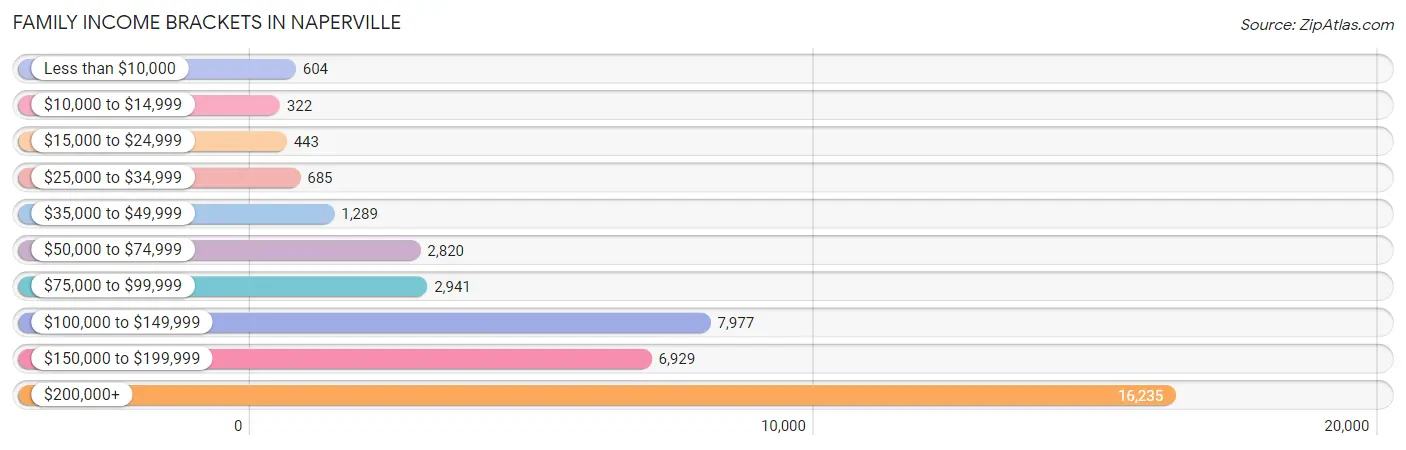
| Income Bracket | # Families | % Families |
| Less than $10,000 | 604 | 1.5% |
| $10,000 to $14,999 | 322 | 0.8% |
| $15,000 to $24,999 | 443 | 1.1% |
| $25,000 to $34,999 | 685 | 1.7% |
| $35,000 to $49,999 | 1,289 | 3.2% |
| $50,000 to $74,999 | 2,820 | 7.0% |
| $75,000 to $99,999 | 2,941 | 7.3% |
| $100,000 to $149,999 | 7,977 | 19.8% |
| $150,000 to $199,999 | 6,929 | 17.2% |
| $200,000+ | 16,235 | 40.3% |
Family Income by Famaliy Size in Naperville
7+ person families (355 | 0.9%) account for the highest median family income in Naperville with $213,750 per family, while 2-person families (16,021 | 39.8%) have the highest median income of $67,360 per family member.
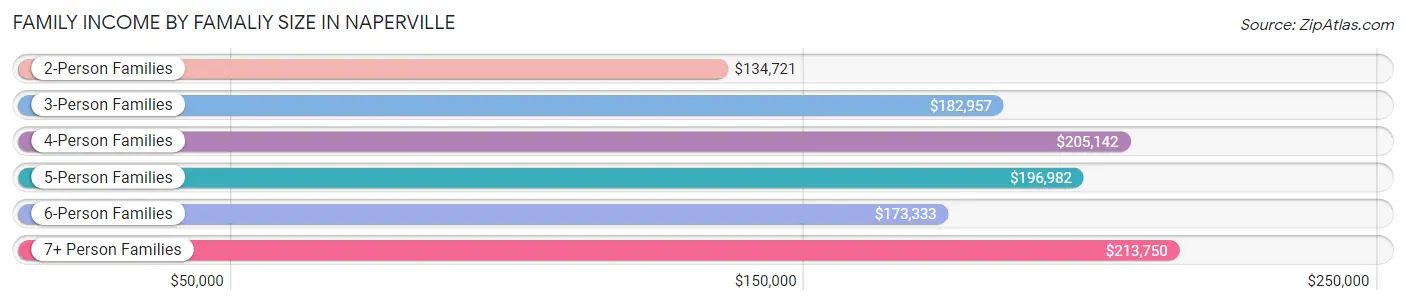
| Income Bracket | # Families | Median Income |
| 2-Person Families | 16,021 (39.8%) | $134,721 |
| 3-Person Families | 10,131 (25.2%) | $182,957 |
| 4-Person Families | 9,592 (23.8%) | $205,142 |
| 5-Person Families | 2,931 (7.3%) | $196,982 |
| 6-Person Families | 1,256 (3.1%) | $173,333 |
| 7+ Person Families | 355 (0.9%) | $213,750 |
| Total | 40,286 (100.0%) | $170,228 |
Family Income by Number of Earners in Naperville
The median family income in Naperville is $170,228, with families comprising 3+ earners (5,385) having the highest median family income of $227,936, while families with no earners (4,266) have the lowest median family income of $96,509, accounting for 13.4% and 10.6% of families, respectively.
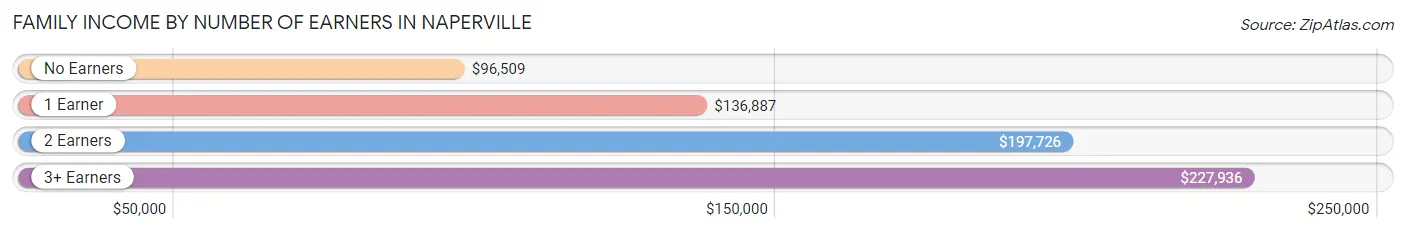
| Number of Earners | # Families | Median Income |
| No Earners | 4,266 (10.6%) | $96,509 |
| 1 Earner | 11,741 (29.1%) | $136,887 |
| 2 Earners | 18,894 (46.9%) | $197,726 |
| 3+ Earners | 5,385 (13.4%) | $227,936 |
| Total | 40,286 (100.0%) | $170,228 |
Household Income in Naperville
Household Income Brackets in Naperville
With 17,920 households falling in the category, the $200,000+ income range is the most frequent in Naperville, accounting for 33.3% of all households. In contrast, only 861 households (1.6%) fall into the $10,000 to $14,999 income bracket, making it the least populous group.
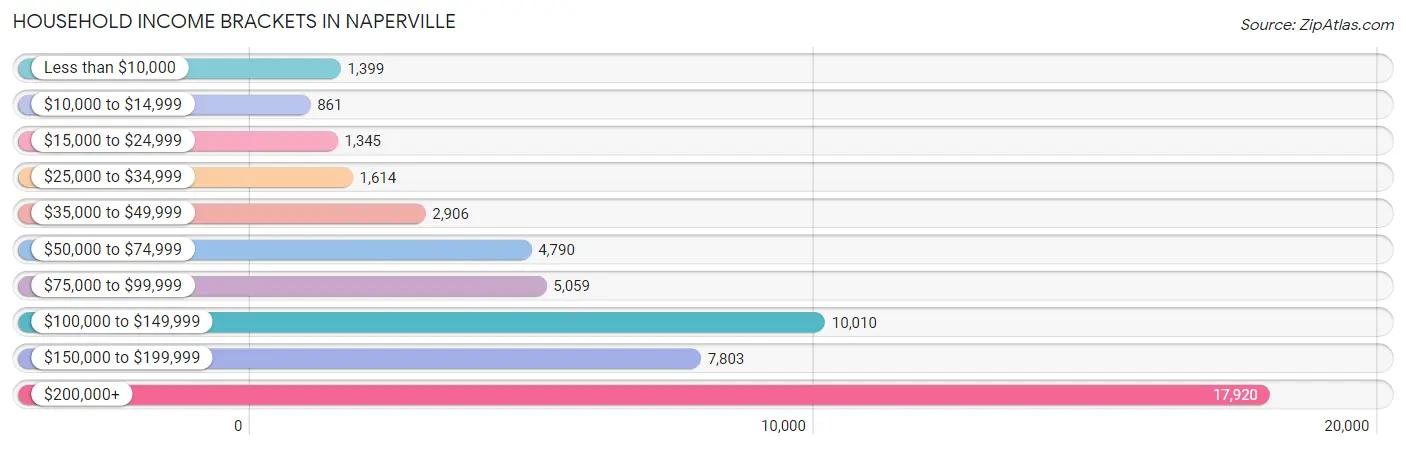
| Income Bracket | # Households | % Households |
| Less than $10,000 | 1,399 | 2.6% |
| $10,000 to $14,999 | 861 | 1.6% |
| $15,000 to $24,999 | 1,345 | 2.5% |
| $25,000 to $34,999 | 1,614 | 3.0% |
| $35,000 to $49,999 | 2,906 | 5.4% |
| $50,000 to $74,999 | 4,790 | 8.9% |
| $75,000 to $99,999 | 5,059 | 9.4% |
| $100,000 to $149,999 | 10,010 | 18.6% |
| $150,000 to $199,999 | 7,803 | 14.5% |
| $200,000+ | 17,920 | 33.3% |
Household Income by Householder Age in Naperville
The median household income in Naperville is $143,754, with the highest median household income of $178,750 found in the 45 to 64 years age bracket for the primary householder. A total of 23,143 households (43.0%) fall into this category. Meanwhile, the 15 to 24 years age bracket for the primary householder has the lowest median household income of $41,620, with 745 households (1.4%) in this group.
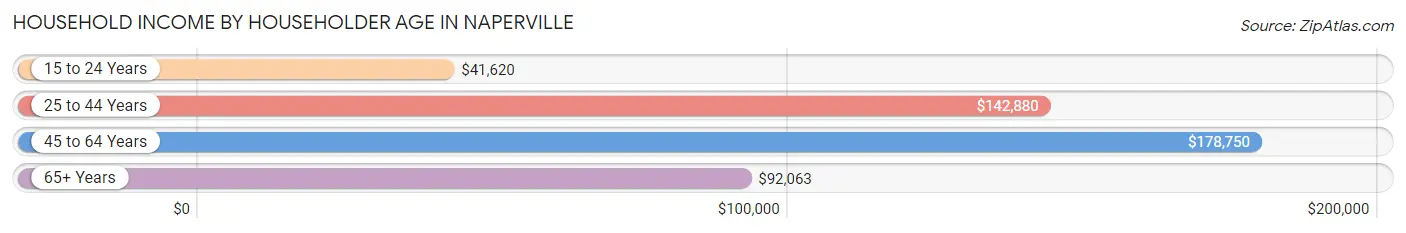
| Income Bracket | # Households | Median Income |
| 15 to 24 Years | 745 (1.4%) | $41,620 |
| 25 to 44 Years | 18,468 (34.3%) | $142,880 |
| 45 to 64 Years | 23,143 (43.0%) | $178,750 |
| 65+ Years | 11,459 (21.3%) | $92,063 |
| Total | 53,815 (100.0%) | $143,754 |
Poverty in Naperville
Income Below Poverty by Sex and Age in Naperville
With 4.0% poverty level for males and 4.7% for females among the residents of Naperville, 18 to 24 year old males and 65 to 74 year old females are the most vulnerable to poverty, with 424 males (8.4%) and 474 females (7.4%) in their respective age groups living below the poverty level.
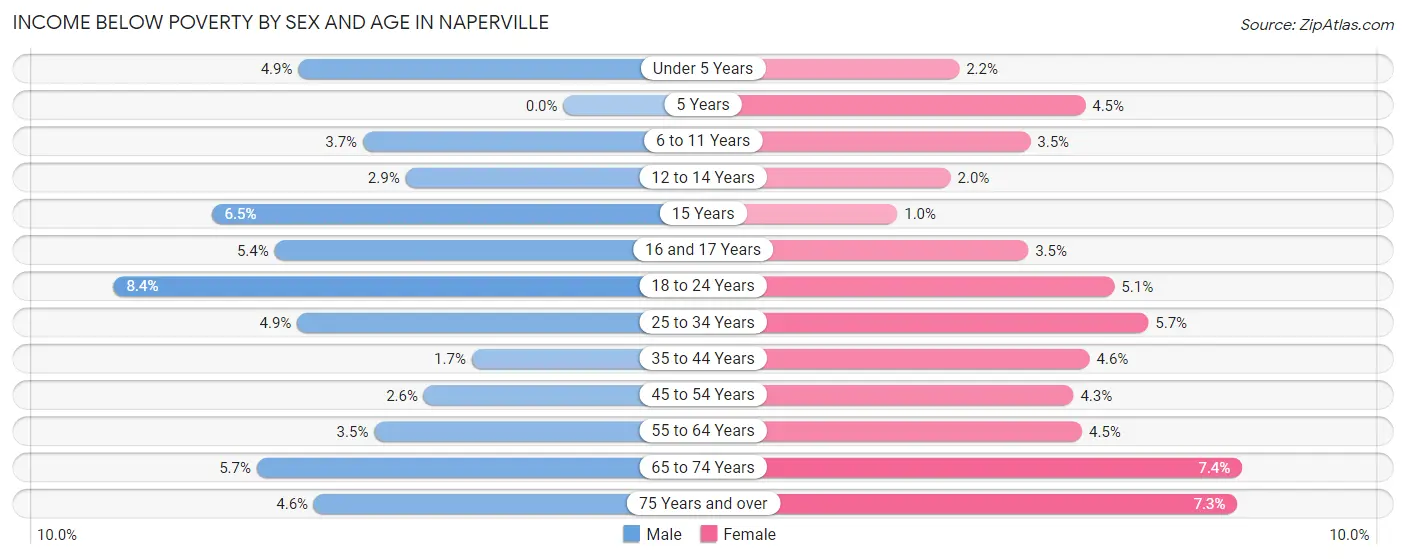
| Age Bracket | Male | Female |
| Under 5 Years | 220 (4.9%) | 92 (2.2%) |
| 5 Years | 0 (0.0%) | 36 (4.5%) |
| 6 to 11 Years | 237 (3.7%) | 204 (3.5%) |
| 12 to 14 Years | 102 (2.9%) | 70 (2.0%) |
| 15 Years | 77 (6.5%) | 10 (1.0%) |
| 16 and 17 Years | 137 (5.4%) | 85 (3.5%) |
| 18 to 24 Years | 424 (8.4%) | 250 (5.1%) |
| 25 to 34 Years | 406 (4.9%) | 492 (5.7%) |
| 35 to 44 Years | 180 (1.7%) | 496 (4.6%) |
| 45 to 54 Years | 279 (2.6%) | 474 (4.3%) |
| 55 to 64 Years | 359 (3.5%) | 439 (4.5%) |
| 65 to 74 Years | 343 (5.7%) | 474 (7.4%) |
| 75 Years and over | 133 (4.6%) | 328 (7.3%) |
| Total | 2,897 (4.0%) | 3,450 (4.7%) |
Income Above Poverty by Sex and Age in Naperville
According to the poverty statistics in Naperville, males aged 5 years and females aged 15 years are the age groups that are most secure financially, with 100.0% of males and 99.0% of females in these age groups living above the poverty line.
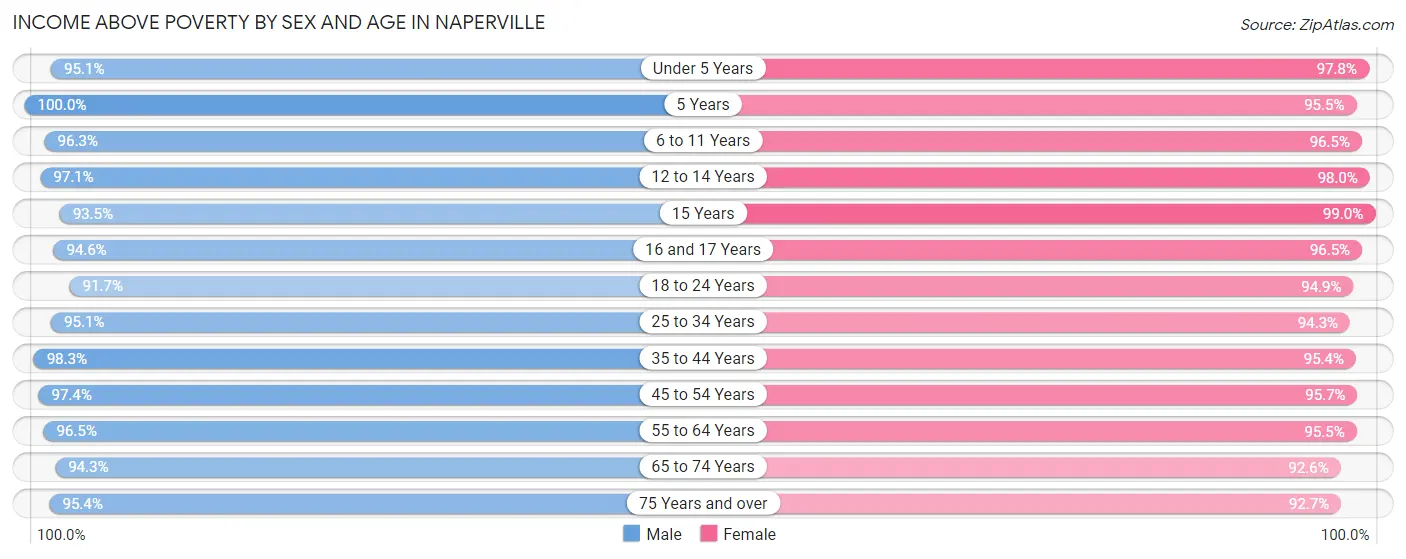
| Age Bracket | Male | Female |
| Under 5 Years | 4,248 (95.1%) | 4,126 (97.8%) |
| 5 Years | 873 (100.0%) | 760 (95.5%) |
| 6 to 11 Years | 6,139 (96.3%) | 5,625 (96.5%) |
| 12 to 14 Years | 3,382 (97.1%) | 3,388 (98.0%) |
| 15 Years | 1,102 (93.5%) | 960 (99.0%) |
| 16 and 17 Years | 2,417 (94.6%) | 2,369 (96.5%) |
| 18 to 24 Years | 4,653 (91.6%) | 4,687 (94.9%) |
| 25 to 34 Years | 7,806 (95.1%) | 8,158 (94.3%) |
| 35 to 44 Years | 10,439 (98.3%) | 10,283 (95.4%) |
| 45 to 54 Years | 10,495 (97.4%) | 10,552 (95.7%) |
| 55 to 64 Years | 9,870 (96.5%) | 9,414 (95.5%) |
| 65 to 74 Years | 5,683 (94.3%) | 5,906 (92.6%) |
| 75 Years and over | 2,739 (95.4%) | 4,142 (92.7%) |
| Total | 69,846 (96.0%) | 70,370 (95.3%) |
Income Below Poverty Among Married-Couple Families in Naperville
The poverty statistics for married-couple families in Naperville show that 1.9% or 666 of the total 34,547 families live below the poverty line. Families with no children have the highest poverty rate of 2.4%, comprising of 425 families. On the other hand, families with 5 or more children have the lowest poverty rate of 0.0%, which includes 0 families.
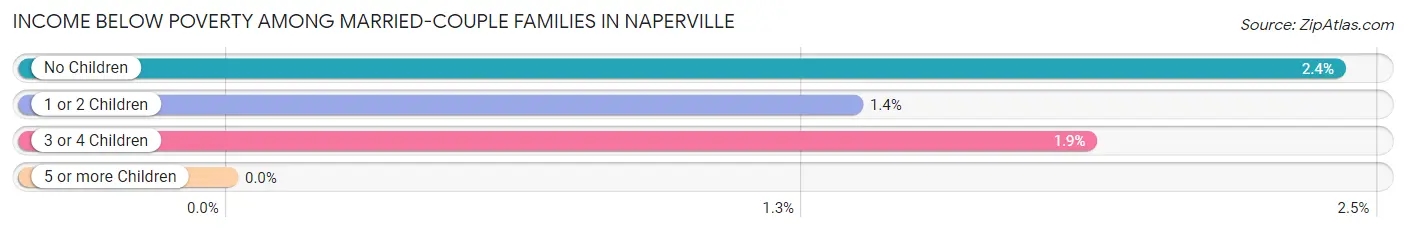
| Children | Above Poverty | Below Poverty |
| No Children | 17,245 (97.6%) | 425 (2.4%) |
| 1 or 2 Children | 13,852 (98.6%) | 191 (1.4%) |
| 3 or 4 Children | 2,622 (98.1%) | 50 (1.9%) |
| 5 or more Children | 162 (100.0%) | 0 (0.0%) |
| Total | 33,881 (98.1%) | 666 (1.9%) |
Income Below Poverty Among Single-Parent Households in Naperville
According to the poverty data in Naperville, 6.8% or 101 single-father households and 11.4% or 486 single-mother households are living below the poverty line. Among single-father households, those with 1 or 2 children have the highest poverty rate, with 54 households (7.9%) experiencing poverty. Likewise, among single-mother households, those with 1 or 2 children have the highest poverty rate, with 356 households (15.8%) falling below the poverty line.
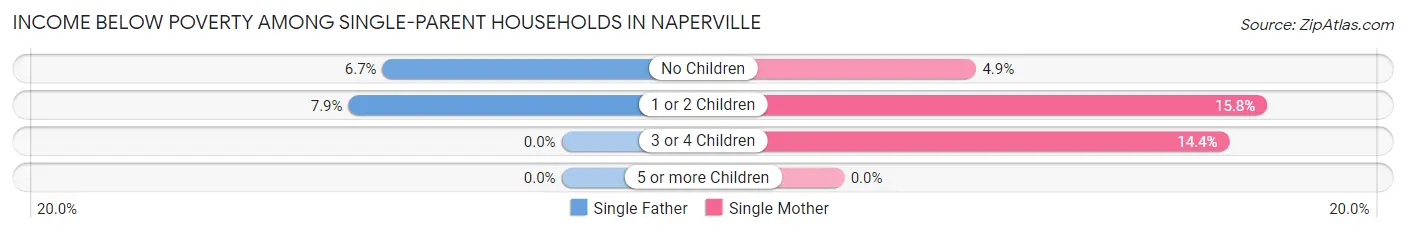
| Children | Single Father | Single Mother |
| No Children | 47 (6.7%) | 82 (4.9%) |
| 1 or 2 Children | 54 (7.9%) | 356 (15.8%) |
| 3 or 4 Children | 0 (0.0%) | 48 (14.4%) |
| 5 or more Children | 0 (0.0%) | 0 (0.0%) |
| Total | 101 (6.8%) | 486 (11.4%) |
Income Below Poverty Among Married-Couple vs Single-Parent Households in Naperville
The poverty data for Naperville shows that 666 of the married-couple family households (1.9%) and 587 of the single-parent households (10.2%) are living below the poverty level. Within the married-couple family households, those with no children have the highest poverty rate, with 425 households (2.4%) falling below the poverty line. Among the single-parent households, those with 1 or 2 children have the highest poverty rate, with 410 household (14.0%) living below poverty.
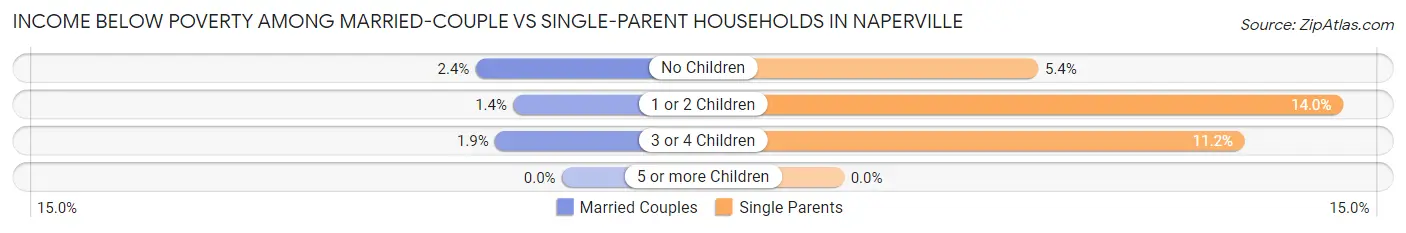
| Children | Married-Couple Families | Single-Parent Households |
| No Children | 425 (2.4%) | 129 (5.4%) |
| 1 or 2 Children | 191 (1.4%) | 410 (14.0%) |
| 3 or 4 Children | 50 (1.9%) | 48 (11.2%) |
| 5 or more Children | 0 (0.0%) | 0 (0.0%) |
| Total | 666 (1.9%) | 587 (10.2%) |
Race in Naperville
The most populous races in Naperville are White / Caucasian (99,710 | 66.9%), Asian (31,328 | 21.0%), and Hispanic or Latino (10,264 | 6.9%).
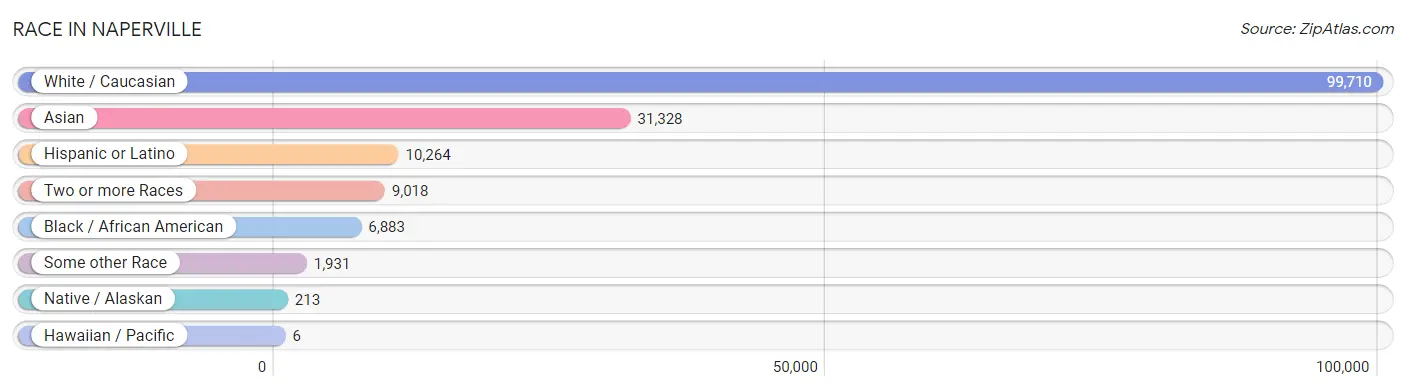
| Race | # Population | % Population |
| Asian | 31,328 | 21.0% |
| Black / African American | 6,883 | 4.6% |
| Hawaiian / Pacific | 6 | 0.0% |
| Hispanic or Latino | 10,264 | 6.9% |
| Native / Alaskan | 213 | 0.1% |
| White / Caucasian | 99,710 | 66.9% |
| Two or more Races | 9,018 | 6.0% |
| Some other Race | 1,931 | 1.3% |
| Total | 149,089 | 100.0% |
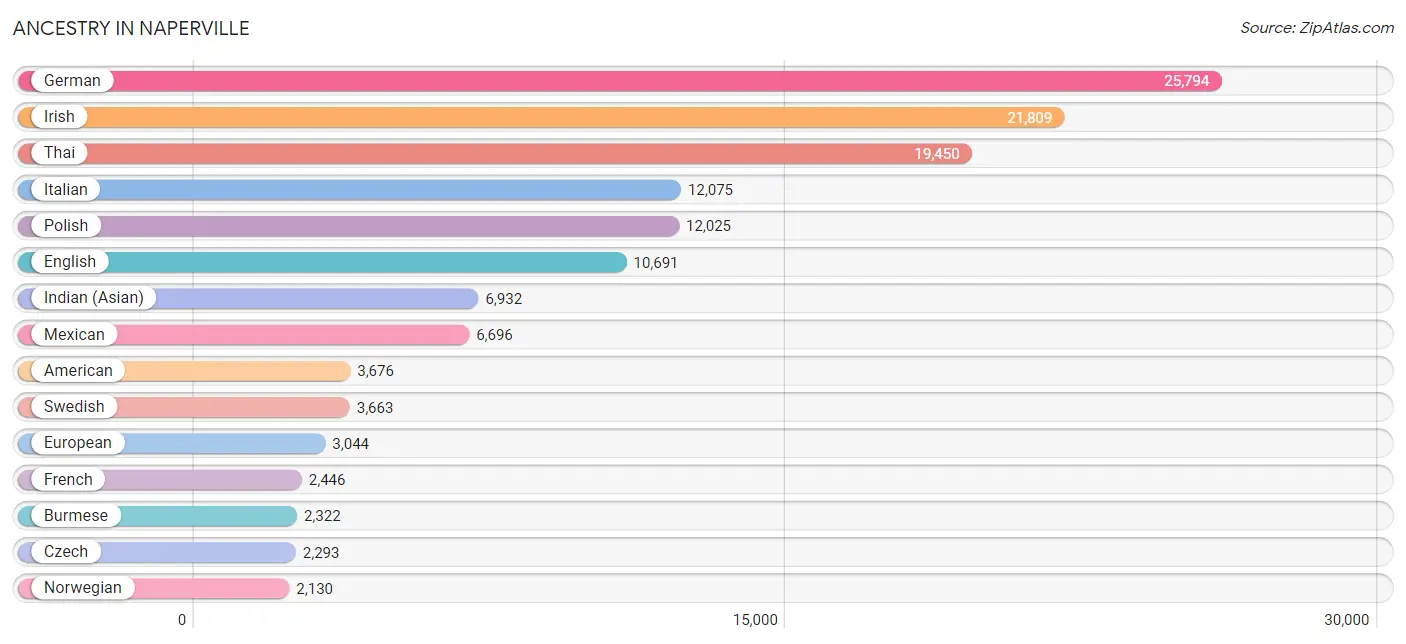
Ancestry in Naperville
The most populous ancestries reported in Naperville are German (25,794 | 17.3%), Irish (21,809 | 14.6%), Thai (19,450 | 13.1%), Italian (12,075 | 8.1%), and Polish (12,025 | 8.1%), together accounting for 61.2% of all Naperville residents.
| Ancestry | # Population | % Population |
| African | 680 | 0.5% |
| Albanian | 656 | 0.4% |
| American | 3,676 | 2.5% |
| Arab | 1,131 | 0.8% |
| Argentinean | 34 | 0.0% |
| Armenian | 225 | 0.2% |
| Assyrian / Chaldean / Syriac | 59 | 0.0% |
| Australian | 14 | 0.0% |
| Austrian | 847 | 0.6% |
| Basque | 34 | 0.0% |
| Belgian | 221 | 0.2% |
| Bhutanese | 395 | 0.3% |
| Blackfeet | 11 | 0.0% |
| Bolivian | 21 | 0.0% |
| Brazilian | 66 | 0.0% |
| British | 903 | 0.6% |
| Bulgarian | 455 | 0.3% |
| Burmese | 2,322 | 1.6% |
| Cajun | 3 | 0.0% |
| Cambodian | 175 | 0.1% |
| Canadian | 230 | 0.2% |
| Carpatho Rusyn | 35 | 0.0% |
| Central American | 449 | 0.3% |
| Central American Indian | 23 | 0.0% |
| Cherokee | 107 | 0.1% |
| Chilean | 125 | 0.1% |
| Chippewa | 87 | 0.1% |
| Choctaw | 2 | 0.0% |
| Colombian | 209 | 0.1% |
| Comanche | 26 | 0.0% |
| Costa Rican | 17 | 0.0% |
| Croatian | 702 | 0.5% |
| Cuban | 183 | 0.1% |
| Cypriot | 19 | 0.0% |
| Czech | 2,293 | 1.5% |
| Czechoslovakian | 182 | 0.1% |
| Danish | 584 | 0.4% |
| Dutch | 1,519 | 1.0% |
| Dutch West Indian | 7 | 0.0% |
| Eastern European | 534 | 0.4% |
| Ecuadorian | 158 | 0.1% |
| Egyptian | 222 | 0.2% |
| English | 10,691 | 7.2% |
| Estonian | 51 | 0.0% |
| Ethiopian | 32 | 0.0% |
| European | 3,044 | 2.0% |
| Filipino | 531 | 0.4% |
| Finnish | 195 | 0.1% |
| French | 2,446 | 1.6% |
| French American Indian | 2 | 0.0% |
| French Canadian | 812 | 0.5% |
| German | 25,794 | 17.3% |
| Ghanaian | 20 | 0.0% |
| Greek | 1,517 | 1.0% |
| Guamanian / Chamorro | 92 | 0.1% |
| Guatemalan | 233 | 0.2% |
| Haitian | 138 | 0.1% |
| Honduran | 27 | 0.0% |
| Hungarian | 521 | 0.4% |
| Icelander | 9 | 0.0% |
| Indian (Asian) | 6,932 | 4.6% |
| Indonesian | 233 | 0.2% |
| Iranian | 374 | 0.3% |
| Iraqi | 8 | 0.0% |
| Irish | 21,809 | 14.6% |
| Iroquois | 48 | 0.0% |
| Israeli | 5 | 0.0% |
| Italian | 12,075 | 8.1% |
| Jamaican | 49 | 0.0% |
| Japanese | 89 | 0.1% |
| Jordanian | 147 | 0.1% |
| Kenyan | 43 | 0.0% |
| Korean | 2,050 | 1.4% |
| Laotian | 76 | 0.1% |
| Latvian | 64 | 0.0% |
| Lebanese | 344 | 0.2% |
| Lithuanian | 1,666 | 1.1% |
| Luxembourger | 63 | 0.0% |
| Macedonian | 153 | 0.1% |
| Malaysian | 14 | 0.0% |
| Maltese | 18 | 0.0% |
| Mexican | 6,696 | 4.5% |
| Mexican American Indian | 92 | 0.1% |
| Mongolian | 47 | 0.0% |
| Moroccan | 75 | 0.1% |
| Native Hawaiian | 110 | 0.1% |
| Navajo | 27 | 0.0% |
| New Zealander | 71 | 0.1% |
| Nicaraguan | 2 | 0.0% |
| Nigerian | 270 | 0.2% |
| Northern European | 248 | 0.2% |
| Norwegian | 2,130 | 1.4% |
| Okinawan | 51 | 0.0% |
| Pakistani | 258 | 0.2% |
| Palestinian | 187 | 0.1% |
| Panamanian | 143 | 0.1% |
| Pennsylvania German | 8 | 0.0% |
| Peruvian | 209 | 0.1% |
| Polish | 12,025 | 8.1% |
| Portuguese | 438 | 0.3% |
| Pueblo | 25 | 0.0% |
| Puerto Rican | 831 | 0.6% |
| Romanian | 682 | 0.5% |
| Russian | 1,637 | 1.1% |
| Salvadoran | 27 | 0.0% |
| Samoan | 5 | 0.0% |
| Scandinavian | 261 | 0.2% |
| Scotch-Irish | 695 | 0.5% |
| Scottish | 1,997 | 1.3% |
| Serbian | 626 | 0.4% |
| Sioux | 11 | 0.0% |
| Slavic | 71 | 0.1% |
| Slovak | 1,013 | 0.7% |
| Slovene | 237 | 0.2% |
| South African | 171 | 0.1% |
| South American | 1,232 | 0.8% |
| Spaniard | 351 | 0.2% |
| Spanish | 284 | 0.2% |
| Spanish American | 5 | 0.0% |
| Spanish American Indian | 3 | 0.0% |
| Sri Lankan | 524 | 0.4% |
| Subsaharan African | 1,369 | 0.9% |
| Swedish | 3,663 | 2.5% |
| Swiss | 387 | 0.3% |
| Syrian | 4 | 0.0% |
| Thai | 19,450 | 13.1% |
| Turkish | 364 | 0.2% |
| Ukrainian | 914 | 0.6% |
| Uruguayan | 185 | 0.1% |
| Venezuelan | 291 | 0.2% |
| Vietnamese | 136 | 0.1% |
| Welsh | 914 | 0.6% |
| West Indian | 35 | 0.0% |
| Yugoslavian | 112 | 0.1% |
| Zimbabwean | 73 | 0.1% | View All 135 Rows |
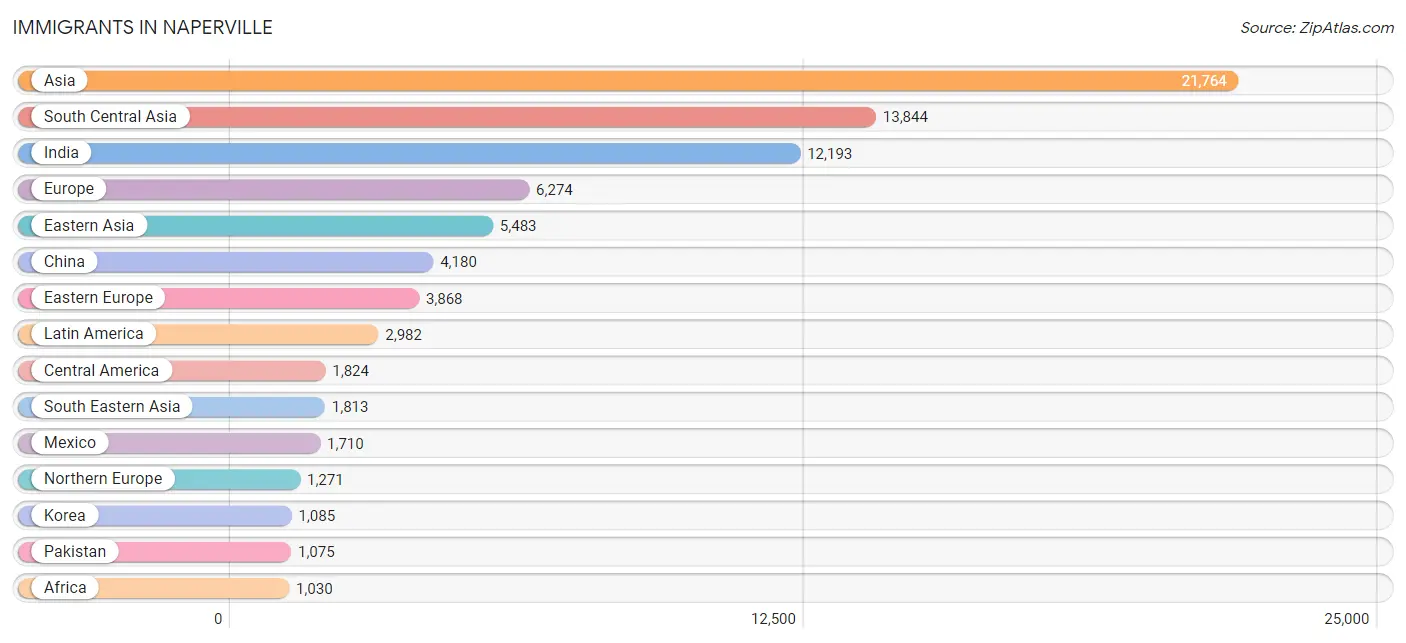
Immigrants in Naperville
The most numerous immigrant groups reported in Naperville came from Asia (21,764 | 14.6%), South Central Asia (13,844 | 9.3%), India (12,193 | 8.2%), Europe (6,274 | 4.2%), and Eastern Asia (5,483 | 3.7%), together accounting for 40.0% of all Naperville residents.
| Immigration Origin | # Population | % Population |
| Africa | 1,030 | 0.7% |
| Albania | 313 | 0.2% |
| Argentina | 34 | 0.0% |
| Asia | 21,764 | 14.6% |
| Australia | 42 | 0.0% |
| Bangladesh | 154 | 0.1% |
| Belarus | 70 | 0.1% |
| Belgium | 14 | 0.0% |
| Bosnia and Herzegovina | 81 | 0.1% |
| Brazil | 129 | 0.1% |
| Bulgaria | 394 | 0.3% |
| Cambodia | 13 | 0.0% |
| Canada | 474 | 0.3% |
| Caribbean | 182 | 0.1% |
| Central America | 1,824 | 1.2% |
| Chile | 47 | 0.0% |
| China | 4,180 | 2.8% |
| Colombia | 187 | 0.1% |
| Croatia | 38 | 0.0% |
| Cuba | 64 | 0.0% |
| Czechoslovakia | 195 | 0.1% |
| Dominican Republic | 35 | 0.0% |
| Eastern Africa | 405 | 0.3% |
| Eastern Asia | 5,483 | 3.7% |
| Eastern Europe | 3,868 | 2.6% |
| Ecuador | 117 | 0.1% |
| Egypt | 27 | 0.0% |
| El Salvador | 25 | 0.0% |
| England | 396 | 0.3% |
| Ethiopia | 35 | 0.0% |
| Europe | 6,274 | 4.2% |
| Fiji | 28 | 0.0% |
| France | 117 | 0.1% |
| Germany | 321 | 0.2% |
| Ghana | 38 | 0.0% |
| Greece | 71 | 0.1% |
| Guatemala | 76 | 0.1% |
| Haiti | 70 | 0.1% |
| Hong Kong | 149 | 0.1% |
| Hungary | 16 | 0.0% |
| India | 12,193 | 8.2% |
| Indonesia | 40 | 0.0% |
| Iran | 125 | 0.1% |
| Iraq | 41 | 0.0% |
| Ireland | 254 | 0.2% |
| Israel | 48 | 0.0% |
| Italy | 213 | 0.1% |
| Jamaica | 13 | 0.0% |
| Japan | 142 | 0.1% |
| Jordan | 33 | 0.0% |
| Kazakhstan | 70 | 0.1% |
| Kenya | 182 | 0.1% |
| Korea | 1,085 | 0.7% |
| Kuwait | 54 | 0.0% |
| Laos | 6 | 0.0% |
| Latin America | 2,982 | 2.0% |
| Latvia | 47 | 0.0% |
| Lebanon | 22 | 0.0% |
| Liberia | 2 | 0.0% |
| Lithuania | 573 | 0.4% |
| Malaysia | 38 | 0.0% |
| Mexico | 1,710 | 1.1% |
| Micronesia | 10 | 0.0% |
| Middle Africa | 12 | 0.0% |
| Moldova | 216 | 0.1% |
| Morocco | 45 | 0.0% |
| Nepal | 3 | 0.0% |
| Netherlands | 30 | 0.0% |
| Nicaragua | 2 | 0.0% |
| Nigeria | 116 | 0.1% |
| North Macedonia | 78 | 0.1% |
| Northern Africa | 72 | 0.1% |
| Northern Europe | 1,271 | 0.9% |
| Oceania | 167 | 0.1% |
| Pakistan | 1,075 | 0.7% |
| Panama | 11 | 0.0% |
| Peru | 182 | 0.1% |
| Philippines | 823 | 0.5% |
| Poland | 683 | 0.5% |
| Romania | 218 | 0.2% |
| Russia | 285 | 0.2% |
| Saudi Arabia | 18 | 0.0% |
| Scotland | 8 | 0.0% |
| Serbia | 228 | 0.2% |
| Singapore | 108 | 0.1% |
| South Africa | 273 | 0.2% |
| South America | 976 | 0.6% |
| South Central Asia | 13,844 | 9.3% |
| South Eastern Asia | 1,813 | 1.2% |
| Southern Europe | 407 | 0.3% |
| Spain | 123 | 0.1% |
| Sri Lanka | 66 | 0.0% |
| Sweden | 8 | 0.0% |
| Switzerland | 59 | 0.0% |
| Syria | 21 | 0.0% |
| Taiwan | 615 | 0.4% |
| Thailand | 197 | 0.1% |
| Turkey | 252 | 0.2% |
| Uganda | 84 | 0.1% |
| Ukraine | 242 | 0.2% |
| Uruguay | 61 | 0.0% |
| Uzbekistan | 158 | 0.1% |
| Venezuela | 219 | 0.2% |
| Vietnam | 362 | 0.2% |
| Western Africa | 156 | 0.1% |
| Western Asia | 550 | 0.4% |
| Western Europe | 541 | 0.4% |
| Zimbabwe | 48 | 0.0% | View All 108 Rows |
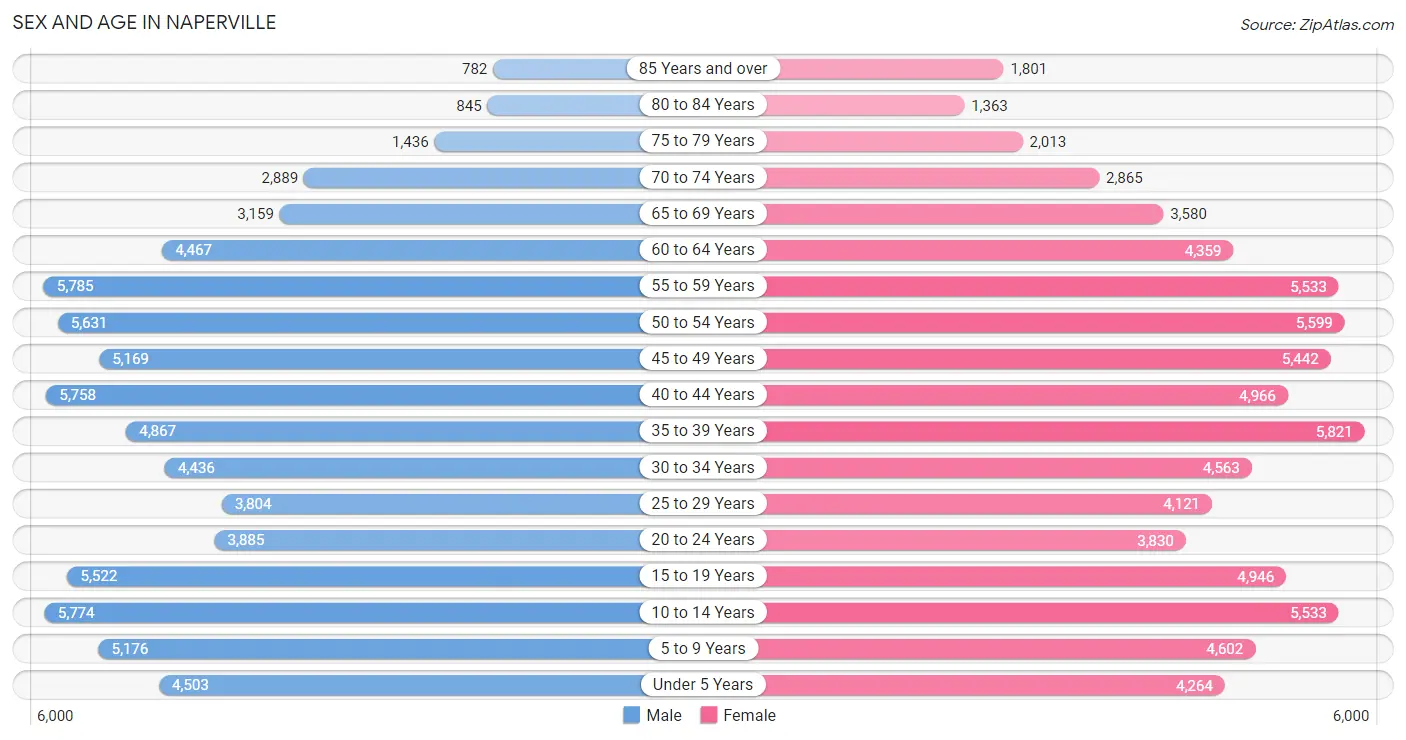
Sex and Age in Naperville
Sex and Age in Naperville
The most populous age groups in Naperville are 55 to 59 Years (5,785 | 7.8%) for men and 35 to 39 Years (5,821 | 7.7%) for women.
| Age Bracket | Male | Female |
| Under 5 Years | 4,503 (6.1%) | 4,264 (5.7%) |
| 5 to 9 Years | 5,176 (7.0%) | 4,602 (6.1%) |
| 10 to 14 Years | 5,774 (7.8%) | 5,533 (7.4%) |
| 15 to 19 Years | 5,522 (7.5%) | 4,946 (6.6%) |
| 20 to 24 Years | 3,885 (5.3%) | 3,830 (5.1%) |
| 25 to 29 Years | 3,804 (5.1%) | 4,121 (5.5%) |
| 30 to 34 Years | 4,436 (6.0%) | 4,563 (6.1%) |
| 35 to 39 Years | 4,867 (6.6%) | 5,821 (7.7%) |
| 40 to 44 Years | 5,758 (7.8%) | 4,966 (6.6%) |
| 45 to 49 Years | 5,169 (7.0%) | 5,442 (7.2%) |
| 50 to 54 Years | 5,631 (7.6%) | 5,599 (7.4%) |
| 55 to 59 Years | 5,785 (7.8%) | 5,533 (7.4%) |
| 60 to 64 Years | 4,467 (6.0%) | 4,359 (5.8%) |
| 65 to 69 Years | 3,159 (4.3%) | 3,580 (4.8%) |
| 70 to 74 Years | 2,889 (3.9%) | 2,865 (3.8%) |
| 75 to 79 Years | 1,436 (1.9%) | 2,013 (2.7%) |
| 80 to 84 Years | 845 (1.1%) | 1,363 (1.8%) |
| 85 Years and over | 782 (1.1%) | 1,801 (2.4%) |
| Total | 73,888 (100.0%) | 75,201 (100.0%) |
Families and Households in Naperville
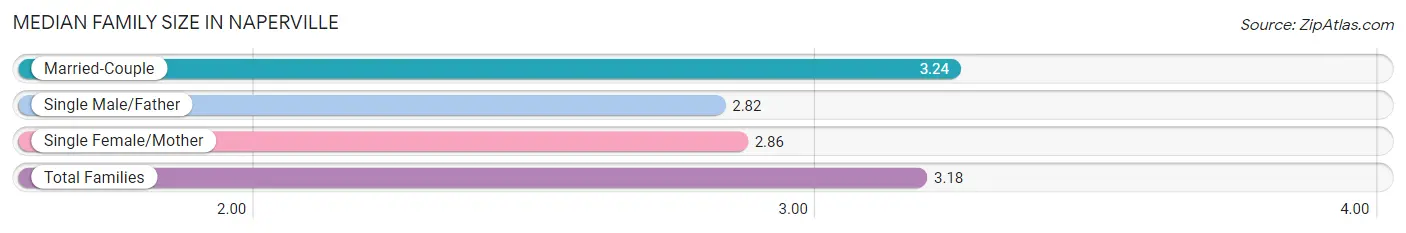
Median Family Size in Naperville
The median family size in Naperville is 3.18 persons per family, with married-couple families (34,547 | 85.8%) accounting for the largest median family size of 3.24 persons per family. On the other hand, single male/father families (1,479 | 3.7%) represent the smallest median family size with 2.82 persons per family.
| Family Type | # Families | Family Size |
| Married-Couple | 34,547 (85.8%) | 3.24 |
| Single Male/Father | 1,479 (3.7%) | 2.82 |
| Single Female/Mother | 4,260 (10.6%) | 2.86 |
| Total Families | 40,286 (100.0%) | 3.18 |
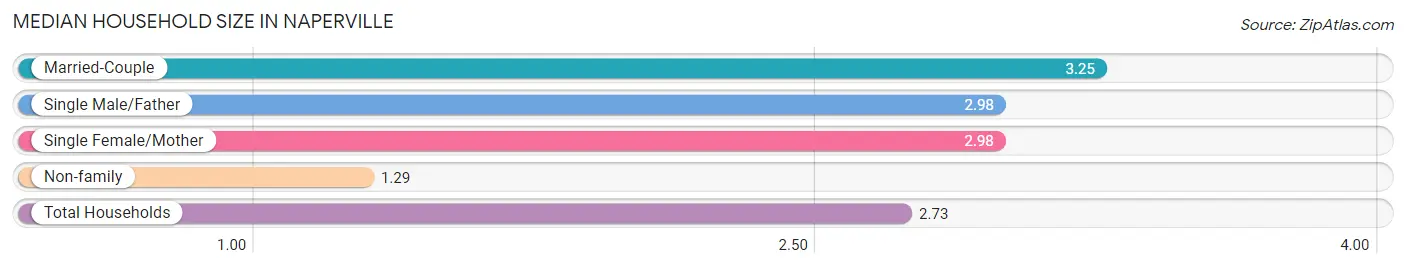
Median Household Size in Naperville
The median household size in Naperville is 2.73 persons per household, with married-couple households (34,547 | 64.2%) accounting for the largest median household size of 3.25 persons per household. non-family households (13,529 | 25.1%) represent the smallest median household size with 1.29 persons per household.
| Household Type | # Households | Household Size |
| Married-Couple | 34,547 (64.2%) | 3.25 |
| Single Male/Father | 1,479 (2.8%) | 2.98 |
| Single Female/Mother | 4,260 (7.9%) | 2.98 |
| Non-family | 13,529 (25.1%) | 1.29 |
| Total Households | 53,815 (100.0%) | 2.73 |
Household Size by Marriage Status in Naperville
Out of a total of 53,815 households in Naperville, 40,286 (74.9%) are family households, while 13,529 (25.1%) are nonfamily households. The most numerous type of family households are 2-person households, comprising 15,566, and the most common type of nonfamily households are 1-person households, comprising 10,941.
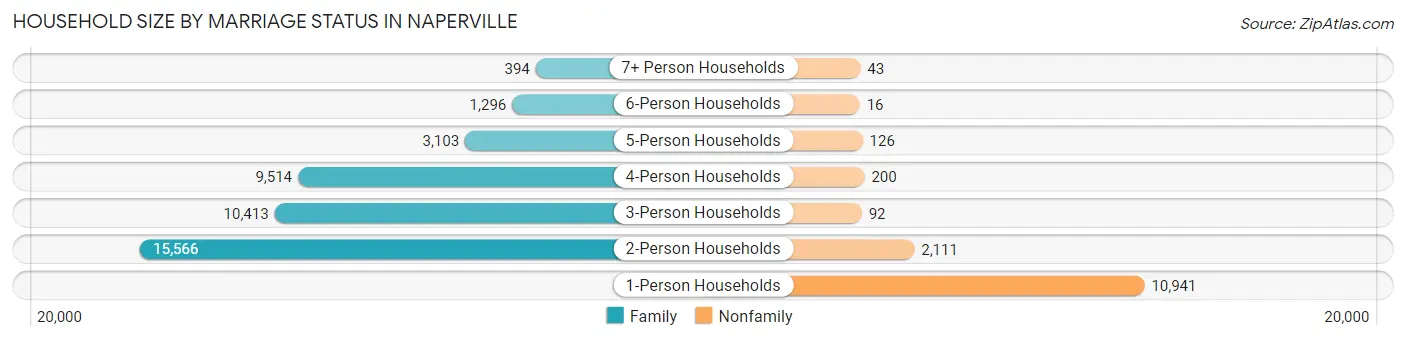
| Household Size | Family Households | Nonfamily Households |
| 1-Person Households | - | 10,941 (20.3%) |
| 2-Person Households | 15,566 (28.9%) | 2,111 (3.9%) |
| 3-Person Households | 10,413 (19.4%) | 92 (0.2%) |
| 4-Person Households | 9,514 (17.7%) | 200 (0.4%) |
| 5-Person Households | 3,103 (5.8%) | 126 (0.2%) |
| 6-Person Households | 1,296 (2.4%) | 16 (0.0%) |
| 7+ Person Households | 394 (0.7%) | 43 (0.1%) |
| Total | 40,286 (74.9%) | 13,529 (25.1%) |
Female Fertility in Naperville
Fertility by Age in Naperville
Average fertility rate in Naperville is 46.0 births per 1,000 women. Women in the age bracket of 20 to 34 years have the highest fertility rate with 72.0 births per 1,000 women. Women in the age bracket of 20 to 34 years acount for 56.1% of all women with births.
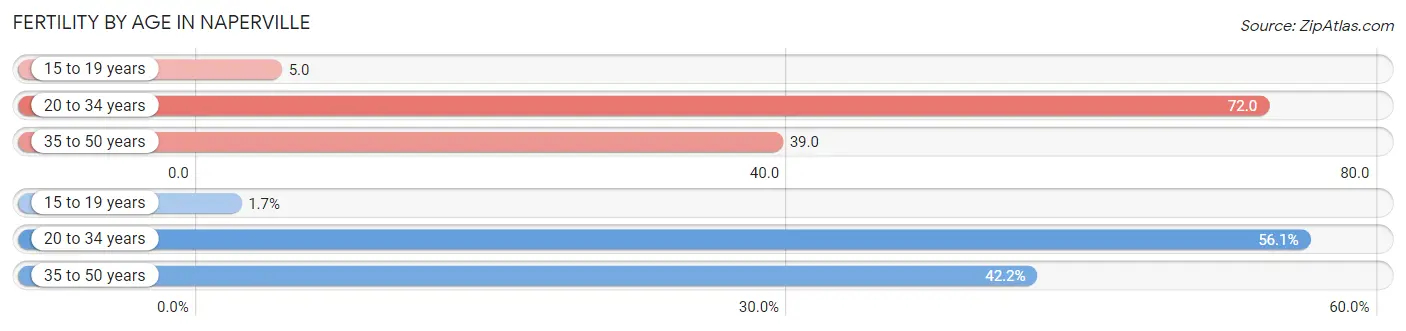
| Age Bracket | Women with Births | Births / 1,000 Women |
| 15 to 19 years | 27 (1.7%) | 5.0 |
| 20 to 34 years | 897 (56.1%) | 72.0 |
| 35 to 50 years | 675 (42.2%) | 39.0 |
| Total | 1,599 (100.0%) | 46.0 |
Fertility by Age by Marriage Status in Naperville
81.6% of women with births (1,599) in Naperville are married. The highest percentage of unmarried women with births falls into 15 to 19 years age bracket with 100.0% of them unmarried at the time of birth, while the lowest percentage of unmarried women with births belong to 35 to 50 years age bracket with 11.1% of them unmarried.
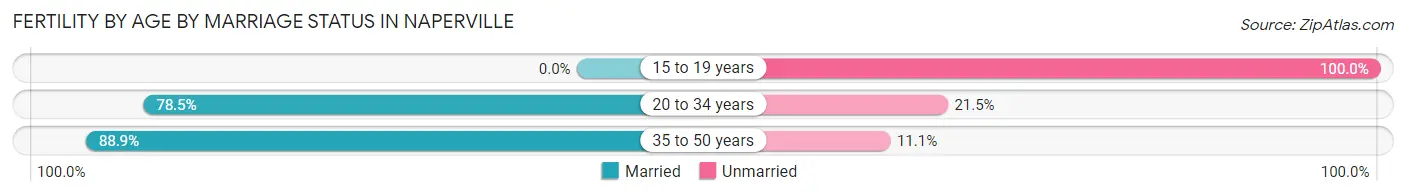
| Age Bracket | Married | Unmarried |
| 15 to 19 years | 0 (0.0%) | 27 (100.0%) |
| 20 to 34 years | 704 (78.5%) | 193 (21.5%) |
| 35 to 50 years | 600 (88.9%) | 75 (11.1%) |
| Total | 1,305 (81.6%) | 294 (18.4%) |
Fertility by Education in Naperville
Average fertility rate in Naperville is 46.0 births per 1,000 women. Women with the education attainment of bachelor's degree have the highest fertility rate of 62.0 births per 1,000 women, while women with the education attainment of less than high school have the lowest fertility at 4.0 births per 1,000 women. Women with the education attainment of bachelor's degree represent 48.5% of all women with births.
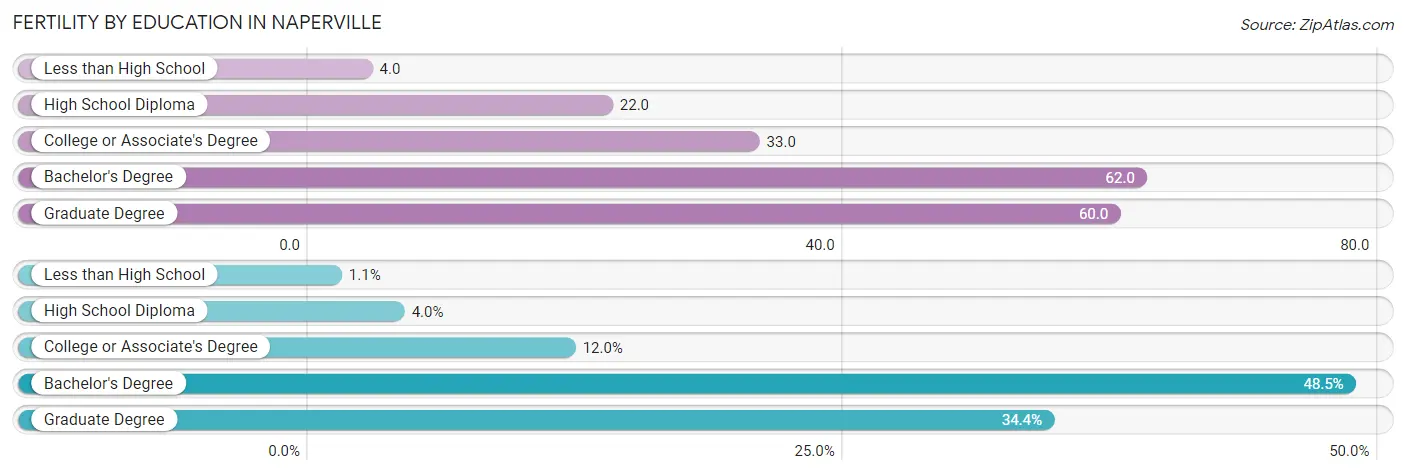
| Educational Attainment | Women with Births | Births / 1,000 Women |
| Less than High School | 17 (1.1%) | 4.0 |
| High School Diploma | 64 (4.0%) | 22.0 |
| College or Associate's Degree | 192 (12.0%) | 33.0 |
| Bachelor's Degree | 776 (48.5%) | 62.0 |
| Graduate Degree | 550 (34.4%) | 60.0 |
| Total | 1,599 (100.0%) | 46.0 |
Fertility by Education by Marriage Status in Naperville
18.4% of women with births in Naperville are unmarried. Women with the educational attainment of less than high school are most likely to be married with 100.0% of them married at childbirth, while women with the educational attainment of high school diploma are least likely to be married with 84.4% of them unmarried at childbirth.
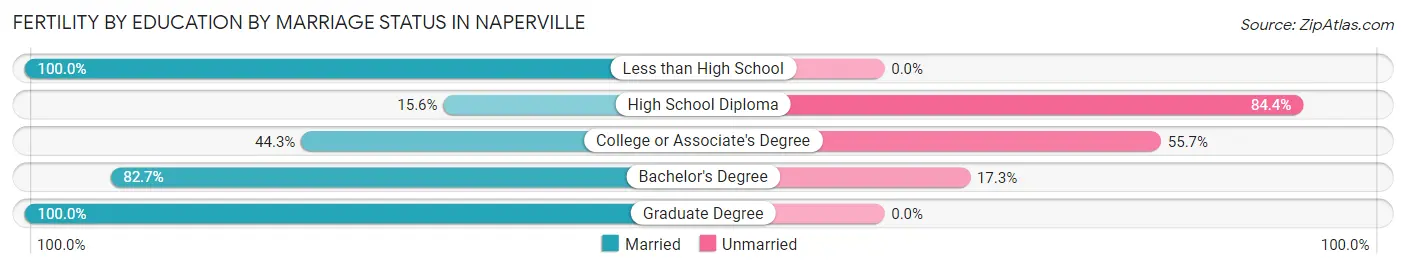
| Educational Attainment | Married | Unmarried |
| Less than High School | 17 (100.0%) | 0 (0.0%) |
| High School Diploma | 10 (15.6%) | 54 (84.4%) |
| College or Associate's Degree | 85 (44.3%) | 107 (55.7%) |
| Bachelor's Degree | 642 (82.7%) | 134 (17.3%) |
| Graduate Degree | 550 (100.0%) | 0 (0.0%) |
| Total | 1,305 (81.6%) | 294 (18.4%) |
Employment Characteristics in Naperville
Employment by Class of Employer in Naperville
Among the 75,466 employed individuals in Naperville, private company employees (53,660 | 71.1%), not-for-profit organizations (7,316 | 9.7%), and local government employees (4,797 | 6.4%) make up the most common classes of employment.
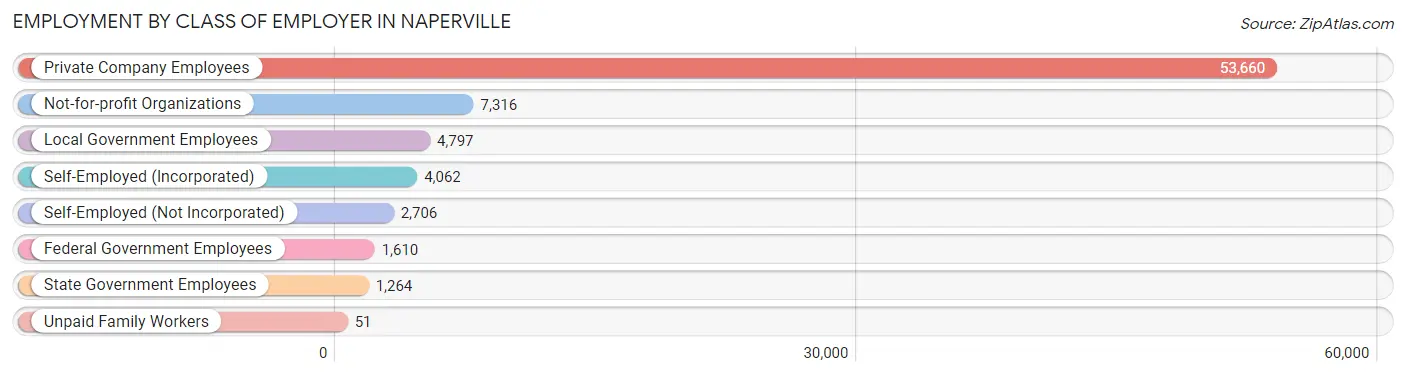
| Employer Class | # Employees | % Employees |
| Private Company Employees | 53,660 | 71.1% |
| Self-Employed (Incorporated) | 4,062 | 5.4% |
| Self-Employed (Not Incorporated) | 2,706 | 3.6% |
| Not-for-profit Organizations | 7,316 | 9.7% |
| Local Government Employees | 4,797 | 6.4% |
| State Government Employees | 1,264 | 1.7% |
| Federal Government Employees | 1,610 | 2.1% |
| Unpaid Family Workers | 51 | 0.1% |
| Total | 75,466 | 100.0% |
Employment Status by Age in Naperville
According to the labor force statistics for Naperville, out of the total population over 16 years of age (117,084), 68.6% or 80,320 individuals are in the labor force, with 4.5% or 3,614 of them unemployed. The age group with the highest labor force participation rate is 45 to 54 years, with 87.1% or 19,024 individuals in the labor force. Within the labor force, the 20 to 24 years age range has the highest percentage of unemployed individuals, with 10.2% or 627 of them being unemployed.
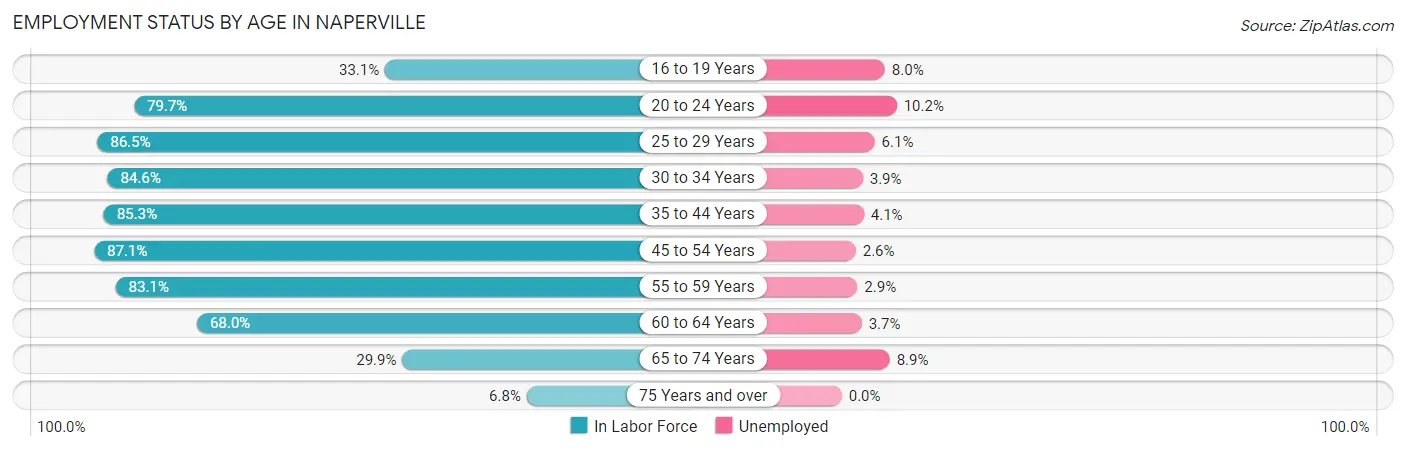
| Age Bracket | In Labor Force | Unemployed |
| 16 to 19 Years | 2,752 (33.1%) | 220 (8.0%) |
| 20 to 24 Years | 6,149 (79.7%) | 627 (10.2%) |
| 25 to 29 Years | 6,855 (86.5%) | 418 (6.1%) |
| 30 to 34 Years | 7,613 (84.6%) | 297 (3.9%) |
| 35 to 44 Years | 18,264 (85.3%) | 749 (4.1%) |
| 45 to 54 Years | 19,024 (87.1%) | 495 (2.6%) |
| 55 to 59 Years | 9,405 (83.1%) | 273 (2.9%) |
| 60 to 64 Years | 6,002 (68.0%) | 222 (3.7%) |
| 65 to 74 Years | 3,735 (29.9%) | 332 (8.9%) |
| 75 Years and over | 560 (6.8%) | 0 (0.0%) |
| Total | 80,320 (68.6%) | 3,614 (4.5%) |
Employment Status by Educational Attainment in Naperville
According to labor force statistics for Naperville, 83.6% of individuals (67,148) out of the total population between 25 and 64 years of age (80,321) are in the labor force, with 3.7% or 2,484 of them being unemployed. The group with the highest labor force participation rate are those with the educational attainment of bachelor's degree or higher, with 85.4% or 51,169 individuals in the labor force. Within the labor force, individuals with less than high school education have the highest percentage of unemployment, with 10.5% or 100 of them being unemployed.
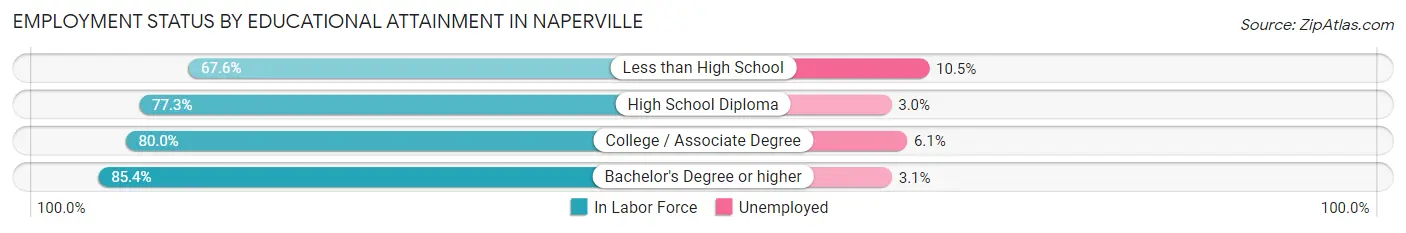
| Educational Attainment | In Labor Force | Unemployed |
| Less than High School | 957 (67.6%) | 149 (10.5%) |
| High School Diploma | 4,936 (77.3%) | 192 (3.0%) |
| College / Associate Degree | 10,082 (80.0%) | 769 (6.1%) |
| Bachelor's Degree or higher | 51,169 (85.4%) | 1,857 (3.1%) |
| Total | 67,148 (83.6%) | 2,972 (3.7%) |
Employment Occupations by Sex in Naperville
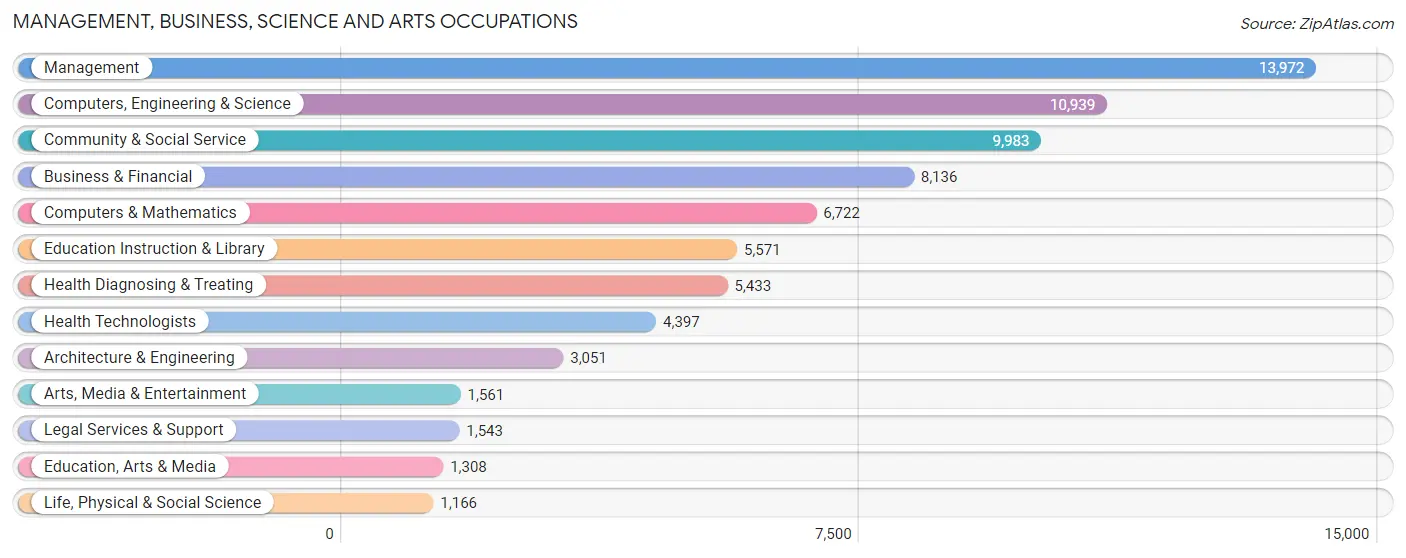
Management, Business, Science and Arts Occupations
The most common Management, Business, Science and Arts occupations in Naperville are Management (13,972 | 18.2%), Computers, Engineering & Science (10,939 | 14.3%), Community & Social Service (9,983 | 13.0%), Business & Financial (8,136 | 10.6%), and Computers & Mathematics (6,722 | 8.8%).
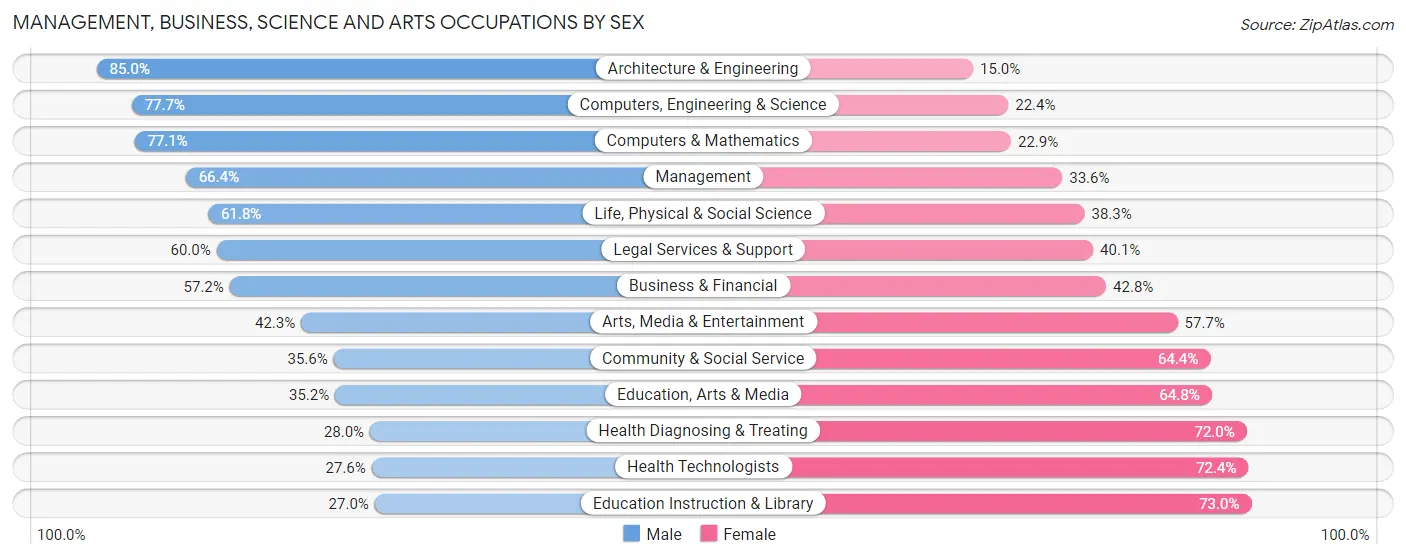
Management, Business, Science and Arts Occupations by Sex
Within the Management, Business, Science and Arts occupations in Naperville, the most male-oriented occupations are Architecture & Engineering (85.0%), Computers, Engineering & Science (77.6%), and Computers & Mathematics (77.1%), while the most female-oriented occupations are Education Instruction & Library (73.0%), Health Technologists (72.4%), and Health Diagnosing & Treating (72.0%).
| Occupation | Male | Female |
| Management | 9,275 (66.4%) | 4,697 (33.6%) |
| Business & Financial | 4,657 (57.2%) | 3,479 (42.8%) |
| Computers, Engineering & Science | 8,494 (77.6%) | 2,445 (22.4%) |
| Computers & Mathematics | 5,181 (77.1%) | 1,541 (22.9%) |
| Architecture & Engineering | 2,593 (85.0%) | 458 (15.0%) |
| Life, Physical & Social Science | 720 (61.8%) | 446 (38.3%) |
| Community & Social Service | 3,550 (35.6%) | 6,433 (64.4%) |
| Education, Arts & Media | 461 (35.2%) | 847 (64.8%) |
| Legal Services & Support | 925 (60.0%) | 618 (40.1%) |
| Education Instruction & Library | 1,503 (27.0%) | 4,068 (73.0%) |
| Arts, Media & Entertainment | 661 (42.3%) | 900 (57.7%) |
| Health Diagnosing & Treating | 1,519 (28.0%) | 3,914 (72.0%) |
| Health Technologists | 1,214 (27.6%) | 3,183 (72.4%) |
| Total (Category) | 27,495 (56.7%) | 20,968 (43.3%) |
| Total (Overall) | 42,263 (55.1%) | 34,373 (44.9%) |
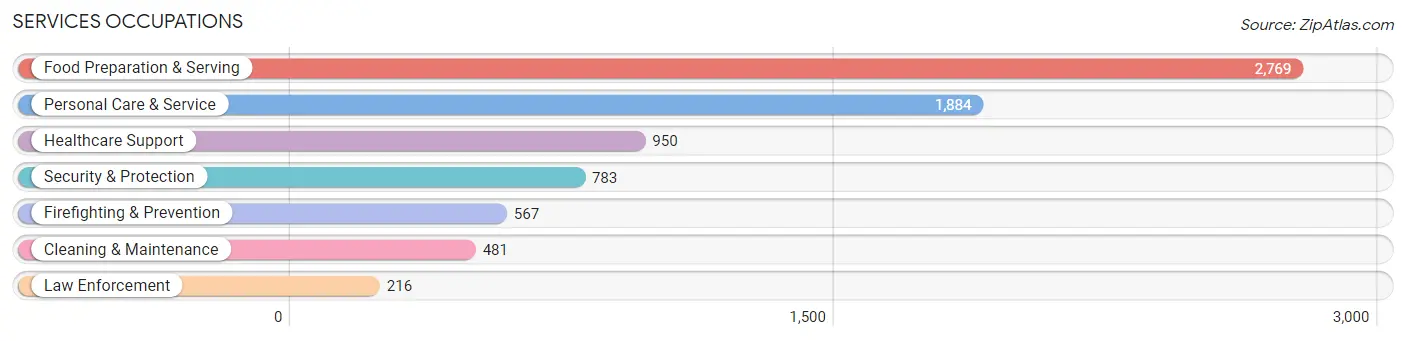
Services Occupations
The most common Services occupations in Naperville are Food Preparation & Serving (2,769 | 3.6%), Personal Care & Service (1,884 | 2.5%), Healthcare Support (950 | 1.2%), Security & Protection (783 | 1.0%), and Firefighting & Prevention (567 | 0.7%).
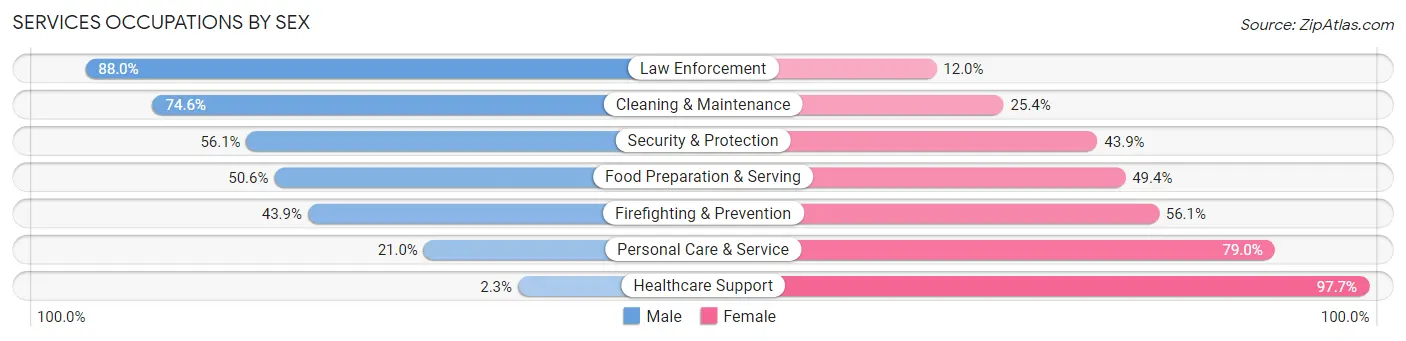
Services Occupations by Sex
Within the Services occupations in Naperville, the most male-oriented occupations are Law Enforcement (88.0%), Cleaning & Maintenance (74.6%), and Security & Protection (56.1%), while the most female-oriented occupations are Healthcare Support (97.7%), Personal Care & Service (79.0%), and Firefighting & Prevention (56.1%).
| Occupation | Male | Female |
| Healthcare Support | 22 (2.3%) | 928 (97.7%) |
| Security & Protection | 439 (56.1%) | 344 (43.9%) |
| Firefighting & Prevention | 249 (43.9%) | 318 (56.1%) |
| Law Enforcement | 190 (88.0%) | 26 (12.0%) |
| Food Preparation & Serving | 1,400 (50.6%) | 1,369 (49.4%) |
| Cleaning & Maintenance | 359 (74.6%) | 122 (25.4%) |
| Personal Care & Service | 395 (21.0%) | 1,489 (79.0%) |
| Total (Category) | 2,615 (38.1%) | 4,252 (61.9%) |
| Total (Overall) | 42,263 (55.1%) | 34,373 (44.9%) |
Sales and Office Occupations
The most common Sales and Office occupations in Naperville are Sales & Related (9,093 | 11.9%), and Office & Administration (5,862 | 7.6%).

Sales and Office Occupations by Sex

| Occupation | Male | Female |
| Sales & Related | 5,440 (59.8%) | 3,653 (40.2%) |
| Office & Administration | 1,700 (29.0%) | 4,162 (71.0%) |
| Total (Category) | 7,140 (47.7%) | 7,815 (52.3%) |
| Total (Overall) | 42,263 (55.1%) | 34,373 (44.9%) |
Natural Resources, Construction and Maintenance Occupations
The most common Natural Resources, Construction and Maintenance occupations in Naperville are Construction & Extraction (957 | 1.3%), Installation, Maintenance & Repair (620 | 0.8%), and Farming, Fishing & Forestry (37 | 0.1%).
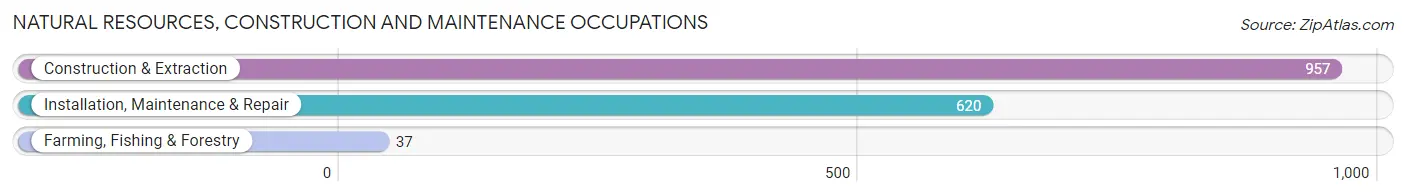
Natural Resources, Construction and Maintenance Occupations by Sex

| Occupation | Male | Female |
| Farming, Fishing & Forestry | 37 (100.0%) | 0 (0.0%) |
| Construction & Extraction | 893 (93.3%) | 64 (6.7%) |
| Installation, Maintenance & Repair | 607 (97.9%) | 13 (2.1%) |
| Total (Category) | 1,537 (95.2%) | 77 (4.8%) |
| Total (Overall) | 42,263 (55.1%) | 34,373 (44.9%) |
Production, Transportation and Moving Occupations
The most common Production, Transportation and Moving occupations in Naperville are Transportation (2,051 | 2.7%), Production (1,637 | 2.1%), and Material Moving (1,049 | 1.4%).
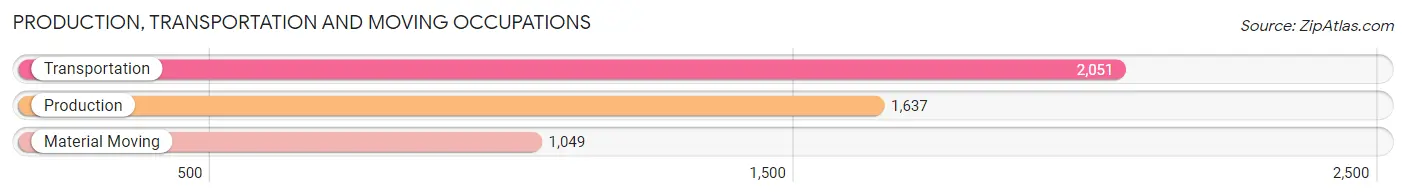
Production, Transportation and Moving Occupations by Sex
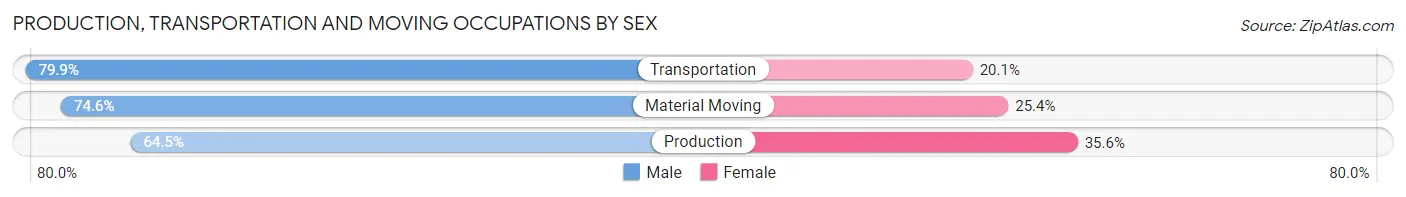
| Occupation | Male | Female |
| Production | 1,055 (64.4%) | 582 (35.5%) |
| Transportation | 1,638 (79.9%) | 413 (20.1%) |
| Material Moving | 783 (74.6%) | 266 (25.4%) |
| Total (Category) | 3,476 (73.4%) | 1,261 (26.6%) |
| Total (Overall) | 42,263 (55.1%) | 34,373 (44.9%) |
Employment Industries by Sex in Naperville
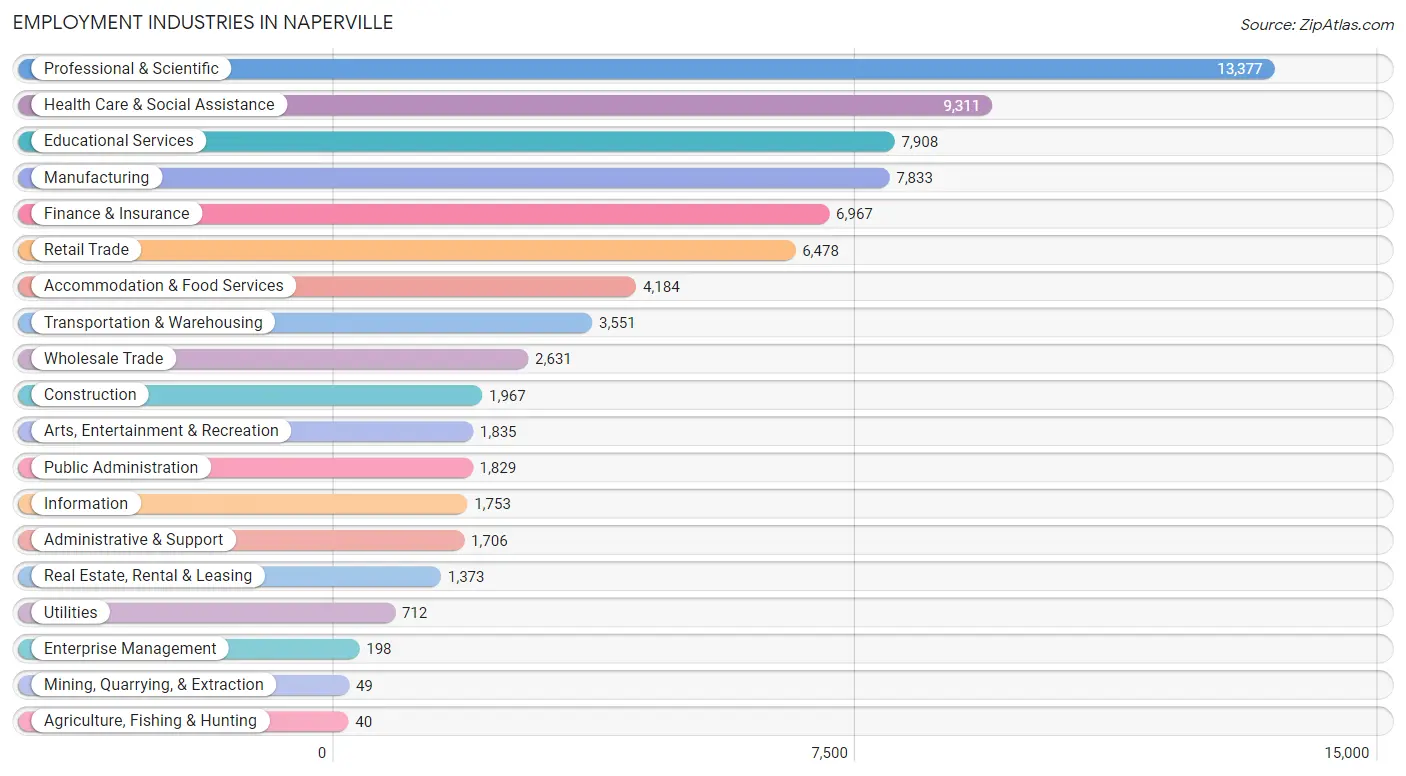
Employment Industries in Naperville
The major employment industries in Naperville include Professional & Scientific (13,377 | 17.5%), Health Care & Social Assistance (9,311 | 12.1%), Educational Services (7,908 | 10.3%), Manufacturing (7,833 | 10.2%), and Finance & Insurance (6,967 | 9.1%).
Employment Industries by Sex in Naperville
The Naperville industries that see more men than women are Construction (86.1%), Transportation & Warehousing (76.7%), and Manufacturing (76.2%), whereas the industries that tend to have a higher number of women are Health Care & Social Assistance (75.0%), Educational Services (67.2%), and Mining, Quarrying, & Extraction (57.1%).
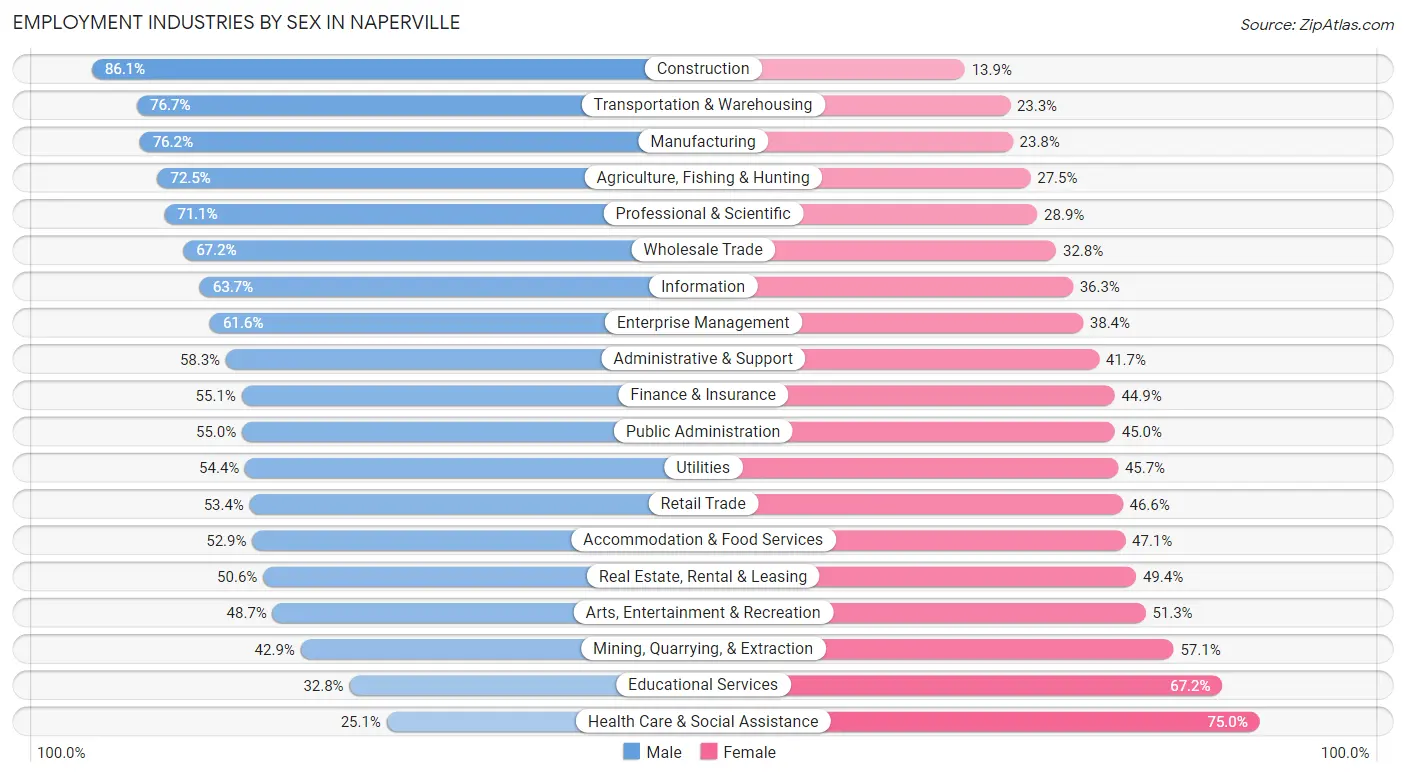
| Industry | Male | Female |
| Agriculture, Fishing & Hunting | 29 (72.5%) | 11 (27.5%) |
| Mining, Quarrying, & Extraction | 21 (42.9%) | 28 (57.1%) |
| Construction | 1,693 (86.1%) | 274 (13.9%) |
| Manufacturing | 5,966 (76.2%) | 1,867 (23.8%) |
| Wholesale Trade | 1,767 (67.2%) | 864 (32.8%) |
| Retail Trade | 3,460 (53.4%) | 3,018 (46.6%) |
| Transportation & Warehousing | 2,724 (76.7%) | 827 (23.3%) |
| Utilities | 387 (54.3%) | 325 (45.7%) |
| Information | 1,117 (63.7%) | 636 (36.3%) |
| Finance & Insurance | 3,837 (55.1%) | 3,130 (44.9%) |
| Real Estate, Rental & Leasing | 695 (50.6%) | 678 (49.4%) |
| Professional & Scientific | 9,508 (71.1%) | 3,869 (28.9%) |
| Enterprise Management | 122 (61.6%) | 76 (38.4%) |
| Administrative & Support | 995 (58.3%) | 711 (41.7%) |
| Educational Services | 2,591 (32.8%) | 5,317 (67.2%) |
| Health Care & Social Assistance | 2,332 (25.1%) | 6,979 (75.0%) |
| Arts, Entertainment & Recreation | 893 (48.7%) | 942 (51.3%) |
| Accommodation & Food Services | 2,212 (52.9%) | 1,972 (47.1%) |
| Public Administration | 1,006 (55.0%) | 823 (45.0%) |
| Total | 42,263 (55.1%) | 34,373 (44.9%) |
Education in Naperville
School Enrollment in Naperville
The most common levels of schooling among the 40,460 students in Naperville are high school (9,659 | 23.9%), middle school (8,778 | 21.7%), and elementary school (7,908 | 19.6%).
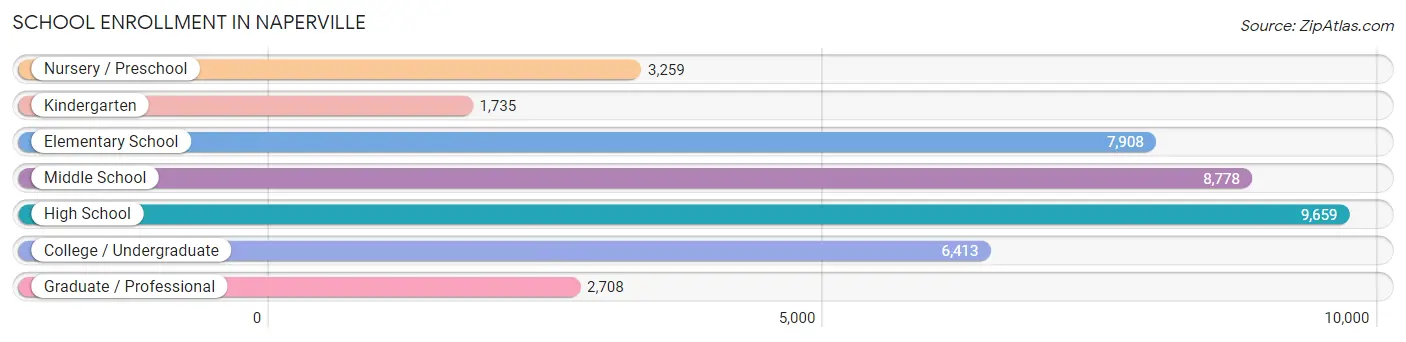
| School Level | # Students | % Students |
| Nursery / Preschool | 3,259 | 8.1% |
| Kindergarten | 1,735 | 4.3% |
| Elementary School | 7,908 | 19.6% |
| Middle School | 8,778 | 21.7% |
| High School | 9,659 | 23.9% |
| College / Undergraduate | 6,413 | 15.9% |
| Graduate / Professional | 2,708 | 6.7% |
| Total | 40,460 | 100.0% |
School Enrollment by Age by Funding Source in Naperville
Out of a total of 40,460 students who are enrolled in schools in Naperville, 7,809 (19.3%) attend a private institution, while the remaining 32,651 (80.7%) are enrolled in public schools. The age group of 3 to 4 year olds has the highest likelihood of being enrolled in private schools, with 1,438 (56.4% in the age bracket) enrolled. Conversely, the age group of 15 to 17 year olds has the lowest likelihood of being enrolled in a private school, with 6,602 (93.2% in the age bracket) attending a public institution.
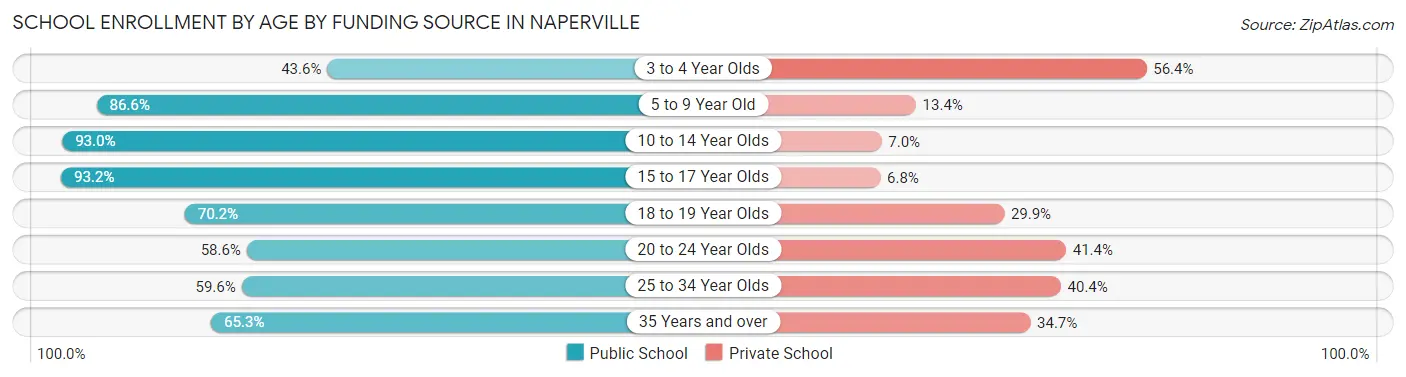
| Age Bracket | Public School | Private School |
| 3 to 4 Year Olds | 1,113 (43.6%) | 1,438 (56.4%) |
| 5 to 9 Year Old | 8,152 (86.6%) | 1,262 (13.4%) |
| 10 to 14 Year Olds | 10,256 (93.0%) | 774 (7.0%) |
| 15 to 17 Year Olds | 6,602 (93.2%) | 481 (6.8%) |
| 18 to 19 Year Olds | 2,012 (70.2%) | 856 (29.8%) |
| 20 to 24 Year Olds | 2,391 (58.6%) | 1,687 (41.4%) |
| 25 to 34 Year Olds | 1,097 (59.6%) | 744 (40.4%) |
| 35 Years and over | 1,041 (65.3%) | 554 (34.7%) |
| Total | 32,651 (80.7%) | 7,809 (19.3%) |
Educational Attainment by Field of Study in Naperville
Business (17,641 | 22.8%), engineering (10,814 | 14.0%), education (6,738 | 8.7%), science & technology (6,459 | 8.4%), and computers & mathematics (5,948 | 7.7%) are the most common fields of study among 77,268 individuals in Naperville who have obtained a bachelor's degree or higher.
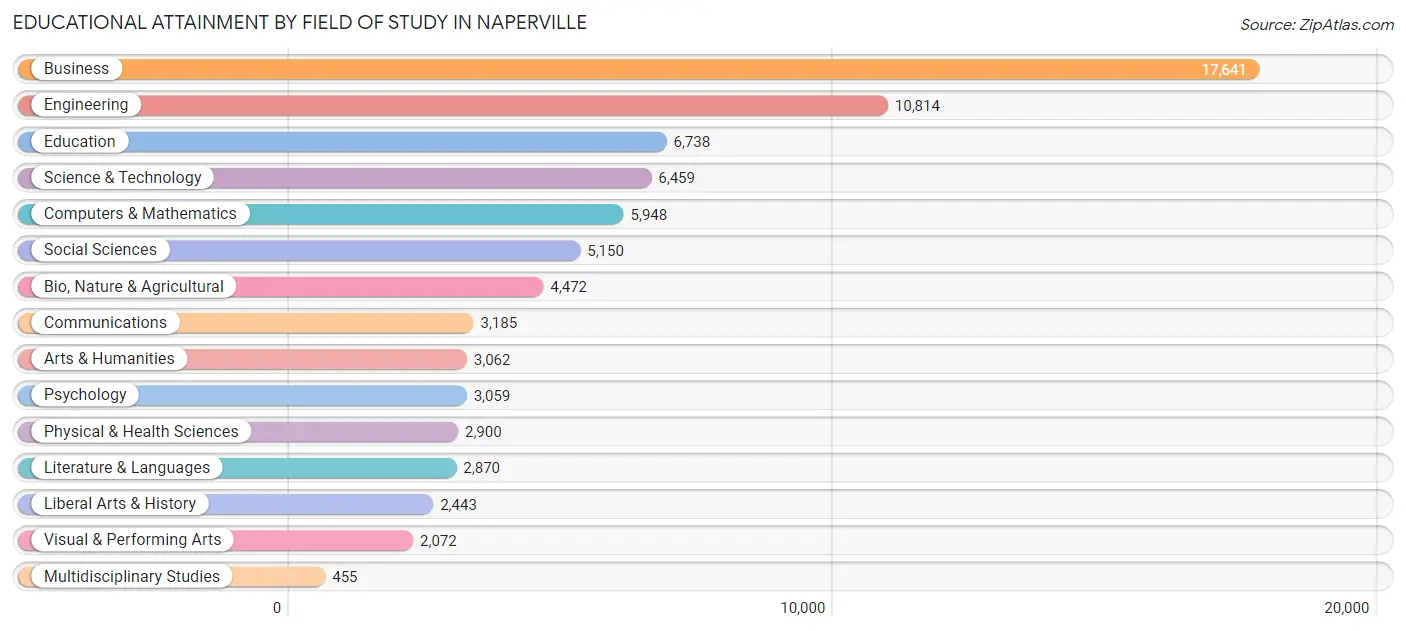
| Field of Study | # Graduates | % Graduates |
| Computers & Mathematics | 5,948 | 7.7% |
| Bio, Nature & Agricultural | 4,472 | 5.8% |
| Physical & Health Sciences | 2,900 | 3.7% |
| Psychology | 3,059 | 4.0% |
| Social Sciences | 5,150 | 6.7% |
| Engineering | 10,814 | 14.0% |
| Multidisciplinary Studies | 455 | 0.6% |
| Science & Technology | 6,459 | 8.4% |
| Business | 17,641 | 22.8% |
| Education | 6,738 | 8.7% |
| Literature & Languages | 2,870 | 3.7% |
| Liberal Arts & History | 2,443 | 3.2% |
| Visual & Performing Arts | 2,072 | 2.7% |
| Communications | 3,185 | 4.1% |
| Arts & Humanities | 3,062 | 4.0% |
| Total | 77,268 | 100.0% |
Transportation & Commute in Naperville
Vehicle Availability by Sex in Naperville
The most prevalent vehicle ownership categories in Naperville are males with 2 vehicles (21,335, accounting for 51.3%) and females with 2 vehicles (16,381, making up 63.6%).
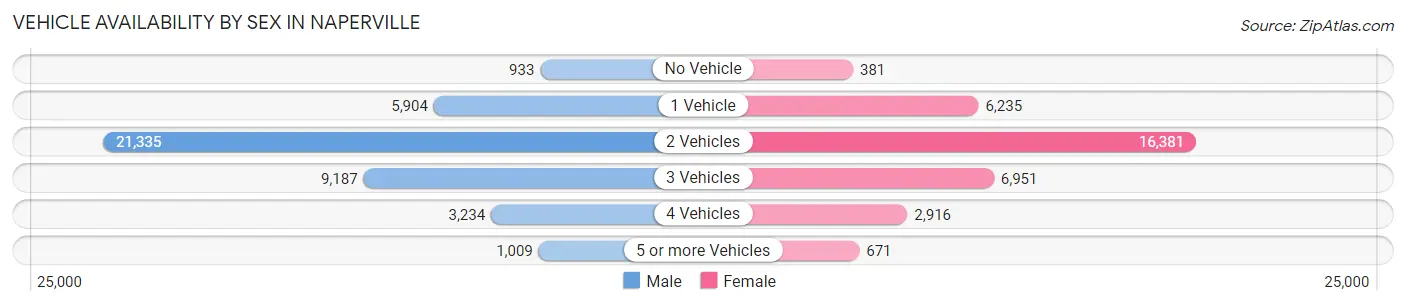
| Vehicles Available | Male | Female |
| No Vehicle | 933 (2.2%) | 381 (1.1%) |
| 1 Vehicle | 5,904 (14.2%) | 6,235 (18.6%) |
| 2 Vehicles | 21,335 (51.3%) | 16,381 (48.8%) |
| 3 Vehicles | 9,187 (22.1%) | 6,951 (20.7%) |
| 4 Vehicles | 3,234 (7.8%) | 2,916 (8.7%) |
| 5 or more Vehicles | 1,009 (2.4%) | 671 (2.0%) |
| Total | 41,602 (100.0%) | 33,535 (100.0%) |
Commute Time in Naperville
The most frequently occuring commute durations in Naperville are 15 to 19 minutes (7,273 commuters, 12.6%), 30 to 34 minutes (7,269 commuters, 12.6%), and 60 to 89 minutes (6,758 commuters, 11.7%).
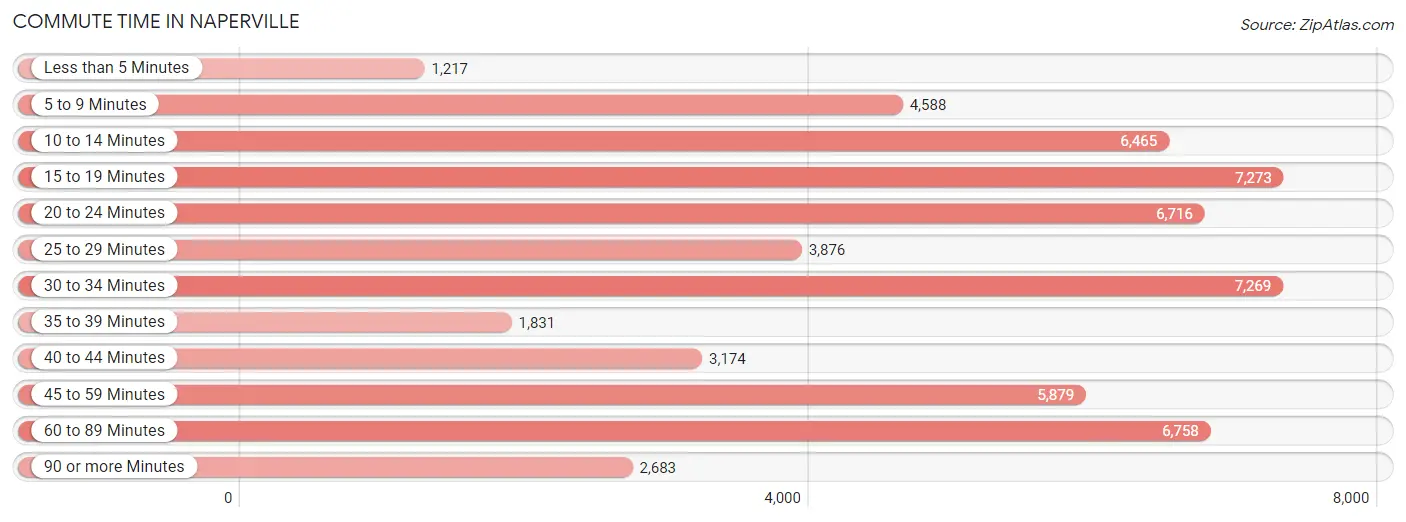
| Commute Time | # Commuters | % Commuters |
| Less than 5 Minutes | 1,217 | 2.1% |
| 5 to 9 Minutes | 4,588 | 8.0% |
| 10 to 14 Minutes | 6,465 | 11.2% |
| 15 to 19 Minutes | 7,273 | 12.6% |
| 20 to 24 Minutes | 6,716 | 11.6% |
| 25 to 29 Minutes | 3,876 | 6.7% |
| 30 to 34 Minutes | 7,269 | 12.6% |
| 35 to 39 Minutes | 1,831 | 3.2% |
| 40 to 44 Minutes | 3,174 | 5.5% |
| 45 to 59 Minutes | 5,879 | 10.2% |
| 60 to 89 Minutes | 6,758 | 11.7% |
| 90 or more Minutes | 2,683 | 4.6% |
Commute Time by Sex in Naperville
The most common commute times in Naperville are 60 to 89 minutes (4,231 commuters, 13.4%) for males and 15 to 19 minutes (3,941 commuters, 15.1%) for females.
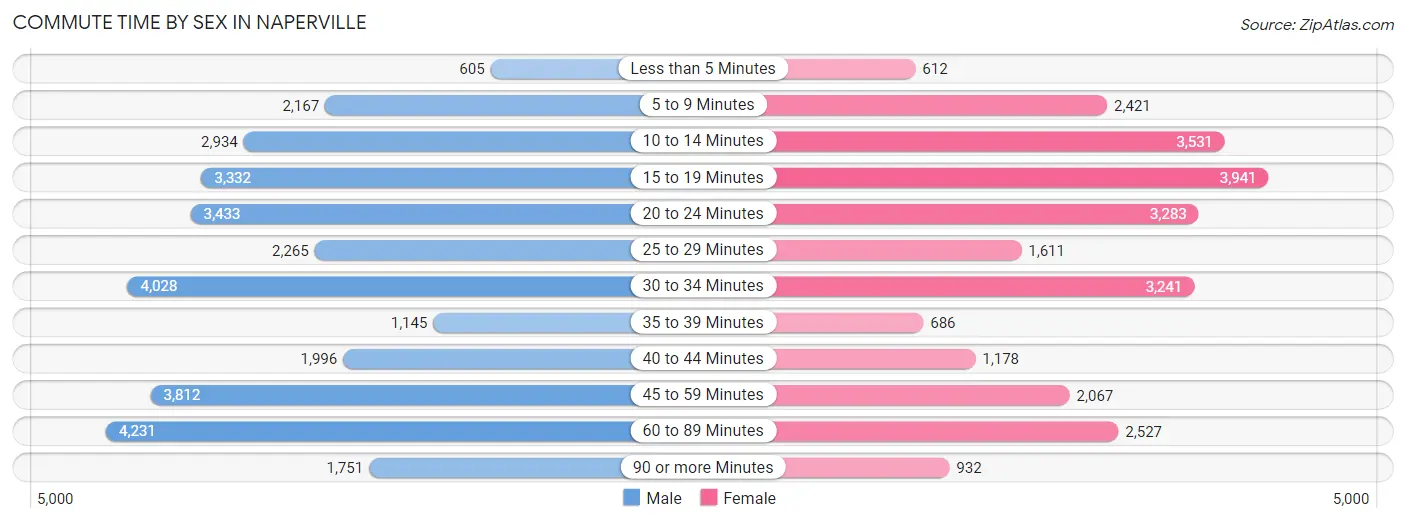
| Commute Time | Male | Female |
| Less than 5 Minutes | 605 (1.9%) | 612 (2.4%) |
| 5 to 9 Minutes | 2,167 (6.8%) | 2,421 (9.3%) |
| 10 to 14 Minutes | 2,934 (9.3%) | 3,531 (13.6%) |
| 15 to 19 Minutes | 3,332 (10.5%) | 3,941 (15.1%) |
| 20 to 24 Minutes | 3,433 (10.8%) | 3,283 (12.6%) |
| 25 to 29 Minutes | 2,265 (7.1%) | 1,611 (6.2%) |
| 30 to 34 Minutes | 4,028 (12.7%) | 3,241 (12.4%) |
| 35 to 39 Minutes | 1,145 (3.6%) | 686 (2.6%) |
| 40 to 44 Minutes | 1,996 (6.3%) | 1,178 (4.5%) |
| 45 to 59 Minutes | 3,812 (12.0%) | 2,067 (7.9%) |
| 60 to 89 Minutes | 4,231 (13.4%) | 2,527 (9.7%) |
| 90 or more Minutes | 1,751 (5.5%) | 932 (3.6%) |
Time of Departure to Work by Sex in Naperville
The most frequent times of departure to work in Naperville are 7:00 AM to 7:29 AM (5,442, 17.2%) for males and 7:00 AM to 7:29 AM (4,289, 16.5%) for females.
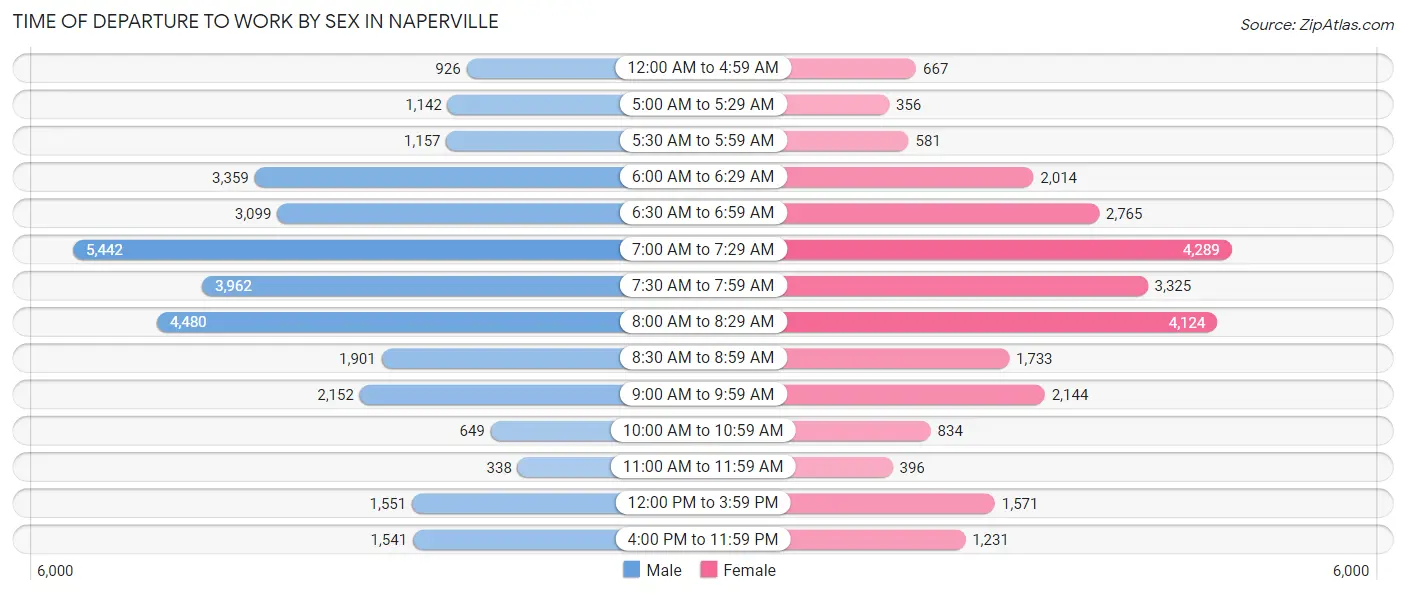
| Time of Departure | Male | Female |
| 12:00 AM to 4:59 AM | 926 (2.9%) | 667 (2.6%) |
| 5:00 AM to 5:29 AM | 1,142 (3.6%) | 356 (1.4%) |
| 5:30 AM to 5:59 AM | 1,157 (3.6%) | 581 (2.2%) |
| 6:00 AM to 6:29 AM | 3,359 (10.6%) | 2,014 (7.7%) |
| 6:30 AM to 6:59 AM | 3,099 (9.8%) | 2,765 (10.6%) |
| 7:00 AM to 7:29 AM | 5,442 (17.2%) | 4,289 (16.5%) |
| 7:30 AM to 7:59 AM | 3,962 (12.5%) | 3,325 (12.8%) |
| 8:00 AM to 8:29 AM | 4,480 (14.1%) | 4,124 (15.8%) |
| 8:30 AM to 8:59 AM | 1,901 (6.0%) | 1,733 (6.7%) |
| 9:00 AM to 9:59 AM | 2,152 (6.8%) | 2,144 (8.2%) |
| 10:00 AM to 10:59 AM | 649 (2.1%) | 834 (3.2%) |
| 11:00 AM to 11:59 AM | 338 (1.1%) | 396 (1.5%) |
| 12:00 PM to 3:59 PM | 1,551 (4.9%) | 1,571 (6.0%) |
| 4:00 PM to 11:59 PM | 1,541 (4.9%) | 1,231 (4.7%) |
| Total | 31,699 (100.0%) | 26,030 (100.0%) |
Housing Occupancy in Naperville
Occupancy by Ownership in Naperville
Of the total 53,815 dwellings in Naperville, owner-occupied units account for 40,032 (74.4%), while renter-occupied units make up 13,783 (25.6%).
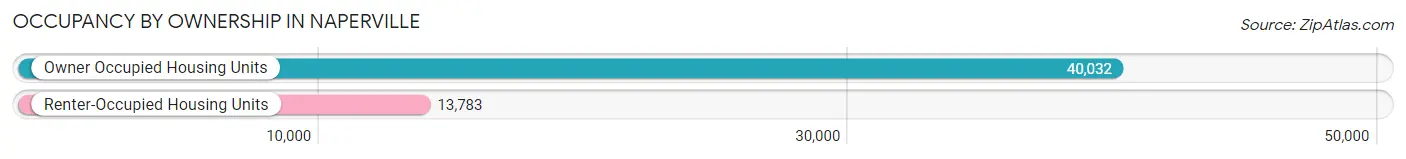
| Occupancy | # Housing Units | % Housing Units |
| Owner Occupied Housing Units | 40,032 | 74.4% |
| Renter-Occupied Housing Units | 13,783 | 25.6% |
| Total Occupied Housing Units | 53,815 | 100.0% |
Occupancy by Household Size in Naperville
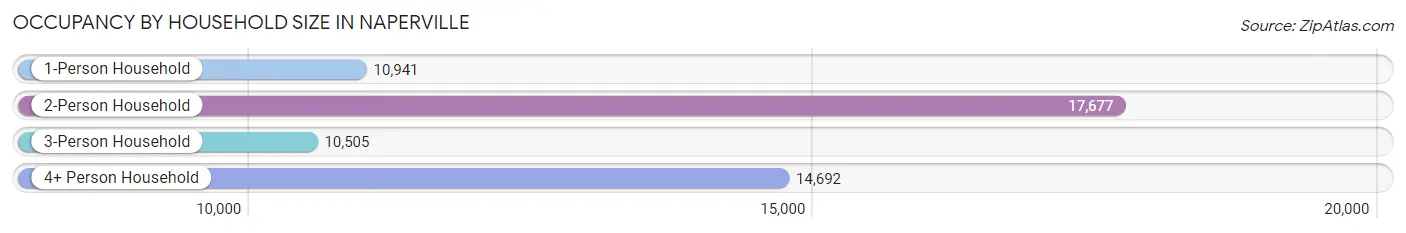
| Household Size | # Housing Units | % Housing Units |
| 1-Person Household | 10,941 | 20.3% |
| 2-Person Household | 17,677 | 32.9% |
| 3-Person Household | 10,505 | 19.5% |
| 4+ Person Household | 14,692 | 27.3% |
| Total Housing Units | 53,815 | 100.0% |
Occupancy by Ownership by Household Size in Naperville
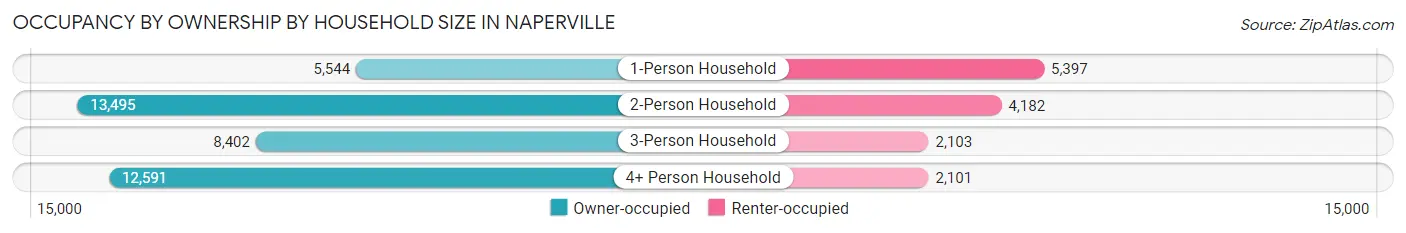
| Household Size | Owner-occupied | Renter-occupied |
| 1-Person Household | 5,544 (50.7%) | 5,397 (49.3%) |
| 2-Person Household | 13,495 (76.3%) | 4,182 (23.7%) |
| 3-Person Household | 8,402 (80.0%) | 2,103 (20.0%) |
| 4+ Person Household | 12,591 (85.7%) | 2,101 (14.3%) |
| Total Housing Units | 40,032 (74.4%) | 13,783 (25.6%) |
Occupancy by Educational Attainment in Naperville
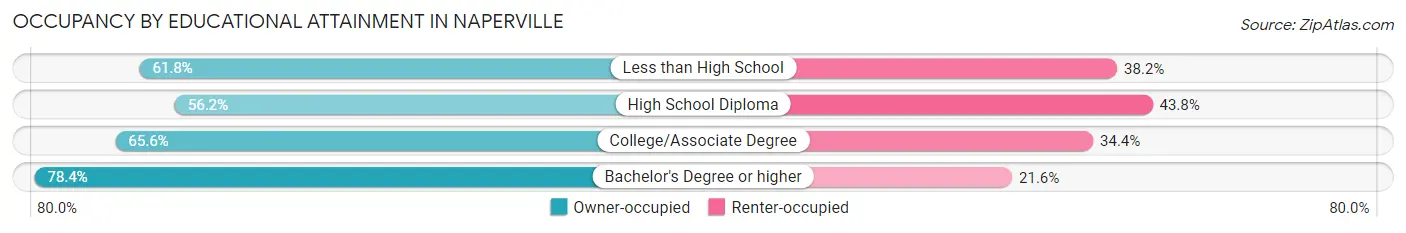
| Household Size | Owner-occupied | Renter-occupied |
| Less than High School | 480 (61.8%) | 297 (38.2%) |
| High School Diploma | 2,142 (56.2%) | 1,672 (43.8%) |
| College/Associate Degree | 6,132 (65.6%) | 3,217 (34.4%) |
| Bachelor's Degree or higher | 31,278 (78.4%) | 8,597 (21.6%) |
Occupancy by Age of Householder in Naperville
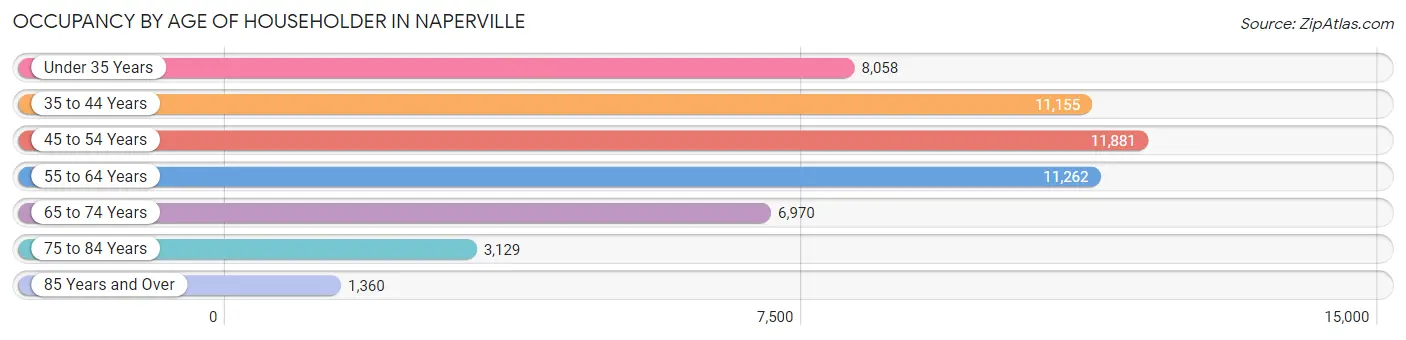
| Age Bracket | # Households | % Households |
| Under 35 Years | 8,058 | 15.0% |
| 35 to 44 Years | 11,155 | 20.7% |
| 45 to 54 Years | 11,881 | 22.1% |
| 55 to 64 Years | 11,262 | 20.9% |
| 65 to 74 Years | 6,970 | 13.0% |
| 75 to 84 Years | 3,129 | 5.8% |
| 85 Years and Over | 1,360 | 2.5% |
| Total | 53,815 | 100.0% |
Housing Finances in Naperville
Median Income by Occupancy in Naperville
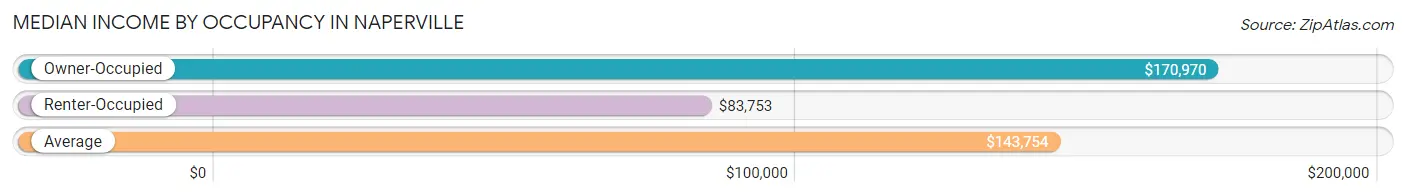
| Occupancy Type | # Households | Median Income |
| Owner-Occupied | 40,032 (74.4%) | $170,970 |
| Renter-Occupied | 13,783 (25.6%) | $83,753 |
| Average | 53,815 (100.0%) | $143,754 |
Occupancy by Householder Income Bracket in Naperville
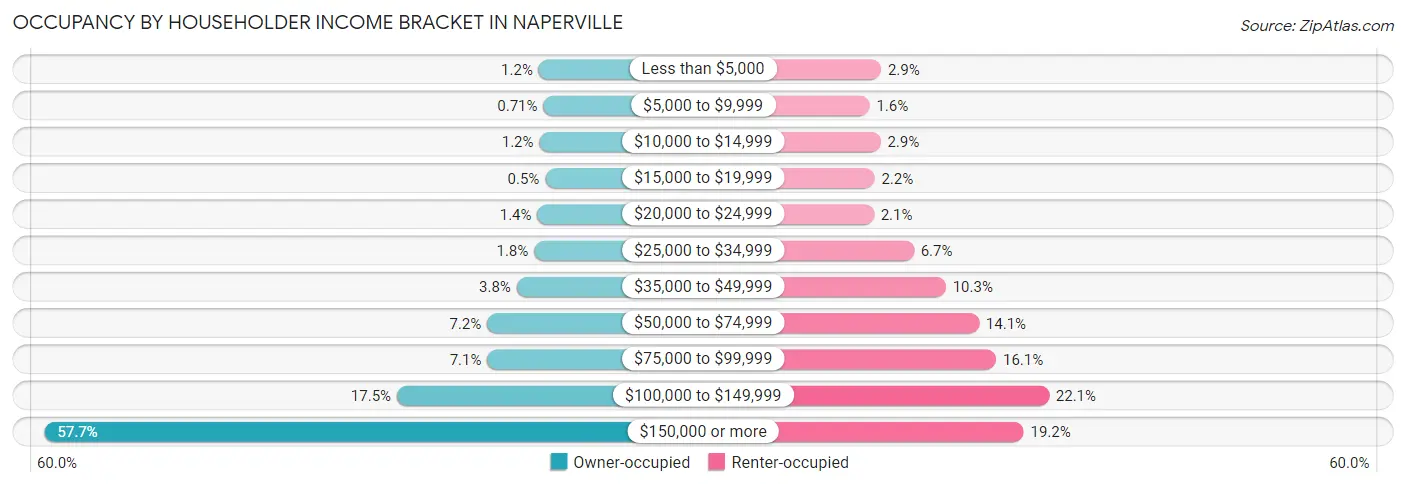
| Income Bracket | Owner-occupied | Renter-occupied |
| Less than $5,000 | 498 (1.2%) | 401 (2.9%) |
| $5,000 to $9,999 | 283 (0.7%) | 219 (1.6%) |
| $10,000 to $14,999 | 470 (1.2%) | 393 (2.9%) |
| $15,000 to $19,999 | 199 (0.5%) | 298 (2.2%) |
| $20,000 to $24,999 | 561 (1.4%) | 286 (2.1%) |
| $25,000 to $34,999 | 710 (1.8%) | 917 (6.7%) |
| $35,000 to $49,999 | 1,505 (3.8%) | 1,421 (10.3%) |
| $50,000 to $74,999 | 2,862 (7.1%) | 1,943 (14.1%) |
| $75,000 to $99,999 | 2,851 (7.1%) | 2,213 (16.1%) |
| $100,000 to $149,999 | 6,984 (17.4%) | 3,045 (22.1%) |
| $150,000 or more | 23,109 (57.7%) | 2,647 (19.2%) |
| Total | 40,032 (100.0%) | 13,783 (100.0%) |
Monthly Housing Cost Tiers in Naperville
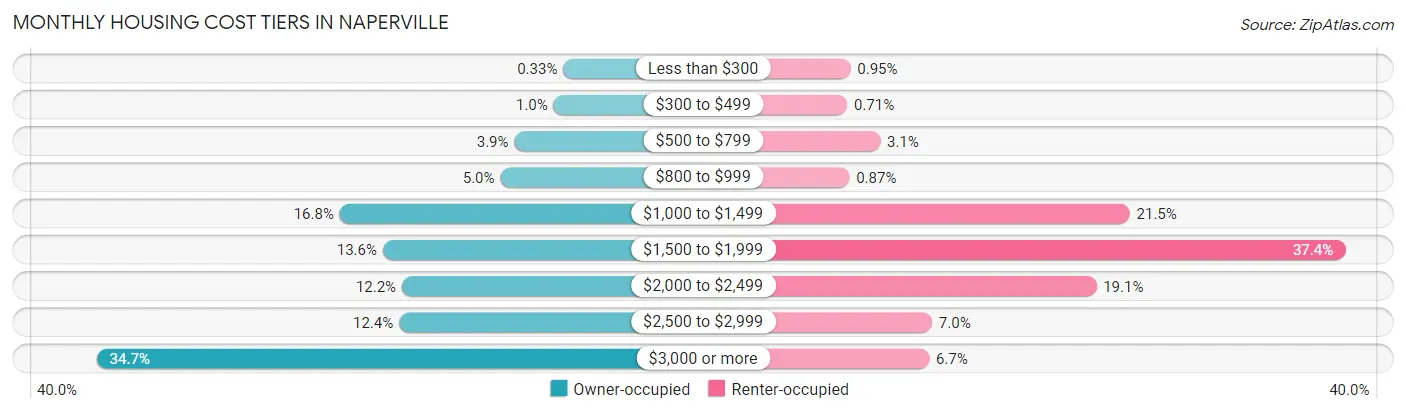
| Monthly Cost | Owner-occupied | Renter-occupied |
| Less than $300 | 134 (0.3%) | 131 (0.9%) |
| $300 to $499 | 418 (1.0%) | 98 (0.7%) |
| $500 to $799 | 1,573 (3.9%) | 433 (3.1%) |
| $800 to $999 | 1,985 (5.0%) | 120 (0.9%) |
| $1,000 to $1,499 | 6,721 (16.8%) | 2,966 (21.5%) |
| $1,500 to $1,999 | 5,452 (13.6%) | 5,152 (37.4%) |
| $2,000 to $2,499 | 4,889 (12.2%) | 2,627 (19.1%) |
| $2,500 to $2,999 | 4,972 (12.4%) | 959 (7.0%) |
| $3,000 or more | 13,888 (34.7%) | 929 (6.7%) |
| Total | 40,032 (100.0%) | 13,783 (100.0%) |
Physical Housing Characteristics in Naperville
Housing Structures in Naperville
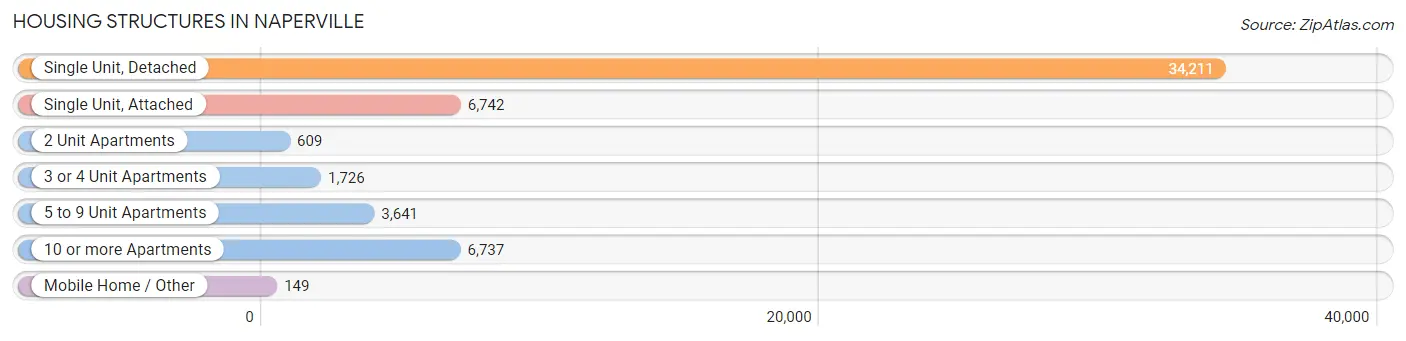
| Structure Type | # Housing Units | % Housing Units |
| Single Unit, Detached | 34,211 | 63.6% |
| Single Unit, Attached | 6,742 | 12.5% |
| 2 Unit Apartments | 609 | 1.1% |
| 3 or 4 Unit Apartments | 1,726 | 3.2% |
| 5 to 9 Unit Apartments | 3,641 | 6.8% |
| 10 or more Apartments | 6,737 | 12.5% |
| Mobile Home / Other | 149 | 0.3% |
| Total | 53,815 | 100.0% |
Housing Structures by Occupancy in Naperville
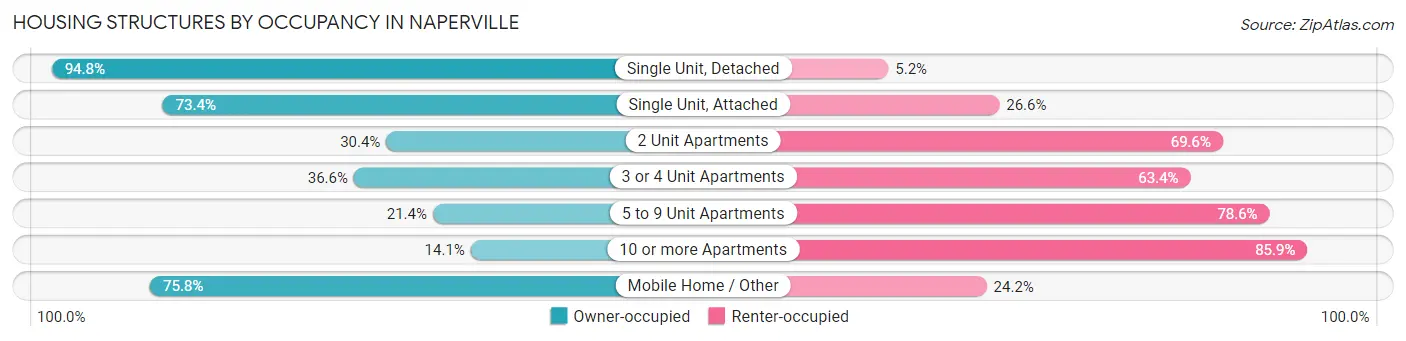
| Structure Type | Owner-occupied | Renter-occupied |
| Single Unit, Detached | 32,423 (94.8%) | 1,788 (5.2%) |
| Single Unit, Attached | 4,949 (73.4%) | 1,793 (26.6%) |
| 2 Unit Apartments | 185 (30.4%) | 424 (69.6%) |
| 3 or 4 Unit Apartments | 632 (36.6%) | 1,094 (63.4%) |
| 5 to 9 Unit Apartments | 779 (21.4%) | 2,862 (78.6%) |
| 10 or more Apartments | 951 (14.1%) | 5,786 (85.9%) |
| Mobile Home / Other | 113 (75.8%) | 36 (24.2%) |
| Total | 40,032 (74.4%) | 13,783 (25.6%) |
Housing Structures by Number of Rooms in Naperville
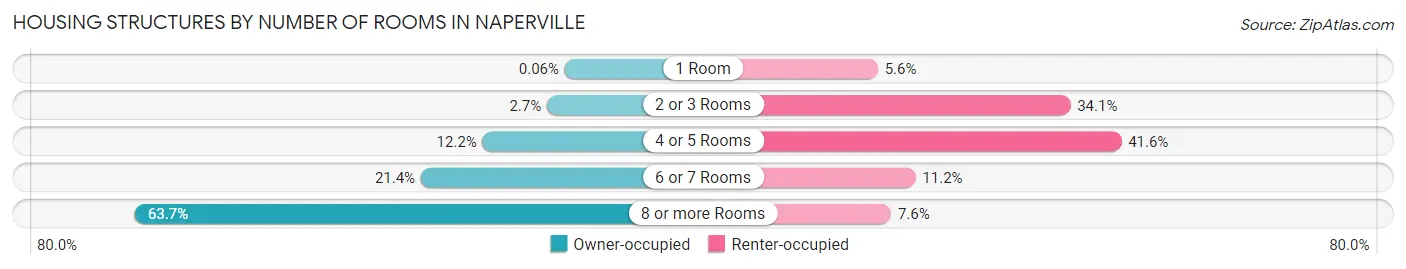
| Number of Rooms | Owner-occupied | Renter-occupied |
| 1 Room | 25 (0.1%) | 770 (5.6%) |
| 2 or 3 Rooms | 1,075 (2.7%) | 4,697 (34.1%) |
| 4 or 5 Rooms | 4,892 (12.2%) | 5,737 (41.6%) |
| 6 or 7 Rooms | 8,546 (21.3%) | 1,539 (11.2%) |
| 8 or more Rooms | 25,494 (63.7%) | 1,040 (7.5%) |
| Total | 40,032 (100.0%) | 13,783 (100.0%) |
Housing Structure by Heating Type in Naperville
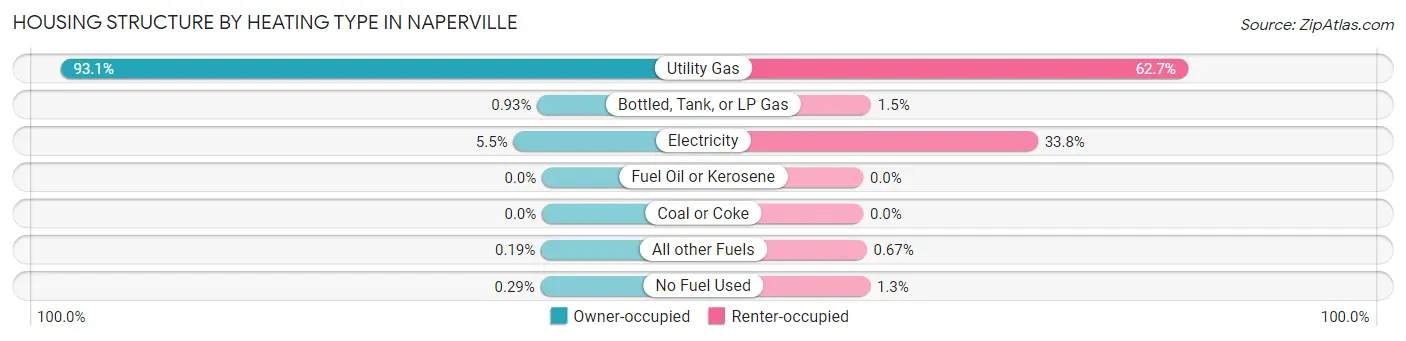
| Heating Type | Owner-occupied | Renter-occupied |
| Utility Gas | 37,255 (93.1%) | 8,646 (62.7%) |
| Bottled, Tank, or LP Gas | 374 (0.9%) | 210 (1.5%) |
| Electricity | 2,212 (5.5%) | 4,652 (33.8%) |
| Fuel Oil or Kerosene | 0 (0.0%) | 0 (0.0%) |
| Coal or Coke | 0 (0.0%) | 0 (0.0%) |
| All other Fuels | 76 (0.2%) | 92 (0.7%) |
| No Fuel Used | 115 (0.3%) | 183 (1.3%) |
| Total | 40,032 (100.0%) | 13,783 (100.0%) |
Household Vehicle Usage in Naperville
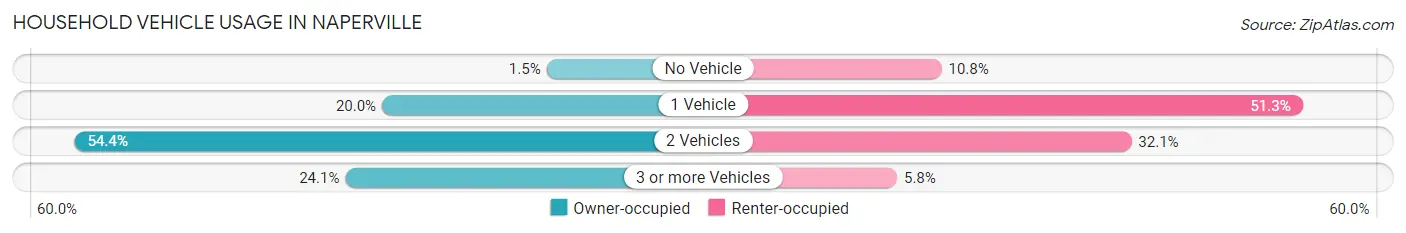
| Vehicles per Household | Owner-occupied | Renter-occupied |
| No Vehicle | 617 (1.5%) | 1,491 (10.8%) |
| 1 Vehicle | 7,995 (20.0%) | 7,064 (51.2%) |
| 2 Vehicles | 21,781 (54.4%) | 4,423 (32.1%) |
| 3 or more Vehicles | 9,639 (24.1%) | 805 (5.8%) |
| Total | 40,032 (100.0%) | 13,783 (100.0%) |
Real Estate & Mortgages in Naperville
Real Estate and Mortgage Overview in Naperville
| Characteristic | Without Mortgage | With Mortgage |
| Housing Units | 12,458 | 27,574 |
| Median Property Value | $466,300 | $489,800 |
| Median Household Income | $131,895 | $17,476 |
| Monthly Housing Costs | $1,240 | $13,689 |
| Real Estate Taxes | $9,676 | $154 |
Property Value by Mortgage Status in Naperville
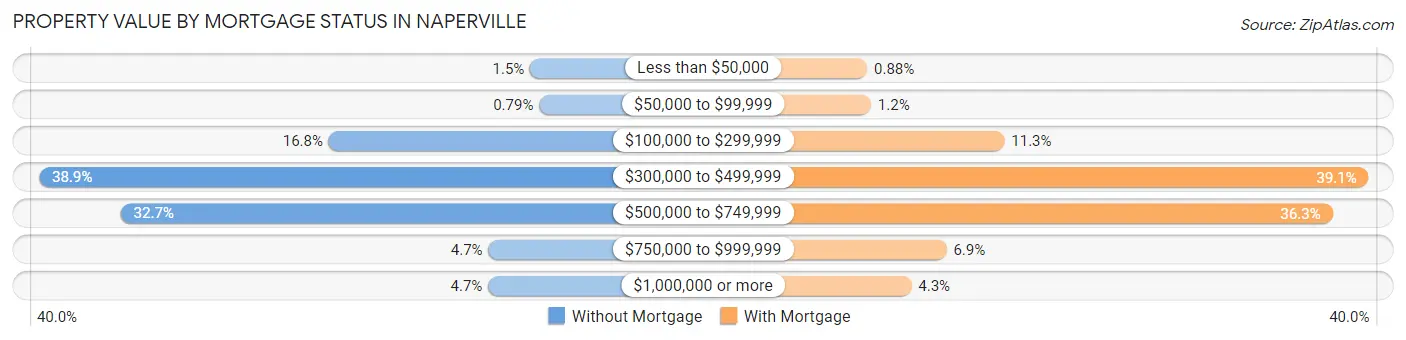
| Property Value | Without Mortgage | With Mortgage |
| Less than $50,000 | 185 (1.5%) | 242 (0.9%) |
| $50,000 to $99,999 | 98 (0.8%) | 323 (1.2%) |
| $100,000 to $299,999 | 2,095 (16.8%) | 3,127 (11.3%) |
| $300,000 to $499,999 | 4,846 (38.9%) | 10,778 (39.1%) |
| $500,000 to $749,999 | 4,071 (32.7%) | 10,021 (36.3%) |
| $750,000 to $999,999 | 580 (4.7%) | 1,911 (6.9%) |
| $1,000,000 or more | 583 (4.7%) | 1,172 (4.3%) |
| Total | 12,458 (100.0%) | 27,574 (100.0%) |
Household Income by Mortgage Status in Naperville
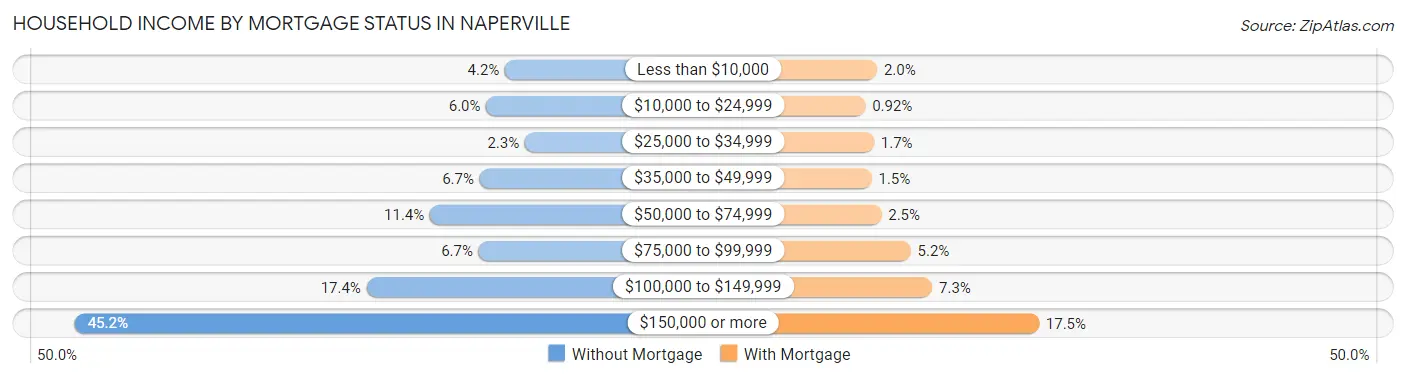
| Household Income | Without Mortgage | With Mortgage |
| Less than $10,000 | 527 (4.2%) | 563 (2.0%) |
| $10,000 to $24,999 | 750 (6.0%) | 254 (0.9%) |
| $25,000 to $34,999 | 291 (2.3%) | 480 (1.7%) |
| $35,000 to $49,999 | 829 (6.7%) | 419 (1.5%) |
| $50,000 to $74,999 | 1,418 (11.4%) | 676 (2.5%) |
| $75,000 to $99,999 | 840 (6.7%) | 1,444 (5.2%) |
| $100,000 to $149,999 | 2,170 (17.4%) | 2,011 (7.3%) |
| $150,000 or more | 5,633 (45.2%) | 4,814 (17.5%) |
| Total | 12,458 (100.0%) | 27,574 (100.0%) |
Property Value to Household Income Ratio in Naperville
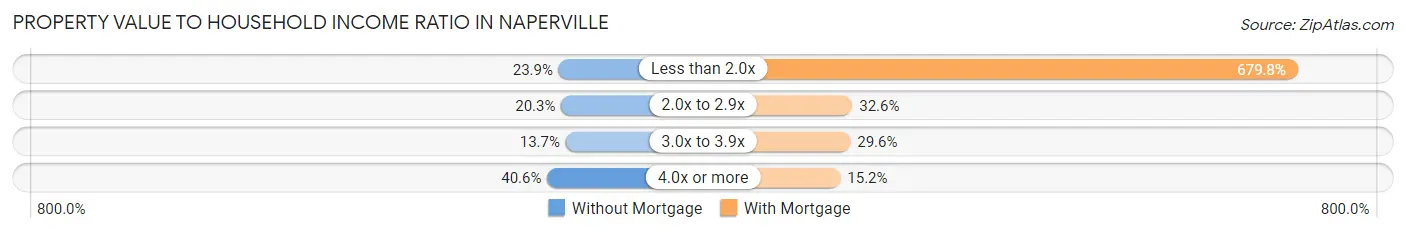
| Value-to-Income Ratio | Without Mortgage | With Mortgage |
| Less than 2.0x | 2,979 (23.9%) | 187,438 (679.8%) |
| 2.0x to 2.9x | 2,526 (20.3%) | 8,976 (32.6%) |
| 3.0x to 3.9x | 1,710 (13.7%) | 8,149 (29.5%) |
| 4.0x or more | 5,054 (40.6%) | 4,192 (15.2%) |
| Total | 12,458 (100.0%) | 27,574 (100.0%) |
Real Estate Taxes by Mortgage Status in Naperville

| Property Taxes | Without Mortgage | With Mortgage |
| Less than $800 | 160 (1.3%) | 55 (0.2%) |
| $800 to $1,499 | 139 (1.1%) | 201 (0.7%) |
| $800 to $1,499 | 12,010 (96.4%) | 308 (1.1%) |
| Total | 12,458 (100.0%) | 27,574 (100.0%) |
Health & Disability in Naperville
Health Insurance Coverage by Age in Naperville
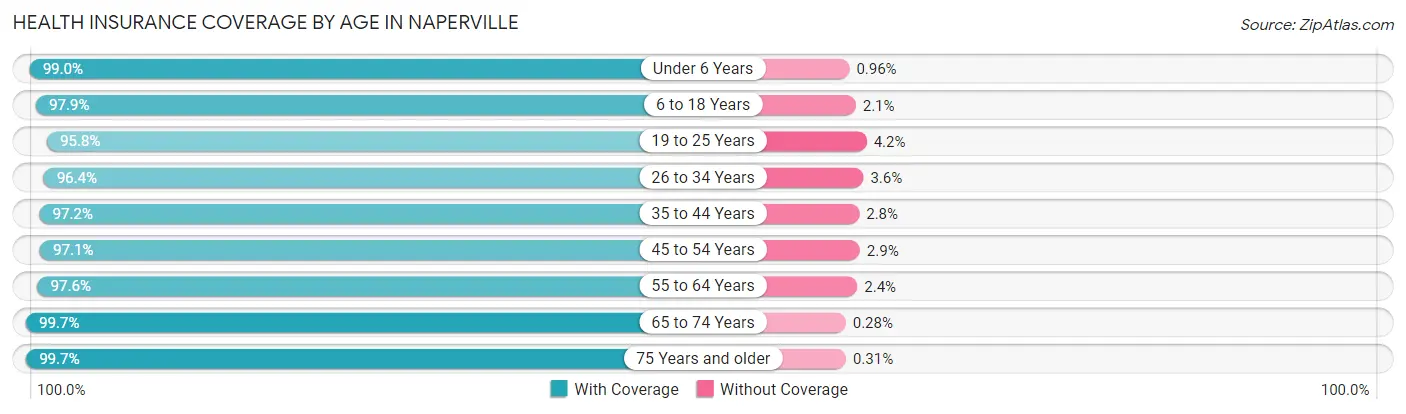
| Age Bracket | With Coverage | Without Coverage |
| Under 6 Years | 10,368 (99.0%) | 101 (1.0%) |
| 6 to 18 Years | 27,829 (97.9%) | 609 (2.1%) |
| 19 to 25 Years | 10,062 (95.8%) | 439 (4.2%) |
| 26 to 34 Years | 14,839 (96.4%) | 551 (3.6%) |
| 35 to 44 Years | 20,803 (97.2%) | 600 (2.8%) |
| 45 to 54 Years | 21,156 (97.1%) | 635 (2.9%) |
| 55 to 64 Years | 19,591 (97.6%) | 491 (2.4%) |
| 65 to 74 Years | 12,371 (99.7%) | 35 (0.3%) |
| 75 Years and older | 7,319 (99.7%) | 23 (0.3%) |
| Total | 144,338 (97.6%) | 3,484 (2.4%) |
Health Insurance Coverage by Citizenship Status in Naperville

| Citizenship Status | With Coverage | Without Coverage |
| Native Born | 10,368 (99.0%) | 101 (1.0%) |
| Foreign Born, Citizen | 27,829 (97.9%) | 609 (2.1%) |
| Foreign Born, not a Citizen | 10,062 (95.8%) | 439 (4.2%) |
Health Insurance Coverage by Household Income in Naperville
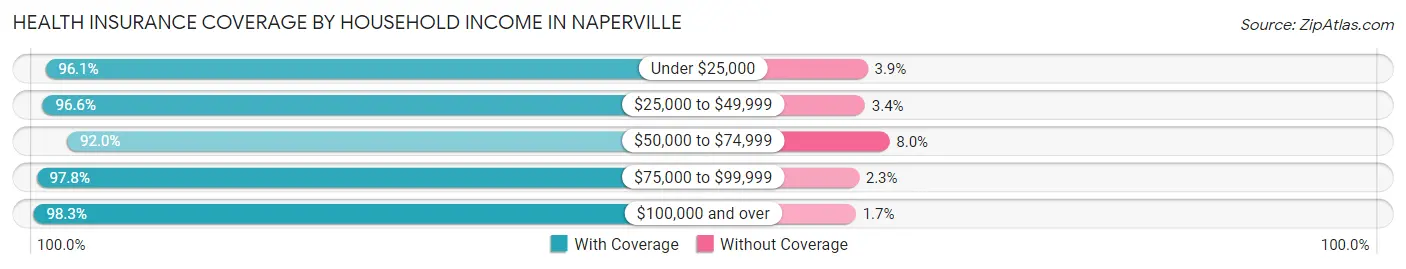
| Household Income | With Coverage | Without Coverage |
| Under $25,000 | 5,778 (96.1%) | 233 (3.9%) |
| $25,000 to $49,999 | 7,778 (96.6%) | 272 (3.4%) |
| $50,000 to $74,999 | 9,260 (92.0%) | 802 (8.0%) |
| $75,000 to $99,999 | 11,031 (97.8%) | 254 (2.2%) |
| $100,000 and over | 109,382 (98.3%) | 1,862 (1.7%) |
Public vs Private Health Insurance Coverage by Age in Naperville
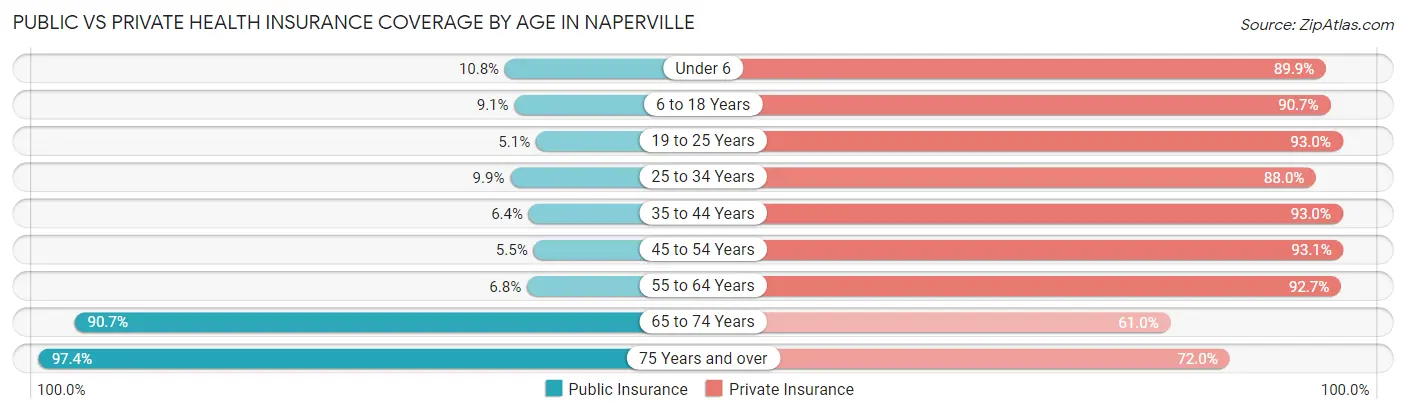
| Age Bracket | Public Insurance | Private Insurance |
| Under 6 | 1,135 (10.8%) | 9,411 (89.9%) |
| 6 to 18 Years | 2,586 (9.1%) | 25,784 (90.7%) |
| 19 to 25 Years | 533 (5.1%) | 9,762 (93.0%) |
| 25 to 34 Years | 1,517 (9.9%) | 13,550 (88.0%) |
| 35 to 44 Years | 1,374 (6.4%) | 19,905 (93.0%) |
| 45 to 54 Years | 1,208 (5.5%) | 20,296 (93.1%) |
| 55 to 64 Years | 1,355 (6.8%) | 18,608 (92.7%) |
| 65 to 74 Years | 11,256 (90.7%) | 7,568 (61.0%) |
| 75 Years and over | 7,149 (97.4%) | 5,284 (72.0%) |
| Total | 28,113 (19.0%) | 130,168 (88.1%) |
Disability Status by Sex by Age in Naperville
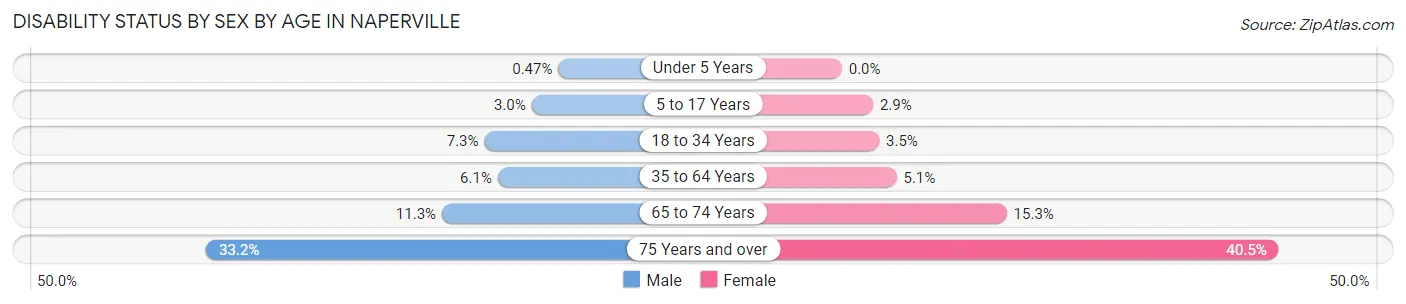
| Age Bracket | Male | Female |
| Under 5 Years | 21 (0.5%) | 0 (0.0%) |
| 5 to 17 Years | 433 (2.9%) | 392 (2.9%) |
| 18 to 34 Years | 1,011 (7.3%) | 484 (3.5%) |
| 35 to 64 Years | 1,926 (6.1%) | 1,607 (5.1%) |
| 65 to 74 Years | 679 (11.3%) | 976 (15.3%) |
| 75 Years and over | 952 (33.2%) | 1,812 (40.5%) |
Disability Class by Sex by Age in Naperville
Disability Class: Hearing Difficulty
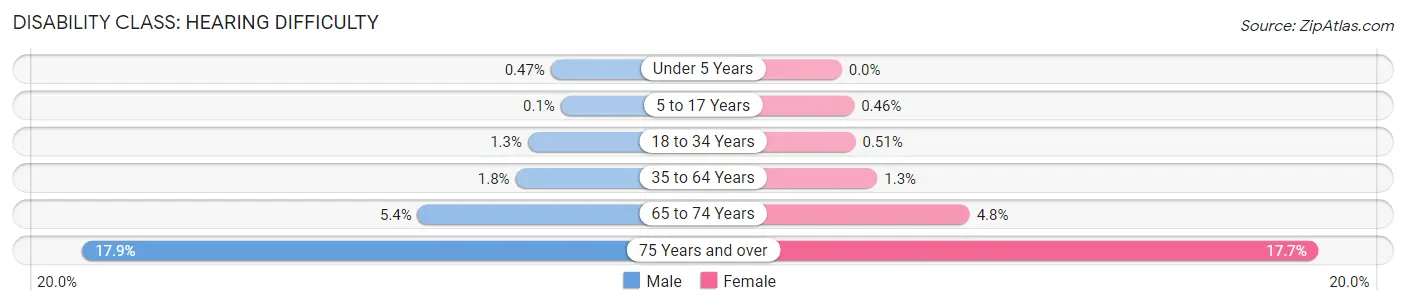
| Age Bracket | Male | Female |
| Under 5 Years | 21 (0.5%) | 0 (0.0%) |
| 5 to 17 Years | 14 (0.1%) | 63 (0.5%) |
| 18 to 34 Years | 182 (1.3%) | 71 (0.5%) |
| 35 to 64 Years | 562 (1.8%) | 417 (1.3%) |
| 65 to 74 Years | 326 (5.4%) | 303 (4.8%) |
| 75 Years and over | 513 (17.9%) | 791 (17.7%) |
Disability Class: Vision Difficulty
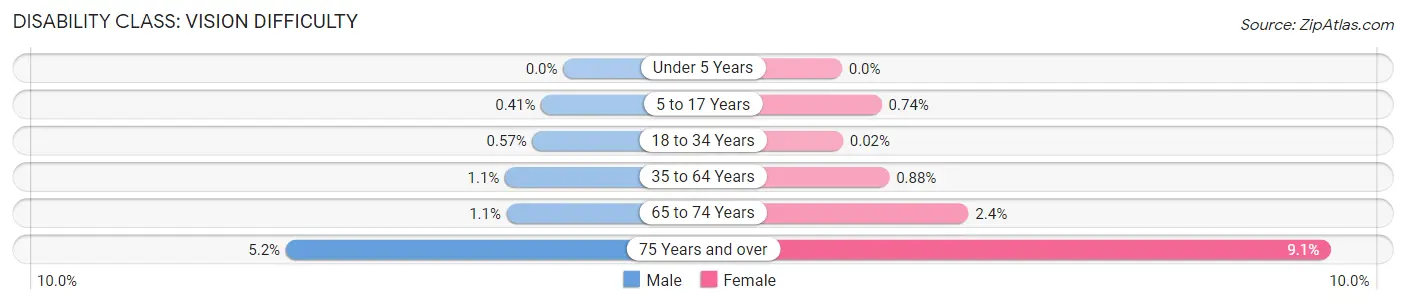
| Age Bracket | Male | Female |
| Under 5 Years | 0 (0.0%) | 0 (0.0%) |
| 5 to 17 Years | 60 (0.4%) | 100 (0.7%) |
| 18 to 34 Years | 79 (0.6%) | 3 (0.0%) |
| 35 to 64 Years | 341 (1.1%) | 278 (0.9%) |
| 65 to 74 Years | 63 (1.1%) | 150 (2.4%) |
| 75 Years and over | 148 (5.1%) | 406 (9.1%) |
Disability Class: Cognitive Difficulty
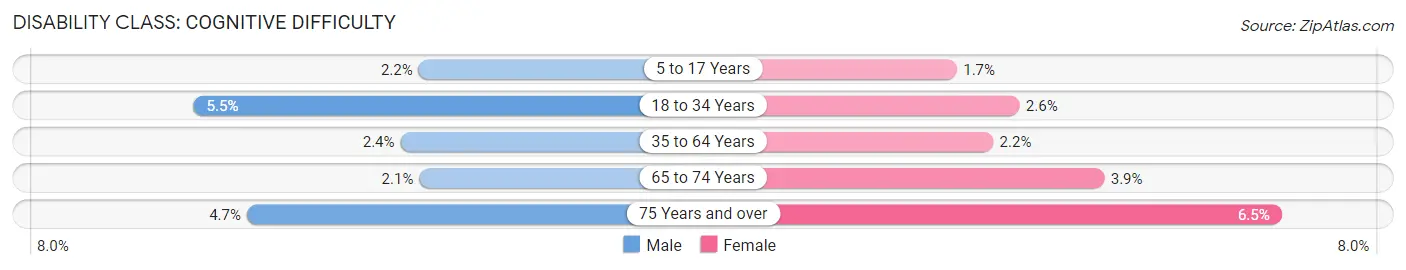
| Age Bracket | Male | Female |
| 5 to 17 Years | 315 (2.1%) | 231 (1.7%) |
| 18 to 34 Years | 758 (5.5%) | 368 (2.6%) |
| 35 to 64 Years | 766 (2.4%) | 709 (2.2%) |
| 65 to 74 Years | 129 (2.1%) | 248 (3.9%) |
| 75 Years and over | 135 (4.7%) | 292 (6.5%) |
Disability Class: Ambulatory Difficulty
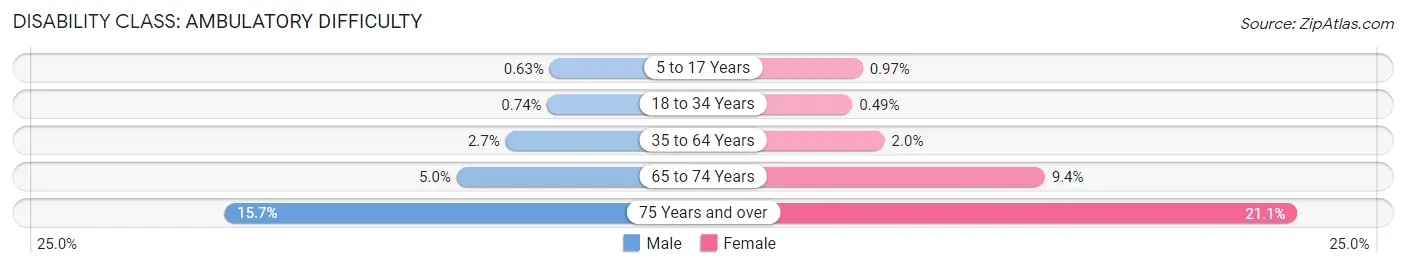
| Age Bracket | Male | Female |
| 5 to 17 Years | 92 (0.6%) | 132 (1.0%) |
| 18 to 34 Years | 102 (0.7%) | 69 (0.5%) |
| 35 to 64 Years | 849 (2.7%) | 631 (2.0%) |
| 65 to 74 Years | 298 (5.0%) | 601 (9.4%) |
| 75 Years and over | 452 (15.7%) | 945 (21.1%) |
Disability Class: Self-Care Difficulty
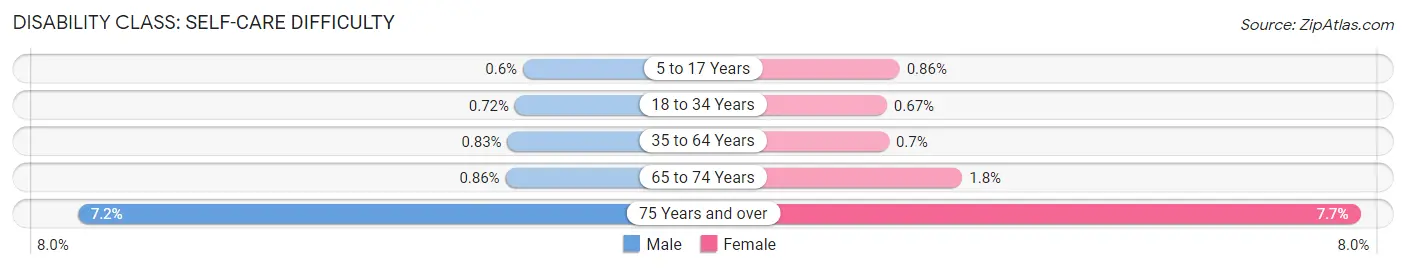
| Age Bracket | Male | Female |
| 5 to 17 Years | 88 (0.6%) | 117 (0.9%) |
| 18 to 34 Years | 100 (0.7%) | 94 (0.7%) |
| 35 to 64 Years | 263 (0.8%) | 223 (0.7%) |
| 65 to 74 Years | 52 (0.9%) | 114 (1.8%) |
| 75 Years and over | 207 (7.2%) | 344 (7.7%) |
Technology Access in Naperville
Computing Device Access in Naperville
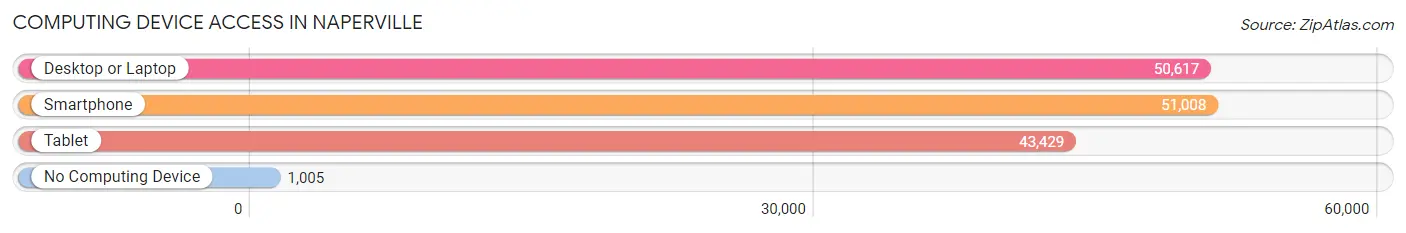
| Device Type | # Households | % Households |
| Desktop or Laptop | 50,617 | 94.1% |
| Smartphone | 51,008 | 94.8% |
| Tablet | 43,429 | 80.7% |
| No Computing Device | 1,005 | 1.9% |
| Total | 53,815 | 100.0% |
Internet Access in Naperville
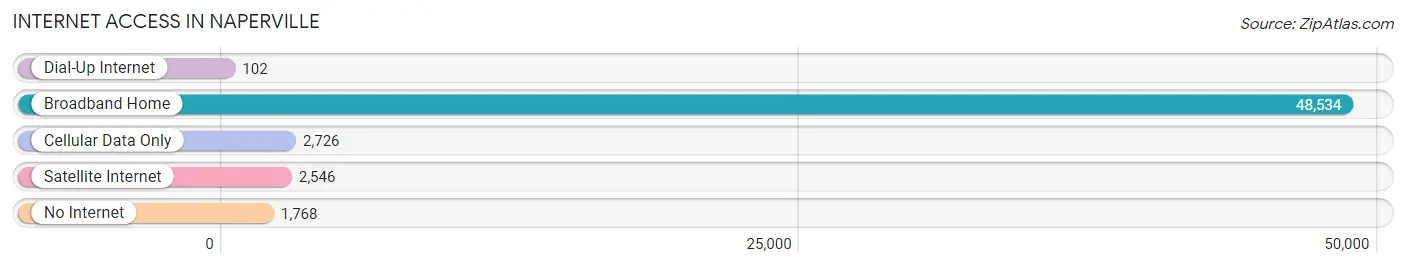
| Internet Type | # Households | % Households |
| Dial-Up Internet | 102 | 0.2% |
| Broadband Home | 48,534 | 90.2% |
| Cellular Data Only | 2,726 | 5.1% |
| Satellite Internet | 2,546 | 4.7% |
| No Internet | 1,768 | 3.3% |
| Total | 53,815 | 100.0% |
Naperville Summary
Naperville, Illinois is a city located in DuPage and Will counties in the state of Illinois. It is the fifth-largest city in the state and the largest in DuPage County. Naperville is located 28 miles west of Chicago and is part of the Chicago metropolitan area. The city has a population of over 145,000 people and is known for its excellent schools, low crime rate, and high quality of life.
History
Naperville was founded in 1831 by Captain Joseph Naper, a settler from the East Coast. Naper had been a captain in the Black Hawk War and was looking for a place to settle down. He chose the area that is now Naperville because of its proximity to the DuPage River and the fertile soil. Naper and his family built a cabin and began farming the land.
The city was officially incorporated in 1857 and was named after Naper. The city grew rapidly in the late 19th century, becoming a major center for manufacturing and industry. The city was also home to several large companies, including the Quaker Oats Company and the Naper Carriage Company.
Geography
Naperville is located in northeastern Illinois, 28 miles west of Chicago. The city is situated on the DuPage River and is surrounded by several small towns and villages. The city is located in both DuPage and Will counties and is part of the Chicago metropolitan area.
The city has a total area of 39.4 square miles, of which 37.2 square miles is land and 2.2 square miles is water. The city is located at an elevation of 690 feet above sea level.
Economy
Naperville has a strong and diverse economy. The city is home to several large companies, including Nicor Gas, Nalco, and Tellabs. The city is also home to several major retail centers, including the Fox Valley Mall and the Naperville Crossing Shopping Center.
The city is also home to several major educational institutions, including North Central College, the University of Illinois at Chicago, and the College of DuPage. The city is also home to several major healthcare providers, including Edward Hospital and Rush Copley Medical Center.
Demographics
As of the 2010 census, Naperville had a population of 145,094 people. The racial makeup of the city was 79.2% White, 5.3% African American, 0.3% Native American, 8.2% Asian, 0.1% Pacific Islander, 4.2% from other races, and 2.7% from two or more races. Hispanic or Latino of any race were 11.3% of the population.
The median income for a household in the city was $97,817, and the median income for a family was $118,847. The per capita income for the city was $45,936. About 3.2% of families and 4.9% of the population were below the poverty line, including 5.1% of those under age 18 and 4.0% of those age 65 or over.
Naperville is a vibrant and diverse city with a strong economy and excellent quality of life. The city is home to several major companies, educational institutions, and healthcare providers, and is a popular destination for tourists and residents alike.
Common Questions
What is Per Capita Income in Naperville?
Per Capita income in Naperville is $67,706.
What is the Median Family Income in Naperville?
Median Family Income in Naperville is $170,228.
What is the Median Household income in Naperville?
Median Household Income in Naperville is $143,754.
What is Income or Wage Gap in Naperville?
Income or Wage Gap in Naperville is 46.7%.
Women in Naperville earn 53.3 cents for every dollar earned by a man.
What is Family Income Deficit in Naperville?
Family Income Deficit in Naperville is $11,506.
Families that are below poverty line in Naperville earn $11,506 less on average than the poverty threshold level.
What is Inequality or Gini Index in Naperville?
Inequality or Gini Index in Naperville is 0.44.
What is the Total Population of Naperville?
Total Population of Naperville is 149,089.
What is the Total Male Population of Naperville?
Total Male Population of Naperville is 73,888.
What is the Total Female Population of Naperville?
Total Female Population of Naperville is 75,201.
What is the Ratio of Males per 100 Females in Naperville?
There are 98.25 Males per 100 Females in Naperville.
What is the Ratio of Females per 100 Males in Naperville?
There are 101.78 Females per 100 Males in Naperville.
What is the Median Population Age in Naperville?
Median Population Age in Naperville is 39.5 Years.
What is the Average Family Size in Naperville
Average Family Size in Naperville is 3.2 People.
What is the Average Household Size in Naperville
Average Household Size in Naperville is 2.7 People.
How Large is the Labor Force in Naperville?
There are 80,320 People in the Labor Forcein in Naperville.
What is the Percentage of People in the Labor Force in Naperville?
68.6% of People are in the Labor Force in Naperville.
What is the Unemployment Rate in Naperville?
Unemployment Rate in Naperville is 4.5%.