Arlington Heights, IL Map & Demographics
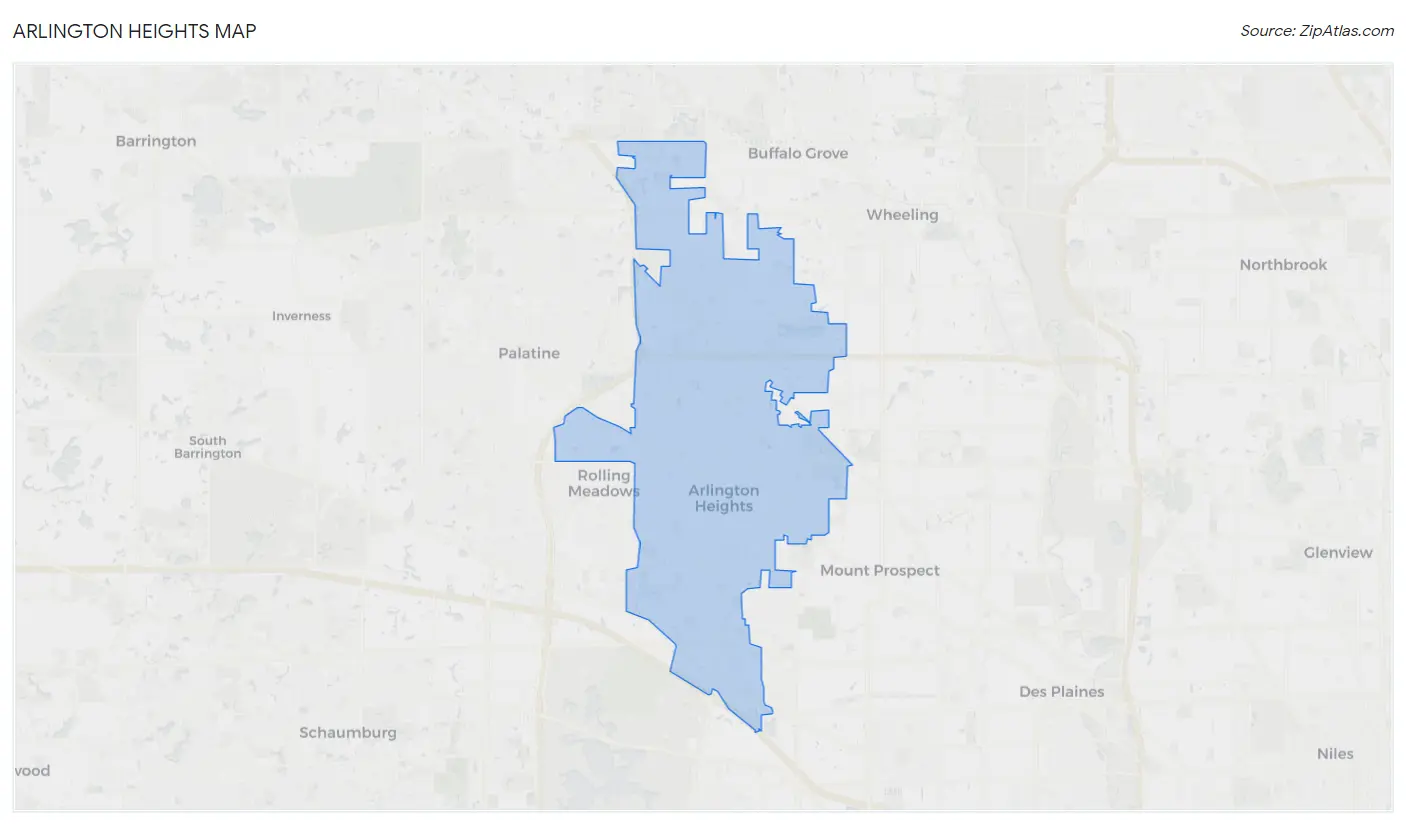
Arlington Heights Map
Arlington Heights Overview
$58,712
PER CAPITA INCOME
$143,272
AVG FAMILY INCOME
$113,502
AVG HOUSEHOLD INCOME
26.0%
WAGE / INCOME GAP [ % ]
74.0¢/ $1
WAGE / INCOME GAP [ $ ]
0.44
INEQUALITY / GINI INDEX
76,794
TOTAL POPULATION
38,076
MALE POPULATION
38,718
FEMALE POPULATION
98.34
MALES / 100 FEMALES
101.69
FEMALES / 100 MALES
42.8
MEDIAN AGE
3.0
AVG FAMILY SIZE
2.4
AVG HOUSEHOLD SIZE
41,203
LABOR FORCE [ PEOPLE ]
67.5%
PERCENT IN LABOR FORCE
3.5%
UNEMPLOYMENT RATE
Income in Arlington Heights
Income Overview in Arlington Heights
Per Capita Income in Arlington Heights is $58,712, while median incomes of families and households are $143,272 and $113,502 respectively.
| Characteristic | Number | Measure |
| Per Capita Income | 76,794 | $58,712 |
| Median Family Income | 20,627 | $143,272 |
| Mean Family Income | 20,627 | $173,434 |
| Median Household Income | 31,683 | $113,502 |
| Mean Household Income | 31,683 | $141,173 |
| Income Deficit | 20,627 | $0 |
| Wage / Income Gap (%) | 76,794 | 26.03% |
| Wage / Income Gap ($) | 76,794 | 73.97¢ per $1 |
| Gini / Inequality Index | 76,794 | 0.44 |
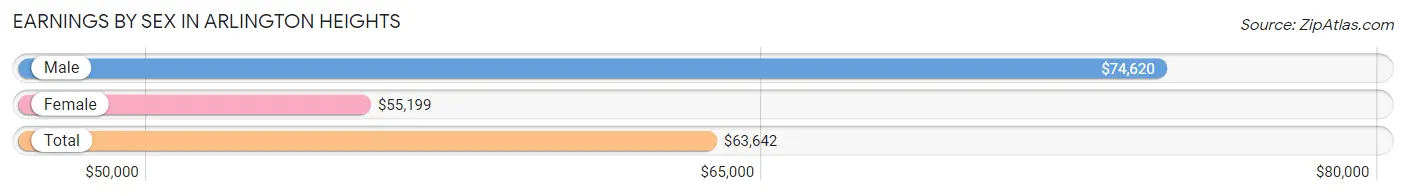
Earnings by Sex in Arlington Heights
Average Earnings in Arlington Heights are $63,642, $74,620 for men and $55,199 for women, a difference of 26.0%.
| Sex | Number | Average Earnings |
| Male | 23,325 (54.2%) | $74,620 |
| Female | 19,703 (45.8%) | $55,199 |
| Total | 43,028 (100.0%) | $63,642 |
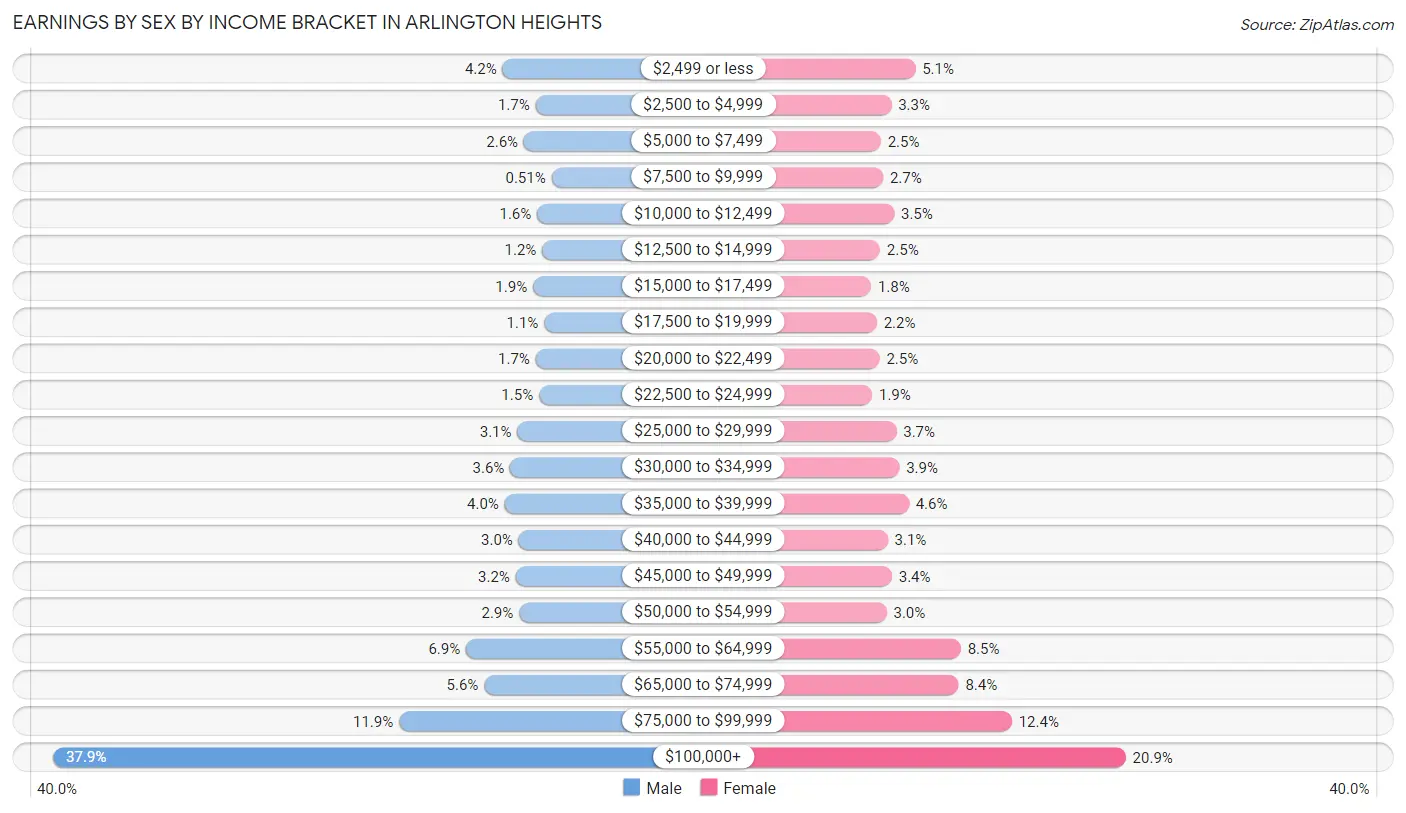
Earnings by Sex by Income Bracket in Arlington Heights
The most common earnings brackets in Arlington Heights are $100,000+ for men (8,833 | 37.9%) and $100,000+ for women (4,118 | 20.9%).
| Income | Male | Female |
| $2,499 or less | 975 (4.2%) | 1,011 (5.1%) |
| $2,500 to $4,999 | 400 (1.7%) | 657 (3.3%) |
| $5,000 to $7,499 | 602 (2.6%) | 500 (2.5%) |
| $7,500 to $9,999 | 119 (0.5%) | 534 (2.7%) |
| $10,000 to $12,499 | 371 (1.6%) | 697 (3.5%) |
| $12,500 to $14,999 | 283 (1.2%) | 489 (2.5%) |
| $15,000 to $17,499 | 443 (1.9%) | 357 (1.8%) |
| $17,500 to $19,999 | 248 (1.1%) | 442 (2.2%) |
| $20,000 to $22,499 | 396 (1.7%) | 483 (2.5%) |
| $22,500 to $24,999 | 339 (1.5%) | 372 (1.9%) |
| $25,000 to $29,999 | 715 (3.1%) | 731 (3.7%) |
| $30,000 to $34,999 | 843 (3.6%) | 775 (3.9%) |
| $35,000 to $39,999 | 938 (4.0%) | 914 (4.6%) |
| $40,000 to $44,999 | 692 (3.0%) | 603 (3.1%) |
| $45,000 to $49,999 | 747 (3.2%) | 664 (3.4%) |
| $50,000 to $54,999 | 686 (2.9%) | 588 (3.0%) |
| $55,000 to $64,999 | 1,613 (6.9%) | 1,683 (8.5%) |
| $65,000 to $74,999 | 1,296 (5.6%) | 1,649 (8.4%) |
| $75,000 to $99,999 | 2,786 (11.9%) | 2,436 (12.4%) |
| $100,000+ | 8,833 (37.9%) | 4,118 (20.9%) |
| Total | 23,325 (100.0%) | 19,703 (100.0%) |
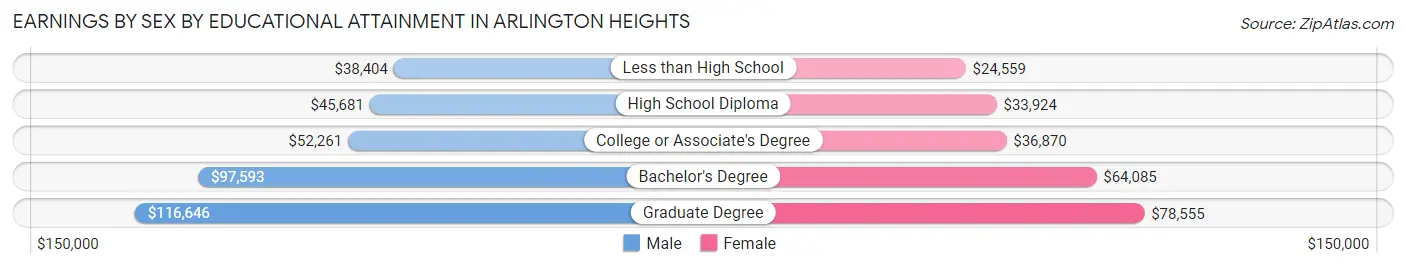
Earnings by Sex by Educational Attainment in Arlington Heights
Average earnings in Arlington Heights are $84,691 for men and $58,386 for women, a difference of 31.1%. Men with an educational attainment of graduate degree enjoy the highest average annual earnings of $116,646, while those with less than high school education earn the least with $38,404. Women with an educational attainment of graduate degree earn the most with the average annual earnings of $78,555, while those with less than high school education have the smallest earnings of $24,559.
| Educational Attainment | Male Income | Female Income |
| Less than High School | $38,404 | $24,559 |
| High School Diploma | $45,681 | $33,924 |
| College or Associate's Degree | $52,261 | $36,870 |
| Bachelor's Degree | $97,593 | $64,085 |
| Graduate Degree | $116,646 | $78,555 |
| Total | $84,691 | $58,386 |
Family Income in Arlington Heights
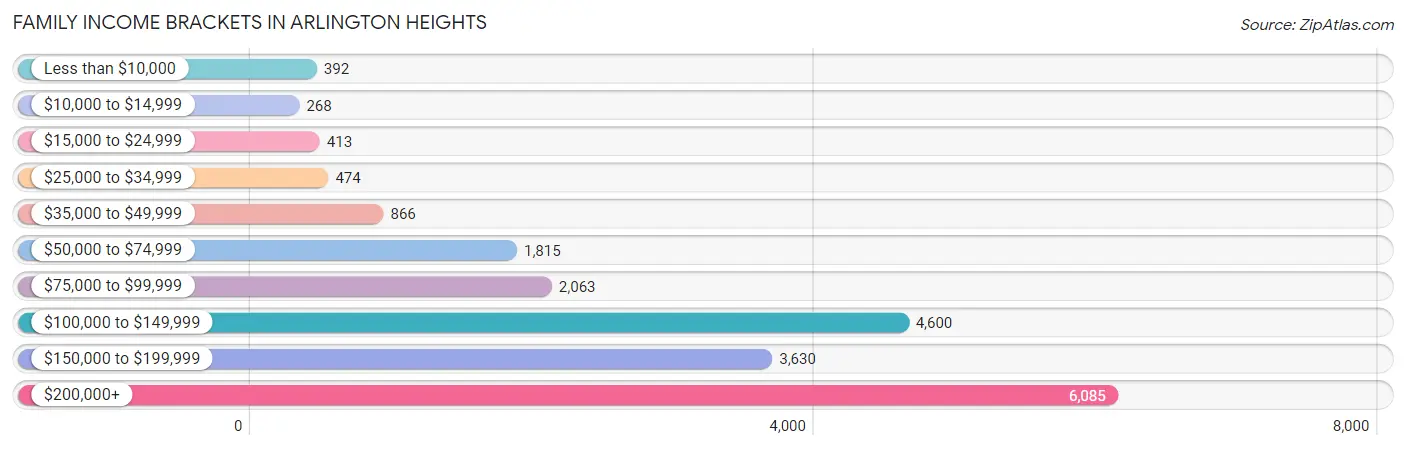
Family Income Brackets in Arlington Heights
According to the Arlington Heights family income data, there are 6,085 families falling into the $200,000+ income range, which is the most common income bracket and makes up 29.5% of all families. Conversely, the $10,000 to $14,999 income bracket is the least frequent group with only 268 families (1.3%) belonging to this category.
| Income Bracket | # Families | % Families |
| Less than $10,000 | 392 | 1.9% |
| $10,000 to $14,999 | 268 | 1.3% |
| $15,000 to $24,999 | 413 | 2.0% |
| $25,000 to $34,999 | 474 | 2.3% |
| $35,000 to $49,999 | 866 | 4.2% |
| $50,000 to $74,999 | 1,815 | 8.8% |
| $75,000 to $99,999 | 2,063 | 10.0% |
| $100,000 to $149,999 | 4,600 | 22.3% |
| $150,000 to $199,999 | 3,630 | 17.6% |
| $200,000+ | 6,085 | 29.5% |
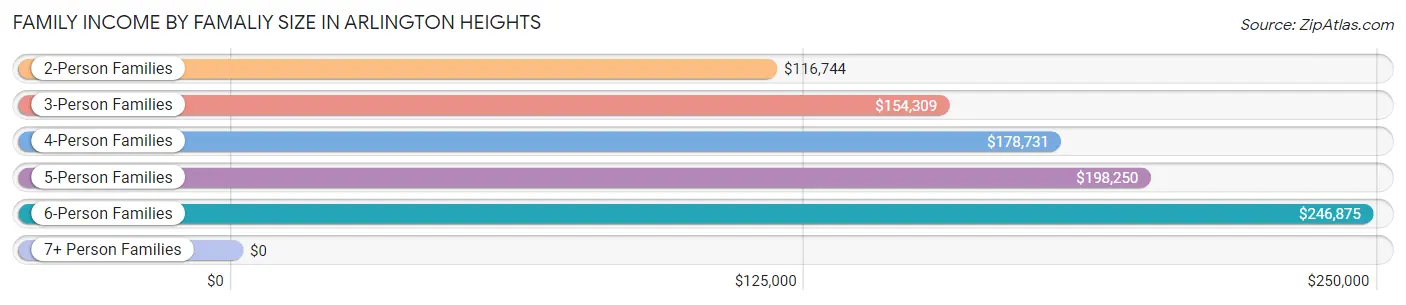
Family Income by Famaliy Size in Arlington Heights
6-person families (291 | 1.4%) account for the highest median family income in Arlington Heights with $246,875 per family, while 2-person families (9,469 | 45.9%) have the highest median income of $58,372 per family member.
| Income Bracket | # Families | Median Income |
| 2-Person Families | 9,469 (45.9%) | $116,744 |
| 3-Person Families | 4,467 (21.7%) | $154,309 |
| 4-Person Families | 4,591 (22.3%) | $178,731 |
| 5-Person Families | 1,785 (8.6%) | $198,250 |
| 6-Person Families | 291 (1.4%) | $246,875 |
| 7+ Person Families | 24 (0.1%) | $0 |
| Total | 20,627 (100.0%) | $143,272 |
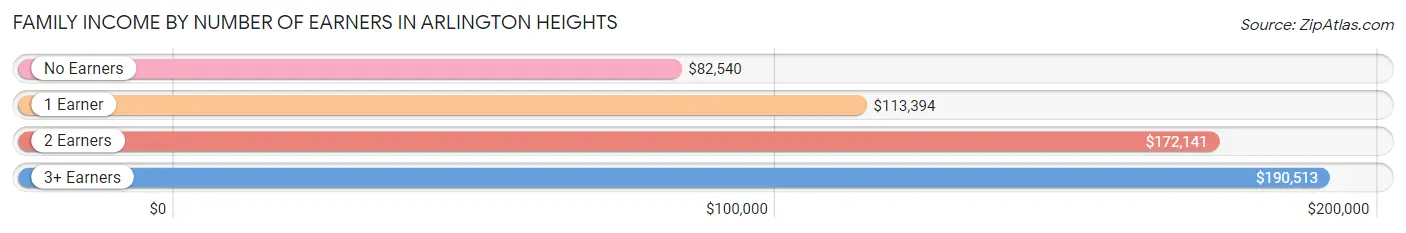
Family Income by Number of Earners in Arlington Heights
The median family income in Arlington Heights is $143,272, with families comprising 3+ earners (2,622) having the highest median family income of $190,513, while families with no earners (2,726) have the lowest median family income of $82,540, accounting for 12.7% and 13.2% of families, respectively.
| Number of Earners | # Families | Median Income |
| No Earners | 2,726 (13.2%) | $82,540 |
| 1 Earner | 5,486 (26.6%) | $113,394 |
| 2 Earners | 9,793 (47.5%) | $172,141 |
| 3+ Earners | 2,622 (12.7%) | $190,513 |
| Total | 20,627 (100.0%) | $143,272 |
Household Income in Arlington Heights
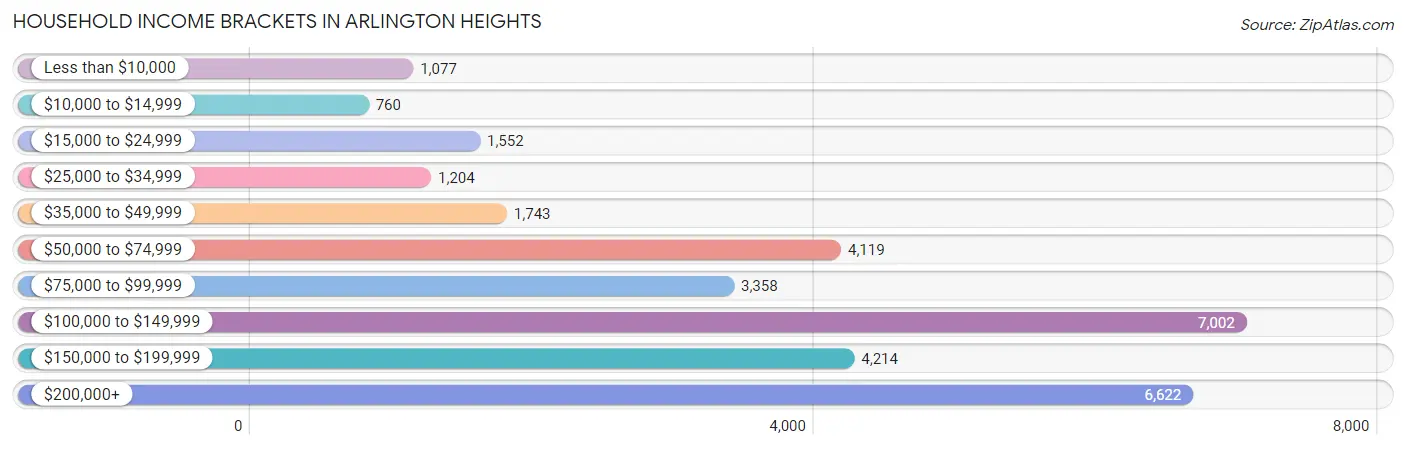
Household Income Brackets in Arlington Heights
With 7,002 households falling in the category, the $100,000 to $149,999 income range is the most frequent in Arlington Heights, accounting for 22.1% of all households. In contrast, only 760 households (2.4%) fall into the $10,000 to $14,999 income bracket, making it the least populous group.
| Income Bracket | # Households | % Households |
| Less than $10,000 | 1,077 | 3.4% |
| $10,000 to $14,999 | 760 | 2.4% |
| $15,000 to $24,999 | 1,552 | 4.9% |
| $25,000 to $34,999 | 1,204 | 3.8% |
| $35,000 to $49,999 | 1,743 | 5.5% |
| $50,000 to $74,999 | 4,119 | 13.0% |
| $75,000 to $99,999 | 3,358 | 10.6% |
| $100,000 to $149,999 | 7,002 | 22.1% |
| $150,000 to $199,999 | 4,214 | 13.3% |
| $200,000+ | 6,622 | 20.9% |
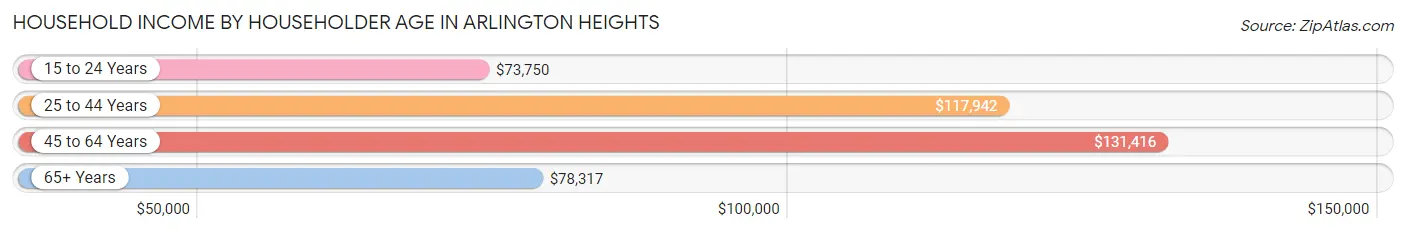
Household Income by Householder Age in Arlington Heights
The median household income in Arlington Heights is $113,502, with the highest median household income of $131,416 found in the 45 to 64 years age bracket for the primary householder. A total of 11,718 households (37.0%) fall into this category. Meanwhile, the 15 to 24 years age bracket for the primary householder has the lowest median household income of $73,750, with 282 households (0.9%) in this group.
| Income Bracket | # Households | Median Income |
| 15 to 24 Years | 282 (0.9%) | $73,750 |
| 25 to 44 Years | 9,929 (31.3%) | $117,942 |
| 45 to 64 Years | 11,718 (37.0%) | $131,416 |
| 65+ Years | 9,754 (30.8%) | $78,317 |
| Total | 31,683 (100.0%) | $113,502 |
Poverty in Arlington Heights
Income Below Poverty by Sex and Age in Arlington Heights
With 4.7% poverty level for males and 6.8% for females among the residents of Arlington Heights, 75 year old and over males and 75 year old and over females are the most vulnerable to poverty, with 273 males (9.9%) and 574 females (14.2%) in their respective age groups living below the poverty level.
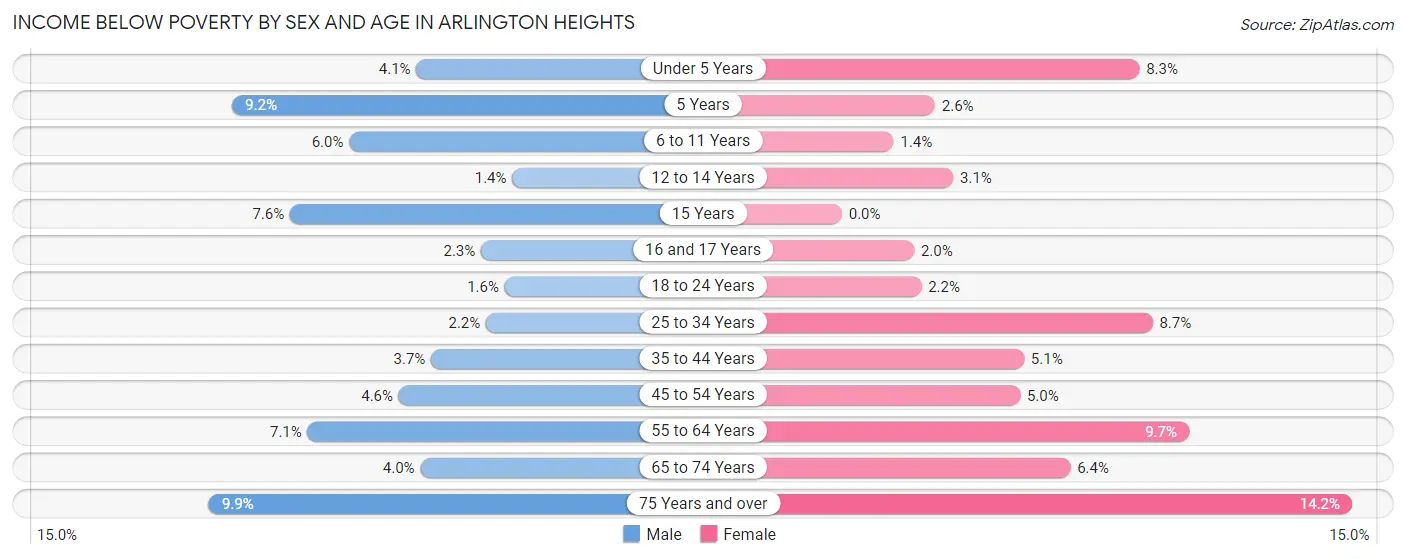
| Age Bracket | Male | Female |
| Under 5 Years | 109 (4.1%) | 200 (8.3%) |
| 5 Years | 52 (9.2%) | 13 (2.6%) |
| 6 to 11 Years | 149 (6.0%) | 41 (1.4%) |
| 12 to 14 Years | 21 (1.4%) | 48 (3.1%) |
| 15 Years | 49 (7.6%) | 0 (0.0%) |
| 16 and 17 Years | 22 (2.3%) | 14 (2.0%) |
| 18 to 24 Years | 32 (1.6%) | 35 (2.2%) |
| 25 to 34 Years | 91 (2.1%) | 377 (8.6%) |
| 35 to 44 Years | 206 (3.7%) | 275 (5.1%) |
| 45 to 54 Years | 249 (4.6%) | 250 (5.0%) |
| 55 to 64 Years | 378 (7.1%) | 504 (9.7%) |
| 65 to 74 Years | 150 (4.0%) | 263 (6.4%) |
| 75 Years and over | 273 (9.9%) | 574 (14.2%) |
| Total | 1,781 (4.7%) | 2,594 (6.8%) |
Income Above Poverty by Sex and Age in Arlington Heights
According to the poverty statistics in Arlington Heights, males aged 12 to 14 years and females aged 15 years are the age groups that are most secure financially, with 98.6% of males and 100.0% of females in these age groups living above the poverty line.
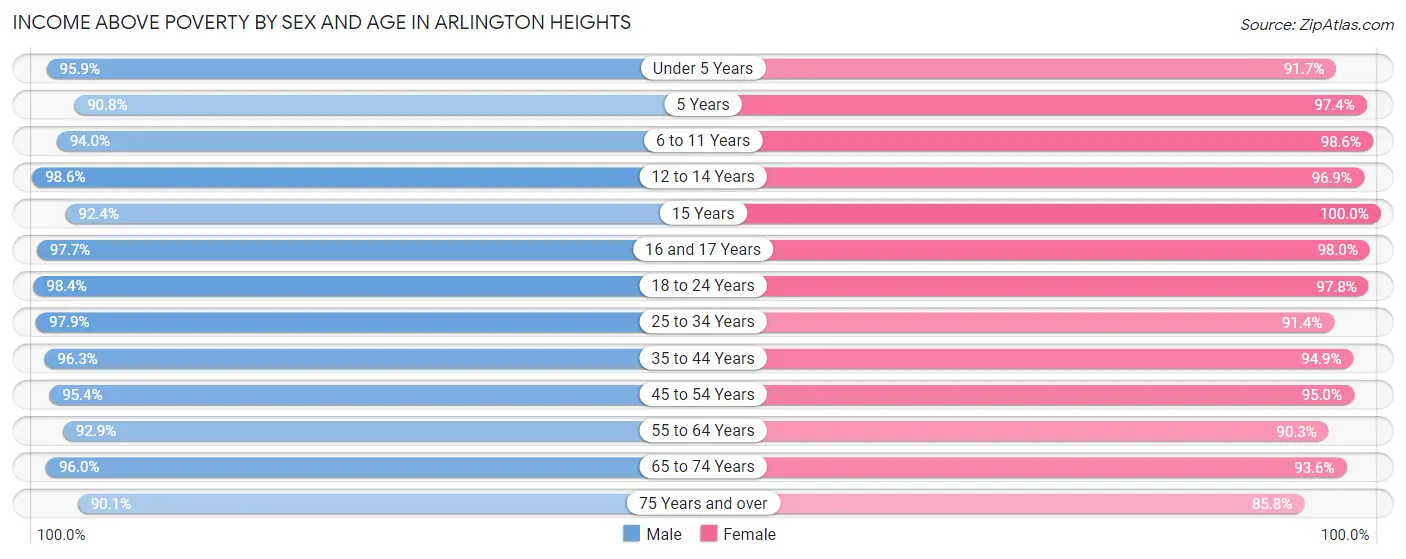
| Age Bracket | Male | Female |
| Under 5 Years | 2,557 (95.9%) | 2,216 (91.7%) |
| 5 Years | 512 (90.8%) | 488 (97.4%) |
| 6 to 11 Years | 2,350 (94.0%) | 2,806 (98.6%) |
| 12 to 14 Years | 1,458 (98.6%) | 1,498 (96.9%) |
| 15 Years | 595 (92.4%) | 555 (100.0%) |
| 16 and 17 Years | 940 (97.7%) | 683 (98.0%) |
| 18 to 24 Years | 1,935 (98.4%) | 1,547 (97.8%) |
| 25 to 34 Years | 4,146 (97.9%) | 3,979 (91.3%) |
| 35 to 44 Years | 5,397 (96.3%) | 5,153 (94.9%) |
| 45 to 54 Years | 5,189 (95.4%) | 4,788 (95.0%) |
| 55 to 64 Years | 4,931 (92.9%) | 4,716 (90.3%) |
| 65 to 74 Years | 3,622 (96.0%) | 3,870 (93.6%) |
| 75 Years and over | 2,493 (90.1%) | 3,469 (85.8%) |
| Total | 36,125 (95.3%) | 35,768 (93.2%) |
Income Below Poverty Among Married-Couple Families in Arlington Heights
The poverty statistics for married-couple families in Arlington Heights show that 4.0% or 708 of the total 17,720 families live below the poverty line. Families with no children have the highest poverty rate of 4.8%, comprising of 487 families. On the other hand, families with 5 or more children have the lowest poverty rate of 0.0%, which includes 0 families.
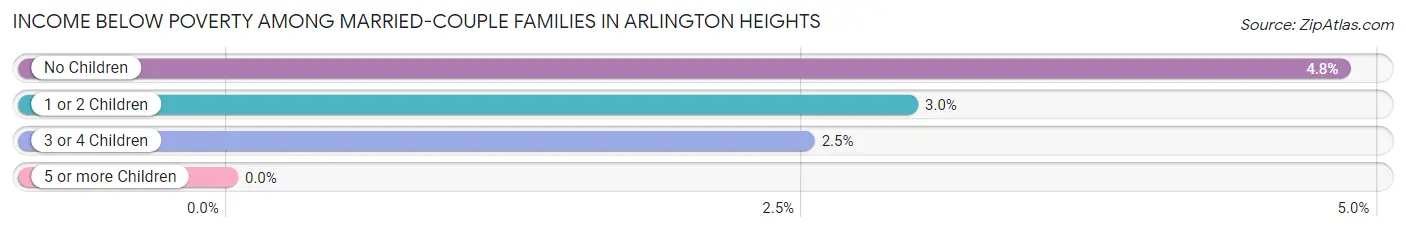
| Children | Above Poverty | Below Poverty |
| No Children | 9,575 (95.2%) | 487 (4.8%) |
| 1 or 2 Children | 6,267 (97.0%) | 191 (3.0%) |
| 3 or 4 Children | 1,166 (97.5%) | 30 (2.5%) |
| 5 or more Children | 4 (100.0%) | 0 (0.0%) |
| Total | 17,012 (96.0%) | 708 (4.0%) |
Income Below Poverty Among Single-Parent Households in Arlington Heights
According to the poverty data in Arlington Heights, 3.6% or 36 single-father households and 10.5% or 201 single-mother households are living below the poverty line. Among single-father households, those with no children have the highest poverty rate, with 36 households (6.2%) experiencing poverty. Likewise, among single-mother households, those with 1 or 2 children have the highest poverty rate, with 184 households (24.0%) falling below the poverty line.
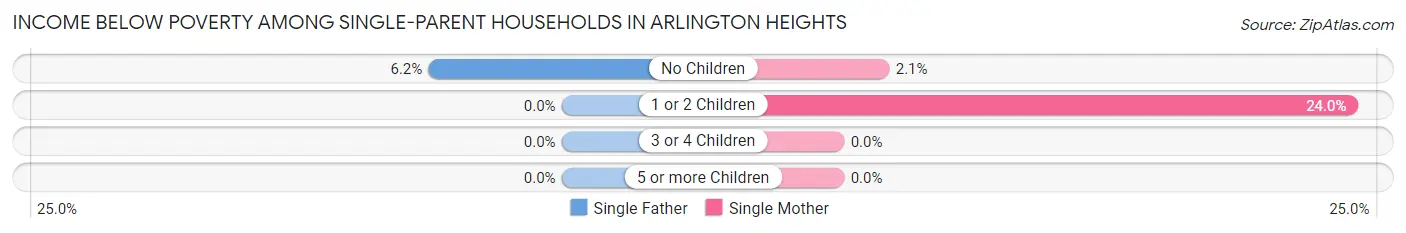
| Children | Single Father | Single Mother |
| No Children | 36 (6.2%) | 17 (2.1%) |
| 1 or 2 Children | 0 (0.0%) | 184 (24.0%) |
| 3 or 4 Children | 0 (0.0%) | 0 (0.0%) |
| 5 or more Children | 0 (0.0%) | 0 (0.0%) |
| Total | 36 (3.6%) | 201 (10.5%) |
Income Below Poverty Among Married-Couple vs Single-Parent Households in Arlington Heights
The poverty data for Arlington Heights shows that 708 of the married-couple family households (4.0%) and 237 of the single-parent households (8.2%) are living below the poverty level. Within the married-couple family households, those with no children have the highest poverty rate, with 487 households (4.8%) falling below the poverty line. Among the single-parent households, those with 1 or 2 children have the highest poverty rate, with 184 household (15.6%) living below poverty.
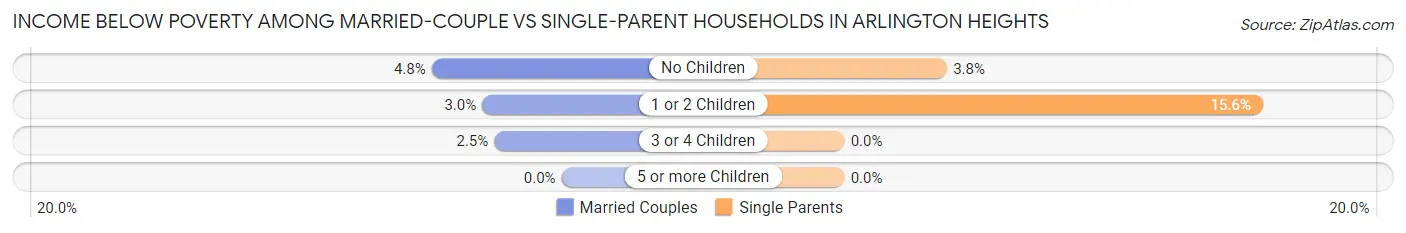
| Children | Married-Couple Families | Single-Parent Households |
| No Children | 487 (4.8%) | 53 (3.8%) |
| 1 or 2 Children | 191 (3.0%) | 184 (15.6%) |
| 3 or 4 Children | 30 (2.5%) | 0 (0.0%) |
| 5 or more Children | 0 (0.0%) | 0 (0.0%) |
| Total | 708 (4.0%) | 237 (8.2%) |
Race in Arlington Heights
The most populous races in Arlington Heights are White / Caucasian (59,279 | 77.2%), Asian (8,505 | 11.1%), and Hispanic or Latino (6,807 | 8.9%).
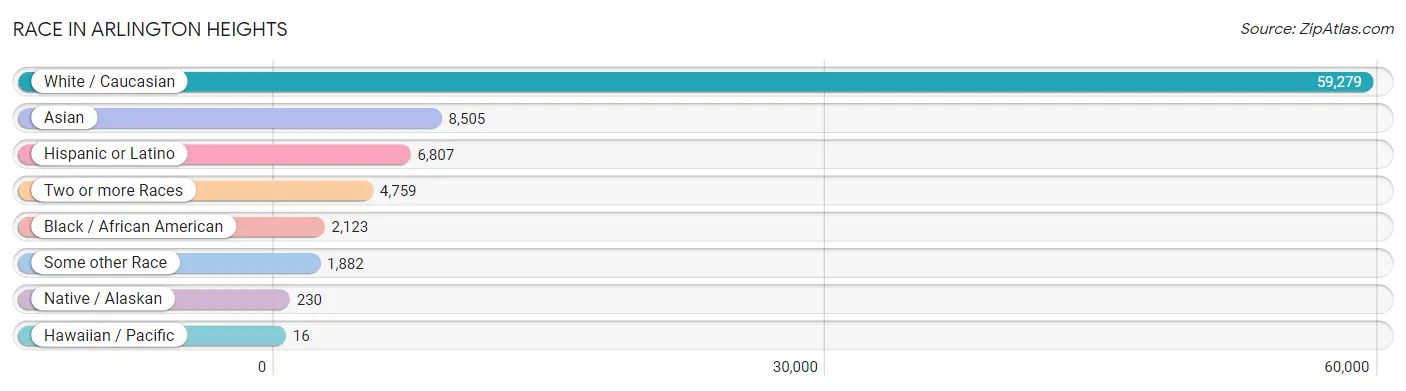
| Race | # Population | % Population |
| Asian | 8,505 | 11.1% |
| Black / African American | 2,123 | 2.8% |
| Hawaiian / Pacific | 16 | 0.0% |
| Hispanic or Latino | 6,807 | 8.9% |
| Native / Alaskan | 230 | 0.3% |
| White / Caucasian | 59,279 | 77.2% |
| Two or more Races | 4,759 | 6.2% |
| Some other Race | 1,882 | 2.5% |
| Total | 76,794 | 100.0% |
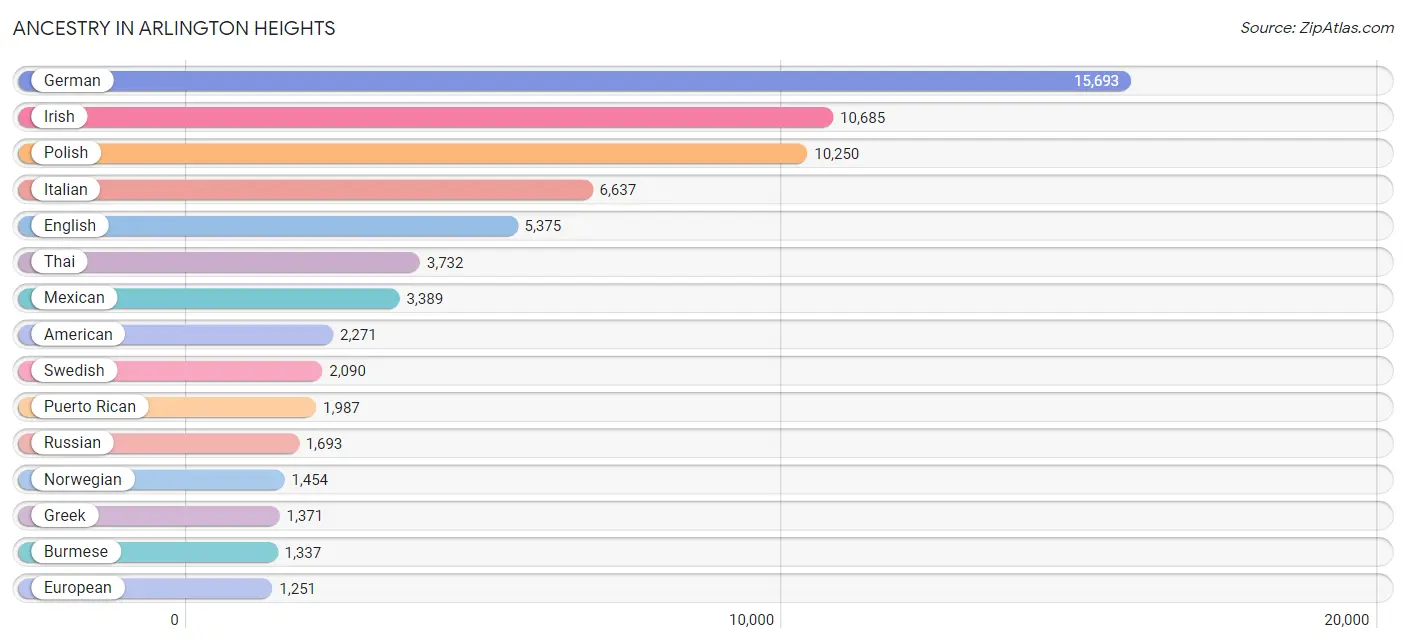
Ancestry in Arlington Heights
The most populous ancestries reported in Arlington Heights are German (15,693 | 20.4%), Irish (10,685 | 13.9%), Polish (10,250 | 13.4%), Italian (6,637 | 8.6%), and English (5,375 | 7.0%), together accounting for 63.3% of all Arlington Heights residents.
| Ancestry | # Population | % Population |
| African | 92 | 0.1% |
| Albanian | 501 | 0.6% |
| American | 2,271 | 3.0% |
| Arab | 531 | 0.7% |
| Argentinean | 110 | 0.1% |
| Armenian | 129 | 0.2% |
| Assyrian / Chaldean / Syriac | 218 | 0.3% |
| Austrian | 366 | 0.5% |
| Belgian | 108 | 0.1% |
| Belizean | 6 | 0.0% |
| Bhutanese | 891 | 1.2% |
| Bolivian | 10 | 0.0% |
| Brazilian | 70 | 0.1% |
| British | 526 | 0.7% |
| Bulgarian | 1,174 | 1.5% |
| Burmese | 1,337 | 1.7% |
| Cambodian | 139 | 0.2% |
| Canadian | 127 | 0.2% |
| Cape Verdean | 10 | 0.0% |
| Central American | 287 | 0.4% |
| Central American Indian | 16 | 0.0% |
| Cherokee | 24 | 0.0% |
| Chilean | 189 | 0.3% |
| Chippewa | 10 | 0.0% |
| Colombian | 5 | 0.0% |
| Creek | 5 | 0.0% |
| Croatian | 249 | 0.3% |
| Cuban | 221 | 0.3% |
| Czech | 532 | 0.7% |
| Czechoslovakian | 203 | 0.3% |
| Danish | 465 | 0.6% |
| Dominican | 43 | 0.1% |
| Dutch | 734 | 1.0% |
| Eastern European | 401 | 0.5% |
| Ecuadorian | 33 | 0.0% |
| Egyptian | 121 | 0.2% |
| English | 5,375 | 7.0% |
| European | 1,251 | 1.6% |
| Filipino | 69 | 0.1% |
| Finnish | 185 | 0.2% |
| French | 1,139 | 1.5% |
| French Canadian | 161 | 0.2% |
| German | 15,693 | 20.4% |
| Greek | 1,371 | 1.8% |
| Guamanian / Chamorro | 16 | 0.0% |
| Guatemalan | 210 | 0.3% |
| Haitian | 9 | 0.0% |
| Hungarian | 393 | 0.5% |
| Indian (Asian) | 1,079 | 1.4% |
| Iranian | 124 | 0.2% |
| Iraqi | 29 | 0.0% |
| Irish | 10,685 | 13.9% |
| Israeli | 10 | 0.0% |
| Italian | 6,637 | 8.6% |
| Jamaican | 115 | 0.2% |
| Japanese | 7 | 0.0% |
| Korean | 1,249 | 1.6% |
| Laotian | 32 | 0.0% |
| Latvian | 6 | 0.0% |
| Lebanese | 34 | 0.0% |
| Lithuanian | 557 | 0.7% |
| Luxembourger | 207 | 0.3% |
| Macedonian | 16 | 0.0% |
| Maltese | 9 | 0.0% |
| Mexican | 3,389 | 4.4% |
| Mexican American Indian | 35 | 0.1% |
| Moroccan | 49 | 0.1% |
| Nicaraguan | 20 | 0.0% |
| Nigerian | 240 | 0.3% |
| Northern European | 167 | 0.2% |
| Norwegian | 1,454 | 1.9% |
| Okinawan | 32 | 0.0% |
| Pakistani | 53 | 0.1% |
| Palestinian | 191 | 0.3% |
| Panamanian | 19 | 0.0% |
| Pennsylvania German | 20 | 0.0% |
| Peruvian | 118 | 0.2% |
| Polish | 10,250 | 13.4% |
| Portuguese | 201 | 0.3% |
| Puerto Rican | 1,987 | 2.6% |
| Romanian | 881 | 1.1% |
| Russian | 1,693 | 2.2% |
| Salvadoran | 3 | 0.0% |
| Scandinavian | 152 | 0.2% |
| Scotch-Irish | 371 | 0.5% |
| Scottish | 1,005 | 1.3% |
| Seminole | 14 | 0.0% |
| Serbian | 197 | 0.3% |
| Sioux | 59 | 0.1% |
| Slavic | 137 | 0.2% |
| Slovak | 381 | 0.5% |
| Slovene | 49 | 0.1% |
| South American | 596 | 0.8% |
| South American Indian | 12 | 0.0% |
| Spaniard | 27 | 0.0% |
| Spanish | 38 | 0.1% |
| Sri Lankan | 516 | 0.7% |
| Subsaharan African | 416 | 0.5% |
| Swedish | 2,090 | 2.7% |
| Swiss | 154 | 0.2% |
| Syrian | 43 | 0.1% |
| Thai | 3,732 | 4.9% |
| Turkish | 101 | 0.1% |
| Ugandan | 1 | 0.0% |
| Ukrainian | 922 | 1.2% |
| Venezuelan | 106 | 0.1% |
| Vietnamese | 12 | 0.0% |
| Welsh | 187 | 0.2% |
| Yugoslavian | 38 | 0.1% | View All 109 Rows |
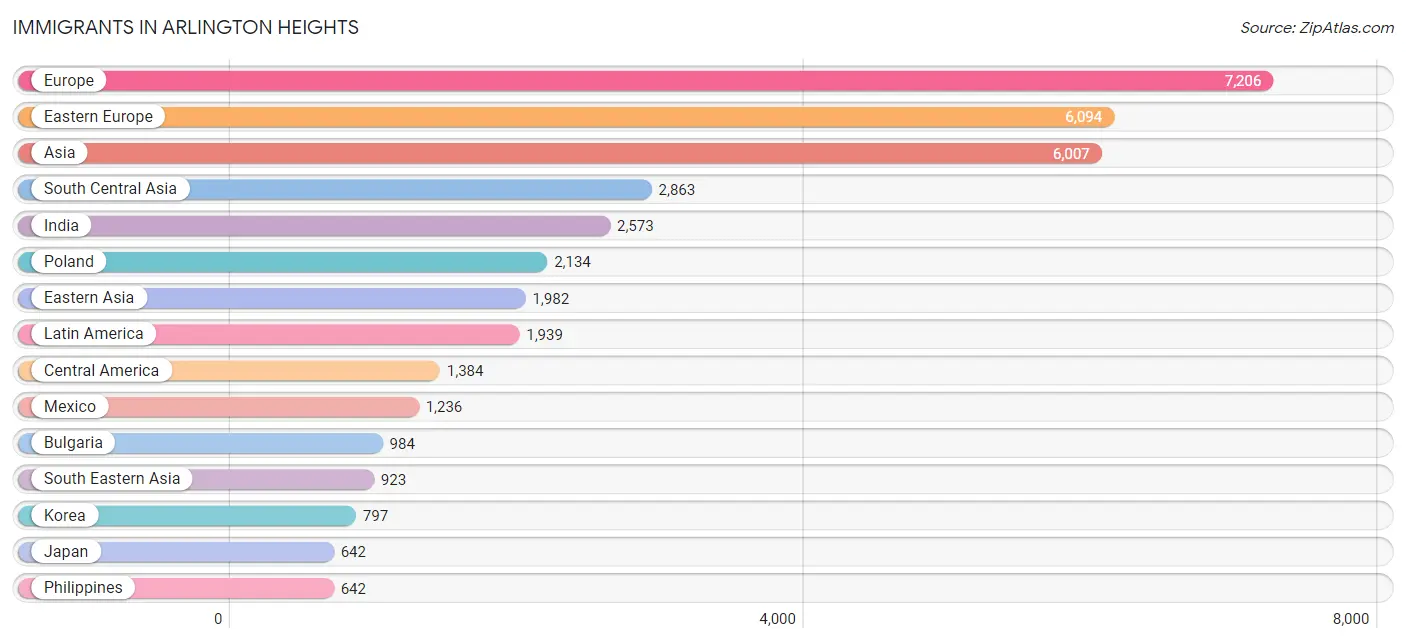
Immigrants in Arlington Heights
The most numerous immigrant groups reported in Arlington Heights came from Europe (7,206 | 9.4%), Eastern Europe (6,094 | 7.9%), Asia (6,007 | 7.8%), South Central Asia (2,863 | 3.7%), and India (2,573 | 3.4%), together accounting for 32.2% of all Arlington Heights residents.
| Immigration Origin | # Population | % Population |
| Africa | 404 | 0.5% |
| Albania | 329 | 0.4% |
| Argentina | 103 | 0.1% |
| Asia | 6,007 | 7.8% |
| Australia | 12 | 0.0% |
| Austria | 51 | 0.1% |
| Bangladesh | 6 | 0.0% |
| Belarus | 602 | 0.8% |
| Belize | 3 | 0.0% |
| Bolivia | 10 | 0.0% |
| Bosnia and Herzegovina | 91 | 0.1% |
| Brazil | 31 | 0.0% |
| Bulgaria | 984 | 1.3% |
| Cambodia | 7 | 0.0% |
| Canada | 252 | 0.3% |
| Caribbean | 67 | 0.1% |
| Central America | 1,384 | 1.8% |
| Chile | 62 | 0.1% |
| China | 435 | 0.6% |
| Colombia | 5 | 0.0% |
| Croatia | 23 | 0.0% |
| Cuba | 58 | 0.1% |
| Czechoslovakia | 58 | 0.1% |
| Denmark | 22 | 0.0% |
| Eastern Africa | 29 | 0.0% |
| Eastern Asia | 1,982 | 2.6% |
| Eastern Europe | 6,094 | 7.9% |
| Ecuador | 17 | 0.0% |
| Egypt | 121 | 0.2% |
| El Salvador | 27 | 0.0% |
| England | 55 | 0.1% |
| Europe | 7,206 | 9.4% |
| Germany | 217 | 0.3% |
| Ghana | 7 | 0.0% |
| Greece | 184 | 0.2% |
| Guatemala | 65 | 0.1% |
| Haiti | 9 | 0.0% |
| Hong Kong | 20 | 0.0% |
| Hungary | 46 | 0.1% |
| India | 2,573 | 3.4% |
| Indonesia | 15 | 0.0% |
| Iran | 55 | 0.1% |
| Iraq | 50 | 0.1% |
| Ireland | 42 | 0.1% |
| Israel | 19 | 0.0% |
| Italy | 327 | 0.4% |
| Japan | 642 | 0.8% |
| Kazakhstan | 9 | 0.0% |
| Korea | 797 | 1.0% |
| Latin America | 1,939 | 2.5% |
| Latvia | 35 | 0.1% |
| Lebanon | 55 | 0.1% |
| Lithuania | 46 | 0.1% |
| Malaysia | 7 | 0.0% |
| Mexico | 1,236 | 1.6% |
| Moldova | 230 | 0.3% |
| Morocco | 49 | 0.1% |
| Nepal | 10 | 0.0% |
| Netherlands | 15 | 0.0% |
| Nicaragua | 53 | 0.1% |
| Nigeria | 131 | 0.2% |
| North Macedonia | 20 | 0.0% |
| Northern Africa | 195 | 0.3% |
| Northern Europe | 290 | 0.4% |
| Norway | 16 | 0.0% |
| Oceania | 28 | 0.0% |
| Pakistan | 192 | 0.3% |
| Peru | 129 | 0.2% |
| Philippines | 642 | 0.8% |
| Poland | 2,134 | 2.8% |
| Romania | 304 | 0.4% |
| Russia | 306 | 0.4% |
| Scotland | 39 | 0.1% |
| Serbia | 115 | 0.2% |
| Singapore | 32 | 0.0% |
| South Africa | 24 | 0.0% |
| South America | 488 | 0.6% |
| South Central Asia | 2,863 | 3.7% |
| South Eastern Asia | 923 | 1.2% |
| Southern Europe | 528 | 0.7% |
| Spain | 17 | 0.0% |
| Sudan | 9 | 0.0% |
| Sweden | 20 | 0.0% |
| Switzerland | 11 | 0.0% |
| Syria | 13 | 0.0% |
| Taiwan | 116 | 0.2% |
| Thailand | 31 | 0.0% |
| Turkey | 61 | 0.1% |
| Uganda | 1 | 0.0% |
| Ukraine | 614 | 0.8% |
| Uzbekistan | 13 | 0.0% |
| Venezuela | 106 | 0.1% |
| Vietnam | 179 | 0.2% |
| Western Africa | 156 | 0.2% |
| Western Asia | 198 | 0.3% |
| Western Europe | 294 | 0.4% | View All 96 Rows |
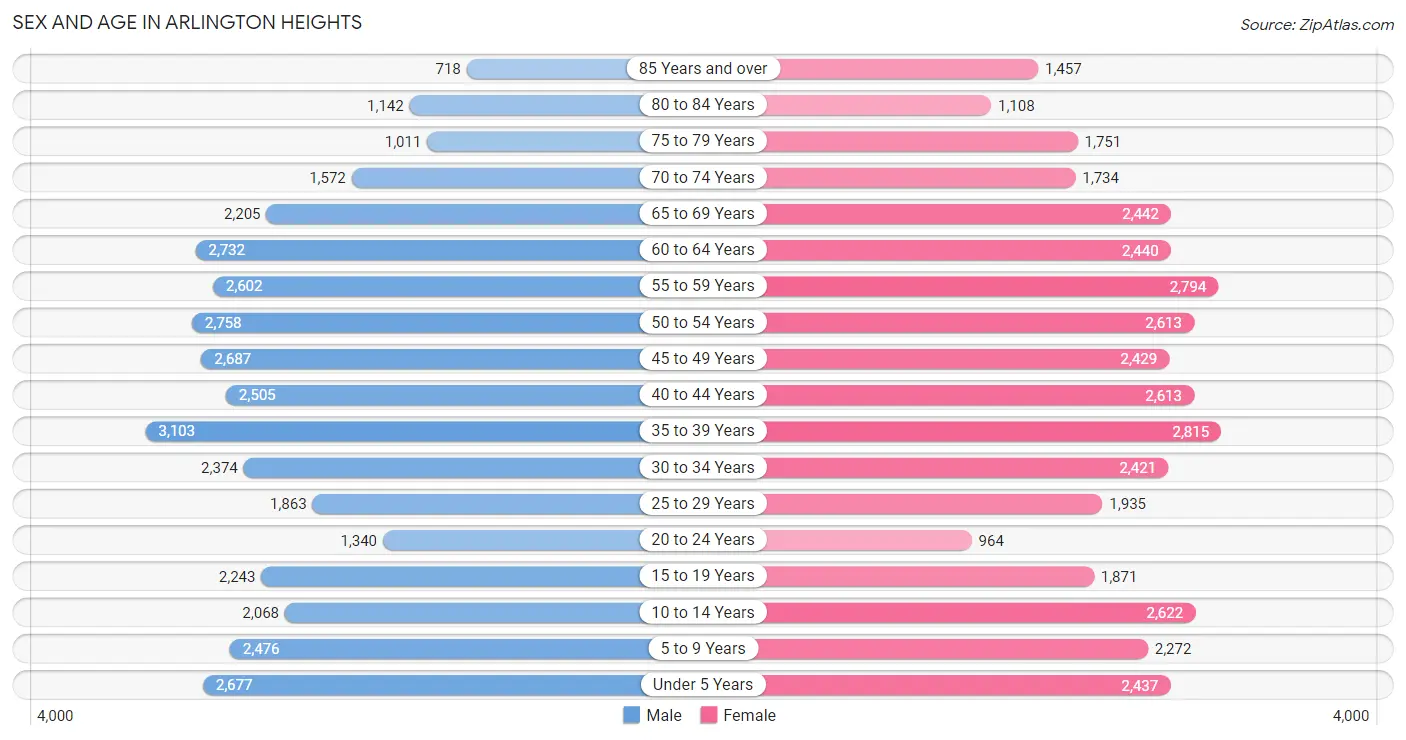
Sex and Age in Arlington Heights
Sex and Age in Arlington Heights
The most populous age groups in Arlington Heights are 35 to 39 Years (3,103 | 8.2%) for men and 35 to 39 Years (2,815 | 7.3%) for women.
| Age Bracket | Male | Female |
| Under 5 Years | 2,677 (7.0%) | 2,437 (6.3%) |
| 5 to 9 Years | 2,476 (6.5%) | 2,272 (5.9%) |
| 10 to 14 Years | 2,068 (5.4%) | 2,622 (6.8%) |
| 15 to 19 Years | 2,243 (5.9%) | 1,871 (4.8%) |
| 20 to 24 Years | 1,340 (3.5%) | 964 (2.5%) |
| 25 to 29 Years | 1,863 (4.9%) | 1,935 (5.0%) |
| 30 to 34 Years | 2,374 (6.2%) | 2,421 (6.2%) |
| 35 to 39 Years | 3,103 (8.2%) | 2,815 (7.3%) |
| 40 to 44 Years | 2,505 (6.6%) | 2,613 (6.8%) |
| 45 to 49 Years | 2,687 (7.1%) | 2,429 (6.3%) |
| 50 to 54 Years | 2,758 (7.2%) | 2,613 (6.8%) |
| 55 to 59 Years | 2,602 (6.8%) | 2,794 (7.2%) |
| 60 to 64 Years | 2,732 (7.2%) | 2,440 (6.3%) |
| 65 to 69 Years | 2,205 (5.8%) | 2,442 (6.3%) |
| 70 to 74 Years | 1,572 (4.1%) | 1,734 (4.5%) |
| 75 to 79 Years | 1,011 (2.7%) | 1,751 (4.5%) |
| 80 to 84 Years | 1,142 (3.0%) | 1,108 (2.9%) |
| 85 Years and over | 718 (1.9%) | 1,457 (3.8%) |
| Total | 38,076 (100.0%) | 38,718 (100.0%) |
Families and Households in Arlington Heights
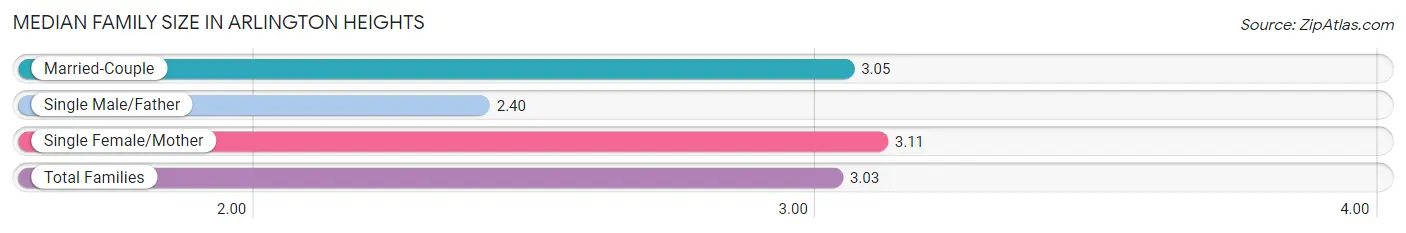
Median Family Size in Arlington Heights
The median family size in Arlington Heights is 3.03 persons per family, with single female/mother families (1,916 | 9.3%) accounting for the largest median family size of 3.11 persons per family. On the other hand, single male/father families (991 | 4.8%) represent the smallest median family size with 2.40 persons per family.
| Family Type | # Families | Family Size |
| Married-Couple | 17,720 (85.9%) | 3.05 |
| Single Male/Father | 991 (4.8%) | 2.40 |
| Single Female/Mother | 1,916 (9.3%) | 3.11 |
| Total Families | 20,627 (100.0%) | 3.03 |
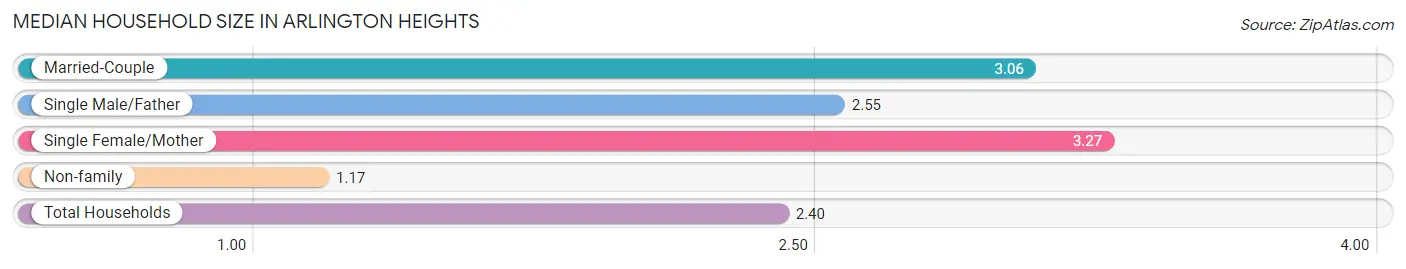
Median Household Size in Arlington Heights
The median household size in Arlington Heights is 2.40 persons per household, with single female/mother households (1,916 | 6.0%) accounting for the largest median household size of 3.27 persons per household. non-family households (11,056 | 34.9%) represent the smallest median household size with 1.17 persons per household.
| Household Type | # Households | Household Size |
| Married-Couple | 17,720 (55.9%) | 3.06 |
| Single Male/Father | 991 (3.1%) | 2.55 |
| Single Female/Mother | 1,916 (6.0%) | 3.27 |
| Non-family | 11,056 (34.9%) | 1.17 |
| Total Households | 31,683 (100.0%) | 2.40 |
Household Size by Marriage Status in Arlington Heights
Out of a total of 31,683 households in Arlington Heights, 20,627 (65.1%) are family households, while 11,056 (34.9%) are nonfamily households. The most numerous type of family households are 2-person households, comprising 9,232, and the most common type of nonfamily households are 1-person households, comprising 9,304.
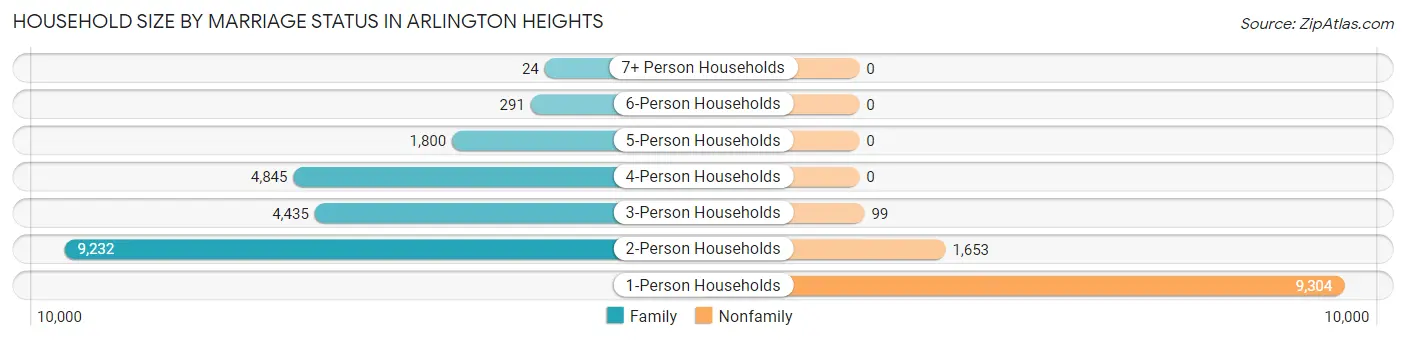
| Household Size | Family Households | Nonfamily Households |
| 1-Person Households | - | 9,304 (29.4%) |
| 2-Person Households | 9,232 (29.1%) | 1,653 (5.2%) |
| 3-Person Households | 4,435 (14.0%) | 99 (0.3%) |
| 4-Person Households | 4,845 (15.3%) | 0 (0.0%) |
| 5-Person Households | 1,800 (5.7%) | 0 (0.0%) |
| 6-Person Households | 291 (0.9%) | 0 (0.0%) |
| 7+ Person Households | 24 (0.1%) | 0 (0.0%) |
| Total | 20,627 (65.1%) | 11,056 (34.9%) |
Female Fertility in Arlington Heights
Fertility by Age in Arlington Heights
Average fertility rate in Arlington Heights is 55.0 births per 1,000 women. Women in the age bracket of 20 to 34 years have the highest fertility rate with 86.0 births per 1,000 women. Women in the age bracket of 20 to 34 years acount for 53.6% of all women with births.
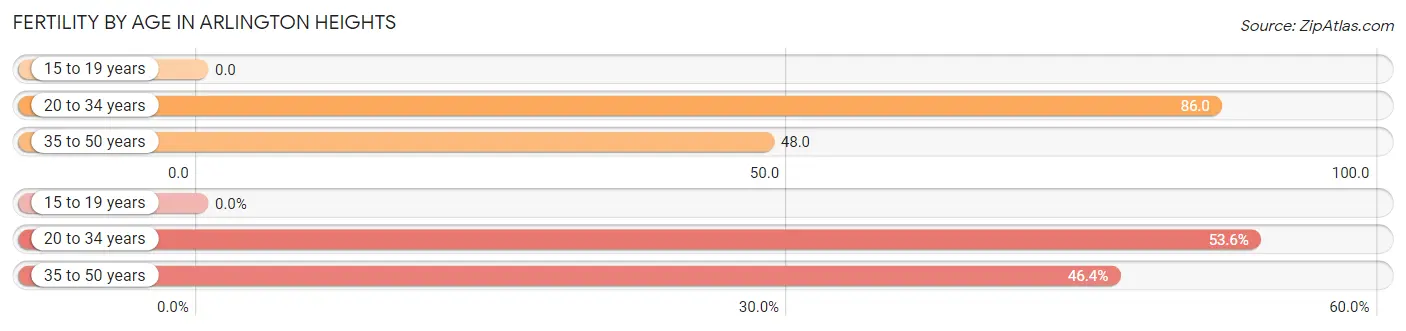
| Age Bracket | Women with Births | Births / 1,000 Women |
| 15 to 19 years | 0 (0.0%) | 0.0 |
| 20 to 34 years | 457 (53.6%) | 86.0 |
| 35 to 50 years | 396 (46.4%) | 48.0 |
| Total | 853 (100.0%) | 55.0 |
Fertility by Age by Marriage Status in Arlington Heights
97.8% of women with births (853) in Arlington Heights are married. The highest percentage of unmarried women with births falls into 35 to 50 years age bracket with 4.8% of them unmarried at the time of birth, while the lowest percentage of unmarried women with births belong to 20 to 34 years age bracket with 0.0% of them unmarried.
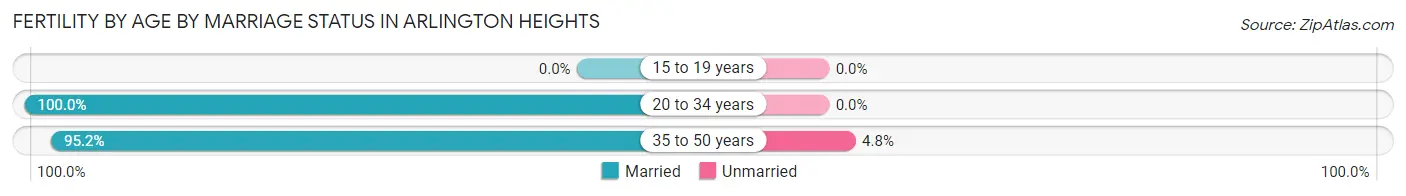
| Age Bracket | Married | Unmarried |
| 15 to 19 years | 0 (0.0%) | 0 (0.0%) |
| 20 to 34 years | 457 (100.0%) | 0 (0.0%) |
| 35 to 50 years | 377 (95.2%) | 19 (4.8%) |
| Total | 834 (97.8%) | 19 (2.2%) |
Fertility by Education in Arlington Heights
Average fertility rate in Arlington Heights is 55.0 births per 1,000 women. Women with the education attainment of graduate degree have the highest fertility rate of 90.0 births per 1,000 women, while women with the education attainment of less than high school have the lowest fertility at 17.0 births per 1,000 women. Women with the education attainment of graduate degree represent 43.3% of all women with births.
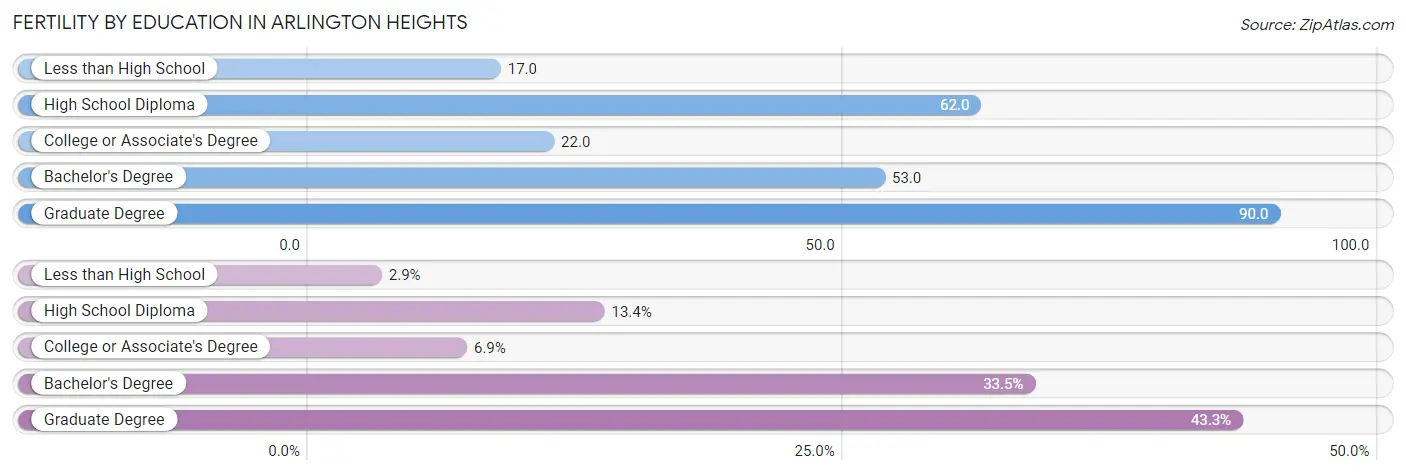
| Educational Attainment | Women with Births | Births / 1,000 Women |
| Less than High School | 25 (2.9%) | 17.0 |
| High School Diploma | 114 (13.4%) | 62.0 |
| College or Associate's Degree | 59 (6.9%) | 22.0 |
| Bachelor's Degree | 286 (33.5%) | 53.0 |
| Graduate Degree | 369 (43.3%) | 90.0 |
| Total | 853 (100.0%) | 55.0 |
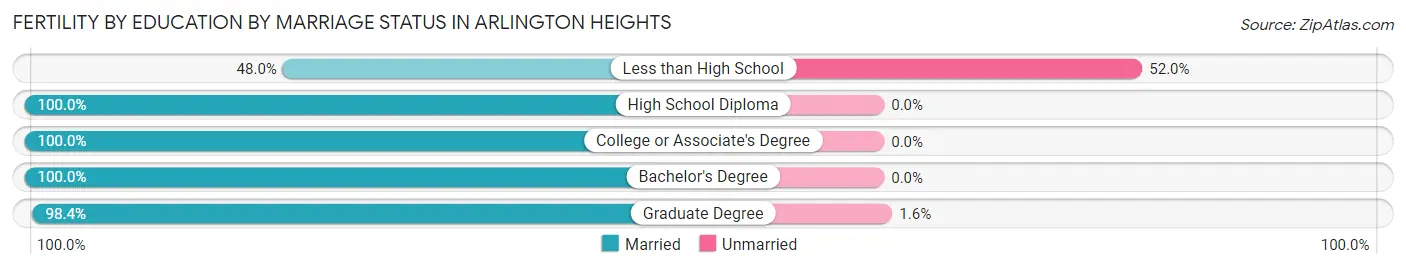
Fertility by Education by Marriage Status in Arlington Heights
2.2% of women with births in Arlington Heights are unmarried. Women with the educational attainment of high school diploma are most likely to be married with 100.0% of them married at childbirth, while women with the educational attainment of less than high school are least likely to be married with 52.0% of them unmarried at childbirth.
| Educational Attainment | Married | Unmarried |
| Less than High School | 12 (48.0%) | 13 (52.0%) |
| High School Diploma | 114 (100.0%) | 0 (0.0%) |
| College or Associate's Degree | 59 (100.0%) | 0 (0.0%) |
| Bachelor's Degree | 286 (100.0%) | 0 (0.0%) |
| Graduate Degree | 363 (98.4%) | 6 (1.6%) |
| Total | 834 (97.8%) | 19 (2.2%) |
Employment Characteristics in Arlington Heights
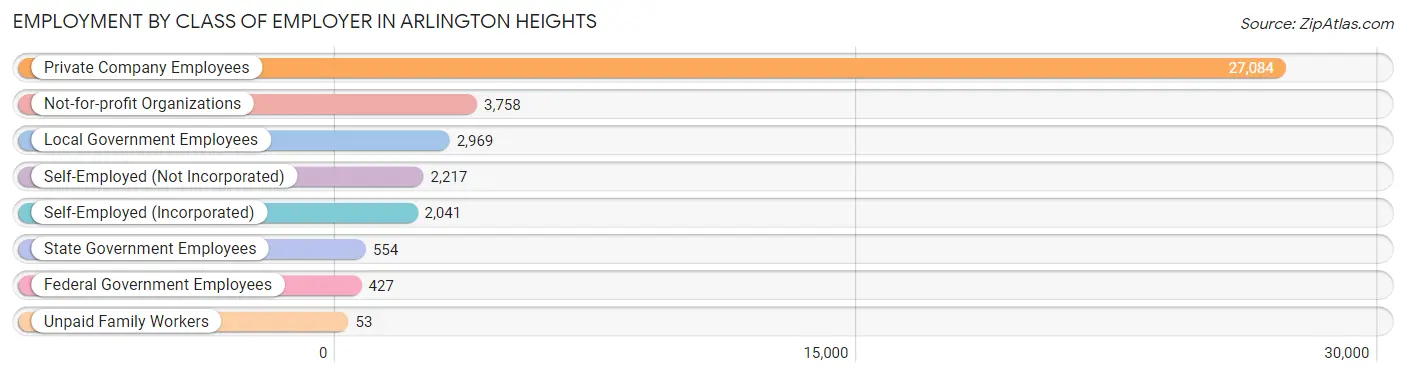
Employment by Class of Employer in Arlington Heights
Among the 39,103 employed individuals in Arlington Heights, private company employees (27,084 | 69.3%), not-for-profit organizations (3,758 | 9.6%), and local government employees (2,969 | 7.6%) make up the most common classes of employment.
| Employer Class | # Employees | % Employees |
| Private Company Employees | 27,084 | 69.3% |
| Self-Employed (Incorporated) | 2,041 | 5.2% |
| Self-Employed (Not Incorporated) | 2,217 | 5.7% |
| Not-for-profit Organizations | 3,758 | 9.6% |
| Local Government Employees | 2,969 | 7.6% |
| State Government Employees | 554 | 1.4% |
| Federal Government Employees | 427 | 1.1% |
| Unpaid Family Workers | 53 | 0.1% |
| Total | 39,103 | 100.0% |
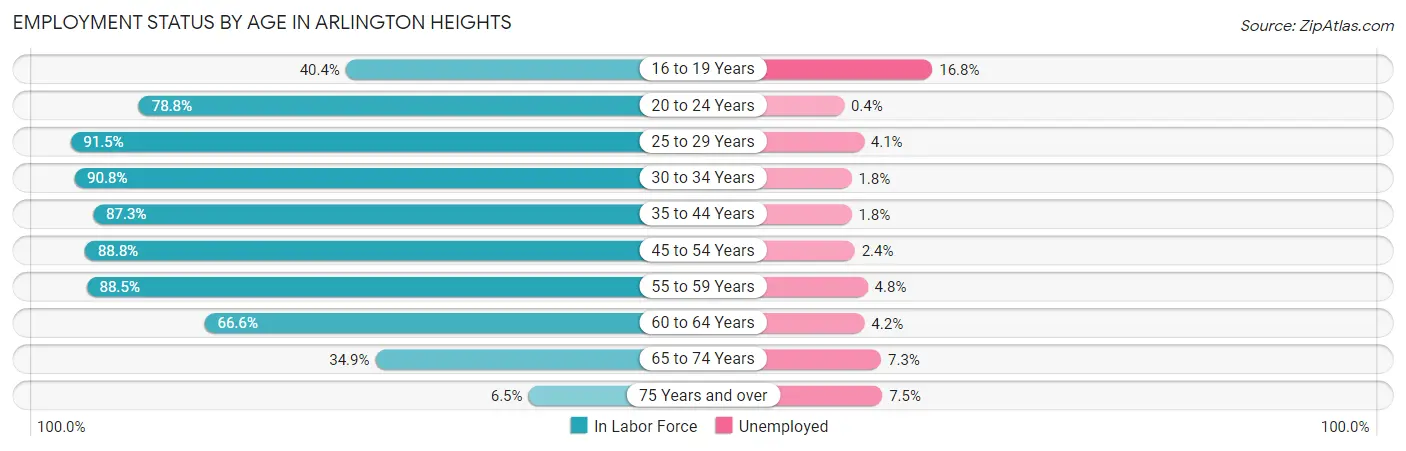
Employment Status by Age in Arlington Heights
According to the labor force statistics for Arlington Heights, out of the total population over 16 years of age (61,041), 67.5% or 41,203 individuals are in the labor force, with 3.5% or 1,442 of them unemployed. The age group with the highest labor force participation rate is 25 to 29 years, with 91.5% or 3,475 individuals in the labor force. Within the labor force, the 16 to 19 years age range has the highest percentage of unemployed individuals, with 16.8% or 198 of them being unemployed.
| Age Bracket | In Labor Force | Unemployed |
| 16 to 19 Years | 1,177 (40.4%) | 198 (16.8%) |
| 20 to 24 Years | 1,816 (78.8%) | 7 (0.4%) |
| 25 to 29 Years | 3,475 (91.5%) | 142 (4.1%) |
| 30 to 34 Years | 4,354 (90.8%) | 78 (1.8%) |
| 35 to 44 Years | 9,634 (87.3%) | 173 (1.8%) |
| 45 to 54 Years | 9,312 (88.8%) | 223 (2.4%) |
| 55 to 59 Years | 4,775 (88.5%) | 229 (4.8%) |
| 60 to 64 Years | 3,445 (66.6%) | 145 (4.2%) |
| 65 to 74 Years | 2,776 (34.9%) | 203 (7.3%) |
| 75 Years and over | 467 (6.5%) | 35 (7.5%) |
| Total | 41,203 (67.5%) | 1,442 (3.5%) |
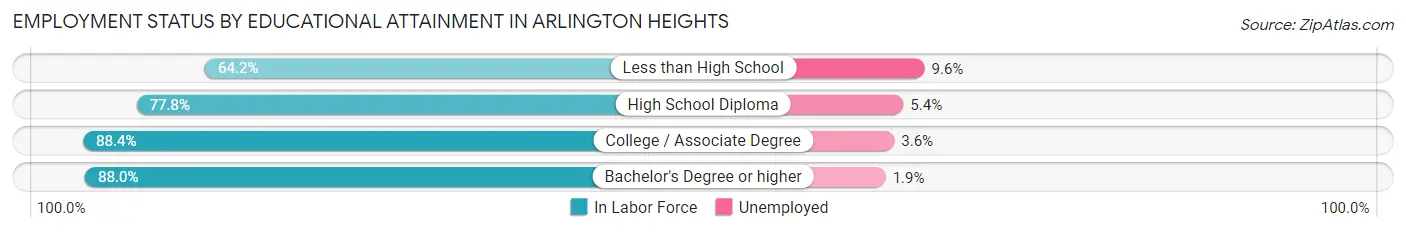
Employment Status by Educational Attainment in Arlington Heights
According to labor force statistics for Arlington Heights, 86.0% of individuals (34,988) out of the total population between 25 and 64 years of age (40,684) are in the labor force, with 2.8% or 980 of them being unemployed. The group with the highest labor force participation rate are those with the educational attainment of college / associate degree, with 88.4% or 6,879 individuals in the labor force. Within the labor force, individuals with less than high school education have the highest percentage of unemployment, with 9.6% or 74 of them being unemployed.
| Educational Attainment | In Labor Force | Unemployed |
| Less than High School | 774 (64.2%) | 116 (9.6%) |
| High School Diploma | 4,132 (77.8%) | 287 (5.4%) |
| College / Associate Degree | 6,879 (88.4%) | 280 (3.6%) |
| Bachelor's Degree or higher | 23,219 (88.0%) | 501 (1.9%) |
| Total | 34,988 (86.0%) | 1,139 (2.8%) |
Employment Occupations by Sex in Arlington Heights
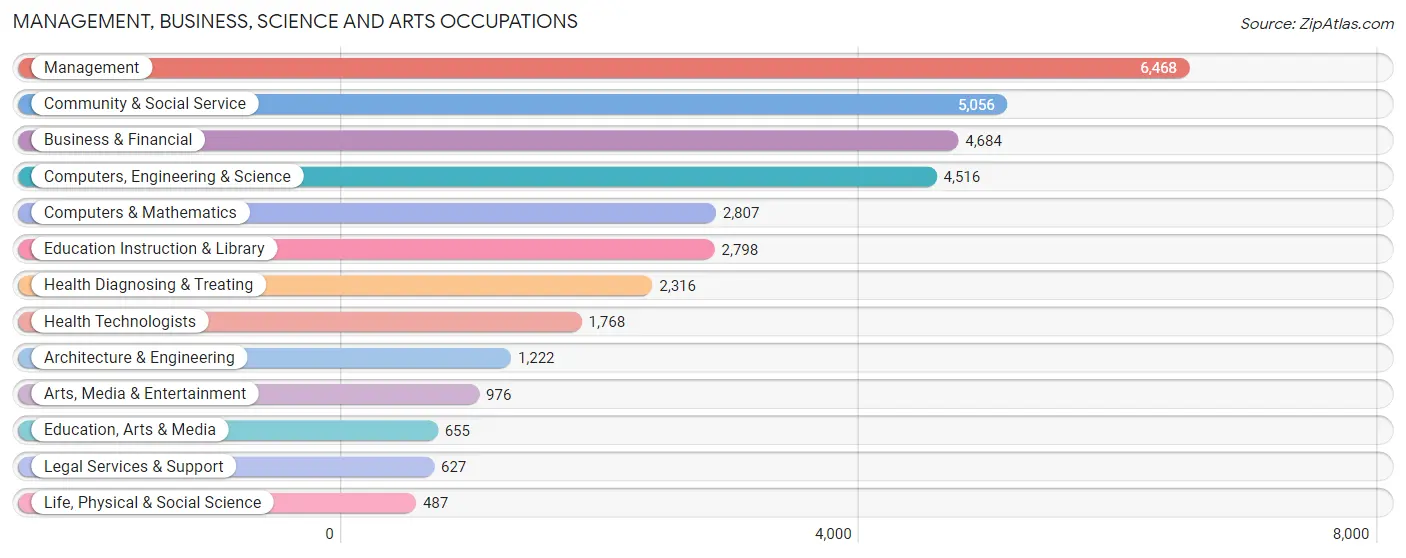
Management, Business, Science and Arts Occupations
The most common Management, Business, Science and Arts occupations in Arlington Heights are Management (6,468 | 16.3%), Community & Social Service (5,056 | 12.7%), Business & Financial (4,684 | 11.8%), Computers, Engineering & Science (4,516 | 11.4%), and Computers & Mathematics (2,807 | 7.1%).
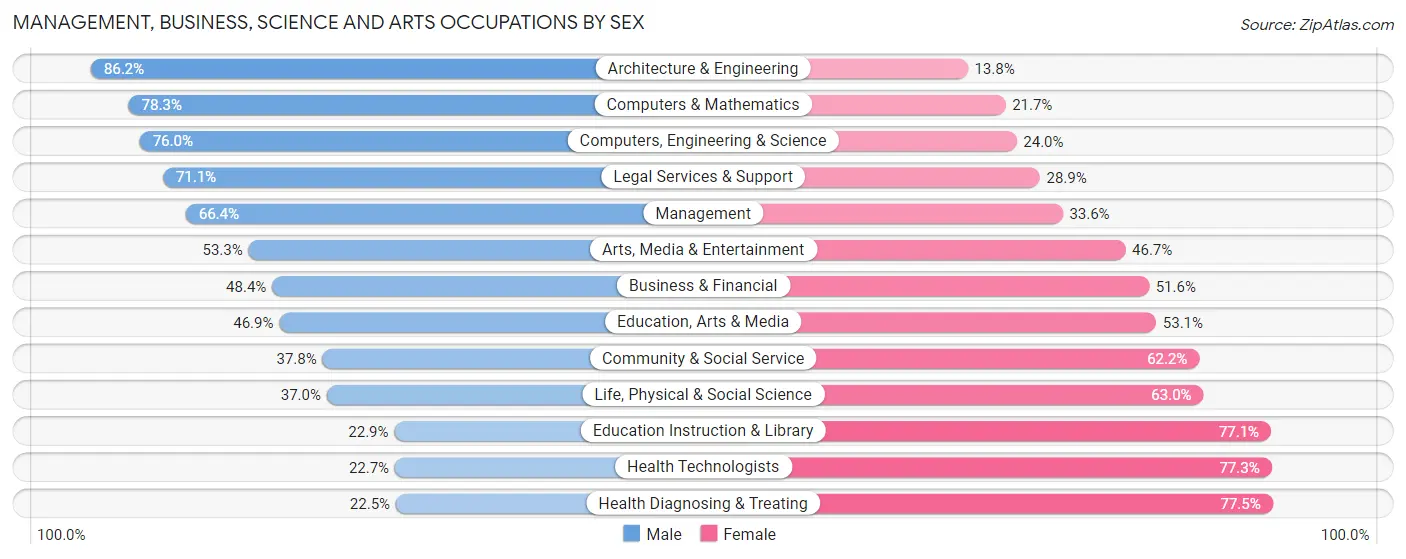
Management, Business, Science and Arts Occupations by Sex
Within the Management, Business, Science and Arts occupations in Arlington Heights, the most male-oriented occupations are Architecture & Engineering (86.2%), Computers & Mathematics (78.3%), and Computers, Engineering & Science (76.0%), while the most female-oriented occupations are Health Diagnosing & Treating (77.5%), Health Technologists (77.3%), and Education Instruction & Library (77.1%).
| Occupation | Male | Female |
| Management | 4,292 (66.4%) | 2,176 (33.6%) |
| Business & Financial | 2,265 (48.4%) | 2,419 (51.6%) |
| Computers, Engineering & Science | 3,431 (76.0%) | 1,085 (24.0%) |
| Computers & Mathematics | 2,198 (78.3%) | 609 (21.7%) |
| Architecture & Engineering | 1,053 (86.2%) | 169 (13.8%) |
| Life, Physical & Social Science | 180 (37.0%) | 307 (63.0%) |
| Community & Social Service | 1,913 (37.8%) | 3,143 (62.2%) |
| Education, Arts & Media | 307 (46.9%) | 348 (53.1%) |
| Legal Services & Support | 446 (71.1%) | 181 (28.9%) |
| Education Instruction & Library | 640 (22.9%) | 2,158 (77.1%) |
| Arts, Media & Entertainment | 520 (53.3%) | 456 (46.7%) |
| Health Diagnosing & Treating | 522 (22.5%) | 1,794 (77.5%) |
| Health Technologists | 402 (22.7%) | 1,366 (77.3%) |
| Total (Category) | 12,423 (53.9%) | 10,617 (46.1%) |
| Total (Overall) | 21,802 (54.8%) | 17,968 (45.2%) |
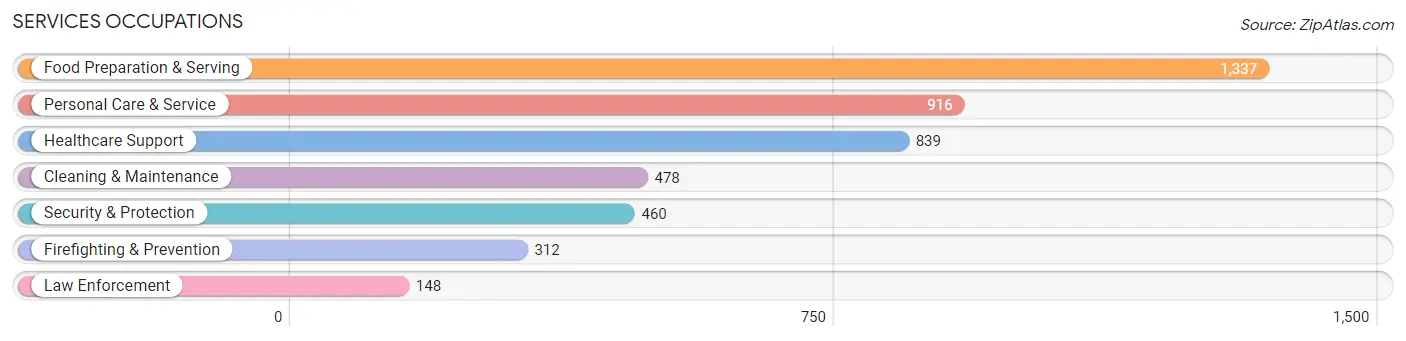
Services Occupations
The most common Services occupations in Arlington Heights are Food Preparation & Serving (1,337 | 3.4%), Personal Care & Service (916 | 2.3%), Healthcare Support (839 | 2.1%), Cleaning & Maintenance (478 | 1.2%), and Security & Protection (460 | 1.2%).
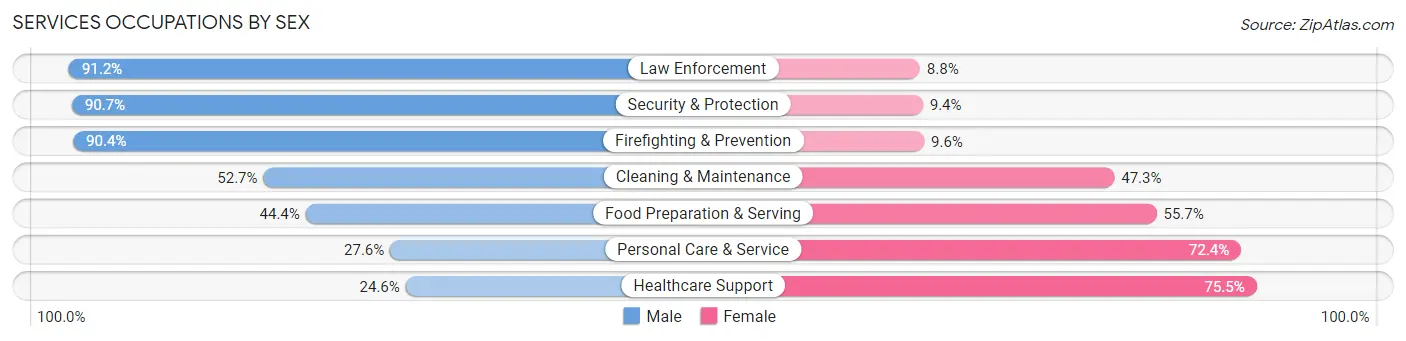
Services Occupations by Sex
Within the Services occupations in Arlington Heights, the most male-oriented occupations are Law Enforcement (91.2%), Security & Protection (90.6%), and Firefighting & Prevention (90.4%), while the most female-oriented occupations are Healthcare Support (75.4%), Personal Care & Service (72.4%), and Food Preparation & Serving (55.6%).
| Occupation | Male | Female |
| Healthcare Support | 206 (24.5%) | 633 (75.4%) |
| Security & Protection | 417 (90.6%) | 43 (9.3%) |
| Firefighting & Prevention | 282 (90.4%) | 30 (9.6%) |
| Law Enforcement | 135 (91.2%) | 13 (8.8%) |
| Food Preparation & Serving | 593 (44.4%) | 744 (55.6%) |
| Cleaning & Maintenance | 252 (52.7%) | 226 (47.3%) |
| Personal Care & Service | 253 (27.6%) | 663 (72.4%) |
| Total (Category) | 1,721 (42.7%) | 2,309 (57.3%) |
| Total (Overall) | 21,802 (54.8%) | 17,968 (45.2%) |
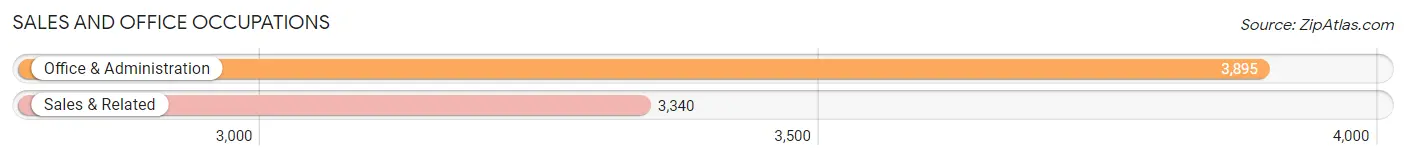
Sales and Office Occupations
The most common Sales and Office occupations in Arlington Heights are Office & Administration (3,895 | 9.8%), and Sales & Related (3,340 | 8.4%).
Sales and Office Occupations by Sex
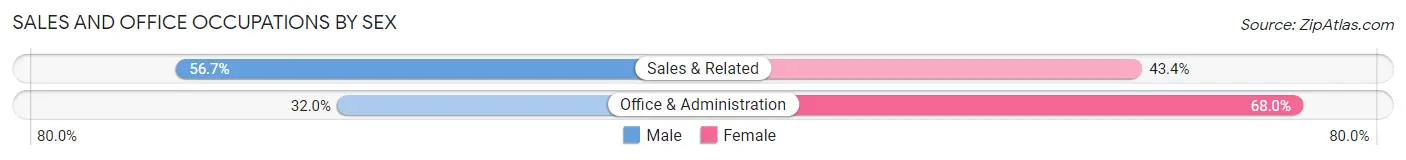
| Occupation | Male | Female |
| Sales & Related | 1,892 (56.7%) | 1,448 (43.3%) |
| Office & Administration | 1,245 (32.0%) | 2,650 (68.0%) |
| Total (Category) | 3,137 (43.4%) | 4,098 (56.6%) |
| Total (Overall) | 21,802 (54.8%) | 17,968 (45.2%) |
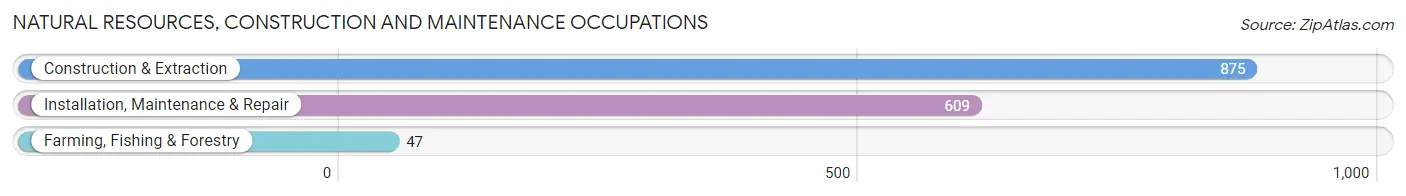
Natural Resources, Construction and Maintenance Occupations
The most common Natural Resources, Construction and Maintenance occupations in Arlington Heights are Construction & Extraction (875 | 2.2%), Installation, Maintenance & Repair (609 | 1.5%), and Farming, Fishing & Forestry (47 | 0.1%).
Natural Resources, Construction and Maintenance Occupations by Sex
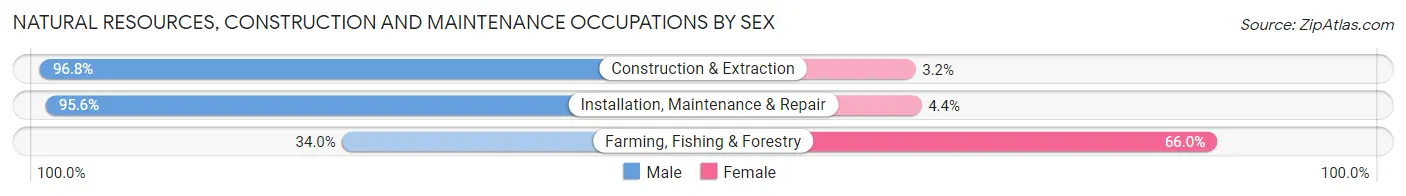
| Occupation | Male | Female |
| Farming, Fishing & Forestry | 16 (34.0%) | 31 (66.0%) |
| Construction & Extraction | 847 (96.8%) | 28 (3.2%) |
| Installation, Maintenance & Repair | 582 (95.6%) | 27 (4.4%) |
| Total (Category) | 1,445 (94.4%) | 86 (5.6%) |
| Total (Overall) | 21,802 (54.8%) | 17,968 (45.2%) |
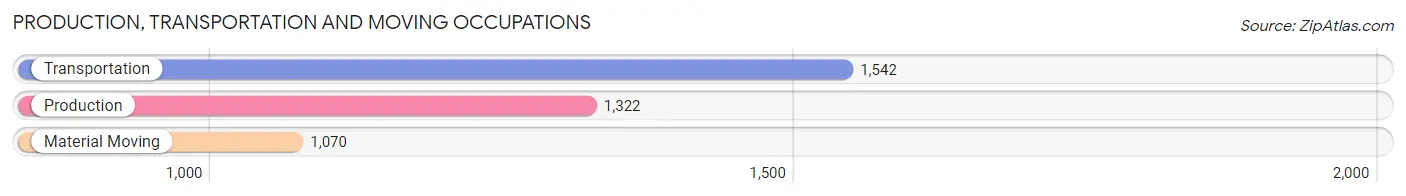
Production, Transportation and Moving Occupations
The most common Production, Transportation and Moving occupations in Arlington Heights are Transportation (1,542 | 3.9%), Production (1,322 | 3.3%), and Material Moving (1,070 | 2.7%).
Production, Transportation and Moving Occupations by Sex
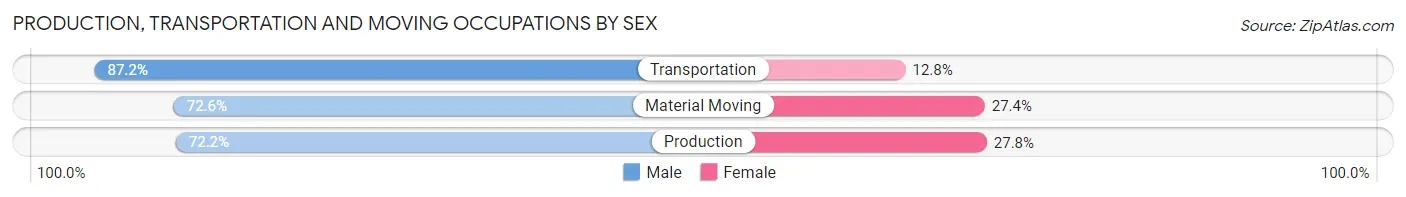
| Occupation | Male | Female |
| Production | 955 (72.2%) | 367 (27.8%) |
| Transportation | 1,344 (87.2%) | 198 (12.8%) |
| Material Moving | 777 (72.6%) | 293 (27.4%) |
| Total (Category) | 3,076 (78.2%) | 858 (21.8%) |
| Total (Overall) | 21,802 (54.8%) | 17,968 (45.2%) |
Employment Industries by Sex in Arlington Heights
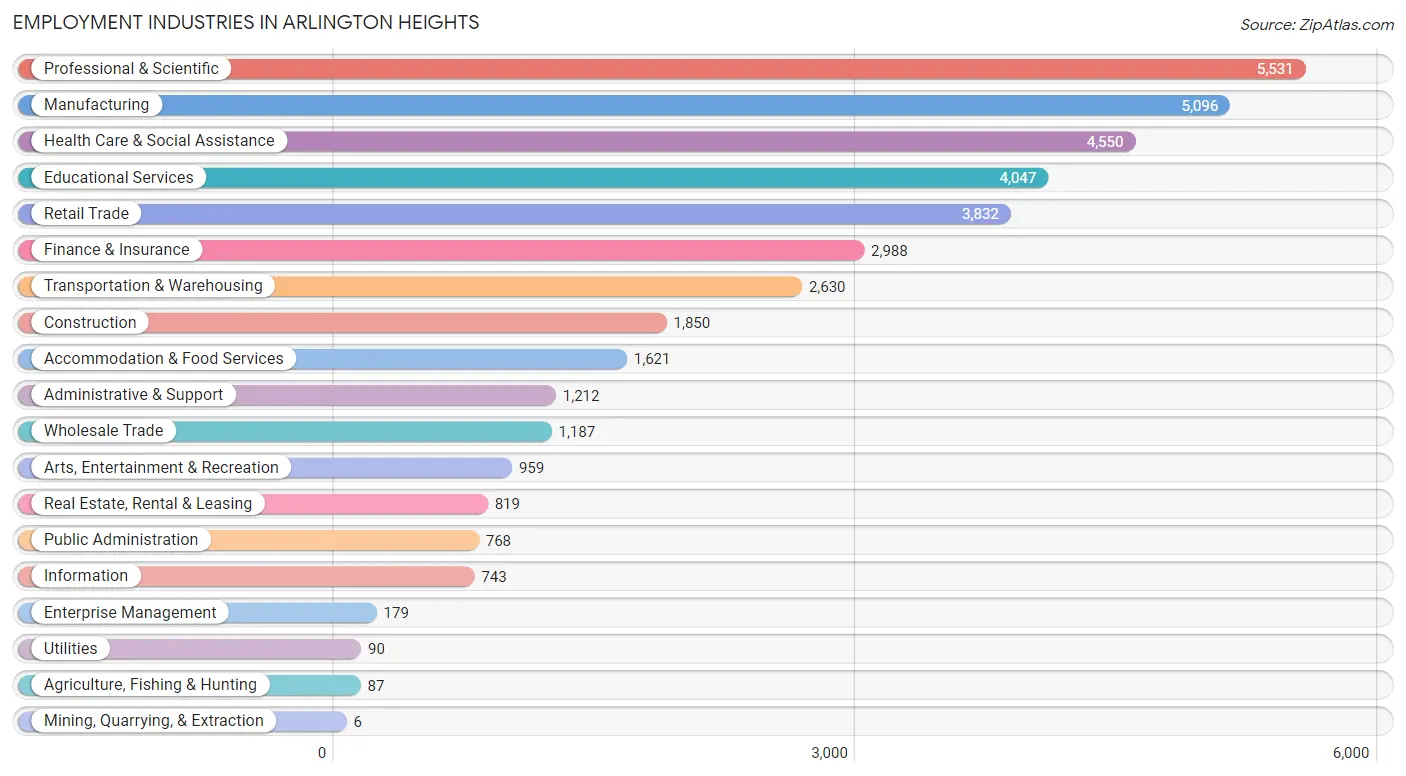
Employment Industries in Arlington Heights
The major employment industries in Arlington Heights include Professional & Scientific (5,531 | 13.9%), Manufacturing (5,096 | 12.8%), Health Care & Social Assistance (4,550 | 11.4%), Educational Services (4,047 | 10.2%), and Retail Trade (3,832 | 9.6%).
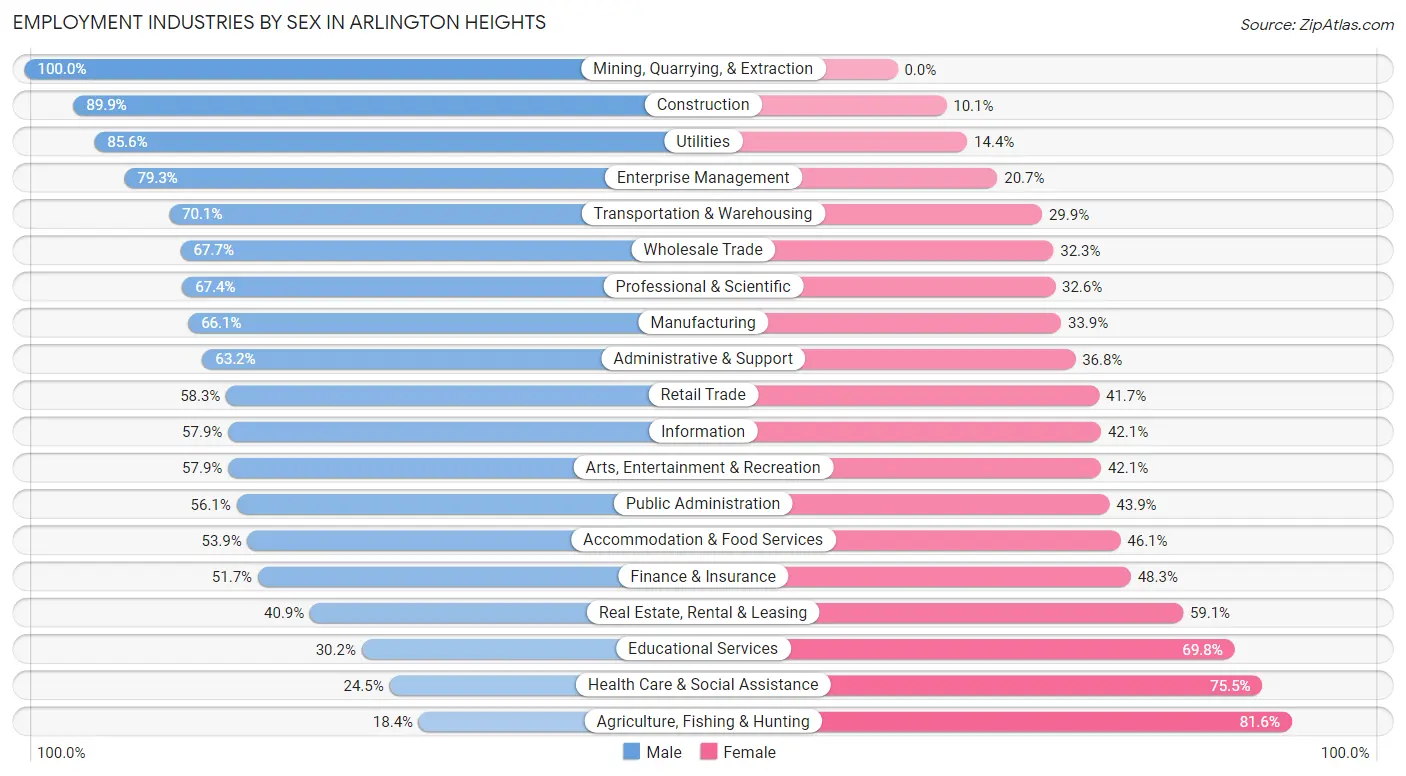
Employment Industries by Sex in Arlington Heights
The Arlington Heights industries that see more men than women are Mining, Quarrying, & Extraction (100.0%), Construction (89.9%), and Utilities (85.6%), whereas the industries that tend to have a higher number of women are Agriculture, Fishing & Hunting (81.6%), Health Care & Social Assistance (75.5%), and Educational Services (69.8%).
| Industry | Male | Female |
| Agriculture, Fishing & Hunting | 16 (18.4%) | 71 (81.6%) |
| Mining, Quarrying, & Extraction | 6 (100.0%) | 0 (0.0%) |
| Construction | 1,663 (89.9%) | 187 (10.1%) |
| Manufacturing | 3,370 (66.1%) | 1,726 (33.9%) |
| Wholesale Trade | 804 (67.7%) | 383 (32.3%) |
| Retail Trade | 2,233 (58.3%) | 1,599 (41.7%) |
| Transportation & Warehousing | 1,843 (70.1%) | 787 (29.9%) |
| Utilities | 77 (85.6%) | 13 (14.4%) |
| Information | 430 (57.9%) | 313 (42.1%) |
| Finance & Insurance | 1,545 (51.7%) | 1,443 (48.3%) |
| Real Estate, Rental & Leasing | 335 (40.9%) | 484 (59.1%) |
| Professional & Scientific | 3,726 (67.4%) | 1,805 (32.6%) |
| Enterprise Management | 142 (79.3%) | 37 (20.7%) |
| Administrative & Support | 766 (63.2%) | 446 (36.8%) |
| Educational Services | 1,223 (30.2%) | 2,824 (69.8%) |
| Health Care & Social Assistance | 1,113 (24.5%) | 3,437 (75.5%) |
| Arts, Entertainment & Recreation | 555 (57.9%) | 404 (42.1%) |
| Accommodation & Food Services | 873 (53.9%) | 748 (46.1%) |
| Public Administration | 431 (56.1%) | 337 (43.9%) |
| Total | 21,802 (54.8%) | 17,968 (45.2%) |
Education in Arlington Heights
School Enrollment in Arlington Heights
The most common levels of schooling among the 17,470 students in Arlington Heights are high school (3,814 | 21.8%), middle school (3,751 | 21.5%), and elementary school (3,281 | 18.8%).
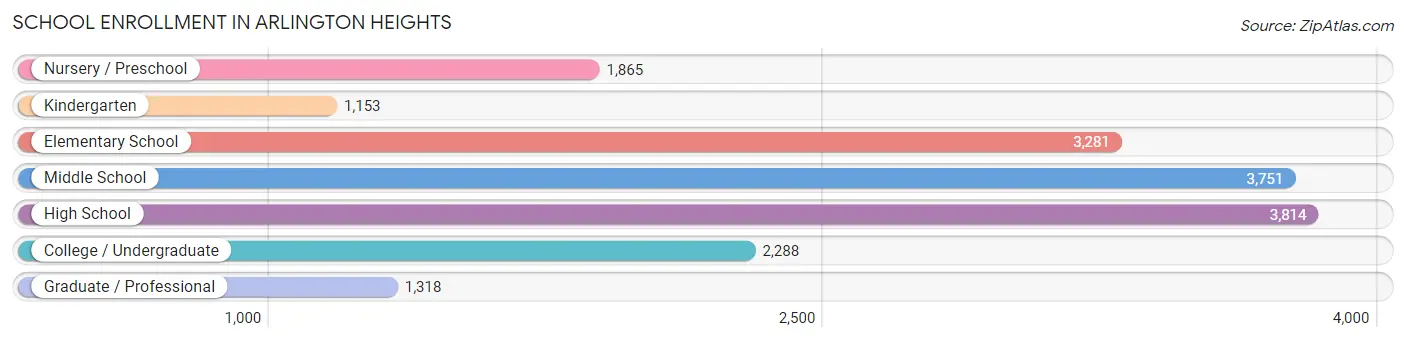
| School Level | # Students | % Students |
| Nursery / Preschool | 1,865 | 10.7% |
| Kindergarten | 1,153 | 6.6% |
| Elementary School | 3,281 | 18.8% |
| Middle School | 3,751 | 21.5% |
| High School | 3,814 | 21.8% |
| College / Undergraduate | 2,288 | 13.1% |
| Graduate / Professional | 1,318 | 7.5% |
| Total | 17,470 | 100.0% |
School Enrollment by Age by Funding Source in Arlington Heights
Out of a total of 17,470 students who are enrolled in schools in Arlington Heights, 3,931 (22.5%) attend a private institution, while the remaining 13,539 (77.5%) are enrolled in public schools. The age group of 3 to 4 year olds has the highest likelihood of being enrolled in private schools, with 846 (53.8% in the age bracket) enrolled. Conversely, the age group of 10 to 14 year olds has the lowest likelihood of being enrolled in a private school, with 4,140 (89.3% in the age bracket) attending a public institution.
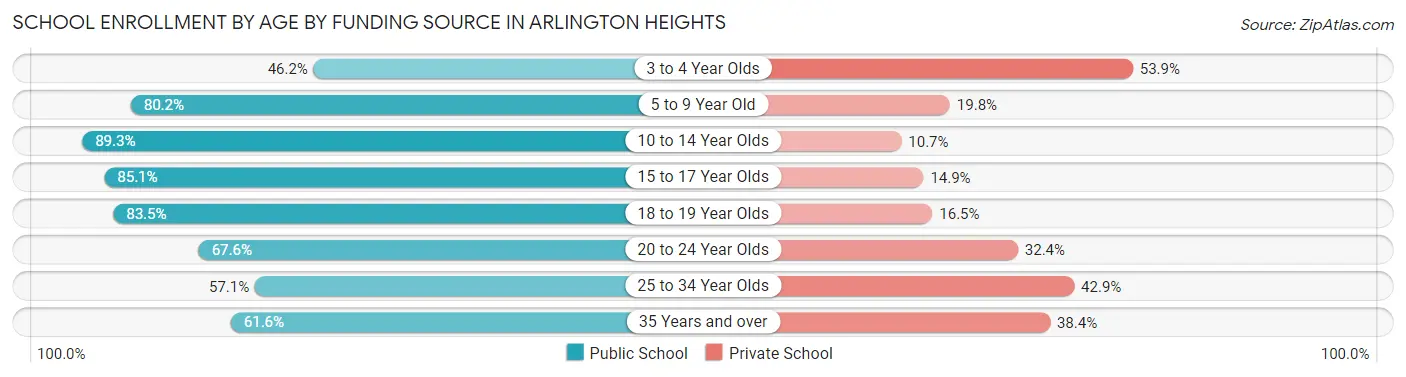
| Age Bracket | Public School | Private School |
| 3 to 4 Year Olds | 725 (46.2%) | 846 (53.8%) |
| 5 to 9 Year Old | 3,518 (80.2%) | 868 (19.8%) |
| 10 to 14 Year Olds | 4,140 (89.3%) | 498 (10.7%) |
| 15 to 17 Year Olds | 2,400 (85.1%) | 419 (14.9%) |
| 18 to 19 Year Olds | 925 (83.5%) | 183 (16.5%) |
| 20 to 24 Year Olds | 735 (67.6%) | 353 (32.4%) |
| 25 to 34 Year Olds | 561 (57.1%) | 422 (42.9%) |
| 35 Years and over | 540 (61.6%) | 337 (38.4%) |
| Total | 13,539 (77.5%) | 3,931 (22.5%) |
Educational Attainment by Field of Study in Arlington Heights
Business (8,230 | 23.1%), engineering (3,759 | 10.6%), education (3,621 | 10.2%), social sciences (3,127 | 8.8%), and science & technology (3,006 | 8.5%) are the most common fields of study among 35,590 individuals in Arlington Heights who have obtained a bachelor's degree or higher.
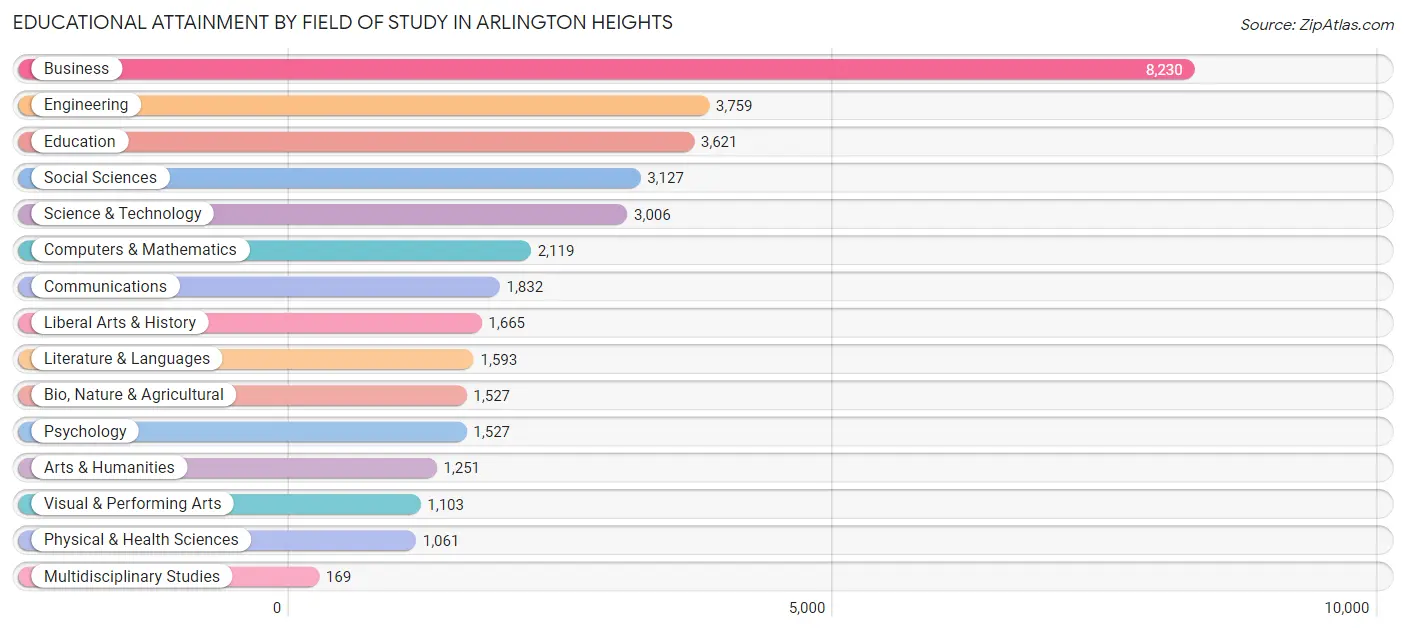
| Field of Study | # Graduates | % Graduates |
| Computers & Mathematics | 2,119 | 5.9% |
| Bio, Nature & Agricultural | 1,527 | 4.3% |
| Physical & Health Sciences | 1,061 | 3.0% |
| Psychology | 1,527 | 4.3% |
| Social Sciences | 3,127 | 8.8% |
| Engineering | 3,759 | 10.6% |
| Multidisciplinary Studies | 169 | 0.5% |
| Science & Technology | 3,006 | 8.5% |
| Business | 8,230 | 23.1% |
| Education | 3,621 | 10.2% |
| Literature & Languages | 1,593 | 4.5% |
| Liberal Arts & History | 1,665 | 4.7% |
| Visual & Performing Arts | 1,103 | 3.1% |
| Communications | 1,832 | 5.1% |
| Arts & Humanities | 1,251 | 3.5% |
| Total | 35,590 | 100.0% |
Transportation & Commute in Arlington Heights
Vehicle Availability by Sex in Arlington Heights
The most prevalent vehicle ownership categories in Arlington Heights are males with 2 vehicles (11,259, accounting for 52.4%) and females with 2 vehicles (8,906, making up 64.0%).
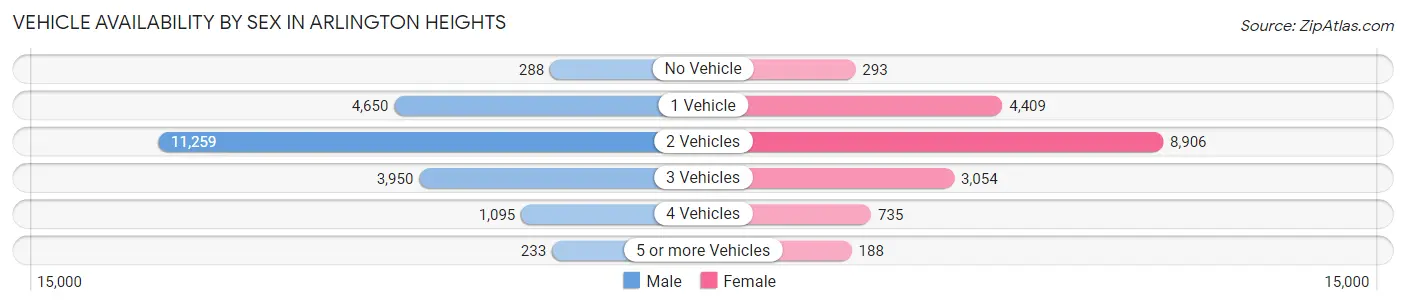
| Vehicles Available | Male | Female |
| No Vehicle | 288 (1.3%) | 293 (1.7%) |
| 1 Vehicle | 4,650 (21.6%) | 4,409 (25.1%) |
| 2 Vehicles | 11,259 (52.4%) | 8,906 (50.6%) |
| 3 Vehicles | 3,950 (18.4%) | 3,054 (17.4%) |
| 4 Vehicles | 1,095 (5.1%) | 735 (4.2%) |
| 5 or more Vehicles | 233 (1.1%) | 188 (1.1%) |
| Total | 21,475 (100.0%) | 17,585 (100.0%) |
Commute Time in Arlington Heights
The most frequently occuring commute durations in Arlington Heights are 20 to 24 minutes (5,255 commuters, 16.6%), 30 to 34 minutes (4,953 commuters, 15.7%), and 15 to 19 minutes (3,941 commuters, 12.5%).
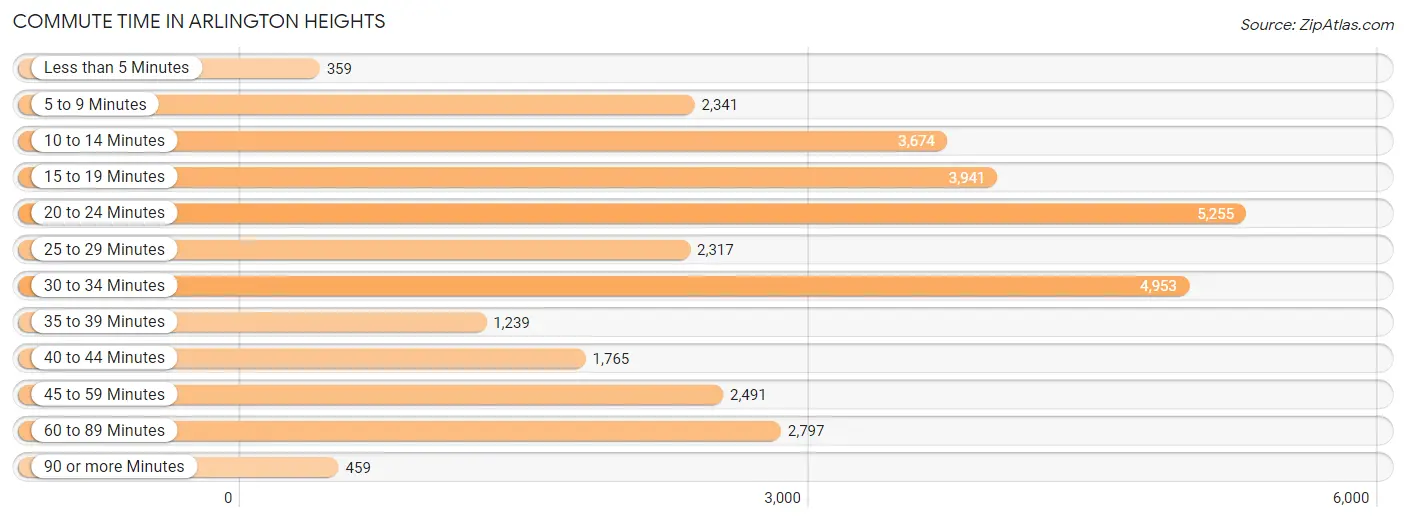
| Commute Time | # Commuters | % Commuters |
| Less than 5 Minutes | 359 | 1.1% |
| 5 to 9 Minutes | 2,341 | 7.4% |
| 10 to 14 Minutes | 3,674 | 11.6% |
| 15 to 19 Minutes | 3,941 | 12.5% |
| 20 to 24 Minutes | 5,255 | 16.6% |
| 25 to 29 Minutes | 2,317 | 7.3% |
| 30 to 34 Minutes | 4,953 | 15.7% |
| 35 to 39 Minutes | 1,239 | 3.9% |
| 40 to 44 Minutes | 1,765 | 5.6% |
| 45 to 59 Minutes | 2,491 | 7.9% |
| 60 to 89 Minutes | 2,797 | 8.8% |
| 90 or more Minutes | 459 | 1.5% |
Commute Time by Sex in Arlington Heights
The most common commute times in Arlington Heights are 30 to 34 minutes (2,926 commuters, 16.6%) for males and 20 to 24 minutes (2,416 commuters, 17.3%) for females.
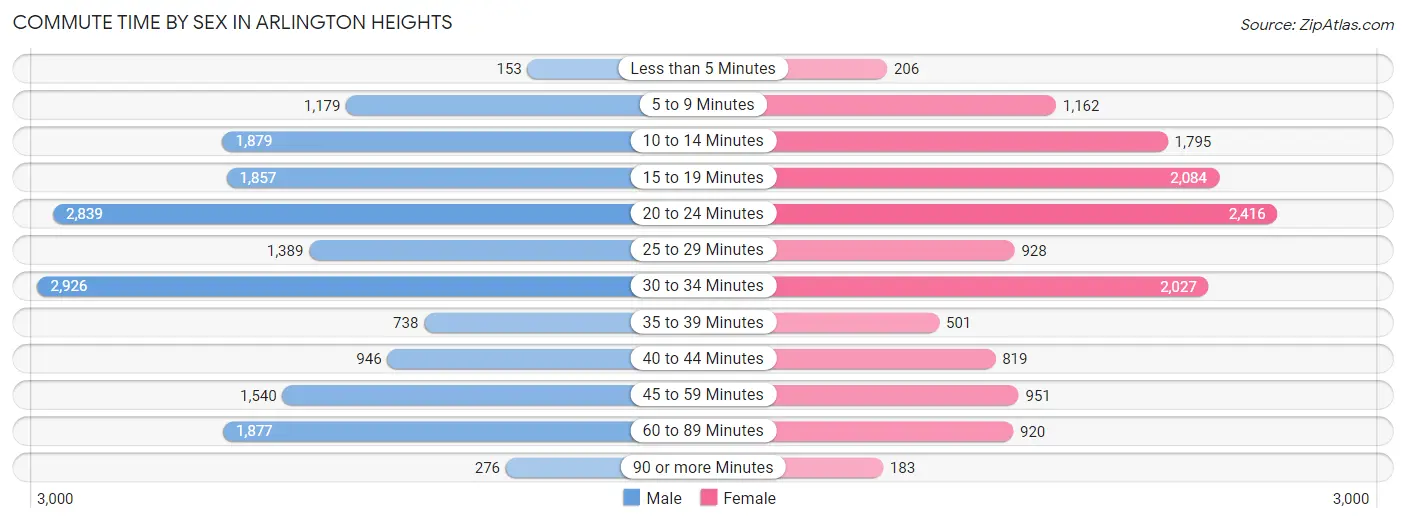
| Commute Time | Male | Female |
| Less than 5 Minutes | 153 (0.9%) | 206 (1.5%) |
| 5 to 9 Minutes | 1,179 (6.7%) | 1,162 (8.3%) |
| 10 to 14 Minutes | 1,879 (10.7%) | 1,795 (12.8%) |
| 15 to 19 Minutes | 1,857 (10.5%) | 2,084 (14.9%) |
| 20 to 24 Minutes | 2,839 (16.1%) | 2,416 (17.3%) |
| 25 to 29 Minutes | 1,389 (7.9%) | 928 (6.6%) |
| 30 to 34 Minutes | 2,926 (16.6%) | 2,027 (14.5%) |
| 35 to 39 Minutes | 738 (4.2%) | 501 (3.6%) |
| 40 to 44 Minutes | 946 (5.4%) | 819 (5.9%) |
| 45 to 59 Minutes | 1,540 (8.7%) | 951 (6.8%) |
| 60 to 89 Minutes | 1,877 (10.7%) | 920 (6.6%) |
| 90 or more Minutes | 276 (1.6%) | 183 (1.3%) |
Time of Departure to Work by Sex in Arlington Heights
The most frequent times of departure to work in Arlington Heights are 7:00 AM to 7:29 AM (3,525, 20.0%) for males and 7:30 AM to 7:59 AM (2,806, 20.1%) for females.
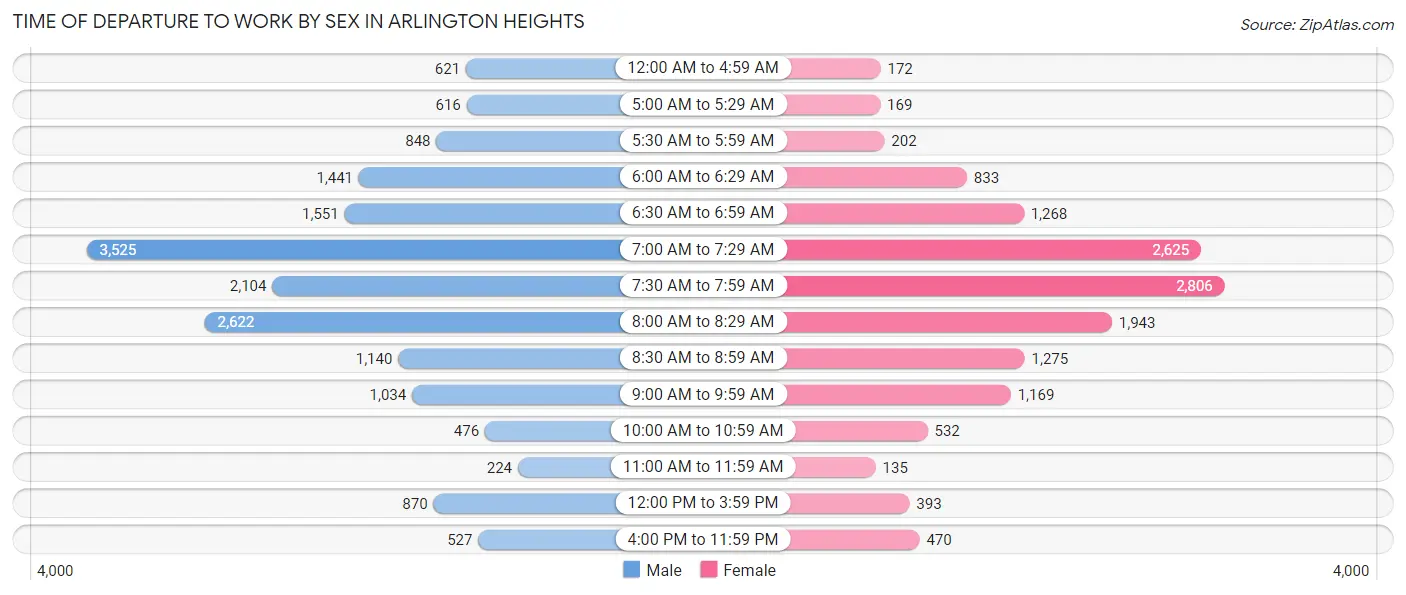
| Time of Departure | Male | Female |
| 12:00 AM to 4:59 AM | 621 (3.5%) | 172 (1.2%) |
| 5:00 AM to 5:29 AM | 616 (3.5%) | 169 (1.2%) |
| 5:30 AM to 5:59 AM | 848 (4.8%) | 202 (1.4%) |
| 6:00 AM to 6:29 AM | 1,441 (8.2%) | 833 (5.9%) |
| 6:30 AM to 6:59 AM | 1,551 (8.8%) | 1,268 (9.1%) |
| 7:00 AM to 7:29 AM | 3,525 (20.0%) | 2,625 (18.8%) |
| 7:30 AM to 7:59 AM | 2,104 (12.0%) | 2,806 (20.1%) |
| 8:00 AM to 8:29 AM | 2,622 (14.9%) | 1,943 (13.9%) |
| 8:30 AM to 8:59 AM | 1,140 (6.5%) | 1,275 (9.1%) |
| 9:00 AM to 9:59 AM | 1,034 (5.9%) | 1,169 (8.4%) |
| 10:00 AM to 10:59 AM | 476 (2.7%) | 532 (3.8%) |
| 11:00 AM to 11:59 AM | 224 (1.3%) | 135 (1.0%) |
| 12:00 PM to 3:59 PM | 870 (4.9%) | 393 (2.8%) |
| 4:00 PM to 11:59 PM | 527 (3.0%) | 470 (3.4%) |
| Total | 17,599 (100.0%) | 13,992 (100.0%) |
Housing Occupancy in Arlington Heights
Occupancy by Ownership in Arlington Heights
Of the total 31,683 dwellings in Arlington Heights, owner-occupied units account for 23,041 (72.7%), while renter-occupied units make up 8,642 (27.3%).
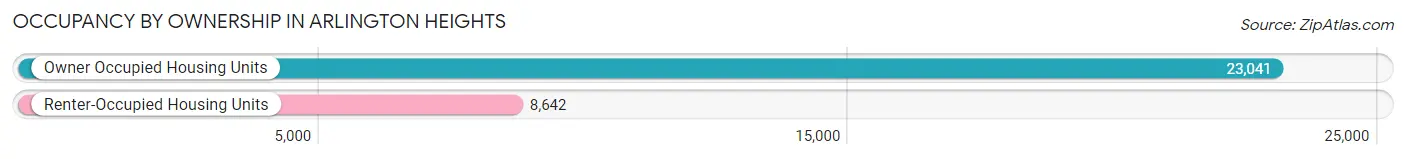
| Occupancy | # Housing Units | % Housing Units |
| Owner Occupied Housing Units | 23,041 | 72.7% |
| Renter-Occupied Housing Units | 8,642 | 27.3% |
| Total Occupied Housing Units | 31,683 | 100.0% |
Occupancy by Household Size in Arlington Heights
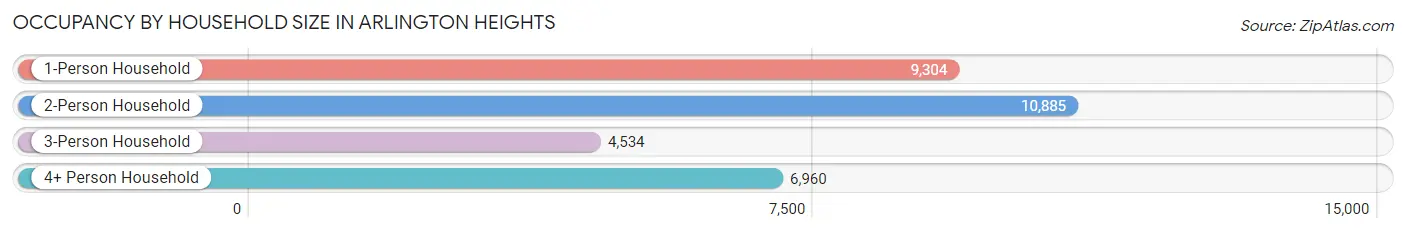
| Household Size | # Housing Units | % Housing Units |
| 1-Person Household | 9,304 | 29.4% |
| 2-Person Household | 10,885 | 34.4% |
| 3-Person Household | 4,534 | 14.3% |
| 4+ Person Household | 6,960 | 22.0% |
| Total Housing Units | 31,683 | 100.0% |
Occupancy by Ownership by Household Size in Arlington Heights
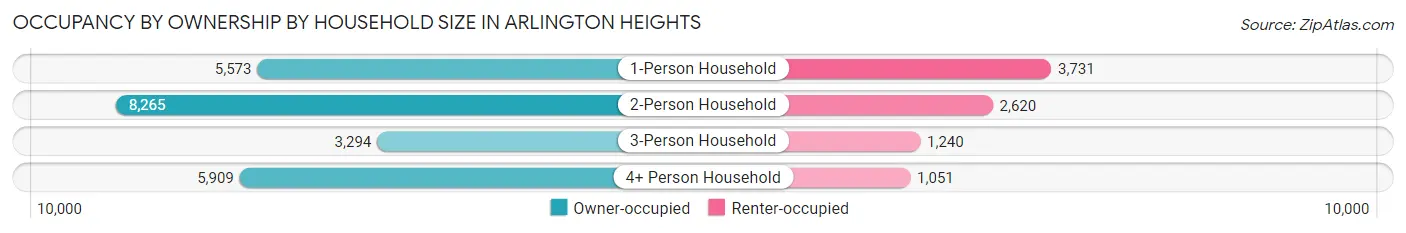
| Household Size | Owner-occupied | Renter-occupied |
| 1-Person Household | 5,573 (59.9%) | 3,731 (40.1%) |
| 2-Person Household | 8,265 (75.9%) | 2,620 (24.1%) |
| 3-Person Household | 3,294 (72.7%) | 1,240 (27.4%) |
| 4+ Person Household | 5,909 (84.9%) | 1,051 (15.1%) |
| Total Housing Units | 23,041 (72.7%) | 8,642 (27.3%) |
Occupancy by Educational Attainment in Arlington Heights
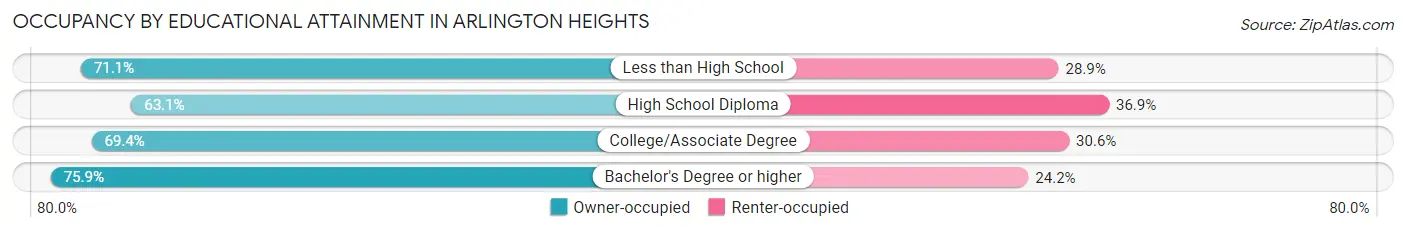
| Household Size | Owner-occupied | Renter-occupied |
| Less than High School | 710 (71.1%) | 289 (28.9%) |
| High School Diploma | 2,604 (63.1%) | 1,525 (36.9%) |
| College/Associate Degree | 4,462 (69.4%) | 1,968 (30.6%) |
| Bachelor's Degree or higher | 15,265 (75.8%) | 4,860 (24.1%) |
Occupancy by Age of Householder in Arlington Heights
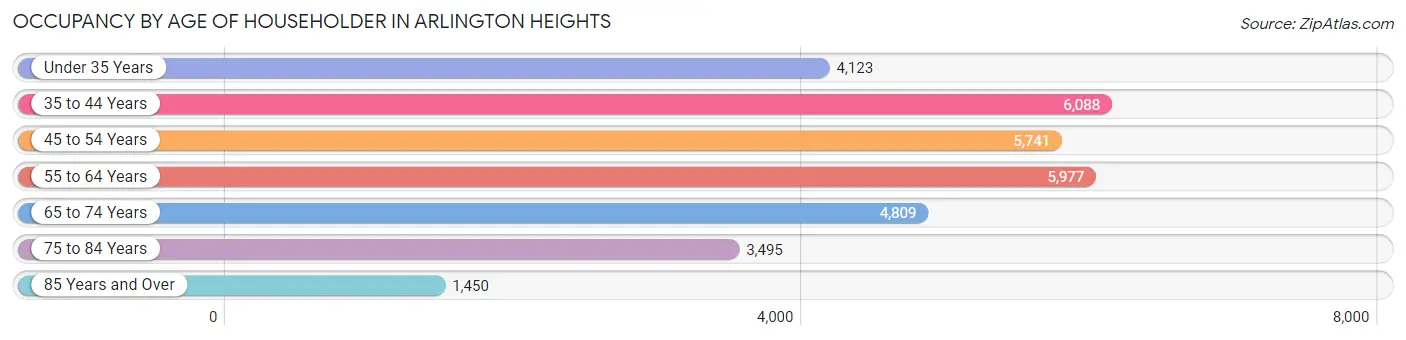
| Age Bracket | # Households | % Households |
| Under 35 Years | 4,123 | 13.0% |
| 35 to 44 Years | 6,088 | 19.2% |
| 45 to 54 Years | 5,741 | 18.1% |
| 55 to 64 Years | 5,977 | 18.9% |
| 65 to 74 Years | 4,809 | 15.2% |
| 75 to 84 Years | 3,495 | 11.0% |
| 85 Years and Over | 1,450 | 4.6% |
| Total | 31,683 | 100.0% |
Housing Finances in Arlington Heights
Median Income by Occupancy in Arlington Heights
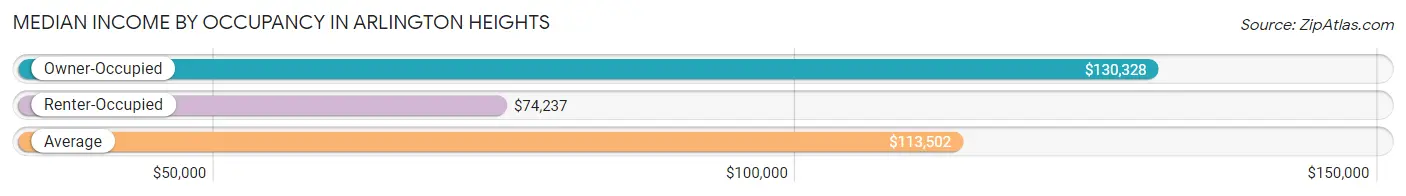
| Occupancy Type | # Households | Median Income |
| Owner-Occupied | 23,041 (72.7%) | $130,328 |
| Renter-Occupied | 8,642 (27.3%) | $74,237 |
| Average | 31,683 (100.0%) | $113,502 |
Occupancy by Householder Income Bracket in Arlington Heights
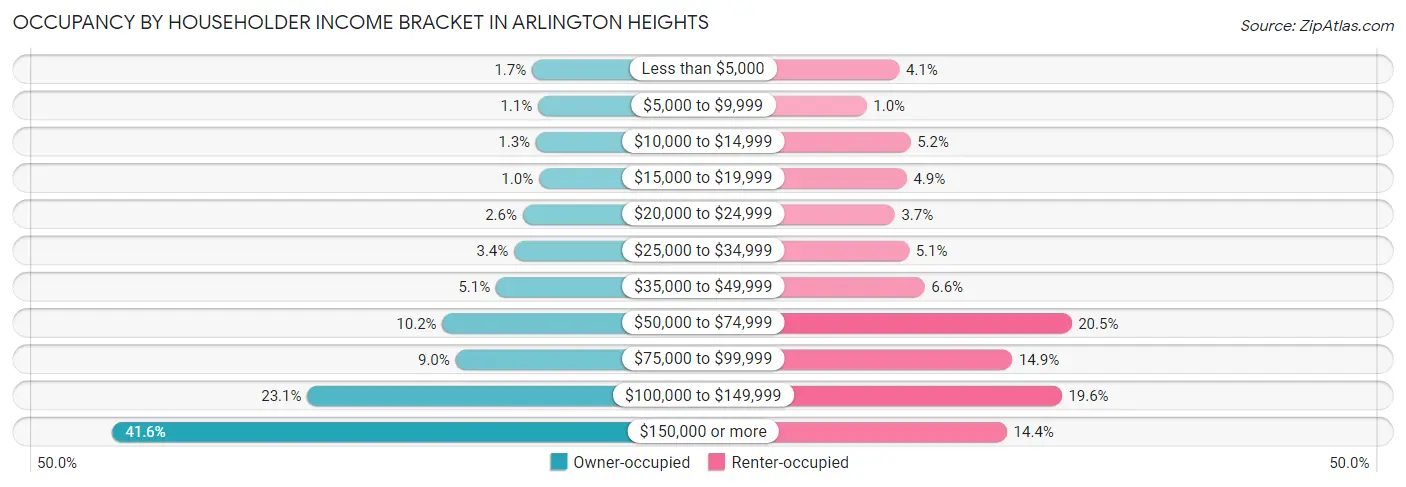
| Income Bracket | Owner-occupied | Renter-occupied |
| Less than $5,000 | 385 (1.7%) | 358 (4.1%) |
| $5,000 to $9,999 | 254 (1.1%) | 89 (1.0%) |
| $10,000 to $14,999 | 299 (1.3%) | 450 (5.2%) |
| $15,000 to $19,999 | 232 (1.0%) | 419 (4.9%) |
| $20,000 to $24,999 | 588 (2.5%) | 321 (3.7%) |
| $25,000 to $34,999 | 779 (3.4%) | 437 (5.1%) |
| $35,000 to $49,999 | 1,175 (5.1%) | 566 (6.6%) |
| $50,000 to $74,999 | 2,353 (10.2%) | 1,775 (20.5%) |
| $75,000 to $99,999 | 2,063 (8.9%) | 1,288 (14.9%) |
| $100,000 to $149,999 | 5,319 (23.1%) | 1,695 (19.6%) |
| $150,000 or more | 9,594 (41.6%) | 1,244 (14.4%) |
| Total | 23,041 (100.0%) | 8,642 (100.0%) |
Monthly Housing Cost Tiers in Arlington Heights
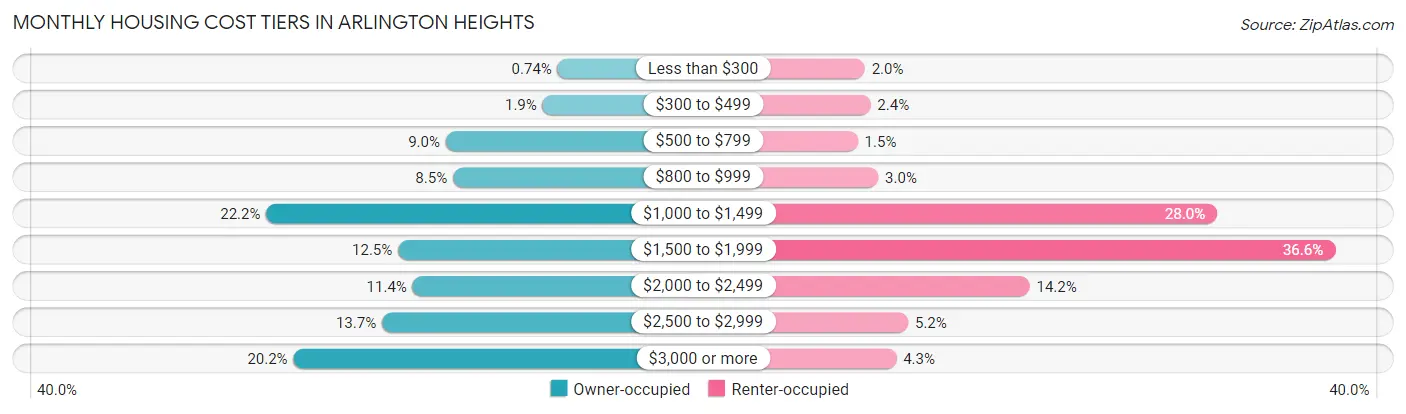
| Monthly Cost | Owner-occupied | Renter-occupied |
| Less than $300 | 170 (0.7%) | 174 (2.0%) |
| $300 to $499 | 426 (1.8%) | 210 (2.4%) |
| $500 to $799 | 2,069 (9.0%) | 129 (1.5%) |
| $800 to $999 | 1,948 (8.5%) | 259 (3.0%) |
| $1,000 to $1,499 | 5,114 (22.2%) | 2,416 (28.0%) |
| $1,500 to $1,999 | 2,877 (12.5%) | 3,166 (36.6%) |
| $2,000 to $2,499 | 2,631 (11.4%) | 1,223 (14.1%) |
| $2,500 to $2,999 | 3,152 (13.7%) | 449 (5.2%) |
| $3,000 or more | 4,654 (20.2%) | 374 (4.3%) |
| Total | 23,041 (100.0%) | 8,642 (100.0%) |
Physical Housing Characteristics in Arlington Heights
Housing Structures in Arlington Heights
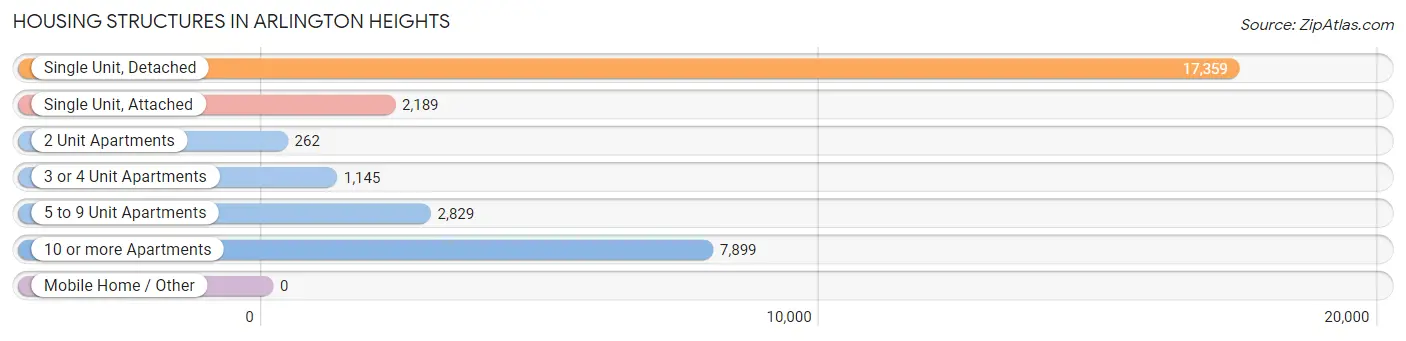
| Structure Type | # Housing Units | % Housing Units |
| Single Unit, Detached | 17,359 | 54.8% |
| Single Unit, Attached | 2,189 | 6.9% |
| 2 Unit Apartments | 262 | 0.8% |
| 3 or 4 Unit Apartments | 1,145 | 3.6% |
| 5 to 9 Unit Apartments | 2,829 | 8.9% |
| 10 or more Apartments | 7,899 | 24.9% |
| Mobile Home / Other | 0 | 0.0% |
| Total | 31,683 | 100.0% |
Housing Structures by Occupancy in Arlington Heights
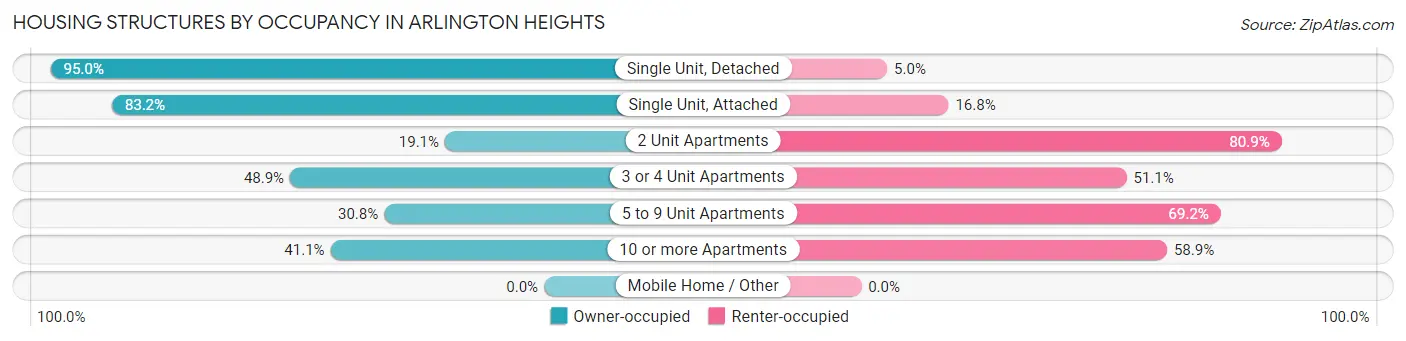
| Structure Type | Owner-occupied | Renter-occupied |
| Single Unit, Detached | 16,491 (95.0%) | 868 (5.0%) |
| Single Unit, Attached | 1,821 (83.2%) | 368 (16.8%) |
| 2 Unit Apartments | 50 (19.1%) | 212 (80.9%) |
| 3 or 4 Unit Apartments | 560 (48.9%) | 585 (51.1%) |
| 5 to 9 Unit Apartments | 871 (30.8%) | 1,958 (69.2%) |
| 10 or more Apartments | 3,248 (41.1%) | 4,651 (58.9%) |
| Mobile Home / Other | 0 (0.0%) | 0 (0.0%) |
| Total | 23,041 (72.7%) | 8,642 (27.3%) |
Housing Structures by Number of Rooms in Arlington Heights
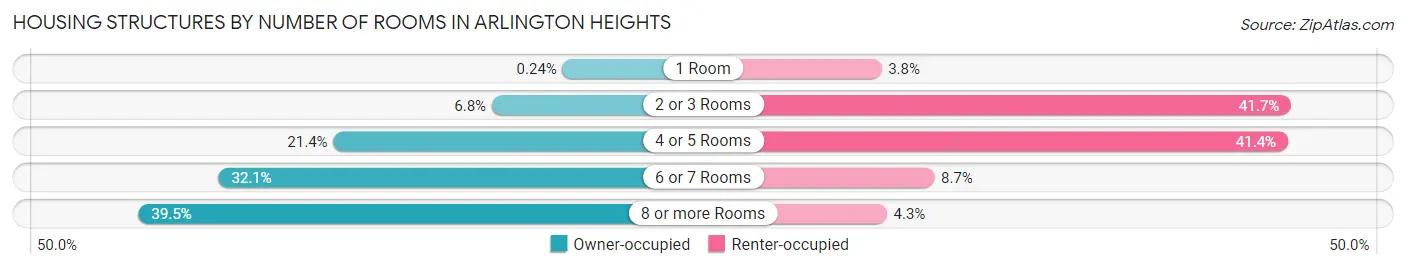
| Number of Rooms | Owner-occupied | Renter-occupied |
| 1 Room | 55 (0.2%) | 330 (3.8%) |
| 2 or 3 Rooms | 1,562 (6.8%) | 3,606 (41.7%) |
| 4 or 5 Rooms | 4,940 (21.4%) | 3,580 (41.4%) |
| 6 or 7 Rooms | 7,390 (32.1%) | 753 (8.7%) |
| 8 or more Rooms | 9,094 (39.5%) | 373 (4.3%) |
| Total | 23,041 (100.0%) | 8,642 (100.0%) |
Housing Structure by Heating Type in Arlington Heights
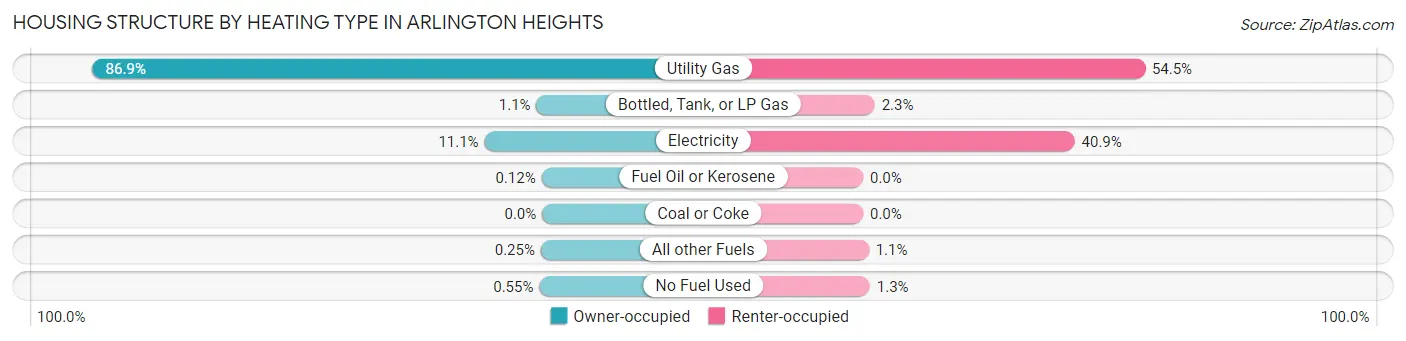
| Heating Type | Owner-occupied | Renter-occupied |
| Utility Gas | 20,010 (86.9%) | 4,707 (54.5%) |
| Bottled, Tank, or LP Gas | 254 (1.1%) | 195 (2.3%) |
| Electricity | 2,567 (11.1%) | 3,533 (40.9%) |
| Fuel Oil or Kerosene | 27 (0.1%) | 0 (0.0%) |
| Coal or Coke | 0 (0.0%) | 0 (0.0%) |
| All other Fuels | 57 (0.3%) | 94 (1.1%) |
| No Fuel Used | 126 (0.5%) | 113 (1.3%) |
| Total | 23,041 (100.0%) | 8,642 (100.0%) |
Household Vehicle Usage in Arlington Heights
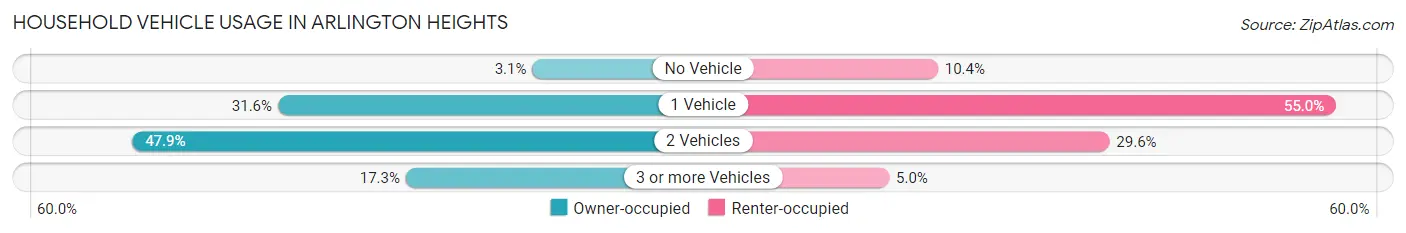
| Vehicles per Household | Owner-occupied | Renter-occupied |
| No Vehicle | 722 (3.1%) | 899 (10.4%) |
| 1 Vehicle | 7,288 (31.6%) | 4,754 (55.0%) |
| 2 Vehicles | 11,046 (47.9%) | 2,561 (29.6%) |
| 3 or more Vehicles | 3,985 (17.3%) | 428 (5.0%) |
| Total | 23,041 (100.0%) | 8,642 (100.0%) |
Real Estate & Mortgages in Arlington Heights
Real Estate and Mortgage Overview in Arlington Heights
| Characteristic | Without Mortgage | With Mortgage |
| Housing Units | 8,681 | 14,360 |
| Median Property Value | $361,000 | $416,700 |
| Median Household Income | $101,590 | $7,119 |
| Monthly Housing Costs | $1,030 | $4,654 |
| Real Estate Taxes | $7,908 | $116 |
Property Value by Mortgage Status in Arlington Heights
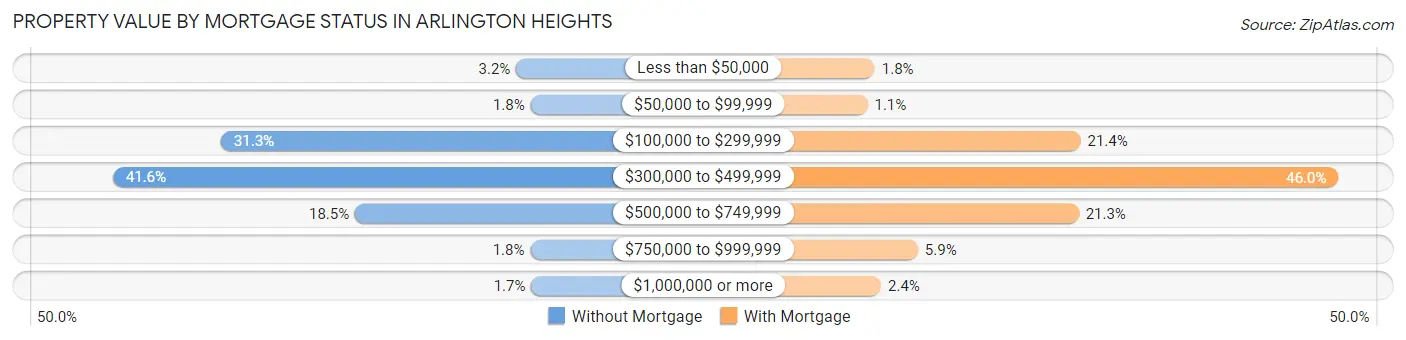
| Property Value | Without Mortgage | With Mortgage |
| Less than $50,000 | 276 (3.2%) | 264 (1.8%) |
| $50,000 to $99,999 | 157 (1.8%) | 163 (1.1%) |
| $100,000 to $299,999 | 2,717 (31.3%) | 3,078 (21.4%) |
| $300,000 to $499,999 | 3,611 (41.6%) | 6,601 (46.0%) |
| $500,000 to $749,999 | 1,609 (18.5%) | 3,052 (21.2%) |
| $750,000 to $999,999 | 160 (1.8%) | 853 (5.9%) |
| $1,000,000 or more | 151 (1.7%) | 349 (2.4%) |
| Total | 8,681 (100.0%) | 14,360 (100.0%) |
Household Income by Mortgage Status in Arlington Heights
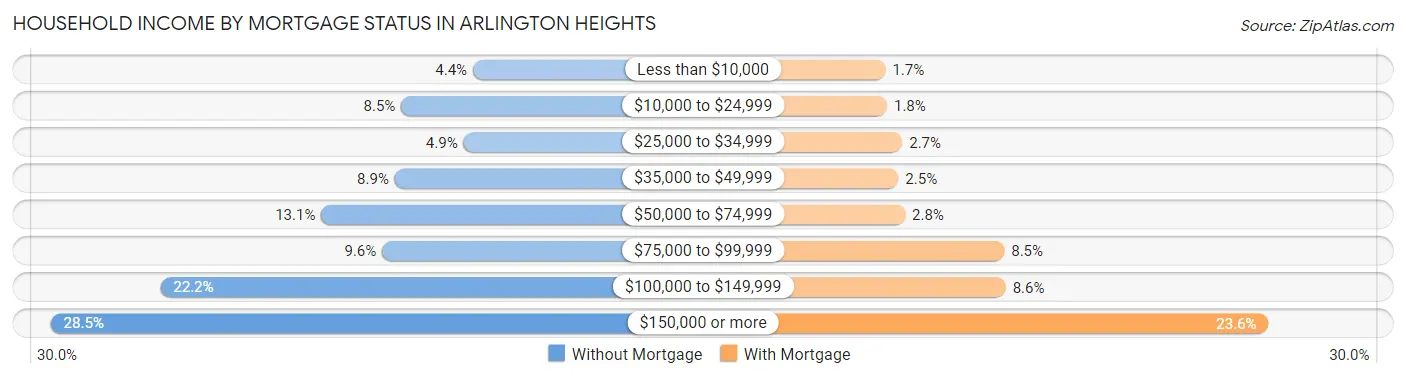
| Household Income | Without Mortgage | With Mortgage |
| Less than $10,000 | 380 (4.4%) | 246 (1.7%) |
| $10,000 to $24,999 | 736 (8.5%) | 259 (1.8%) |
| $25,000 to $34,999 | 427 (4.9%) | 383 (2.7%) |
| $35,000 to $49,999 | 768 (8.8%) | 352 (2.5%) |
| $50,000 to $74,999 | 1,133 (13.1%) | 407 (2.8%) |
| $75,000 to $99,999 | 831 (9.6%) | 1,220 (8.5%) |
| $100,000 to $149,999 | 1,931 (22.2%) | 1,232 (8.6%) |
| $150,000 or more | 2,475 (28.5%) | 3,388 (23.6%) |
| Total | 8,681 (100.0%) | 14,360 (100.0%) |
Property Value to Household Income Ratio in Arlington Heights
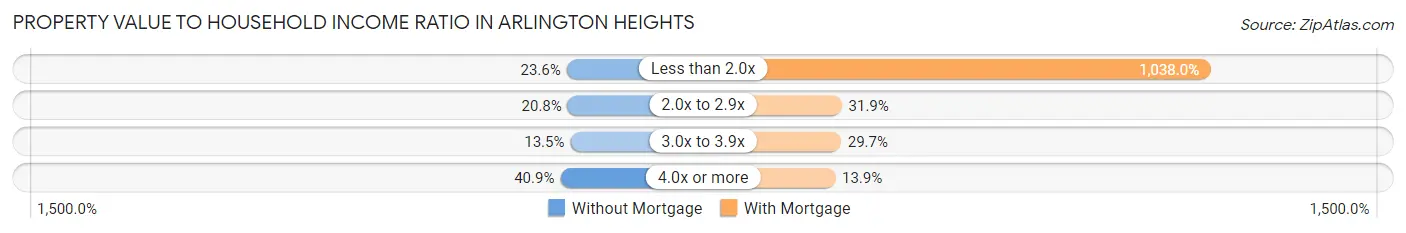
| Value-to-Income Ratio | Without Mortgage | With Mortgage |
| Less than 2.0x | 2,047 (23.6%) | 149,053 (1,038.0%) |
| 2.0x to 2.9x | 1,801 (20.7%) | 4,582 (31.9%) |
| 3.0x to 3.9x | 1,169 (13.5%) | 4,269 (29.7%) |
| 4.0x or more | 3,546 (40.8%) | 1,999 (13.9%) |
| Total | 8,681 (100.0%) | 14,360 (100.0%) |
Real Estate Taxes by Mortgage Status in Arlington Heights
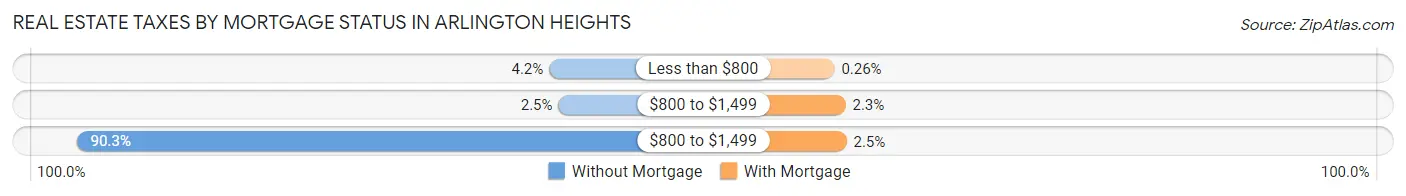
| Property Taxes | Without Mortgage | With Mortgage |
| Less than $800 | 365 (4.2%) | 37 (0.3%) |
| $800 to $1,499 | 218 (2.5%) | 328 (2.3%) |
| $800 to $1,499 | 7,841 (90.3%) | 353 (2.5%) |
| Total | 8,681 (100.0%) | 14,360 (100.0%) |
Health & Disability in Arlington Heights
Health Insurance Coverage by Age in Arlington Heights
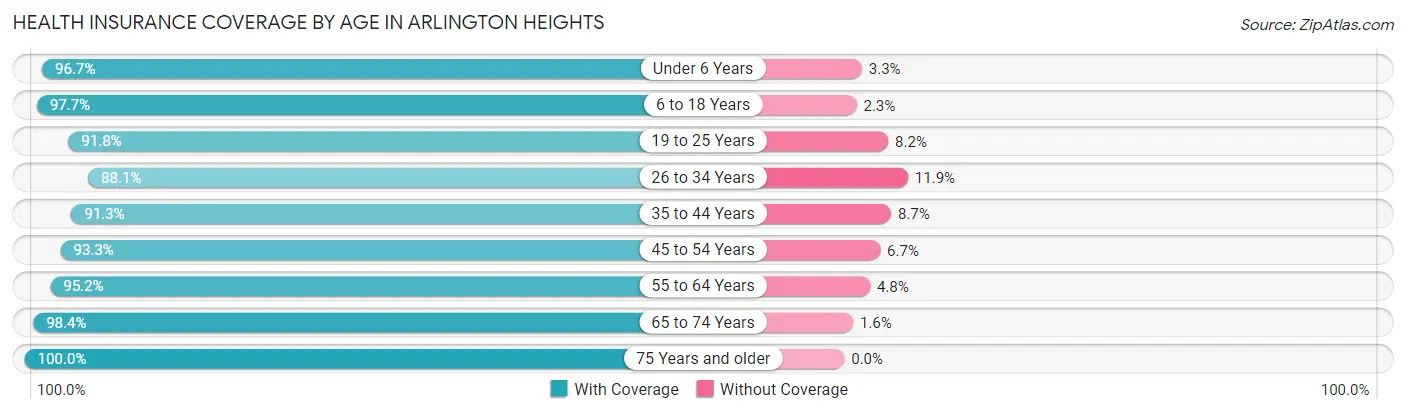
| Age Bracket | With Coverage | Without Coverage |
| Under 6 Years | 5,977 (96.7%) | 202 (3.3%) |
| 6 to 18 Years | 11,586 (97.7%) | 270 (2.3%) |
| 19 to 25 Years | 3,287 (91.8%) | 293 (8.2%) |
| 26 to 34 Years | 6,995 (88.1%) | 941 (11.9%) |
| 35 to 44 Years | 10,070 (91.3%) | 961 (8.7%) |
| 45 to 54 Years | 9,756 (93.3%) | 699 (6.7%) |
| 55 to 64 Years | 10,025 (95.2%) | 504 (4.8%) |
| 65 to 74 Years | 7,778 (98.4%) | 127 (1.6%) |
| 75 Years and older | 6,809 (100.0%) | 0 (0.0%) |
| Total | 72,283 (94.8%) | 3,997 (5.2%) |
Health Insurance Coverage by Citizenship Status in Arlington Heights
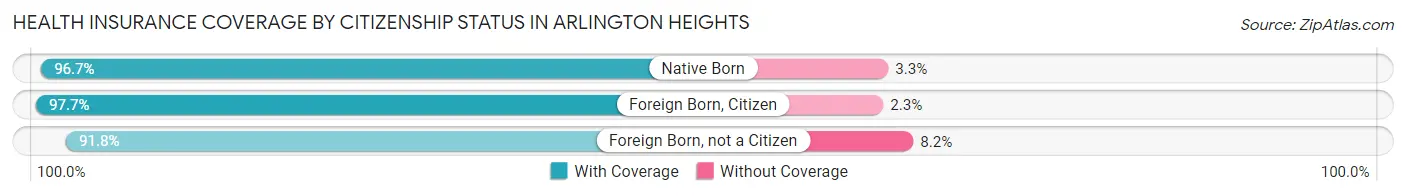
| Citizenship Status | With Coverage | Without Coverage |
| Native Born | 5,977 (96.7%) | 202 (3.3%) |
| Foreign Born, Citizen | 11,586 (97.7%) | 270 (2.3%) |
| Foreign Born, not a Citizen | 3,287 (91.8%) | 293 (8.2%) |
Health Insurance Coverage by Household Income in Arlington Heights
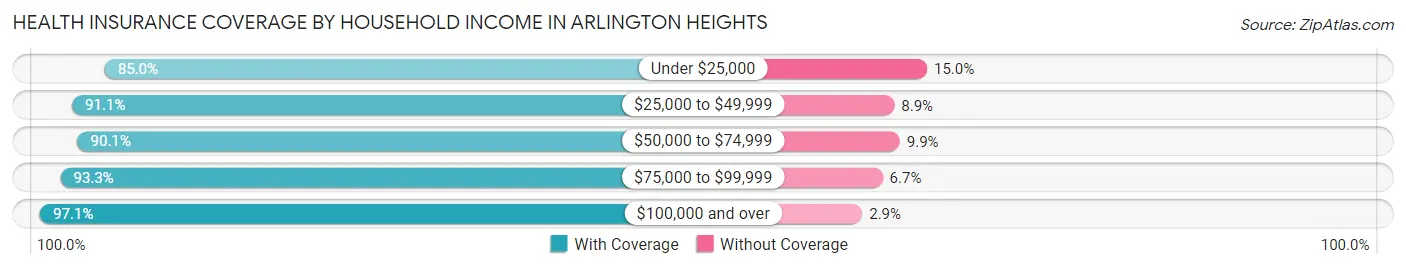
| Household Income | With Coverage | Without Coverage |
| Under $25,000 | 4,047 (85.0%) | 716 (15.0%) |
| $25,000 to $49,999 | 4,571 (91.1%) | 447 (8.9%) |
| $50,000 to $74,999 | 7,853 (90.1%) | 867 (9.9%) |
| $75,000 to $99,999 | 6,915 (93.3%) | 498 (6.7%) |
| $100,000 and over | 48,615 (97.1%) | 1,453 (2.9%) |
Public vs Private Health Insurance Coverage by Age in Arlington Heights
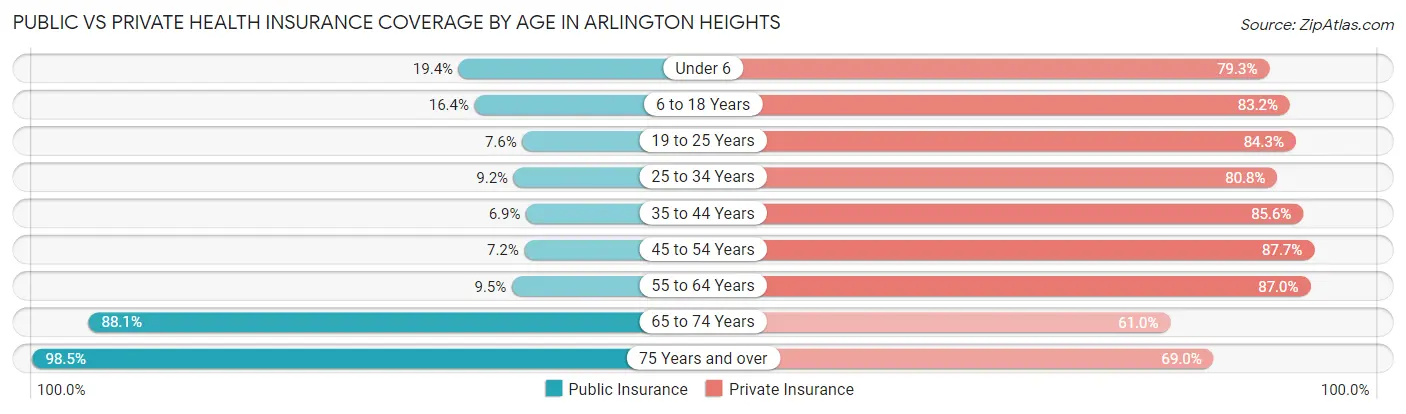
| Age Bracket | Public Insurance | Private Insurance |
| Under 6 | 1,198 (19.4%) | 4,902 (79.3%) |
| 6 to 18 Years | 1,949 (16.4%) | 9,860 (83.2%) |
| 19 to 25 Years | 271 (7.6%) | 3,016 (84.3%) |
| 25 to 34 Years | 728 (9.2%) | 6,415 (80.8%) |
| 35 to 44 Years | 759 (6.9%) | 9,447 (85.6%) |
| 45 to 54 Years | 752 (7.2%) | 9,165 (87.7%) |
| 55 to 64 Years | 1,001 (9.5%) | 9,155 (87.0%) |
| 65 to 74 Years | 6,966 (88.1%) | 4,819 (61.0%) |
| 75 Years and over | 6,709 (98.5%) | 4,699 (69.0%) |
| Total | 20,333 (26.7%) | 61,478 (80.6%) |
Disability Status by Sex by Age in Arlington Heights
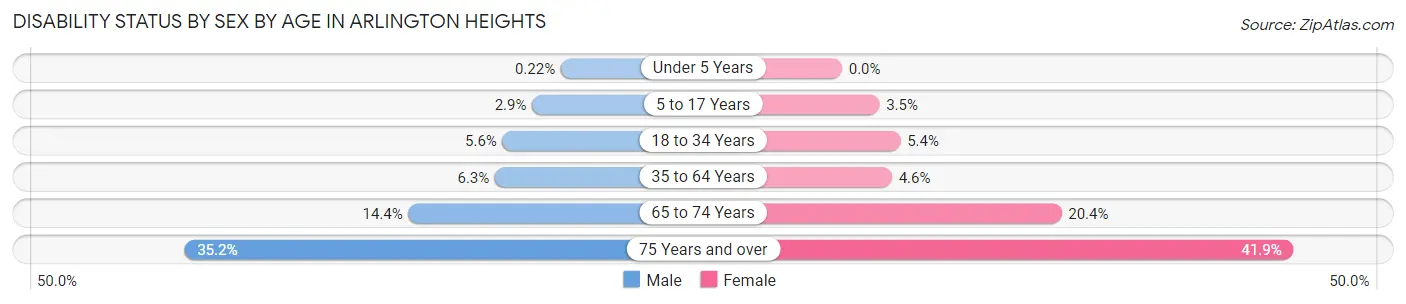
| Age Bracket | Male | Female |
| Under 5 Years | 6 (0.2%) | 0 (0.0%) |
| 5 to 17 Years | 177 (2.9%) | 213 (3.5%) |
| 18 to 34 Years | 349 (5.6%) | 322 (5.4%) |
| 35 to 64 Years | 1,034 (6.3%) | 726 (4.6%) |
| 65 to 74 Years | 542 (14.4%) | 842 (20.4%) |
| 75 Years and over | 973 (35.2%) | 1,695 (41.9%) |
Disability Class by Sex by Age in Arlington Heights
Disability Class: Hearing Difficulty
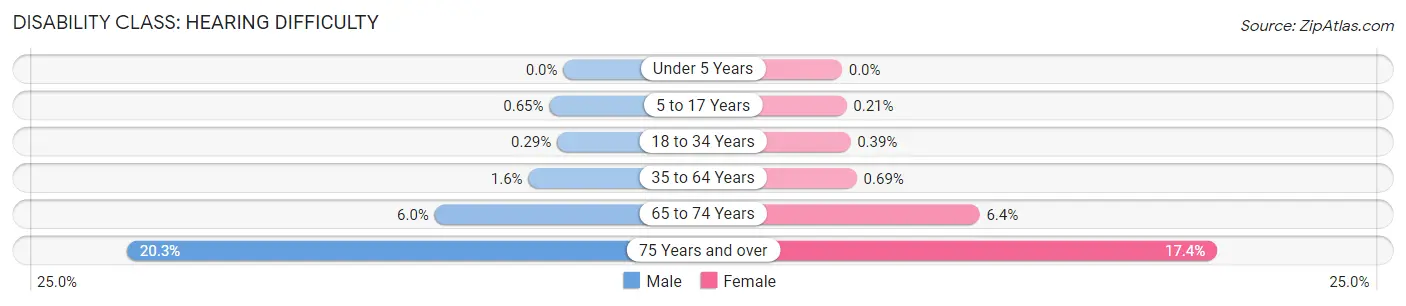
| Age Bracket | Male | Female |
| Under 5 Years | 0 (0.0%) | 0 (0.0%) |
| 5 to 17 Years | 40 (0.6%) | 13 (0.2%) |
| 18 to 34 Years | 18 (0.3%) | 23 (0.4%) |
| 35 to 64 Years | 265 (1.6%) | 108 (0.7%) |
| 65 to 74 Years | 225 (6.0%) | 264 (6.4%) |
| 75 Years and over | 560 (20.3%) | 704 (17.4%) |
Disability Class: Vision Difficulty
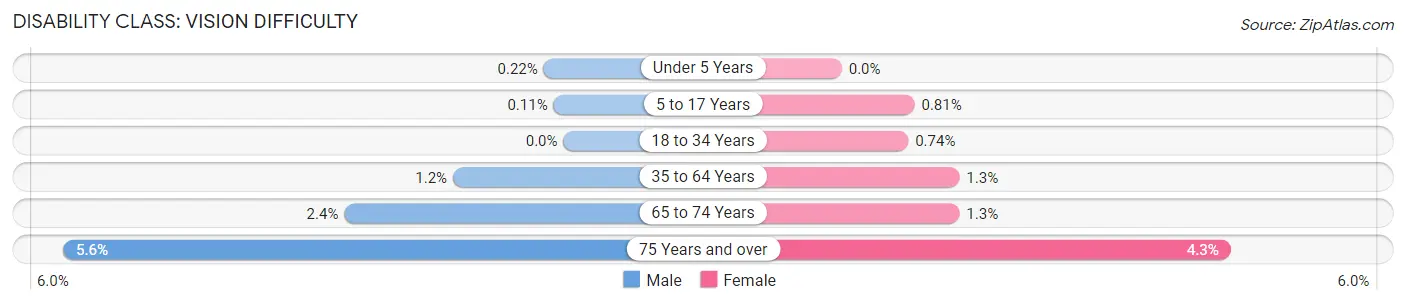
| Age Bracket | Male | Female |
| Under 5 Years | 6 (0.2%) | 0 (0.0%) |
| 5 to 17 Years | 7 (0.1%) | 50 (0.8%) |
| 18 to 34 Years | 0 (0.0%) | 44 (0.7%) |
| 35 to 64 Years | 201 (1.2%) | 206 (1.3%) |
| 65 to 74 Years | 92 (2.4%) | 54 (1.3%) |
| 75 Years and over | 154 (5.6%) | 175 (4.3%) |
Disability Class: Cognitive Difficulty
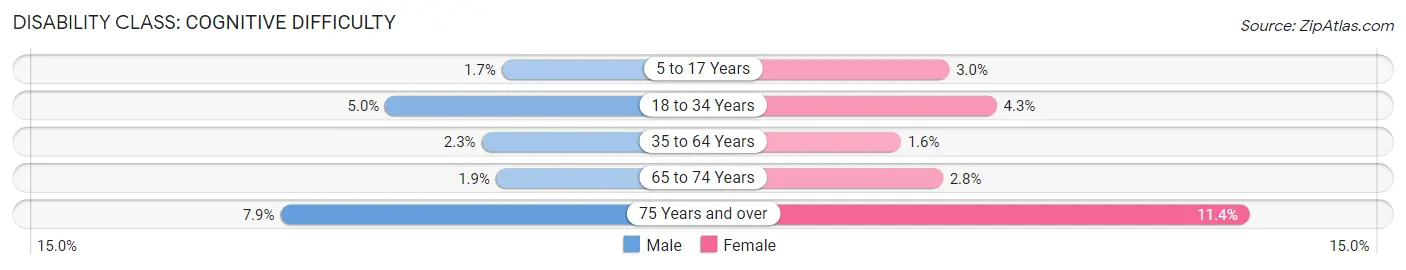
| Age Bracket | Male | Female |
| 5 to 17 Years | 106 (1.7%) | 184 (3.0%) |
| 18 to 34 Years | 308 (5.0%) | 256 (4.3%) |
| 35 to 64 Years | 373 (2.3%) | 258 (1.6%) |
| 65 to 74 Years | 71 (1.9%) | 116 (2.8%) |
| 75 Years and over | 218 (7.9%) | 459 (11.4%) |
Disability Class: Ambulatory Difficulty
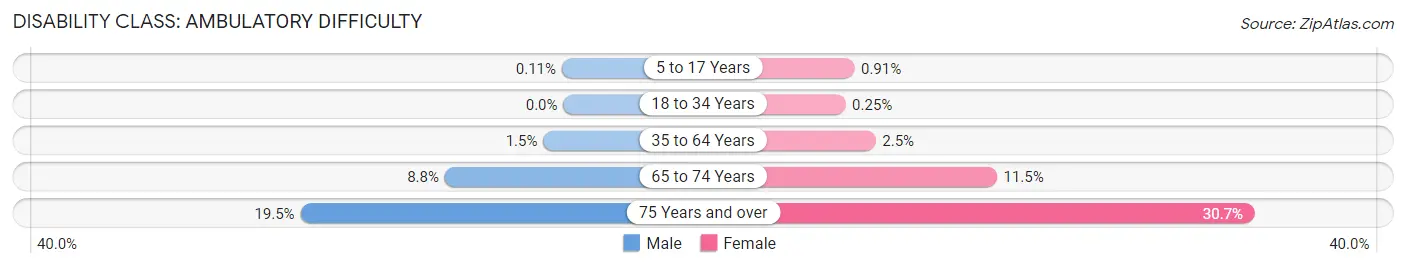
| Age Bracket | Male | Female |
| 5 to 17 Years | 7 (0.1%) | 56 (0.9%) |
| 18 to 34 Years | 0 (0.0%) | 15 (0.3%) |
| 35 to 64 Years | 243 (1.5%) | 390 (2.5%) |
| 65 to 74 Years | 332 (8.8%) | 475 (11.5%) |
| 75 Years and over | 540 (19.5%) | 1,240 (30.7%) |
Disability Class: Self-Care Difficulty
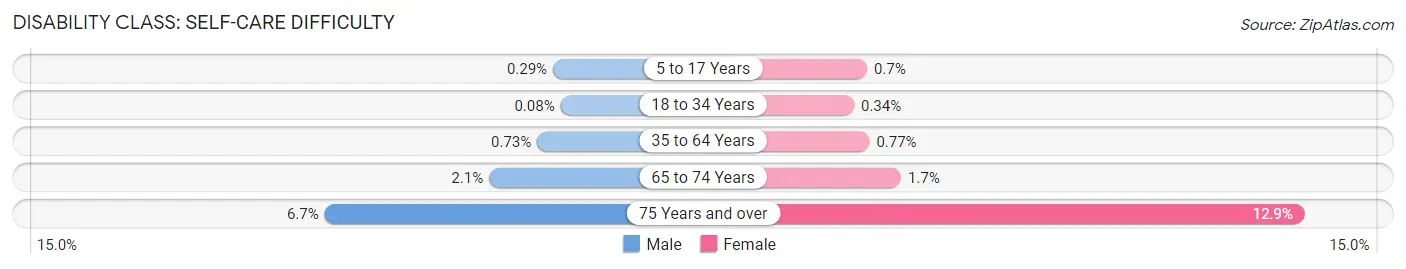
| Age Bracket | Male | Female |
| 5 to 17 Years | 18 (0.3%) | 43 (0.7%) |
| 18 to 34 Years | 5 (0.1%) | 20 (0.3%) |
| 35 to 64 Years | 119 (0.7%) | 121 (0.8%) |
| 65 to 74 Years | 78 (2.1%) | 68 (1.7%) |
| 75 Years and over | 184 (6.7%) | 521 (12.9%) |
Technology Access in Arlington Heights
Computing Device Access in Arlington Heights
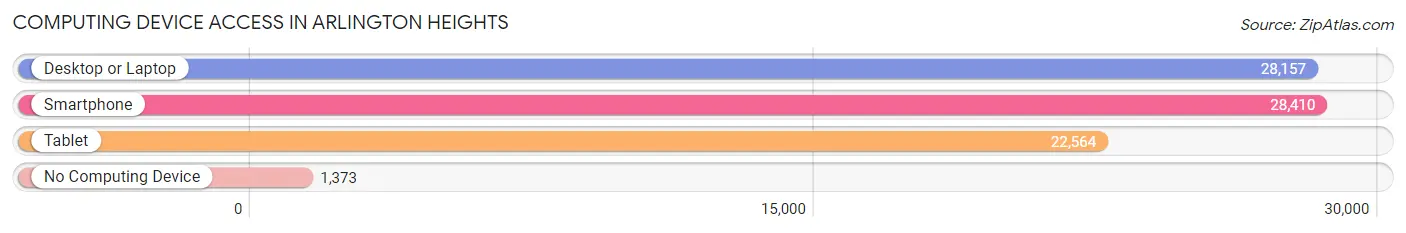
| Device Type | # Households | % Households |
| Desktop or Laptop | 28,157 | 88.9% |
| Smartphone | 28,410 | 89.7% |
| Tablet | 22,564 | 71.2% |
| No Computing Device | 1,373 | 4.3% |
| Total | 31,683 | 100.0% |
Internet Access in Arlington Heights
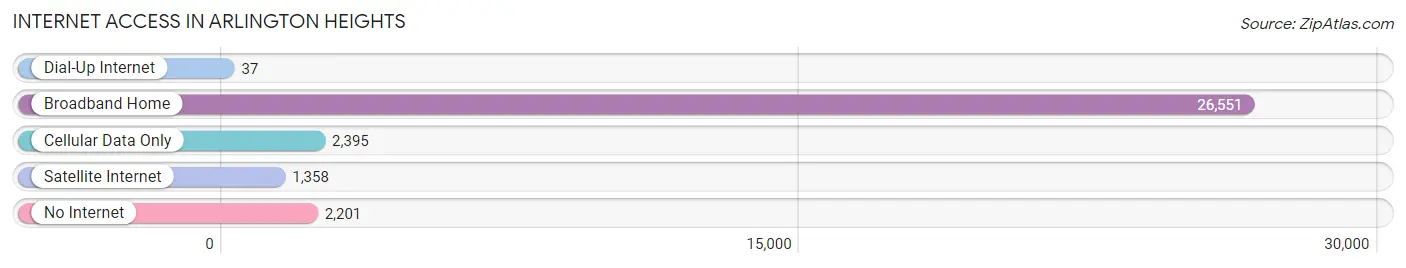
| Internet Type | # Households | % Households |
| Dial-Up Internet | 37 | 0.1% |
| Broadband Home | 26,551 | 83.8% |
| Cellular Data Only | 2,395 | 7.6% |
| Satellite Internet | 1,358 | 4.3% |
| No Internet | 2,201 | 7.0% |
| Total | 31,683 | 100.0% |
Arlington Heights Summary
Arlington Heights is a village located in Cook County, Illinois, United States. It is a suburb of Chicago, located about 25 miles northwest of the city. As of the 2010 census, the village had a population of 75,101. It is the most populous community in the United States that is incorporated as a village.
History
Arlington Heights was first settled in the 1830s by German immigrants. The village was originally known as Dunton, and was renamed in 1877 after General Robert E. Lee's Virginia estate, Arlington House. The village was incorporated in 1887.
In the early 20th century, Arlington Heights was a small farming community. The village experienced rapid growth after World War II, when the population increased from about 3,000 to over 75,000. This growth was largely due to the expansion of the Chicago metropolitan area and the availability of affordable housing.
Geography
Arlington Heights is located in northeastern Illinois, about 25 miles northwest of Chicago. It is bordered by Palatine to the north, Rolling Meadows to the northeast, Elk Grove Village to the east, Mount Prospect to the southeast, Prospect Heights to the south, and Wheeling to the west.
The village has a total area of 16.6 square miles, of which 16.3 square miles is land and 0.3 square miles is water. The village is located in the Fox River Valley, and is drained by the Fox River.
Economy
Arlington Heights is a major economic center in the Chicago metropolitan area. The village is home to several large employers, including Motorola Solutions, Zurich North America, and the Arlington Park Race Track. The village is also home to a number of retail and dining establishments, as well as a variety of professional services.
Demographics
As of the 2010 census, there were 75,101 people, 28,845 households, and 20,845 families residing in the village. The population density was 4,567.3 people per square mile. The racial makeup of the village was 79.2% White, 4.3% African American, 0.2% Native American, 9.3% Asian, 0.1% Pacific Islander, 4.2% from other races, and 2.7% from two or more races. Hispanic or Latino of any race were 11.7% of the population.
The median income for a household in the village was $76,824, and the median income for a family was $90,945. The per capita income for the village was $37,945. About 3.2% of families and 4.7% of the population were below the poverty line, including 5.2% of those under age 18 and 4.2% of those age 65 or over.
Common Questions
What is Per Capita Income in Arlington Heights?
Per Capita income in Arlington Heights is $58,712.
What is the Median Family Income in Arlington Heights?
Median Family Income in Arlington Heights is $143,272.
What is the Median Household income in Arlington Heights?
Median Household Income in Arlington Heights is $113,502.
What is Income or Wage Gap in Arlington Heights?
Income or Wage Gap in Arlington Heights is 26.0%.
Women in Arlington Heights earn 74.0 cents for every dollar earned by a man.
What is Inequality or Gini Index in Arlington Heights?
Inequality or Gini Index in Arlington Heights is 0.44.
What is the Total Population of Arlington Heights?
Total Population of Arlington Heights is 76,794.
What is the Total Male Population of Arlington Heights?
Total Male Population of Arlington Heights is 38,076.
What is the Total Female Population of Arlington Heights?
Total Female Population of Arlington Heights is 38,718.
What is the Ratio of Males per 100 Females in Arlington Heights?
There are 98.34 Males per 100 Females in Arlington Heights.
What is the Ratio of Females per 100 Males in Arlington Heights?
There are 101.69 Females per 100 Males in Arlington Heights.
What is the Median Population Age in Arlington Heights?
Median Population Age in Arlington Heights is 42.8 Years.
What is the Average Family Size in Arlington Heights
Average Family Size in Arlington Heights is 3.0 People.
What is the Average Household Size in Arlington Heights
Average Household Size in Arlington Heights is 2.4 People.
How Large is the Labor Force in Arlington Heights?
There are 41,203 People in the Labor Forcein in Arlington Heights.
What is the Percentage of People in the Labor Force in Arlington Heights?
67.5% of People are in the Labor Force in Arlington Heights.
What is the Unemployment Rate in Arlington Heights?
Unemployment Rate in Arlington Heights is 3.5%.