Toms River, NJ Map & Demographics
Toms River Map
Toms River Overview
$47,751
PER CAPITA INCOME
$120,025
AVG FAMILY INCOME
$92,012
AVG HOUSEHOLD INCOME
39.5%
WAGE / INCOME GAP [ % ]
60.5¢/ $1
WAGE / INCOME GAP [ $ ]
$9,080
FAMILY INCOME DEFICIT
0.46
INEQUALITY / GINI INDEX
92,827
TOTAL POPULATION
45,031
MALE POPULATION
47,796
FEMALE POPULATION
94.21
MALES / 100 FEMALES
106.14
FEMALES / 100 MALES
42.3
MEDIAN AGE
3.2
AVG FAMILY SIZE
2.6
AVG HOUSEHOLD SIZE
48,460
LABOR FORCE [ PEOPLE ]
64.2%
PERCENT IN LABOR FORCE
5.7%
UNEMPLOYMENT RATE
Income in Toms River
Income Overview in Toms River
Per Capita Income in Toms River is $47,751, while median incomes of families and households are $120,025 and $92,012 respectively.
| Characteristic | Number | Measure |
| Per Capita Income | 92,827 | $47,751 |
| Median Family Income | 23,094 | $120,025 |
| Mean Family Income | 23,094 | $142,651 |
| Median Household Income | 35,166 | $92,012 |
| Mean Household Income | 35,166 | $123,915 |
| Income Deficit | 23,094 | $9,080 |
| Wage / Income Gap (%) | 92,827 | 39.53% |
| Wage / Income Gap ($) | 92,827 | 60.47¢ per $1 |
| Gini / Inequality Index | 92,827 | 0.46 |
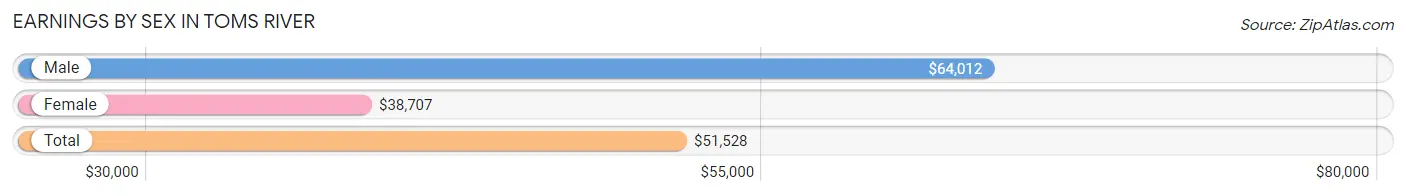
Earnings by Sex in Toms River
Average Earnings in Toms River are $51,528, $64,012 for men and $38,707 for women, a difference of 39.5%.
| Sex | Number | Average Earnings |
| Male | 25,310 (50.8%) | $64,012 |
| Female | 24,517 (49.2%) | $38,707 |
| Total | 49,827 (100.0%) | $51,528 |
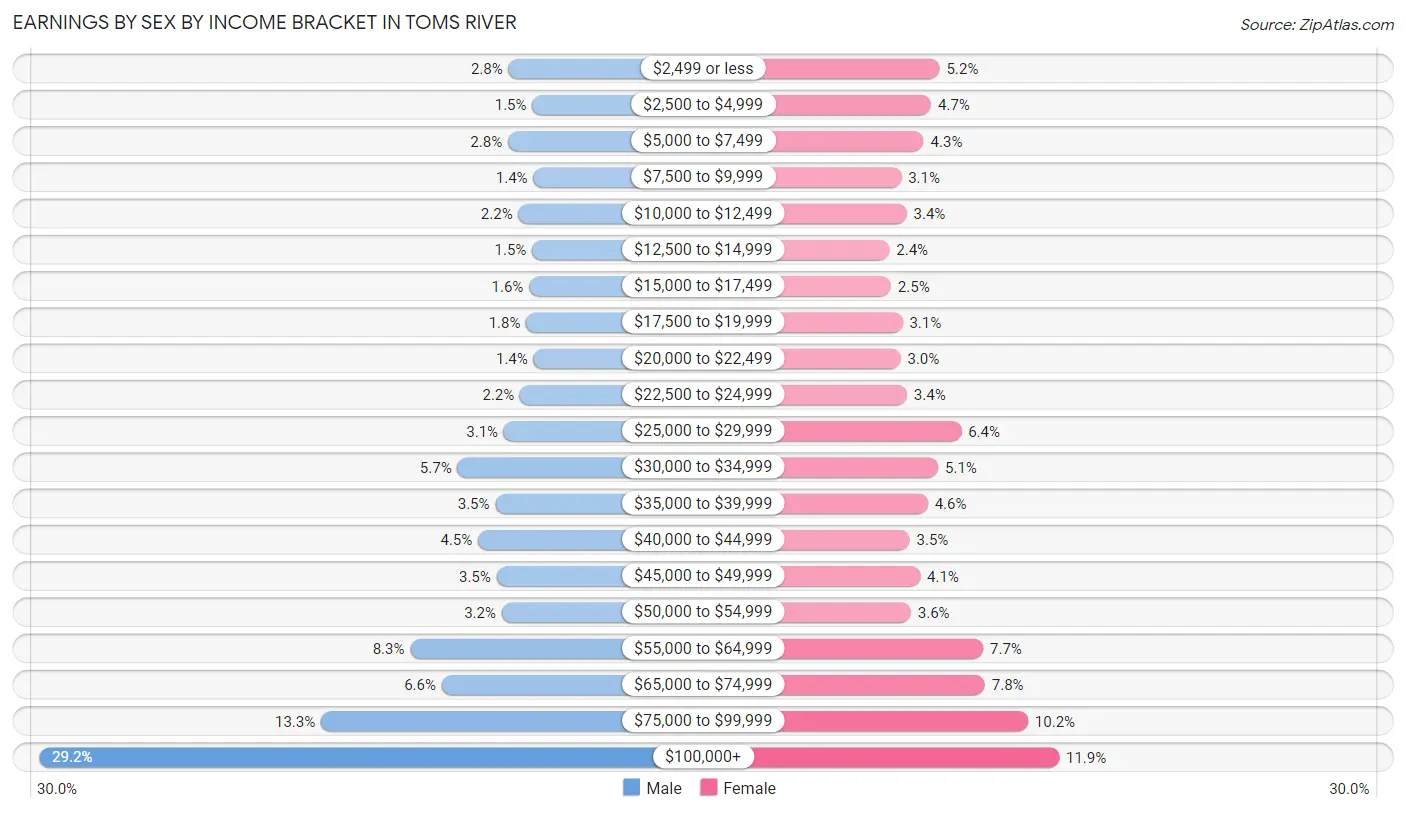
Earnings by Sex by Income Bracket in Toms River
The most common earnings brackets in Toms River are $100,000+ for men (7,386 | 29.2%) and $100,000+ for women (2,926 | 11.9%).
| Income | Male | Female |
| $2,499 or less | 708 (2.8%) | 1,281 (5.2%) |
| $2,500 to $4,999 | 370 (1.5%) | 1,161 (4.7%) |
| $5,000 to $7,499 | 717 (2.8%) | 1,060 (4.3%) |
| $7,500 to $9,999 | 354 (1.4%) | 750 (3.1%) |
| $10,000 to $12,499 | 566 (2.2%) | 823 (3.4%) |
| $12,500 to $14,999 | 373 (1.5%) | 585 (2.4%) |
| $15,000 to $17,499 | 414 (1.6%) | 609 (2.5%) |
| $17,500 to $19,999 | 455 (1.8%) | 767 (3.1%) |
| $20,000 to $22,499 | 353 (1.4%) | 741 (3.0%) |
| $22,500 to $24,999 | 545 (2.1%) | 829 (3.4%) |
| $25,000 to $29,999 | 775 (3.1%) | 1,576 (6.4%) |
| $30,000 to $34,999 | 1,435 (5.7%) | 1,258 (5.1%) |
| $35,000 to $39,999 | 895 (3.5%) | 1,116 (4.5%) |
| $40,000 to $44,999 | 1,141 (4.5%) | 865 (3.5%) |
| $45,000 to $49,999 | 877 (3.5%) | 1,009 (4.1%) |
| $50,000 to $54,999 | 806 (3.2%) | 883 (3.6%) |
| $55,000 to $64,999 | 2,107 (8.3%) | 1,879 (7.7%) |
| $65,000 to $74,999 | 1,657 (6.6%) | 1,902 (7.8%) |
| $75,000 to $99,999 | 3,376 (13.3%) | 2,497 (10.2%) |
| $100,000+ | 7,386 (29.2%) | 2,926 (11.9%) |
| Total | 25,310 (100.0%) | 24,517 (100.0%) |
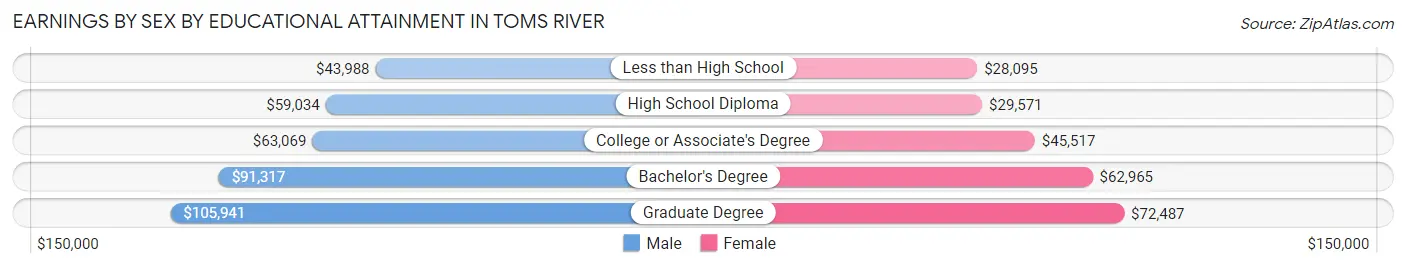
Earnings by Sex by Educational Attainment in Toms River
Average earnings in Toms River are $72,419 for men and $47,640 for women, a difference of 34.2%. Men with an educational attainment of graduate degree enjoy the highest average annual earnings of $105,941, while those with less than high school education earn the least with $43,988. Women with an educational attainment of graduate degree earn the most with the average annual earnings of $72,487, while those with less than high school education have the smallest earnings of $28,095.
| Educational Attainment | Male Income | Female Income |
| Less than High School | $43,988 | $28,095 |
| High School Diploma | $59,034 | $29,571 |
| College or Associate's Degree | $63,069 | $45,517 |
| Bachelor's Degree | $91,317 | $62,965 |
| Graduate Degree | $105,941 | $72,487 |
| Total | $72,419 | $47,640 |
Family Income in Toms River
Family Income Brackets in Toms River
According to the Toms River family income data, there are 5,242 families falling into the $100,000 to $149,999 income range, which is the most common income bracket and makes up 22.7% of all families. Conversely, the $10,000 to $14,999 income bracket is the least frequent group with only 208 families (0.9%) belonging to this category.
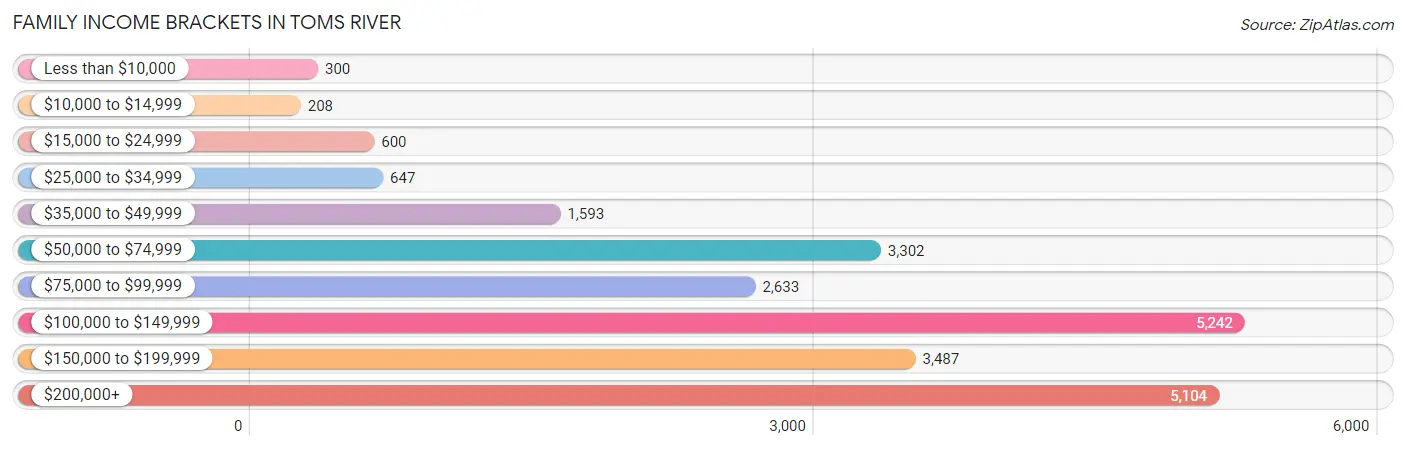
| Income Bracket | # Families | % Families |
| Less than $10,000 | 300 | 1.3% |
| $10,000 to $14,999 | 208 | 0.9% |
| $15,000 to $24,999 | 600 | 2.6% |
| $25,000 to $34,999 | 647 | 2.8% |
| $35,000 to $49,999 | 1,593 | 6.9% |
| $50,000 to $74,999 | 3,302 | 14.3% |
| $75,000 to $99,999 | 2,633 | 11.4% |
| $100,000 to $149,999 | 5,242 | 22.7% |
| $150,000 to $199,999 | 3,487 | 15.1% |
| $200,000+ | 5,104 | 22.1% |
Family Income by Famaliy Size in Toms River
4-person families (4,732 | 20.5%) account for the highest median family income in Toms River with $163,014 per family, while 2-person families (9,762 | 42.3%) have the highest median income of $48,682 per family member.
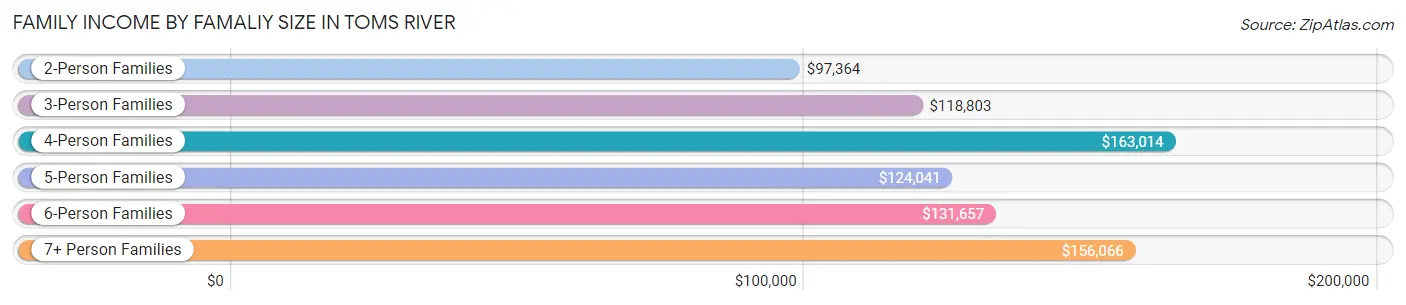
| Income Bracket | # Families | Median Income |
| 2-Person Families | 9,762 (42.3%) | $97,364 |
| 3-Person Families | 5,377 (23.3%) | $118,803 |
| 4-Person Families | 4,732 (20.5%) | $163,014 |
| 5-Person Families | 2,022 (8.8%) | $124,041 |
| 6-Person Families | 565 (2.5%) | $131,657 |
| 7+ Person Families | 636 (2.8%) | $156,066 |
| Total | 23,094 (100.0%) | $120,025 |
Family Income by Number of Earners in Toms River
The median family income in Toms River is $120,025, with families comprising 3+ earners (3,714) having the highest median family income of $168,237, while families with no earners (2,979) have the lowest median family income of $63,364, accounting for 16.1% and 12.9% of families, respectively.
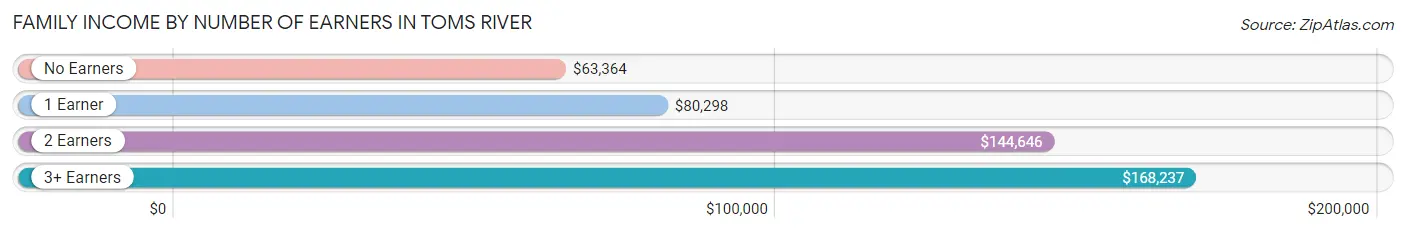
| Number of Earners | # Families | Median Income |
| No Earners | 2,979 (12.9%) | $63,364 |
| 1 Earner | 6,474 (28.0%) | $80,298 |
| 2 Earners | 9,927 (43.0%) | $144,646 |
| 3+ Earners | 3,714 (16.1%) | $168,237 |
| Total | 23,094 (100.0%) | $120,025 |
Household Income in Toms River
Household Income Brackets in Toms River
With 6,400 households falling in the category, the $100,000 to $149,999 income range is the most frequent in Toms River, accounting for 18.2% of all households. In contrast, only 985 households (2.8%) fall into the $10,000 to $14,999 income bracket, making it the least populous group.
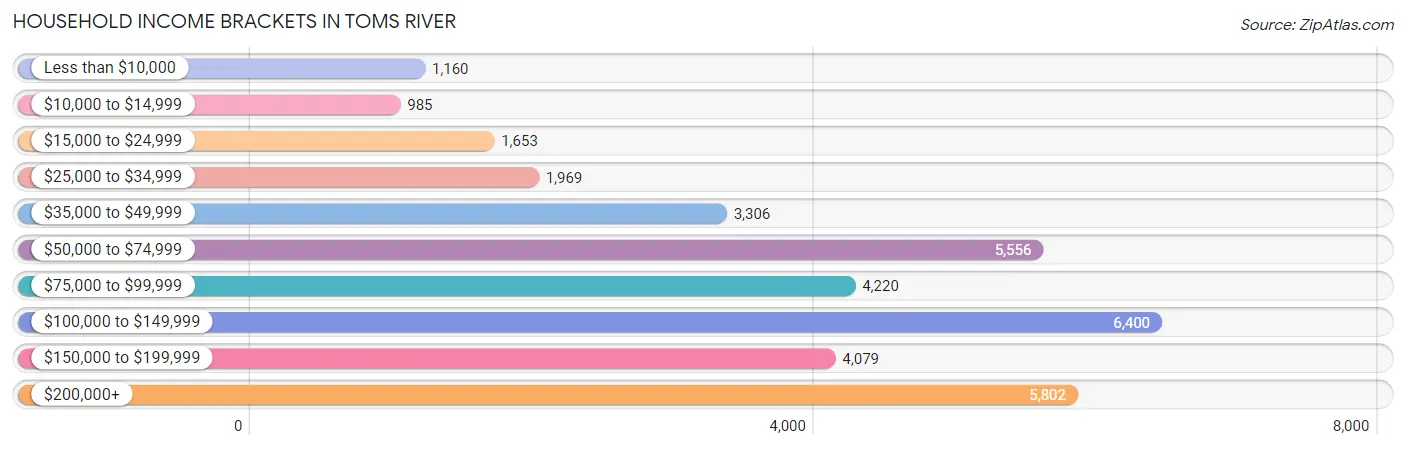
| Income Bracket | # Households | % Households |
| Less than $10,000 | 1,160 | 3.3% |
| $10,000 to $14,999 | 985 | 2.8% |
| $15,000 to $24,999 | 1,653 | 4.7% |
| $25,000 to $34,999 | 1,969 | 5.6% |
| $35,000 to $49,999 | 3,306 | 9.4% |
| $50,000 to $74,999 | 5,556 | 15.8% |
| $75,000 to $99,999 | 4,220 | 12.0% |
| $100,000 to $149,999 | 6,400 | 18.2% |
| $150,000 to $199,999 | 4,079 | 11.6% |
| $200,000+ | 5,802 | 16.5% |
Household Income by Householder Age in Toms River
The median household income in Toms River is $92,012, with the highest median household income of $116,376 found in the 45 to 64 years age bracket for the primary householder. A total of 14,490 households (41.2%) fall into this category. Meanwhile, the 65+ years age bracket for the primary householder has the lowest median household income of $55,848, with 11,316 households (32.2%) in this group.
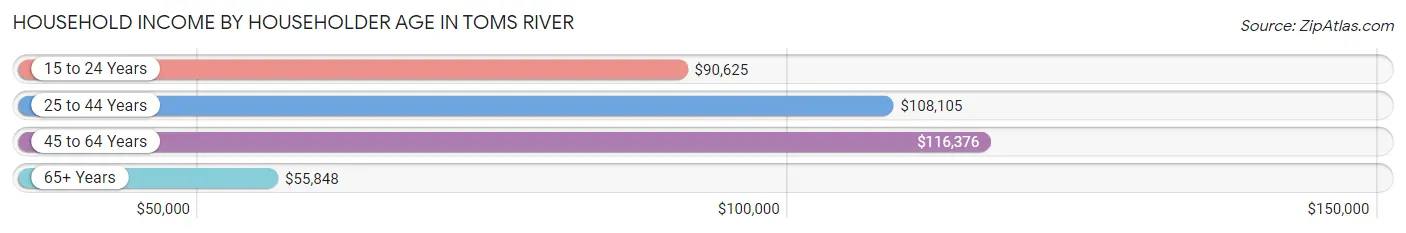
| Income Bracket | # Households | Median Income |
| 15 to 24 Years | 426 (1.2%) | $90,625 |
| 25 to 44 Years | 8,934 (25.4%) | $108,105 |
| 45 to 64 Years | 14,490 (41.2%) | $116,376 |
| 65+ Years | 11,316 (32.2%) | $55,848 |
| Total | 35,166 (100.0%) | $92,012 |
Poverty in Toms River
Income Below Poverty by Sex and Age in Toms River
With 6.0% poverty level for males and 7.9% for females among the residents of Toms River, 65 to 74 year old males and 15 year old females are the most vulnerable to poverty, with 663 males (14.1%) and 96 females (14.5%) in their respective age groups living below the poverty level.
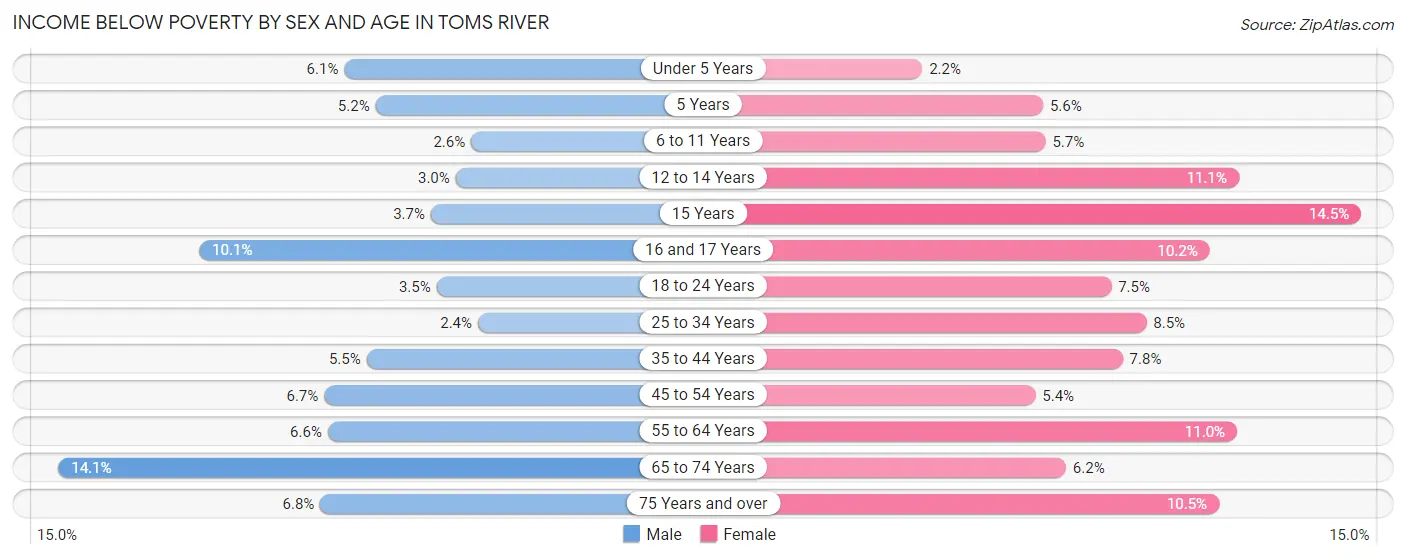
| Age Bracket | Male | Female |
| Under 5 Years | 147 (6.1%) | 58 (2.2%) |
| 5 Years | 19 (5.2%) | 15 (5.6%) |
| 6 to 11 Years | 79 (2.6%) | 180 (5.7%) |
| 12 to 14 Years | 65 (3.0%) | 214 (11.1%) |
| 15 Years | 21 (3.7%) | 96 (14.5%) |
| 16 and 17 Years | 122 (10.1%) | 143 (10.2%) |
| 18 to 24 Years | 129 (3.5%) | 279 (7.5%) |
| 25 to 34 Years | 138 (2.4%) | 479 (8.5%) |
| 35 to 44 Years | 276 (5.5%) | 390 (7.8%) |
| 45 to 54 Years | 425 (6.7%) | 376 (5.4%) |
| 55 to 64 Years | 411 (6.6%) | 713 (11.0%) |
| 65 to 74 Years | 663 (14.1%) | 297 (6.2%) |
| 75 Years and over | 183 (6.8%) | 486 (10.5%) |
| Total | 2,678 (6.0%) | 3,726 (7.9%) |
Income Above Poverty by Sex and Age in Toms River
According to the poverty statistics in Toms River, males aged 25 to 34 years and females aged under 5 years are the age groups that are most secure financially, with 97.6% of males and 97.8% of females in these age groups living above the poverty line.
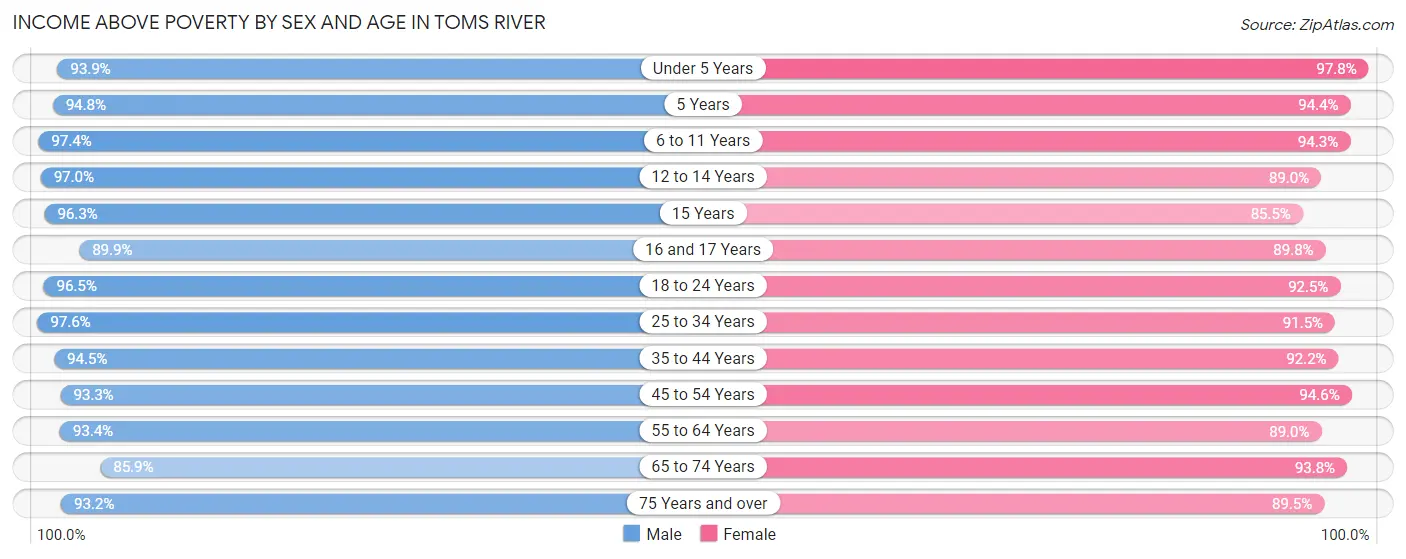
| Age Bracket | Male | Female |
| Under 5 Years | 2,261 (93.9%) | 2,531 (97.8%) |
| 5 Years | 344 (94.8%) | 253 (94.4%) |
| 6 to 11 Years | 2,997 (97.4%) | 2,994 (94.3%) |
| 12 to 14 Years | 2,100 (97.0%) | 1,723 (88.9%) |
| 15 Years | 548 (96.3%) | 568 (85.5%) |
| 16 and 17 Years | 1,081 (89.9%) | 1,254 (89.8%) |
| 18 to 24 Years | 3,530 (96.5%) | 3,439 (92.5%) |
| 25 to 34 Years | 5,650 (97.6%) | 5,168 (91.5%) |
| 35 to 44 Years | 4,757 (94.5%) | 4,599 (92.2%) |
| 45 to 54 Years | 5,952 (93.3%) | 6,605 (94.6%) |
| 55 to 64 Years | 5,852 (93.4%) | 5,768 (89.0%) |
| 65 to 74 Years | 4,052 (85.9%) | 4,466 (93.8%) |
| 75 Years and over | 2,522 (93.2%) | 4,141 (89.5%) |
| Total | 41,646 (94.0%) | 43,509 (92.1%) |
Income Below Poverty Among Married-Couple Families in Toms River
The poverty statistics for married-couple families in Toms River show that 2.1% or 362 of the total 17,036 families live below the poverty line. Families with no children have the highest poverty rate of 2.3%, comprising of 228 families. On the other hand, families with 5 or more children have the lowest poverty rate of 0.0%, which includes 0 families.
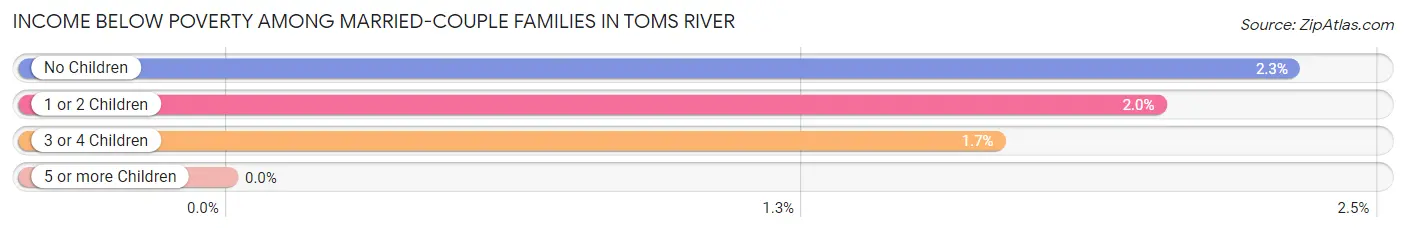
| Children | Above Poverty | Below Poverty |
| No Children | 9,651 (97.7%) | 228 (2.3%) |
| 1 or 2 Children | 5,331 (98.0%) | 110 (2.0%) |
| 3 or 4 Children | 1,415 (98.3%) | 24 (1.7%) |
| 5 or more Children | 277 (100.0%) | 0 (0.0%) |
| Total | 16,674 (97.9%) | 362 (2.1%) |
Income Below Poverty Among Single-Parent Households in Toms River
According to the poverty data in Toms River, 6.4% or 113 single-father households and 12.5% or 538 single-mother households are living below the poverty line. Among single-father households, those with 1 or 2 children have the highest poverty rate, with 75 households (11.1%) experiencing poverty. Likewise, among single-mother households, those with 3 or 4 children have the highest poverty rate, with 92 households (27.5%) falling below the poverty line.
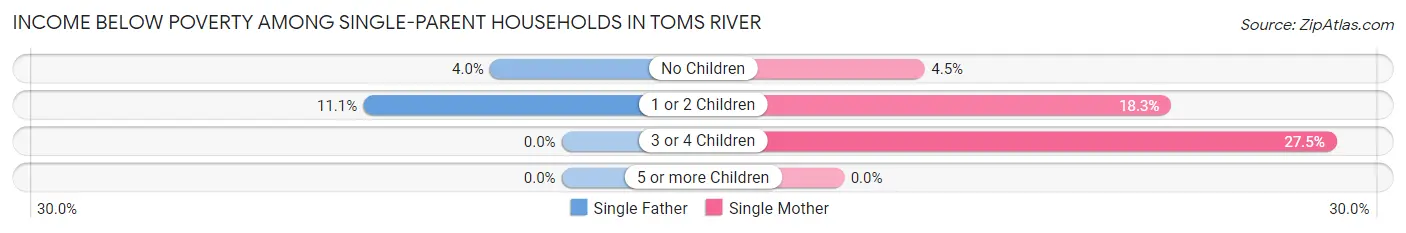
| Children | Single Father | Single Mother |
| No Children | 38 (4.0%) | 91 (4.5%) |
| 1 or 2 Children | 75 (11.1%) | 355 (18.3%) |
| 3 or 4 Children | 0 (0.0%) | 92 (27.5%) |
| 5 or more Children | 0 (0.0%) | 0 (0.0%) |
| Total | 113 (6.4%) | 538 (12.5%) |
Income Below Poverty Among Married-Couple vs Single-Parent Households in Toms River
The poverty data for Toms River shows that 362 of the married-couple family households (2.1%) and 651 of the single-parent households (10.7%) are living below the poverty level. Within the married-couple family households, those with no children have the highest poverty rate, with 228 households (2.3%) falling below the poverty line. Among the single-parent households, those with 3 or 4 children have the highest poverty rate, with 92 household (20.9%) living below poverty.
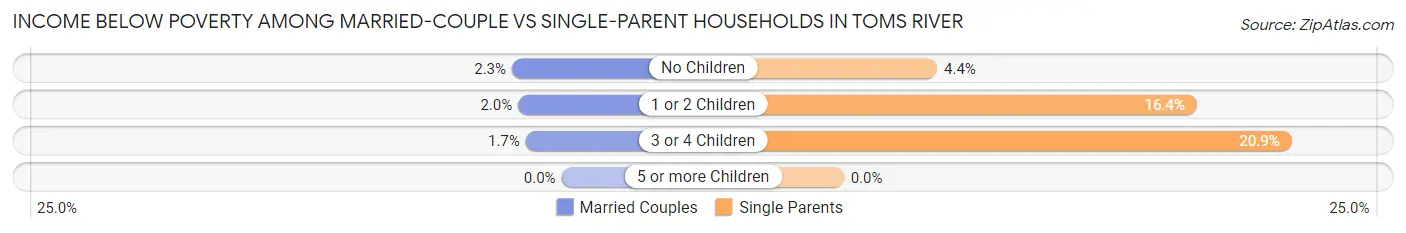
| Children | Married-Couple Families | Single-Parent Households |
| No Children | 228 (2.3%) | 129 (4.3%) |
| 1 or 2 Children | 110 (2.0%) | 430 (16.4%) |
| 3 or 4 Children | 24 (1.7%) | 92 (20.9%) |
| 5 or more Children | 0 (0.0%) | 0 (0.0%) |
| Total | 362 (2.1%) | 651 (10.7%) |
Race in Toms River
The most populous races in Toms River are White / Caucasian (77,267 | 83.2%), Hispanic or Latino (10,102 | 10.9%), and Two or more Races (5,187 | 5.6%).
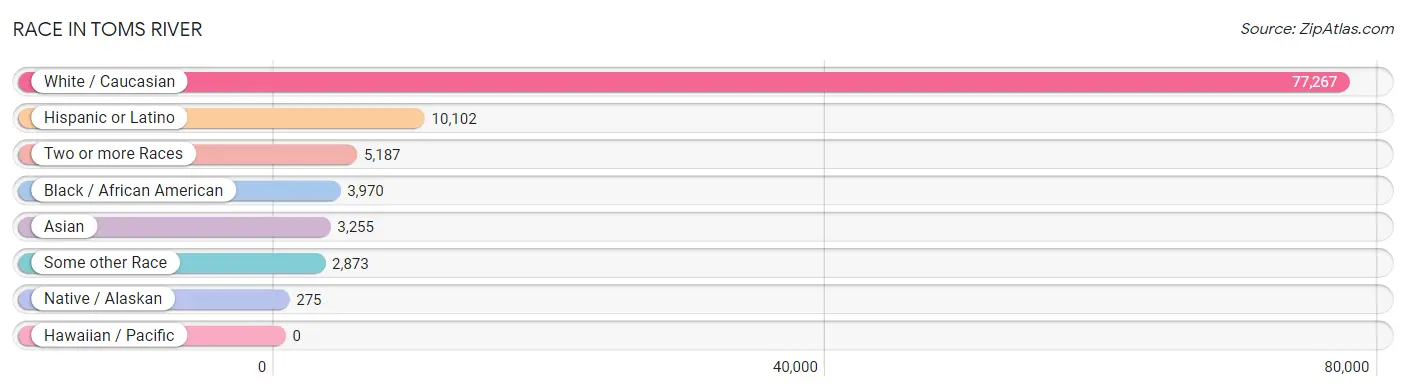
| Race | # Population | % Population |
| Asian | 3,255 | 3.5% |
| Black / African American | 3,970 | 4.3% |
| Hawaiian / Pacific | 0 | 0.0% |
| Hispanic or Latino | 10,102 | 10.9% |
| Native / Alaskan | 275 | 0.3% |
| White / Caucasian | 77,267 | 83.2% |
| Two or more Races | 5,187 | 5.6% |
| Some other Race | 2,873 | 3.1% |
| Total | 92,827 | 100.0% |
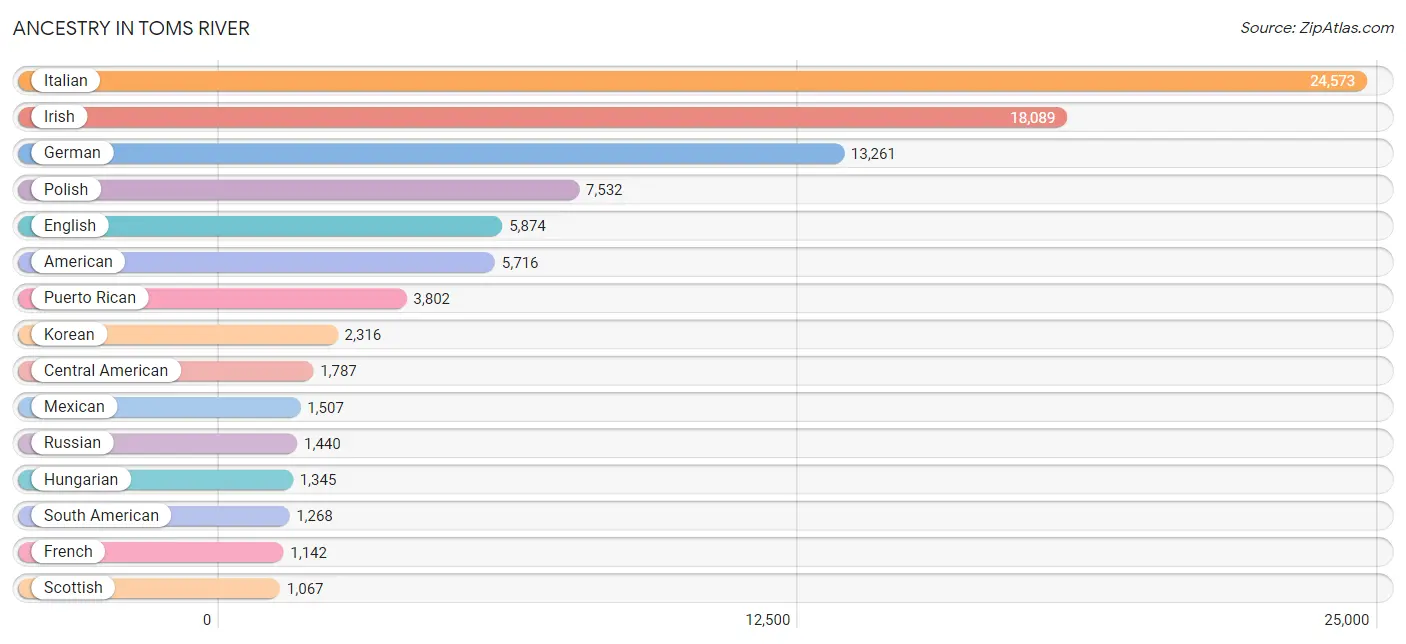
Ancestry in Toms River
The most populous ancestries reported in Toms River are Italian (24,573 | 26.5%), Irish (18,089 | 19.5%), German (13,261 | 14.3%), Polish (7,532 | 8.1%), and English (5,874 | 6.3%), together accounting for 74.7% of all Toms River residents.
| Ancestry | # Population | % Population |
| African | 156 | 0.2% |
| Albanian | 131 | 0.1% |
| Aleut | 4 | 0.0% |
| American | 5,716 | 6.2% |
| Apache | 33 | 0.0% |
| Arab | 637 | 0.7% |
| Argentinean | 20 | 0.0% |
| Armenian | 82 | 0.1% |
| Assyrian / Chaldean / Syriac | 4 | 0.0% |
| Australian | 7 | 0.0% |
| Austrian | 340 | 0.4% |
| Bahamian | 8 | 0.0% |
| Barbadian | 2 | 0.0% |
| Basque | 9 | 0.0% |
| Belgian | 25 | 0.0% |
| Bhutanese | 148 | 0.2% |
| Brazilian | 53 | 0.1% |
| British | 394 | 0.4% |
| British West Indian | 59 | 0.1% |
| Burmese | 395 | 0.4% |
| Canadian | 542 | 0.6% |
| Celtic | 29 | 0.0% |
| Central American | 1,787 | 1.9% |
| Central American Indian | 11 | 0.0% |
| Cherokee | 234 | 0.3% |
| Chilean | 10 | 0.0% |
| Chippewa | 55 | 0.1% |
| Colombian | 446 | 0.5% |
| Costa Rican | 647 | 0.7% |
| Creek | 14 | 0.0% |
| Croatian | 145 | 0.2% |
| Cuban | 546 | 0.6% |
| Cypriot | 53 | 0.1% |
| Czech | 257 | 0.3% |
| Czechoslovakian | 109 | 0.1% |
| Danish | 455 | 0.5% |
| Delaware | 18 | 0.0% |
| Dominican | 383 | 0.4% |
| Dutch | 729 | 0.8% |
| Eastern European | 367 | 0.4% |
| Ecuadorian | 239 | 0.3% |
| Egyptian | 197 | 0.2% |
| English | 5,874 | 6.3% |
| Estonian | 23 | 0.0% |
| Ethiopian | 55 | 0.1% |
| European | 729 | 0.8% |
| Filipino | 65 | 0.1% |
| Finnish | 92 | 0.1% |
| French | 1,142 | 1.2% |
| French American Indian | 20 | 0.0% |
| French Canadian | 91 | 0.1% |
| German | 13,261 | 14.3% |
| Ghanaian | 108 | 0.1% |
| Greek | 1,004 | 1.1% |
| Guatemalan | 408 | 0.4% |
| Guyanese | 167 | 0.2% |
| Haitian | 150 | 0.2% |
| Honduran | 14 | 0.0% |
| Hungarian | 1,345 | 1.5% |
| Icelander | 6 | 0.0% |
| Indian (Asian) | 379 | 0.4% |
| Iranian | 38 | 0.0% |
| Irish | 18,089 | 19.5% |
| Israeli | 226 | 0.2% |
| Italian | 24,573 | 26.5% |
| Jamaican | 184 | 0.2% |
| Japanese | 29 | 0.0% |
| Korean | 2,316 | 2.5% |
| Latvian | 188 | 0.2% |
| Lebanese | 184 | 0.2% |
| Lithuanian | 598 | 0.6% |
| Malaysian | 101 | 0.1% |
| Maltese | 22 | 0.0% |
| Mexican | 1,507 | 1.6% |
| Mexican American Indian | 18 | 0.0% |
| Moroccan | 29 | 0.0% |
| Nigerian | 29 | 0.0% |
| Northern European | 23 | 0.0% |
| Norwegian | 541 | 0.6% |
| Pakistani | 13 | 0.0% |
| Panamanian | 49 | 0.1% |
| Pennsylvania German | 10 | 0.0% |
| Peruvian | 409 | 0.4% |
| Polish | 7,532 | 8.1% |
| Portuguese | 724 | 0.8% |
| Puerto Rican | 3,802 | 4.1% |
| Romanian | 52 | 0.1% |
| Russian | 1,440 | 1.5% |
| Salvadoran | 669 | 0.7% |
| Scandinavian | 219 | 0.2% |
| Scotch-Irish | 494 | 0.5% |
| Scottish | 1,067 | 1.1% |
| Serbian | 8 | 0.0% |
| Slavic | 80 | 0.1% |
| Slovak | 392 | 0.4% |
| Slovene | 18 | 0.0% |
| South African | 9 | 0.0% |
| South American | 1,268 | 1.4% |
| South American Indian | 243 | 0.3% |
| Spaniard | 514 | 0.5% |
| Spanish | 158 | 0.2% |
| Sri Lankan | 144 | 0.2% |
| Subsaharan African | 328 | 0.4% |
| Swedish | 441 | 0.5% |
| Swiss | 100 | 0.1% |
| Syrian | 79 | 0.1% |
| Thai | 454 | 0.5% |
| Trinidadian and Tobagonian | 144 | 0.2% |
| Turkish | 174 | 0.2% |
| Ukrainian | 604 | 0.6% |
| Uruguayan | 83 | 0.1% |
| Venezuelan | 61 | 0.1% |
| Welsh | 492 | 0.5% |
| West Indian | 53 | 0.1% |
| Yugoslavian | 7 | 0.0% | View All 115 Rows |
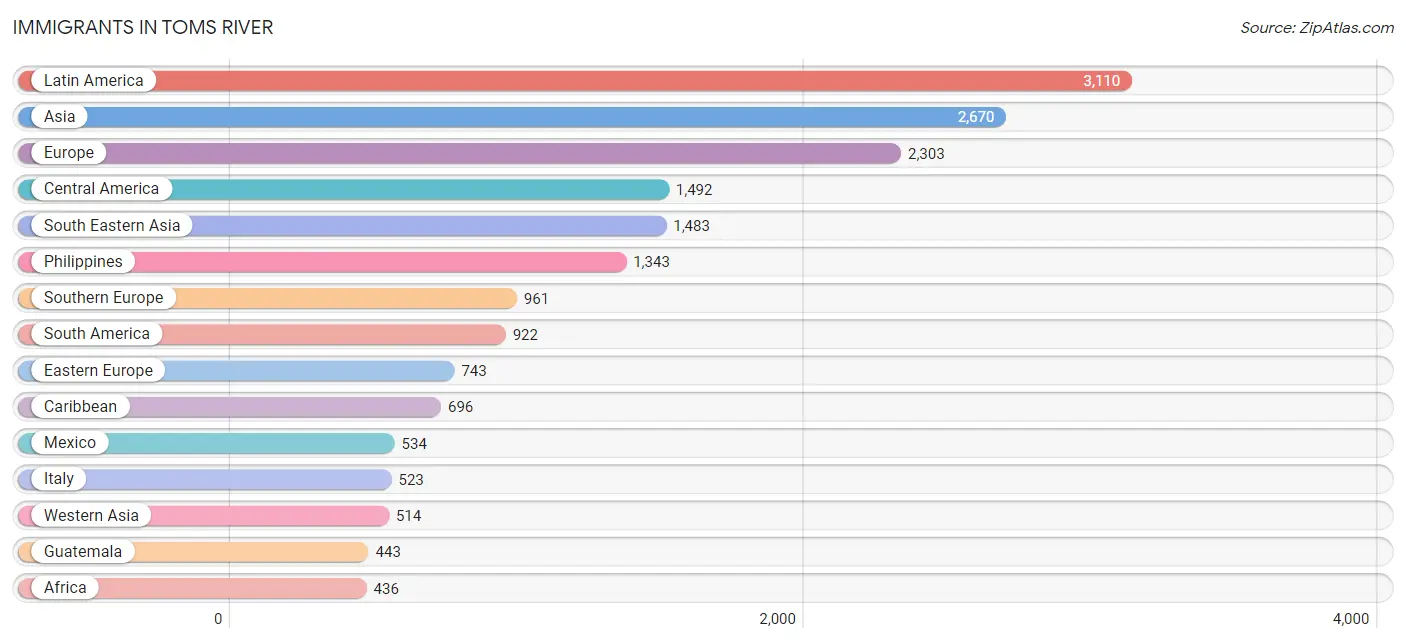
Immigrants in Toms River
The most numerous immigrant groups reported in Toms River came from Latin America (3,110 | 3.4%), Asia (2,670 | 2.9%), Europe (2,303 | 2.5%), Central America (1,492 | 1.6%), and South Eastern Asia (1,483 | 1.6%), together accounting for 11.9% of all Toms River residents.
| Immigration Origin | # Population | % Population |
| Africa | 436 | 0.5% |
| Albania | 75 | 0.1% |
| Argentina | 7 | 0.0% |
| Asia | 2,670 | 2.9% |
| Brazil | 17 | 0.0% |
| Cambodia | 29 | 0.0% |
| Canada | 76 | 0.1% |
| Caribbean | 696 | 0.7% |
| Central America | 1,492 | 1.6% |
| China | 158 | 0.2% |
| Colombia | 413 | 0.4% |
| Costa Rica | 209 | 0.2% |
| Croatia | 8 | 0.0% |
| Cuba | 140 | 0.2% |
| Dominican Republic | 167 | 0.2% |
| Eastern Africa | 24 | 0.0% |
| Eastern Asia | 369 | 0.4% |
| Eastern Europe | 743 | 0.8% |
| Ecuador | 34 | 0.0% |
| Egypt | 72 | 0.1% |
| El Salvador | 282 | 0.3% |
| England | 170 | 0.2% |
| Europe | 2,303 | 2.5% |
| France | 47 | 0.1% |
| Germany | 200 | 0.2% |
| Ghana | 158 | 0.2% |
| Greece | 224 | 0.2% |
| Guatemala | 443 | 0.5% |
| Guyana | 150 | 0.2% |
| Haiti | 245 | 0.3% |
| Honduras | 24 | 0.0% |
| Hungary | 35 | 0.0% |
| India | 239 | 0.3% |
| Iran | 20 | 0.0% |
| Ireland | 44 | 0.1% |
| Israel | 239 | 0.3% |
| Italy | 523 | 0.6% |
| Jamaica | 107 | 0.1% |
| Japan | 23 | 0.0% |
| Korea | 188 | 0.2% |
| Laos | 59 | 0.1% |
| Latin America | 3,110 | 3.4% |
| Latvia | 34 | 0.0% |
| Lebanon | 21 | 0.0% |
| Lithuania | 173 | 0.2% |
| Malaysia | 7 | 0.0% |
| Mexico | 534 | 0.6% |
| Morocco | 14 | 0.0% |
| Nigeria | 82 | 0.1% |
| Northern Africa | 86 | 0.1% |
| Northern Europe | 340 | 0.4% |
| Norway | 13 | 0.0% |
| Pakistan | 7 | 0.0% |
| Peru | 203 | 0.2% |
| Philippines | 1,343 | 1.5% |
| Poland | 203 | 0.2% |
| Portugal | 69 | 0.1% |
| Romania | 28 | 0.0% |
| Russia | 30 | 0.0% |
| Scotland | 7 | 0.0% |
| Sierra Leone | 66 | 0.1% |
| South Africa | 19 | 0.0% |
| South America | 922 | 1.0% |
| South Central Asia | 304 | 0.3% |
| South Eastern Asia | 1,483 | 1.6% |
| Southern Europe | 961 | 1.0% |
| Spain | 145 | 0.2% |
| Switzerland | 12 | 0.0% |
| Syria | 16 | 0.0% |
| Taiwan | 100 | 0.1% |
| Thailand | 13 | 0.0% |
| Trinidad and Tobago | 37 | 0.0% |
| Turkey | 122 | 0.1% |
| Ukraine | 108 | 0.1% |
| Uruguay | 98 | 0.1% |
| Uzbekistan | 38 | 0.0% |
| Vietnam | 32 | 0.0% |
| Western Africa | 306 | 0.3% |
| Western Asia | 514 | 0.5% |
| Western Europe | 259 | 0.3% |
| Zimbabwe | 7 | 0.0% | View All 81 Rows |
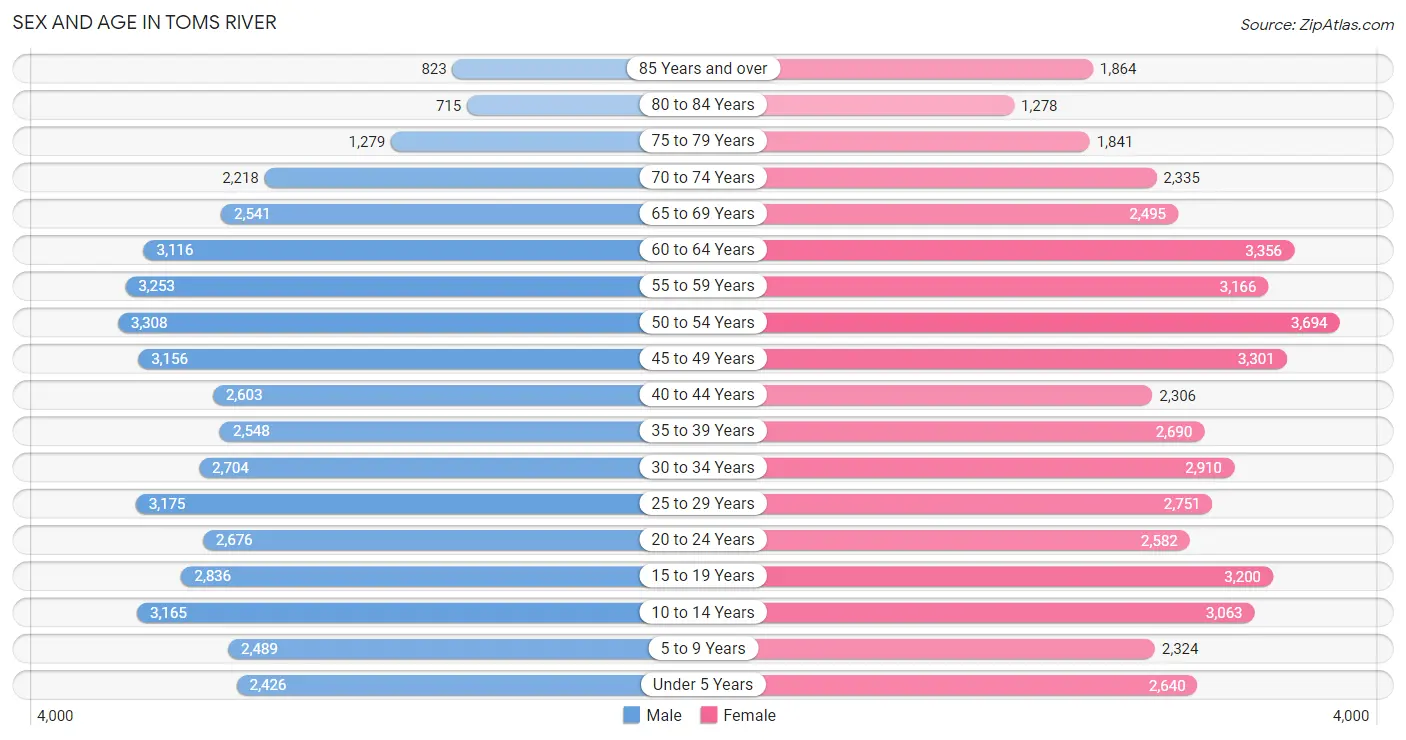
Sex and Age in Toms River
Sex and Age in Toms River
The most populous age groups in Toms River are 50 to 54 Years (3,308 | 7.3%) for men and 50 to 54 Years (3,694 | 7.7%) for women.
| Age Bracket | Male | Female |
| Under 5 Years | 2,426 (5.4%) | 2,640 (5.5%) |
| 5 to 9 Years | 2,489 (5.5%) | 2,324 (4.9%) |
| 10 to 14 Years | 3,165 (7.0%) | 3,063 (6.4%) |
| 15 to 19 Years | 2,836 (6.3%) | 3,200 (6.7%) |
| 20 to 24 Years | 2,676 (5.9%) | 2,582 (5.4%) |
| 25 to 29 Years | 3,175 (7.0%) | 2,751 (5.8%) |
| 30 to 34 Years | 2,704 (6.0%) | 2,910 (6.1%) |
| 35 to 39 Years | 2,548 (5.7%) | 2,690 (5.6%) |
| 40 to 44 Years | 2,603 (5.8%) | 2,306 (4.8%) |
| 45 to 49 Years | 3,156 (7.0%) | 3,301 (6.9%) |
| 50 to 54 Years | 3,308 (7.3%) | 3,694 (7.7%) |
| 55 to 59 Years | 3,253 (7.2%) | 3,166 (6.6%) |
| 60 to 64 Years | 3,116 (6.9%) | 3,356 (7.0%) |
| 65 to 69 Years | 2,541 (5.6%) | 2,495 (5.2%) |
| 70 to 74 Years | 2,218 (4.9%) | 2,335 (4.9%) |
| 75 to 79 Years | 1,279 (2.8%) | 1,841 (3.8%) |
| 80 to 84 Years | 715 (1.6%) | 1,278 (2.7%) |
| 85 Years and over | 823 (1.8%) | 1,864 (3.9%) |
| Total | 45,031 (100.0%) | 47,796 (100.0%) |
Families and Households in Toms River
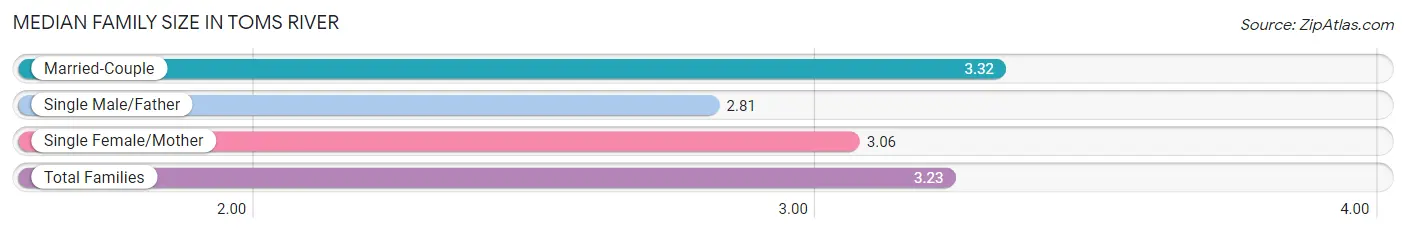
Median Family Size in Toms River
The median family size in Toms River is 3.23 persons per family, with married-couple families (17,036 | 73.8%) accounting for the largest median family size of 3.32 persons per family. On the other hand, single male/father families (1,767 | 7.6%) represent the smallest median family size with 2.81 persons per family.
| Family Type | # Families | Family Size |
| Married-Couple | 17,036 (73.8%) | 3.32 |
| Single Male/Father | 1,767 (7.6%) | 2.81 |
| Single Female/Mother | 4,291 (18.6%) | 3.06 |
| Total Families | 23,094 (100.0%) | 3.23 |
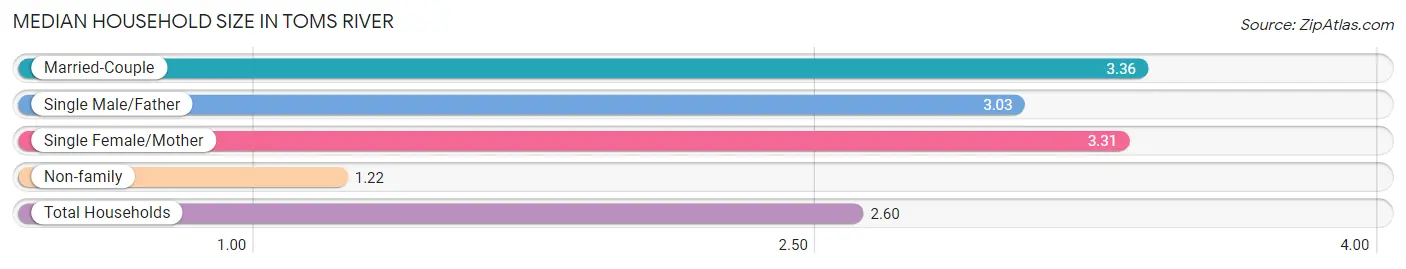
Median Household Size in Toms River
The median household size in Toms River is 2.60 persons per household, with married-couple households (17,036 | 48.4%) accounting for the largest median household size of 3.36 persons per household. non-family households (12,072 | 34.3%) represent the smallest median household size with 1.22 persons per household.
| Household Type | # Households | Household Size |
| Married-Couple | 17,036 (48.4%) | 3.36 |
| Single Male/Father | 1,767 (5.0%) | 3.03 |
| Single Female/Mother | 4,291 (12.2%) | 3.31 |
| Non-family | 12,072 (34.3%) | 1.22 |
| Total Households | 35,166 (100.0%) | 2.60 |
Household Size by Marriage Status in Toms River
Out of a total of 35,166 households in Toms River, 23,094 (65.7%) are family households, while 12,072 (34.3%) are nonfamily households. The most numerous type of family households are 2-person households, comprising 9,188, and the most common type of nonfamily households are 1-person households, comprising 9,788.
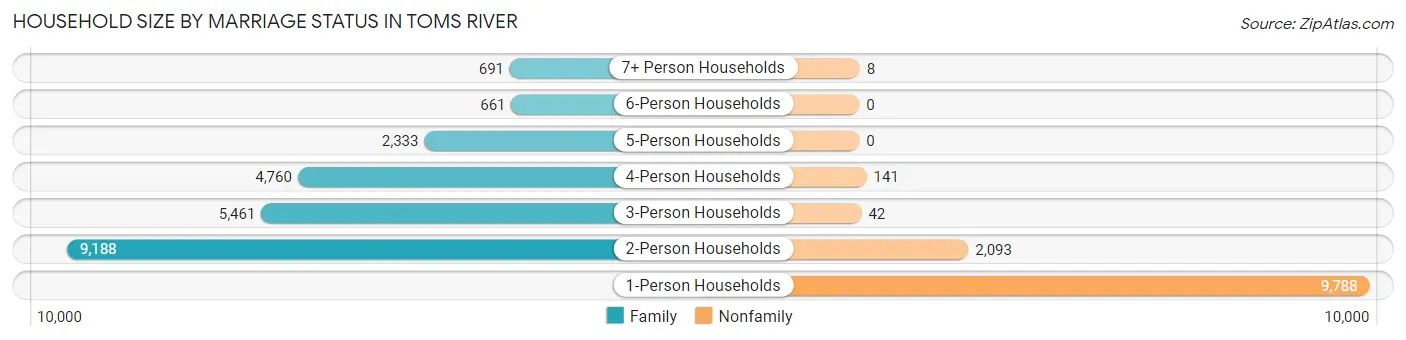
| Household Size | Family Households | Nonfamily Households |
| 1-Person Households | - | 9,788 (27.8%) |
| 2-Person Households | 9,188 (26.1%) | 2,093 (5.9%) |
| 3-Person Households | 5,461 (15.5%) | 42 (0.1%) |
| 4-Person Households | 4,760 (13.5%) | 141 (0.4%) |
| 5-Person Households | 2,333 (6.6%) | 0 (0.0%) |
| 6-Person Households | 661 (1.9%) | 0 (0.0%) |
| 7+ Person Households | 691 (2.0%) | 8 (0.0%) |
| Total | 23,094 (65.7%) | 12,072 (34.3%) |
Female Fertility in Toms River
Fertility by Age in Toms River
Average fertility rate in Toms River is 46.0 births per 1,000 women. Women in the age bracket of 20 to 34 years have the highest fertility rate with 89.0 births per 1,000 women. Women in the age bracket of 20 to 34 years acount for 77.1% of all women with births.
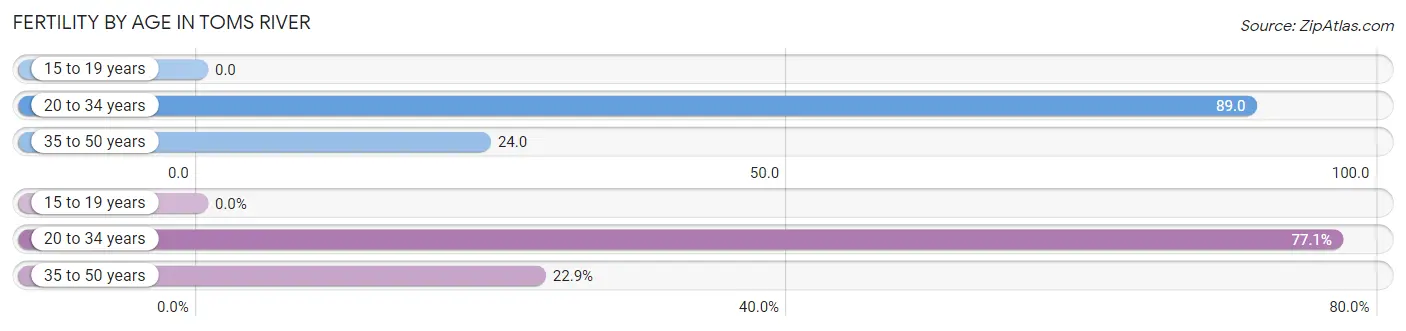
| Age Bracket | Women with Births | Births / 1,000 Women |
| 15 to 19 years | 0 (0.0%) | 0.0 |
| 20 to 34 years | 736 (77.1%) | 89.0 |
| 35 to 50 years | 219 (22.9%) | 24.0 |
| Total | 955 (100.0%) | 46.0 |
Fertility by Age by Marriage Status in Toms River
84.3% of women with births (955) in Toms River are married. The highest percentage of unmarried women with births falls into 20 to 34 years age bracket with 17.0% of them unmarried at the time of birth, while the lowest percentage of unmarried women with births belong to 35 to 50 years age bracket with 11.4% of them unmarried.
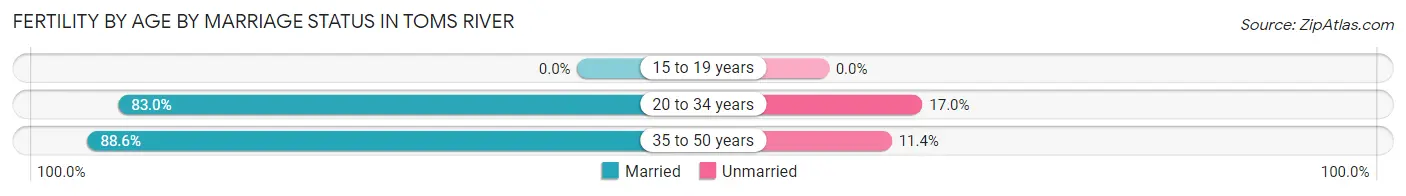
| Age Bracket | Married | Unmarried |
| 15 to 19 years | 0 (0.0%) | 0 (0.0%) |
| 20 to 34 years | 611 (83.0%) | 125 (17.0%) |
| 35 to 50 years | 194 (88.6%) | 25 (11.4%) |
| Total | 805 (84.3%) | 150 (15.7%) |
Fertility by Education in Toms River
Average fertility rate in Toms River is 46.0 births per 1,000 women. Women with the education attainment of bachelor's degree have the highest fertility rate of 76.0 births per 1,000 women, while women with the education attainment of less than high school have the lowest fertility at 20.0 births per 1,000 women. Women with the education attainment of bachelor's degree represent 41.7% of all women with births.
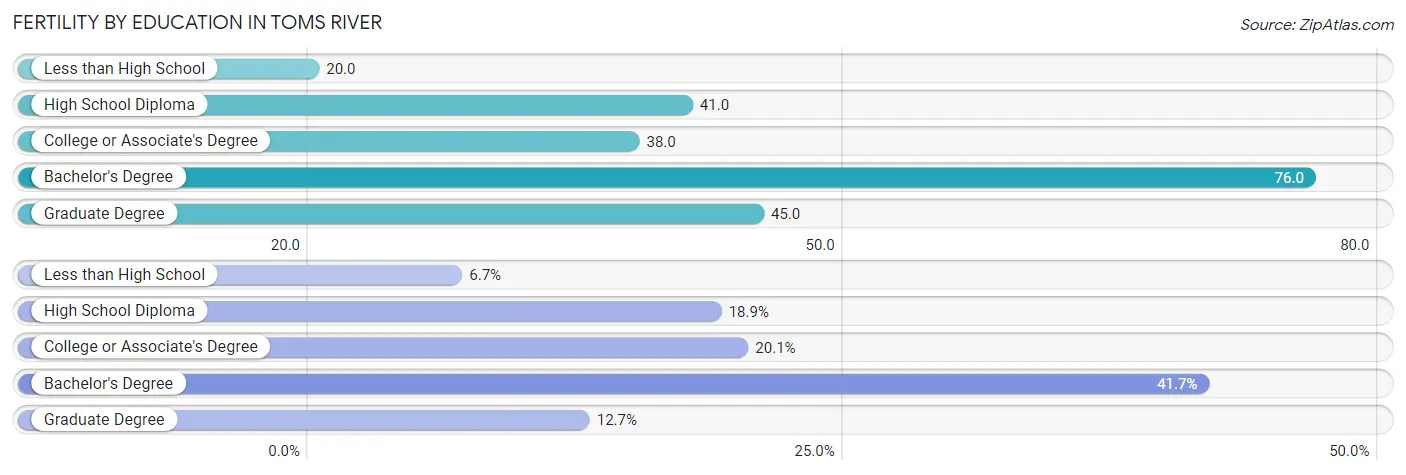
| Educational Attainment | Women with Births | Births / 1,000 Women |
| Less than High School | 64 (6.7%) | 20.0 |
| High School Diploma | 180 (18.9%) | 41.0 |
| College or Associate's Degree | 192 (20.1%) | 38.0 |
| Bachelor's Degree | 398 (41.7%) | 76.0 |
| Graduate Degree | 121 (12.7%) | 45.0 |
| Total | 955 (100.0%) | 46.0 |
Fertility by Education by Marriage Status in Toms River
15.7% of women with births in Toms River are unmarried. Women with the educational attainment of bachelor's degree are most likely to be married with 100.0% of them married at childbirth, while women with the educational attainment of less than high school are least likely to be married with 43.8% of them unmarried at childbirth.
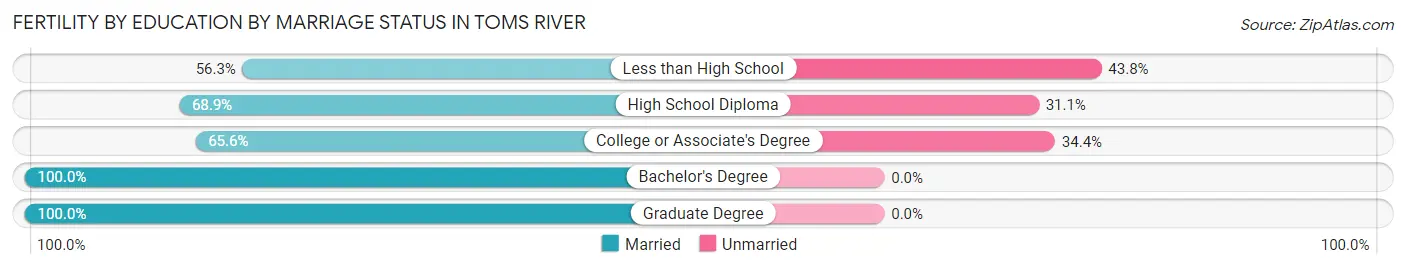
| Educational Attainment | Married | Unmarried |
| Less than High School | 36 (56.2%) | 28 (43.8%) |
| High School Diploma | 124 (68.9%) | 56 (31.1%) |
| College or Associate's Degree | 126 (65.6%) | 66 (34.4%) |
| Bachelor's Degree | 398 (100.0%) | 0 (0.0%) |
| Graduate Degree | 121 (100.0%) | 0 (0.0%) |
| Total | 805 (84.3%) | 150 (15.7%) |
Employment Characteristics in Toms River
Employment by Class of Employer in Toms River
Among the 44,861 employed individuals in Toms River, private company employees (28,521 | 63.6%), local government employees (5,661 | 12.6%), and not-for-profit organizations (3,156 | 7.0%) make up the most common classes of employment.
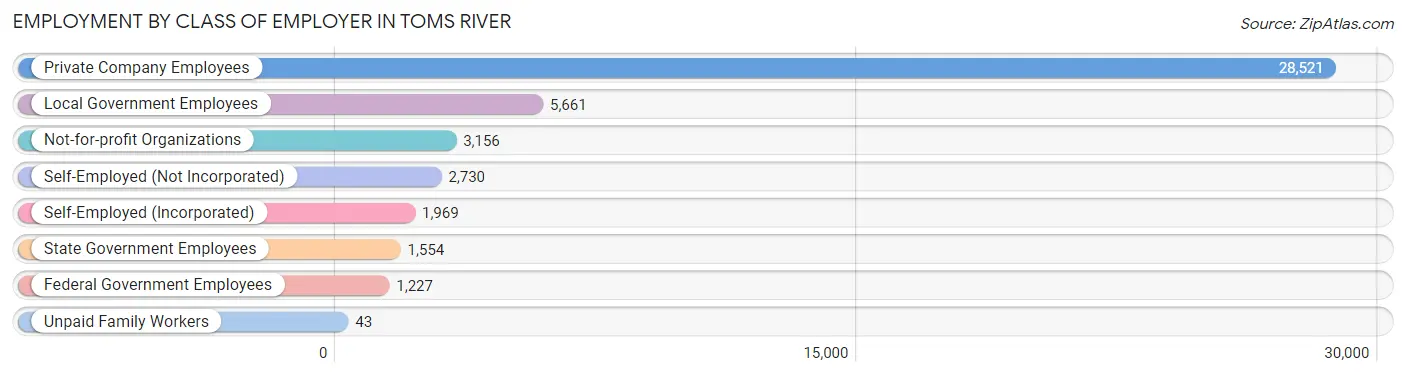
| Employer Class | # Employees | % Employees |
| Private Company Employees | 28,521 | 63.6% |
| Self-Employed (Incorporated) | 1,969 | 4.4% |
| Self-Employed (Not Incorporated) | 2,730 | 6.1% |
| Not-for-profit Organizations | 3,156 | 7.0% |
| Local Government Employees | 5,661 | 12.6% |
| State Government Employees | 1,554 | 3.5% |
| Federal Government Employees | 1,227 | 2.7% |
| Unpaid Family Workers | 43 | 0.1% |
| Total | 44,861 | 100.0% |
Employment Status by Age in Toms River
According to the labor force statistics for Toms River, out of the total population over 16 years of age (75,483), 64.2% or 48,460 individuals are in the labor force, with 5.7% or 2,762 of them unemployed. The age group with the highest labor force participation rate is 25 to 29 years, with 86.6% or 5,132 individuals in the labor force. Within the labor force, the 16 to 19 years age range has the highest percentage of unemployed individuals, with 11.4% or 253 of them being unemployed.
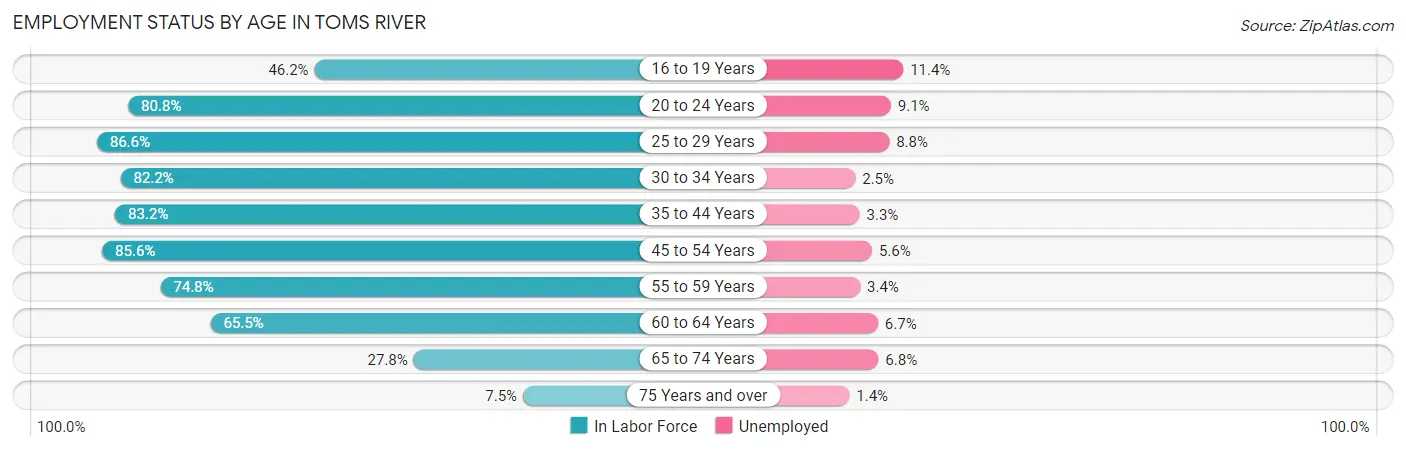
| Age Bracket | In Labor Force | Unemployed |
| 16 to 19 Years | 2,217 (46.2%) | 253 (11.4%) |
| 20 to 24 Years | 4,248 (80.8%) | 387 (9.1%) |
| 25 to 29 Years | 5,132 (86.6%) | 452 (8.8%) |
| 30 to 34 Years | 4,615 (82.2%) | 115 (2.5%) |
| 35 to 44 Years | 8,442 (83.2%) | 279 (3.3%) |
| 45 to 54 Years | 11,521 (85.6%) | 645 (5.6%) |
| 55 to 59 Years | 4,801 (74.8%) | 163 (3.4%) |
| 60 to 64 Years | 4,239 (65.5%) | 284 (6.7%) |
| 65 to 74 Years | 2,666 (27.8%) | 181 (6.8%) |
| 75 Years and over | 585 (7.5%) | 8 (1.4%) |
| Total | 48,460 (64.2%) | 2,762 (5.7%) |
Employment Status by Educational Attainment in Toms River
According to labor force statistics for Toms River, 80.7% of individuals (38,766) out of the total population between 25 and 64 years of age (48,037) are in the labor force, with 5.0% or 1,938 of them being unemployed. The group with the highest labor force participation rate are those with the educational attainment of bachelor's degree or higher, with 90.0% or 16,457 individuals in the labor force. Within the labor force, individuals with high school diploma education have the highest percentage of unemployment, with 6.4% or 687 of them being unemployed.
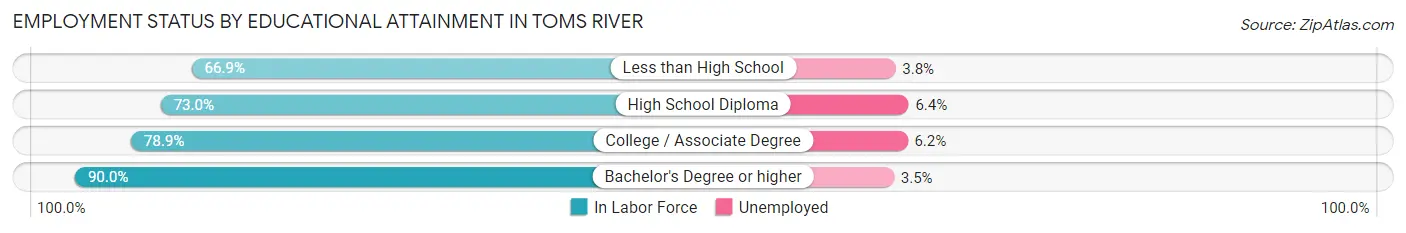
| Educational Attainment | In Labor Force | Unemployed |
| Less than High School | 1,698 (66.9%) | 96 (3.8%) |
| High School Diploma | 10,731 (73.0%) | 941 (6.4%) |
| College / Associate Degree | 9,873 (78.9%) | 776 (6.2%) |
| Bachelor's Degree or higher | 16,457 (90.0%) | 640 (3.5%) |
| Total | 38,766 (80.7%) | 2,402 (5.0%) |
Employment Occupations by Sex in Toms River
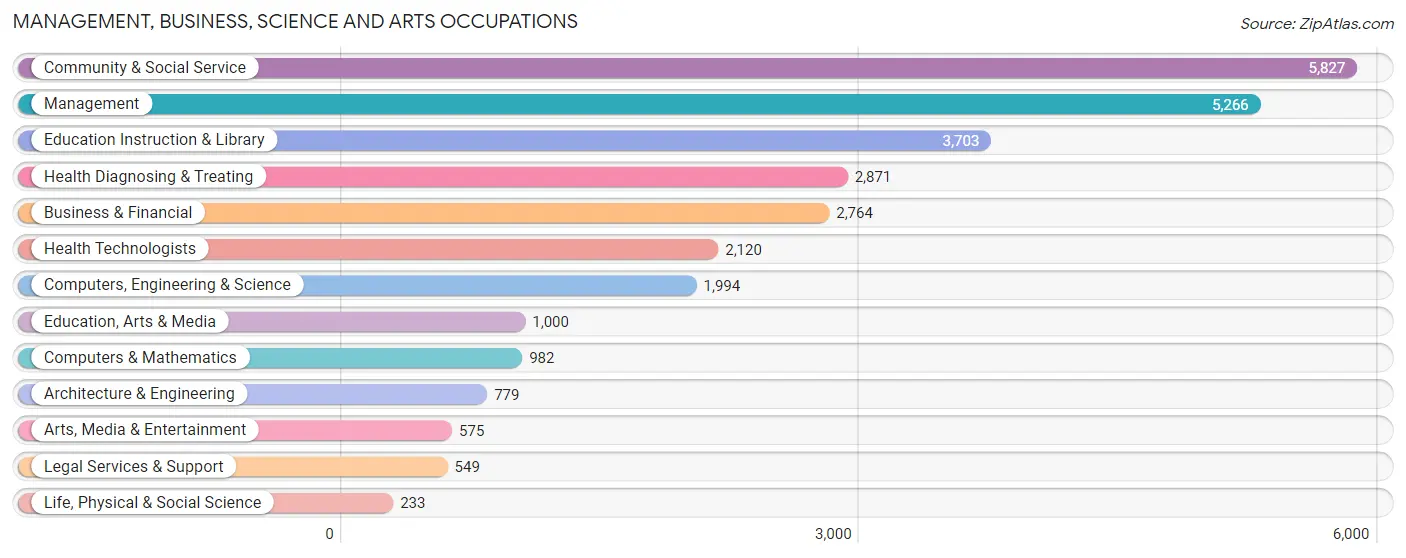
Management, Business, Science and Arts Occupations
The most common Management, Business, Science and Arts occupations in Toms River are Community & Social Service (5,827 | 12.8%), Management (5,266 | 11.6%), Education Instruction & Library (3,703 | 8.1%), Health Diagnosing & Treating (2,871 | 6.3%), and Business & Financial (2,764 | 6.1%).
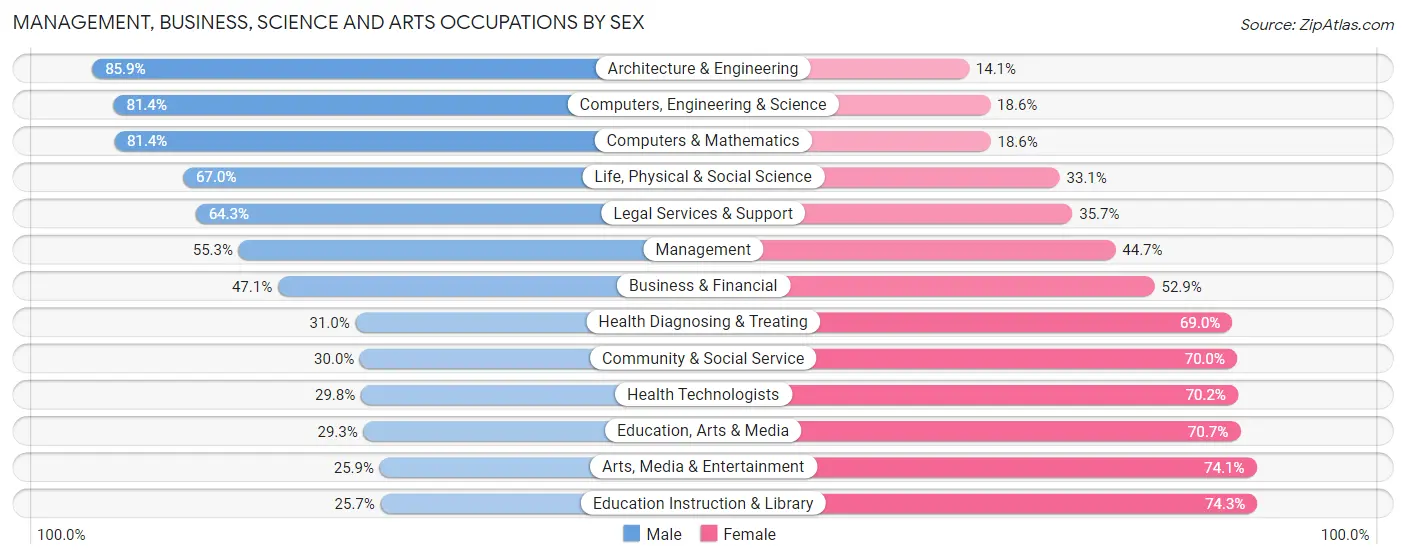
Management, Business, Science and Arts Occupations by Sex
Within the Management, Business, Science and Arts occupations in Toms River, the most male-oriented occupations are Architecture & Engineering (85.9%), Computers, Engineering & Science (81.4%), and Computers & Mathematics (81.4%), while the most female-oriented occupations are Education Instruction & Library (74.3%), Arts, Media & Entertainment (74.1%), and Education, Arts & Media (70.7%).
| Occupation | Male | Female |
| Management | 2,913 (55.3%) | 2,353 (44.7%) |
| Business & Financial | 1,303 (47.1%) | 1,461 (52.9%) |
| Computers, Engineering & Science | 1,624 (81.4%) | 370 (18.6%) |
| Computers & Mathematics | 799 (81.4%) | 183 (18.6%) |
| Architecture & Engineering | 669 (85.9%) | 110 (14.1%) |
| Life, Physical & Social Science | 156 (66.9%) | 77 (33.1%) |
| Community & Social Service | 1,748 (30.0%) | 4,079 (70.0%) |
| Education, Arts & Media | 293 (29.3%) | 707 (70.7%) |
| Legal Services & Support | 353 (64.3%) | 196 (35.7%) |
| Education Instruction & Library | 953 (25.7%) | 2,750 (74.3%) |
| Arts, Media & Entertainment | 149 (25.9%) | 426 (74.1%) |
| Health Diagnosing & Treating | 889 (31.0%) | 1,982 (69.0%) |
| Health Technologists | 632 (29.8%) | 1,488 (70.2%) |
| Total (Category) | 8,477 (45.3%) | 10,245 (54.7%) |
| Total (Overall) | 23,260 (51.1%) | 22,224 (48.9%) |
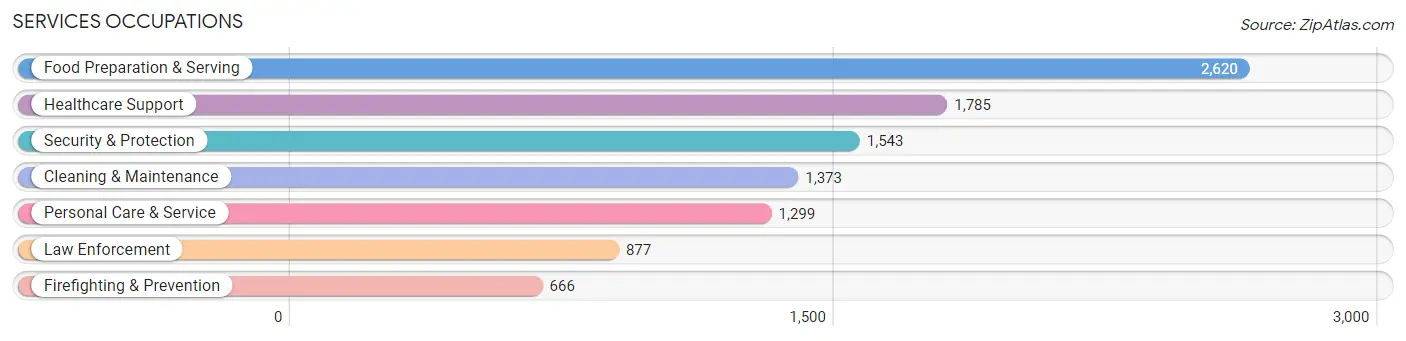
Services Occupations
The most common Services occupations in Toms River are Food Preparation & Serving (2,620 | 5.8%), Healthcare Support (1,785 | 3.9%), Security & Protection (1,543 | 3.4%), Cleaning & Maintenance (1,373 | 3.0%), and Personal Care & Service (1,299 | 2.9%).
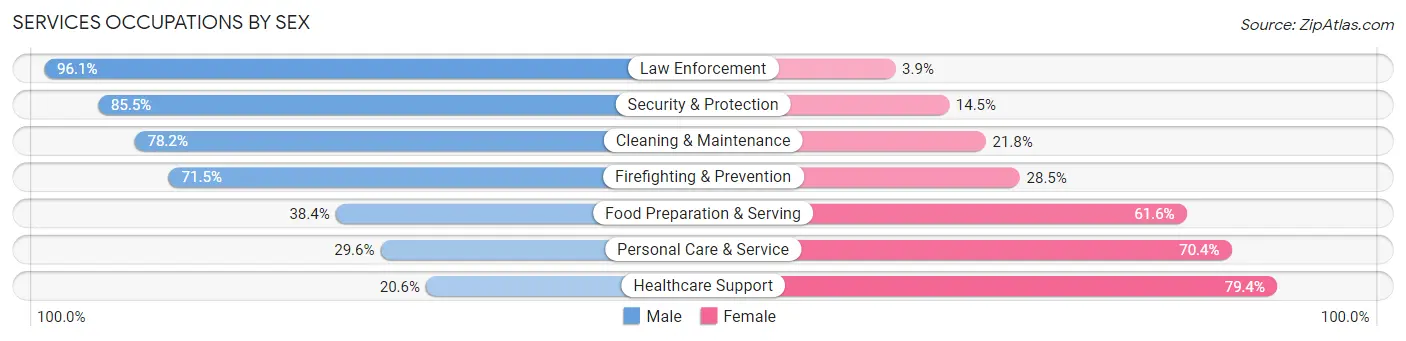
Services Occupations by Sex
Within the Services occupations in Toms River, the most male-oriented occupations are Law Enforcement (96.1%), Security & Protection (85.5%), and Cleaning & Maintenance (78.2%), while the most female-oriented occupations are Healthcare Support (79.4%), Personal Care & Service (70.4%), and Food Preparation & Serving (61.6%).
| Occupation | Male | Female |
| Healthcare Support | 367 (20.6%) | 1,418 (79.4%) |
| Security & Protection | 1,319 (85.5%) | 224 (14.5%) |
| Firefighting & Prevention | 476 (71.5%) | 190 (28.5%) |
| Law Enforcement | 843 (96.1%) | 34 (3.9%) |
| Food Preparation & Serving | 1,007 (38.4%) | 1,613 (61.6%) |
| Cleaning & Maintenance | 1,074 (78.2%) | 299 (21.8%) |
| Personal Care & Service | 384 (29.6%) | 915 (70.4%) |
| Total (Category) | 4,151 (48.2%) | 4,469 (51.8%) |
| Total (Overall) | 23,260 (51.1%) | 22,224 (48.9%) |
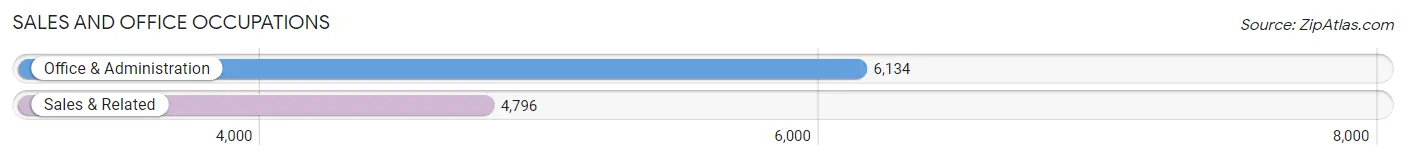
Sales and Office Occupations
The most common Sales and Office occupations in Toms River are Office & Administration (6,134 | 13.5%), and Sales & Related (4,796 | 10.5%).
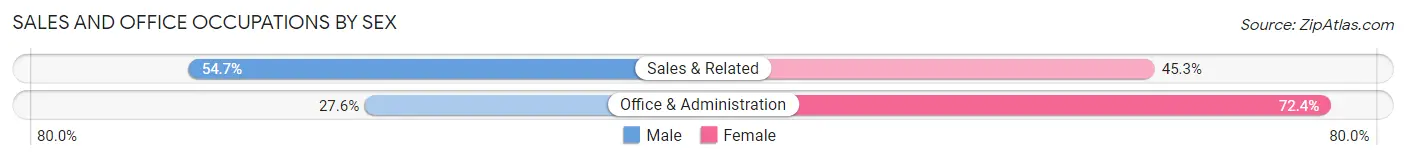
Sales and Office Occupations by Sex
| Occupation | Male | Female |
| Sales & Related | 2,625 (54.7%) | 2,171 (45.3%) |
| Office & Administration | 1,695 (27.6%) | 4,439 (72.4%) |
| Total (Category) | 4,320 (39.5%) | 6,610 (60.5%) |
| Total (Overall) | 23,260 (51.1%) | 22,224 (48.9%) |
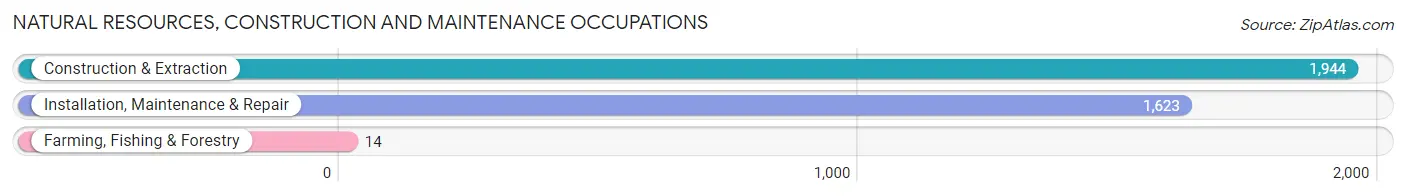
Natural Resources, Construction and Maintenance Occupations
The most common Natural Resources, Construction and Maintenance occupations in Toms River are Construction & Extraction (1,944 | 4.3%), Installation, Maintenance & Repair (1,623 | 3.6%), and Farming, Fishing & Forestry (14 | 0.0%).
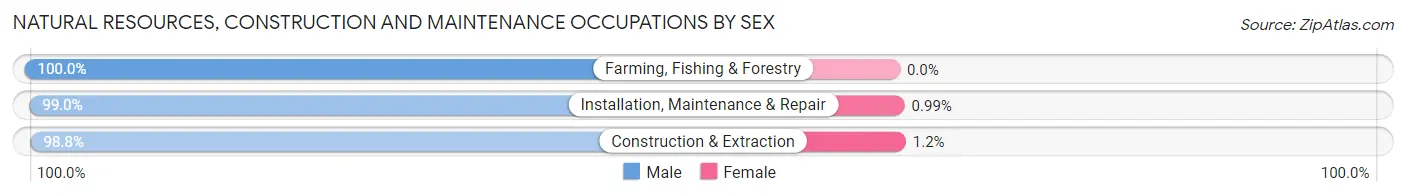
Natural Resources, Construction and Maintenance Occupations by Sex
| Occupation | Male | Female |
| Farming, Fishing & Forestry | 14 (100.0%) | 0 (0.0%) |
| Construction & Extraction | 1,920 (98.8%) | 24 (1.2%) |
| Installation, Maintenance & Repair | 1,607 (99.0%) | 16 (1.0%) |
| Total (Category) | 3,541 (98.9%) | 40 (1.1%) |
| Total (Overall) | 23,260 (51.1%) | 22,224 (48.9%) |
Production, Transportation and Moving Occupations
The most common Production, Transportation and Moving occupations in Toms River are Transportation (1,545 | 3.4%), Production (1,213 | 2.7%), and Material Moving (873 | 1.9%).
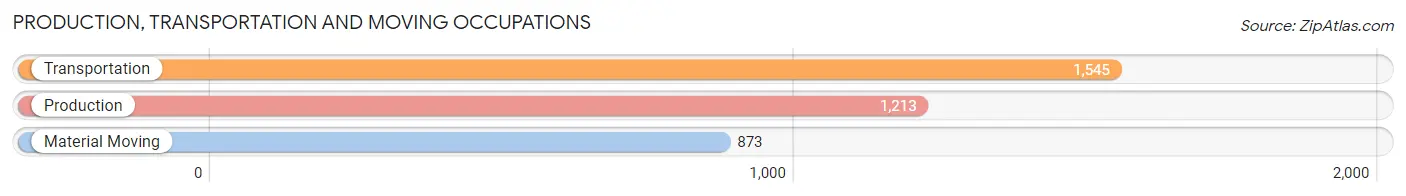
Production, Transportation and Moving Occupations by Sex
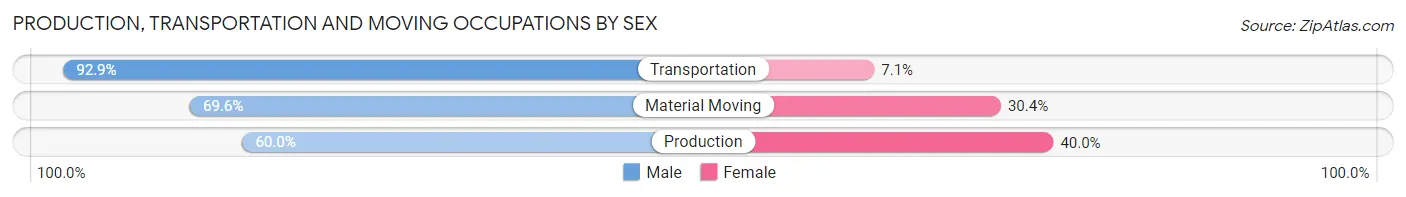
| Occupation | Male | Female |
| Production | 728 (60.0%) | 485 (40.0%) |
| Transportation | 1,435 (92.9%) | 110 (7.1%) |
| Material Moving | 608 (69.6%) | 265 (30.4%) |
| Total (Category) | 2,771 (76.3%) | 860 (23.7%) |
| Total (Overall) | 23,260 (51.1%) | 22,224 (48.9%) |
Employment Industries by Sex in Toms River
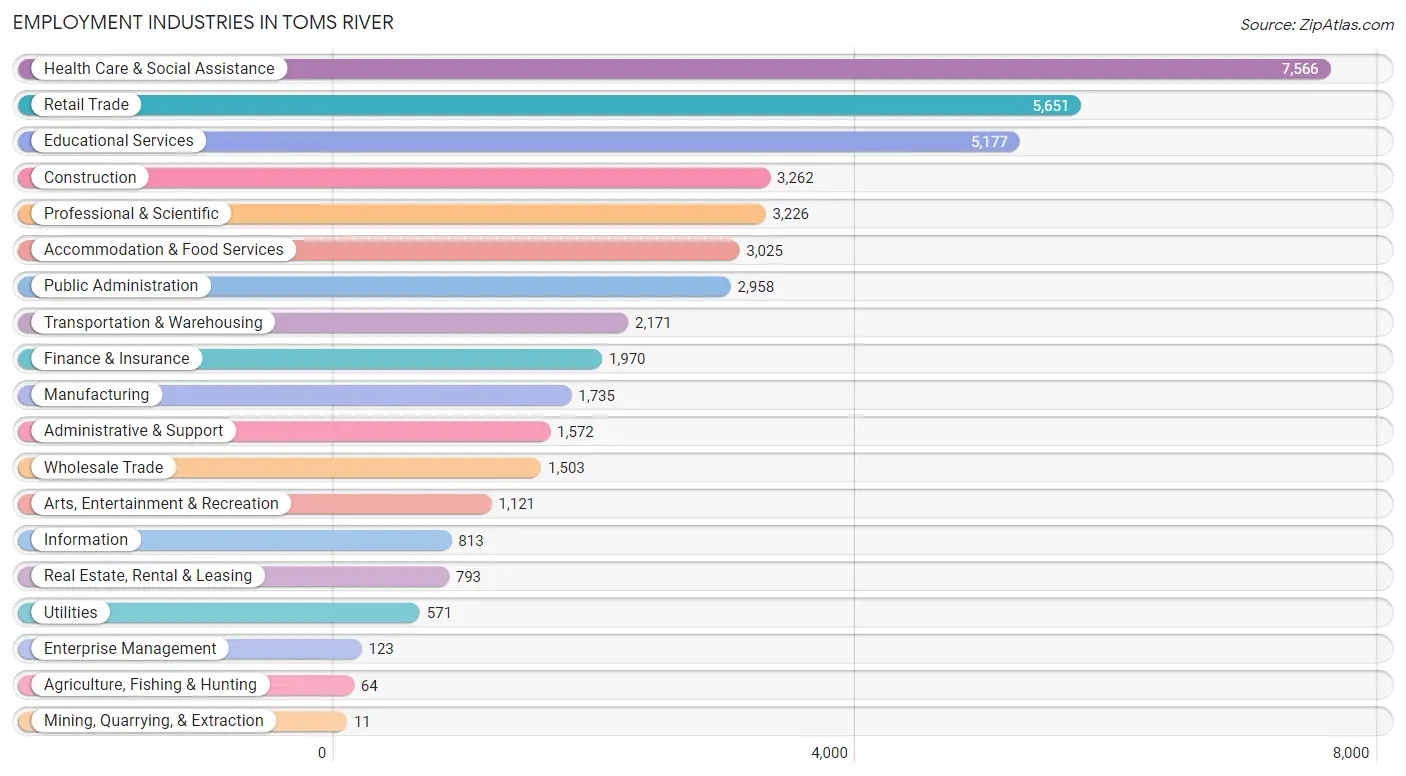
Employment Industries in Toms River
The major employment industries in Toms River include Health Care & Social Assistance (7,566 | 16.6%), Retail Trade (5,651 | 12.4%), Educational Services (5,177 | 11.4%), Construction (3,262 | 7.2%), and Professional & Scientific (3,226 | 7.1%).
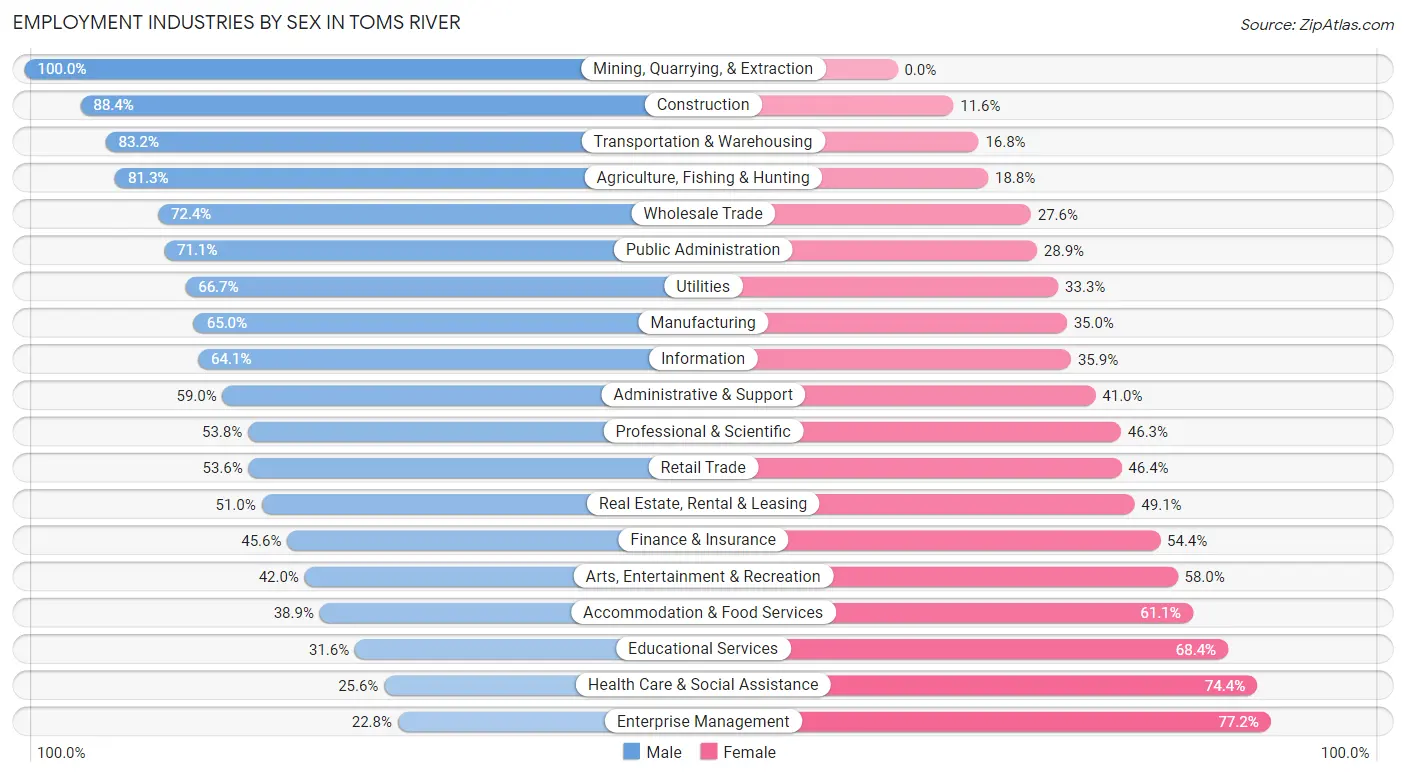
Employment Industries by Sex in Toms River
The Toms River industries that see more men than women are Mining, Quarrying, & Extraction (100.0%), Construction (88.4%), and Transportation & Warehousing (83.2%), whereas the industries that tend to have a higher number of women are Enterprise Management (77.2%), Health Care & Social Assistance (74.4%), and Educational Services (68.4%).
| Industry | Male | Female |
| Agriculture, Fishing & Hunting | 52 (81.2%) | 12 (18.8%) |
| Mining, Quarrying, & Extraction | 11 (100.0%) | 0 (0.0%) |
| Construction | 2,885 (88.4%) | 377 (11.6%) |
| Manufacturing | 1,127 (65.0%) | 608 (35.0%) |
| Wholesale Trade | 1,088 (72.4%) | 415 (27.6%) |
| Retail Trade | 3,031 (53.6%) | 2,620 (46.4%) |
| Transportation & Warehousing | 1,807 (83.2%) | 364 (16.8%) |
| Utilities | 381 (66.7%) | 190 (33.3%) |
| Information | 521 (64.1%) | 292 (35.9%) |
| Finance & Insurance | 899 (45.6%) | 1,071 (54.4%) |
| Real Estate, Rental & Leasing | 404 (50.9%) | 389 (49.0%) |
| Professional & Scientific | 1,734 (53.7%) | 1,492 (46.3%) |
| Enterprise Management | 28 (22.8%) | 95 (77.2%) |
| Administrative & Support | 928 (59.0%) | 644 (41.0%) |
| Educational Services | 1,636 (31.6%) | 3,541 (68.4%) |
| Health Care & Social Assistance | 1,935 (25.6%) | 5,631 (74.4%) |
| Arts, Entertainment & Recreation | 471 (42.0%) | 650 (58.0%) |
| Accommodation & Food Services | 1,177 (38.9%) | 1,848 (61.1%) |
| Public Administration | 2,104 (71.1%) | 854 (28.9%) |
| Total | 23,260 (51.1%) | 22,224 (48.9%) |
Education in Toms River
School Enrollment in Toms River
The most common levels of schooling among the 21,946 students in Toms River are high school (5,306 | 24.2%), middle school (4,778 | 21.8%), and elementary school (4,451 | 20.3%).
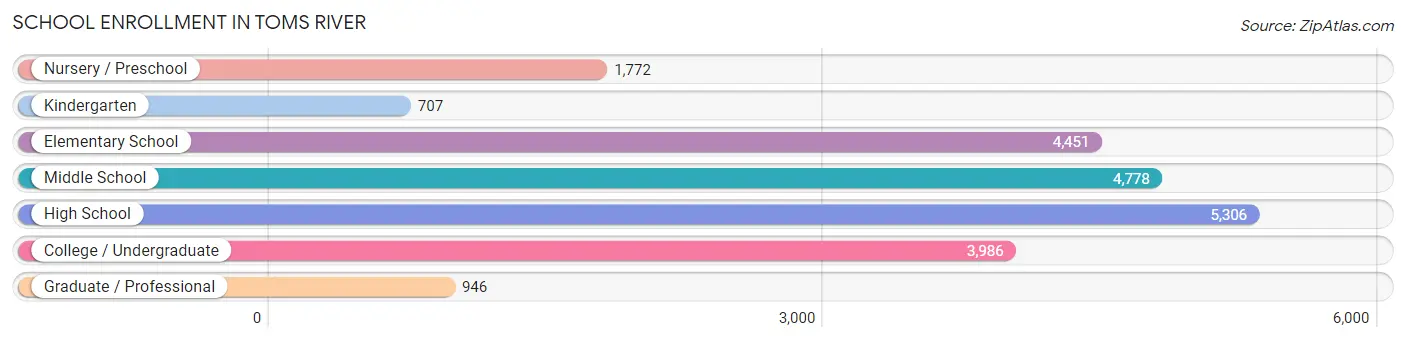
| School Level | # Students | % Students |
| Nursery / Preschool | 1,772 | 8.1% |
| Kindergarten | 707 | 3.2% |
| Elementary School | 4,451 | 20.3% |
| Middle School | 4,778 | 21.8% |
| High School | 5,306 | 24.2% |
| College / Undergraduate | 3,986 | 18.2% |
| Graduate / Professional | 946 | 4.3% |
| Total | 21,946 | 100.0% |
School Enrollment by Age by Funding Source in Toms River
Out of a total of 21,946 students who are enrolled in schools in Toms River, 5,618 (25.6%) attend a private institution, while the remaining 16,328 (74.4%) are enrolled in public schools. The age group of 3 to 4 year olds has the highest likelihood of being enrolled in private schools, with 982 (61.7% in the age bracket) enrolled. Conversely, the age group of 18 to 19 year olds has the lowest likelihood of being enrolled in a private school, with 1,453 (84.3% in the age bracket) attending a public institution.
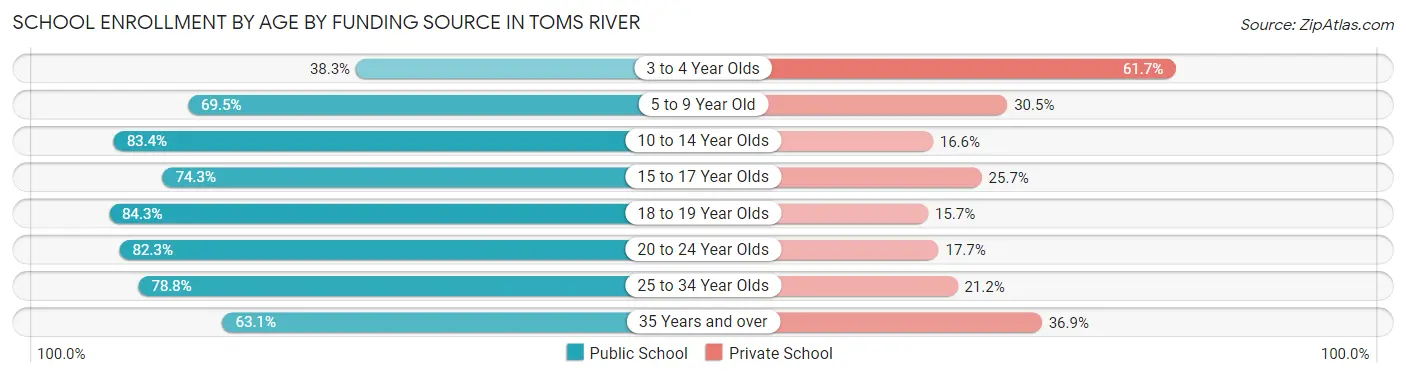
| Age Bracket | Public School | Private School |
| 3 to 4 Year Olds | 609 (38.3%) | 982 (61.7%) |
| 5 to 9 Year Old | 3,256 (69.5%) | 1,427 (30.5%) |
| 10 to 14 Year Olds | 5,166 (83.4%) | 1,028 (16.6%) |
| 15 to 17 Year Olds | 2,738 (74.3%) | 947 (25.7%) |
| 18 to 19 Year Olds | 1,453 (84.3%) | 271 (15.7%) |
| 20 to 24 Year Olds | 1,690 (82.3%) | 363 (17.7%) |
| 25 to 34 Year Olds | 762 (78.8%) | 205 (21.2%) |
| 35 Years and over | 662 (63.1%) | 387 (36.9%) |
| Total | 16,328 (74.4%) | 5,618 (25.6%) |
Educational Attainment by Field of Study in Toms River
Education (4,469 | 18.6%), business (4,209 | 17.5%), science & technology (2,234 | 9.3%), arts & humanities (2,053 | 8.5%), and social sciences (1,489 | 6.2%) are the most common fields of study among 24,028 individuals in Toms River who have obtained a bachelor's degree or higher.
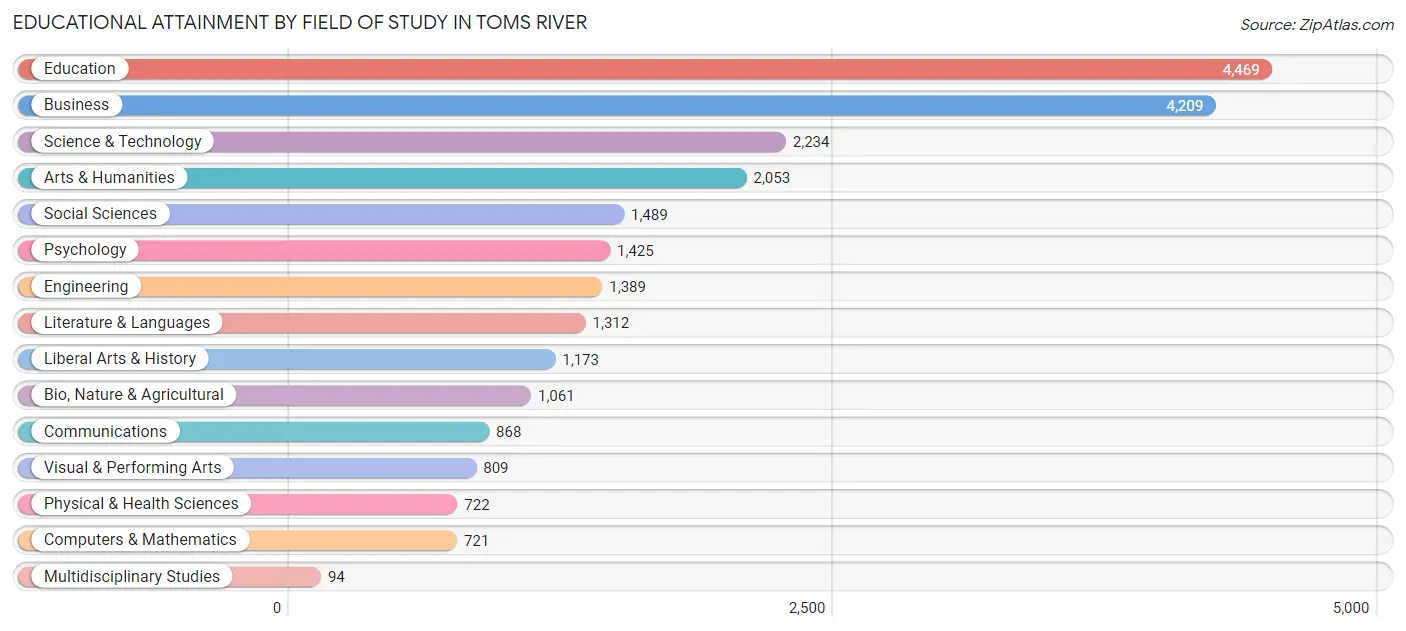
| Field of Study | # Graduates | % Graduates |
| Computers & Mathematics | 721 | 3.0% |
| Bio, Nature & Agricultural | 1,061 | 4.4% |
| Physical & Health Sciences | 722 | 3.0% |
| Psychology | 1,425 | 5.9% |
| Social Sciences | 1,489 | 6.2% |
| Engineering | 1,389 | 5.8% |
| Multidisciplinary Studies | 94 | 0.4% |
| Science & Technology | 2,234 | 9.3% |
| Business | 4,209 | 17.5% |
| Education | 4,469 | 18.6% |
| Literature & Languages | 1,312 | 5.5% |
| Liberal Arts & History | 1,173 | 4.9% |
| Visual & Performing Arts | 809 | 3.4% |
| Communications | 868 | 3.6% |
| Arts & Humanities | 2,053 | 8.5% |
| Total | 24,028 | 100.0% |
Transportation & Commute in Toms River
Vehicle Availability by Sex in Toms River
The most prevalent vehicle ownership categories in Toms River are males with 2 vehicles (9,774, accounting for 42.1%) and females with 2 vehicles (9,296, making up 45.2%).
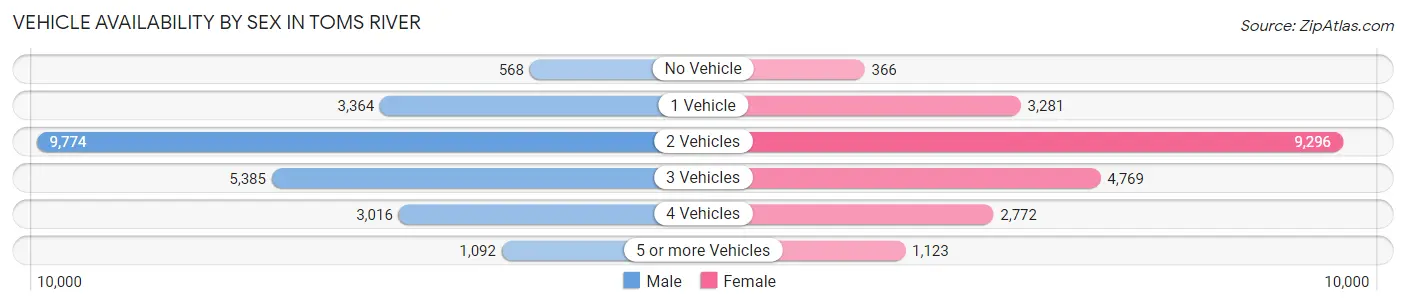
| Vehicles Available | Male | Female |
| No Vehicle | 568 (2.5%) | 366 (1.7%) |
| 1 Vehicle | 3,364 (14.5%) | 3,281 (15.2%) |
| 2 Vehicles | 9,774 (42.1%) | 9,296 (43.0%) |
| 3 Vehicles | 5,385 (23.2%) | 4,769 (22.1%) |
| 4 Vehicles | 3,016 (13.0%) | 2,772 (12.8%) |
| 5 or more Vehicles | 1,092 (4.7%) | 1,123 (5.2%) |
| Total | 23,199 (100.0%) | 21,607 (100.0%) |
Commute Time in Toms River
The most frequently occuring commute durations in Toms River are 15 to 19 minutes (6,633 commuters, 16.7%), 10 to 14 minutes (5,537 commuters, 13.9%), and 20 to 24 minutes (4,771 commuters, 12.0%).
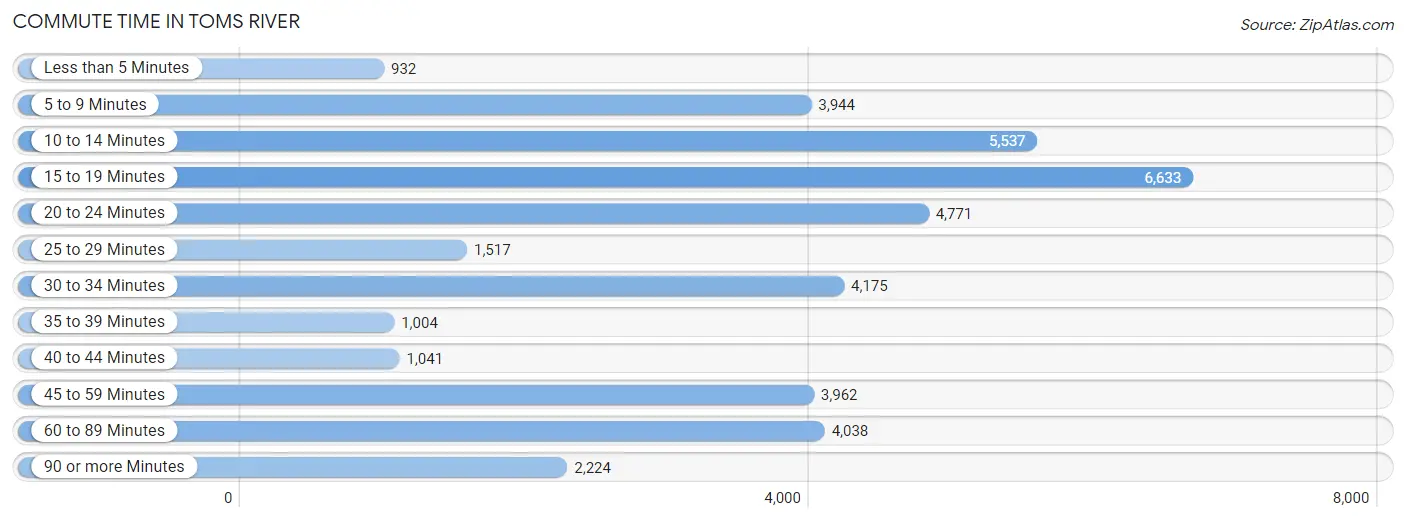
| Commute Time | # Commuters | % Commuters |
| Less than 5 Minutes | 932 | 2.3% |
| 5 to 9 Minutes | 3,944 | 9.9% |
| 10 to 14 Minutes | 5,537 | 13.9% |
| 15 to 19 Minutes | 6,633 | 16.7% |
| 20 to 24 Minutes | 4,771 | 12.0% |
| 25 to 29 Minutes | 1,517 | 3.8% |
| 30 to 34 Minutes | 4,175 | 10.5% |
| 35 to 39 Minutes | 1,004 | 2.5% |
| 40 to 44 Minutes | 1,041 | 2.6% |
| 45 to 59 Minutes | 3,962 | 10.0% |
| 60 to 89 Minutes | 4,038 | 10.2% |
| 90 or more Minutes | 2,224 | 5.6% |
Commute Time by Sex in Toms River
The most common commute times in Toms River are 15 to 19 minutes (2,995 commuters, 14.4%) for males and 15 to 19 minutes (3,638 commuters, 19.2%) for females.
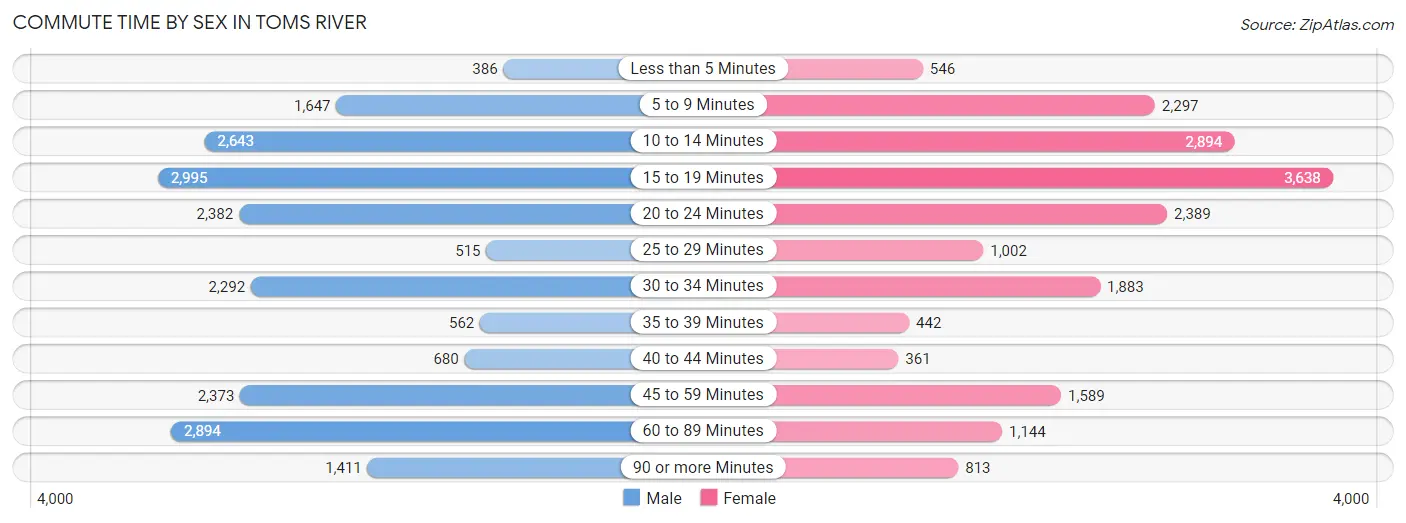
| Commute Time | Male | Female |
| Less than 5 Minutes | 386 (1.9%) | 546 (2.9%) |
| 5 to 9 Minutes | 1,647 (7.9%) | 2,297 (12.1%) |
| 10 to 14 Minutes | 2,643 (12.7%) | 2,894 (15.2%) |
| 15 to 19 Minutes | 2,995 (14.4%) | 3,638 (19.2%) |
| 20 to 24 Minutes | 2,382 (11.5%) | 2,389 (12.6%) |
| 25 to 29 Minutes | 515 (2.5%) | 1,002 (5.3%) |
| 30 to 34 Minutes | 2,292 (11.0%) | 1,883 (9.9%) |
| 35 to 39 Minutes | 562 (2.7%) | 442 (2.3%) |
| 40 to 44 Minutes | 680 (3.3%) | 361 (1.9%) |
| 45 to 59 Minutes | 2,373 (11.4%) | 1,589 (8.4%) |
| 60 to 89 Minutes | 2,894 (13.9%) | 1,144 (6.0%) |
| 90 or more Minutes | 1,411 (6.8%) | 813 (4.3%) |
Time of Departure to Work by Sex in Toms River
The most frequent times of departure to work in Toms River are 7:00 AM to 7:29 AM (2,835, 13.6%) for males and 8:00 AM to 8:29 AM (2,666, 14.0%) for females.
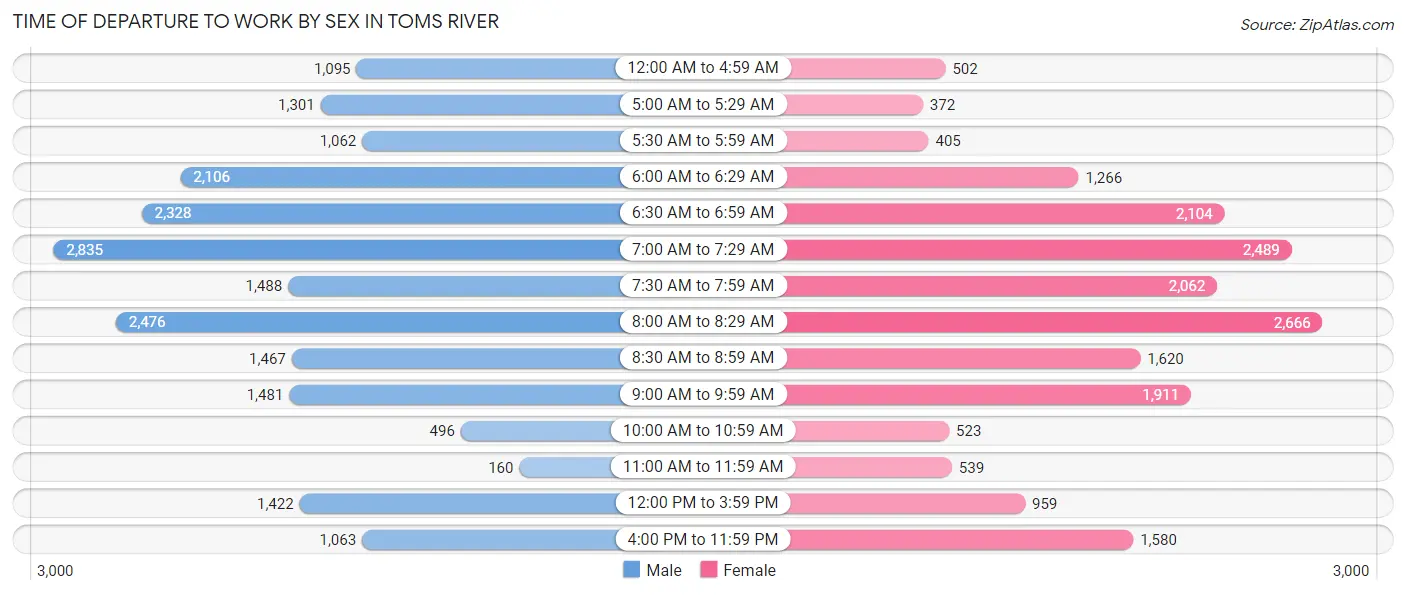
| Time of Departure | Male | Female |
| 12:00 AM to 4:59 AM | 1,095 (5.3%) | 502 (2.6%) |
| 5:00 AM to 5:29 AM | 1,301 (6.3%) | 372 (2.0%) |
| 5:30 AM to 5:59 AM | 1,062 (5.1%) | 405 (2.1%) |
| 6:00 AM to 6:29 AM | 2,106 (10.1%) | 1,266 (6.7%) |
| 6:30 AM to 6:59 AM | 2,328 (11.2%) | 2,104 (11.1%) |
| 7:00 AM to 7:29 AM | 2,835 (13.6%) | 2,489 (13.1%) |
| 7:30 AM to 7:59 AM | 1,488 (7.2%) | 2,062 (10.8%) |
| 8:00 AM to 8:29 AM | 2,476 (11.9%) | 2,666 (14.0%) |
| 8:30 AM to 8:59 AM | 1,467 (7.1%) | 1,620 (8.5%) |
| 9:00 AM to 9:59 AM | 1,481 (7.1%) | 1,911 (10.1%) |
| 10:00 AM to 10:59 AM | 496 (2.4%) | 523 (2.8%) |
| 11:00 AM to 11:59 AM | 160 (0.8%) | 539 (2.8%) |
| 12:00 PM to 3:59 PM | 1,422 (6.8%) | 959 (5.1%) |
| 4:00 PM to 11:59 PM | 1,063 (5.1%) | 1,580 (8.3%) |
| Total | 20,780 (100.0%) | 18,998 (100.0%) |
Housing Occupancy in Toms River
Occupancy by Ownership in Toms River
Of the total 35,166 dwellings in Toms River, owner-occupied units account for 28,336 (80.6%), while renter-occupied units make up 6,830 (19.4%).
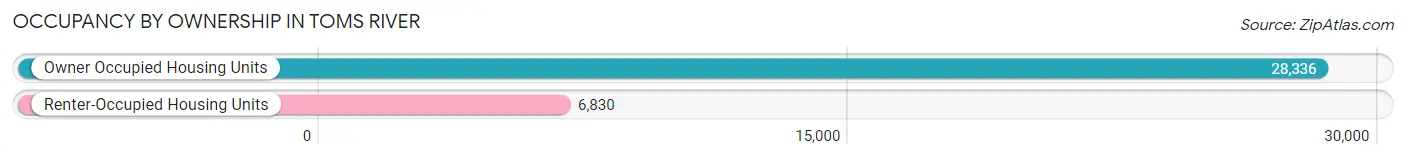
| Occupancy | # Housing Units | % Housing Units |
| Owner Occupied Housing Units | 28,336 | 80.6% |
| Renter-Occupied Housing Units | 6,830 | 19.4% |
| Total Occupied Housing Units | 35,166 | 100.0% |
Occupancy by Household Size in Toms River
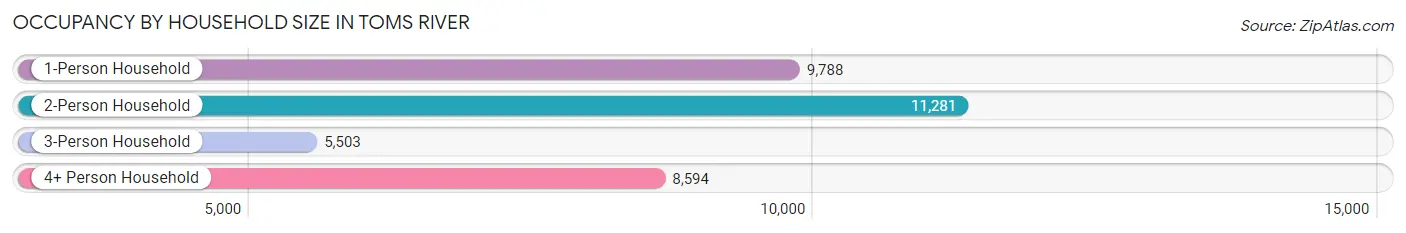
| Household Size | # Housing Units | % Housing Units |
| 1-Person Household | 9,788 | 27.8% |
| 2-Person Household | 11,281 | 32.1% |
| 3-Person Household | 5,503 | 15.7% |
| 4+ Person Household | 8,594 | 24.4% |
| Total Housing Units | 35,166 | 100.0% |
Occupancy by Ownership by Household Size in Toms River
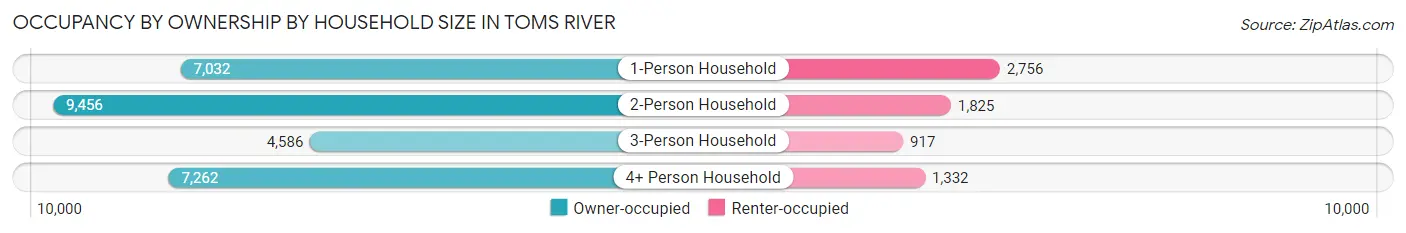
| Household Size | Owner-occupied | Renter-occupied |
| 1-Person Household | 7,032 (71.8%) | 2,756 (28.2%) |
| 2-Person Household | 9,456 (83.8%) | 1,825 (16.2%) |
| 3-Person Household | 4,586 (83.3%) | 917 (16.7%) |
| 4+ Person Household | 7,262 (84.5%) | 1,332 (15.5%) |
| Total Housing Units | 28,336 (80.6%) | 6,830 (19.4%) |
Occupancy by Educational Attainment in Toms River
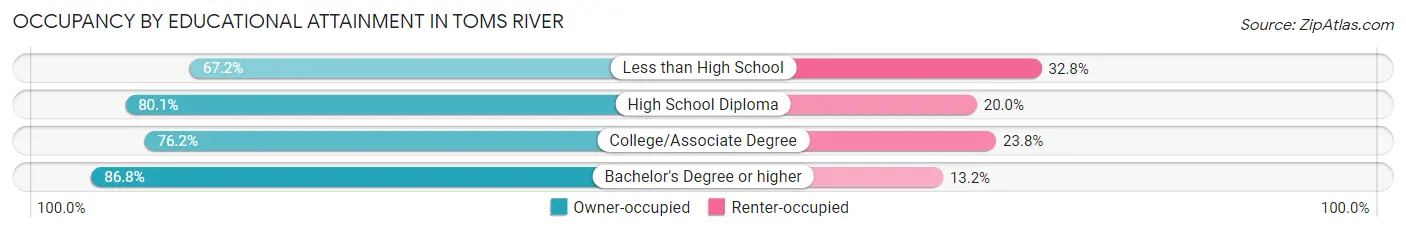
| Household Size | Owner-occupied | Renter-occupied |
| Less than High School | 1,455 (67.2%) | 710 (32.8%) |
| High School Diploma | 8,331 (80.0%) | 2,076 (20.0%) |
| College/Associate Degree | 7,605 (76.2%) | 2,374 (23.8%) |
| Bachelor's Degree or higher | 10,945 (86.8%) | 1,670 (13.2%) |
Occupancy by Age of Householder in Toms River
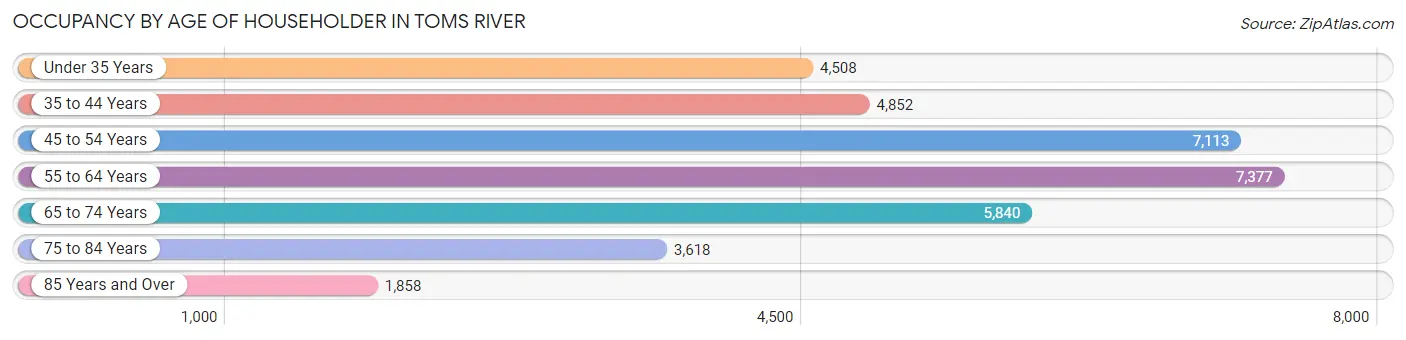
| Age Bracket | # Households | % Households |
| Under 35 Years | 4,508 | 12.8% |
| 35 to 44 Years | 4,852 | 13.8% |
| 45 to 54 Years | 7,113 | 20.2% |
| 55 to 64 Years | 7,377 | 21.0% |
| 65 to 74 Years | 5,840 | 16.6% |
| 75 to 84 Years | 3,618 | 10.3% |
| 85 Years and Over | 1,858 | 5.3% |
| Total | 35,166 | 100.0% |
Housing Finances in Toms River
Median Income by Occupancy in Toms River
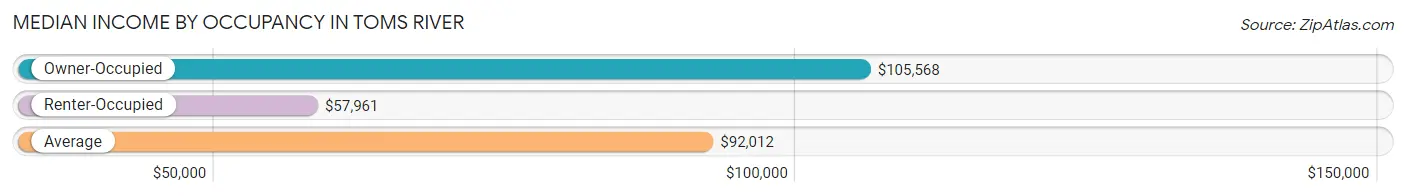
| Occupancy Type | # Households | Median Income |
| Owner-Occupied | 28,336 (80.6%) | $105,568 |
| Renter-Occupied | 6,830 (19.4%) | $57,961 |
| Average | 35,166 (100.0%) | $92,012 |
Occupancy by Householder Income Bracket in Toms River
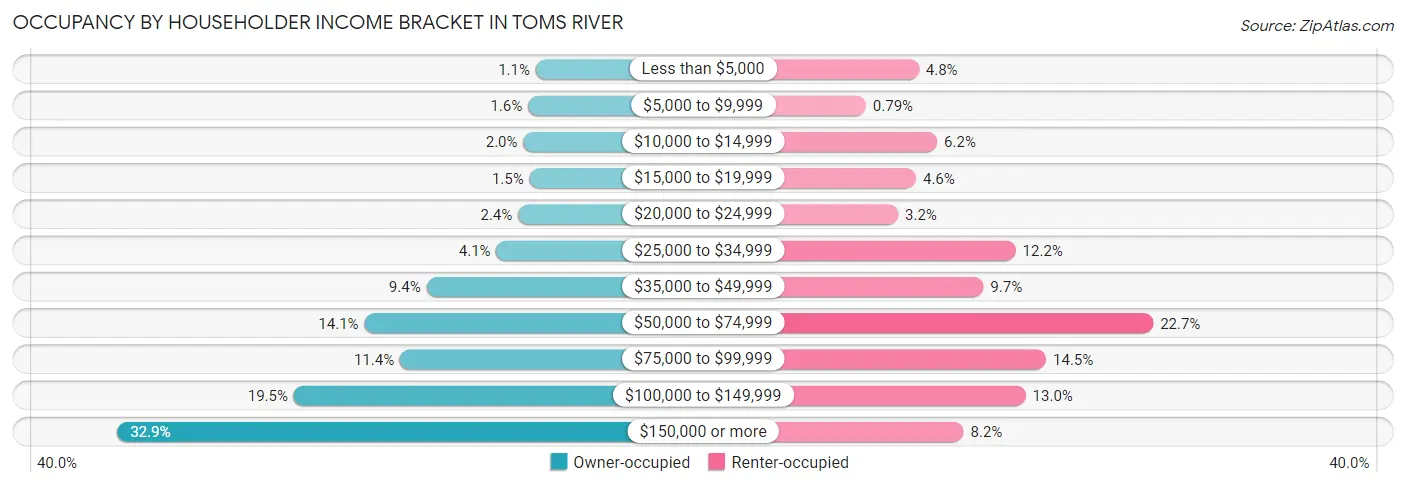
| Income Bracket | Owner-occupied | Renter-occupied |
| Less than $5,000 | 297 (1.1%) | 329 (4.8%) |
| $5,000 to $9,999 | 466 (1.6%) | 54 (0.8%) |
| $10,000 to $14,999 | 567 (2.0%) | 425 (6.2%) |
| $15,000 to $19,999 | 434 (1.5%) | 315 (4.6%) |
| $20,000 to $24,999 | 681 (2.4%) | 221 (3.2%) |
| $25,000 to $34,999 | 1,147 (4.1%) | 833 (12.2%) |
| $35,000 to $49,999 | 2,657 (9.4%) | 665 (9.7%) |
| $50,000 to $74,999 | 3,999 (14.1%) | 1,549 (22.7%) |
| $75,000 to $99,999 | 3,231 (11.4%) | 992 (14.5%) |
| $100,000 to $149,999 | 5,524 (19.5%) | 885 (13.0%) |
| $150,000 or more | 9,333 (32.9%) | 562 (8.2%) |
| Total | 28,336 (100.0%) | 6,830 (100.0%) |
Monthly Housing Cost Tiers in Toms River
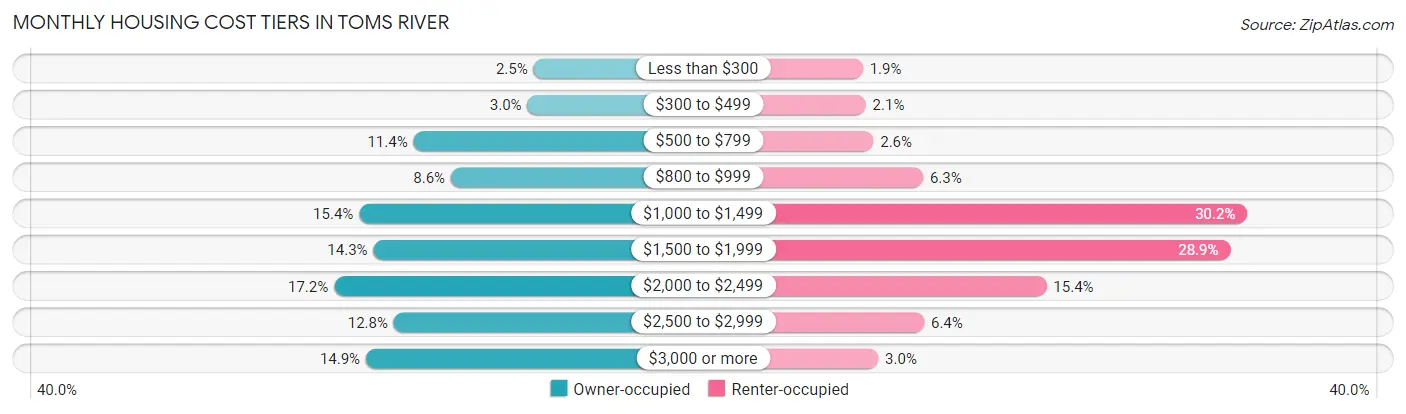
| Monthly Cost | Owner-occupied | Renter-occupied |
| Less than $300 | 714 (2.5%) | 127 (1.9%) |
| $300 to $499 | 841 (3.0%) | 142 (2.1%) |
| $500 to $799 | 3,220 (11.4%) | 180 (2.6%) |
| $800 to $999 | 2,437 (8.6%) | 430 (6.3%) |
| $1,000 to $1,499 | 4,351 (15.4%) | 2,061 (30.2%) |
| $1,500 to $1,999 | 4,054 (14.3%) | 1,976 (28.9%) |
| $2,000 to $2,499 | 4,876 (17.2%) | 1,051 (15.4%) |
| $2,500 to $2,999 | 3,631 (12.8%) | 436 (6.4%) |
| $3,000 or more | 4,212 (14.9%) | 205 (3.0%) |
| Total | 28,336 (100.0%) | 6,830 (100.0%) |
Physical Housing Characteristics in Toms River
Housing Structures in Toms River
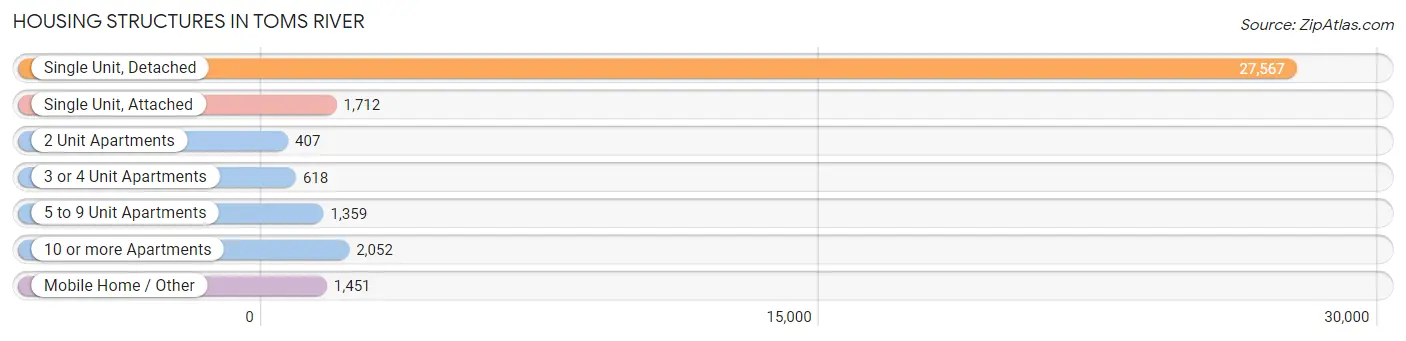
| Structure Type | # Housing Units | % Housing Units |
| Single Unit, Detached | 27,567 | 78.4% |
| Single Unit, Attached | 1,712 | 4.9% |
| 2 Unit Apartments | 407 | 1.2% |
| 3 or 4 Unit Apartments | 618 | 1.8% |
| 5 to 9 Unit Apartments | 1,359 | 3.9% |
| 10 or more Apartments | 2,052 | 5.8% |
| Mobile Home / Other | 1,451 | 4.1% |
| Total | 35,166 | 100.0% |
Housing Structures by Occupancy in Toms River
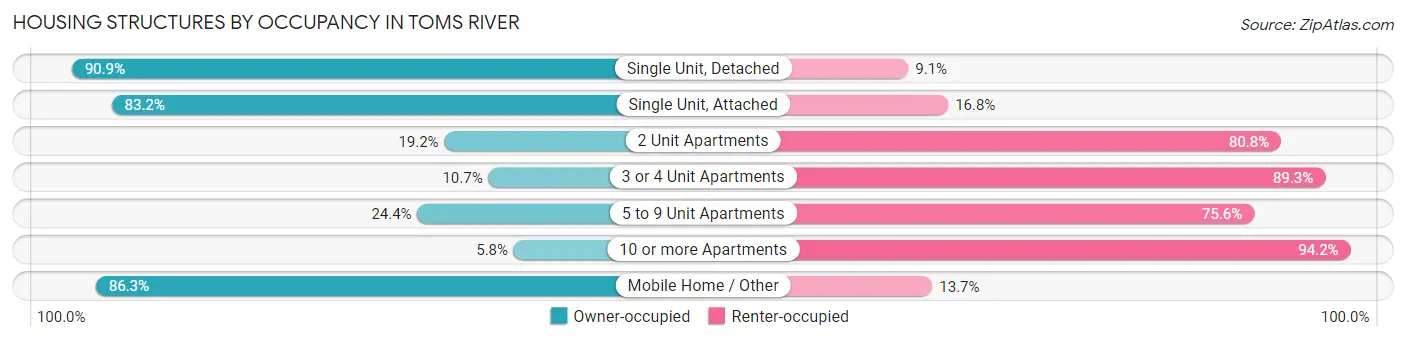
| Structure Type | Owner-occupied | Renter-occupied |
| Single Unit, Detached | 25,065 (90.9%) | 2,502 (9.1%) |
| Single Unit, Attached | 1,425 (83.2%) | 287 (16.8%) |
| 2 Unit Apartments | 78 (19.2%) | 329 (80.8%) |
| 3 or 4 Unit Apartments | 66 (10.7%) | 552 (89.3%) |
| 5 to 9 Unit Apartments | 331 (24.4%) | 1,028 (75.6%) |
| 10 or more Apartments | 119 (5.8%) | 1,933 (94.2%) |
| Mobile Home / Other | 1,252 (86.3%) | 199 (13.7%) |
| Total | 28,336 (80.6%) | 6,830 (19.4%) |
Housing Structures by Number of Rooms in Toms River
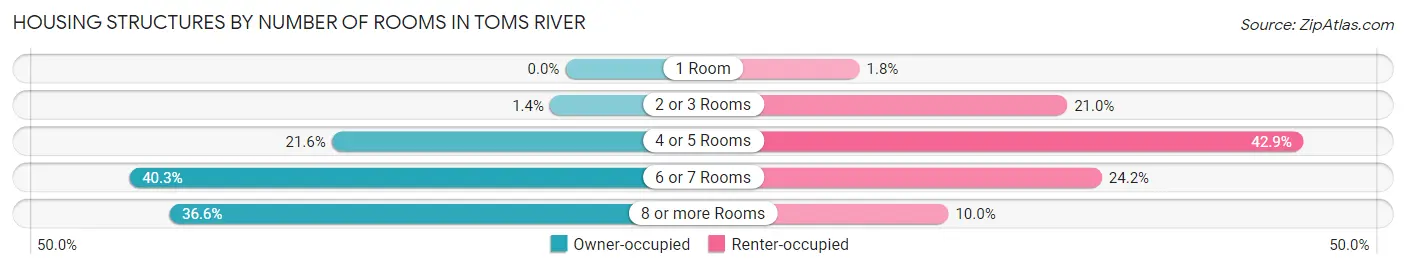
| Number of Rooms | Owner-occupied | Renter-occupied |
| 1 Room | 0 (0.0%) | 124 (1.8%) |
| 2 or 3 Rooms | 406 (1.4%) | 1,436 (21.0%) |
| 4 or 5 Rooms | 6,123 (21.6%) | 2,929 (42.9%) |
| 6 or 7 Rooms | 11,426 (40.3%) | 1,655 (24.2%) |
| 8 or more Rooms | 10,381 (36.6%) | 686 (10.0%) |
| Total | 28,336 (100.0%) | 6,830 (100.0%) |
Housing Structure by Heating Type in Toms River
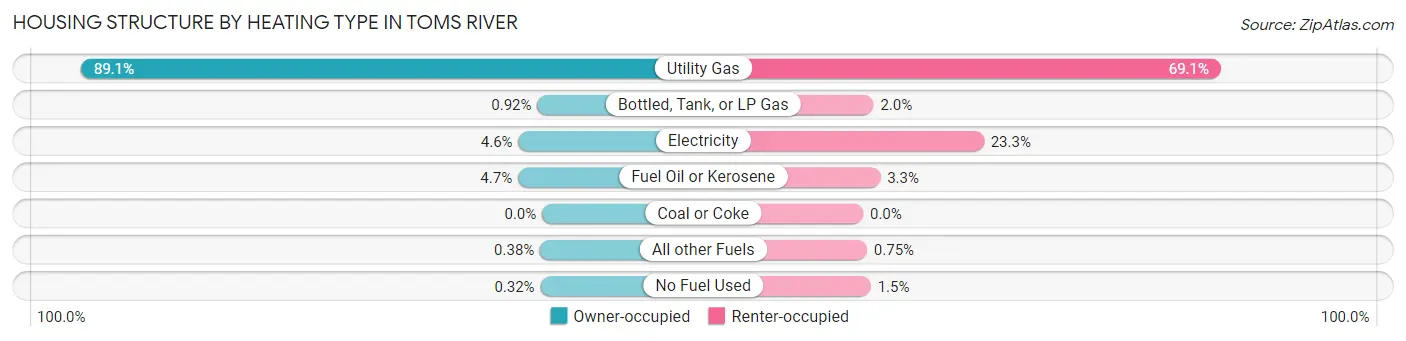
| Heating Type | Owner-occupied | Renter-occupied |
| Utility Gas | 25,256 (89.1%) | 4,721 (69.1%) |
| Bottled, Tank, or LP Gas | 261 (0.9%) | 137 (2.0%) |
| Electricity | 1,299 (4.6%) | 1,593 (23.3%) |
| Fuel Oil or Kerosene | 1,320 (4.7%) | 226 (3.3%) |
| Coal or Coke | 0 (0.0%) | 0 (0.0%) |
| All other Fuels | 109 (0.4%) | 51 (0.7%) |
| No Fuel Used | 91 (0.3%) | 102 (1.5%) |
| Total | 28,336 (100.0%) | 6,830 (100.0%) |
Household Vehicle Usage in Toms River
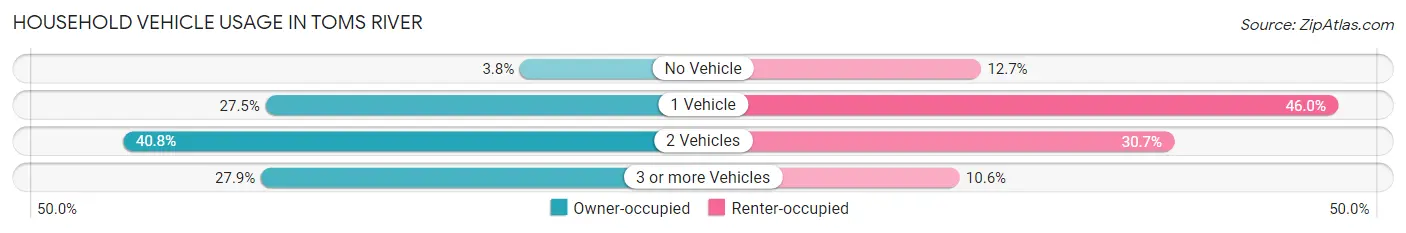
| Vehicles per Household | Owner-occupied | Renter-occupied |
| No Vehicle | 1,063 (3.7%) | 864 (12.7%) |
| 1 Vehicle | 7,791 (27.5%) | 3,142 (46.0%) |
| 2 Vehicles | 11,571 (40.8%) | 2,097 (30.7%) |
| 3 or more Vehicles | 7,911 (27.9%) | 727 (10.6%) |
| Total | 28,336 (100.0%) | 6,830 (100.0%) |
Real Estate & Mortgages in Toms River
Real Estate and Mortgage Overview in Toms River
| Characteristic | Without Mortgage | With Mortgage |
| Housing Units | 9,411 | 18,925 |
| Median Property Value | $327,300 | $370,400 |
| Median Household Income | $66,929 | $7,716 |
| Monthly Housing Costs | $843 | $4,155 |
| Real Estate Taxes | $5,986 | $280 |
Property Value by Mortgage Status in Toms River
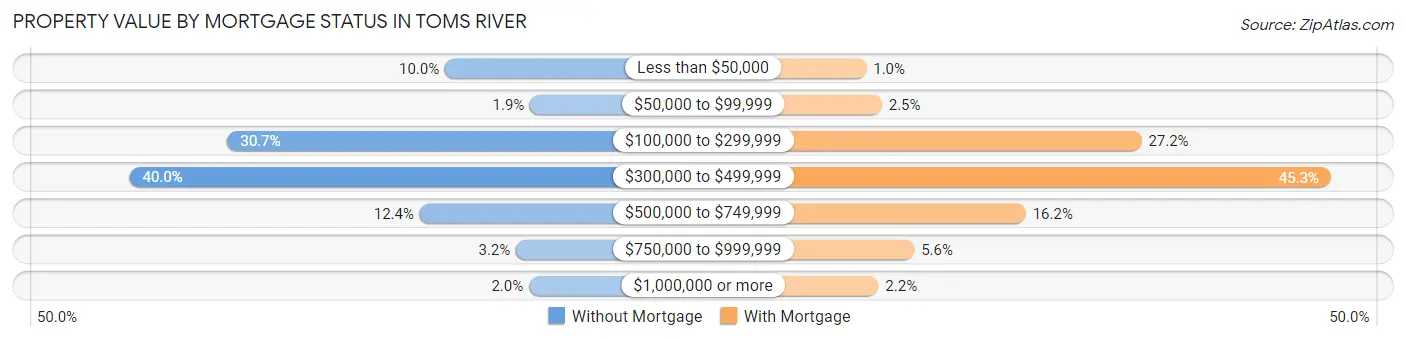
| Property Value | Without Mortgage | With Mortgage |
| Less than $50,000 | 937 (10.0%) | 193 (1.0%) |
| $50,000 to $99,999 | 174 (1.8%) | 474 (2.5%) |
| $100,000 to $299,999 | 2,888 (30.7%) | 5,153 (27.2%) |
| $300,000 to $499,999 | 3,765 (40.0%) | 8,567 (45.3%) |
| $500,000 to $749,999 | 1,163 (12.4%) | 3,067 (16.2%) |
| $750,000 to $999,999 | 300 (3.2%) | 1,058 (5.6%) |
| $1,000,000 or more | 184 (2.0%) | 413 (2.2%) |
| Total | 9,411 (100.0%) | 18,925 (100.0%) |
Household Income by Mortgage Status in Toms River
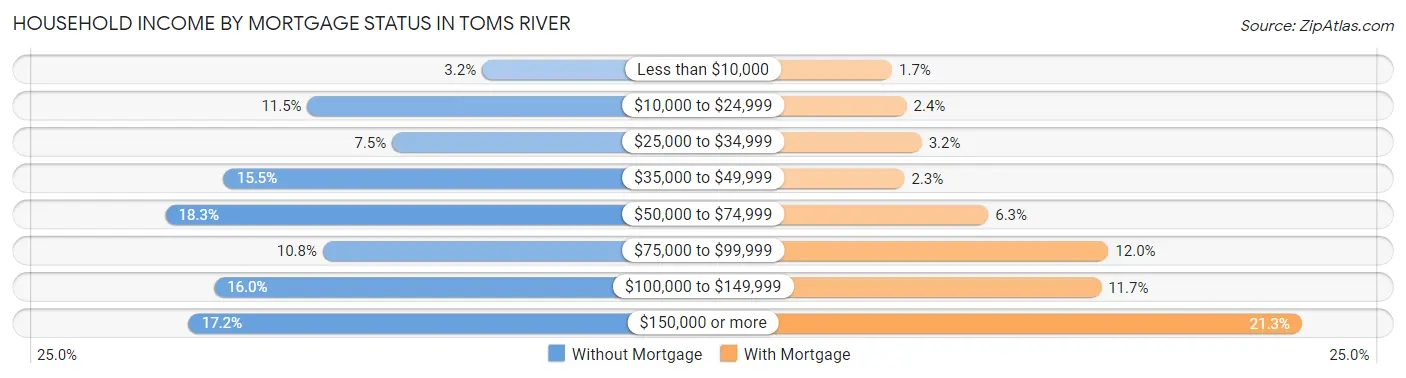
| Household Income | Without Mortgage | With Mortgage |
| Less than $10,000 | 303 (3.2%) | 329 (1.7%) |
| $10,000 to $24,999 | 1,085 (11.5%) | 460 (2.4%) |
| $25,000 to $34,999 | 706 (7.5%) | 597 (3.2%) |
| $35,000 to $49,999 | 1,460 (15.5%) | 441 (2.3%) |
| $50,000 to $74,999 | 1,721 (18.3%) | 1,197 (6.3%) |
| $75,000 to $99,999 | 1,016 (10.8%) | 2,278 (12.0%) |
| $100,000 to $149,999 | 1,503 (16.0%) | 2,215 (11.7%) |
| $150,000 or more | 1,617 (17.2%) | 4,021 (21.2%) |
| Total | 9,411 (100.0%) | 18,925 (100.0%) |
Property Value to Household Income Ratio in Toms River
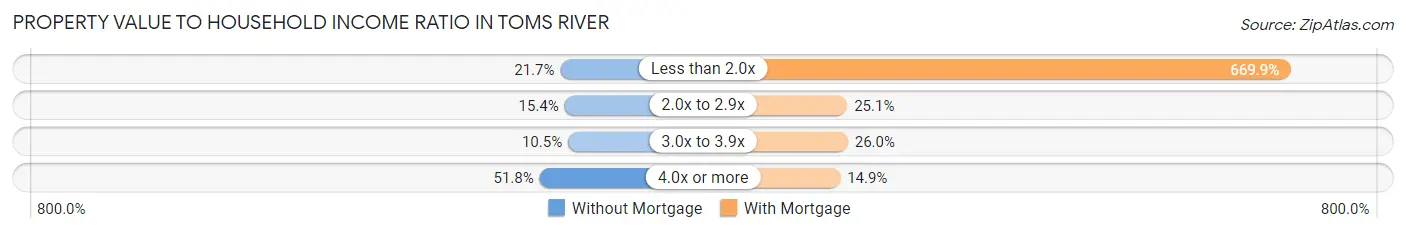
| Value-to-Income Ratio | Without Mortgage | With Mortgage |
| Less than 2.0x | 2,043 (21.7%) | 126,781 (669.9%) |
| 2.0x to 2.9x | 1,453 (15.4%) | 4,757 (25.1%) |
| 3.0x to 3.9x | 991 (10.5%) | 4,912 (26.0%) |
| 4.0x or more | 4,877 (51.8%) | 2,819 (14.9%) |
| Total | 9,411 (100.0%) | 18,925 (100.0%) |
Real Estate Taxes by Mortgage Status in Toms River
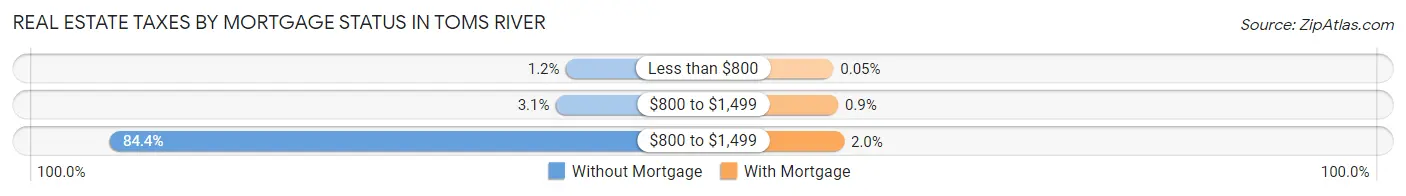
| Property Taxes | Without Mortgage | With Mortgage |
| Less than $800 | 116 (1.2%) | 10 (0.1%) |
| $800 to $1,499 | 289 (3.1%) | 171 (0.9%) |
| $800 to $1,499 | 7,942 (84.4%) | 381 (2.0%) |
| Total | 9,411 (100.0%) | 18,925 (100.0%) |
Health & Disability in Toms River
Health Insurance Coverage by Age in Toms River
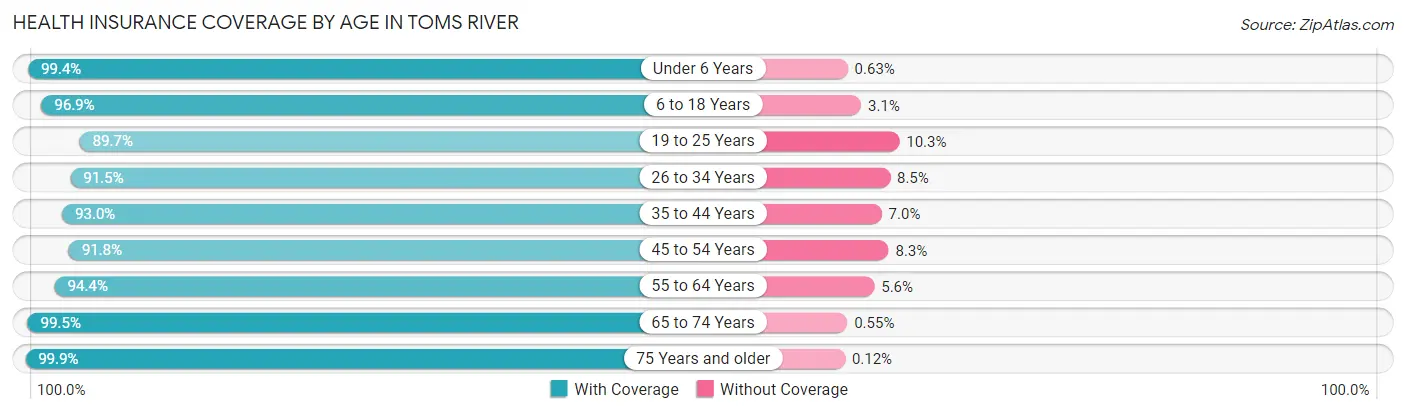
| Age Bracket | With Coverage | Without Coverage |
| Under 6 Years | 5,669 (99.4%) | 36 (0.6%) |
| 6 to 18 Years | 14,981 (96.9%) | 484 (3.1%) |
| 19 to 25 Years | 6,811 (89.7%) | 779 (10.3%) |
| 26 to 34 Years | 9,022 (91.5%) | 841 (8.5%) |
| 35 to 44 Years | 9,250 (93.0%) | 693 (7.0%) |
| 45 to 54 Years | 12,227 (91.7%) | 1,100 (8.3%) |
| 55 to 64 Years | 12,032 (94.4%) | 712 (5.6%) |
| 65 to 74 Years | 9,426 (99.5%) | 52 (0.5%) |
| 75 Years and older | 7,323 (99.9%) | 9 (0.1%) |
| Total | 86,741 (94.9%) | 4,706 (5.1%) |
Health Insurance Coverage by Citizenship Status in Toms River
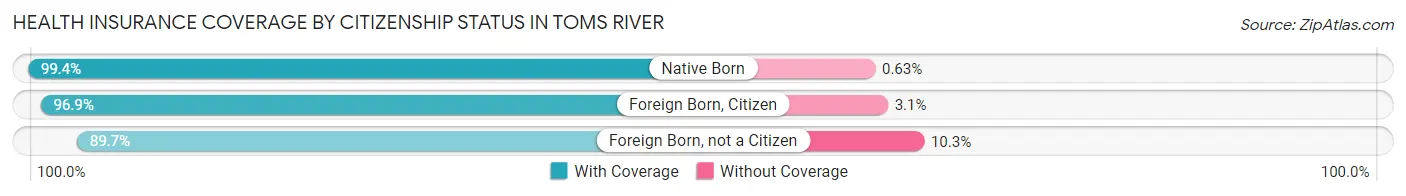
| Citizenship Status | With Coverage | Without Coverage |
| Native Born | 5,669 (99.4%) | 36 (0.6%) |
| Foreign Born, Citizen | 14,981 (96.9%) | 484 (3.1%) |
| Foreign Born, not a Citizen | 6,811 (89.7%) | 779 (10.3%) |
Health Insurance Coverage by Household Income in Toms River
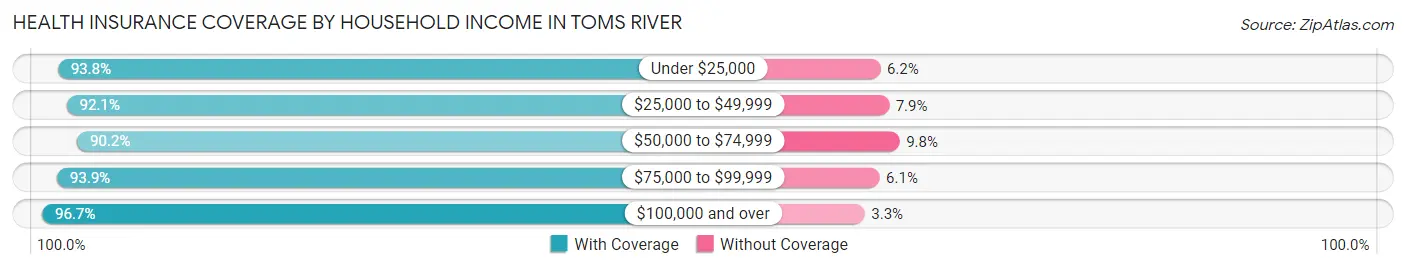
| Household Income | With Coverage | Without Coverage |
| Under $25,000 | 5,329 (93.8%) | 353 (6.2%) |
| $25,000 to $49,999 | 8,277 (92.1%) | 706 (7.9%) |
| $50,000 to $74,999 | 10,933 (90.2%) | 1,190 (9.8%) |
| $75,000 to $99,999 | 10,897 (93.9%) | 703 (6.1%) |
| $100,000 and over | 51,023 (96.7%) | 1,736 (3.3%) |
Public vs Private Health Insurance Coverage by Age in Toms River
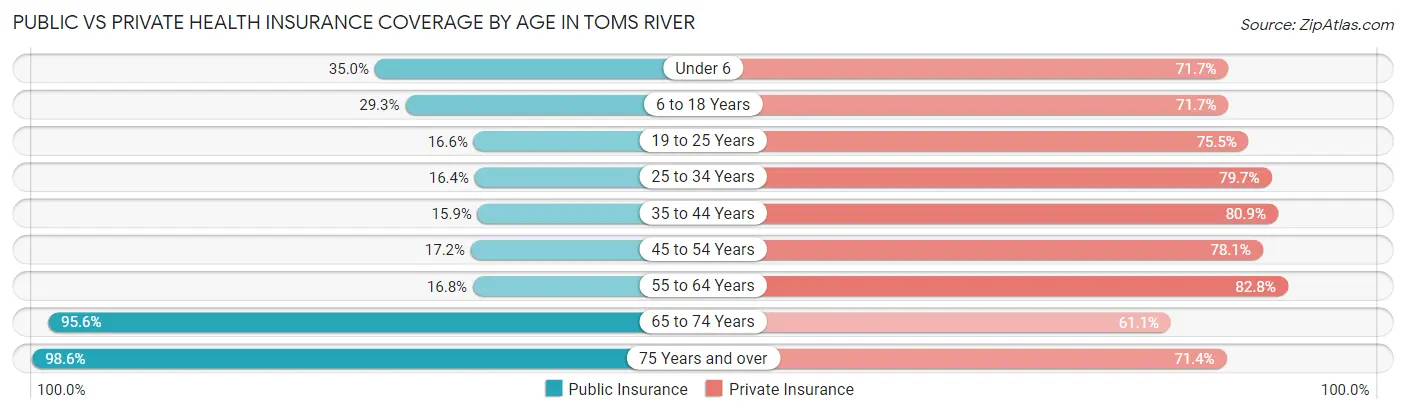
| Age Bracket | Public Insurance | Private Insurance |
| Under 6 | 1,996 (35.0%) | 4,091 (71.7%) |
| 6 to 18 Years | 4,536 (29.3%) | 11,093 (71.7%) |
| 19 to 25 Years | 1,262 (16.6%) | 5,732 (75.5%) |
| 25 to 34 Years | 1,620 (16.4%) | 7,862 (79.7%) |
| 35 to 44 Years | 1,582 (15.9%) | 8,045 (80.9%) |
| 45 to 54 Years | 2,288 (17.2%) | 10,410 (78.1%) |
| 55 to 64 Years | 2,138 (16.8%) | 10,546 (82.8%) |
| 65 to 74 Years | 9,064 (95.6%) | 5,789 (61.1%) |
| 75 Years and over | 7,228 (98.6%) | 5,234 (71.4%) |
| Total | 31,714 (34.7%) | 68,802 (75.2%) |
Disability Status by Sex by Age in Toms River
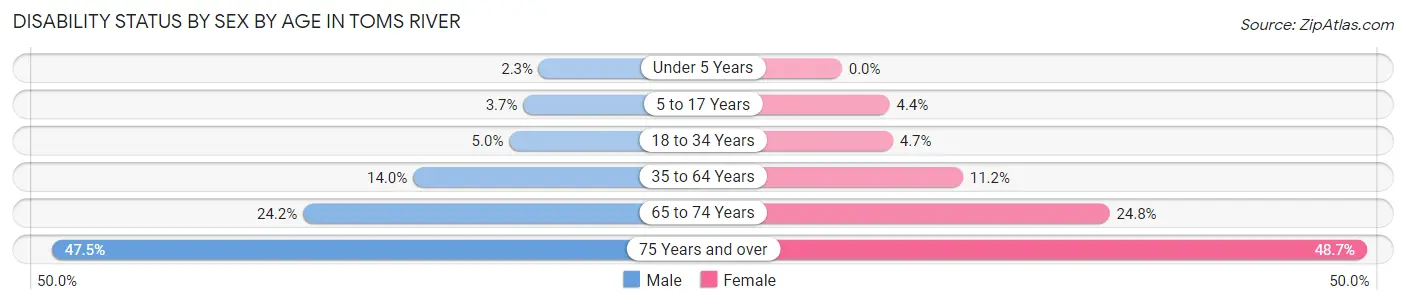
| Age Bracket | Male | Female |
| Under 5 Years | 55 (2.3%) | 0 (0.0%) |
| 5 to 17 Years | 276 (3.7%) | 330 (4.4%) |
| 18 to 34 Years | 468 (5.0%) | 443 (4.7%) |
| 35 to 64 Years | 2,452 (14.0%) | 2,070 (11.2%) |
| 65 to 74 Years | 1,139 (24.2%) | 1,183 (24.8%) |
| 75 Years and over | 1,284 (47.5%) | 2,254 (48.7%) |
Disability Class by Sex by Age in Toms River
Disability Class: Hearing Difficulty
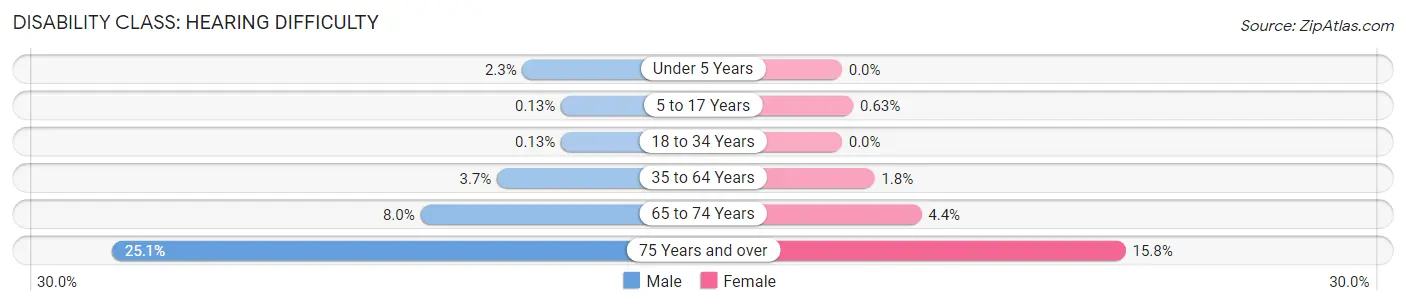
| Age Bracket | Male | Female |
| Under 5 Years | 55 (2.3%) | 0 (0.0%) |
| 5 to 17 Years | 10 (0.1%) | 47 (0.6%) |
| 18 to 34 Years | 12 (0.1%) | 0 (0.0%) |
| 35 to 64 Years | 649 (3.7%) | 335 (1.8%) |
| 65 to 74 Years | 375 (8.0%) | 211 (4.4%) |
| 75 Years and over | 680 (25.1%) | 731 (15.8%) |
Disability Class: Vision Difficulty
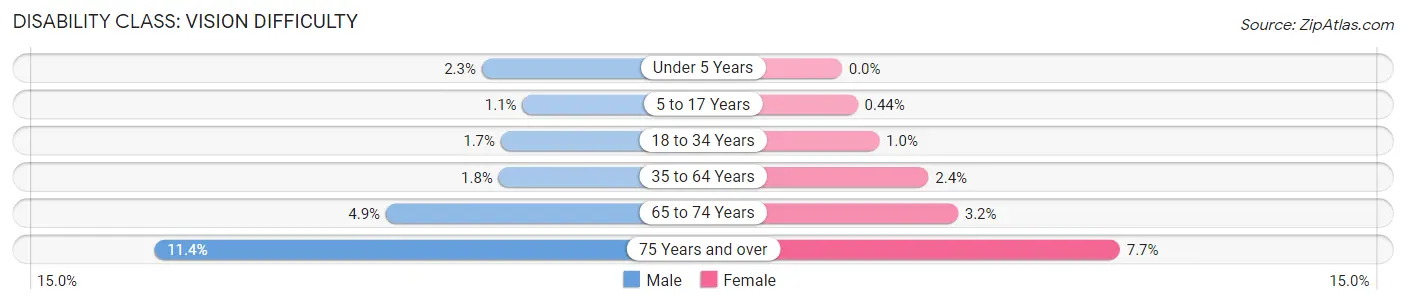
| Age Bracket | Male | Female |
| Under 5 Years | 55 (2.3%) | 0 (0.0%) |
| 5 to 17 Years | 85 (1.1%) | 33 (0.4%) |
| 18 to 34 Years | 162 (1.7%) | 97 (1.0%) |
| 35 to 64 Years | 317 (1.8%) | 445 (2.4%) |
| 65 to 74 Years | 233 (4.9%) | 154 (3.2%) |
| 75 Years and over | 308 (11.4%) | 358 (7.7%) |
Disability Class: Cognitive Difficulty
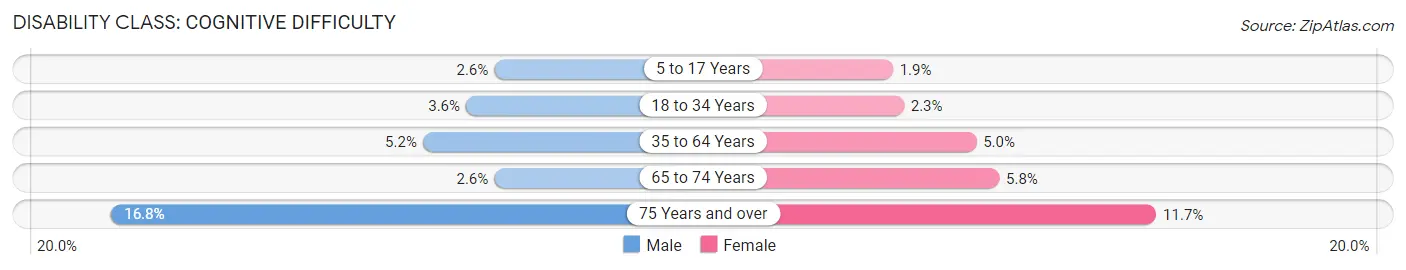
| Age Bracket | Male | Female |
| 5 to 17 Years | 191 (2.6%) | 141 (1.9%) |
| 18 to 34 Years | 337 (3.6%) | 215 (2.3%) |
| 35 to 64 Years | 917 (5.2%) | 920 (5.0%) |
| 65 to 74 Years | 121 (2.6%) | 278 (5.8%) |
| 75 Years and over | 454 (16.8%) | 540 (11.7%) |
Disability Class: Ambulatory Difficulty
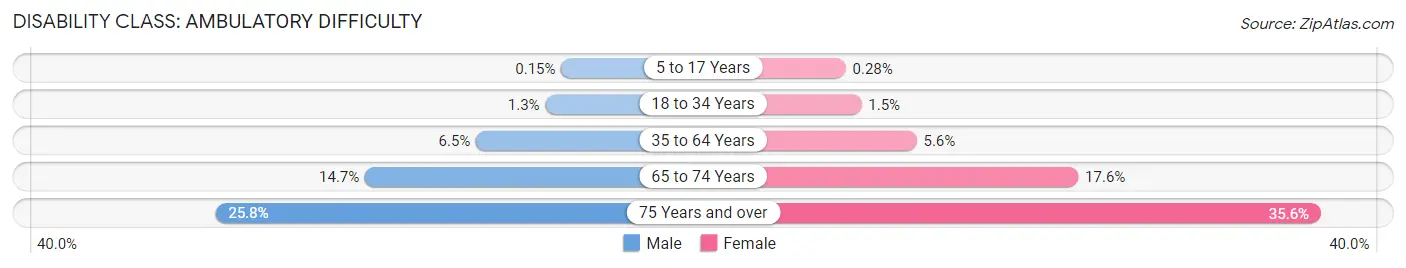
| Age Bracket | Male | Female |
| 5 to 17 Years | 11 (0.2%) | 21 (0.3%) |
| 18 to 34 Years | 124 (1.3%) | 136 (1.5%) |
| 35 to 64 Years | 1,137 (6.5%) | 1,023 (5.6%) |
| 65 to 74 Years | 694 (14.7%) | 836 (17.5%) |
| 75 Years and over | 699 (25.8%) | 1,646 (35.6%) |
Disability Class: Self-Care Difficulty
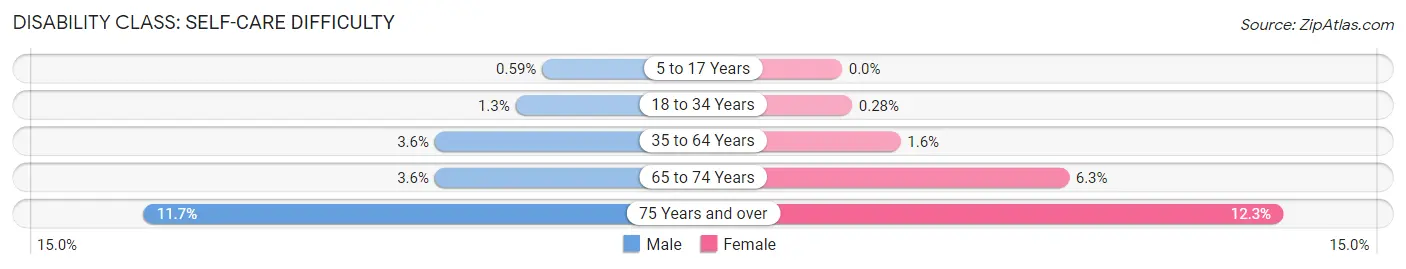
| Age Bracket | Male | Female |
| 5 to 17 Years | 44 (0.6%) | 0 (0.0%) |
| 18 to 34 Years | 124 (1.3%) | 26 (0.3%) |
| 35 to 64 Years | 630 (3.6%) | 300 (1.6%) |
| 65 to 74 Years | 169 (3.6%) | 301 (6.3%) |
| 75 Years and over | 316 (11.7%) | 568 (12.3%) |
Technology Access in Toms River
Computing Device Access in Toms River
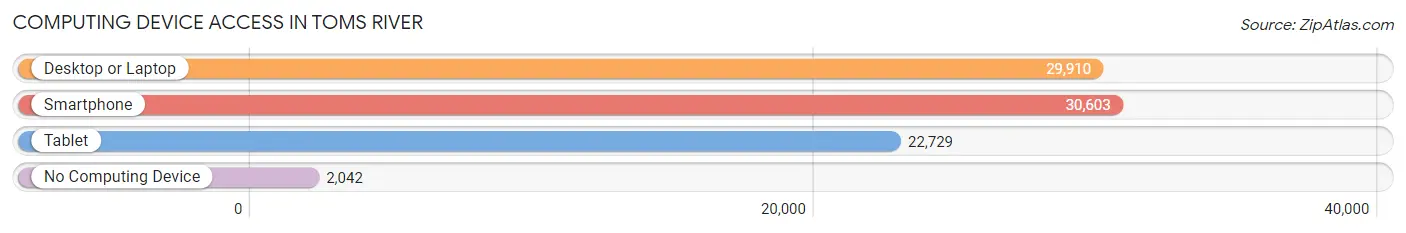
| Device Type | # Households | % Households |
| Desktop or Laptop | 29,910 | 85.1% |
| Smartphone | 30,603 | 87.0% |
| Tablet | 22,729 | 64.6% |
| No Computing Device | 2,042 | 5.8% |
| Total | 35,166 | 100.0% |
Internet Access in Toms River
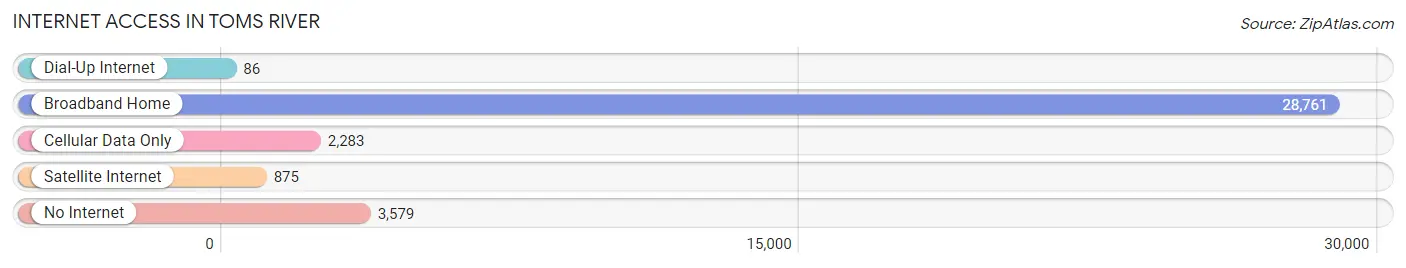
| Internet Type | # Households | % Households |
| Dial-Up Internet | 86 | 0.2% |
| Broadband Home | 28,761 | 81.8% |
| Cellular Data Only | 2,283 | 6.5% |
| Satellite Internet | 875 | 2.5% |
| No Internet | 3,579 | 10.2% |
| Total | 35,166 | 100.0% |
Toms River Summary
Toms River is a township located in Ocean County, New Jersey. It is situated along the Barnegat Bay, a part of the Atlantic Ocean, and is approximately 50 miles south of New York City. The township is home to a population of approximately 91,239 people, making it the largest municipality in Ocean County.
History
Toms River was originally inhabited by the Lenape Native Americans, who called the area “Tom’s River” after the river that runs through the area. The first European settlers arrived in the area in 1698, and the area was officially incorporated as a township in 1767.
During the American Revolution, Toms River was the site of a major battle between the British and American forces. The Battle of Toms River, which took place on December 26, 1776, was a decisive victory for the Americans.
In the 19th century, Toms River became a popular resort destination for wealthy New Yorkers. The area was known for its mineral springs, which were believed to have healing properties.
In the 1950s, Toms River began to experience rapid growth due to the development of the Garden State Parkway. The highway made it easier for people to travel to and from the area, and the population of the township began to grow rapidly.
Geography
Toms River is located in Ocean County, New Jersey. It is situated along the Barnegat Bay, a part of the Atlantic Ocean, and is approximately 50 miles south of New York City. The township covers an area of approximately 64 square miles, and is bordered by the townships of Berkeley, Lacey, Manchester, and Brick.
The township is divided into two distinct regions: the mainland and the barrier island. The mainland is located on the mainland of New Jersey, and is home to the majority of the population. The barrier island is located off the coast of the mainland, and is home to several popular beach communities.
Economy
Toms River has a diverse economy that is driven by a variety of industries. The township is home to several large employers, including Ocean County College, Community Medical Center, and the Ocean County Vocational Technical School.
The township is also home to several retail and commercial businesses, including the Ocean County Mall, which is the largest shopping mall in the county.
Demographics
As of the 2010 census, Toms River had a population of 91,239 people. The racial makeup of the township was 87.3% White, 5.3% African American, 0.3% Native American, 2.2% Asian, and 4.9% from other races. Hispanic or Latino of any race were 8.7% of the population.
The median household income in Toms River was $68,945, and the median family income was $81,945. The per capita income for the township was $31,945.
Conclusion
Toms River is a township located in Ocean County, New Jersey. It is situated along the Barnegat Bay, a part of the Atlantic Ocean, and is approximately 50 miles south of New York City. The township is home to a population of approximately 91,239 people, making it the largest municipality in Ocean County. Toms River has a diverse economy that is driven by a variety of industries, and the racial makeup of the township is 87.3% White, 5.3% African American, 0.3% Native American, 2.2% Asian, and 4.9% from other races. The median household income in Toms River was $68,945, and the median family income was $81,945.
Common Questions
What is Per Capita Income in Toms River?
Per Capita income in Toms River is $47,751.
What is the Median Family Income in Toms River?
Median Family Income in Toms River is $120,025.
What is the Median Household income in Toms River?
Median Household Income in Toms River is $92,012.
What is Income or Wage Gap in Toms River?
Income or Wage Gap in Toms River is 39.5%.
Women in Toms River earn 60.5 cents for every dollar earned by a man.
What is Family Income Deficit in Toms River?
Family Income Deficit in Toms River is $9,080.
Families that are below poverty line in Toms River earn $9,080 less on average than the poverty threshold level.
What is Inequality or Gini Index in Toms River?
Inequality or Gini Index in Toms River is 0.46.
What is the Total Population of Toms River?
Total Population of Toms River is 92,827.
What is the Total Male Population of Toms River?
Total Male Population of Toms River is 45,031.
What is the Total Female Population of Toms River?
Total Female Population of Toms River is 47,796.
What is the Ratio of Males per 100 Females in Toms River?
There are 94.21 Males per 100 Females in Toms River.
What is the Ratio of Females per 100 Males in Toms River?
There are 106.14 Females per 100 Males in Toms River.
What is the Median Population Age in Toms River?
Median Population Age in Toms River is 42.3 Years.
What is the Average Family Size in Toms River
Average Family Size in Toms River is 3.2 People.
What is the Average Household Size in Toms River
Average Household Size in Toms River is 2.6 People.
How Large is the Labor Force in Toms River?
There are 48,460 People in the Labor Forcein in Toms River.
What is the Percentage of People in the Labor Force in Toms River?
64.2% of People are in the Labor Force in Toms River.
What is the Unemployment Rate in Toms River?
Unemployment Rate in Toms River is 5.7%.