Wilkes Barre, PA Map & Demographics
Wilkes Barre Map
Wilkes Barre Overview
$23,995
PER CAPITA INCOME
$57,047
AVG FAMILY INCOME
$46,597
AVG HOUSEHOLD INCOME
26.0%
WAGE / INCOME GAP [ % ]
74.0¢/ $1
WAGE / INCOME GAP [ $ ]
$12,945
FAMILY INCOME DEFICIT
0.45
INEQUALITY / GINI INDEX
44,123
TOTAL POPULATION
21,616
MALE POPULATION
22,507
FEMALE POPULATION
96.04
MALES / 100 FEMALES
104.12
FEMALES / 100 MALES
34.3
MEDIAN AGE
3.1
AVG FAMILY SIZE
2.5
AVG HOUSEHOLD SIZE
20,214
LABOR FORCE [ PEOPLE ]
56.9%
PERCENT IN LABOR FORCE
8.4%
UNEMPLOYMENT RATE
Wilkes Barre Area Codes
Income in Wilkes Barre
Income Overview in Wilkes Barre
Per Capita Income in Wilkes Barre is $23,995, while median incomes of families and households are $57,047 and $46,597 respectively.
| Characteristic | Number | Measure |
| Per Capita Income | 44,123 | $23,995 |
| Median Family Income | 9,815 | $57,047 |
| Mean Family Income | 9,815 | $72,003 |
| Median Household Income | 16,461 | $46,597 |
| Mean Household Income | 16,461 | $60,771 |
| Income Deficit | 9,815 | $12,945 |
| Wage / Income Gap (%) | 44,123 | 25.96% |
| Wage / Income Gap ($) | 44,123 | 74.04¢ per $1 |
| Gini / Inequality Index | 44,123 | 0.45 |
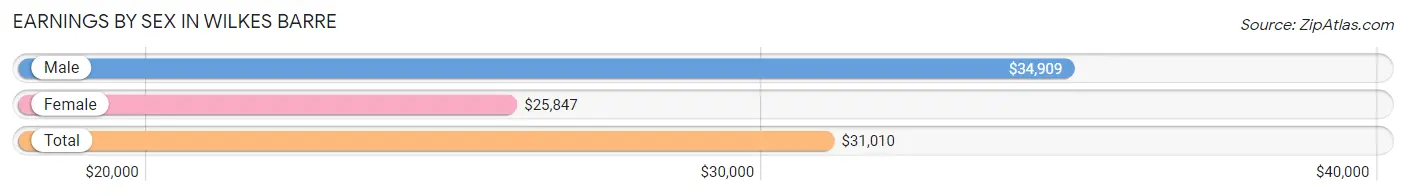
Earnings by Sex in Wilkes Barre
Average Earnings in Wilkes Barre are $31,010, $34,909 for men and $25,847 for women, a difference of 26.0%.
| Sex | Number | Average Earnings |
| Male | 11,209 (50.7%) | $34,909 |
| Female | 10,900 (49.3%) | $25,847 |
| Total | 22,109 (100.0%) | $31,010 |
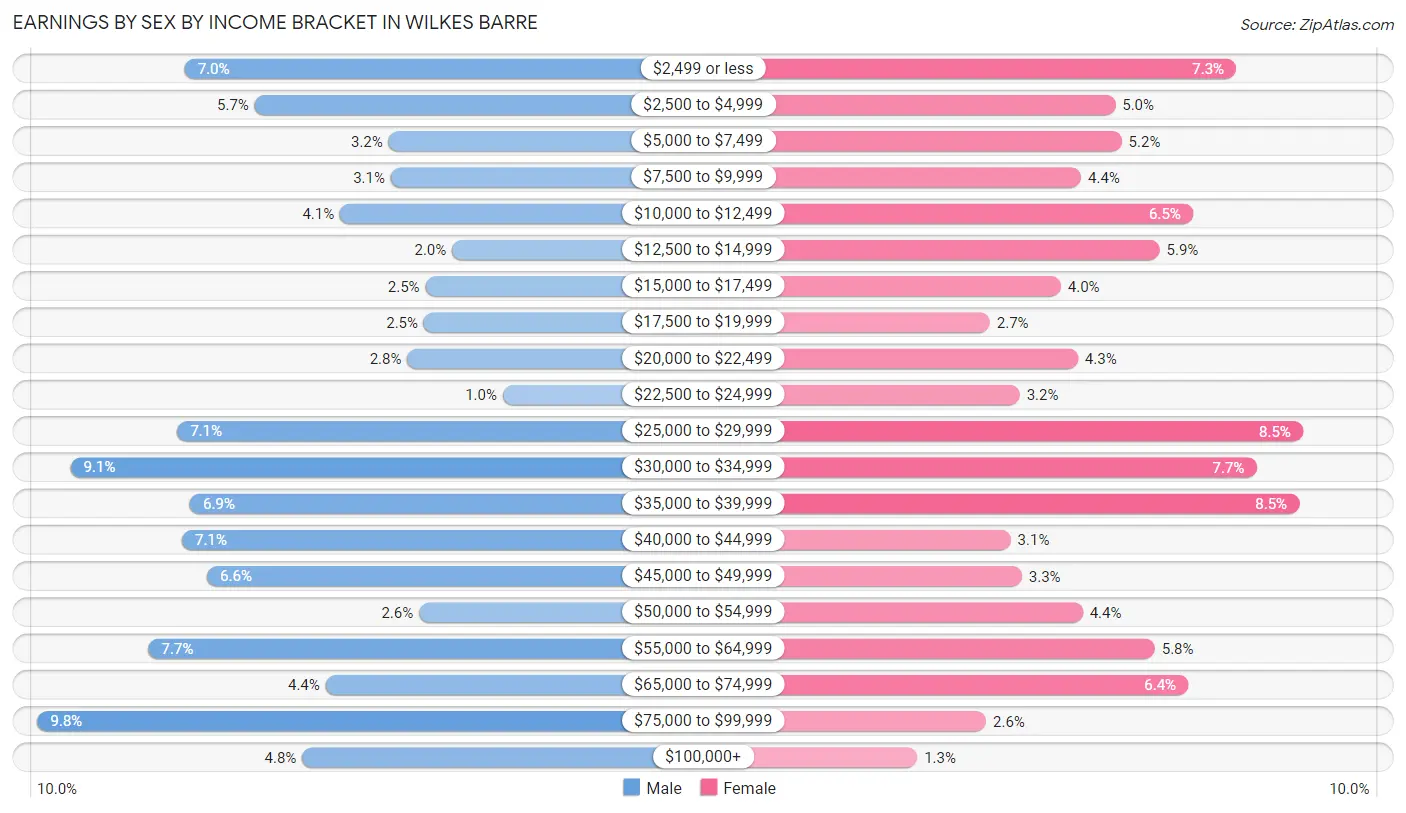
Earnings by Sex by Income Bracket in Wilkes Barre
The most common earnings brackets in Wilkes Barre are $75,000 to $99,999 for men (1,094 | 9.8%) and $25,000 to $29,999 for women (931 | 8.5%).
| Income | Male | Female |
| $2,499 or less | 785 (7.0%) | 795 (7.3%) |
| $2,500 to $4,999 | 638 (5.7%) | 548 (5.0%) |
| $5,000 to $7,499 | 357 (3.2%) | 561 (5.1%) |
| $7,500 to $9,999 | 352 (3.1%) | 479 (4.4%) |
| $10,000 to $12,499 | 458 (4.1%) | 706 (6.5%) |
| $12,500 to $14,999 | 223 (2.0%) | 639 (5.9%) |
| $15,000 to $17,499 | 279 (2.5%) | 437 (4.0%) |
| $17,500 to $19,999 | 282 (2.5%) | 292 (2.7%) |
| $20,000 to $22,499 | 317 (2.8%) | 472 (4.3%) |
| $22,500 to $24,999 | 117 (1.0%) | 353 (3.2%) |
| $25,000 to $29,999 | 800 (7.1%) | 931 (8.5%) |
| $30,000 to $34,999 | 1,025 (9.1%) | 836 (7.7%) |
| $35,000 to $39,999 | 773 (6.9%) | 923 (8.5%) |
| $40,000 to $44,999 | 790 (7.0%) | 335 (3.1%) |
| $45,000 to $49,999 | 738 (6.6%) | 357 (3.3%) |
| $50,000 to $54,999 | 293 (2.6%) | 482 (4.4%) |
| $55,000 to $64,999 | 861 (7.7%) | 629 (5.8%) |
| $65,000 to $74,999 | 489 (4.4%) | 697 (6.4%) |
| $75,000 to $99,999 | 1,094 (9.8%) | 284 (2.6%) |
| $100,000+ | 538 (4.8%) | 144 (1.3%) |
| Total | 11,209 (100.0%) | 10,900 (100.0%) |
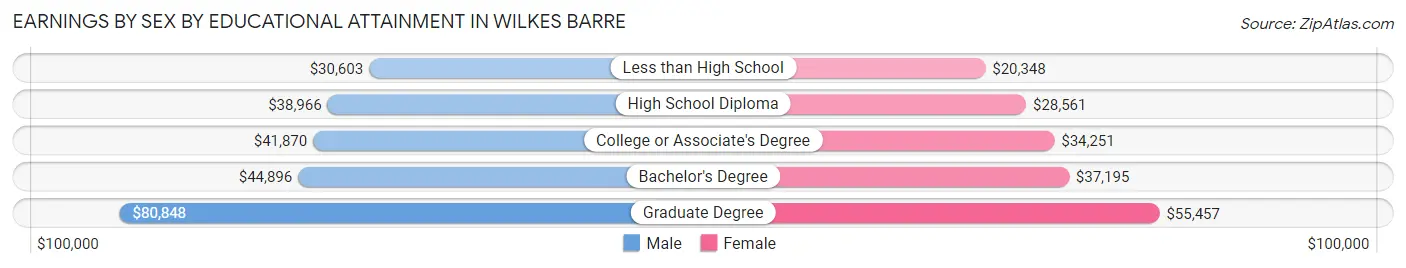
Earnings by Sex by Educational Attainment in Wilkes Barre
Average earnings in Wilkes Barre are $41,034 for men and $32,263 for women, a difference of 21.4%. Men with an educational attainment of graduate degree enjoy the highest average annual earnings of $80,848, while those with less than high school education earn the least with $30,603. Women with an educational attainment of graduate degree earn the most with the average annual earnings of $55,457, while those with less than high school education have the smallest earnings of $20,348.
| Educational Attainment | Male Income | Female Income |
| Less than High School | $30,603 | $20,348 |
| High School Diploma | $38,966 | $28,561 |
| College or Associate's Degree | $41,870 | $34,251 |
| Bachelor's Degree | $44,896 | $37,195 |
| Graduate Degree | $80,848 | $55,457 |
| Total | $41,034 | $32,263 |
Family Income in Wilkes Barre
Family Income Brackets in Wilkes Barre
According to the Wilkes Barre family income data, there are 1,727 families falling into the $50,000 to $74,999 income range, which is the most common income bracket and makes up 17.6% of all families. Conversely, the $150,000 to $199,999 income bracket is the least frequent group with only 402 families (4.1%) belonging to this category.
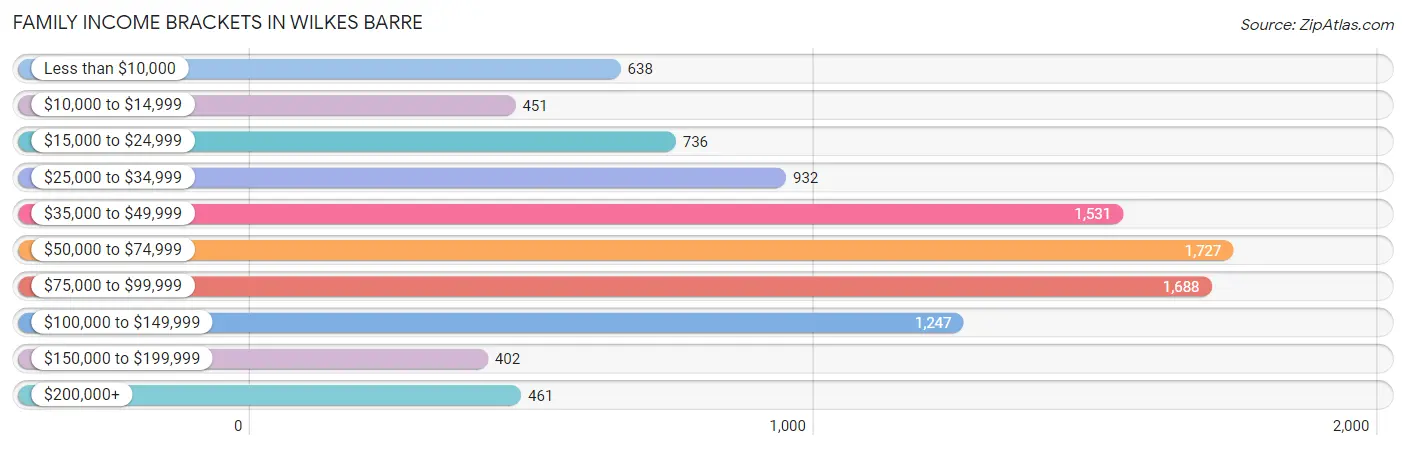
| Income Bracket | # Families | % Families |
| Less than $10,000 | 638 | 6.5% |
| $10,000 to $14,999 | 451 | 4.6% |
| $15,000 to $24,999 | 736 | 7.5% |
| $25,000 to $34,999 | 932 | 9.5% |
| $35,000 to $49,999 | 1,531 | 15.6% |
| $50,000 to $74,999 | 1,727 | 17.6% |
| $75,000 to $99,999 | 1,688 | 17.2% |
| $100,000 to $149,999 | 1,247 | 12.7% |
| $150,000 to $199,999 | 402 | 4.1% |
| $200,000+ | 461 | 4.7% |
Family Income by Famaliy Size in Wilkes Barre
7+ person families (209 | 2.1%) account for the highest median family income in Wilkes Barre with $98,194 per family, while 2-person families (4,438 | 45.2%) have the highest median income of $27,954 per family member.
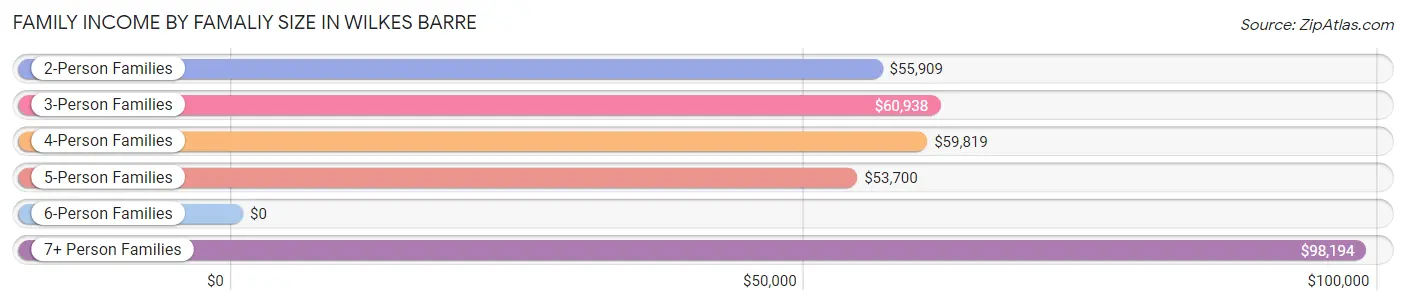
| Income Bracket | # Families | Median Income |
| 2-Person Families | 4,438 (45.2%) | $55,909 |
| 3-Person Families | 2,411 (24.6%) | $60,938 |
| 4-Person Families | 1,699 (17.3%) | $59,819 |
| 5-Person Families | 852 (8.7%) | $53,700 |
| 6-Person Families | 206 (2.1%) | $0 |
| 7+ Person Families | 209 (2.1%) | $98,194 |
| Total | 9,815 (100.0%) | $57,047 |
Family Income by Number of Earners in Wilkes Barre
The median family income in Wilkes Barre is $57,047, with families comprising 3+ earners (1,316) having the highest median family income of $118,933, while families with no earners (1,832) have the lowest median family income of $30,648, accounting for 13.4% and 18.7% of families, respectively.
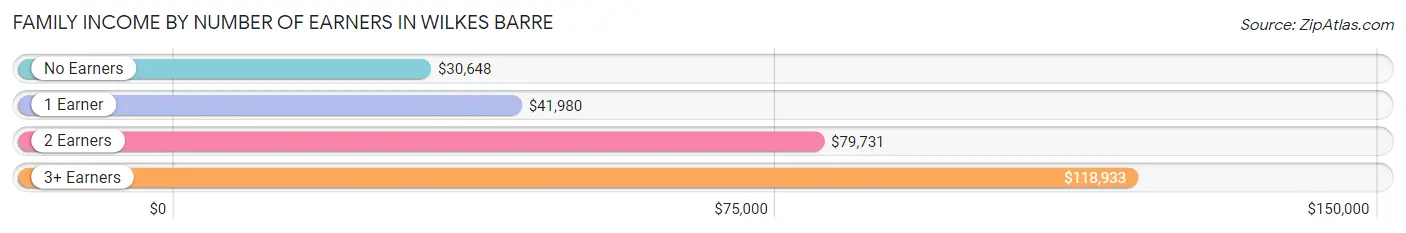
| Number of Earners | # Families | Median Income |
| No Earners | 1,832 (18.7%) | $30,648 |
| 1 Earner | 3,395 (34.6%) | $41,980 |
| 2 Earners | 3,272 (33.3%) | $79,731 |
| 3+ Earners | 1,316 (13.4%) | $118,933 |
| Total | 9,815 (100.0%) | $57,047 |
Household Income in Wilkes Barre
Household Income Brackets in Wilkes Barre
With 2,683 households falling in the category, the $50,000 to $74,999 income range is the most frequent in Wilkes Barre, accounting for 16.3% of all households. In contrast, only 477 households (2.9%) fall into the $150,000 to $199,999 income bracket, making it the least populous group.
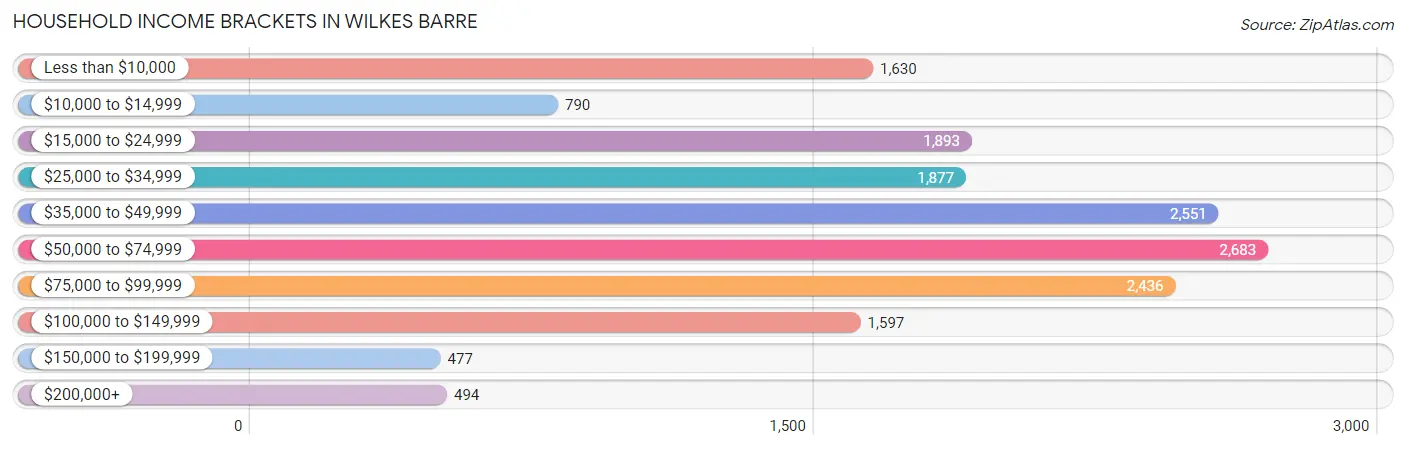
| Income Bracket | # Households | % Households |
| Less than $10,000 | 1,630 | 9.9% |
| $10,000 to $14,999 | 790 | 4.8% |
| $15,000 to $24,999 | 1,893 | 11.5% |
| $25,000 to $34,999 | 1,877 | 11.4% |
| $35,000 to $49,999 | 2,551 | 15.5% |
| $50,000 to $74,999 | 2,683 | 16.3% |
| $75,000 to $99,999 | 2,436 | 14.8% |
| $100,000 to $149,999 | 1,597 | 9.7% |
| $150,000 to $199,999 | 477 | 2.9% |
| $200,000+ | 494 | 3.0% |
Household Income by Householder Age in Wilkes Barre
The median household income in Wilkes Barre is $46,597, with the highest median household income of $55,625 found in the 45 to 64 years age bracket for the primary householder. A total of 5,297 households (32.2%) fall into this category. Meanwhile, the 15 to 24 years age bracket for the primary householder has the lowest median household income of $21,376, with 671 households (4.1%) in this group.
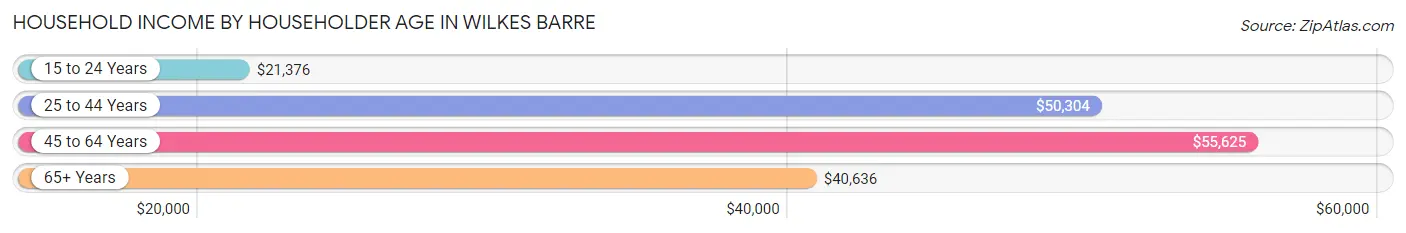
| Income Bracket | # Households | Median Income |
| 15 to 24 Years | 671 (4.1%) | $21,376 |
| 25 to 44 Years | 6,222 (37.8%) | $50,304 |
| 45 to 64 Years | 5,297 (32.2%) | $55,625 |
| 65+ Years | 4,271 (26.0%) | $40,636 |
| Total | 16,461 (100.0%) | $46,597 |
Poverty in Wilkes Barre
Income Below Poverty by Sex and Age in Wilkes Barre
With 19.6% poverty level for males and 23.8% for females among the residents of Wilkes Barre, 15 year old males and 5 year old females are the most vulnerable to poverty, with 123 males (49.4%) and 156 females (40.6%) in their respective age groups living below the poverty level.
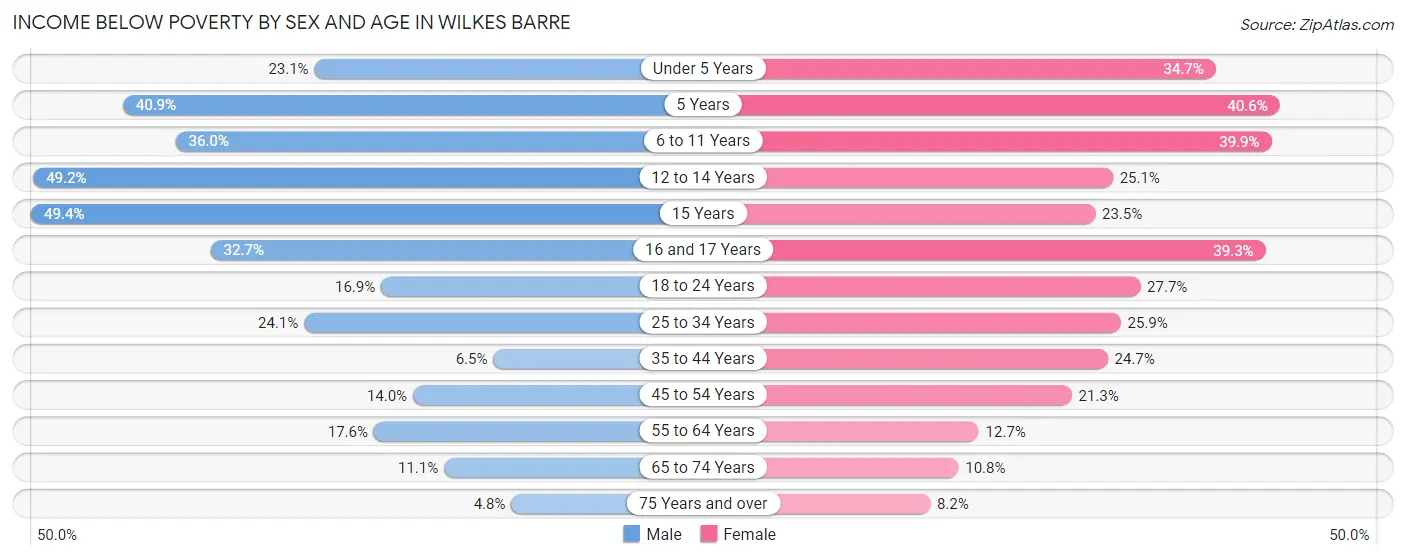
| Age Bracket | Male | Female |
| Under 5 Years | 264 (23.1%) | 573 (34.7%) |
| 5 Years | 56 (40.9%) | 156 (40.6%) |
| 6 to 11 Years | 618 (36.0%) | 584 (39.9%) |
| 12 to 14 Years | 368 (49.2%) | 136 (25.1%) |
| 15 Years | 123 (49.4%) | 51 (23.5%) |
| 16 and 17 Years | 184 (32.7%) | 320 (39.3%) |
| 18 to 24 Years | 296 (16.9%) | 510 (27.7%) |
| 25 to 34 Years | 790 (24.1%) | 853 (25.9%) |
| 35 to 44 Years | 164 (6.5%) | 736 (24.7%) |
| 45 to 54 Years | 335 (14.0%) | 456 (21.3%) |
| 55 to 64 Years | 399 (17.6%) | 260 (12.7%) |
| 65 to 74 Years | 184 (11.1%) | 187 (10.8%) |
| 75 Years and over | 55 (4.8%) | 147 (8.2%) |
| Total | 3,836 (19.6%) | 4,969 (23.8%) |
Income Above Poverty by Sex and Age in Wilkes Barre
According to the poverty statistics in Wilkes Barre, males aged 75 years and over and females aged 75 years and over are the age groups that are most secure financially, with 95.2% of males and 91.8% of females in these age groups living above the poverty line.
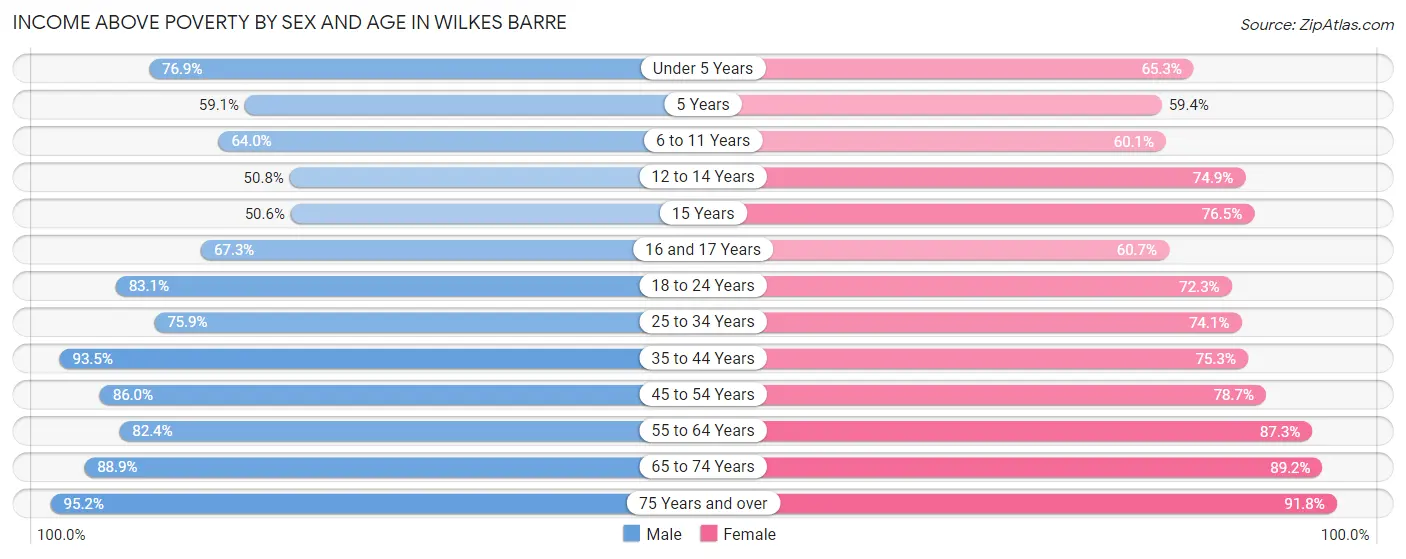
| Age Bracket | Male | Female |
| Under 5 Years | 879 (76.9%) | 1,079 (65.3%) |
| 5 Years | 81 (59.1%) | 228 (59.4%) |
| 6 to 11 Years | 1,099 (64.0%) | 881 (60.1%) |
| 12 to 14 Years | 380 (50.8%) | 405 (74.9%) |
| 15 Years | 126 (50.6%) | 166 (76.5%) |
| 16 and 17 Years | 378 (67.3%) | 494 (60.7%) |
| 18 to 24 Years | 1,453 (83.1%) | 1,332 (72.3%) |
| 25 to 34 Years | 2,493 (75.9%) | 2,444 (74.1%) |
| 35 to 44 Years | 2,358 (93.5%) | 2,248 (75.3%) |
| 45 to 54 Years | 2,065 (86.0%) | 1,683 (78.7%) |
| 55 to 64 Years | 1,869 (82.4%) | 1,787 (87.3%) |
| 65 to 74 Years | 1,478 (88.9%) | 1,543 (89.2%) |
| 75 Years and over | 1,084 (95.2%) | 1,650 (91.8%) |
| Total | 15,743 (80.4%) | 15,940 (76.2%) |
Income Below Poverty Among Married-Couple Families in Wilkes Barre
The poverty statistics for married-couple families in Wilkes Barre show that 8.2% or 447 of the total 5,439 families live below the poverty line. Families with 5 or more children have the highest poverty rate of 65.4%, comprising of 17 families. On the other hand, families with no children have the lowest poverty rate of 4.2%, which includes 142 families.
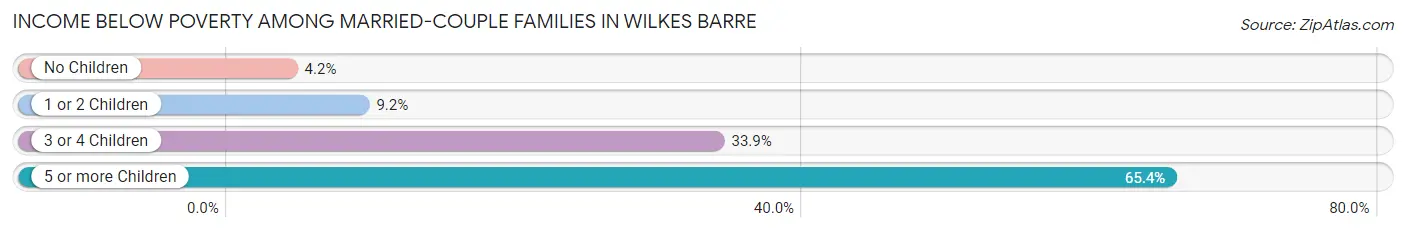
| Children | Above Poverty | Below Poverty |
| No Children | 3,280 (95.9%) | 142 (4.2%) |
| 1 or 2 Children | 1,420 (90.8%) | 143 (9.1%) |
| 3 or 4 Children | 283 (66.1%) | 145 (33.9%) |
| 5 or more Children | 9 (34.6%) | 17 (65.4%) |
| Total | 4,992 (91.8%) | 447 (8.2%) |
Income Below Poverty Among Single-Parent Households in Wilkes Barre
According to the poverty data in Wilkes Barre, 14.1% or 164 single-father households and 33.3% or 1,070 single-mother households are living below the poverty line. Among single-father households, those with 3 or 4 children have the highest poverty rate, with 42 households (59.2%) experiencing poverty. Likewise, among single-mother households, those with 5 or more children have the highest poverty rate, with 74 households (84.1%) falling below the poverty line.
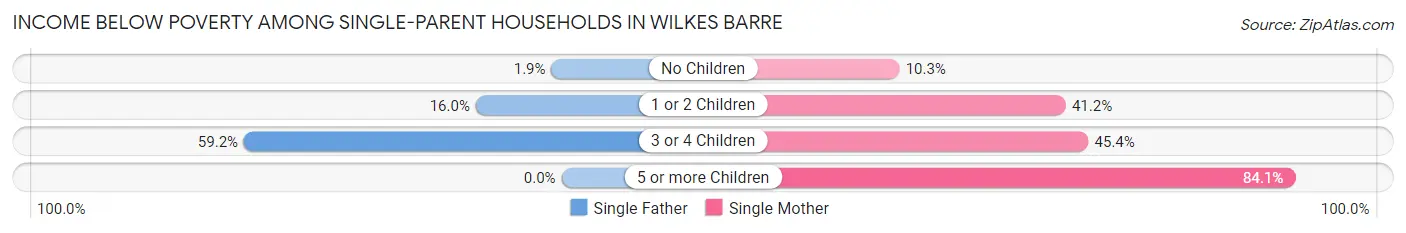
| Children | Single Father | Single Mother |
| No Children | 7 (1.9%) | 105 (10.2%) |
| 1 or 2 Children | 115 (16.0%) | 617 (41.2%) |
| 3 or 4 Children | 42 (59.2%) | 274 (45.4%) |
| 5 or more Children | 0 (0.0%) | 74 (84.1%) |
| Total | 164 (14.1%) | 1,070 (33.3%) |
Income Below Poverty Among Married-Couple vs Single-Parent Households in Wilkes Barre
The poverty data for Wilkes Barre shows that 447 of the married-couple family households (8.2%) and 1,234 of the single-parent households (28.2%) are living below the poverty level. Within the married-couple family households, those with 5 or more children have the highest poverty rate, with 17 households (65.4%) falling below the poverty line. Among the single-parent households, those with 5 or more children have the highest poverty rate, with 74 household (84.1%) living below poverty.
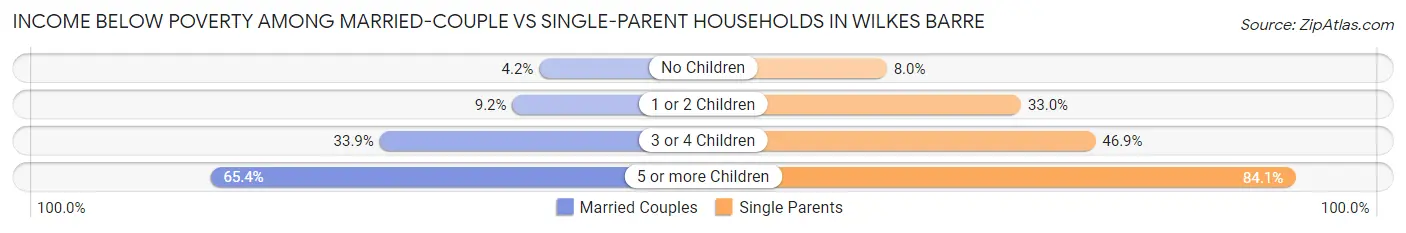
| Children | Married-Couple Families | Single-Parent Households |
| No Children | 142 (4.2%) | 112 (8.0%) |
| 1 or 2 Children | 143 (9.1%) | 732 (33.0%) |
| 3 or 4 Children | 145 (33.9%) | 316 (46.9%) |
| 5 or more Children | 17 (65.4%) | 74 (84.1%) |
| Total | 447 (8.2%) | 1,234 (28.2%) |
Race in Wilkes Barre
The most populous races in Wilkes Barre are White / Caucasian (26,011 | 59.0%), Hispanic or Latino (12,844 | 29.1%), and Some other Race (6,210 | 14.1%).
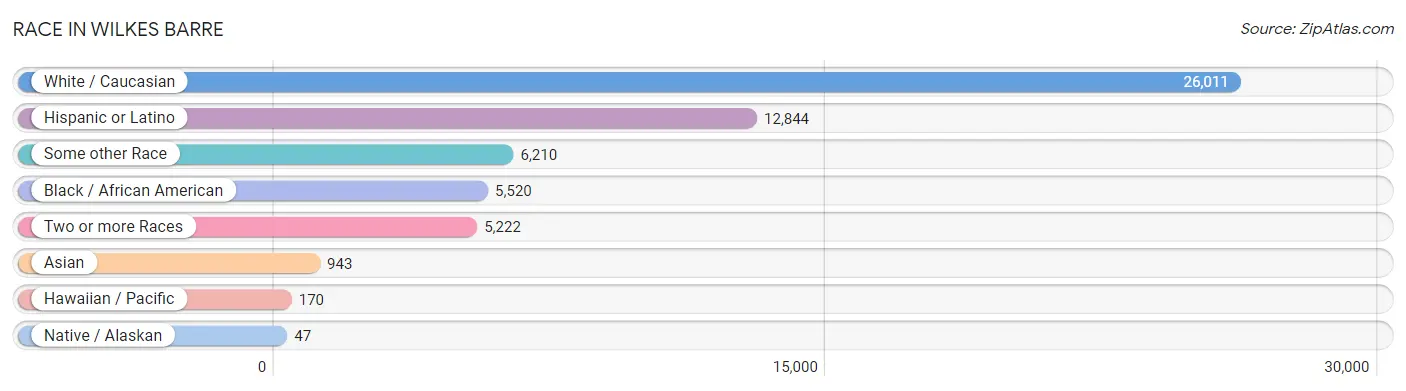
| Race | # Population | % Population |
| Asian | 943 | 2.1% |
| Black / African American | 5,520 | 12.5% |
| Hawaiian / Pacific | 170 | 0.4% |
| Hispanic or Latino | 12,844 | 29.1% |
| Native / Alaskan | 47 | 0.1% |
| White / Caucasian | 26,011 | 59.0% |
| Two or more Races | 5,222 | 11.8% |
| Some other Race | 6,210 | 14.1% |
| Total | 44,123 | 100.0% |
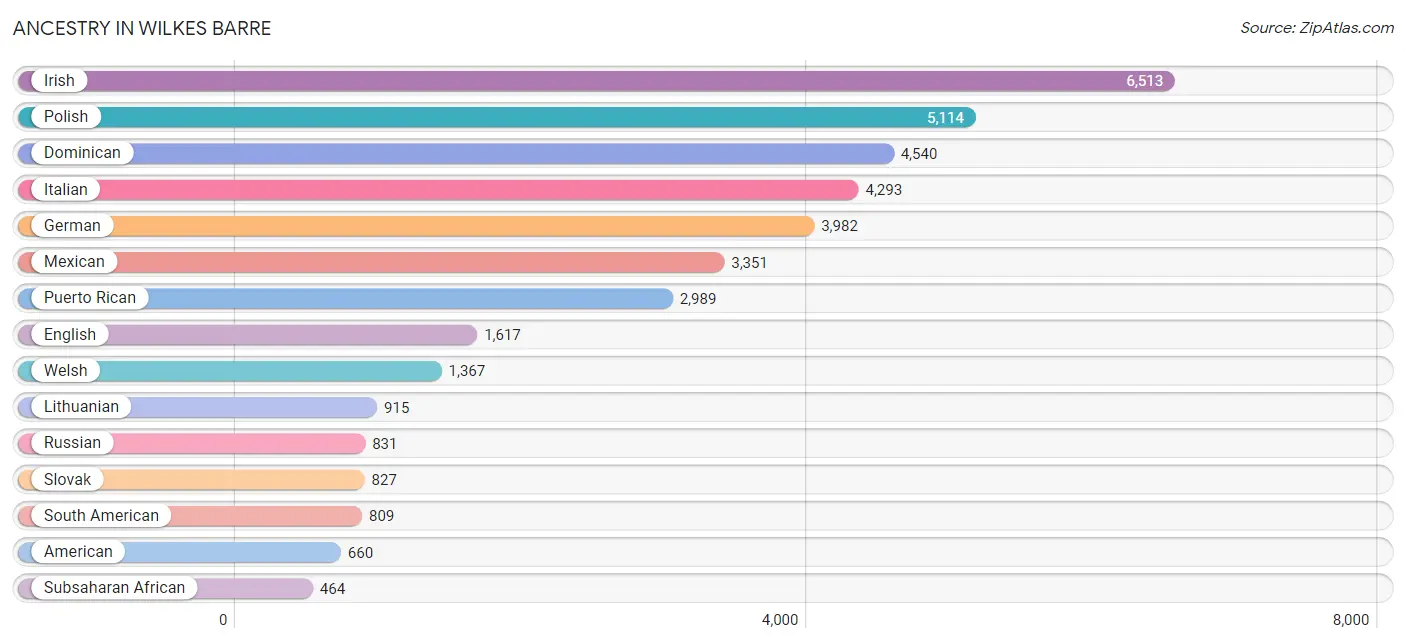
Ancestry in Wilkes Barre
The most populous ancestries reported in Wilkes Barre are Irish (6,513 | 14.8%), Polish (5,114 | 11.6%), Dominican (4,540 | 10.3%), Italian (4,293 | 9.7%), and German (3,982 | 9.0%), together accounting for 55.4% of all Wilkes Barre residents.
| Ancestry | # Population | % Population |
| African | 362 | 0.8% |
| American | 660 | 1.5% |
| Arab | 412 | 0.9% |
| Austrian | 160 | 0.4% |
| Bangladeshi | 297 | 0.7% |
| Belgian | 12 | 0.0% |
| Bhutanese | 21 | 0.1% |
| Blackfeet | 8 | 0.0% |
| Brazilian | 6 | 0.0% |
| British | 21 | 0.1% |
| British West Indian | 51 | 0.1% |
| Burmese | 223 | 0.5% |
| Canadian | 4 | 0.0% |
| Carpatho Rusyn | 55 | 0.1% |
| Central American | 410 | 0.9% |
| Central American Indian | 63 | 0.1% |
| Cherokee | 87 | 0.2% |
| Chilean | 16 | 0.0% |
| Colombian | 284 | 0.6% |
| Croatian | 48 | 0.1% |
| Cuban | 64 | 0.2% |
| Czech | 70 | 0.2% |
| Czechoslovakian | 22 | 0.1% |
| Danish | 10 | 0.0% |
| Dominican | 4,540 | 10.3% |
| Dutch | 251 | 0.6% |
| Eastern European | 107 | 0.2% |
| Ecuadorian | 463 | 1.1% |
| Egyptian | 17 | 0.0% |
| English | 1,617 | 3.7% |
| Ethiopian | 13 | 0.0% |
| European | 320 | 0.7% |
| French | 332 | 0.7% |
| French American Indian | 2 | 0.0% |
| French Canadian | 124 | 0.3% |
| German | 3,982 | 9.0% |
| Ghanaian | 3 | 0.0% |
| Greek | 92 | 0.2% |
| Guatemalan | 40 | 0.1% |
| Guyanese | 129 | 0.3% |
| Haitian | 36 | 0.1% |
| Honduran | 258 | 0.6% |
| Hungarian | 185 | 0.4% |
| Indian (Asian) | 108 | 0.2% |
| Iranian | 6 | 0.0% |
| Irish | 6,513 | 14.8% |
| Iroquois | 12 | 0.0% |
| Italian | 4,293 | 9.7% |
| Jamaican | 441 | 1.0% |
| Kenyan | 20 | 0.1% |
| Korean | 240 | 0.5% |
| Latvian | 5 | 0.0% |
| Lebanese | 281 | 0.6% |
| Lithuanian | 915 | 2.1% |
| Mexican | 3,351 | 7.6% |
| Native Hawaiian | 187 | 0.4% |
| Nigerian | 18 | 0.0% |
| Norwegian | 29 | 0.1% |
| Panamanian | 85 | 0.2% |
| Pennsylvania German | 463 | 1.1% |
| Peruvian | 32 | 0.1% |
| Polish | 5,114 | 11.6% |
| Portuguese | 83 | 0.2% |
| Puerto Rican | 2,989 | 6.8% |
| Romanian | 20 | 0.1% |
| Russian | 831 | 1.9% |
| Salvadoran | 27 | 0.1% |
| Samoan | 38 | 0.1% |
| Scandinavian | 64 | 0.2% |
| Scotch-Irish | 129 | 0.3% |
| Scottish | 311 | 0.7% |
| Sioux | 4 | 0.0% |
| Slovak | 827 | 1.9% |
| Slovene | 26 | 0.1% |
| South American | 809 | 1.8% |
| Spaniard | 297 | 0.7% |
| Spanish | 7 | 0.0% |
| Spanish American | 44 | 0.1% |
| Sri Lankan | 209 | 0.5% |
| Subsaharan African | 464 | 1.1% |
| Swedish | 59 | 0.1% |
| Swiss | 4 | 0.0% |
| Syrian | 100 | 0.2% |
| Thai | 69 | 0.2% |
| Trinidadian and Tobagonian | 31 | 0.1% |
| Ukrainian | 260 | 0.6% |
| Uruguayan | 14 | 0.0% |
| Welsh | 1,367 | 3.1% |
| West Indian | 34 | 0.1% |
| Yugoslavian | 5 | 0.0% | View All 90 Rows |
Immigrants in Wilkes Barre
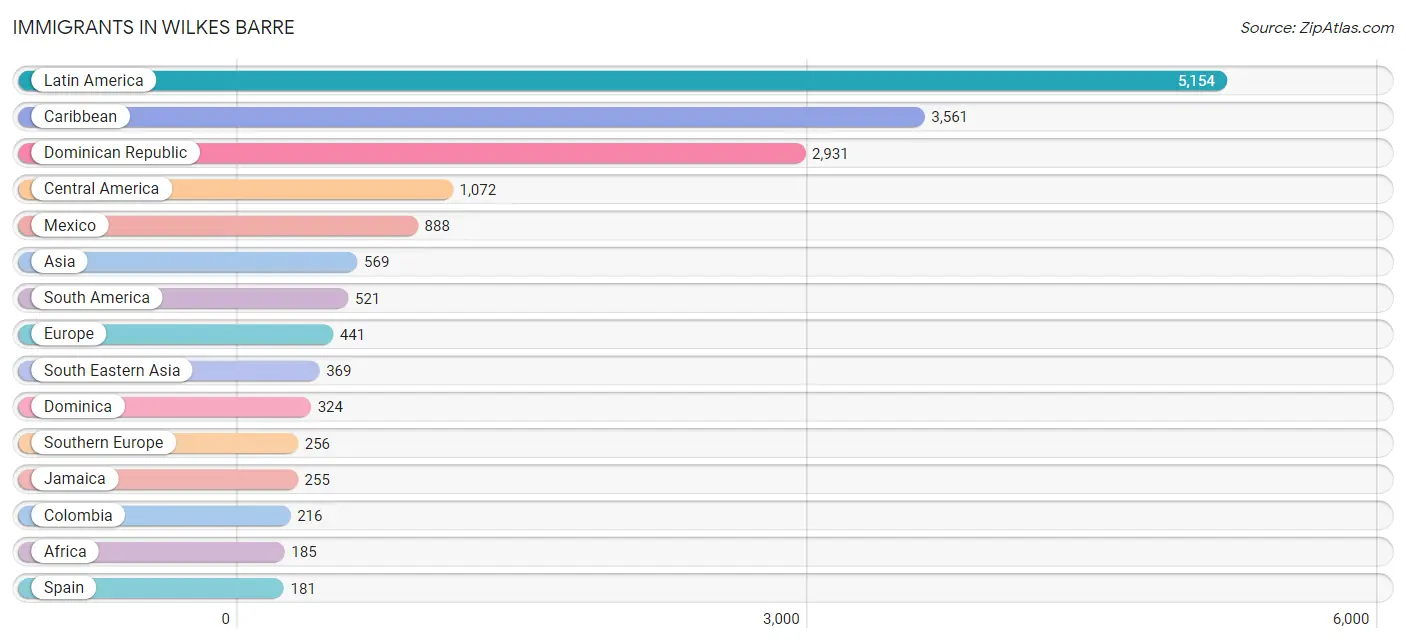
The most numerous immigrant groups reported in Wilkes Barre came from Latin America (5,154 | 11.7%), Caribbean (3,561 | 8.1%), Dominican Republic (2,931 | 6.6%), Central America (1,072 | 2.4%), and Mexico (888 | 2.0%), together accounting for 30.8% of all Wilkes Barre residents.
| Immigration Origin | # Population | % Population |
| Africa | 185 | 0.4% |
| Asia | 569 | 1.3% |
| Austria | 10 | 0.0% |
| Brazil | 4 | 0.0% |
| Canada | 21 | 0.1% |
| Caribbean | 3,561 | 8.1% |
| Central America | 1,072 | 2.4% |
| China | 39 | 0.1% |
| Colombia | 216 | 0.5% |
| Czechoslovakia | 2 | 0.0% |
| Dominica | 324 | 0.7% |
| Dominican Republic | 2,931 | 6.6% |
| Eastern Africa | 33 | 0.1% |
| Eastern Asia | 113 | 0.3% |
| Eastern Europe | 127 | 0.3% |
| Ecuador | 164 | 0.4% |
| El Salvador | 44 | 0.1% |
| England | 21 | 0.1% |
| Ethiopia | 13 | 0.0% |
| Europe | 441 | 1.0% |
| Germany | 12 | 0.0% |
| Ghana | 19 | 0.0% |
| Greece | 14 | 0.0% |
| Guatemala | 40 | 0.1% |
| Guyana | 90 | 0.2% |
| Haiti | 1 | 0.0% |
| Honduras | 100 | 0.2% |
| India | 58 | 0.1% |
| Indonesia | 36 | 0.1% |
| Israel | 16 | 0.0% |
| Italy | 33 | 0.1% |
| Jamaica | 255 | 0.6% |
| Japan | 19 | 0.0% |
| Kenya | 20 | 0.1% |
| Korea | 55 | 0.1% |
| Kuwait | 6 | 0.0% |
| Laos | 88 | 0.2% |
| Latin America | 5,154 | 11.7% |
| Mexico | 888 | 2.0% |
| Nigeria | 9 | 0.0% |
| Northern Europe | 36 | 0.1% |
| Norway | 9 | 0.0% |
| Oceania | 15 | 0.0% |
| Pakistan | 7 | 0.0% |
| Peru | 39 | 0.1% |
| Philippines | 138 | 0.3% |
| Poland | 10 | 0.0% |
| Portugal | 28 | 0.1% |
| South America | 521 | 1.2% |
| South Central Asia | 65 | 0.2% |
| South Eastern Asia | 369 | 0.8% |
| Southern Europe | 256 | 0.6% |
| Spain | 181 | 0.4% |
| St. Vincent and the Grenadines | 45 | 0.1% |
| Trinidad and Tobago | 5 | 0.0% |
| Ukraine | 105 | 0.2% |
| Uruguay | 8 | 0.0% |
| Vietnam | 107 | 0.2% |
| Western Africa | 53 | 0.1% |
| Western Asia | 22 | 0.1% |
| Western Europe | 22 | 0.1% | View All 61 Rows |
Sex and Age in Wilkes Barre
Sex and Age in Wilkes Barre
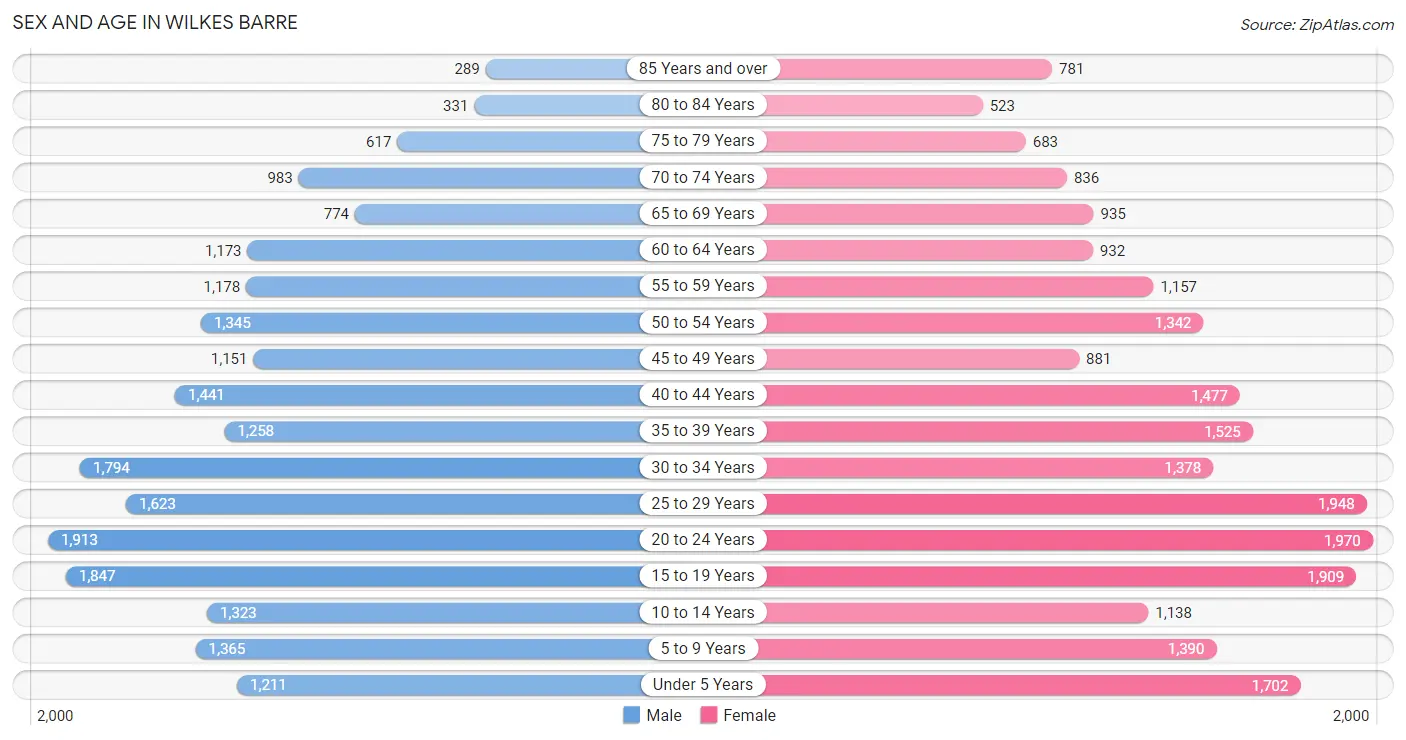
The most populous age groups in Wilkes Barre are 20 to 24 Years (1,913 | 8.8%) for men and 20 to 24 Years (1,970 | 8.7%) for women.
| Age Bracket | Male | Female |
| Under 5 Years | 1,211 (5.6%) | 1,702 (7.6%) |
| 5 to 9 Years | 1,365 (6.3%) | 1,390 (6.2%) |
| 10 to 14 Years | 1,323 (6.1%) | 1,138 (5.1%) |
| 15 to 19 Years | 1,847 (8.5%) | 1,909 (8.5%) |
| 20 to 24 Years | 1,913 (8.8%) | 1,970 (8.7%) |
| 25 to 29 Years | 1,623 (7.5%) | 1,948 (8.7%) |
| 30 to 34 Years | 1,794 (8.3%) | 1,378 (6.1%) |
| 35 to 39 Years | 1,258 (5.8%) | 1,525 (6.8%) |
| 40 to 44 Years | 1,441 (6.7%) | 1,477 (6.6%) |
| 45 to 49 Years | 1,151 (5.3%) | 881 (3.9%) |
| 50 to 54 Years | 1,345 (6.2%) | 1,342 (6.0%) |
| 55 to 59 Years | 1,178 (5.4%) | 1,157 (5.1%) |
| 60 to 64 Years | 1,173 (5.4%) | 932 (4.1%) |
| 65 to 69 Years | 774 (3.6%) | 935 (4.2%) |
| 70 to 74 Years | 983 (4.5%) | 836 (3.7%) |
| 75 to 79 Years | 617 (2.9%) | 683 (3.0%) |
| 80 to 84 Years | 331 (1.5%) | 523 (2.3%) |
| 85 Years and over | 289 (1.3%) | 781 (3.5%) |
| Total | 21,616 (100.0%) | 22,507 (100.0%) |
Families and Households in Wilkes Barre
Median Family Size in Wilkes Barre
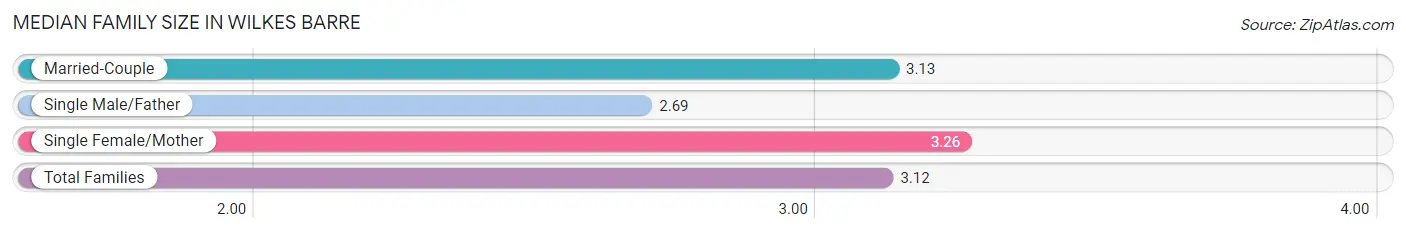
The median family size in Wilkes Barre is 3.12 persons per family, with single female/mother families (3,212 | 32.7%) accounting for the largest median family size of 3.26 persons per family. On the other hand, single male/father families (1,164 | 11.9%) represent the smallest median family size with 2.69 persons per family.
| Family Type | # Families | Family Size |
| Married-Couple | 5,439 (55.4%) | 3.13 |
| Single Male/Father | 1,164 (11.9%) | 2.69 |
| Single Female/Mother | 3,212 (32.7%) | 3.26 |
| Total Families | 9,815 (100.0%) | 3.12 |
Median Household Size in Wilkes Barre
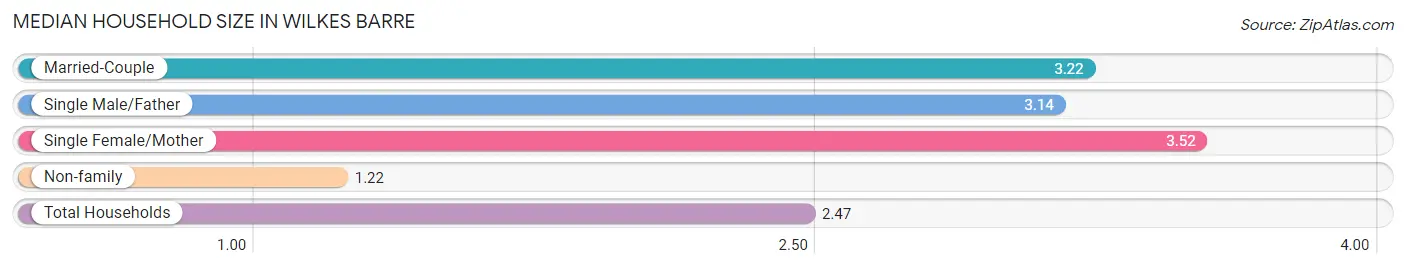
The median household size in Wilkes Barre is 2.47 persons per household, with single female/mother households (3,212 | 19.5%) accounting for the largest median household size of 3.52 persons per household. non-family households (6,646 | 40.4%) represent the smallest median household size with 1.22 persons per household.
| Household Type | # Households | Household Size |
| Married-Couple | 5,439 (33.0%) | 3.22 |
| Single Male/Father | 1,164 (7.1%) | 3.14 |
| Single Female/Mother | 3,212 (19.5%) | 3.52 |
| Non-family | 6,646 (40.4%) | 1.22 |
| Total Households | 16,461 (100.0%) | 2.47 |
Household Size by Marriage Status in Wilkes Barre
Out of a total of 16,461 households in Wilkes Barre, 9,815 (59.6%) are family households, while 6,646 (40.4%) are nonfamily households. The most numerous type of family households are 2-person households, comprising 4,013, and the most common type of nonfamily households are 1-person households, comprising 5,536.
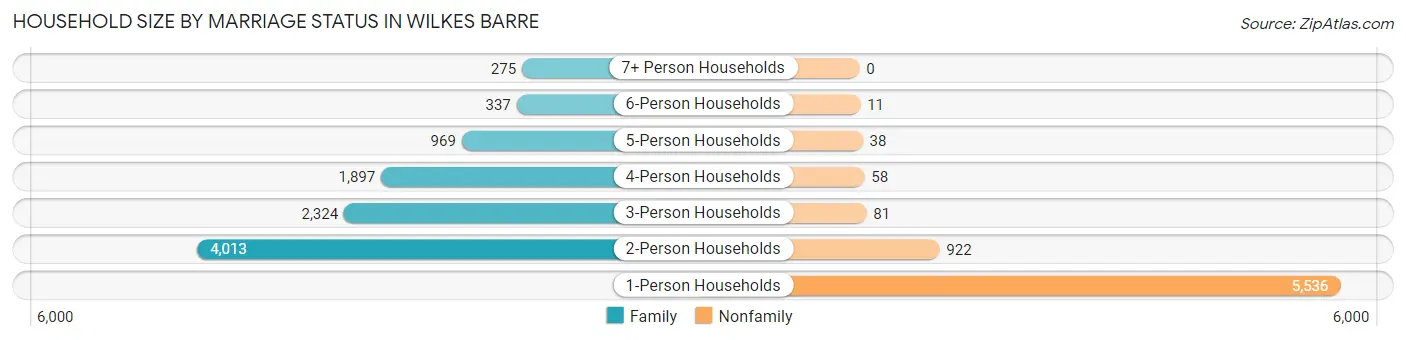
| Household Size | Family Households | Nonfamily Households |
| 1-Person Households | - | 5,536 (33.6%) |
| 2-Person Households | 4,013 (24.4%) | 922 (5.6%) |
| 3-Person Households | 2,324 (14.1%) | 81 (0.5%) |
| 4-Person Households | 1,897 (11.5%) | 58 (0.4%) |
| 5-Person Households | 969 (5.9%) | 38 (0.2%) |
| 6-Person Households | 337 (2.1%) | 11 (0.1%) |
| 7+ Person Households | 275 (1.7%) | 0 (0.0%) |
| Total | 9,815 (59.6%) | 6,646 (40.4%) |
Female Fertility in Wilkes Barre
Fertility by Age in Wilkes Barre
Average fertility rate in Wilkes Barre is 59.0 births per 1,000 women. Women in the age bracket of 20 to 34 years have the highest fertility rate with 89.0 births per 1,000 women. Women in the age bracket of 20 to 34 years acount for 70.0% of all women with births.
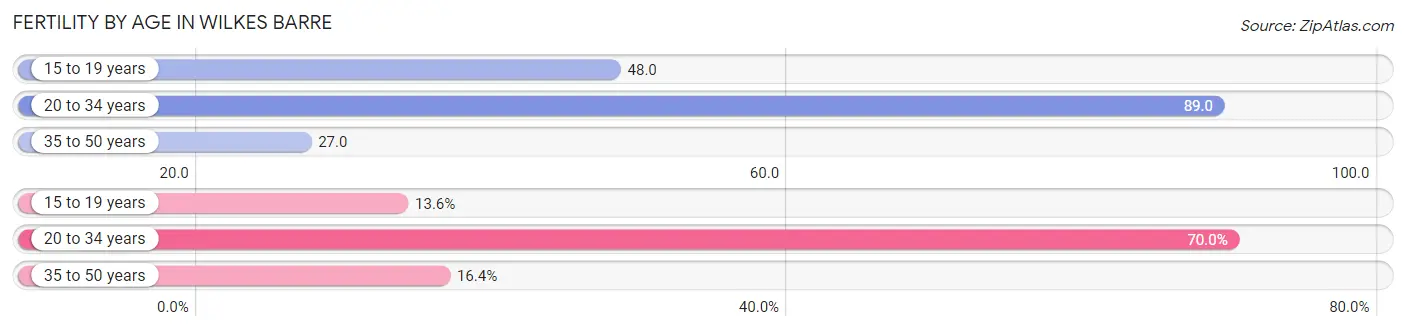
| Age Bracket | Women with Births | Births / 1,000 Women |
| 15 to 19 years | 91 (13.6%) | 48.0 |
| 20 to 34 years | 469 (70.0%) | 89.0 |
| 35 to 50 years | 110 (16.4%) | 27.0 |
| Total | 670 (100.0%) | 59.0 |
Fertility by Age by Marriage Status in Wilkes Barre
38.1% of women with births (670) in Wilkes Barre are married. The highest percentage of unmarried women with births falls into 15 to 19 years age bracket with 100.0% of them unmarried at the time of birth, while the lowest percentage of unmarried women with births belong to 20 to 34 years age bracket with 55.0% of them unmarried.
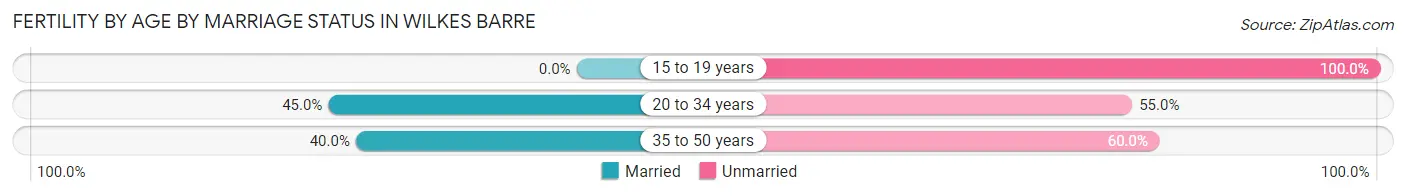
| Age Bracket | Married | Unmarried |
| 15 to 19 years | 0 (0.0%) | 91 (100.0%) |
| 20 to 34 years | 211 (45.0%) | 258 (55.0%) |
| 35 to 50 years | 44 (40.0%) | 66 (60.0%) |
| Total | 255 (38.1%) | 415 (61.9%) |
Fertility by Education in Wilkes Barre
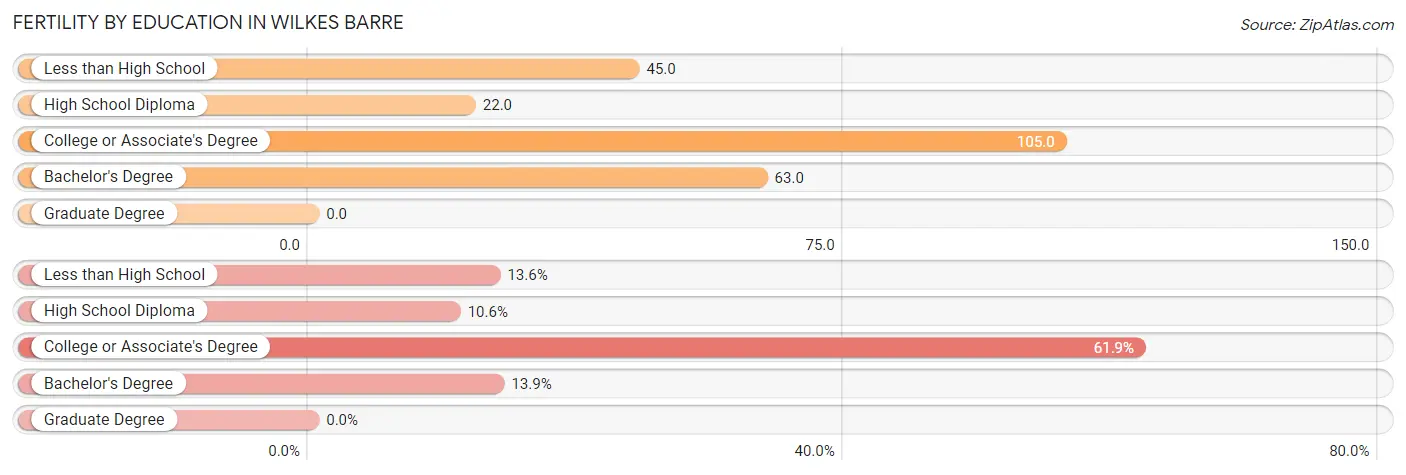
| Educational Attainment | Women with Births | Births / 1,000 Women |
| Less than High School | 91 (13.6%) | 45.0 |
| High School Diploma | 71 (10.6%) | 22.0 |
| College or Associate's Degree | 415 (61.9%) | 105.0 |
| Bachelor's Degree | 93 (13.9%) | 63.0 |
| Graduate Degree | 0 (0.0%) | 0.0 |
| Total | 670 (100.0%) | 59.0 |
Fertility by Education by Marriage Status in Wilkes Barre
61.9% of women with births in Wilkes Barre are unmarried. Women with the educational attainment of bachelor's degree are most likely to be married with 79.6% of them married at childbirth, while women with the educational attainment of less than high school are least likely to be married with 100.0% of them unmarried at childbirth.
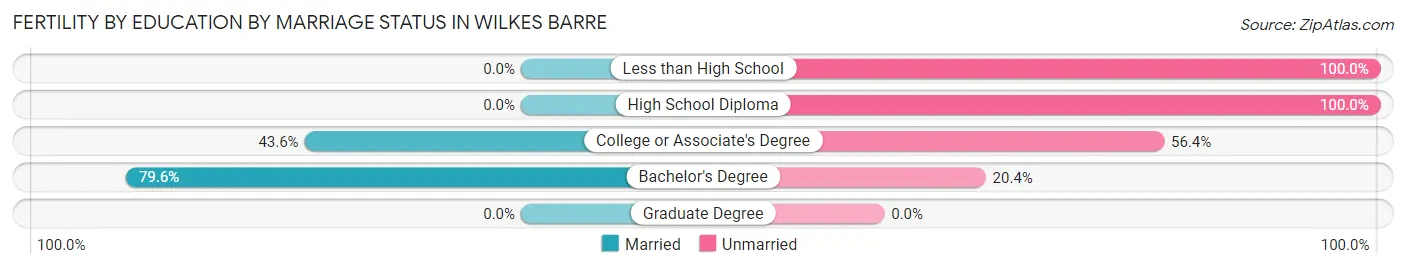
| Educational Attainment | Married | Unmarried |
| Less than High School | 0 (0.0%) | 91 (100.0%) |
| High School Diploma | 0 (0.0%) | 71 (100.0%) |
| College or Associate's Degree | 181 (43.6%) | 234 (56.4%) |
| Bachelor's Degree | 74 (79.6%) | 19 (20.4%) |
| Graduate Degree | 0 (0.0%) | 0 (0.0%) |
| Total | 255 (38.1%) | 415 (61.9%) |
Employment Characteristics in Wilkes Barre
Employment by Class of Employer in Wilkes Barre
Among the 18,342 employed individuals in Wilkes Barre, private company employees (13,971 | 76.2%), not-for-profit organizations (1,672 | 9.1%), and local government employees (1,070 | 5.8%) make up the most common classes of employment.
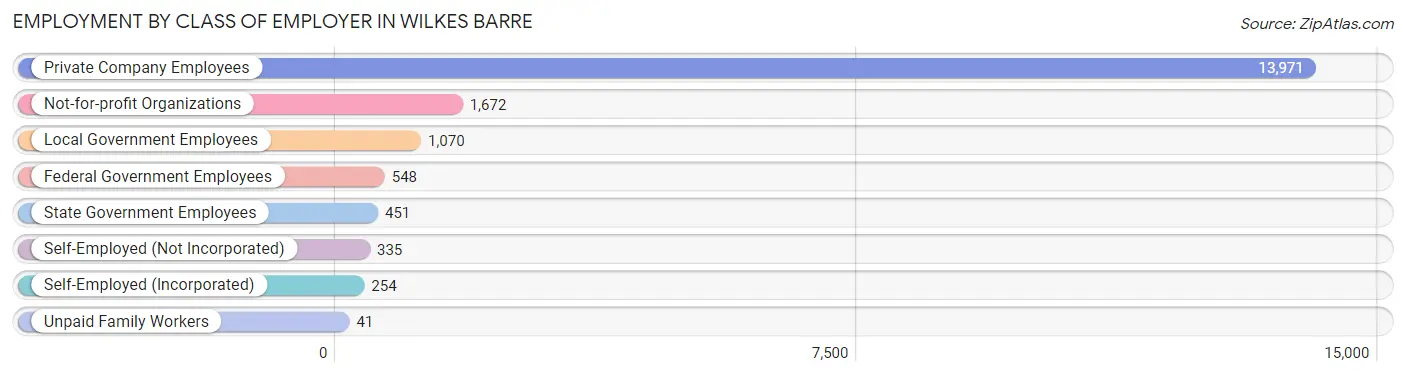
| Employer Class | # Employees | % Employees |
| Private Company Employees | 13,971 | 76.2% |
| Self-Employed (Incorporated) | 254 | 1.4% |
| Self-Employed (Not Incorporated) | 335 | 1.8% |
| Not-for-profit Organizations | 1,672 | 9.1% |
| Local Government Employees | 1,070 | 5.8% |
| State Government Employees | 451 | 2.5% |
| Federal Government Employees | 548 | 3.0% |
| Unpaid Family Workers | 41 | 0.2% |
| Total | 18,342 | 100.0% |
Employment Status by Age in Wilkes Barre
According to the labor force statistics for Wilkes Barre, out of the total population over 16 years of age (35,526), 56.9% or 20,214 individuals are in the labor force, with 8.4% or 1,698 of them unemployed. The age group with the highest labor force participation rate is 35 to 44 years, with 78.2% or 4,458 individuals in the labor force. Within the labor force, the 16 to 19 years age range has the highest percentage of unemployed individuals, with 23.1% or 262 of them being unemployed.
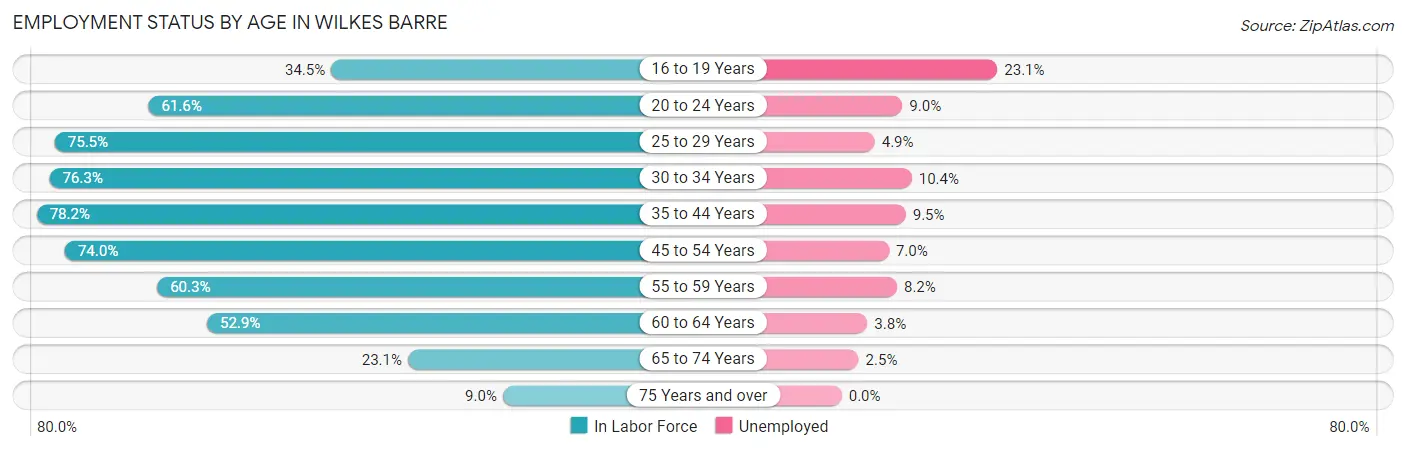
| Age Bracket | In Labor Force | Unemployed |
| 16 to 19 Years | 1,134 (34.5%) | 262 (23.1%) |
| 20 to 24 Years | 2,392 (61.6%) | 215 (9.0%) |
| 25 to 29 Years | 2,696 (75.5%) | 132 (4.9%) |
| 30 to 34 Years | 2,420 (76.3%) | 252 (10.4%) |
| 35 to 44 Years | 4,458 (78.2%) | 424 (9.5%) |
| 45 to 54 Years | 3,492 (74.0%) | 244 (7.0%) |
| 55 to 59 Years | 1,408 (60.3%) | 115 (8.2%) |
| 60 to 64 Years | 1,114 (52.9%) | 42 (3.8%) |
| 65 to 74 Years | 815 (23.1%) | 20 (2.5%) |
| 75 Years and over | 290 (9.0%) | 0 (0.0%) |
| Total | 20,214 (56.9%) | 1,698 (8.4%) |
Employment Status by Educational Attainment in Wilkes Barre
According to labor force statistics for Wilkes Barre, 72.2% of individuals (15,597) out of the total population between 25 and 64 years of age (21,603) are in the labor force, with 7.7% or 1,201 of them being unemployed. The group with the highest labor force participation rate are those with the educational attainment of bachelor's degree or higher, with 85.1% or 3,597 individuals in the labor force. Within the labor force, individuals with less than high school education have the highest percentage of unemployment, with 10.8% or 138 of them being unemployed.
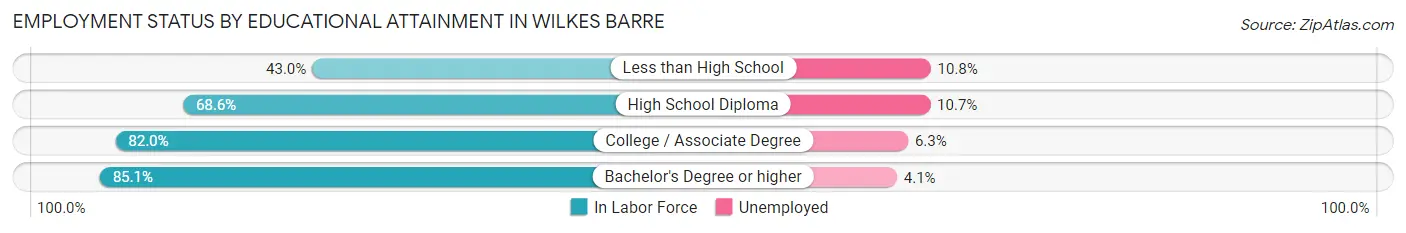
| Educational Attainment | In Labor Force | Unemployed |
| Less than High School | 1,274 (43.0%) | 320 (10.8%) |
| High School Diploma | 5,625 (68.6%) | 877 (10.7%) |
| College / Associate Degree | 5,095 (82.0%) | 391 (6.3%) |
| Bachelor's Degree or higher | 3,597 (85.1%) | 173 (4.1%) |
| Total | 15,597 (72.2%) | 1,663 (7.7%) |
Employment Occupations by Sex in Wilkes Barre
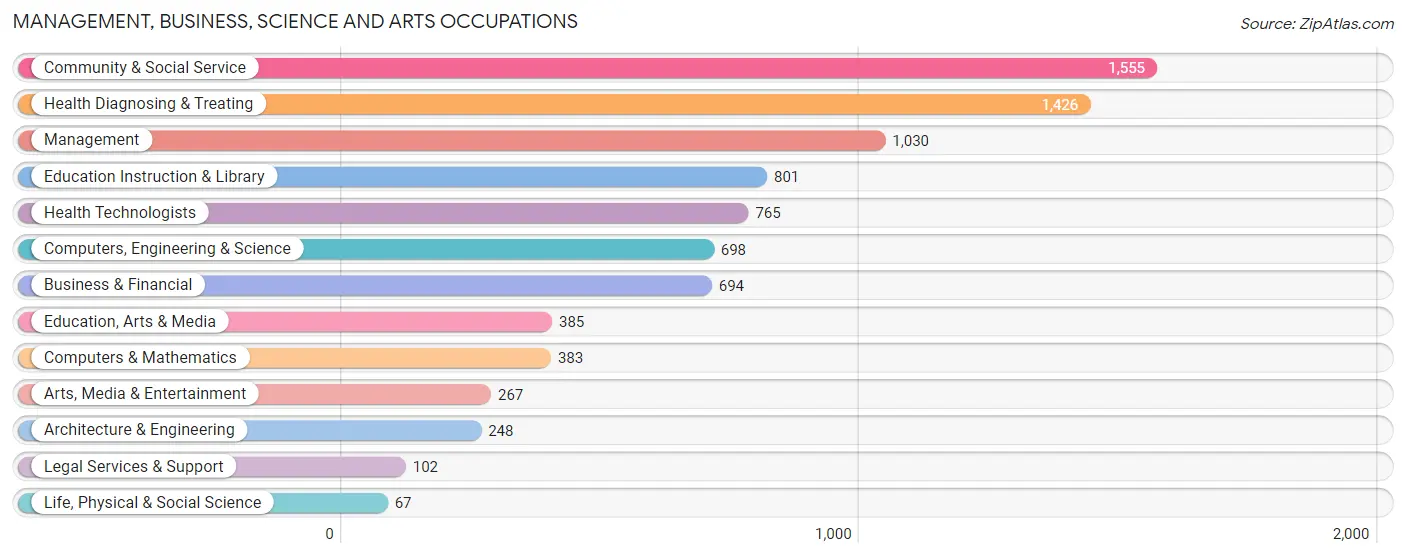
Management, Business, Science and Arts Occupations
The most common Management, Business, Science and Arts occupations in Wilkes Barre are Community & Social Service (1,555 | 8.4%), Health Diagnosing & Treating (1,426 | 7.7%), Management (1,030 | 5.6%), Education Instruction & Library (801 | 4.3%), and Health Technologists (765 | 4.1%).
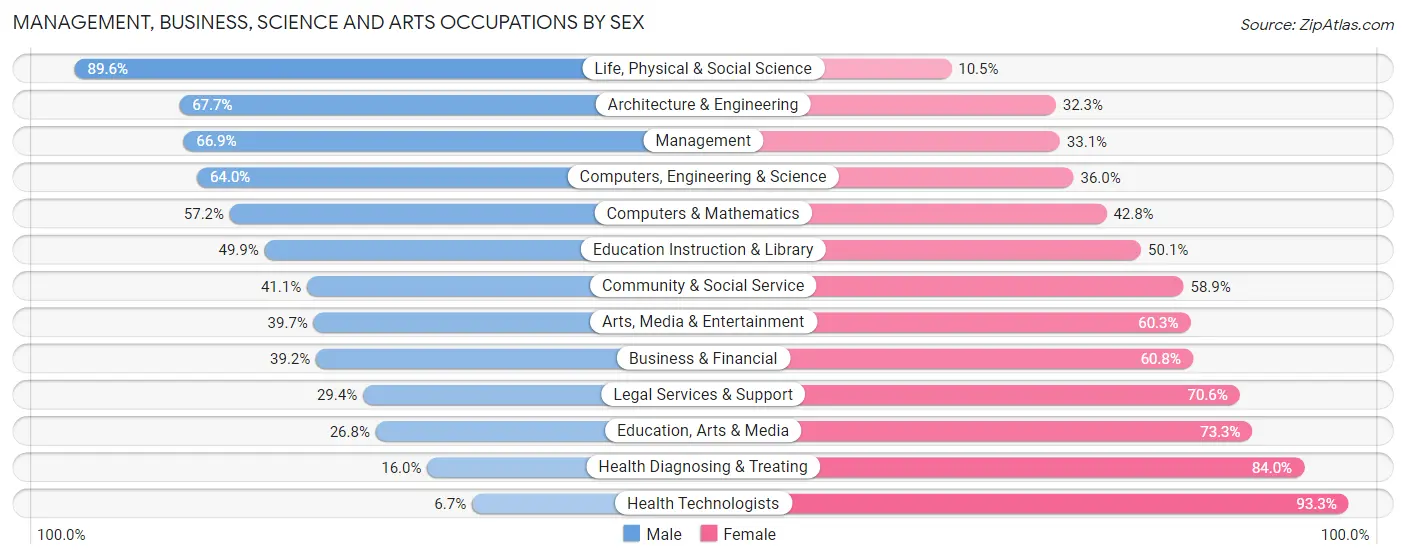
Management, Business, Science and Arts Occupations by Sex
Within the Management, Business, Science and Arts occupations in Wilkes Barre, the most male-oriented occupations are Life, Physical & Social Science (89.5%), Architecture & Engineering (67.7%), and Management (66.9%), while the most female-oriented occupations are Health Technologists (93.3%), Health Diagnosing & Treating (84.0%), and Education, Arts & Media (73.3%).
| Occupation | Male | Female |
| Management | 689 (66.9%) | 341 (33.1%) |
| Business & Financial | 272 (39.2%) | 422 (60.8%) |
| Computers, Engineering & Science | 447 (64.0%) | 251 (36.0%) |
| Computers & Mathematics | 219 (57.2%) | 164 (42.8%) |
| Architecture & Engineering | 168 (67.7%) | 80 (32.3%) |
| Life, Physical & Social Science | 60 (89.5%) | 7 (10.4%) |
| Community & Social Service | 639 (41.1%) | 916 (58.9%) |
| Education, Arts & Media | 103 (26.8%) | 282 (73.3%) |
| Legal Services & Support | 30 (29.4%) | 72 (70.6%) |
| Education Instruction & Library | 400 (49.9%) | 401 (50.1%) |
| Arts, Media & Entertainment | 106 (39.7%) | 161 (60.3%) |
| Health Diagnosing & Treating | 228 (16.0%) | 1,198 (84.0%) |
| Health Technologists | 51 (6.7%) | 714 (93.3%) |
| Total (Category) | 2,275 (42.1%) | 3,128 (57.9%) |
| Total (Overall) | 9,458 (51.2%) | 8,998 (48.7%) |
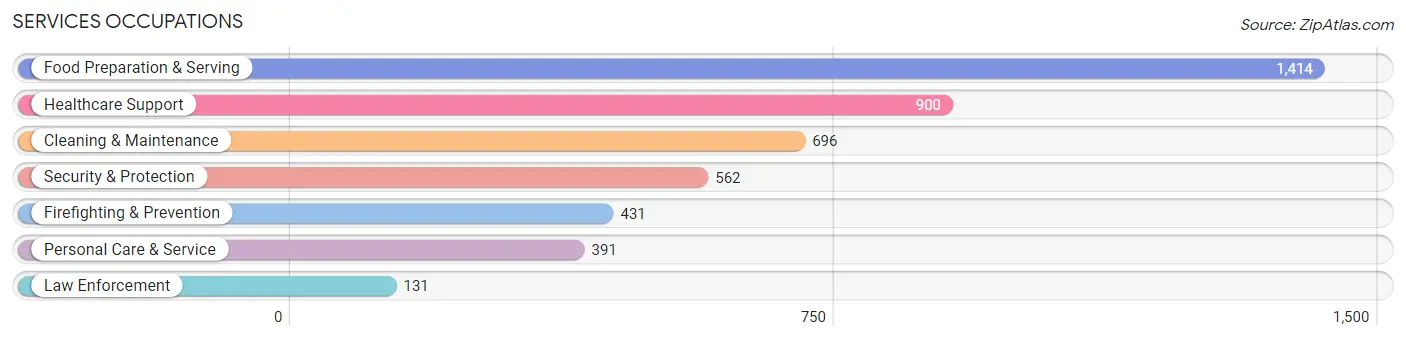
Services Occupations
The most common Services occupations in Wilkes Barre are Food Preparation & Serving (1,414 | 7.7%), Healthcare Support (900 | 4.9%), Cleaning & Maintenance (696 | 3.8%), Security & Protection (562 | 3.0%), and Firefighting & Prevention (431 | 2.3%).
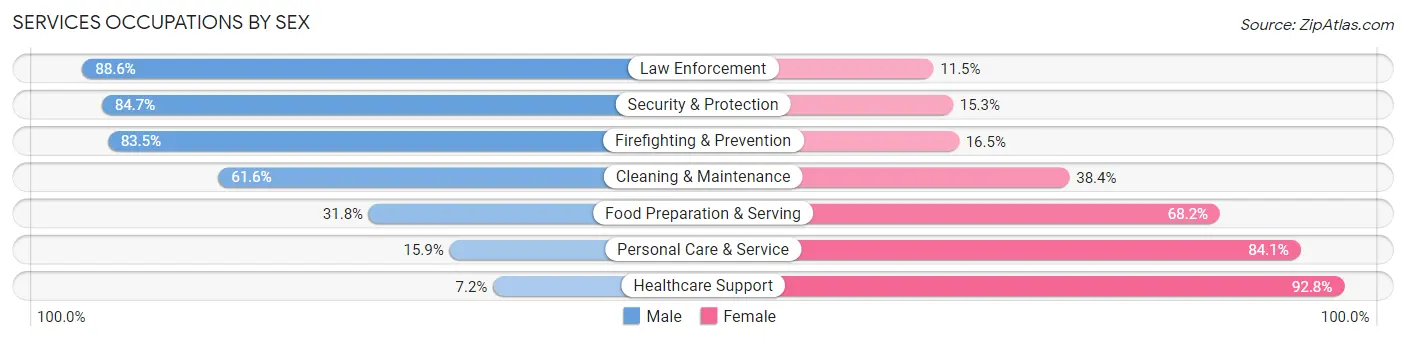
Services Occupations by Sex
Within the Services occupations in Wilkes Barre, the most male-oriented occupations are Law Enforcement (88.5%), Security & Protection (84.7%), and Firefighting & Prevention (83.5%), while the most female-oriented occupations are Healthcare Support (92.8%), Personal Care & Service (84.1%), and Food Preparation & Serving (68.2%).
| Occupation | Male | Female |
| Healthcare Support | 65 (7.2%) | 835 (92.8%) |
| Security & Protection | 476 (84.7%) | 86 (15.3%) |
| Firefighting & Prevention | 360 (83.5%) | 71 (16.5%) |
| Law Enforcement | 116 (88.5%) | 15 (11.5%) |
| Food Preparation & Serving | 450 (31.8%) | 964 (68.2%) |
| Cleaning & Maintenance | 429 (61.6%) | 267 (38.4%) |
| Personal Care & Service | 62 (15.9%) | 329 (84.1%) |
| Total (Category) | 1,482 (37.4%) | 2,481 (62.6%) |
| Total (Overall) | 9,458 (51.2%) | 8,998 (48.7%) |
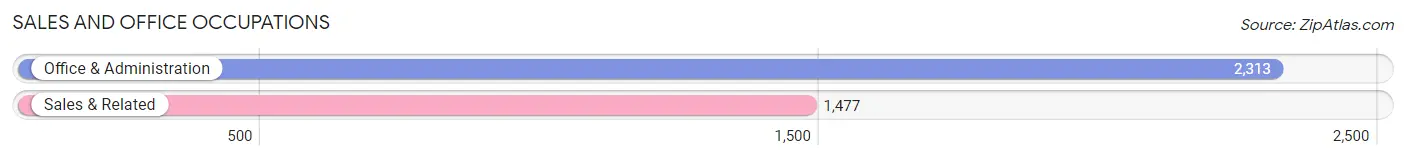
Sales and Office Occupations
The most common Sales and Office occupations in Wilkes Barre are Office & Administration (2,313 | 12.5%), and Sales & Related (1,477 | 8.0%).
Sales and Office Occupations by Sex
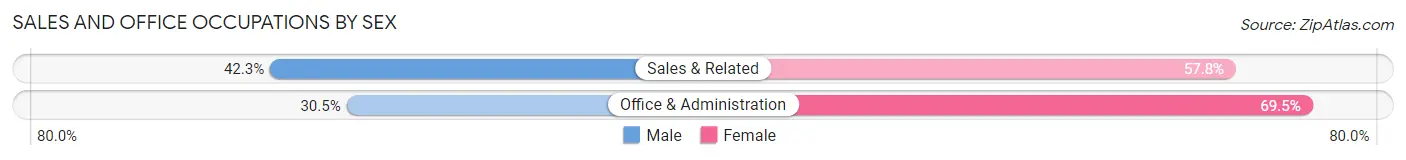
| Occupation | Male | Female |
| Sales & Related | 624 (42.2%) | 853 (57.8%) |
| Office & Administration | 705 (30.5%) | 1,608 (69.5%) |
| Total (Category) | 1,329 (35.1%) | 2,461 (64.9%) |
| Total (Overall) | 9,458 (51.2%) | 8,998 (48.7%) |
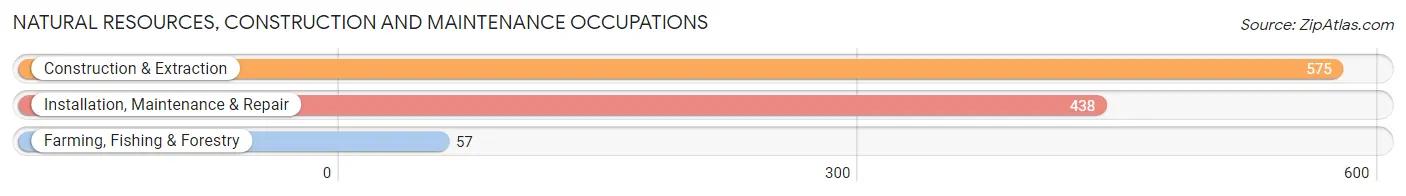
Natural Resources, Construction and Maintenance Occupations
The most common Natural Resources, Construction and Maintenance occupations in Wilkes Barre are Construction & Extraction (575 | 3.1%), Installation, Maintenance & Repair (438 | 2.4%), and Farming, Fishing & Forestry (57 | 0.3%).
Natural Resources, Construction and Maintenance Occupations by Sex
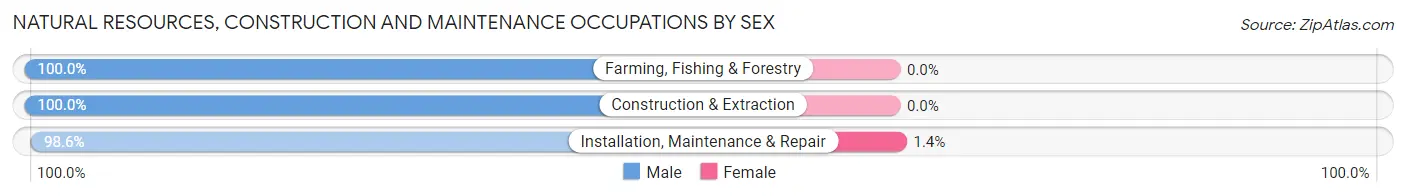
| Occupation | Male | Female |
| Farming, Fishing & Forestry | 57 (100.0%) | 0 (0.0%) |
| Construction & Extraction | 575 (100.0%) | 0 (0.0%) |
| Installation, Maintenance & Repair | 432 (98.6%) | 6 (1.4%) |
| Total (Category) | 1,064 (99.4%) | 6 (0.6%) |
| Total (Overall) | 9,458 (51.2%) | 8,998 (48.7%) |
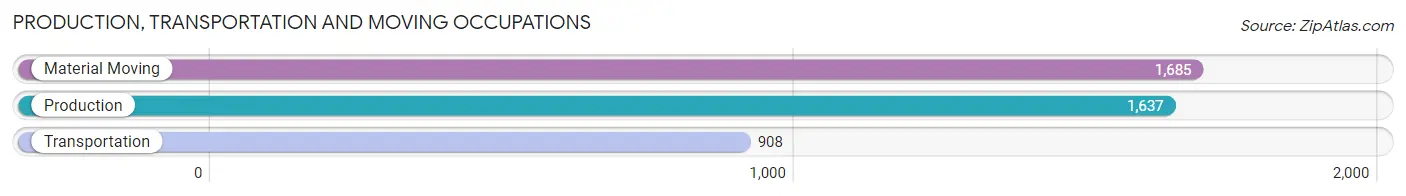
Production, Transportation and Moving Occupations
The most common Production, Transportation and Moving occupations in Wilkes Barre are Material Moving (1,685 | 9.1%), Production (1,637 | 8.9%), and Transportation (908 | 4.9%).
Production, Transportation and Moving Occupations by Sex
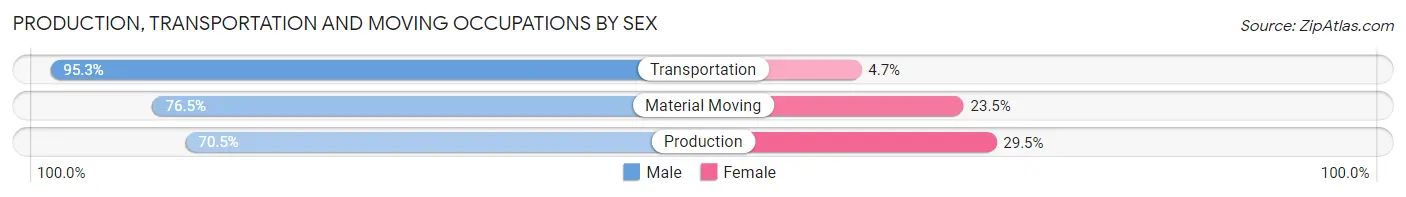
| Occupation | Male | Female |
| Production | 1,154 (70.5%) | 483 (29.5%) |
| Transportation | 865 (95.3%) | 43 (4.7%) |
| Material Moving | 1,289 (76.5%) | 396 (23.5%) |
| Total (Category) | 3,308 (78.2%) | 922 (21.8%) |
| Total (Overall) | 9,458 (51.2%) | 8,998 (48.7%) |
Employment Industries by Sex in Wilkes Barre
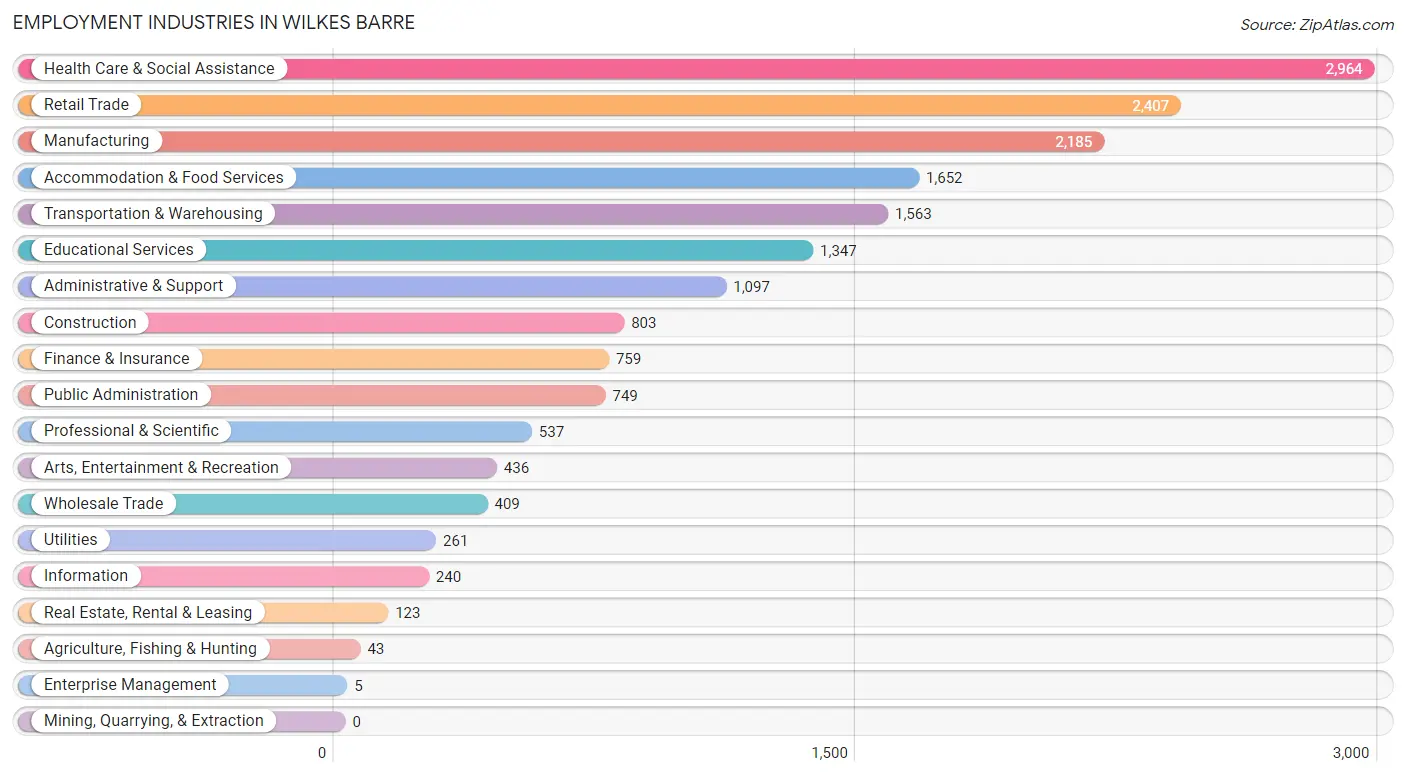
Employment Industries in Wilkes Barre
The major employment industries in Wilkes Barre include Health Care & Social Assistance (2,964 | 16.1%), Retail Trade (2,407 | 13.0%), Manufacturing (2,185 | 11.8%), Accommodation & Food Services (1,652 | 8.9%), and Transportation & Warehousing (1,563 | 8.5%).
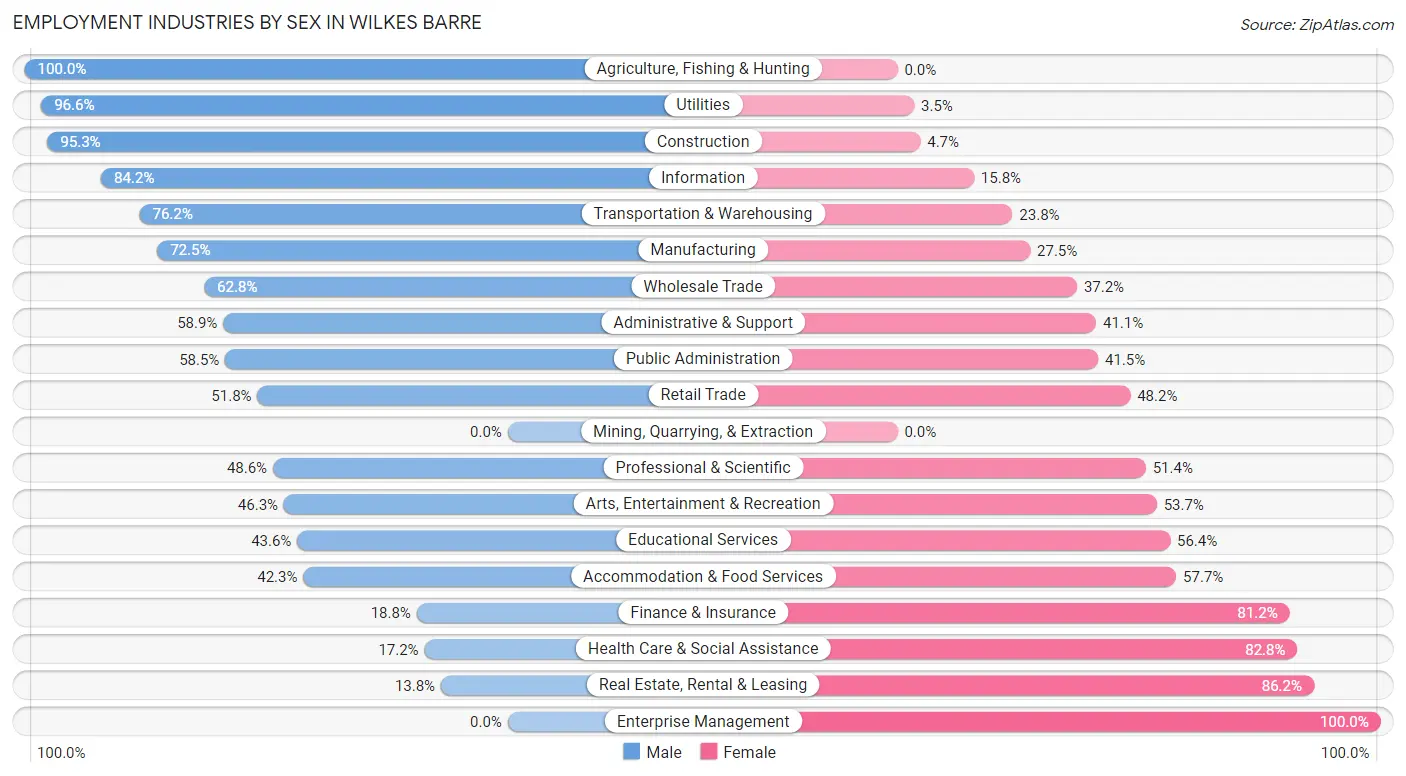
Employment Industries by Sex in Wilkes Barre
The Wilkes Barre industries that see more men than women are Agriculture, Fishing & Hunting (100.0%), Utilities (96.6%), and Construction (95.3%), whereas the industries that tend to have a higher number of women are Enterprise Management (100.0%), Real Estate, Rental & Leasing (86.2%), and Health Care & Social Assistance (82.8%).
| Industry | Male | Female |
| Agriculture, Fishing & Hunting | 43 (100.0%) | 0 (0.0%) |
| Mining, Quarrying, & Extraction | 0 (0.0%) | 0 (0.0%) |
| Construction | 765 (95.3%) | 38 (4.7%) |
| Manufacturing | 1,585 (72.5%) | 600 (27.5%) |
| Wholesale Trade | 257 (62.8%) | 152 (37.2%) |
| Retail Trade | 1,247 (51.8%) | 1,160 (48.2%) |
| Transportation & Warehousing | 1,191 (76.2%) | 372 (23.8%) |
| Utilities | 252 (96.6%) | 9 (3.5%) |
| Information | 202 (84.2%) | 38 (15.8%) |
| Finance & Insurance | 143 (18.8%) | 616 (81.2%) |
| Real Estate, Rental & Leasing | 17 (13.8%) | 106 (86.2%) |
| Professional & Scientific | 261 (48.6%) | 276 (51.4%) |
| Enterprise Management | 0 (0.0%) | 5 (100.0%) |
| Administrative & Support | 646 (58.9%) | 451 (41.1%) |
| Educational Services | 587 (43.6%) | 760 (56.4%) |
| Health Care & Social Assistance | 511 (17.2%) | 2,453 (82.8%) |
| Arts, Entertainment & Recreation | 202 (46.3%) | 234 (53.7%) |
| Accommodation & Food Services | 699 (42.3%) | 953 (57.7%) |
| Public Administration | 438 (58.5%) | 311 (41.5%) |
| Total | 9,458 (51.2%) | 8,998 (48.7%) |
Education in Wilkes Barre
School Enrollment in Wilkes Barre
The most common levels of schooling among the 11,512 students in Wilkes Barre are college / undergraduate (4,118 | 35.8%), elementary school (2,423 | 21.0%), and high school (1,894 | 16.5%).
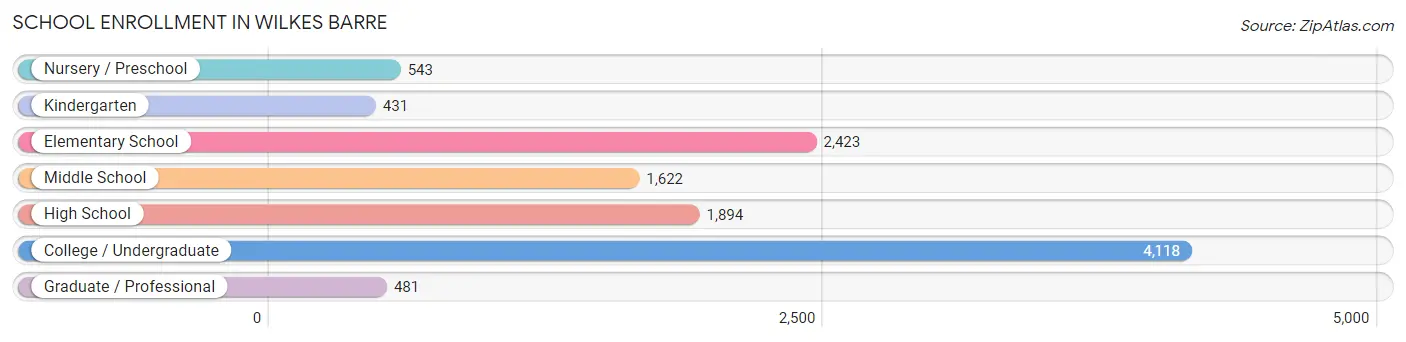
| School Level | # Students | % Students |
| Nursery / Preschool | 543 | 4.7% |
| Kindergarten | 431 | 3.7% |
| Elementary School | 2,423 | 21.0% |
| Middle School | 1,622 | 14.1% |
| High School | 1,894 | 16.5% |
| College / Undergraduate | 4,118 | 35.8% |
| Graduate / Professional | 481 | 4.2% |
| Total | 11,512 | 100.0% |
School Enrollment by Age by Funding Source in Wilkes Barre
Out of a total of 11,512 students who are enrolled in schools in Wilkes Barre, 3,868 (33.6%) attend a private institution, while the remaining 7,644 (66.4%) are enrolled in public schools. The age group of 20 to 24 year olds has the highest likelihood of being enrolled in private schools, with 1,620 (81.1% in the age bracket) enrolled. Conversely, the age group of 5 to 9 year old has the lowest likelihood of being enrolled in a private school, with 2,414 (93.7% in the age bracket) attending a public institution.
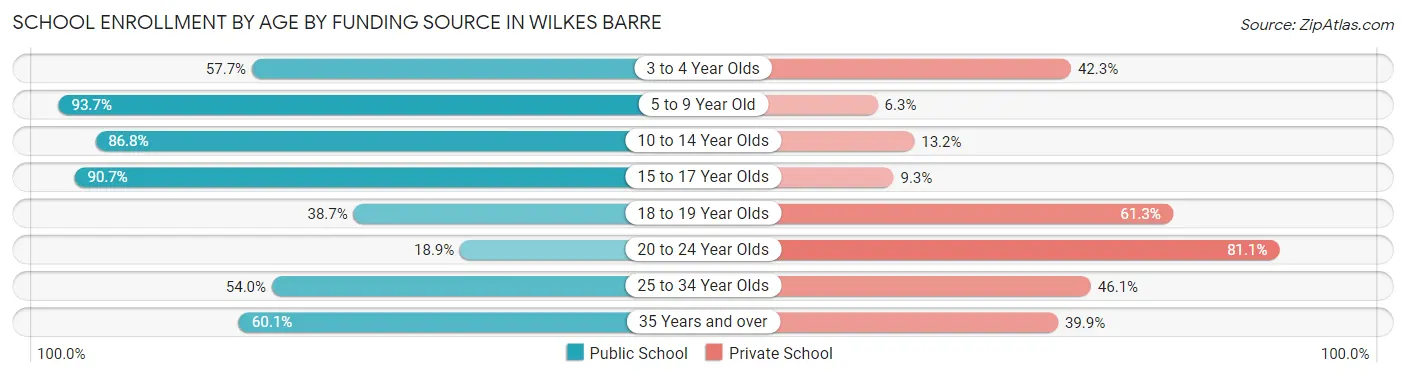
| Age Bracket | Public School | Private School |
| 3 to 4 Year Olds | 222 (57.7%) | 163 (42.3%) |
| 5 to 9 Year Old | 2,414 (93.7%) | 163 (6.3%) |
| 10 to 14 Year Olds | 1,999 (86.8%) | 303 (13.2%) |
| 15 to 17 Year Olds | 1,337 (90.7%) | 137 (9.3%) |
| 18 to 19 Year Olds | 605 (38.7%) | 957 (61.3%) |
| 20 to 24 Year Olds | 377 (18.9%) | 1,620 (81.1%) |
| 25 to 34 Year Olds | 396 (53.9%) | 338 (46.1%) |
| 35 Years and over | 289 (60.1%) | 192 (39.9%) |
| Total | 7,644 (66.4%) | 3,868 (33.6%) |
Educational Attainment by Field of Study in Wilkes Barre
Business (965 | 16.3%), science & technology (738 | 12.5%), education (734 | 12.4%), psychology (556 | 9.4%), and arts & humanities (473 | 8.0%) are the most common fields of study among 5,915 individuals in Wilkes Barre who have obtained a bachelor's degree or higher.
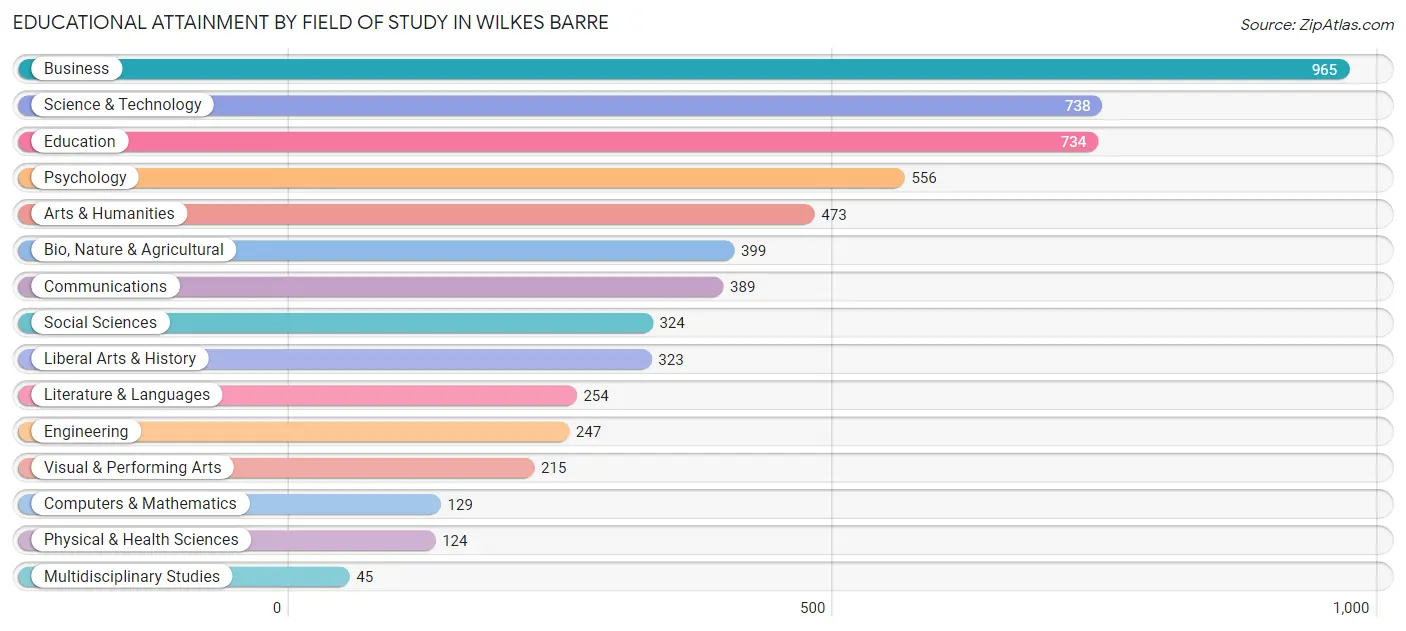
| Field of Study | # Graduates | % Graduates |
| Computers & Mathematics | 129 | 2.2% |
| Bio, Nature & Agricultural | 399 | 6.8% |
| Physical & Health Sciences | 124 | 2.1% |
| Psychology | 556 | 9.4% |
| Social Sciences | 324 | 5.5% |
| Engineering | 247 | 4.2% |
| Multidisciplinary Studies | 45 | 0.8% |
| Science & Technology | 738 | 12.5% |
| Business | 965 | 16.3% |
| Education | 734 | 12.4% |
| Literature & Languages | 254 | 4.3% |
| Liberal Arts & History | 323 | 5.5% |
| Visual & Performing Arts | 215 | 3.6% |
| Communications | 389 | 6.6% |
| Arts & Humanities | 473 | 8.0% |
| Total | 5,915 | 100.0% |
Transportation & Commute in Wilkes Barre
Vehicle Availability by Sex in Wilkes Barre
The most prevalent vehicle ownership categories in Wilkes Barre are males with 2 vehicles (3,662, accounting for 40.1%) and females with 2 vehicles (3,499, making up 42.6%).
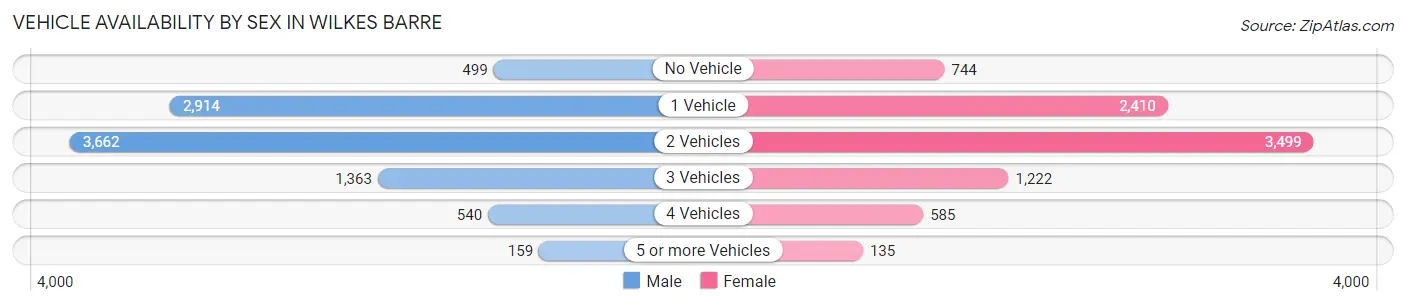
| Vehicles Available | Male | Female |
| No Vehicle | 499 (5.5%) | 744 (8.7%) |
| 1 Vehicle | 2,914 (31.9%) | 2,410 (28.0%) |
| 2 Vehicles | 3,662 (40.1%) | 3,499 (40.7%) |
| 3 Vehicles | 1,363 (14.9%) | 1,222 (14.2%) |
| 4 Vehicles | 540 (5.9%) | 585 (6.8%) |
| 5 or more Vehicles | 159 (1.7%) | 135 (1.6%) |
| Total | 9,137 (100.0%) | 8,595 (100.0%) |
Commute Time in Wilkes Barre
The most frequently occuring commute durations in Wilkes Barre are 15 to 19 minutes (3,680 commuters, 21.4%), 10 to 14 minutes (3,517 commuters, 20.4%), and 5 to 9 minutes (2,763 commuters, 16.1%).
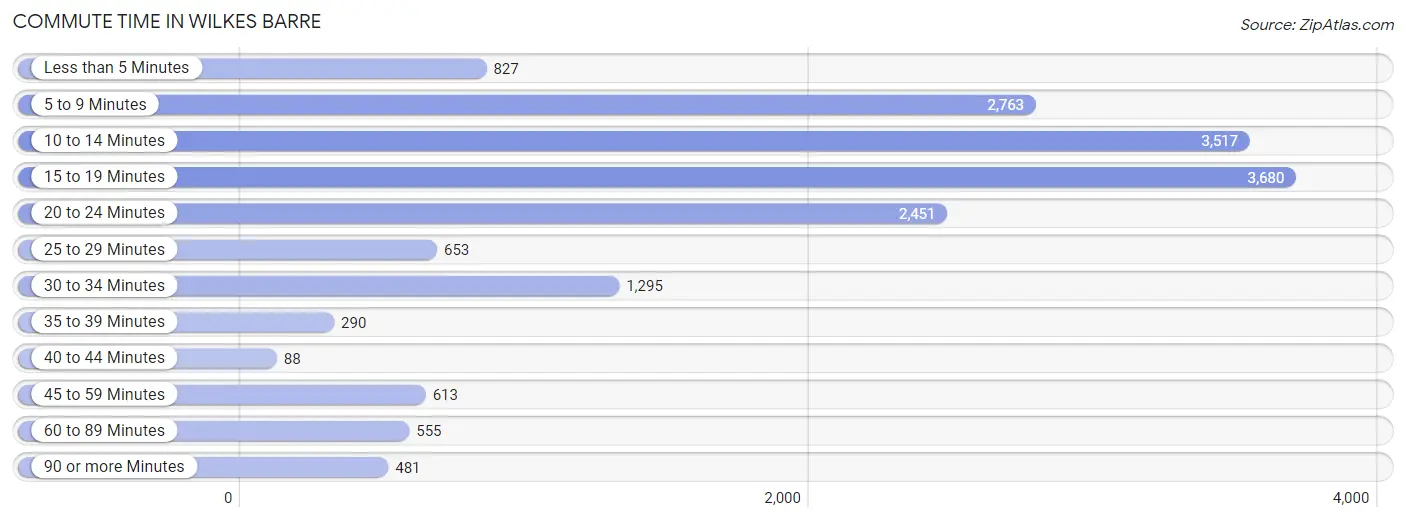
| Commute Time | # Commuters | % Commuters |
| Less than 5 Minutes | 827 | 4.8% |
| 5 to 9 Minutes | 2,763 | 16.1% |
| 10 to 14 Minutes | 3,517 | 20.4% |
| 15 to 19 Minutes | 3,680 | 21.4% |
| 20 to 24 Minutes | 2,451 | 14.2% |
| 25 to 29 Minutes | 653 | 3.8% |
| 30 to 34 Minutes | 1,295 | 7.5% |
| 35 to 39 Minutes | 290 | 1.7% |
| 40 to 44 Minutes | 88 | 0.5% |
| 45 to 59 Minutes | 613 | 3.6% |
| 60 to 89 Minutes | 555 | 3.2% |
| 90 or more Minutes | 481 | 2.8% |
Commute Time by Sex in Wilkes Barre
The most common commute times in Wilkes Barre are 15 to 19 minutes (1,829 commuters, 20.3%) for males and 10 to 14 minutes (1,900 commuters, 23.2%) for females.
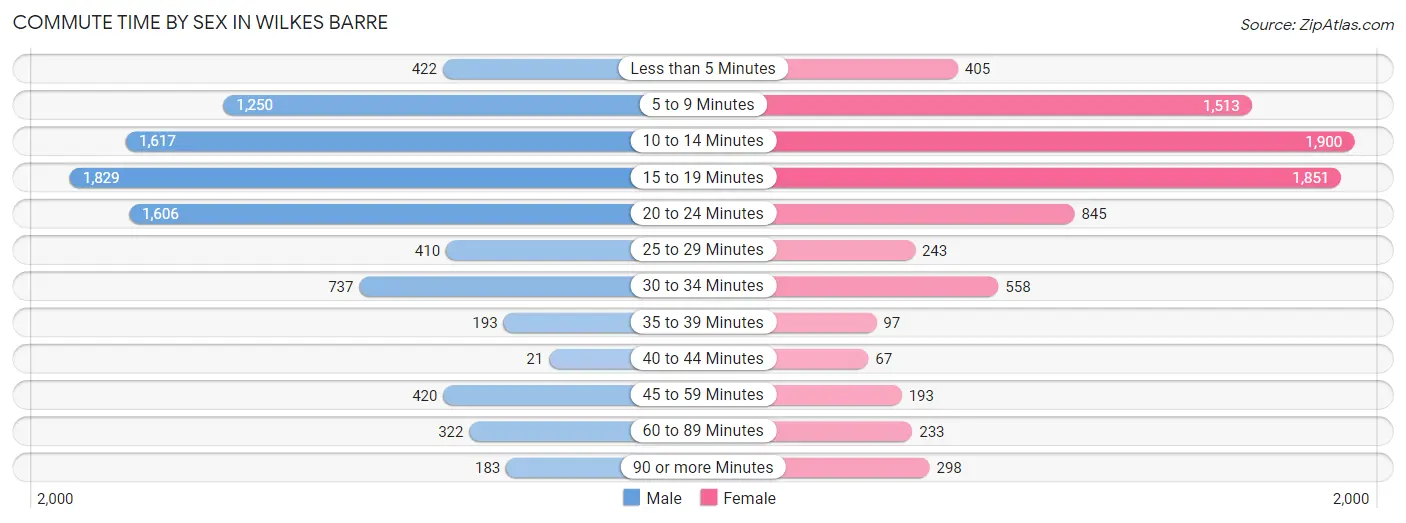
| Commute Time | Male | Female |
| Less than 5 Minutes | 422 (4.7%) | 405 (4.9%) |
| 5 to 9 Minutes | 1,250 (13.9%) | 1,513 (18.4%) |
| 10 to 14 Minutes | 1,617 (17.9%) | 1,900 (23.2%) |
| 15 to 19 Minutes | 1,829 (20.3%) | 1,851 (22.6%) |
| 20 to 24 Minutes | 1,606 (17.8%) | 845 (10.3%) |
| 25 to 29 Minutes | 410 (4.5%) | 243 (3.0%) |
| 30 to 34 Minutes | 737 (8.2%) | 558 (6.8%) |
| 35 to 39 Minutes | 193 (2.1%) | 97 (1.2%) |
| 40 to 44 Minutes | 21 (0.2%) | 67 (0.8%) |
| 45 to 59 Minutes | 420 (4.7%) | 193 (2.4%) |
| 60 to 89 Minutes | 322 (3.6%) | 233 (2.8%) |
| 90 or more Minutes | 183 (2.0%) | 298 (3.6%) |
Time of Departure to Work by Sex in Wilkes Barre
The most frequent times of departure to work in Wilkes Barre are 12:00 PM to 3:59 PM (1,663, 18.5%) for males and 12:00 PM to 3:59 PM (1,322, 16.1%) for females.
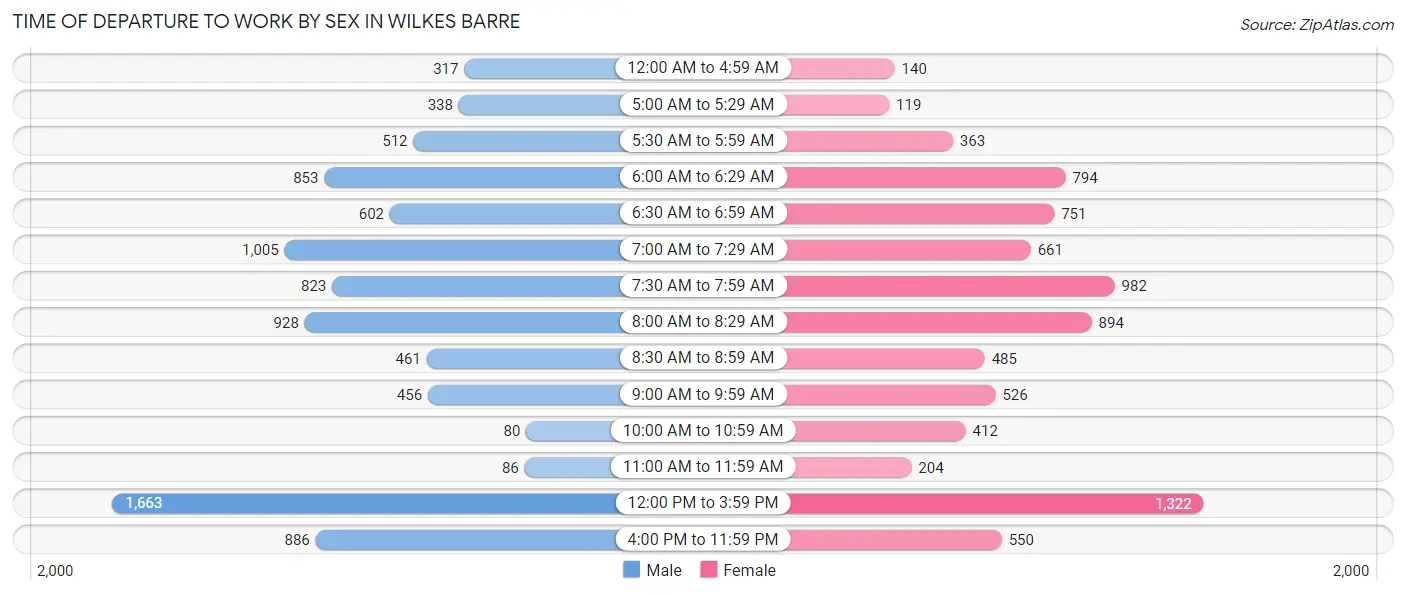
| Time of Departure | Male | Female |
| 12:00 AM to 4:59 AM | 317 (3.5%) | 140 (1.7%) |
| 5:00 AM to 5:29 AM | 338 (3.7%) | 119 (1.5%) |
| 5:30 AM to 5:59 AM | 512 (5.7%) | 363 (4.4%) |
| 6:00 AM to 6:29 AM | 853 (9.5%) | 794 (9.7%) |
| 6:30 AM to 6:59 AM | 602 (6.7%) | 751 (9.2%) |
| 7:00 AM to 7:29 AM | 1,005 (11.2%) | 661 (8.1%) |
| 7:30 AM to 7:59 AM | 823 (9.1%) | 982 (12.0%) |
| 8:00 AM to 8:29 AM | 928 (10.3%) | 894 (10.9%) |
| 8:30 AM to 8:59 AM | 461 (5.1%) | 485 (5.9%) |
| 9:00 AM to 9:59 AM | 456 (5.1%) | 526 (6.4%) |
| 10:00 AM to 10:59 AM | 80 (0.9%) | 412 (5.0%) |
| 11:00 AM to 11:59 AM | 86 (0.9%) | 204 (2.5%) |
| 12:00 PM to 3:59 PM | 1,663 (18.5%) | 1,322 (16.1%) |
| 4:00 PM to 11:59 PM | 886 (9.8%) | 550 (6.7%) |
| Total | 9,010 (100.0%) | 8,203 (100.0%) |
Housing Occupancy in Wilkes Barre
Occupancy by Ownership in Wilkes Barre
Of the total 16,461 dwellings in Wilkes Barre, owner-occupied units account for 7,877 (47.8%), while renter-occupied units make up 8,584 (52.1%).
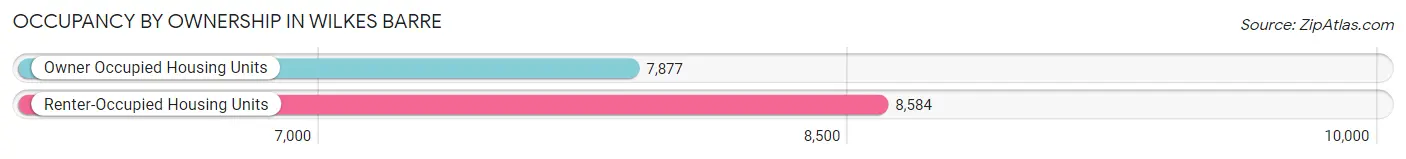
| Occupancy | # Housing Units | % Housing Units |
| Owner Occupied Housing Units | 7,877 | 47.8% |
| Renter-Occupied Housing Units | 8,584 | 52.1% |
| Total Occupied Housing Units | 16,461 | 100.0% |
Occupancy by Household Size in Wilkes Barre
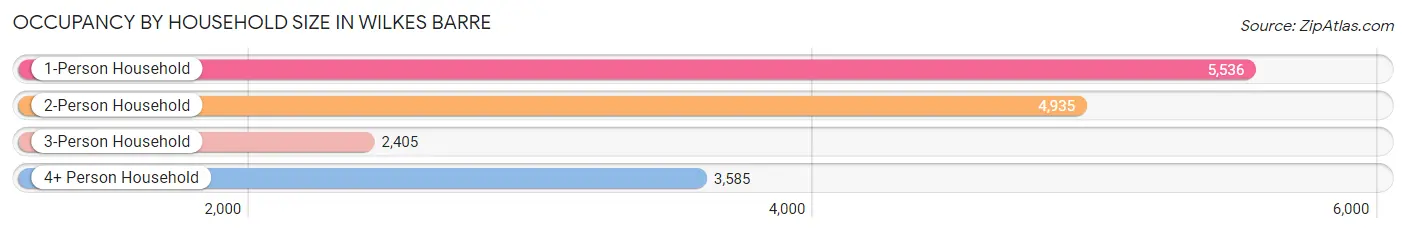
| Household Size | # Housing Units | % Housing Units |
| 1-Person Household | 5,536 | 33.6% |
| 2-Person Household | 4,935 | 30.0% |
| 3-Person Household | 2,405 | 14.6% |
| 4+ Person Household | 3,585 | 21.8% |
| Total Housing Units | 16,461 | 100.0% |
Occupancy by Ownership by Household Size in Wilkes Barre
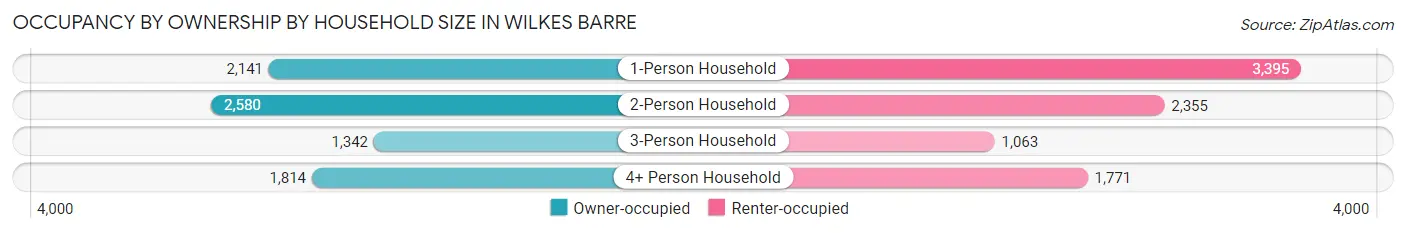
| Household Size | Owner-occupied | Renter-occupied |
| 1-Person Household | 2,141 (38.7%) | 3,395 (61.3%) |
| 2-Person Household | 2,580 (52.3%) | 2,355 (47.7%) |
| 3-Person Household | 1,342 (55.8%) | 1,063 (44.2%) |
| 4+ Person Household | 1,814 (50.6%) | 1,771 (49.4%) |
| Total Housing Units | 7,877 (47.8%) | 8,584 (52.1%) |
Occupancy by Educational Attainment in Wilkes Barre
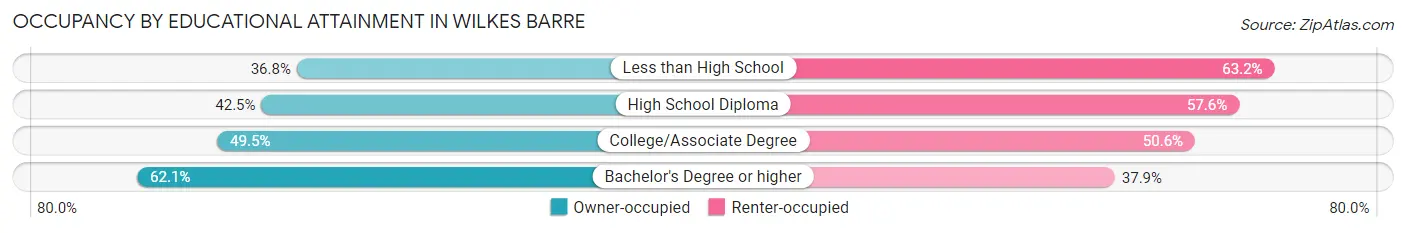
| Household Size | Owner-occupied | Renter-occupied |
| Less than High School | 704 (36.8%) | 1,207 (63.2%) |
| High School Diploma | 2,598 (42.4%) | 3,522 (57.6%) |
| College/Associate Degree | 2,584 (49.4%) | 2,642 (50.5%) |
| Bachelor's Degree or higher | 1,991 (62.1%) | 1,213 (37.9%) |
Occupancy by Age of Householder in Wilkes Barre
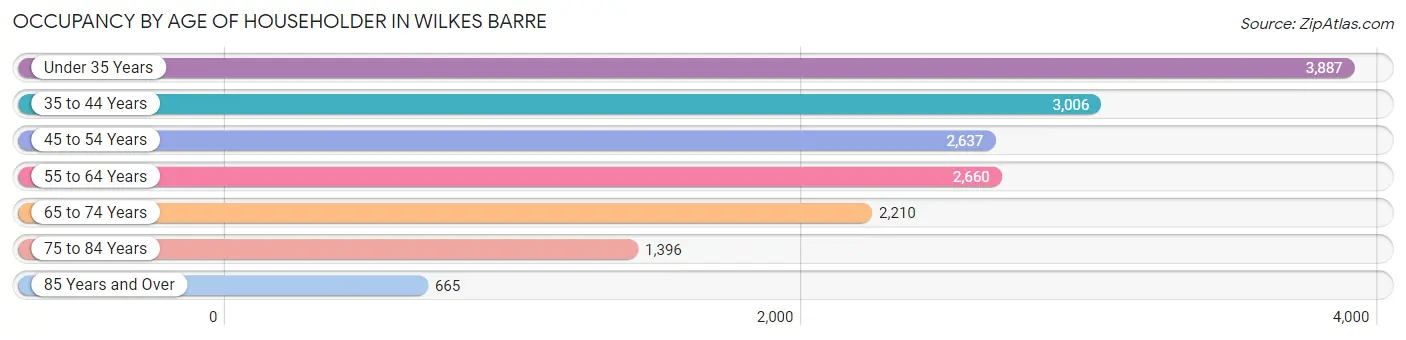
| Age Bracket | # Households | % Households |
| Under 35 Years | 3,887 | 23.6% |
| 35 to 44 Years | 3,006 | 18.3% |
| 45 to 54 Years | 2,637 | 16.0% |
| 55 to 64 Years | 2,660 | 16.2% |
| 65 to 74 Years | 2,210 | 13.4% |
| 75 to 84 Years | 1,396 | 8.5% |
| 85 Years and Over | 665 | 4.0% |
| Total | 16,461 | 100.0% |
Housing Finances in Wilkes Barre
Median Income by Occupancy in Wilkes Barre
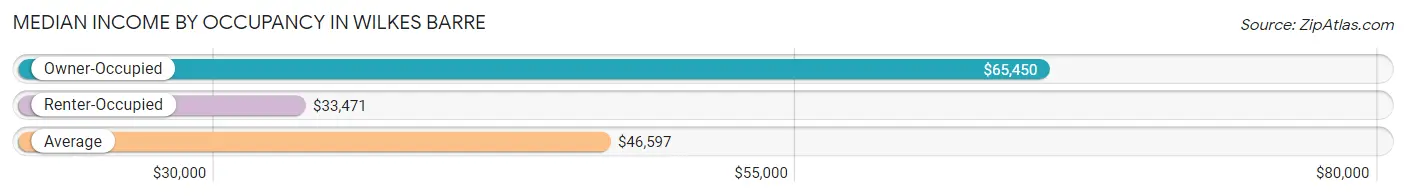
| Occupancy Type | # Households | Median Income |
| Owner-Occupied | 7,877 (47.8%) | $65,450 |
| Renter-Occupied | 8,584 (52.1%) | $33,471 |
| Average | 16,461 (100.0%) | $46,597 |
Occupancy by Householder Income Bracket in Wilkes Barre
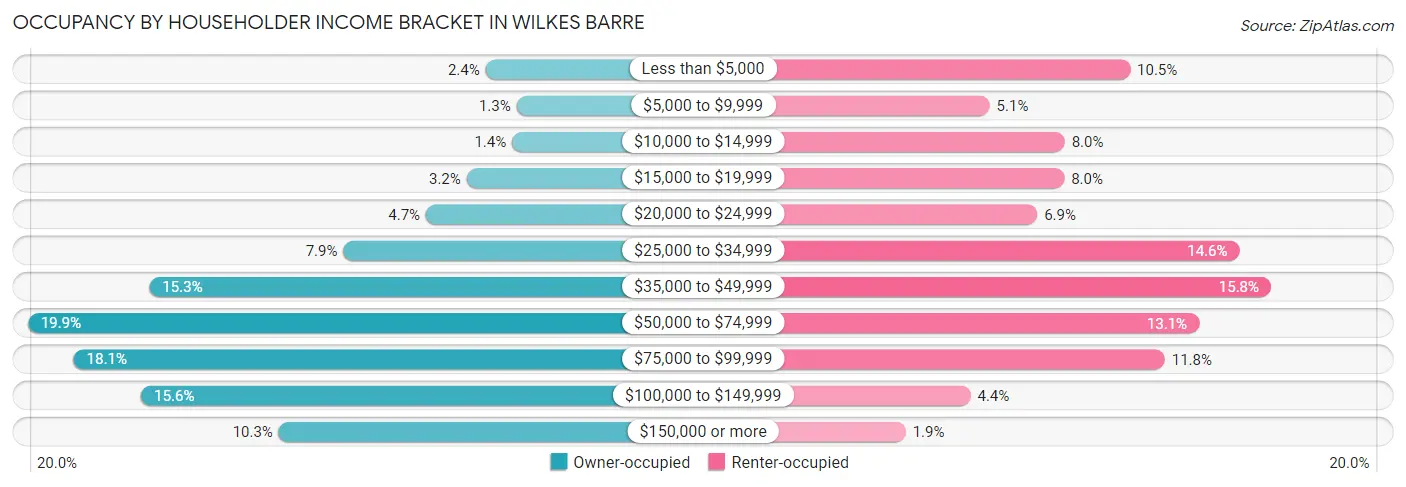
| Income Bracket | Owner-occupied | Renter-occupied |
| Less than $5,000 | 192 (2.4%) | 898 (10.5%) |
| $5,000 to $9,999 | 99 (1.3%) | 439 (5.1%) |
| $10,000 to $14,999 | 113 (1.4%) | 684 (8.0%) |
| $15,000 to $19,999 | 249 (3.2%) | 682 (8.0%) |
| $20,000 to $24,999 | 371 (4.7%) | 594 (6.9%) |
| $25,000 to $34,999 | 619 (7.9%) | 1,255 (14.6%) |
| $35,000 to $49,999 | 1,201 (15.2%) | 1,358 (15.8%) |
| $50,000 to $74,999 | 1,566 (19.9%) | 1,123 (13.1%) |
| $75,000 to $99,999 | 1,428 (18.1%) | 1,011 (11.8%) |
| $100,000 to $149,999 | 1,226 (15.6%) | 376 (4.4%) |
| $150,000 or more | 813 (10.3%) | 164 (1.9%) |
| Total | 7,877 (100.0%) | 8,584 (100.0%) |
Monthly Housing Cost Tiers in Wilkes Barre
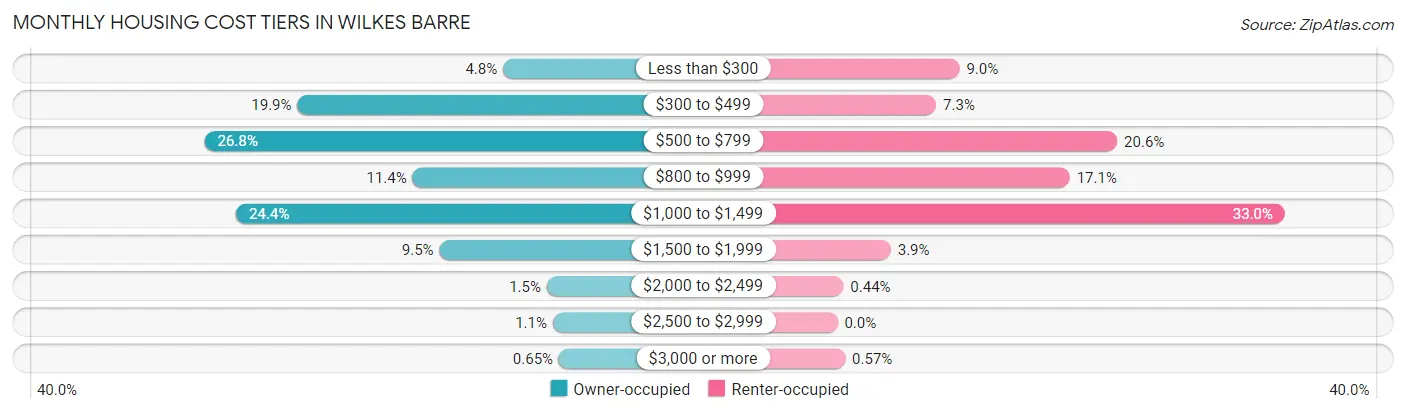
| Monthly Cost | Owner-occupied | Renter-occupied |
| Less than $300 | 375 (4.8%) | 772 (9.0%) |
| $300 to $499 | 1,568 (19.9%) | 624 (7.3%) |
| $500 to $799 | 2,107 (26.8%) | 1,768 (20.6%) |
| $800 to $999 | 900 (11.4%) | 1,469 (17.1%) |
| $1,000 to $1,499 | 1,924 (24.4%) | 2,828 (33.0%) |
| $1,500 to $1,999 | 744 (9.5%) | 337 (3.9%) |
| $2,000 to $2,499 | 121 (1.5%) | 38 (0.4%) |
| $2,500 to $2,999 | 87 (1.1%) | 0 (0.0%) |
| $3,000 or more | 51 (0.6%) | 49 (0.6%) |
| Total | 7,877 (100.0%) | 8,584 (100.0%) |
Physical Housing Characteristics in Wilkes Barre
Housing Structures in Wilkes Barre
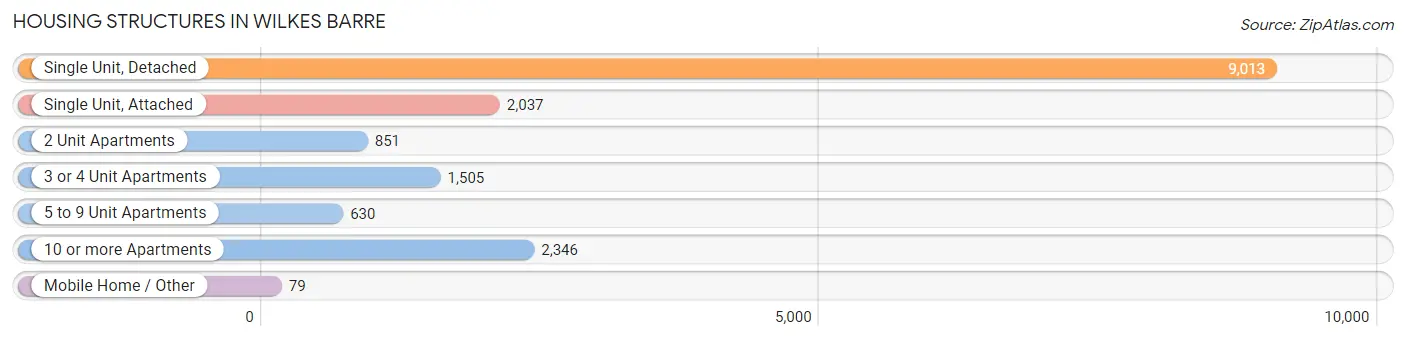
| Structure Type | # Housing Units | % Housing Units |
| Single Unit, Detached | 9,013 | 54.7% |
| Single Unit, Attached | 2,037 | 12.4% |
| 2 Unit Apartments | 851 | 5.2% |
| 3 or 4 Unit Apartments | 1,505 | 9.1% |
| 5 to 9 Unit Apartments | 630 | 3.8% |
| 10 or more Apartments | 2,346 | 14.2% |
| Mobile Home / Other | 79 | 0.5% |
| Total | 16,461 | 100.0% |
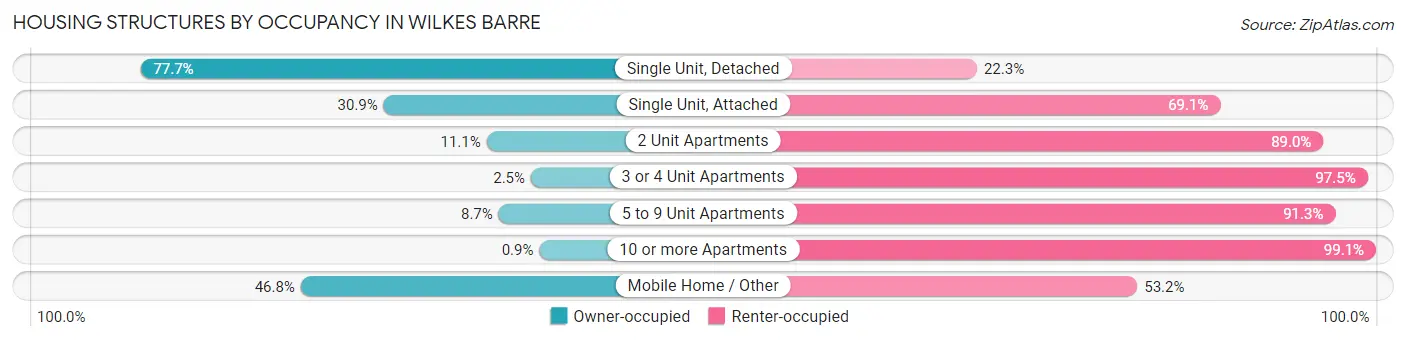
Housing Structures by Occupancy in Wilkes Barre
| Structure Type | Owner-occupied | Renter-occupied |
| Single Unit, Detached | 7,003 (77.7%) | 2,010 (22.3%) |
| Single Unit, Attached | 629 (30.9%) | 1,408 (69.1%) |
| 2 Unit Apartments | 94 (11.1%) | 757 (88.9%) |
| 3 or 4 Unit Apartments | 38 (2.5%) | 1,467 (97.5%) |
| 5 to 9 Unit Apartments | 55 (8.7%) | 575 (91.3%) |
| 10 or more Apartments | 21 (0.9%) | 2,325 (99.1%) |
| Mobile Home / Other | 37 (46.8%) | 42 (53.2%) |
| Total | 7,877 (47.8%) | 8,584 (52.1%) |
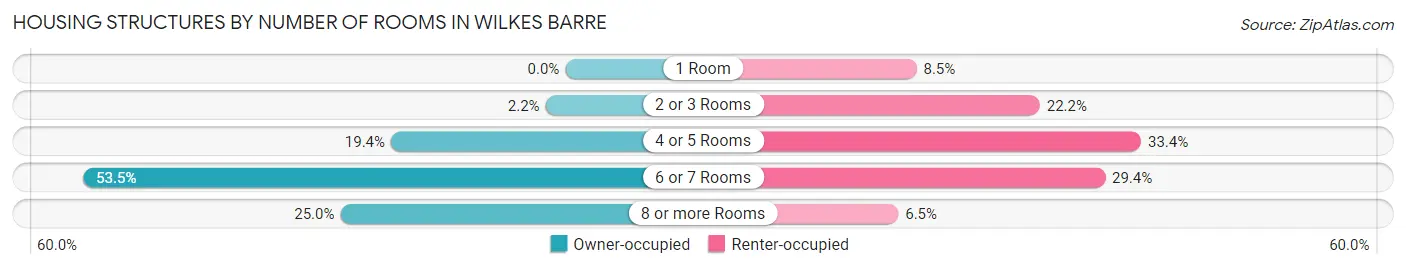
Housing Structures by Number of Rooms in Wilkes Barre
| Number of Rooms | Owner-occupied | Renter-occupied |
| 1 Room | 0 (0.0%) | 730 (8.5%) |
| 2 or 3 Rooms | 173 (2.2%) | 1,904 (22.2%) |
| 4 or 5 Rooms | 1,524 (19.4%) | 2,869 (33.4%) |
| 6 or 7 Rooms | 4,214 (53.5%) | 2,525 (29.4%) |
| 8 or more Rooms | 1,966 (25.0%) | 556 (6.5%) |
| Total | 7,877 (100.0%) | 8,584 (100.0%) |
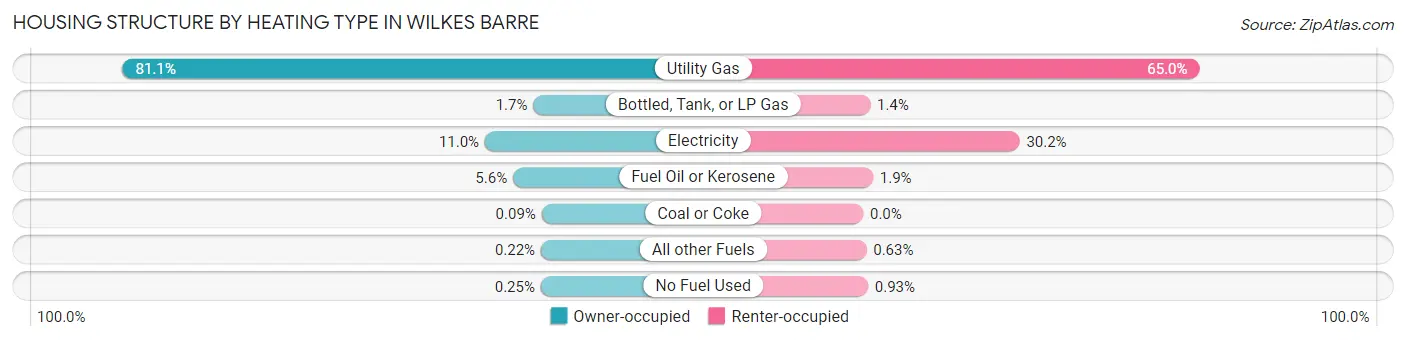
Housing Structure by Heating Type in Wilkes Barre
| Heating Type | Owner-occupied | Renter-occupied |
| Utility Gas | 6,386 (81.1%) | 5,578 (65.0%) |
| Bottled, Tank, or LP Gas | 134 (1.7%) | 116 (1.3%) |
| Electricity | 870 (11.0%) | 2,594 (30.2%) |
| Fuel Oil or Kerosene | 443 (5.6%) | 162 (1.9%) |
| Coal or Coke | 7 (0.1%) | 0 (0.0%) |
| All other Fuels | 17 (0.2%) | 54 (0.6%) |
| No Fuel Used | 20 (0.3%) | 80 (0.9%) |
| Total | 7,877 (100.0%) | 8,584 (100.0%) |
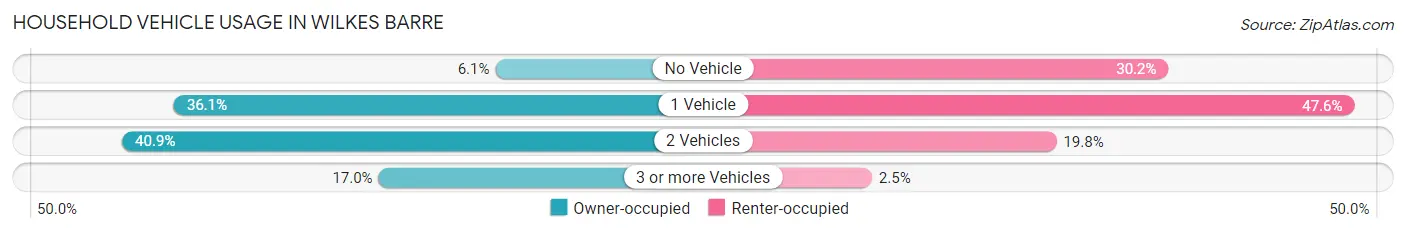
Household Vehicle Usage in Wilkes Barre
| Vehicles per Household | Owner-occupied | Renter-occupied |
| No Vehicle | 477 (6.1%) | 2,591 (30.2%) |
| 1 Vehicle | 2,841 (36.1%) | 4,082 (47.5%) |
| 2 Vehicles | 3,222 (40.9%) | 1,695 (19.8%) |
| 3 or more Vehicles | 1,337 (17.0%) | 216 (2.5%) |
| Total | 7,877 (100.0%) | 8,584 (100.0%) |
Real Estate & Mortgages in Wilkes Barre
Real Estate and Mortgage Overview in Wilkes Barre
| Characteristic | Without Mortgage | With Mortgage |
| Housing Units | 4,007 | 3,870 |
| Median Property Value | $88,000 | $108,500 |
| Median Household Income | $54,493 | $538 |
| Monthly Housing Costs | $515 | $46 |
| Real Estate Taxes | $1,900 | $52 |
Property Value by Mortgage Status in Wilkes Barre
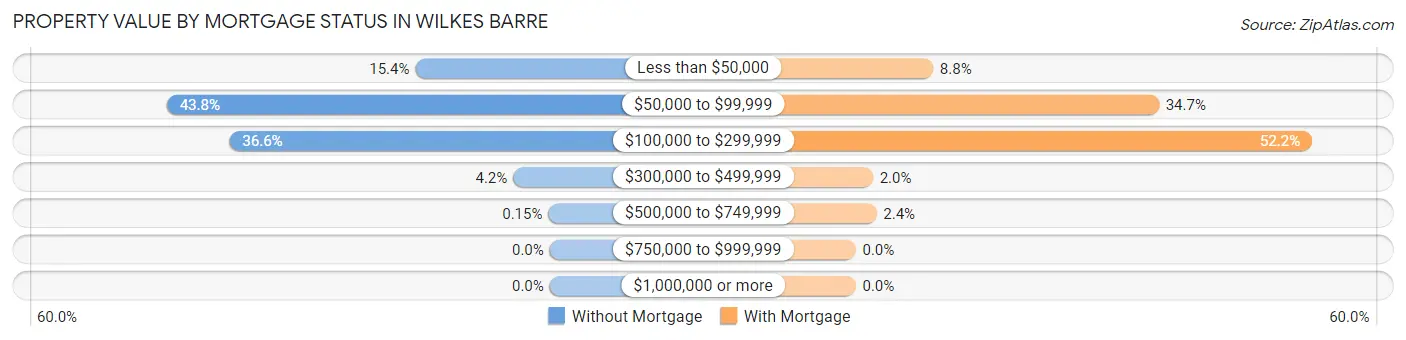
| Property Value | Without Mortgage | With Mortgage |
| Less than $50,000 | 615 (15.3%) | 342 (8.8%) |
| $50,000 to $99,999 | 1,753 (43.8%) | 1,341 (34.6%) |
| $100,000 to $299,999 | 1,466 (36.6%) | 2,019 (52.2%) |
| $300,000 to $499,999 | 167 (4.2%) | 76 (2.0%) |
| $500,000 to $749,999 | 6 (0.2%) | 92 (2.4%) |
| $750,000 to $999,999 | 0 (0.0%) | 0 (0.0%) |
| $1,000,000 or more | 0 (0.0%) | 0 (0.0%) |
| Total | 4,007 (100.0%) | 3,870 (100.0%) |
Household Income by Mortgage Status in Wilkes Barre
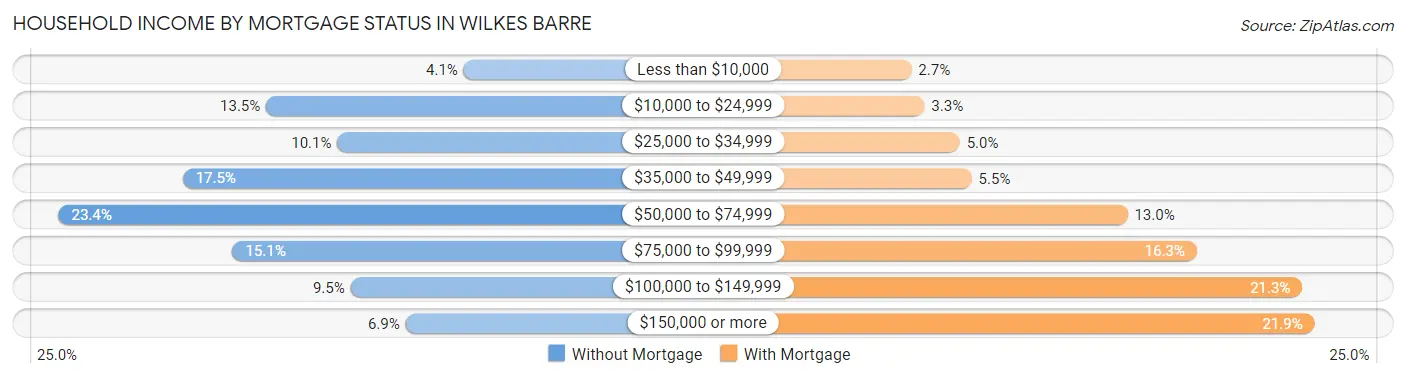
| Household Income | Without Mortgage | With Mortgage |
| Less than $10,000 | 164 (4.1%) | 103 (2.7%) |
| $10,000 to $24,999 | 541 (13.5%) | 127 (3.3%) |
| $25,000 to $34,999 | 405 (10.1%) | 192 (5.0%) |
| $35,000 to $49,999 | 700 (17.5%) | 214 (5.5%) |
| $50,000 to $74,999 | 937 (23.4%) | 501 (13.0%) |
| $75,000 to $99,999 | 605 (15.1%) | 629 (16.3%) |
| $100,000 to $149,999 | 380 (9.5%) | 823 (21.3%) |
| $150,000 or more | 275 (6.9%) | 846 (21.9%) |
| Total | 4,007 (100.0%) | 3,870 (100.0%) |
Property Value to Household Income Ratio in Wilkes Barre
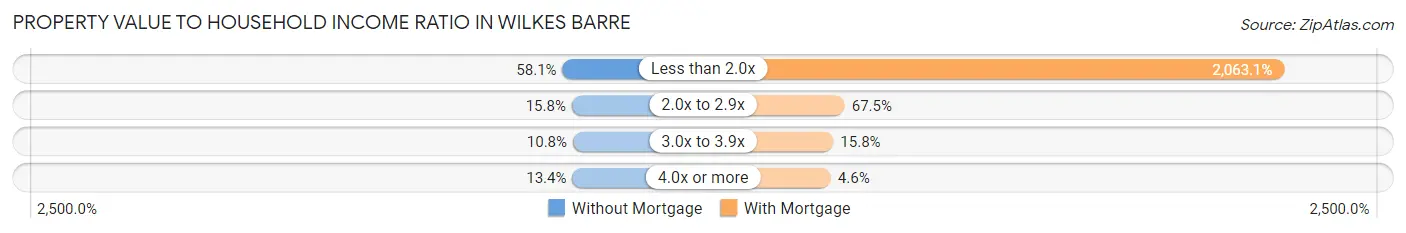
| Value-to-Income Ratio | Without Mortgage | With Mortgage |
| Less than 2.0x | 2,329 (58.1%) | 79,843 (2,063.1%) |
| 2.0x to 2.9x | 634 (15.8%) | 2,613 (67.5%) |
| 3.0x to 3.9x | 432 (10.8%) | 611 (15.8%) |
| 4.0x or more | 537 (13.4%) | 178 (4.6%) |
| Total | 4,007 (100.0%) | 3,870 (100.0%) |
Real Estate Taxes by Mortgage Status in Wilkes Barre
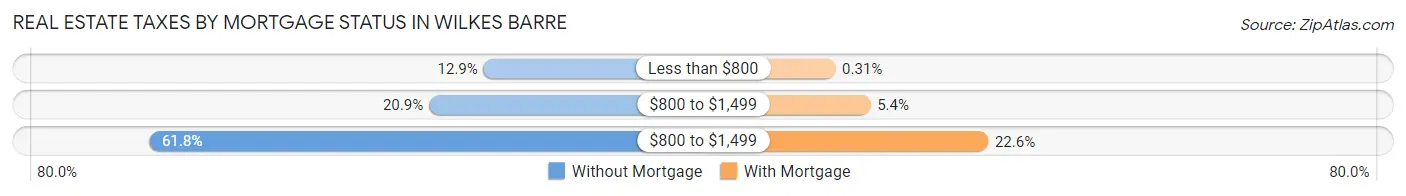
| Property Taxes | Without Mortgage | With Mortgage |
| Less than $800 | 518 (12.9%) | 12 (0.3%) |
| $800 to $1,499 | 838 (20.9%) | 210 (5.4%) |
| $800 to $1,499 | 2,477 (61.8%) | 876 (22.6%) |
| Total | 4,007 (100.0%) | 3,870 (100.0%) |
Health & Disability in Wilkes Barre
Health Insurance Coverage by Age in Wilkes Barre
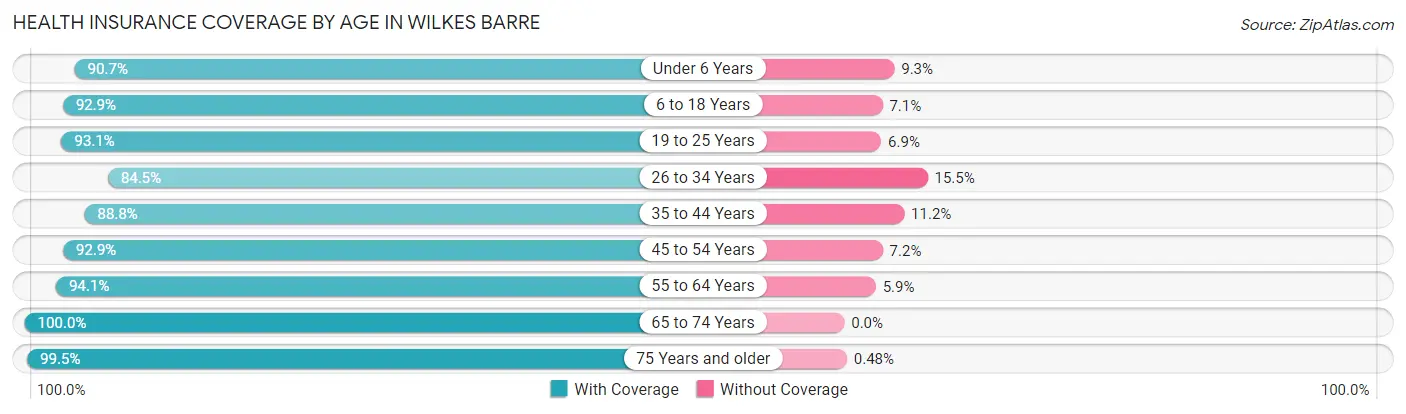
| Age Bracket | With Coverage | Without Coverage |
| Under 6 Years | 3,114 (90.7%) | 320 (9.3%) |
| 6 to 18 Years | 7,017 (92.9%) | 537 (7.1%) |
| 19 to 25 Years | 4,877 (93.1%) | 360 (6.9%) |
| 26 to 34 Years | 5,030 (84.5%) | 925 (15.5%) |
| 35 to 44 Years | 4,937 (88.8%) | 620 (11.2%) |
| 45 to 54 Years | 4,248 (92.8%) | 327 (7.1%) |
| 55 to 64 Years | 4,062 (94.1%) | 253 (5.9%) |
| 65 to 74 Years | 3,392 (100.0%) | 0 (0.0%) |
| 75 Years and older | 2,922 (99.5%) | 14 (0.5%) |
| Total | 39,599 (92.2%) | 3,356 (7.8%) |
Health Insurance Coverage by Citizenship Status in Wilkes Barre
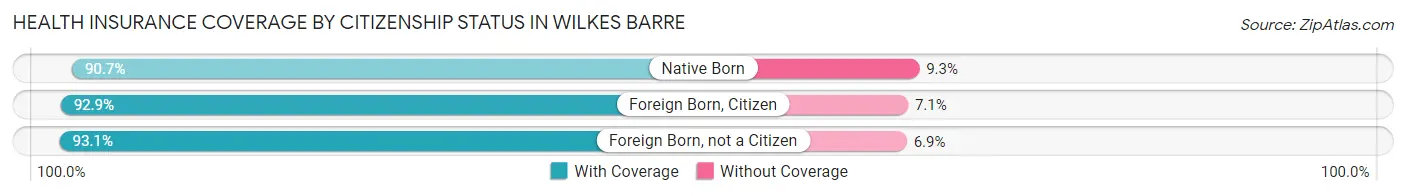
| Citizenship Status | With Coverage | Without Coverage |
| Native Born | 3,114 (90.7%) | 320 (9.3%) |
| Foreign Born, Citizen | 7,017 (92.9%) | 537 (7.1%) |
| Foreign Born, not a Citizen | 4,877 (93.1%) | 360 (6.9%) |
Health Insurance Coverage by Household Income in Wilkes Barre
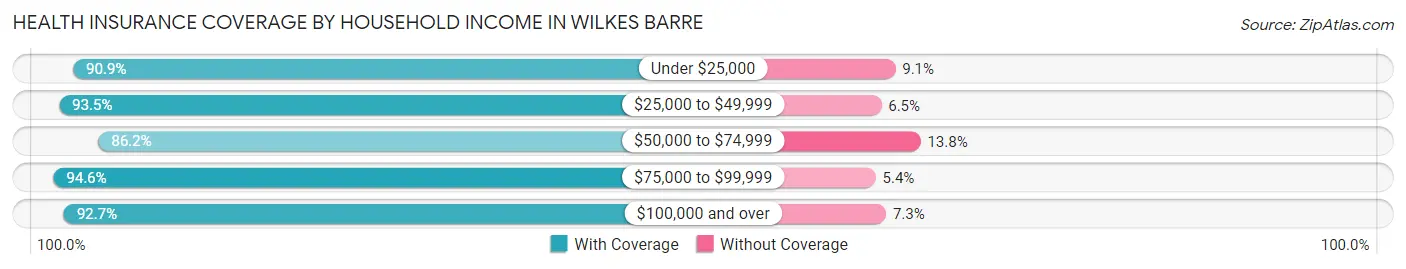
| Household Income | With Coverage | Without Coverage |
| Under $25,000 | 7,464 (90.9%) | 745 (9.1%) |
| $25,000 to $49,999 | 8,874 (93.5%) | 613 (6.5%) |
| $50,000 to $74,999 | 5,704 (86.2%) | 914 (13.8%) |
| $75,000 to $99,999 | 6,538 (94.6%) | 373 (5.4%) |
| $100,000 and over | 8,616 (92.7%) | 683 (7.3%) |
Public vs Private Health Insurance Coverage by Age in Wilkes Barre
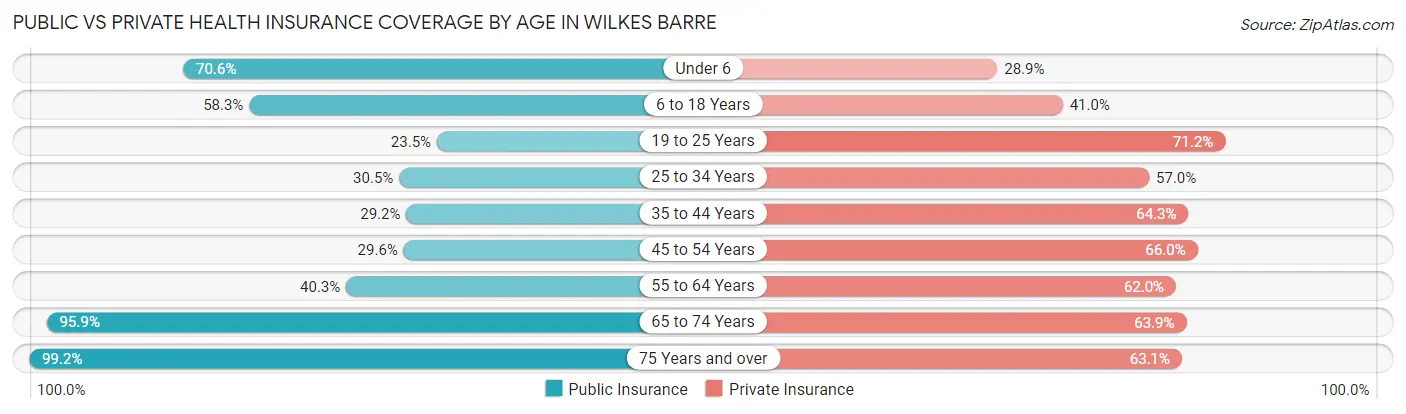
| Age Bracket | Public Insurance | Private Insurance |
| Under 6 | 2,424 (70.6%) | 991 (28.9%) |
| 6 to 18 Years | 4,405 (58.3%) | 3,097 (41.0%) |
| 19 to 25 Years | 1,229 (23.5%) | 3,726 (71.2%) |
| 25 to 34 Years | 1,815 (30.5%) | 3,397 (57.0%) |
| 35 to 44 Years | 1,620 (29.1%) | 3,574 (64.3%) |
| 45 to 54 Years | 1,356 (29.6%) | 3,021 (66.0%) |
| 55 to 64 Years | 1,740 (40.3%) | 2,676 (62.0%) |
| 65 to 74 Years | 3,254 (95.9%) | 2,169 (63.9%) |
| 75 Years and over | 2,912 (99.2%) | 1,853 (63.1%) |
| Total | 20,755 (48.3%) | 24,504 (57.1%) |
Disability Status by Sex by Age in Wilkes Barre
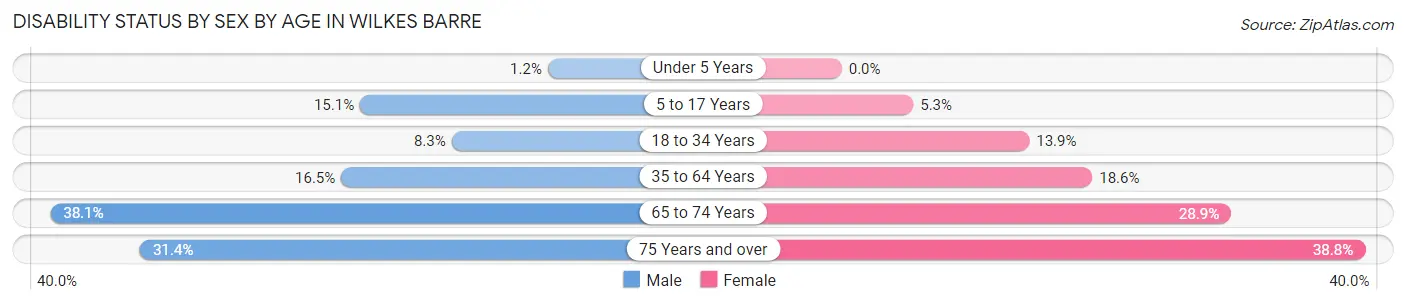
| Age Bracket | Male | Female |
| Under 5 Years | 14 (1.2%) | 0 (0.0%) |
| 5 to 17 Years | 528 (15.1%) | 189 (5.3%) |
| 18 to 34 Years | 505 (8.3%) | 853 (13.9%) |
| 35 to 64 Years | 1,195 (16.5%) | 1,340 (18.6%) |
| 65 to 74 Years | 633 (38.1%) | 500 (28.9%) |
| 75 Years and over | 358 (31.4%) | 698 (38.8%) |
Disability Class by Sex by Age in Wilkes Barre
Disability Class: Hearing Difficulty
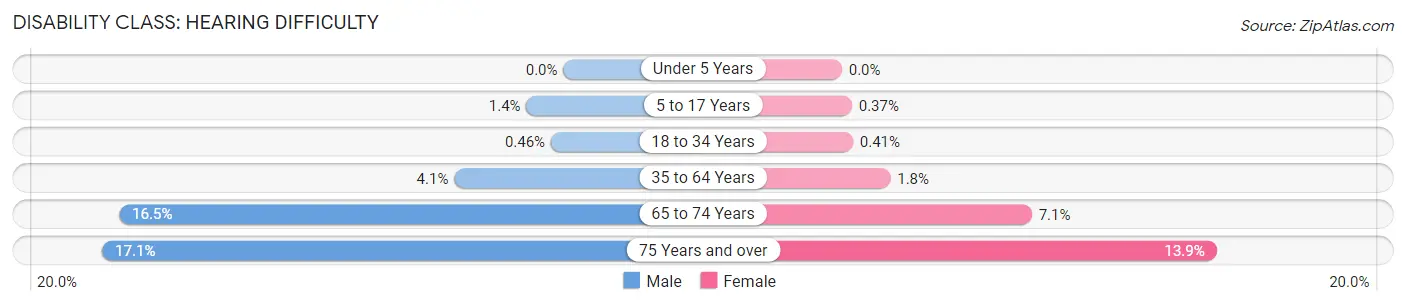
| Age Bracket | Male | Female |
| Under 5 Years | 0 (0.0%) | 0 (0.0%) |
| 5 to 17 Years | 48 (1.4%) | 13 (0.4%) |
| 18 to 34 Years | 28 (0.5%) | 25 (0.4%) |
| 35 to 64 Years | 293 (4.1%) | 130 (1.8%) |
| 65 to 74 Years | 274 (16.5%) | 122 (7.0%) |
| 75 Years and over | 195 (17.1%) | 250 (13.9%) |
Disability Class: Vision Difficulty
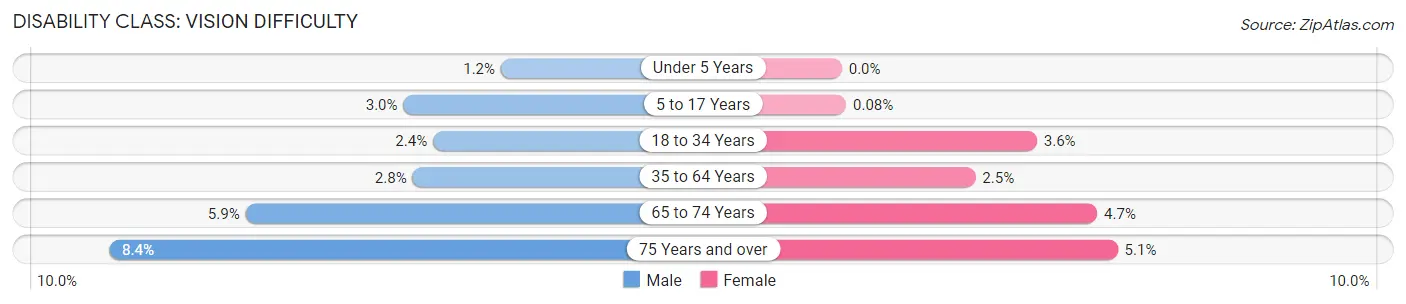
| Age Bracket | Male | Female |
| Under 5 Years | 14 (1.2%) | 0 (0.0%) |
| 5 to 17 Years | 104 (3.0%) | 3 (0.1%) |
| 18 to 34 Years | 147 (2.4%) | 222 (3.6%) |
| 35 to 64 Years | 203 (2.8%) | 179 (2.5%) |
| 65 to 74 Years | 98 (5.9%) | 82 (4.7%) |
| 75 Years and over | 96 (8.4%) | 92 (5.1%) |
Disability Class: Cognitive Difficulty
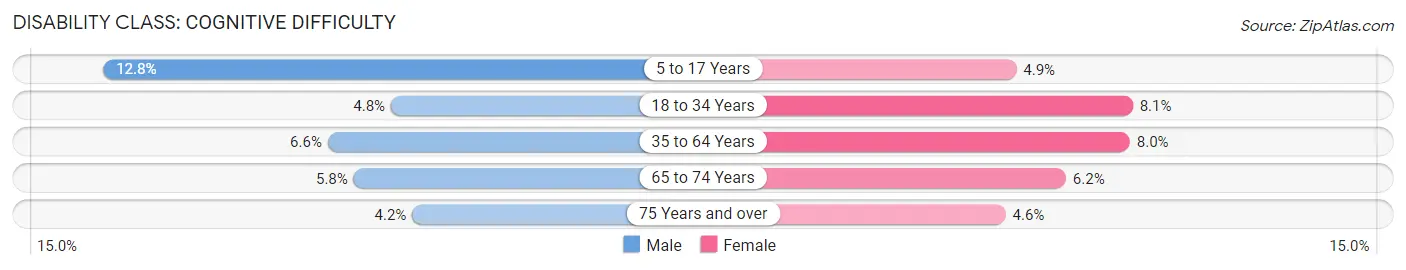
| Age Bracket | Male | Female |
| 5 to 17 Years | 448 (12.8%) | 173 (4.9%) |
| 18 to 34 Years | 292 (4.8%) | 496 (8.1%) |
| 35 to 64 Years | 475 (6.6%) | 578 (8.0%) |
| 65 to 74 Years | 97 (5.8%) | 108 (6.2%) |
| 75 Years and over | 48 (4.2%) | 82 (4.6%) |
Disability Class: Ambulatory Difficulty
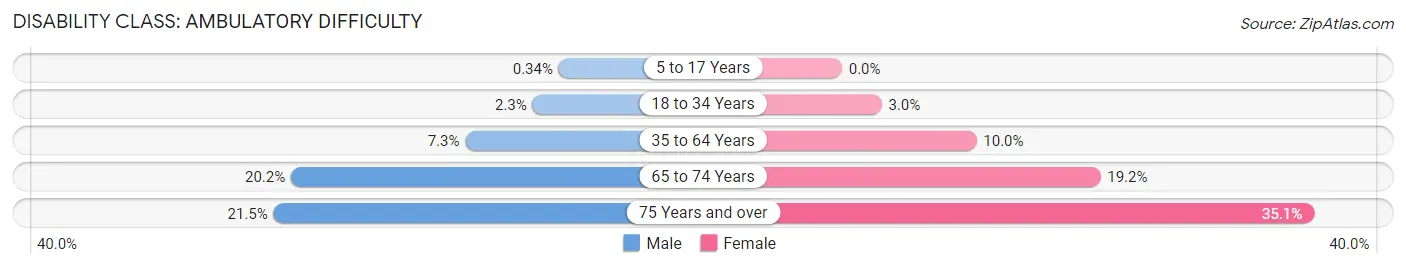
| Age Bracket | Male | Female |
| 5 to 17 Years | 12 (0.3%) | 0 (0.0%) |
| 18 to 34 Years | 139 (2.3%) | 181 (2.9%) |
| 35 to 64 Years | 527 (7.3%) | 720 (10.0%) |
| 65 to 74 Years | 336 (20.2%) | 332 (19.2%) |
| 75 Years and over | 245 (21.5%) | 630 (35.1%) |
Disability Class: Self-Care Difficulty
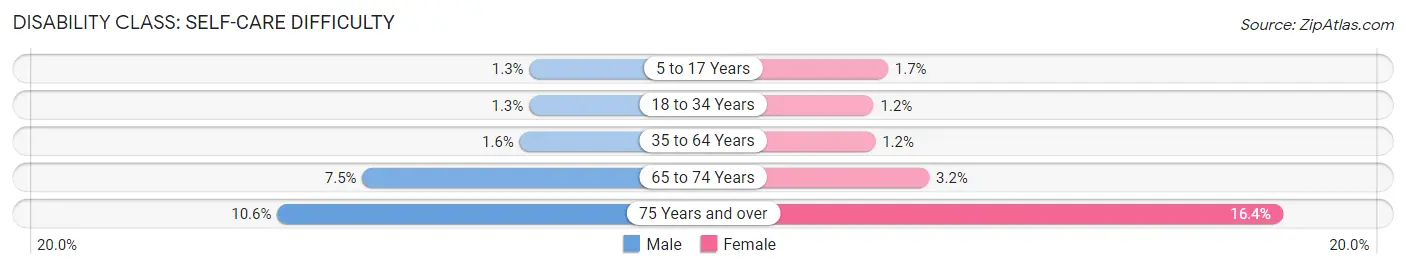
| Age Bracket | Male | Female |
| 5 to 17 Years | 44 (1.3%) | 61 (1.7%) |
| 18 to 34 Years | 77 (1.3%) | 72 (1.2%) |
| 35 to 64 Years | 117 (1.6%) | 89 (1.2%) |
| 65 to 74 Years | 124 (7.5%) | 56 (3.2%) |
| 75 Years and over | 121 (10.6%) | 294 (16.4%) |
Technology Access in Wilkes Barre
Computing Device Access in Wilkes Barre
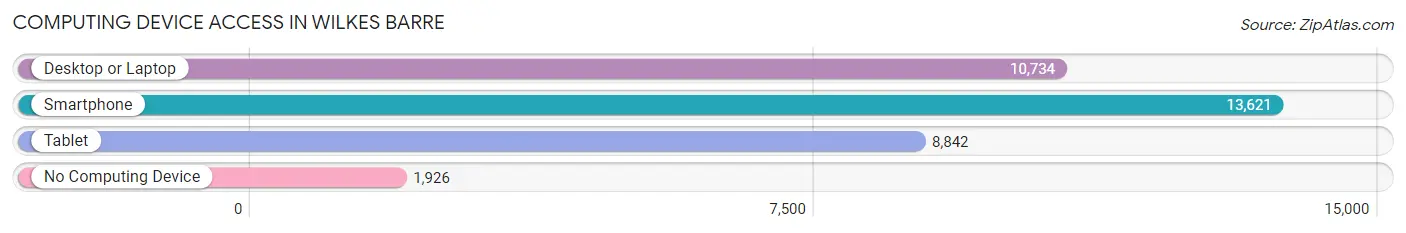
| Device Type | # Households | % Households |
| Desktop or Laptop | 10,734 | 65.2% |
| Smartphone | 13,621 | 82.8% |
| Tablet | 8,842 | 53.7% |
| No Computing Device | 1,926 | 11.7% |
| Total | 16,461 | 100.0% |
Internet Access in Wilkes Barre
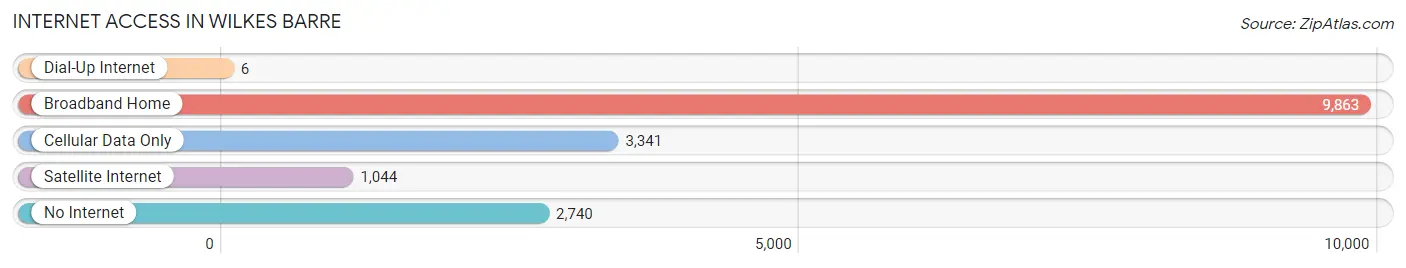
| Internet Type | # Households | % Households |
| Dial-Up Internet | 6 | 0.0% |
| Broadband Home | 9,863 | 59.9% |
| Cellular Data Only | 3,341 | 20.3% |
| Satellite Internet | 1,044 | 6.3% |
| No Internet | 2,740 | 16.7% |
| Total | 16,461 | 100.0% |
Wilkes Barre Summary
Wilkes-Barre, Pennsylvania is a city located in Luzerne County in the northeastern part of the state. It is the county seat and the largest city in the county. The city is situated at the confluence of the Susquehanna and Lackawanna Rivers and is part of the Wyoming Valley. Wilkes-Barre is the principal city of the Wilkes-Barre, PA Metropolitan Statistical Area, which includes all of Luzerne County. The population of Wilkes-Barre was 41,498 at the 2010 census.
History
The area that is now Wilkes-Barre was first settled in 1769 by John Durkee, a Connecticut settler. The area was originally part of Northampton County, but was later transferred to Luzerne County in 1786. The city was incorporated in 1806 and was named after John Wilkes and Isaac Barré, two British members of Parliament who opposed the Stamp Act of 1765.
The city was a major coal mining center during the 19th and 20th centuries. The city was also the site of the infamous Wyoming Massacre of 1778, in which a group of American settlers were killed by a band of Native Americans.
Geography
Wilkes-Barre is located at 41°15'N 75°52'W (41.25, -75.86). According to the United States Census Bureau, the city has a total area of 8.2 square miles (21.2 km2), of which 8.1 square miles (21.0 km2) is land and 0.1 square miles (0.2 km2) is water.
The city is located in the Wyoming Valley, which is part of the Ridge-and-Valley Appalachians. The city is situated at the confluence of the Susquehanna and Lackawanna Rivers. The city is located in the Northeastern Pennsylvania region, which is part of the Appalachian region.
Economy
Wilkes-Barre is the economic center of Luzerne County. The city is home to a number of major employers, including Geisinger Health System, Wilkes University, and King's College. The city is also home to a number of manufacturing companies, including Procter & Gamble, Unilever, and Nestle.
The city is also home to a number of retail stores, including the Wyoming Valley Mall, which is the largest shopping mall in the area. The city is also home to a number of restaurants, bars, and entertainment venues.
Demographics
As of the 2010 census, the population of Wilkes-Barre was 41,498. The racial makeup of the city was 87.2% White, 8.3% African American, 0.3% Native American, 1.2% Asian, 0.1% Pacific Islander, 0.7% from other races, and 2.4% from two or more races. Hispanic or Latino of any race were 3.2% of the population.
The median income for a household in the city was $35,945, and the median income for a family was $45,945. The per capita income for the city was $20,945. About 15.2% of families and 18.3% of the population were below the poverty line, including 28.3% of those under age 18 and 8.7% of those age 65 or over.
Common Questions
What is Per Capita Income in Wilkes Barre?
Per Capita income in Wilkes Barre is $23,995.
What is the Median Family Income in Wilkes Barre?
Median Family Income in Wilkes Barre is $57,047.
What is the Median Household income in Wilkes Barre?
Median Household Income in Wilkes Barre is $46,597.
What is Income or Wage Gap in Wilkes Barre?
Income or Wage Gap in Wilkes Barre is 26.0%.
Women in Wilkes Barre earn 74.0 cents for every dollar earned by a man.
What is Family Income Deficit in Wilkes Barre?
Family Income Deficit in Wilkes Barre is $12,945.
Families that are below poverty line in Wilkes Barre earn $12,945 less on average than the poverty threshold level.
What is Inequality or Gini Index in Wilkes Barre?
Inequality or Gini Index in Wilkes Barre is 0.45.
What is the Total Population of Wilkes Barre?
Total Population of Wilkes Barre is 44,123.
What is the Total Male Population of Wilkes Barre?
Total Male Population of Wilkes Barre is 21,616.
What is the Total Female Population of Wilkes Barre?
Total Female Population of Wilkes Barre is 22,507.
What is the Ratio of Males per 100 Females in Wilkes Barre?
There are 96.04 Males per 100 Females in Wilkes Barre.
What is the Ratio of Females per 100 Males in Wilkes Barre?
There are 104.12 Females per 100 Males in Wilkes Barre.
What is the Median Population Age in Wilkes Barre?
Median Population Age in Wilkes Barre is 34.3 Years.
What is the Average Family Size in Wilkes Barre
Average Family Size in Wilkes Barre is 3.1 People.
What is the Average Household Size in Wilkes Barre
Average Household Size in Wilkes Barre is 2.5 People.
How Large is the Labor Force in Wilkes Barre?
There are 20,214 People in the Labor Forcein in Wilkes Barre.
What is the Percentage of People in the Labor Force in Wilkes Barre?
56.9% of People are in the Labor Force in Wilkes Barre.
What is the Unemployment Rate in Wilkes Barre?
Unemployment Rate in Wilkes Barre is 8.4%.