Jacksonville, FL Map & Demographics
Jacksonville Map
Jacksonville Overview
$35,870
PER CAPITA INCOME
$77,309
AVG FAMILY INCOME
$64,138
AVG HOUSEHOLD INCOME
21.9%
WAGE / INCOME GAP [ % ]
78.1¢/ $1
WAGE / INCOME GAP [ $ ]
$10,997
FAMILY INCOME DEFICIT
0.47
INEQUALITY / GINI INDEX
950,203
TOTAL POPULATION
461,833
MALE POPULATION
488,370
FEMALE POPULATION
94.57
MALES / 100 FEMALES
105.75
FEMALES / 100 MALES
36.3
MEDIAN AGE
3.1
AVG FAMILY SIZE
2.5
AVG HOUSEHOLD SIZE
496,812
LABOR FORCE [ PEOPLE ]
65.6%
PERCENT IN LABOR FORCE
4.8%
UNEMPLOYMENT RATE
Jacksonville Zip Codes
Jacksonville Area Codes
Income in Jacksonville
Income Overview in Jacksonville
Per Capita Income in Jacksonville is $35,870, while median incomes of families and households are $77,309 and $64,138 respectively.
| Characteristic | Number | Measure |
| Per Capita Income | 950,203 | $35,870 |
| Median Family Income | 228,014 | $77,309 |
| Mean Family Income | 228,014 | $102,485 |
| Median Household Income | 375,851 | $64,138 |
| Mean Household Income | 375,851 | $87,378 |
| Income Deficit | 228,014 | $10,997 |
| Wage / Income Gap (%) | 950,203 | 21.86% |
| Wage / Income Gap ($) | 950,203 | 78.14¢ per $1 |
| Gini / Inequality Index | 950,203 | 0.47 |
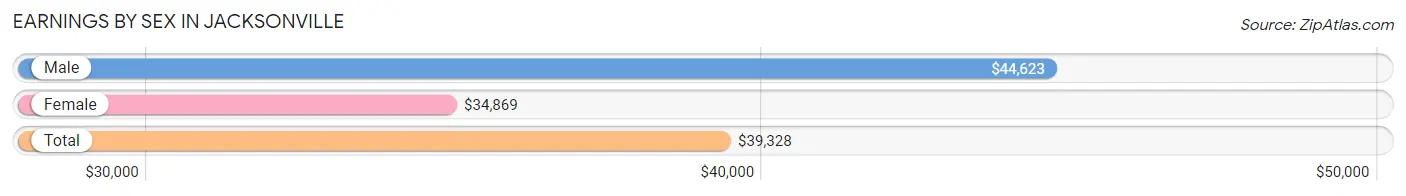
Earnings by Sex in Jacksonville
Average Earnings in Jacksonville are $39,328, $44,623 for men and $34,869 for women, a difference of 21.9%.
| Sex | Number | Average Earnings |
| Male | 266,309 (52.0%) | $44,623 |
| Female | 245,397 (48.0%) | $34,869 |
| Total | 511,706 (100.0%) | $39,328 |
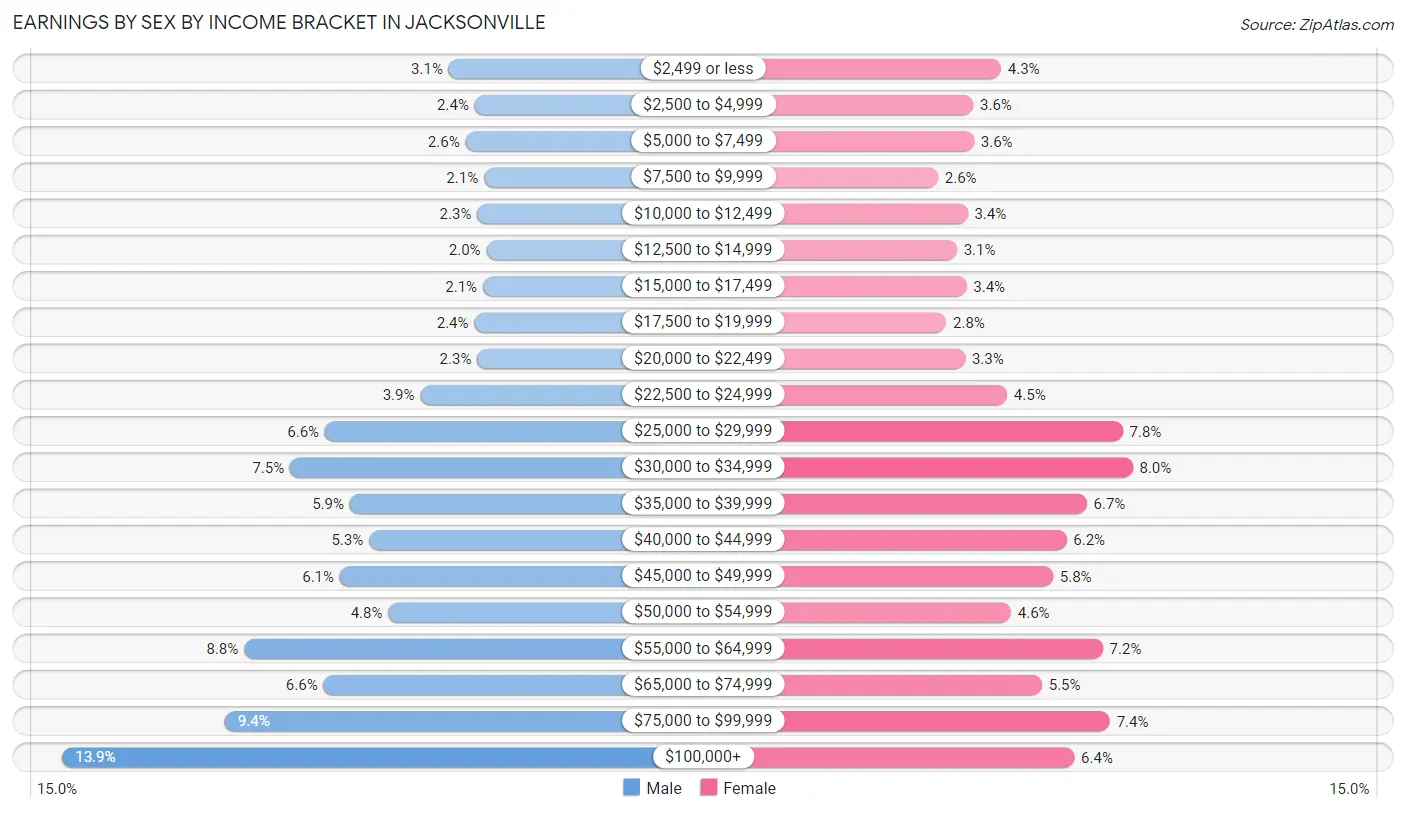
Earnings by Sex by Income Bracket in Jacksonville
The most common earnings brackets in Jacksonville are $100,000+ for men (37,119 | 13.9%) and $30,000 to $34,999 for women (19,703 | 8.0%).
| Income | Male | Female |
| $2,499 or less | 8,213 (3.1%) | 10,636 (4.3%) |
| $2,500 to $4,999 | 6,271 (2.4%) | 8,723 (3.5%) |
| $5,000 to $7,499 | 6,945 (2.6%) | 8,768 (3.6%) |
| $7,500 to $9,999 | 5,554 (2.1%) | 6,274 (2.6%) |
| $10,000 to $12,499 | 6,081 (2.3%) | 8,328 (3.4%) |
| $12,500 to $14,999 | 5,383 (2.0%) | 7,577 (3.1%) |
| $15,000 to $17,499 | 5,634 (2.1%) | 8,241 (3.4%) |
| $17,500 to $19,999 | 6,282 (2.4%) | 6,858 (2.8%) |
| $20,000 to $22,499 | 6,071 (2.3%) | 8,137 (3.3%) |
| $22,500 to $24,999 | 10,332 (3.9%) | 11,039 (4.5%) |
| $25,000 to $29,999 | 17,469 (6.6%) | 19,011 (7.7%) |
| $30,000 to $34,999 | 20,078 (7.5%) | 19,703 (8.0%) |
| $35,000 to $39,999 | 15,596 (5.9%) | 16,533 (6.7%) |
| $40,000 to $44,999 | 14,158 (5.3%) | 15,132 (6.2%) |
| $45,000 to $49,999 | 16,363 (6.1%) | 14,207 (5.8%) |
| $50,000 to $54,999 | 12,723 (4.8%) | 11,318 (4.6%) |
| $55,000 to $64,999 | 23,509 (8.8%) | 17,652 (7.2%) |
| $65,000 to $74,999 | 17,565 (6.6%) | 13,458 (5.5%) |
| $75,000 to $99,999 | 24,963 (9.4%) | 18,125 (7.4%) |
| $100,000+ | 37,119 (13.9%) | 15,677 (6.4%) |
| Total | 266,309 (100.0%) | 245,397 (100.0%) |
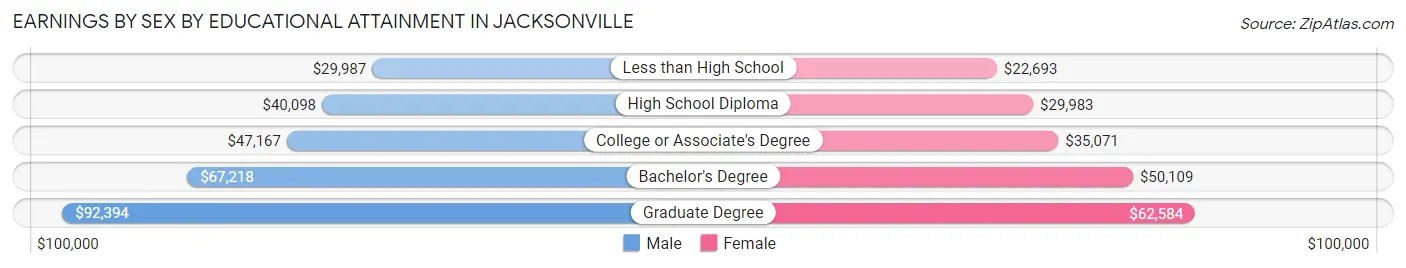
Earnings by Sex by Educational Attainment in Jacksonville
Average earnings in Jacksonville are $49,047 for men and $38,740 for women, a difference of 21.0%. Men with an educational attainment of graduate degree enjoy the highest average annual earnings of $92,394, while those with less than high school education earn the least with $29,987. Women with an educational attainment of graduate degree earn the most with the average annual earnings of $62,584, while those with less than high school education have the smallest earnings of $22,693.
| Educational Attainment | Male Income | Female Income |
| Less than High School | $29,987 | $22,693 |
| High School Diploma | $40,098 | $29,983 |
| College or Associate's Degree | $47,167 | $35,071 |
| Bachelor's Degree | $67,218 | $50,109 |
| Graduate Degree | $92,394 | $62,584 |
| Total | $49,047 | $38,740 |
Family Income in Jacksonville
Family Income Brackets in Jacksonville
According to the Jacksonville family income data, there are 42,639 families falling into the $100,000 to $149,999 income range, which is the most common income bracket and makes up 18.7% of all families. Conversely, the $10,000 to $14,999 income bracket is the least frequent group with only 5,244 families (2.3%) belonging to this category.
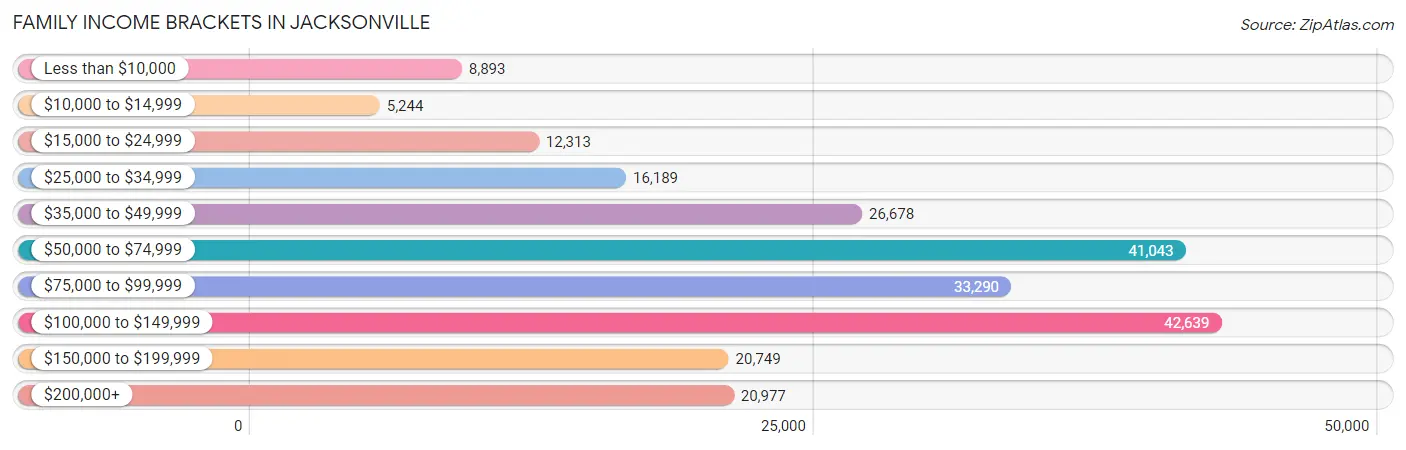
| Income Bracket | # Families | % Families |
| Less than $10,000 | 8,893 | 3.9% |
| $10,000 to $14,999 | 5,244 | 2.3% |
| $15,000 to $24,999 | 12,313 | 5.4% |
| $25,000 to $34,999 | 16,189 | 7.1% |
| $35,000 to $49,999 | 26,678 | 11.7% |
| $50,000 to $74,999 | 41,043 | 18.0% |
| $75,000 to $99,999 | 33,290 | 14.6% |
| $100,000 to $149,999 | 42,639 | 18.7% |
| $150,000 to $199,999 | 20,749 | 9.1% |
| $200,000+ | 20,977 | 9.2% |
Family Income by Famaliy Size in Jacksonville
4-person families (36,605 | 16.1%) account for the highest median family income in Jacksonville with $96,236 per family, while 2-person families (109,722 | 48.1%) have the highest median income of $35,966 per family member.
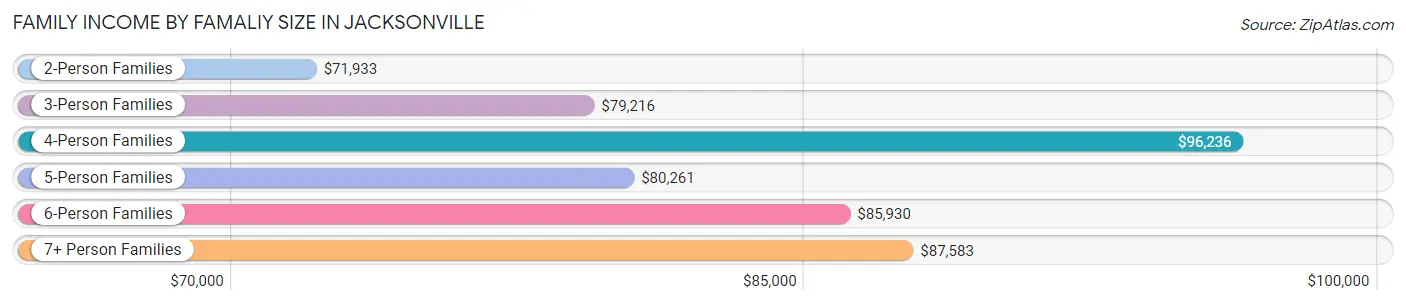
| Income Bracket | # Families | Median Income |
| 2-Person Families | 109,722 (48.1%) | $71,933 |
| 3-Person Families | 57,192 (25.1%) | $79,216 |
| 4-Person Families | 36,605 (16.1%) | $96,236 |
| 5-Person Families | 15,722 (6.9%) | $80,261 |
| 6-Person Families | 5,805 (2.5%) | $85,930 |
| 7+ Person Families | 2,968 (1.3%) | $87,583 |
| Total | 228,014 (100.0%) | $77,309 |
Family Income by Number of Earners in Jacksonville
The median family income in Jacksonville is $77,309, with families comprising 3+ earners (21,652) having the highest median family income of $130,882, while families with no earners (30,534) have the lowest median family income of $38,744, accounting for 9.5% and 13.4% of families, respectively.
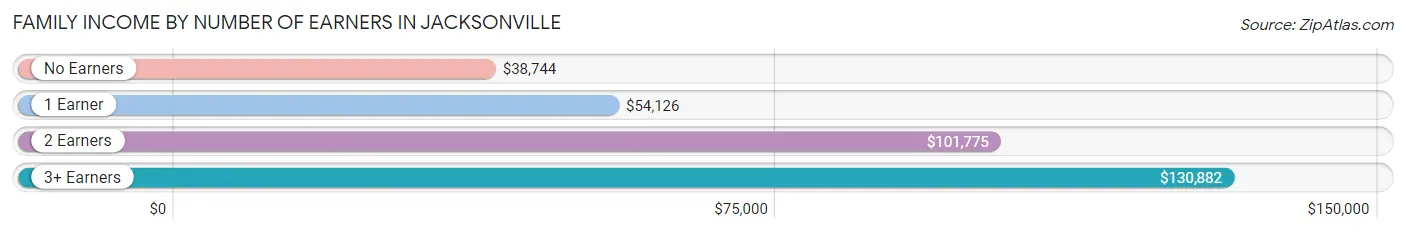
| Number of Earners | # Families | Median Income |
| No Earners | 30,534 (13.4%) | $38,744 |
| 1 Earner | 84,213 (36.9%) | $54,126 |
| 2 Earners | 91,615 (40.2%) | $101,775 |
| 3+ Earners | 21,652 (9.5%) | $130,882 |
| Total | 228,014 (100.0%) | $77,309 |
Household Income in Jacksonville
Household Income Brackets in Jacksonville
With 68,781 households falling in the category, the $50,000 to $74,999 income range is the most frequent in Jacksonville, accounting for 18.3% of all households. In contrast, only 15,034 households (4.0%) fall into the $10,000 to $14,999 income bracket, making it the least populous group.
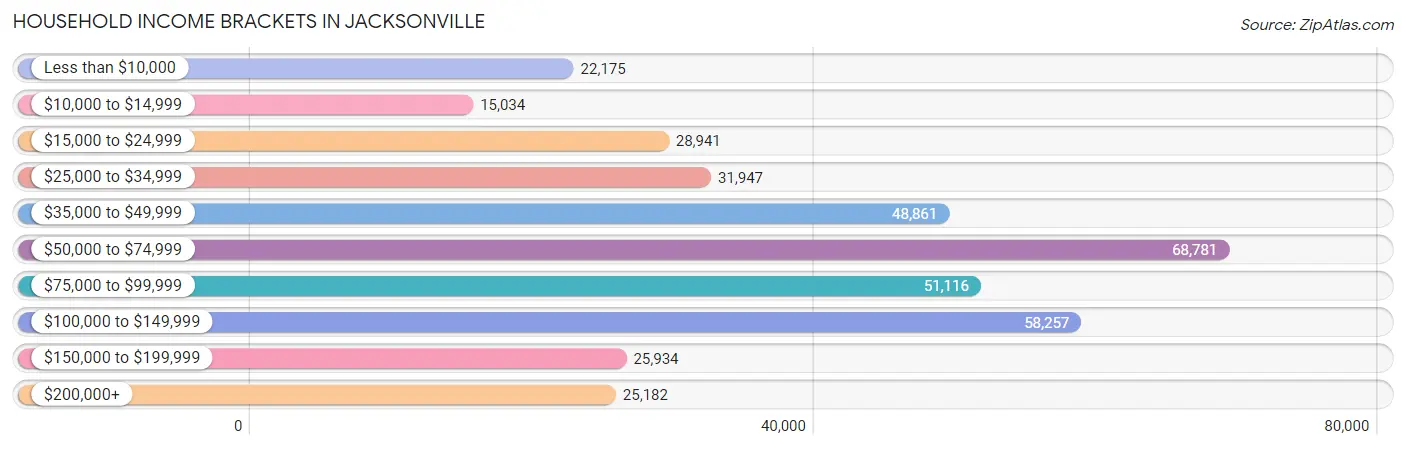
| Income Bracket | # Households | % Households |
| Less than $10,000 | 22,175 | 5.9% |
| $10,000 to $14,999 | 15,034 | 4.0% |
| $15,000 to $24,999 | 28,941 | 7.7% |
| $25,000 to $34,999 | 31,947 | 8.5% |
| $35,000 to $49,999 | 48,861 | 13.0% |
| $50,000 to $74,999 | 68,781 | 18.3% |
| $75,000 to $99,999 | 51,116 | 13.6% |
| $100,000 to $149,999 | 58,257 | 15.5% |
| $150,000 to $199,999 | 25,934 | 6.9% |
| $200,000+ | 25,182 | 6.7% |
Household Income by Householder Age in Jacksonville
The median household income in Jacksonville is $64,138, with the highest median household income of $76,399 found in the 45 to 64 years age bracket for the primary householder. A total of 133,472 households (35.5%) fall into this category. Meanwhile, the 15 to 24 years age bracket for the primary householder has the lowest median household income of $40,277, with 16,170 households (4.3%) in this group.
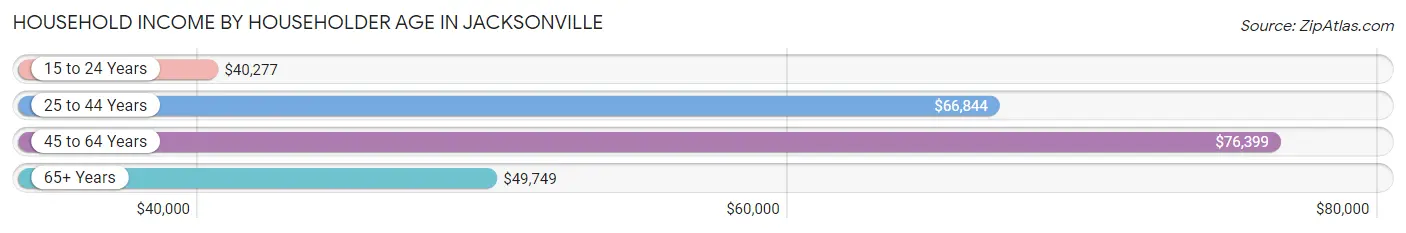
| Income Bracket | # Households | Median Income |
| 15 to 24 Years | 16,170 (4.3%) | $40,277 |
| 25 to 44 Years | 141,668 (37.7%) | $66,844 |
| 45 to 64 Years | 133,472 (35.5%) | $76,399 |
| 65+ Years | 84,541 (22.5%) | $49,749 |
| Total | 375,851 (100.0%) | $64,138 |
Poverty in Jacksonville
Income Below Poverty by Sex and Age in Jacksonville
With 13.2% poverty level for males and 16.2% for females among the residents of Jacksonville, 12 to 14 year old males and under 5 year old females are the most vulnerable to poverty, with 4,345 males (23.0%) and 7,022 females (23.4%) in their respective age groups living below the poverty level.
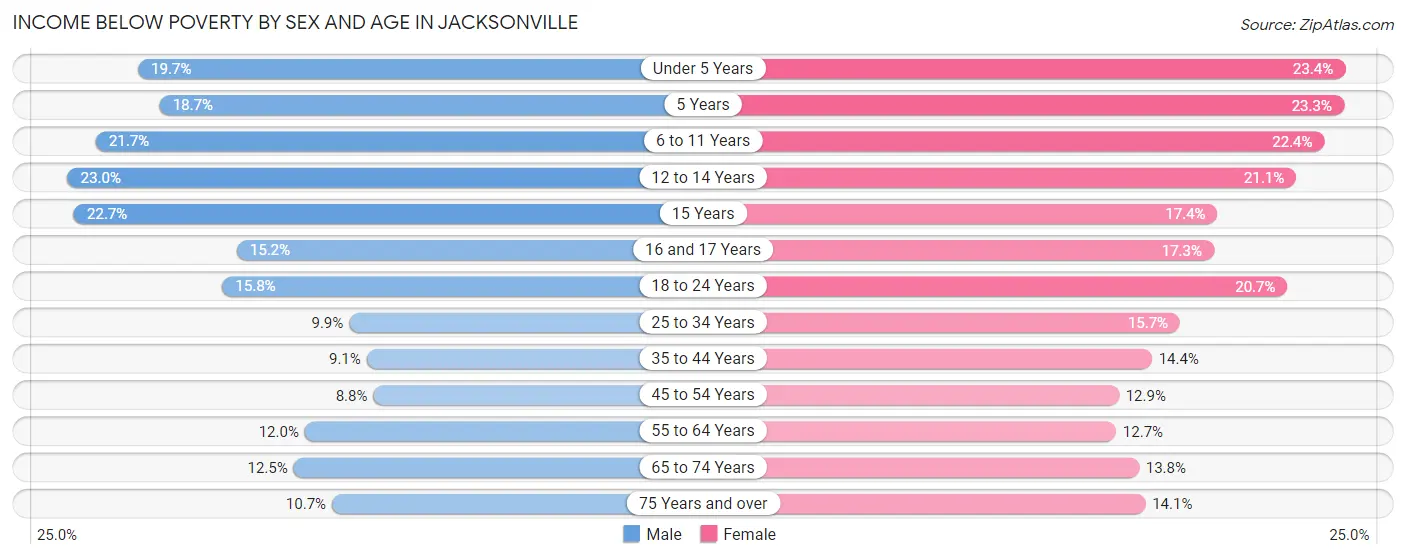
| Age Bracket | Male | Female |
| Under 5 Years | 6,222 (19.7%) | 7,022 (23.4%) |
| 5 Years | 1,102 (18.7%) | 1,531 (23.3%) |
| 6 to 11 Years | 7,608 (21.7%) | 7,442 (22.4%) |
| 12 to 14 Years | 4,345 (23.0%) | 3,764 (21.1%) |
| 15 Years | 1,168 (22.7%) | 1,021 (17.4%) |
| 16 and 17 Years | 1,738 (15.1%) | 1,808 (17.3%) |
| 18 to 24 Years | 5,932 (15.8%) | 7,736 (20.7%) |
| 25 to 34 Years | 7,500 (9.9%) | 12,088 (15.7%) |
| 35 to 44 Years | 5,532 (9.1%) | 9,078 (14.4%) |
| 45 to 54 Years | 4,830 (8.8%) | 7,477 (12.9%) |
| 55 to 64 Years | 6,728 (12.0%) | 7,866 (12.7%) |
| 65 to 74 Years | 4,636 (12.5%) | 6,240 (13.8%) |
| 75 Years and over | 2,130 (10.7%) | 4,298 (14.1%) |
| Total | 59,471 (13.2%) | 77,371 (16.2%) |
Income Above Poverty by Sex and Age in Jacksonville
According to the poverty statistics in Jacksonville, males aged 45 to 54 years and females aged 55 to 64 years are the age groups that are most secure financially, with 91.2% of males and 87.3% of females in these age groups living above the poverty line.
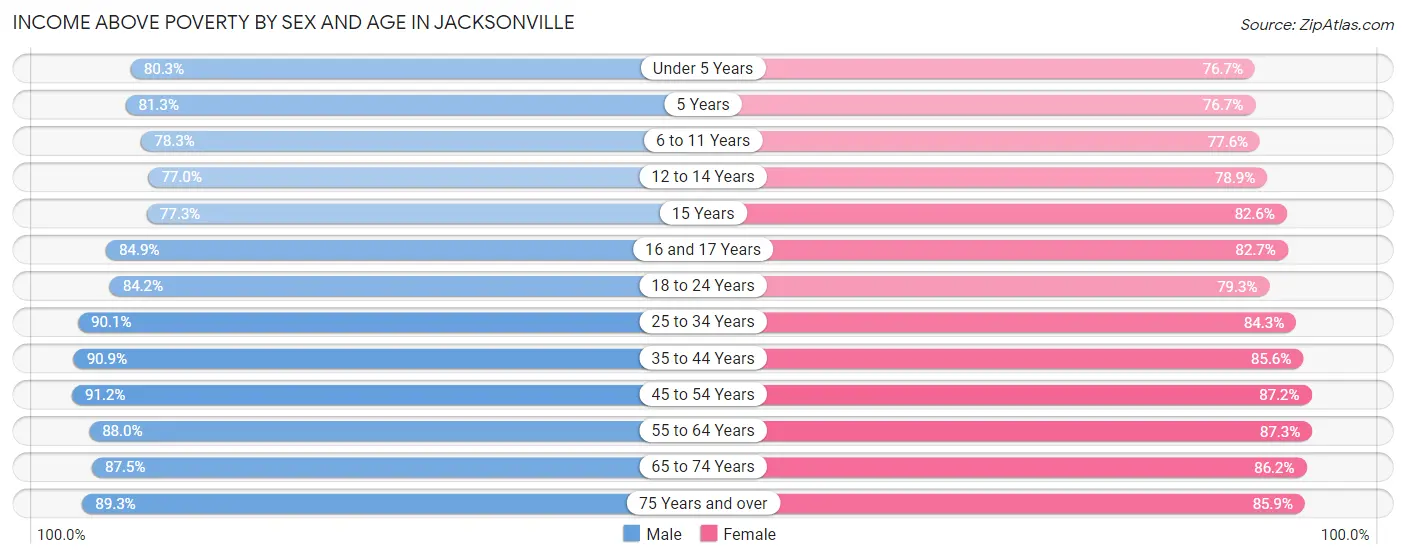
| Age Bracket | Male | Female |
| Under 5 Years | 25,307 (80.3%) | 23,045 (76.6%) |
| 5 Years | 4,783 (81.3%) | 5,043 (76.7%) |
| 6 to 11 Years | 27,476 (78.3%) | 25,796 (77.6%) |
| 12 to 14 Years | 14,546 (77.0%) | 14,094 (78.9%) |
| 15 Years | 3,975 (77.3%) | 4,838 (82.6%) |
| 16 and 17 Years | 9,731 (84.9%) | 8,665 (82.7%) |
| 18 to 24 Years | 31,554 (84.2%) | 29,691 (79.3%) |
| 25 to 34 Years | 67,967 (90.1%) | 64,938 (84.3%) |
| 35 to 44 Years | 55,079 (90.9%) | 54,060 (85.6%) |
| 45 to 54 Years | 49,920 (91.2%) | 50,723 (87.2%) |
| 55 to 64 Years | 49,320 (88.0%) | 53,962 (87.3%) |
| 65 to 74 Years | 32,400 (87.5%) | 39,058 (86.2%) |
| 75 Years and over | 17,709 (89.3%) | 26,217 (85.9%) |
| Total | 389,767 (86.8%) | 400,130 (83.8%) |
Income Below Poverty Among Married-Couple Families in Jacksonville
The poverty statistics for married-couple families in Jacksonville show that 5.4% or 8,087 of the total 150,471 families live below the poverty line. Families with 5 or more children have the highest poverty rate of 21.7%, comprising of 232 families. On the other hand, families with no children have the lowest poverty rate of 4.4%, which includes 3,983 families.
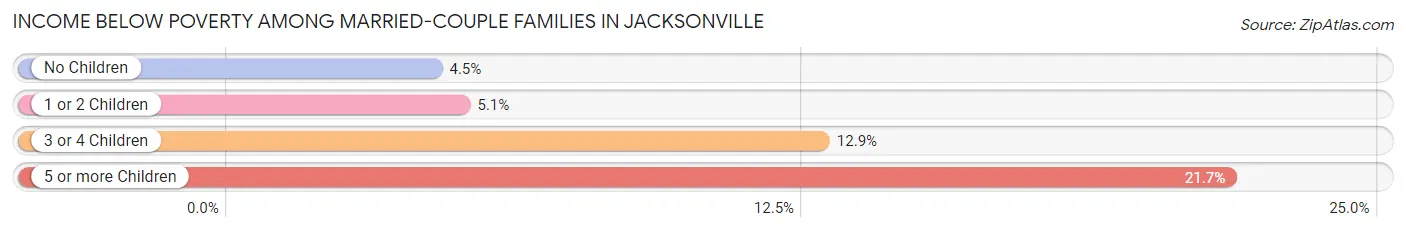
| Children | Above Poverty | Below Poverty |
| No Children | 85,506 (95.6%) | 3,983 (4.4%) |
| 1 or 2 Children | 46,673 (94.9%) | 2,487 (5.1%) |
| 3 or 4 Children | 9,370 (87.1%) | 1,385 (12.9%) |
| 5 or more Children | 835 (78.3%) | 232 (21.7%) |
| Total | 142,384 (94.6%) | 8,087 (5.4%) |
Income Below Poverty Among Single-Parent Households in Jacksonville
According to the poverty data in Jacksonville, 12.2% or 2,451 single-father households and 25.3% or 14,497 single-mother households are living below the poverty line. Among single-father households, those with 5 or more children have the highest poverty rate, with 147 households (56.3%) experiencing poverty. Likewise, among single-mother households, those with 5 or more children have the highest poverty rate, with 638 households (71.6%) falling below the poverty line.
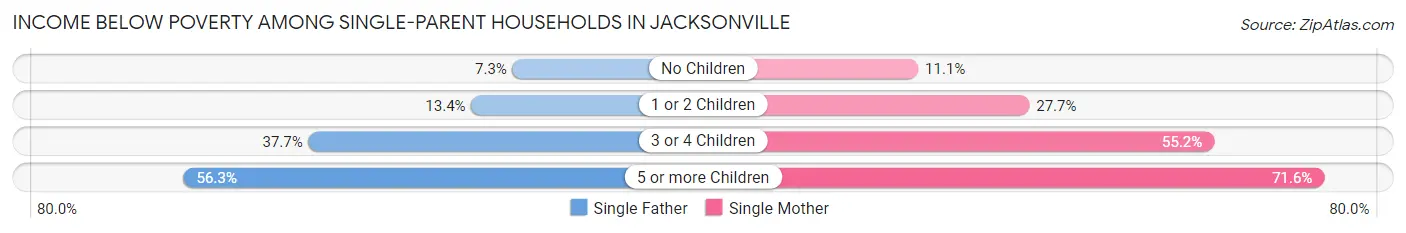
| Children | Single Father | Single Mother |
| No Children | 765 (7.3%) | 2,281 (11.1%) |
| 1 or 2 Children | 1,104 (13.4%) | 8,293 (27.7%) |
| 3 or 4 Children | 435 (37.7%) | 3,285 (55.2%) |
| 5 or more Children | 147 (56.3%) | 638 (71.6%) |
| Total | 2,451 (12.2%) | 14,497 (25.3%) |
Income Below Poverty Among Married-Couple vs Single-Parent Households in Jacksonville
The poverty data for Jacksonville shows that 8,087 of the married-couple family households (5.4%) and 16,948 of the single-parent households (21.9%) are living below the poverty level. Within the married-couple family households, those with 5 or more children have the highest poverty rate, with 232 households (21.7%) falling below the poverty line. Among the single-parent households, those with 5 or more children have the highest poverty rate, with 785 household (68.1%) living below poverty.
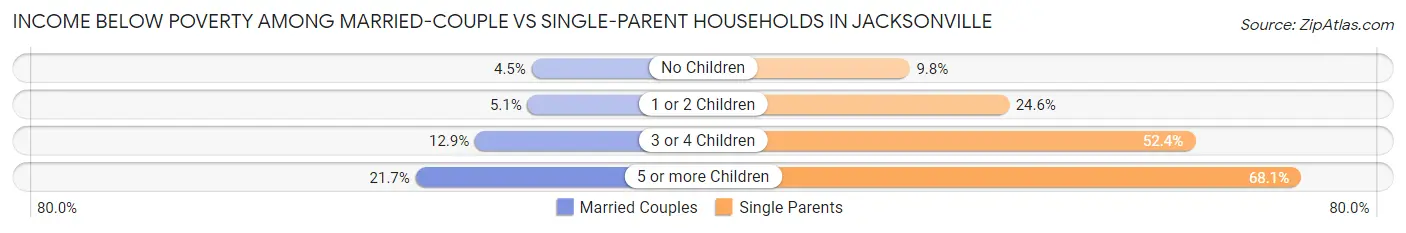
| Children | Married-Couple Families | Single-Parent Households |
| No Children | 3,983 (4.4%) | 3,046 (9.8%) |
| 1 or 2 Children | 2,487 (5.1%) | 9,397 (24.6%) |
| 3 or 4 Children | 1,385 (12.9%) | 3,720 (52.3%) |
| 5 or more Children | 232 (21.7%) | 785 (68.1%) |
| Total | 8,087 (5.4%) | 16,948 (21.9%) |
Race in Jacksonville
The most populous races in Jacksonville are White / Caucasian (504,534 | 53.1%), Black / African American (289,093 | 30.4%), and Hispanic or Latino (107,028 | 11.3%).
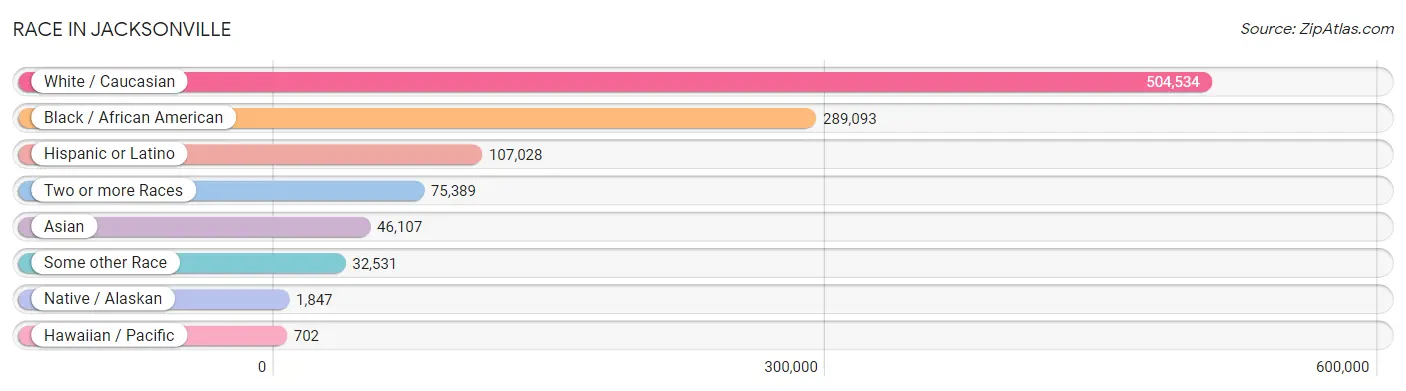
| Race | # Population | % Population |
| Asian | 46,107 | 4.9% |
| Black / African American | 289,093 | 30.4% |
| Hawaiian / Pacific | 702 | 0.1% |
| Hispanic or Latino | 107,028 | 11.3% |
| Native / Alaskan | 1,847 | 0.2% |
| White / Caucasian | 504,534 | 53.1% |
| Two or more Races | 75,389 | 7.9% |
| Some other Race | 32,531 | 3.4% |
| Total | 950,203 | 100.0% |
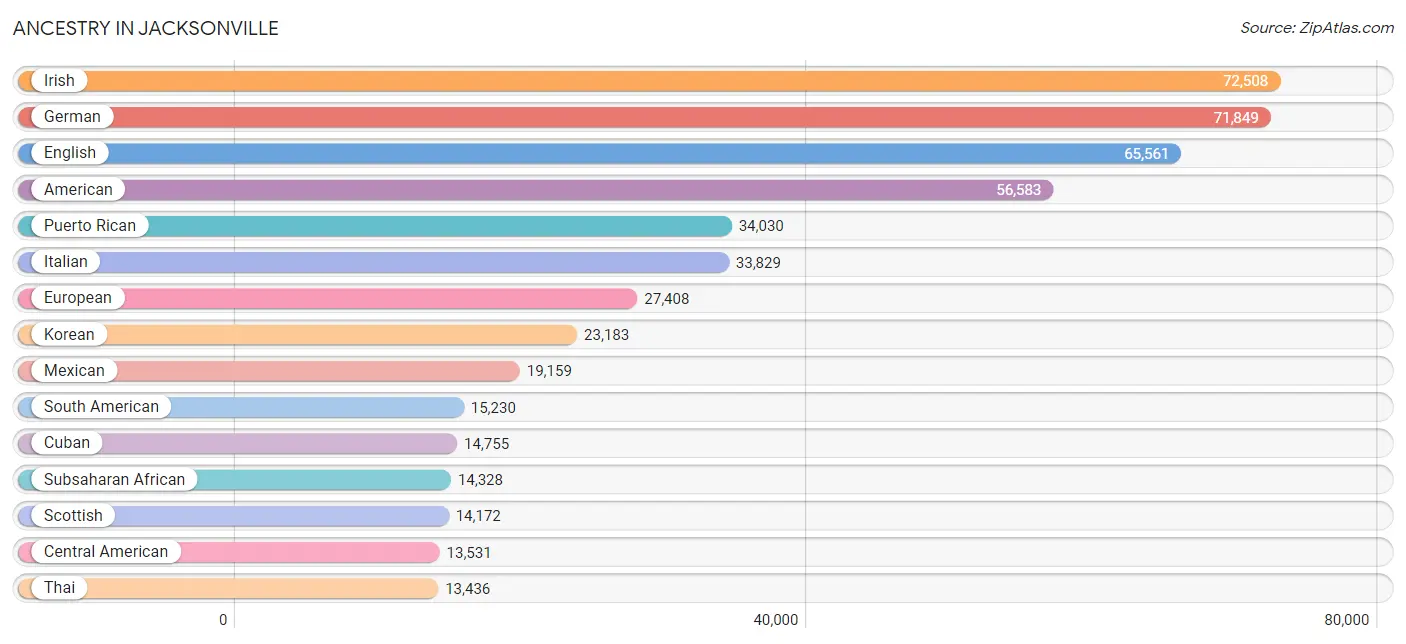
Ancestry in Jacksonville
The most populous ancestries reported in Jacksonville are Irish (72,508 | 7.6%), German (71,849 | 7.6%), English (65,561 | 6.9%), American (56,583 | 5.9%), and Puerto Rican (34,030 | 3.6%), together accounting for 31.6% of all Jacksonville residents.
| Ancestry | # Population | % Population |
| Afghan | 402 | 0.0% |
| African | 9,276 | 1.0% |
| Alaska Native | 12 | 0.0% |
| Alaskan Athabascan | 215 | 0.0% |
| Albanian | 3,807 | 0.4% |
| Alsatian | 8 | 0.0% |
| American | 56,583 | 5.9% |
| Apache | 186 | 0.0% |
| Arab | 11,324 | 1.2% |
| Argentinean | 849 | 0.1% |
| Armenian | 146 | 0.0% |
| Australian | 244 | 0.0% |
| Austrian | 1,055 | 0.1% |
| Bahamian | 641 | 0.1% |
| Bangladeshi | 29 | 0.0% |
| Barbadian | 245 | 0.0% |
| Basque | 34 | 0.0% |
| Belgian | 209 | 0.0% |
| Belizean | 201 | 0.0% |
| Bhutanese | 2,446 | 0.3% |
| Blackfeet | 416 | 0.0% |
| Bolivian | 357 | 0.0% |
| Brazilian | 3,810 | 0.4% |
| British | 5,189 | 0.5% |
| British West Indian | 316 | 0.0% |
| Bulgarian | 612 | 0.1% |
| Burmese | 1,833 | 0.2% |
| Cajun | 202 | 0.0% |
| Canadian | 1,226 | 0.1% |
| Cape Verdean | 224 | 0.0% |
| Celtic | 80 | 0.0% |
| Central American | 13,531 | 1.4% |
| Central American Indian | 1,276 | 0.1% |
| Cherokee | 2,553 | 0.3% |
| Chickasaw | 123 | 0.0% |
| Chilean | 433 | 0.1% |
| Chinese | 44 | 0.0% |
| Chippewa | 68 | 0.0% |
| Choctaw | 283 | 0.0% |
| Colombian | 5,057 | 0.5% |
| Comanche | 8 | 0.0% |
| Costa Rican | 615 | 0.1% |
| Creek | 320 | 0.0% |
| Croatian | 648 | 0.1% |
| Crow | 5 | 0.0% |
| Cuban | 14,755 | 1.5% |
| Cypriot | 50 | 0.0% |
| Czech | 1,391 | 0.2% |
| Czechoslovakian | 663 | 0.1% |
| Danish | 1,031 | 0.1% |
| Delaware | 14 | 0.0% |
| Dominican | 3,607 | 0.4% |
| Dutch | 5,037 | 0.5% |
| Eastern European | 1,596 | 0.2% |
| Ecuadorian | 1,092 | 0.1% |
| Egyptian | 1,098 | 0.1% |
| English | 65,561 | 6.9% |
| Estonian | 171 | 0.0% |
| Ethiopian | 646 | 0.1% |
| European | 27,408 | 2.9% |
| Filipino | 274 | 0.0% |
| Finnish | 739 | 0.1% |
| French | 12,319 | 1.3% |
| French American Indian | 47 | 0.0% |
| French Canadian | 3,093 | 0.3% |
| German | 71,849 | 7.6% |
| German Russian | 38 | 0.0% |
| Ghanaian | 235 | 0.0% |
| Greek | 2,741 | 0.3% |
| Guamanian / Chamorro | 490 | 0.1% |
| Guatemalan | 3,232 | 0.3% |
| Guyanese | 813 | 0.1% |
| Haitian | 7,464 | 0.8% |
| Honduran | 3,933 | 0.4% |
| Hungarian | 2,268 | 0.2% |
| Icelander | 91 | 0.0% |
| Indian (Asian) | 5,749 | 0.6% |
| Indonesian | 2,137 | 0.2% |
| Iranian | 884 | 0.1% |
| Iraqi | 864 | 0.1% |
| Irish | 72,508 | 7.6% |
| Iroquois | 175 | 0.0% |
| Israeli | 180 | 0.0% |
| Italian | 33,829 | 3.6% |
| Jamaican | 6,294 | 0.7% |
| Japanese | 1,593 | 0.2% |
| Jordanian | 512 | 0.1% |
| Kenyan | 95 | 0.0% |
| Kiowa | 3 | 0.0% |
| Korean | 23,183 | 2.4% |
| Laotian | 555 | 0.1% |
| Latvian | 63 | 0.0% |
| Lebanese | 1,847 | 0.2% |
| Liberian | 72 | 0.0% |
| Lithuanian | 777 | 0.1% |
| Lumbee | 52 | 0.0% |
| Luxembourger | 16 | 0.0% |
| Macedonian | 94 | 0.0% |
| Malaysian | 870 | 0.1% |
| Maltese | 53 | 0.0% |
| Mexican | 19,159 | 2.0% |
| Mexican American Indian | 171 | 0.0% |
| Mongolian | 14 | 0.0% |
| Moroccan | 289 | 0.0% |
| Native Hawaiian | 316 | 0.0% |
| Navajo | 82 | 0.0% |
| New Zealander | 229 | 0.0% |
| Nicaraguan | 1,499 | 0.2% |
| Nigerian | 1,819 | 0.2% |
| Northern European | 808 | 0.1% |
| Norwegian | 3,988 | 0.4% |
| Okinawan | 33 | 0.0% |
| Osage | 47 | 0.0% |
| Ottawa | 32 | 0.0% |
| Paiute | 6 | 0.0% |
| Pakistani | 964 | 0.1% |
| Palestinian | 293 | 0.0% |
| Panamanian | 2,336 | 0.3% |
| Paraguayan | 20 | 0.0% |
| Pennsylvania German | 113 | 0.0% |
| Peruvian | 1,342 | 0.1% |
| Polish | 13,189 | 1.4% |
| Portuguese | 2,405 | 0.3% |
| Potawatomi | 27 | 0.0% |
| Puerto Rican | 34,030 | 3.6% |
| Romanian | 1,673 | 0.2% |
| Russian | 3,974 | 0.4% |
| Salvadoran | 1,916 | 0.2% |
| Samoan | 241 | 0.0% |
| Scandinavian | 1,937 | 0.2% |
| Scotch-Irish | 8,525 | 0.9% |
| Scottish | 14,172 | 1.5% |
| Seminole | 185 | 0.0% |
| Serbian | 717 | 0.1% |
| Shoshone | 48 | 0.0% |
| Sierra Leonean | 62 | 0.0% |
| Sioux | 56 | 0.0% |
| Slavic | 441 | 0.1% |
| Slovak | 564 | 0.1% |
| Slovene | 64 | 0.0% |
| South African | 150 | 0.0% |
| South American | 15,230 | 1.6% |
| South American Indian | 66 | 0.0% |
| Soviet Union | 8 | 0.0% |
| Spaniard | 2,337 | 0.3% |
| Spanish | 1,680 | 0.2% |
| Spanish American | 30 | 0.0% |
| Spanish American Indian | 130 | 0.0% |
| Sri Lankan | 5,423 | 0.6% |
| Subsaharan African | 14,328 | 1.5% |
| Sudanese | 433 | 0.1% |
| Swedish | 5,421 | 0.6% |
| Swiss | 1,225 | 0.1% |
| Syrian | 3,476 | 0.4% |
| Thai | 13,436 | 1.4% |
| Trinidadian and Tobagonian | 707 | 0.1% |
| Turkish | 556 | 0.1% |
| U.S. Virgin Islander | 51 | 0.0% |
| Ugandan | 11 | 0.0% |
| Ukrainian | 2,508 | 0.3% |
| Uruguayan | 407 | 0.0% |
| Venezuelan | 5,473 | 0.6% |
| Vietnamese | 608 | 0.1% |
| Welsh | 4,782 | 0.5% |
| West Indian | 1,108 | 0.1% |
| Yugoslavian | 3,703 | 0.4% | View All 166 Rows |
Immigrants in Jacksonville
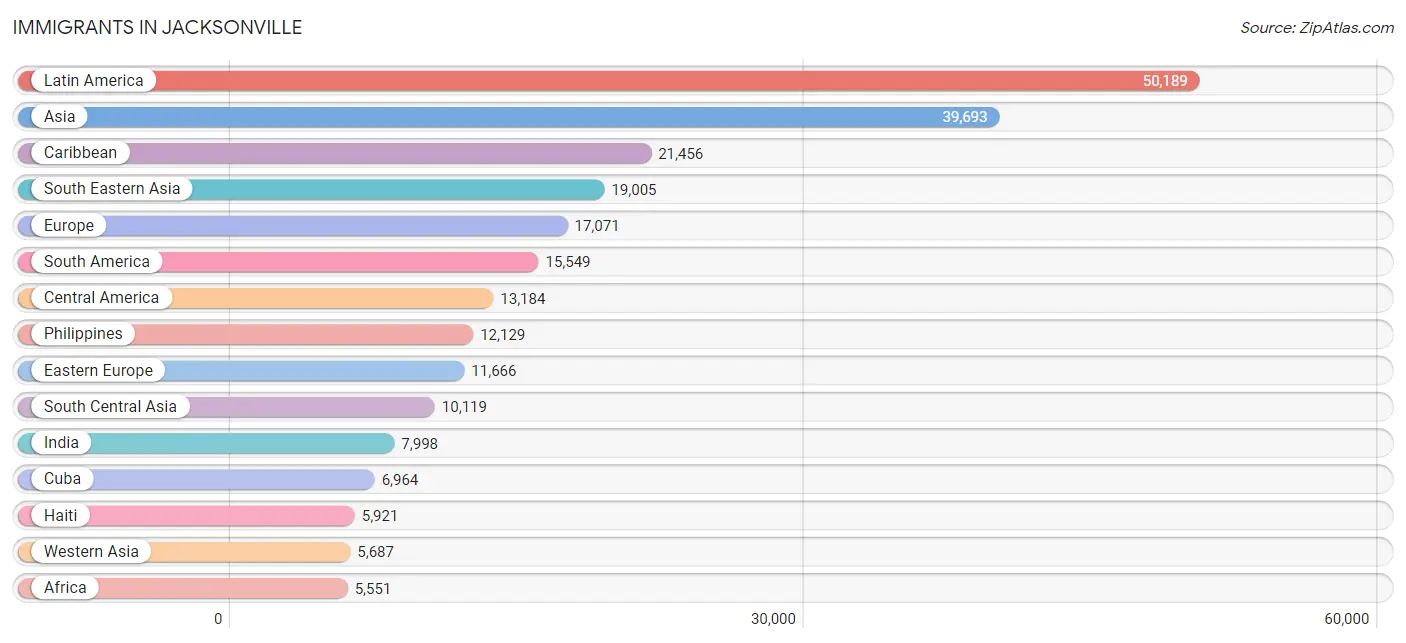
The most numerous immigrant groups reported in Jacksonville came from Latin America (50,189 | 5.3%), Asia (39,693 | 4.2%), Caribbean (21,456 | 2.3%), South Eastern Asia (19,005 | 2.0%), and Europe (17,071 | 1.8%), together accounting for 15.5% of all Jacksonville residents.
| Immigration Origin | # Population | % Population |
| Afghanistan | 271 | 0.0% |
| Africa | 5,551 | 0.6% |
| Albania | 2,333 | 0.3% |
| Argentina | 483 | 0.1% |
| Asia | 39,693 | 4.2% |
| Australia | 110 | 0.0% |
| Austria | 239 | 0.0% |
| Bahamas | 499 | 0.1% |
| Bangladesh | 712 | 0.1% |
| Barbados | 278 | 0.0% |
| Belarus | 194 | 0.0% |
| Belgium | 123 | 0.0% |
| Belize | 124 | 0.0% |
| Bolivia | 222 | 0.0% |
| Bosnia and Herzegovina | 3,494 | 0.4% |
| Brazil | 3,484 | 0.4% |
| Bulgaria | 257 | 0.0% |
| Cambodia | 772 | 0.1% |
| Cameroon | 23 | 0.0% |
| Canada | 1,532 | 0.2% |
| Caribbean | 21,456 | 2.3% |
| Central America | 13,184 | 1.4% |
| Chile | 265 | 0.0% |
| China | 2,473 | 0.3% |
| Colombia | 3,385 | 0.4% |
| Congo | 43 | 0.0% |
| Costa Rica | 442 | 0.1% |
| Croatia | 310 | 0.0% |
| Cuba | 6,964 | 0.7% |
| Czechoslovakia | 53 | 0.0% |
| Denmark | 46 | 0.0% |
| Dominica | 174 | 0.0% |
| Dominican Republic | 1,859 | 0.2% |
| Eastern Africa | 1,414 | 0.2% |
| Eastern Asia | 4,698 | 0.5% |
| Eastern Europe | 11,666 | 1.2% |
| Ecuador | 785 | 0.1% |
| Egypt | 568 | 0.1% |
| El Salvador | 1,231 | 0.1% |
| England | 628 | 0.1% |
| Eritrea | 6 | 0.0% |
| Ethiopia | 785 | 0.1% |
| Europe | 17,071 | 1.8% |
| Fiji | 20 | 0.0% |
| France | 199 | 0.0% |
| Germany | 1,555 | 0.2% |
| Ghana | 227 | 0.0% |
| Greece | 144 | 0.0% |
| Grenada | 68 | 0.0% |
| Guatemala | 2,003 | 0.2% |
| Guyana | 647 | 0.1% |
| Haiti | 5,921 | 0.6% |
| Honduras | 2,461 | 0.3% |
| Hong Kong | 133 | 0.0% |
| Hungary | 169 | 0.0% |
| India | 7,998 | 0.8% |
| Indonesia | 207 | 0.0% |
| Iran | 560 | 0.1% |
| Iraq | 1,248 | 0.1% |
| Ireland | 174 | 0.0% |
| Israel | 354 | 0.0% |
| Italy | 265 | 0.0% |
| Jamaica | 4,275 | 0.4% |
| Japan | 1,226 | 0.1% |
| Jordan | 670 | 0.1% |
| Kenya | 206 | 0.0% |
| Korea | 999 | 0.1% |
| Kuwait | 168 | 0.0% |
| Laos | 240 | 0.0% |
| Latin America | 50,189 | 5.3% |
| Latvia | 6 | 0.0% |
| Lebanon | 313 | 0.0% |
| Liberia | 532 | 0.1% |
| Lithuania | 53 | 0.0% |
| Malaysia | 80 | 0.0% |
| Mexico | 5,283 | 0.6% |
| Middle Africa | 80 | 0.0% |
| Moldova | 615 | 0.1% |
| Morocco | 221 | 0.0% |
| Nepal | 33 | 0.0% |
| Netherlands | 77 | 0.0% |
| Nicaragua | 790 | 0.1% |
| Nigeria | 879 | 0.1% |
| Northern Africa | 1,098 | 0.1% |
| Northern Europe | 2,201 | 0.2% |
| Norway | 99 | 0.0% |
| Oceania | 351 | 0.0% |
| Pakistan | 316 | 0.0% |
| Panama | 850 | 0.1% |
| Peru | 935 | 0.1% |
| Philippines | 12,129 | 1.3% |
| Poland | 388 | 0.0% |
| Portugal | 240 | 0.0% |
| Romania | 454 | 0.1% |
| Russia | 967 | 0.1% |
| Saudi Arabia | 173 | 0.0% |
| Scotland | 106 | 0.0% |
| Senegal | 127 | 0.0% |
| Serbia | 425 | 0.0% |
| Sierra Leone | 11 | 0.0% |
| Singapore | 61 | 0.0% |
| South Africa | 259 | 0.0% |
| South America | 15,549 | 1.6% |
| South Central Asia | 10,119 | 1.1% |
| South Eastern Asia | 19,005 | 2.0% |
| Southern Europe | 986 | 0.1% |
| Spain | 337 | 0.0% |
| Sudan | 261 | 0.0% |
| Sweden | 86 | 0.0% |
| Switzerland | 13 | 0.0% |
| Syria | 2,158 | 0.2% |
| Taiwan | 180 | 0.0% |
| Thailand | 863 | 0.1% |
| Trinidad and Tobago | 1,024 | 0.1% |
| Turkey | 255 | 0.0% |
| Uganda | 51 | 0.0% |
| Ukraine | 1,505 | 0.2% |
| Uruguay | 255 | 0.0% |
| Uzbekistan | 74 | 0.0% |
| Venezuela | 5,007 | 0.5% |
| Vietnam | 3,394 | 0.4% |
| Western Africa | 2,184 | 0.2% |
| Western Asia | 5,687 | 0.6% |
| Western Europe | 2,206 | 0.2% |
| Zaire | 14 | 0.0% |
| Zimbabwe | 24 | 0.0% | View All 126 Rows |
Sex and Age in Jacksonville
Sex and Age in Jacksonville
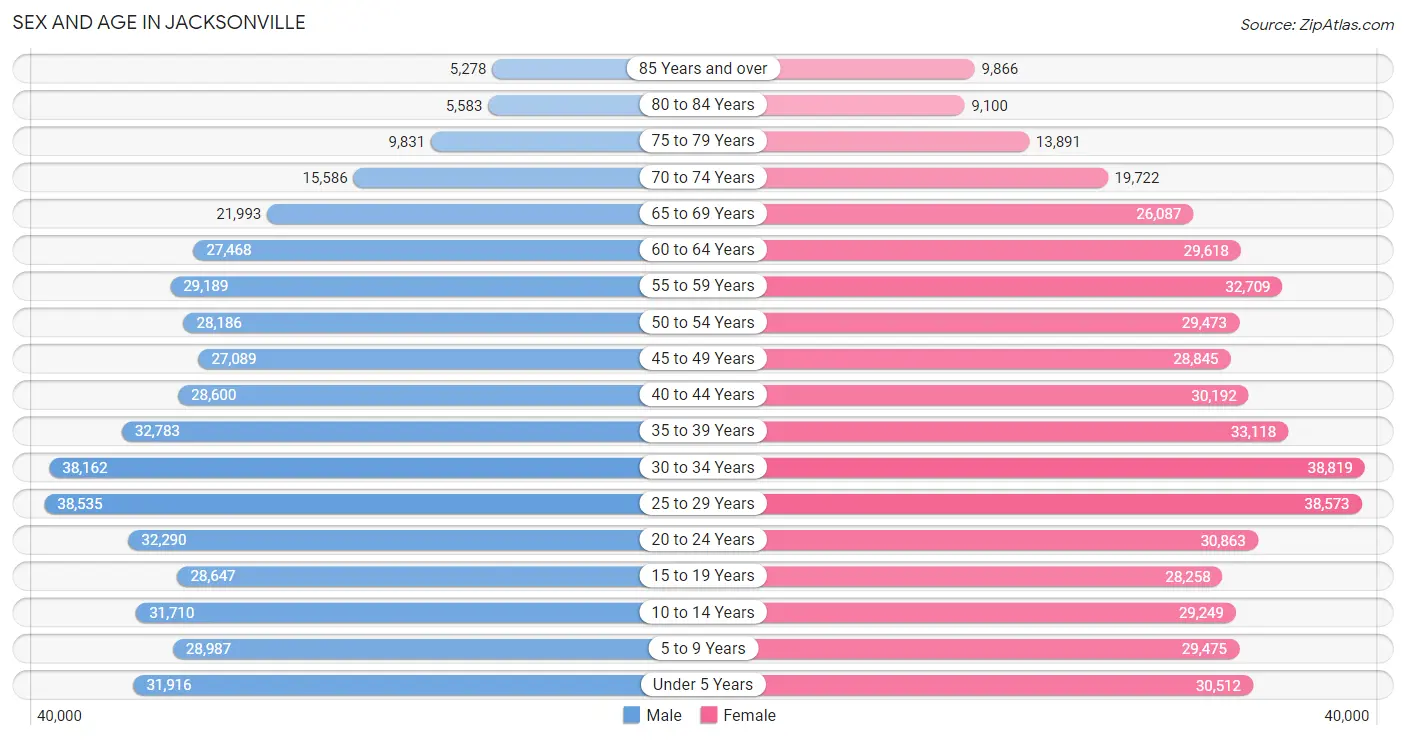
The most populous age groups in Jacksonville are 25 to 29 Years (38,535 | 8.3%) for men and 30 to 34 Years (38,819 | 8.0%) for women.
| Age Bracket | Male | Female |
| Under 5 Years | 31,916 (6.9%) | 30,512 (6.2%) |
| 5 to 9 Years | 28,987 (6.3%) | 29,475 (6.0%) |
| 10 to 14 Years | 31,710 (6.9%) | 29,249 (6.0%) |
| 15 to 19 Years | 28,647 (6.2%) | 28,258 (5.8%) |
| 20 to 24 Years | 32,290 (7.0%) | 30,863 (6.3%) |
| 25 to 29 Years | 38,535 (8.3%) | 38,573 (7.9%) |
| 30 to 34 Years | 38,162 (8.3%) | 38,819 (8.0%) |
| 35 to 39 Years | 32,783 (7.1%) | 33,118 (6.8%) |
| 40 to 44 Years | 28,600 (6.2%) | 30,192 (6.2%) |
| 45 to 49 Years | 27,089 (5.9%) | 28,845 (5.9%) |
| 50 to 54 Years | 28,186 (6.1%) | 29,473 (6.0%) |
| 55 to 59 Years | 29,189 (6.3%) | 32,709 (6.7%) |
| 60 to 64 Years | 27,468 (5.9%) | 29,618 (6.1%) |
| 65 to 69 Years | 21,993 (4.8%) | 26,087 (5.3%) |
| 70 to 74 Years | 15,586 (3.4%) | 19,722 (4.0%) |
| 75 to 79 Years | 9,831 (2.1%) | 13,891 (2.8%) |
| 80 to 84 Years | 5,583 (1.2%) | 9,100 (1.9%) |
| 85 Years and over | 5,278 (1.1%) | 9,866 (2.0%) |
| Total | 461,833 (100.0%) | 488,370 (100.0%) |
Families and Households in Jacksonville
Median Family Size in Jacksonville
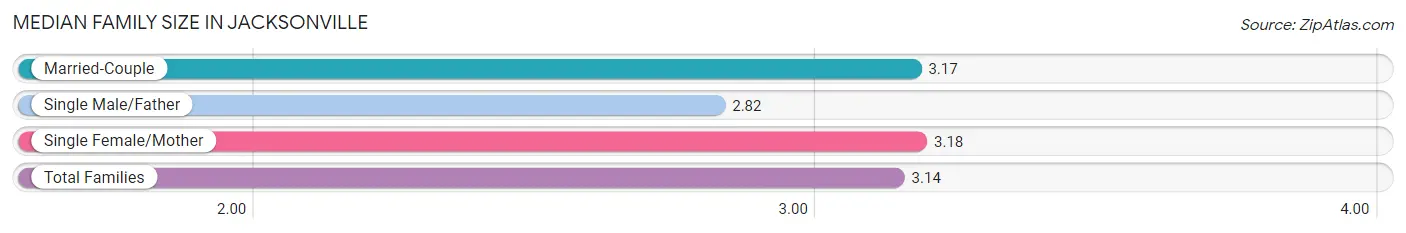
The median family size in Jacksonville is 3.14 persons per family, with single female/mother families (57,385 | 25.2%) accounting for the largest median family size of 3.18 persons per family. On the other hand, single male/father families (20,158 | 8.8%) represent the smallest median family size with 2.82 persons per family.
| Family Type | # Families | Family Size |
| Married-Couple | 150,471 (66.0%) | 3.17 |
| Single Male/Father | 20,158 (8.8%) | 2.82 |
| Single Female/Mother | 57,385 (25.2%) | 3.18 |
| Total Families | 228,014 (100.0%) | 3.14 |
Median Household Size in Jacksonville
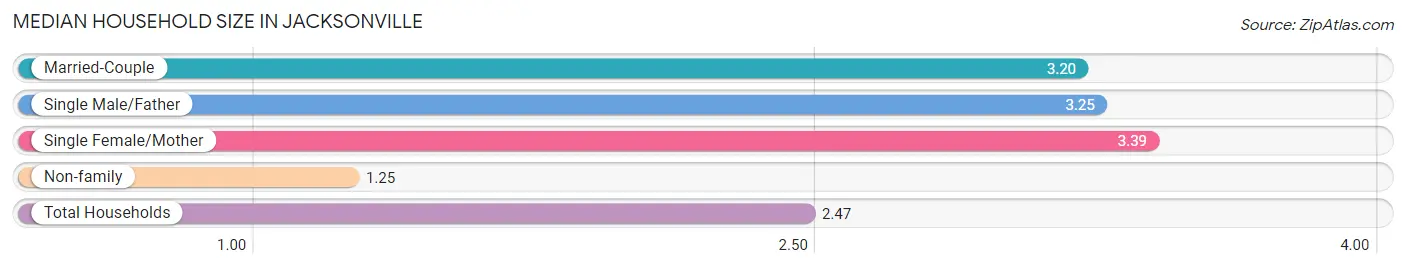
The median household size in Jacksonville is 2.47 persons per household, with single female/mother households (57,385 | 15.3%) accounting for the largest median household size of 3.39 persons per household. non-family households (147,837 | 39.3%) represent the smallest median household size with 1.25 persons per household.
| Household Type | # Households | Household Size |
| Married-Couple | 150,471 (40.0%) | 3.20 |
| Single Male/Father | 20,158 (5.4%) | 3.25 |
| Single Female/Mother | 57,385 (15.3%) | 3.39 |
| Non-family | 147,837 (39.3%) | 1.25 |
| Total Households | 375,851 (100.0%) | 2.47 |
Household Size by Marriage Status in Jacksonville
Out of a total of 375,851 households in Jacksonville, 228,014 (60.7%) are family households, while 147,837 (39.3%) are nonfamily households. The most numerous type of family households are 2-person households, comprising 100,243, and the most common type of nonfamily households are 1-person households, comprising 120,169.
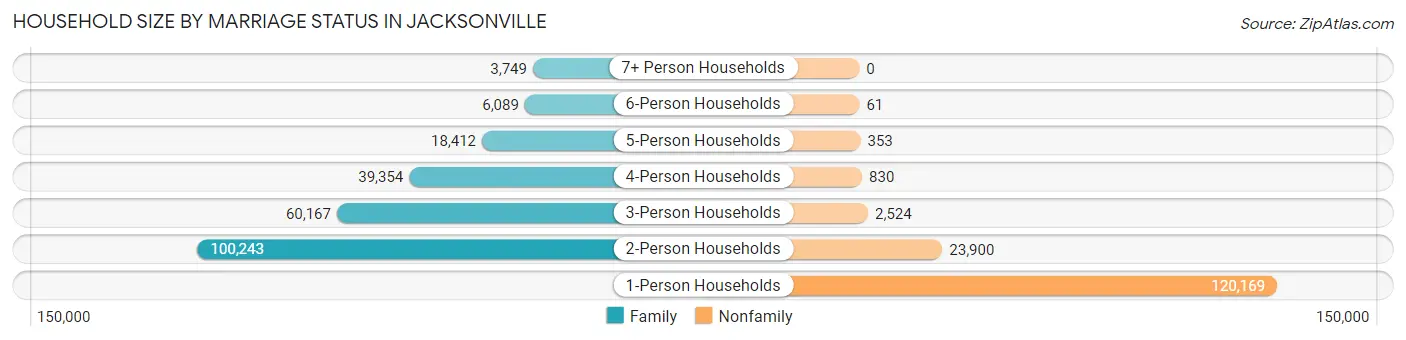
| Household Size | Family Households | Nonfamily Households |
| 1-Person Households | - | 120,169 (32.0%) |
| 2-Person Households | 100,243 (26.7%) | 23,900 (6.4%) |
| 3-Person Households | 60,167 (16.0%) | 2,524 (0.7%) |
| 4-Person Households | 39,354 (10.5%) | 830 (0.2%) |
| 5-Person Households | 18,412 (4.9%) | 353 (0.1%) |
| 6-Person Households | 6,089 (1.6%) | 61 (0.0%) |
| 7+ Person Households | 3,749 (1.0%) | 0 (0.0%) |
| Total | 228,014 (60.7%) | 147,837 (39.3%) |
Female Fertility in Jacksonville
Fertility by Age in Jacksonville
Average fertility rate in Jacksonville is 64.0 births per 1,000 women. Women in the age bracket of 20 to 34 years have the highest fertility rate with 102.0 births per 1,000 women. Women in the age bracket of 20 to 34 years acount for 74.2% of all women with births.
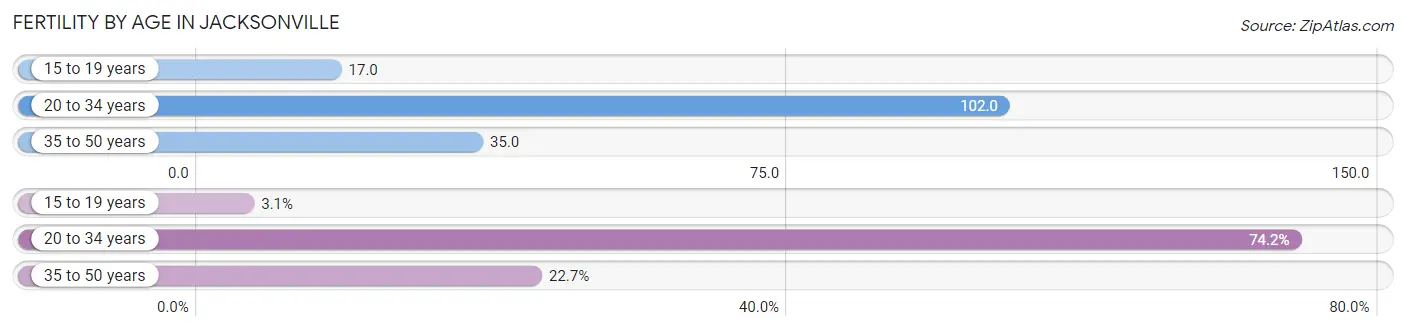
| Age Bracket | Women with Births | Births / 1,000 Women |
| 15 to 19 years | 468 (3.1%) | 17.0 |
| 20 to 34 years | 11,068 (74.2%) | 102.0 |
| 35 to 50 years | 3,382 (22.7%) | 35.0 |
| Total | 14,918 (100.0%) | 64.0 |
Fertility by Age by Marriage Status in Jacksonville
60.6% of women with births (14,918) in Jacksonville are married. The highest percentage of unmarried women with births falls into 15 to 19 years age bracket with 100.0% of them unmarried at the time of birth, while the lowest percentage of unmarried women with births belong to 35 to 50 years age bracket with 24.1% of them unmarried.
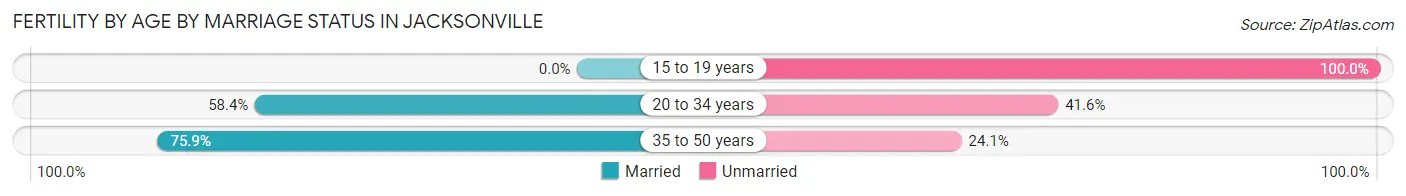
| Age Bracket | Married | Unmarried |
| 15 to 19 years | 0 (0.0%) | 468 (100.0%) |
| 20 to 34 years | 6,464 (58.4%) | 4,604 (41.6%) |
| 35 to 50 years | 2,567 (75.9%) | 815 (24.1%) |
| Total | 9,040 (60.6%) | 5,878 (39.4%) |
Fertility by Education in Jacksonville
Average fertility rate in Jacksonville is 64.0 births per 1,000 women. Women with the education attainment of graduate degree have the highest fertility rate of 73.0 births per 1,000 women, while women with the education attainment of less than high school have the lowest fertility at 50.0 births per 1,000 women. Women with the education attainment of college or associate's degree represent 33.6% of all women with births.
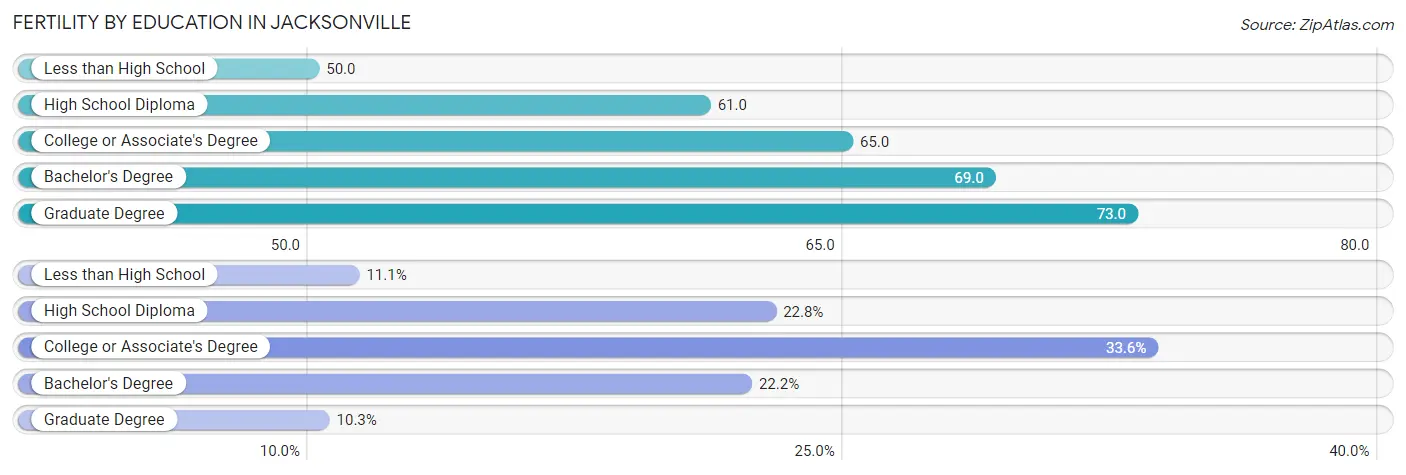
| Educational Attainment | Women with Births | Births / 1,000 Women |
| Less than High School | 1,661 (11.1%) | 50.0 |
| High School Diploma | 3,408 (22.8%) | 61.0 |
| College or Associate's Degree | 5,008 (33.6%) | 65.0 |
| Bachelor's Degree | 3,306 (22.2%) | 69.0 |
| Graduate Degree | 1,535 (10.3%) | 73.0 |
| Total | 14,918 (100.0%) | 64.0 |
Fertility by Education by Marriage Status in Jacksonville
39.4% of women with births in Jacksonville are unmarried. Women with the educational attainment of graduate degree are most likely to be married with 85.3% of them married at childbirth, while women with the educational attainment of high school diploma are least likely to be married with 65.1% of them unmarried at childbirth.
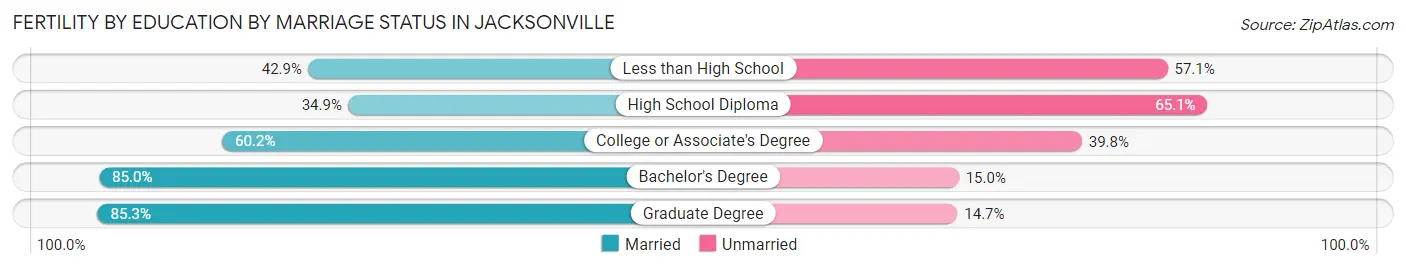
| Educational Attainment | Married | Unmarried |
| Less than High School | 713 (42.9%) | 948 (57.1%) |
| High School Diploma | 1,189 (34.9%) | 2,219 (65.1%) |
| College or Associate's Degree | 3,015 (60.2%) | 1,993 (39.8%) |
| Bachelor's Degree | 2,810 (85.0%) | 496 (15.0%) |
| Graduate Degree | 1,309 (85.3%) | 226 (14.7%) |
| Total | 9,040 (60.6%) | 5,878 (39.4%) |
Employment Characteristics in Jacksonville
Employment by Class of Employer in Jacksonville
Among the 463,989 employed individuals in Jacksonville, private company employees (319,001 | 68.8%), not-for-profit organizations (41,234 | 8.9%), and federal government employees (29,712 | 6.4%) make up the most common classes of employment.
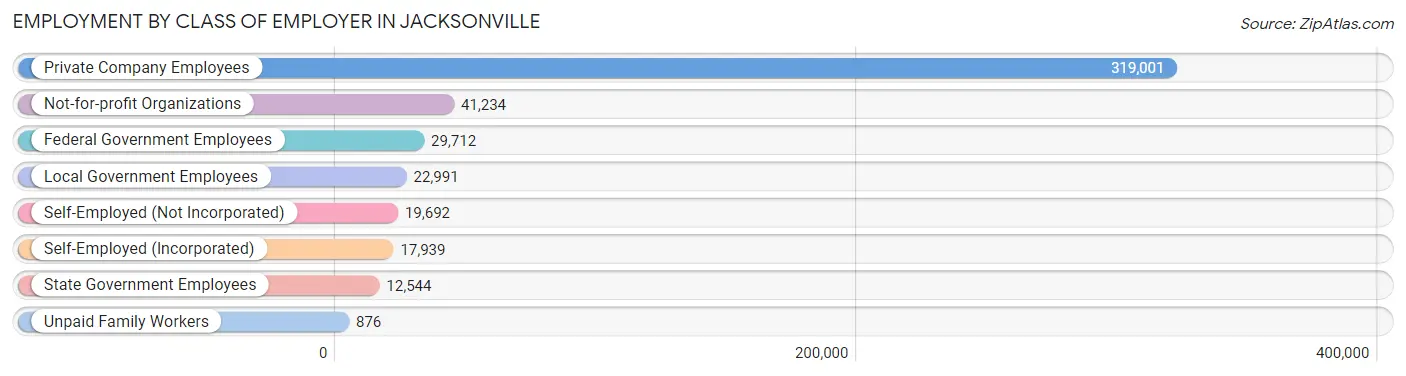
| Employer Class | # Employees | % Employees |
| Private Company Employees | 319,001 | 68.8% |
| Self-Employed (Incorporated) | 17,939 | 3.9% |
| Self-Employed (Not Incorporated) | 19,692 | 4.2% |
| Not-for-profit Organizations | 41,234 | 8.9% |
| Local Government Employees | 22,991 | 5.0% |
| State Government Employees | 12,544 | 2.7% |
| Federal Government Employees | 29,712 | 6.4% |
| Unpaid Family Workers | 876 | 0.2% |
| Total | 463,989 | 100.0% |
Employment Status by Age in Jacksonville
According to the labor force statistics for Jacksonville, out of the total population over 16 years of age (757,336), 65.6% or 496,812 individuals are in the labor force, with 4.8% or 23,847 of them unemployed. The age group with the highest labor force participation rate is 25 to 29 years, with 85.8% or 66,159 individuals in the labor force. Within the labor force, the 16 to 19 years age range has the highest percentage of unemployed individuals, with 15.0% or 2,519 of them being unemployed.
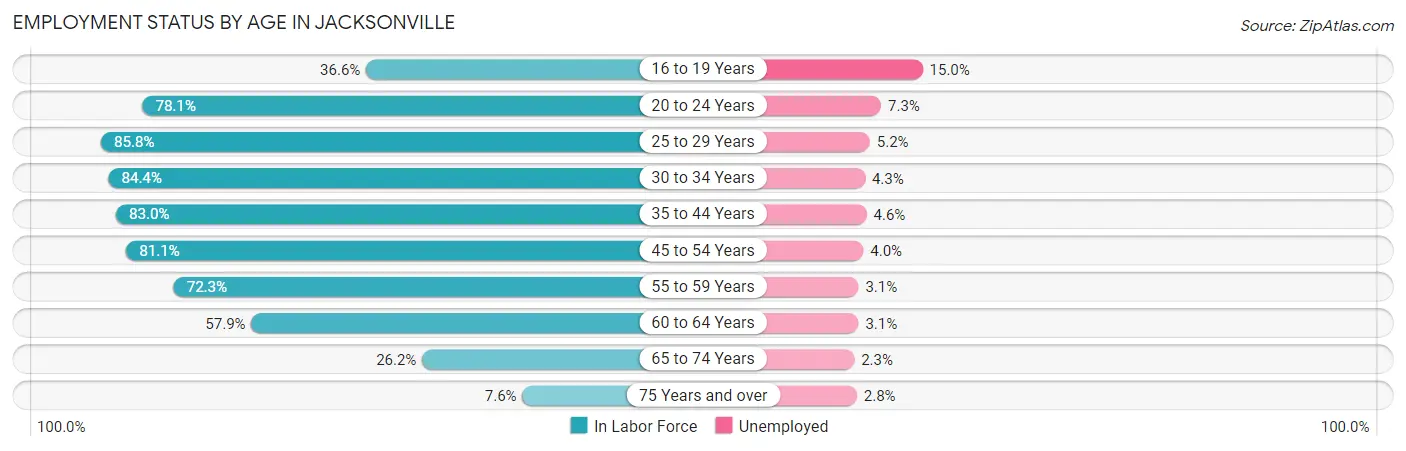
| Age Bracket | In Labor Force | Unemployed |
| 16 to 19 Years | 16,795 (36.6%) | 2,519 (15.0%) |
| 20 to 24 Years | 49,322 (78.1%) | 3,601 (7.3%) |
| 25 to 29 Years | 66,159 (85.8%) | 3,440 (5.2%) |
| 30 to 34 Years | 64,972 (84.4%) | 2,794 (4.3%) |
| 35 to 44 Years | 103,495 (83.0%) | 4,761 (4.6%) |
| 45 to 54 Years | 92,124 (81.1%) | 3,685 (4.0%) |
| 55 to 59 Years | 44,752 (72.3%) | 1,387 (3.1%) |
| 60 to 64 Years | 33,053 (57.9%) | 1,025 (3.1%) |
| 65 to 74 Years | 21,848 (26.2%) | 503 (2.3%) |
| 75 Years and over | 4,070 (7.6%) | 114 (2.8%) |
| Total | 496,812 (65.6%) | 23,847 (4.8%) |
Employment Status by Educational Attainment in Jacksonville
According to labor force statistics for Jacksonville, 79.1% of individuals (404,485) out of the total population between 25 and 64 years of age (511,359) are in the labor force, with 4.2% or 16,988 of them being unemployed. The group with the highest labor force participation rate are those with the educational attainment of bachelor's degree or higher, with 86.9% or 140,327 individuals in the labor force. Within the labor force, individuals with less than high school education have the highest percentage of unemployment, with 8.4% or 2,333 of them being unemployed.
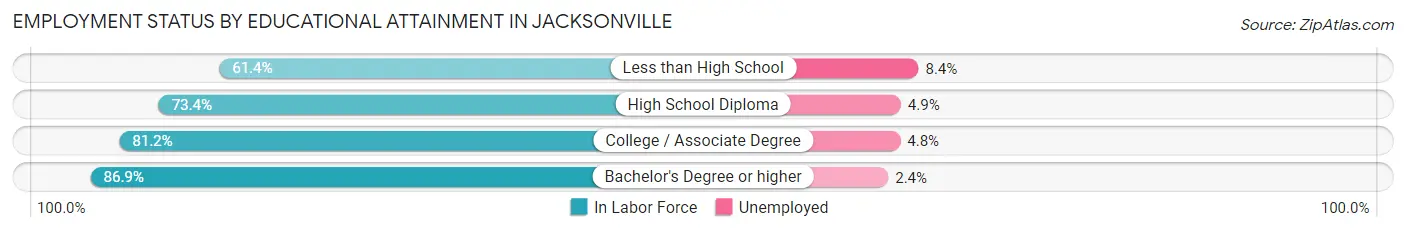
| Educational Attainment | In Labor Force | Unemployed |
| Less than High School | 27,772 (61.4%) | 3,799 (8.4%) |
| High School Diploma | 103,449 (73.4%) | 6,906 (4.9%) |
| College / Associate Degree | 132,931 (81.2%) | 7,858 (4.8%) |
| Bachelor's Degree or higher | 140,327 (86.9%) | 3,876 (2.4%) |
| Total | 404,485 (79.1%) | 21,477 (4.2%) |
Employment Occupations by Sex in Jacksonville
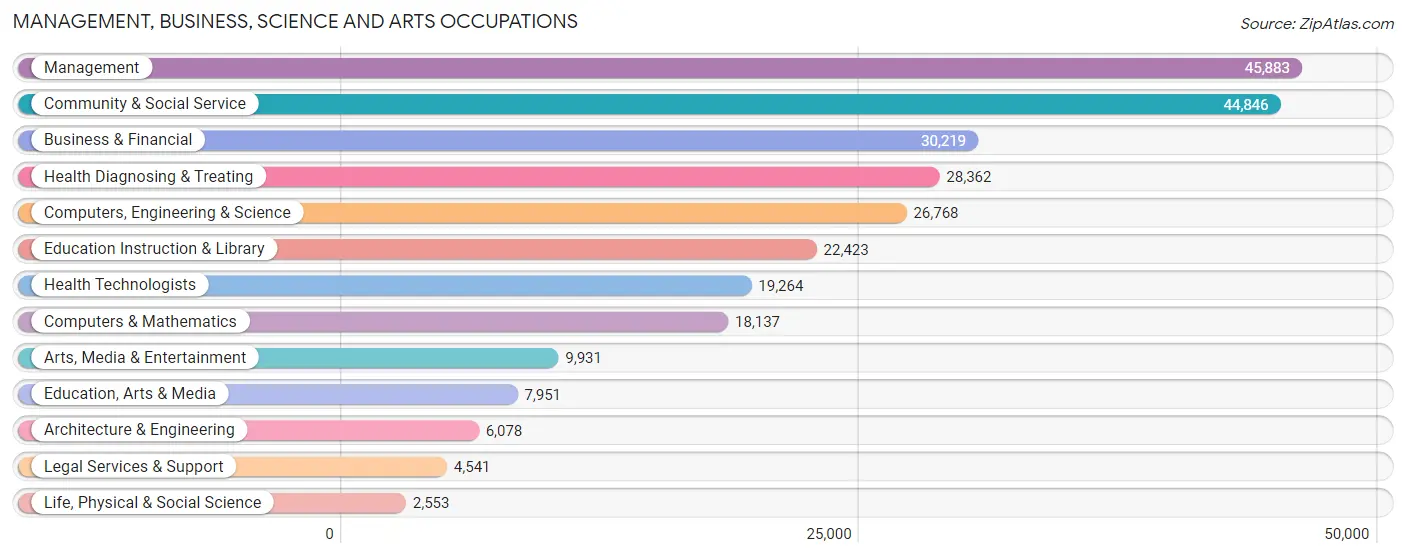
Management, Business, Science and Arts Occupations
The most common Management, Business, Science and Arts occupations in Jacksonville are Management (45,883 | 10.0%), Community & Social Service (44,846 | 9.8%), Business & Financial (30,219 | 6.6%), Health Diagnosing & Treating (28,362 | 6.2%), and Computers, Engineering & Science (26,768 | 5.8%).
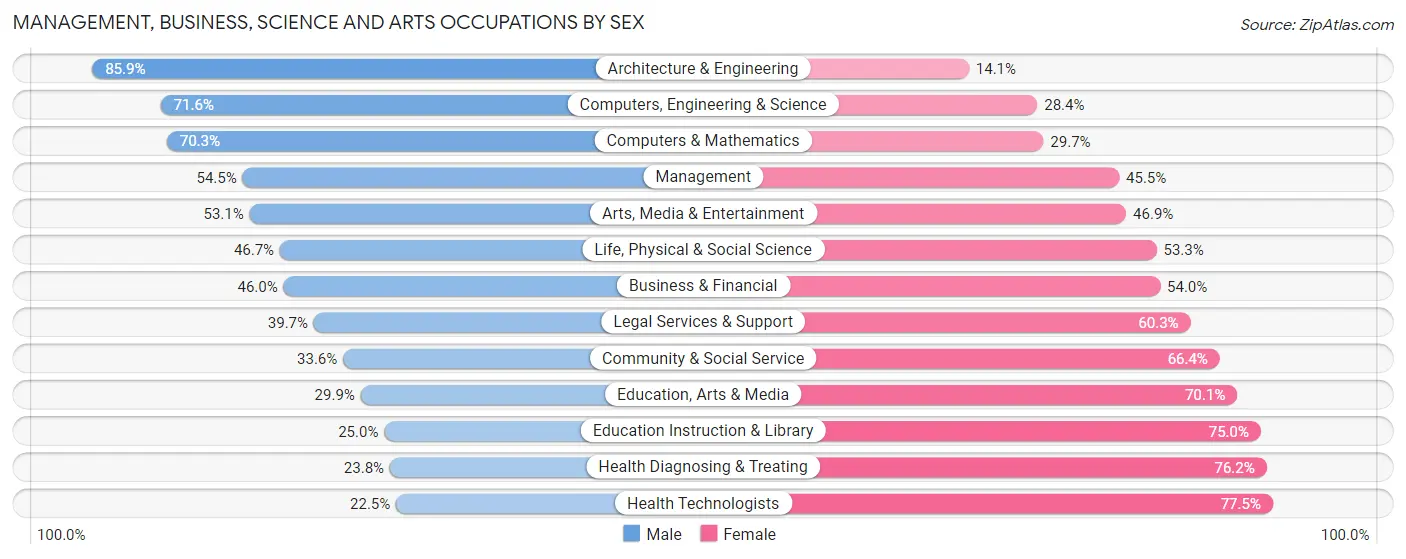
Management, Business, Science and Arts Occupations by Sex
Within the Management, Business, Science and Arts occupations in Jacksonville, the most male-oriented occupations are Architecture & Engineering (85.9%), Computers, Engineering & Science (71.6%), and Computers & Mathematics (70.3%), while the most female-oriented occupations are Health Technologists (77.5%), Health Diagnosing & Treating (76.2%), and Education Instruction & Library (75.0%).
| Occupation | Male | Female |
| Management | 25,026 (54.5%) | 20,857 (45.5%) |
| Business & Financial | 13,896 (46.0%) | 16,323 (54.0%) |
| Computers, Engineering & Science | 19,168 (71.6%) | 7,600 (28.4%) |
| Computers & Mathematics | 12,755 (70.3%) | 5,382 (29.7%) |
| Architecture & Engineering | 5,220 (85.9%) | 858 (14.1%) |
| Life, Physical & Social Science | 1,193 (46.7%) | 1,360 (53.3%) |
| Community & Social Service | 15,050 (33.6%) | 29,796 (66.4%) |
| Education, Arts & Media | 2,377 (29.9%) | 5,574 (70.1%) |
| Legal Services & Support | 1,801 (39.7%) | 2,740 (60.3%) |
| Education Instruction & Library | 5,602 (25.0%) | 16,821 (75.0%) |
| Arts, Media & Entertainment | 5,270 (53.1%) | 4,661 (46.9%) |
| Health Diagnosing & Treating | 6,746 (23.8%) | 21,616 (76.2%) |
| Health Technologists | 4,334 (22.5%) | 14,930 (77.5%) |
| Total (Category) | 79,886 (45.4%) | 96,192 (54.6%) |
| Total (Overall) | 236,219 (51.5%) | 222,440 (48.5%) |
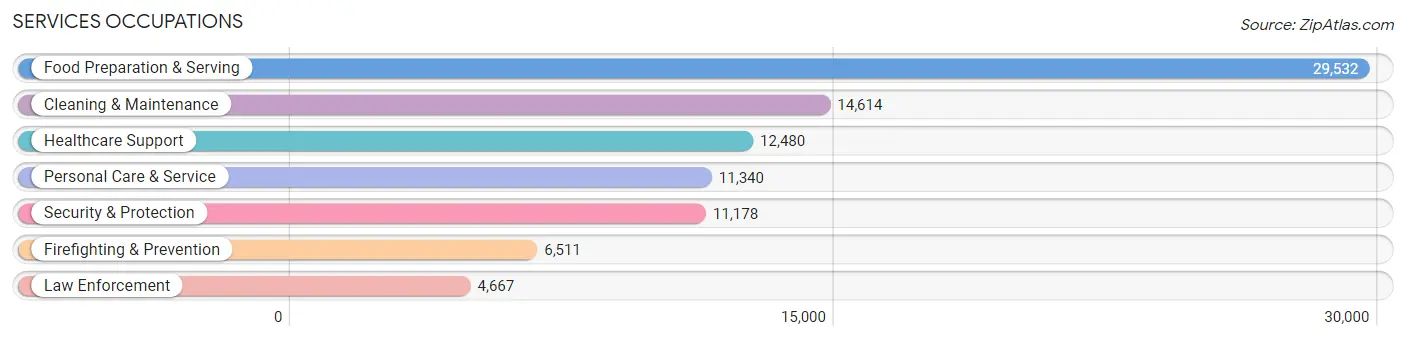
Services Occupations
The most common Services occupations in Jacksonville are Food Preparation & Serving (29,532 | 6.4%), Cleaning & Maintenance (14,614 | 3.2%), Healthcare Support (12,480 | 2.7%), Personal Care & Service (11,340 | 2.5%), and Security & Protection (11,178 | 2.4%).
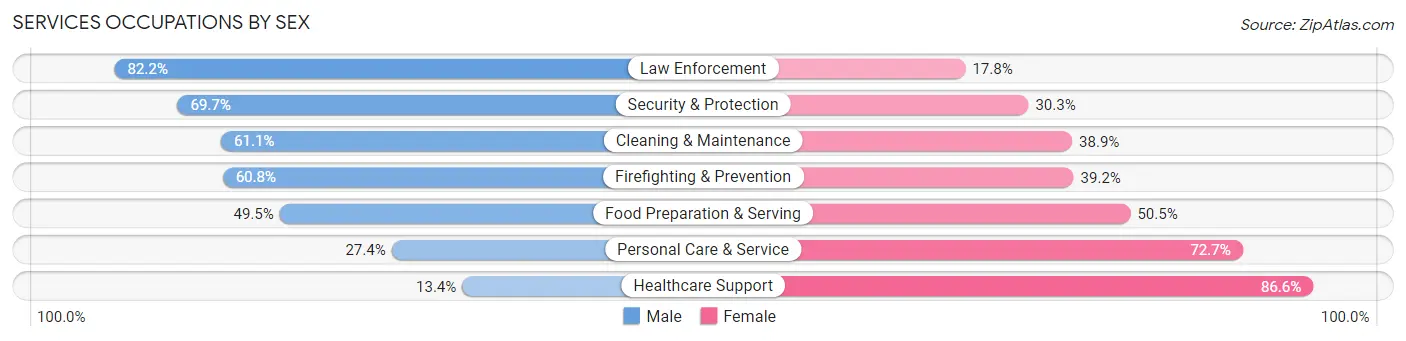
Services Occupations by Sex
Within the Services occupations in Jacksonville, the most male-oriented occupations are Law Enforcement (82.2%), Security & Protection (69.7%), and Cleaning & Maintenance (61.1%), while the most female-oriented occupations are Healthcare Support (86.6%), Personal Care & Service (72.7%), and Food Preparation & Serving (50.5%).
| Occupation | Male | Female |
| Healthcare Support | 1,668 (13.4%) | 10,812 (86.6%) |
| Security & Protection | 7,793 (69.7%) | 3,385 (30.3%) |
| Firefighting & Prevention | 3,957 (60.8%) | 2,554 (39.2%) |
| Law Enforcement | 3,836 (82.2%) | 831 (17.8%) |
| Food Preparation & Serving | 14,623 (49.5%) | 14,909 (50.5%) |
| Cleaning & Maintenance | 8,925 (61.1%) | 5,689 (38.9%) |
| Personal Care & Service | 3,102 (27.4%) | 8,238 (72.7%) |
| Total (Category) | 36,111 (45.6%) | 43,033 (54.4%) |
| Total (Overall) | 236,219 (51.5%) | 222,440 (48.5%) |
Sales and Office Occupations
The most common Sales and Office occupations in Jacksonville are Office & Administration (60,672 | 13.2%), and Sales & Related (47,004 | 10.2%).

Sales and Office Occupations by Sex
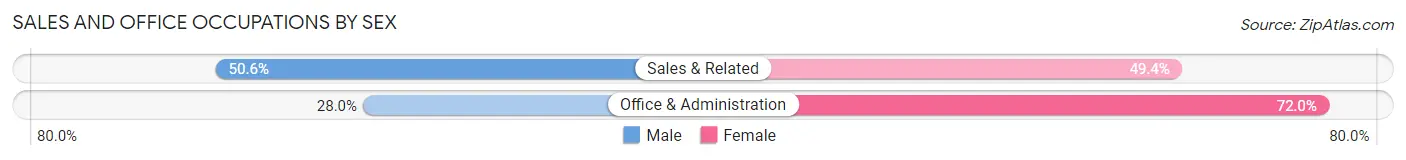
| Occupation | Male | Female |
| Sales & Related | 23,784 (50.6%) | 23,220 (49.4%) |
| Office & Administration | 16,966 (28.0%) | 43,706 (72.0%) |
| Total (Category) | 40,750 (37.9%) | 66,926 (62.2%) |
| Total (Overall) | 236,219 (51.5%) | 222,440 (48.5%) |
Natural Resources, Construction and Maintenance Occupations
The most common Natural Resources, Construction and Maintenance occupations in Jacksonville are Construction & Extraction (20,271 | 4.4%), Installation, Maintenance & Repair (15,826 | 3.5%), and Farming, Fishing & Forestry (716 | 0.2%).

Natural Resources, Construction and Maintenance Occupations by Sex
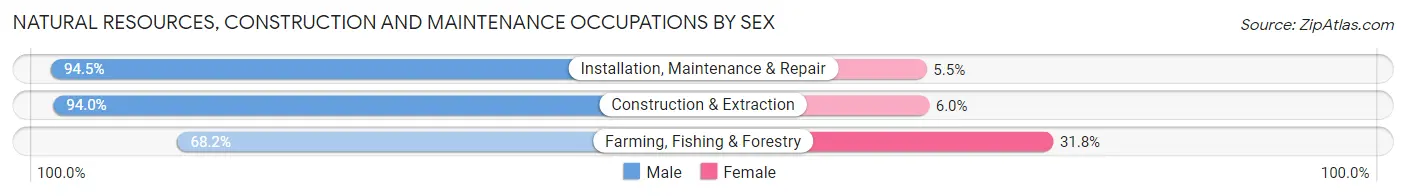
| Occupation | Male | Female |
| Farming, Fishing & Forestry | 488 (68.2%) | 228 (31.8%) |
| Construction & Extraction | 19,055 (94.0%) | 1,216 (6.0%) |
| Installation, Maintenance & Repair | 14,954 (94.5%) | 872 (5.5%) |
| Total (Category) | 34,497 (93.7%) | 2,316 (6.3%) |
| Total (Overall) | 236,219 (51.5%) | 222,440 (48.5%) |
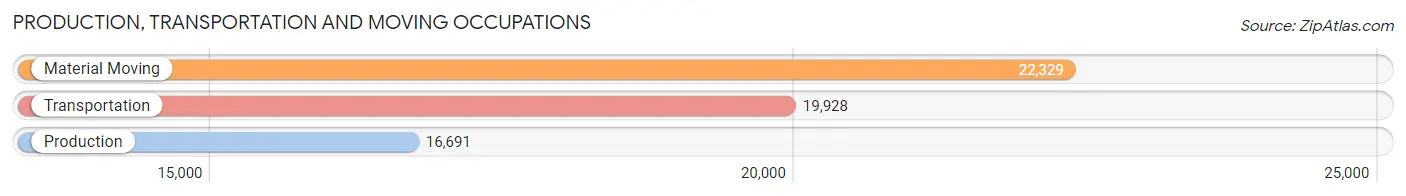
Production, Transportation and Moving Occupations
The most common Production, Transportation and Moving occupations in Jacksonville are Material Moving (22,329 | 4.9%), Transportation (19,928 | 4.3%), and Production (16,691 | 3.6%).
Production, Transportation and Moving Occupations by Sex
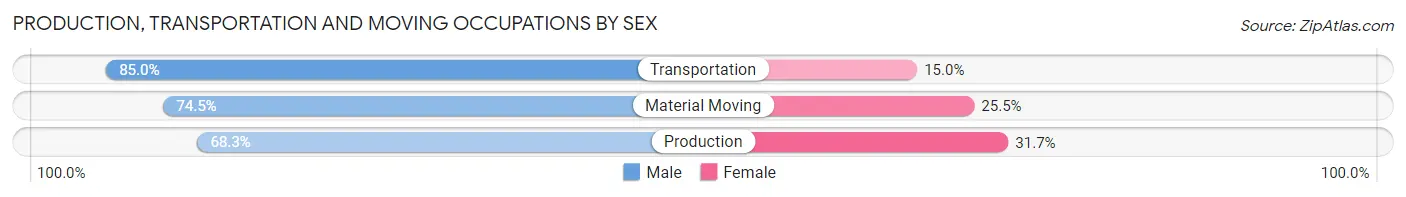
| Occupation | Male | Female |
| Production | 11,396 (68.3%) | 5,295 (31.7%) |
| Transportation | 16,940 (85.0%) | 2,988 (15.0%) |
| Material Moving | 16,639 (74.5%) | 5,690 (25.5%) |
| Total (Category) | 44,975 (76.3%) | 13,973 (23.7%) |
| Total (Overall) | 236,219 (51.5%) | 222,440 (48.5%) |
Employment Industries by Sex in Jacksonville
Employment Industries in Jacksonville
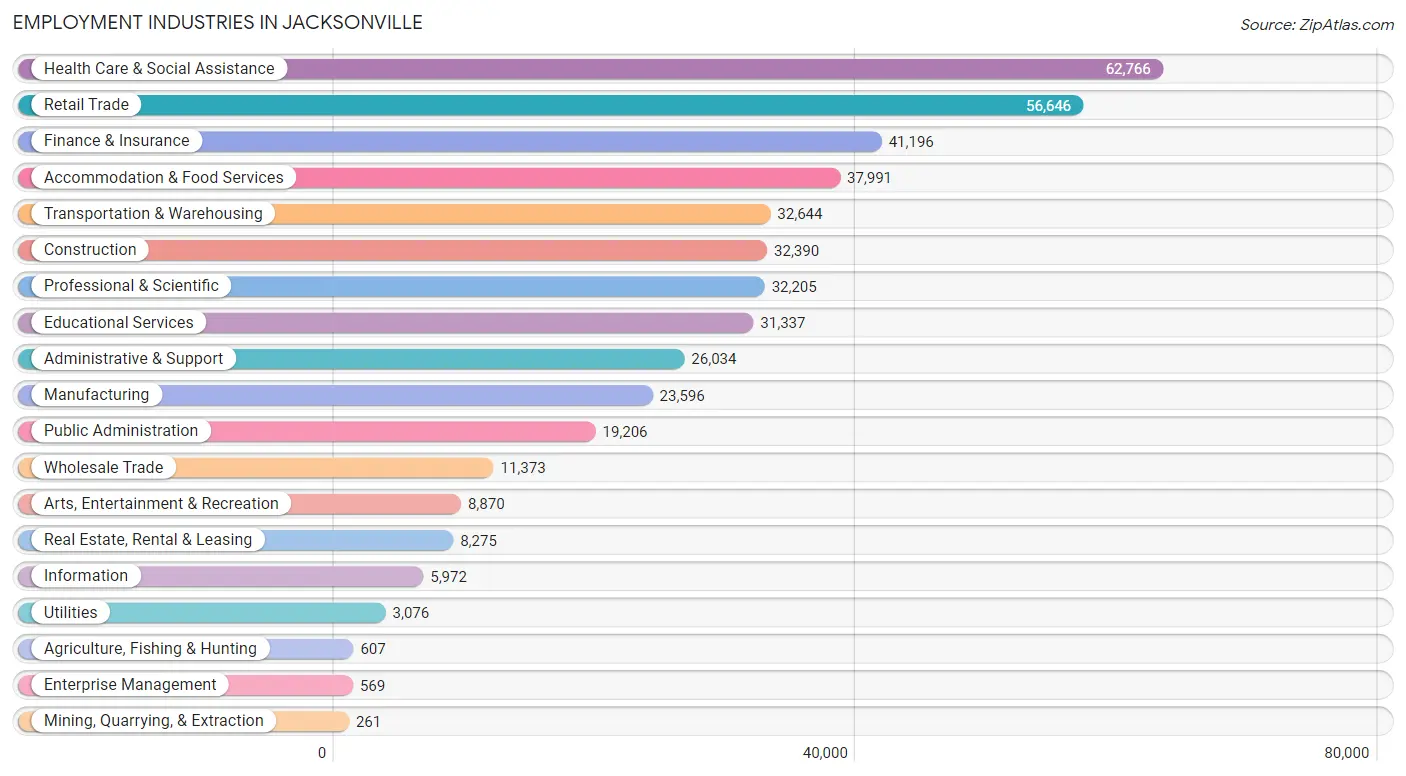
The major employment industries in Jacksonville include Health Care & Social Assistance (62,766 | 13.7%), Retail Trade (56,646 | 12.3%), Finance & Insurance (41,196 | 9.0%), Accommodation & Food Services (37,991 | 8.3%), and Transportation & Warehousing (32,644 | 7.1%).
Employment Industries by Sex in Jacksonville
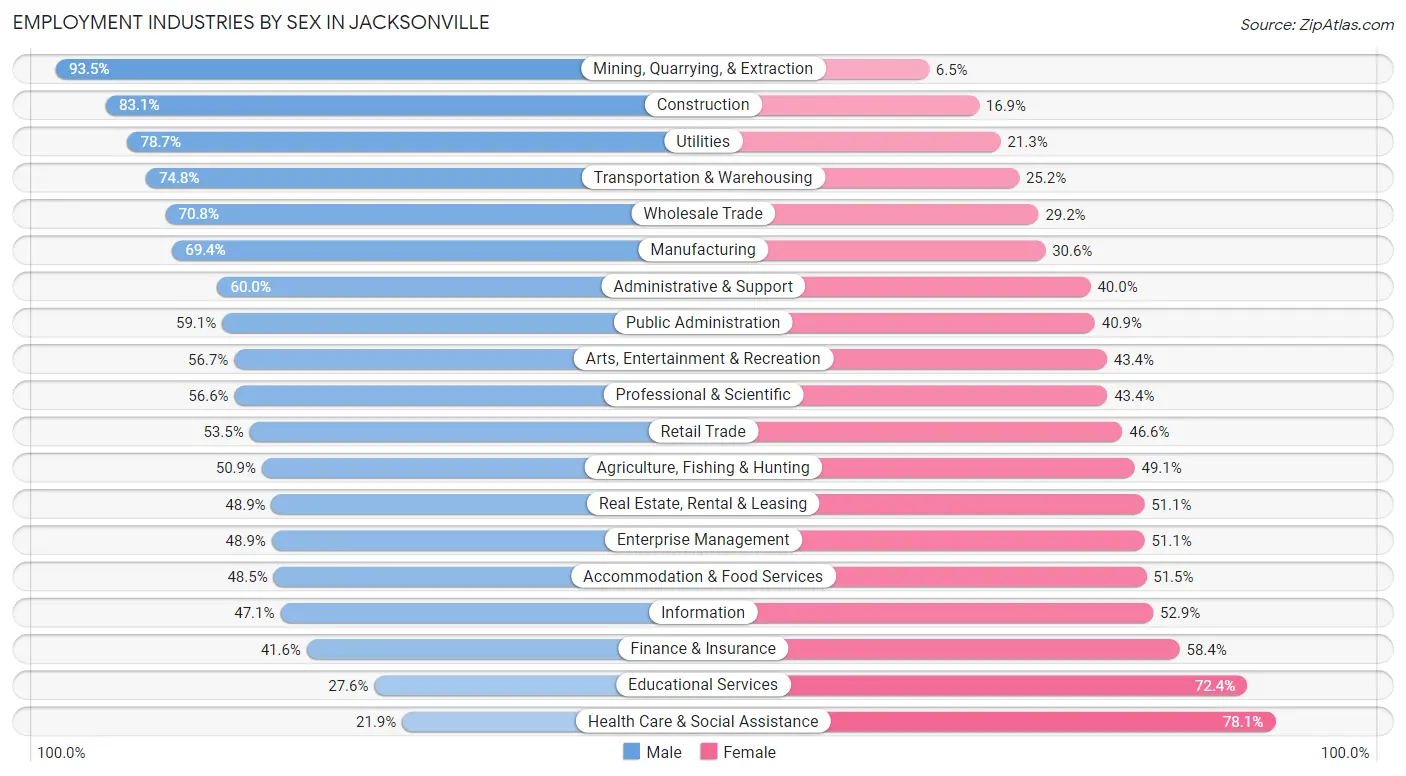
The Jacksonville industries that see more men than women are Mining, Quarrying, & Extraction (93.5%), Construction (83.1%), and Utilities (78.7%), whereas the industries that tend to have a higher number of women are Health Care & Social Assistance (78.1%), Educational Services (72.4%), and Finance & Insurance (58.4%).
| Industry | Male | Female |
| Agriculture, Fishing & Hunting | 309 (50.9%) | 298 (49.1%) |
| Mining, Quarrying, & Extraction | 244 (93.5%) | 17 (6.5%) |
| Construction | 26,929 (83.1%) | 5,461 (16.9%) |
| Manufacturing | 16,378 (69.4%) | 7,218 (30.6%) |
| Wholesale Trade | 8,053 (70.8%) | 3,320 (29.2%) |
| Retail Trade | 30,277 (53.4%) | 26,369 (46.6%) |
| Transportation & Warehousing | 24,431 (74.8%) | 8,213 (25.2%) |
| Utilities | 2,420 (78.7%) | 656 (21.3%) |
| Information | 2,811 (47.1%) | 3,161 (52.9%) |
| Finance & Insurance | 17,140 (41.6%) | 24,056 (58.4%) |
| Real Estate, Rental & Leasing | 4,047 (48.9%) | 4,228 (51.1%) |
| Professional & Scientific | 18,219 (56.6%) | 13,986 (43.4%) |
| Enterprise Management | 278 (48.9%) | 291 (51.1%) |
| Administrative & Support | 15,632 (60.0%) | 10,402 (40.0%) |
| Educational Services | 8,656 (27.6%) | 22,681 (72.4%) |
| Health Care & Social Assistance | 13,722 (21.9%) | 49,044 (78.1%) |
| Arts, Entertainment & Recreation | 5,025 (56.7%) | 3,845 (43.3%) |
| Accommodation & Food Services | 18,417 (48.5%) | 19,574 (51.5%) |
| Public Administration | 11,359 (59.1%) | 7,847 (40.9%) |
| Total | 236,219 (51.5%) | 222,440 (48.5%) |
Education in Jacksonville
School Enrollment in Jacksonville
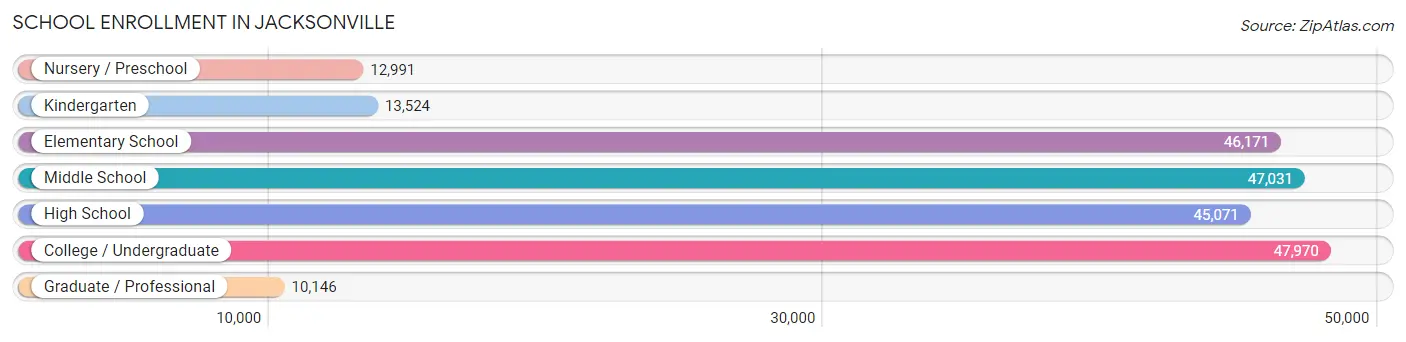
The most common levels of schooling among the 222,904 students in Jacksonville are college / undergraduate (47,970 | 21.5%), middle school (47,031 | 21.1%), and elementary school (46,171 | 20.7%).
| School Level | # Students | % Students |
| Nursery / Preschool | 12,991 | 5.8% |
| Kindergarten | 13,524 | 6.1% |
| Elementary School | 46,171 | 20.7% |
| Middle School | 47,031 | 21.1% |
| High School | 45,071 | 20.2% |
| College / Undergraduate | 47,970 | 21.5% |
| Graduate / Professional | 10,146 | 4.5% |
| Total | 222,904 | 100.0% |
School Enrollment by Age by Funding Source in Jacksonville
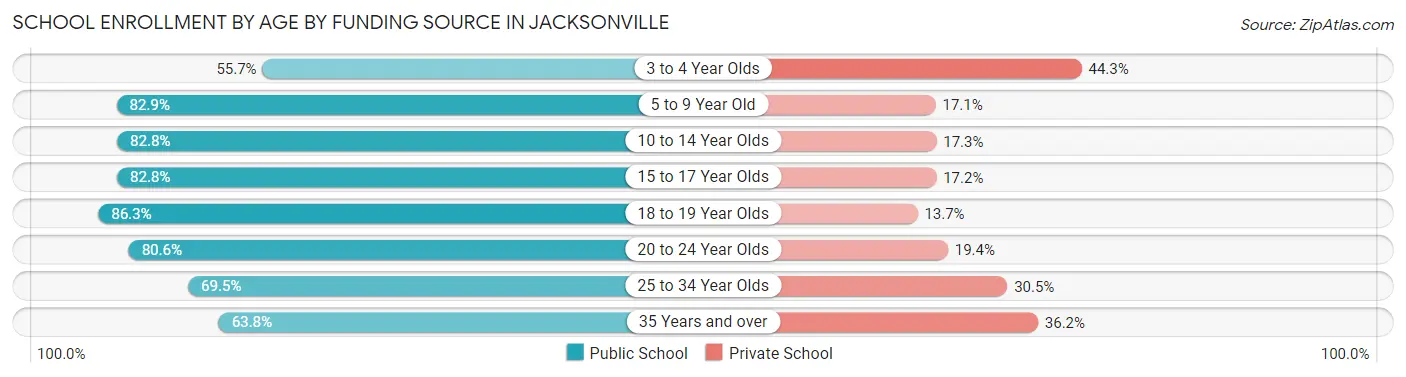
Out of a total of 222,904 students who are enrolled in schools in Jacksonville, 45,695 (20.5%) attend a private institution, while the remaining 177,209 (79.5%) are enrolled in public schools. The age group of 3 to 4 year olds has the highest likelihood of being enrolled in private schools, with 4,715 (44.3% in the age bracket) enrolled. Conversely, the age group of 18 to 19 year olds has the lowest likelihood of being enrolled in a private school, with 13,061 (86.3% in the age bracket) attending a public institution.
| Age Bracket | Public School | Private School |
| 3 to 4 Year Olds | 5,928 (55.7%) | 4,715 (44.3%) |
| 5 to 9 Year Old | 45,895 (82.9%) | 9,479 (17.1%) |
| 10 to 14 Year Olds | 49,232 (82.8%) | 10,264 (17.2%) |
| 15 to 17 Year Olds | 26,537 (82.8%) | 5,528 (17.2%) |
| 18 to 19 Year Olds | 13,061 (86.3%) | 2,081 (13.7%) |
| 20 to 24 Year Olds | 16,933 (80.6%) | 4,075 (19.4%) |
| 25 to 34 Year Olds | 11,365 (69.5%) | 4,979 (30.5%) |
| 35 Years and over | 8,191 (63.8%) | 4,641 (36.2%) |
| Total | 177,209 (79.5%) | 45,695 (20.5%) |
Educational Attainment by Field of Study in Jacksonville
Business (51,878 | 24.4%), science & technology (25,702 | 12.1%), education (24,013 | 11.3%), social sciences (13,645 | 6.4%), and arts & humanities (13,206 | 6.2%) are the most common fields of study among 212,719 individuals in Jacksonville who have obtained a bachelor's degree or higher.

| Field of Study | # Graduates | % Graduates |
| Computers & Mathematics | 12,868 | 6.0% |
| Bio, Nature & Agricultural | 9,921 | 4.7% |
| Physical & Health Sciences | 4,931 | 2.3% |
| Psychology | 11,217 | 5.3% |
| Social Sciences | 13,645 | 6.4% |
| Engineering | 12,732 | 6.0% |
| Multidisciplinary Studies | 2,017 | 0.9% |
| Science & Technology | 25,702 | 12.1% |
| Business | 51,878 | 24.4% |
| Education | 24,013 | 11.3% |
| Literature & Languages | 6,645 | 3.1% |
| Liberal Arts & History | 7,722 | 3.6% |
| Visual & Performing Arts | 7,592 | 3.6% |
| Communications | 8,630 | 4.1% |
| Arts & Humanities | 13,206 | 6.2% |
| Total | 212,719 | 100.0% |
Transportation & Commute in Jacksonville
Vehicle Availability by Sex in Jacksonville
The most prevalent vehicle ownership categories in Jacksonville are males with 2 vehicles (108,321, accounting for 45.3%) and females with 2 vehicles (93,701, making up 49.7%).
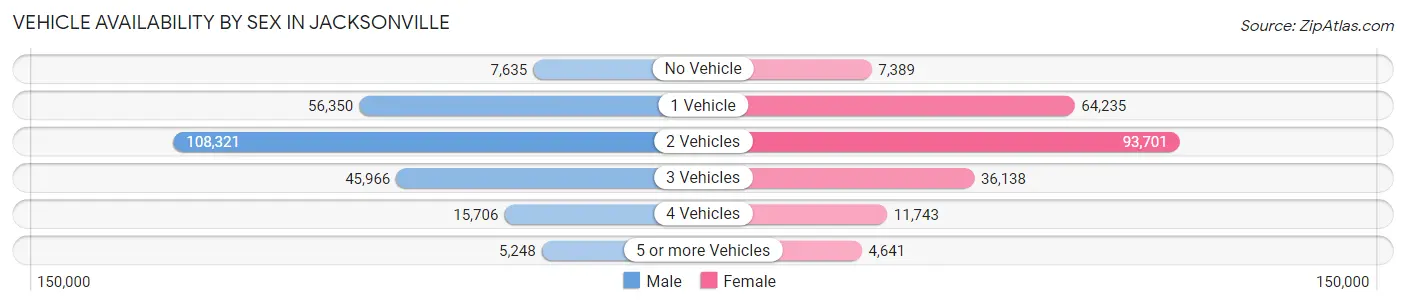
| Vehicles Available | Male | Female |
| No Vehicle | 7,635 (3.2%) | 7,389 (3.4%) |
| 1 Vehicle | 56,350 (23.6%) | 64,235 (29.5%) |
| 2 Vehicles | 108,321 (45.3%) | 93,701 (43.0%) |
| 3 Vehicles | 45,966 (19.2%) | 36,138 (16.6%) |
| 4 Vehicles | 15,706 (6.6%) | 11,743 (5.4%) |
| 5 or more Vehicles | 5,248 (2.2%) | 4,641 (2.1%) |
| Total | 239,226 (100.0%) | 217,847 (100.0%) |
Commute Time in Jacksonville
The most frequently occuring commute durations in Jacksonville are 30 to 34 minutes (78,360 commuters, 19.0%), 20 to 24 minutes (78,183 commuters, 19.0%), and 15 to 19 minutes (71,451 commuters, 17.3%).
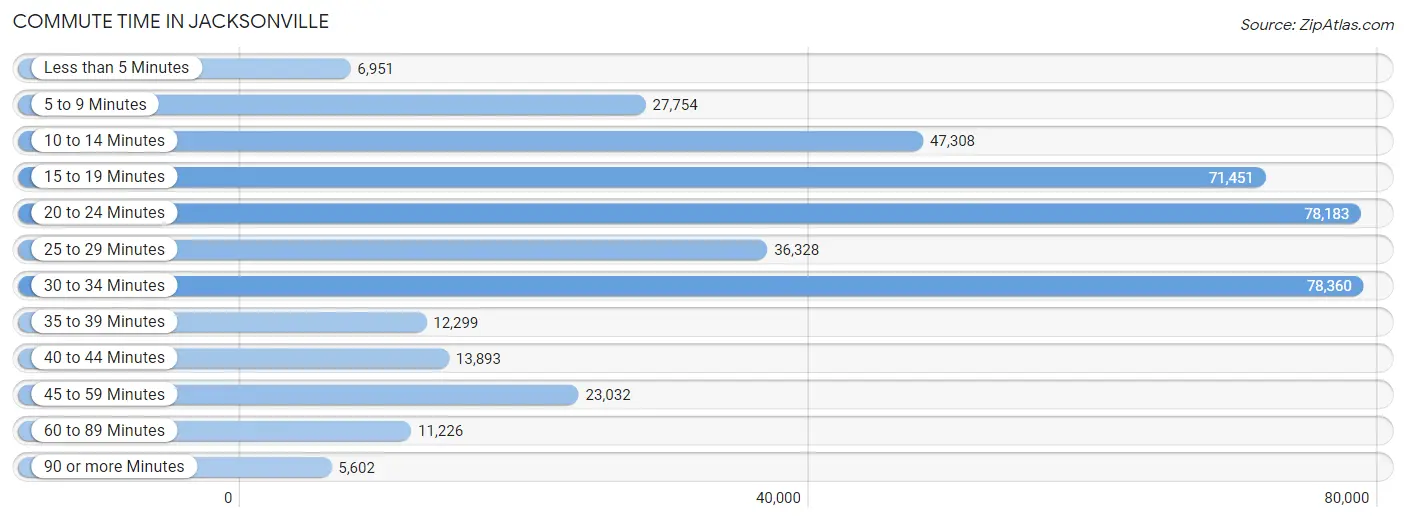
| Commute Time | # Commuters | % Commuters |
| Less than 5 Minutes | 6,951 | 1.7% |
| 5 to 9 Minutes | 27,754 | 6.7% |
| 10 to 14 Minutes | 47,308 | 11.5% |
| 15 to 19 Minutes | 71,451 | 17.3% |
| 20 to 24 Minutes | 78,183 | 19.0% |
| 25 to 29 Minutes | 36,328 | 8.8% |
| 30 to 34 Minutes | 78,360 | 19.0% |
| 35 to 39 Minutes | 12,299 | 3.0% |
| 40 to 44 Minutes | 13,893 | 3.4% |
| 45 to 59 Minutes | 23,032 | 5.6% |
| 60 to 89 Minutes | 11,226 | 2.7% |
| 90 or more Minutes | 5,602 | 1.4% |
Commute Time by Sex in Jacksonville
The most common commute times in Jacksonville are 30 to 34 minutes (42,138 commuters, 19.2%) for males and 20 to 24 minutes (36,997 commuters, 19.1%) for females.
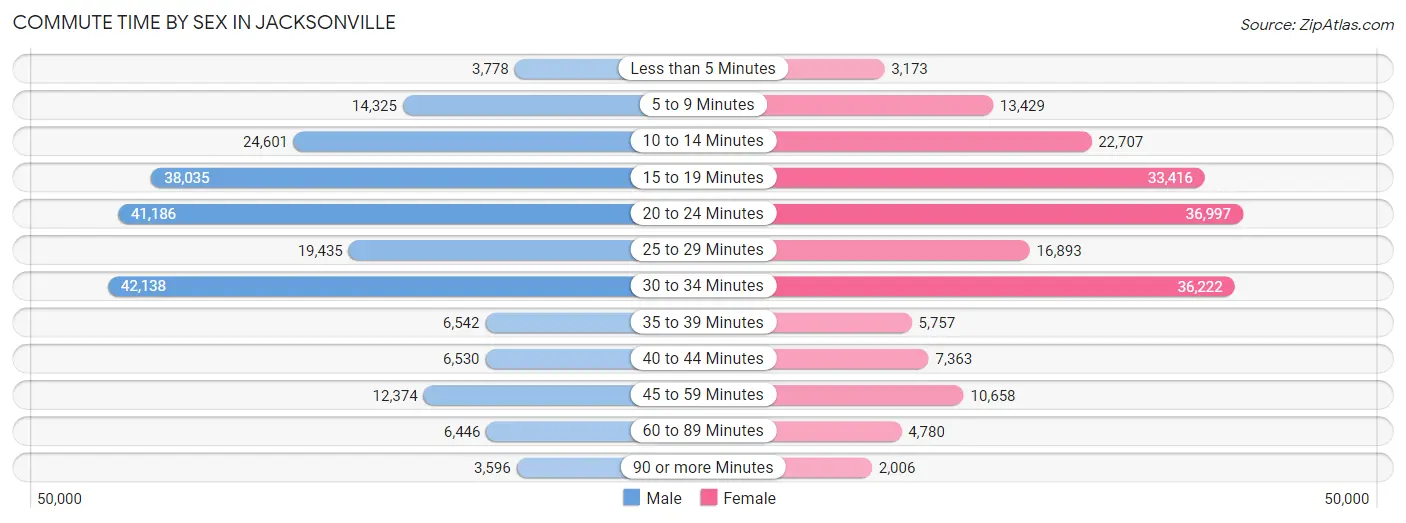
| Commute Time | Male | Female |
| Less than 5 Minutes | 3,778 (1.7%) | 3,173 (1.6%) |
| 5 to 9 Minutes | 14,325 (6.5%) | 13,429 (6.9%) |
| 10 to 14 Minutes | 24,601 (11.2%) | 22,707 (11.7%) |
| 15 to 19 Minutes | 38,035 (17.4%) | 33,416 (17.3%) |
| 20 to 24 Minutes | 41,186 (18.8%) | 36,997 (19.1%) |
| 25 to 29 Minutes | 19,435 (8.9%) | 16,893 (8.7%) |
| 30 to 34 Minutes | 42,138 (19.2%) | 36,222 (18.7%) |
| 35 to 39 Minutes | 6,542 (3.0%) | 5,757 (3.0%) |
| 40 to 44 Minutes | 6,530 (3.0%) | 7,363 (3.8%) |
| 45 to 59 Minutes | 12,374 (5.7%) | 10,658 (5.5%) |
| 60 to 89 Minutes | 6,446 (2.9%) | 4,780 (2.5%) |
| 90 or more Minutes | 3,596 (1.6%) | 2,006 (1.0%) |
Time of Departure to Work by Sex in Jacksonville
The most frequent times of departure to work in Jacksonville are 7:00 AM to 7:29 AM (31,134, 14.2%) for males and 7:00 AM to 7:29 AM (30,752, 15.9%) for females.
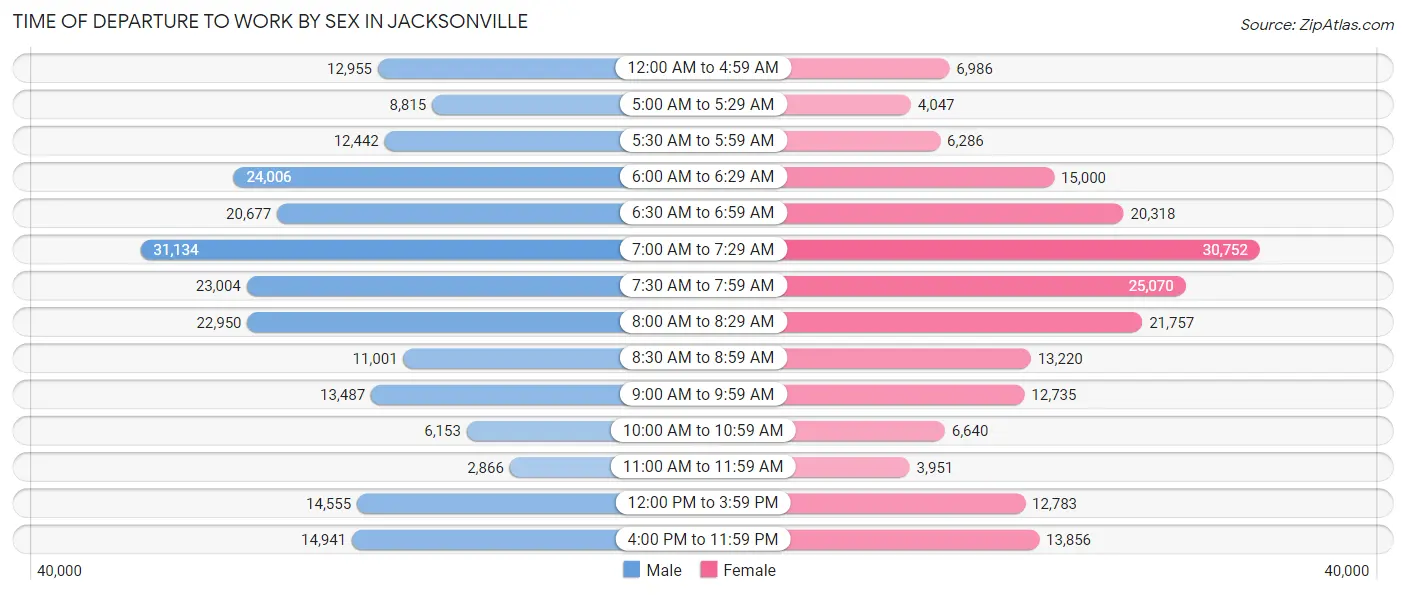
| Time of Departure | Male | Female |
| 12:00 AM to 4:59 AM | 12,955 (5.9%) | 6,986 (3.6%) |
| 5:00 AM to 5:29 AM | 8,815 (4.0%) | 4,047 (2.1%) |
| 5:30 AM to 5:59 AM | 12,442 (5.7%) | 6,286 (3.3%) |
| 6:00 AM to 6:29 AM | 24,006 (11.0%) | 15,000 (7.8%) |
| 6:30 AM to 6:59 AM | 20,677 (9.4%) | 20,318 (10.5%) |
| 7:00 AM to 7:29 AM | 31,134 (14.2%) | 30,752 (15.9%) |
| 7:30 AM to 7:59 AM | 23,004 (10.5%) | 25,070 (13.0%) |
| 8:00 AM to 8:29 AM | 22,950 (10.5%) | 21,757 (11.3%) |
| 8:30 AM to 8:59 AM | 11,001 (5.0%) | 13,220 (6.8%) |
| 9:00 AM to 9:59 AM | 13,487 (6.2%) | 12,735 (6.6%) |
| 10:00 AM to 10:59 AM | 6,153 (2.8%) | 6,640 (3.4%) |
| 11:00 AM to 11:59 AM | 2,866 (1.3%) | 3,951 (2.0%) |
| 12:00 PM to 3:59 PM | 14,555 (6.7%) | 12,783 (6.6%) |
| 4:00 PM to 11:59 PM | 14,941 (6.8%) | 13,856 (7.2%) |
| Total | 218,986 (100.0%) | 193,401 (100.0%) |
Housing Occupancy in Jacksonville
Occupancy by Ownership in Jacksonville
Of the total 375,851 dwellings in Jacksonville, owner-occupied units account for 214,163 (57.0%), while renter-occupied units make up 161,688 (43.0%).
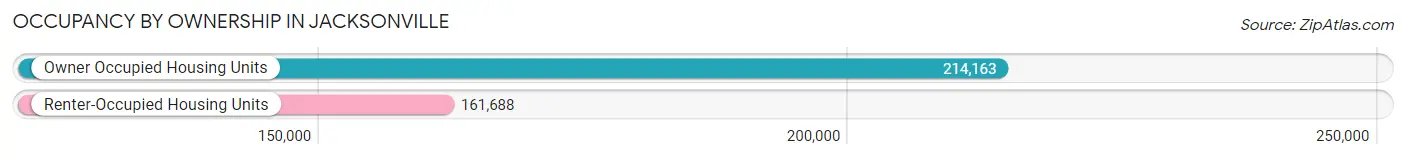
| Occupancy | # Housing Units | % Housing Units |
| Owner Occupied Housing Units | 214,163 | 57.0% |
| Renter-Occupied Housing Units | 161,688 | 43.0% |
| Total Occupied Housing Units | 375,851 | 100.0% |
Occupancy by Household Size in Jacksonville
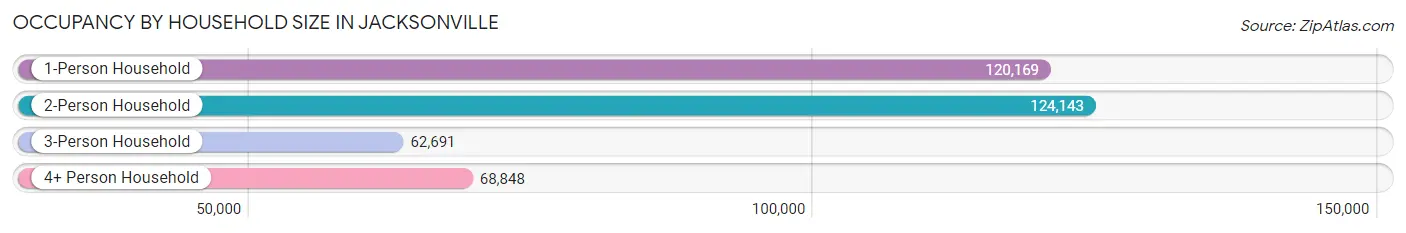
| Household Size | # Housing Units | % Housing Units |
| 1-Person Household | 120,169 | 32.0% |
| 2-Person Household | 124,143 | 33.0% |
| 3-Person Household | 62,691 | 16.7% |
| 4+ Person Household | 68,848 | 18.3% |
| Total Housing Units | 375,851 | 100.0% |
Occupancy by Ownership by Household Size in Jacksonville
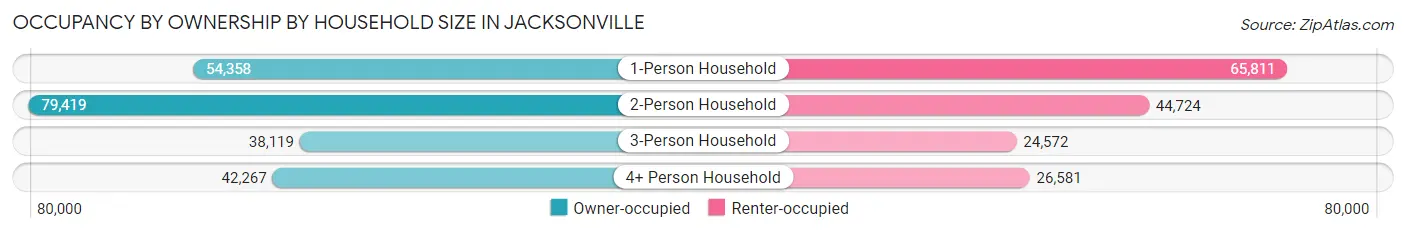
| Household Size | Owner-occupied | Renter-occupied |
| 1-Person Household | 54,358 (45.2%) | 65,811 (54.8%) |
| 2-Person Household | 79,419 (64.0%) | 44,724 (36.0%) |
| 3-Person Household | 38,119 (60.8%) | 24,572 (39.2%) |
| 4+ Person Household | 42,267 (61.4%) | 26,581 (38.6%) |
| Total Housing Units | 214,163 (57.0%) | 161,688 (43.0%) |
Occupancy by Educational Attainment in Jacksonville
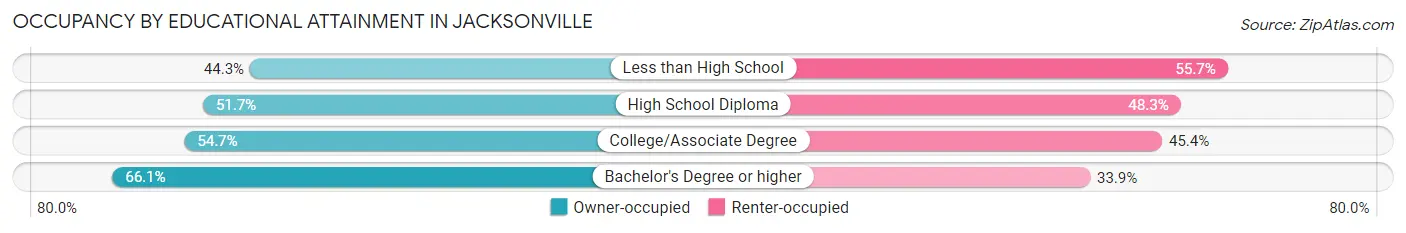
| Household Size | Owner-occupied | Renter-occupied |
| Less than High School | 12,769 (44.3%) | 16,080 (55.7%) |
| High School Diploma | 48,372 (51.7%) | 45,168 (48.3%) |
| College/Associate Degree | 69,120 (54.6%) | 57,366 (45.4%) |
| Bachelor's Degree or higher | 83,902 (66.1%) | 43,074 (33.9%) |
Occupancy by Age of Householder in Jacksonville
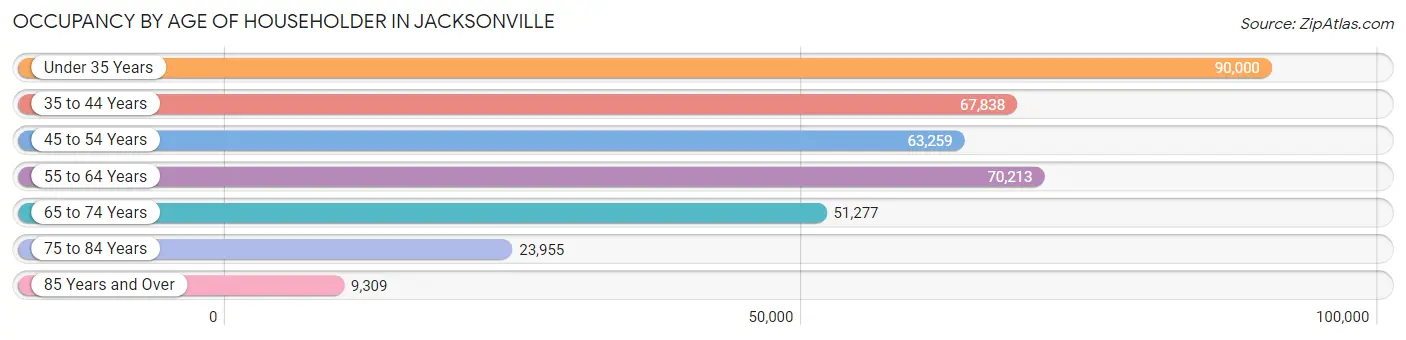
| Age Bracket | # Households | % Households |
| Under 35 Years | 90,000 | 23.9% |
| 35 to 44 Years | 67,838 | 18.0% |
| 45 to 54 Years | 63,259 | 16.8% |
| 55 to 64 Years | 70,213 | 18.7% |
| 65 to 74 Years | 51,277 | 13.6% |
| 75 to 84 Years | 23,955 | 6.4% |
| 85 Years and Over | 9,309 | 2.5% |
| Total | 375,851 | 100.0% |
Housing Finances in Jacksonville
Median Income by Occupancy in Jacksonville
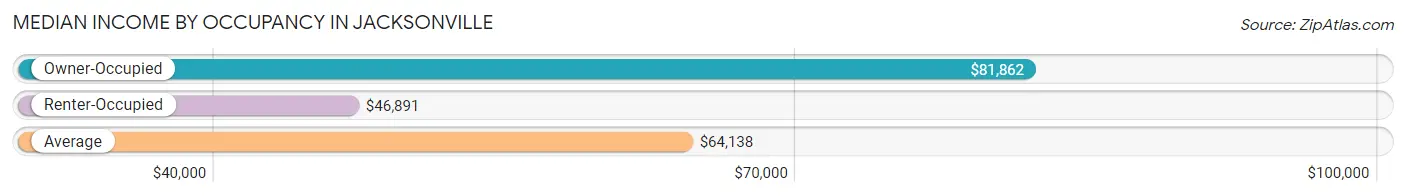
| Occupancy Type | # Households | Median Income |
| Owner-Occupied | 214,163 (57.0%) | $81,862 |
| Renter-Occupied | 161,688 (43.0%) | $46,891 |
| Average | 375,851 (100.0%) | $64,138 |
Occupancy by Householder Income Bracket in Jacksonville
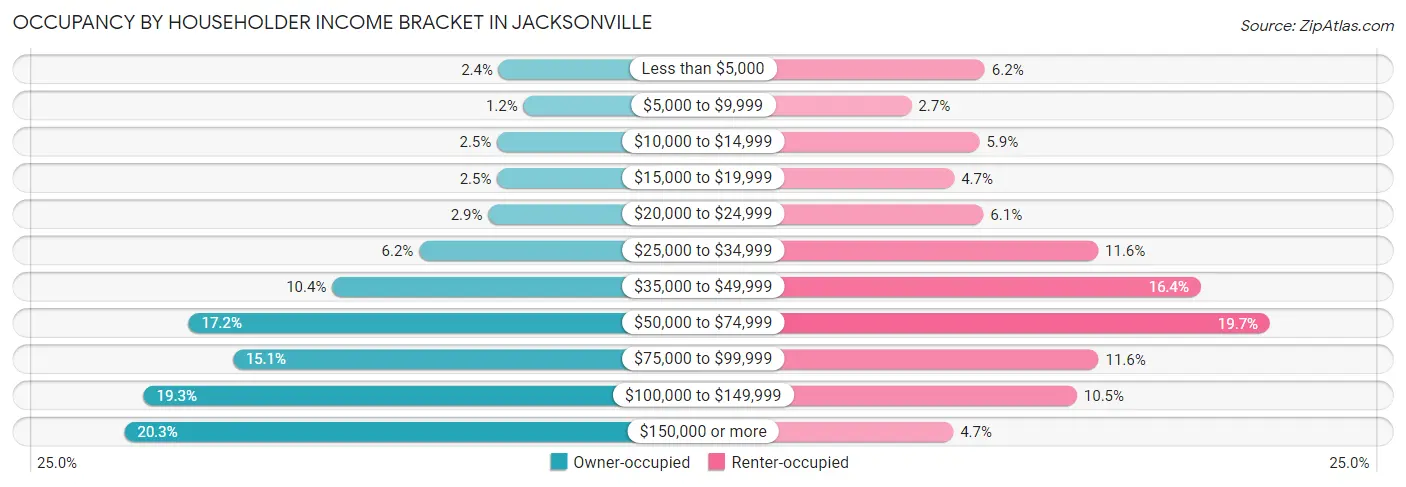
| Income Bracket | Owner-occupied | Renter-occupied |
| Less than $5,000 | 5,184 (2.4%) | 9,964 (6.2%) |
| $5,000 to $9,999 | 2,659 (1.2%) | 4,307 (2.7%) |
| $10,000 to $14,999 | 5,362 (2.5%) | 9,545 (5.9%) |
| $15,000 to $19,999 | 5,326 (2.5%) | 7,598 (4.7%) |
| $20,000 to $24,999 | 6,263 (2.9%) | 9,850 (6.1%) |
| $25,000 to $34,999 | 13,307 (6.2%) | 18,672 (11.6%) |
| $35,000 to $49,999 | 22,174 (10.3%) | 26,580 (16.4%) |
| $50,000 to $74,999 | 36,804 (17.2%) | 31,901 (19.7%) |
| $75,000 to $99,999 | 32,326 (15.1%) | 18,707 (11.6%) |
| $100,000 to $149,999 | 41,391 (19.3%) | 17,041 (10.5%) |
| $150,000 or more | 43,367 (20.3%) | 7,523 (4.6%) |
| Total | 214,163 (100.0%) | 161,688 (100.0%) |
Monthly Housing Cost Tiers in Jacksonville
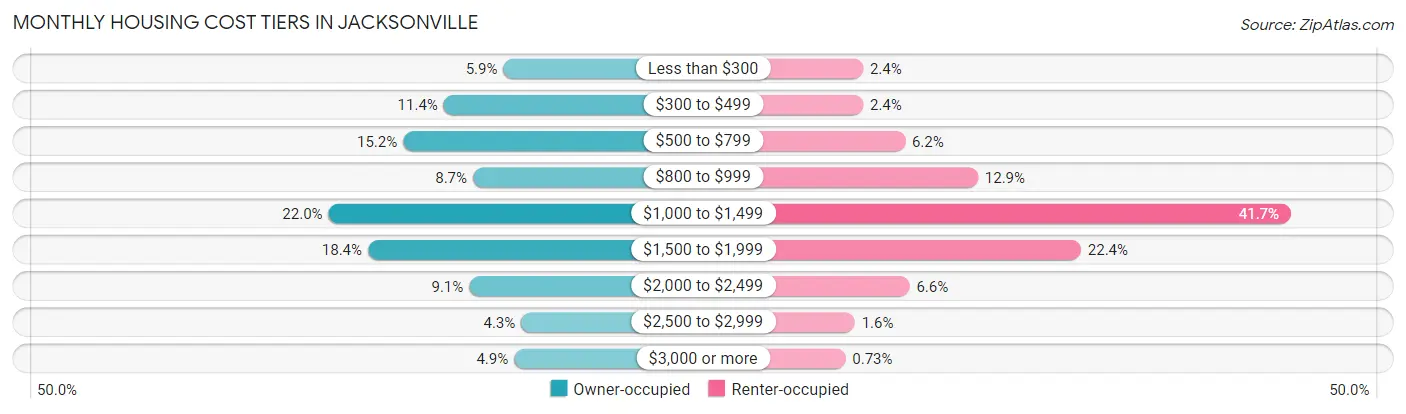
| Monthly Cost | Owner-occupied | Renter-occupied |
| Less than $300 | 12,704 (5.9%) | 3,797 (2.4%) |
| $300 to $499 | 24,468 (11.4%) | 3,809 (2.4%) |
| $500 to $799 | 32,477 (15.2%) | 10,052 (6.2%) |
| $800 to $999 | 18,699 (8.7%) | 20,910 (12.9%) |
| $1,000 to $1,499 | 47,178 (22.0%) | 67,485 (41.7%) |
| $1,500 to $1,999 | 39,416 (18.4%) | 36,232 (22.4%) |
| $2,000 to $2,499 | 19,441 (9.1%) | 10,726 (6.6%) |
| $2,500 to $2,999 | 9,192 (4.3%) | 2,567 (1.6%) |
| $3,000 or more | 10,588 (4.9%) | 1,183 (0.7%) |
| Total | 214,163 (100.0%) | 161,688 (100.0%) |
Physical Housing Characteristics in Jacksonville
Housing Structures in Jacksonville
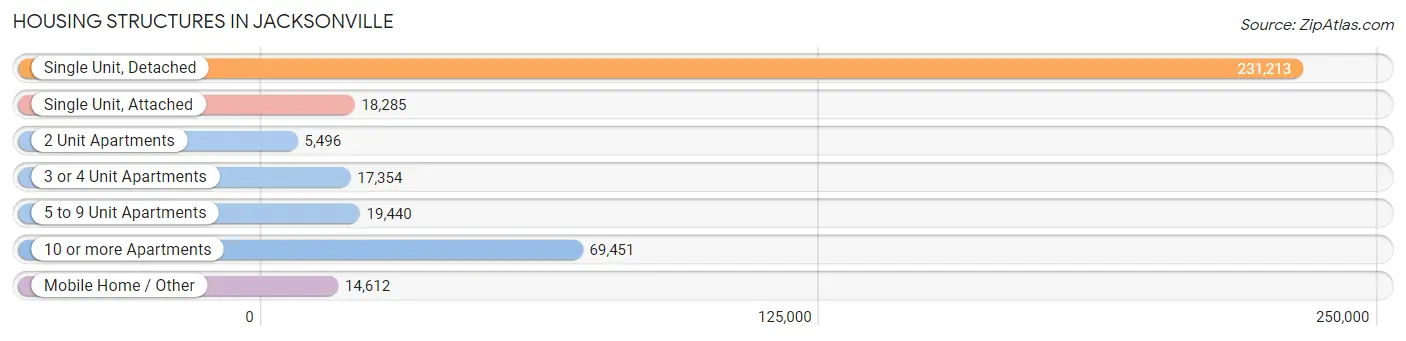
| Structure Type | # Housing Units | % Housing Units |
| Single Unit, Detached | 231,213 | 61.5% |
| Single Unit, Attached | 18,285 | 4.9% |
| 2 Unit Apartments | 5,496 | 1.5% |
| 3 or 4 Unit Apartments | 17,354 | 4.6% |
| 5 to 9 Unit Apartments | 19,440 | 5.2% |
| 10 or more Apartments | 69,451 | 18.5% |
| Mobile Home / Other | 14,612 | 3.9% |
| Total | 375,851 | 100.0% |
Housing Structures by Occupancy in Jacksonville
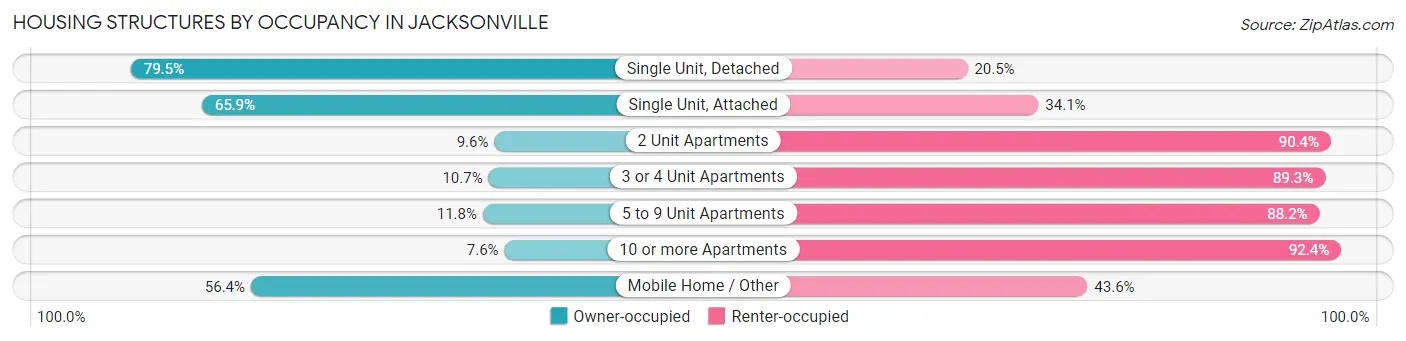
| Structure Type | Owner-occupied | Renter-occupied |
| Single Unit, Detached | 183,910 (79.5%) | 47,303 (20.5%) |
| Single Unit, Attached | 12,045 (65.9%) | 6,240 (34.1%) |
| 2 Unit Apartments | 526 (9.6%) | 4,970 (90.4%) |
| 3 or 4 Unit Apartments | 1,853 (10.7%) | 15,501 (89.3%) |
| 5 to 9 Unit Apartments | 2,290 (11.8%) | 17,150 (88.2%) |
| 10 or more Apartments | 5,292 (7.6%) | 64,159 (92.4%) |
| Mobile Home / Other | 8,247 (56.4%) | 6,365 (43.6%) |
| Total | 214,163 (57.0%) | 161,688 (43.0%) |
Housing Structures by Number of Rooms in Jacksonville
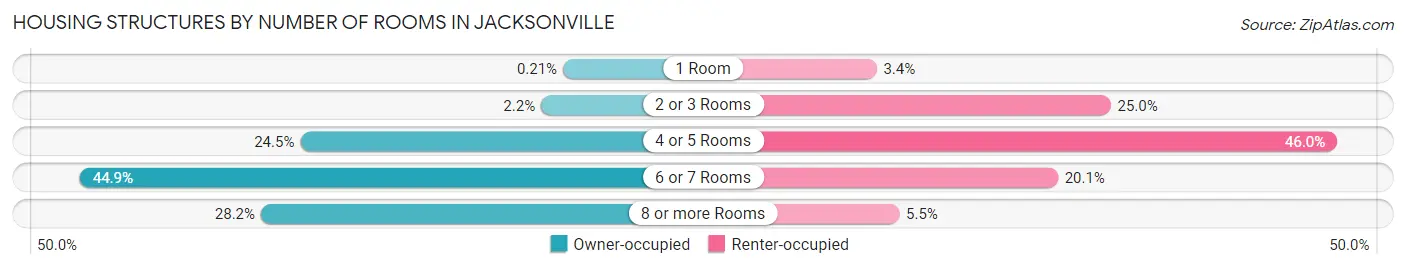
| Number of Rooms | Owner-occupied | Renter-occupied |
| 1 Room | 445 (0.2%) | 5,469 (3.4%) |
| 2 or 3 Rooms | 4,806 (2.2%) | 40,473 (25.0%) |
| 4 or 5 Rooms | 52,494 (24.5%) | 74,342 (46.0%) |
| 6 or 7 Rooms | 96,131 (44.9%) | 32,560 (20.1%) |
| 8 or more Rooms | 60,287 (28.1%) | 8,844 (5.5%) |
| Total | 214,163 (100.0%) | 161,688 (100.0%) |
Housing Structure by Heating Type in Jacksonville
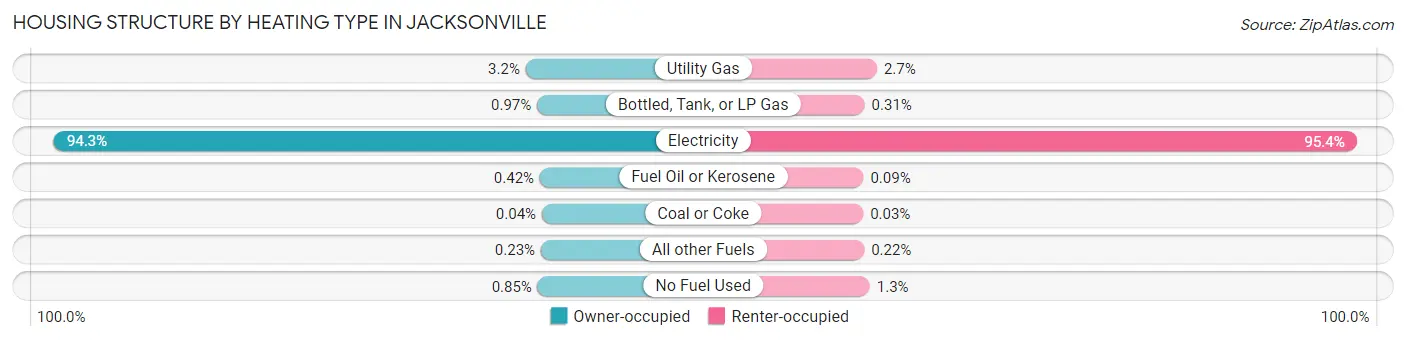
| Heating Type | Owner-occupied | Renter-occupied |
| Utility Gas | 6,762 (3.2%) | 4,344 (2.7%) |
| Bottled, Tank, or LP Gas | 2,067 (1.0%) | 503 (0.3%) |
| Electricity | 202,045 (94.3%) | 154,163 (95.4%) |
| Fuel Oil or Kerosene | 895 (0.4%) | 149 (0.1%) |
| Coal or Coke | 83 (0.0%) | 48 (0.0%) |
| All other Fuels | 497 (0.2%) | 360 (0.2%) |
| No Fuel Used | 1,814 (0.9%) | 2,121 (1.3%) |
| Total | 214,163 (100.0%) | 161,688 (100.0%) |
Household Vehicle Usage in Jacksonville
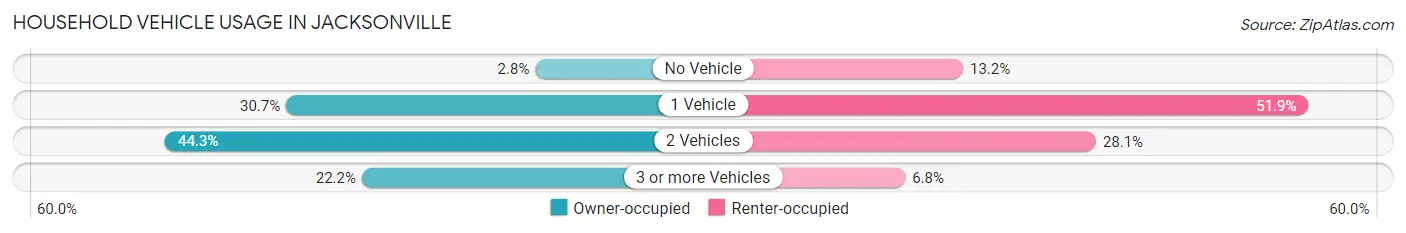
| Vehicles per Household | Owner-occupied | Renter-occupied |
| No Vehicle | 6,004 (2.8%) | 21,390 (13.2%) |
| 1 Vehicle | 65,760 (30.7%) | 83,918 (51.9%) |
| 2 Vehicles | 94,787 (44.3%) | 45,474 (28.1%) |
| 3 or more Vehicles | 47,612 (22.2%) | 10,906 (6.8%) |
| Total | 214,163 (100.0%) | 161,688 (100.0%) |
Real Estate & Mortgages in Jacksonville
Real Estate and Mortgage Overview in Jacksonville
| Characteristic | Without Mortgage | With Mortgage |
| Housing Units | 74,028 | 140,135 |
| Median Property Value | $207,300 | $257,700 |
| Median Household Income | $63,254 | $32,690 |
| Monthly Housing Costs | $511 | $10,078 |
| Real Estate Taxes | $1,549 | $6,195 |
Property Value by Mortgage Status in Jacksonville
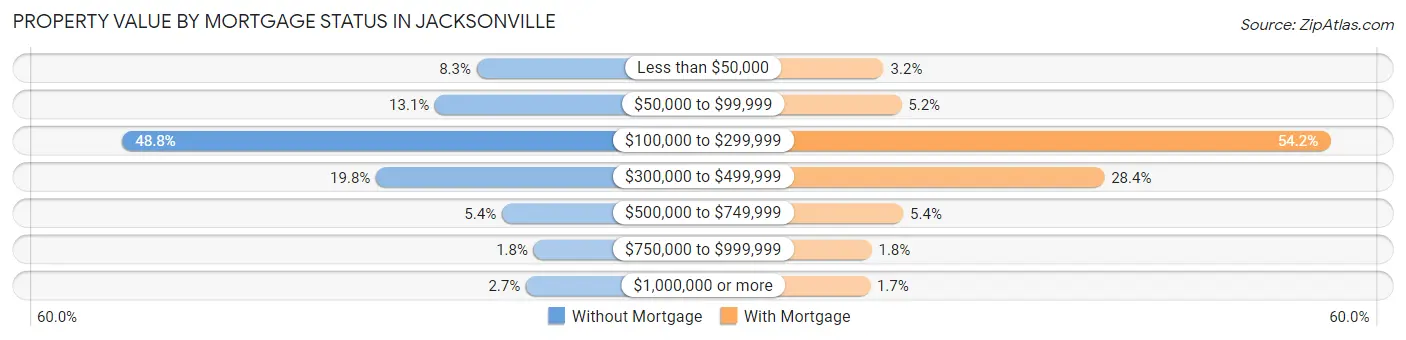
| Property Value | Without Mortgage | With Mortgage |
| Less than $50,000 | 6,159 (8.3%) | 4,495 (3.2%) |
| $50,000 to $99,999 | 9,686 (13.1%) | 7,331 (5.2%) |
| $100,000 to $299,999 | 36,144 (48.8%) | 75,986 (54.2%) |
| $300,000 to $499,999 | 14,676 (19.8%) | 39,829 (28.4%) |
| $500,000 to $749,999 | 4,029 (5.4%) | 7,617 (5.4%) |
| $750,000 to $999,999 | 1,341 (1.8%) | 2,561 (1.8%) |
| $1,000,000 or more | 1,993 (2.7%) | 2,316 (1.7%) |
| Total | 74,028 (100.0%) | 140,135 (100.0%) |
Household Income by Mortgage Status in Jacksonville
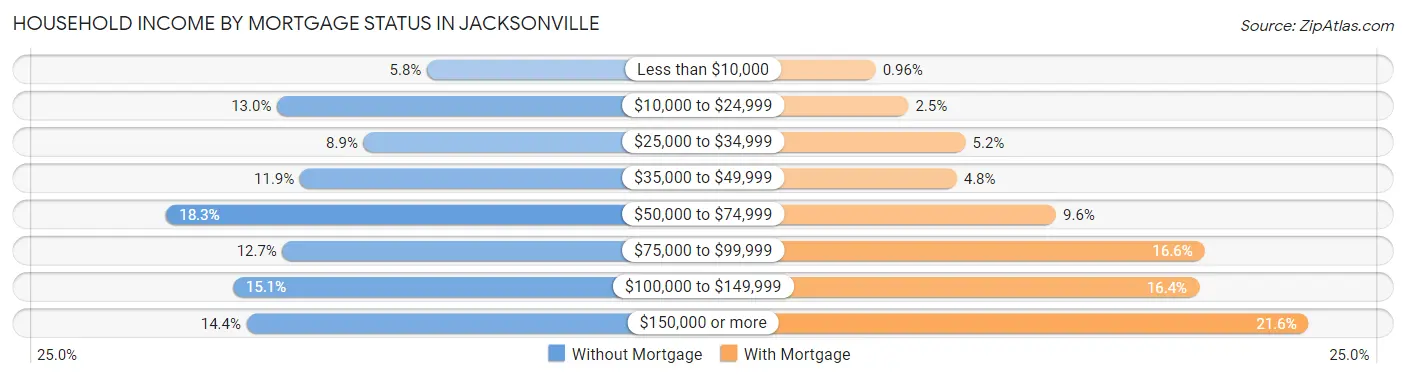
| Household Income | Without Mortgage | With Mortgage |
| Less than $10,000 | 4,316 (5.8%) | 1,343 (1.0%) |
| $10,000 to $24,999 | 9,604 (13.0%) | 3,527 (2.5%) |
| $25,000 to $34,999 | 6,548 (8.8%) | 7,347 (5.2%) |
| $35,000 to $49,999 | 8,797 (11.9%) | 6,759 (4.8%) |
| $50,000 to $74,999 | 13,513 (18.2%) | 13,377 (9.6%) |
| $75,000 to $99,999 | 9,407 (12.7%) | 23,291 (16.6%) |
| $100,000 to $149,999 | 11,166 (15.1%) | 22,919 (16.4%) |
| $150,000 or more | 10,677 (14.4%) | 30,225 (21.6%) |
| Total | 74,028 (100.0%) | 140,135 (100.0%) |
Property Value to Household Income Ratio in Jacksonville
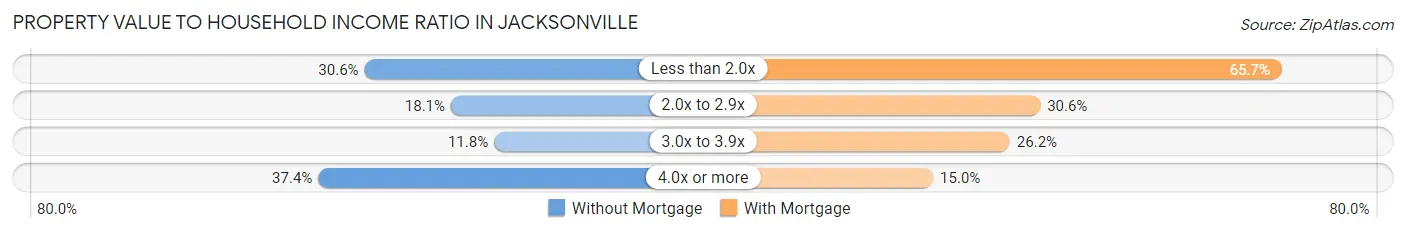
| Value-to-Income Ratio | Without Mortgage | With Mortgage |
| Less than 2.0x | 22,677 (30.6%) | 92,003 (65.6%) |
| 2.0x to 2.9x | 13,374 (18.1%) | 42,808 (30.5%) |
| 3.0x to 3.9x | 8,734 (11.8%) | 36,642 (26.2%) |
| 4.0x or more | 27,651 (37.3%) | 21,023 (15.0%) |
| Total | 74,028 (100.0%) | 140,135 (100.0%) |
Real Estate Taxes by Mortgage Status in Jacksonville
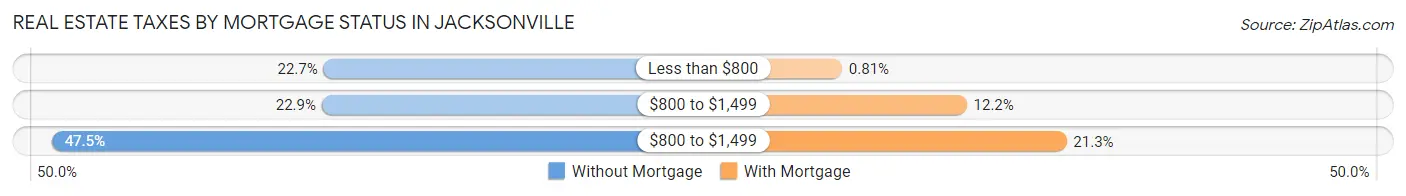
| Property Taxes | Without Mortgage | With Mortgage |
| Less than $800 | 16,806 (22.7%) | 1,142 (0.8%) |
| $800 to $1,499 | 16,923 (22.9%) | 17,097 (12.2%) |
| $800 to $1,499 | 35,176 (47.5%) | 29,862 (21.3%) |
| Total | 74,028 (100.0%) | 140,135 (100.0%) |
Health & Disability in Jacksonville
Health Insurance Coverage by Age in Jacksonville
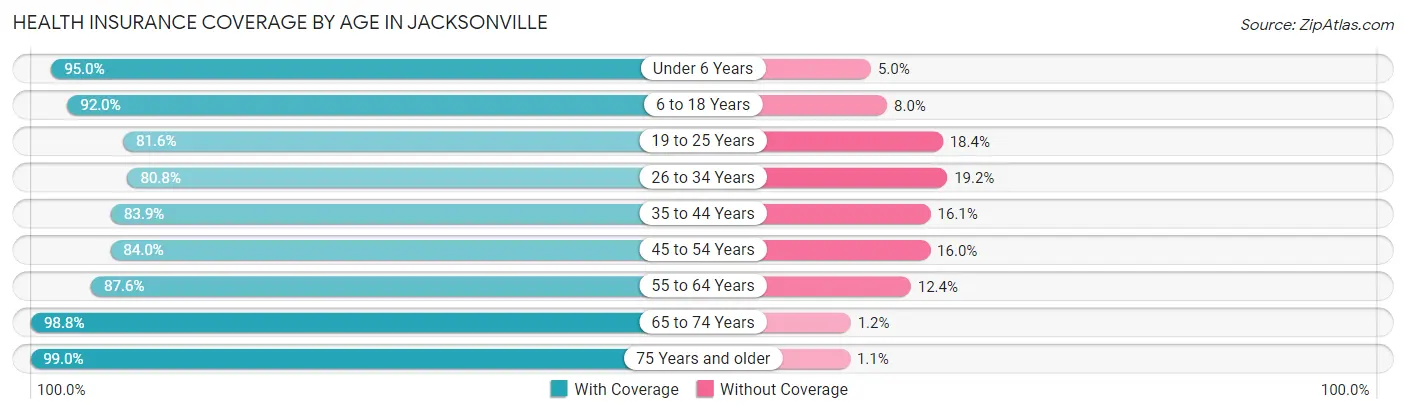
| Age Bracket | With Coverage | Without Coverage |
| Under 6 Years | 71,477 (95.0%) | 3,738 (5.0%) |
| 6 to 18 Years | 140,099 (92.0%) | 12,154 (8.0%) |
| 19 to 25 Years | 68,089 (81.6%) | 15,311 (18.4%) |
| 26 to 34 Years | 106,373 (80.8%) | 25,260 (19.2%) |
| 35 to 44 Years | 101,893 (83.9%) | 19,554 (16.1%) |
| 45 to 54 Years | 94,416 (84.0%) | 18,003 (16.0%) |
| 55 to 64 Years | 103,150 (87.6%) | 14,599 (12.4%) |
| 65 to 74 Years | 81,350 (98.8%) | 984 (1.2%) |
| 75 Years and older | 49,826 (99.0%) | 528 (1.1%) |
| Total | 816,673 (88.1%) | 110,131 (11.9%) |
Health Insurance Coverage by Citizenship Status in Jacksonville
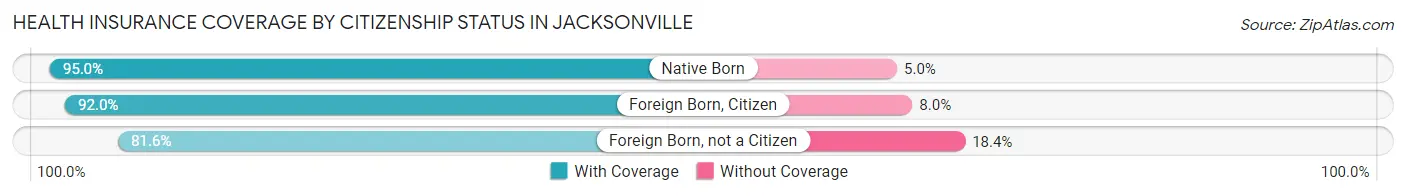
| Citizenship Status | With Coverage | Without Coverage |
| Native Born | 71,477 (95.0%) | 3,738 (5.0%) |
| Foreign Born, Citizen | 140,099 (92.0%) | 12,154 (8.0%) |
| Foreign Born, not a Citizen | 68,089 (81.6%) | 15,311 (18.4%) |
Health Insurance Coverage by Household Income in Jacksonville
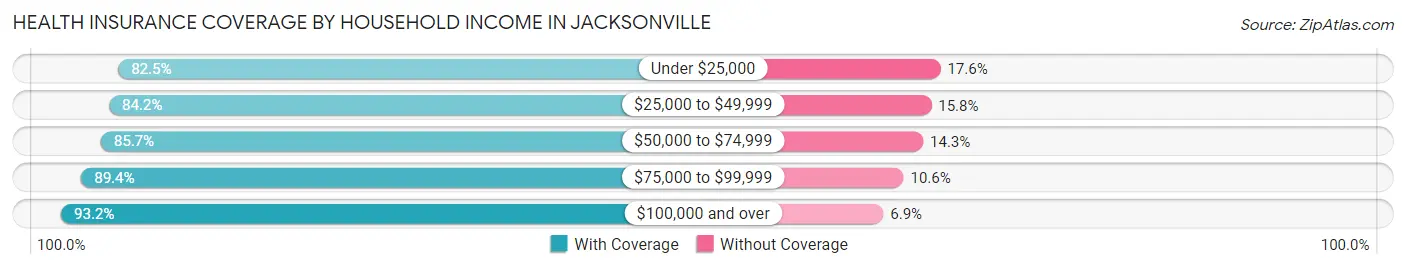
| Household Income | With Coverage | Without Coverage |
| Under $25,000 | 99,983 (82.5%) | 21,282 (17.5%) |
| $25,000 to $49,999 | 144,570 (84.2%) | 27,190 (15.8%) |
| $50,000 to $74,999 | 139,776 (85.7%) | 23,329 (14.3%) |
| $75,000 to $99,999 | 117,635 (89.4%) | 13,998 (10.6%) |
| $100,000 and over | 305,555 (93.1%) | 22,465 (6.9%) |
Public vs Private Health Insurance Coverage by Age in Jacksonville
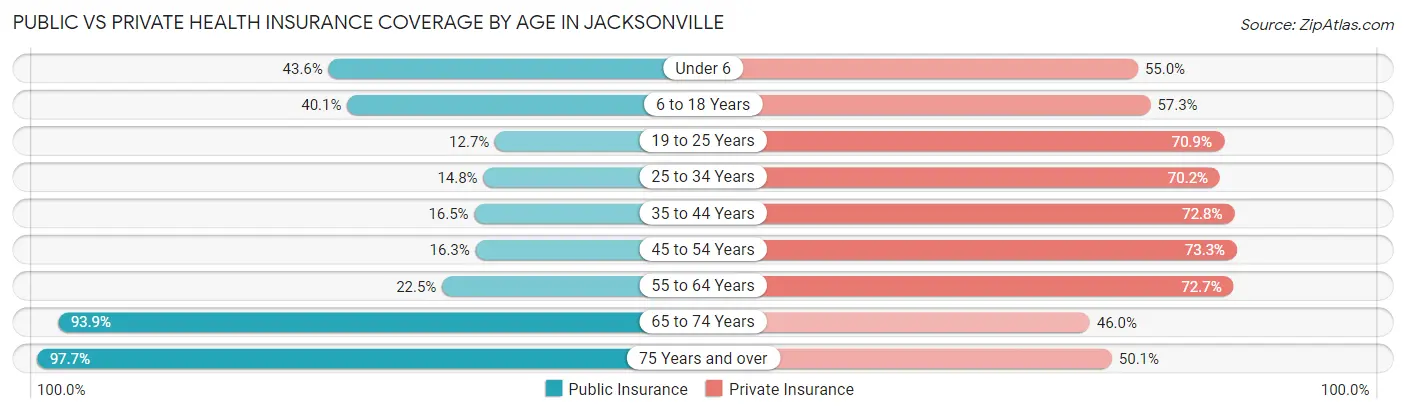
| Age Bracket | Public Insurance | Private Insurance |
| Under 6 | 32,771 (43.6%) | 41,342 (55.0%) |
| 6 to 18 Years | 61,061 (40.1%) | 87,231 (57.3%) |
| 19 to 25 Years | 10,555 (12.7%) | 59,131 (70.9%) |
| 25 to 34 Years | 19,527 (14.8%) | 92,376 (70.2%) |
| 35 to 44 Years | 20,043 (16.5%) | 88,459 (72.8%) |
| 45 to 54 Years | 18,313 (16.3%) | 82,444 (73.3%) |
| 55 to 64 Years | 26,486 (22.5%) | 85,607 (72.7%) |
| 65 to 74 Years | 77,271 (93.9%) | 37,902 (46.0%) |
| 75 Years and over | 49,214 (97.7%) | 25,242 (50.1%) |
| Total | 315,241 (34.0%) | 599,734 (64.7%) |
Disability Status by Sex by Age in Jacksonville
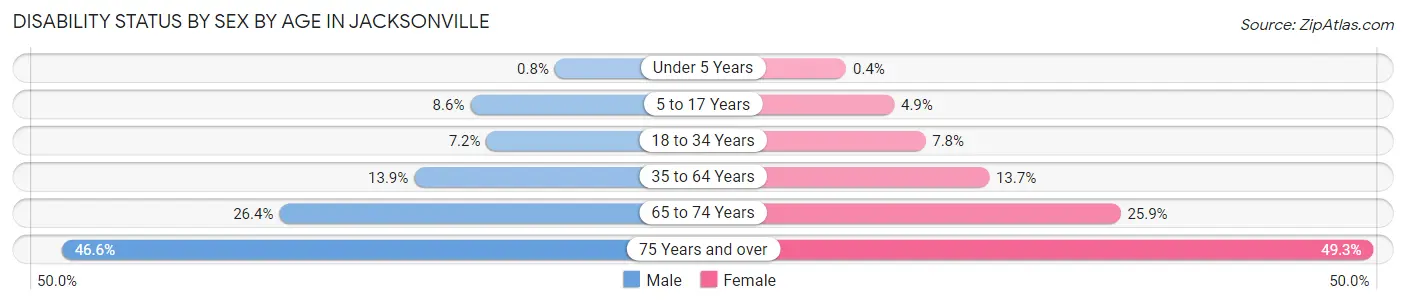
| Age Bracket | Male | Female |
| Under 5 Years | 255 (0.8%) | 123 (0.4%) |
| 5 to 17 Years | 6,679 (8.6%) | 3,641 (4.9%) |
| 18 to 34 Years | 7,855 (7.1%) | 9,124 (7.7%) |
| 35 to 64 Years | 23,407 (13.9%) | 24,944 (13.7%) |
| 65 to 74 Years | 9,765 (26.4%) | 11,712 (25.9%) |
| 75 Years and over | 9,235 (46.6%) | 15,052 (49.3%) |
Disability Class by Sex by Age in Jacksonville
Disability Class: Hearing Difficulty
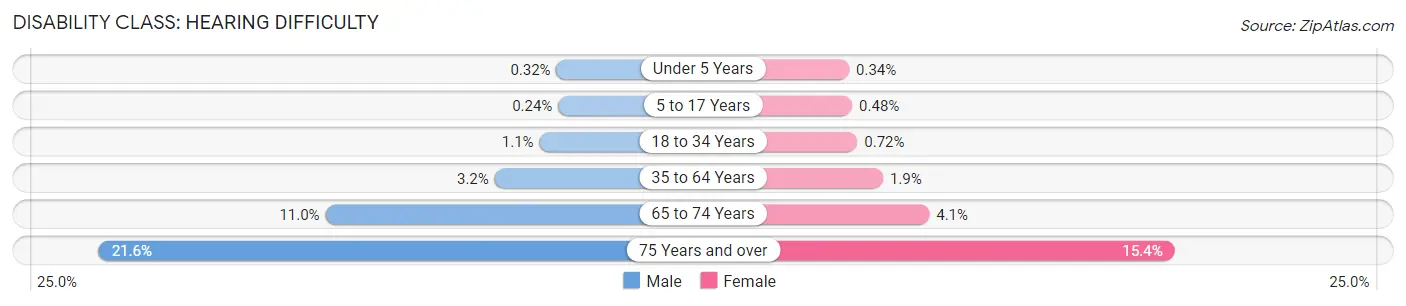
| Age Bracket | Male | Female |
| Under 5 Years | 102 (0.3%) | 105 (0.3%) |
| 5 to 17 Years | 185 (0.2%) | 363 (0.5%) |
| 18 to 34 Years | 1,217 (1.1%) | 849 (0.7%) |
| 35 to 64 Years | 5,391 (3.2%) | 3,483 (1.9%) |
| 65 to 74 Years | 4,087 (11.0%) | 1,839 (4.1%) |
| 75 Years and over | 4,278 (21.6%) | 4,711 (15.4%) |
Disability Class: Vision Difficulty
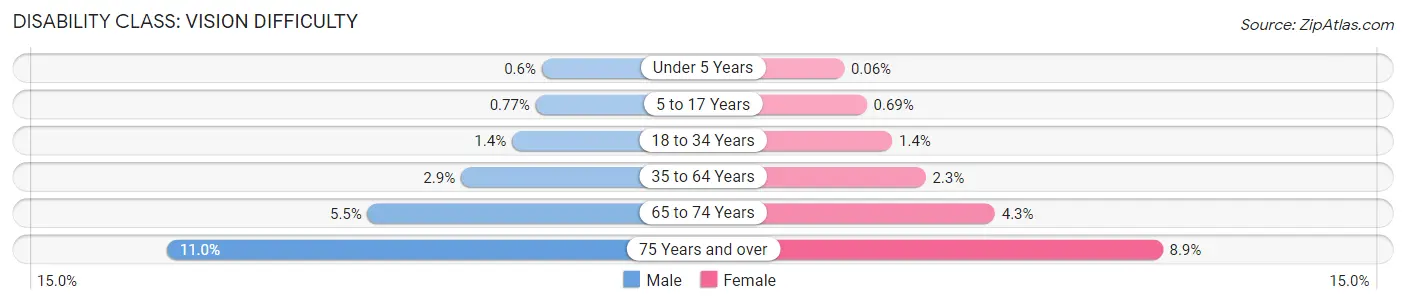
| Age Bracket | Male | Female |
| Under 5 Years | 191 (0.6%) | 18 (0.1%) |
| 5 to 17 Years | 596 (0.8%) | 518 (0.7%) |
| 18 to 34 Years | 1,577 (1.4%) | 1,645 (1.4%) |
| 35 to 64 Years | 4,810 (2.9%) | 4,251 (2.3%) |
| 65 to 74 Years | 2,018 (5.4%) | 1,931 (4.3%) |
| 75 Years and over | 2,190 (11.0%) | 2,724 (8.9%) |
Disability Class: Cognitive Difficulty
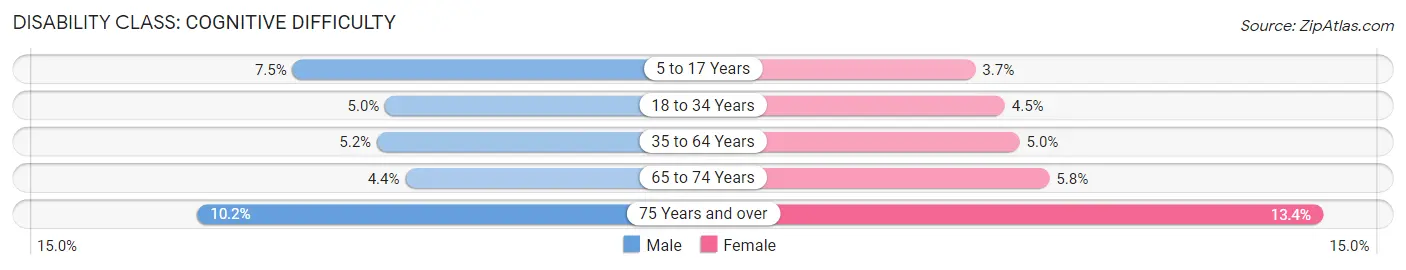
| Age Bracket | Male | Female |
| 5 to 17 Years | 5,827 (7.5%) | 2,794 (3.7%) |
| 18 to 34 Years | 5,451 (5.0%) | 5,347 (4.5%) |
| 35 to 64 Years | 8,766 (5.2%) | 9,049 (5.0%) |
| 65 to 74 Years | 1,629 (4.4%) | 2,619 (5.8%) |
| 75 Years and over | 2,022 (10.2%) | 4,087 (13.4%) |
Disability Class: Ambulatory Difficulty
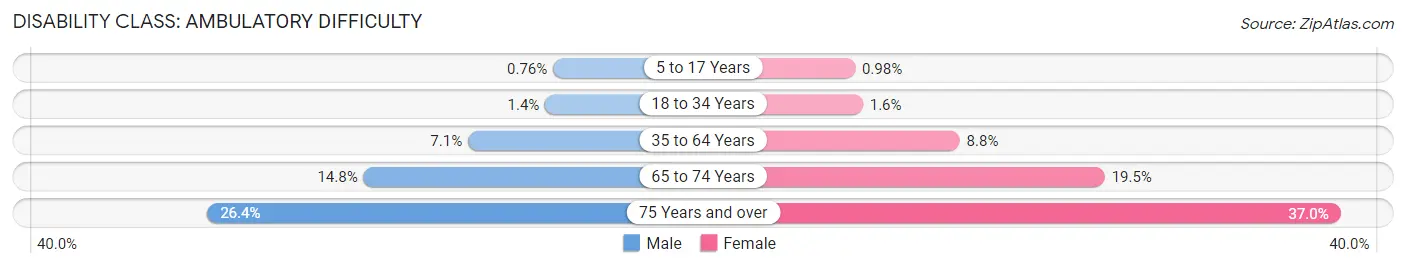
| Age Bracket | Male | Female |
| 5 to 17 Years | 589 (0.8%) | 736 (1.0%) |
| 18 to 34 Years | 1,484 (1.3%) | 1,833 (1.6%) |
| 35 to 64 Years | 11,972 (7.1%) | 15,987 (8.7%) |
| 65 to 74 Years | 5,497 (14.8%) | 8,840 (19.5%) |
| 75 Years and over | 5,246 (26.4%) | 11,300 (37.0%) |
Disability Class: Self-Care Difficulty
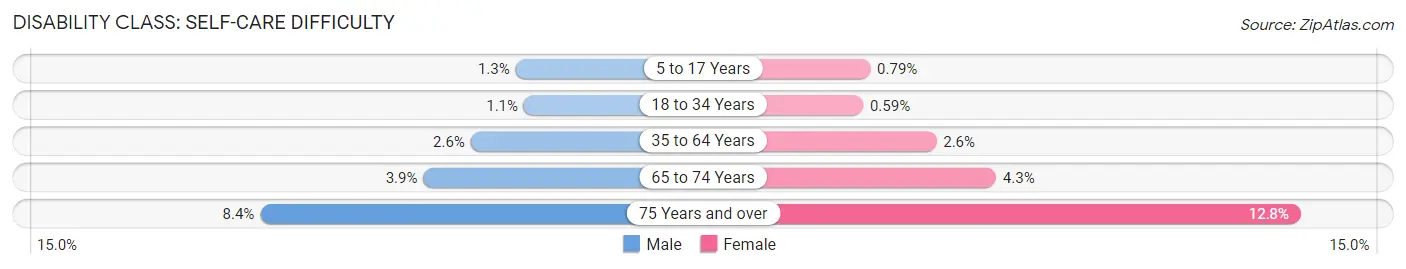
| Age Bracket | Male | Female |
| 5 to 17 Years | 1,028 (1.3%) | 594 (0.8%) |
| 18 to 34 Years | 1,206 (1.1%) | 690 (0.6%) |
| 35 to 64 Years | 4,359 (2.6%) | 4,799 (2.6%) |
| 65 to 74 Years | 1,446 (3.9%) | 1,944 (4.3%) |
| 75 Years and over | 1,674 (8.4%) | 3,900 (12.8%) |
Technology Access in Jacksonville
Computing Device Access in Jacksonville
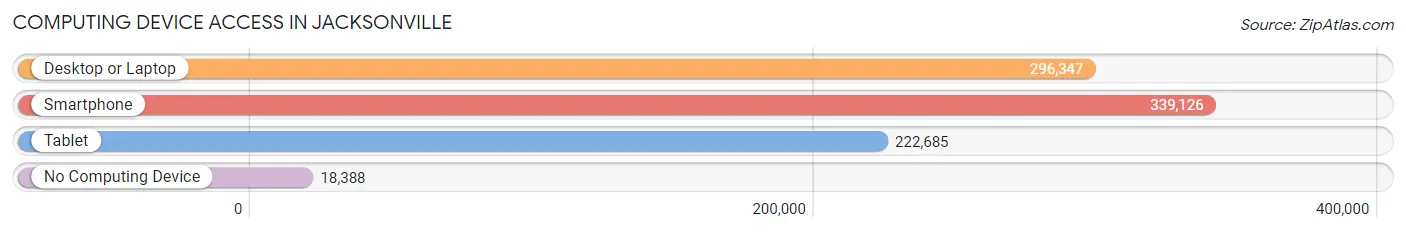
| Device Type | # Households | % Households |
| Desktop or Laptop | 296,347 | 78.8% |
| Smartphone | 339,126 | 90.2% |
| Tablet | 222,685 | 59.3% |
| No Computing Device | 18,388 | 4.9% |
| Total | 375,851 | 100.0% |
Internet Access in Jacksonville
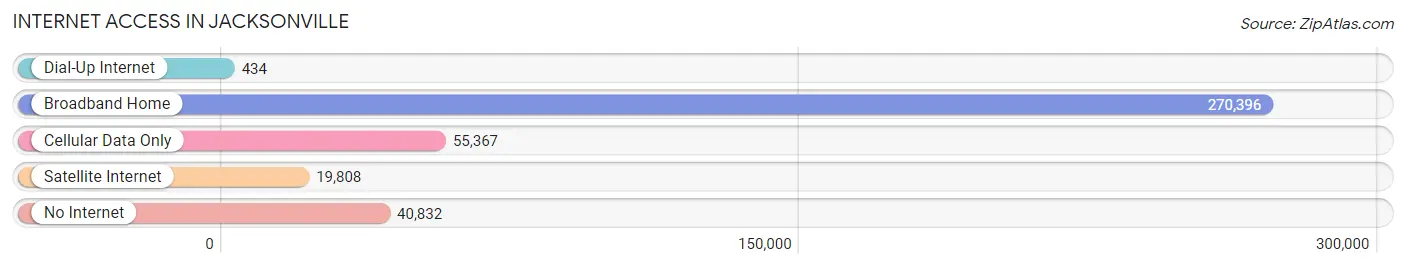
| Internet Type | # Households | % Households |
| Dial-Up Internet | 434 | 0.1% |
| Broadband Home | 270,396 | 71.9% |
| Cellular Data Only | 55,367 | 14.7% |
| Satellite Internet | 19,808 | 5.3% |
| No Internet | 40,832 | 10.9% |
| Total | 375,851 | 100.0% |
Jacksonville Summary
Jacksonville, Florida is the largest city in the state of Florida and the largest city by area in the contiguous United States. It is located in the First Coast region of northeast Florida, along the St. Johns River. Jacksonville is the county seat of Duval County, with which it is consolidated. The city is situated on the banks of the St. Johns River, in the First Coast region of northeast Florida, about 25 miles (40 km) south of the Georgia state line and about 340 miles (550 km) north of Miami.
History
The area of Jacksonville has been inhabited for thousands of years by various cultures of indigenous peoples. At the time of European contact, the area was inhabited by the Mocama, a coastal subgroup of the Timucua people. In 1564, French Huguenot explorer Jean Ribault charted the St. Johns River, calling it the River of May because he discovered it on May 1. Ribault erected a stone column at his landing site near the river's mouth, claiming the newly discovered land for France. In 1565, Spanish forces led by Pedro Menéndez de Avilés established the settlement of St. Augustine, the first European settlement in what is now the continental United States.
In 1822, a year after the United States acquired Florida from Spain, the town of Jacksonville was platted along the St. Johns River. The city was named after Andrew Jackson, the first military governor of the Florida Territory and seventh President of the United States. Jacksonville was incorporated as a city in 1832.
Geography
Jacksonville is located in the First Coast region of northeast Florida, along the St. Johns River. The city is situated on the banks of the St. Johns River, in the First Coast region of northeast Florida, about 25 miles (40 km) south of the Georgia state line and about 340 miles (550 km) north of Miami. The city is bordered by the St. Johns River to the south, the Atlantic Ocean to the east, the Intracoastal Waterway to the north, and the city of Baldwin to the west.
Economy
Jacksonville is a major business and financial center of the southeastern United States. The city is home to several major corporate headquarters, including CSX Corporation, Fidelity National Financial, FIS, Landstar System, and Web.com. The city is also home to several major military installations, including Naval Air Station Jacksonville, Naval Station Mayport, and Camp Blanding.
The Port of Jacksonville is the fourth largest port in the United States by tonnage, and the largest on the East Coast south of Norfolk, Virginia. The port handles mostly bulk cargo, such as coal, petroleum, and cement, as well as containers. The port is also a major cruise ship port, with several cruise lines operating out of the port.
Demographics
As of the 2010 census, Jacksonville had a population of 821,784, making it the most populous city in Florida and the twelfth most populous city in the United States. The city is the center of the Jacksonville metropolitan area, which had a population of 1,504,980 in 2019. The racial makeup of the city was 54.3% White, 32.2% African American, 5.2% Asian, 0.5% Native American, 0.1% Pacific Islander, 5.2% from other races, and 2.5% from two or more races. Hispanic or Latino of any race were 11.9% of the population.
The median household income in Jacksonville was $50,895 in 2019, and the median family income was $62,845. The per capita income for the city was $27,945. About 17.2% of the population was below the poverty line.
Common Questions
What is Per Capita Income in Jacksonville?
Per Capita income in Jacksonville is $35,870.
What is the Median Family Income in Jacksonville?
Median Family Income in Jacksonville is $77,309.
What is the Median Household income in Jacksonville?
Median Household Income in Jacksonville is $64,138.
What is Income or Wage Gap in Jacksonville?
Income or Wage Gap in Jacksonville is 21.9%.
Women in Jacksonville earn 78.1 cents for every dollar earned by a man.
What is Family Income Deficit in Jacksonville?
Family Income Deficit in Jacksonville is $10,997.
Families that are below poverty line in Jacksonville earn $10,997 less on average than the poverty threshold level.
What is Inequality or Gini Index in Jacksonville?
Inequality or Gini Index in Jacksonville is 0.47.
What is the Total Population of Jacksonville?
Total Population of Jacksonville is 950,203.
What is the Total Male Population of Jacksonville?
Total Male Population of Jacksonville is 461,833.
What is the Total Female Population of Jacksonville?
Total Female Population of Jacksonville is 488,370.
What is the Ratio of Males per 100 Females in Jacksonville?
There are 94.57 Males per 100 Females in Jacksonville.
What is the Ratio of Females per 100 Males in Jacksonville?
There are 105.75 Females per 100 Males in Jacksonville.
What is the Median Population Age in Jacksonville?
Median Population Age in Jacksonville is 36.3 Years.
What is the Average Family Size in Jacksonville
Average Family Size in Jacksonville is 3.1 People.
What is the Average Household Size in Jacksonville
Average Household Size in Jacksonville is 2.5 People.
How Large is the Labor Force in Jacksonville?
There are 496,812 People in the Labor Forcein in Jacksonville.
What is the Percentage of People in the Labor Force in Jacksonville?
65.6% of People are in the Labor Force in Jacksonville.
What is the Unemployment Rate in Jacksonville?
Unemployment Rate in Jacksonville is 4.8%.