Peabody, MA Map & Demographics
Peabody Map
Peabody Overview
$48,490
PER CAPITA INCOME
$114,872
AVG FAMILY INCOME
$91,125
AVG HOUSEHOLD INCOME
23.6%
WAGE / INCOME GAP [ % ]
76.4¢/ $1
WAGE / INCOME GAP [ $ ]
$11,312
FAMILY INCOME DEFICIT
0.45
INEQUALITY / GINI INDEX
54,204
TOTAL POPULATION
25,909
MALE POPULATION
28,295
FEMALE POPULATION
91.57
MALES / 100 FEMALES
109.21
FEMALES / 100 MALES
46.9
MEDIAN AGE
3.0
AVG FAMILY SIZE
2.4
AVG HOUSEHOLD SIZE
28,980
LABOR FORCE [ PEOPLE ]
63.3%
PERCENT IN LABOR FORCE
4.4%
UNEMPLOYMENT RATE
Peabody Zip Codes
Income in Peabody
Income Overview in Peabody
Per Capita Income in Peabody is $48,490, while median incomes of families and households are $114,872 and $91,125 respectively.
| Characteristic | Number | Measure |
| Per Capita Income | 54,204 | $48,490 |
| Median Family Income | 14,212 | $114,872 |
| Mean Family Income | 14,212 | $134,963 |
| Median Household Income | 22,678 | $91,125 |
| Mean Household Income | 22,678 | $115,191 |
| Income Deficit | 14,212 | $11,312 |
| Wage / Income Gap (%) | 54,204 | 23.62% |
| Wage / Income Gap ($) | 54,204 | 76.38¢ per $1 |
| Gini / Inequality Index | 54,204 | 0.45 |
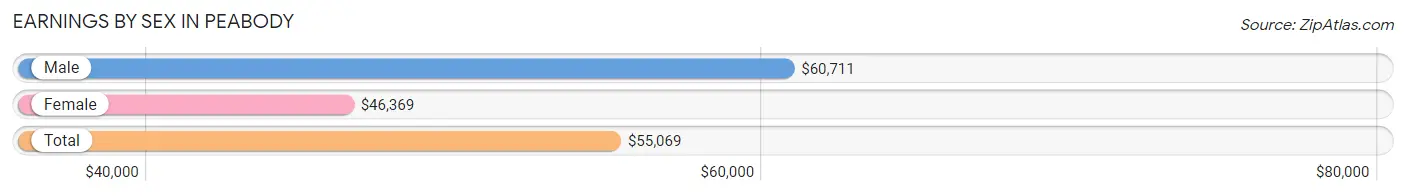
Earnings by Sex in Peabody
Average Earnings in Peabody are $55,069, $60,711 for men and $46,369 for women, a difference of 23.6%.
| Sex | Number | Average Earnings |
| Male | 15,378 (50.9%) | $60,711 |
| Female | 14,818 (49.1%) | $46,369 |
| Total | 30,196 (100.0%) | $55,069 |
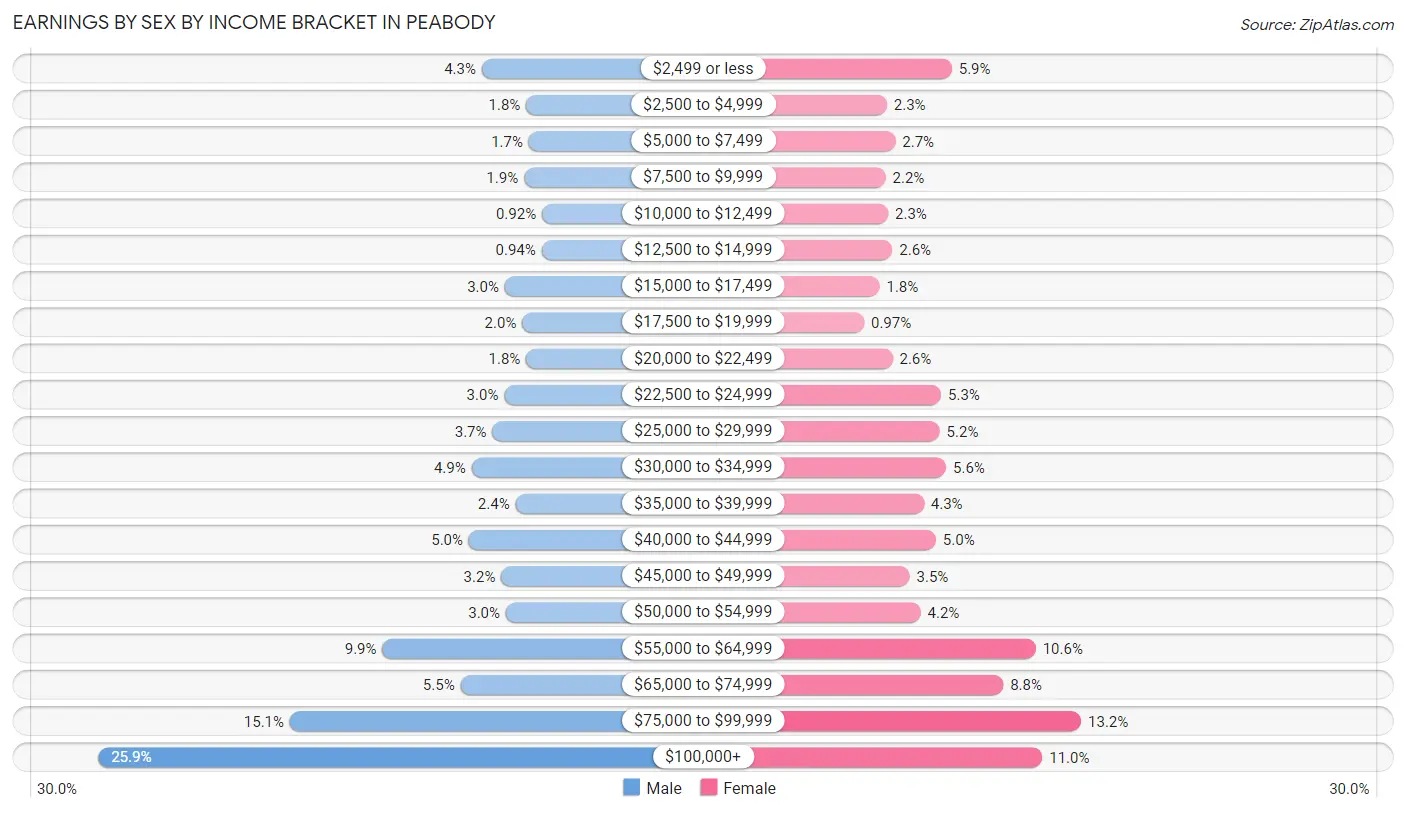
Earnings by Sex by Income Bracket in Peabody
The most common earnings brackets in Peabody are $100,000+ for men (3,976 | 25.9%) and $75,000 to $99,999 for women (1,951 | 13.2%).
| Income | Male | Female |
| $2,499 or less | 662 (4.3%) | 875 (5.9%) |
| $2,500 to $4,999 | 279 (1.8%) | 333 (2.2%) |
| $5,000 to $7,499 | 255 (1.7%) | 404 (2.7%) |
| $7,500 to $9,999 | 297 (1.9%) | 323 (2.2%) |
| $10,000 to $12,499 | 142 (0.9%) | 344 (2.3%) |
| $12,500 to $14,999 | 145 (0.9%) | 379 (2.6%) |
| $15,000 to $17,499 | 463 (3.0%) | 272 (1.8%) |
| $17,500 to $19,999 | 312 (2.0%) | 144 (1.0%) |
| $20,000 to $22,499 | 278 (1.8%) | 381 (2.6%) |
| $22,500 to $24,999 | 467 (3.0%) | 785 (5.3%) |
| $25,000 to $29,999 | 570 (3.7%) | 774 (5.2%) |
| $30,000 to $34,999 | 751 (4.9%) | 827 (5.6%) |
| $35,000 to $39,999 | 371 (2.4%) | 641 (4.3%) |
| $40,000 to $44,999 | 774 (5.0%) | 743 (5.0%) |
| $45,000 to $49,999 | 494 (3.2%) | 523 (3.5%) |
| $50,000 to $54,999 | 454 (2.9%) | 615 (4.2%) |
| $55,000 to $64,999 | 1,521 (9.9%) | 1,573 (10.6%) |
| $65,000 to $74,999 | 846 (5.5%) | 1,303 (8.8%) |
| $75,000 to $99,999 | 2,321 (15.1%) | 1,951 (13.2%) |
| $100,000+ | 3,976 (25.9%) | 1,628 (11.0%) |
| Total | 15,378 (100.0%) | 14,818 (100.0%) |
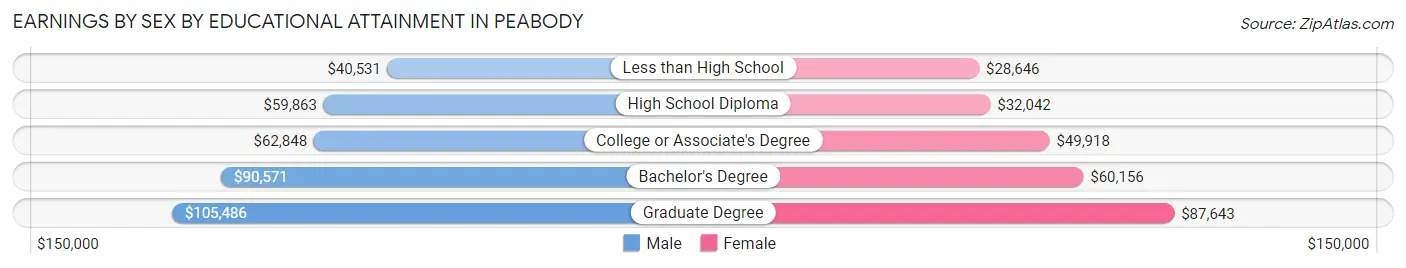
Earnings by Sex by Educational Attainment in Peabody
Average earnings in Peabody are $70,927 for men and $53,745 for women, a difference of 24.2%. Men with an educational attainment of graduate degree enjoy the highest average annual earnings of $105,486, while those with less than high school education earn the least with $40,531. Women with an educational attainment of graduate degree earn the most with the average annual earnings of $87,643, while those with less than high school education have the smallest earnings of $28,646.
| Educational Attainment | Male Income | Female Income |
| Less than High School | $40,531 | $28,646 |
| High School Diploma | $59,863 | $32,042 |
| College or Associate's Degree | $62,848 | $49,918 |
| Bachelor's Degree | $90,571 | $60,156 |
| Graduate Degree | $105,486 | $87,643 |
| Total | $70,927 | $53,745 |
Family Income in Peabody
Family Income Brackets in Peabody
According to the Peabody family income data, there are 3,724 families falling into the $100,000 to $149,999 income range, which is the most common income bracket and makes up 26.2% of all families. Conversely, the $10,000 to $14,999 income bracket is the least frequent group with only 284 families (2.0%) belonging to this category.
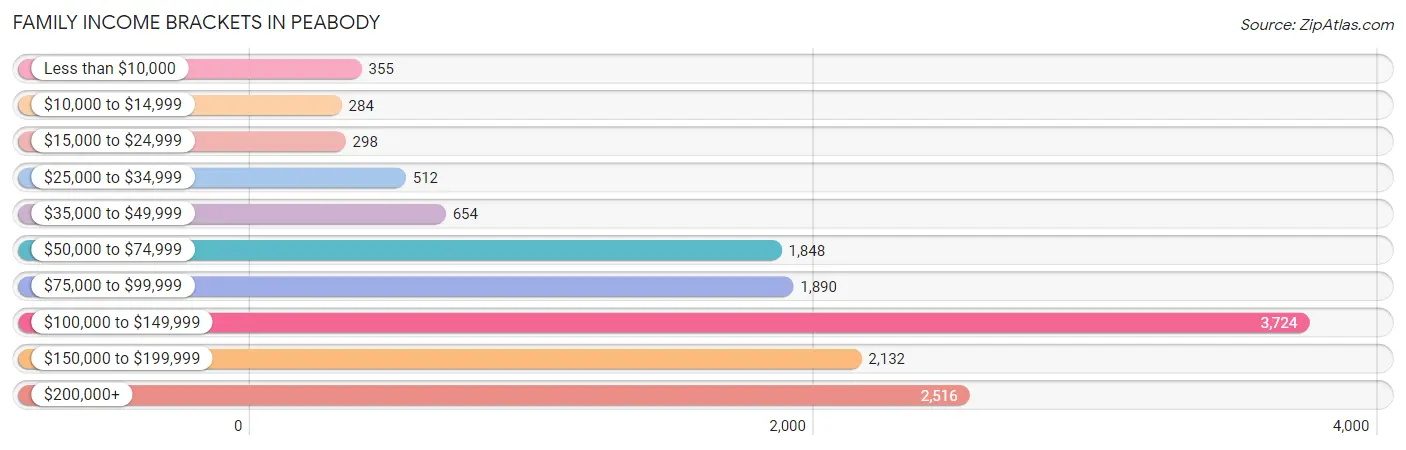
| Income Bracket | # Families | % Families |
| Less than $10,000 | 355 | 2.5% |
| $10,000 to $14,999 | 284 | 2.0% |
| $15,000 to $24,999 | 298 | 2.1% |
| $25,000 to $34,999 | 512 | 3.6% |
| $35,000 to $49,999 | 654 | 4.6% |
| $50,000 to $74,999 | 1,848 | 13.0% |
| $75,000 to $99,999 | 1,890 | 13.3% |
| $100,000 to $149,999 | 3,724 | 26.2% |
| $150,000 to $199,999 | 2,132 | 15.0% |
| $200,000+ | 2,516 | 17.7% |
Family Income by Famaliy Size in Peabody
6-person families (466 | 3.3%) account for the highest median family income in Peabody with $189,063 per family, while 2-person families (6,578 | 46.3%) have the highest median income of $48,225 per family member.
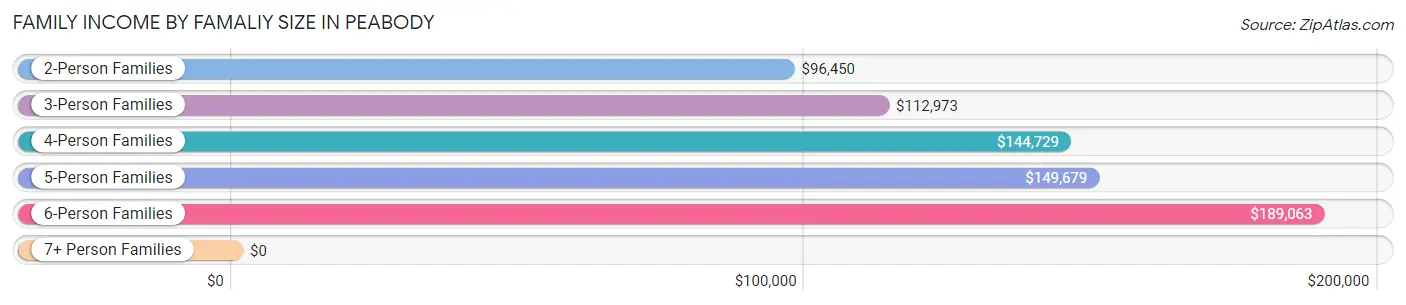
| Income Bracket | # Families | Median Income |
| 2-Person Families | 6,578 (46.3%) | $96,450 |
| 3-Person Families | 3,179 (22.4%) | $112,973 |
| 4-Person Families | 2,845 (20.0%) | $144,729 |
| 5-Person Families | 1,024 (7.2%) | $149,679 |
| 6-Person Families | 466 (3.3%) | $189,063 |
| 7+ Person Families | 120 (0.8%) | $0 |
| Total | 14,212 (100.0%) | $114,872 |
Family Income by Number of Earners in Peabody
The median family income in Peabody is $114,872, with families comprising 3+ earners (2,544) having the highest median family income of $189,877, while families with no earners (2,228) have the lowest median family income of $57,250, accounting for 17.9% and 15.7% of families, respectively.
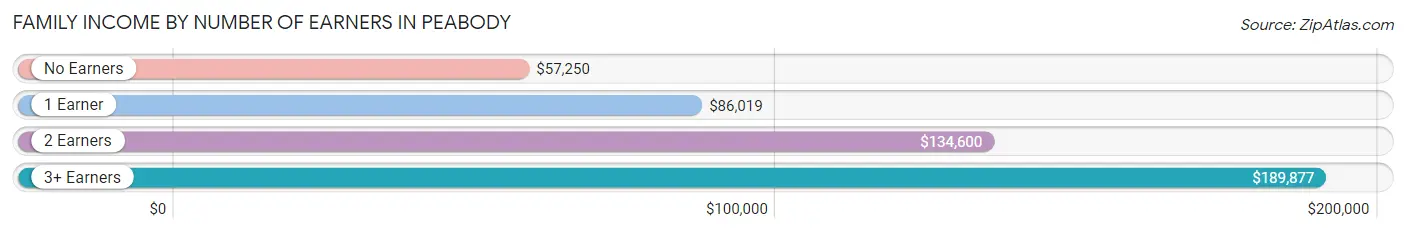
| Number of Earners | # Families | Median Income |
| No Earners | 2,228 (15.7%) | $57,250 |
| 1 Earner | 3,176 (22.4%) | $86,019 |
| 2 Earners | 6,264 (44.1%) | $134,600 |
| 3+ Earners | 2,544 (17.9%) | $189,877 |
| Total | 14,212 (100.0%) | $114,872 |
Household Income in Peabody
Household Income Brackets in Peabody
With 4,558 households falling in the category, the $100,000 to $149,999 income range is the most frequent in Peabody, accounting for 20.1% of all households. In contrast, only 658 households (2.9%) fall into the $10,000 to $14,999 income bracket, making it the least populous group.
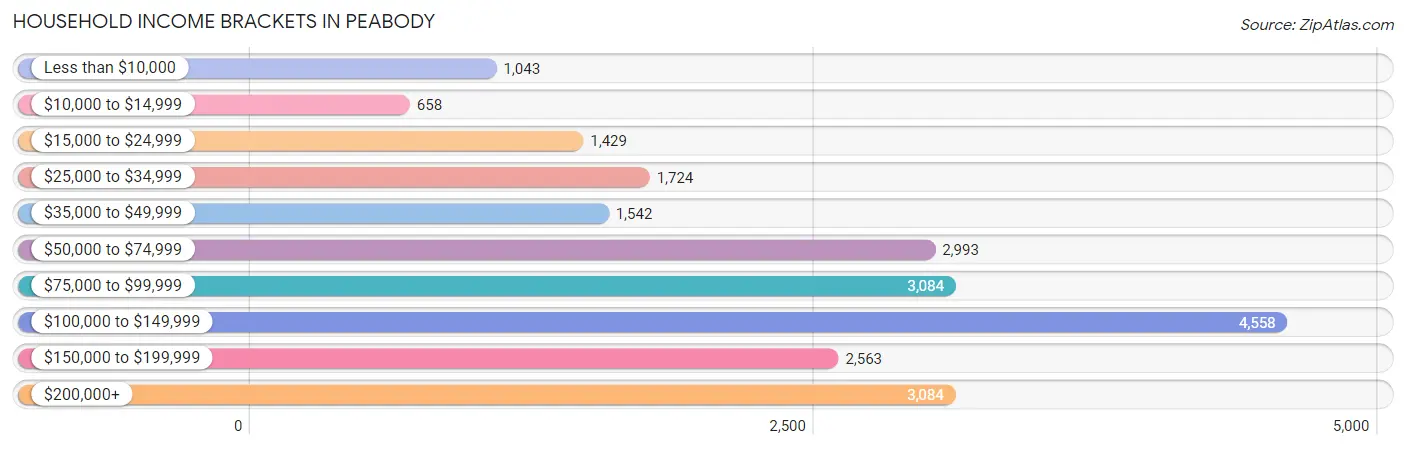
| Income Bracket | # Households | % Households |
| Less than $10,000 | 1,043 | 4.6% |
| $10,000 to $14,999 | 658 | 2.9% |
| $15,000 to $24,999 | 1,429 | 6.3% |
| $25,000 to $34,999 | 1,724 | 7.6% |
| $35,000 to $49,999 | 1,542 | 6.8% |
| $50,000 to $74,999 | 2,993 | 13.2% |
| $75,000 to $99,999 | 3,084 | 13.6% |
| $100,000 to $149,999 | 4,558 | 20.1% |
| $150,000 to $199,999 | 2,563 | 11.3% |
| $200,000+ | 3,084 | 13.6% |
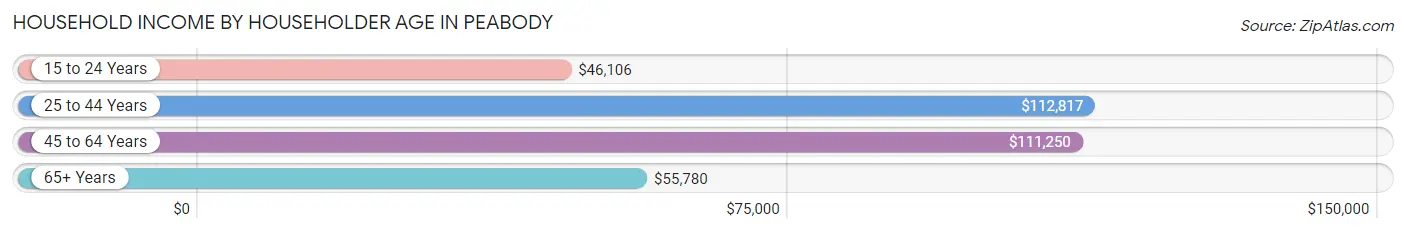
Household Income by Householder Age in Peabody
The median household income in Peabody is $91,125, with the highest median household income of $112,817 found in the 25 to 44 years age bracket for the primary householder. A total of 5,749 households (25.4%) fall into this category. Meanwhile, the 15 to 24 years age bracket for the primary householder has the lowest median household income of $46,106, with 347 households (1.5%) in this group.
| Income Bracket | # Households | Median Income |
| 15 to 24 Years | 347 (1.5%) | $46,106 |
| 25 to 44 Years | 5,749 (25.4%) | $112,817 |
| 45 to 64 Years | 8,312 (36.6%) | $111,250 |
| 65+ Years | 8,270 (36.5%) | $55,780 |
| Total | 22,678 (100.0%) | $91,125 |
Poverty in Peabody
Income Below Poverty by Sex and Age in Peabody
With 6.0% poverty level for males and 7.9% for females among the residents of Peabody, 15 year old males and 5 year old females are the most vulnerable to poverty, with 66 males (22.8%) and 19 females (11.7%) in their respective age groups living below the poverty level.
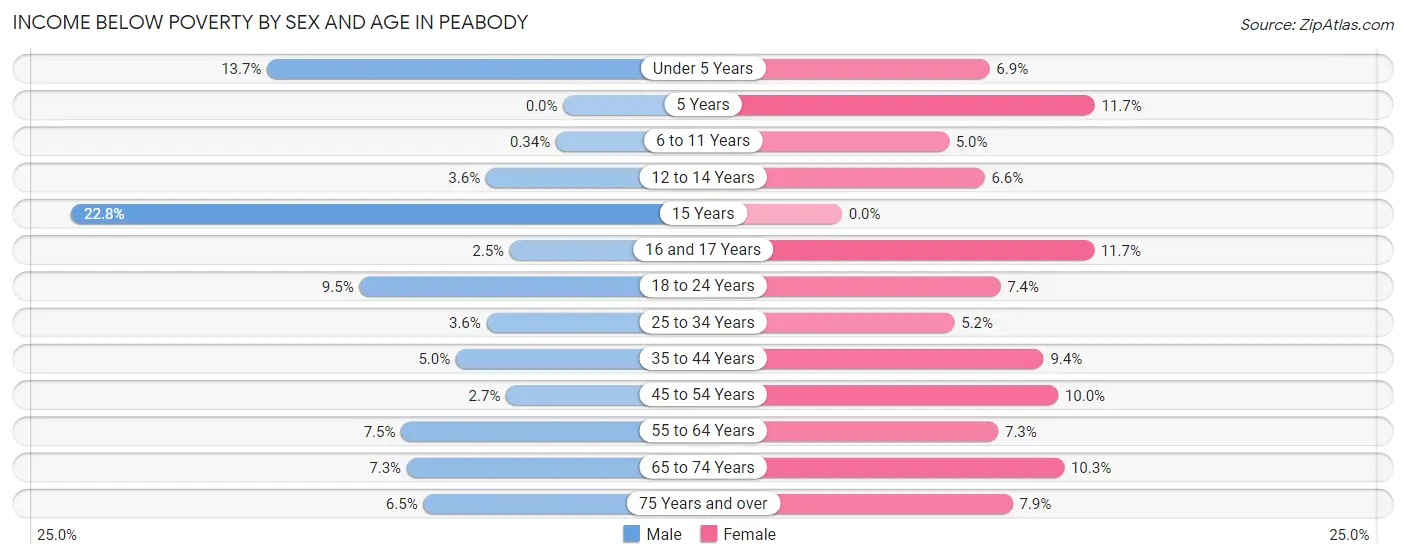
| Age Bracket | Male | Female |
| Under 5 Years | 190 (13.7%) | 106 (6.9%) |
| 5 Years | 0 (0.0%) | 19 (11.7%) |
| 6 to 11 Years | 5 (0.3%) | 75 (5.0%) |
| 12 to 14 Years | 23 (3.6%) | 57 (6.6%) |
| 15 Years | 66 (22.8%) | 0 (0.0%) |
| 16 and 17 Years | 19 (2.5%) | 45 (11.7%) |
| 18 to 24 Years | 210 (9.5%) | 154 (7.3%) |
| 25 to 34 Years | 101 (3.6%) | 177 (5.2%) |
| 35 to 44 Years | 167 (5.0%) | 260 (9.4%) |
| 45 to 54 Years | 86 (2.6%) | 354 (10.0%) |
| 55 to 64 Years | 291 (7.5%) | 296 (7.2%) |
| 65 to 74 Years | 218 (7.3%) | 323 (10.3%) |
| 75 Years and over | 158 (6.5%) | 336 (7.9%) |
| Total | 1,534 (6.0%) | 2,202 (7.9%) |
Income Above Poverty by Sex and Age in Peabody
According to the poverty statistics in Peabody, males aged 5 years and females aged 15 years are the age groups that are most secure financially, with 100.0% of males and 100.0% of females in these age groups living above the poverty line.
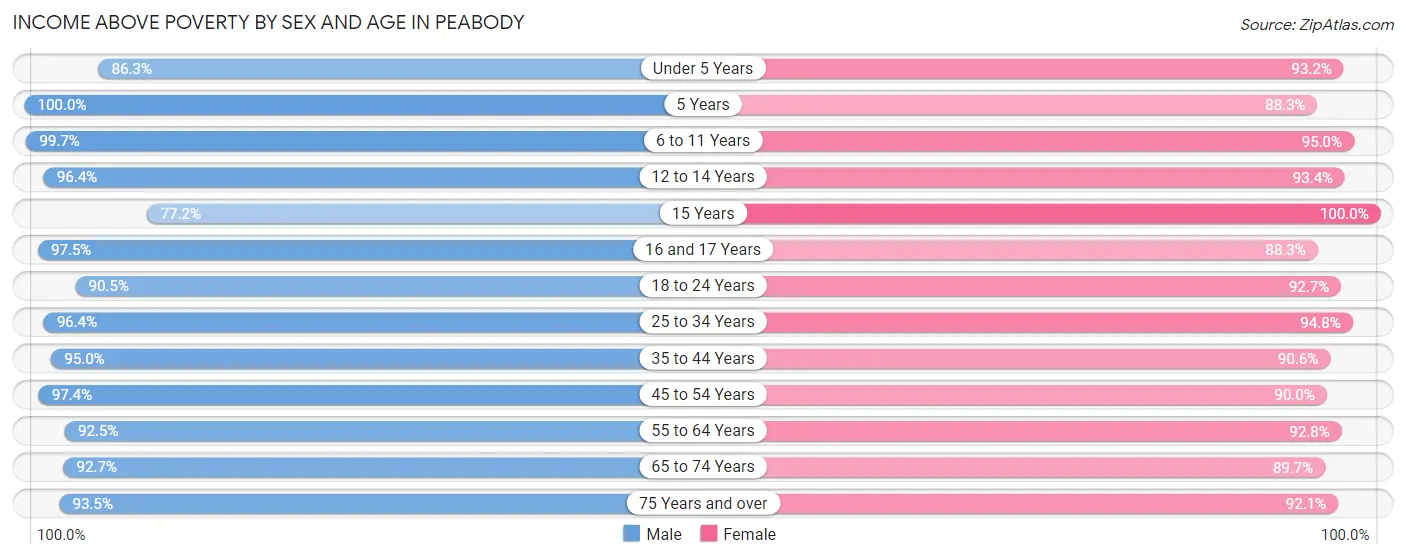
| Age Bracket | Male | Female |
| Under 5 Years | 1,193 (86.3%) | 1,441 (93.1%) |
| 5 Years | 235 (100.0%) | 143 (88.3%) |
| 6 to 11 Years | 1,450 (99.7%) | 1,438 (95.0%) |
| 12 to 14 Years | 618 (96.4%) | 804 (93.4%) |
| 15 Years | 223 (77.2%) | 117 (100.0%) |
| 16 and 17 Years | 748 (97.5%) | 340 (88.3%) |
| 18 to 24 Years | 2,009 (90.5%) | 1,940 (92.6%) |
| 25 to 34 Years | 2,733 (96.4%) | 3,211 (94.8%) |
| 35 to 44 Years | 3,189 (95.0%) | 2,519 (90.6%) |
| 45 to 54 Years | 3,155 (97.4%) | 3,177 (90.0%) |
| 55 to 64 Years | 3,579 (92.5%) | 3,786 (92.7%) |
| 65 to 74 Years | 2,785 (92.7%) | 2,811 (89.7%) |
| 75 Years and over | 2,276 (93.5%) | 3,907 (92.1%) |
| Total | 24,193 (94.0%) | 25,634 (92.1%) |
Income Below Poverty Among Married-Couple Families in Peabody
The poverty statistics for married-couple families in Peabody show that 2.5% or 264 of the total 10,655 families live below the poverty line. Families with no children have the highest poverty rate of 2.9%, comprising of 190 families. On the other hand, families with 3 or 4 children have the lowest poverty rate of 0.0%, which includes 0 families.
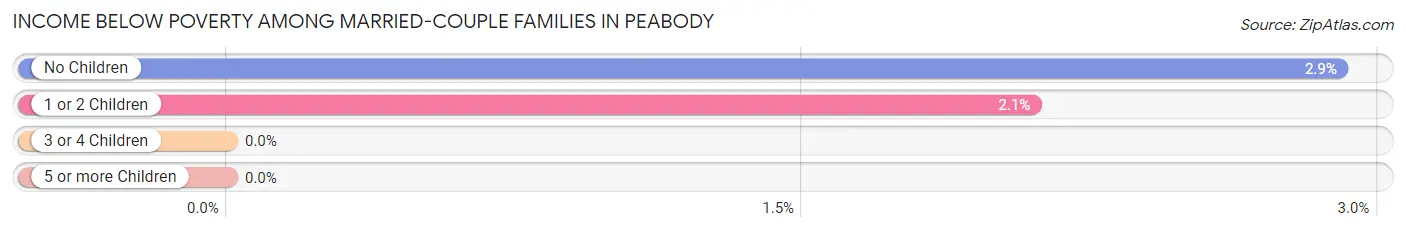
| Children | Above Poverty | Below Poverty |
| No Children | 6,362 (97.1%) | 190 (2.9%) |
| 1 or 2 Children | 3,457 (97.9%) | 74 (2.1%) |
| 3 or 4 Children | 543 (100.0%) | 0 (0.0%) |
| 5 or more Children | 29 (100.0%) | 0 (0.0%) |
| Total | 10,391 (97.5%) | 264 (2.5%) |
Income Below Poverty Among Single-Parent Households in Peabody
According to the poverty data in Peabody, 7.2% or 79 single-father households and 17.1% or 420 single-mother households are living below the poverty line. Among single-father households, those with 3 or 4 children have the highest poverty rate, with 31 households (100.0%) experiencing poverty. Likewise, among single-mother households, those with 3 or 4 children have the highest poverty rate, with 6 households (24.0%) falling below the poverty line.
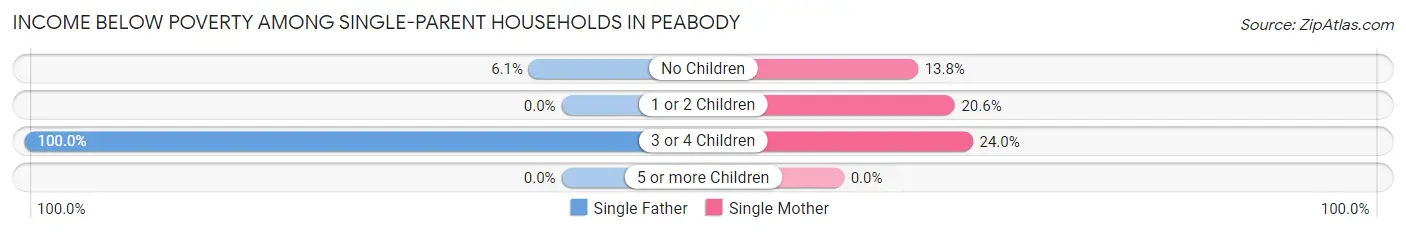
| Children | Single Father | Single Mother |
| No Children | 48 (6.1%) | 177 (13.8%) |
| 1 or 2 Children | 0 (0.0%) | 237 (20.6%) |
| 3 or 4 Children | 31 (100.0%) | 6 (24.0%) |
| 5 or more Children | 0 (0.0%) | 0 (0.0%) |
| Total | 79 (7.2%) | 420 (17.1%) |
Income Below Poverty Among Married-Couple vs Single-Parent Households in Peabody
The poverty data for Peabody shows that 264 of the married-couple family households (2.5%) and 499 of the single-parent households (14.0%) are living below the poverty level. Within the married-couple family households, those with no children have the highest poverty rate, with 190 households (2.9%) falling below the poverty line. Among the single-parent households, those with 3 or 4 children have the highest poverty rate, with 37 household (66.1%) living below poverty.
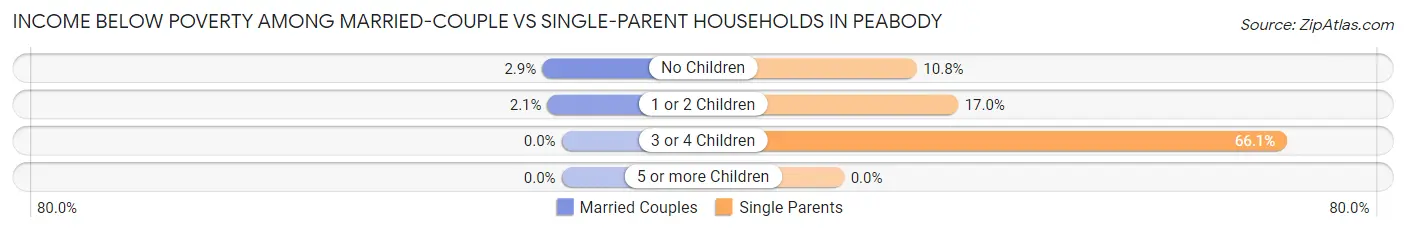
| Children | Married-Couple Families | Single-Parent Households |
| No Children | 190 (2.9%) | 225 (10.8%) |
| 1 or 2 Children | 74 (2.1%) | 237 (17.0%) |
| 3 or 4 Children | 0 (0.0%) | 37 (66.1%) |
| 5 or more Children | 0 (0.0%) | 0 (0.0%) |
| Total | 264 (2.5%) | 499 (14.0%) |
Race in Peabody
The most populous races in Peabody are White / Caucasian (46,088 | 85.0%), Hispanic or Latino (6,328 | 11.7%), and Two or more Races (3,823 | 7.0%).
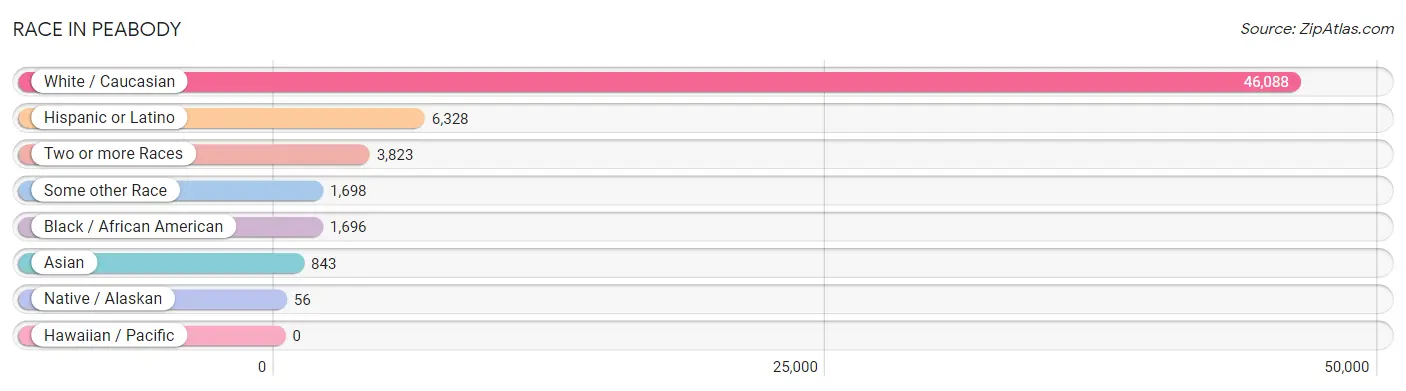
| Race | # Population | % Population |
| Asian | 843 | 1.6% |
| Black / African American | 1,696 | 3.1% |
| Hawaiian / Pacific | 0 | 0.0% |
| Hispanic or Latino | 6,328 | 11.7% |
| Native / Alaskan | 56 | 0.1% |
| White / Caucasian | 46,088 | 85.0% |
| Two or more Races | 3,823 | 7.0% |
| Some other Race | 1,698 | 3.1% |
| Total | 54,204 | 100.0% |
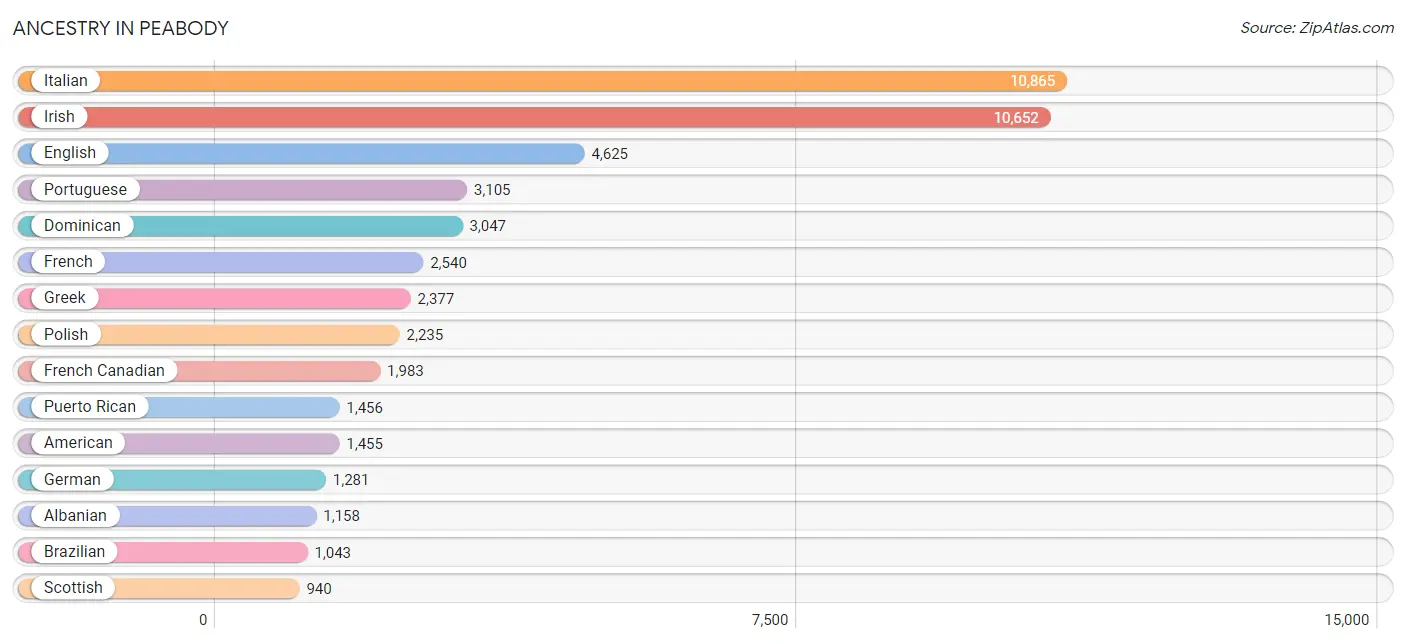
Ancestry in Peabody
The most populous ancestries reported in Peabody are Italian (10,865 | 20.0%), Irish (10,652 | 19.7%), English (4,625 | 8.5%), Portuguese (3,105 | 5.7%), and Dominican (3,047 | 5.6%), together accounting for 59.6% of all Peabody residents.
| Ancestry | # Population | % Population |
| African | 13 | 0.0% |
| Albanian | 1,158 | 2.1% |
| American | 1,455 | 2.7% |
| Arab | 187 | 0.3% |
| Argentinean | 30 | 0.1% |
| Armenian | 103 | 0.2% |
| Australian | 9 | 0.0% |
| Austrian | 242 | 0.4% |
| Barbadian | 69 | 0.1% |
| Bermudan | 17 | 0.0% |
| Bhutanese | 60 | 0.1% |
| Blackfeet | 17 | 0.0% |
| Brazilian | 1,043 | 1.9% |
| British | 143 | 0.3% |
| British West Indian | 7 | 0.0% |
| Bulgarian | 8 | 0.0% |
| Burmese | 55 | 0.1% |
| Canadian | 386 | 0.7% |
| Central American | 693 | 1.3% |
| Central American Indian | 110 | 0.2% |
| Chilean | 89 | 0.2% |
| Costa Rican | 17 | 0.0% |
| Croatian | 15 | 0.0% |
| Cuban | 160 | 0.3% |
| Czech | 19 | 0.0% |
| Czechoslovakian | 12 | 0.0% |
| Danish | 39 | 0.1% |
| Dominican | 3,047 | 5.6% |
| Dutch | 104 | 0.2% |
| Eastern European | 193 | 0.4% |
| Egyptian | 59 | 0.1% |
| English | 4,625 | 8.5% |
| European | 707 | 1.3% |
| Finnish | 86 | 0.2% |
| French | 2,540 | 4.7% |
| French Canadian | 1,983 | 3.7% |
| German | 1,281 | 2.4% |
| Greek | 2,377 | 4.4% |
| Guatemalan | 156 | 0.3% |
| Guyanese | 36 | 0.1% |
| Haitian | 566 | 1.0% |
| Honduran | 65 | 0.1% |
| Hungarian | 285 | 0.5% |
| Icelander | 13 | 0.0% |
| Indian (Asian) | 503 | 0.9% |
| Iranian | 102 | 0.2% |
| Iraqi | 59 | 0.1% |
| Irish | 10,652 | 19.7% |
| Iroquois | 60 | 0.1% |
| Italian | 10,865 | 20.0% |
| Jamaican | 34 | 0.1% |
| Japanese | 156 | 0.3% |
| Korean | 135 | 0.3% |
| Laotian | 2 | 0.0% |
| Latvian | 58 | 0.1% |
| Lebanese | 34 | 0.1% |
| Lithuanian | 702 | 1.3% |
| Luxembourger | 10 | 0.0% |
| Mexican | 142 | 0.3% |
| Moroccan | 16 | 0.0% |
| Norwegian | 41 | 0.1% |
| Pakistani | 67 | 0.1% |
| Peruvian | 140 | 0.3% |
| Polish | 2,235 | 4.1% |
| Portuguese | 3,105 | 5.7% |
| Puerto Rican | 1,456 | 2.7% |
| Romanian | 84 | 0.2% |
| Russian | 921 | 1.7% |
| Salvadoran | 455 | 0.8% |
| Scandinavian | 12 | 0.0% |
| Scotch-Irish | 517 | 0.9% |
| Scottish | 940 | 1.7% |
| Slovak | 19 | 0.0% |
| South American | 259 | 0.5% |
| Spaniard | 222 | 0.4% |
| Spanish | 76 | 0.1% |
| Sri Lankan | 206 | 0.4% |
| Subsaharan African | 188 | 0.4% |
| Swedish | 530 | 1.0% |
| Swiss | 59 | 0.1% |
| Syrian | 12 | 0.0% |
| Thai | 74 | 0.1% |
| Trinidadian and Tobagonian | 26 | 0.1% |
| Turkish | 42 | 0.1% |
| Ukrainian | 250 | 0.5% |
| Welsh | 97 | 0.2% |
| West Indian | 81 | 0.2% | View All 87 Rows |
Immigrants in Peabody
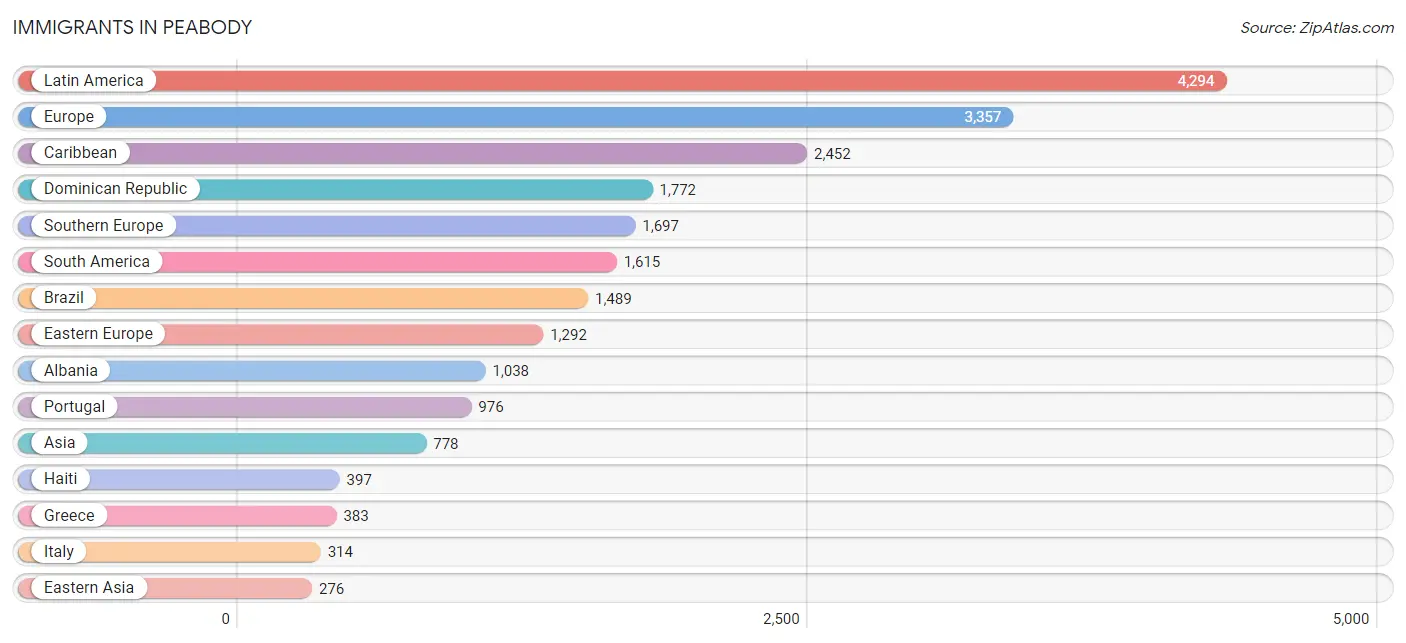
The most numerous immigrant groups reported in Peabody came from Latin America (4,294 | 7.9%), Europe (3,357 | 6.2%), Caribbean (2,452 | 4.5%), Dominican Republic (1,772 | 3.3%), and Southern Europe (1,697 | 3.1%), together accounting for 25.0% of all Peabody residents.
| Immigration Origin | # Population | % Population |
| Africa | 235 | 0.4% |
| Albania | 1,038 | 1.9% |
| Argentina | 15 | 0.0% |
| Armenia | 7 | 0.0% |
| Asia | 778 | 1.4% |
| Australia | 33 | 0.1% |
| Austria | 55 | 0.1% |
| Azores | 85 | 0.2% |
| Barbados | 32 | 0.1% |
| Brazil | 1,489 | 2.8% |
| Cambodia | 48 | 0.1% |
| Canada | 146 | 0.3% |
| Caribbean | 2,452 | 4.5% |
| Central America | 227 | 0.4% |
| Chile | 45 | 0.1% |
| China | 205 | 0.4% |
| Colombia | 16 | 0.0% |
| Congo | 40 | 0.1% |
| Croatia | 15 | 0.0% |
| Cuba | 157 | 0.3% |
| Czechoslovakia | 11 | 0.0% |
| Dominican Republic | 1,772 | 3.3% |
| Eastern Africa | 28 | 0.1% |
| Eastern Asia | 276 | 0.5% |
| Eastern Europe | 1,292 | 2.4% |
| Egypt | 23 | 0.0% |
| El Salvador | 123 | 0.2% |
| England | 54 | 0.1% |
| Europe | 3,357 | 6.2% |
| France | 68 | 0.1% |
| Germany | 19 | 0.0% |
| Greece | 383 | 0.7% |
| Guatemala | 63 | 0.1% |
| Haiti | 397 | 0.7% |
| Honduras | 34 | 0.1% |
| India | 6 | 0.0% |
| Indonesia | 2 | 0.0% |
| Iran | 102 | 0.2% |
| Iraq | 80 | 0.2% |
| Ireland | 99 | 0.2% |
| Israel | 15 | 0.0% |
| Italy | 314 | 0.6% |
| Jamaica | 53 | 0.1% |
| Japan | 16 | 0.0% |
| Jordan | 24 | 0.0% |
| Kenya | 28 | 0.1% |
| Korea | 55 | 0.1% |
| Latin America | 4,294 | 7.9% |
| Mexico | 7 | 0.0% |
| Middle Africa | 83 | 0.2% |
| Morocco | 27 | 0.1% |
| Nigeria | 52 | 0.1% |
| Northern Africa | 50 | 0.1% |
| Northern Europe | 206 | 0.4% |
| Oceania | 33 | 0.1% |
| Peru | 50 | 0.1% |
| Philippines | 43 | 0.1% |
| Poland | 80 | 0.2% |
| Portugal | 976 | 1.8% |
| Romania | 76 | 0.1% |
| Russia | 69 | 0.1% |
| Scotland | 20 | 0.0% |
| South America | 1,615 | 3.0% |
| South Central Asia | 108 | 0.2% |
| South Eastern Asia | 240 | 0.4% |
| Southern Europe | 1,697 | 3.1% |
| Spain | 24 | 0.0% |
| Switzerland | 20 | 0.0% |
| Taiwan | 29 | 0.1% |
| Thailand | 63 | 0.1% |
| Trinidad and Tobago | 34 | 0.1% |
| Turkey | 28 | 0.1% |
| Ukraine | 3 | 0.0% |
| Vietnam | 84 | 0.2% |
| Western Africa | 74 | 0.1% |
| Western Asia | 154 | 0.3% |
| Western Europe | 162 | 0.3% |
| Zaire | 43 | 0.1% | View All 78 Rows |
Sex and Age in Peabody
Sex and Age in Peabody
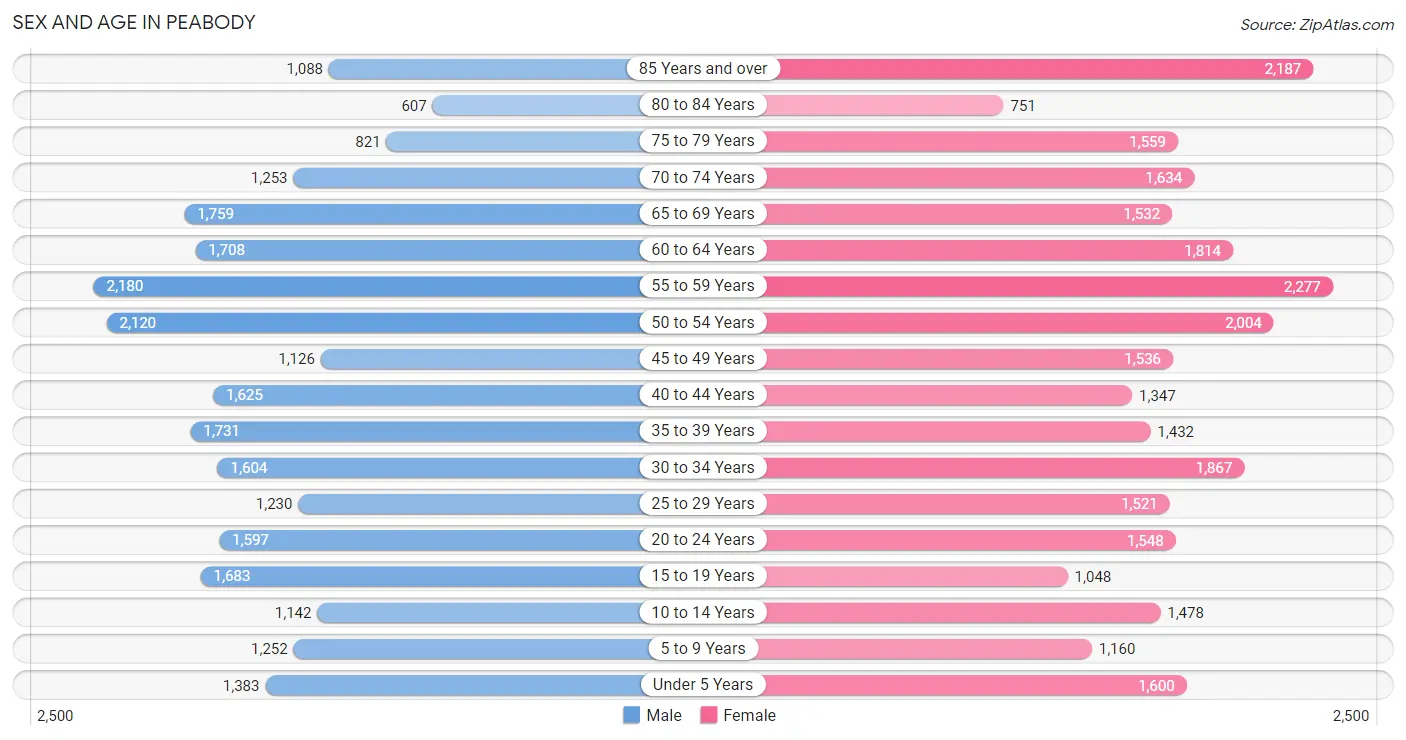
The most populous age groups in Peabody are 55 to 59 Years (2,180 | 8.4%) for men and 55 to 59 Years (2,277 | 8.1%) for women.
| Age Bracket | Male | Female |
| Under 5 Years | 1,383 (5.3%) | 1,600 (5.7%) |
| 5 to 9 Years | 1,252 (4.8%) | 1,160 (4.1%) |
| 10 to 14 Years | 1,142 (4.4%) | 1,478 (5.2%) |
| 15 to 19 Years | 1,683 (6.5%) | 1,048 (3.7%) |
| 20 to 24 Years | 1,597 (6.2%) | 1,548 (5.5%) |
| 25 to 29 Years | 1,230 (4.8%) | 1,521 (5.4%) |
| 30 to 34 Years | 1,604 (6.2%) | 1,867 (6.6%) |
| 35 to 39 Years | 1,731 (6.7%) | 1,432 (5.1%) |
| 40 to 44 Years | 1,625 (6.3%) | 1,347 (4.8%) |
| 45 to 49 Years | 1,126 (4.3%) | 1,536 (5.4%) |
| 50 to 54 Years | 2,120 (8.2%) | 2,004 (7.1%) |
| 55 to 59 Years | 2,180 (8.4%) | 2,277 (8.1%) |
| 60 to 64 Years | 1,708 (6.6%) | 1,814 (6.4%) |
| 65 to 69 Years | 1,759 (6.8%) | 1,532 (5.4%) |
| 70 to 74 Years | 1,253 (4.8%) | 1,634 (5.8%) |
| 75 to 79 Years | 821 (3.2%) | 1,559 (5.5%) |
| 80 to 84 Years | 607 (2.3%) | 751 (2.6%) |
| 85 Years and over | 1,088 (4.2%) | 2,187 (7.7%) |
| Total | 25,909 (100.0%) | 28,295 (100.0%) |
Families and Households in Peabody
Median Family Size in Peabody
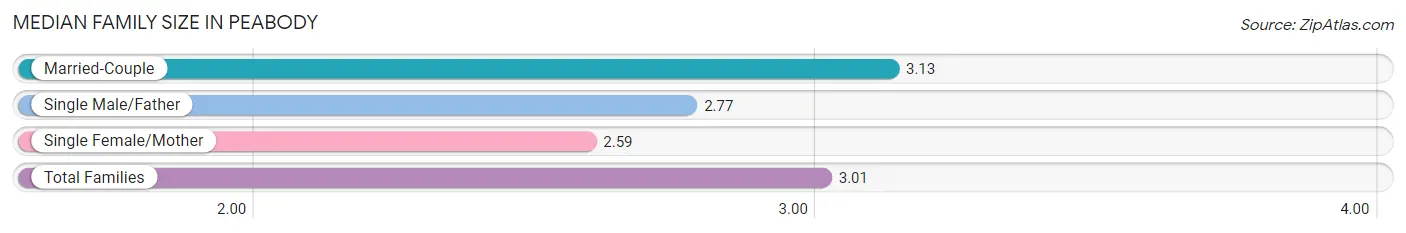
The median family size in Peabody is 3.01 persons per family, with married-couple families (10,655 | 75.0%) accounting for the largest median family size of 3.13 persons per family. On the other hand, single female/mother families (2,457 | 17.3%) represent the smallest median family size with 2.59 persons per family.
| Family Type | # Families | Family Size |
| Married-Couple | 10,655 (75.0%) | 3.13 |
| Single Male/Father | 1,100 (7.7%) | 2.77 |
| Single Female/Mother | 2,457 (17.3%) | 2.59 |
| Total Families | 14,212 (100.0%) | 3.01 |
Median Household Size in Peabody
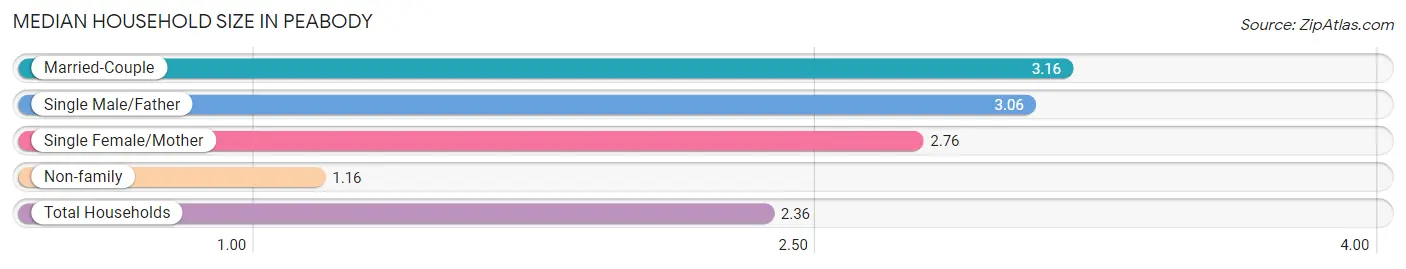
The median household size in Peabody is 2.36 persons per household, with married-couple households (10,655 | 47.0%) accounting for the largest median household size of 3.16 persons per household. non-family households (8,466 | 37.3%) represent the smallest median household size with 1.16 persons per household.
| Household Type | # Households | Household Size |
| Married-Couple | 10,655 (47.0%) | 3.16 |
| Single Male/Father | 1,100 (4.9%) | 3.06 |
| Single Female/Mother | 2,457 (10.8%) | 2.76 |
| Non-family | 8,466 (37.3%) | 1.16 |
| Total Households | 22,678 (100.0%) | 2.36 |
Household Size by Marriage Status in Peabody
Out of a total of 22,678 households in Peabody, 14,212 (62.7%) are family households, while 8,466 (37.3%) are nonfamily households. The most numerous type of family households are 2-person households, comprising 6,117, and the most common type of nonfamily households are 1-person households, comprising 7,428.
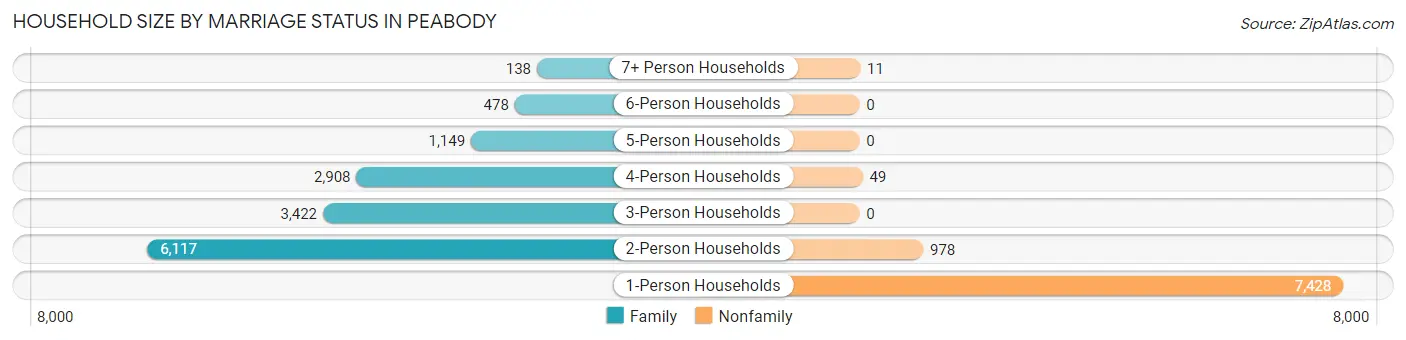
| Household Size | Family Households | Nonfamily Households |
| 1-Person Households | - | 7,428 (32.8%) |
| 2-Person Households | 6,117 (27.0%) | 978 (4.3%) |
| 3-Person Households | 3,422 (15.1%) | 0 (0.0%) |
| 4-Person Households | 2,908 (12.8%) | 49 (0.2%) |
| 5-Person Households | 1,149 (5.1%) | 0 (0.0%) |
| 6-Person Households | 478 (2.1%) | 0 (0.0%) |
| 7+ Person Households | 138 (0.6%) | 11 (0.1%) |
| Total | 14,212 (62.7%) | 8,466 (37.3%) |
Female Fertility in Peabody
Fertility by Age in Peabody
Average fertility rate in Peabody is 80.0 births per 1,000 women. Women in the age bracket of 20 to 34 years have the highest fertility rate with 128.0 births per 1,000 women. Women in the age bracket of 20 to 34 years acount for 74.3% of all women with births.
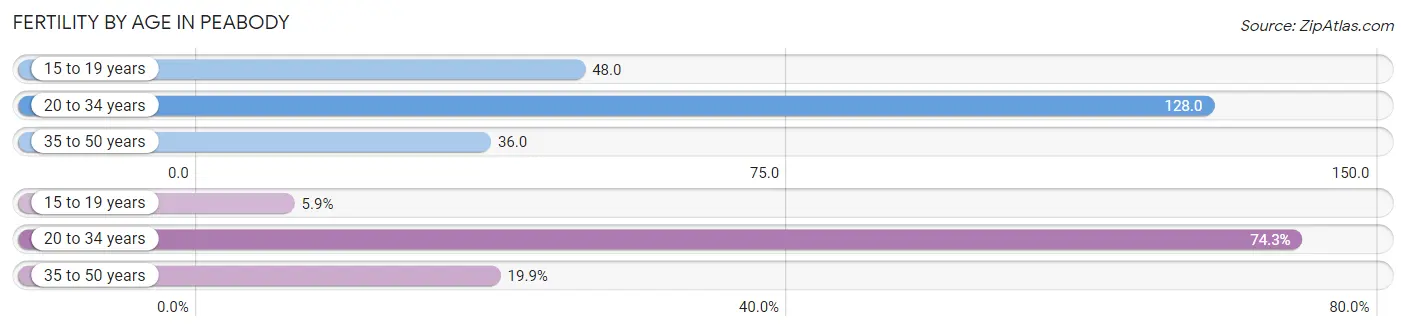
| Age Bracket | Women with Births | Births / 1,000 Women |
| 15 to 19 years | 50 (5.9%) | 48.0 |
| 20 to 34 years | 632 (74.3%) | 128.0 |
| 35 to 50 years | 169 (19.9%) | 36.0 |
| Total | 851 (100.0%) | 80.0 |
Fertility by Age by Marriage Status in Peabody
80.8% of women with births (851) in Peabody are married. The highest percentage of unmarried women with births falls into 15 to 19 years age bracket with 100.0% of them unmarried at the time of birth, while the lowest percentage of unmarried women with births belong to 35 to 50 years age bracket with 4.7% of them unmarried.
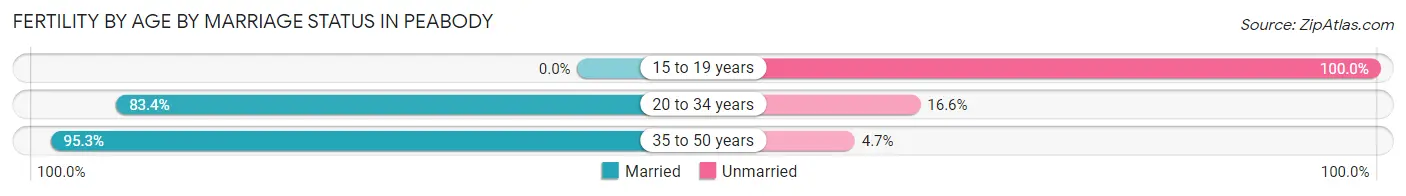
| Age Bracket | Married | Unmarried |
| 15 to 19 years | 0 (0.0%) | 50 (100.0%) |
| 20 to 34 years | 527 (83.4%) | 105 (16.6%) |
| 35 to 50 years | 161 (95.3%) | 8 (4.7%) |
| Total | 688 (80.8%) | 163 (19.2%) |
Fertility by Education in Peabody
Average fertility rate in Peabody is 80.0 births per 1,000 women. Women with the education attainment of graduate degree have the highest fertility rate of 103.0 births per 1,000 women, while women with the education attainment of college or associate's degree have the lowest fertility at 62.0 births per 1,000 women. Women with the education attainment of bachelor's degree represent 31.0% of all women with births.
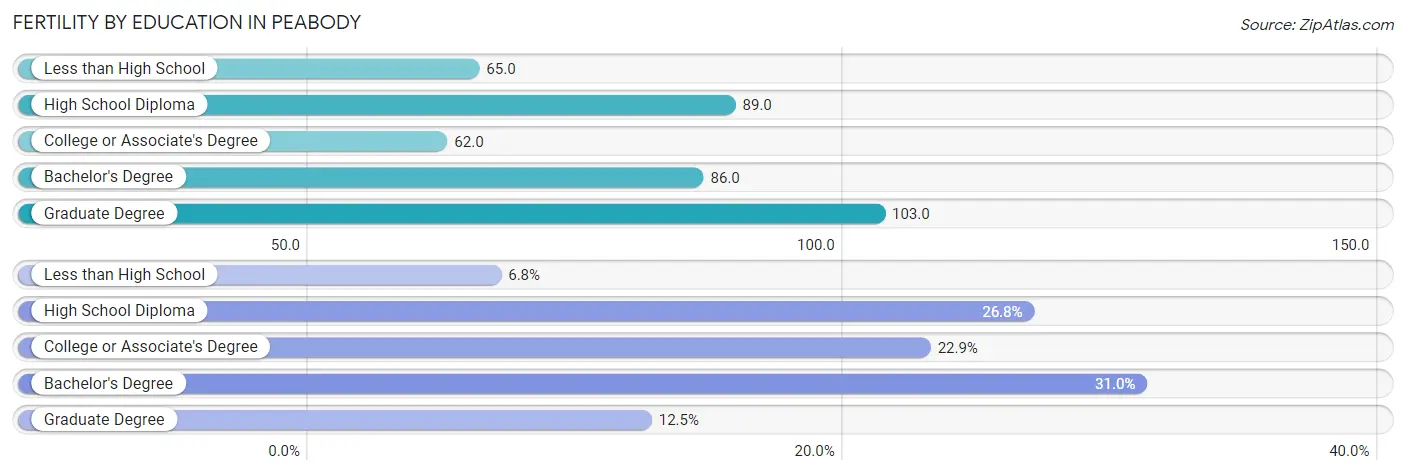
| Educational Attainment | Women with Births | Births / 1,000 Women |
| Less than High School | 58 (6.8%) | 65.0 |
| High School Diploma | 228 (26.8%) | 89.0 |
| College or Associate's Degree | 195 (22.9%) | 62.0 |
| Bachelor's Degree | 264 (31.0%) | 86.0 |
| Graduate Degree | 106 (12.5%) | 103.0 |
| Total | 851 (100.0%) | 80.0 |
Fertility by Education by Marriage Status in Peabody
19.2% of women with births in Peabody are unmarried. Women with the educational attainment of college or associate's degree are most likely to be married with 100.0% of them married at childbirth, while women with the educational attainment of less than high school are least likely to be married with 100.0% of them unmarried at childbirth.
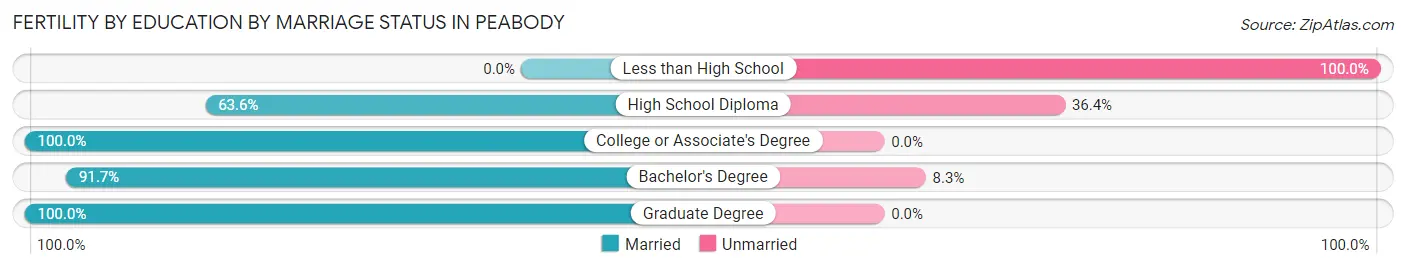
| Educational Attainment | Married | Unmarried |
| Less than High School | 0 (0.0%) | 58 (100.0%) |
| High School Diploma | 145 (63.6%) | 83 (36.4%) |
| College or Associate's Degree | 195 (100.0%) | 0 (0.0%) |
| Bachelor's Degree | 242 (91.7%) | 22 (8.3%) |
| Graduate Degree | 106 (100.0%) | 0 (0.0%) |
| Total | 688 (80.8%) | 163 (19.2%) |
Employment Characteristics in Peabody
Employment by Class of Employer in Peabody
Among the 26,837 employed individuals in Peabody, private company employees (17,692 | 65.9%), not-for-profit organizations (3,298 | 12.3%), and local government employees (2,647 | 9.9%) make up the most common classes of employment.
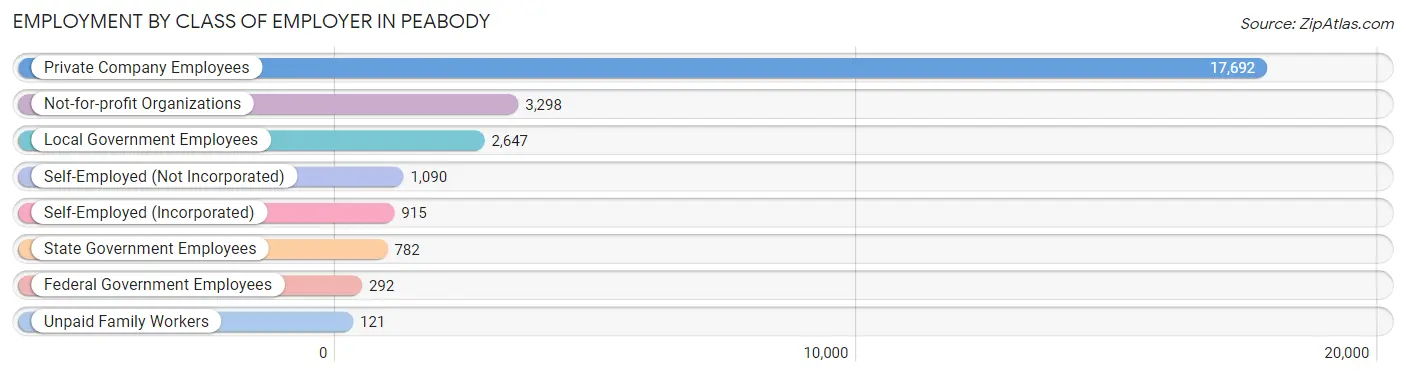
| Employer Class | # Employees | % Employees |
| Private Company Employees | 17,692 | 65.9% |
| Self-Employed (Incorporated) | 915 | 3.4% |
| Self-Employed (Not Incorporated) | 1,090 | 4.1% |
| Not-for-profit Organizations | 3,298 | 12.3% |
| Local Government Employees | 2,647 | 9.9% |
| State Government Employees | 782 | 2.9% |
| Federal Government Employees | 292 | 1.1% |
| Unpaid Family Workers | 121 | 0.4% |
| Total | 26,837 | 100.0% |
Employment Status by Age in Peabody
According to the labor force statistics for Peabody, out of the total population over 16 years of age (45,782), 63.3% or 28,980 individuals are in the labor force, with 4.4% or 1,275 of them unemployed. The age group with the highest labor force participation rate is 25 to 29 years, with 92.9% or 2,556 individuals in the labor force. Within the labor force, the 16 to 19 years age range has the highest percentage of unemployed individuals, with 9.9% or 103 of them being unemployed.
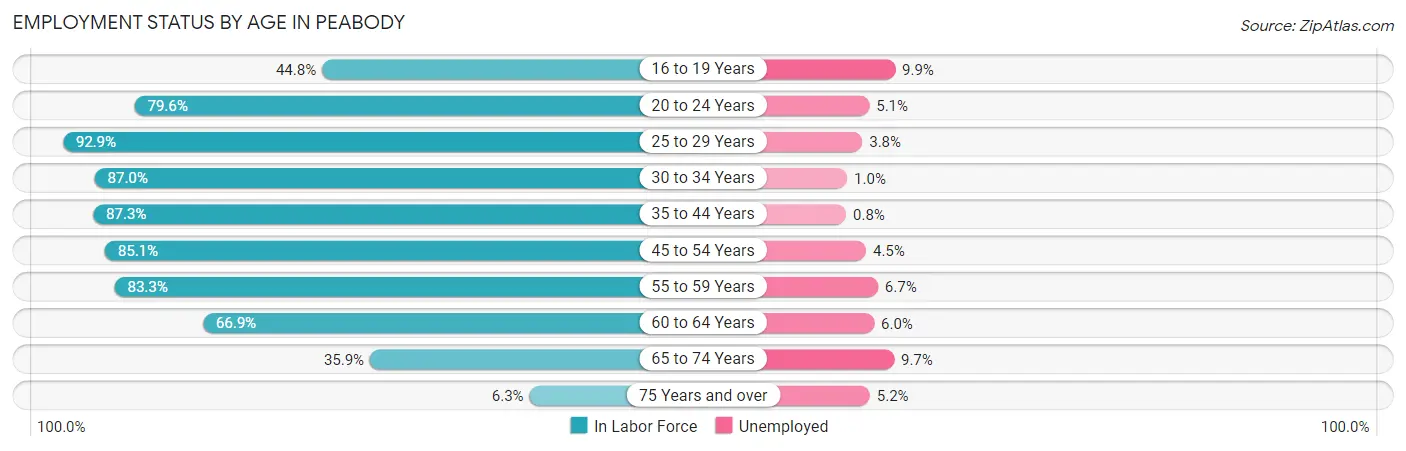
| Age Bracket | In Labor Force | Unemployed |
| 16 to 19 Years | 1,041 (44.8%) | 103 (9.9%) |
| 20 to 24 Years | 2,503 (79.6%) | 128 (5.1%) |
| 25 to 29 Years | 2,556 (92.9%) | 97 (3.8%) |
| 30 to 34 Years | 3,020 (87.0%) | 30 (1.0%) |
| 35 to 44 Years | 5,356 (87.3%) | 43 (0.8%) |
| 45 to 54 Years | 5,775 (85.1%) | 260 (4.5%) |
| 55 to 59 Years | 3,713 (83.3%) | 249 (6.7%) |
| 60 to 64 Years | 2,356 (66.9%) | 141 (6.0%) |
| 65 to 74 Years | 2,218 (35.9%) | 215 (9.7%) |
| 75 Years and over | 442 (6.3%) | 23 (5.2%) |
| Total | 28,980 (63.3%) | 1,275 (4.4%) |
Employment Status by Educational Attainment in Peabody
According to labor force statistics for Peabody, 84.0% of individuals (22,782) out of the total population between 25 and 64 years of age (27,122) are in the labor force, with 3.6% or 820 of them being unemployed. The group with the highest labor force participation rate are those with the educational attainment of bachelor's degree or higher, with 91.6% or 9,133 individuals in the labor force. Within the labor force, individuals with less than high school education have the highest percentage of unemployment, with 7.6% or 110 of them being unemployed.
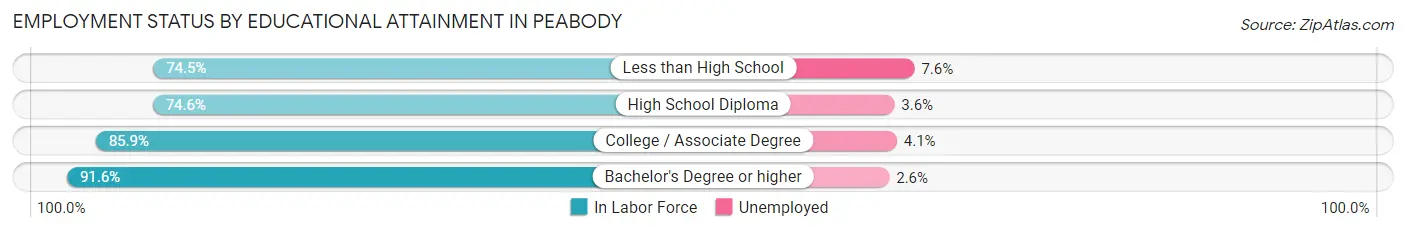
| Educational Attainment | In Labor Force | Unemployed |
| Less than High School | 1,448 (74.5%) | 148 (7.6%) |
| High School Diploma | 5,713 (74.6%) | 276 (3.6%) |
| College / Associate Degree | 6,486 (85.9%) | 310 (4.1%) |
| Bachelor's Degree or higher | 9,133 (91.6%) | 259 (2.6%) |
| Total | 22,782 (84.0%) | 976 (3.6%) |
Employment Occupations by Sex in Peabody
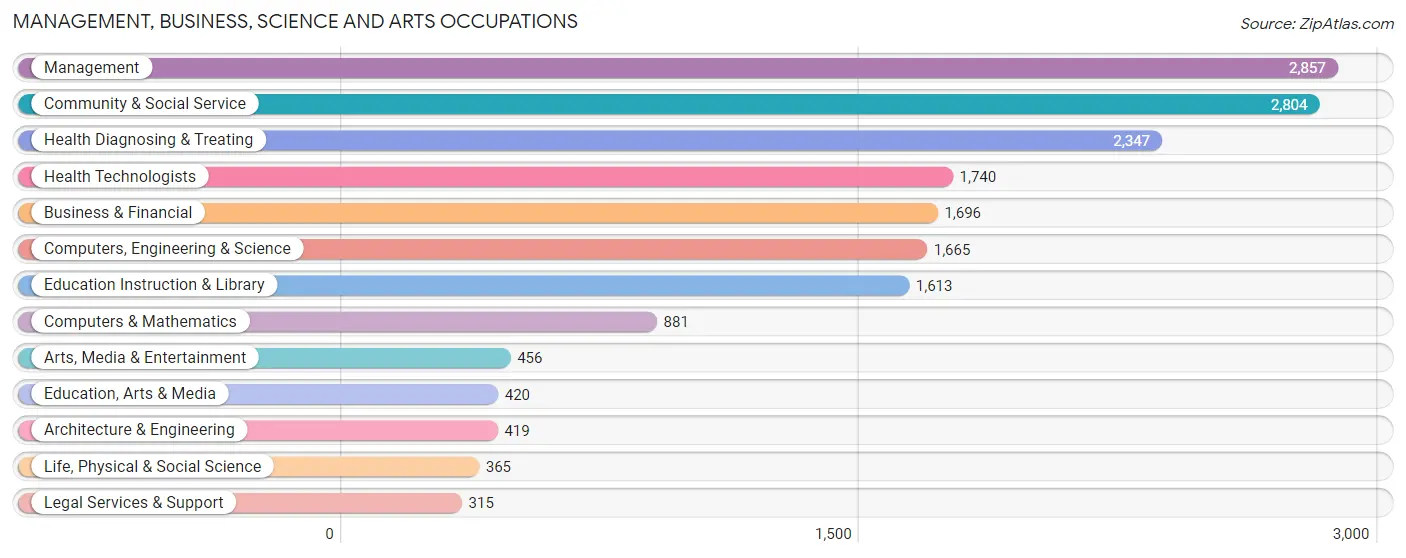
Management, Business, Science and Arts Occupations
The most common Management, Business, Science and Arts occupations in Peabody are Management (2,857 | 10.3%), Community & Social Service (2,804 | 10.1%), Health Diagnosing & Treating (2,347 | 8.5%), Health Technologists (1,740 | 6.3%), and Business & Financial (1,696 | 6.1%).
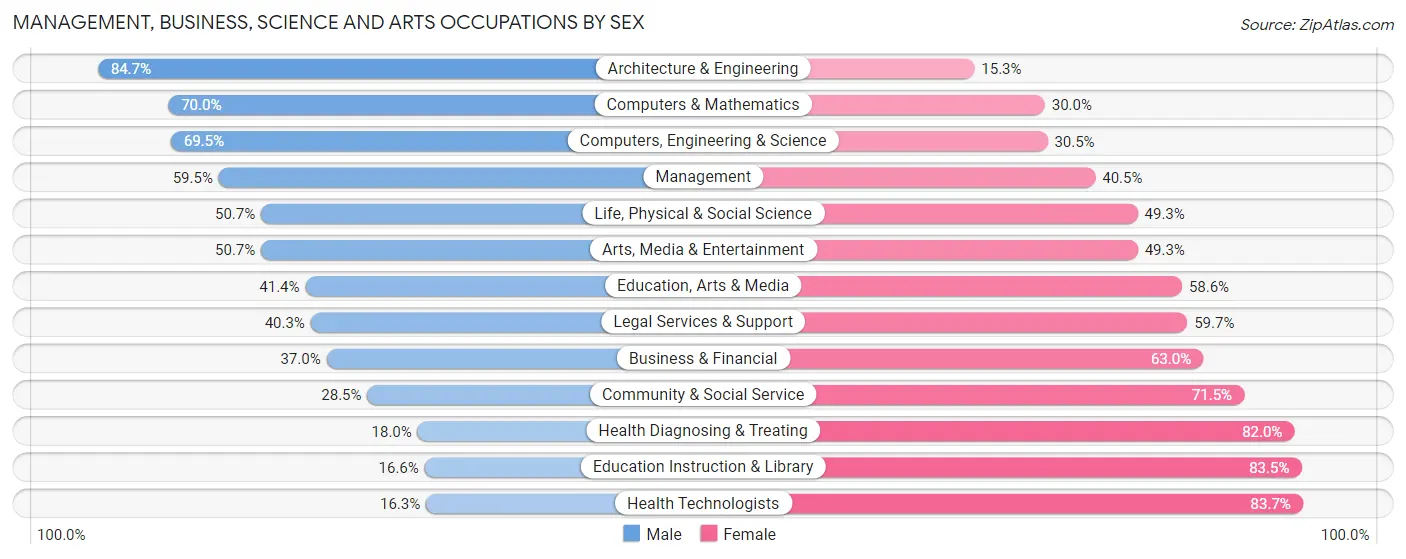
Management, Business, Science and Arts Occupations by Sex
Within the Management, Business, Science and Arts occupations in Peabody, the most male-oriented occupations are Architecture & Engineering (84.7%), Computers & Mathematics (70.0%), and Computers, Engineering & Science (69.5%), while the most female-oriented occupations are Health Technologists (83.7%), Education Instruction & Library (83.5%), and Health Diagnosing & Treating (82.0%).
| Occupation | Male | Female |
| Management | 1,700 (59.5%) | 1,157 (40.5%) |
| Business & Financial | 628 (37.0%) | 1,068 (63.0%) |
| Computers, Engineering & Science | 1,157 (69.5%) | 508 (30.5%) |
| Computers & Mathematics | 617 (70.0%) | 264 (30.0%) |
| Architecture & Engineering | 355 (84.7%) | 64 (15.3%) |
| Life, Physical & Social Science | 185 (50.7%) | 180 (49.3%) |
| Community & Social Service | 799 (28.5%) | 2,005 (71.5%) |
| Education, Arts & Media | 174 (41.4%) | 246 (58.6%) |
| Legal Services & Support | 127 (40.3%) | 188 (59.7%) |
| Education Instruction & Library | 267 (16.6%) | 1,346 (83.5%) |
| Arts, Media & Entertainment | 231 (50.7%) | 225 (49.3%) |
| Health Diagnosing & Treating | 423 (18.0%) | 1,924 (82.0%) |
| Health Technologists | 283 (16.3%) | 1,457 (83.7%) |
| Total (Category) | 4,707 (41.4%) | 6,662 (58.6%) |
| Total (Overall) | 14,002 (50.6%) | 13,676 (49.4%) |
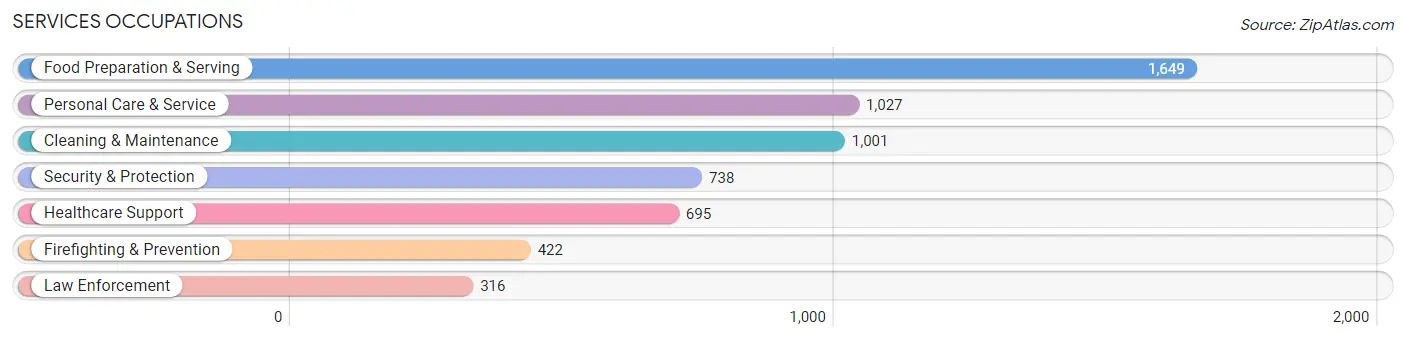
Services Occupations
The most common Services occupations in Peabody are Food Preparation & Serving (1,649 | 6.0%), Personal Care & Service (1,027 | 3.7%), Cleaning & Maintenance (1,001 | 3.6%), Security & Protection (738 | 2.7%), and Healthcare Support (695 | 2.5%).
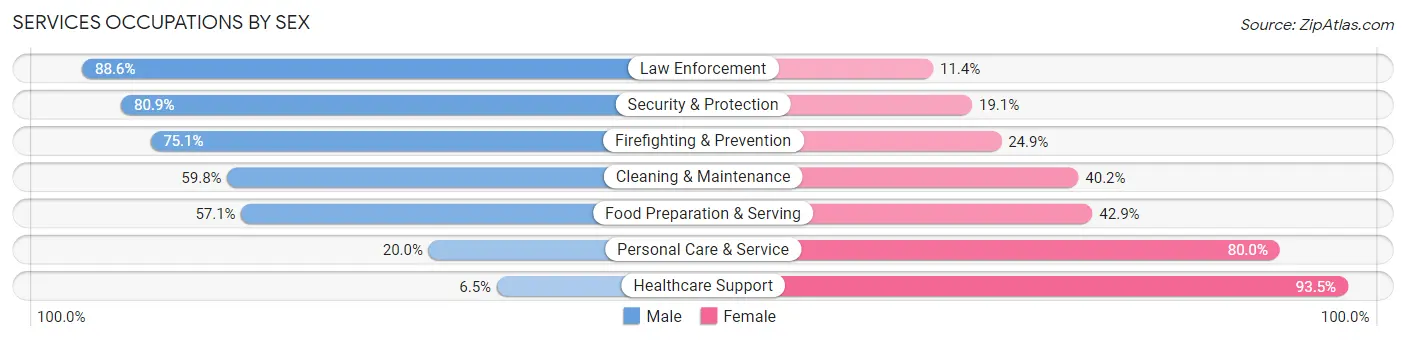
Services Occupations by Sex
Within the Services occupations in Peabody, the most male-oriented occupations are Law Enforcement (88.6%), Security & Protection (80.9%), and Firefighting & Prevention (75.1%), while the most female-oriented occupations are Healthcare Support (93.5%), Personal Care & Service (80.0%), and Food Preparation & Serving (42.9%).
| Occupation | Male | Female |
| Healthcare Support | 45 (6.5%) | 650 (93.5%) |
| Security & Protection | 597 (80.9%) | 141 (19.1%) |
| Firefighting & Prevention | 317 (75.1%) | 105 (24.9%) |
| Law Enforcement | 280 (88.6%) | 36 (11.4%) |
| Food Preparation & Serving | 941 (57.1%) | 708 (42.9%) |
| Cleaning & Maintenance | 599 (59.8%) | 402 (40.2%) |
| Personal Care & Service | 205 (20.0%) | 822 (80.0%) |
| Total (Category) | 2,387 (46.7%) | 2,723 (53.3%) |
| Total (Overall) | 14,002 (50.6%) | 13,676 (49.4%) |
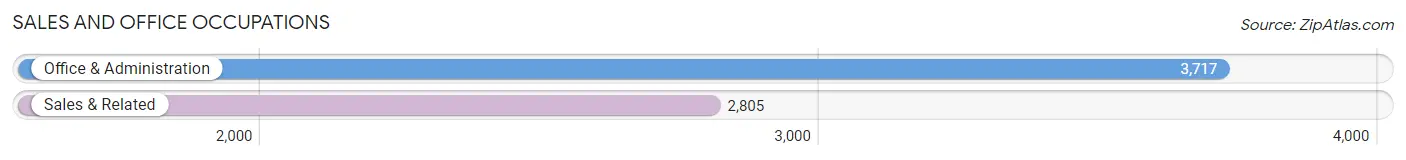
Sales and Office Occupations
The most common Sales and Office occupations in Peabody are Office & Administration (3,717 | 13.4%), and Sales & Related (2,805 | 10.1%).
Sales and Office Occupations by Sex
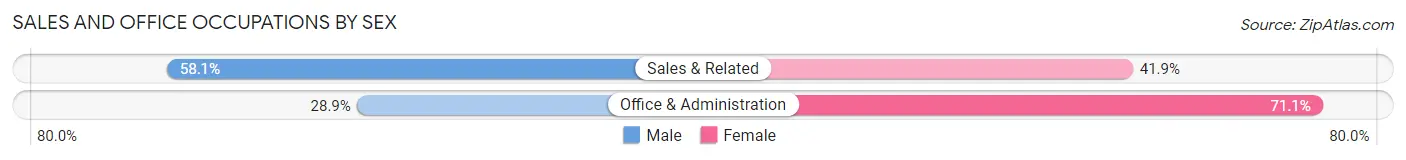
| Occupation | Male | Female |
| Sales & Related | 1,630 (58.1%) | 1,175 (41.9%) |
| Office & Administration | 1,075 (28.9%) | 2,642 (71.1%) |
| Total (Category) | 2,705 (41.5%) | 3,817 (58.5%) |
| Total (Overall) | 14,002 (50.6%) | 13,676 (49.4%) |
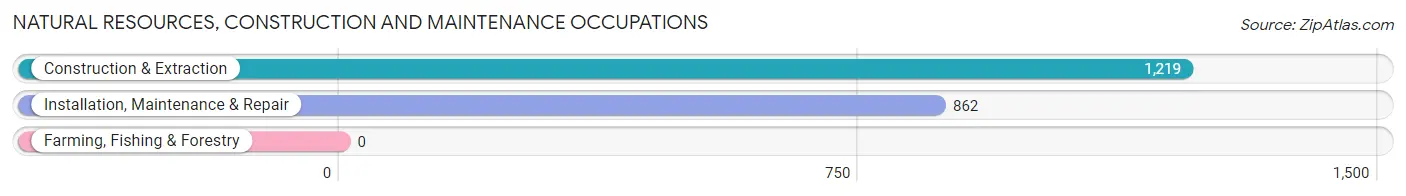
Natural Resources, Construction and Maintenance Occupations
The most common Natural Resources, Construction and Maintenance occupations in Peabody are Construction & Extraction (1,219 | 4.4%), and Installation, Maintenance & Repair (862 | 3.1%).
Natural Resources, Construction and Maintenance Occupations by Sex
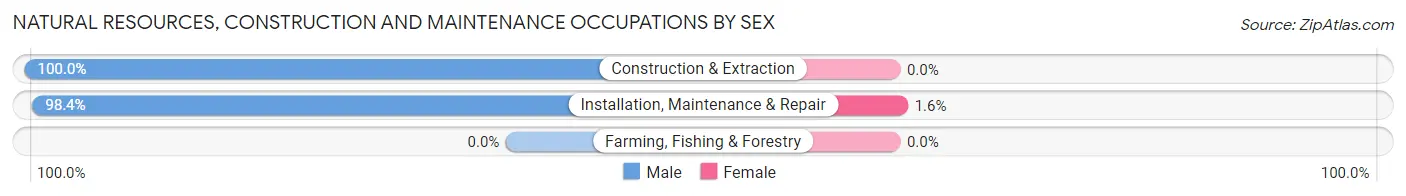
| Occupation | Male | Female |
| Farming, Fishing & Forestry | 0 (0.0%) | 0 (0.0%) |
| Construction & Extraction | 1,219 (100.0%) | 0 (0.0%) |
| Installation, Maintenance & Repair | 848 (98.4%) | 14 (1.6%) |
| Total (Category) | 2,067 (99.3%) | 14 (0.7%) |
| Total (Overall) | 14,002 (50.6%) | 13,676 (49.4%) |
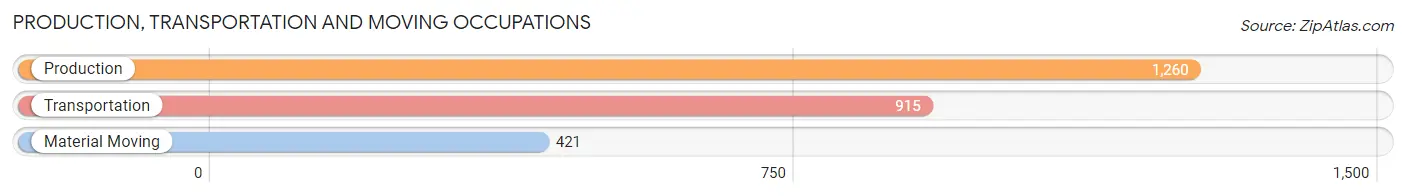
Production, Transportation and Moving Occupations
The most common Production, Transportation and Moving occupations in Peabody are Production (1,260 | 4.5%), Transportation (915 | 3.3%), and Material Moving (421 | 1.5%).
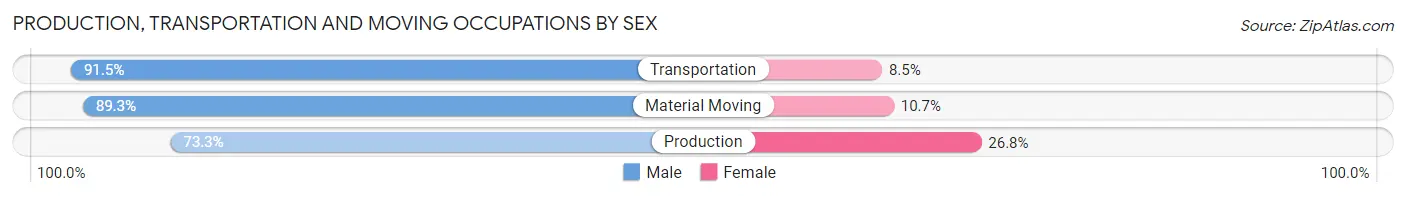
Production, Transportation and Moving Occupations by Sex
| Occupation | Male | Female |
| Production | 923 (73.3%) | 337 (26.8%) |
| Transportation | 837 (91.5%) | 78 (8.5%) |
| Material Moving | 376 (89.3%) | 45 (10.7%) |
| Total (Category) | 2,136 (82.3%) | 460 (17.7%) |
| Total (Overall) | 14,002 (50.6%) | 13,676 (49.4%) |
Employment Industries by Sex in Peabody
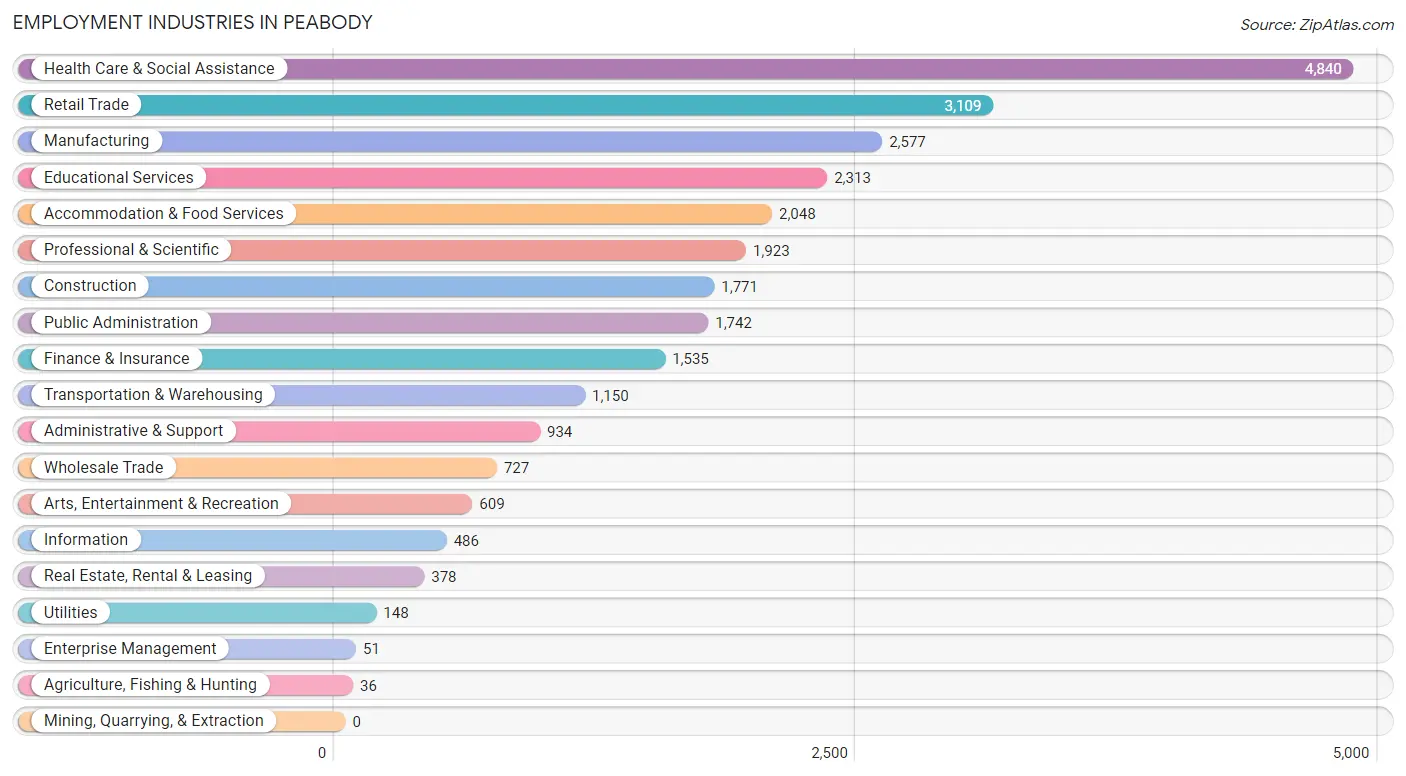
Employment Industries in Peabody
The major employment industries in Peabody include Health Care & Social Assistance (4,840 | 17.5%), Retail Trade (3,109 | 11.2%), Manufacturing (2,577 | 9.3%), Educational Services (2,313 | 8.4%), and Accommodation & Food Services (2,048 | 7.4%).
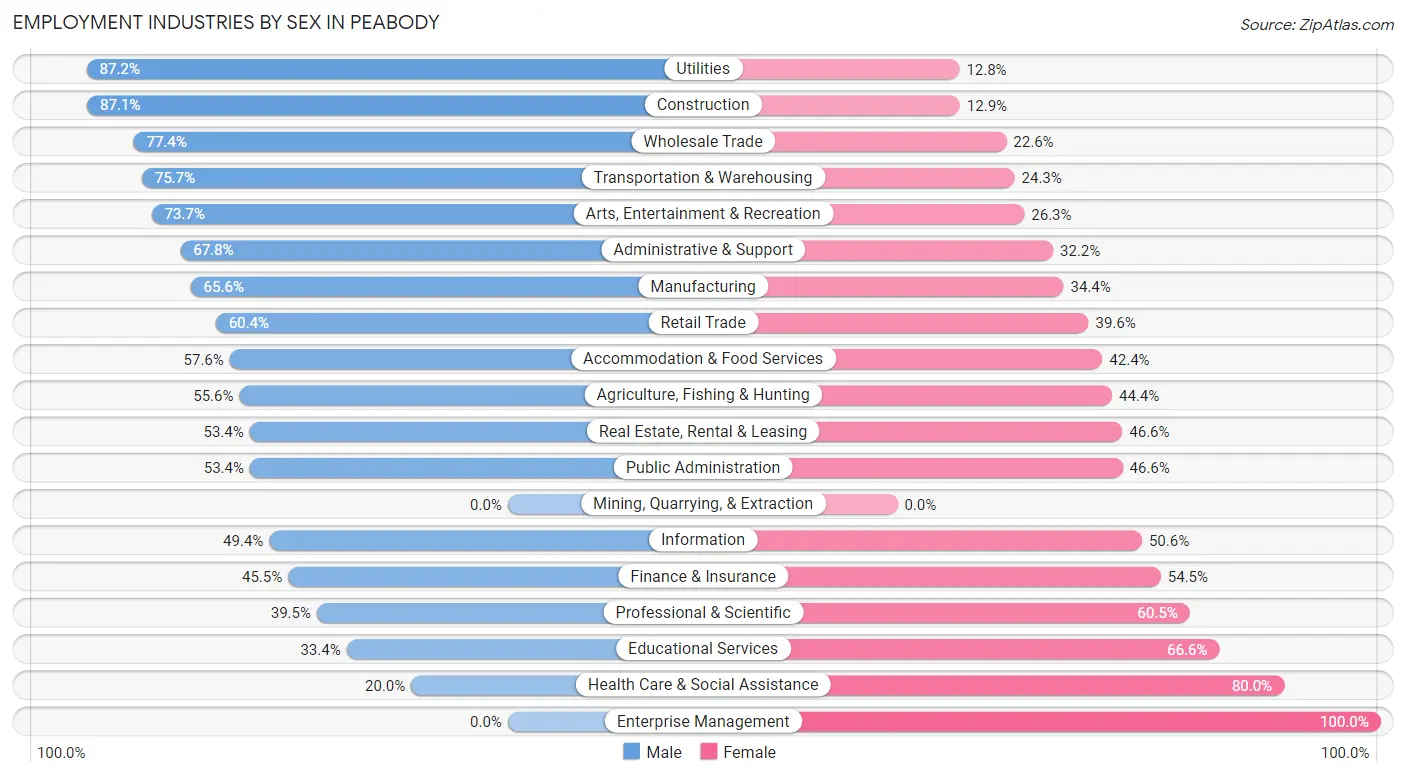
Employment Industries by Sex in Peabody
The Peabody industries that see more men than women are Utilities (87.2%), Construction (87.1%), and Wholesale Trade (77.4%), whereas the industries that tend to have a higher number of women are Enterprise Management (100.0%), Health Care & Social Assistance (80.0%), and Educational Services (66.6%).
| Industry | Male | Female |
| Agriculture, Fishing & Hunting | 20 (55.6%) | 16 (44.4%) |
| Mining, Quarrying, & Extraction | 0 (0.0%) | 0 (0.0%) |
| Construction | 1,542 (87.1%) | 229 (12.9%) |
| Manufacturing | 1,691 (65.6%) | 886 (34.4%) |
| Wholesale Trade | 563 (77.4%) | 164 (22.6%) |
| Retail Trade | 1,879 (60.4%) | 1,230 (39.6%) |
| Transportation & Warehousing | 871 (75.7%) | 279 (24.3%) |
| Utilities | 129 (87.2%) | 19 (12.8%) |
| Information | 240 (49.4%) | 246 (50.6%) |
| Finance & Insurance | 698 (45.5%) | 837 (54.5%) |
| Real Estate, Rental & Leasing | 202 (53.4%) | 176 (46.6%) |
| Professional & Scientific | 760 (39.5%) | 1,163 (60.5%) |
| Enterprise Management | 0 (0.0%) | 51 (100.0%) |
| Administrative & Support | 633 (67.8%) | 301 (32.2%) |
| Educational Services | 772 (33.4%) | 1,541 (66.6%) |
| Health Care & Social Assistance | 968 (20.0%) | 3,872 (80.0%) |
| Arts, Entertainment & Recreation | 449 (73.7%) | 160 (26.3%) |
| Accommodation & Food Services | 1,179 (57.6%) | 869 (42.4%) |
| Public Administration | 930 (53.4%) | 812 (46.6%) |
| Total | 14,002 (50.6%) | 13,676 (49.4%) |
Education in Peabody
School Enrollment in Peabody
The most common levels of schooling among the 9,824 students in Peabody are high school (2,399 | 24.4%), elementary school (2,065 | 21.0%), and college / undergraduate (1,912 | 19.5%).
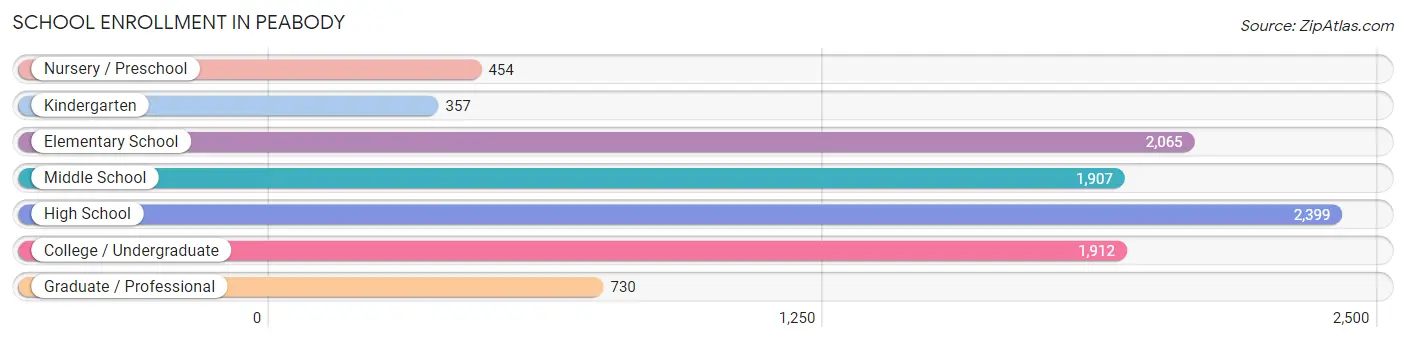
| School Level | # Students | % Students |
| Nursery / Preschool | 454 | 4.6% |
| Kindergarten | 357 | 3.6% |
| Elementary School | 2,065 | 21.0% |
| Middle School | 1,907 | 19.4% |
| High School | 2,399 | 24.4% |
| College / Undergraduate | 1,912 | 19.5% |
| Graduate / Professional | 730 | 7.4% |
| Total | 9,824 | 100.0% |
School Enrollment by Age by Funding Source in Peabody
Out of a total of 9,824 students who are enrolled in schools in Peabody, 2,377 (24.2%) attend a private institution, while the remaining 7,447 (75.8%) are enrolled in public schools. The age group of 35 years and over has the highest likelihood of being enrolled in private schools, with 487 (68.7% in the age bracket) enrolled. Conversely, the age group of 5 to 9 year old has the lowest likelihood of being enrolled in a private school, with 2,101 (90.9% in the age bracket) attending a public institution.
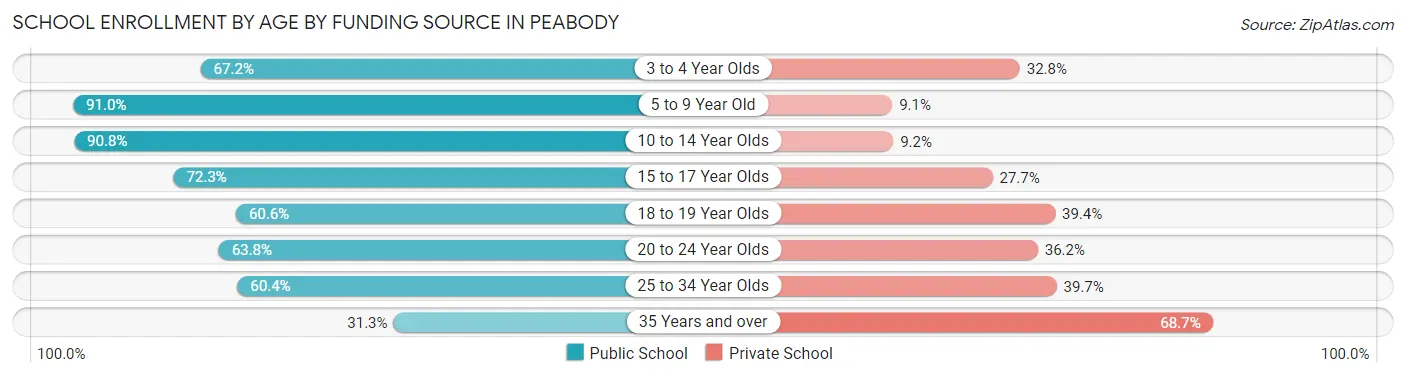
| Age Bracket | Public School | Private School |
| 3 to 4 Year Olds | 211 (67.2%) | 103 (32.8%) |
| 5 to 9 Year Old | 2,101 (90.9%) | 209 (9.0%) |
| 10 to 14 Year Olds | 2,349 (90.8%) | 239 (9.2%) |
| 15 to 17 Year Olds | 1,066 (72.3%) | 409 (27.7%) |
| 18 to 19 Year Olds | 402 (60.6%) | 261 (39.4%) |
| 20 to 24 Year Olds | 618 (63.8%) | 350 (36.2%) |
| 25 to 34 Year Olds | 481 (60.4%) | 316 (39.7%) |
| 35 Years and over | 222 (31.3%) | 487 (68.7%) |
| Total | 7,447 (75.8%) | 2,377 (24.2%) |
Educational Attainment by Field of Study in Peabody
Business (3,167 | 21.2%), science & technology (1,974 | 13.2%), education (1,915 | 12.8%), arts & humanities (1,084 | 7.2%), and social sciences (1,079 | 7.2%) are the most common fields of study among 14,943 individuals in Peabody who have obtained a bachelor's degree or higher.
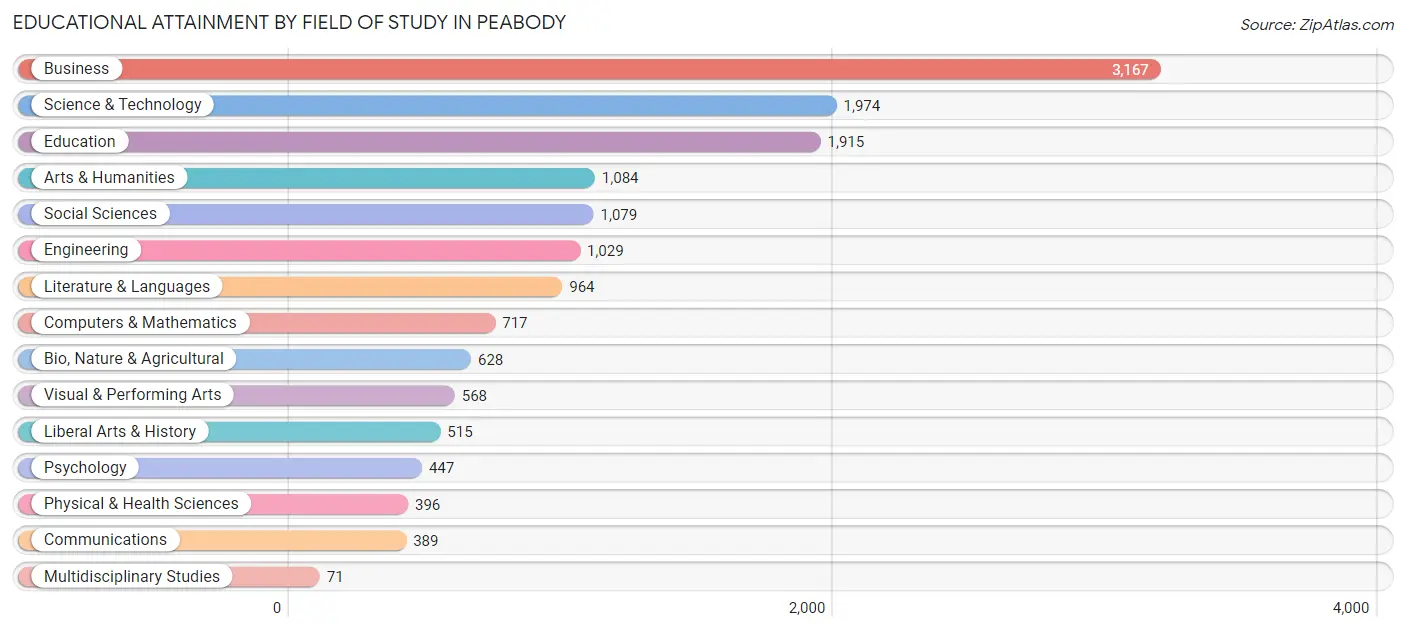
| Field of Study | # Graduates | % Graduates |
| Computers & Mathematics | 717 | 4.8% |
| Bio, Nature & Agricultural | 628 | 4.2% |
| Physical & Health Sciences | 396 | 2.6% |
| Psychology | 447 | 3.0% |
| Social Sciences | 1,079 | 7.2% |
| Engineering | 1,029 | 6.9% |
| Multidisciplinary Studies | 71 | 0.5% |
| Science & Technology | 1,974 | 13.2% |
| Business | 3,167 | 21.2% |
| Education | 1,915 | 12.8% |
| Literature & Languages | 964 | 6.5% |
| Liberal Arts & History | 515 | 3.5% |
| Visual & Performing Arts | 568 | 3.8% |
| Communications | 389 | 2.6% |
| Arts & Humanities | 1,084 | 7.2% |
| Total | 14,943 | 100.0% |
Transportation & Commute in Peabody
Vehicle Availability by Sex in Peabody
The most prevalent vehicle ownership categories in Peabody are males with 2 vehicles (6,052, accounting for 44.2%) and females with 2 vehicles (5,949, making up 46.3%).
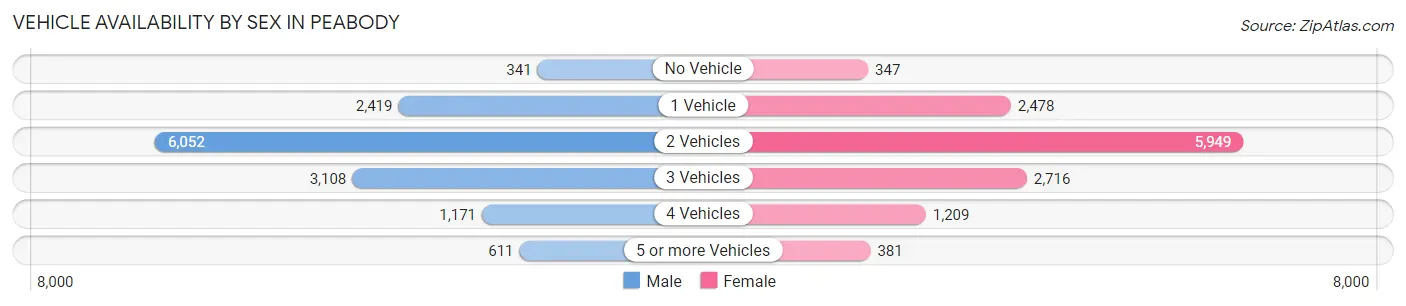
| Vehicles Available | Male | Female |
| No Vehicle | 341 (2.5%) | 347 (2.6%) |
| 1 Vehicle | 2,419 (17.6%) | 2,478 (18.9%) |
| 2 Vehicles | 6,052 (44.2%) | 5,949 (45.5%) |
| 3 Vehicles | 3,108 (22.7%) | 2,716 (20.8%) |
| 4 Vehicles | 1,171 (8.6%) | 1,209 (9.2%) |
| 5 or more Vehicles | 611 (4.5%) | 381 (2.9%) |
| Total | 13,702 (100.0%) | 13,080 (100.0%) |
Commute Time in Peabody
The most frequently occuring commute durations in Peabody are 15 to 19 minutes (4,430 commuters, 17.6%), 20 to 24 minutes (3,594 commuters, 14.3%), and 30 to 34 minutes (3,394 commuters, 13.5%).
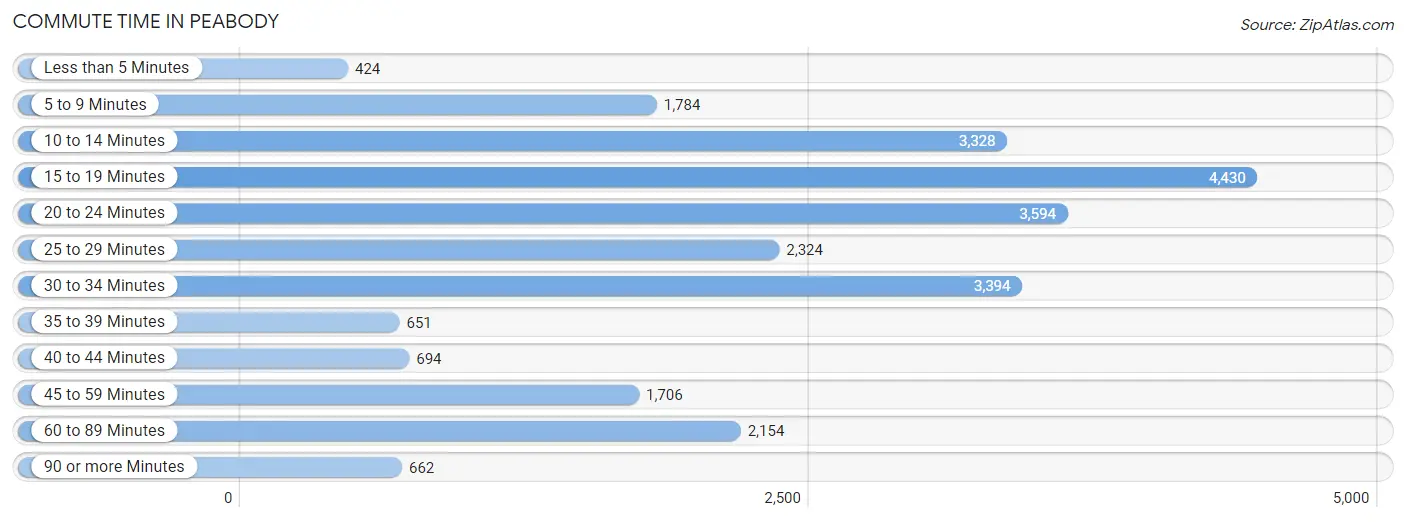
| Commute Time | # Commuters | % Commuters |
| Less than 5 Minutes | 424 | 1.7% |
| 5 to 9 Minutes | 1,784 | 7.1% |
| 10 to 14 Minutes | 3,328 | 13.2% |
| 15 to 19 Minutes | 4,430 | 17.6% |
| 20 to 24 Minutes | 3,594 | 14.3% |
| 25 to 29 Minutes | 2,324 | 9.2% |
| 30 to 34 Minutes | 3,394 | 13.5% |
| 35 to 39 Minutes | 651 | 2.6% |
| 40 to 44 Minutes | 694 | 2.8% |
| 45 to 59 Minutes | 1,706 | 6.8% |
| 60 to 89 Minutes | 2,154 | 8.6% |
| 90 or more Minutes | 662 | 2.6% |
Commute Time by Sex in Peabody
The most common commute times in Peabody are 15 to 19 minutes (2,107 commuters, 16.2%) for males and 15 to 19 minutes (2,323 commuters, 19.1%) for females.
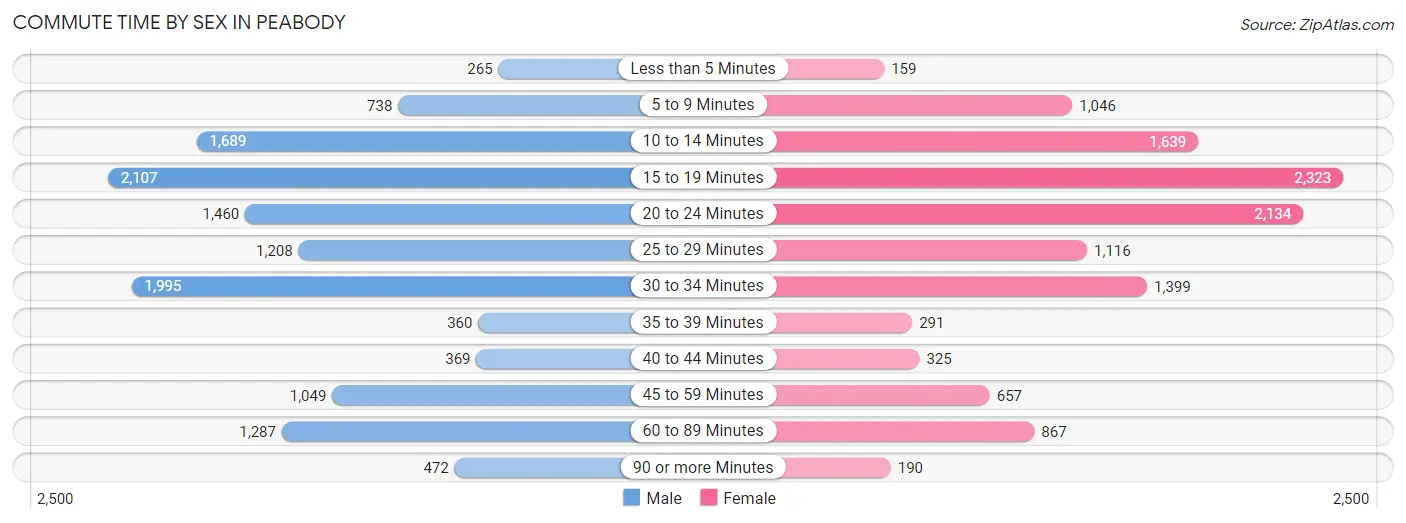
| Commute Time | Male | Female |
| Less than 5 Minutes | 265 (2.0%) | 159 (1.3%) |
| 5 to 9 Minutes | 738 (5.7%) | 1,046 (8.6%) |
| 10 to 14 Minutes | 1,689 (13.0%) | 1,639 (13.5%) |
| 15 to 19 Minutes | 2,107 (16.2%) | 2,323 (19.1%) |
| 20 to 24 Minutes | 1,460 (11.2%) | 2,134 (17.6%) |
| 25 to 29 Minutes | 1,208 (9.3%) | 1,116 (9.2%) |
| 30 to 34 Minutes | 1,995 (15.3%) | 1,399 (11.5%) |
| 35 to 39 Minutes | 360 (2.8%) | 291 (2.4%) |
| 40 to 44 Minutes | 369 (2.8%) | 325 (2.7%) |
| 45 to 59 Minutes | 1,049 (8.1%) | 657 (5.4%) |
| 60 to 89 Minutes | 1,287 (9.9%) | 867 (7.1%) |
| 90 or more Minutes | 472 (3.6%) | 190 (1.6%) |
Time of Departure to Work by Sex in Peabody
The most frequent times of departure to work in Peabody are 6:00 AM to 6:29 AM (2,047, 15.8%) for males and 7:00 AM to 7:29 AM (1,825, 15.0%) for females.
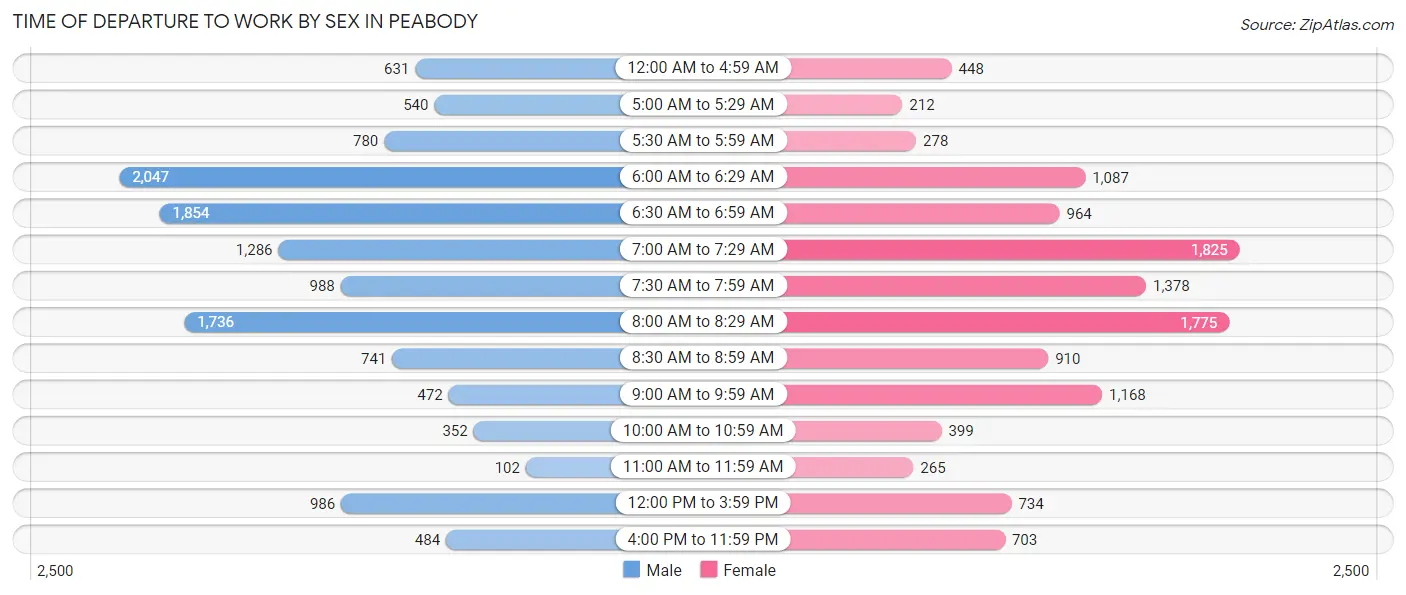
| Time of Departure | Male | Female |
| 12:00 AM to 4:59 AM | 631 (4.9%) | 448 (3.7%) |
| 5:00 AM to 5:29 AM | 540 (4.2%) | 212 (1.8%) |
| 5:30 AM to 5:59 AM | 780 (6.0%) | 278 (2.3%) |
| 6:00 AM to 6:29 AM | 2,047 (15.8%) | 1,087 (8.9%) |
| 6:30 AM to 6:59 AM | 1,854 (14.3%) | 964 (7.9%) |
| 7:00 AM to 7:29 AM | 1,286 (9.9%) | 1,825 (15.0%) |
| 7:30 AM to 7:59 AM | 988 (7.6%) | 1,378 (11.4%) |
| 8:00 AM to 8:29 AM | 1,736 (13.4%) | 1,775 (14.6%) |
| 8:30 AM to 8:59 AM | 741 (5.7%) | 910 (7.5%) |
| 9:00 AM to 9:59 AM | 472 (3.6%) | 1,168 (9.6%) |
| 10:00 AM to 10:59 AM | 352 (2.7%) | 399 (3.3%) |
| 11:00 AM to 11:59 AM | 102 (0.8%) | 265 (2.2%) |
| 12:00 PM to 3:59 PM | 986 (7.6%) | 734 (6.0%) |
| 4:00 PM to 11:59 PM | 484 (3.7%) | 703 (5.8%) |
| Total | 12,999 (100.0%) | 12,146 (100.0%) |
Housing Occupancy in Peabody
Occupancy by Ownership in Peabody
Of the total 22,678 dwellings in Peabody, owner-occupied units account for 14,851 (65.5%), while renter-occupied units make up 7,827 (34.5%).
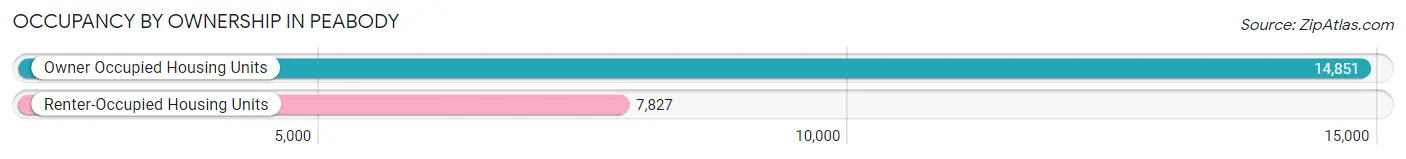
| Occupancy | # Housing Units | % Housing Units |
| Owner Occupied Housing Units | 14,851 | 65.5% |
| Renter-Occupied Housing Units | 7,827 | 34.5% |
| Total Occupied Housing Units | 22,678 | 100.0% |
Occupancy by Household Size in Peabody
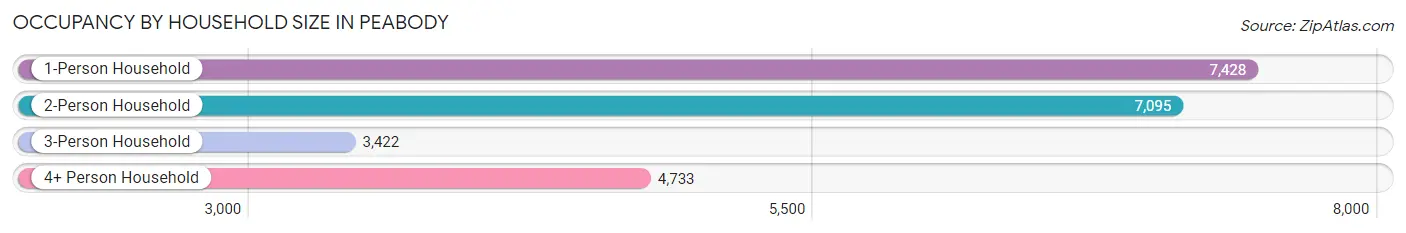
| Household Size | # Housing Units | % Housing Units |
| 1-Person Household | 7,428 | 32.8% |
| 2-Person Household | 7,095 | 31.3% |
| 3-Person Household | 3,422 | 15.1% |
| 4+ Person Household | 4,733 | 20.9% |
| Total Housing Units | 22,678 | 100.0% |
Occupancy by Ownership by Household Size in Peabody
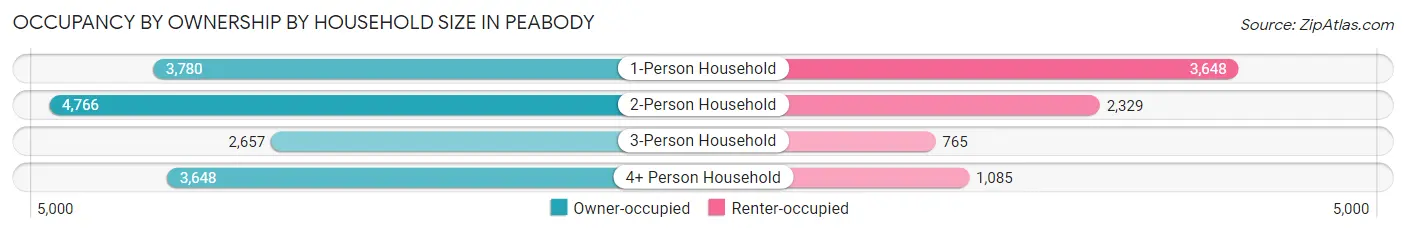
| Household Size | Owner-occupied | Renter-occupied |
| 1-Person Household | 3,780 (50.9%) | 3,648 (49.1%) |
| 2-Person Household | 4,766 (67.2%) | 2,329 (32.8%) |
| 3-Person Household | 2,657 (77.6%) | 765 (22.4%) |
| 4+ Person Household | 3,648 (77.1%) | 1,085 (22.9%) |
| Total Housing Units | 14,851 (65.5%) | 7,827 (34.5%) |
Occupancy by Educational Attainment in Peabody
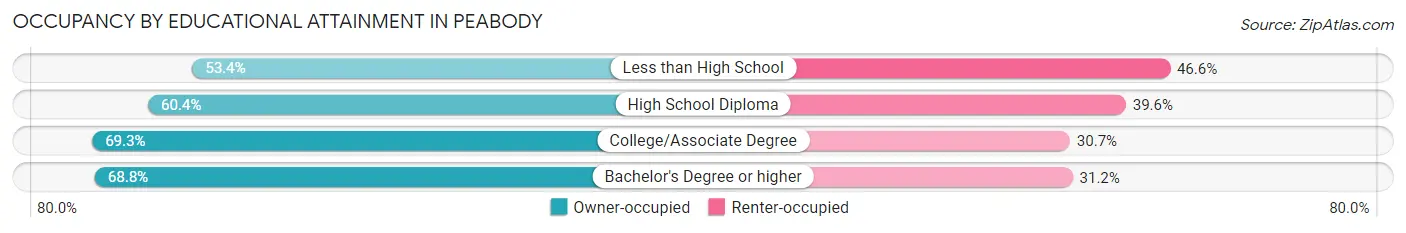
| Household Size | Owner-occupied | Renter-occupied |
| Less than High School | 920 (53.4%) | 803 (46.6%) |
| High School Diploma | 3,737 (60.4%) | 2,449 (39.6%) |
| College/Associate Degree | 4,317 (69.3%) | 1,915 (30.7%) |
| Bachelor's Degree or higher | 5,877 (68.8%) | 2,660 (31.2%) |
Occupancy by Age of Householder in Peabody
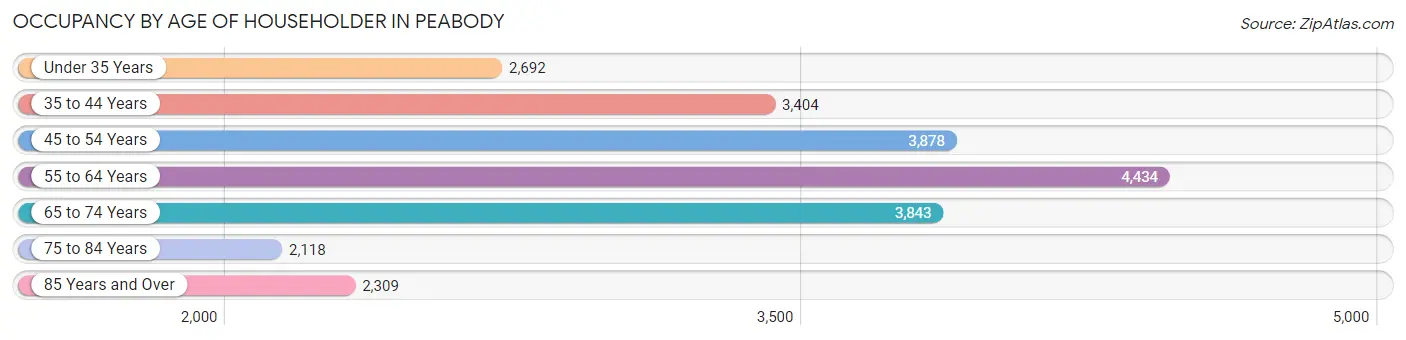
| Age Bracket | # Households | % Households |
| Under 35 Years | 2,692 | 11.9% |
| 35 to 44 Years | 3,404 | 15.0% |
| 45 to 54 Years | 3,878 | 17.1% |
| 55 to 64 Years | 4,434 | 19.6% |
| 65 to 74 Years | 3,843 | 17.0% |
| 75 to 84 Years | 2,118 | 9.3% |
| 85 Years and Over | 2,309 | 10.2% |
| Total | 22,678 | 100.0% |
Housing Finances in Peabody
Median Income by Occupancy in Peabody
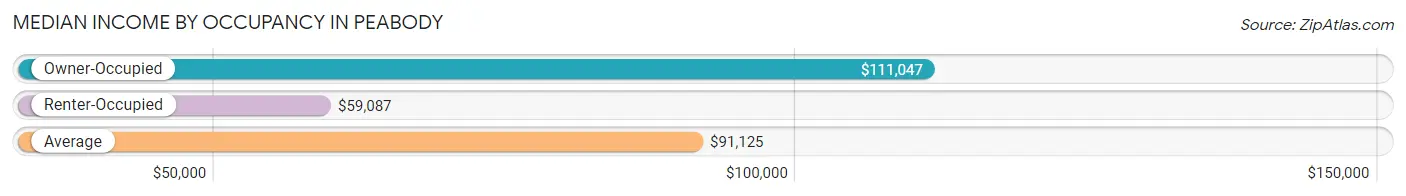
| Occupancy Type | # Households | Median Income |
| Owner-Occupied | 14,851 (65.5%) | $111,047 |
| Renter-Occupied | 7,827 (34.5%) | $59,087 |
| Average | 22,678 (100.0%) | $91,125 |
Occupancy by Householder Income Bracket in Peabody
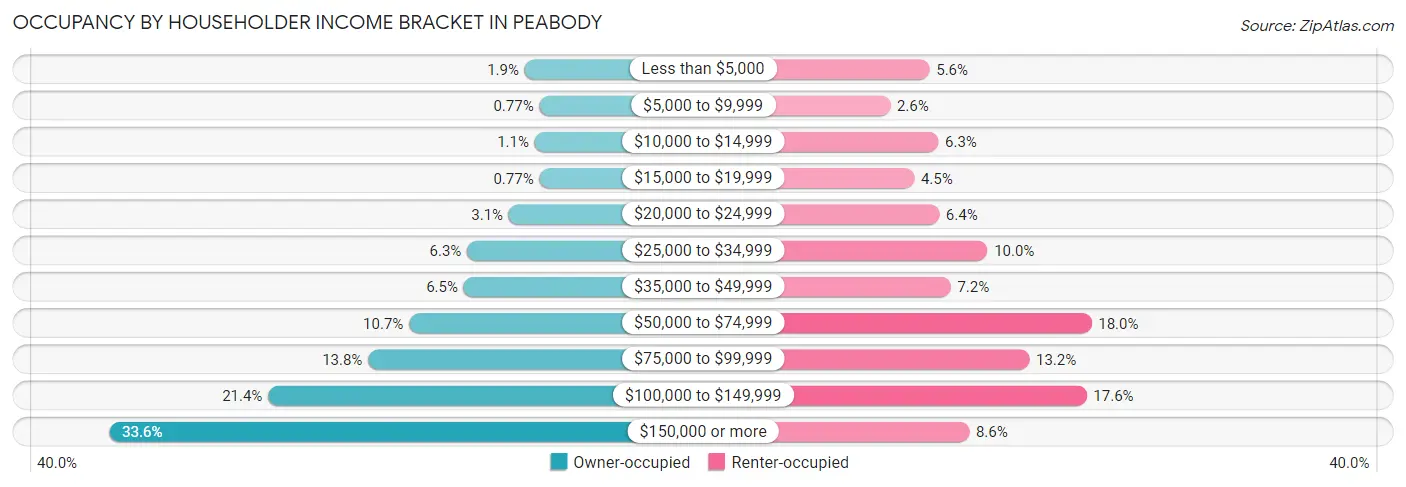
| Income Bracket | Owner-occupied | Renter-occupied |
| Less than $5,000 | 281 (1.9%) | 440 (5.6%) |
| $5,000 to $9,999 | 115 (0.8%) | 205 (2.6%) |
| $10,000 to $14,999 | 168 (1.1%) | 492 (6.3%) |
| $15,000 to $19,999 | 114 (0.8%) | 348 (4.4%) |
| $20,000 to $24,999 | 461 (3.1%) | 497 (6.4%) |
| $25,000 to $34,999 | 932 (6.3%) | 785 (10.0%) |
| $35,000 to $49,999 | 971 (6.5%) | 566 (7.2%) |
| $50,000 to $74,999 | 1,589 (10.7%) | 1,406 (18.0%) |
| $75,000 to $99,999 | 2,052 (13.8%) | 1,035 (13.2%) |
| $100,000 to $149,999 | 3,184 (21.4%) | 1,377 (17.6%) |
| $150,000 or more | 4,984 (33.6%) | 676 (8.6%) |
| Total | 14,851 (100.0%) | 7,827 (100.0%) |
Monthly Housing Cost Tiers in Peabody
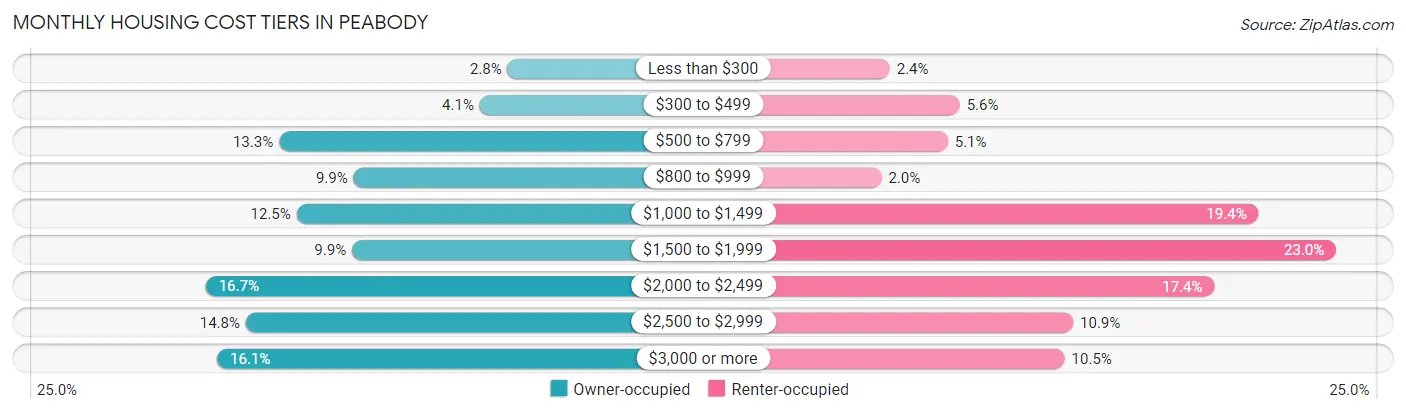
| Monthly Cost | Owner-occupied | Renter-occupied |
| Less than $300 | 412 (2.8%) | 189 (2.4%) |
| $300 to $499 | 601 (4.1%) | 441 (5.6%) |
| $500 to $799 | 1,973 (13.3%) | 398 (5.1%) |
| $800 to $999 | 1,465 (9.9%) | 159 (2.0%) |
| $1,000 to $1,499 | 1,854 (12.5%) | 1,517 (19.4%) |
| $1,500 to $1,999 | 1,474 (9.9%) | 1,796 (23.0%) |
| $2,000 to $2,499 | 2,474 (16.7%) | 1,358 (17.3%) |
| $2,500 to $2,999 | 2,201 (14.8%) | 849 (10.8%) |
| $3,000 or more | 2,397 (16.1%) | 819 (10.5%) |
| Total | 14,851 (100.0%) | 7,827 (100.0%) |
Physical Housing Characteristics in Peabody
Housing Structures in Peabody
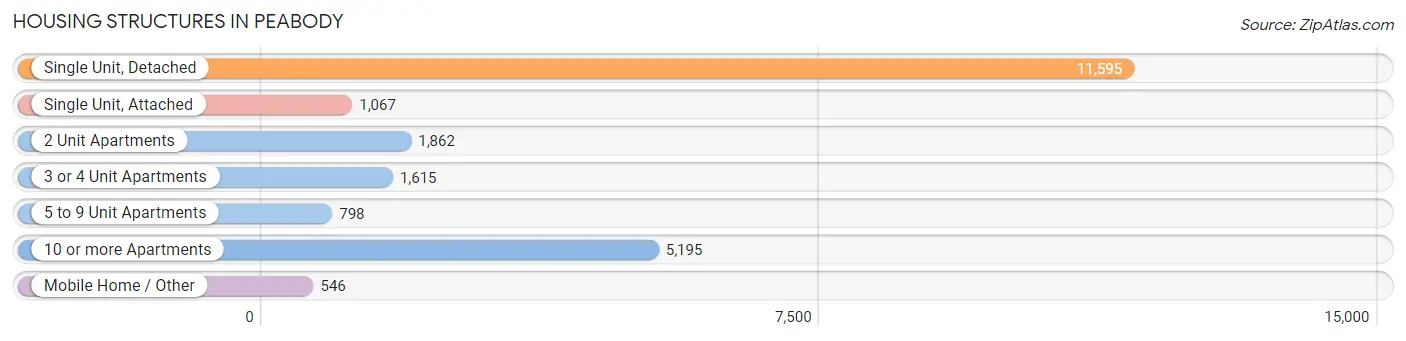
| Structure Type | # Housing Units | % Housing Units |
| Single Unit, Detached | 11,595 | 51.1% |
| Single Unit, Attached | 1,067 | 4.7% |
| 2 Unit Apartments | 1,862 | 8.2% |
| 3 or 4 Unit Apartments | 1,615 | 7.1% |
| 5 to 9 Unit Apartments | 798 | 3.5% |
| 10 or more Apartments | 5,195 | 22.9% |
| Mobile Home / Other | 546 | 2.4% |
| Total | 22,678 | 100.0% |
Housing Structures by Occupancy in Peabody
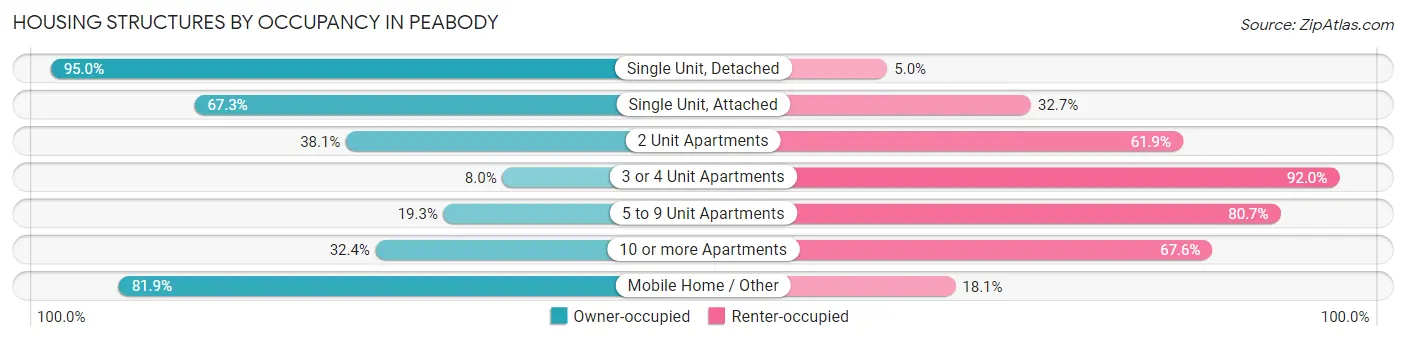
| Structure Type | Owner-occupied | Renter-occupied |
| Single Unit, Detached | 11,011 (95.0%) | 584 (5.0%) |
| Single Unit, Attached | 718 (67.3%) | 349 (32.7%) |
| 2 Unit Apartments | 709 (38.1%) | 1,153 (61.9%) |
| 3 or 4 Unit Apartments | 129 (8.0%) | 1,486 (92.0%) |
| 5 to 9 Unit Apartments | 154 (19.3%) | 644 (80.7%) |
| 10 or more Apartments | 1,683 (32.4%) | 3,512 (67.6%) |
| Mobile Home / Other | 447 (81.9%) | 99 (18.1%) |
| Total | 14,851 (65.5%) | 7,827 (34.5%) |
Housing Structures by Number of Rooms in Peabody
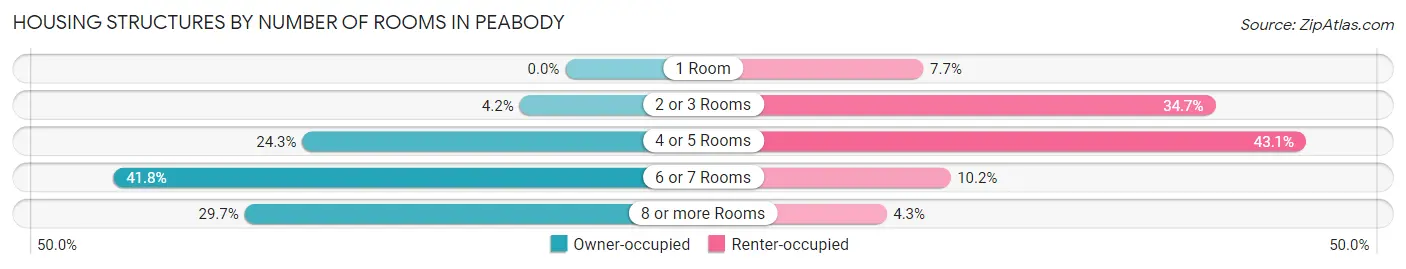
| Number of Rooms | Owner-occupied | Renter-occupied |
| 1 Room | 0 (0.0%) | 603 (7.7%) |
| 2 or 3 Rooms | 628 (4.2%) | 2,717 (34.7%) |
| 4 or 5 Rooms | 3,611 (24.3%) | 3,373 (43.1%) |
| 6 or 7 Rooms | 6,207 (41.8%) | 798 (10.2%) |
| 8 or more Rooms | 4,405 (29.7%) | 336 (4.3%) |
| Total | 14,851 (100.0%) | 7,827 (100.0%) |
Housing Structure by Heating Type in Peabody
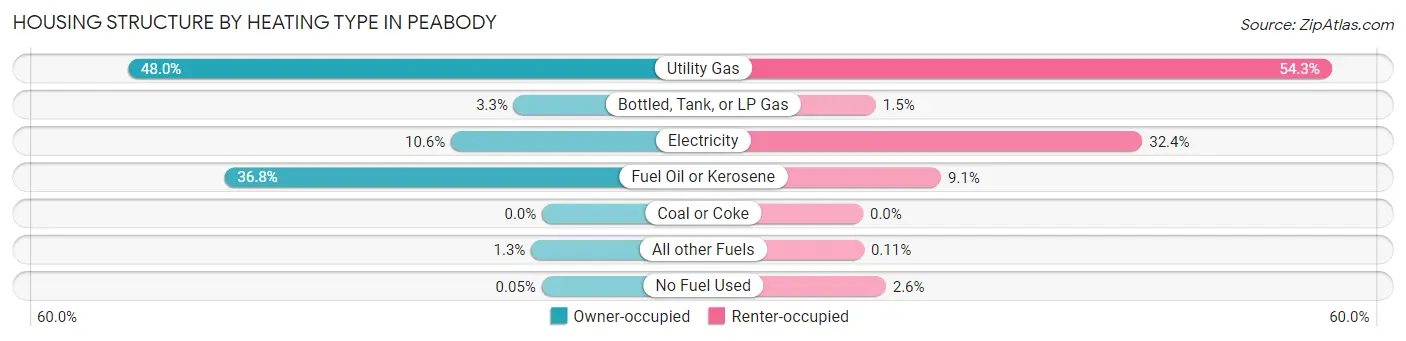
| Heating Type | Owner-occupied | Renter-occupied |
| Utility Gas | 7,131 (48.0%) | 4,252 (54.3%) |
| Bottled, Tank, or LP Gas | 487 (3.3%) | 117 (1.5%) |
| Electricity | 1,568 (10.6%) | 2,534 (32.4%) |
| Fuel Oil or Kerosene | 5,470 (36.8%) | 708 (9.0%) |
| Coal or Coke | 0 (0.0%) | 0 (0.0%) |
| All other Fuels | 188 (1.3%) | 9 (0.1%) |
| No Fuel Used | 7 (0.1%) | 207 (2.6%) |
| Total | 14,851 (100.0%) | 7,827 (100.0%) |
Household Vehicle Usage in Peabody
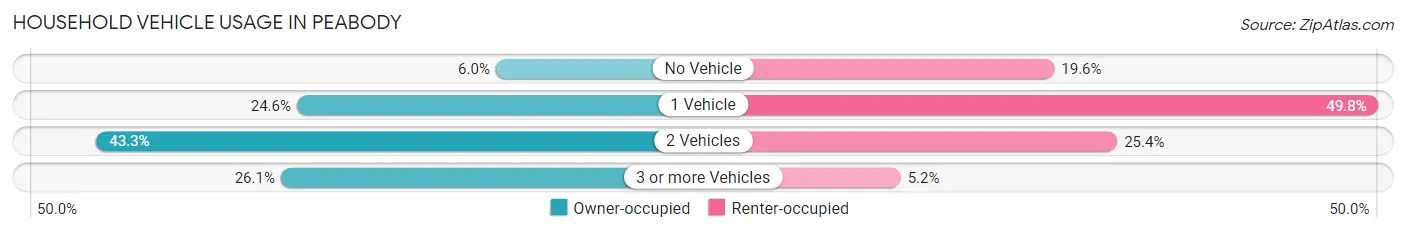
| Vehicles per Household | Owner-occupied | Renter-occupied |
| No Vehicle | 894 (6.0%) | 1,530 (19.6%) |
| 1 Vehicle | 3,652 (24.6%) | 3,899 (49.8%) |
| 2 Vehicles | 6,430 (43.3%) | 1,990 (25.4%) |
| 3 or more Vehicles | 3,875 (26.1%) | 408 (5.2%) |
| Total | 14,851 (100.0%) | 7,827 (100.0%) |
Real Estate & Mortgages in Peabody
Real Estate and Mortgage Overview in Peabody
| Characteristic | Without Mortgage | With Mortgage |
| Housing Units | 5,334 | 9,517 |
| Median Property Value | $471,000 | $537,000 |
| Median Household Income | $64,706 | $4,001 |
| Monthly Housing Costs | $783 | $2,373 |
| Real Estate Taxes | $4,519 | $189 |
Property Value by Mortgage Status in Peabody
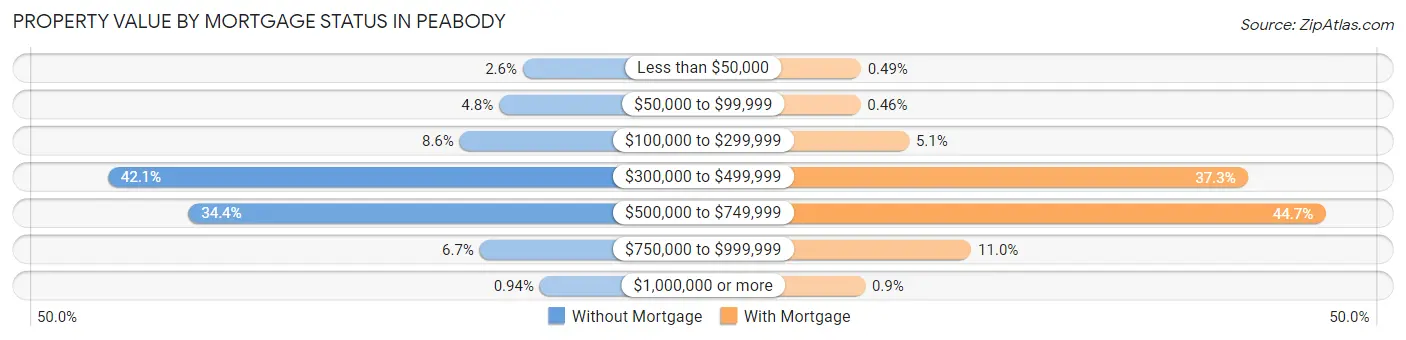
| Property Value | Without Mortgage | With Mortgage |
| Less than $50,000 | 136 (2.5%) | 47 (0.5%) |
| $50,000 to $99,999 | 257 (4.8%) | 44 (0.5%) |
| $100,000 to $299,999 | 457 (8.6%) | 484 (5.1%) |
| $300,000 to $499,999 | 2,244 (42.1%) | 3,553 (37.3%) |
| $500,000 to $749,999 | 1,835 (34.4%) | 4,255 (44.7%) |
| $750,000 to $999,999 | 355 (6.7%) | 1,048 (11.0%) |
| $1,000,000 or more | 50 (0.9%) | 86 (0.9%) |
| Total | 5,334 (100.0%) | 9,517 (100.0%) |
Household Income by Mortgage Status in Peabody
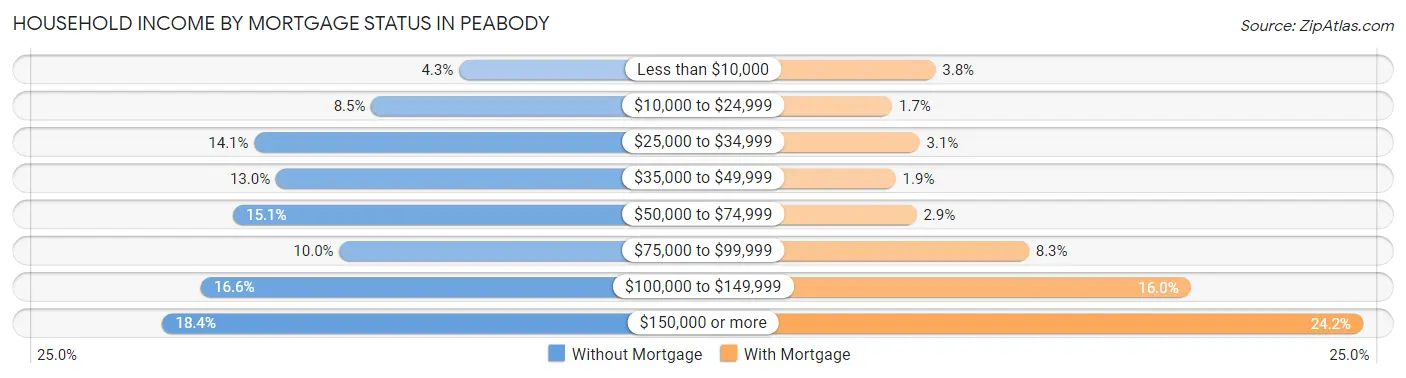
| Household Income | Without Mortgage | With Mortgage |
| Less than $10,000 | 230 (4.3%) | 362 (3.8%) |
| $10,000 to $24,999 | 453 (8.5%) | 166 (1.7%) |
| $25,000 to $34,999 | 750 (14.1%) | 290 (3.0%) |
| $35,000 to $49,999 | 695 (13.0%) | 182 (1.9%) |
| $50,000 to $74,999 | 804 (15.1%) | 276 (2.9%) |
| $75,000 to $99,999 | 534 (10.0%) | 785 (8.3%) |
| $100,000 to $149,999 | 885 (16.6%) | 1,518 (16.0%) |
| $150,000 or more | 983 (18.4%) | 2,299 (24.2%) |
| Total | 5,334 (100.0%) | 9,517 (100.0%) |
Property Value to Household Income Ratio in Peabody
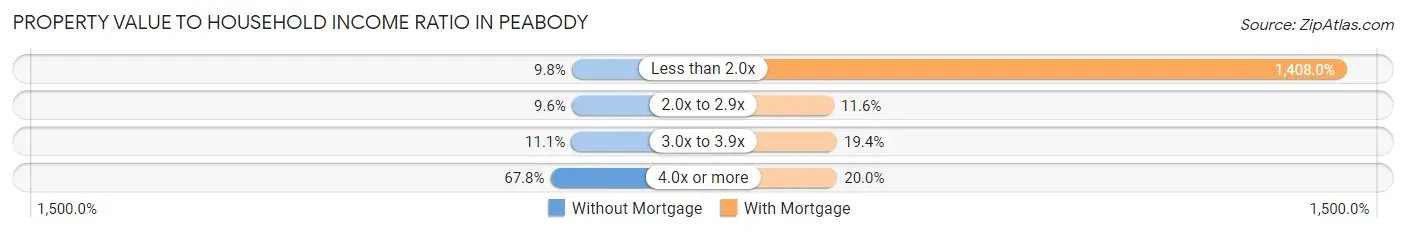
| Value-to-Income Ratio | Without Mortgage | With Mortgage |
| Less than 2.0x | 522 (9.8%) | 133,997 (1,408.0%) |
| 2.0x to 2.9x | 514 (9.6%) | 1,101 (11.6%) |
| 3.0x to 3.9x | 594 (11.1%) | 1,844 (19.4%) |
| 4.0x or more | 3,616 (67.8%) | 1,906 (20.0%) |
| Total | 5,334 (100.0%) | 9,517 (100.0%) |
Real Estate Taxes by Mortgage Status in Peabody
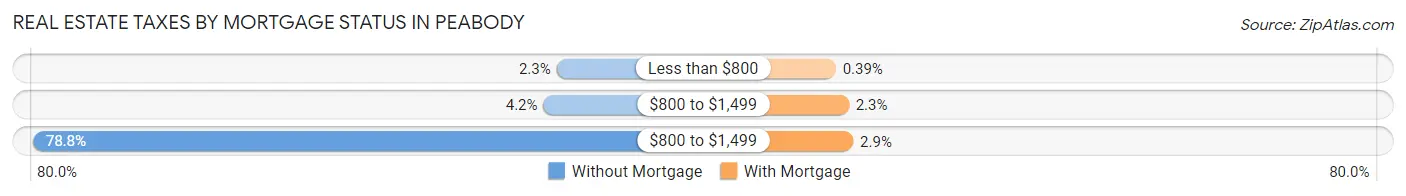
| Property Taxes | Without Mortgage | With Mortgage |
| Less than $800 | 121 (2.3%) | 37 (0.4%) |
| $800 to $1,499 | 224 (4.2%) | 218 (2.3%) |
| $800 to $1,499 | 4,203 (78.8%) | 280 (2.9%) |
| Total | 5,334 (100.0%) | 9,517 (100.0%) |
Health & Disability in Peabody
Health Insurance Coverage by Age in Peabody

| Age Bracket | With Coverage | Without Coverage |
| Under 6 Years | 3,361 (99.4%) | 19 (0.6%) |
| 6 to 18 Years | 6,660 (97.6%) | 164 (2.4%) |
| 19 to 25 Years | 3,970 (92.4%) | 326 (7.6%) |
| 26 to 34 Years | 5,210 (92.9%) | 396 (7.1%) |
| 35 to 44 Years | 5,997 (97.8%) | 138 (2.2%) |
| 45 to 54 Years | 6,584 (97.5%) | 172 (2.5%) |
| 55 to 64 Years | 7,617 (95.8%) | 335 (4.2%) |
| 65 to 74 Years | 6,102 (99.4%) | 35 (0.6%) |
| 75 Years and older | 6,649 (99.6%) | 28 (0.4%) |
| Total | 52,150 (97.0%) | 1,613 (3.0%) |
Health Insurance Coverage by Citizenship Status in Peabody
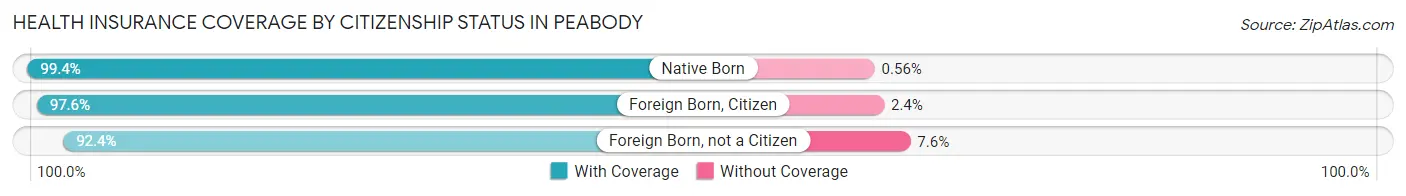
| Citizenship Status | With Coverage | Without Coverage |
| Native Born | 3,361 (99.4%) | 19 (0.6%) |
| Foreign Born, Citizen | 6,660 (97.6%) | 164 (2.4%) |
| Foreign Born, not a Citizen | 3,970 (92.4%) | 326 (7.6%) |
Health Insurance Coverage by Household Income in Peabody
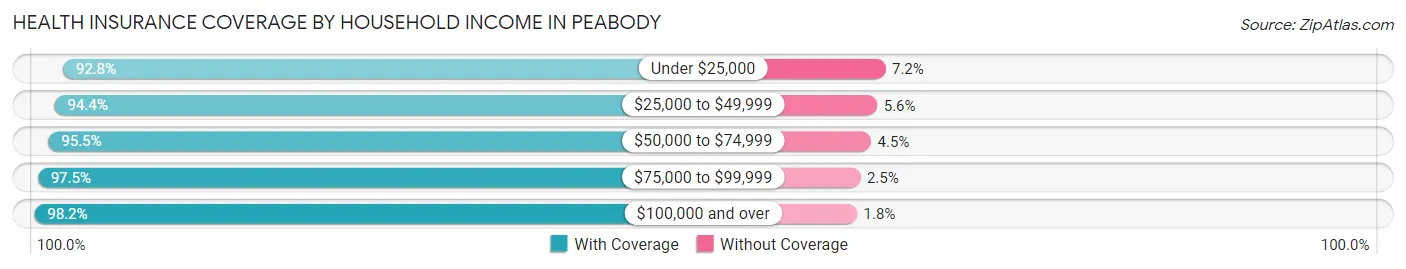
| Household Income | With Coverage | Without Coverage |
| Under $25,000 | 4,150 (92.8%) | 320 (7.2%) |
| $25,000 to $49,999 | 4,515 (94.4%) | 269 (5.6%) |
| $50,000 to $74,999 | 6,108 (95.5%) | 285 (4.5%) |
| $75,000 to $99,999 | 6,871 (97.5%) | 173 (2.5%) |
| $100,000 and over | 30,310 (98.2%) | 564 (1.8%) |
Public vs Private Health Insurance Coverage by Age in Peabody
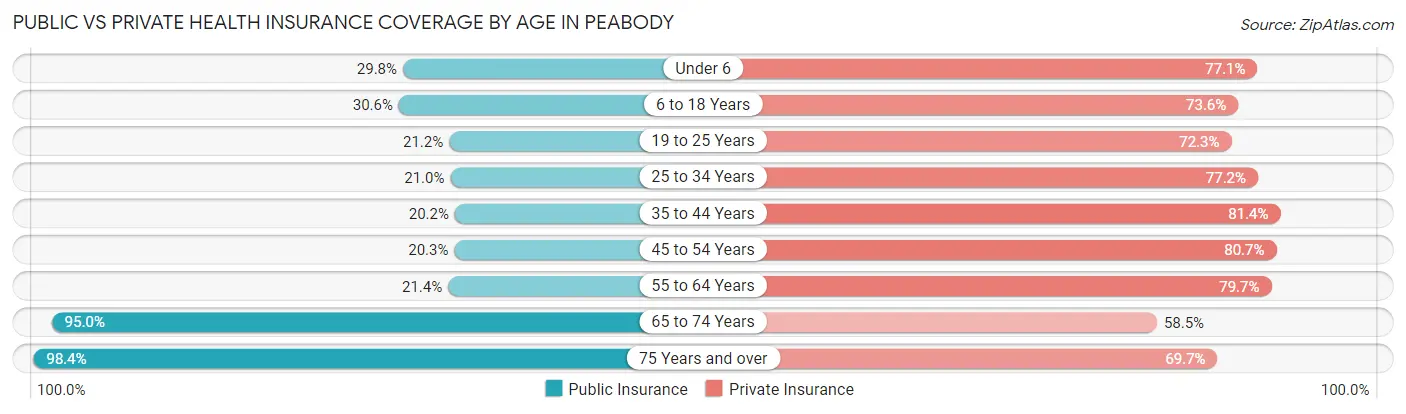
| Age Bracket | Public Insurance | Private Insurance |
| Under 6 | 1,007 (29.8%) | 2,607 (77.1%) |
| 6 to 18 Years | 2,085 (30.5%) | 5,020 (73.6%) |
| 19 to 25 Years | 911 (21.2%) | 3,106 (72.3%) |
| 25 to 34 Years | 1,176 (21.0%) | 4,329 (77.2%) |
| 35 to 44 Years | 1,236 (20.2%) | 4,994 (81.4%) |
| 45 to 54 Years | 1,368 (20.3%) | 5,449 (80.6%) |
| 55 to 64 Years | 1,702 (21.4%) | 6,339 (79.7%) |
| 65 to 74 Years | 5,829 (95.0%) | 3,590 (58.5%) |
| 75 Years and over | 6,569 (98.4%) | 4,655 (69.7%) |
| Total | 21,883 (40.7%) | 40,089 (74.6%) |
Disability Status by Sex by Age in Peabody
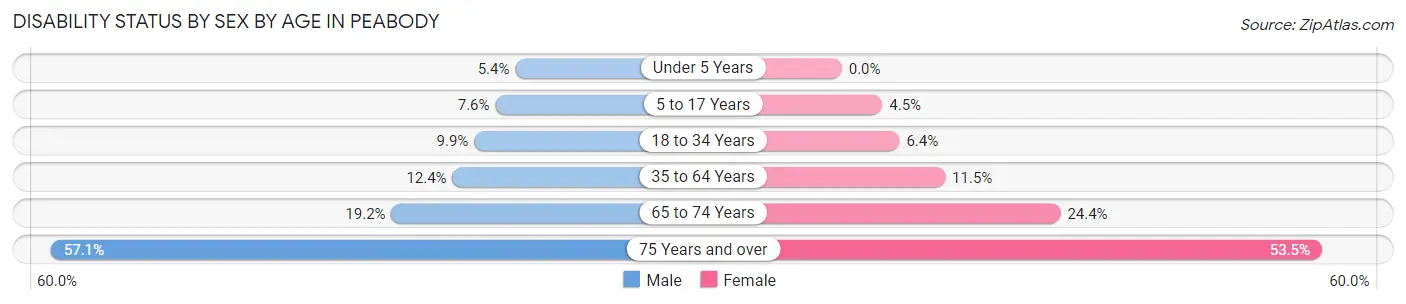
| Age Bracket | Male | Female |
| Under 5 Years | 74 (5.3%) | 0 (0.0%) |
| 5 to 17 Years | 261 (7.6%) | 142 (4.5%) |
| 18 to 34 Years | 502 (9.9%) | 352 (6.4%) |
| 35 to 64 Years | 1,291 (12.3%) | 1,196 (11.5%) |
| 65 to 74 Years | 575 (19.2%) | 763 (24.3%) |
| 75 Years and over | 1,389 (57.1%) | 2,268 (53.4%) |
Disability Class by Sex by Age in Peabody
Disability Class: Hearing Difficulty
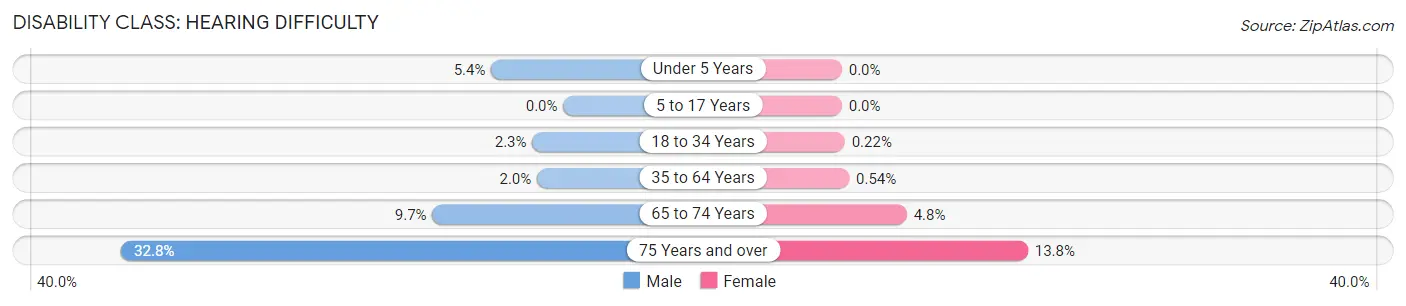
| Age Bracket | Male | Female |
| Under 5 Years | 74 (5.3%) | 0 (0.0%) |
| 5 to 17 Years | 0 (0.0%) | 0 (0.0%) |
| 18 to 34 Years | 116 (2.3%) | 12 (0.2%) |
| 35 to 64 Years | 204 (1.9%) | 56 (0.5%) |
| 65 to 74 Years | 292 (9.7%) | 151 (4.8%) |
| 75 Years and over | 799 (32.8%) | 586 (13.8%) |
Disability Class: Vision Difficulty
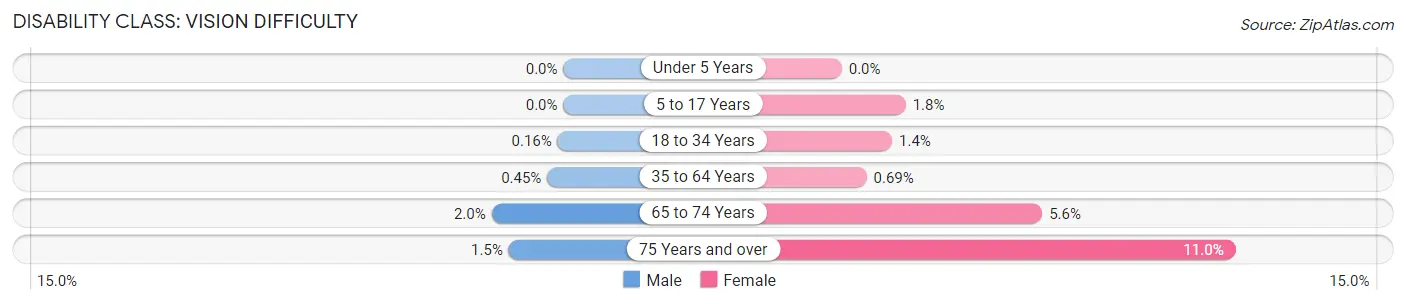
| Age Bracket | Male | Female |
| Under 5 Years | 0 (0.0%) | 0 (0.0%) |
| 5 to 17 Years | 0 (0.0%) | 56 (1.8%) |
| 18 to 34 Years | 8 (0.2%) | 77 (1.4%) |
| 35 to 64 Years | 47 (0.4%) | 72 (0.7%) |
| 65 to 74 Years | 60 (2.0%) | 175 (5.6%) |
| 75 Years and over | 37 (1.5%) | 465 (11.0%) |
Disability Class: Cognitive Difficulty
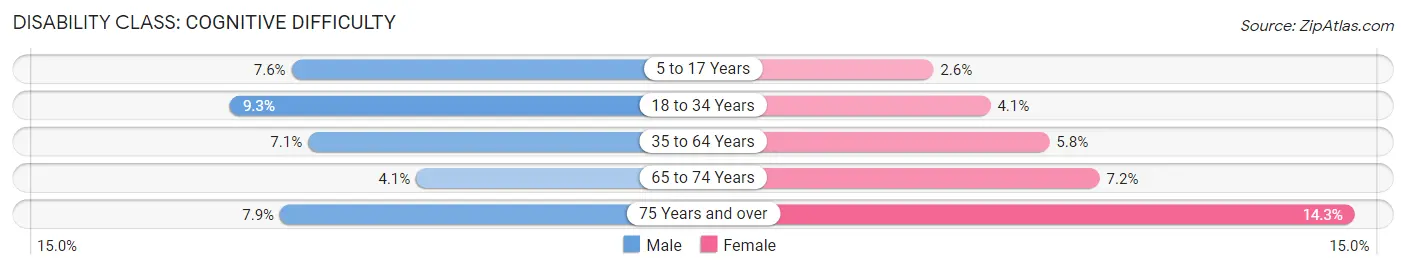
| Age Bracket | Male | Female |
| 5 to 17 Years | 261 (7.6%) | 80 (2.5%) |
| 18 to 34 Years | 469 (9.3%) | 227 (4.1%) |
| 35 to 64 Years | 743 (7.1%) | 601 (5.8%) |
| 65 to 74 Years | 123 (4.1%) | 225 (7.2%) |
| 75 Years and over | 192 (7.9%) | 606 (14.3%) |
Disability Class: Ambulatory Difficulty
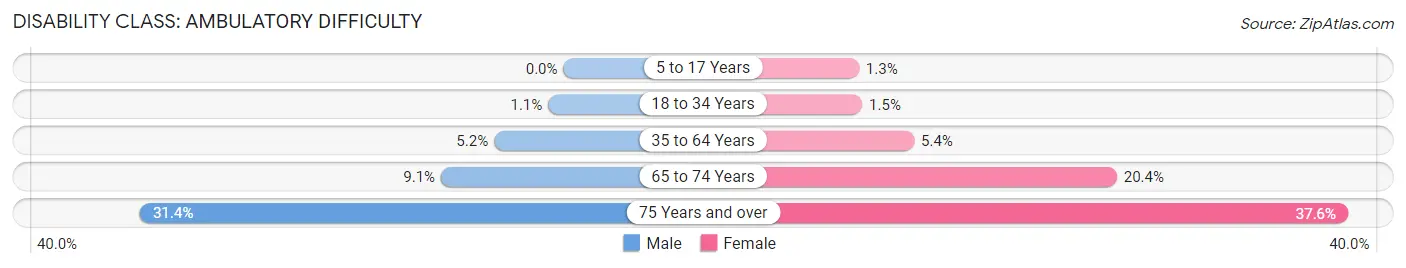
| Age Bracket | Male | Female |
| 5 to 17 Years | 0 (0.0%) | 40 (1.3%) |
| 18 to 34 Years | 57 (1.1%) | 83 (1.5%) |
| 35 to 64 Years | 538 (5.1%) | 558 (5.4%) |
| 65 to 74 Years | 273 (9.1%) | 640 (20.4%) |
| 75 Years and over | 765 (31.4%) | 1,594 (37.6%) |
Disability Class: Self-Care Difficulty
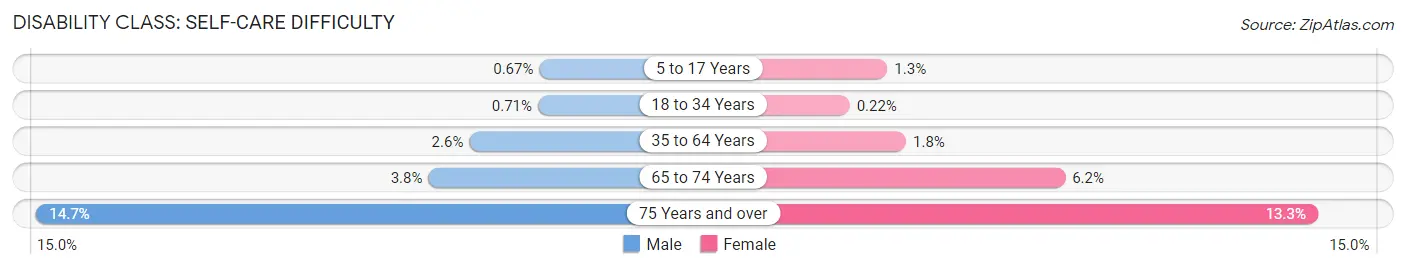
| Age Bracket | Male | Female |
| 5 to 17 Years | 23 (0.7%) | 40 (1.3%) |
| 18 to 34 Years | 36 (0.7%) | 12 (0.2%) |
| 35 to 64 Years | 274 (2.6%) | 186 (1.8%) |
| 65 to 74 Years | 113 (3.8%) | 195 (6.2%) |
| 75 Years and over | 357 (14.7%) | 562 (13.3%) |
Technology Access in Peabody
Computing Device Access in Peabody
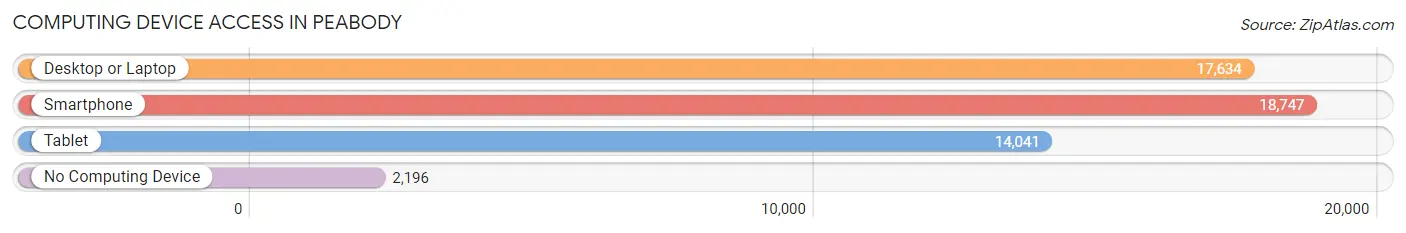
| Device Type | # Households | % Households |
| Desktop or Laptop | 17,634 | 77.8% |
| Smartphone | 18,747 | 82.7% |
| Tablet | 14,041 | 61.9% |
| No Computing Device | 2,196 | 9.7% |
| Total | 22,678 | 100.0% |
Internet Access in Peabody
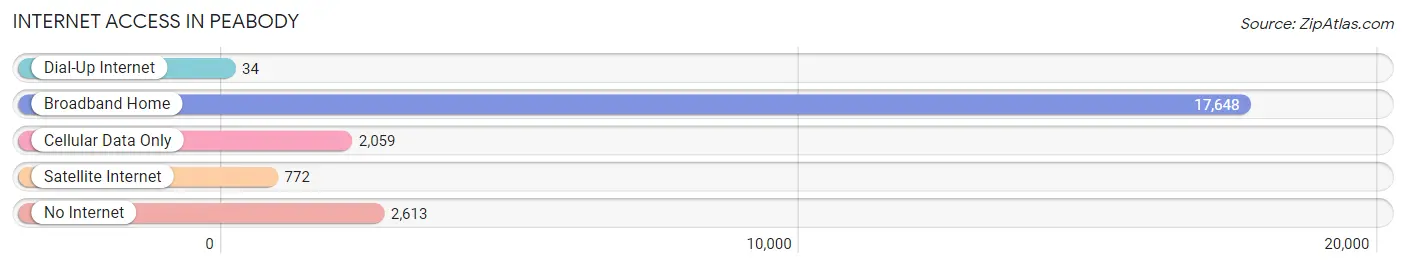
| Internet Type | # Households | % Households |
| Dial-Up Internet | 34 | 0.2% |
| Broadband Home | 17,648 | 77.8% |
| Cellular Data Only | 2,059 | 9.1% |
| Satellite Internet | 772 | 3.4% |
| No Internet | 2,613 | 11.5% |
| Total | 22,678 | 100.0% |
Peabody Summary
Peabody, Massachusetts is a city located in the northeastern United States, in the state of Massachusetts. It is located in Essex County, and is part of the Greater Boston metropolitan area. The city has a population of 51,251 as of the 2010 census, making it the tenth largest city in the state.
History
Peabody was first settled in 1626, and was originally part of Salem. It was officially incorporated as a town in 1752, and was named after the first settler, George Peabody. The town was primarily agricultural, and was known for its apple orchards. In 1868, the town was reincorporated as a city.
In the late 19th century, Peabody became a major industrial center, with the development of the shoe industry. The city was home to several major shoe companies, including the United Shoe Machinery Corporation, which was the largest shoe machinery manufacturer in the world. The city also had several tanneries, and was home to the first leather-tanning machine in the United States.
Geography
Peabody is located in northeastern Massachusetts, in Essex County. It is bordered by the cities of Salem to the north, Danvers to the east, Lynn to the south, and Middleton to the west. The city is located approximately 20 miles north of Boston.
The city has a total area of 11.2 square miles, of which 10.9 square miles is land and 0.3 square miles is water. The city is located on the North Shore of Massachusetts, and is part of the Atlantic coastal plain. The city is located on the Saugus River, and is drained by the Ipswich River.
Economy
Peabody has a diverse economy, with a mix of manufacturing, retail, and service industries. The city is home to several major employers, including the United Shoe Machinery Corporation, the North Shore Medical Center, and the Peabody Institute Library.
The city is also home to several shopping centers, including the Northshore Mall, the Liberty Tree Mall, and the Peabody Square Shopping Center. The city is also home to several restaurants, bars, and entertainment venues.
Demographics
As of the 2010 census, there were 51,251 people, 20,845 households, and 13,845 families residing in the city. The population density was 4,711.3 people per square mile. The racial makeup of the city was 87.2% White, 4.2% African American, 0.3% Native American, 4.2% Asian, 0.1% Pacific Islander, 1.7% from other races, and 2.3% from two or more races. Hispanic or Latino of any race were 5.2% of the population.
The median income for a household in the city was $62,837, and the median income for a family was $76,837. The per capita income for the city was $30,945. About 5.2% of families and 7.2% of the population were below the poverty line, including 10.2% of those under age 18 and 6.2% of those age 65 or over.
Common Questions
What is Per Capita Income in Peabody?
Per Capita income in Peabody is $48,490.
What is the Median Family Income in Peabody?
Median Family Income in Peabody is $114,872.
What is the Median Household income in Peabody?
Median Household Income in Peabody is $91,125.
What is Income or Wage Gap in Peabody?
Income or Wage Gap in Peabody is 23.6%.
Women in Peabody earn 76.4 cents for every dollar earned by a man.
What is Family Income Deficit in Peabody?
Family Income Deficit in Peabody is $11,312.
Families that are below poverty line in Peabody earn $11,312 less on average than the poverty threshold level.
What is Inequality or Gini Index in Peabody?
Inequality or Gini Index in Peabody is 0.45.
What is the Total Population of Peabody?
Total Population of Peabody is 54,204.
What is the Total Male Population of Peabody?
Total Male Population of Peabody is 25,909.
What is the Total Female Population of Peabody?
Total Female Population of Peabody is 28,295.
What is the Ratio of Males per 100 Females in Peabody?
There are 91.57 Males per 100 Females in Peabody.
What is the Ratio of Females per 100 Males in Peabody?
There are 109.21 Females per 100 Males in Peabody.
What is the Median Population Age in Peabody?
Median Population Age in Peabody is 46.9 Years.
What is the Average Family Size in Peabody
Average Family Size in Peabody is 3.0 People.
What is the Average Household Size in Peabody
Average Household Size in Peabody is 2.4 People.
How Large is the Labor Force in Peabody?
There are 28,980 People in the Labor Forcein in Peabody.
What is the Percentage of People in the Labor Force in Peabody?
63.3% of People are in the Labor Force in Peabody.
What is the Unemployment Rate in Peabody?
Unemployment Rate in Peabody is 4.4%.