Boulder, CO Map & Demographics
Boulder Map
Boulder Overview
$56,026
PER CAPITA INCOME
$147,382
AVG FAMILY INCOME
$80,243
AVG HOUSEHOLD INCOME
35.4%
WAGE / INCOME GAP [ % ]
64.6¢/ $1
WAGE / INCOME GAP [ $ ]
$12,835
FAMILY INCOME DEFICIT
0.56
INEQUALITY / GINI INDEX
106,598
TOTAL POPULATION
55,075
MALE POPULATION
51,523
FEMALE POPULATION
106.89
MALES / 100 FEMALES
93.55
FEMALES / 100 MALES
28.5
MEDIAN AGE
2.8
AVG FAMILY SIZE
2.2
AVG HOUSEHOLD SIZE
61,410
LABOR FORCE [ PEOPLE ]
63.9%
PERCENT IN LABOR FORCE
5.4%
UNEMPLOYMENT RATE
Boulder Area Codes
Income in Boulder
Income Overview in Boulder
Per Capita Income in Boulder is $56,026, while median incomes of families and households are $147,382 and $80,243 respectively.
| Characteristic | Number | Measure |
| Per Capita Income | 106,598 | $56,026 |
| Median Family Income | 17,459 | $147,382 |
| Mean Family Income | 17,459 | $201,744 |
| Median Household Income | 43,658 | $80,243 |
| Mean Household Income | 43,658 | $132,935 |
| Income Deficit | 17,459 | $12,835 |
| Wage / Income Gap (%) | 106,598 | 35.38% |
| Wage / Income Gap ($) | 106,598 | 64.62¢ per $1 |
| Gini / Inequality Index | 106,598 | 0.56 |
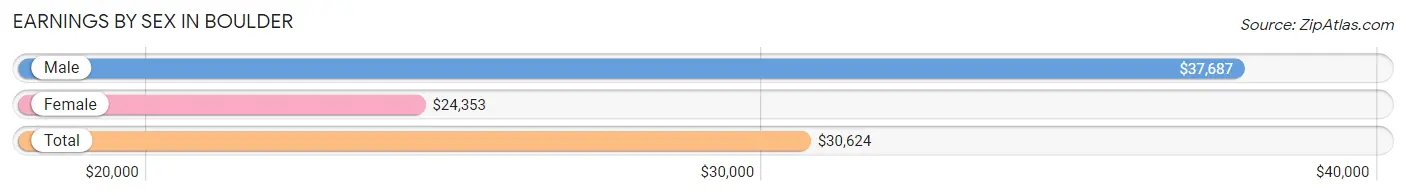
Earnings by Sex in Boulder
Average Earnings in Boulder are $30,624, $37,687 for men and $24,353 for women, a difference of 35.4%.
| Sex | Number | Average Earnings |
| Male | 38,024 (53.4%) | $37,687 |
| Female | 33,216 (46.6%) | $24,353 |
| Total | 71,240 (100.0%) | $30,624 |
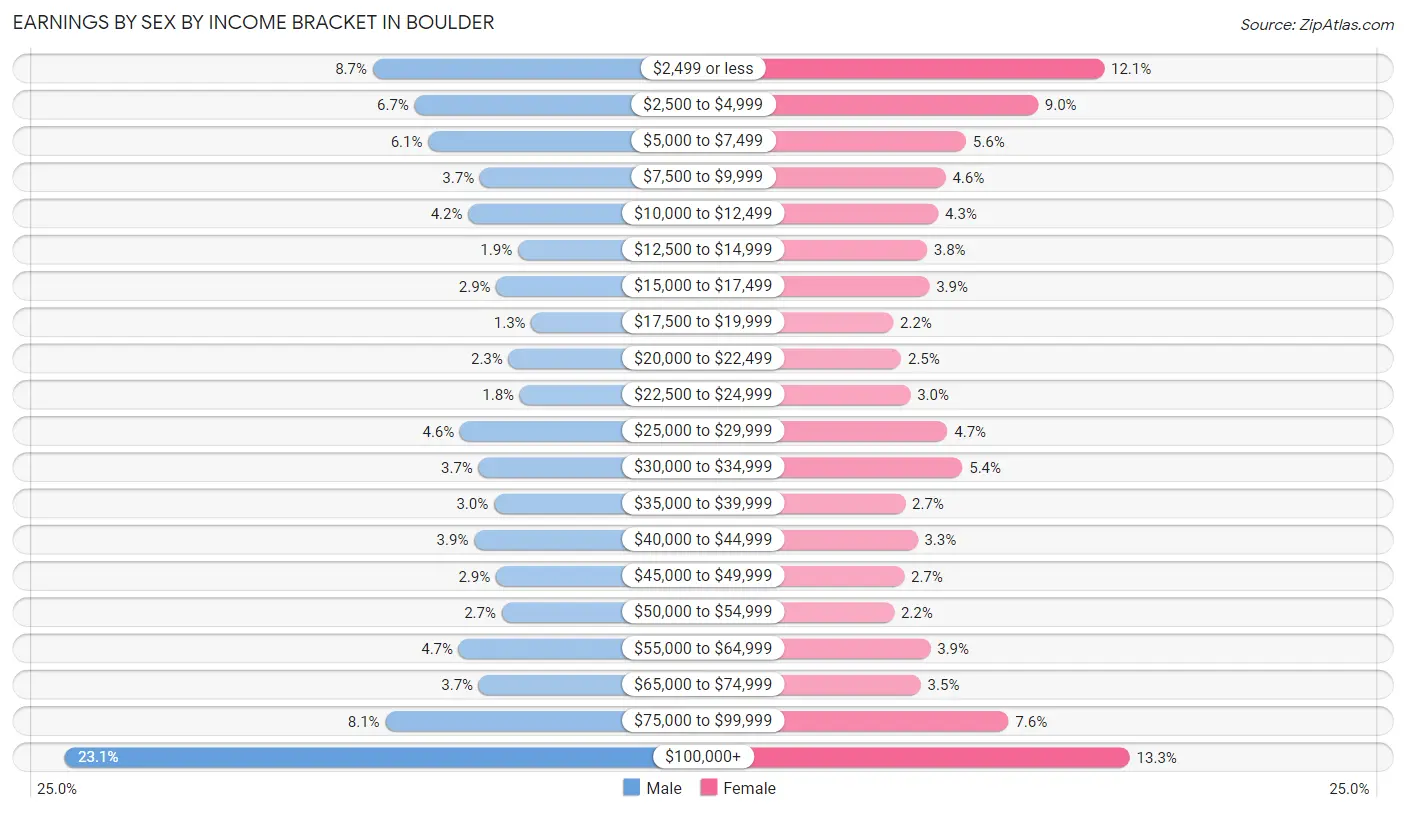
Earnings by Sex by Income Bracket in Boulder
The most common earnings brackets in Boulder are $100,000+ for men (8,782 | 23.1%) and $100,000+ for women (4,400 | 13.3%).
| Income | Male | Female |
| $2,499 or less | 3,306 (8.7%) | 4,003 (12.0%) |
| $2,500 to $4,999 | 2,560 (6.7%) | 2,973 (8.9%) |
| $5,000 to $7,499 | 2,314 (6.1%) | 1,852 (5.6%) |
| $7,500 to $9,999 | 1,396 (3.7%) | 1,536 (4.6%) |
| $10,000 to $12,499 | 1,603 (4.2%) | 1,420 (4.3%) |
| $12,500 to $14,999 | 719 (1.9%) | 1,246 (3.7%) |
| $15,000 to $17,499 | 1,104 (2.9%) | 1,281 (3.9%) |
| $17,500 to $19,999 | 478 (1.3%) | 722 (2.2%) |
| $20,000 to $22,499 | 886 (2.3%) | 845 (2.5%) |
| $22,500 to $24,999 | 683 (1.8%) | 985 (3.0%) |
| $25,000 to $29,999 | 1,750 (4.6%) | 1,566 (4.7%) |
| $30,000 to $34,999 | 1,417 (3.7%) | 1,796 (5.4%) |
| $35,000 to $39,999 | 1,143 (3.0%) | 908 (2.7%) |
| $40,000 to $44,999 | 1,500 (3.9%) | 1,099 (3.3%) |
| $45,000 to $49,999 | 1,109 (2.9%) | 890 (2.7%) |
| $50,000 to $54,999 | 1,008 (2.6%) | 733 (2.2%) |
| $55,000 to $64,999 | 1,773 (4.7%) | 1,298 (3.9%) |
| $65,000 to $74,999 | 1,413 (3.7%) | 1,149 (3.5%) |
| $75,000 to $99,999 | 3,080 (8.1%) | 2,514 (7.6%) |
| $100,000+ | 8,782 (23.1%) | 4,400 (13.3%) |
| Total | 38,024 (100.0%) | 33,216 (100.0%) |
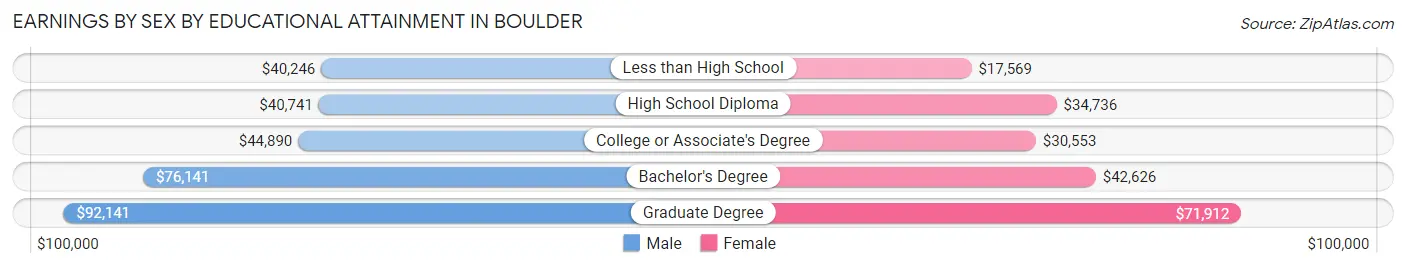
Earnings by Sex by Educational Attainment in Boulder
Average earnings in Boulder are $68,437 for men and $47,312 for women, a difference of 30.9%. Men with an educational attainment of graduate degree enjoy the highest average annual earnings of $92,141, while those with less than high school education earn the least with $40,246. Women with an educational attainment of graduate degree earn the most with the average annual earnings of $71,912, while those with less than high school education have the smallest earnings of $17,569.
| Educational Attainment | Male Income | Female Income |
| Less than High School | $40,246 | $17,569 |
| High School Diploma | $40,741 | $34,736 |
| College or Associate's Degree | $44,890 | $30,553 |
| Bachelor's Degree | $76,141 | $42,626 |
| Graduate Degree | $92,141 | $71,912 |
| Total | $68,437 | $47,312 |
Family Income in Boulder
Family Income Brackets in Boulder
According to the Boulder family income data, there are 6,128 families falling into the $200,000+ income range, which is the most common income bracket and makes up 35.1% of all families. Conversely, the $10,000 to $14,999 income bracket is the least frequent group with only 157 families (0.9%) belonging to this category.
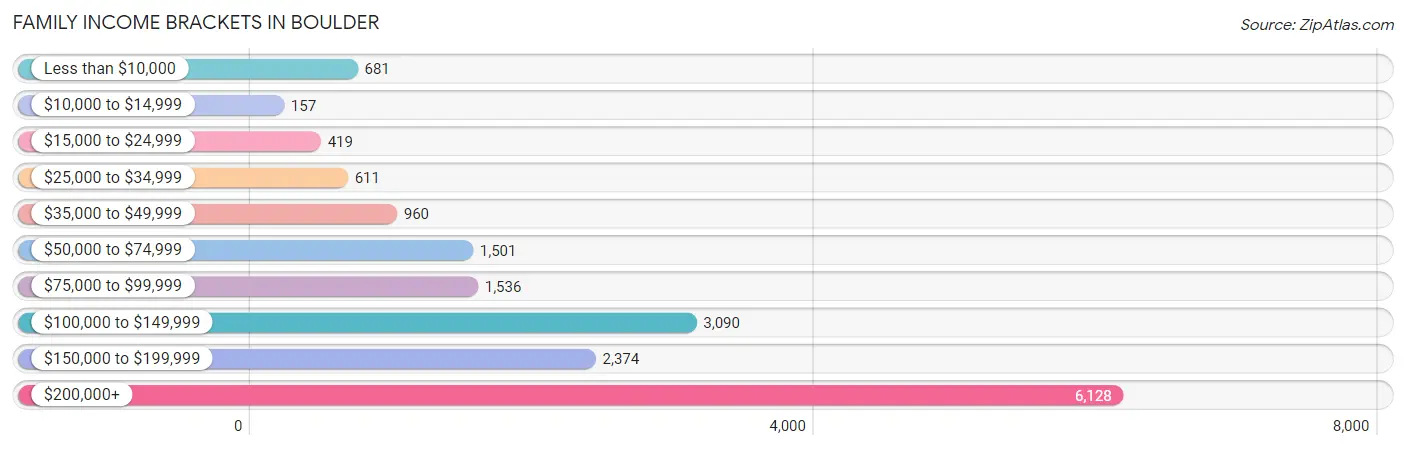
| Income Bracket | # Families | % Families |
| Less than $10,000 | 681 | 3.9% |
| $10,000 to $14,999 | 157 | 0.9% |
| $15,000 to $24,999 | 419 | 2.4% |
| $25,000 to $34,999 | 611 | 3.5% |
| $35,000 to $49,999 | 960 | 5.5% |
| $50,000 to $74,999 | 1,501 | 8.6% |
| $75,000 to $99,999 | 1,536 | 8.8% |
| $100,000 to $149,999 | 3,090 | 17.7% |
| $150,000 to $199,999 | 2,374 | 13.6% |
| $200,000+ | 6,128 | 35.1% |
Family Income by Famaliy Size in Boulder
4-person families (2,991 | 17.1%) account for the highest median family income in Boulder with $204,122 per family, while 2-person families (9,881 | 56.6%) have the highest median income of $61,720 per family member.
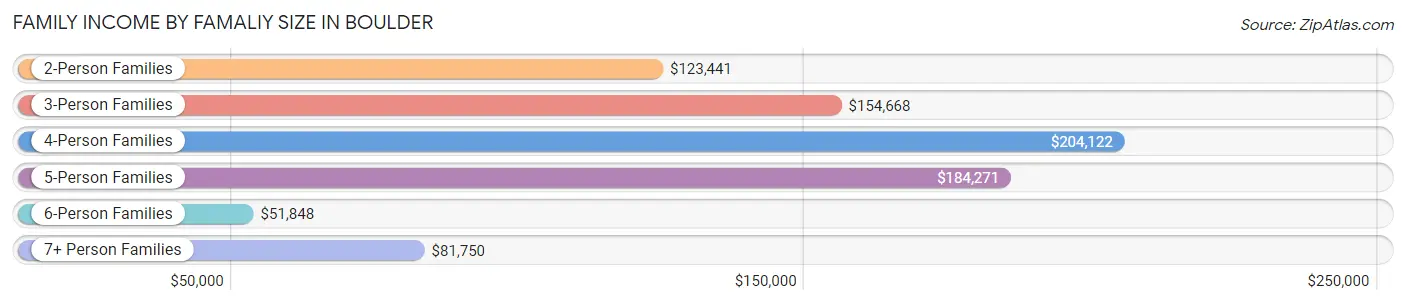
| Income Bracket | # Families | Median Income |
| 2-Person Families | 9,881 (56.6%) | $123,441 |
| 3-Person Families | 3,523 (20.2%) | $154,668 |
| 4-Person Families | 2,991 (17.1%) | $204,122 |
| 5-Person Families | 803 (4.6%) | $184,271 |
| 6-Person Families | 114 (0.6%) | $51,848 |
| 7+ Person Families | 147 (0.8%) | $81,750 |
| Total | 17,459 (100.0%) | $147,382 |
Family Income by Number of Earners in Boulder
The median family income in Boulder is $147,382, with families comprising 3+ earners (1,359) having the highest median family income of $199,934, while families with 1 earner (4,886) have the lowest median family income of $101,409, accounting for 7.8% and 28.0% of families, respectively.
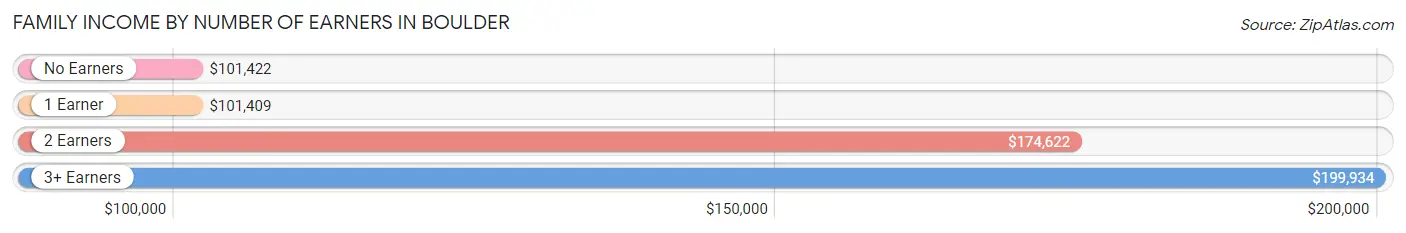
| Number of Earners | # Families | Median Income |
| No Earners | 2,508 (14.4%) | $101,422 |
| 1 Earner | 4,886 (28.0%) | $101,409 |
| 2 Earners | 8,706 (49.9%) | $174,622 |
| 3+ Earners | 1,359 (7.8%) | $199,934 |
| Total | 17,459 (100.0%) | $147,382 |
Household Income in Boulder
Household Income Brackets in Boulder
With 8,644 households falling in the category, the $200,000+ income range is the most frequent in Boulder, accounting for 19.8% of all households. In contrast, only 1,353 households (3.1%) fall into the $10,000 to $14,999 income bracket, making it the least populous group.
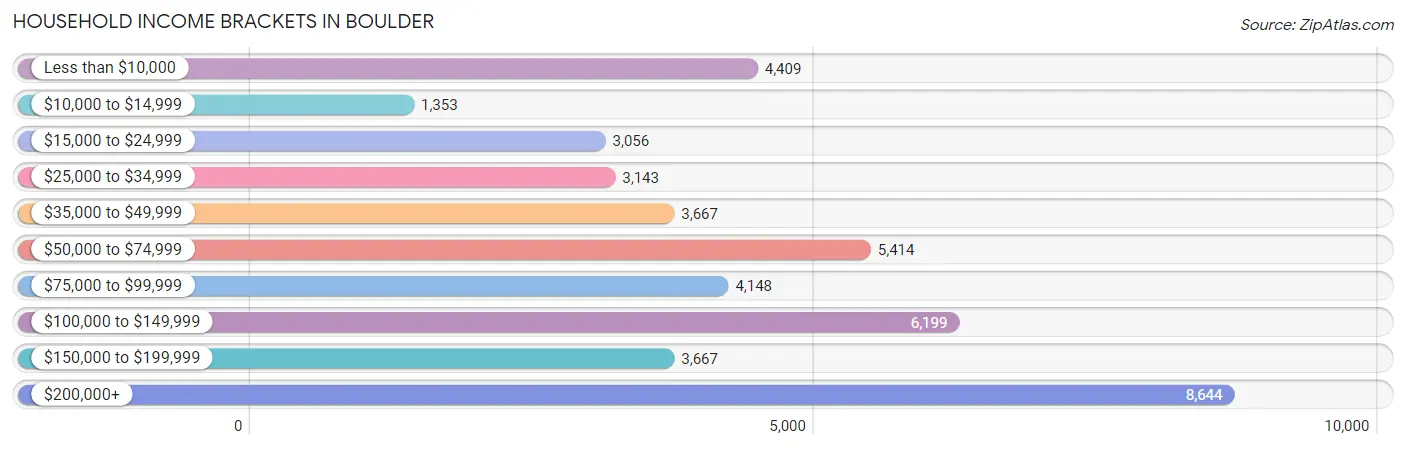
| Income Bracket | # Households | % Households |
| Less than $10,000 | 4,409 | 10.1% |
| $10,000 to $14,999 | 1,353 | 3.1% |
| $15,000 to $24,999 | 3,056 | 7.0% |
| $25,000 to $34,999 | 3,143 | 7.2% |
| $35,000 to $49,999 | 3,667 | 8.4% |
| $50,000 to $74,999 | 5,414 | 12.4% |
| $75,000 to $99,999 | 4,148 | 9.5% |
| $100,000 to $149,999 | 6,199 | 14.2% |
| $150,000 to $199,999 | 3,667 | 8.4% |
| $200,000+ | 8,644 | 19.8% |
Household Income by Householder Age in Boulder
The median household income in Boulder is $80,243, with the highest median household income of $137,679 found in the 45 to 64 years age bracket for the primary householder. A total of 11,499 households (26.3%) fall into this category. Meanwhile, the 15 to 24 years age bracket for the primary householder has the lowest median household income of $22,847, with 9,004 households (20.6%) in this group.
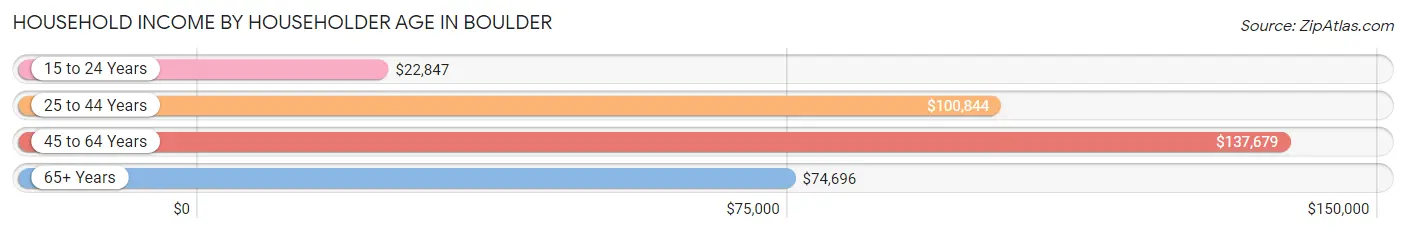
| Income Bracket | # Households | Median Income |
| 15 to 24 Years | 9,004 (20.6%) | $22,847 |
| 25 to 44 Years | 14,284 (32.7%) | $100,844 |
| 45 to 64 Years | 11,499 (26.3%) | $137,679 |
| 65+ Years | 8,871 (20.3%) | $74,696 |
| Total | 43,658 (100.0%) | $80,243 |
Poverty in Boulder
Income Below Poverty by Sex and Age in Boulder
With 22.6% poverty level for males and 21.6% for females among the residents of Boulder, 18 to 24 year old males and 18 to 24 year old females are the most vulnerable to poverty, with 7,993 males (62.1%) and 7,056 females (61.5%) in their respective age groups living below the poverty level.
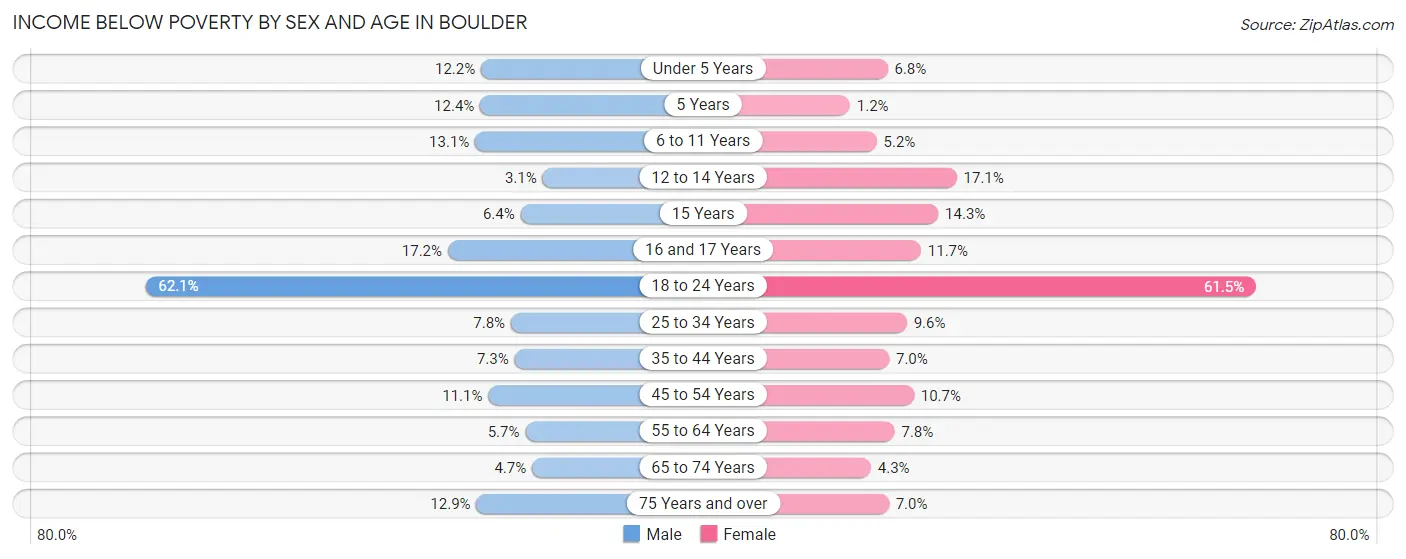
| Age Bracket | Male | Female |
| Under 5 Years | 154 (12.2%) | 80 (6.8%) |
| 5 Years | 21 (12.3%) | 4 (1.2%) |
| 6 to 11 Years | 316 (13.1%) | 99 (5.2%) |
| 12 to 14 Years | 26 (3.1%) | 244 (17.1%) |
| 15 Years | 21 (6.4%) | 72 (14.3%) |
| 16 and 17 Years | 148 (17.2%) | 117 (11.7%) |
| 18 to 24 Years | 7,993 (62.1%) | 7,056 (61.5%) |
| 25 to 34 Years | 726 (7.8%) | 687 (9.6%) |
| 35 to 44 Years | 394 (7.2%) | 361 (7.0%) |
| 45 to 54 Years | 615 (11.1%) | 555 (10.7%) |
| 55 to 64 Years | 254 (5.7%) | 324 (7.8%) |
| 65 to 74 Years | 161 (4.6%) | 172 (4.3%) |
| 75 Years and over | 288 (12.9%) | 194 (7.0%) |
| Total | 11,117 (22.6%) | 9,965 (21.6%) |
Income Above Poverty by Sex and Age in Boulder
According to the poverty statistics in Boulder, males aged 12 to 14 years and females aged 5 years are the age groups that are most secure financially, with 96.9% of males and 98.8% of females in these age groups living above the poverty line.
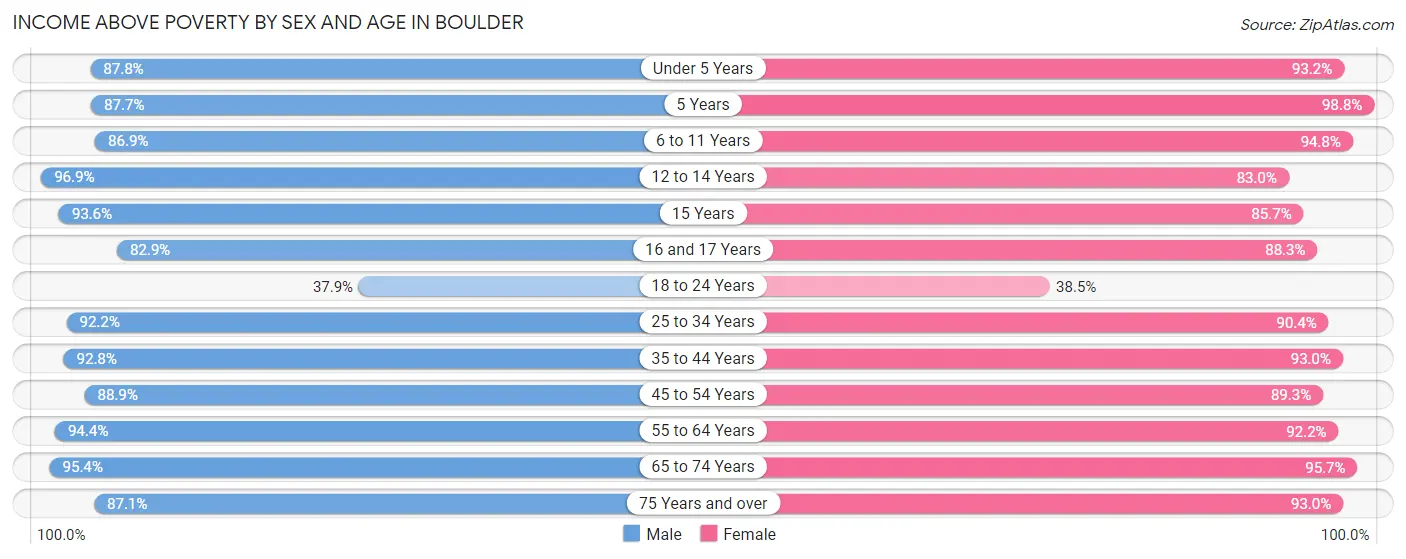
| Age Bracket | Male | Female |
| Under 5 Years | 1,106 (87.8%) | 1,098 (93.2%) |
| 5 Years | 149 (87.6%) | 331 (98.8%) |
| 6 to 11 Years | 2,096 (86.9%) | 1,817 (94.8%) |
| 12 to 14 Years | 816 (96.9%) | 1,187 (83.0%) |
| 15 Years | 309 (93.6%) | 431 (85.7%) |
| 16 and 17 Years | 715 (82.9%) | 880 (88.3%) |
| 18 to 24 Years | 4,886 (37.9%) | 4,416 (38.5%) |
| 25 to 34 Years | 8,596 (92.2%) | 6,442 (90.4%) |
| 35 to 44 Years | 5,042 (92.7%) | 4,790 (93.0%) |
| 45 to 54 Years | 4,904 (88.9%) | 4,637 (89.3%) |
| 55 to 64 Years | 4,243 (94.4%) | 3,812 (92.2%) |
| 65 to 74 Years | 3,298 (95.4%) | 3,820 (95.7%) |
| 75 Years and over | 1,942 (87.1%) | 2,589 (93.0%) |
| Total | 38,102 (77.4%) | 36,250 (78.4%) |
Income Below Poverty Among Married-Couple Families in Boulder
The poverty statistics for married-couple families in Boulder show that 2.6% or 364 of the total 14,083 families live below the poverty line. Families with 3 or 4 children have the highest poverty rate of 4.1%, comprising of 29 families. On the other hand, families with 5 or more children have the lowest poverty rate of 0.0%, which includes 0 families.
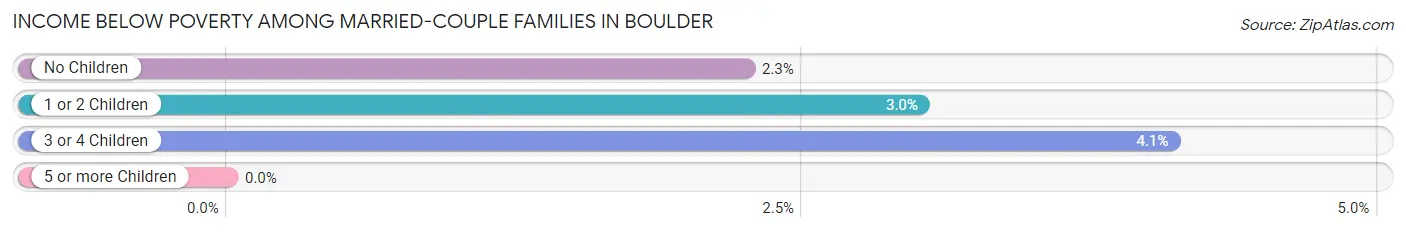
| Children | Above Poverty | Below Poverty |
| No Children | 8,220 (97.8%) | 189 (2.2%) |
| 1 or 2 Children | 4,697 (97.0%) | 146 (3.0%) |
| 3 or 4 Children | 679 (95.9%) | 29 (4.1%) |
| 5 or more Children | 123 (100.0%) | 0 (0.0%) |
| Total | 13,719 (97.4%) | 364 (2.6%) |
Income Below Poverty Among Single-Parent Households in Boulder
According to the poverty data in Boulder, 13.2% or 153 single-father households and 27.6% or 612 single-mother households are living below the poverty line. Among single-father households, those with 5 or more children have the highest poverty rate, with 20 households (100.0%) experiencing poverty. Likewise, among single-mother households, those with 5 or more children have the highest poverty rate, with 20 households (100.0%) falling below the poverty line.
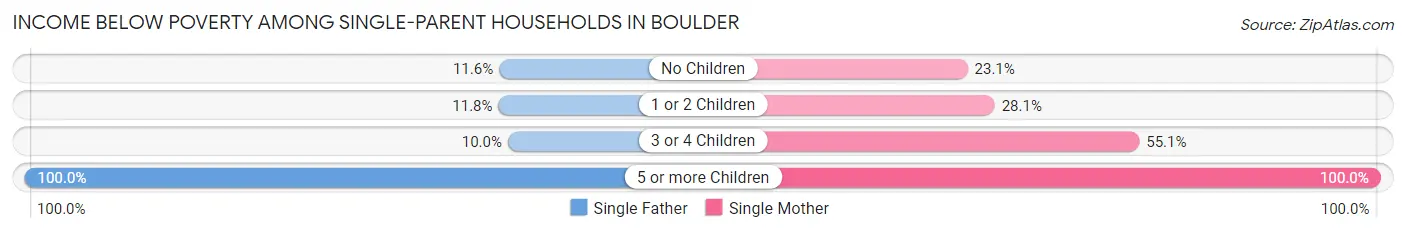
| Children | Single Father | Single Mother |
| No Children | 66 (11.6%) | 227 (23.1%) |
| 1 or 2 Children | 64 (11.8%) | 316 (28.1%) |
| 3 or 4 Children | 3 (10.0%) | 49 (55.1%) |
| 5 or more Children | 20 (100.0%) | 20 (100.0%) |
| Total | 153 (13.2%) | 612 (27.6%) |
Income Below Poverty Among Married-Couple vs Single-Parent Households in Boulder
The poverty data for Boulder shows that 364 of the married-couple family households (2.6%) and 765 of the single-parent households (22.7%) are living below the poverty level. Within the married-couple family households, those with 3 or 4 children have the highest poverty rate, with 29 households (4.1%) falling below the poverty line. Among the single-parent households, those with 5 or more children have the highest poverty rate, with 40 household (100.0%) living below poverty.
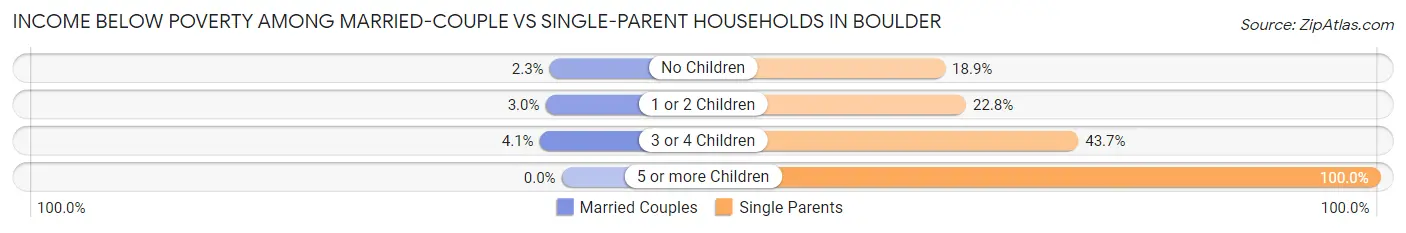
| Children | Married-Couple Families | Single-Parent Households |
| No Children | 189 (2.2%) | 293 (18.9%) |
| 1 or 2 Children | 146 (3.0%) | 380 (22.8%) |
| 3 or 4 Children | 29 (4.1%) | 52 (43.7%) |
| 5 or more Children | 0 (0.0%) | 40 (100.0%) |
| Total | 364 (2.6%) | 765 (22.7%) |
Race in Boulder
The most populous races in Boulder are White / Caucasian (88,651 | 83.2%), Hispanic or Latino (11,452 | 10.7%), and Two or more Races (7,776 | 7.3%).
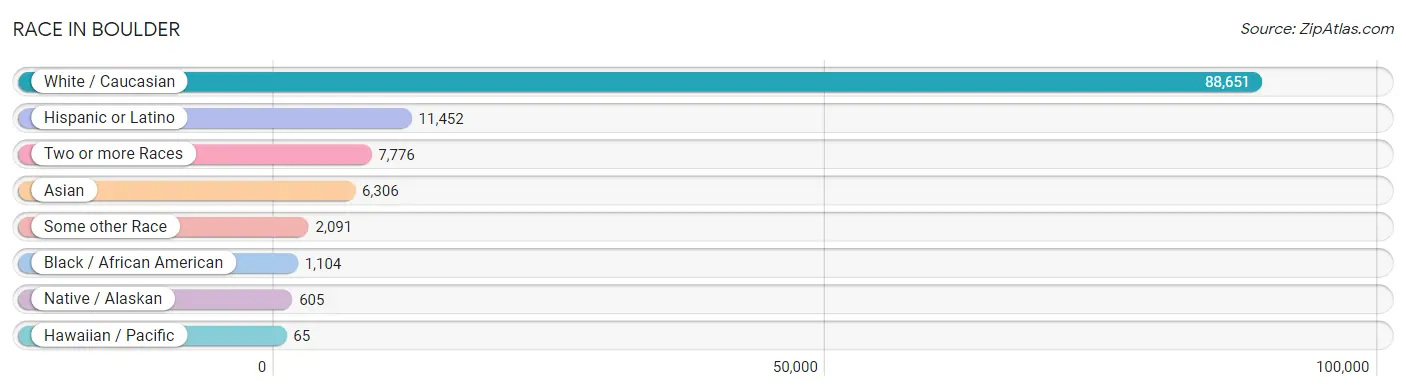
| Race | # Population | % Population |
| Asian | 6,306 | 5.9% |
| Black / African American | 1,104 | 1.0% |
| Hawaiian / Pacific | 65 | 0.1% |
| Hispanic or Latino | 11,452 | 10.7% |
| Native / Alaskan | 605 | 0.6% |
| White / Caucasian | 88,651 | 83.2% |
| Two or more Races | 7,776 | 7.3% |
| Some other Race | 2,091 | 2.0% |
| Total | 106,598 | 100.0% |
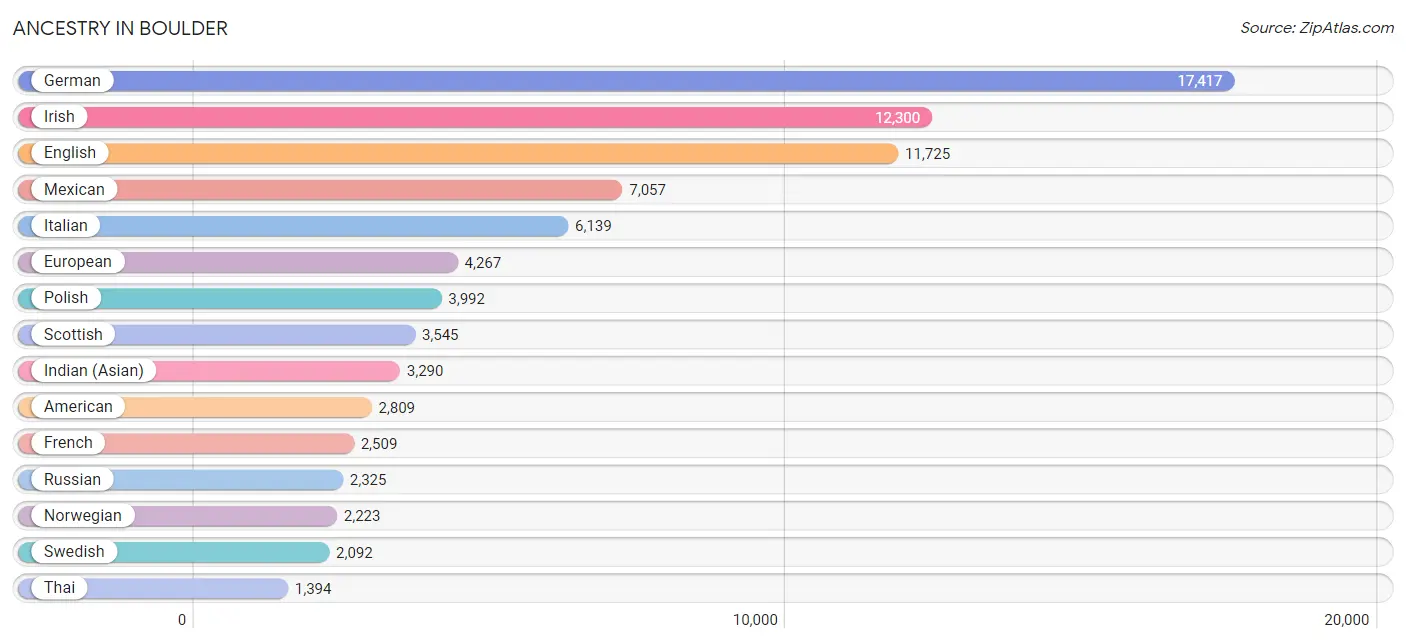
Ancestry in Boulder
The most populous ancestries reported in Boulder are German (17,417 | 16.3%), Irish (12,300 | 11.5%), English (11,725 | 11.0%), Mexican (7,057 | 6.6%), and Italian (6,139 | 5.8%), together accounting for 51.3% of all Boulder residents.
| Ancestry | # Population | % Population |
| Afghan | 45 | 0.0% |
| African | 146 | 0.1% |
| Alaskan Athabascan | 40 | 0.0% |
| Albanian | 13 | 0.0% |
| Alsatian | 12 | 0.0% |
| American | 2,809 | 2.6% |
| Apache | 281 | 0.3% |
| Arab | 675 | 0.6% |
| Argentinean | 197 | 0.2% |
| Armenian | 105 | 0.1% |
| Australian | 115 | 0.1% |
| Austrian | 669 | 0.6% |
| Bangladeshi | 59 | 0.1% |
| Basque | 39 | 0.0% |
| Belgian | 220 | 0.2% |
| Belizean | 5 | 0.0% |
| Bhutanese | 785 | 0.7% |
| Blackfeet | 57 | 0.1% |
| Bolivian | 116 | 0.1% |
| Brazilian | 262 | 0.3% |
| British | 1,349 | 1.3% |
| Bulgarian | 53 | 0.1% |
| Burmese | 762 | 0.7% |
| Cajun | 18 | 0.0% |
| Canadian | 395 | 0.4% |
| Carpatho Rusyn | 13 | 0.0% |
| Celtic | 50 | 0.1% |
| Central American | 1,005 | 0.9% |
| Cherokee | 311 | 0.3% |
| Chickasaw | 18 | 0.0% |
| Chilean | 153 | 0.1% |
| Chinese | 5 | 0.0% |
| Chippewa | 19 | 0.0% |
| Choctaw | 22 | 0.0% |
| Colombian | 343 | 0.3% |
| Costa Rican | 7 | 0.0% |
| Creek | 92 | 0.1% |
| Croatian | 270 | 0.3% |
| Cuban | 347 | 0.3% |
| Cypriot | 89 | 0.1% |
| Czech | 978 | 0.9% |
| Czechoslovakian | 77 | 0.1% |
| Danish | 912 | 0.9% |
| Delaware | 7 | 0.0% |
| Dominican | 27 | 0.0% |
| Dutch | 1,286 | 1.2% |
| Dutch West Indian | 7 | 0.0% |
| Eastern European | 996 | 0.9% |
| Ecuadorian | 69 | 0.1% |
| Egyptian | 45 | 0.0% |
| English | 11,725 | 11.0% |
| Estonian | 49 | 0.1% |
| Ethiopian | 107 | 0.1% |
| European | 4,267 | 4.0% |
| Filipino | 323 | 0.3% |
| Finnish | 620 | 0.6% |
| French | 2,509 | 2.4% |
| French American Indian | 14 | 0.0% |
| French Canadian | 531 | 0.5% |
| German | 17,417 | 16.3% |
| German Russian | 28 | 0.0% |
| Ghanaian | 20 | 0.0% |
| Greek | 743 | 0.7% |
| Guamanian / Chamorro | 20 | 0.0% |
| Guatemalan | 88 | 0.1% |
| Haitian | 56 | 0.1% |
| Honduran | 137 | 0.1% |
| Hopi | 12 | 0.0% |
| Hungarian | 577 | 0.5% |
| Icelander | 47 | 0.0% |
| Indian (Asian) | 3,290 | 3.1% |
| Indonesian | 20 | 0.0% |
| Iranian | 458 | 0.4% |
| Iraqi | 22 | 0.0% |
| Irish | 12,300 | 11.5% |
| Iroquois | 18 | 0.0% |
| Israeli | 146 | 0.1% |
| Italian | 6,139 | 5.8% |
| Jamaican | 258 | 0.2% |
| Japanese | 31 | 0.0% |
| Jordanian | 10 | 0.0% |
| Korean | 513 | 0.5% |
| Laotian | 52 | 0.1% |
| Latvian | 60 | 0.1% |
| Lebanese | 124 | 0.1% |
| Lithuanian | 988 | 0.9% |
| Lumbee | 37 | 0.0% |
| Luxembourger | 40 | 0.0% |
| Macedonian | 46 | 0.0% |
| Malaysian | 26 | 0.0% |
| Mexican | 7,057 | 6.6% |
| Mexican American Indian | 45 | 0.0% |
| Mongolian | 34 | 0.0% |
| Native Hawaiian | 177 | 0.2% |
| Navajo | 88 | 0.1% |
| New Zealander | 6 | 0.0% |
| Nicaraguan | 17 | 0.0% |
| Nigerian | 83 | 0.1% |
| Northern European | 437 | 0.4% |
| Norwegian | 2,223 | 2.1% |
| Osage | 6 | 0.0% |
| Pakistani | 142 | 0.1% |
| Panamanian | 18 | 0.0% |
| Paraguayan | 15 | 0.0% |
| Pennsylvania German | 43 | 0.0% |
| Peruvian | 250 | 0.2% |
| Polish | 3,992 | 3.7% |
| Portuguese | 549 | 0.5% |
| Puerto Rican | 257 | 0.2% |
| Romanian | 162 | 0.2% |
| Russian | 2,325 | 2.2% |
| Salvadoran | 738 | 0.7% |
| Samoan | 16 | 0.0% |
| Scandinavian | 507 | 0.5% |
| Scotch-Irish | 994 | 0.9% |
| Scottish | 3,545 | 3.3% |
| Serbian | 60 | 0.1% |
| Sioux | 52 | 0.1% |
| Slavic | 54 | 0.1% |
| Slovak | 122 | 0.1% |
| Slovene | 86 | 0.1% |
| Somali | 7 | 0.0% |
| South African | 151 | 0.1% |
| South American | 1,210 | 1.1% |
| Spaniard | 720 | 0.7% |
| Spanish | 588 | 0.5% |
| Sri Lankan | 372 | 0.4% |
| Subsaharan African | 662 | 0.6% |
| Sudanese | 5 | 0.0% |
| Swedish | 2,092 | 2.0% |
| Swiss | 604 | 0.6% |
| Thai | 1,394 | 1.3% |
| Tlingit-Haida | 52 | 0.1% |
| Turkish | 158 | 0.2% |
| Ukrainian | 660 | 0.6% |
| Ute | 90 | 0.1% |
| Venezuelan | 67 | 0.1% |
| Vietnamese | 36 | 0.0% |
| Welsh | 1,247 | 1.2% |
| West Indian | 43 | 0.0% |
| Yaqui | 12 | 0.0% |
| Yugoslavian | 138 | 0.1% | View All 142 Rows |
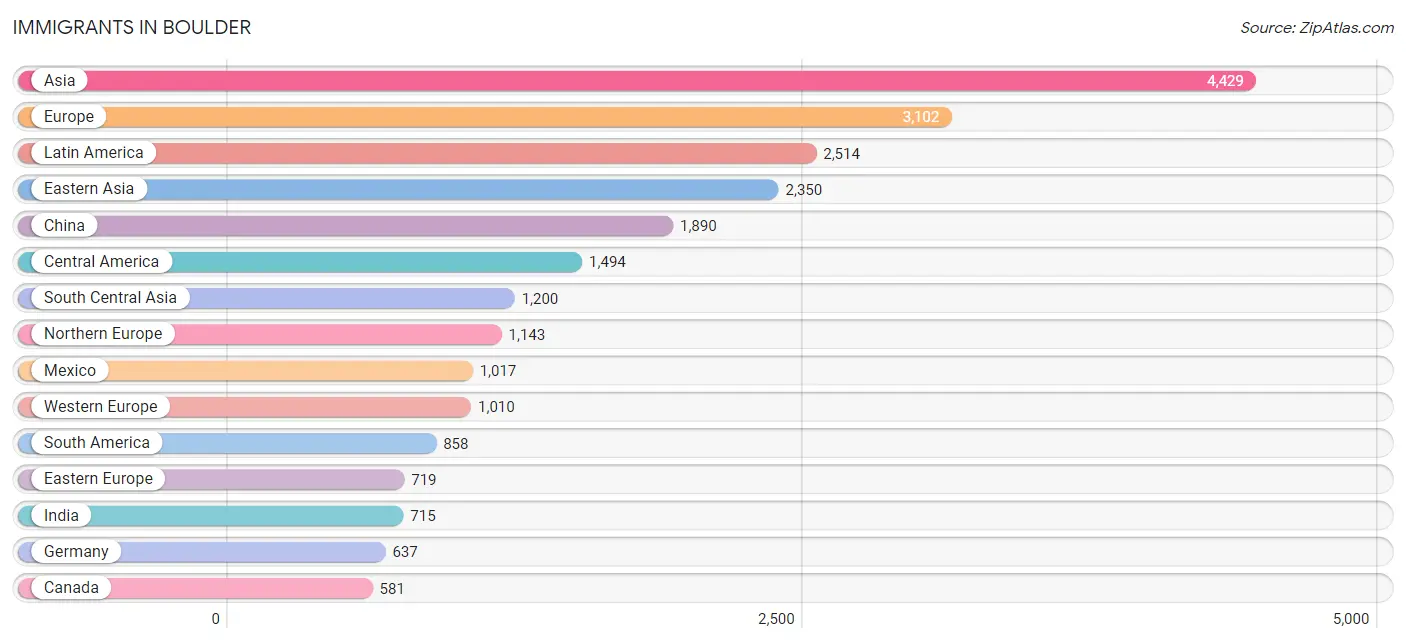
Immigrants in Boulder
The most numerous immigrant groups reported in Boulder came from Asia (4,429 | 4.2%), Europe (3,102 | 2.9%), Latin America (2,514 | 2.4%), Eastern Asia (2,350 | 2.2%), and China (1,890 | 1.8%), together accounting for 13.4% of all Boulder residents.
| Immigration Origin | # Population | % Population |
| Africa | 283 | 0.3% |
| Argentina | 126 | 0.1% |
| Asia | 4,429 | 4.2% |
| Australia | 45 | 0.0% |
| Austria | 5 | 0.0% |
| Bangladesh | 12 | 0.0% |
| Barbados | 9 | 0.0% |
| Belgium | 135 | 0.1% |
| Bosnia and Herzegovina | 73 | 0.1% |
| Brazil | 322 | 0.3% |
| Bulgaria | 51 | 0.1% |
| Cambodia | 20 | 0.0% |
| Canada | 581 | 0.5% |
| Caribbean | 162 | 0.2% |
| Central America | 1,494 | 1.4% |
| Chile | 80 | 0.1% |
| China | 1,890 | 1.8% |
| Colombia | 156 | 0.2% |
| Croatia | 5 | 0.0% |
| Cuba | 44 | 0.0% |
| Czechoslovakia | 28 | 0.0% |
| Denmark | 16 | 0.0% |
| Dominican Republic | 10 | 0.0% |
| Eastern Africa | 57 | 0.1% |
| Eastern Asia | 2,350 | 2.2% |
| Eastern Europe | 719 | 0.7% |
| Ecuador | 64 | 0.1% |
| Egypt | 27 | 0.0% |
| El Salvador | 362 | 0.3% |
| England | 274 | 0.3% |
| Ethiopia | 36 | 0.0% |
| Europe | 3,102 | 2.9% |
| France | 153 | 0.1% |
| Germany | 637 | 0.6% |
| Ghana | 5 | 0.0% |
| Greece | 26 | 0.0% |
| Guatemala | 63 | 0.1% |
| Haiti | 35 | 0.0% |
| Honduras | 43 | 0.0% |
| Hong Kong | 67 | 0.1% |
| Hungary | 32 | 0.0% |
| India | 715 | 0.7% |
| Indonesia | 24 | 0.0% |
| Iran | 204 | 0.2% |
| Iraq | 12 | 0.0% |
| Ireland | 248 | 0.2% |
| Israel | 132 | 0.1% |
| Italy | 60 | 0.1% |
| Jamaica | 49 | 0.1% |
| Japan | 116 | 0.1% |
| Jordan | 23 | 0.0% |
| Kenya | 7 | 0.0% |
| Korea | 344 | 0.3% |
| Kuwait | 143 | 0.1% |
| Laos | 12 | 0.0% |
| Latin America | 2,514 | 2.4% |
| Latvia | 14 | 0.0% |
| Lebanon | 9 | 0.0% |
| Liberia | 27 | 0.0% |
| Lithuania | 60 | 0.1% |
| Malaysia | 73 | 0.1% |
| Mexico | 1,017 | 0.9% |
| Morocco | 15 | 0.0% |
| Nepal | 229 | 0.2% |
| Netherlands | 10 | 0.0% |
| Nicaragua | 9 | 0.0% |
| North Macedonia | 24 | 0.0% |
| Northern Africa | 42 | 0.0% |
| Northern Europe | 1,143 | 1.1% |
| Norway | 62 | 0.1% |
| Oceania | 60 | 0.1% |
| Pakistan | 6 | 0.0% |
| Peru | 81 | 0.1% |
| Philippines | 33 | 0.0% |
| Poland | 141 | 0.1% |
| Portugal | 41 | 0.0% |
| Romania | 18 | 0.0% |
| Russia | 135 | 0.1% |
| Saudi Arabia | 111 | 0.1% |
| Scotland | 119 | 0.1% |
| Serbia | 10 | 0.0% |
| Singapore | 43 | 0.0% |
| South Africa | 66 | 0.1% |
| South America | 858 | 0.8% |
| South Central Asia | 1,200 | 1.1% |
| South Eastern Asia | 291 | 0.3% |
| Southern Europe | 230 | 0.2% |
| Spain | 103 | 0.1% |
| Sweden | 52 | 0.1% |
| Switzerland | 70 | 0.1% |
| Taiwan | 145 | 0.1% |
| Thailand | 26 | 0.0% |
| Turkey | 82 | 0.1% |
| Ukraine | 88 | 0.1% |
| Uzbekistan | 5 | 0.0% |
| Venezuela | 29 | 0.0% |
| Vietnam | 60 | 0.1% |
| Western Africa | 36 | 0.0% |
| Western Asia | 581 | 0.5% |
| Western Europe | 1,010 | 0.9% | View All 100 Rows |
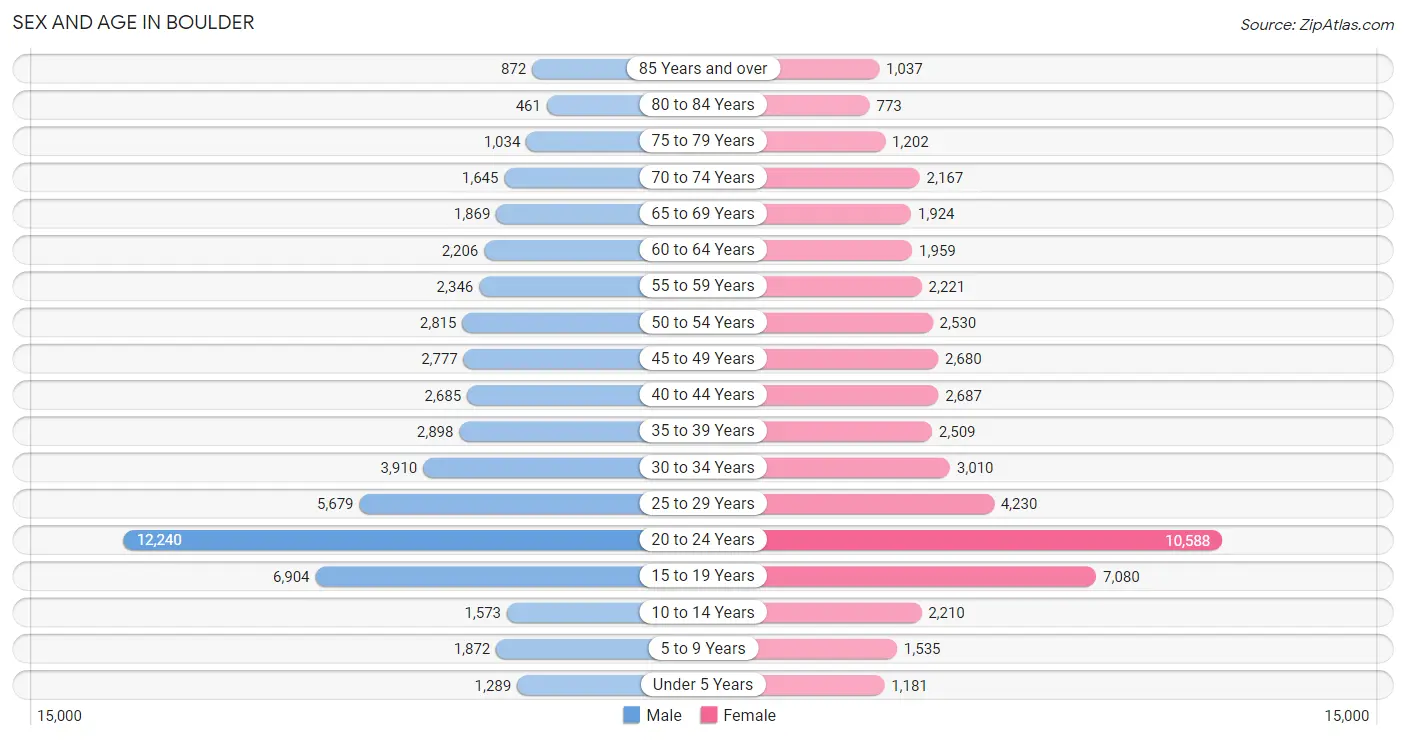
Sex and Age in Boulder
Sex and Age in Boulder
The most populous age groups in Boulder are 20 to 24 Years (12,240 | 22.2%) for men and 20 to 24 Years (10,588 | 20.5%) for women.
| Age Bracket | Male | Female |
| Under 5 Years | 1,289 (2.3%) | 1,181 (2.3%) |
| 5 to 9 Years | 1,872 (3.4%) | 1,535 (3.0%) |
| 10 to 14 Years | 1,573 (2.9%) | 2,210 (4.3%) |
| 15 to 19 Years | 6,904 (12.5%) | 7,080 (13.7%) |
| 20 to 24 Years | 12,240 (22.2%) | 10,588 (20.5%) |
| 25 to 29 Years | 5,679 (10.3%) | 4,230 (8.2%) |
| 30 to 34 Years | 3,910 (7.1%) | 3,010 (5.8%) |
| 35 to 39 Years | 2,898 (5.3%) | 2,509 (4.9%) |
| 40 to 44 Years | 2,685 (4.9%) | 2,687 (5.2%) |
| 45 to 49 Years | 2,777 (5.0%) | 2,680 (5.2%) |
| 50 to 54 Years | 2,815 (5.1%) | 2,530 (4.9%) |
| 55 to 59 Years | 2,346 (4.3%) | 2,221 (4.3%) |
| 60 to 64 Years | 2,206 (4.0%) | 1,959 (3.8%) |
| 65 to 69 Years | 1,869 (3.4%) | 1,924 (3.7%) |
| 70 to 74 Years | 1,645 (3.0%) | 2,167 (4.2%) |
| 75 to 79 Years | 1,034 (1.9%) | 1,202 (2.3%) |
| 80 to 84 Years | 461 (0.8%) | 773 (1.5%) |
| 85 Years and over | 872 (1.6%) | 1,037 (2.0%) |
| Total | 55,075 (100.0%) | 51,523 (100.0%) |
Families and Households in Boulder
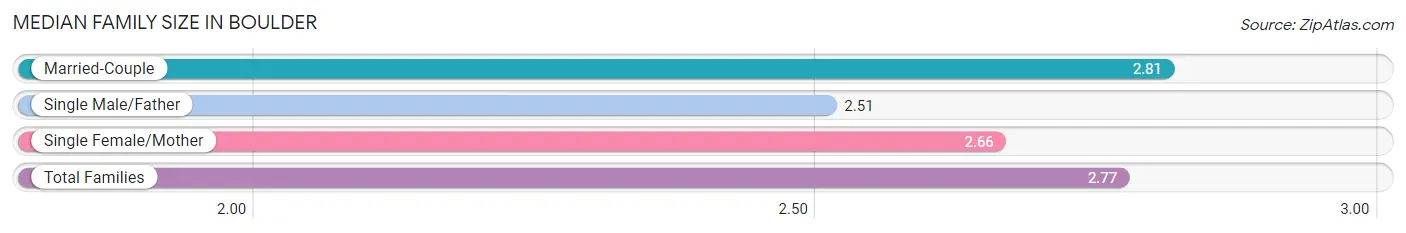
Median Family Size in Boulder
The median family size in Boulder is 2.77 persons per family, with married-couple families (14,083 | 80.7%) accounting for the largest median family size of 2.81 persons per family. On the other hand, single male/father families (1,161 | 6.7%) represent the smallest median family size with 2.51 persons per family.
| Family Type | # Families | Family Size |
| Married-Couple | 14,083 (80.7%) | 2.81 |
| Single Male/Father | 1,161 (6.7%) | 2.51 |
| Single Female/Mother | 2,215 (12.7%) | 2.66 |
| Total Families | 17,459 (100.0%) | 2.77 |
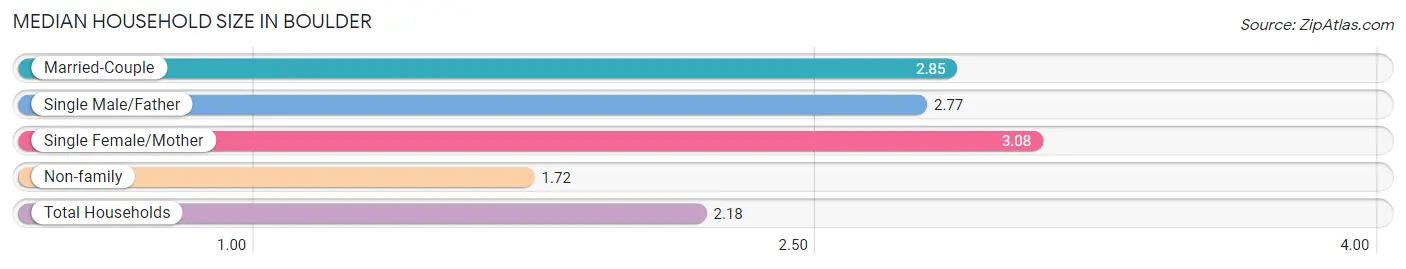
Median Household Size in Boulder
The median household size in Boulder is 2.18 persons per household, with single female/mother households (2,215 | 5.1%) accounting for the largest median household size of 3.08 persons per household. non-family households (26,199 | 60.0%) represent the smallest median household size with 1.72 persons per household.
| Household Type | # Households | Household Size |
| Married-Couple | 14,083 (32.3%) | 2.85 |
| Single Male/Father | 1,161 (2.7%) | 2.77 |
| Single Female/Mother | 2,215 (5.1%) | 3.08 |
| Non-family | 26,199 (60.0%) | 1.72 |
| Total Households | 43,658 (100.0%) | 2.18 |
Household Size by Marriage Status in Boulder
Out of a total of 43,658 households in Boulder, 17,459 (40.0%) are family households, while 26,199 (60.0%) are nonfamily households. The most numerous type of family households are 2-person households, comprising 9,099, and the most common type of nonfamily households are 1-person households, comprising 15,225.
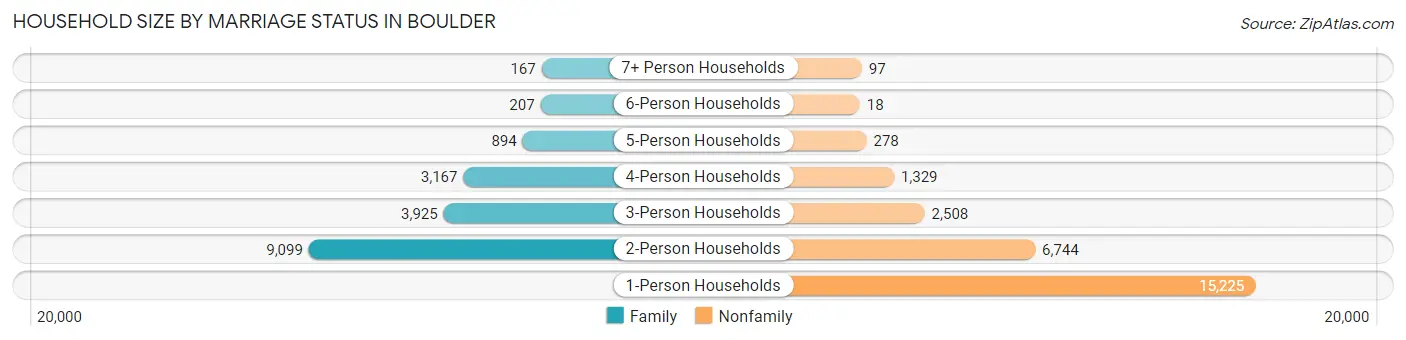
| Household Size | Family Households | Nonfamily Households |
| 1-Person Households | - | 15,225 (34.9%) |
| 2-Person Households | 9,099 (20.8%) | 6,744 (15.4%) |
| 3-Person Households | 3,925 (9.0%) | 2,508 (5.7%) |
| 4-Person Households | 3,167 (7.2%) | 1,329 (3.0%) |
| 5-Person Households | 894 (2.1%) | 278 (0.6%) |
| 6-Person Households | 207 (0.5%) | 18 (0.0%) |
| 7+ Person Households | 167 (0.4%) | 97 (0.2%) |
| Total | 17,459 (40.0%) | 26,199 (60.0%) |
Female Fertility in Boulder
Fertility by Age in Boulder
Average fertility rate in Boulder is 16.0 births per 1,000 women. Women in the age bracket of 35 to 50 years have the highest fertility rate with 42.0 births per 1,000 women. Women in the age bracket of 35 to 50 years acount for 64.7% of all women with births.
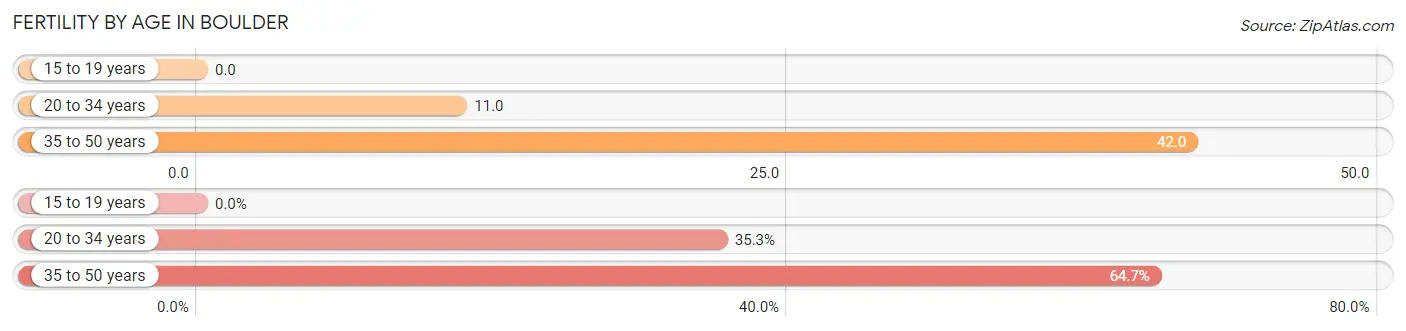
| Age Bracket | Women with Births | Births / 1,000 Women |
| 15 to 19 years | 0 (0.0%) | 0.0 |
| 20 to 34 years | 193 (35.3%) | 11.0 |
| 35 to 50 years | 354 (64.7%) | 42.0 |
| Total | 547 (100.0%) | 16.0 |
Fertility by Age by Marriage Status in Boulder
83.9% of women with births (547) in Boulder are married. The highest percentage of unmarried women with births falls into 35 to 50 years age bracket with 16.7% of them unmarried at the time of birth, while the lowest percentage of unmarried women with births belong to 20 to 34 years age bracket with 15.0% of them unmarried.
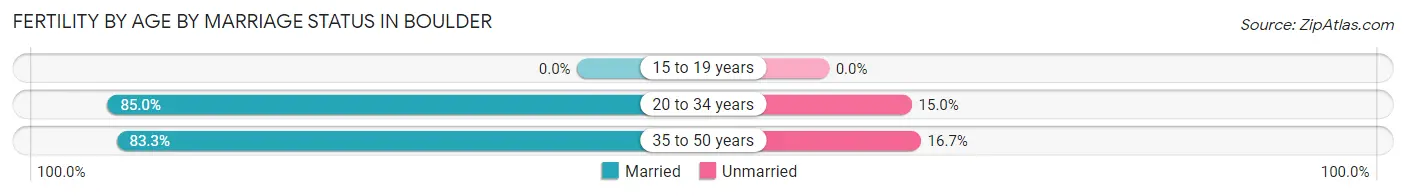
| Age Bracket | Married | Unmarried |
| 15 to 19 years | 0 (0.0%) | 0 (0.0%) |
| 20 to 34 years | 164 (85.0%) | 29 (15.0%) |
| 35 to 50 years | 295 (83.3%) | 59 (16.7%) |
| Total | 459 (83.9%) | 88 (16.1%) |
Fertility by Education in Boulder
Average fertility rate in Boulder is 16.0 births per 1,000 women. Women with the education attainment of graduate degree have the highest fertility rate of 40.0 births per 1,000 women, while women with the education attainment of college or associate's degree have the lowest fertility at 3.0 births per 1,000 women. Women with the education attainment of graduate degree represent 45.0% of all women with births.
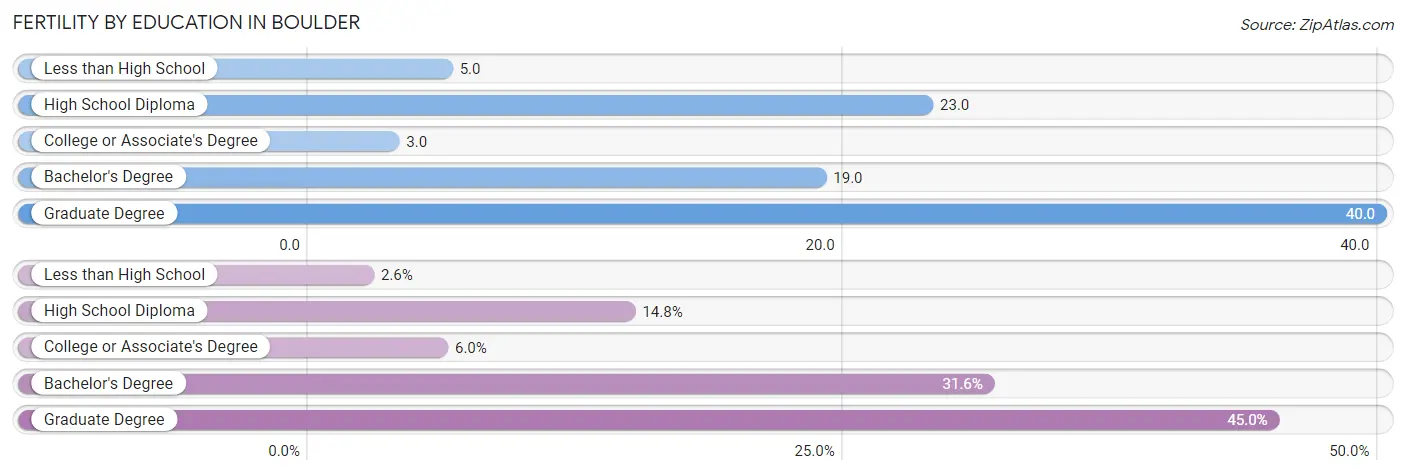
| Educational Attainment | Women with Births | Births / 1,000 Women |
| Less than High School | 14 (2.6%) | 5.0 |
| High School Diploma | 81 (14.8%) | 23.0 |
| College or Associate's Degree | 33 (6.0%) | 3.0 |
| Bachelor's Degree | 173 (31.6%) | 19.0 |
| Graduate Degree | 246 (45.0%) | 40.0 |
| Total | 547 (100.0%) | 16.0 |
Fertility by Education by Marriage Status in Boulder
16.1% of women with births in Boulder are unmarried. Women with the educational attainment of bachelor's degree are most likely to be married with 100.0% of them married at childbirth, while women with the educational attainment of less than high school are least likely to be married with 100.0% of them unmarried at childbirth.
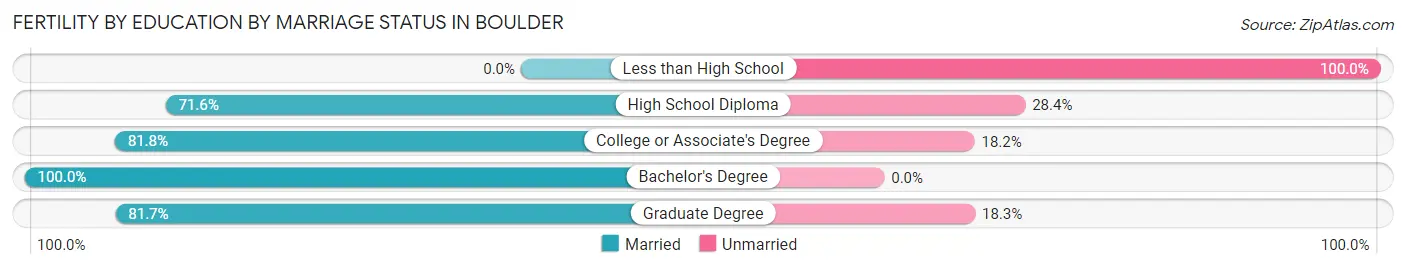
| Educational Attainment | Married | Unmarried |
| Less than High School | 0 (0.0%) | 14 (100.0%) |
| High School Diploma | 58 (71.6%) | 23 (28.4%) |
| College or Associate's Degree | 27 (81.8%) | 6 (18.2%) |
| Bachelor's Degree | 173 (100.0%) | 0 (0.0%) |
| Graduate Degree | 201 (81.7%) | 45 (18.3%) |
| Total | 459 (83.9%) | 88 (16.1%) |
Employment Characteristics in Boulder
Employment by Class of Employer in Boulder
Among the 57,120 employed individuals in Boulder, private company employees (35,457 | 62.1%), not-for-profit organizations (5,963 | 10.4%), and state government employees (5,221 | 9.1%) make up the most common classes of employment.
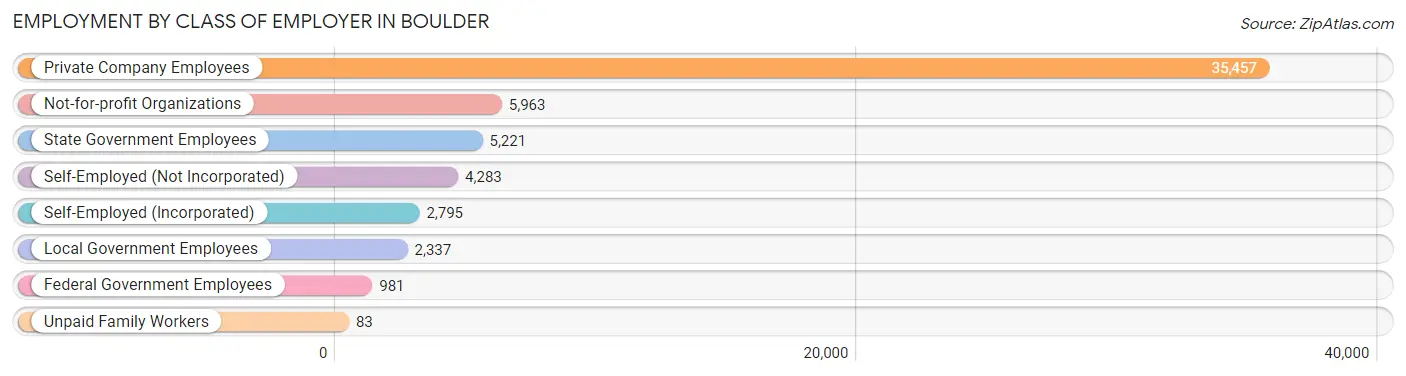
| Employer Class | # Employees | % Employees |
| Private Company Employees | 35,457 | 62.1% |
| Self-Employed (Incorporated) | 2,795 | 4.9% |
| Self-Employed (Not Incorporated) | 4,283 | 7.5% |
| Not-for-profit Organizations | 5,963 | 10.4% |
| Local Government Employees | 2,337 | 4.1% |
| State Government Employees | 5,221 | 9.1% |
| Federal Government Employees | 981 | 1.7% |
| Unpaid Family Workers | 83 | 0.2% |
| Total | 57,120 | 100.0% |
Employment Status by Age in Boulder
According to the labor force statistics for Boulder, out of the total population over 16 years of age (96,104), 63.9% or 61,410 individuals are in the labor force, with 5.4% or 3,316 of them unemployed. The age group with the highest labor force participation rate is 25 to 29 years, with 90.4% or 8,958 individuals in the labor force. Within the labor force, the 16 to 19 years age range has the highest percentage of unemployed individuals, with 18.8% or 868 of them being unemployed.
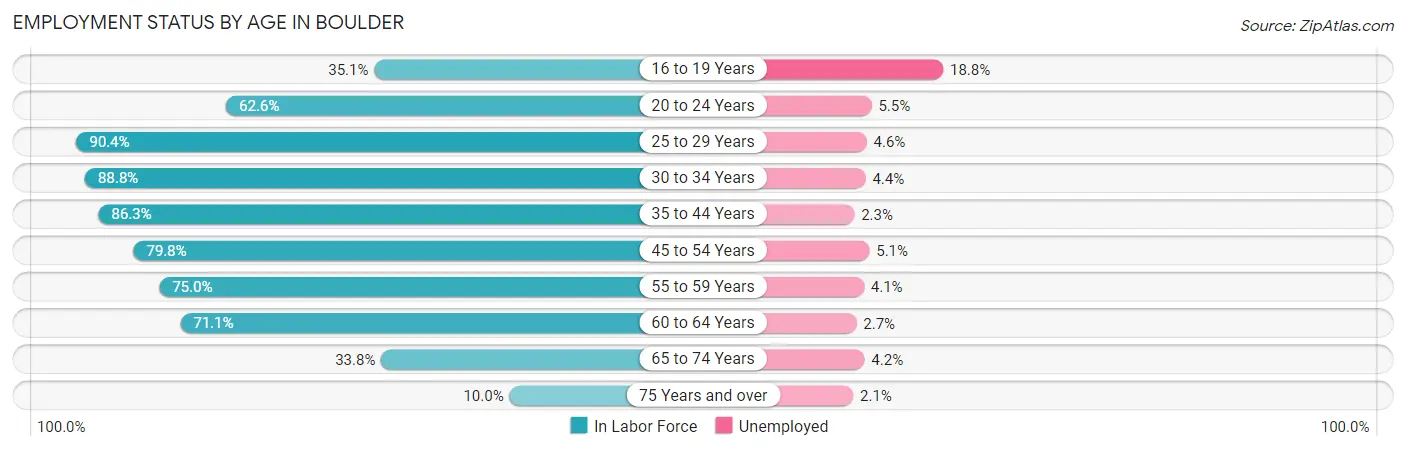
| Age Bracket | In Labor Force | Unemployed |
| 16 to 19 Years | 4,616 (35.1%) | 868 (18.8%) |
| 20 to 24 Years | 14,290 (62.6%) | 786 (5.5%) |
| 25 to 29 Years | 8,958 (90.4%) | 412 (4.6%) |
| 30 to 34 Years | 6,145 (88.8%) | 270 (4.4%) |
| 35 to 44 Years | 9,302 (86.3%) | 214 (2.3%) |
| 45 to 54 Years | 8,620 (79.8%) | 440 (5.1%) |
| 55 to 59 Years | 3,425 (75.0%) | 140 (4.1%) |
| 60 to 64 Years | 2,961 (71.1%) | 80 (2.7%) |
| 65 to 74 Years | 2,570 (33.8%) | 108 (4.2%) |
| 75 Years and over | 538 (10.0%) | 11 (2.1%) |
| Total | 61,410 (63.9%) | 3,316 (5.4%) |
Employment Status by Educational Attainment in Boulder
According to labor force statistics for Boulder, 83.6% of individuals (39,411) out of the total population between 25 and 64 years of age (47,142) are in the labor force, with 4.0% or 1,576 of them being unemployed. The group with the highest labor force participation rate are those with the educational attainment of bachelor's degree or higher, with 86.8% or 31,451 individuals in the labor force. Within the labor force, individuals with less than high school education have the highest percentage of unemployment, with 6.8% or 74 of them being unemployed.
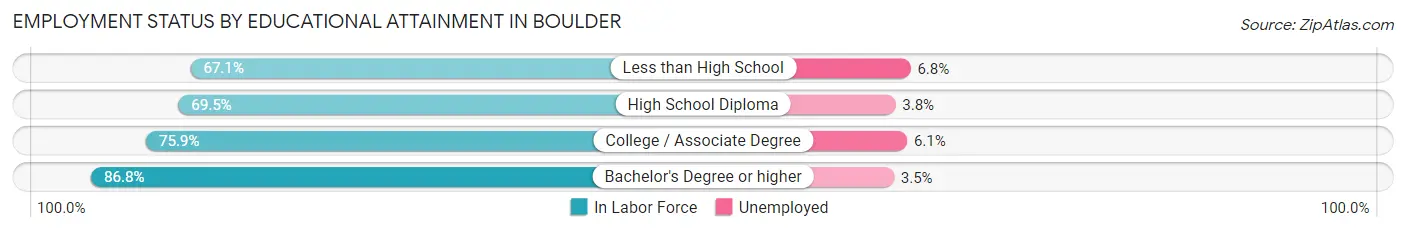
| Educational Attainment | In Labor Force | Unemployed |
| Less than High School | 1,089 (67.1%) | 110 (6.8%) |
| High School Diploma | 2,020 (69.5%) | 110 (3.8%) |
| College / Associate Degree | 4,842 (75.9%) | 389 (6.1%) |
| Bachelor's Degree or higher | 31,451 (86.8%) | 1,268 (3.5%) |
| Total | 39,411 (83.6%) | 1,886 (4.0%) |
Employment Occupations by Sex in Boulder
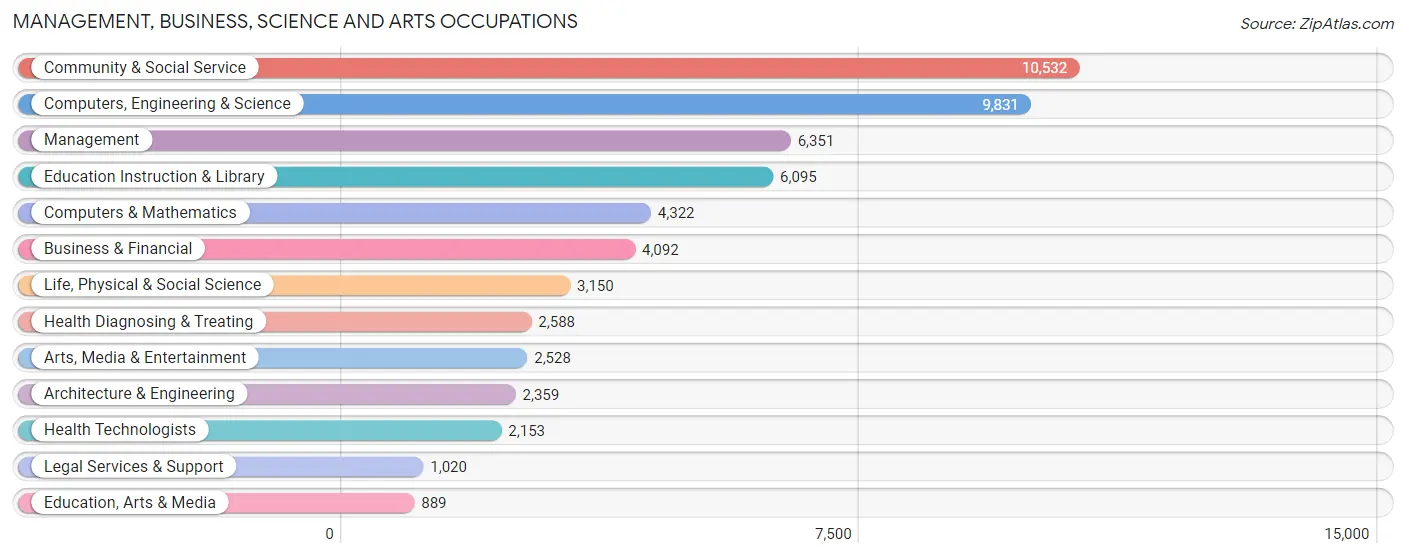
Management, Business, Science and Arts Occupations
The most common Management, Business, Science and Arts occupations in Boulder are Community & Social Service (10,532 | 18.1%), Computers, Engineering & Science (9,831 | 16.9%), Management (6,351 | 10.9%), Education Instruction & Library (6,095 | 10.5%), and Computers & Mathematics (4,322 | 7.4%).
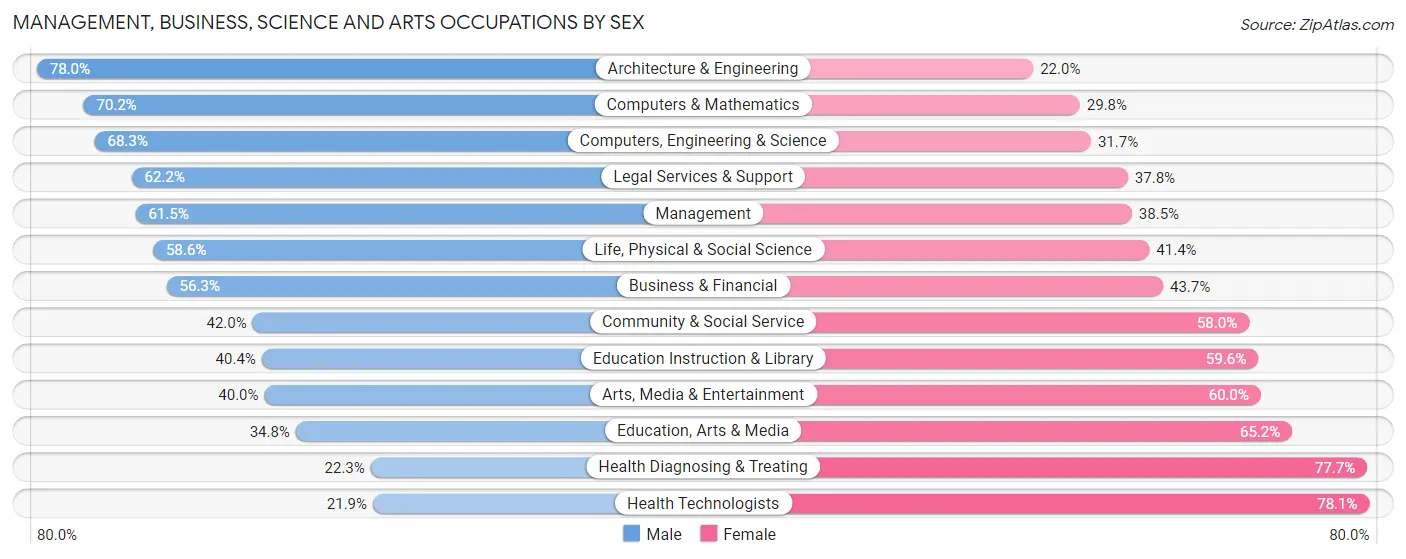
Management, Business, Science and Arts Occupations by Sex
Within the Management, Business, Science and Arts occupations in Boulder, the most male-oriented occupations are Architecture & Engineering (78.0%), Computers & Mathematics (70.2%), and Computers, Engineering & Science (68.3%), while the most female-oriented occupations are Health Technologists (78.1%), Health Diagnosing & Treating (77.7%), and Education, Arts & Media (65.2%).
| Occupation | Male | Female |
| Management | 3,905 (61.5%) | 2,446 (38.5%) |
| Business & Financial | 2,304 (56.3%) | 1,788 (43.7%) |
| Computers, Engineering & Science | 6,717 (68.3%) | 3,114 (31.7%) |
| Computers & Mathematics | 3,033 (70.2%) | 1,289 (29.8%) |
| Architecture & Engineering | 1,839 (78.0%) | 520 (22.0%) |
| Life, Physical & Social Science | 1,845 (58.6%) | 1,305 (41.4%) |
| Community & Social Service | 4,419 (42.0%) | 6,113 (58.0%) |
| Education, Arts & Media | 309 (34.8%) | 580 (65.2%) |
| Legal Services & Support | 634 (62.2%) | 386 (37.8%) |
| Education Instruction & Library | 2,465 (40.4%) | 3,630 (59.6%) |
| Arts, Media & Entertainment | 1,011 (40.0%) | 1,517 (60.0%) |
| Health Diagnosing & Treating | 576 (22.3%) | 2,012 (77.7%) |
| Health Technologists | 471 (21.9%) | 1,682 (78.1%) |
| Total (Category) | 17,921 (53.7%) | 15,473 (46.3%) |
| Total (Overall) | 30,263 (52.1%) | 27,800 (47.9%) |
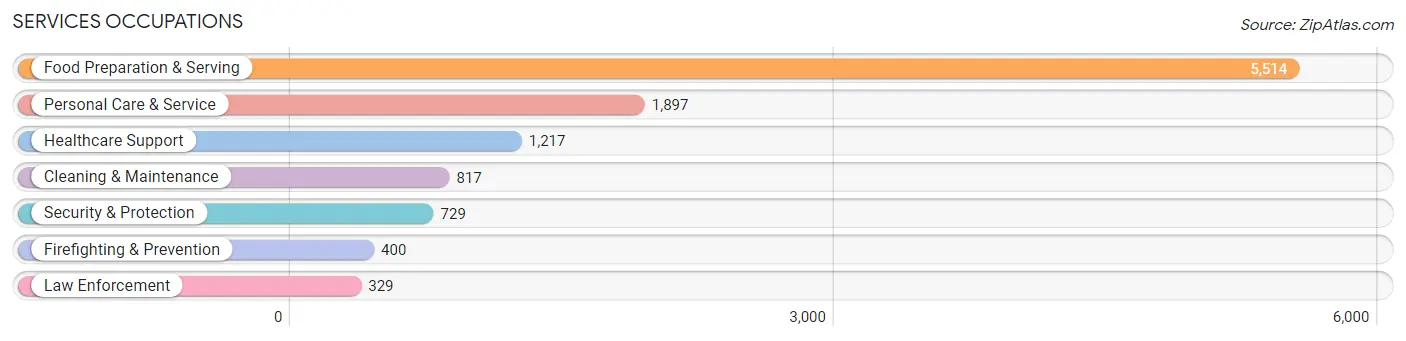
Services Occupations
The most common Services occupations in Boulder are Food Preparation & Serving (5,514 | 9.5%), Personal Care & Service (1,897 | 3.3%), Healthcare Support (1,217 | 2.1%), Cleaning & Maintenance (817 | 1.4%), and Security & Protection (729 | 1.3%).
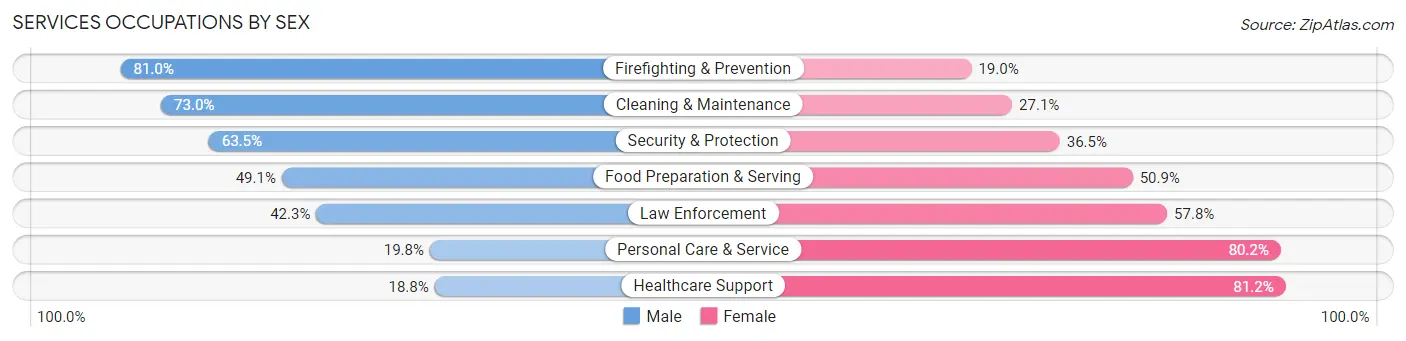
Services Occupations by Sex
Within the Services occupations in Boulder, the most male-oriented occupations are Firefighting & Prevention (81.0%), Cleaning & Maintenance (73.0%), and Security & Protection (63.5%), while the most female-oriented occupations are Healthcare Support (81.2%), Personal Care & Service (80.2%), and Law Enforcement (57.8%).
| Occupation | Male | Female |
| Healthcare Support | 229 (18.8%) | 988 (81.2%) |
| Security & Protection | 463 (63.5%) | 266 (36.5%) |
| Firefighting & Prevention | 324 (81.0%) | 76 (19.0%) |
| Law Enforcement | 139 (42.2%) | 190 (57.8%) |
| Food Preparation & Serving | 2,706 (49.1%) | 2,808 (50.9%) |
| Cleaning & Maintenance | 596 (73.0%) | 221 (27.1%) |
| Personal Care & Service | 375 (19.8%) | 1,522 (80.2%) |
| Total (Category) | 4,369 (42.9%) | 5,805 (57.1%) |
| Total (Overall) | 30,263 (52.1%) | 27,800 (47.9%) |
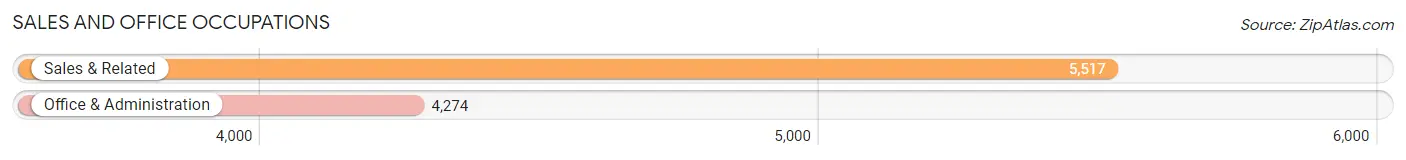
Sales and Office Occupations
The most common Sales and Office occupations in Boulder are Sales & Related (5,517 | 9.5%), and Office & Administration (4,274 | 7.4%).
Sales and Office Occupations by Sex
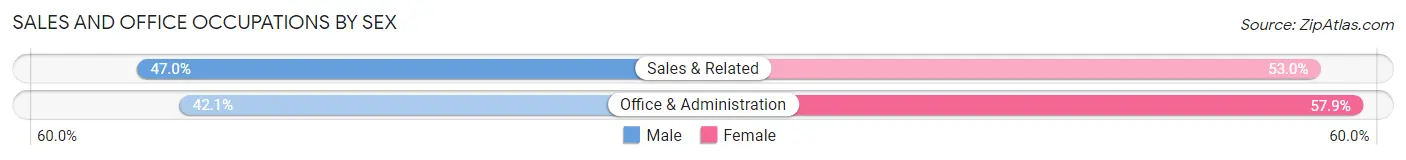
| Occupation | Male | Female |
| Sales & Related | 2,591 (47.0%) | 2,926 (53.0%) |
| Office & Administration | 1,799 (42.1%) | 2,475 (57.9%) |
| Total (Category) | 4,390 (44.8%) | 5,401 (55.2%) |
| Total (Overall) | 30,263 (52.1%) | 27,800 (47.9%) |
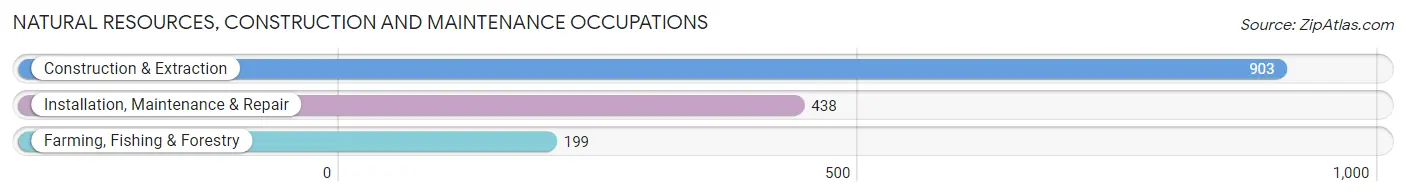
Natural Resources, Construction and Maintenance Occupations
The most common Natural Resources, Construction and Maintenance occupations in Boulder are Construction & Extraction (903 | 1.6%), Installation, Maintenance & Repair (438 | 0.7%), and Farming, Fishing & Forestry (199 | 0.3%).
Natural Resources, Construction and Maintenance Occupations by Sex
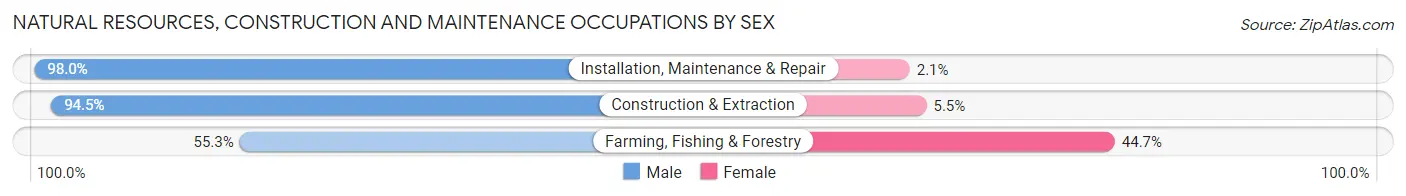
| Occupation | Male | Female |
| Farming, Fishing & Forestry | 110 (55.3%) | 89 (44.7%) |
| Construction & Extraction | 853 (94.5%) | 50 (5.5%) |
| Installation, Maintenance & Repair | 429 (98.0%) | 9 (2.1%) |
| Total (Category) | 1,392 (90.4%) | 148 (9.6%) |
| Total (Overall) | 30,263 (52.1%) | 27,800 (47.9%) |
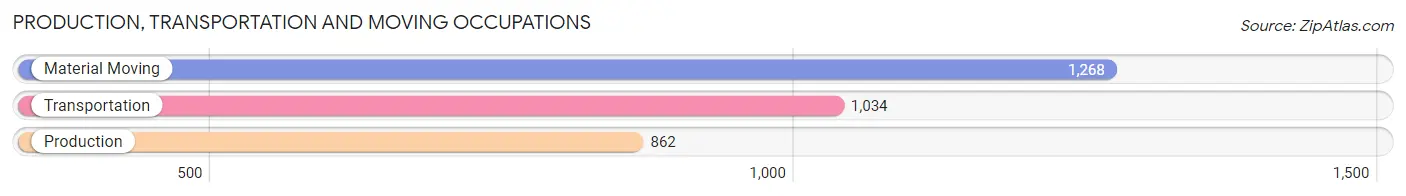
Production, Transportation and Moving Occupations
The most common Production, Transportation and Moving occupations in Boulder are Material Moving (1,268 | 2.2%), Transportation (1,034 | 1.8%), and Production (862 | 1.5%).
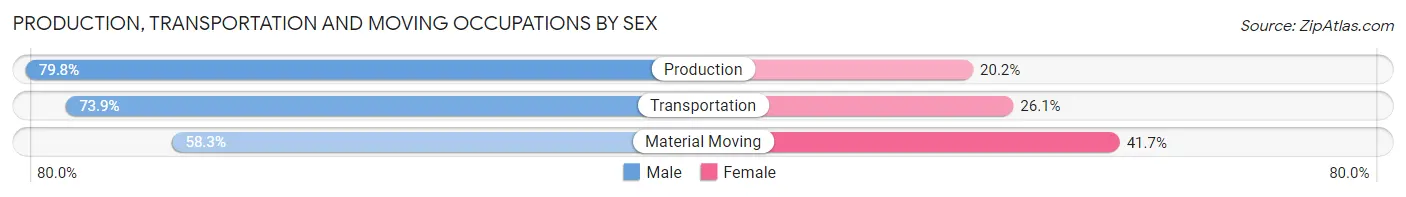
Production, Transportation and Moving Occupations by Sex
| Occupation | Male | Female |
| Production | 688 (79.8%) | 174 (20.2%) |
| Transportation | 764 (73.9%) | 270 (26.1%) |
| Material Moving | 739 (58.3%) | 529 (41.7%) |
| Total (Category) | 2,191 (69.3%) | 973 (30.7%) |
| Total (Overall) | 30,263 (52.1%) | 27,800 (47.9%) |
Employment Industries by Sex in Boulder
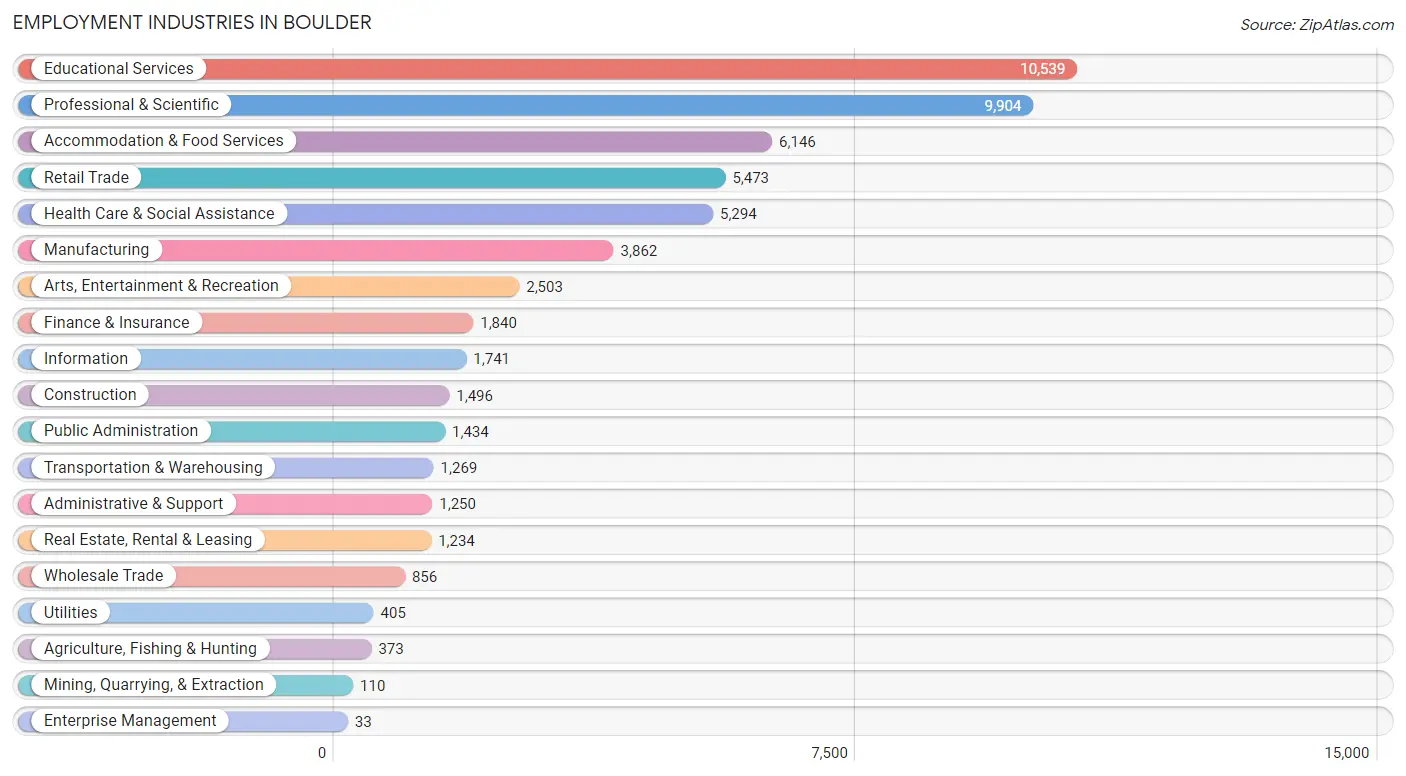
Employment Industries in Boulder
The major employment industries in Boulder include Educational Services (10,539 | 18.1%), Professional & Scientific (9,904 | 17.1%), Accommodation & Food Services (6,146 | 10.6%), Retail Trade (5,473 | 9.4%), and Health Care & Social Assistance (5,294 | 9.1%).
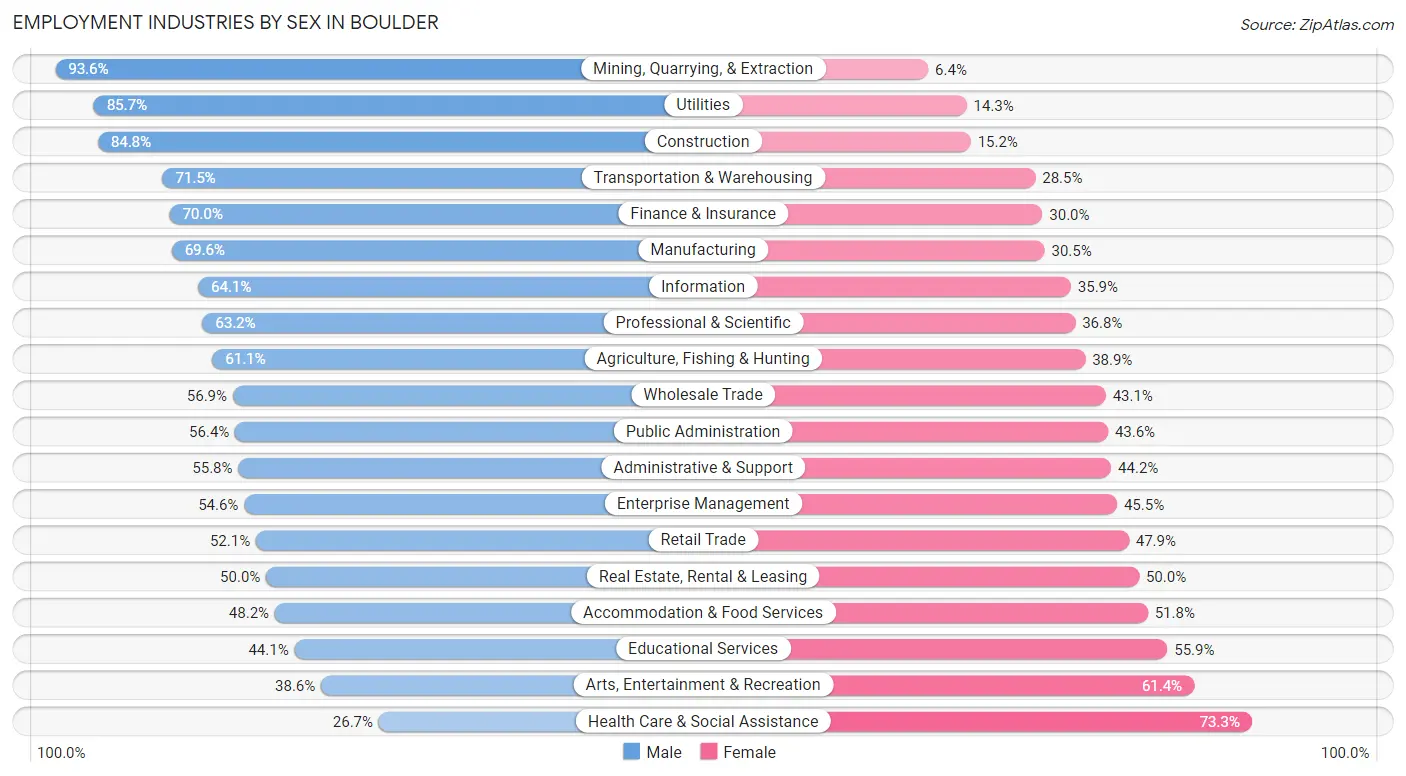
Employment Industries by Sex in Boulder
The Boulder industries that see more men than women are Mining, Quarrying, & Extraction (93.6%), Utilities (85.7%), and Construction (84.8%), whereas the industries that tend to have a higher number of women are Health Care & Social Assistance (73.3%), Arts, Entertainment & Recreation (61.4%), and Educational Services (55.9%).
| Industry | Male | Female |
| Agriculture, Fishing & Hunting | 228 (61.1%) | 145 (38.9%) |
| Mining, Quarrying, & Extraction | 103 (93.6%) | 7 (6.4%) |
| Construction | 1,269 (84.8%) | 227 (15.2%) |
| Manufacturing | 2,686 (69.6%) | 1,176 (30.4%) |
| Wholesale Trade | 487 (56.9%) | 369 (43.1%) |
| Retail Trade | 2,852 (52.1%) | 2,621 (47.9%) |
| Transportation & Warehousing | 907 (71.5%) | 362 (28.5%) |
| Utilities | 347 (85.7%) | 58 (14.3%) |
| Information | 1,116 (64.1%) | 625 (35.9%) |
| Finance & Insurance | 1,288 (70.0%) | 552 (30.0%) |
| Real Estate, Rental & Leasing | 617 (50.0%) | 617 (50.0%) |
| Professional & Scientific | 6,259 (63.2%) | 3,645 (36.8%) |
| Enterprise Management | 18 (54.5%) | 15 (45.5%) |
| Administrative & Support | 697 (55.8%) | 553 (44.2%) |
| Educational Services | 4,652 (44.1%) | 5,887 (55.9%) |
| Health Care & Social Assistance | 1,412 (26.7%) | 3,882 (73.3%) |
| Arts, Entertainment & Recreation | 967 (38.6%) | 1,536 (61.4%) |
| Accommodation & Food Services | 2,962 (48.2%) | 3,184 (51.8%) |
| Public Administration | 809 (56.4%) | 625 (43.6%) |
| Total | 30,263 (52.1%) | 27,800 (47.9%) |
Education in Boulder
School Enrollment in Boulder
The most common levels of schooling among the 44,435 students in Boulder are college / undergraduate (27,663 | 62.3%), graduate / professional (5,303 | 11.9%), and high school (3,834 | 8.6%).
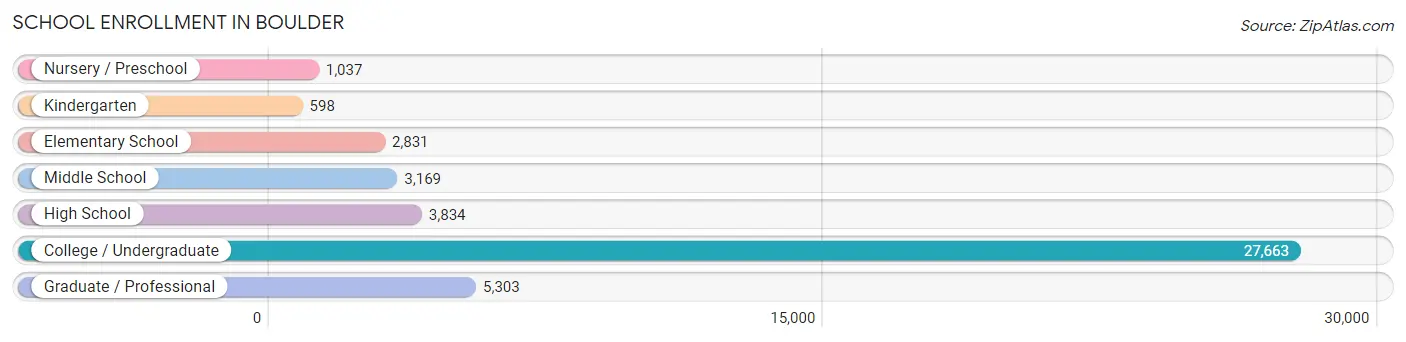
| School Level | # Students | % Students |
| Nursery / Preschool | 1,037 | 2.3% |
| Kindergarten | 598 | 1.3% |
| Elementary School | 2,831 | 6.4% |
| Middle School | 3,169 | 7.1% |
| High School | 3,834 | 8.6% |
| College / Undergraduate | 27,663 | 62.3% |
| Graduate / Professional | 5,303 | 11.9% |
| Total | 44,435 | 100.0% |
School Enrollment by Age by Funding Source in Boulder
Out of a total of 44,435 students who are enrolled in schools in Boulder, 3,288 (7.4%) attend a private institution, while the remaining 41,147 (92.6%) are enrolled in public schools. The age group of 3 to 4 year olds has the highest likelihood of being enrolled in private schools, with 532 (59.7% in the age bracket) enrolled. Conversely, the age group of 18 to 19 year olds has the lowest likelihood of being enrolled in a private school, with 10,177 (96.8% in the age bracket) attending a public institution.
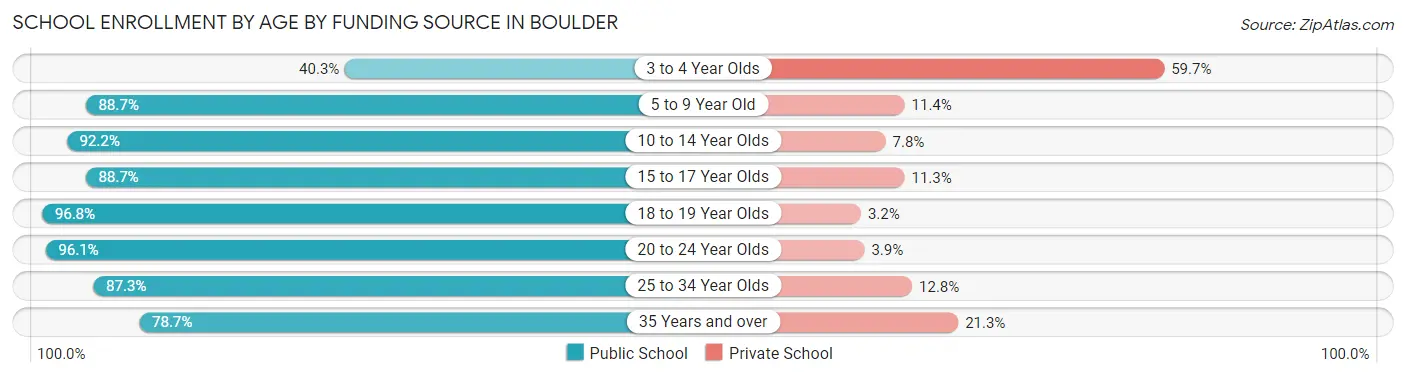
| Age Bracket | Public School | Private School |
| 3 to 4 Year Olds | 359 (40.3%) | 532 (59.7%) |
| 5 to 9 Year Old | 2,959 (88.6%) | 379 (11.4%) |
| 10 to 14 Year Olds | 3,471 (92.2%) | 294 (7.8%) |
| 15 to 17 Year Olds | 2,447 (88.7%) | 313 (11.3%) |
| 18 to 19 Year Olds | 10,177 (96.8%) | 339 (3.2%) |
| 20 to 24 Year Olds | 17,541 (96.1%) | 709 (3.9%) |
| 25 to 34 Year Olds | 3,380 (87.3%) | 494 (12.8%) |
| 35 Years and over | 819 (78.7%) | 222 (21.3%) |
| Total | 41,147 (92.6%) | 3,288 (7.4%) |
Educational Attainment by Field of Study in Boulder
Social sciences (5,963 | 11.6%), engineering (5,839 | 11.3%), business (5,156 | 10.0%), bio, nature & agricultural (4,333 | 8.4%), and physical & health sciences (4,085 | 7.9%) are the most common fields of study among 51,537 individuals in Boulder who have obtained a bachelor's degree or higher.
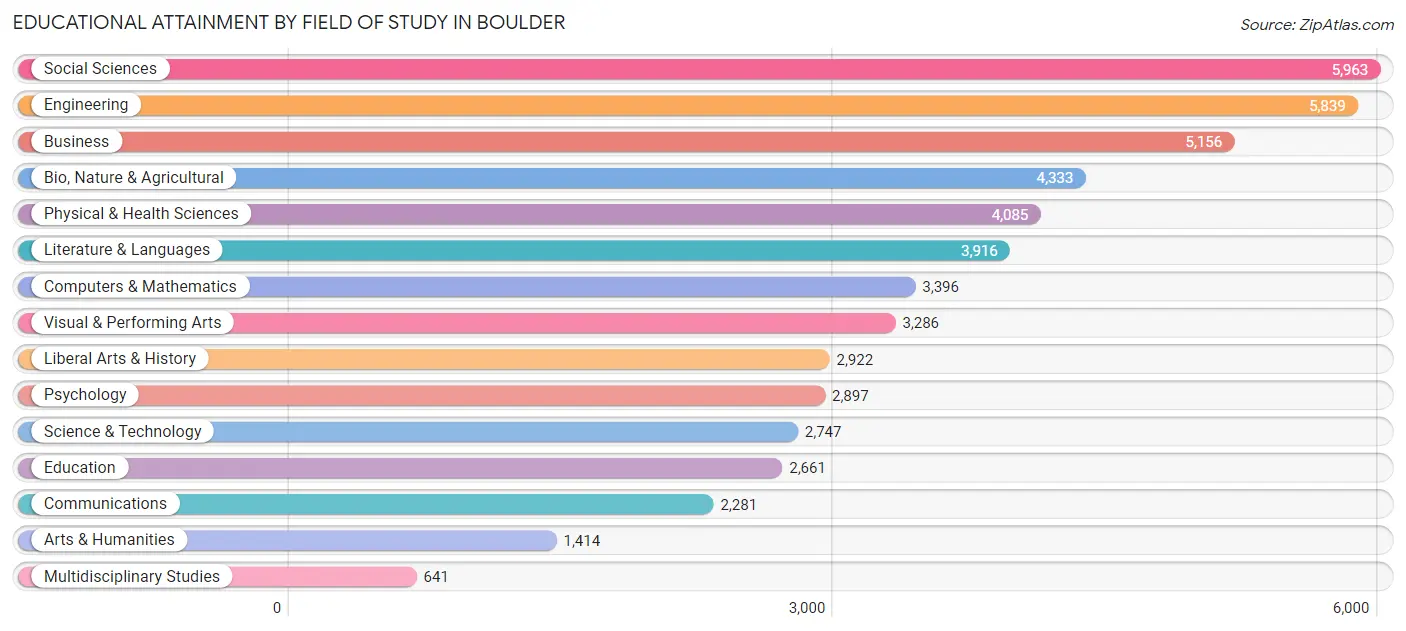
| Field of Study | # Graduates | % Graduates |
| Computers & Mathematics | 3,396 | 6.6% |
| Bio, Nature & Agricultural | 4,333 | 8.4% |
| Physical & Health Sciences | 4,085 | 7.9% |
| Psychology | 2,897 | 5.6% |
| Social Sciences | 5,963 | 11.6% |
| Engineering | 5,839 | 11.3% |
| Multidisciplinary Studies | 641 | 1.2% |
| Science & Technology | 2,747 | 5.3% |
| Business | 5,156 | 10.0% |
| Education | 2,661 | 5.2% |
| Literature & Languages | 3,916 | 7.6% |
| Liberal Arts & History | 2,922 | 5.7% |
| Visual & Performing Arts | 3,286 | 6.4% |
| Communications | 2,281 | 4.4% |
| Arts & Humanities | 1,414 | 2.7% |
| Total | 51,537 | 100.0% |
Transportation & Commute in Boulder
Vehicle Availability by Sex in Boulder
The most prevalent vehicle ownership categories in Boulder are males with 2 vehicles (11,777, accounting for 41.5%) and females with 2 vehicles (10,637, making up 45.7%).
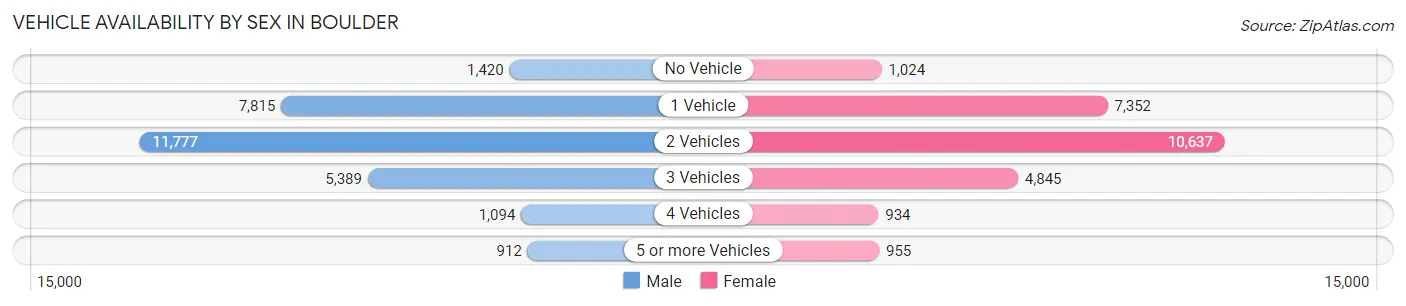
| Vehicles Available | Male | Female |
| No Vehicle | 1,420 (5.0%) | 1,024 (4.0%) |
| 1 Vehicle | 7,815 (27.5%) | 7,352 (28.5%) |
| 2 Vehicles | 11,777 (41.5%) | 10,637 (41.3%) |
| 3 Vehicles | 5,389 (19.0%) | 4,845 (18.8%) |
| 4 Vehicles | 1,094 (3.8%) | 934 (3.6%) |
| 5 or more Vehicles | 912 (3.2%) | 955 (3.7%) |
| Total | 28,407 (100.0%) | 25,747 (100.0%) |
Commute Time in Boulder
The most frequently occuring commute durations in Boulder are 10 to 14 minutes (9,578 commuters, 23.3%), 15 to 19 minutes (8,694 commuters, 21.1%), and 5 to 9 minutes (7,172 commuters, 17.4%).
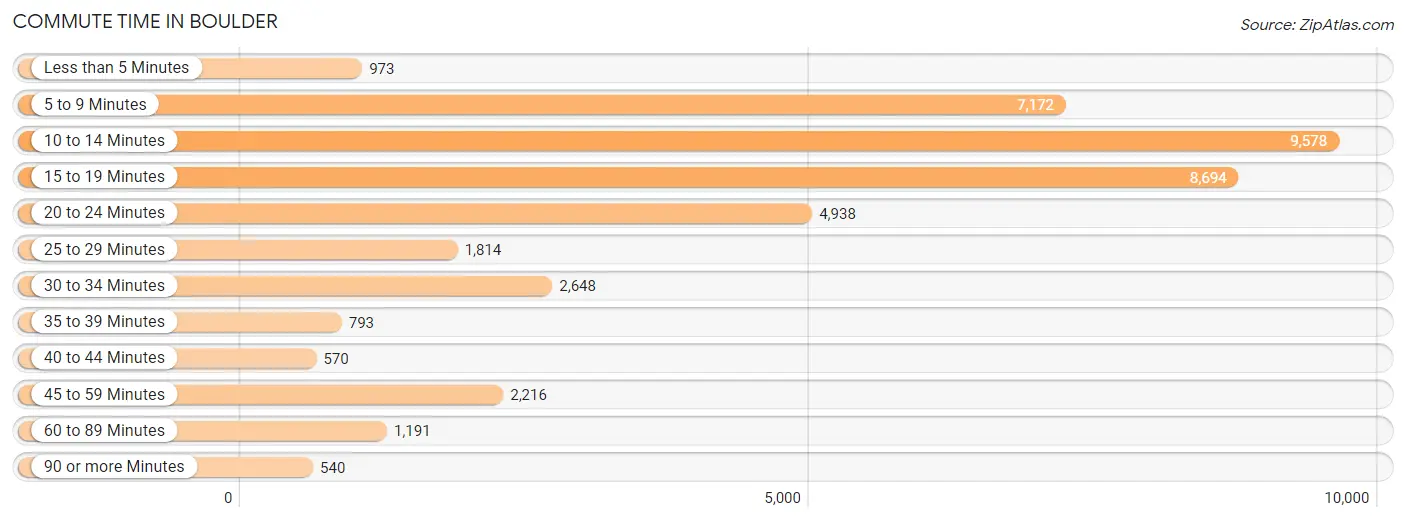
| Commute Time | # Commuters | % Commuters |
| Less than 5 Minutes | 973 | 2.4% |
| 5 to 9 Minutes | 7,172 | 17.4% |
| 10 to 14 Minutes | 9,578 | 23.3% |
| 15 to 19 Minutes | 8,694 | 21.1% |
| 20 to 24 Minutes | 4,938 | 12.0% |
| 25 to 29 Minutes | 1,814 | 4.4% |
| 30 to 34 Minutes | 2,648 | 6.4% |
| 35 to 39 Minutes | 793 | 1.9% |
| 40 to 44 Minutes | 570 | 1.4% |
| 45 to 59 Minutes | 2,216 | 5.4% |
| 60 to 89 Minutes | 1,191 | 2.9% |
| 90 or more Minutes | 540 | 1.3% |
Commute Time by Sex in Boulder
The most common commute times in Boulder are 10 to 14 minutes (5,148 commuters, 23.7%) for males and 10 to 14 minutes (4,430 commuters, 22.8%) for females.
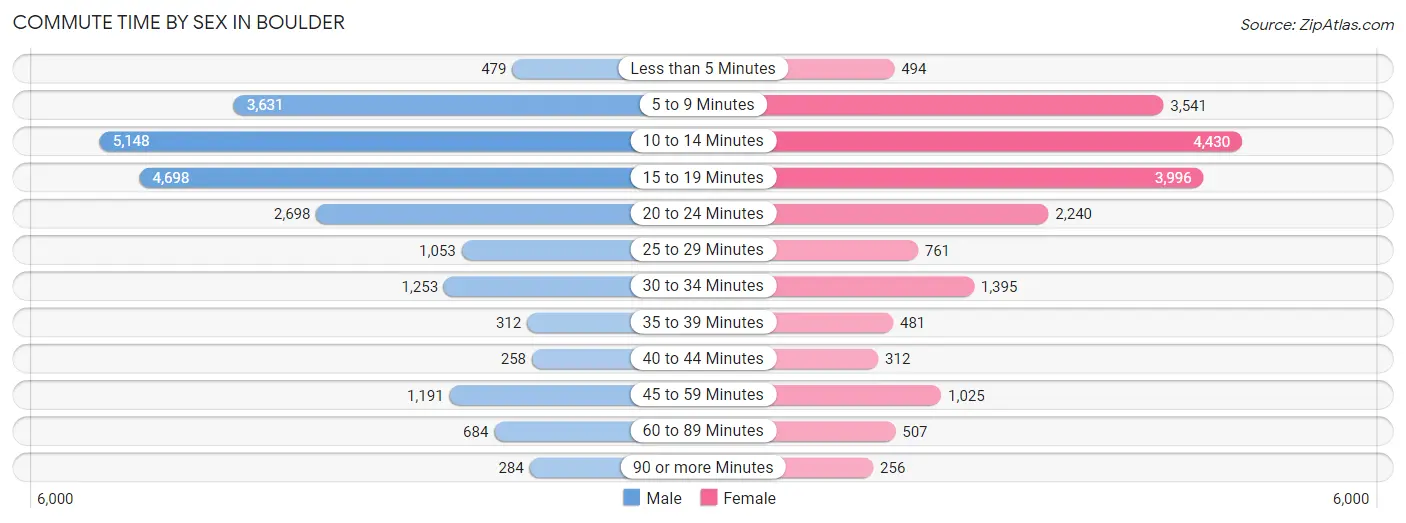
| Commute Time | Male | Female |
| Less than 5 Minutes | 479 (2.2%) | 494 (2.5%) |
| 5 to 9 Minutes | 3,631 (16.7%) | 3,541 (18.2%) |
| 10 to 14 Minutes | 5,148 (23.7%) | 4,430 (22.8%) |
| 15 to 19 Minutes | 4,698 (21.7%) | 3,996 (20.6%) |
| 20 to 24 Minutes | 2,698 (12.4%) | 2,240 (11.5%) |
| 25 to 29 Minutes | 1,053 (4.9%) | 761 (3.9%) |
| 30 to 34 Minutes | 1,253 (5.8%) | 1,395 (7.2%) |
| 35 to 39 Minutes | 312 (1.4%) | 481 (2.5%) |
| 40 to 44 Minutes | 258 (1.2%) | 312 (1.6%) |
| 45 to 59 Minutes | 1,191 (5.5%) | 1,025 (5.3%) |
| 60 to 89 Minutes | 684 (3.2%) | 507 (2.6%) |
| 90 or more Minutes | 284 (1.3%) | 256 (1.3%) |
Time of Departure to Work by Sex in Boulder
The most frequent times of departure to work in Boulder are 9:00 AM to 9:59 AM (3,667, 16.9%) for males and 7:30 AM to 7:59 AM (2,967, 15.3%) for females.
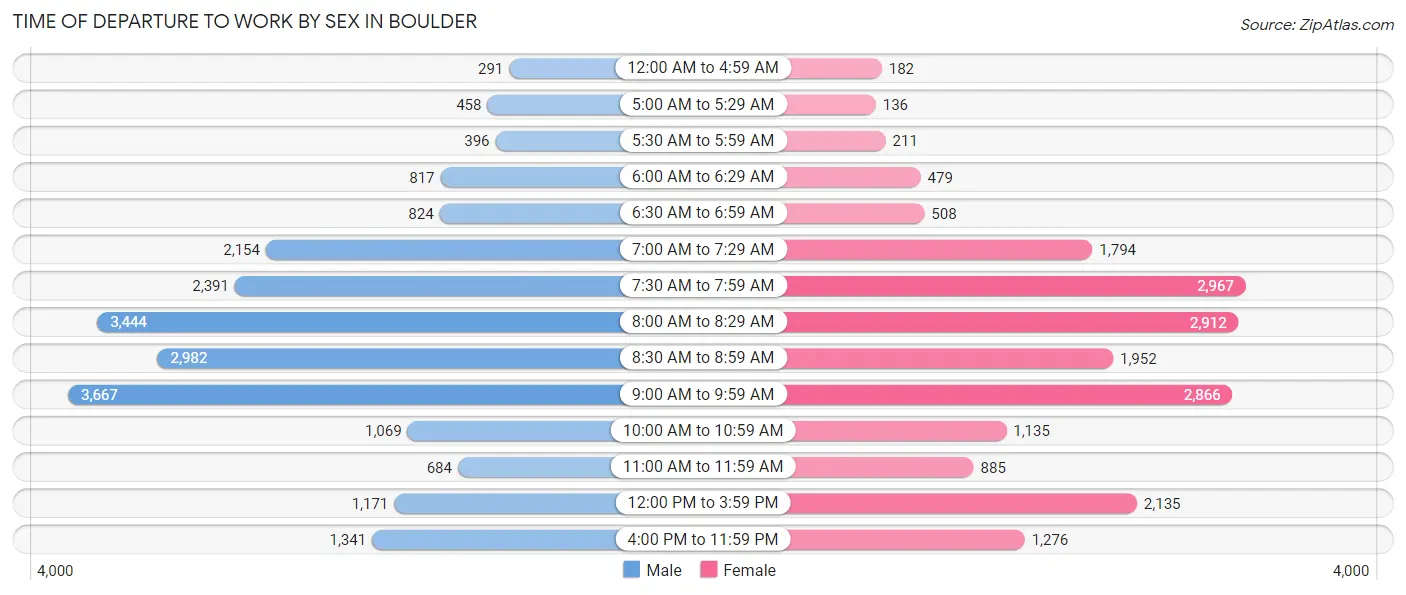
| Time of Departure | Male | Female |
| 12:00 AM to 4:59 AM | 291 (1.3%) | 182 (0.9%) |
| 5:00 AM to 5:29 AM | 458 (2.1%) | 136 (0.7%) |
| 5:30 AM to 5:59 AM | 396 (1.8%) | 211 (1.1%) |
| 6:00 AM to 6:29 AM | 817 (3.8%) | 479 (2.5%) |
| 6:30 AM to 6:59 AM | 824 (3.8%) | 508 (2.6%) |
| 7:00 AM to 7:29 AM | 2,154 (9.9%) | 1,794 (9.2%) |
| 7:30 AM to 7:59 AM | 2,391 (11.0%) | 2,967 (15.3%) |
| 8:00 AM to 8:29 AM | 3,444 (15.9%) | 2,912 (15.0%) |
| 8:30 AM to 8:59 AM | 2,982 (13.8%) | 1,952 (10.0%) |
| 9:00 AM to 9:59 AM | 3,667 (16.9%) | 2,866 (14.7%) |
| 10:00 AM to 10:59 AM | 1,069 (4.9%) | 1,135 (5.8%) |
| 11:00 AM to 11:59 AM | 684 (3.2%) | 885 (4.5%) |
| 12:00 PM to 3:59 PM | 1,171 (5.4%) | 2,135 (11.0%) |
| 4:00 PM to 11:59 PM | 1,341 (6.2%) | 1,276 (6.6%) |
| Total | 21,689 (100.0%) | 19,438 (100.0%) |
Housing Occupancy in Boulder
Occupancy by Ownership in Boulder
Of the total 43,658 dwellings in Boulder, owner-occupied units account for 20,617 (47.2%), while renter-occupied units make up 23,041 (52.8%).
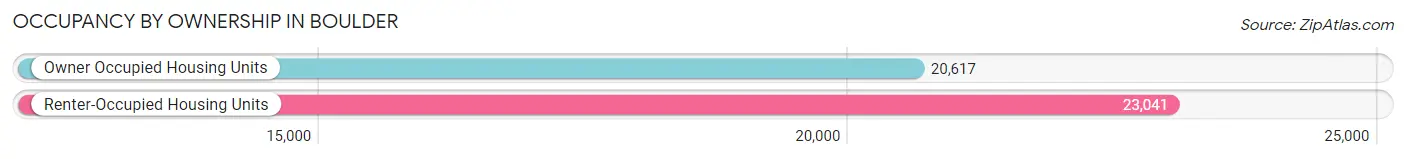
| Occupancy | # Housing Units | % Housing Units |
| Owner Occupied Housing Units | 20,617 | 47.2% |
| Renter-Occupied Housing Units | 23,041 | 52.8% |
| Total Occupied Housing Units | 43,658 | 100.0% |
Occupancy by Household Size in Boulder
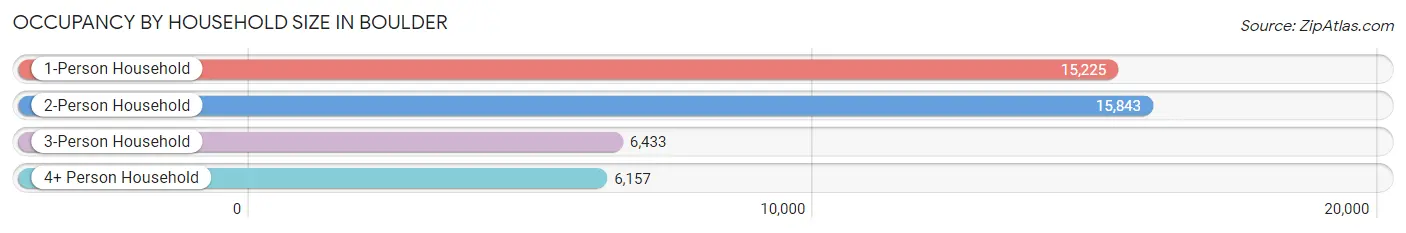
| Household Size | # Housing Units | % Housing Units |
| 1-Person Household | 15,225 | 34.9% |
| 2-Person Household | 15,843 | 36.3% |
| 3-Person Household | 6,433 | 14.7% |
| 4+ Person Household | 6,157 | 14.1% |
| Total Housing Units | 43,658 | 100.0% |
Occupancy by Ownership by Household Size in Boulder
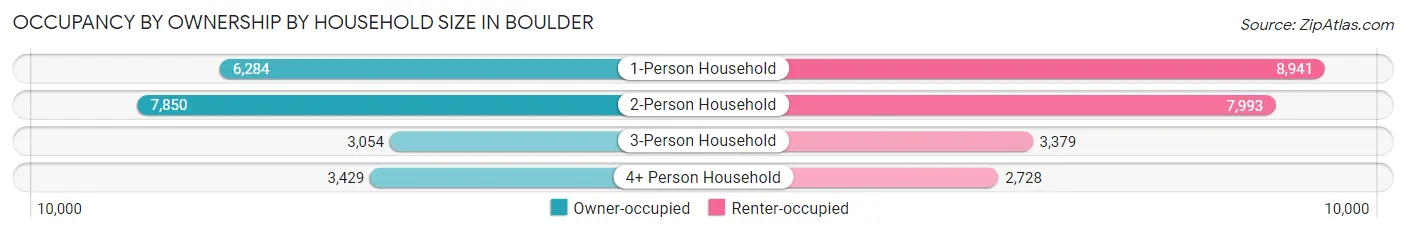
| Household Size | Owner-occupied | Renter-occupied |
| 1-Person Household | 6,284 (41.3%) | 8,941 (58.7%) |
| 2-Person Household | 7,850 (49.5%) | 7,993 (50.4%) |
| 3-Person Household | 3,054 (47.5%) | 3,379 (52.5%) |
| 4+ Person Household | 3,429 (55.7%) | 2,728 (44.3%) |
| Total Housing Units | 20,617 (47.2%) | 23,041 (52.8%) |
Occupancy by Educational Attainment in Boulder
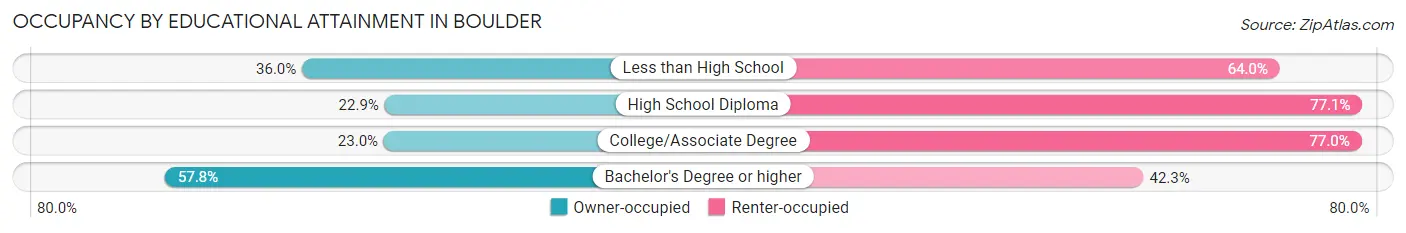
| Household Size | Owner-occupied | Renter-occupied |
| Less than High School | 376 (36.0%) | 669 (64.0%) |
| High School Diploma | 582 (22.9%) | 1,961 (77.1%) |
| College/Associate Degree | 2,306 (23.0%) | 7,715 (77.0%) |
| Bachelor's Degree or higher | 17,353 (57.8%) | 12,696 (42.2%) |
Occupancy by Age of Householder in Boulder
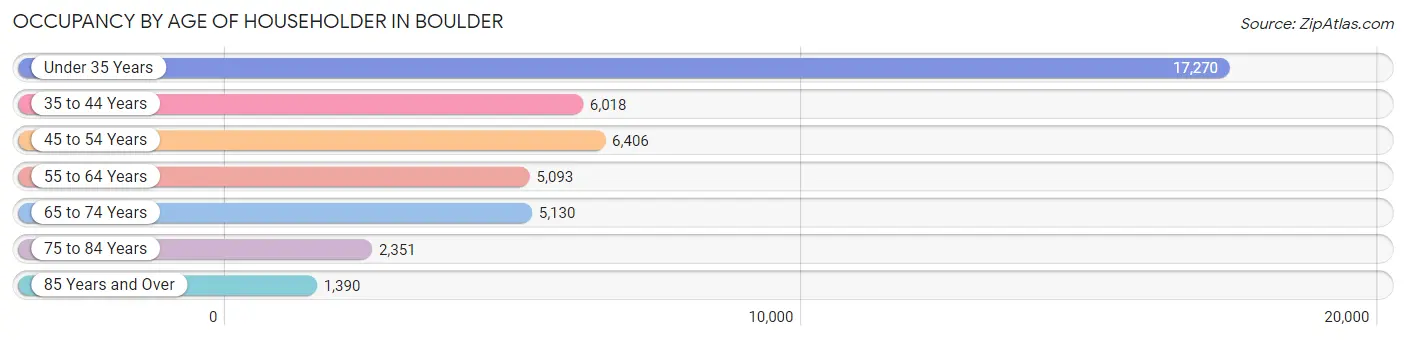
| Age Bracket | # Households | % Households |
| Under 35 Years | 17,270 | 39.6% |
| 35 to 44 Years | 6,018 | 13.8% |
| 45 to 54 Years | 6,406 | 14.7% |
| 55 to 64 Years | 5,093 | 11.7% |
| 65 to 74 Years | 5,130 | 11.7% |
| 75 to 84 Years | 2,351 | 5.4% |
| 85 Years and Over | 1,390 | 3.2% |
| Total | 43,658 | 100.0% |
Housing Finances in Boulder
Median Income by Occupancy in Boulder
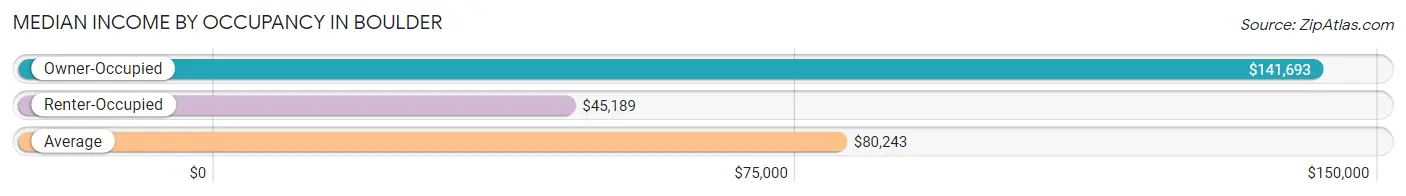
| Occupancy Type | # Households | Median Income |
| Owner-Occupied | 20,617 (47.2%) | $141,693 |
| Renter-Occupied | 23,041 (52.8%) | $45,189 |
| Average | 43,658 (100.0%) | $80,243 |
Occupancy by Householder Income Bracket in Boulder
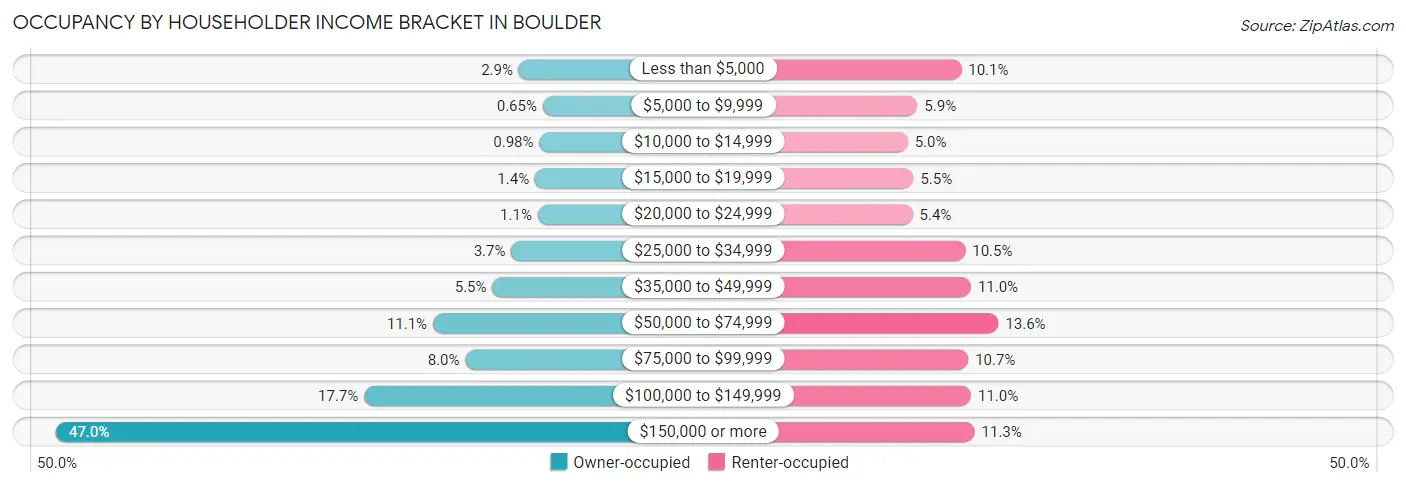
| Income Bracket | Owner-occupied | Renter-occupied |
| Less than $5,000 | 605 (2.9%) | 2,321 (10.1%) |
| $5,000 to $9,999 | 134 (0.6%) | 1,357 (5.9%) |
| $10,000 to $14,999 | 203 (1.0%) | 1,144 (5.0%) |
| $15,000 to $19,999 | 286 (1.4%) | 1,271 (5.5%) |
| $20,000 to $24,999 | 233 (1.1%) | 1,251 (5.4%) |
| $25,000 to $34,999 | 753 (3.6%) | 2,408 (10.4%) |
| $35,000 to $49,999 | 1,124 (5.4%) | 2,533 (11.0%) |
| $50,000 to $74,999 | 2,291 (11.1%) | 3,136 (13.6%) |
| $75,000 to $99,999 | 1,655 (8.0%) | 2,472 (10.7%) |
| $100,000 to $149,999 | 3,644 (17.7%) | 2,534 (11.0%) |
| $150,000 or more | 9,689 (47.0%) | 2,614 (11.3%) |
| Total | 20,617 (100.0%) | 23,041 (100.0%) |
Monthly Housing Cost Tiers in Boulder
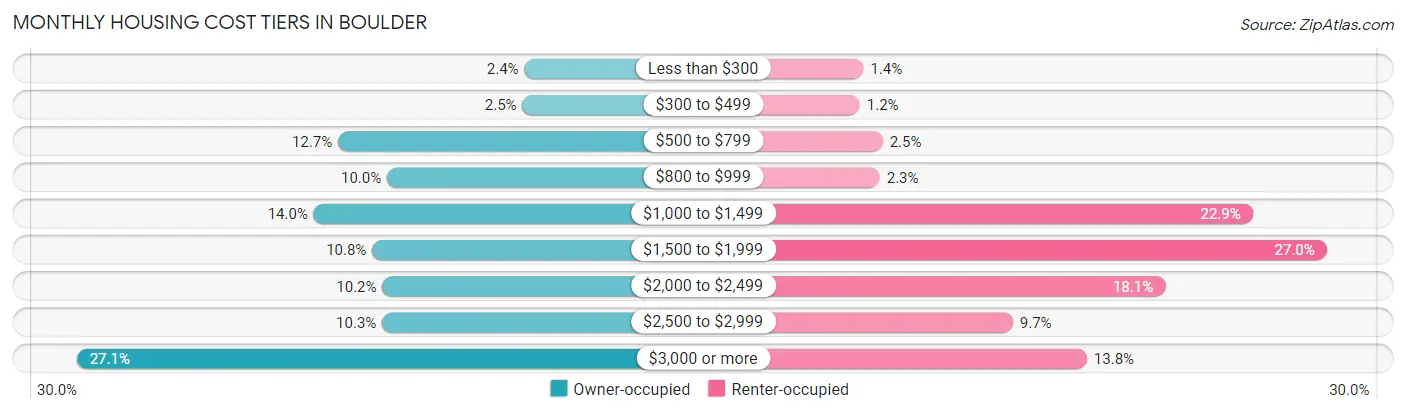
| Monthly Cost | Owner-occupied | Renter-occupied |
| Less than $300 | 493 (2.4%) | 332 (1.4%) |
| $300 to $499 | 515 (2.5%) | 285 (1.2%) |
| $500 to $799 | 2,616 (12.7%) | 575 (2.5%) |
| $800 to $999 | 2,058 (10.0%) | 540 (2.3%) |
| $1,000 to $1,499 | 2,893 (14.0%) | 5,283 (22.9%) |
| $1,500 to $1,999 | 2,226 (10.8%) | 6,225 (27.0%) |
| $2,000 to $2,499 | 2,112 (10.2%) | 4,169 (18.1%) |
| $2,500 to $2,999 | 2,113 (10.2%) | 2,233 (9.7%) |
| $3,000 or more | 5,591 (27.1%) | 3,176 (13.8%) |
| Total | 20,617 (100.0%) | 23,041 (100.0%) |
Physical Housing Characteristics in Boulder
Housing Structures in Boulder
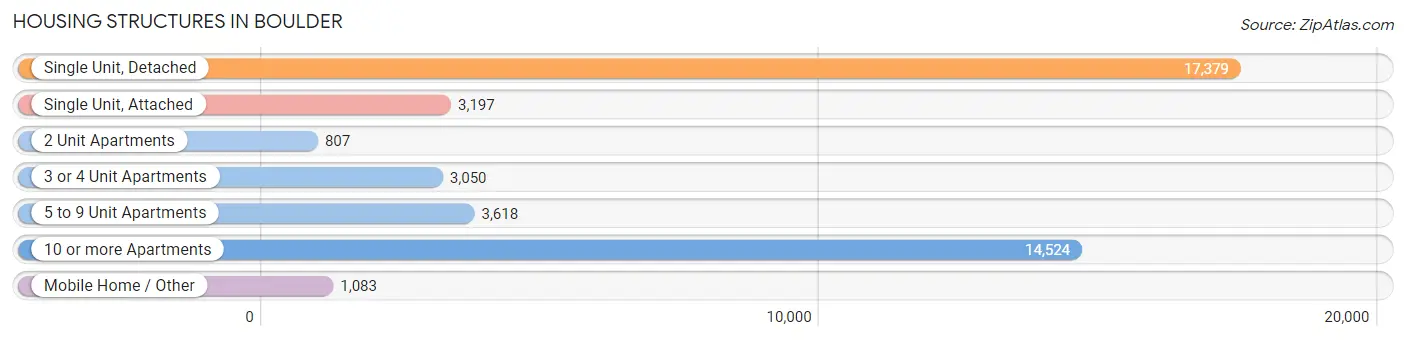
| Structure Type | # Housing Units | % Housing Units |
| Single Unit, Detached | 17,379 | 39.8% |
| Single Unit, Attached | 3,197 | 7.3% |
| 2 Unit Apartments | 807 | 1.8% |
| 3 or 4 Unit Apartments | 3,050 | 7.0% |
| 5 to 9 Unit Apartments | 3,618 | 8.3% |
| 10 or more Apartments | 14,524 | 33.3% |
| Mobile Home / Other | 1,083 | 2.5% |
| Total | 43,658 | 100.0% |
Housing Structures by Occupancy in Boulder
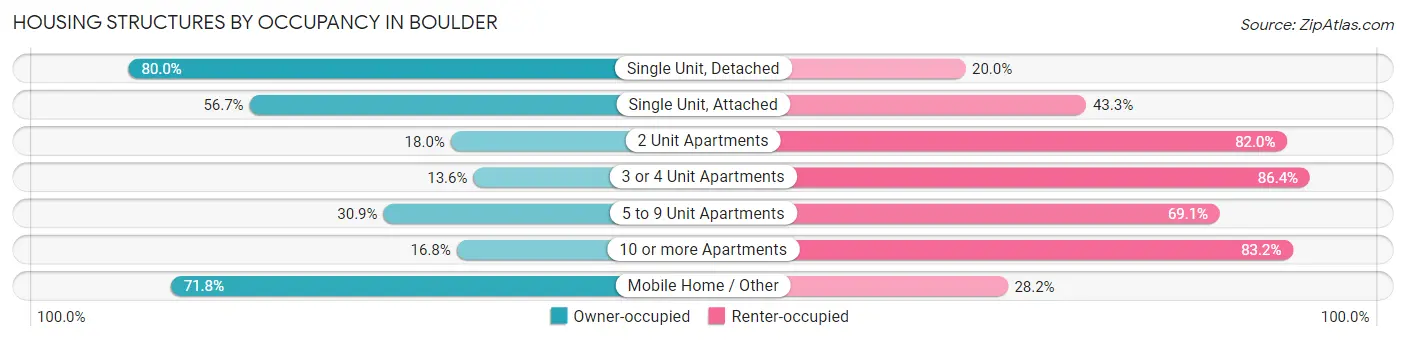
| Structure Type | Owner-occupied | Renter-occupied |
| Single Unit, Detached | 13,904 (80.0%) | 3,475 (20.0%) |
| Single Unit, Attached | 1,813 (56.7%) | 1,384 (43.3%) |
| 2 Unit Apartments | 145 (18.0%) | 662 (82.0%) |
| 3 or 4 Unit Apartments | 415 (13.6%) | 2,635 (86.4%) |
| 5 to 9 Unit Apartments | 1,119 (30.9%) | 2,499 (69.1%) |
| 10 or more Apartments | 2,443 (16.8%) | 12,081 (83.2%) |
| Mobile Home / Other | 778 (71.8%) | 305 (28.2%) |
| Total | 20,617 (47.2%) | 23,041 (52.8%) |
Housing Structures by Number of Rooms in Boulder
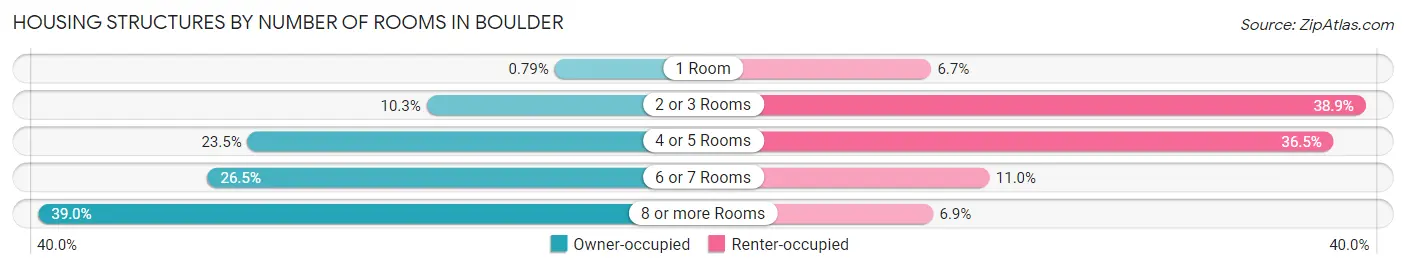
| Number of Rooms | Owner-occupied | Renter-occupied |
| 1 Room | 162 (0.8%) | 1,544 (6.7%) |
| 2 or 3 Rooms | 2,115 (10.3%) | 8,963 (38.9%) |
| 4 or 5 Rooms | 4,847 (23.5%) | 8,416 (36.5%) |
| 6 or 7 Rooms | 5,456 (26.5%) | 2,540 (11.0%) |
| 8 or more Rooms | 8,037 (39.0%) | 1,578 (6.9%) |
| Total | 20,617 (100.0%) | 23,041 (100.0%) |
Housing Structure by Heating Type in Boulder
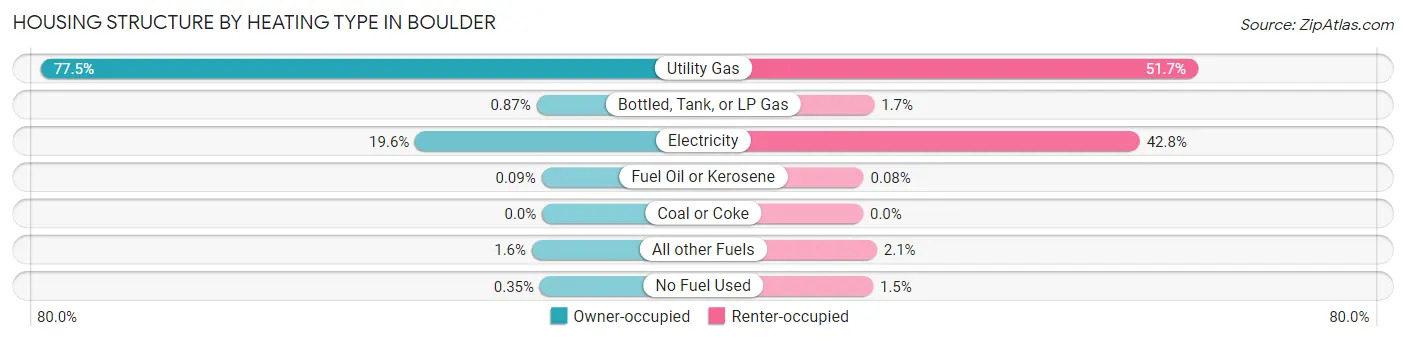
| Heating Type | Owner-occupied | Renter-occupied |
| Utility Gas | 15,978 (77.5%) | 11,922 (51.7%) |
| Bottled, Tank, or LP Gas | 179 (0.9%) | 401 (1.7%) |
| Electricity | 4,045 (19.6%) | 9,855 (42.8%) |
| Fuel Oil or Kerosene | 18 (0.1%) | 18 (0.1%) |
| Coal or Coke | 0 (0.0%) | 0 (0.0%) |
| All other Fuels | 325 (1.6%) | 490 (2.1%) |
| No Fuel Used | 72 (0.4%) | 355 (1.5%) |
| Total | 20,617 (100.0%) | 23,041 (100.0%) |
Household Vehicle Usage in Boulder
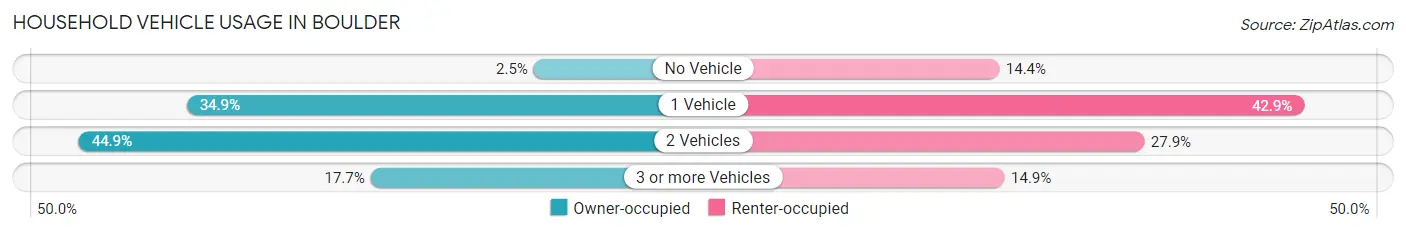
| Vehicles per Household | Owner-occupied | Renter-occupied |
| No Vehicle | 511 (2.5%) | 3,311 (14.4%) |
| 1 Vehicle | 7,188 (34.9%) | 9,877 (42.9%) |
| 2 Vehicles | 9,266 (44.9%) | 6,430 (27.9%) |
| 3 or more Vehicles | 3,652 (17.7%) | 3,423 (14.9%) |
| Total | 20,617 (100.0%) | 23,041 (100.0%) |
Real Estate & Mortgages in Boulder
Real Estate and Mortgage Overview in Boulder
| Characteristic | Without Mortgage | With Mortgage |
| Housing Units | 8,153 | 12,464 |
| Median Property Value | $920,500 | $919,400 |
| Median Household Income | $105,781 | $6,796 |
| Monthly Housing Costs | $865 | $5,529 |
| Real Estate Taxes | $4,859 | $135 |
Property Value by Mortgage Status in Boulder
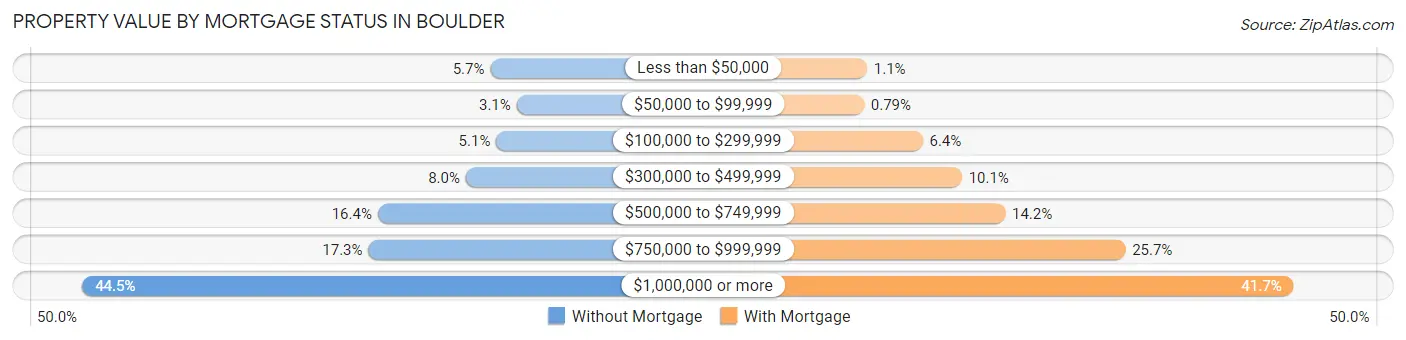
| Property Value | Without Mortgage | With Mortgage |
| Less than $50,000 | 461 (5.7%) | 135 (1.1%) |
| $50,000 to $99,999 | 256 (3.1%) | 98 (0.8%) |
| $100,000 to $299,999 | 414 (5.1%) | 795 (6.4%) |
| $300,000 to $499,999 | 651 (8.0%) | 1,260 (10.1%) |
| $500,000 to $749,999 | 1,335 (16.4%) | 1,775 (14.2%) |
| $750,000 to $999,999 | 1,407 (17.3%) | 3,201 (25.7%) |
| $1,000,000 or more | 3,629 (44.5%) | 5,200 (41.7%) |
| Total | 8,153 (100.0%) | 12,464 (100.0%) |
Household Income by Mortgage Status in Boulder
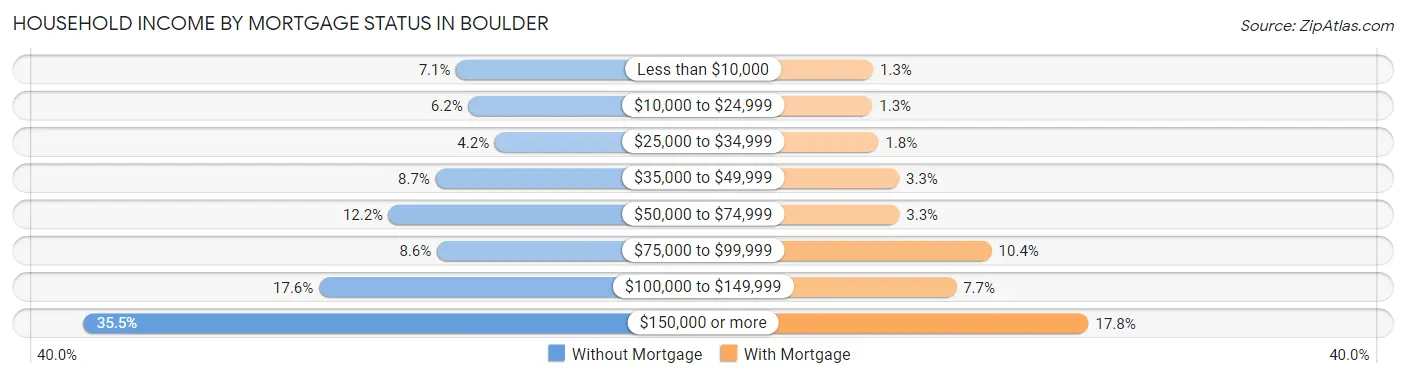
| Household Income | Without Mortgage | With Mortgage |
| Less than $10,000 | 580 (7.1%) | 167 (1.3%) |
| $10,000 to $24,999 | 504 (6.2%) | 159 (1.3%) |
| $25,000 to $34,999 | 339 (4.2%) | 218 (1.8%) |
| $35,000 to $49,999 | 708 (8.7%) | 414 (3.3%) |
| $50,000 to $74,999 | 998 (12.2%) | 416 (3.3%) |
| $75,000 to $99,999 | 699 (8.6%) | 1,293 (10.4%) |
| $100,000 to $149,999 | 1,432 (17.6%) | 956 (7.7%) |
| $150,000 or more | 2,893 (35.5%) | 2,212 (17.7%) |
| Total | 8,153 (100.0%) | 12,464 (100.0%) |
Property Value to Household Income Ratio in Boulder
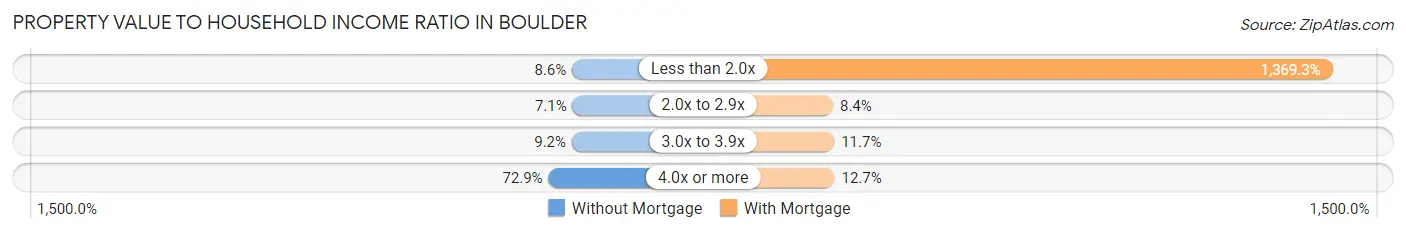
| Value-to-Income Ratio | Without Mortgage | With Mortgage |
| Less than 2.0x | 699 (8.6%) | 170,671 (1,369.3%) |
| 2.0x to 2.9x | 578 (7.1%) | 1,049 (8.4%) |
| 3.0x to 3.9x | 746 (9.1%) | 1,459 (11.7%) |
| 4.0x or more | 5,945 (72.9%) | 1,580 (12.7%) |
| Total | 8,153 (100.0%) | 12,464 (100.0%) |
Real Estate Taxes by Mortgage Status in Boulder
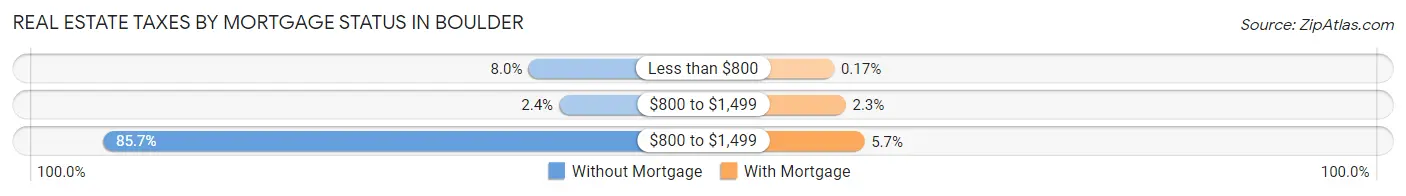
| Property Taxes | Without Mortgage | With Mortgage |
| Less than $800 | 653 (8.0%) | 21 (0.2%) |
| $800 to $1,499 | 196 (2.4%) | 284 (2.3%) |
| $800 to $1,499 | 6,984 (85.7%) | 709 (5.7%) |
| Total | 8,153 (100.0%) | 12,464 (100.0%) |
Health & Disability in Boulder
Health Insurance Coverage by Age in Boulder
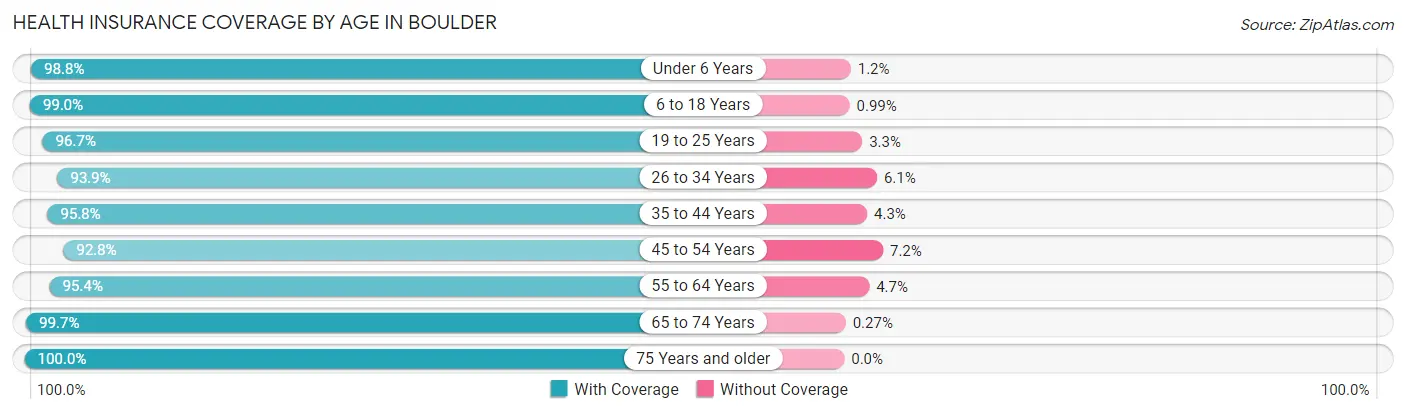
| Age Bracket | With Coverage | Without Coverage |
| Under 6 Years | 2,939 (98.8%) | 36 (1.2%) |
| 6 to 18 Years | 14,159 (99.0%) | 141 (1.0%) |
| 19 to 25 Years | 29,966 (96.7%) | 1,036 (3.3%) |
| 26 to 34 Years | 13,802 (93.9%) | 896 (6.1%) |
| 35 to 44 Years | 10,144 (95.8%) | 450 (4.3%) |
| 45 to 54 Years | 9,939 (92.8%) | 773 (7.2%) |
| 55 to 64 Years | 8,240 (95.4%) | 402 (4.6%) |
| 65 to 74 Years | 7,431 (99.7%) | 20 (0.3%) |
| 75 Years and older | 5,013 (100.0%) | 0 (0.0%) |
| Total | 101,633 (96.4%) | 3,754 (3.6%) |
Health Insurance Coverage by Citizenship Status in Boulder
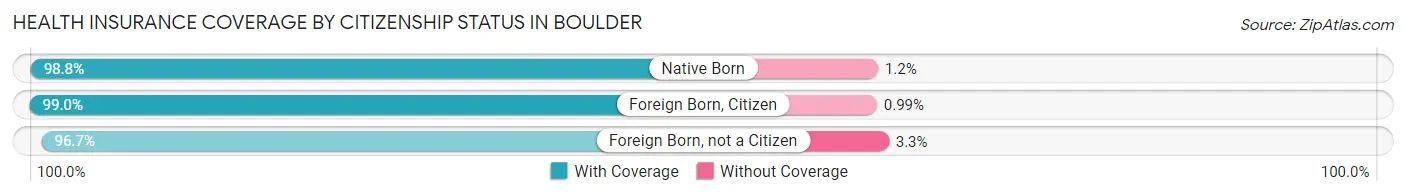
| Citizenship Status | With Coverage | Without Coverage |
| Native Born | 2,939 (98.8%) | 36 (1.2%) |
| Foreign Born, Citizen | 14,159 (99.0%) | 141 (1.0%) |
| Foreign Born, not a Citizen | 29,966 (96.7%) | 1,036 (3.3%) |
Health Insurance Coverage by Household Income in Boulder
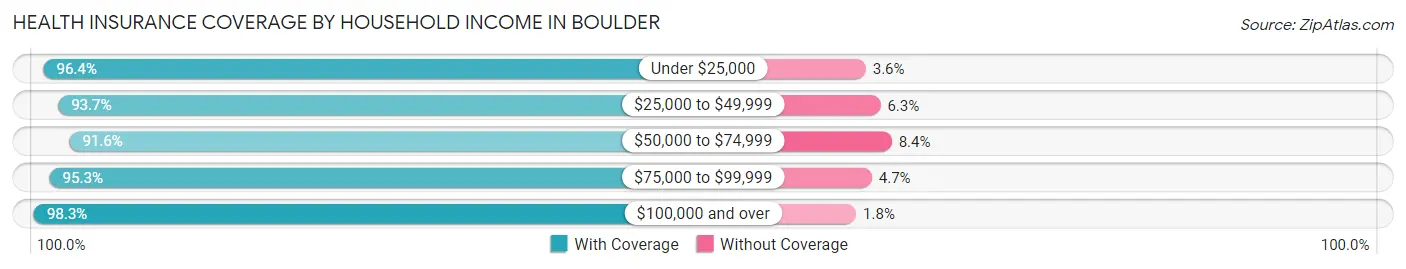
| Household Income | With Coverage | Without Coverage |
| Under $25,000 | 14,798 (96.4%) | 547 (3.6%) |
| $25,000 to $49,999 | 12,106 (93.7%) | 815 (6.3%) |
| $50,000 to $74,999 | 9,905 (91.6%) | 909 (8.4%) |
| $75,000 to $99,999 | 9,117 (95.3%) | 450 (4.7%) |
| $100,000 and over | 45,611 (98.3%) | 813 (1.8%) |
Public vs Private Health Insurance Coverage by Age in Boulder
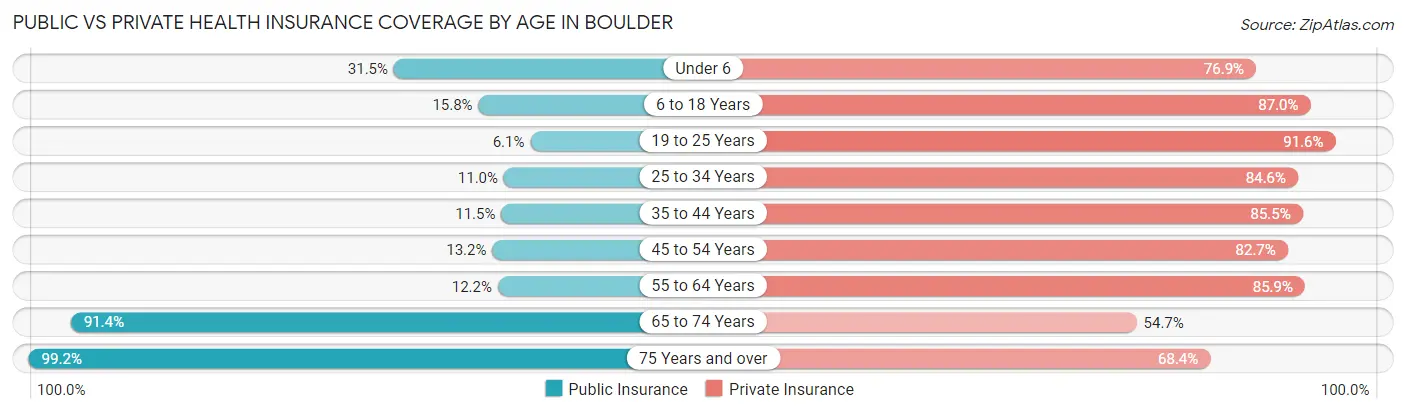
| Age Bracket | Public Insurance | Private Insurance |
| Under 6 | 936 (31.5%) | 2,287 (76.9%) |
| 6 to 18 Years | 2,253 (15.8%) | 12,437 (87.0%) |
| 19 to 25 Years | 1,899 (6.1%) | 28,394 (91.6%) |
| 25 to 34 Years | 1,622 (11.0%) | 12,441 (84.6%) |
| 35 to 44 Years | 1,220 (11.5%) | 9,059 (85.5%) |
| 45 to 54 Years | 1,413 (13.2%) | 8,863 (82.7%) |
| 55 to 64 Years | 1,051 (12.2%) | 7,426 (85.9%) |
| 65 to 74 Years | 6,812 (91.4%) | 4,077 (54.7%) |
| 75 Years and over | 4,975 (99.2%) | 3,427 (68.4%) |
| Total | 22,181 (21.0%) | 88,411 (83.9%) |
Disability Status by Sex by Age in Boulder
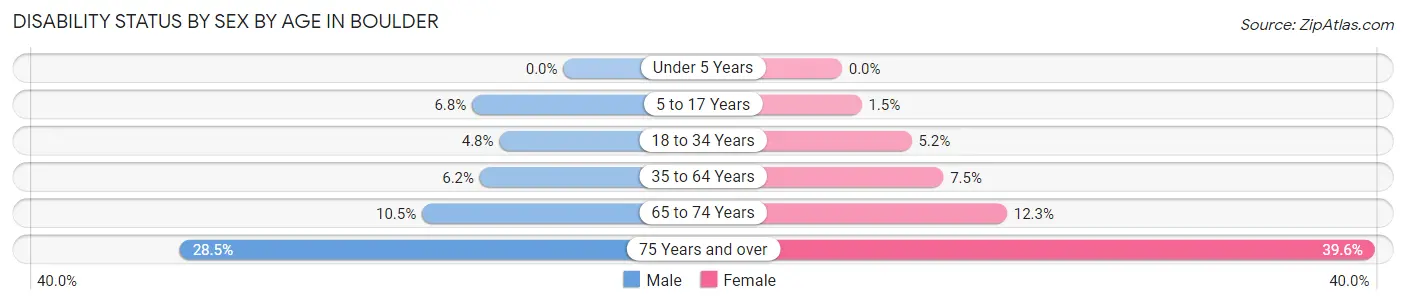
| Age Bracket | Male | Female |
| Under 5 Years | 0 (0.0%) | 0 (0.0%) |
| 5 to 17 Years | 316 (6.8%) | 77 (1.5%) |
| 18 to 34 Years | 1,296 (4.8%) | 1,206 (5.2%) |
| 35 to 64 Years | 958 (6.2%) | 1,091 (7.5%) |
| 65 to 74 Years | 363 (10.5%) | 489 (12.2%) |
| 75 Years and over | 635 (28.5%) | 1,101 (39.6%) |
Disability Class by Sex by Age in Boulder
Disability Class: Hearing Difficulty
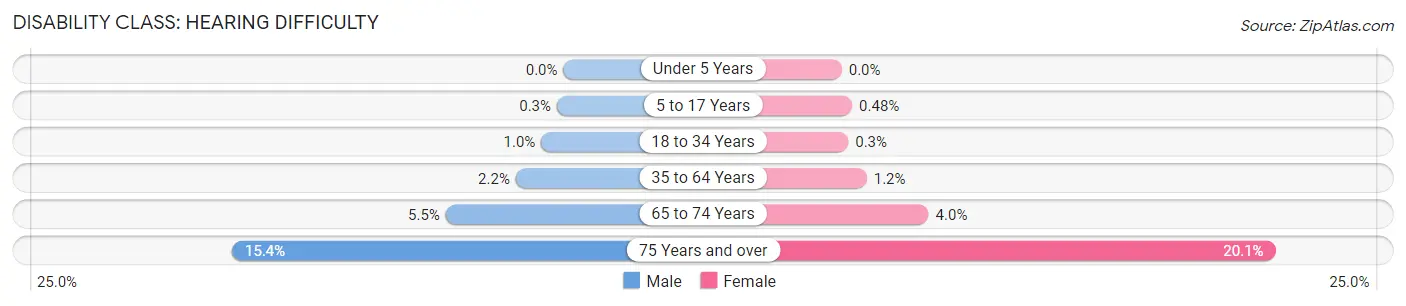
| Age Bracket | Male | Female |
| Under 5 Years | 0 (0.0%) | 0 (0.0%) |
| 5 to 17 Years | 14 (0.3%) | 25 (0.5%) |
| 18 to 34 Years | 282 (1.0%) | 70 (0.3%) |
| 35 to 64 Years | 341 (2.2%) | 168 (1.2%) |
| 65 to 74 Years | 189 (5.5%) | 161 (4.0%) |
| 75 Years and over | 343 (15.4%) | 560 (20.1%) |
Disability Class: Vision Difficulty
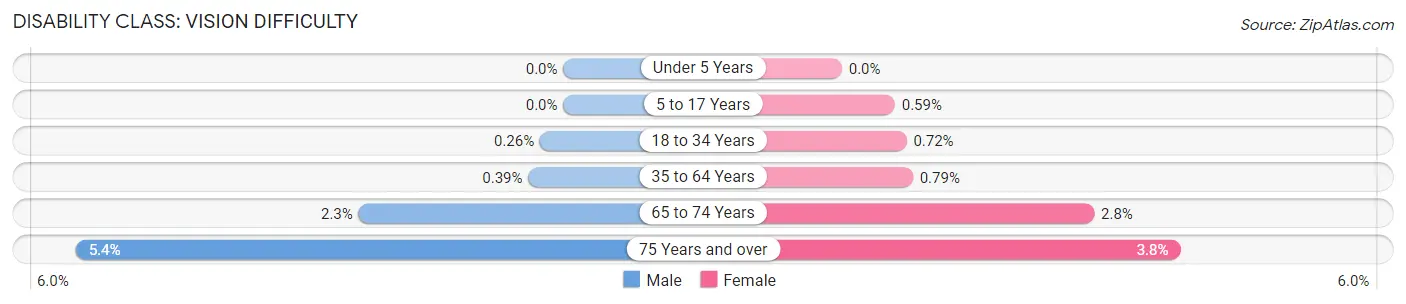
| Age Bracket | Male | Female |
| Under 5 Years | 0 (0.0%) | 0 (0.0%) |
| 5 to 17 Years | 0 (0.0%) | 31 (0.6%) |
| 18 to 34 Years | 72 (0.3%) | 168 (0.7%) |
| 35 to 64 Years | 60 (0.4%) | 114 (0.8%) |
| 65 to 74 Years | 79 (2.3%) | 112 (2.8%) |
| 75 Years and over | 121 (5.4%) | 105 (3.8%) |
Disability Class: Cognitive Difficulty
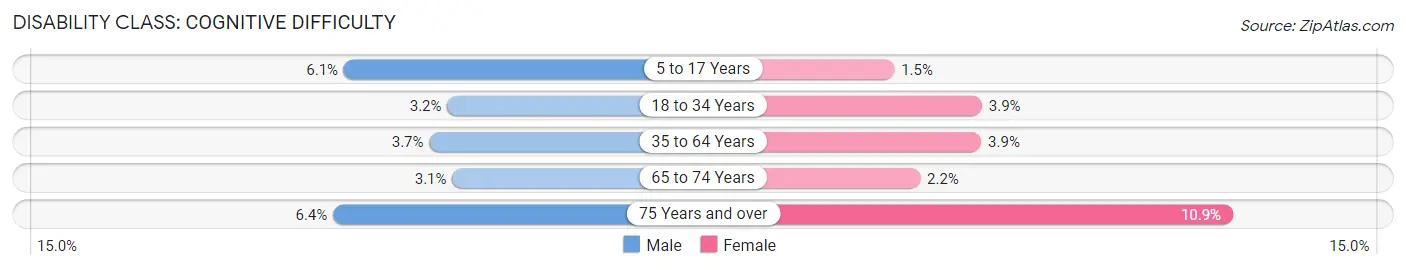
| Age Bracket | Male | Female |
| 5 to 17 Years | 285 (6.1%) | 77 (1.5%) |
| 18 to 34 Years | 881 (3.2%) | 909 (3.9%) |
| 35 to 64 Years | 577 (3.7%) | 562 (3.9%) |
| 65 to 74 Years | 107 (3.1%) | 87 (2.2%) |
| 75 Years and over | 143 (6.4%) | 303 (10.9%) |
Disability Class: Ambulatory Difficulty
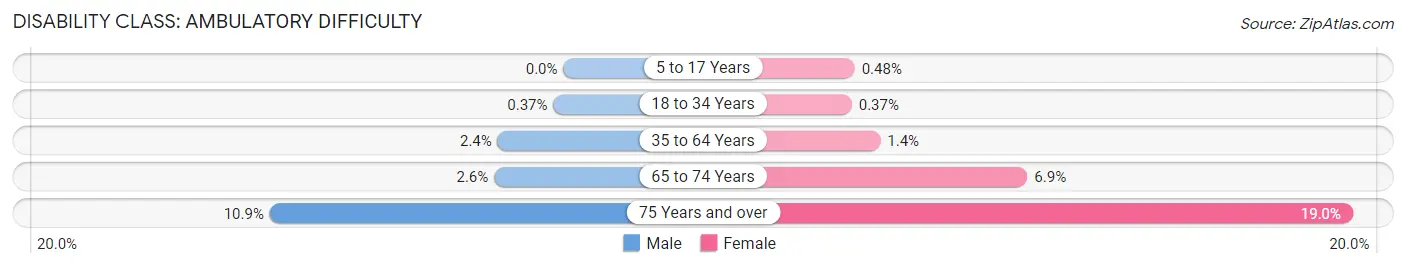
| Age Bracket | Male | Female |
| 5 to 17 Years | 0 (0.0%) | 25 (0.5%) |
| 18 to 34 Years | 100 (0.4%) | 87 (0.4%) |
| 35 to 64 Years | 377 (2.4%) | 207 (1.4%) |
| 65 to 74 Years | 89 (2.6%) | 275 (6.9%) |
| 75 Years and over | 243 (10.9%) | 528 (19.0%) |
Disability Class: Self-Care Difficulty
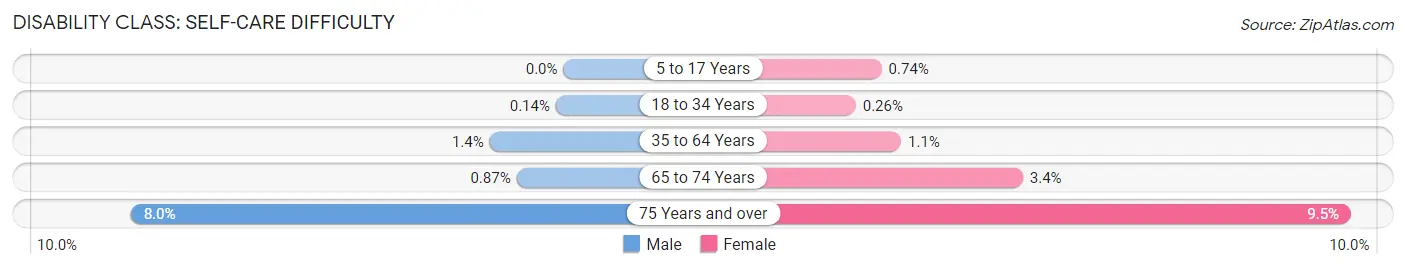
| Age Bracket | Male | Female |
| 5 to 17 Years | 0 (0.0%) | 39 (0.7%) |
| 18 to 34 Years | 38 (0.1%) | 60 (0.3%) |
| 35 to 64 Years | 211 (1.4%) | 160 (1.1%) |
| 65 to 74 Years | 30 (0.9%) | 134 (3.4%) |
| 75 Years and over | 179 (8.0%) | 263 (9.5%) |
Technology Access in Boulder
Computing Device Access in Boulder
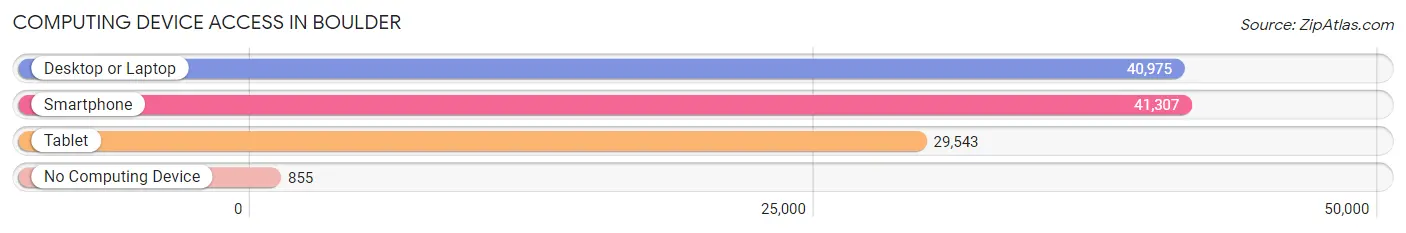
| Device Type | # Households | % Households |
| Desktop or Laptop | 40,975 | 93.9% |
| Smartphone | 41,307 | 94.6% |
| Tablet | 29,543 | 67.7% |
| No Computing Device | 855 | 2.0% |
| Total | 43,658 | 100.0% |
Internet Access in Boulder
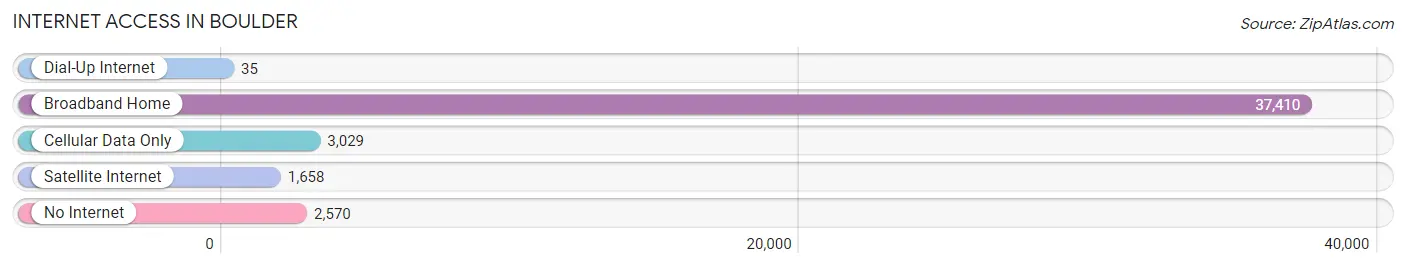
| Internet Type | # Households | % Households |
| Dial-Up Internet | 35 | 0.1% |
| Broadband Home | 37,410 | 85.7% |
| Cellular Data Only | 3,029 | 6.9% |
| Satellite Internet | 1,658 | 3.8% |
| No Internet | 2,570 | 5.9% |
| Total | 43,658 | 100.0% |
Boulder Summary
Boulder, Colorado is a city located in the foothills of the Rocky Mountains, approximately 25 miles northwest of Denver. It is the county seat of Boulder County and the 11th most populous city in the state. Boulder is known for its natural beauty, outdoor recreation opportunities, and vibrant culture.
History
The area that is now Boulder was first inhabited by the Arapaho and Cheyenne Native American tribes. The first European settlers arrived in the area in the mid-1800s, and the city was officially founded in 1859. The city was named after the large boulder that sits at the base of the Flatirons, a prominent rock formation in the area.
In the late 1800s, Boulder became a popular destination for tourists and health seekers due to its dry climate and natural beauty. The city was also home to the University of Colorado, which was founded in 1876.
Geography
Boulder is located in the foothills of the Rocky Mountains at an elevation of 5,430 feet. The city is situated on the eastern edge of the Great Plains, and is surrounded by mountains on three sides. The city is located at the confluence of Boulder Creek and the South Platte River.
The city has a total area of 27.7 square miles, of which 0.2 square miles is water. The city is located in a semi-arid climate zone, and receives an average of 300 days of sunshine per year.
Economy
Boulder has a diverse economy that is driven by the University of Colorado, the National Center for Atmospheric Research, and the city’s many technology companies. The city is home to several major employers, including IBM, Ball Aerospace, and Google.
The city’s economy is also supported by its thriving tourism industry. Boulder is home to several popular attractions, including the Boulder Creek Path, the Boulder Flatirons, and the Pearl Street Mall.
Demographics
As of the 2010 census, the population of Boulder was 97,385. The city has a population density of 3,521 people per square mile. The median age of the population is 28.7 years, and the median household income is $63,932.
The racial makeup of the city is 79.2% White, 4.3% African American, 0.9% Native American, 8.2% Asian, 0.1% Pacific Islander, 3.3% from other races, and 4.0% from two or more races. The city is also home to a large Hispanic population, which makes up 11.3% of the population.
Boulder is a vibrant and diverse city that is known for its natural beauty, outdoor recreation opportunities, and vibrant culture. The city’s economy is driven by the University of Colorado, the National Center for Atmospheric Research, and the city’s many technology companies. The city is also home to a diverse population, with a median age of 28.7 years and a median household income of $63,932.
Common Questions
What is Per Capita Income in Boulder?
Per Capita income in Boulder is $56,026.
What is the Median Family Income in Boulder?
Median Family Income in Boulder is $147,382.
What is the Median Household income in Boulder?
Median Household Income in Boulder is $80,243.
What is Income or Wage Gap in Boulder?
Income or Wage Gap in Boulder is 35.4%.
Women in Boulder earn 64.6 cents for every dollar earned by a man.
What is Family Income Deficit in Boulder?
Family Income Deficit in Boulder is $12,835.
Families that are below poverty line in Boulder earn $12,835 less on average than the poverty threshold level.
What is Inequality or Gini Index in Boulder?
Inequality or Gini Index in Boulder is 0.56.
What is the Total Population of Boulder?
Total Population of Boulder is 106,598.
What is the Total Male Population of Boulder?
Total Male Population of Boulder is 55,075.
What is the Total Female Population of Boulder?
Total Female Population of Boulder is 51,523.
What is the Ratio of Males per 100 Females in Boulder?
There are 106.89 Males per 100 Females in Boulder.
What is the Ratio of Females per 100 Males in Boulder?
There are 93.55 Females per 100 Males in Boulder.
What is the Median Population Age in Boulder?
Median Population Age in Boulder is 28.5 Years.
What is the Average Family Size in Boulder
Average Family Size in Boulder is 2.8 People.
What is the Average Household Size in Boulder
Average Household Size in Boulder is 2.2 People.
How Large is the Labor Force in Boulder?
There are 61,410 People in the Labor Forcein in Boulder.
What is the Percentage of People in the Labor Force in Boulder?
63.9% of People are in the Labor Force in Boulder.
What is the Unemployment Rate in Boulder?
Unemployment Rate in Boulder is 5.4%.