Raleigh, NC Map & Demographics
Raleigh Map
Raleigh Overview
$47,257
PER CAPITA INCOME
$103,882
AVG FAMILY INCOME
$78,631
AVG HOUSEHOLD INCOME
18.1%
WAGE / INCOME GAP [ % ]
81.9¢/ $1
WAGE / INCOME GAP [ $ ]
$10,749
FAMILY INCOME DEFICIT
0.48
INEQUALITY / GINI INDEX
465,517
TOTAL POPULATION
227,275
MALE POPULATION
238,242
FEMALE POPULATION
95.40
MALES / 100 FEMALES
104.83
FEMALES / 100 MALES
34.6
MEDIAN AGE
3.1
AVG FAMILY SIZE
2.4
AVG HOUSEHOLD SIZE
267,788
LABOR FORCE [ PEOPLE ]
69.8%
PERCENT IN LABOR FORCE
4.5%
UNEMPLOYMENT RATE
Raleigh Zip Codes
Raleigh Area Codes
Income in Raleigh
Income Overview in Raleigh
Per Capita Income in Raleigh is $47,257, while median incomes of families and households are $103,882 and $78,631 respectively.
| Characteristic | Number | Measure |
| Per Capita Income | 465,517 | $47,257 |
| Median Family Income | 101,881 | $103,882 |
| Mean Family Income | 101,881 | $142,114 |
| Median Household Income | 189,830 | $78,631 |
| Mean Household Income | 189,830 | $112,110 |
| Income Deficit | 101,881 | $10,749 |
| Wage / Income Gap (%) | 465,517 | 18.14% |
| Wage / Income Gap ($) | 465,517 | 81.86¢ per $1 |
| Gini / Inequality Index | 465,517 | 0.48 |
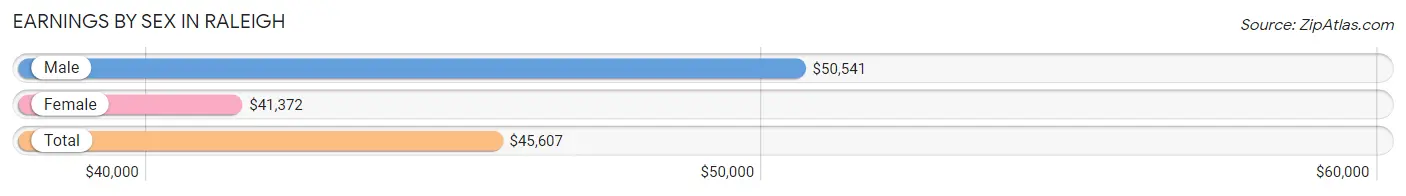
Earnings by Sex in Raleigh
Average Earnings in Raleigh are $45,607, $50,541 for men and $41,372 for women, a difference of 18.1%.
| Sex | Number | Average Earnings |
| Male | 141,903 (50.9%) | $50,541 |
| Female | 137,095 (49.1%) | $41,372 |
| Total | 278,998 (100.0%) | $45,607 |
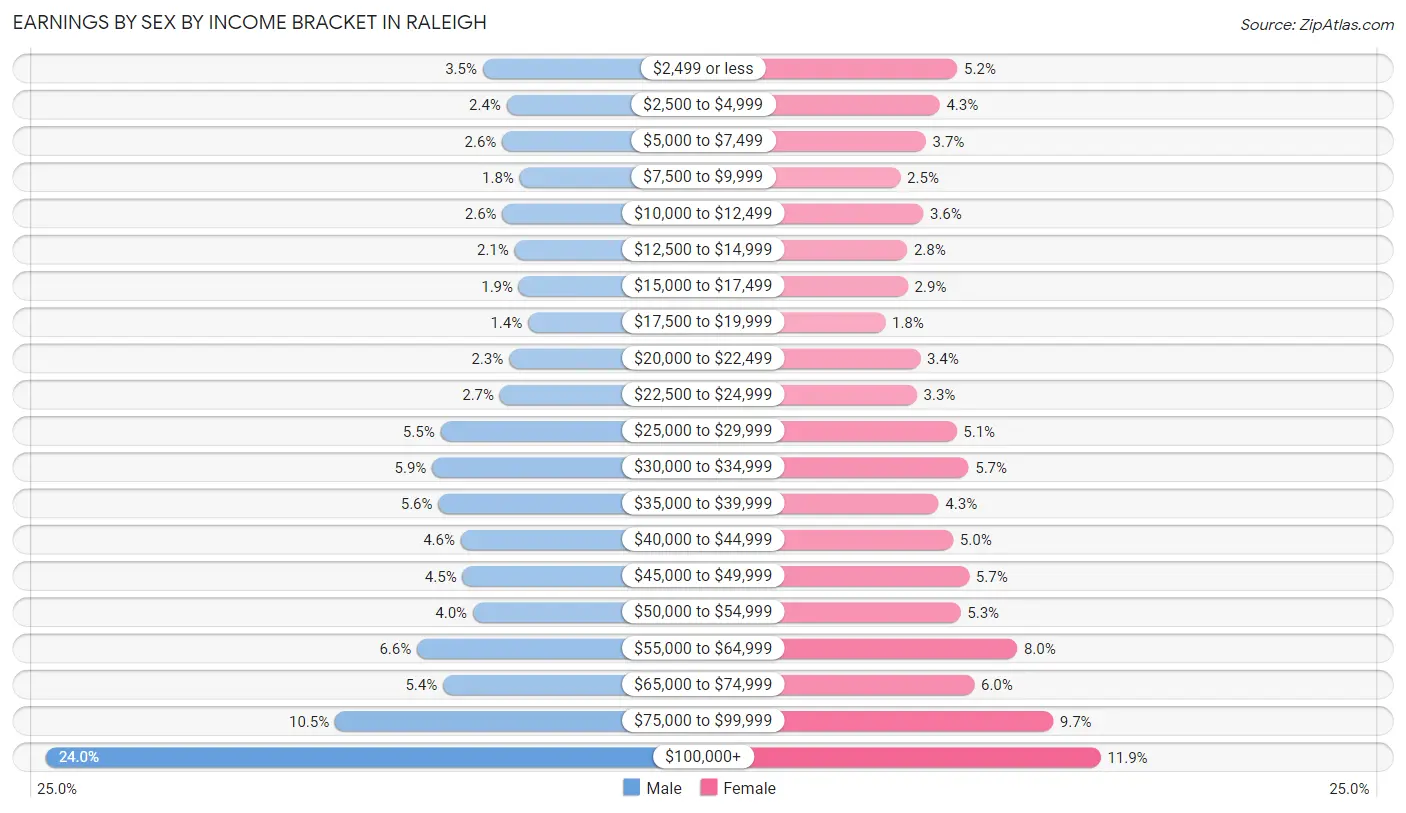
Earnings by Sex by Income Bracket in Raleigh
The most common earnings brackets in Raleigh are $100,000+ for men (34,065 | 24.0%) and $100,000+ for women (16,293 | 11.9%).
| Income | Male | Female |
| $2,499 or less | 5,030 (3.5%) | 7,088 (5.2%) |
| $2,500 to $4,999 | 3,440 (2.4%) | 5,956 (4.3%) |
| $5,000 to $7,499 | 3,737 (2.6%) | 5,058 (3.7%) |
| $7,500 to $9,999 | 2,574 (1.8%) | 3,427 (2.5%) |
| $10,000 to $12,499 | 3,713 (2.6%) | 4,889 (3.6%) |
| $12,500 to $14,999 | 2,907 (2.1%) | 3,863 (2.8%) |
| $15,000 to $17,499 | 2,629 (1.8%) | 3,914 (2.9%) |
| $17,500 to $19,999 | 2,021 (1.4%) | 2,449 (1.8%) |
| $20,000 to $22,499 | 3,284 (2.3%) | 4,707 (3.4%) |
| $22,500 to $24,999 | 3,885 (2.7%) | 4,478 (3.3%) |
| $25,000 to $29,999 | 7,828 (5.5%) | 7,034 (5.1%) |
| $30,000 to $34,999 | 8,387 (5.9%) | 7,803 (5.7%) |
| $35,000 to $39,999 | 7,973 (5.6%) | 5,875 (4.3%) |
| $40,000 to $44,999 | 6,485 (4.6%) | 6,812 (5.0%) |
| $45,000 to $49,999 | 6,369 (4.5%) | 7,842 (5.7%) |
| $50,000 to $54,999 | 5,670 (4.0%) | 7,293 (5.3%) |
| $55,000 to $64,999 | 9,399 (6.6%) | 10,925 (8.0%) |
| $65,000 to $74,999 | 7,660 (5.4%) | 8,166 (6.0%) |
| $75,000 to $99,999 | 14,847 (10.5%) | 13,223 (9.7%) |
| $100,000+ | 34,065 (24.0%) | 16,293 (11.9%) |
| Total | 141,903 (100.0%) | 137,095 (100.0%) |
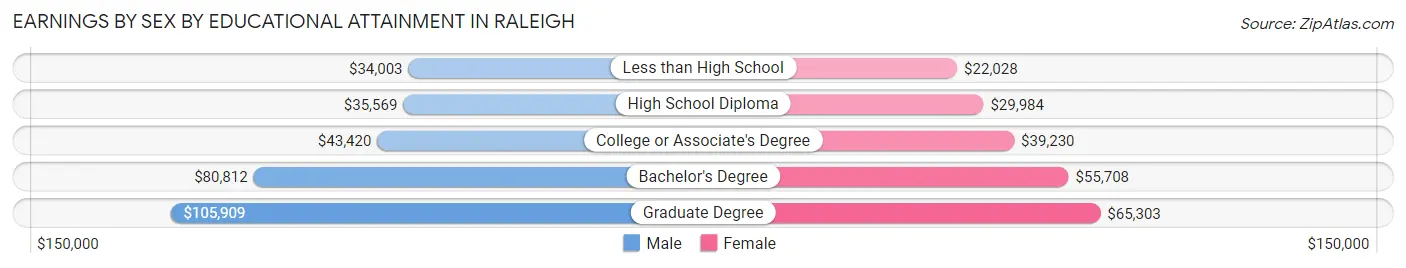
Earnings by Sex by Educational Attainment in Raleigh
Average earnings in Raleigh are $57,759 for men and $46,792 for women, a difference of 19.0%. Men with an educational attainment of graduate degree enjoy the highest average annual earnings of $105,909, while those with less than high school education earn the least with $34,003. Women with an educational attainment of graduate degree earn the most with the average annual earnings of $65,303, while those with less than high school education have the smallest earnings of $22,028.
| Educational Attainment | Male Income | Female Income |
| Less than High School | $34,003 | $22,028 |
| High School Diploma | $35,569 | $29,984 |
| College or Associate's Degree | $43,420 | $39,230 |
| Bachelor's Degree | $80,812 | $55,708 |
| Graduate Degree | $105,909 | $65,303 |
| Total | $57,759 | $46,792 |
Family Income in Raleigh
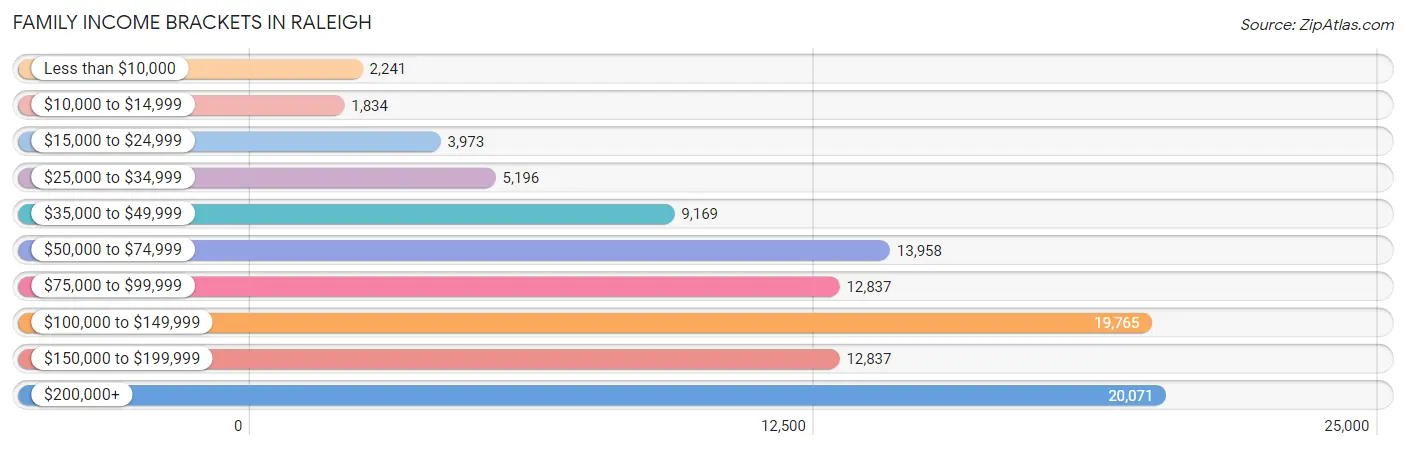
Family Income Brackets in Raleigh
According to the Raleigh family income data, there are 20,071 families falling into the $200,000+ income range, which is the most common income bracket and makes up 19.7% of all families. Conversely, the $10,000 to $14,999 income bracket is the least frequent group with only 1,834 families (1.8%) belonging to this category.
| Income Bracket | # Families | % Families |
| Less than $10,000 | 2,241 | 2.2% |
| $10,000 to $14,999 | 1,834 | 1.8% |
| $15,000 to $24,999 | 3,973 | 3.9% |
| $25,000 to $34,999 | 5,196 | 5.1% |
| $35,000 to $49,999 | 9,169 | 9.0% |
| $50,000 to $74,999 | 13,958 | 13.7% |
| $75,000 to $99,999 | 12,837 | 12.6% |
| $100,000 to $149,999 | 19,765 | 19.4% |
| $150,000 to $199,999 | 12,837 | 12.6% |
| $200,000+ | 20,071 | 19.7% |
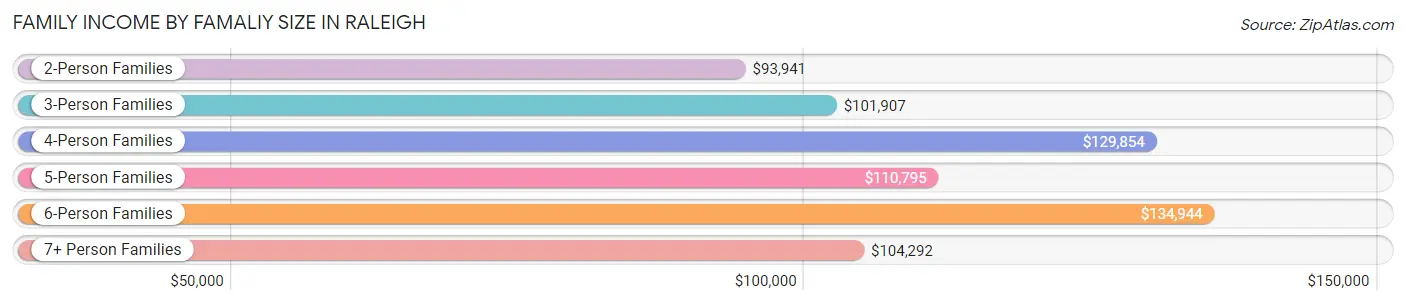
Family Income by Famaliy Size in Raleigh
6-person families (1,722 | 1.7%) account for the highest median family income in Raleigh with $134,944 per family, while 2-person families (48,128 | 47.2%) have the highest median income of $46,970 per family member.
| Income Bracket | # Families | Median Income |
| 2-Person Families | 48,128 (47.2%) | $93,941 |
| 3-Person Families | 23,463 (23.0%) | $101,907 |
| 4-Person Families | 20,441 (20.1%) | $129,854 |
| 5-Person Families | 7,185 (7.0%) | $110,795 |
| 6-Person Families | 1,722 (1.7%) | $134,944 |
| 7+ Person Families | 942 (0.9%) | $104,292 |
| Total | 101,881 (100.0%) | $103,882 |
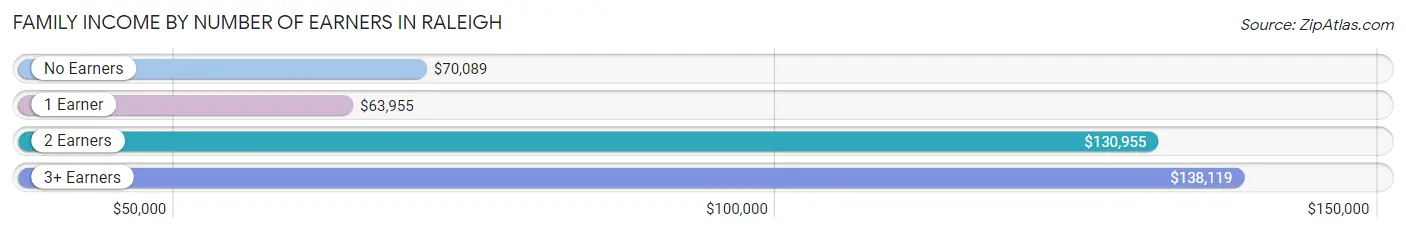
Family Income by Number of Earners in Raleigh
The median family income in Raleigh is $103,882, with families comprising 3+ earners (9,276) having the highest median family income of $138,119, while families with 1 earner (32,112) have the lowest median family income of $63,955, accounting for 9.1% and 31.5% of families, respectively.
| Number of Earners | # Families | Median Income |
| No Earners | 10,466 (10.3%) | $70,089 |
| 1 Earner | 32,112 (31.5%) | $63,955 |
| 2 Earners | 50,027 (49.1%) | $130,955 |
| 3+ Earners | 9,276 (9.1%) | $138,119 |
| Total | 101,881 (100.0%) | $103,882 |
Household Income in Raleigh
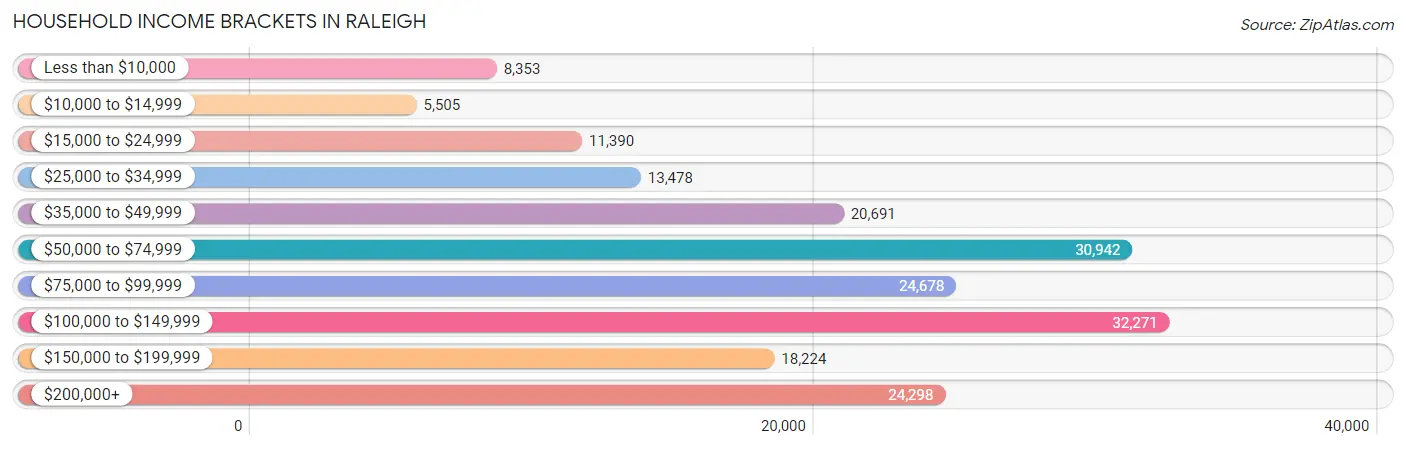
Household Income Brackets in Raleigh
With 32,271 households falling in the category, the $100,000 to $149,999 income range is the most frequent in Raleigh, accounting for 17.0% of all households. In contrast, only 5,505 households (2.9%) fall into the $10,000 to $14,999 income bracket, making it the least populous group.
| Income Bracket | # Households | % Households |
| Less than $10,000 | 8,353 | 4.4% |
| $10,000 to $14,999 | 5,505 | 2.9% |
| $15,000 to $24,999 | 11,390 | 6.0% |
| $25,000 to $34,999 | 13,478 | 7.1% |
| $35,000 to $49,999 | 20,691 | 10.9% |
| $50,000 to $74,999 | 30,942 | 16.3% |
| $75,000 to $99,999 | 24,678 | 13.0% |
| $100,000 to $149,999 | 32,271 | 17.0% |
| $150,000 to $199,999 | 18,224 | 9.6% |
| $200,000+ | 24,298 | 12.8% |
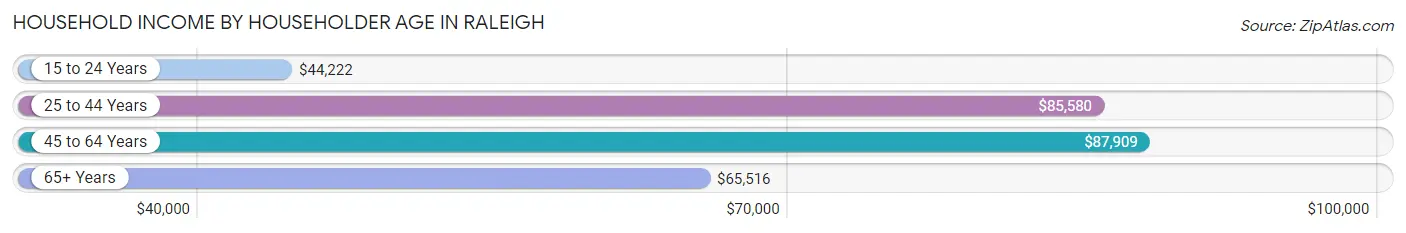
Household Income by Householder Age in Raleigh
The median household income in Raleigh is $78,631, with the highest median household income of $87,909 found in the 45 to 64 years age bracket for the primary householder. A total of 64,103 households (33.8%) fall into this category. Meanwhile, the 15 to 24 years age bracket for the primary householder has the lowest median household income of $44,222, with 11,571 households (6.1%) in this group.
| Income Bracket | # Households | Median Income |
| 15 to 24 Years | 11,571 (6.1%) | $44,222 |
| 25 to 44 Years | 79,972 (42.1%) | $85,580 |
| 45 to 64 Years | 64,103 (33.8%) | $87,909 |
| 65+ Years | 34,184 (18.0%) | $65,516 |
| Total | 189,830 (100.0%) | $78,631 |
Poverty in Raleigh
Income Below Poverty by Sex and Age in Raleigh
With 11.4% poverty level for males and 12.2% for females among the residents of Raleigh, 18 to 24 year old males and 18 to 24 year old females are the most vulnerable to poverty, with 6,013 males (27.9%) and 6,678 females (29.0%) in their respective age groups living below the poverty level.
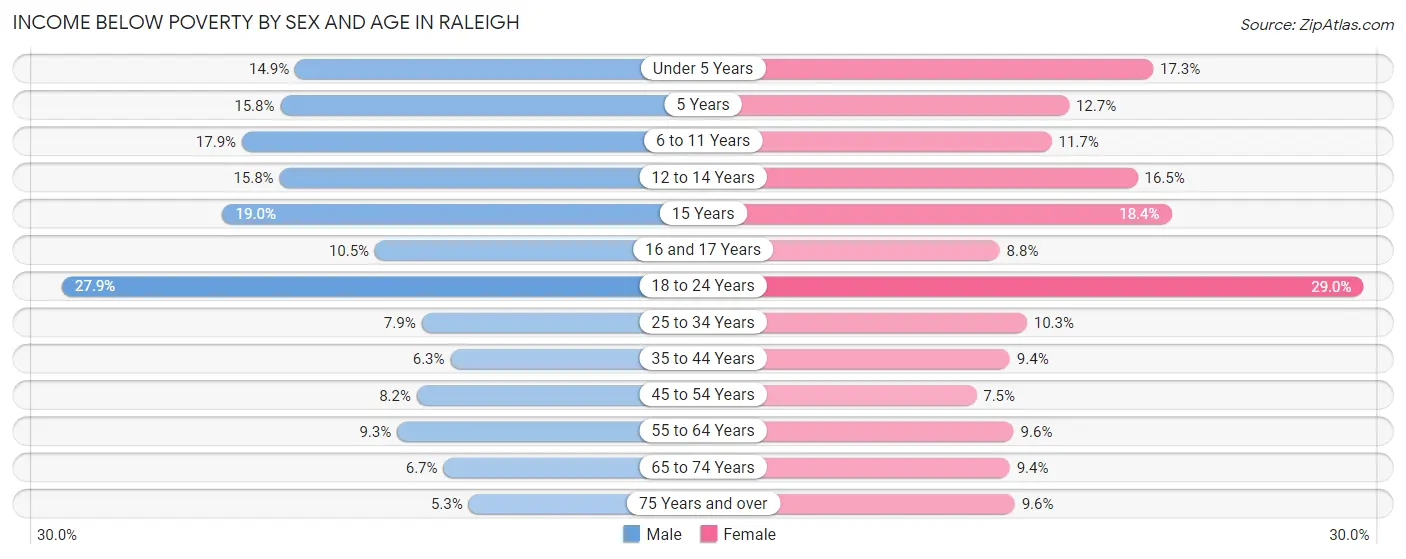
| Age Bracket | Male | Female |
| Under 5 Years | 1,953 (14.9%) | 2,103 (17.3%) |
| 5 Years | 431 (15.8%) | 321 (12.7%) |
| 6 to 11 Years | 2,923 (17.9%) | 1,646 (11.7%) |
| 12 to 14 Years | 1,312 (15.8%) | 1,167 (16.5%) |
| 15 Years | 470 (19.0%) | 398 (18.3%) |
| 16 and 17 Years | 591 (10.5%) | 462 (8.8%) |
| 18 to 24 Years | 6,013 (27.9%) | 6,678 (29.0%) |
| 25 to 34 Years | 3,361 (7.9%) | 4,364 (10.3%) |
| 35 to 44 Years | 2,034 (6.3%) | 3,148 (9.4%) |
| 45 to 54 Years | 2,374 (8.2%) | 2,262 (7.5%) |
| 55 to 64 Years | 2,080 (9.3%) | 2,457 (9.6%) |
| 65 to 74 Years | 930 (6.7%) | 1,670 (9.3%) |
| 75 Years and over | 405 (5.3%) | 1,199 (9.6%) |
| Total | 24,877 (11.4%) | 27,875 (12.2%) |
Income Above Poverty by Sex and Age in Raleigh
According to the poverty statistics in Raleigh, males aged 75 years and over and females aged 45 to 54 years are the age groups that are most secure financially, with 94.7% of males and 92.5% of females in these age groups living above the poverty line.
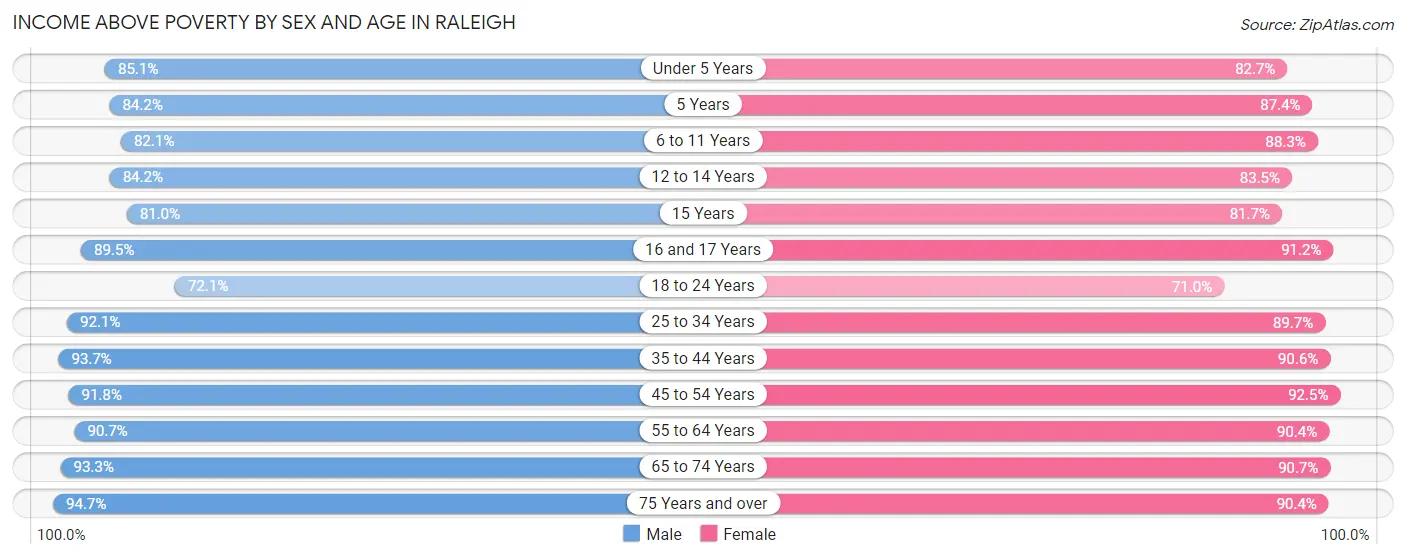
| Age Bracket | Male | Female |
| Under 5 Years | 11,119 (85.1%) | 10,032 (82.7%) |
| 5 Years | 2,304 (84.2%) | 2,216 (87.4%) |
| 6 to 11 Years | 13,403 (82.1%) | 12,442 (88.3%) |
| 12 to 14 Years | 6,988 (84.2%) | 5,917 (83.5%) |
| 15 Years | 2,007 (81.0%) | 1,771 (81.7%) |
| 16 and 17 Years | 5,041 (89.5%) | 4,793 (91.2%) |
| 18 to 24 Years | 15,521 (72.1%) | 16,315 (71.0%) |
| 25 to 34 Years | 39,198 (92.1%) | 38,005 (89.7%) |
| 35 to 44 Years | 30,300 (93.7%) | 30,480 (90.6%) |
| 45 to 54 Years | 26,723 (91.8%) | 27,955 (92.5%) |
| 55 to 64 Years | 20,380 (90.7%) | 23,220 (90.4%) |
| 65 to 74 Years | 12,993 (93.3%) | 16,194 (90.6%) |
| 75 Years and over | 7,263 (94.7%) | 11,251 (90.4%) |
| Total | 193,240 (88.6%) | 200,591 (87.8%) |
Income Below Poverty Among Married-Couple Families in Raleigh
The poverty statistics for married-couple families in Raleigh show that 2.9% or 2,134 of the total 72,228 families live below the poverty line. Families with 3 or 4 children have the highest poverty rate of 10.5%, comprising of 551 families. On the other hand, families with no children have the lowest poverty rate of 2.0%, which includes 798 families.
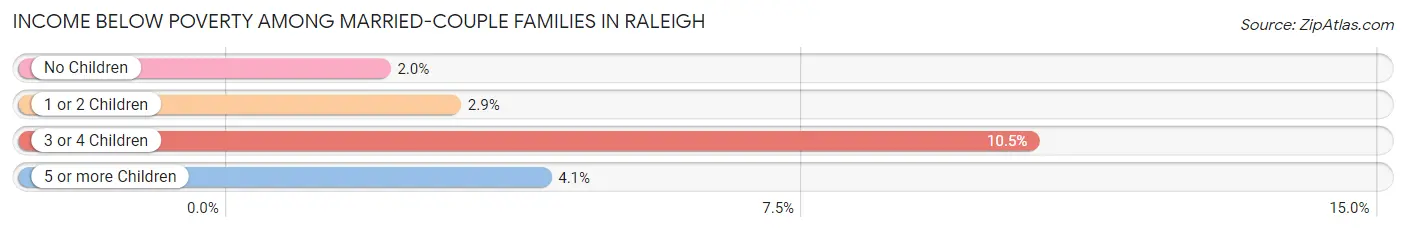
| Children | Above Poverty | Below Poverty |
| No Children | 39,354 (98.0%) | 798 (2.0%) |
| 1 or 2 Children | 25,720 (97.1%) | 772 (2.9%) |
| 3 or 4 Children | 4,715 (89.5%) | 551 (10.5%) |
| 5 or more Children | 305 (95.9%) | 13 (4.1%) |
| Total | 70,094 (97.1%) | 2,134 (2.9%) |
Income Below Poverty Among Single-Parent Households in Raleigh
According to the poverty data in Raleigh, 8.7% or 603 single-father households and 19.6% or 4,462 single-mother households are living below the poverty line. Among single-father households, those with 3 or 4 children have the highest poverty rate, with 343 households (45.0%) experiencing poverty. Likewise, among single-mother households, those with 5 or more children have the highest poverty rate, with 50 households (96.2%) falling below the poverty line.
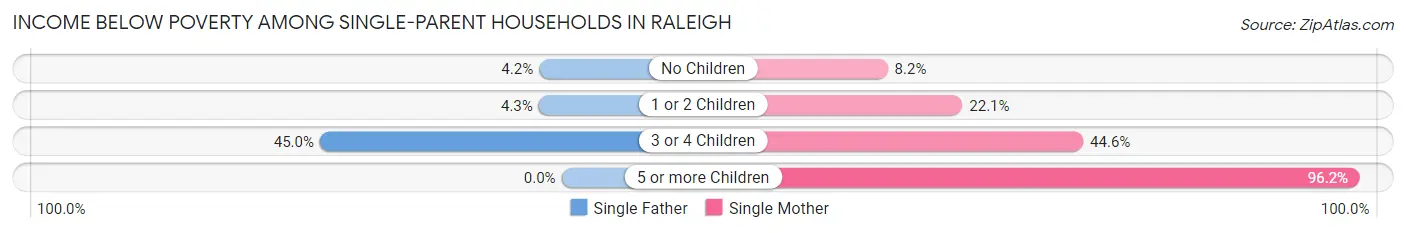
| Children | Single Father | Single Mother |
| No Children | 133 (4.2%) | 647 (8.2%) |
| 1 or 2 Children | 127 (4.3%) | 2,780 (22.1%) |
| 3 or 4 Children | 343 (45.0%) | 985 (44.6%) |
| 5 or more Children | 0 (0.0%) | 50 (96.2%) |
| Total | 603 (8.7%) | 4,462 (19.6%) |
Income Below Poverty Among Married-Couple vs Single-Parent Households in Raleigh
The poverty data for Raleigh shows that 2,134 of the married-couple family households (2.9%) and 5,065 of the single-parent households (17.1%) are living below the poverty level. Within the married-couple family households, those with 3 or 4 children have the highest poverty rate, with 551 households (10.5%) falling below the poverty line. Among the single-parent households, those with 5 or more children have the highest poverty rate, with 50 household (96.2%) living below poverty.
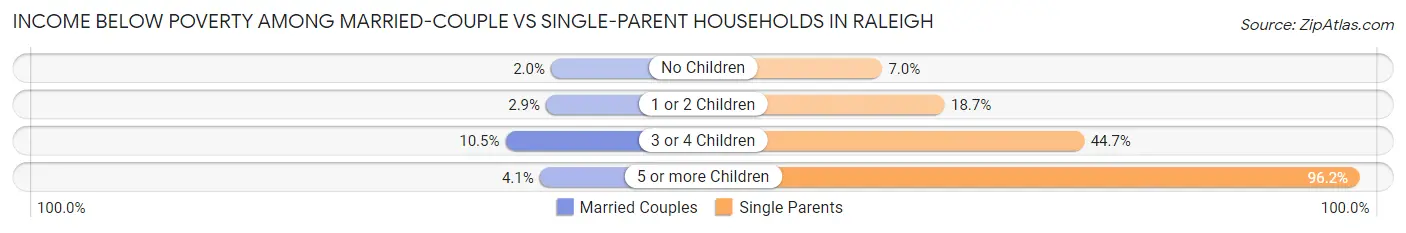
| Children | Married-Couple Families | Single-Parent Households |
| No Children | 798 (2.0%) | 780 (7.0%) |
| 1 or 2 Children | 772 (2.9%) | 2,907 (18.7%) |
| 3 or 4 Children | 551 (10.5%) | 1,328 (44.7%) |
| 5 or more Children | 13 (4.1%) | 50 (96.2%) |
| Total | 2,134 (2.9%) | 5,065 (17.1%) |
Race in Raleigh
The most populous races in Raleigh are White / Caucasian (258,136 | 55.4%), Black / African American (131,013 | 28.1%), and Hispanic or Latino (54,037 | 11.6%).
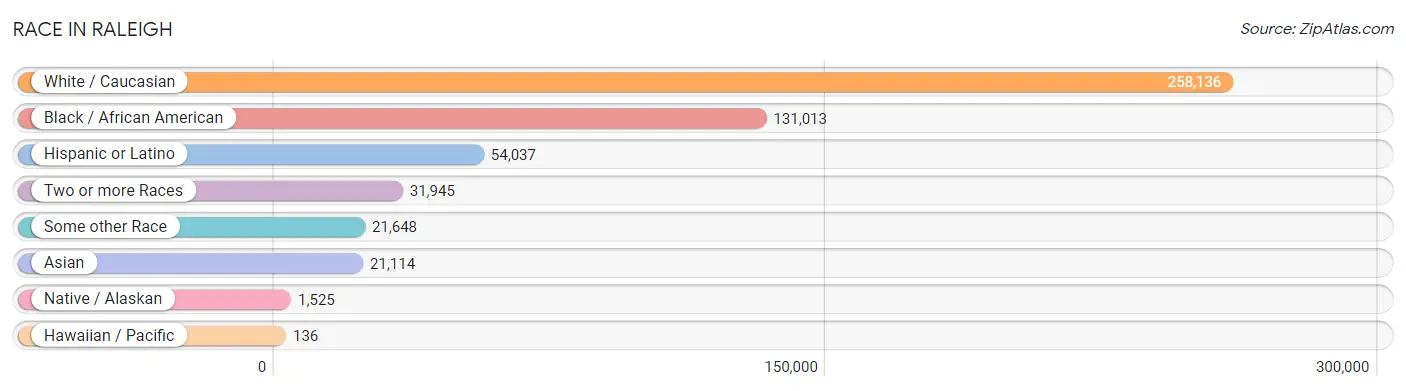
| Race | # Population | % Population |
| Asian | 21,114 | 4.5% |
| Black / African American | 131,013 | 28.1% |
| Hawaiian / Pacific | 136 | 0.0% |
| Hispanic or Latino | 54,037 | 11.6% |
| Native / Alaskan | 1,525 | 0.3% |
| White / Caucasian | 258,136 | 55.4% |
| Two or more Races | 31,945 | 6.9% |
| Some other Race | 21,648 | 4.6% |
| Total | 465,517 | 100.0% |
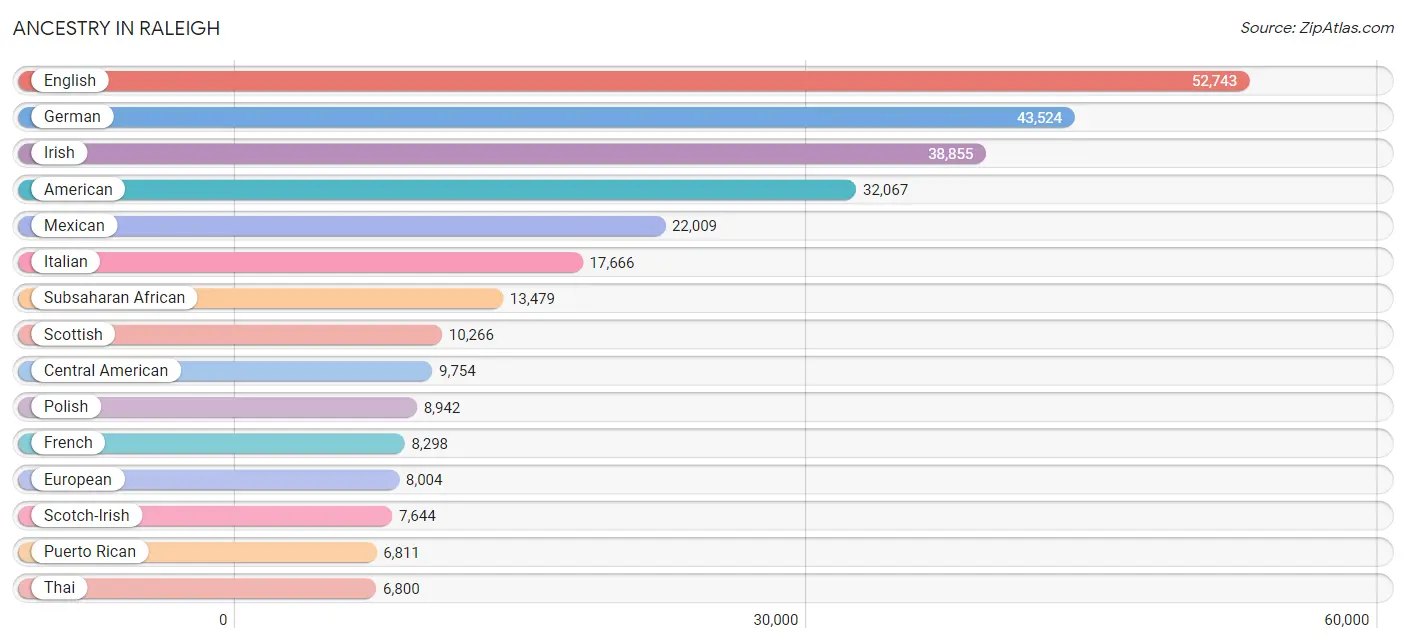
Ancestry in Raleigh
The most populous ancestries reported in Raleigh are English (52,743 | 11.3%), German (43,524 | 9.3%), Irish (38,855 | 8.4%), American (32,067 | 6.9%), and Mexican (22,009 | 4.7%), together accounting for 40.7% of all Raleigh residents.
| Ancestry | # Population | % Population |
| Afghan | 333 | 0.1% |
| African | 5,989 | 1.3% |
| Alaskan Athabascan | 16 | 0.0% |
| Albanian | 64 | 0.0% |
| Aleut | 49 | 0.0% |
| American | 32,067 | 6.9% |
| Apache | 77 | 0.0% |
| Arab | 5,776 | 1.2% |
| Argentinean | 287 | 0.1% |
| Armenian | 116 | 0.0% |
| Australian | 65 | 0.0% |
| Austrian | 768 | 0.2% |
| Bahamian | 53 | 0.0% |
| Bangladeshi | 196 | 0.0% |
| Barbadian | 47 | 0.0% |
| Basque | 41 | 0.0% |
| Belgian | 473 | 0.1% |
| Belizean | 212 | 0.1% |
| Bermudan | 103 | 0.0% |
| Bhutanese | 792 | 0.2% |
| Blackfeet | 318 | 0.1% |
| Bolivian | 33 | 0.0% |
| Brazilian | 614 | 0.1% |
| British | 3,887 | 0.8% |
| British West Indian | 150 | 0.0% |
| Bulgarian | 326 | 0.1% |
| Burmese | 2,158 | 0.5% |
| Cajun | 63 | 0.0% |
| Cambodian | 12 | 0.0% |
| Canadian | 1,055 | 0.2% |
| Cape Verdean | 163 | 0.0% |
| Carpatho Rusyn | 24 | 0.0% |
| Celtic | 66 | 0.0% |
| Central American | 9,754 | 2.1% |
| Central American Indian | 352 | 0.1% |
| Cherokee | 1,704 | 0.4% |
| Chickasaw | 1 | 0.0% |
| Chilean | 140 | 0.0% |
| Chippewa | 74 | 0.0% |
| Choctaw | 81 | 0.0% |
| Colombian | 1,369 | 0.3% |
| Costa Rican | 77 | 0.0% |
| Creek | 255 | 0.1% |
| Croatian | 324 | 0.1% |
| Cuban | 2,238 | 0.5% |
| Cypriot | 8 | 0.0% |
| Czech | 1,136 | 0.2% |
| Czechoslovakian | 169 | 0.0% |
| Danish | 942 | 0.2% |
| Delaware | 16 | 0.0% |
| Dominican | 4,787 | 1.0% |
| Dutch | 4,017 | 0.9% |
| Eastern European | 1,338 | 0.3% |
| Ecuadorian | 451 | 0.1% |
| Egyptian | 1,727 | 0.4% |
| English | 52,743 | 11.3% |
| Estonian | 37 | 0.0% |
| Ethiopian | 903 | 0.2% |
| European | 8,004 | 1.7% |
| Filipino | 288 | 0.1% |
| Finnish | 305 | 0.1% |
| French | 8,298 | 1.8% |
| French Canadian | 1,691 | 0.4% |
| German | 43,524 | 9.3% |
| Ghanaian | 211 | 0.1% |
| Greek | 1,589 | 0.3% |
| Guamanian / Chamorro | 160 | 0.0% |
| Guatemalan | 1,538 | 0.3% |
| Guyanese | 107 | 0.0% |
| Haitian | 708 | 0.2% |
| Honduran | 2,236 | 0.5% |
| Hungarian | 2,040 | 0.4% |
| Icelander | 46 | 0.0% |
| Indian (Asian) | 3,842 | 0.8% |
| Indonesian | 398 | 0.1% |
| Inupiat | 19 | 0.0% |
| Iranian | 1,418 | 0.3% |
| Iraqi | 284 | 0.1% |
| Irish | 38,855 | 8.4% |
| Iroquois | 126 | 0.0% |
| Israeli | 242 | 0.1% |
| Italian | 17,666 | 3.8% |
| Jamaican | 1,137 | 0.2% |
| Japanese | 25 | 0.0% |
| Jordanian | 96 | 0.0% |
| Kenyan | 719 | 0.2% |
| Korean | 3,988 | 0.9% |
| Laotian | 28 | 0.0% |
| Latvian | 115 | 0.0% |
| Lebanese | 1,266 | 0.3% |
| Liberian | 87 | 0.0% |
| Lithuanian | 964 | 0.2% |
| Lumbee | 239 | 0.1% |
| Luxembourger | 48 | 0.0% |
| Macedonian | 55 | 0.0% |
| Malaysian | 73 | 0.0% |
| Maltese | 14 | 0.0% |
| Mexican | 22,009 | 4.7% |
| Mexican American Indian | 402 | 0.1% |
| Mongolian | 79 | 0.0% |
| Moroccan | 844 | 0.2% |
| Native Hawaiian | 240 | 0.1% |
| Navajo | 8 | 0.0% |
| New Zealander | 19 | 0.0% |
| Nicaraguan | 215 | 0.1% |
| Nigerian | 3,017 | 0.6% |
| Northern European | 642 | 0.1% |
| Norwegian | 2,658 | 0.6% |
| Okinawan | 9 | 0.0% |
| Pakistani | 166 | 0.0% |
| Palestinian | 466 | 0.1% |
| Panamanian | 419 | 0.1% |
| Paraguayan | 57 | 0.0% |
| Pennsylvania German | 46 | 0.0% |
| Peruvian | 619 | 0.1% |
| Polish | 8,942 | 1.9% |
| Portuguese | 1,792 | 0.4% |
| Potawatomi | 25 | 0.0% |
| Puerto Rican | 6,811 | 1.5% |
| Romanian | 682 | 0.2% |
| Russian | 3,047 | 0.6% |
| Salvadoran | 5,059 | 1.1% |
| Samoan | 79 | 0.0% |
| Scandinavian | 1,148 | 0.3% |
| Scotch-Irish | 7,644 | 1.6% |
| Scottish | 10,266 | 2.2% |
| Seminole | 8 | 0.0% |
| Senegalese | 283 | 0.1% |
| Serbian | 199 | 0.0% |
| Sierra Leonean | 126 | 0.0% |
| Sioux | 42 | 0.0% |
| Slavic | 181 | 0.0% |
| Slovak | 715 | 0.2% |
| Slovene | 274 | 0.1% |
| Somali | 17 | 0.0% |
| South African | 103 | 0.0% |
| South American | 4,398 | 0.9% |
| South American Indian | 159 | 0.0% |
| Spaniard | 870 | 0.2% |
| Spanish | 306 | 0.1% |
| Spanish American | 26 | 0.0% |
| Sri Lankan | 4,374 | 0.9% |
| Subsaharan African | 13,479 | 2.9% |
| Sudanese | 68 | 0.0% |
| Swedish | 2,563 | 0.5% |
| Swiss | 702 | 0.2% |
| Syrian | 209 | 0.0% |
| Thai | 6,800 | 1.5% |
| Tlingit-Haida | 7 | 0.0% |
| Trinidadian and Tobagonian | 220 | 0.1% |
| Turkish | 556 | 0.1% |
| U.S. Virgin Islander | 46 | 0.0% |
| Ugandan | 39 | 0.0% |
| Ukrainian | 1,464 | 0.3% |
| Uruguayan | 94 | 0.0% |
| Venezuelan | 1,306 | 0.3% |
| Vietnamese | 235 | 0.1% |
| Welsh | 2,404 | 0.5% |
| West Indian | 503 | 0.1% |
| Yaqui | 36 | 0.0% |
| Yugoslavian | 79 | 0.0% | View All 161 Rows |
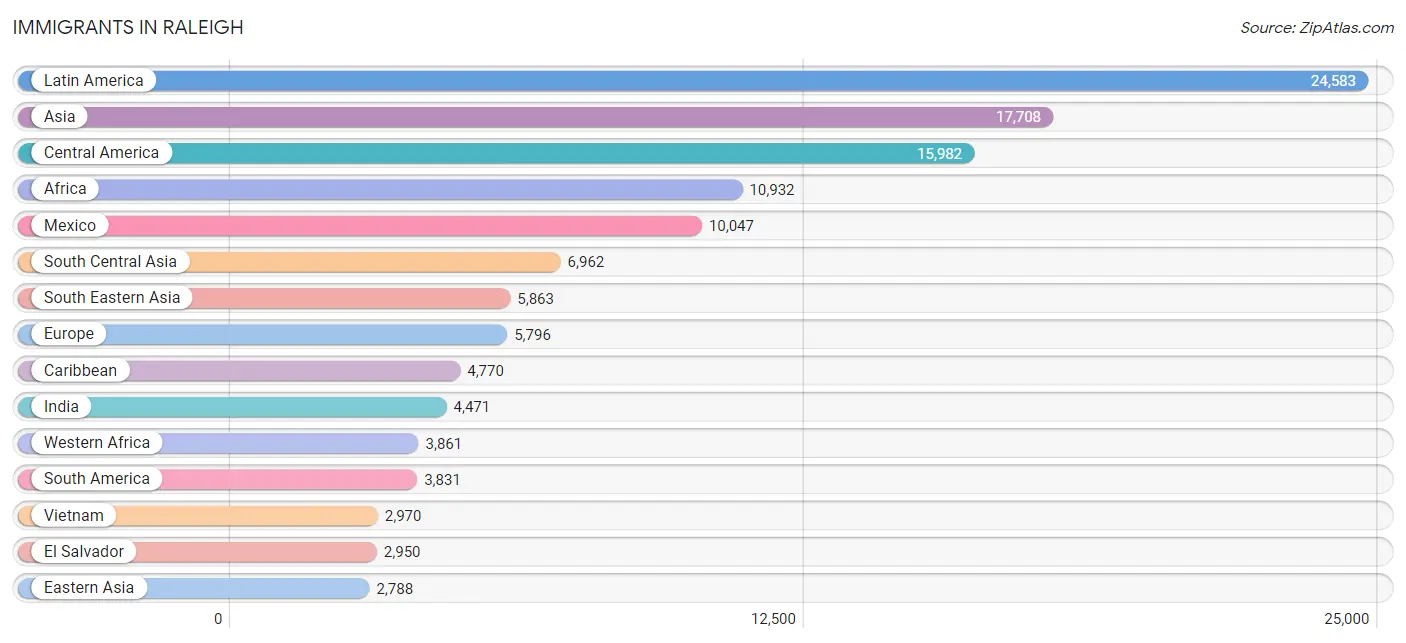
Immigrants in Raleigh
The most numerous immigrant groups reported in Raleigh came from Latin America (24,583 | 5.3%), Asia (17,708 | 3.8%), Central America (15,982 | 3.4%), Africa (10,932 | 2.4%), and Mexico (10,047 | 2.2%), together accounting for 17.0% of all Raleigh residents.
| Immigration Origin | # Population | % Population |
| Afghanistan | 288 | 0.1% |
| Africa | 10,932 | 2.4% |
| Albania | 5 | 0.0% |
| Argentina | 227 | 0.1% |
| Asia | 17,708 | 3.8% |
| Australia | 179 | 0.0% |
| Austria | 44 | 0.0% |
| Bahamas | 195 | 0.0% |
| Bangladesh | 337 | 0.1% |
| Belarus | 58 | 0.0% |
| Belgium | 130 | 0.0% |
| Belize | 108 | 0.0% |
| Bolivia | 83 | 0.0% |
| Bosnia and Herzegovina | 16 | 0.0% |
| Brazil | 511 | 0.1% |
| Bulgaria | 82 | 0.0% |
| Canada | 1,086 | 0.2% |
| Caribbean | 4,770 | 1.0% |
| Central America | 15,982 | 3.4% |
| Chile | 98 | 0.0% |
| China | 1,814 | 0.4% |
| Colombia | 861 | 0.2% |
| Congo | 980 | 0.2% |
| Costa Rica | 24 | 0.0% |
| Croatia | 99 | 0.0% |
| Cuba | 532 | 0.1% |
| Czechoslovakia | 142 | 0.0% |
| Denmark | 40 | 0.0% |
| Dominica | 339 | 0.1% |
| Dominican Republic | 1,964 | 0.4% |
| Eastern Africa | 2,744 | 0.6% |
| Eastern Asia | 2,788 | 0.6% |
| Eastern Europe | 2,535 | 0.5% |
| Ecuador | 136 | 0.0% |
| Egypt | 1,082 | 0.2% |
| El Salvador | 2,950 | 0.6% |
| England | 435 | 0.1% |
| Eritrea | 308 | 0.1% |
| Ethiopia | 529 | 0.1% |
| Europe | 5,796 | 1.3% |
| Fiji | 14 | 0.0% |
| France | 557 | 0.1% |
| Germany | 625 | 0.1% |
| Ghana | 262 | 0.1% |
| Greece | 90 | 0.0% |
| Grenada | 529 | 0.1% |
| Guatemala | 683 | 0.2% |
| Guyana | 55 | 0.0% |
| Haiti | 277 | 0.1% |
| Honduras | 1,837 | 0.4% |
| Hong Kong | 18 | 0.0% |
| Hungary | 119 | 0.0% |
| India | 4,471 | 1.0% |
| Indonesia | 36 | 0.0% |
| Iran | 948 | 0.2% |
| Iraq | 418 | 0.1% |
| Ireland | 94 | 0.0% |
| Israel | 132 | 0.0% |
| Italy | 174 | 0.0% |
| Jamaica | 371 | 0.1% |
| Japan | 204 | 0.0% |
| Jordan | 205 | 0.0% |
| Kazakhstan | 53 | 0.0% |
| Kenya | 1,279 | 0.3% |
| Korea | 770 | 0.2% |
| Kuwait | 37 | 0.0% |
| Laos | 64 | 0.0% |
| Latin America | 24,583 | 5.3% |
| Latvia | 33 | 0.0% |
| Lebanon | 208 | 0.0% |
| Liberia | 102 | 0.0% |
| Lithuania | 11 | 0.0% |
| Malaysia | 353 | 0.1% |
| Mexico | 10,047 | 2.2% |
| Middle Africa | 1,782 | 0.4% |
| Moldova | 32 | 0.0% |
| Morocco | 603 | 0.1% |
| Nepal | 123 | 0.0% |
| Netherlands | 126 | 0.0% |
| Nicaragua | 96 | 0.0% |
| Nigeria | 2,320 | 0.5% |
| Northern Africa | 1,778 | 0.4% |
| Northern Europe | 1,272 | 0.3% |
| Norway | 36 | 0.0% |
| Oceania | 239 | 0.1% |
| Pakistan | 652 | 0.1% |
| Panama | 237 | 0.1% |
| Peru | 461 | 0.1% |
| Philippines | 2,163 | 0.5% |
| Poland | 359 | 0.1% |
| Portugal | 32 | 0.0% |
| Romania | 327 | 0.1% |
| Russia | 503 | 0.1% |
| Saudi Arabia | 55 | 0.0% |
| Scotland | 50 | 0.0% |
| Senegal | 282 | 0.1% |
| Serbia | 42 | 0.0% |
| Sierra Leone | 97 | 0.0% |
| Singapore | 20 | 0.0% |
| South Africa | 190 | 0.0% |
| South America | 3,831 | 0.8% |
| South Central Asia | 6,962 | 1.5% |
| South Eastern Asia | 5,863 | 1.3% |
| Southern Europe | 495 | 0.1% |
| Spain | 199 | 0.0% |
| Sri Lanka | 65 | 0.0% |
| St. Vincent and the Grenadines | 22 | 0.0% |
| Sudan | 40 | 0.0% |
| Sweden | 106 | 0.0% |
| Syria | 303 | 0.1% |
| Taiwan | 260 | 0.1% |
| Thailand | 78 | 0.0% |
| Trinidad and Tobago | 428 | 0.1% |
| Turkey | 274 | 0.1% |
| Uganda | 55 | 0.0% |
| Ukraine | 369 | 0.1% |
| Uruguay | 104 | 0.0% |
| Uzbekistan | 25 | 0.0% |
| Venezuela | 1,295 | 0.3% |
| Vietnam | 2,970 | 0.6% |
| West Indies | 52 | 0.0% |
| Western Africa | 3,861 | 0.8% |
| Western Asia | 2,014 | 0.4% |
| Western Europe | 1,482 | 0.3% |
| Yemen | 224 | 0.1% |
| Zaire | 647 | 0.1% |
| Zimbabwe | 150 | 0.0% | View All 127 Rows |
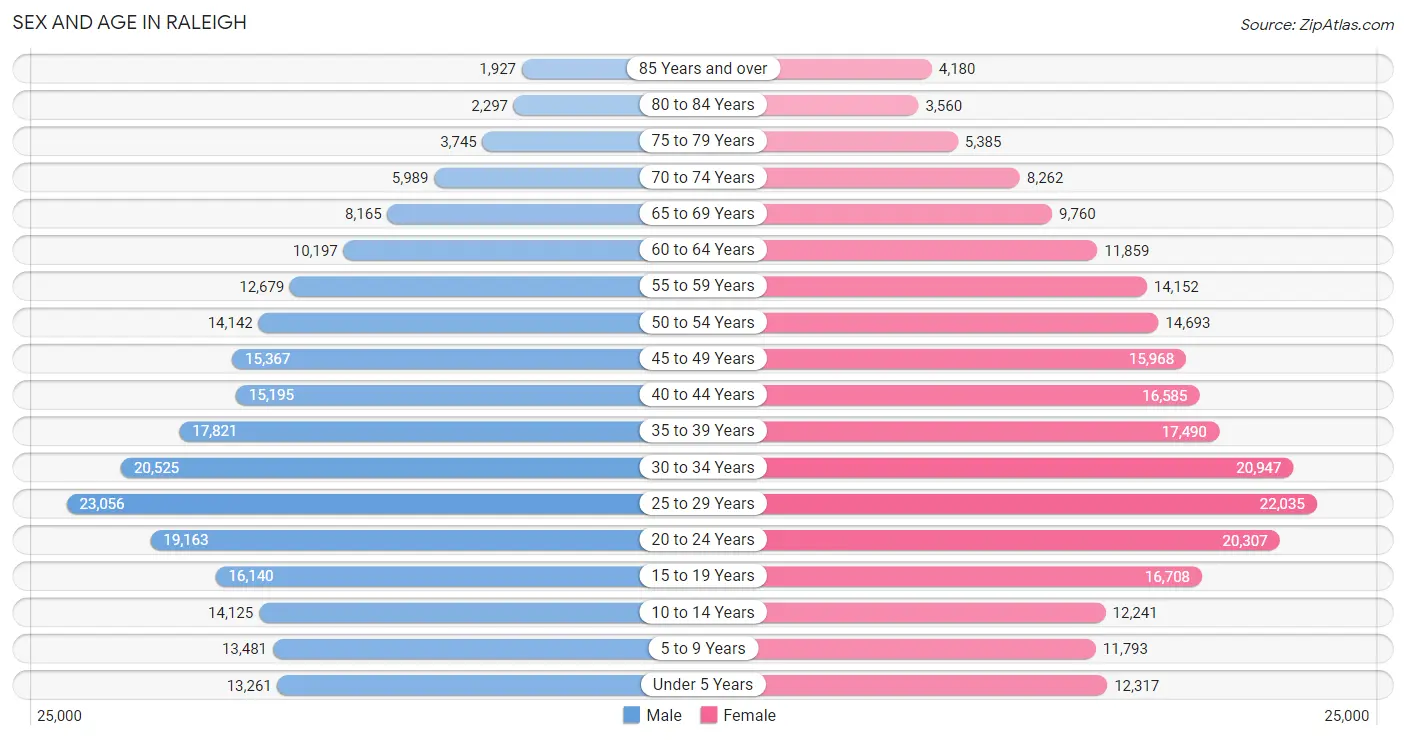
Sex and Age in Raleigh
Sex and Age in Raleigh
The most populous age groups in Raleigh are 25 to 29 Years (23,056 | 10.1%) for men and 25 to 29 Years (22,035 | 9.2%) for women.
| Age Bracket | Male | Female |
| Under 5 Years | 13,261 (5.8%) | 12,317 (5.2%) |
| 5 to 9 Years | 13,481 (5.9%) | 11,793 (5.0%) |
| 10 to 14 Years | 14,125 (6.2%) | 12,241 (5.1%) |
| 15 to 19 Years | 16,140 (7.1%) | 16,708 (7.0%) |
| 20 to 24 Years | 19,163 (8.4%) | 20,307 (8.5%) |
| 25 to 29 Years | 23,056 (10.1%) | 22,035 (9.2%) |
| 30 to 34 Years | 20,525 (9.0%) | 20,947 (8.8%) |
| 35 to 39 Years | 17,821 (7.8%) | 17,490 (7.3%) |
| 40 to 44 Years | 15,195 (6.7%) | 16,585 (7.0%) |
| 45 to 49 Years | 15,367 (6.8%) | 15,968 (6.7%) |
| 50 to 54 Years | 14,142 (6.2%) | 14,693 (6.2%) |
| 55 to 59 Years | 12,679 (5.6%) | 14,152 (5.9%) |
| 60 to 64 Years | 10,197 (4.5%) | 11,859 (5.0%) |
| 65 to 69 Years | 8,165 (3.6%) | 9,760 (4.1%) |
| 70 to 74 Years | 5,989 (2.6%) | 8,262 (3.5%) |
| 75 to 79 Years | 3,745 (1.7%) | 5,385 (2.3%) |
| 80 to 84 Years | 2,297 (1.0%) | 3,560 (1.5%) |
| 85 Years and over | 1,927 (0.9%) | 4,180 (1.8%) |
| Total | 227,275 (100.0%) | 238,242 (100.0%) |
Families and Households in Raleigh
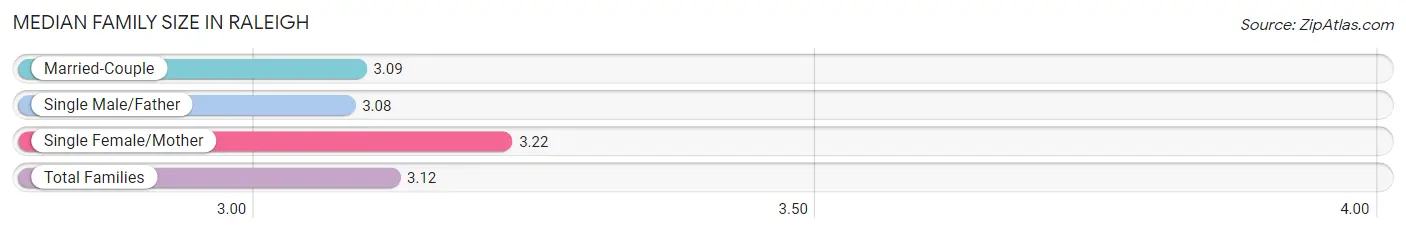
Median Family Size in Raleigh
The median family size in Raleigh is 3.12 persons per family, with single female/mother families (22,735 | 22.3%) accounting for the largest median family size of 3.22 persons per family. On the other hand, single male/father families (6,918 | 6.8%) represent the smallest median family size with 3.08 persons per family.
| Family Type | # Families | Family Size |
| Married-Couple | 72,228 (70.9%) | 3.09 |
| Single Male/Father | 6,918 (6.8%) | 3.08 |
| Single Female/Mother | 22,735 (22.3%) | 3.22 |
| Total Families | 101,881 (100.0%) | 3.12 |
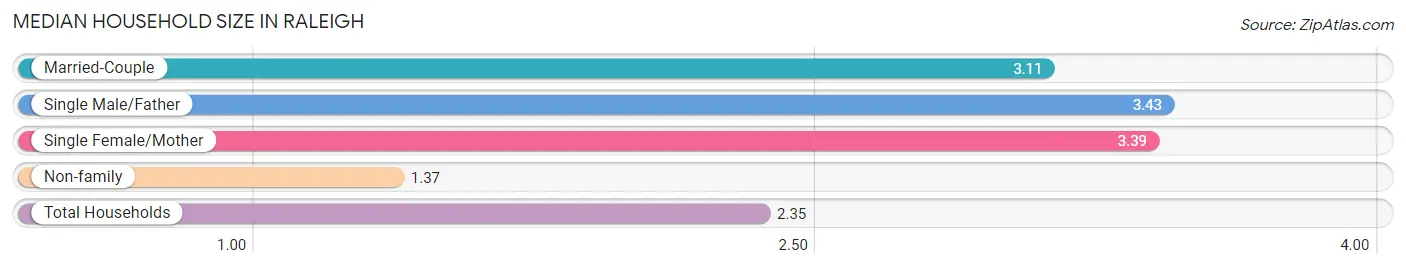
Median Household Size in Raleigh
The median household size in Raleigh is 2.35 persons per household, with single male/father households (6,918 | 3.6%) accounting for the largest median household size of 3.43 persons per household. non-family households (87,949 | 46.3%) represent the smallest median household size with 1.37 persons per household.
| Household Type | # Households | Household Size |
| Married-Couple | 72,228 (38.1%) | 3.11 |
| Single Male/Father | 6,918 (3.6%) | 3.43 |
| Single Female/Mother | 22,735 (12.0%) | 3.39 |
| Non-family | 87,949 (46.3%) | 1.37 |
| Total Households | 189,830 (100.0%) | 2.35 |
Household Size by Marriage Status in Raleigh
Out of a total of 189,830 households in Raleigh, 101,881 (53.7%) are family households, while 87,949 (46.3%) are nonfamily households. The most numerous type of family households are 2-person households, comprising 45,107, and the most common type of nonfamily households are 1-person households, comprising 66,563.
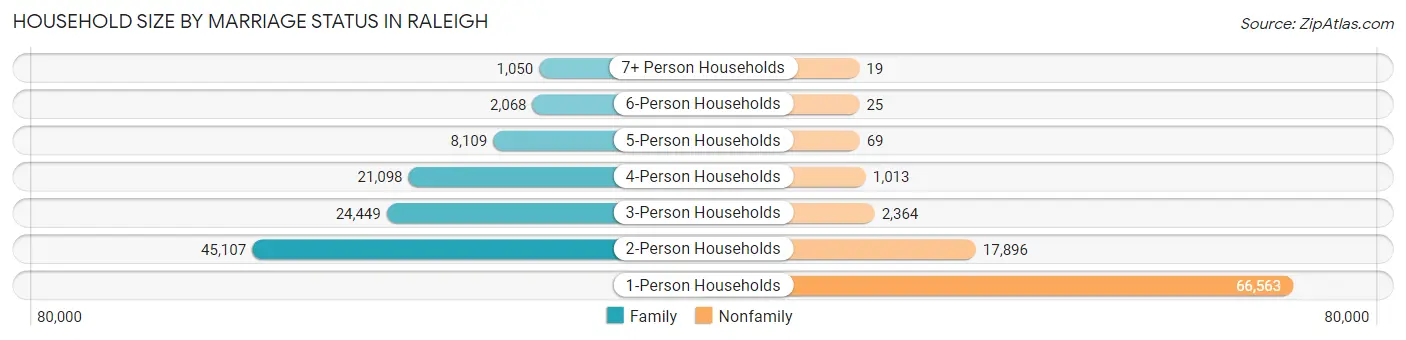
| Household Size | Family Households | Nonfamily Households |
| 1-Person Households | - | 66,563 (35.1%) |
| 2-Person Households | 45,107 (23.8%) | 17,896 (9.4%) |
| 3-Person Households | 24,449 (12.9%) | 2,364 (1.3%) |
| 4-Person Households | 21,098 (11.1%) | 1,013 (0.5%) |
| 5-Person Households | 8,109 (4.3%) | 69 (0.0%) |
| 6-Person Households | 2,068 (1.1%) | 25 (0.0%) |
| 7+ Person Households | 1,050 (0.5%) | 19 (0.0%) |
| Total | 101,881 (53.7%) | 87,949 (46.3%) |
Female Fertility in Raleigh
Fertility by Age in Raleigh
Average fertility rate in Raleigh is 45.0 births per 1,000 women. Women in the age bracket of 20 to 34 years have the highest fertility rate with 74.0 births per 1,000 women. Women in the age bracket of 20 to 34 years acount for 77.9% of all women with births.
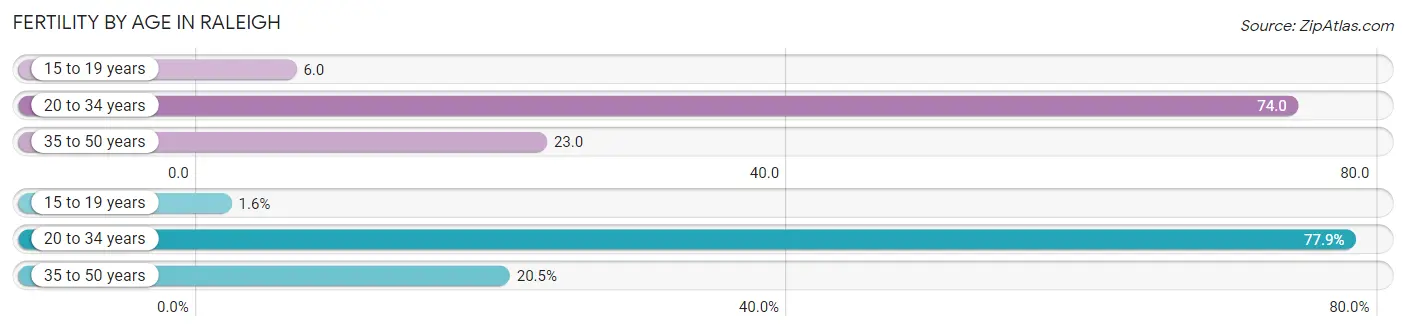
| Age Bracket | Women with Births | Births / 1,000 Women |
| 15 to 19 years | 96 (1.6%) | 6.0 |
| 20 to 34 years | 4,684 (77.9%) | 74.0 |
| 35 to 50 years | 1,231 (20.5%) | 23.0 |
| Total | 6,011 (100.0%) | 45.0 |
Fertility by Age by Marriage Status in Raleigh
68.6% of women with births (6,011) in Raleigh are married. The highest percentage of unmarried women with births falls into 15 to 19 years age bracket with 100.0% of them unmarried at the time of birth, while the lowest percentage of unmarried women with births belong to 35 to 50 years age bracket with 13.9% of them unmarried.
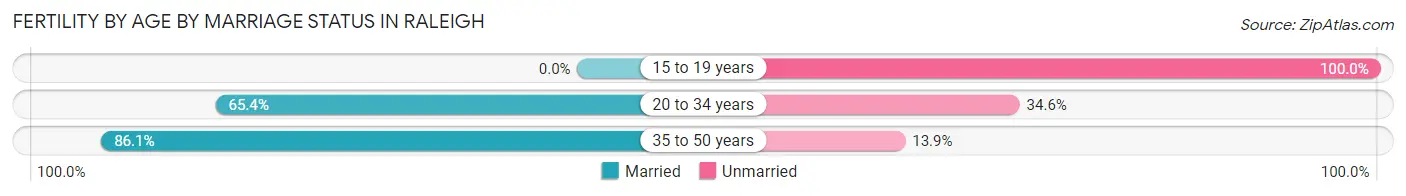
| Age Bracket | Married | Unmarried |
| 15 to 19 years | 0 (0.0%) | 96 (100.0%) |
| 20 to 34 years | 3,063 (65.4%) | 1,621 (34.6%) |
| 35 to 50 years | 1,060 (86.1%) | 171 (13.9%) |
| Total | 4,124 (68.6%) | 1,887 (31.4%) |
Fertility by Education in Raleigh
Average fertility rate in Raleigh is 45.0 births per 1,000 women. Women with the education attainment of graduate degree have the highest fertility rate of 53.0 births per 1,000 women, while women with the education attainment of less than high school have the lowest fertility at 36.0 births per 1,000 women. Women with the education attainment of bachelor's degree represent 30.9% of all women with births.
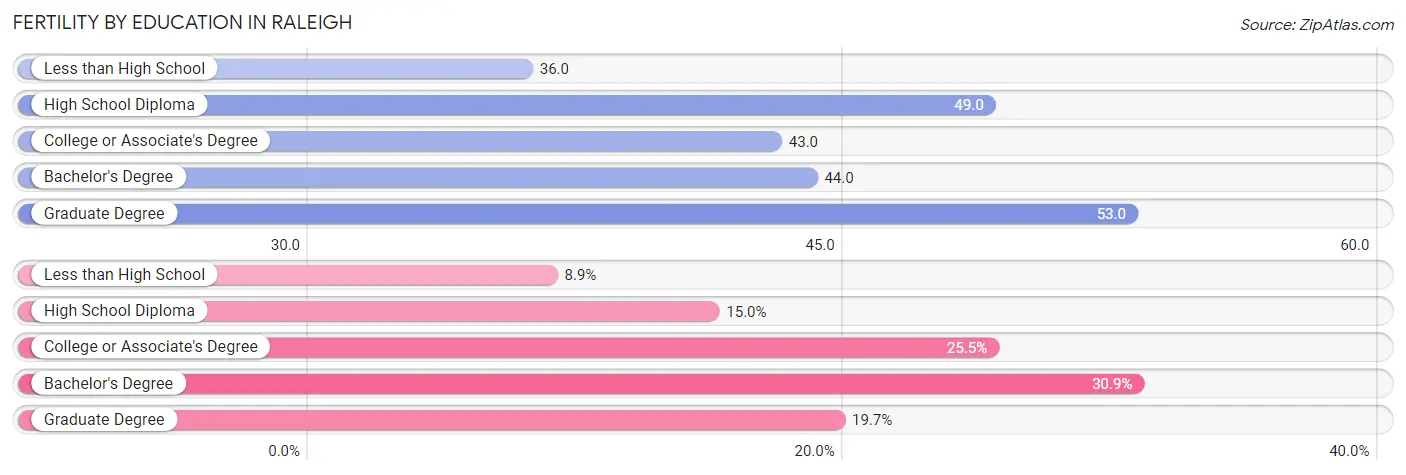
| Educational Attainment | Women with Births | Births / 1,000 Women |
| Less than High School | 537 (8.9%) | 36.0 |
| High School Diploma | 901 (15.0%) | 49.0 |
| College or Associate's Degree | 1,531 (25.5%) | 43.0 |
| Bachelor's Degree | 1,858 (30.9%) | 44.0 |
| Graduate Degree | 1,184 (19.7%) | 53.0 |
| Total | 6,011 (100.0%) | 45.0 |
Fertility by Education by Marriage Status in Raleigh
31.4% of women with births in Raleigh are unmarried. Women with the educational attainment of graduate degree are most likely to be married with 95.4% of them married at childbirth, while women with the educational attainment of high school diploma are least likely to be married with 65.4% of them unmarried at childbirth.
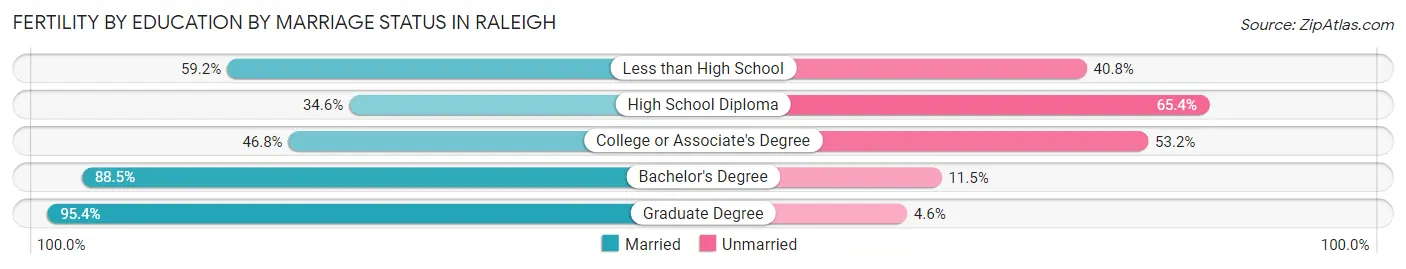
| Educational Attainment | Married | Unmarried |
| Less than High School | 318 (59.2%) | 219 (40.8%) |
| High School Diploma | 312 (34.6%) | 589 (65.4%) |
| College or Associate's Degree | 717 (46.8%) | 814 (53.2%) |
| Bachelor's Degree | 1,644 (88.5%) | 214 (11.5%) |
| Graduate Degree | 1,130 (95.4%) | 54 (4.6%) |
| Total | 4,124 (68.6%) | 1,887 (31.4%) |
Employment Characteristics in Raleigh
Employment by Class of Employer in Raleigh
Among the 250,982 employed individuals in Raleigh, private company employees (177,292 | 70.6%), not-for-profit organizations (20,453 | 8.2%), and state government employees (19,077 | 7.6%) make up the most common classes of employment.
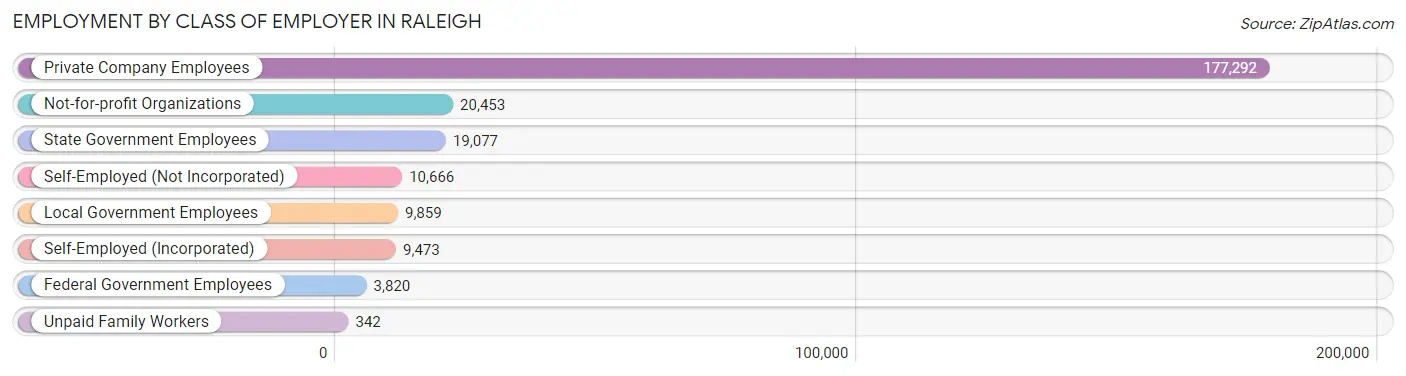
| Employer Class | # Employees | % Employees |
| Private Company Employees | 177,292 | 70.6% |
| Self-Employed (Incorporated) | 9,473 | 3.8% |
| Self-Employed (Not Incorporated) | 10,666 | 4.3% |
| Not-for-profit Organizations | 20,453 | 8.2% |
| Local Government Employees | 9,859 | 3.9% |
| State Government Employees | 19,077 | 7.6% |
| Federal Government Employees | 3,820 | 1.5% |
| Unpaid Family Workers | 342 | 0.1% |
| Total | 250,982 | 100.0% |
Employment Status by Age in Raleigh
According to the labor force statistics for Raleigh, out of the total population over 16 years of age (383,650), 69.8% or 267,788 individuals are in the labor force, with 4.5% or 12,050 of them unemployed. The age group with the highest labor force participation rate is 25 to 29 years, with 89.0% or 40,131 individuals in the labor force. Within the labor force, the 16 to 19 years age range has the highest percentage of unemployed individuals, with 15.9% or 1,291 of them being unemployed.
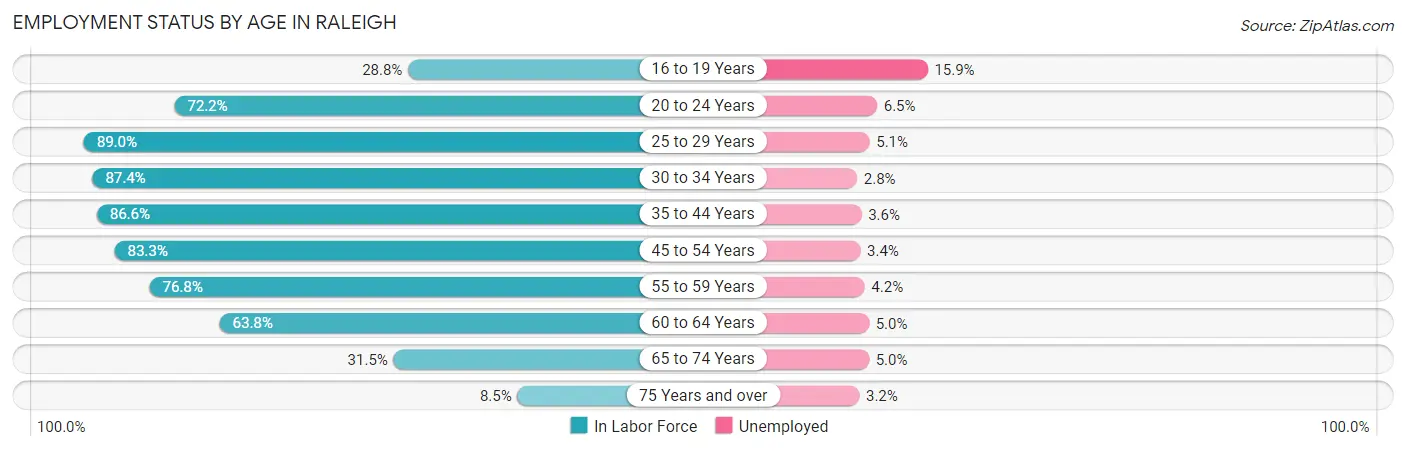
| Age Bracket | In Labor Force | Unemployed |
| 16 to 19 Years | 8,121 (28.8%) | 1,291 (15.9%) |
| 20 to 24 Years | 28,497 (72.2%) | 1,852 (6.5%) |
| 25 to 29 Years | 40,131 (89.0%) | 2,047 (5.1%) |
| 30 to 34 Years | 36,247 (87.4%) | 1,015 (2.8%) |
| 35 to 44 Years | 58,101 (86.6%) | 2,092 (3.6%) |
| 45 to 54 Years | 50,122 (83.3%) | 1,704 (3.4%) |
| 55 to 59 Years | 20,606 (76.8%) | 865 (4.2%) |
| 60 to 64 Years | 14,072 (63.8%) | 704 (5.0%) |
| 65 to 74 Years | 10,135 (31.5%) | 507 (5.0%) |
| 75 Years and over | 1,793 (8.5%) | 57 (3.2%) |
| Total | 267,788 (69.8%) | 12,050 (4.5%) |
Employment Status by Educational Attainment in Raleigh
According to labor force statistics for Raleigh, 83.5% of individuals (219,364) out of the total population between 25 and 64 years of age (262,711) are in the labor force, with 3.9% or 8,555 of them being unemployed. The group with the highest labor force participation rate are those with the educational attainment of bachelor's degree or higher, with 87.9% or 124,302 individuals in the labor force. Within the labor force, individuals with high school diploma education have the highest percentage of unemployment, with 7.5% or 2,288 of them being unemployed.
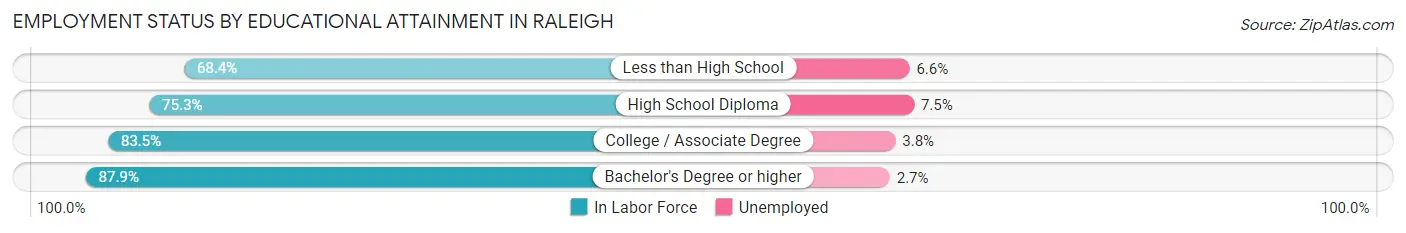
| Educational Attainment | In Labor Force | Unemployed |
| Less than High School | 13,126 (68.4%) | 1,267 (6.6%) |
| High School Diploma | 30,508 (75.3%) | 3,039 (7.5%) |
| College / Associate Degree | 51,430 (83.5%) | 2,341 (3.8%) |
| Bachelor's Degree or higher | 124,302 (87.9%) | 3,818 (2.7%) |
| Total | 219,364 (83.5%) | 10,246 (3.9%) |
Employment Occupations by Sex in Raleigh
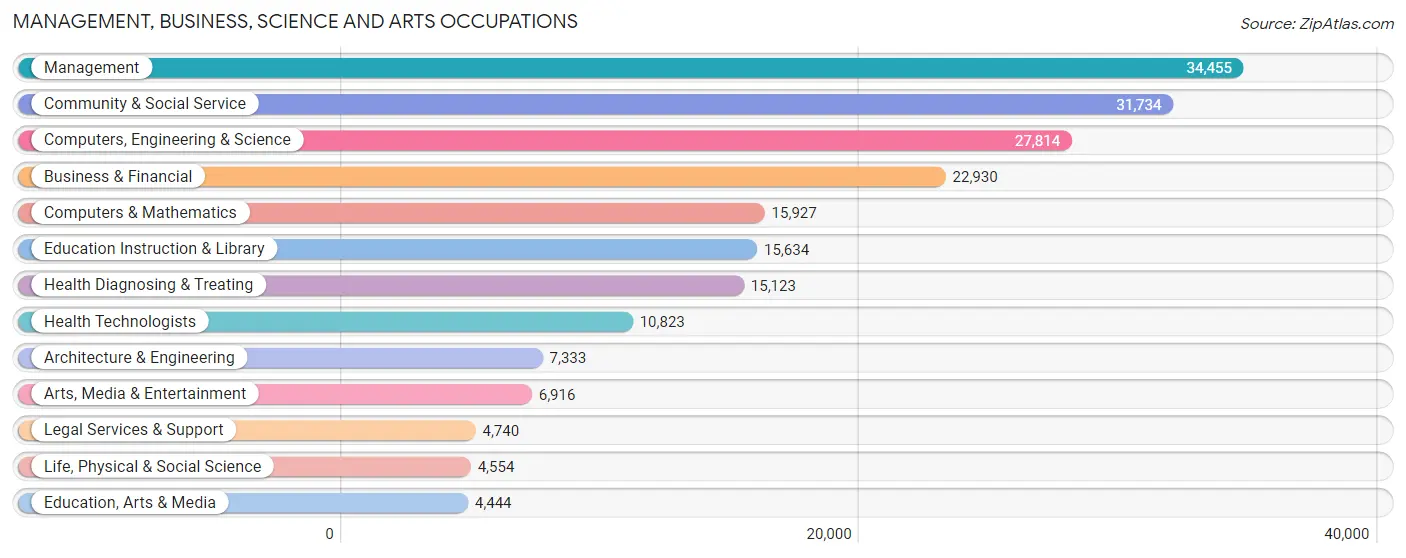
Management, Business, Science and Arts Occupations
The most common Management, Business, Science and Arts occupations in Raleigh are Management (34,455 | 13.5%), Community & Social Service (31,734 | 12.4%), Computers, Engineering & Science (27,814 | 10.9%), Business & Financial (22,930 | 9.0%), and Computers & Mathematics (15,927 | 6.2%).
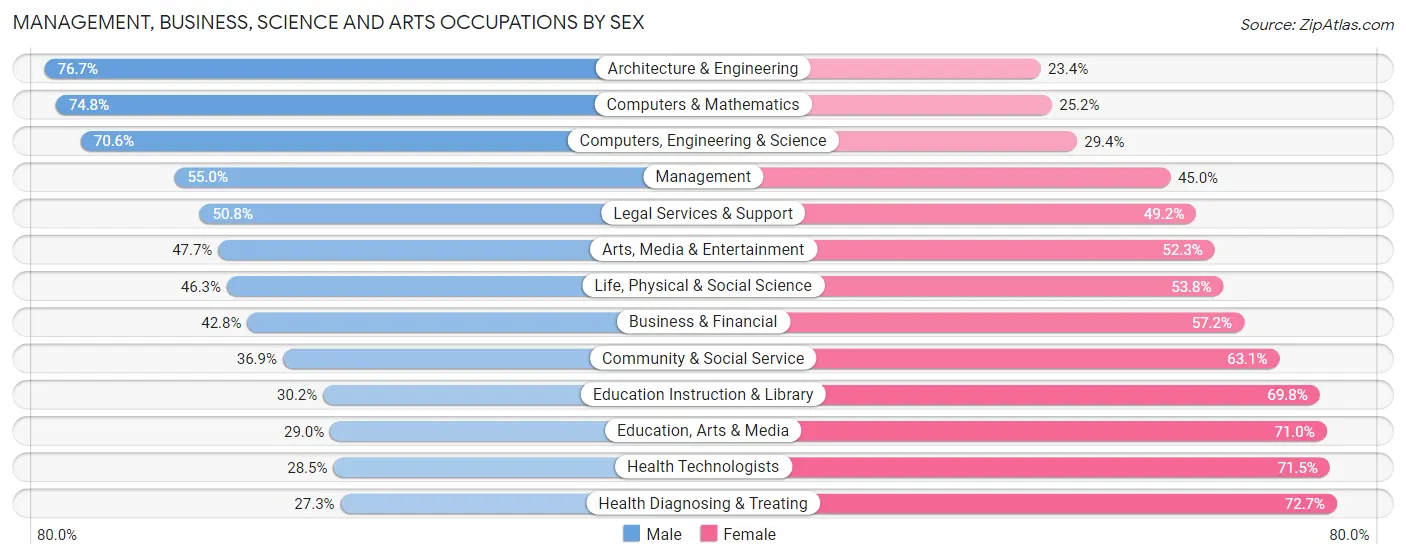
Management, Business, Science and Arts Occupations by Sex
Within the Management, Business, Science and Arts occupations in Raleigh, the most male-oriented occupations are Architecture & Engineering (76.6%), Computers & Mathematics (74.8%), and Computers, Engineering & Science (70.6%), while the most female-oriented occupations are Health Diagnosing & Treating (72.7%), Health Technologists (71.5%), and Education, Arts & Media (71.0%).
| Occupation | Male | Female |
| Management | 18,942 (55.0%) | 15,513 (45.0%) |
| Business & Financial | 9,820 (42.8%) | 13,110 (57.2%) |
| Computers, Engineering & Science | 19,638 (70.6%) | 8,176 (29.4%) |
| Computers & Mathematics | 11,911 (74.8%) | 4,016 (25.2%) |
| Architecture & Engineering | 5,621 (76.6%) | 1,712 (23.4%) |
| Life, Physical & Social Science | 2,106 (46.3%) | 2,448 (53.7%) |
| Community & Social Service | 11,714 (36.9%) | 20,020 (63.1%) |
| Education, Arts & Media | 1,290 (29.0%) | 3,154 (71.0%) |
| Legal Services & Support | 2,408 (50.8%) | 2,332 (49.2%) |
| Education Instruction & Library | 4,718 (30.2%) | 10,916 (69.8%) |
| Arts, Media & Entertainment | 3,298 (47.7%) | 3,618 (52.3%) |
| Health Diagnosing & Treating | 4,129 (27.3%) | 10,994 (72.7%) |
| Health Technologists | 3,084 (28.5%) | 7,739 (71.5%) |
| Total (Category) | 64,243 (48.6%) | 67,813 (51.3%) |
| Total (Overall) | 131,008 (51.3%) | 124,511 (48.7%) |
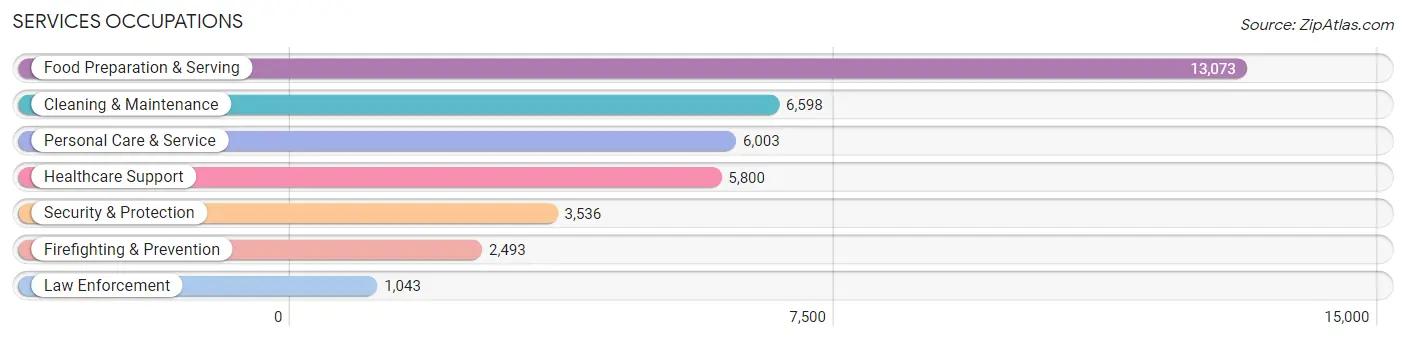
Services Occupations
The most common Services occupations in Raleigh are Food Preparation & Serving (13,073 | 5.1%), Cleaning & Maintenance (6,598 | 2.6%), Personal Care & Service (6,003 | 2.4%), Healthcare Support (5,800 | 2.3%), and Security & Protection (3,536 | 1.4%).
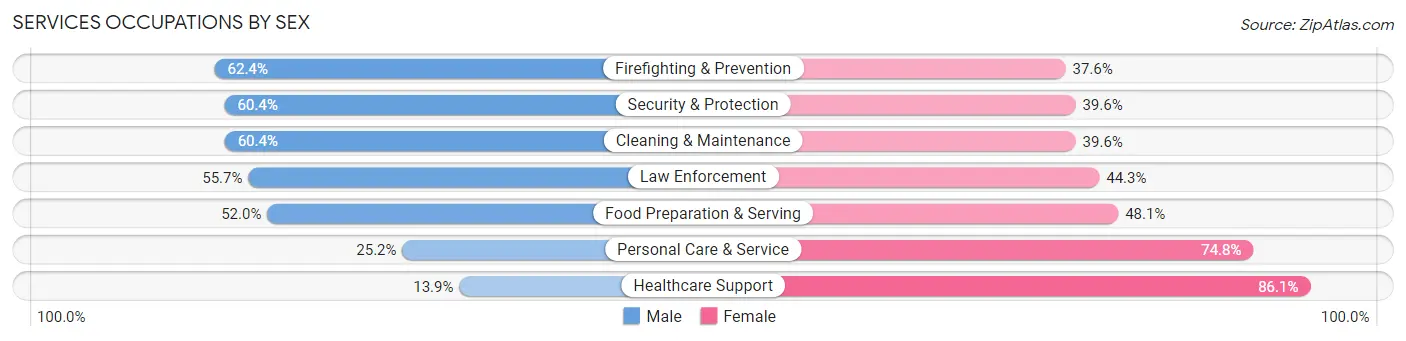
Services Occupations by Sex
Within the Services occupations in Raleigh, the most male-oriented occupations are Firefighting & Prevention (62.4%), Security & Protection (60.4%), and Cleaning & Maintenance (60.4%), while the most female-oriented occupations are Healthcare Support (86.1%), Personal Care & Service (74.8%), and Food Preparation & Serving (48.0%).
| Occupation | Male | Female |
| Healthcare Support | 808 (13.9%) | 4,992 (86.1%) |
| Security & Protection | 2,136 (60.4%) | 1,400 (39.6%) |
| Firefighting & Prevention | 1,555 (62.4%) | 938 (37.6%) |
| Law Enforcement | 581 (55.7%) | 462 (44.3%) |
| Food Preparation & Serving | 6,792 (51.9%) | 6,281 (48.0%) |
| Cleaning & Maintenance | 3,983 (60.4%) | 2,615 (39.6%) |
| Personal Care & Service | 1,513 (25.2%) | 4,490 (74.8%) |
| Total (Category) | 15,232 (43.5%) | 19,778 (56.5%) |
| Total (Overall) | 131,008 (51.3%) | 124,511 (48.7%) |
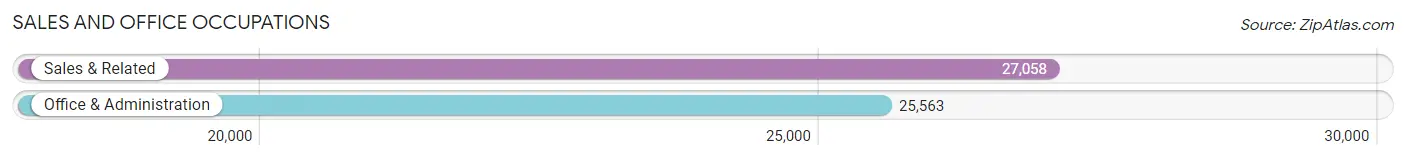
Sales and Office Occupations
The most common Sales and Office occupations in Raleigh are Sales & Related (27,058 | 10.6%), and Office & Administration (25,563 | 10.0%).
Sales and Office Occupations by Sex
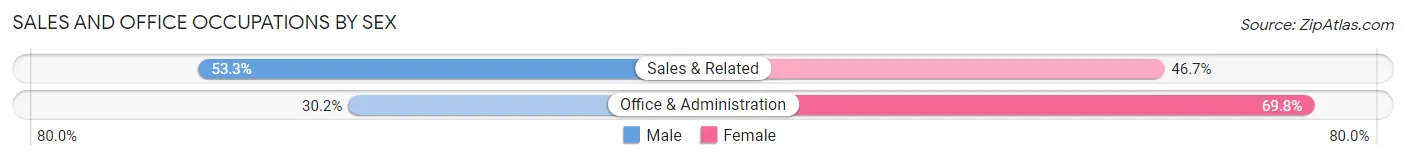
| Occupation | Male | Female |
| Sales & Related | 14,410 (53.3%) | 12,648 (46.7%) |
| Office & Administration | 7,727 (30.2%) | 17,836 (69.8%) |
| Total (Category) | 22,137 (42.1%) | 30,484 (57.9%) |
| Total (Overall) | 131,008 (51.3%) | 124,511 (48.7%) |
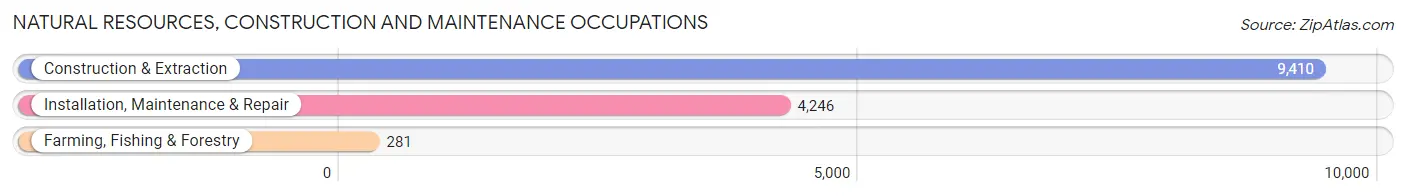
Natural Resources, Construction and Maintenance Occupations
The most common Natural Resources, Construction and Maintenance occupations in Raleigh are Construction & Extraction (9,410 | 3.7%), Installation, Maintenance & Repair (4,246 | 1.7%), and Farming, Fishing & Forestry (281 | 0.1%).
Natural Resources, Construction and Maintenance Occupations by Sex
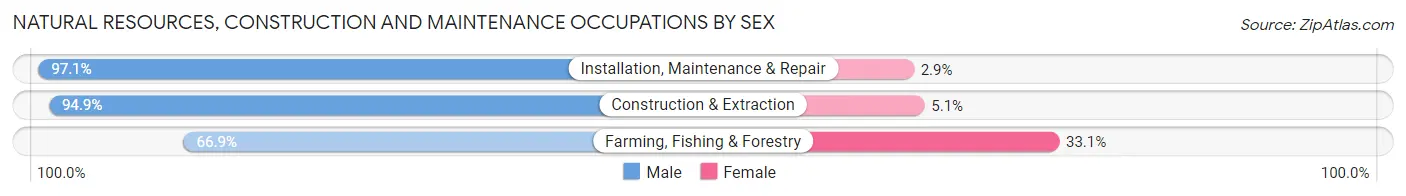
| Occupation | Male | Female |
| Farming, Fishing & Forestry | 188 (66.9%) | 93 (33.1%) |
| Construction & Extraction | 8,932 (94.9%) | 478 (5.1%) |
| Installation, Maintenance & Repair | 4,124 (97.1%) | 122 (2.9%) |
| Total (Category) | 13,244 (95.0%) | 693 (5.0%) |
| Total (Overall) | 131,008 (51.3%) | 124,511 (48.7%) |
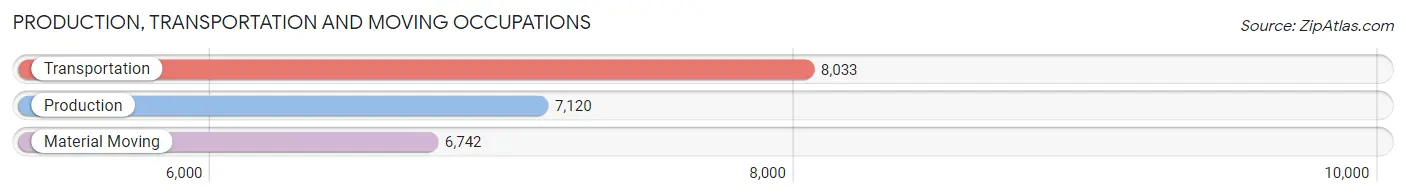
Production, Transportation and Moving Occupations
The most common Production, Transportation and Moving occupations in Raleigh are Transportation (8,033 | 3.1%), Production (7,120 | 2.8%), and Material Moving (6,742 | 2.6%).
Production, Transportation and Moving Occupations by Sex
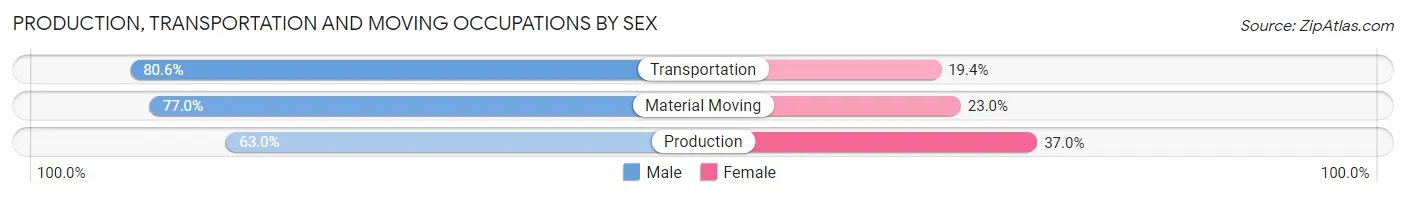
| Occupation | Male | Female |
| Production | 4,485 (63.0%) | 2,635 (37.0%) |
| Transportation | 6,475 (80.6%) | 1,558 (19.4%) |
| Material Moving | 5,192 (77.0%) | 1,550 (23.0%) |
| Total (Category) | 16,152 (73.8%) | 5,743 (26.2%) |
| Total (Overall) | 131,008 (51.3%) | 124,511 (48.7%) |
Employment Industries by Sex in Raleigh
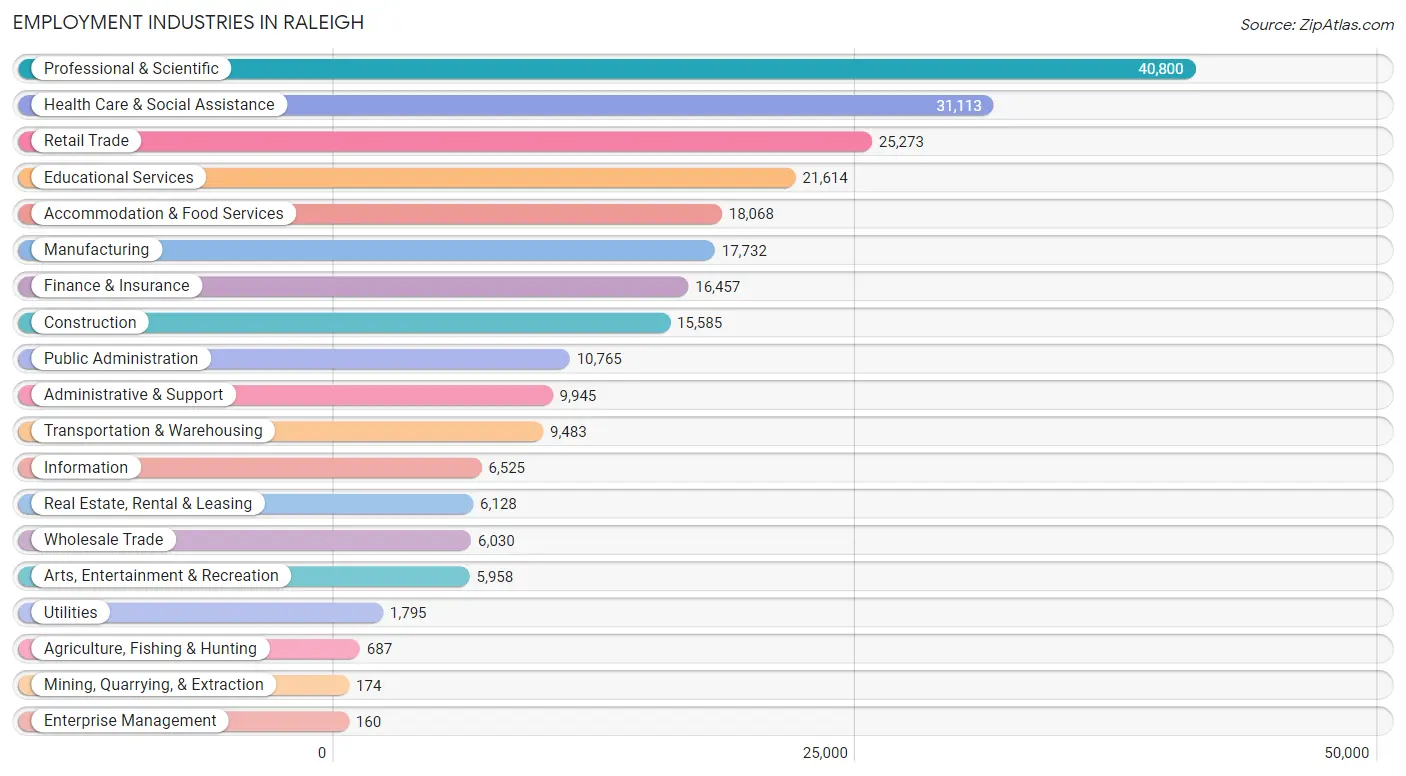
Employment Industries in Raleigh
The major employment industries in Raleigh include Professional & Scientific (40,800 | 16.0%), Health Care & Social Assistance (31,113 | 12.2%), Retail Trade (25,273 | 9.9%), Educational Services (21,614 | 8.5%), and Accommodation & Food Services (18,068 | 7.1%).
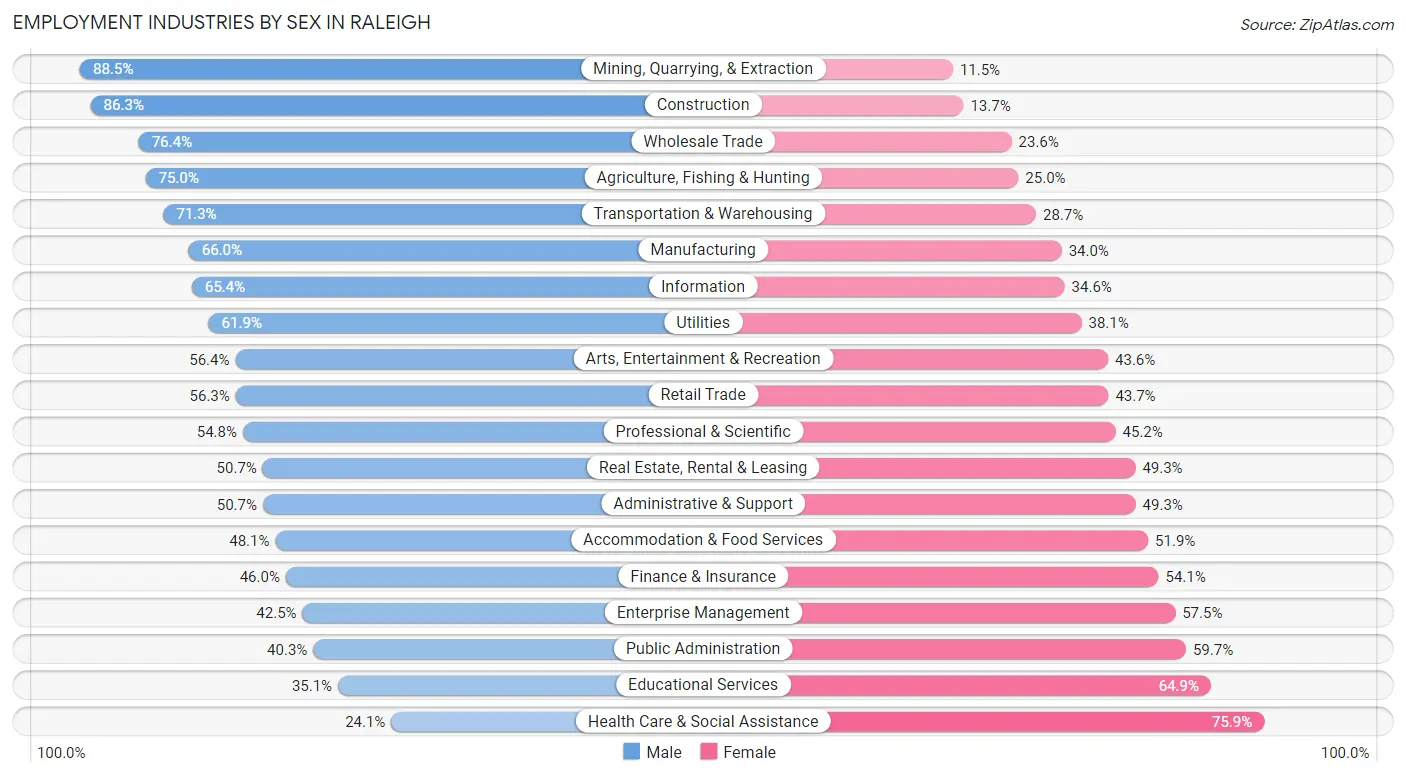
Employment Industries by Sex in Raleigh
The Raleigh industries that see more men than women are Mining, Quarrying, & Extraction (88.5%), Construction (86.3%), and Wholesale Trade (76.4%), whereas the industries that tend to have a higher number of women are Health Care & Social Assistance (75.9%), Educational Services (64.9%), and Public Administration (59.7%).
| Industry | Male | Female |
| Agriculture, Fishing & Hunting | 515 (75.0%) | 172 (25.0%) |
| Mining, Quarrying, & Extraction | 154 (88.5%) | 20 (11.5%) |
| Construction | 13,453 (86.3%) | 2,132 (13.7%) |
| Manufacturing | 11,704 (66.0%) | 6,028 (34.0%) |
| Wholesale Trade | 4,605 (76.4%) | 1,425 (23.6%) |
| Retail Trade | 14,233 (56.3%) | 11,040 (43.7%) |
| Transportation & Warehousing | 6,760 (71.3%) | 2,723 (28.7%) |
| Utilities | 1,111 (61.9%) | 684 (38.1%) |
| Information | 4,266 (65.4%) | 2,259 (34.6%) |
| Finance & Insurance | 7,562 (46.0%) | 8,895 (54.0%) |
| Real Estate, Rental & Leasing | 3,109 (50.7%) | 3,019 (49.3%) |
| Professional & Scientific | 22,376 (54.8%) | 18,424 (45.2%) |
| Enterprise Management | 68 (42.5%) | 92 (57.5%) |
| Administrative & Support | 5,041 (50.7%) | 4,904 (49.3%) |
| Educational Services | 7,596 (35.1%) | 14,018 (64.9%) |
| Health Care & Social Assistance | 7,506 (24.1%) | 23,607 (75.9%) |
| Arts, Entertainment & Recreation | 3,360 (56.4%) | 2,598 (43.6%) |
| Accommodation & Food Services | 8,690 (48.1%) | 9,378 (51.9%) |
| Public Administration | 4,335 (40.3%) | 6,430 (59.7%) |
| Total | 131,008 (51.3%) | 124,511 (48.7%) |
Education in Raleigh
School Enrollment in Raleigh
The most common levels of schooling among the 120,104 students in Raleigh are college / undergraduate (35,439 | 29.5%), middle school (21,819 | 18.2%), and high school (20,246 | 16.9%).
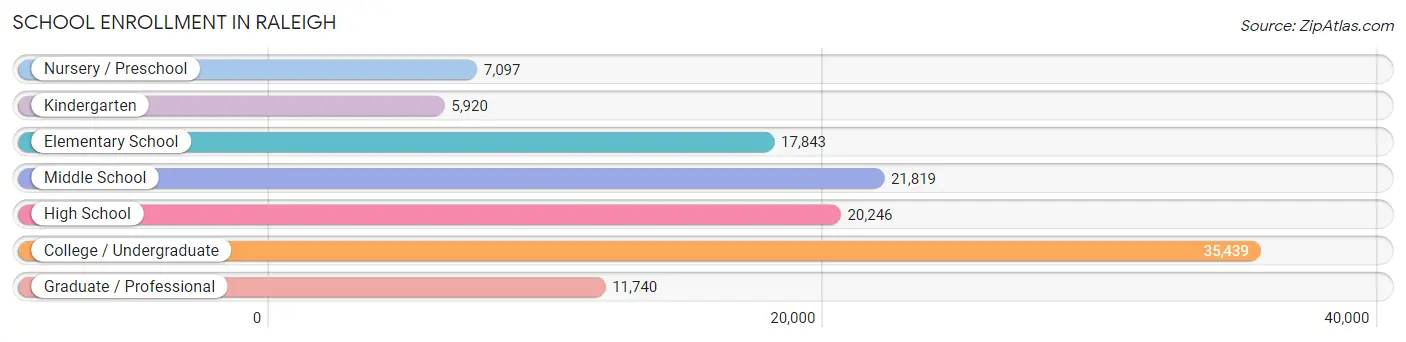
| School Level | # Students | % Students |
| Nursery / Preschool | 7,097 | 5.9% |
| Kindergarten | 5,920 | 4.9% |
| Elementary School | 17,843 | 14.9% |
| Middle School | 21,819 | 18.2% |
| High School | 20,246 | 16.9% |
| College / Undergraduate | 35,439 | 29.5% |
| Graduate / Professional | 11,740 | 9.8% |
| Total | 120,104 | 100.0% |
School Enrollment by Age by Funding Source in Raleigh
Out of a total of 120,104 students who are enrolled in schools in Raleigh, 21,619 (18.0%) attend a private institution, while the remaining 98,485 (82.0%) are enrolled in public schools. The age group of 3 to 4 year olds has the highest likelihood of being enrolled in private schools, with 3,803 (67.6% in the age bracket) enrolled. Conversely, the age group of 10 to 14 year olds has the lowest likelihood of being enrolled in a private school, with 22,878 (88.7% in the age bracket) attending a public institution.
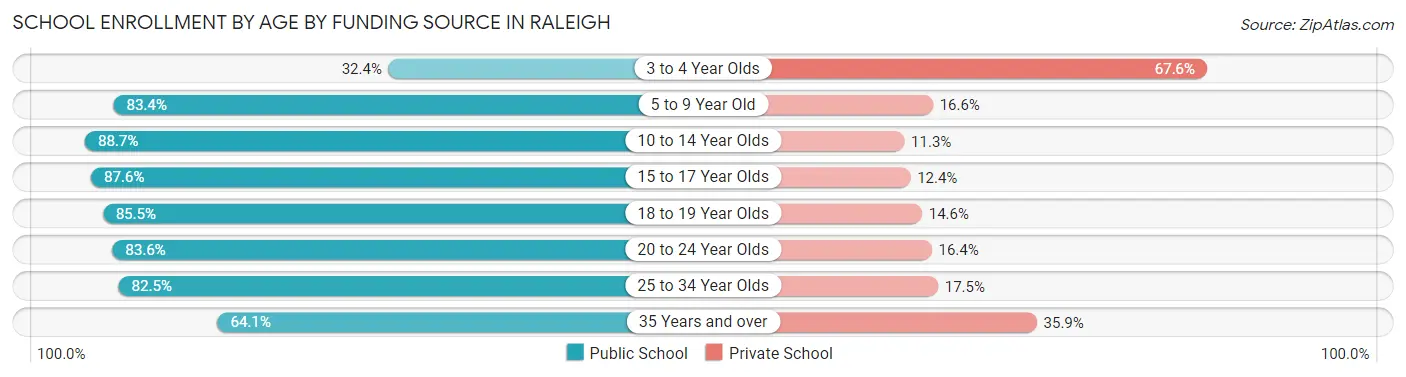
| Age Bracket | Public School | Private School |
| 3 to 4 Year Olds | 1,819 (32.4%) | 3,803 (67.6%) |
| 5 to 9 Year Old | 19,565 (83.4%) | 3,888 (16.6%) |
| 10 to 14 Year Olds | 22,878 (88.7%) | 2,906 (11.3%) |
| 15 to 17 Year Olds | 13,248 (87.6%) | 1,874 (12.4%) |
| 18 to 19 Year Olds | 12,658 (85.5%) | 2,156 (14.5%) |
| 20 to 24 Year Olds | 16,114 (83.6%) | 3,152 (16.4%) |
| 25 to 34 Year Olds | 8,680 (82.5%) | 1,845 (17.5%) |
| 35 Years and over | 3,535 (64.1%) | 1,983 (35.9%) |
| Total | 98,485 (82.0%) | 21,619 (18.0%) |
Educational Attainment by Field of Study in Raleigh
Business (34,244 | 19.0%), social sciences (16,977 | 9.4%), engineering (15,154 | 8.4%), bio, nature & agricultural (14,173 | 7.9%), and science & technology (13,719 | 7.6%) are the most common fields of study among 179,837 individuals in Raleigh who have obtained a bachelor's degree or higher.
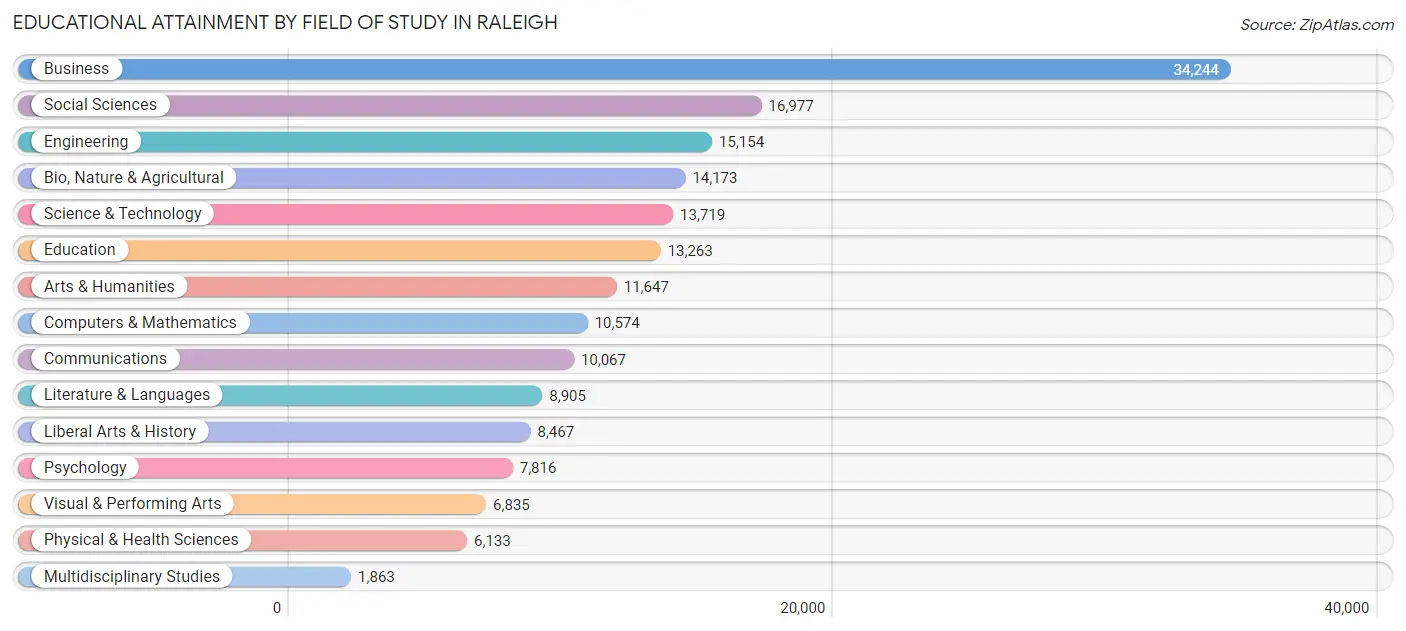
| Field of Study | # Graduates | % Graduates |
| Computers & Mathematics | 10,574 | 5.9% |
| Bio, Nature & Agricultural | 14,173 | 7.9% |
| Physical & Health Sciences | 6,133 | 3.4% |
| Psychology | 7,816 | 4.3% |
| Social Sciences | 16,977 | 9.4% |
| Engineering | 15,154 | 8.4% |
| Multidisciplinary Studies | 1,863 | 1.0% |
| Science & Technology | 13,719 | 7.6% |
| Business | 34,244 | 19.0% |
| Education | 13,263 | 7.4% |
| Literature & Languages | 8,905 | 5.0% |
| Liberal Arts & History | 8,467 | 4.7% |
| Visual & Performing Arts | 6,835 | 3.8% |
| Communications | 10,067 | 5.6% |
| Arts & Humanities | 11,647 | 6.5% |
| Total | 179,837 | 100.0% |
Transportation & Commute in Raleigh
Vehicle Availability by Sex in Raleigh
The most prevalent vehicle ownership categories in Raleigh are males with 2 vehicles (60,614, accounting for 47.0%) and females with 2 vehicles (50,996, making up 50.2%).
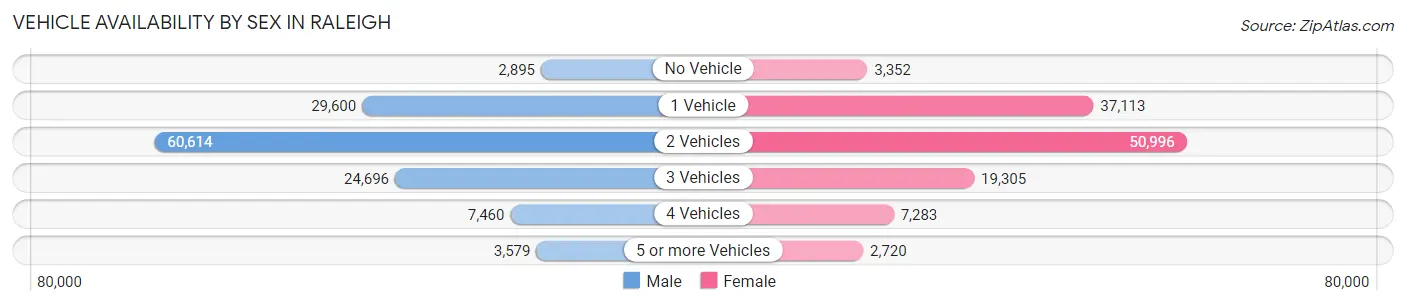
| Vehicles Available | Male | Female |
| No Vehicle | 2,895 (2.2%) | 3,352 (2.8%) |
| 1 Vehicle | 29,600 (23.0%) | 37,113 (30.7%) |
| 2 Vehicles | 60,614 (47.0%) | 50,996 (42.2%) |
| 3 Vehicles | 24,696 (19.2%) | 19,305 (16.0%) |
| 4 Vehicles | 7,460 (5.8%) | 7,283 (6.0%) |
| 5 or more Vehicles | 3,579 (2.8%) | 2,720 (2.2%) |
| Total | 128,844 (100.0%) | 120,769 (100.0%) |
Commute Time in Raleigh
The most frequently occuring commute durations in Raleigh are 15 to 19 minutes (38,571 commuters, 19.2%), 20 to 24 minutes (36,941 commuters, 18.4%), and 10 to 14 minutes (28,070 commuters, 14.0%).
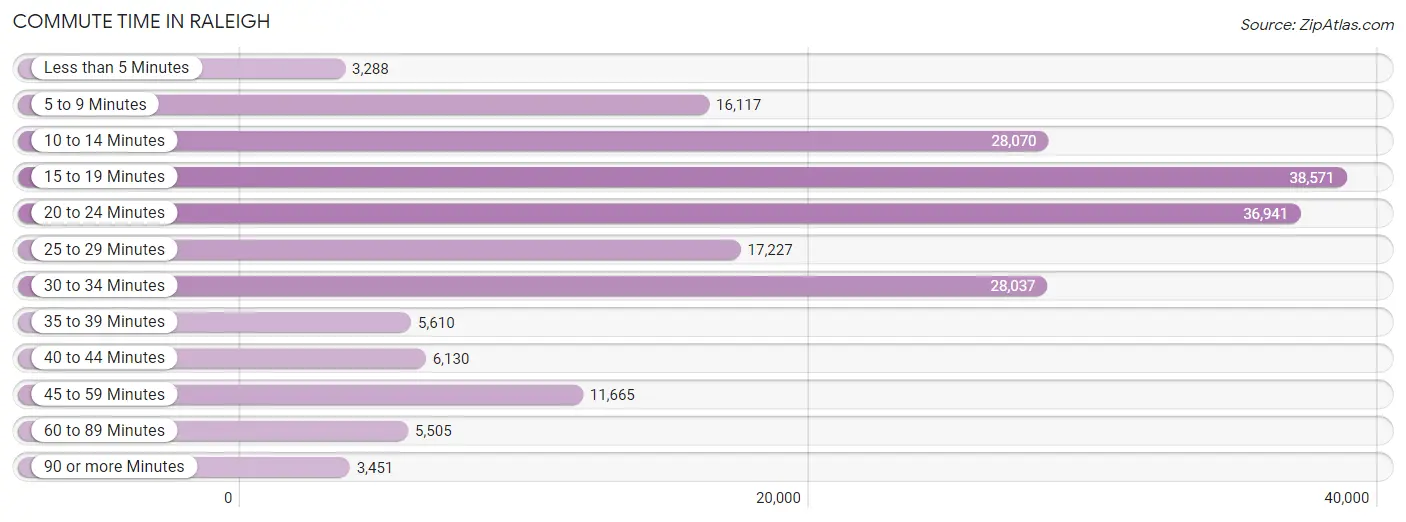
| Commute Time | # Commuters | % Commuters |
| Less than 5 Minutes | 3,288 | 1.6% |
| 5 to 9 Minutes | 16,117 | 8.0% |
| 10 to 14 Minutes | 28,070 | 14.0% |
| 15 to 19 Minutes | 38,571 | 19.2% |
| 20 to 24 Minutes | 36,941 | 18.4% |
| 25 to 29 Minutes | 17,227 | 8.6% |
| 30 to 34 Minutes | 28,037 | 14.0% |
| 35 to 39 Minutes | 5,610 | 2.8% |
| 40 to 44 Minutes | 6,130 | 3.1% |
| 45 to 59 Minutes | 11,665 | 5.8% |
| 60 to 89 Minutes | 5,505 | 2.7% |
| 90 or more Minutes | 3,451 | 1.7% |
Commute Time by Sex in Raleigh
The most common commute times in Raleigh are 15 to 19 minutes (20,512 commuters, 19.6%) for males and 20 to 24 minutes (18,789 commuters, 19.6%) for females.
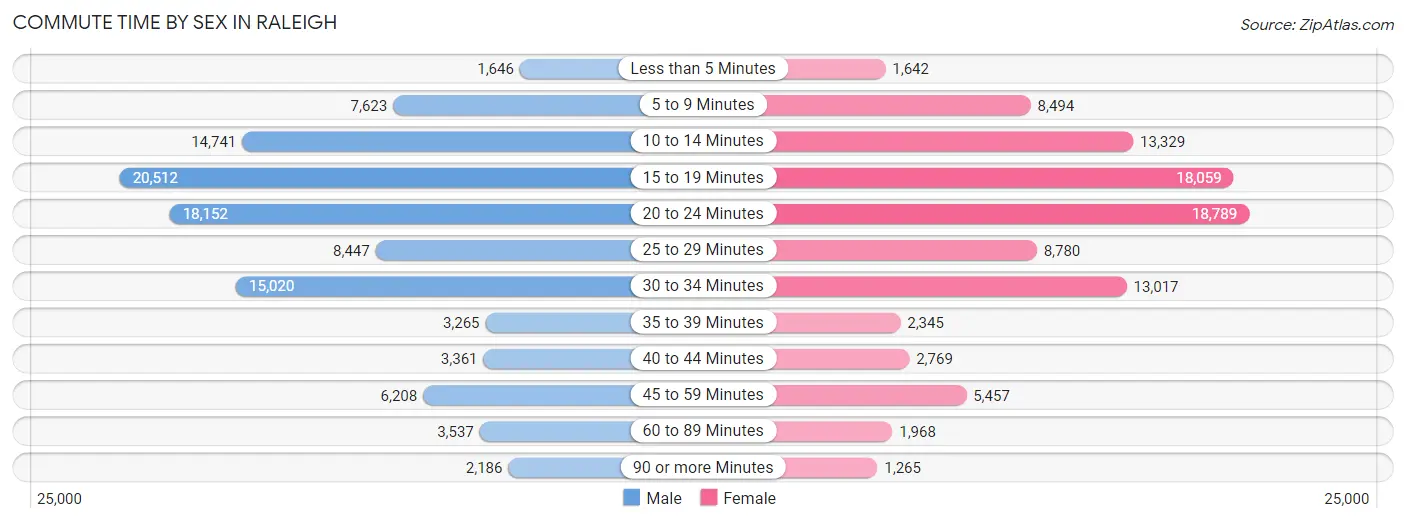
| Commute Time | Male | Female |
| Less than 5 Minutes | 1,646 (1.6%) | 1,642 (1.7%) |
| 5 to 9 Minutes | 7,623 (7.3%) | 8,494 (8.9%) |
| 10 to 14 Minutes | 14,741 (14.1%) | 13,329 (13.9%) |
| 15 to 19 Minutes | 20,512 (19.6%) | 18,059 (18.8%) |
| 20 to 24 Minutes | 18,152 (17.3%) | 18,789 (19.6%) |
| 25 to 29 Minutes | 8,447 (8.1%) | 8,780 (9.1%) |
| 30 to 34 Minutes | 15,020 (14.3%) | 13,017 (13.6%) |
| 35 to 39 Minutes | 3,265 (3.1%) | 2,345 (2.4%) |
| 40 to 44 Minutes | 3,361 (3.2%) | 2,769 (2.9%) |
| 45 to 59 Minutes | 6,208 (5.9%) | 5,457 (5.7%) |
| 60 to 89 Minutes | 3,537 (3.4%) | 1,968 (2.1%) |
| 90 or more Minutes | 2,186 (2.1%) | 1,265 (1.3%) |
Time of Departure to Work by Sex in Raleigh
The most frequent times of departure to work in Raleigh are 8:00 AM to 8:29 AM (15,029, 14.3%) for males and 8:00 AM to 8:29 AM (15,978, 16.7%) for females.
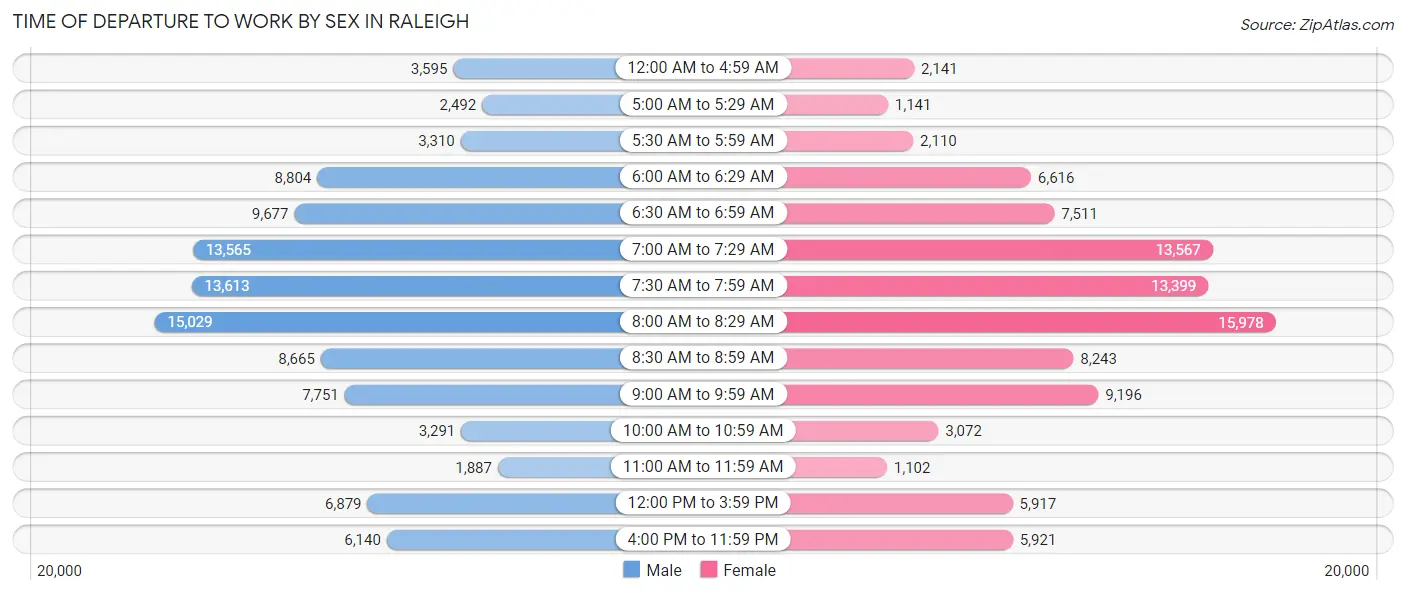
| Time of Departure | Male | Female |
| 12:00 AM to 4:59 AM | 3,595 (3.4%) | 2,141 (2.2%) |
| 5:00 AM to 5:29 AM | 2,492 (2.4%) | 1,141 (1.2%) |
| 5:30 AM to 5:59 AM | 3,310 (3.2%) | 2,110 (2.2%) |
| 6:00 AM to 6:29 AM | 8,804 (8.4%) | 6,616 (6.9%) |
| 6:30 AM to 6:59 AM | 9,677 (9.2%) | 7,511 (7.8%) |
| 7:00 AM to 7:29 AM | 13,565 (13.0%) | 13,567 (14.1%) |
| 7:30 AM to 7:59 AM | 13,613 (13.0%) | 13,399 (14.0%) |
| 8:00 AM to 8:29 AM | 15,029 (14.3%) | 15,978 (16.7%) |
| 8:30 AM to 8:59 AM | 8,665 (8.3%) | 8,243 (8.6%) |
| 9:00 AM to 9:59 AM | 7,751 (7.4%) | 9,196 (9.6%) |
| 10:00 AM to 10:59 AM | 3,291 (3.1%) | 3,072 (3.2%) |
| 11:00 AM to 11:59 AM | 1,887 (1.8%) | 1,102 (1.1%) |
| 12:00 PM to 3:59 PM | 6,879 (6.6%) | 5,917 (6.2%) |
| 4:00 PM to 11:59 PM | 6,140 (5.9%) | 5,921 (6.2%) |
| Total | 104,698 (100.0%) | 95,914 (100.0%) |
Housing Occupancy in Raleigh
Occupancy by Ownership in Raleigh
Of the total 189,830 dwellings in Raleigh, owner-occupied units account for 97,018 (51.1%), while renter-occupied units make up 92,812 (48.9%).
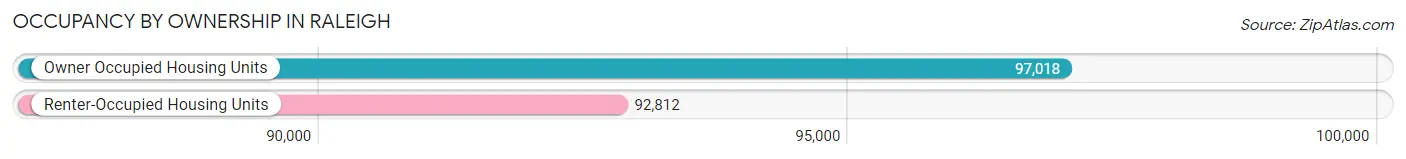
| Occupancy | # Housing Units | % Housing Units |
| Owner Occupied Housing Units | 97,018 | 51.1% |
| Renter-Occupied Housing Units | 92,812 | 48.9% |
| Total Occupied Housing Units | 189,830 | 100.0% |
Occupancy by Household Size in Raleigh
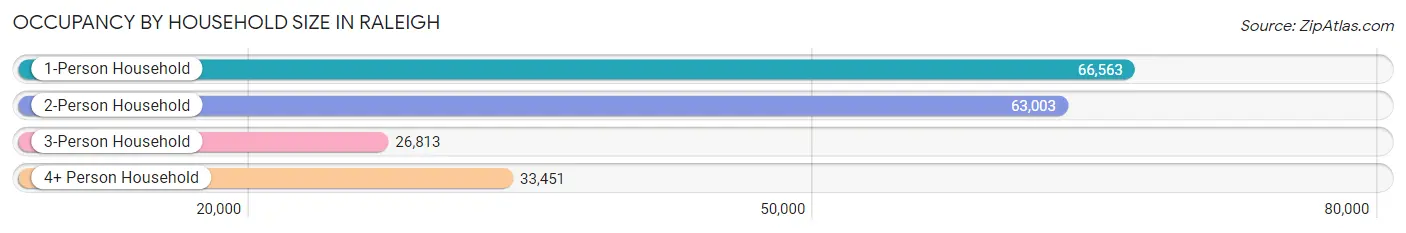
| Household Size | # Housing Units | % Housing Units |
| 1-Person Household | 66,563 | 35.1% |
| 2-Person Household | 63,003 | 33.2% |
| 3-Person Household | 26,813 | 14.1% |
| 4+ Person Household | 33,451 | 17.6% |
| Total Housing Units | 189,830 | 100.0% |
Occupancy by Ownership by Household Size in Raleigh
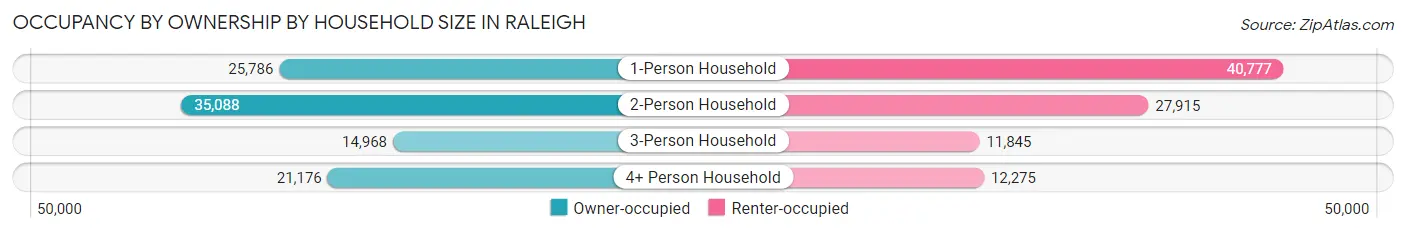
| Household Size | Owner-occupied | Renter-occupied |
| 1-Person Household | 25,786 (38.7%) | 40,777 (61.3%) |
| 2-Person Household | 35,088 (55.7%) | 27,915 (44.3%) |
| 3-Person Household | 14,968 (55.8%) | 11,845 (44.2%) |
| 4+ Person Household | 21,176 (63.3%) | 12,275 (36.7%) |
| Total Housing Units | 97,018 (51.1%) | 92,812 (48.9%) |
Occupancy by Educational Attainment in Raleigh
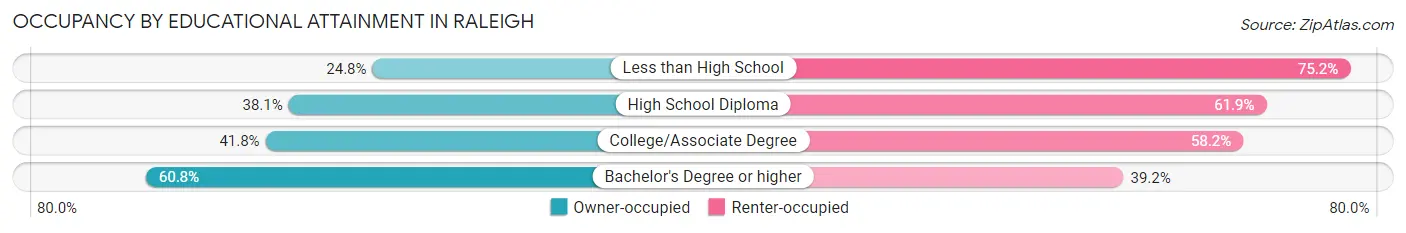
| Household Size | Owner-occupied | Renter-occupied |
| Less than High School | 2,548 (24.8%) | 7,709 (75.2%) |
| High School Diploma | 9,696 (38.1%) | 15,736 (61.9%) |
| College/Associate Degree | 19,582 (41.8%) | 27,270 (58.2%) |
| Bachelor's Degree or higher | 65,192 (60.8%) | 42,097 (39.2%) |
Occupancy by Age of Householder in Raleigh
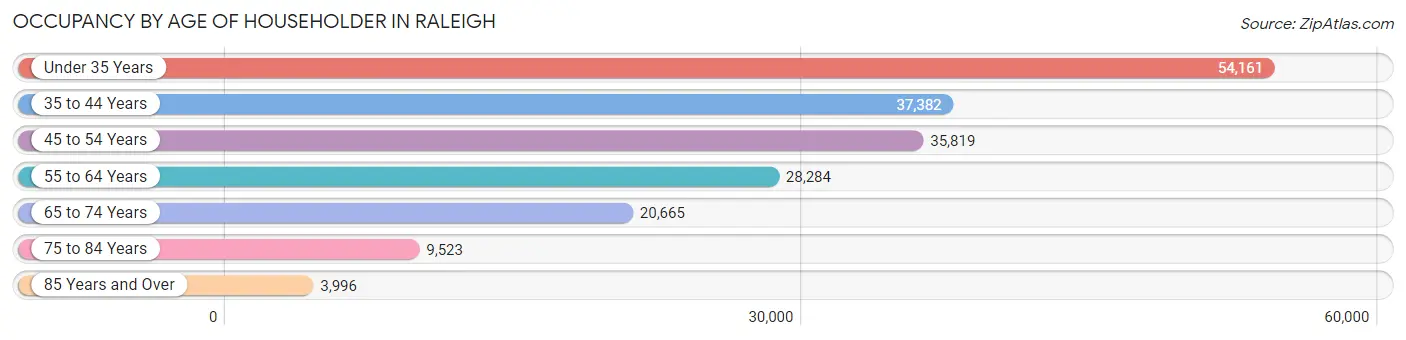
| Age Bracket | # Households | % Households |
| Under 35 Years | 54,161 | 28.5% |
| 35 to 44 Years | 37,382 | 19.7% |
| 45 to 54 Years | 35,819 | 18.9% |
| 55 to 64 Years | 28,284 | 14.9% |
| 65 to 74 Years | 20,665 | 10.9% |
| 75 to 84 Years | 9,523 | 5.0% |
| 85 Years and Over | 3,996 | 2.1% |
| Total | 189,830 | 100.0% |
Housing Finances in Raleigh
Median Income by Occupancy in Raleigh
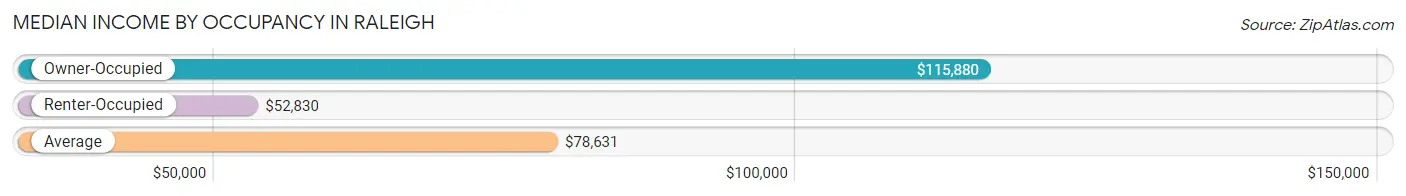
| Occupancy Type | # Households | Median Income |
| Owner-Occupied | 97,018 (51.1%) | $115,880 |
| Renter-Occupied | 92,812 (48.9%) | $52,830 |
| Average | 189,830 (100.0%) | $78,631 |
Occupancy by Householder Income Bracket in Raleigh
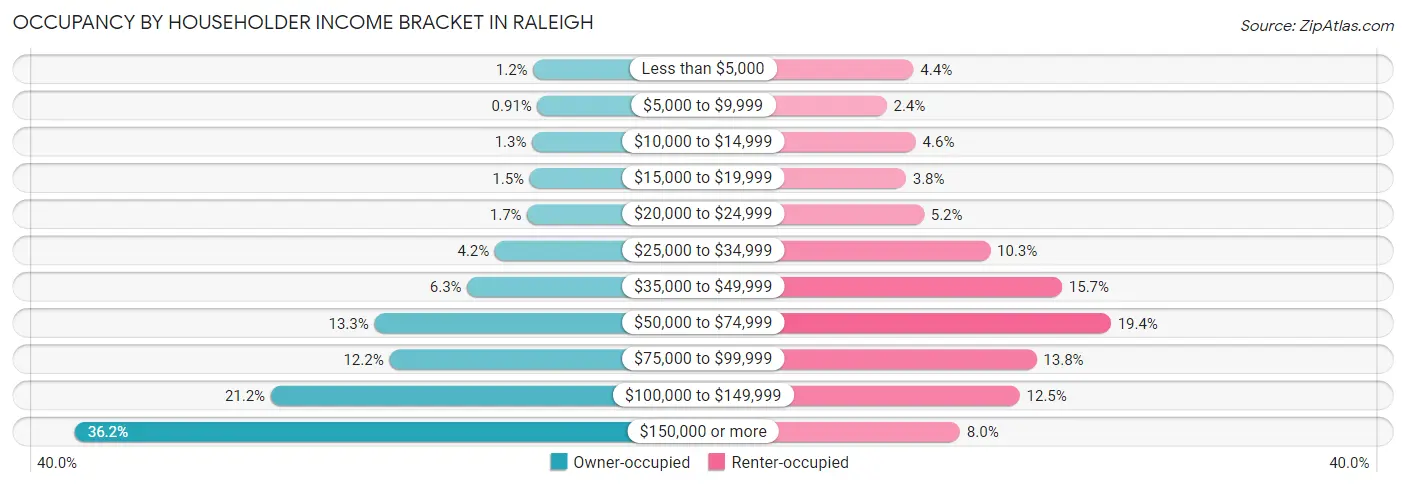
| Income Bracket | Owner-occupied | Renter-occupied |
| Less than $5,000 | 1,192 (1.2%) | 4,095 (4.4%) |
| $5,000 to $9,999 | 884 (0.9%) | 2,192 (2.4%) |
| $10,000 to $14,999 | 1,278 (1.3%) | 4,247 (4.6%) |
| $15,000 to $19,999 | 1,457 (1.5%) | 3,551 (3.8%) |
| $20,000 to $24,999 | 1,640 (1.7%) | 4,824 (5.2%) |
| $25,000 to $34,999 | 4,026 (4.2%) | 9,516 (10.2%) |
| $35,000 to $49,999 | 6,070 (6.3%) | 14,587 (15.7%) |
| $50,000 to $74,999 | 12,941 (13.3%) | 18,040 (19.4%) |
| $75,000 to $99,999 | 11,841 (12.2%) | 12,787 (13.8%) |
| $100,000 to $149,999 | 20,599 (21.2%) | 11,599 (12.5%) |
| $150,000 or more | 35,090 (36.2%) | 7,374 (8.0%) |
| Total | 97,018 (100.0%) | 92,812 (100.0%) |
Monthly Housing Cost Tiers in Raleigh
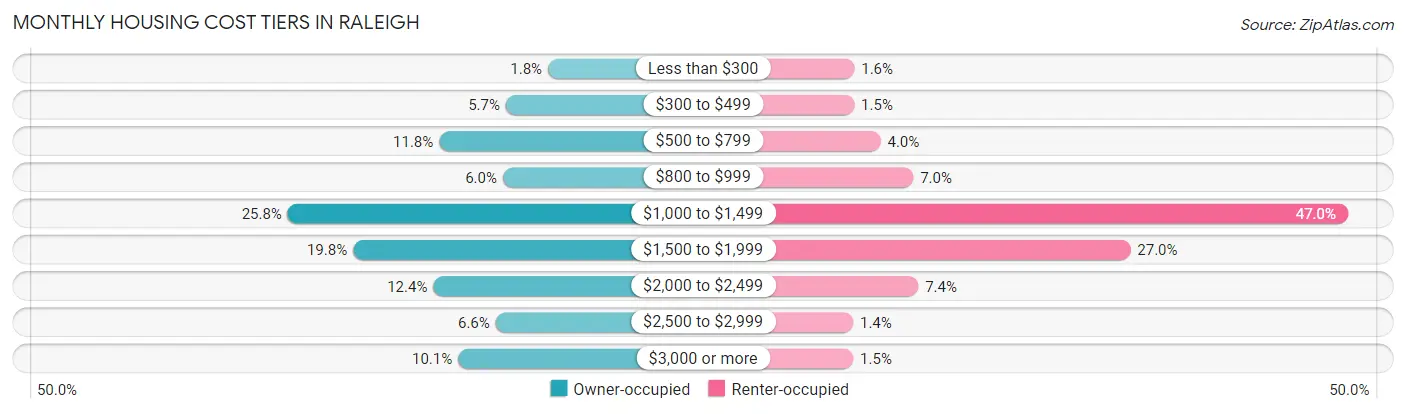
| Monthly Cost | Owner-occupied | Renter-occupied |
| Less than $300 | 1,765 (1.8%) | 1,437 (1.5%) |
| $300 to $499 | 5,529 (5.7%) | 1,425 (1.5%) |
| $500 to $799 | 11,486 (11.8%) | 3,686 (4.0%) |
| $800 to $999 | 5,805 (6.0%) | 6,479 (7.0%) |
| $1,000 to $1,499 | 25,008 (25.8%) | 43,602 (47.0%) |
| $1,500 to $1,999 | 19,177 (19.8%) | 25,034 (27.0%) |
| $2,000 to $2,499 | 12,010 (12.4%) | 6,903 (7.4%) |
| $2,500 to $2,999 | 6,441 (6.6%) | 1,336 (1.4%) |
| $3,000 or more | 9,797 (10.1%) | 1,346 (1.5%) |
| Total | 97,018 (100.0%) | 92,812 (100.0%) |
Physical Housing Characteristics in Raleigh
Housing Structures in Raleigh
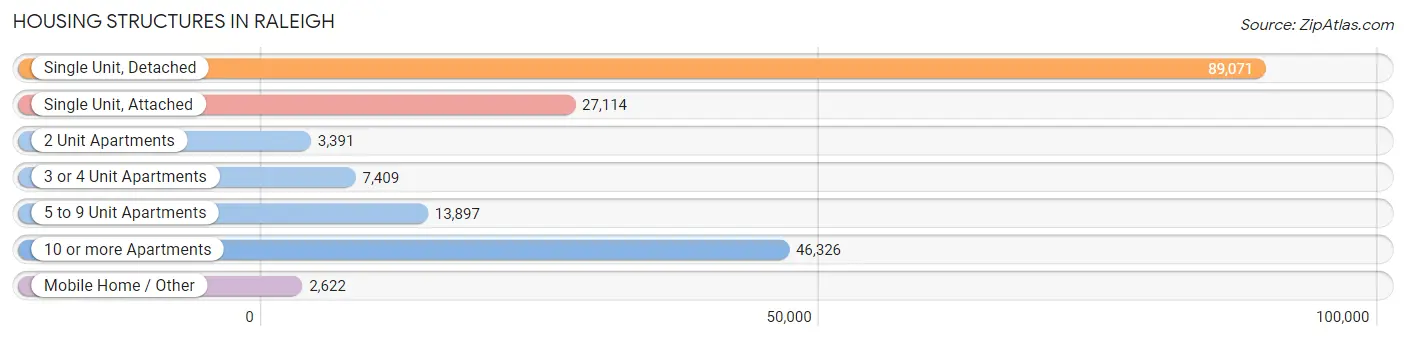
| Structure Type | # Housing Units | % Housing Units |
| Single Unit, Detached | 89,071 | 46.9% |
| Single Unit, Attached | 27,114 | 14.3% |
| 2 Unit Apartments | 3,391 | 1.8% |
| 3 or 4 Unit Apartments | 7,409 | 3.9% |
| 5 to 9 Unit Apartments | 13,897 | 7.3% |
| 10 or more Apartments | 46,326 | 24.4% |
| Mobile Home / Other | 2,622 | 1.4% |
| Total | 189,830 | 100.0% |
Housing Structures by Occupancy in Raleigh
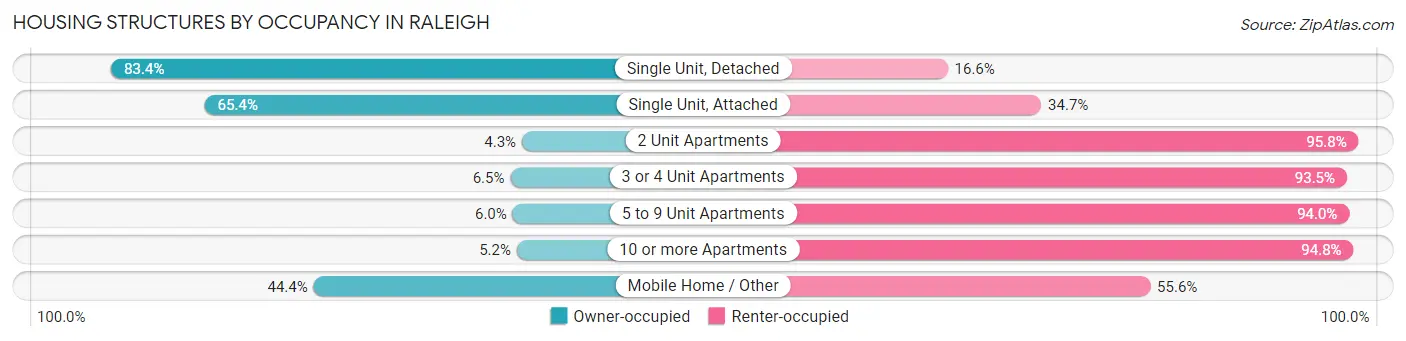
| Structure Type | Owner-occupied | Renter-occupied |
| Single Unit, Detached | 74,250 (83.4%) | 14,821 (16.6%) |
| Single Unit, Attached | 17,719 (65.3%) | 9,395 (34.6%) |
| 2 Unit Apartments | 144 (4.3%) | 3,247 (95.8%) |
| 3 or 4 Unit Apartments | 481 (6.5%) | 6,928 (93.5%) |
| 5 to 9 Unit Apartments | 840 (6.0%) | 13,057 (94.0%) |
| 10 or more Apartments | 2,421 (5.2%) | 43,905 (94.8%) |
| Mobile Home / Other | 1,163 (44.4%) | 1,459 (55.6%) |
| Total | 97,018 (51.1%) | 92,812 (48.9%) |
Housing Structures by Number of Rooms in Raleigh
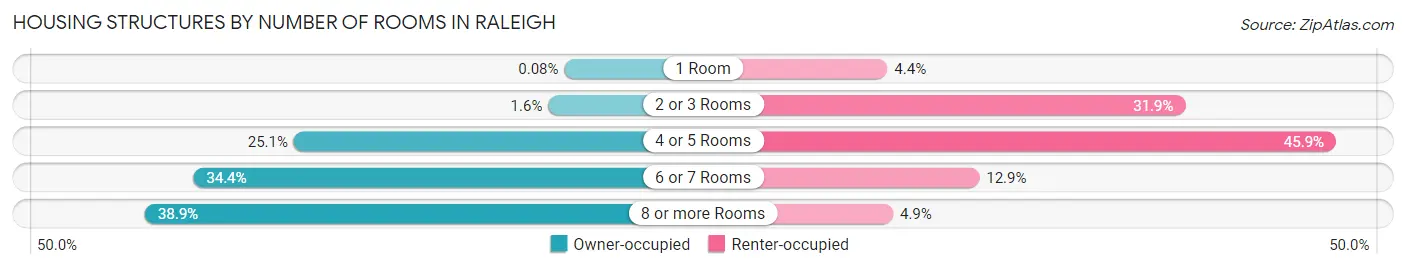
| Number of Rooms | Owner-occupied | Renter-occupied |
| 1 Room | 74 (0.1%) | 4,070 (4.4%) |
| 2 or 3 Rooms | 1,519 (1.6%) | 29,645 (31.9%) |
| 4 or 5 Rooms | 24,352 (25.1%) | 42,570 (45.9%) |
| 6 or 7 Rooms | 33,364 (34.4%) | 11,966 (12.9%) |
| 8 or more Rooms | 37,709 (38.9%) | 4,561 (4.9%) |
| Total | 97,018 (100.0%) | 92,812 (100.0%) |
Housing Structure by Heating Type in Raleigh

| Heating Type | Owner-occupied | Renter-occupied |
| Utility Gas | 59,462 (61.3%) | 17,852 (19.2%) |
| Bottled, Tank, or LP Gas | 1,303 (1.3%) | 812 (0.9%) |
| Electricity | 35,660 (36.8%) | 73,345 (79.0%) |
| Fuel Oil or Kerosene | 132 (0.1%) | 71 (0.1%) |
| Coal or Coke | 0 (0.0%) | 0 (0.0%) |
| All other Fuels | 343 (0.4%) | 149 (0.2%) |
| No Fuel Used | 118 (0.1%) | 583 (0.6%) |
| Total | 97,018 (100.0%) | 92,812 (100.0%) |
Household Vehicle Usage in Raleigh
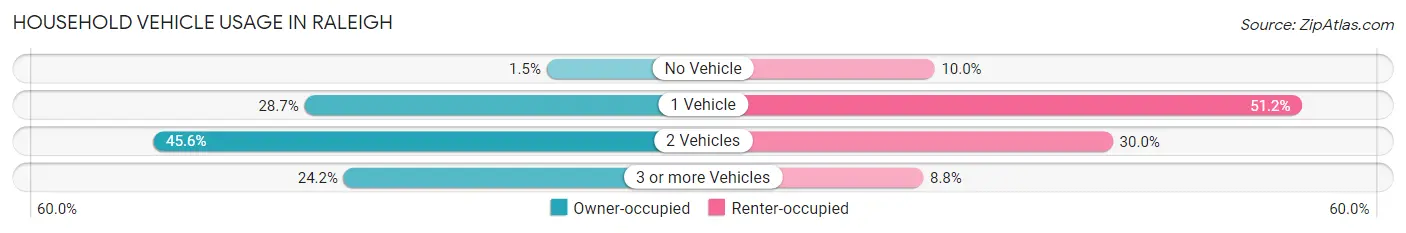
| Vehicles per Household | Owner-occupied | Renter-occupied |
| No Vehicle | 1,463 (1.5%) | 9,309 (10.0%) |
| 1 Vehicle | 27,798 (28.6%) | 47,543 (51.2%) |
| 2 Vehicles | 44,238 (45.6%) | 27,836 (30.0%) |
| 3 or more Vehicles | 23,519 (24.2%) | 8,124 (8.7%) |
| Total | 97,018 (100.0%) | 92,812 (100.0%) |
Real Estate & Mortgages in Raleigh
Real Estate and Mortgage Overview in Raleigh
| Characteristic | Without Mortgage | With Mortgage |
| Housing Units | 23,595 | 73,423 |
| Median Property Value | $369,700 | $339,900 |
| Median Household Income | $88,297 | $28,781 |
| Monthly Housing Costs | $645 | $9,723 |
| Real Estate Taxes | $3,132 | $780 |
Property Value by Mortgage Status in Raleigh
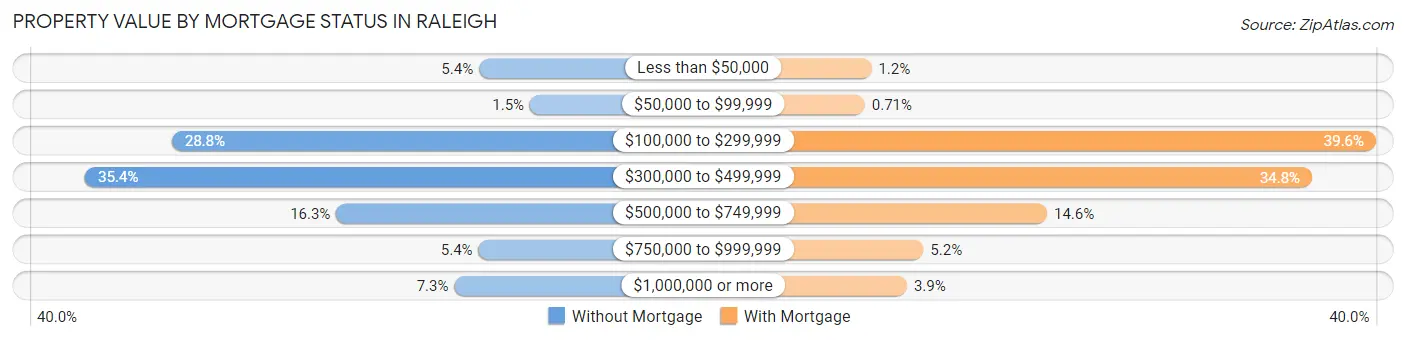
| Property Value | Without Mortgage | With Mortgage |
| Less than $50,000 | 1,270 (5.4%) | 887 (1.2%) |
| $50,000 to $99,999 | 355 (1.5%) | 519 (0.7%) |
| $100,000 to $299,999 | 6,790 (28.8%) | 29,108 (39.6%) |
| $300,000 to $499,999 | 8,351 (35.4%) | 25,526 (34.8%) |
| $500,000 to $749,999 | 3,836 (16.3%) | 10,710 (14.6%) |
| $750,000 to $999,999 | 1,280 (5.4%) | 3,797 (5.2%) |
| $1,000,000 or more | 1,713 (7.3%) | 2,876 (3.9%) |
| Total | 23,595 (100.0%) | 73,423 (100.0%) |
Household Income by Mortgage Status in Raleigh
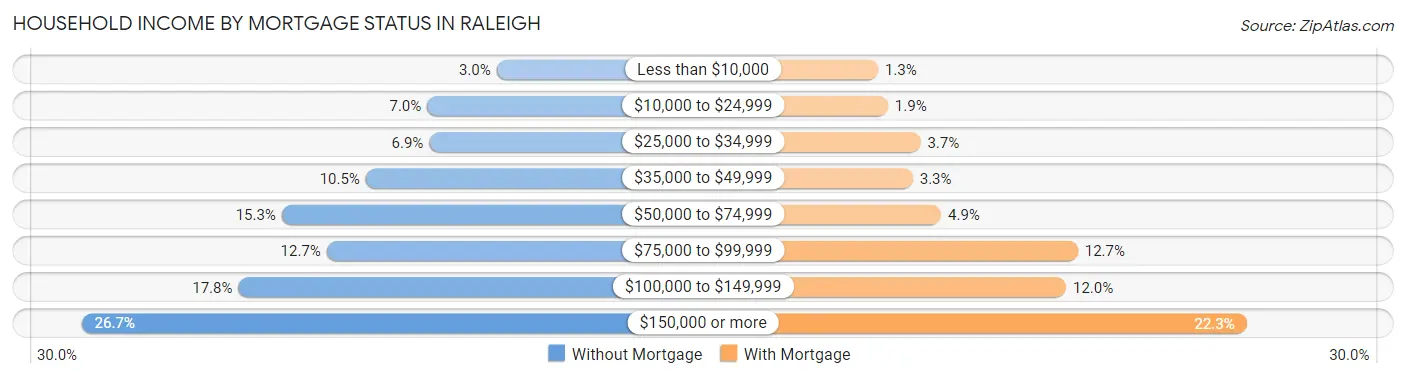
| Household Income | Without Mortgage | With Mortgage |
| Less than $10,000 | 715 (3.0%) | 941 (1.3%) |
| $10,000 to $24,999 | 1,651 (7.0%) | 1,361 (1.8%) |
| $25,000 to $34,999 | 1,624 (6.9%) | 2,724 (3.7%) |
| $35,000 to $49,999 | 2,479 (10.5%) | 2,402 (3.3%) |
| $50,000 to $74,999 | 3,613 (15.3%) | 3,591 (4.9%) |
| $75,000 to $99,999 | 3,007 (12.7%) | 9,328 (12.7%) |
| $100,000 to $149,999 | 4,197 (17.8%) | 8,834 (12.0%) |
| $150,000 or more | 6,309 (26.7%) | 16,402 (22.3%) |
| Total | 23,595 (100.0%) | 73,423 (100.0%) |
Property Value to Household Income Ratio in Raleigh
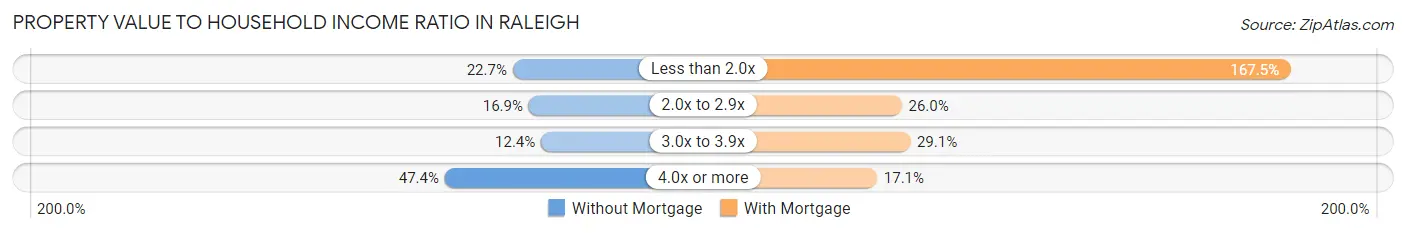
| Value-to-Income Ratio | Without Mortgage | With Mortgage |
| Less than 2.0x | 5,353 (22.7%) | 122,977 (167.5%) |
| 2.0x to 2.9x | 3,975 (16.9%) | 19,097 (26.0%) |
| 3.0x to 3.9x | 2,921 (12.4%) | 21,349 (29.1%) |
| 4.0x or more | 11,180 (47.4%) | 12,524 (17.1%) |
| Total | 23,595 (100.0%) | 73,423 (100.0%) |
Real Estate Taxes by Mortgage Status in Raleigh
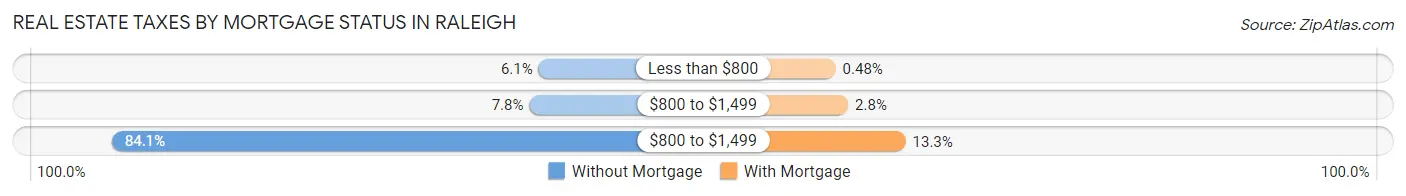
| Property Taxes | Without Mortgage | With Mortgage |
| Less than $800 | 1,447 (6.1%) | 349 (0.5%) |
| $800 to $1,499 | 1,844 (7.8%) | 2,024 (2.8%) |
| $800 to $1,499 | 19,833 (84.1%) | 9,728 (13.3%) |
| Total | 23,595 (100.0%) | 73,423 (100.0%) |
Health & Disability in Raleigh
Health Insurance Coverage by Age in Raleigh
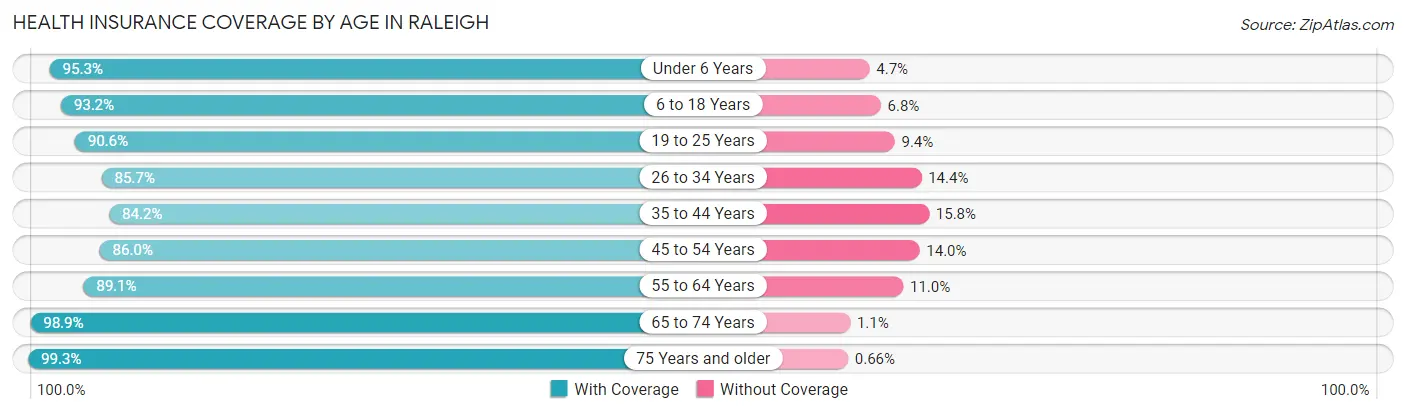
| Age Bracket | With Coverage | Without Coverage |
| Under 6 Years | 29,450 (95.3%) | 1,447 (4.7%) |
| 6 to 18 Years | 66,655 (93.2%) | 4,837 (6.8%) |
| 19 to 25 Years | 50,155 (90.6%) | 5,184 (9.4%) |
| 26 to 34 Years | 65,090 (85.7%) | 10,904 (14.3%) |
| 35 to 44 Years | 55,570 (84.2%) | 10,407 (15.8%) |
| 45 to 54 Years | 51,000 (86.0%) | 8,303 (14.0%) |
| 55 to 64 Years | 42,882 (89.0%) | 5,272 (11.0%) |
| 65 to 74 Years | 31,450 (98.9%) | 337 (1.1%) |
| 75 Years and older | 19,986 (99.3%) | 132 (0.7%) |
| Total | 412,238 (89.8%) | 46,823 (10.2%) |
Health Insurance Coverage by Citizenship Status in Raleigh
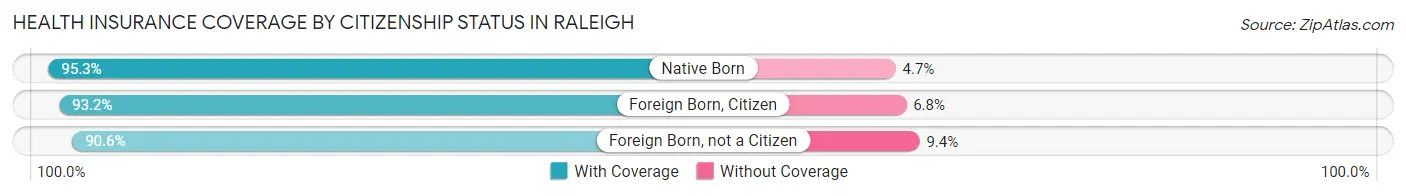
| Citizenship Status | With Coverage | Without Coverage |
| Native Born | 29,450 (95.3%) | 1,447 (4.7%) |
| Foreign Born, Citizen | 66,655 (93.2%) | 4,837 (6.8%) |
| Foreign Born, not a Citizen | 50,155 (90.6%) | 5,184 (9.4%) |
Health Insurance Coverage by Household Income in Raleigh
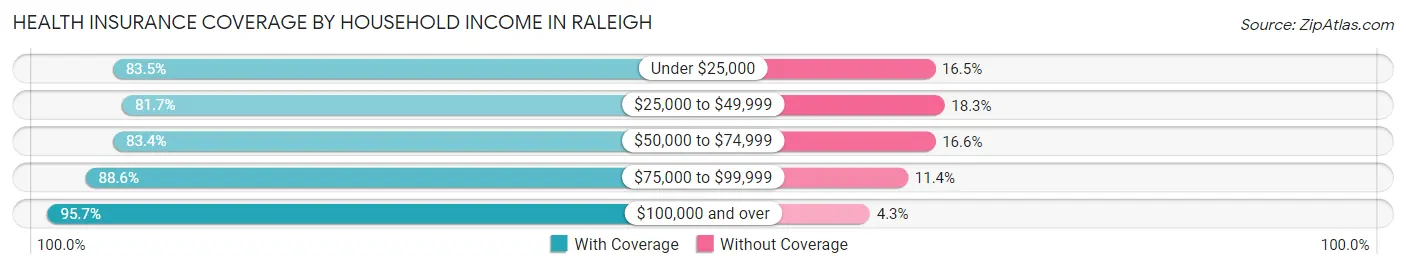
| Household Income | With Coverage | Without Coverage |
| Under $25,000 | 36,967 (83.5%) | 7,318 (16.5%) |
| $25,000 to $49,999 | 56,474 (81.7%) | 12,630 (18.3%) |
| $50,000 to $74,999 | 54,857 (83.4%) | 10,897 (16.6%) |
| $75,000 to $99,999 | 52,521 (88.6%) | 6,787 (11.4%) |
| $100,000 and over | 198,740 (95.7%) | 8,955 (4.3%) |
Public vs Private Health Insurance Coverage by Age in Raleigh
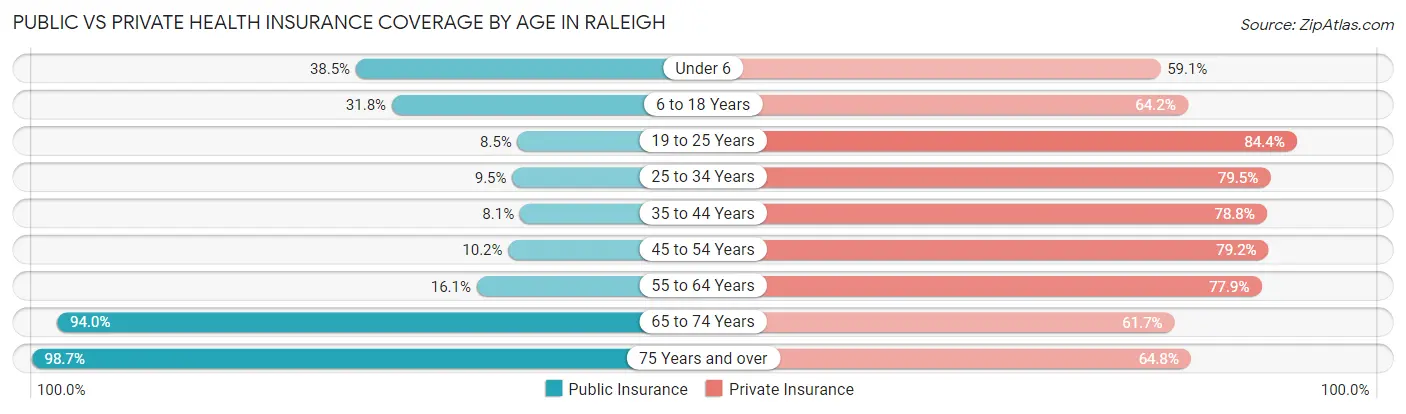
| Age Bracket | Public Insurance | Private Insurance |
| Under 6 | 11,895 (38.5%) | 18,259 (59.1%) |
| 6 to 18 Years | 22,747 (31.8%) | 45,875 (64.2%) |
| 19 to 25 Years | 4,690 (8.5%) | 46,708 (84.4%) |
| 25 to 34 Years | 7,191 (9.5%) | 60,411 (79.5%) |
| 35 to 44 Years | 5,309 (8.1%) | 52,016 (78.8%) |
| 45 to 54 Years | 6,053 (10.2%) | 46,954 (79.2%) |
| 55 to 64 Years | 7,737 (16.1%) | 37,488 (77.8%) |
| 65 to 74 Years | 29,870 (94.0%) | 19,621 (61.7%) |
| 75 Years and over | 19,857 (98.7%) | 13,028 (64.8%) |
| Total | 115,349 (25.1%) | 340,360 (74.1%) |
Disability Status by Sex by Age in Raleigh
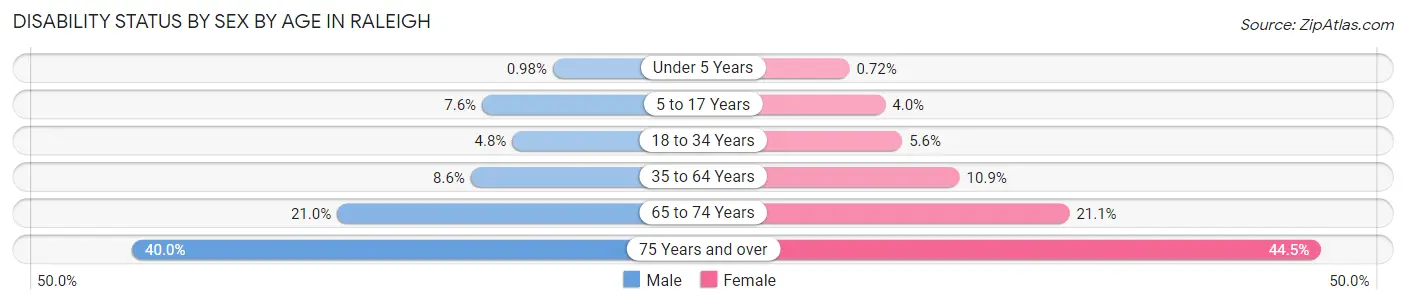
| Age Bracket | Male | Female |
| Under 5 Years | 130 (1.0%) | 89 (0.7%) |
| 5 to 17 Years | 2,701 (7.6%) | 1,274 (4.0%) |
| 18 to 34 Years | 3,284 (4.8%) | 4,028 (5.6%) |
| 35 to 64 Years | 7,214 (8.6%) | 9,797 (10.9%) |
| 65 to 74 Years | 2,925 (21.0%) | 3,775 (21.1%) |
| 75 Years and over | 3,069 (40.0%) | 5,536 (44.5%) |
Disability Class by Sex by Age in Raleigh
Disability Class: Hearing Difficulty
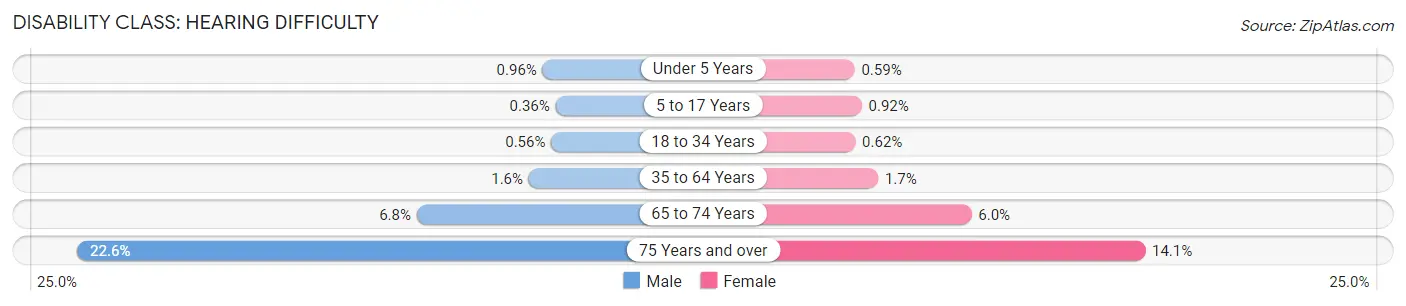
| Age Bracket | Male | Female |
| Under 5 Years | 127 (1.0%) | 73 (0.6%) |
| 5 to 17 Years | 130 (0.4%) | 290 (0.9%) |
| 18 to 34 Years | 384 (0.6%) | 443 (0.6%) |
| 35 to 64 Years | 1,344 (1.6%) | 1,501 (1.7%) |
| 65 to 74 Years | 947 (6.8%) | 1,073 (6.0%) |
| 75 Years and over | 1,730 (22.6%) | 1,752 (14.1%) |
Disability Class: Vision Difficulty
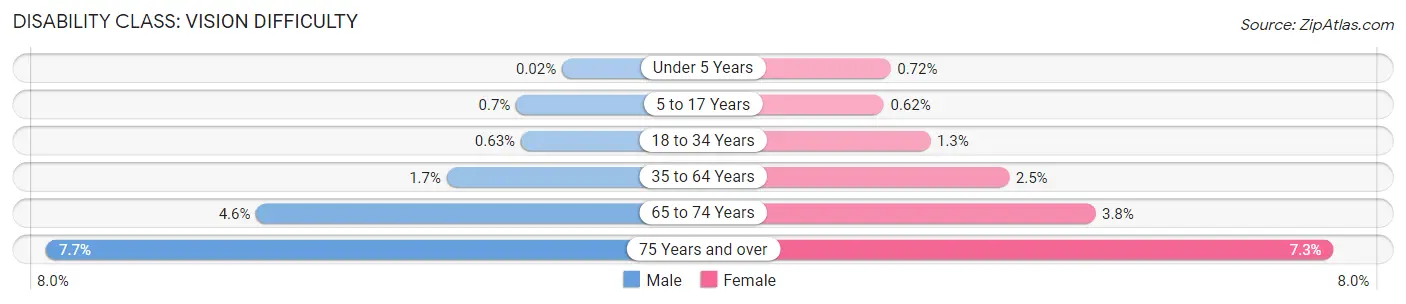
| Age Bracket | Male | Female |
| Under 5 Years | 3 (0.0%) | 89 (0.7%) |
| 5 to 17 Years | 250 (0.7%) | 194 (0.6%) |
| 18 to 34 Years | 434 (0.6%) | 944 (1.3%) |
| 35 to 64 Years | 1,449 (1.7%) | 2,220 (2.5%) |
| 65 to 74 Years | 635 (4.6%) | 672 (3.8%) |
| 75 Years and over | 589 (7.7%) | 909 (7.3%) |
Disability Class: Cognitive Difficulty
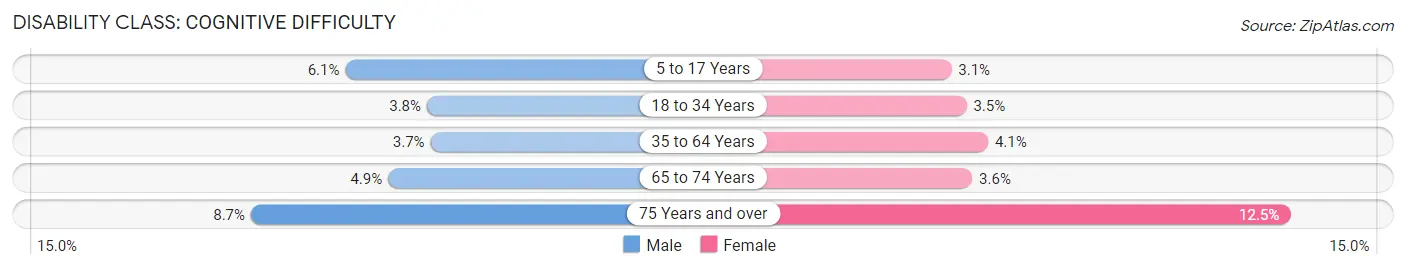
| Age Bracket | Male | Female |
| 5 to 17 Years | 2,167 (6.1%) | 960 (3.0%) |
| 18 to 34 Years | 2,622 (3.8%) | 2,493 (3.5%) |
| 35 to 64 Years | 3,103 (3.7%) | 3,646 (4.1%) |
| 65 to 74 Years | 679 (4.9%) | 649 (3.6%) |
| 75 Years and over | 667 (8.7%) | 1,558 (12.5%) |
Disability Class: Ambulatory Difficulty
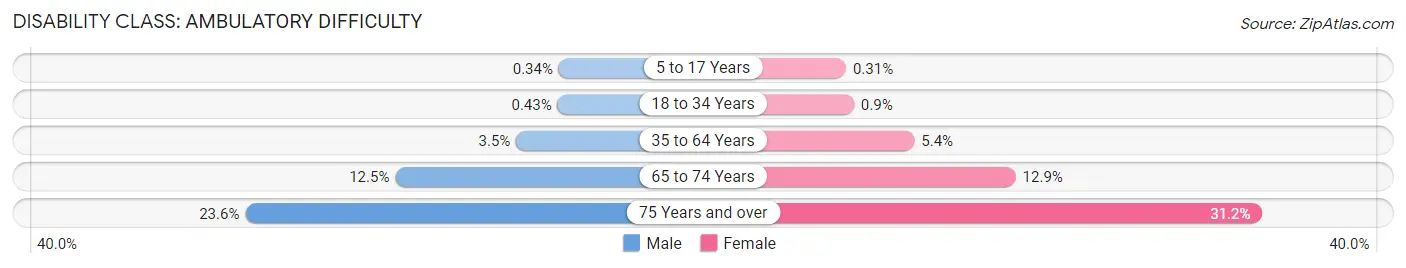
| Age Bracket | Male | Female |
| 5 to 17 Years | 123 (0.3%) | 99 (0.3%) |
| 18 to 34 Years | 296 (0.4%) | 649 (0.9%) |
| 35 to 64 Years | 2,933 (3.5%) | 4,826 (5.4%) |
| 65 to 74 Years | 1,737 (12.5%) | 2,306 (12.9%) |
| 75 Years and over | 1,811 (23.6%) | 3,887 (31.2%) |
Disability Class: Self-Care Difficulty
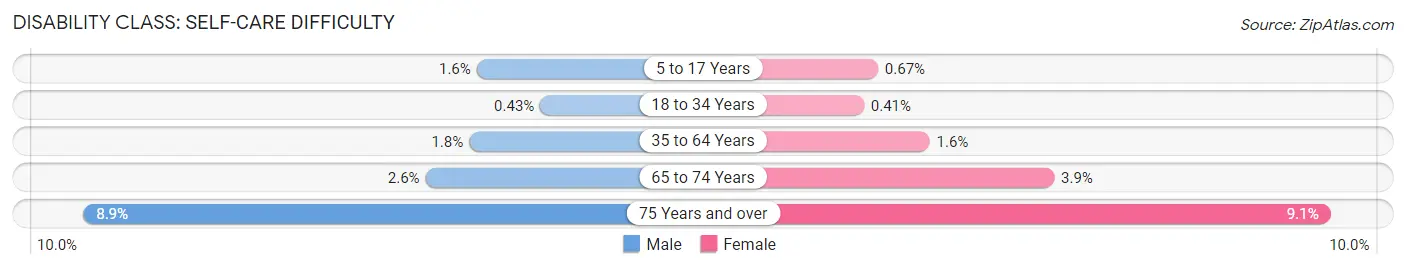
| Age Bracket | Male | Female |
| 5 to 17 Years | 576 (1.6%) | 210 (0.7%) |
| 18 to 34 Years | 300 (0.4%) | 292 (0.4%) |
| 35 to 64 Years | 1,472 (1.8%) | 1,458 (1.6%) |
| 65 to 74 Years | 357 (2.6%) | 703 (3.9%) |
| 75 Years and over | 683 (8.9%) | 1,129 (9.1%) |
Technology Access in Raleigh
Computing Device Access in Raleigh
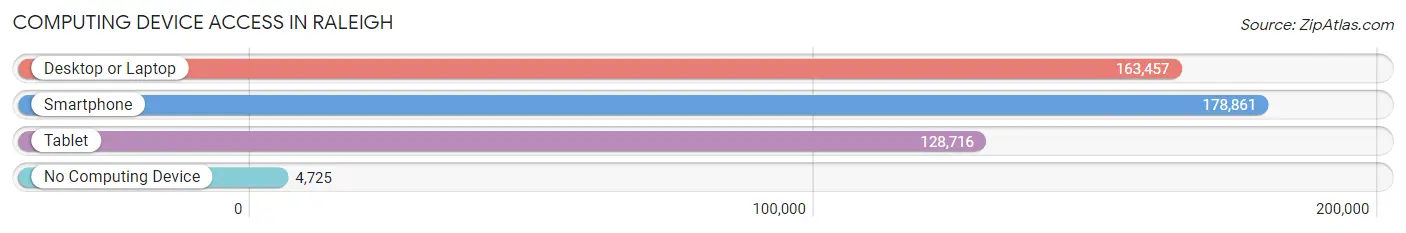
| Device Type | # Households | % Households |
| Desktop or Laptop | 163,457 | 86.1% |
| Smartphone | 178,861 | 94.2% |
| Tablet | 128,716 | 67.8% |
| No Computing Device | 4,725 | 2.5% |
| Total | 189,830 | 100.0% |
Internet Access in Raleigh
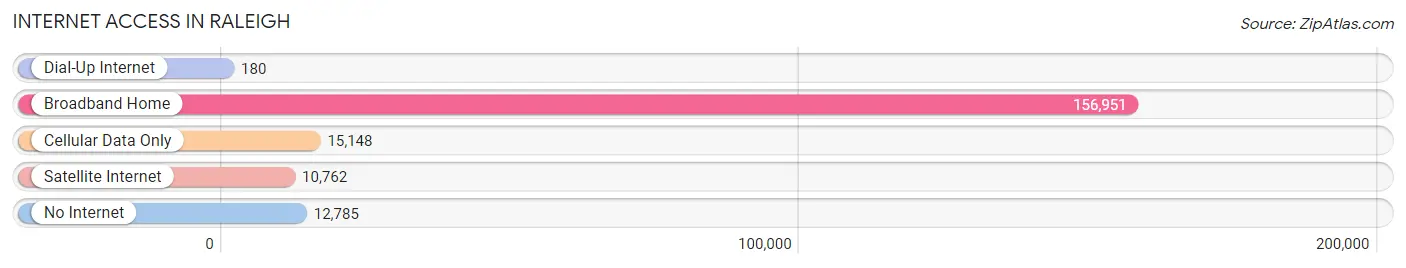
| Internet Type | # Households | % Households |
| Dial-Up Internet | 180 | 0.1% |
| Broadband Home | 156,951 | 82.7% |
| Cellular Data Only | 15,148 | 8.0% |
| Satellite Internet | 10,762 | 5.7% |
| No Internet | 12,785 | 6.7% |
| Total | 189,830 | 100.0% |
Raleigh Summary
Raleigh, North Carolina is the capital of the state and the second-largest city in the state. It is located in Wake County and is part of the Research Triangle metropolitan area. The city has a population of over 431,000 people and is the second-largest city in the state.
History
Raleigh was founded in 1792 as the capital of North Carolina. The city was named after Sir Walter Raleigh, who was an English explorer and colonizer. The city was planned by William Christmas, who was a surveyor and engineer. The city was laid out in a grid pattern with four streets running north-south and four streets running east-west. The city was designed to be the political and economic center of the state.
The city grew rapidly in the 19th century and became an important center for manufacturing and industry. The city was also a major center for education, with the University of North Carolina at Chapel Hill and North Carolina State University both located in the city.
In the 20th century, the city continued to grow and develop. The city was the site of the Research Triangle Park, which was established in 1959 and is now one of the largest research parks in the world. The city also became a major center for technology and innovation.
Geography
Raleigh is located in the Piedmont region of North Carolina. The city is situated on the Neuse River and is surrounded by rolling hills and forests. The city is located at an elevation of about 400 feet above sea level. The city has a humid subtropical climate with hot, humid summers and mild winters.
The city covers an area of about 144 square miles and is divided into several neighborhoods. The downtown area is the center of the city and is home to many of the city’s businesses, government buildings, and cultural attractions. The city is also home to several parks and green spaces, including William B. Umstead State Park and Pullen Park.
Economy
Raleigh is a major economic center in North Carolina. The city is home to several major corporations, including Red Hat, Lenovo, and IBM. The city is also home to several universities and colleges, including the University of North Carolina at Chapel Hill and North Carolina State University.
The city’s economy is also driven by the technology and research industries. The city is home to the Research Triangle Park, which is one of the largest research parks in the world. The city is also home to several major hospitals and medical centers.
Demographics
Raleigh has a population of over 431,000 people. The city is racially diverse, with the largest racial groups being White (56.2%), African American (30.2%), and Hispanic or Latino (7.7%). The city is also home to a large number of immigrants, with the largest immigrant groups being from India, China, and Mexico.
The city has a median household income of $60,000 and a poverty rate of 15.2%. The city also has a high rate of educational attainment, with over 80% of the population having a high school diploma or higher.
Raleigh is a vibrant and diverse city with a rich history and a strong economy. The city is home to several major corporations, universities, and research centers. The city is also home to a diverse population and is a major center for technology and innovation.
Common Questions
What is Per Capita Income in Raleigh?
Per Capita income in Raleigh is $47,257.
What is the Median Family Income in Raleigh?
Median Family Income in Raleigh is $103,882.
What is the Median Household income in Raleigh?
Median Household Income in Raleigh is $78,631.
What is Income or Wage Gap in Raleigh?
Income or Wage Gap in Raleigh is 18.1%.
Women in Raleigh earn 81.9 cents for every dollar earned by a man.
What is Family Income Deficit in Raleigh?
Family Income Deficit in Raleigh is $10,749.
Families that are below poverty line in Raleigh earn $10,749 less on average than the poverty threshold level.
What is Inequality or Gini Index in Raleigh?
Inequality or Gini Index in Raleigh is 0.48.
What is the Total Population of Raleigh?
Total Population of Raleigh is 465,517.
What is the Total Male Population of Raleigh?
Total Male Population of Raleigh is 227,275.
What is the Total Female Population of Raleigh?
Total Female Population of Raleigh is 238,242.
What is the Ratio of Males per 100 Females in Raleigh?
There are 95.40 Males per 100 Females in Raleigh.
What is the Ratio of Females per 100 Males in Raleigh?
There are 104.83 Females per 100 Males in Raleigh.
What is the Median Population Age in Raleigh?
Median Population Age in Raleigh is 34.6 Years.
What is the Average Family Size in Raleigh
Average Family Size in Raleigh is 3.1 People.
What is the Average Household Size in Raleigh
Average Household Size in Raleigh is 2.4 People.
How Large is the Labor Force in Raleigh?
There are 267,788 People in the Labor Forcein in Raleigh.
What is the Percentage of People in the Labor Force in Raleigh?
69.8% of People are in the Labor Force in Raleigh.
What is the Unemployment Rate in Raleigh?
Unemployment Rate in Raleigh is 4.5%.