Sacramento, CA Map & Demographics
Sacramento Map
Sacramento Overview
$39,336
PER CAPITA INCOME
$92,595
AVG FAMILY INCOME
$78,954
AVG HOUSEHOLD INCOME
14.5%
WAGE / INCOME GAP [ % ]
85.5¢/ $1
WAGE / INCOME GAP [ $ ]
$12,144
FAMILY INCOME DEFICIT
0.45
INEQUALITY / GINI INDEX
523,600
TOTAL POPULATION
258,612
MALE POPULATION
264,988
FEMALE POPULATION
97.59
MALES / 100 FEMALES
102.47
FEMALES / 100 MALES
35.2
MEDIAN AGE
3.4
AVG FAMILY SIZE
2.6
AVG HOUSEHOLD SIZE
272,517
LABOR FORCE [ PEOPLE ]
64.6%
PERCENT IN LABOR FORCE
6.3%
UNEMPLOYMENT RATE
Sacramento Zip Codes
Income in Sacramento
Income Overview in Sacramento
Per Capita Income in Sacramento is $39,336, while median incomes of families and households are $92,595 and $78,954 respectively.
| Characteristic | Number | Measure |
| Per Capita Income | 523,600 | $39,336 |
| Median Family Income | 115,910 | $92,595 |
| Mean Family Income | 115,910 | $116,333 |
| Median Household Income | 196,524 | $78,954 |
| Mean Household Income | 196,524 | $102,258 |
| Income Deficit | 115,910 | $12,144 |
| Wage / Income Gap (%) | 523,600 | 14.54% |
| Wage / Income Gap ($) | 523,600 | 85.46¢ per $1 |
| Gini / Inequality Index | 523,600 | 0.45 |
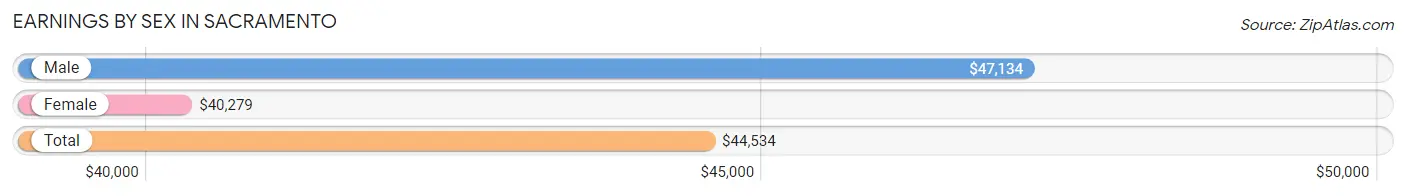
Earnings by Sex in Sacramento
Average Earnings in Sacramento are $44,534, $47,134 for men and $40,279 for women, a difference of 14.5%.
| Sex | Number | Average Earnings |
| Male | 145,096 (52.0%) | $47,134 |
| Female | 133,746 (48.0%) | $40,279 |
| Total | 278,842 (100.0%) | $44,534 |
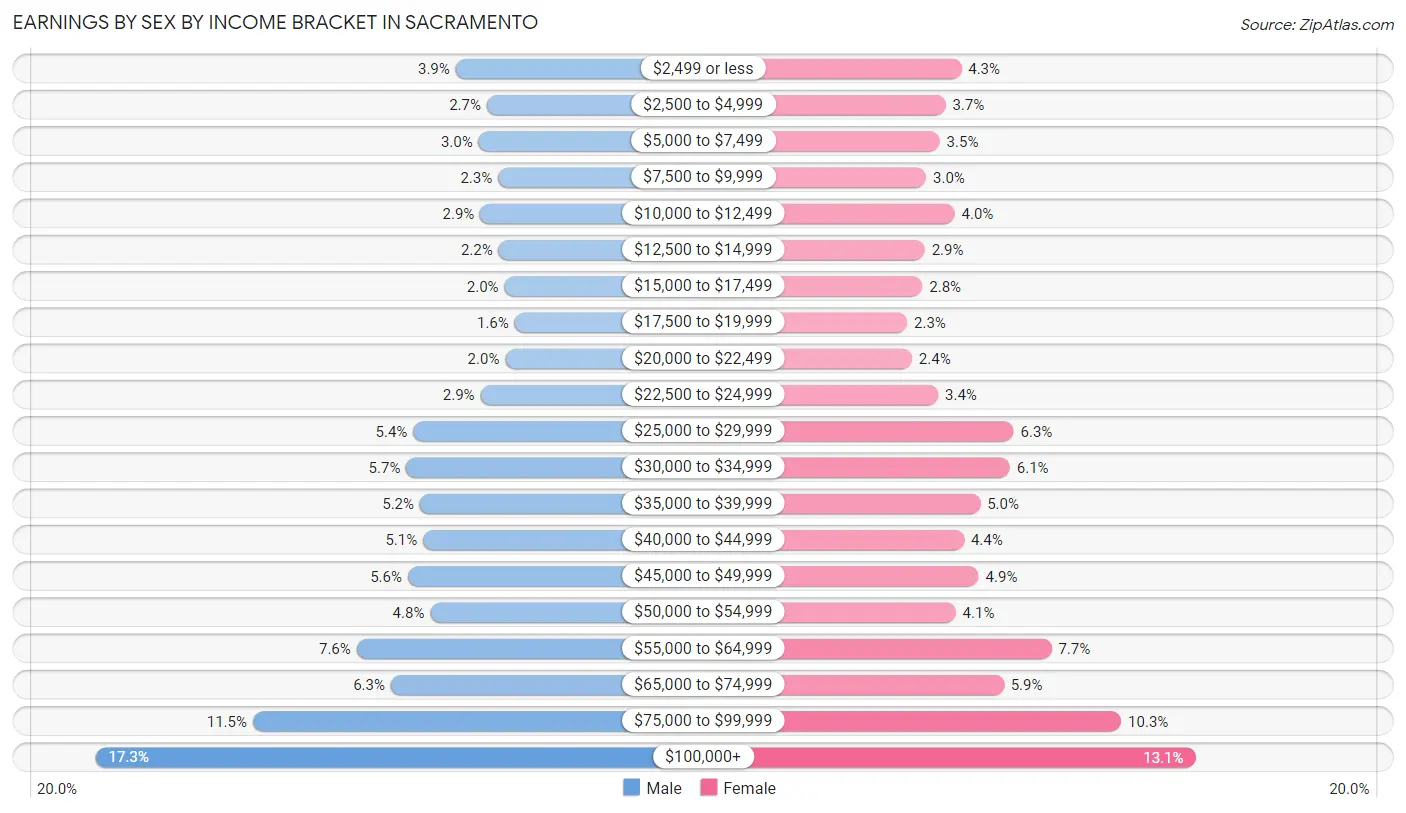
Earnings by Sex by Income Bracket in Sacramento
The most common earnings brackets in Sacramento are $100,000+ for men (25,165 | 17.3%) and $100,000+ for women (17,469 | 13.1%).
| Income | Male | Female |
| $2,499 or less | 5,589 (3.8%) | 5,735 (4.3%) |
| $2,500 to $4,999 | 3,882 (2.7%) | 4,946 (3.7%) |
| $5,000 to $7,499 | 4,336 (3.0%) | 4,648 (3.5%) |
| $7,500 to $9,999 | 3,276 (2.3%) | 3,975 (3.0%) |
| $10,000 to $12,499 | 4,258 (2.9%) | 5,407 (4.0%) |
| $12,500 to $14,999 | 3,249 (2.2%) | 3,905 (2.9%) |
| $15,000 to $17,499 | 2,937 (2.0%) | 3,781 (2.8%) |
| $17,500 to $19,999 | 2,382 (1.6%) | 3,029 (2.3%) |
| $20,000 to $22,499 | 2,884 (2.0%) | 3,267 (2.4%) |
| $22,500 to $24,999 | 4,234 (2.9%) | 4,570 (3.4%) |
| $25,000 to $29,999 | 7,896 (5.4%) | 8,361 (6.2%) |
| $30,000 to $34,999 | 8,271 (5.7%) | 8,176 (6.1%) |
| $35,000 to $39,999 | 7,531 (5.2%) | 6,681 (5.0%) |
| $40,000 to $44,999 | 7,363 (5.1%) | 5,870 (4.4%) |
| $45,000 to $49,999 | 8,186 (5.6%) | 6,604 (4.9%) |
| $50,000 to $54,999 | 6,959 (4.8%) | 5,459 (4.1%) |
| $55,000 to $64,999 | 10,974 (7.6%) | 10,255 (7.7%) |
| $65,000 to $74,999 | 9,112 (6.3%) | 7,865 (5.9%) |
| $75,000 to $99,999 | 16,612 (11.5%) | 13,743 (10.3%) |
| $100,000+ | 25,165 (17.3%) | 17,469 (13.1%) |
| Total | 145,096 (100.0%) | 133,746 (100.0%) |
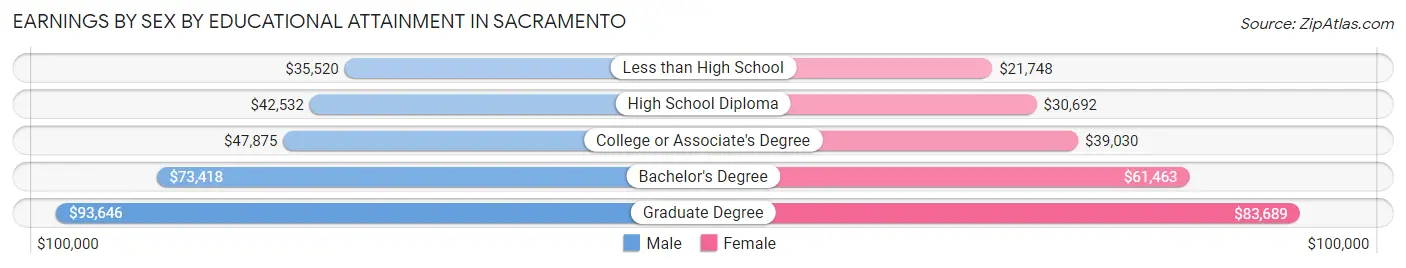
Earnings by Sex by Educational Attainment in Sacramento
Average earnings in Sacramento are $53,505 for men and $46,784 for women, a difference of 12.6%. Men with an educational attainment of graduate degree enjoy the highest average annual earnings of $93,646, while those with less than high school education earn the least with $35,520. Women with an educational attainment of graduate degree earn the most with the average annual earnings of $83,689, while those with less than high school education have the smallest earnings of $21,748.
| Educational Attainment | Male Income | Female Income |
| Less than High School | $35,520 | $21,748 |
| High School Diploma | $42,532 | $30,692 |
| College or Associate's Degree | $47,875 | $39,030 |
| Bachelor's Degree | $73,418 | $61,463 |
| Graduate Degree | $93,646 | $83,689 |
| Total | $53,505 | $46,784 |
Family Income in Sacramento
Family Income Brackets in Sacramento
According to the Sacramento family income data, there are 23,414 families falling into the $100,000 to $149,999 income range, which is the most common income bracket and makes up 20.2% of all families. Conversely, the $10,000 to $14,999 income bracket is the least frequent group with only 2,666 families (2.3%) belonging to this category.
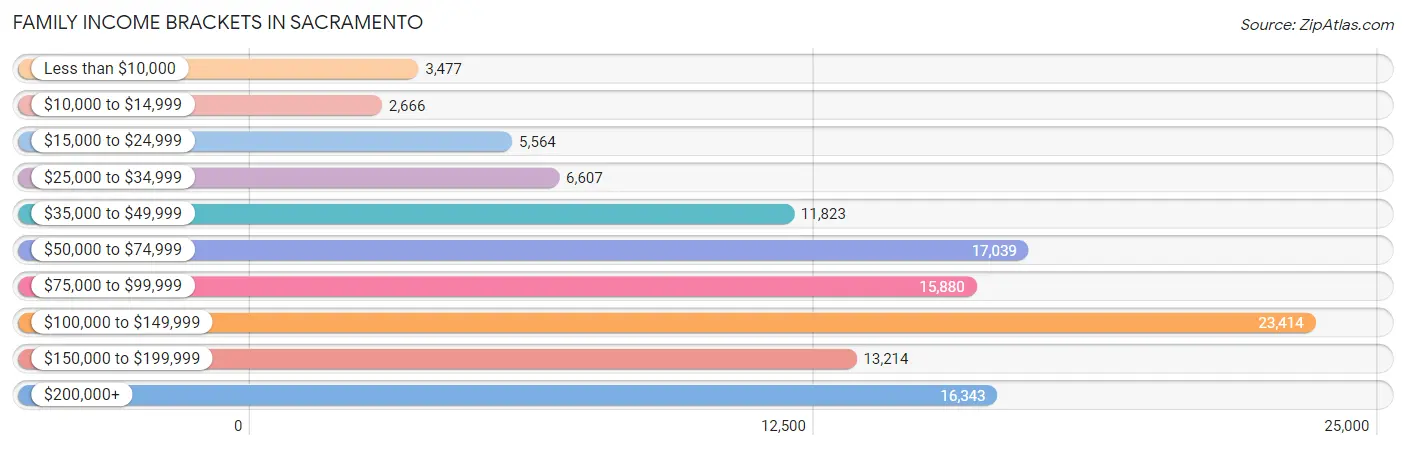
| Income Bracket | # Families | % Families |
| Less than $10,000 | 3,477 | 3.0% |
| $10,000 to $14,999 | 2,666 | 2.3% |
| $15,000 to $24,999 | 5,564 | 4.8% |
| $25,000 to $34,999 | 6,607 | 5.7% |
| $35,000 to $49,999 | 11,823 | 10.2% |
| $50,000 to $74,999 | 17,039 | 14.7% |
| $75,000 to $99,999 | 15,880 | 13.7% |
| $100,000 to $149,999 | 23,414 | 20.2% |
| $150,000 to $199,999 | 13,214 | 11.4% |
| $200,000+ | 16,343 | 14.1% |
Family Income by Famaliy Size in Sacramento
7+ person families (4,079 | 3.5%) account for the highest median family income in Sacramento with $111,576 per family, while 2-person families (47,660 | 41.1%) have the highest median income of $44,447 per family member.
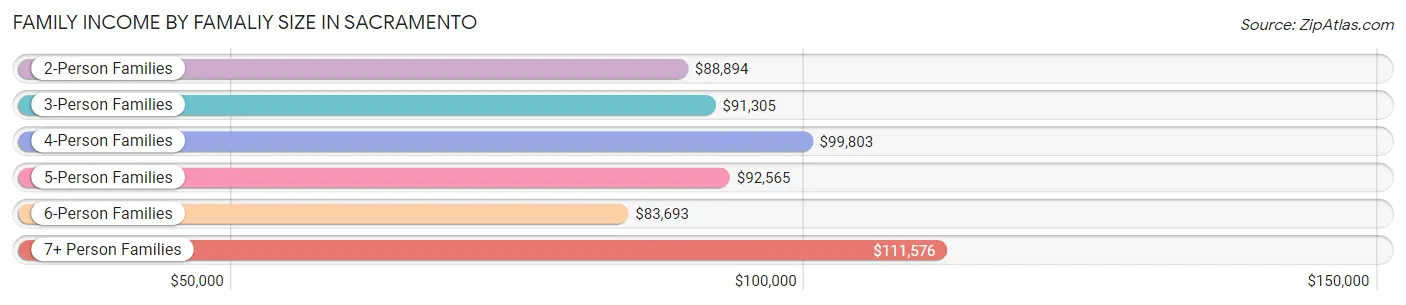
| Income Bracket | # Families | Median Income |
| 2-Person Families | 47,660 (41.1%) | $88,894 |
| 3-Person Families | 25,639 (22.1%) | $91,305 |
| 4-Person Families | 22,253 (19.2%) | $99,803 |
| 5-Person Families | 11,660 (10.1%) | $92,565 |
| 6-Person Families | 4,619 (4.0%) | $83,693 |
| 7+ Person Families | 4,079 (3.5%) | $111,576 |
| Total | 115,910 (100.0%) | $92,595 |
Family Income by Number of Earners in Sacramento
The median family income in Sacramento is $92,595, with families comprising 3+ earners (14,372) having the highest median family income of $137,735, while families with no earners (15,586) have the lowest median family income of $47,291, accounting for 12.4% and 13.5% of families, respectively.
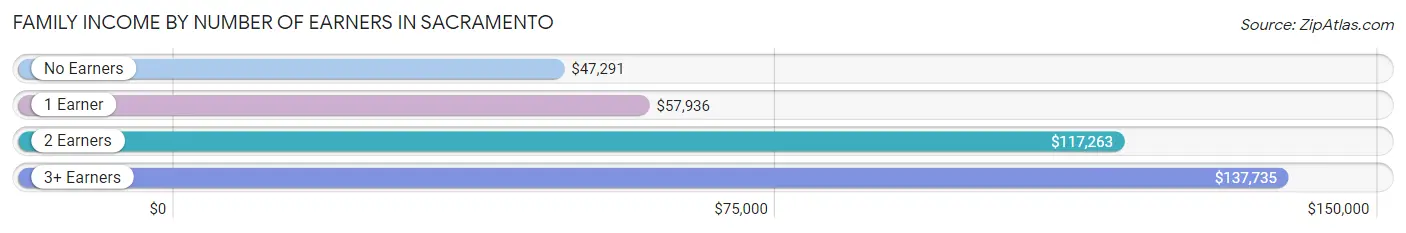
| Number of Earners | # Families | Median Income |
| No Earners | 15,586 (13.5%) | $47,291 |
| 1 Earner | 37,085 (32.0%) | $57,936 |
| 2 Earners | 48,867 (42.2%) | $117,263 |
| 3+ Earners | 14,372 (12.4%) | $137,735 |
| Total | 115,910 (100.0%) | $92,595 |
Household Income in Sacramento
Household Income Brackets in Sacramento
With 36,357 households falling in the category, the $100,000 to $149,999 income range is the most frequent in Sacramento, accounting for 18.5% of all households. In contrast, only 9,433 households (4.8%) fall into the less than $10,000 income bracket, making it the least populous group.
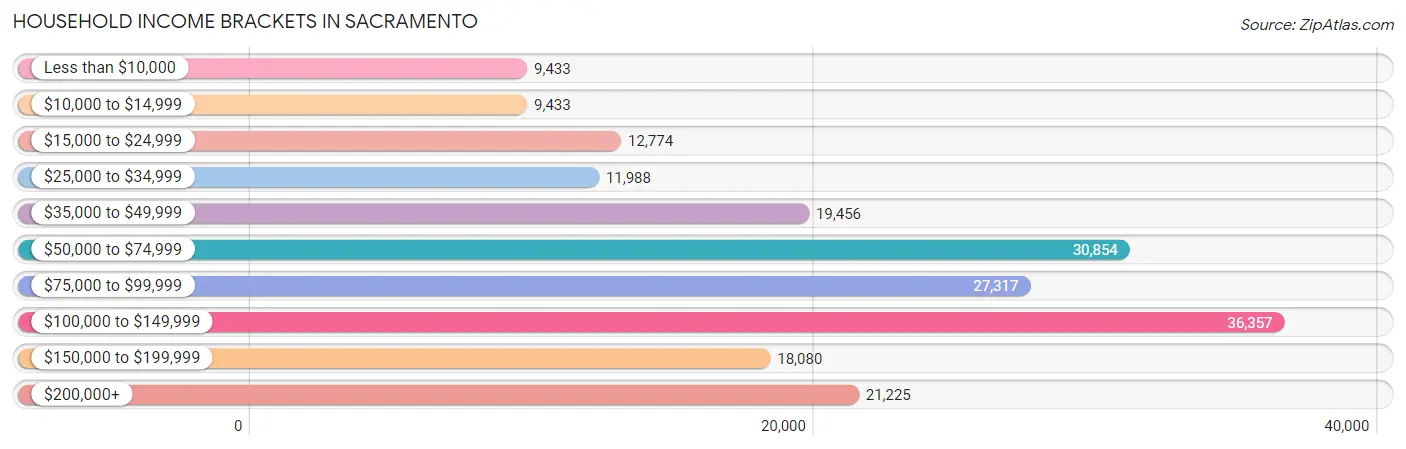
| Income Bracket | # Households | % Households |
| Less than $10,000 | 9,433 | 4.8% |
| $10,000 to $14,999 | 9,433 | 4.8% |
| $15,000 to $24,999 | 12,774 | 6.5% |
| $25,000 to $34,999 | 11,988 | 6.1% |
| $35,000 to $49,999 | 19,456 | 9.9% |
| $50,000 to $74,999 | 30,854 | 15.7% |
| $75,000 to $99,999 | 27,317 | 13.9% |
| $100,000 to $149,999 | 36,357 | 18.5% |
| $150,000 to $199,999 | 18,080 | 9.2% |
| $200,000+ | 21,225 | 10.8% |
Household Income by Householder Age in Sacramento
The median household income in Sacramento is $78,954, with the highest median household income of $90,798 found in the 45 to 64 years age bracket for the primary householder. A total of 65,670 households (33.4%) fall into this category. Meanwhile, the 15 to 24 years age bracket for the primary householder has the lowest median household income of $46,463, with 7,468 households (3.8%) in this group.
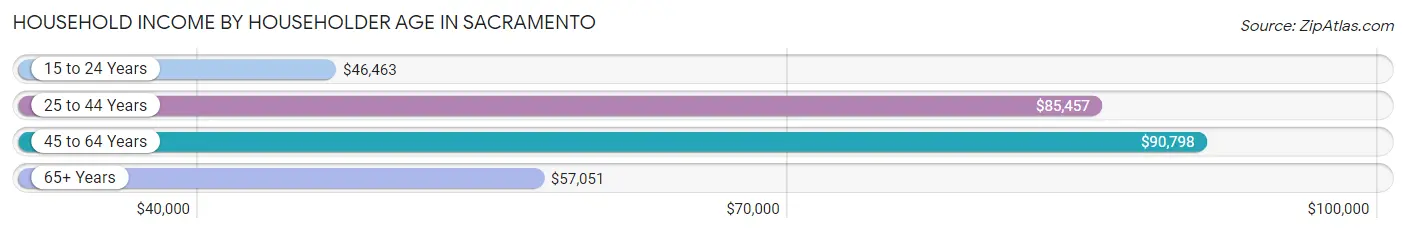
| Income Bracket | # Households | Median Income |
| 15 to 24 Years | 7,468 (3.8%) | $46,463 |
| 25 to 44 Years | 79,930 (40.7%) | $85,457 |
| 45 to 64 Years | 65,670 (33.4%) | $90,798 |
| 65+ Years | 43,456 (22.1%) | $57,051 |
| Total | 196,524 (100.0%) | $78,954 |
Poverty in Sacramento
Income Below Poverty by Sex and Age in Sacramento
With 13.8% poverty level for males and 15.8% for females among the residents of Sacramento, 15 year old males and 18 to 24 year old females are the most vulnerable to poverty, with 904 males (26.5%) and 5,658 females (25.2%) in their respective age groups living below the poverty level.
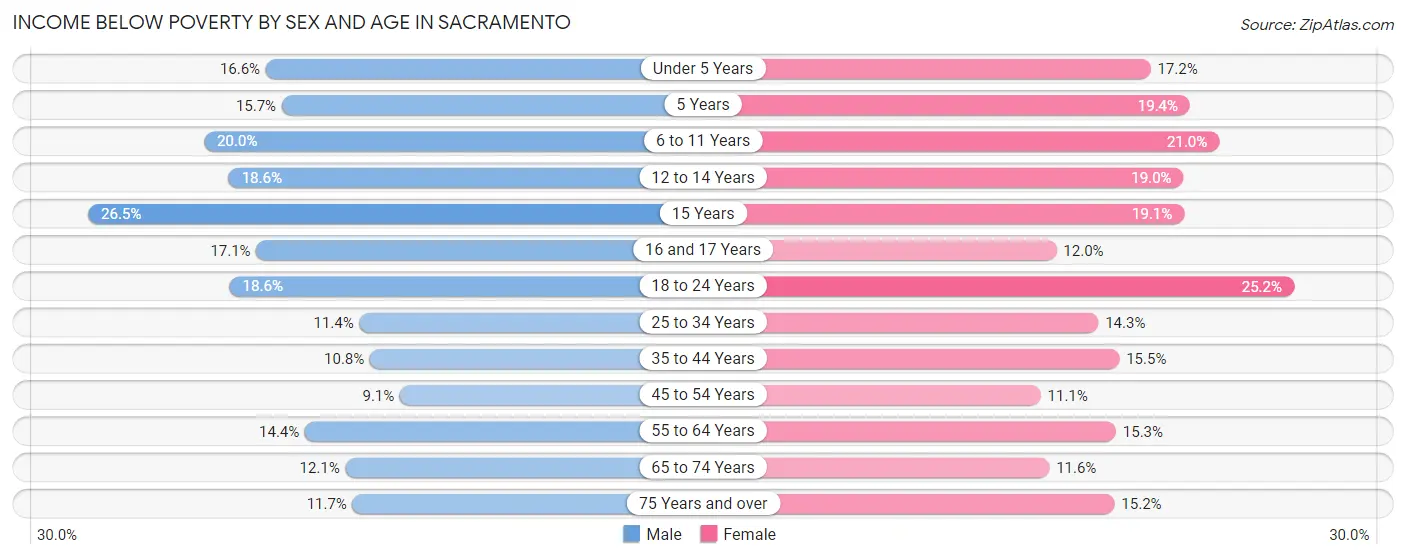
| Age Bracket | Male | Female |
| Under 5 Years | 2,660 (16.6%) | 2,598 (17.2%) |
| 5 Years | 460 (15.7%) | 623 (19.4%) |
| 6 to 11 Years | 4,019 (20.0%) | 3,706 (21.0%) |
| 12 to 14 Years | 1,823 (18.6%) | 1,725 (19.0%) |
| 15 Years | 904 (26.5%) | 573 (19.1%) |
| 16 and 17 Years | 1,047 (17.1%) | 841 (11.9%) |
| 18 to 24 Years | 4,529 (18.6%) | 5,658 (25.2%) |
| 25 to 34 Years | 5,290 (11.4%) | 6,834 (14.3%) |
| 35 to 44 Years | 3,996 (10.8%) | 5,647 (15.4%) |
| 45 to 54 Years | 2,743 (9.1%) | 3,364 (11.1%) |
| 55 to 64 Years | 3,744 (14.4%) | 4,630 (15.3%) |
| 65 to 74 Years | 2,467 (12.1%) | 2,575 (11.6%) |
| 75 Years and over | 1,366 (11.7%) | 2,503 (15.2%) |
| Total | 35,048 (13.8%) | 41,277 (15.8%) |
Income Above Poverty by Sex and Age in Sacramento
According to the poverty statistics in Sacramento, males aged 45 to 54 years and females aged 45 to 54 years are the age groups that are most secure financially, with 90.9% of males and 88.9% of females in these age groups living above the poverty line.
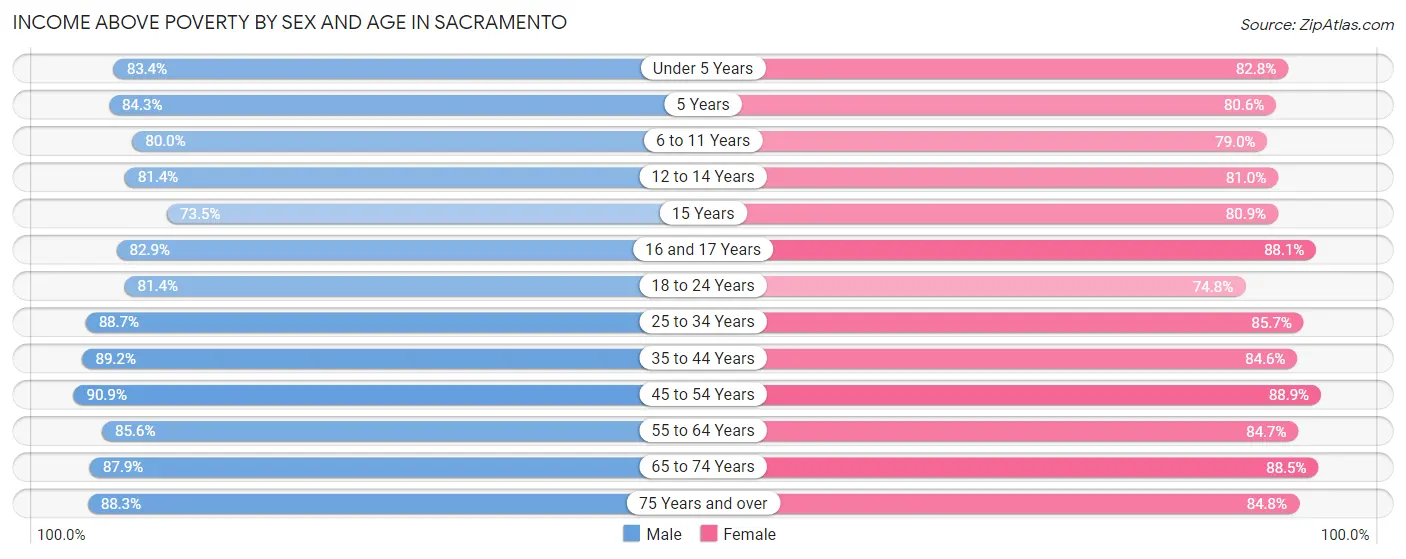
| Age Bracket | Male | Female |
| Under 5 Years | 13,404 (83.4%) | 12,515 (82.8%) |
| 5 Years | 2,475 (84.3%) | 2,592 (80.6%) |
| 6 to 11 Years | 16,063 (80.0%) | 13,937 (79.0%) |
| 12 to 14 Years | 7,962 (81.4%) | 7,344 (81.0%) |
| 15 Years | 2,512 (73.5%) | 2,433 (80.9%) |
| 16 and 17 Years | 5,079 (82.9%) | 6,194 (88.0%) |
| 18 to 24 Years | 19,853 (81.4%) | 16,824 (74.8%) |
| 25 to 34 Years | 41,308 (88.6%) | 41,031 (85.7%) |
| 35 to 44 Years | 33,138 (89.2%) | 30,912 (84.6%) |
| 45 to 54 Years | 27,439 (90.9%) | 27,013 (88.9%) |
| 55 to 64 Years | 22,296 (85.6%) | 25,705 (84.7%) |
| 65 to 74 Years | 17,867 (87.9%) | 19,724 (88.4%) |
| 75 Years and over | 10,277 (88.3%) | 13,985 (84.8%) |
| Total | 219,673 (86.2%) | 220,209 (84.2%) |
Income Below Poverty Among Married-Couple Families in Sacramento
The poverty statistics for married-couple families in Sacramento show that 6.5% or 4,926 of the total 75,795 families live below the poverty line. Families with 5 or more children have the highest poverty rate of 29.0%, comprising of 227 families. On the other hand, families with no children have the lowest poverty rate of 3.6%, which includes 1,457 families.
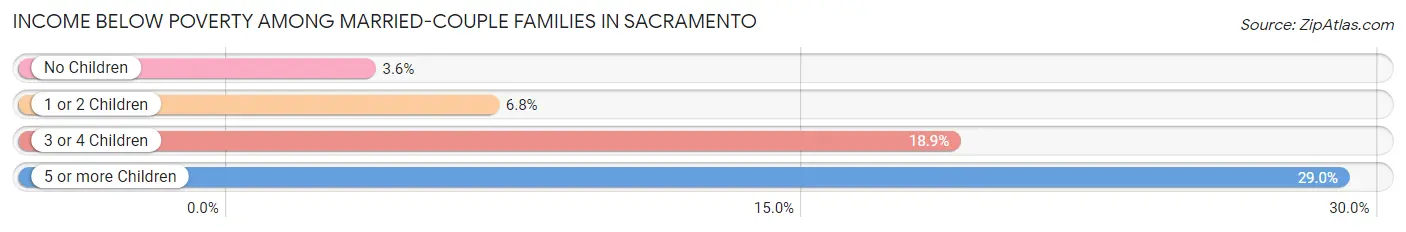
| Children | Above Poverty | Below Poverty |
| No Children | 39,173 (96.4%) | 1,457 (3.6%) |
| 1 or 2 Children | 25,089 (93.2%) | 1,833 (6.8%) |
| 3 or 4 Children | 6,052 (81.1%) | 1,409 (18.9%) |
| 5 or more Children | 555 (71.0%) | 227 (29.0%) |
| Total | 70,869 (93.5%) | 4,926 (6.5%) |
Income Below Poverty Among Single-Parent Households in Sacramento
According to the poverty data in Sacramento, 9.9% or 1,289 single-father households and 20.1% or 5,429 single-mother households are living below the poverty line. Among single-father households, those with 5 or more children have the highest poverty rate, with 38 households (31.9%) experiencing poverty. Likewise, among single-mother households, those with 5 or more children have the highest poverty rate, with 217 households (60.6%) falling below the poverty line.
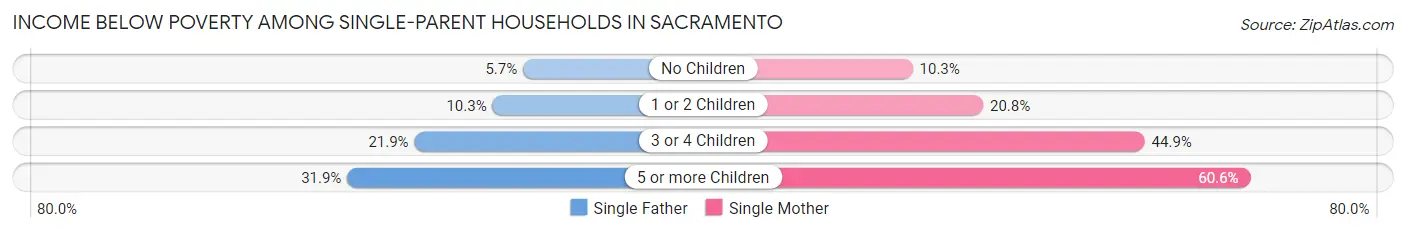
| Children | Single Father | Single Mother |
| No Children | 335 (5.7%) | 1,119 (10.3%) |
| 1 or 2 Children | 562 (10.3%) | 2,588 (20.8%) |
| 3 or 4 Children | 354 (21.9%) | 1,505 (44.9%) |
| 5 or more Children | 38 (31.9%) | 217 (60.6%) |
| Total | 1,289 (9.9%) | 5,429 (20.1%) |
Income Below Poverty Among Married-Couple vs Single-Parent Households in Sacramento
The poverty data for Sacramento shows that 4,926 of the married-couple family households (6.5%) and 6,718 of the single-parent households (16.8%) are living below the poverty level. Within the married-couple family households, those with 5 or more children have the highest poverty rate, with 227 households (29.0%) falling below the poverty line. Among the single-parent households, those with 5 or more children have the highest poverty rate, with 255 household (53.5%) living below poverty.
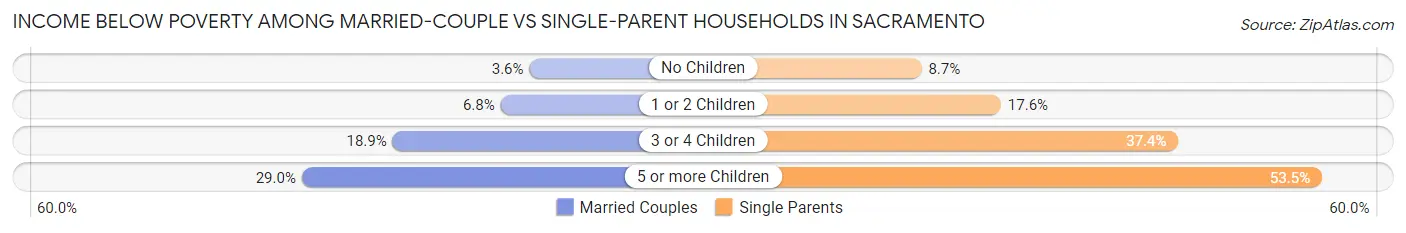
| Children | Married-Couple Families | Single-Parent Households |
| No Children | 1,457 (3.6%) | 1,454 (8.7%) |
| 1 or 2 Children | 1,833 (6.8%) | 3,150 (17.6%) |
| 3 or 4 Children | 1,409 (18.9%) | 1,859 (37.4%) |
| 5 or more Children | 227 (29.0%) | 255 (53.5%) |
| Total | 4,926 (6.5%) | 6,718 (16.8%) |
Race in Sacramento
The most populous races in Sacramento are White / Caucasian (205,913 | 39.3%), Hispanic or Latino (153,778 | 29.4%), and Asian (102,179 | 19.5%).
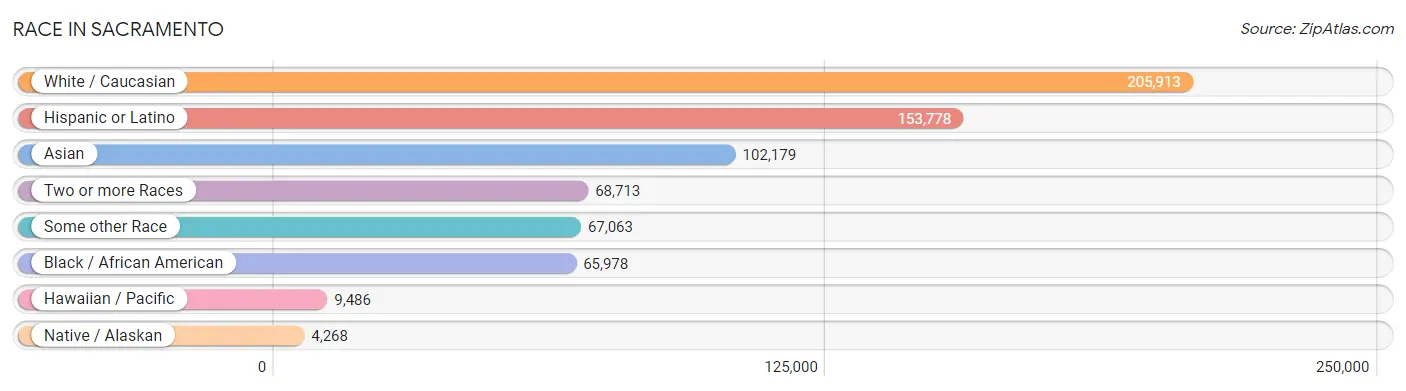
| Race | # Population | % Population |
| Asian | 102,179 | 19.5% |
| Black / African American | 65,978 | 12.6% |
| Hawaiian / Pacific | 9,486 | 1.8% |
| Hispanic or Latino | 153,778 | 29.4% |
| Native / Alaskan | 4,268 | 0.8% |
| White / Caucasian | 205,913 | 39.3% |
| Two or more Races | 68,713 | 13.1% |
| Some other Race | 67,063 | 12.8% |
| Total | 523,600 | 100.0% |
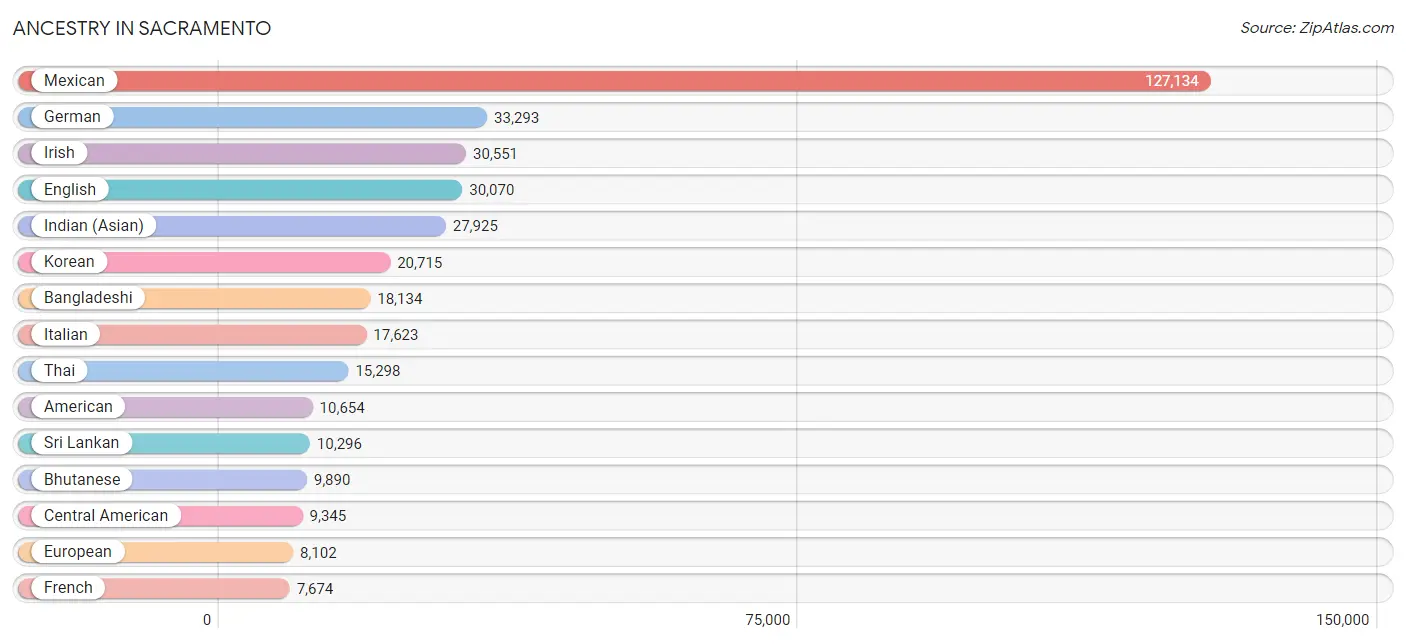
Ancestry in Sacramento
The most populous ancestries reported in Sacramento are Mexican (127,134 | 24.3%), German (33,293 | 6.4%), Irish (30,551 | 5.8%), English (30,070 | 5.7%), and Indian (Asian) (27,925 | 5.3%), together accounting for 47.5% of all Sacramento residents.
| Ancestry | # Population | % Population |
| Afghan | 1,953 | 0.4% |
| African | 3,266 | 0.6% |
| Alaskan Athabascan | 6 | 0.0% |
| Albanian | 23 | 0.0% |
| Aleut | 22 | 0.0% |
| Alsatian | 6 | 0.0% |
| American | 10,654 | 2.0% |
| Apache | 815 | 0.2% |
| Arab | 3,699 | 0.7% |
| Argentinean | 220 | 0.0% |
| Armenian | 605 | 0.1% |
| Assyrian / Chaldean / Syriac | 9 | 0.0% |
| Australian | 193 | 0.0% |
| Austrian | 634 | 0.1% |
| Bahamian | 8 | 0.0% |
| Bangladeshi | 18,134 | 3.5% |
| Barbadian | 62 | 0.0% |
| Basque | 168 | 0.0% |
| Belgian | 164 | 0.0% |
| Belizean | 53 | 0.0% |
| Bermudan | 17 | 0.0% |
| Bhutanese | 9,890 | 1.9% |
| Blackfeet | 867 | 0.2% |
| Bolivian | 126 | 0.0% |
| Brazilian | 613 | 0.1% |
| British | 2,402 | 0.5% |
| British West Indian | 5 | 0.0% |
| Bulgarian | 193 | 0.0% |
| Burmese | 2,886 | 0.5% |
| Cajun | 72 | 0.0% |
| Cambodian | 46 | 0.0% |
| Canadian | 470 | 0.1% |
| Cape Verdean | 231 | 0.0% |
| Celtic | 132 | 0.0% |
| Central American | 9,345 | 1.8% |
| Central American Indian | 327 | 0.1% |
| Cherokee | 2,792 | 0.5% |
| Chickasaw | 133 | 0.0% |
| Chilean | 132 | 0.0% |
| Chippewa | 94 | 0.0% |
| Choctaw | 987 | 0.2% |
| Colombian | 1,036 | 0.2% |
| Colville | 8 | 0.0% |
| Comanche | 239 | 0.1% |
| Costa Rican | 533 | 0.1% |
| Cree | 236 | 0.1% |
| Creek | 526 | 0.1% |
| Croatian | 845 | 0.2% |
| Crow | 19 | 0.0% |
| Cuban | 708 | 0.1% |
| Czech | 759 | 0.1% |
| Czechoslovakian | 223 | 0.0% |
| Danish | 2,130 | 0.4% |
| Delaware | 26 | 0.0% |
| Dominican | 528 | 0.1% |
| Dutch | 2,931 | 0.6% |
| Eastern European | 744 | 0.1% |
| Ecuadorian | 461 | 0.1% |
| Egyptian | 384 | 0.1% |
| English | 30,070 | 5.7% |
| Estonian | 63 | 0.0% |
| Ethiopian | 465 | 0.1% |
| European | 8,102 | 1.5% |
| Fijian | 660 | 0.1% |
| Filipino | 511 | 0.1% |
| Finnish | 628 | 0.1% |
| French | 7,674 | 1.5% |
| French American Indian | 39 | 0.0% |
| French Canadian | 1,241 | 0.2% |
| German | 33,293 | 6.4% |
| German Russian | 35 | 0.0% |
| Ghanaian | 125 | 0.0% |
| Greek | 1,639 | 0.3% |
| Guamanian / Chamorro | 454 | 0.1% |
| Guatemalan | 2,248 | 0.4% |
| Guyanese | 17 | 0.0% |
| Haitian | 317 | 0.1% |
| Hmong | 36 | 0.0% |
| Honduran | 579 | 0.1% |
| Hopi | 100 | 0.0% |
| Hungarian | 891 | 0.2% |
| Icelander | 52 | 0.0% |
| Indian (Asian) | 27,925 | 5.3% |
| Indonesian | 140 | 0.0% |
| Inupiat | 8 | 0.0% |
| Iranian | 654 | 0.1% |
| Iraqi | 357 | 0.1% |
| Irish | 30,551 | 5.8% |
| Iroquois | 96 | 0.0% |
| Israeli | 161 | 0.0% |
| Italian | 17,623 | 3.4% |
| Jamaican | 476 | 0.1% |
| Japanese | 1,714 | 0.3% |
| Jordanian | 276 | 0.1% |
| Kenyan | 394 | 0.1% |
| Korean | 20,715 | 4.0% |
| Laotian | 579 | 0.1% |
| Latvian | 167 | 0.0% |
| Lebanese | 260 | 0.1% |
| Liberian | 198 | 0.0% |
| Lithuanian | 623 | 0.1% |
| Luxembourger | 36 | 0.0% |
| Macedonian | 19 | 0.0% |
| Malaysian | 5,040 | 1.0% |
| Maltese | 80 | 0.0% |
| Marshallese | 17 | 0.0% |
| Menominee | 24 | 0.0% |
| Mexican | 127,134 | 24.3% |
| Mexican American Indian | 1,977 | 0.4% |
| Mongolian | 64 | 0.0% |
| Moroccan | 74 | 0.0% |
| Native Hawaiian | 1,821 | 0.4% |
| Navajo | 485 | 0.1% |
| Nepalese | 2,223 | 0.4% |
| New Zealander | 18 | 0.0% |
| Nicaraguan | 1,373 | 0.3% |
| Nigerian | 1,038 | 0.2% |
| Northern European | 865 | 0.2% |
| Norwegian | 4,587 | 0.9% |
| Okinawan | 44 | 0.0% |
| Paiute | 362 | 0.1% |
| Pakistani | 994 | 0.2% |
| Palestinian | 246 | 0.1% |
| Panamanian | 322 | 0.1% |
| Pennsylvania German | 78 | 0.0% |
| Peruvian | 1,157 | 0.2% |
| Pima | 33 | 0.0% |
| Polish | 5,411 | 1.0% |
| Portuguese | 5,482 | 1.1% |
| Potawatomi | 6 | 0.0% |
| Pueblo | 93 | 0.0% |
| Puerto Rican | 4,535 | 0.9% |
| Puget Sound Salish | 74 | 0.0% |
| Romanian | 1,545 | 0.3% |
| Russian | 4,519 | 0.9% |
| Salvadoran | 4,290 | 0.8% |
| Samoan | 1,032 | 0.2% |
| Scandinavian | 1,442 | 0.3% |
| Scotch-Irish | 3,234 | 0.6% |
| Scottish | 5,769 | 1.1% |
| Seminole | 140 | 0.0% |
| Senegalese | 69 | 0.0% |
| Serbian | 201 | 0.0% |
| Shoshone | 51 | 0.0% |
| Sierra Leonean | 32 | 0.0% |
| Sioux | 314 | 0.1% |
| Slavic | 555 | 0.1% |
| Slovak | 325 | 0.1% |
| Slovene | 16 | 0.0% |
| Somali | 8 | 0.0% |
| South African | 215 | 0.0% |
| South American | 3,512 | 0.7% |
| South American Indian | 228 | 0.0% |
| Spaniard | 2,976 | 0.6% |
| Spanish | 1,895 | 0.4% |
| Spanish American | 81 | 0.0% |
| Spanish American Indian | 22 | 0.0% |
| Sri Lankan | 10,296 | 2.0% |
| Subsaharan African | 7,166 | 1.4% |
| Swedish | 4,186 | 0.8% |
| Swiss | 1,048 | 0.2% |
| Syrian | 508 | 0.1% |
| Taiwanese | 68 | 0.0% |
| Thai | 15,298 | 2.9% |
| Tohono O'Odham | 36 | 0.0% |
| Tongan | 424 | 0.1% |
| Trinidadian and Tobagonian | 97 | 0.0% |
| Tsimshian | 12 | 0.0% |
| Turkish | 120 | 0.0% |
| Ugandan | 175 | 0.0% |
| Ukrainian | 2,312 | 0.4% |
| Uruguayan | 16 | 0.0% |
| Venezuelan | 364 | 0.1% |
| Vietnamese | 30 | 0.0% |
| Welsh | 2,118 | 0.4% |
| West Indian | 74 | 0.0% |
| Yakama | 16 | 0.0% |
| Yaqui | 172 | 0.0% |
| Yugoslavian | 401 | 0.1% |
| Yup'ik | 6 | 0.0% | View All 180 Rows |
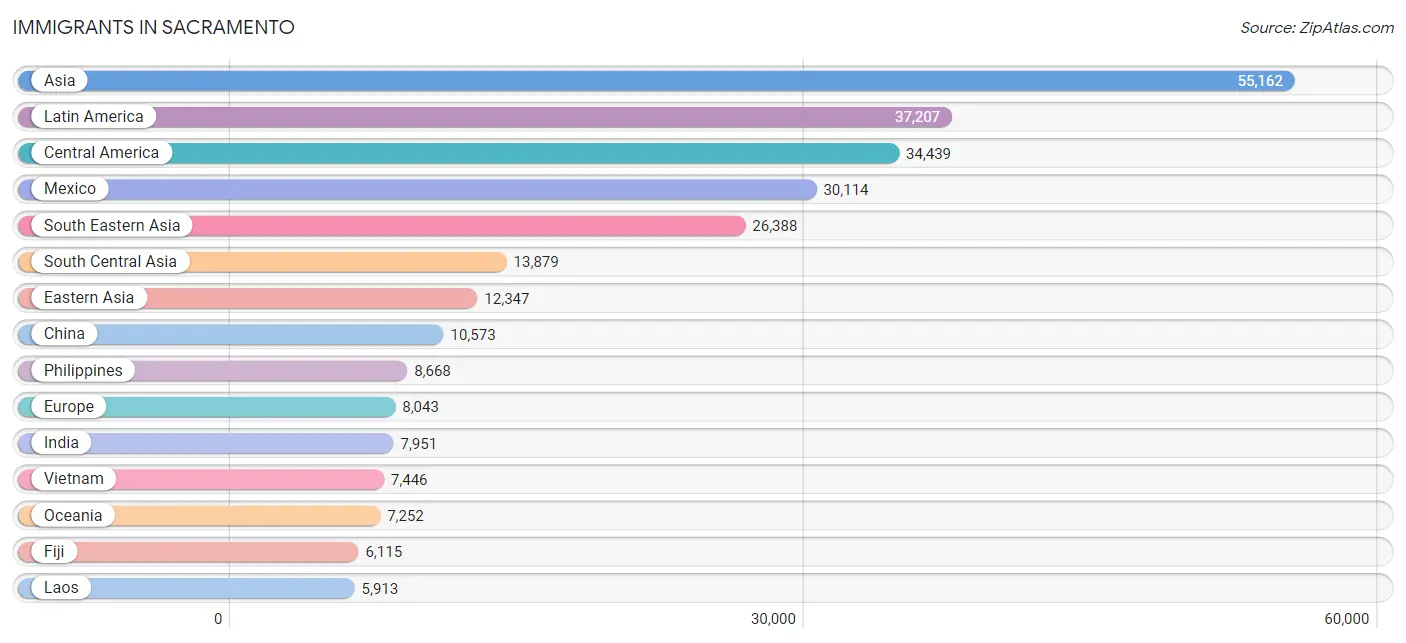
Immigrants in Sacramento
The most numerous immigrant groups reported in Sacramento came from Asia (55,162 | 10.5%), Latin America (37,207 | 7.1%), Central America (34,439 | 6.6%), Mexico (30,114 | 5.8%), and South Eastern Asia (26,388 | 5.0%), together accounting for 35.0% of all Sacramento residents.
| Immigration Origin | # Population | % Population |
| Afghanistan | 2,222 | 0.4% |
| Africa | 2,898 | 0.5% |
| Albania | 14 | 0.0% |
| Argentina | 85 | 0.0% |
| Armenia | 99 | 0.0% |
| Asia | 55,162 | 10.5% |
| Australia | 108 | 0.0% |
| Austria | 67 | 0.0% |
| Azores | 44 | 0.0% |
| Bangladesh | 23 | 0.0% |
| Belarus | 150 | 0.0% |
| Belgium | 9 | 0.0% |
| Belize | 74 | 0.0% |
| Bolivia | 19 | 0.0% |
| Bosnia and Herzegovina | 41 | 0.0% |
| Brazil | 529 | 0.1% |
| Bulgaria | 55 | 0.0% |
| Cabo Verde | 46 | 0.0% |
| Cambodia | 453 | 0.1% |
| Cameroon | 49 | 0.0% |
| Canada | 975 | 0.2% |
| Caribbean | 696 | 0.1% |
| Central America | 34,439 | 6.6% |
| Chile | 83 | 0.0% |
| China | 10,573 | 2.0% |
| Colombia | 645 | 0.1% |
| Costa Rica | 292 | 0.1% |
| Croatia | 26 | 0.0% |
| Cuba | 96 | 0.0% |
| Czechoslovakia | 92 | 0.0% |
| Denmark | 39 | 0.0% |
| Dominican Republic | 134 | 0.0% |
| Eastern Africa | 1,058 | 0.2% |
| Eastern Asia | 12,347 | 2.4% |
| Eastern Europe | 5,137 | 1.0% |
| Ecuador | 113 | 0.0% |
| Egypt | 125 | 0.0% |
| El Salvador | 2,000 | 0.4% |
| England | 547 | 0.1% |
| Eritrea | 23 | 0.0% |
| Ethiopia | 331 | 0.1% |
| Europe | 8,043 | 1.5% |
| Fiji | 6,115 | 1.2% |
| France | 159 | 0.0% |
| Germany | 437 | 0.1% |
| Ghana | 173 | 0.0% |
| Greece | 150 | 0.0% |
| Guatemala | 1,007 | 0.2% |
| Guyana | 19 | 0.0% |
| Haiti | 128 | 0.0% |
| Honduras | 510 | 0.1% |
| Hong Kong | 1,693 | 0.3% |
| Hungary | 52 | 0.0% |
| India | 7,951 | 1.5% |
| Indonesia | 508 | 0.1% |
| Iran | 405 | 0.1% |
| Iraq | 709 | 0.1% |
| Ireland | 124 | 0.0% |
| Israel | 170 | 0.0% |
| Italy | 249 | 0.1% |
| Jamaica | 243 | 0.1% |
| Japan | 889 | 0.2% |
| Jordan | 99 | 0.0% |
| Kazakhstan | 196 | 0.0% |
| Kenya | 519 | 0.1% |
| Korea | 885 | 0.2% |
| Kuwait | 39 | 0.0% |
| Laos | 5,913 | 1.1% |
| Latin America | 37,207 | 7.1% |
| Latvia | 96 | 0.0% |
| Lebanon | 138 | 0.0% |
| Liberia | 244 | 0.1% |
| Lithuania | 48 | 0.0% |
| Malaysia | 169 | 0.0% |
| Mexico | 30,114 | 5.8% |
| Micronesia | 123 | 0.0% |
| Middle Africa | 49 | 0.0% |
| Moldova | 453 | 0.1% |
| Morocco | 23 | 0.0% |
| Nepal | 633 | 0.1% |
| Netherlands | 19 | 0.0% |
| Nicaragua | 336 | 0.1% |
| Nigeria | 578 | 0.1% |
| North Macedonia | 19 | 0.0% |
| Northern Africa | 216 | 0.0% |
| Northern Europe | 1,508 | 0.3% |
| Norway | 75 | 0.0% |
| Oceania | 7,252 | 1.4% |
| Pakistan | 2,145 | 0.4% |
| Panama | 106 | 0.0% |
| Peru | 421 | 0.1% |
| Philippines | 8,668 | 1.7% |
| Poland | 394 | 0.1% |
| Portugal | 137 | 0.0% |
| Romania | 404 | 0.1% |
| Russia | 1,578 | 0.3% |
| Saudi Arabia | 307 | 0.1% |
| Scotland | 44 | 0.0% |
| Senegal | 137 | 0.0% |
| Serbia | 20 | 0.0% |
| Sierra Leone | 32 | 0.0% |
| Singapore | 47 | 0.0% |
| Somalia | 8 | 0.0% |
| South Africa | 288 | 0.1% |
| South America | 2,072 | 0.4% |
| South Central Asia | 13,879 | 2.6% |
| South Eastern Asia | 26,388 | 5.0% |
| Southern Europe | 638 | 0.1% |
| Spain | 102 | 0.0% |
| Sri Lanka | 118 | 0.0% |
| Sudan | 8 | 0.0% |
| Sweden | 58 | 0.0% |
| Switzerland | 30 | 0.0% |
| Syria | 476 | 0.1% |
| Taiwan | 666 | 0.1% |
| Thailand | 2,738 | 0.5% |
| Trinidad and Tobago | 24 | 0.0% |
| Turkey | 45 | 0.0% |
| Uganda | 90 | 0.0% |
| Ukraine | 1,566 | 0.3% |
| Uzbekistan | 98 | 0.0% |
| Venezuela | 158 | 0.0% |
| Vietnam | 7,446 | 1.4% |
| West Indies | 19 | 0.0% |
| Western Africa | 1,210 | 0.2% |
| Western Asia | 2,414 | 0.5% |
| Western Europe | 721 | 0.1% |
| Zimbabwe | 21 | 0.0% | View All 128 Rows |
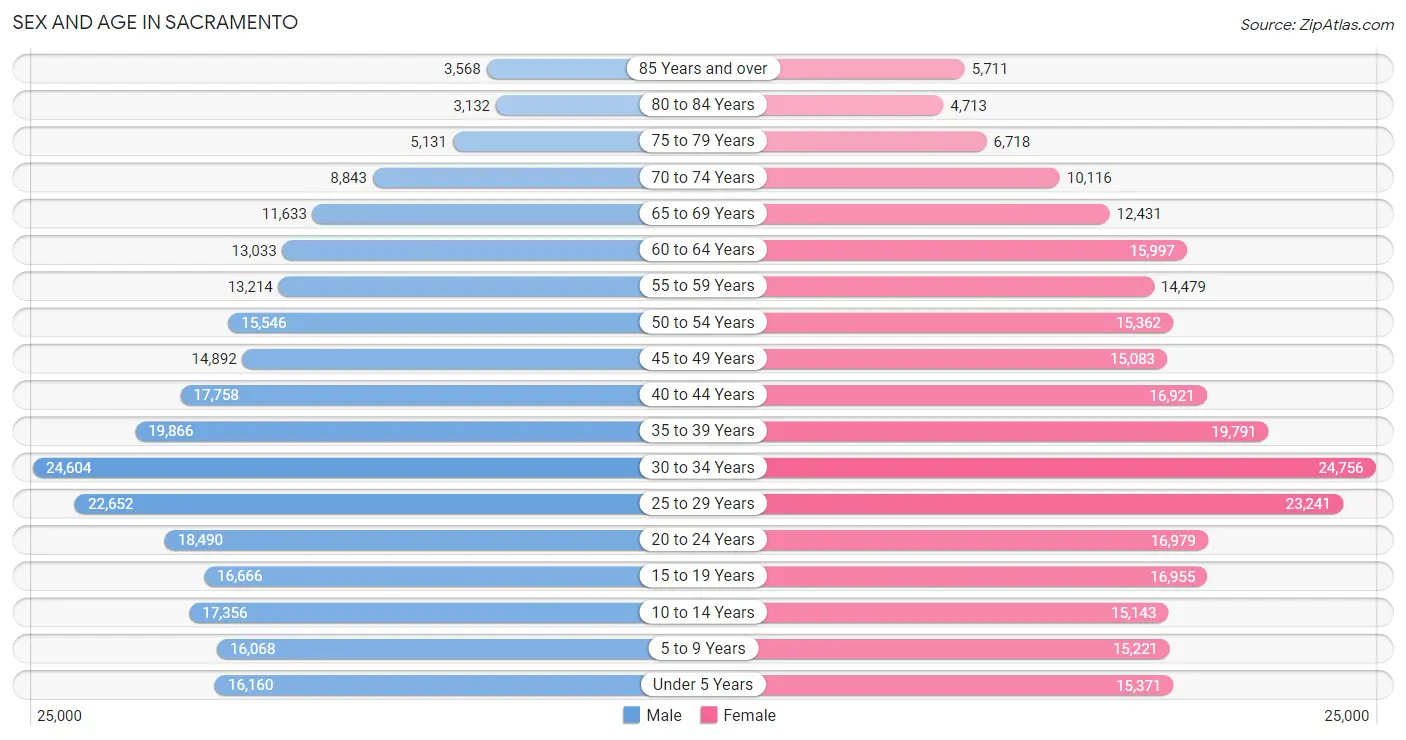
Sex and Age in Sacramento
Sex and Age in Sacramento
The most populous age groups in Sacramento are 30 to 34 Years (24,604 | 9.5%) for men and 30 to 34 Years (24,756 | 9.3%) for women.
| Age Bracket | Male | Female |
| Under 5 Years | 16,160 (6.2%) | 15,371 (5.8%) |
| 5 to 9 Years | 16,068 (6.2%) | 15,221 (5.7%) |
| 10 to 14 Years | 17,356 (6.7%) | 15,143 (5.7%) |
| 15 to 19 Years | 16,666 (6.4%) | 16,955 (6.4%) |
| 20 to 24 Years | 18,490 (7.1%) | 16,979 (6.4%) |
| 25 to 29 Years | 22,652 (8.8%) | 23,241 (8.8%) |
| 30 to 34 Years | 24,604 (9.5%) | 24,756 (9.3%) |
| 35 to 39 Years | 19,866 (7.7%) | 19,791 (7.5%) |
| 40 to 44 Years | 17,758 (6.9%) | 16,921 (6.4%) |
| 45 to 49 Years | 14,892 (5.8%) | 15,083 (5.7%) |
| 50 to 54 Years | 15,546 (6.0%) | 15,362 (5.8%) |
| 55 to 59 Years | 13,214 (5.1%) | 14,479 (5.5%) |
| 60 to 64 Years | 13,033 (5.0%) | 15,997 (6.0%) |
| 65 to 69 Years | 11,633 (4.5%) | 12,431 (4.7%) |
| 70 to 74 Years | 8,843 (3.4%) | 10,116 (3.8%) |
| 75 to 79 Years | 5,131 (2.0%) | 6,718 (2.5%) |
| 80 to 84 Years | 3,132 (1.2%) | 4,713 (1.8%) |
| 85 Years and over | 3,568 (1.4%) | 5,711 (2.2%) |
| Total | 258,612 (100.0%) | 264,988 (100.0%) |
Families and Households in Sacramento
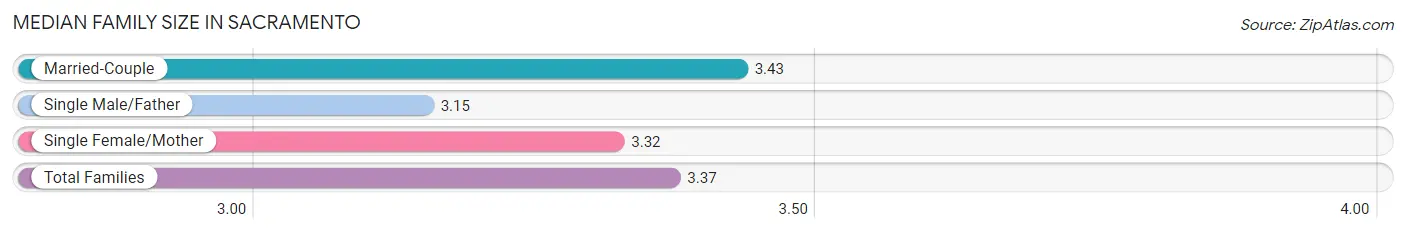
Median Family Size in Sacramento
The median family size in Sacramento is 3.37 persons per family, with married-couple families (75,795 | 65.4%) accounting for the largest median family size of 3.43 persons per family. On the other hand, single male/father families (13,045 | 11.3%) represent the smallest median family size with 3.15 persons per family.
| Family Type | # Families | Family Size |
| Married-Couple | 75,795 (65.4%) | 3.43 |
| Single Male/Father | 13,045 (11.3%) | 3.15 |
| Single Female/Mother | 27,070 (23.4%) | 3.32 |
| Total Families | 115,910 (100.0%) | 3.37 |
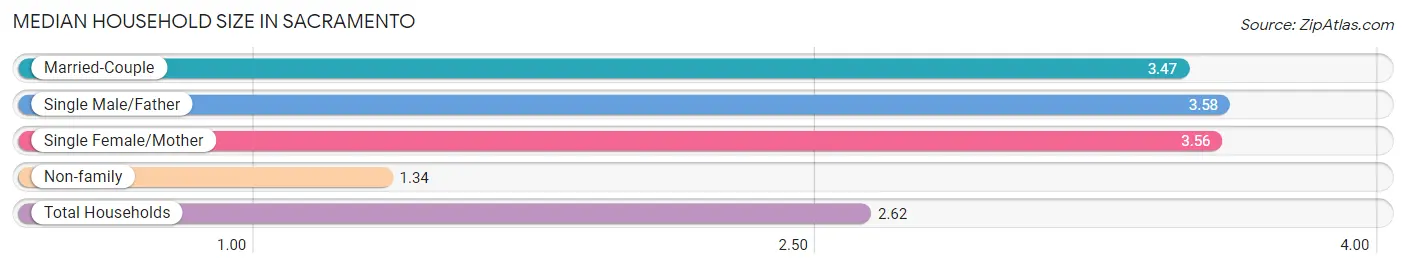
Median Household Size in Sacramento
The median household size in Sacramento is 2.62 persons per household, with single male/father households (13,045 | 6.6%) accounting for the largest median household size of 3.58 persons per household. non-family households (80,614 | 41.0%) represent the smallest median household size with 1.34 persons per household.
| Household Type | # Households | Household Size |
| Married-Couple | 75,795 (38.6%) | 3.47 |
| Single Male/Father | 13,045 (6.6%) | 3.58 |
| Single Female/Mother | 27,070 (13.8%) | 3.56 |
| Non-family | 80,614 (41.0%) | 1.34 |
| Total Households | 196,524 (100.0%) | 2.62 |
Household Size by Marriage Status in Sacramento
Out of a total of 196,524 households in Sacramento, 115,910 (59.0%) are family households, while 80,614 (41.0%) are nonfamily households. The most numerous type of family households are 2-person households, comprising 43,291, and the most common type of nonfamily households are 1-person households, comprising 61,148.
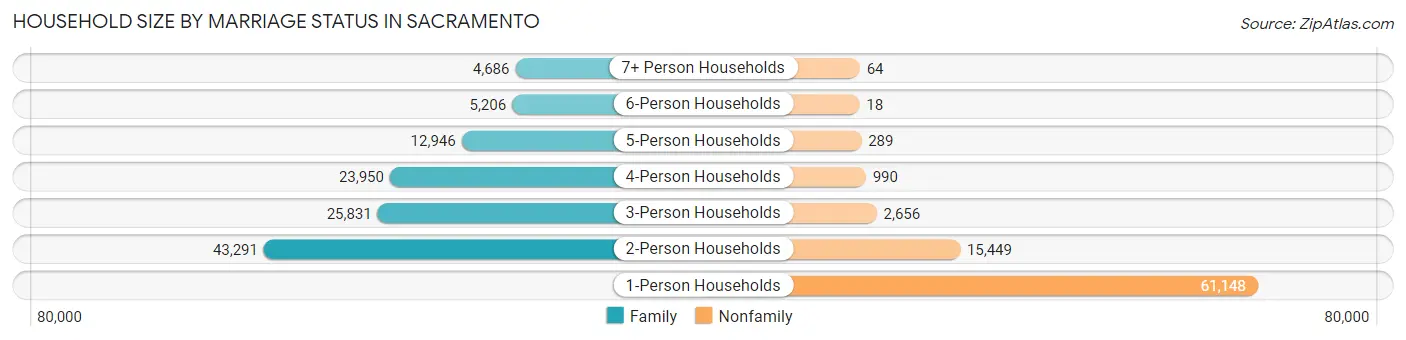
| Household Size | Family Households | Nonfamily Households |
| 1-Person Households | - | 61,148 (31.1%) |
| 2-Person Households | 43,291 (22.0%) | 15,449 (7.9%) |
| 3-Person Households | 25,831 (13.1%) | 2,656 (1.3%) |
| 4-Person Households | 23,950 (12.2%) | 990 (0.5%) |
| 5-Person Households | 12,946 (6.6%) | 289 (0.2%) |
| 6-Person Households | 5,206 (2.6%) | 18 (0.0%) |
| 7+ Person Households | 4,686 (2.4%) | 64 (0.0%) |
| Total | 115,910 (59.0%) | 80,614 (41.0%) |
Female Fertility in Sacramento
Fertility by Age in Sacramento
Average fertility rate in Sacramento is 51.0 births per 1,000 women. Women in the age bracket of 20 to 34 years have the highest fertility rate with 66.0 births per 1,000 women. Women in the age bracket of 20 to 34 years acount for 61.1% of all women with births.
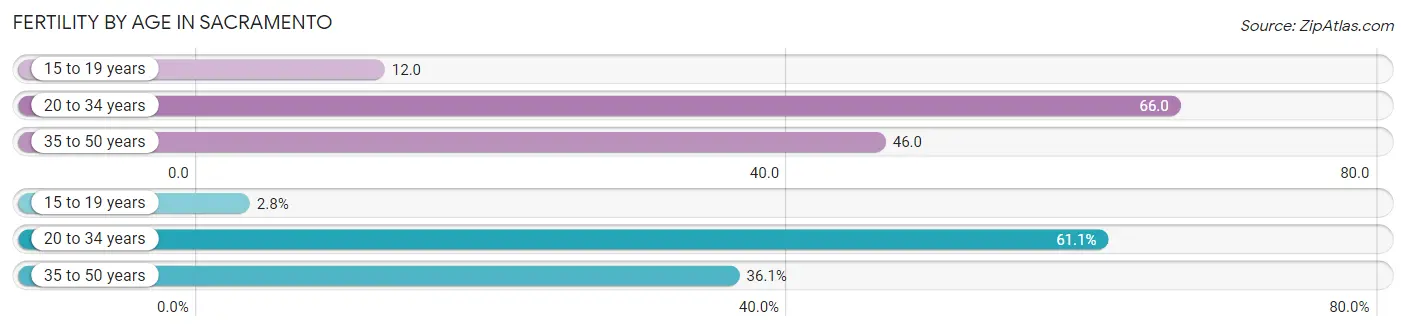
| Age Bracket | Women with Births | Births / 1,000 Women |
| 15 to 19 years | 198 (2.8%) | 12.0 |
| 20 to 34 years | 4,265 (61.1%) | 66.0 |
| 35 to 50 years | 2,519 (36.1%) | 46.0 |
| Total | 6,982 (100.0%) | 51.0 |
Fertility by Age by Marriage Status in Sacramento
69.1% of women with births (6,982) in Sacramento are married. The highest percentage of unmarried women with births falls into 15 to 19 years age bracket with 85.4% of them unmarried at the time of birth, while the lowest percentage of unmarried women with births belong to 35 to 50 years age bracket with 18.8% of them unmarried.
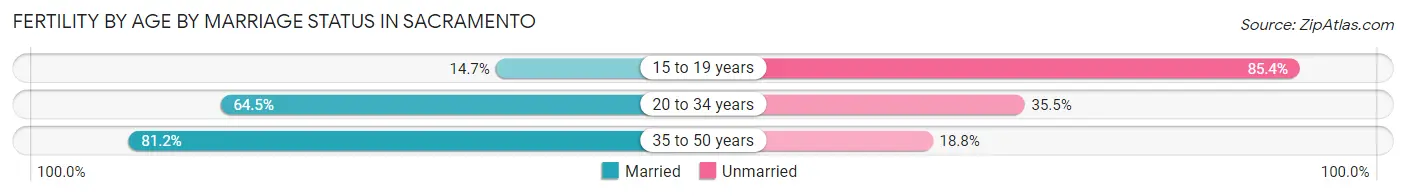
| Age Bracket | Married | Unmarried |
| 15 to 19 years | 29 (14.6%) | 169 (85.4%) |
| 20 to 34 years | 2,751 (64.5%) | 1,514 (35.5%) |
| 35 to 50 years | 2,045 (81.2%) | 474 (18.8%) |
| Total | 4,825 (69.1%) | 2,157 (30.9%) |
Fertility by Education in Sacramento
Average fertility rate in Sacramento is 51.0 births per 1,000 women. Women with the education attainment of high school diploma have the highest fertility rate of 65.0 births per 1,000 women, while women with the education attainment of less than high school have the lowest fertility at 26.0 births per 1,000 women. Women with the education attainment of college or associate's degree represent 36.1% of all women with births.
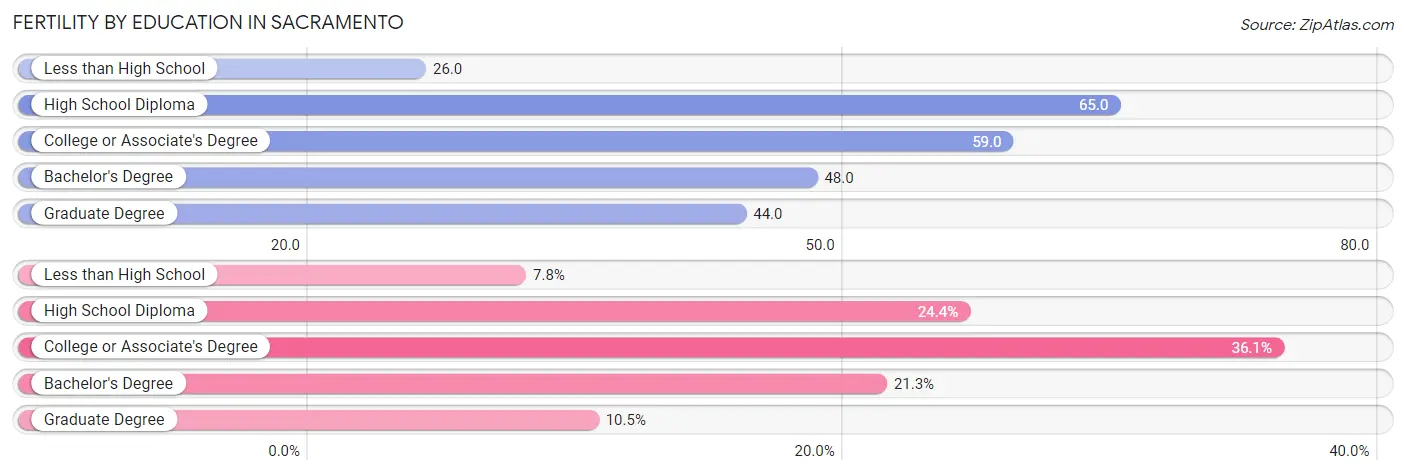
| Educational Attainment | Women with Births | Births / 1,000 Women |
| Less than High School | 541 (7.7%) | 26.0 |
| High School Diploma | 1,702 (24.4%) | 65.0 |
| College or Associate's Degree | 2,523 (36.1%) | 59.0 |
| Bachelor's Degree | 1,485 (21.3%) | 48.0 |
| Graduate Degree | 731 (10.5%) | 44.0 |
| Total | 6,982 (100.0%) | 51.0 |
Fertility by Education by Marriage Status in Sacramento
30.9% of women with births in Sacramento are unmarried. Women with the educational attainment of graduate degree are most likely to be married with 93.7% of them married at childbirth, while women with the educational attainment of less than high school are least likely to be married with 44.9% of them unmarried at childbirth.
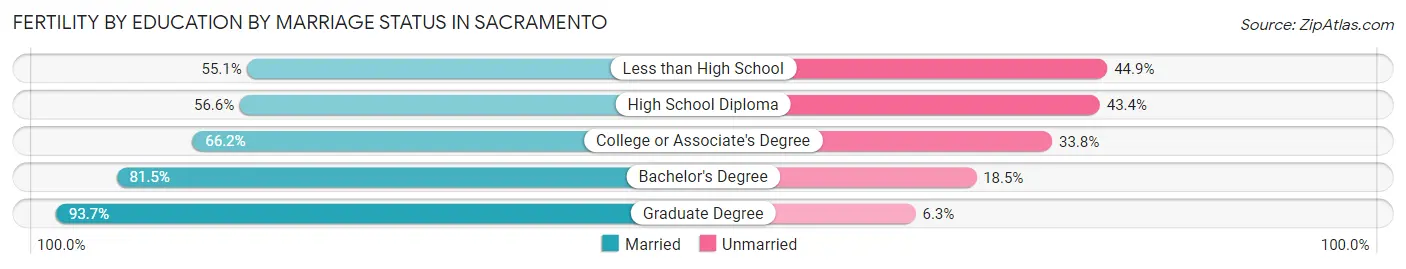
| Educational Attainment | Married | Unmarried |
| Less than High School | 298 (55.1%) | 243 (44.9%) |
| High School Diploma | 963 (56.6%) | 739 (43.4%) |
| College or Associate's Degree | 1,670 (66.2%) | 853 (33.8%) |
| Bachelor's Degree | 1,210 (81.5%) | 275 (18.5%) |
| Graduate Degree | 685 (93.7%) | 46 (6.3%) |
| Total | 4,825 (69.1%) | 2,157 (30.9%) |
Employment Characteristics in Sacramento
Employment by Class of Employer in Sacramento
Among the 248,877 employed individuals in Sacramento, private company employees (144,713 | 58.2%), state government employees (36,100 | 14.5%), and not-for-profit organizations (21,875 | 8.8%) make up the most common classes of employment.
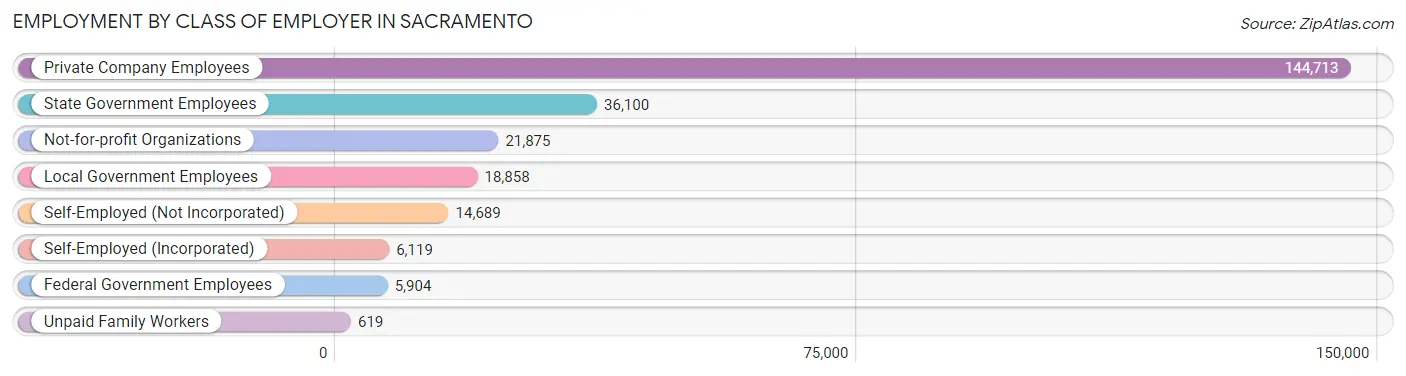
| Employer Class | # Employees | % Employees |
| Private Company Employees | 144,713 | 58.2% |
| Self-Employed (Incorporated) | 6,119 | 2.5% |
| Self-Employed (Not Incorporated) | 14,689 | 5.9% |
| Not-for-profit Organizations | 21,875 | 8.8% |
| Local Government Employees | 18,858 | 7.6% |
| State Government Employees | 36,100 | 14.5% |
| Federal Government Employees | 5,904 | 2.4% |
| Unpaid Family Workers | 619 | 0.3% |
| Total | 248,877 | 100.0% |
Employment Status by Age in Sacramento
According to the labor force statistics for Sacramento, out of the total population over 16 years of age (421,853), 64.6% or 272,517 individuals are in the labor force, with 6.3% or 17,169 of them unemployed. The age group with the highest labor force participation rate is 25 to 29 years, with 85.5% or 39,239 individuals in the labor force. Within the labor force, the 16 to 19 years age range has the highest percentage of unemployed individuals, with 18.9% or 1,727 of them being unemployed.
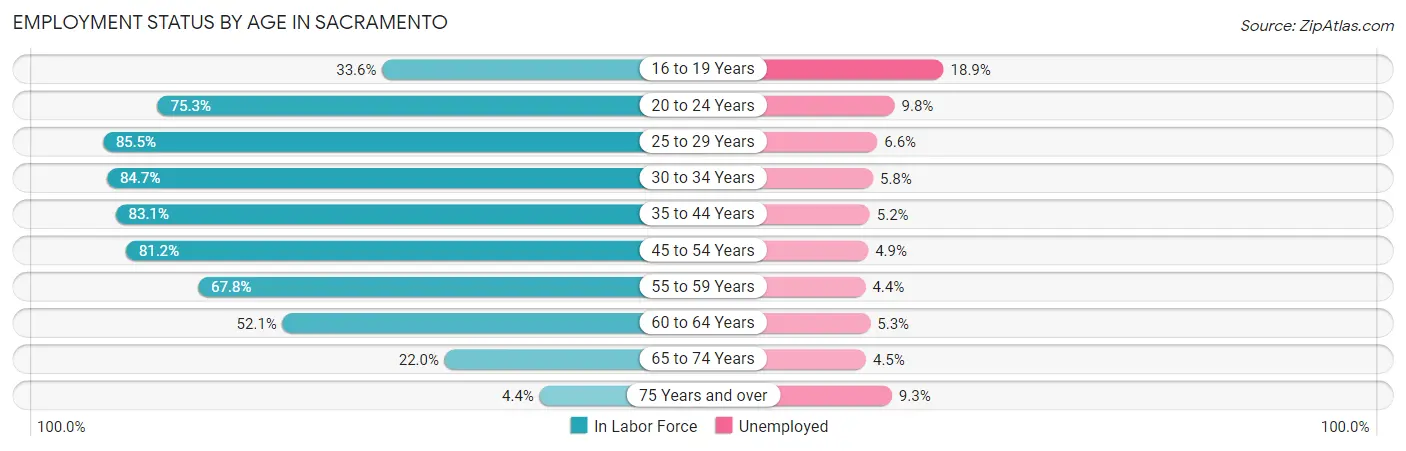
| Age Bracket | In Labor Force | Unemployed |
| 16 to 19 Years | 9,137 (33.6%) | 1,727 (18.9%) |
| 20 to 24 Years | 26,708 (75.3%) | 2,617 (9.8%) |
| 25 to 29 Years | 39,239 (85.5%) | 2,590 (6.6%) |
| 30 to 34 Years | 41,808 (84.7%) | 2,425 (5.8%) |
| 35 to 44 Years | 61,773 (83.1%) | 3,212 (5.2%) |
| 45 to 54 Years | 49,437 (81.2%) | 2,422 (4.9%) |
| 55 to 59 Years | 18,776 (67.8%) | 826 (4.4%) |
| 60 to 64 Years | 15,125 (52.1%) | 802 (5.3%) |
| 65 to 74 Years | 9,465 (22.0%) | 426 (4.5%) |
| 75 Years and over | 1,275 (4.4%) | 119 (9.3%) |
| Total | 272,517 (64.6%) | 17,169 (6.3%) |
Employment Status by Educational Attainment in Sacramento
According to labor force statistics for Sacramento, 78.7% of individuals (226,022) out of the total population between 25 and 64 years of age (287,195) are in the labor force, with 5.4% or 12,205 of them being unemployed. The group with the highest labor force participation rate are those with the educational attainment of bachelor's degree or higher, with 89.3% or 94,895 individuals in the labor force. Within the labor force, individuals with high school diploma education have the highest percentage of unemployment, with 8.1% or 3,340 of them being unemployed.
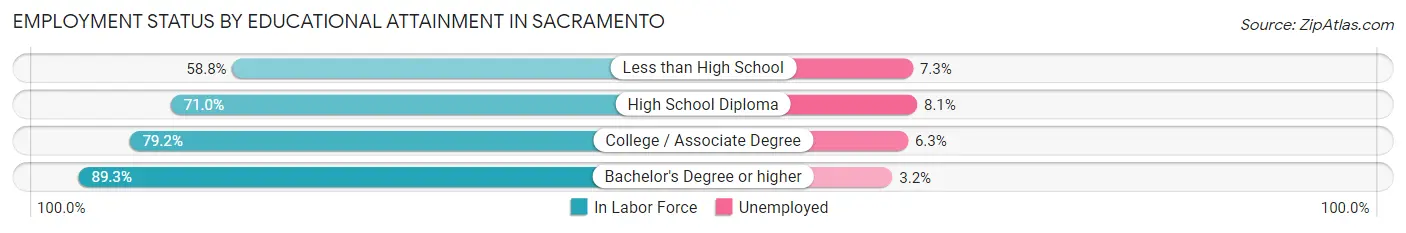
| Educational Attainment | In Labor Force | Unemployed |
| Less than High School | 21,131 (58.8%) | 2,623 (7.3%) |
| High School Diploma | 41,240 (71.0%) | 4,705 (8.1%) |
| College / Associate Degree | 68,832 (79.2%) | 5,475 (6.3%) |
| Bachelor's Degree or higher | 94,895 (89.3%) | 3,400 (3.2%) |
| Total | 226,022 (78.7%) | 15,509 (5.4%) |
Employment Occupations by Sex in Sacramento
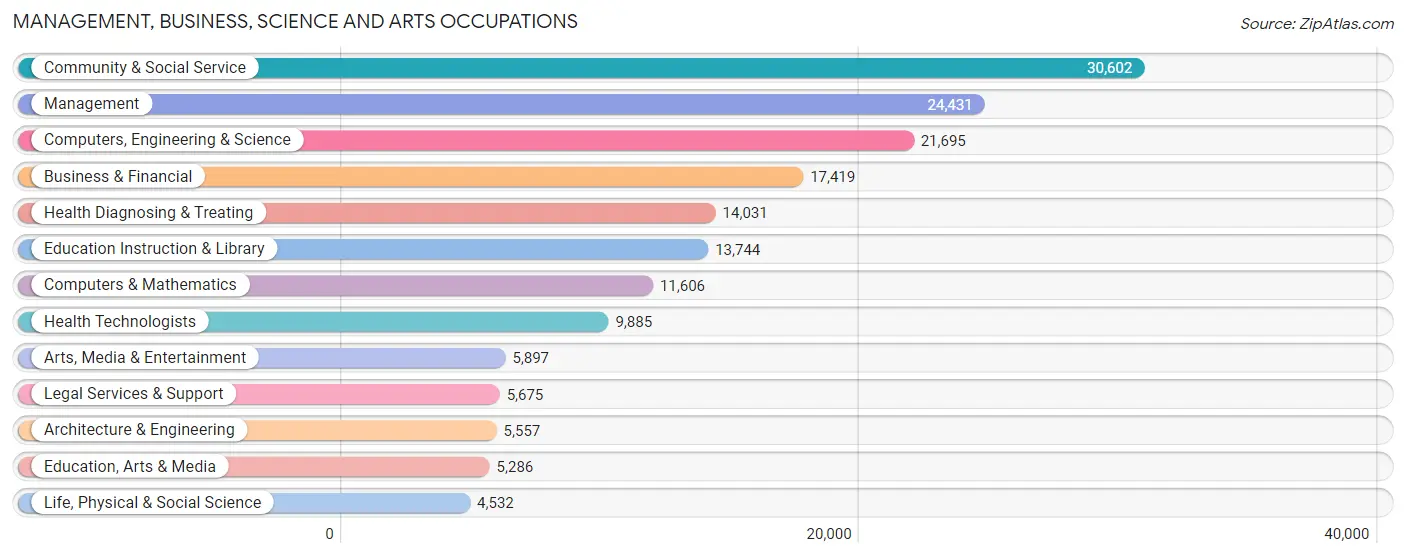
Management, Business, Science and Arts Occupations
The most common Management, Business, Science and Arts occupations in Sacramento are Community & Social Service (30,602 | 12.0%), Management (24,431 | 9.6%), Computers, Engineering & Science (21,695 | 8.5%), Business & Financial (17,419 | 6.8%), and Health Diagnosing & Treating (14,031 | 5.5%).
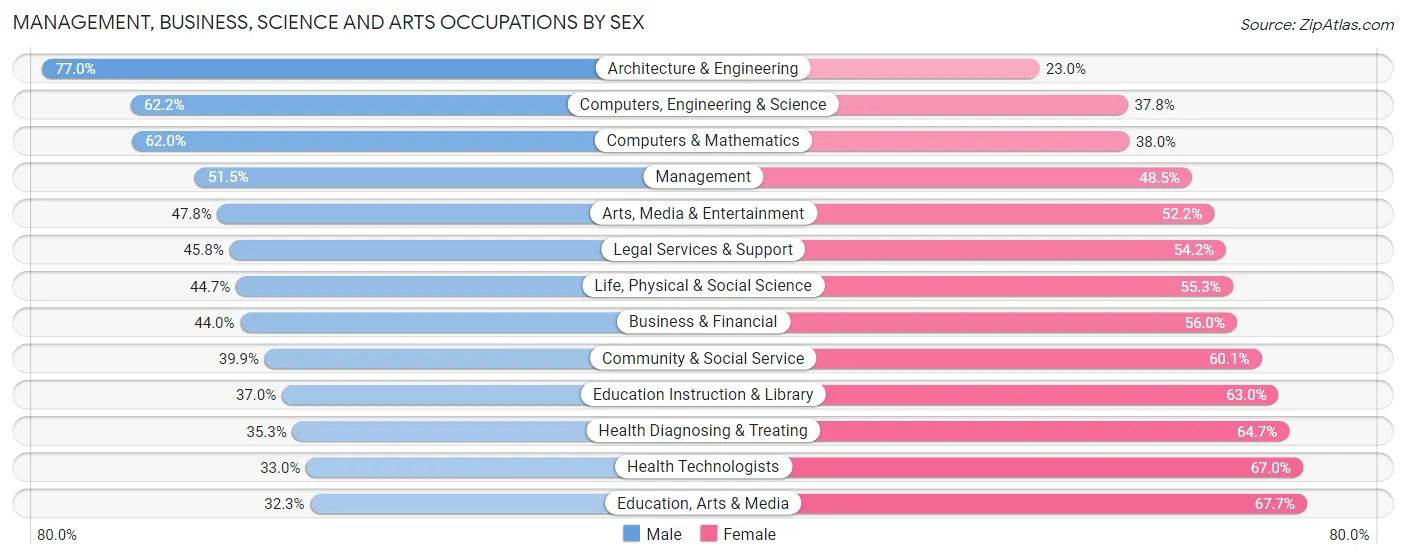
Management, Business, Science and Arts Occupations by Sex
Within the Management, Business, Science and Arts occupations in Sacramento, the most male-oriented occupations are Architecture & Engineering (77.0%), Computers, Engineering & Science (62.2%), and Computers & Mathematics (62.0%), while the most female-oriented occupations are Education, Arts & Media (67.7%), Health Technologists (67.0%), and Health Diagnosing & Treating (64.7%).
| Occupation | Male | Female |
| Management | 12,590 (51.5%) | 11,841 (48.5%) |
| Business & Financial | 7,663 (44.0%) | 9,756 (56.0%) |
| Computers, Engineering & Science | 13,501 (62.2%) | 8,194 (37.8%) |
| Computers & Mathematics | 7,194 (62.0%) | 4,412 (38.0%) |
| Architecture & Engineering | 4,281 (77.0%) | 1,276 (23.0%) |
| Life, Physical & Social Science | 2,026 (44.7%) | 2,506 (55.3%) |
| Community & Social Service | 12,217 (39.9%) | 18,385 (60.1%) |
| Education, Arts & Media | 1,708 (32.3%) | 3,578 (67.7%) |
| Legal Services & Support | 2,600 (45.8%) | 3,075 (54.2%) |
| Education Instruction & Library | 5,091 (37.0%) | 8,653 (63.0%) |
| Arts, Media & Entertainment | 2,818 (47.8%) | 3,079 (52.2%) |
| Health Diagnosing & Treating | 4,950 (35.3%) | 9,081 (64.7%) |
| Health Technologists | 3,262 (33.0%) | 6,623 (67.0%) |
| Total (Category) | 50,921 (47.1%) | 57,257 (52.9%) |
| Total (Overall) | 132,865 (52.1%) | 122,027 (47.9%) |
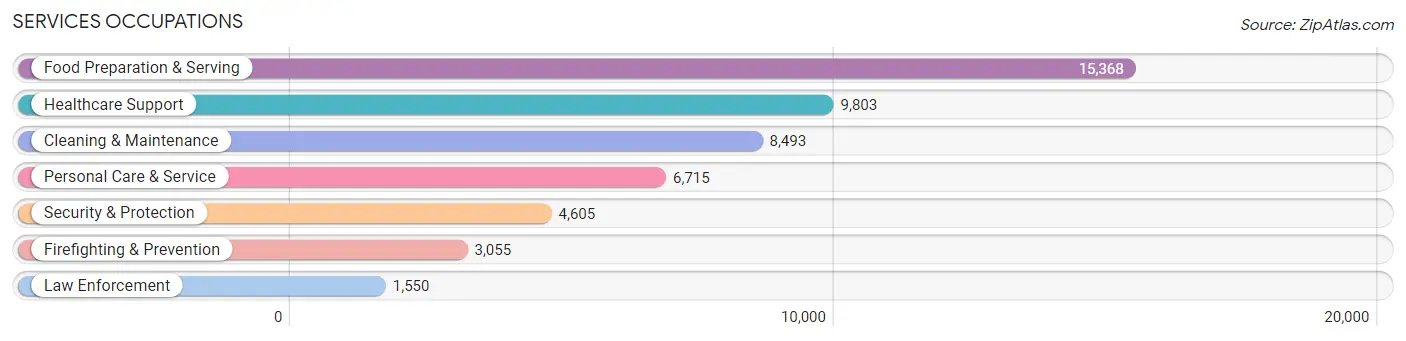
Services Occupations
The most common Services occupations in Sacramento are Food Preparation & Serving (15,368 | 6.0%), Healthcare Support (9,803 | 3.8%), Cleaning & Maintenance (8,493 | 3.3%), Personal Care & Service (6,715 | 2.6%), and Security & Protection (4,605 | 1.8%).
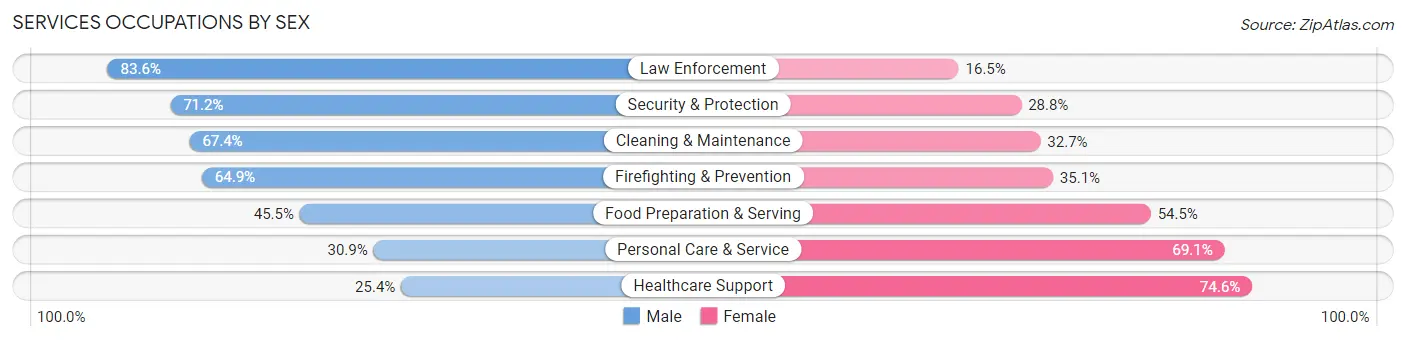
Services Occupations by Sex
Within the Services occupations in Sacramento, the most male-oriented occupations are Law Enforcement (83.6%), Security & Protection (71.2%), and Cleaning & Maintenance (67.3%), while the most female-oriented occupations are Healthcare Support (74.6%), Personal Care & Service (69.1%), and Food Preparation & Serving (54.5%).
| Occupation | Male | Female |
| Healthcare Support | 2,493 (25.4%) | 7,310 (74.6%) |
| Security & Protection | 3,277 (71.2%) | 1,328 (28.8%) |
| Firefighting & Prevention | 1,982 (64.9%) | 1,073 (35.1%) |
| Law Enforcement | 1,295 (83.6%) | 255 (16.5%) |
| Food Preparation & Serving | 6,994 (45.5%) | 8,374 (54.5%) |
| Cleaning & Maintenance | 5,720 (67.3%) | 2,773 (32.7%) |
| Personal Care & Service | 2,075 (30.9%) | 4,640 (69.1%) |
| Total (Category) | 20,559 (45.7%) | 24,425 (54.3%) |
| Total (Overall) | 132,865 (52.1%) | 122,027 (47.9%) |
Sales and Office Occupations
The most common Sales and Office occupations in Sacramento are Office & Administration (31,243 | 12.3%), and Sales & Related (22,143 | 8.7%).
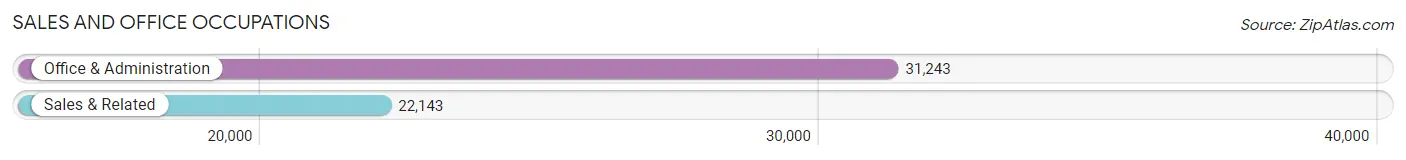
Sales and Office Occupations by Sex
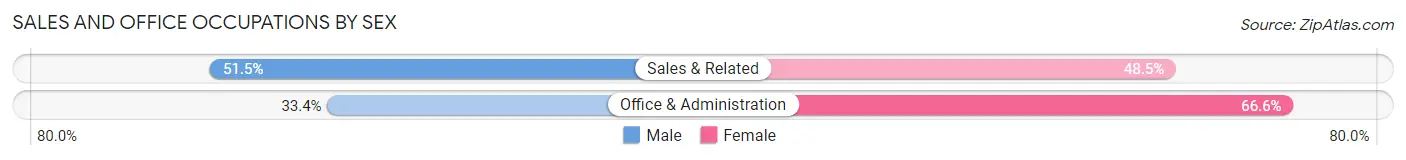
| Occupation | Male | Female |
| Sales & Related | 11,395 (51.5%) | 10,748 (48.5%) |
| Office & Administration | 10,439 (33.4%) | 20,804 (66.6%) |
| Total (Category) | 21,834 (40.9%) | 31,552 (59.1%) |
| Total (Overall) | 132,865 (52.1%) | 122,027 (47.9%) |
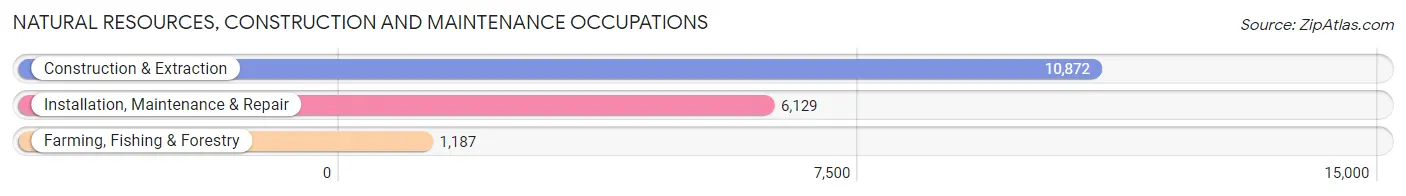
Natural Resources, Construction and Maintenance Occupations
The most common Natural Resources, Construction and Maintenance occupations in Sacramento are Construction & Extraction (10,872 | 4.3%), Installation, Maintenance & Repair (6,129 | 2.4%), and Farming, Fishing & Forestry (1,187 | 0.5%).
Natural Resources, Construction and Maintenance Occupations by Sex
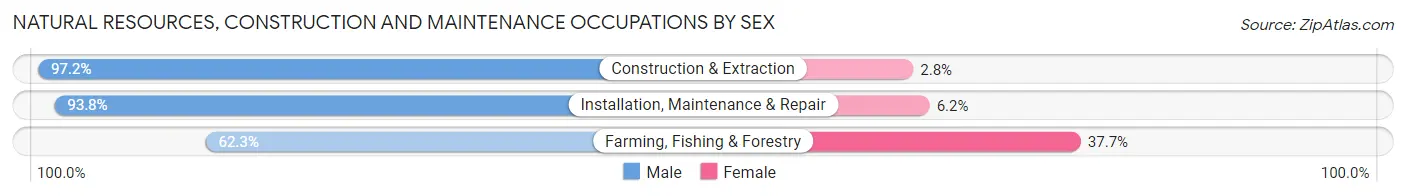
| Occupation | Male | Female |
| Farming, Fishing & Forestry | 740 (62.3%) | 447 (37.7%) |
| Construction & Extraction | 10,569 (97.2%) | 303 (2.8%) |
| Installation, Maintenance & Repair | 5,749 (93.8%) | 380 (6.2%) |
| Total (Category) | 17,058 (93.8%) | 1,130 (6.2%) |
| Total (Overall) | 132,865 (52.1%) | 122,027 (47.9%) |
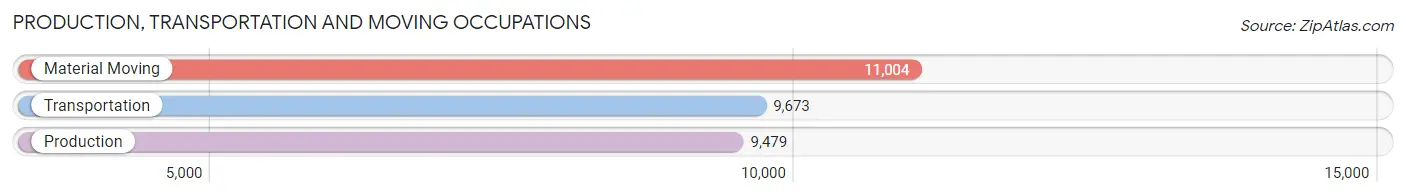
Production, Transportation and Moving Occupations
The most common Production, Transportation and Moving occupations in Sacramento are Material Moving (11,004 | 4.3%), Transportation (9,673 | 3.8%), and Production (9,479 | 3.7%).
Production, Transportation and Moving Occupations by Sex
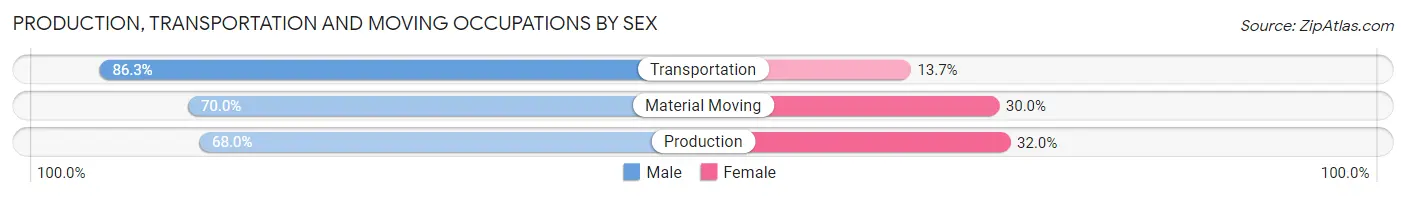
| Occupation | Male | Female |
| Production | 6,443 (68.0%) | 3,036 (32.0%) |
| Transportation | 8,344 (86.3%) | 1,329 (13.7%) |
| Material Moving | 7,706 (70.0%) | 3,298 (30.0%) |
| Total (Category) | 22,493 (74.6%) | 7,663 (25.4%) |
| Total (Overall) | 132,865 (52.1%) | 122,027 (47.9%) |
Employment Industries by Sex in Sacramento
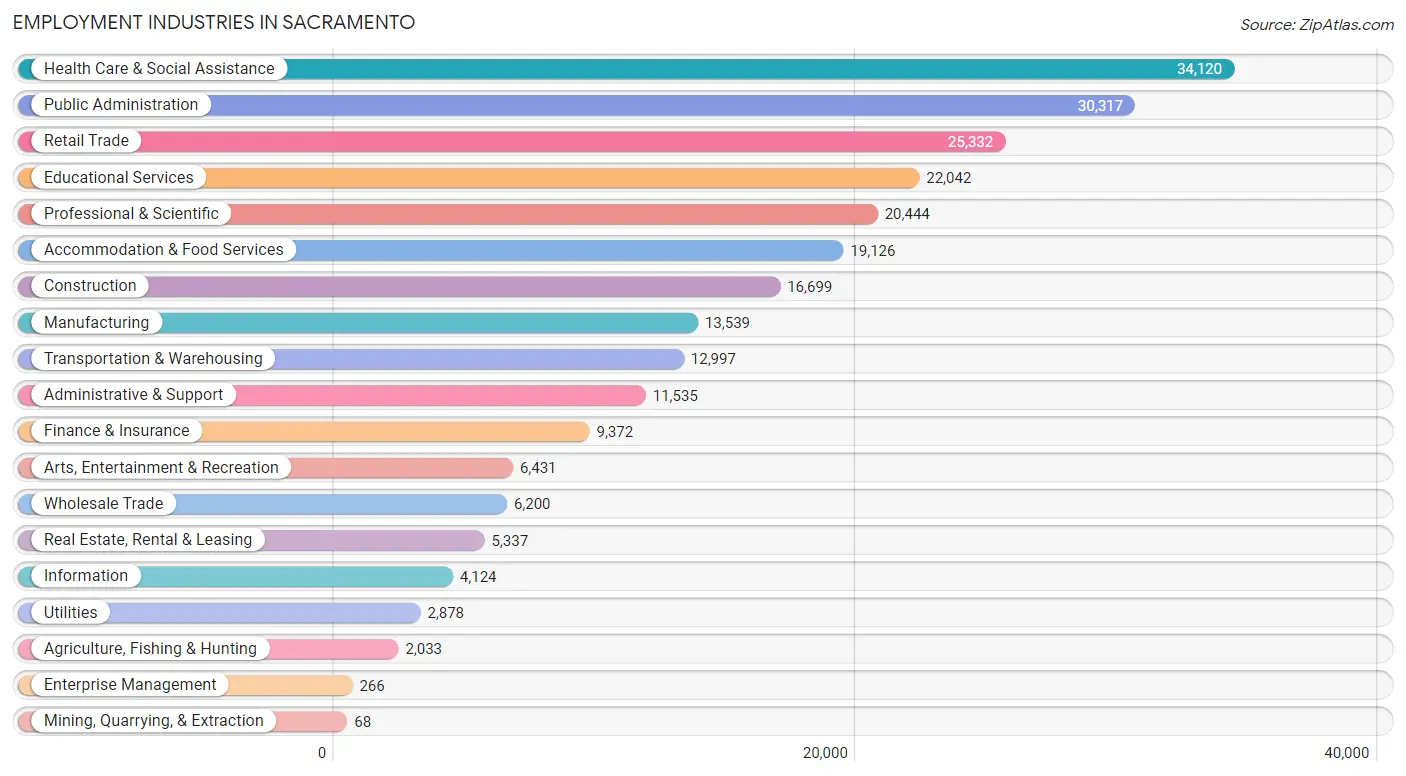
Employment Industries in Sacramento
The major employment industries in Sacramento include Health Care & Social Assistance (34,120 | 13.4%), Public Administration (30,317 | 11.9%), Retail Trade (25,332 | 9.9%), Educational Services (22,042 | 8.6%), and Professional & Scientific (20,444 | 8.0%).
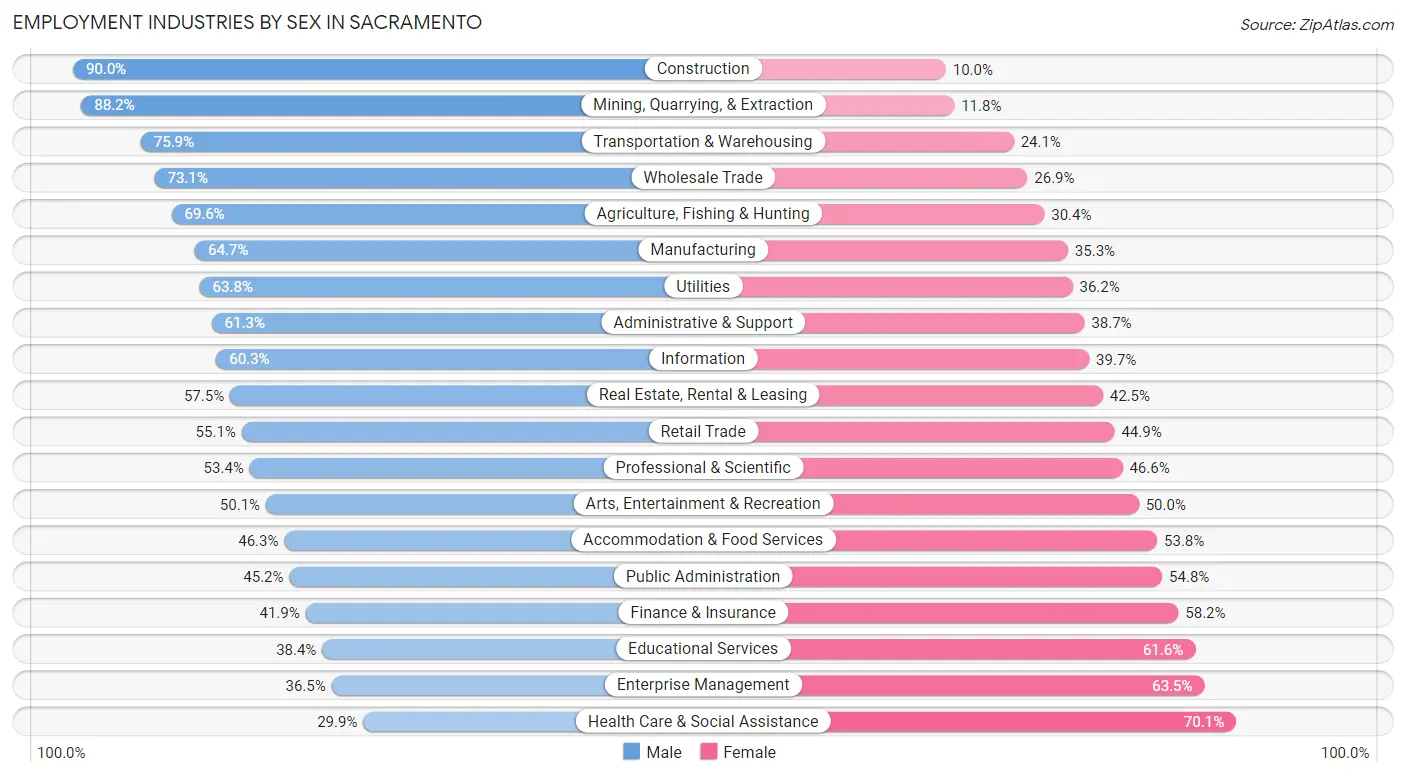
Employment Industries by Sex in Sacramento
The Sacramento industries that see more men than women are Construction (90.0%), Mining, Quarrying, & Extraction (88.2%), and Transportation & Warehousing (75.9%), whereas the industries that tend to have a higher number of women are Health Care & Social Assistance (70.1%), Enterprise Management (63.5%), and Educational Services (61.6%).
| Industry | Male | Female |
| Agriculture, Fishing & Hunting | 1,415 (69.6%) | 618 (30.4%) |
| Mining, Quarrying, & Extraction | 60 (88.2%) | 8 (11.8%) |
| Construction | 15,028 (90.0%) | 1,671 (10.0%) |
| Manufacturing | 8,761 (64.7%) | 4,778 (35.3%) |
| Wholesale Trade | 4,532 (73.1%) | 1,668 (26.9%) |
| Retail Trade | 13,950 (55.1%) | 11,382 (44.9%) |
| Transportation & Warehousing | 9,869 (75.9%) | 3,128 (24.1%) |
| Utilities | 1,835 (63.8%) | 1,043 (36.2%) |
| Information | 2,487 (60.3%) | 1,637 (39.7%) |
| Finance & Insurance | 3,922 (41.8%) | 5,450 (58.2%) |
| Real Estate, Rental & Leasing | 3,068 (57.5%) | 2,269 (42.5%) |
| Professional & Scientific | 10,922 (53.4%) | 9,522 (46.6%) |
| Enterprise Management | 97 (36.5%) | 169 (63.5%) |
| Administrative & Support | 7,070 (61.3%) | 4,465 (38.7%) |
| Educational Services | 8,465 (38.4%) | 13,577 (61.6%) |
| Health Care & Social Assistance | 10,206 (29.9%) | 23,914 (70.1%) |
| Arts, Entertainment & Recreation | 3,219 (50.0%) | 3,212 (49.9%) |
| Accommodation & Food Services | 8,846 (46.3%) | 10,280 (53.7%) |
| Public Administration | 13,703 (45.2%) | 16,614 (54.8%) |
| Total | 132,865 (52.1%) | 122,027 (47.9%) |
Education in Sacramento
School Enrollment in Sacramento
The most common levels of schooling among the 135,317 students in Sacramento are college / undergraduate (35,970 | 26.6%), high school (27,297 | 20.2%), and elementary school (24,972 | 18.4%).
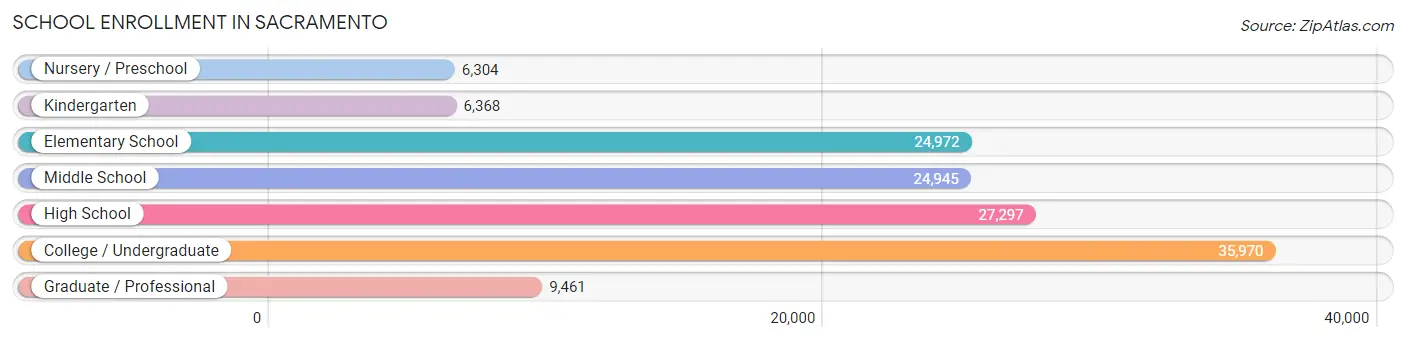
| School Level | # Students | % Students |
| Nursery / Preschool | 6,304 | 4.7% |
| Kindergarten | 6,368 | 4.7% |
| Elementary School | 24,972 | 18.4% |
| Middle School | 24,945 | 18.4% |
| High School | 27,297 | 20.2% |
| College / Undergraduate | 35,970 | 26.6% |
| Graduate / Professional | 9,461 | 7.0% |
| Total | 135,317 | 100.0% |
School Enrollment by Age by Funding Source in Sacramento
Out of a total of 135,317 students who are enrolled in schools in Sacramento, 15,020 (11.1%) attend a private institution, while the remaining 120,297 (88.9%) are enrolled in public schools. The age group of 3 to 4 year olds has the highest likelihood of being enrolled in private schools, with 1,932 (38.3% in the age bracket) enrolled. Conversely, the age group of 18 to 19 year olds has the lowest likelihood of being enrolled in a private school, with 10,211 (95.0% in the age bracket) attending a public institution.
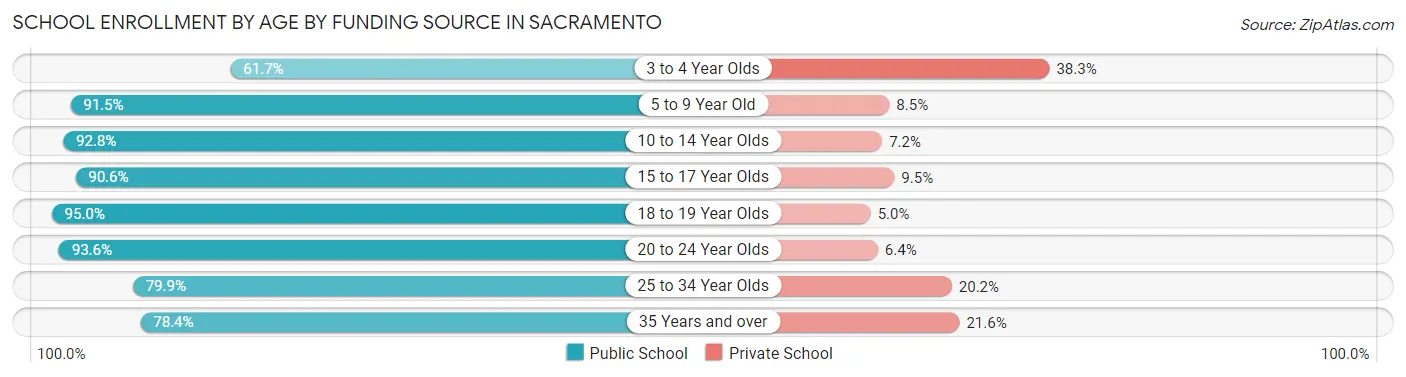
| Age Bracket | Public School | Private School |
| 3 to 4 Year Olds | 3,107 (61.7%) | 1,932 (38.3%) |
| 5 to 9 Year Old | 26,795 (91.5%) | 2,494 (8.5%) |
| 10 to 14 Year Olds | 29,593 (92.8%) | 2,289 (7.2%) |
| 15 to 17 Year Olds | 17,272 (90.5%) | 1,802 (9.5%) |
| 18 to 19 Year Olds | 10,211 (95.0%) | 542 (5.0%) |
| 20 to 24 Year Olds | 14,057 (93.6%) | 958 (6.4%) |
| 25 to 34 Year Olds | 11,878 (79.8%) | 2,997 (20.2%) |
| 35 Years and over | 7,365 (78.4%) | 2,025 (21.6%) |
| Total | 120,297 (88.9%) | 15,020 (11.1%) |
Educational Attainment by Field of Study in Sacramento
Business (22,225 | 15.8%), social sciences (18,368 | 13.1%), bio, nature & agricultural (11,996 | 8.5%), arts & humanities (10,961 | 7.8%), and science & technology (10,303 | 7.3%) are the most common fields of study among 140,764 individuals in Sacramento who have obtained a bachelor's degree or higher.
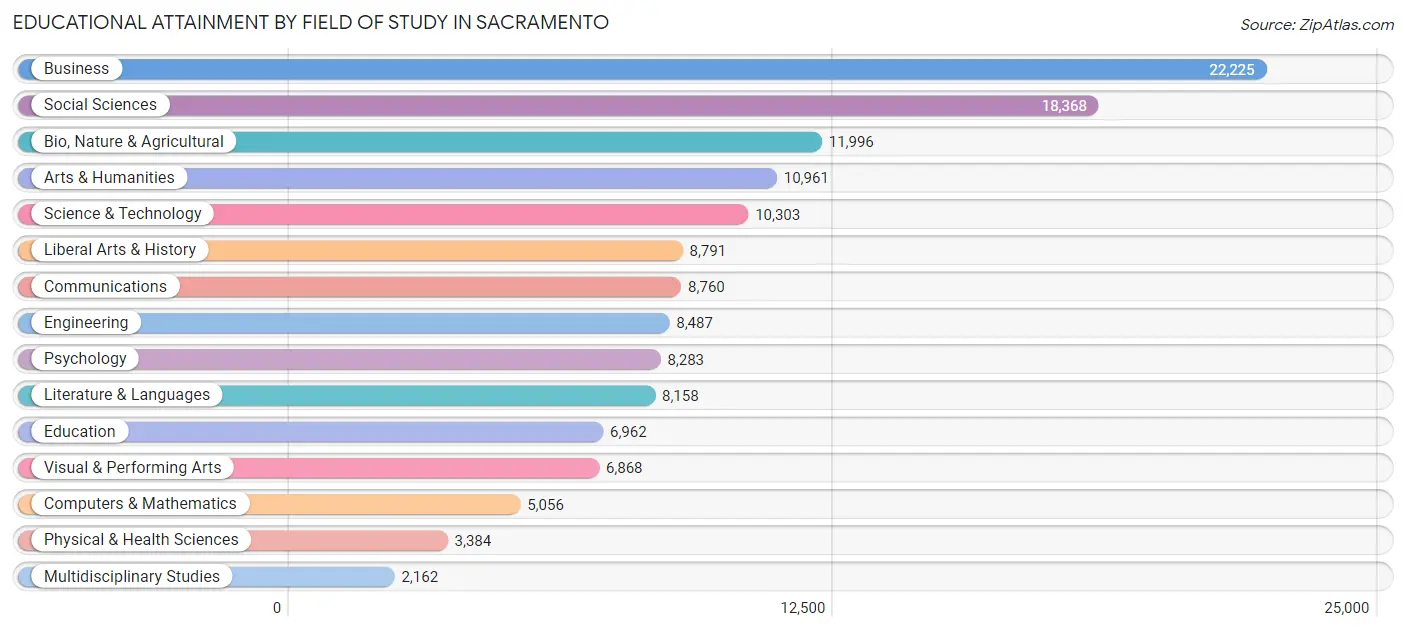
| Field of Study | # Graduates | % Graduates |
| Computers & Mathematics | 5,056 | 3.6% |
| Bio, Nature & Agricultural | 11,996 | 8.5% |
| Physical & Health Sciences | 3,384 | 2.4% |
| Psychology | 8,283 | 5.9% |
| Social Sciences | 18,368 | 13.1% |
| Engineering | 8,487 | 6.0% |
| Multidisciplinary Studies | 2,162 | 1.5% |
| Science & Technology | 10,303 | 7.3% |
| Business | 22,225 | 15.8% |
| Education | 6,962 | 5.0% |
| Literature & Languages | 8,158 | 5.8% |
| Liberal Arts & History | 8,791 | 6.2% |
| Visual & Performing Arts | 6,868 | 4.9% |
| Communications | 8,760 | 6.2% |
| Arts & Humanities | 10,961 | 7.8% |
| Total | 140,764 | 100.0% |
Transportation & Commute in Sacramento
Vehicle Availability by Sex in Sacramento
The most prevalent vehicle ownership categories in Sacramento are males with 2 vehicles (54,582, accounting for 42.0%) and females with 2 vehicles (47,251, making up 46.4%).
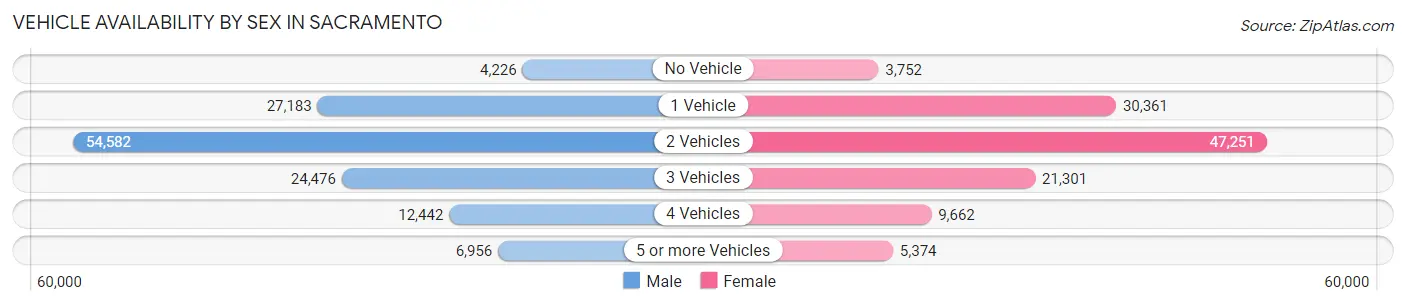
| Vehicles Available | Male | Female |
| No Vehicle | 4,226 (3.3%) | 3,752 (3.2%) |
| 1 Vehicle | 27,183 (20.9%) | 30,361 (25.8%) |
| 2 Vehicles | 54,582 (42.0%) | 47,251 (40.1%) |
| 3 Vehicles | 24,476 (18.9%) | 21,301 (18.1%) |
| 4 Vehicles | 12,442 (9.6%) | 9,662 (8.2%) |
| 5 or more Vehicles | 6,956 (5.4%) | 5,374 (4.6%) |
| Total | 129,865 (100.0%) | 117,701 (100.0%) |
Commute Time in Sacramento
The most frequently occuring commute durations in Sacramento are 15 to 19 minutes (39,586 commuters, 18.7%), 20 to 24 minutes (37,825 commuters, 17.9%), and 30 to 34 minutes (34,128 commuters, 16.2%).
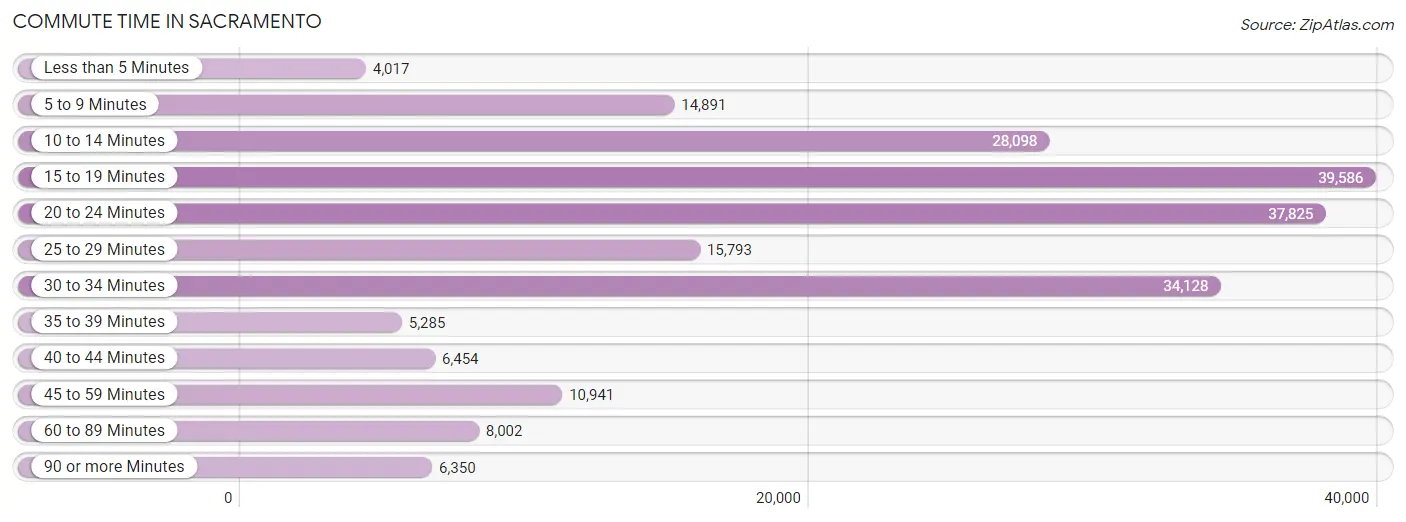
| Commute Time | # Commuters | % Commuters |
| Less than 5 Minutes | 4,017 | 1.9% |
| 5 to 9 Minutes | 14,891 | 7.0% |
| 10 to 14 Minutes | 28,098 | 13.3% |
| 15 to 19 Minutes | 39,586 | 18.7% |
| 20 to 24 Minutes | 37,825 | 17.9% |
| 25 to 29 Minutes | 15,793 | 7.5% |
| 30 to 34 Minutes | 34,128 | 16.2% |
| 35 to 39 Minutes | 5,285 | 2.5% |
| 40 to 44 Minutes | 6,454 | 3.0% |
| 45 to 59 Minutes | 10,941 | 5.2% |
| 60 to 89 Minutes | 8,002 | 3.8% |
| 90 or more Minutes | 6,350 | 3.0% |
Commute Time by Sex in Sacramento
The most common commute times in Sacramento are 20 to 24 minutes (20,961 commuters, 18.6%) for males and 15 to 19 minutes (19,662 commuters, 19.9%) for females.
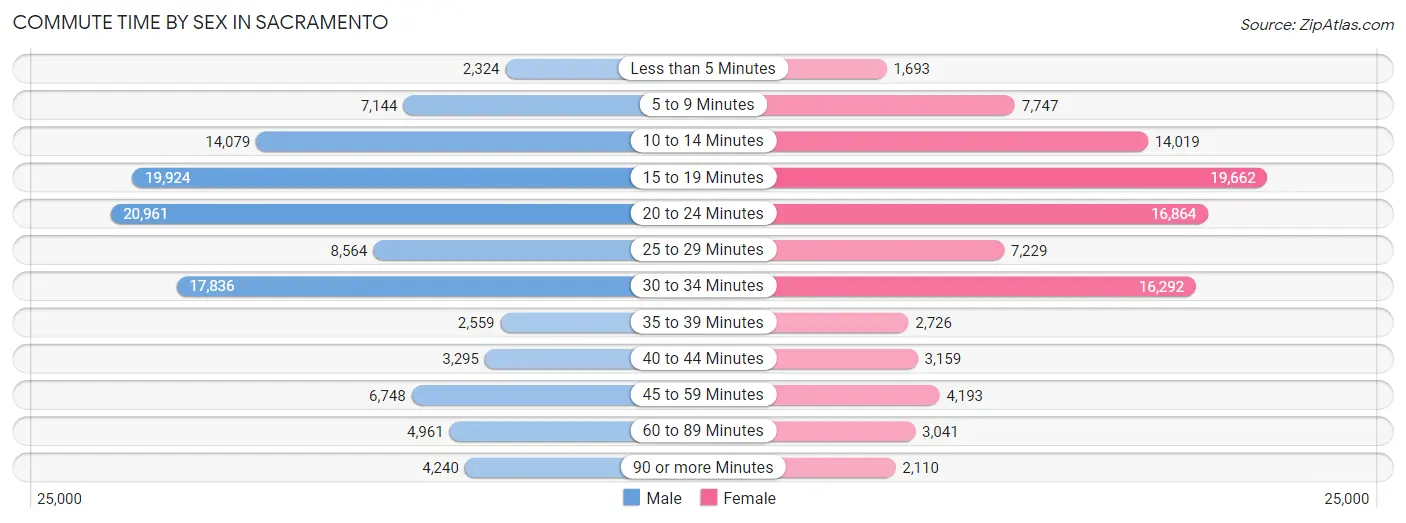
| Commute Time | Male | Female |
| Less than 5 Minutes | 2,324 (2.1%) | 1,693 (1.7%) |
| 5 to 9 Minutes | 7,144 (6.3%) | 7,747 (7.9%) |
| 10 to 14 Minutes | 14,079 (12.5%) | 14,019 (14.2%) |
| 15 to 19 Minutes | 19,924 (17.7%) | 19,662 (19.9%) |
| 20 to 24 Minutes | 20,961 (18.6%) | 16,864 (17.1%) |
| 25 to 29 Minutes | 8,564 (7.6%) | 7,229 (7.3%) |
| 30 to 34 Minutes | 17,836 (15.8%) | 16,292 (16.5%) |
| 35 to 39 Minutes | 2,559 (2.3%) | 2,726 (2.8%) |
| 40 to 44 Minutes | 3,295 (2.9%) | 3,159 (3.2%) |
| 45 to 59 Minutes | 6,748 (6.0%) | 4,193 (4.3%) |
| 60 to 89 Minutes | 4,961 (4.4%) | 3,041 (3.1%) |
| 90 or more Minutes | 4,240 (3.8%) | 2,110 (2.1%) |
Time of Departure to Work by Sex in Sacramento
The most frequent times of departure to work in Sacramento are 7:00 AM to 7:29 AM (14,257, 12.7%) for males and 7:30 AM to 7:59 AM (14,300, 14.5%) for females.
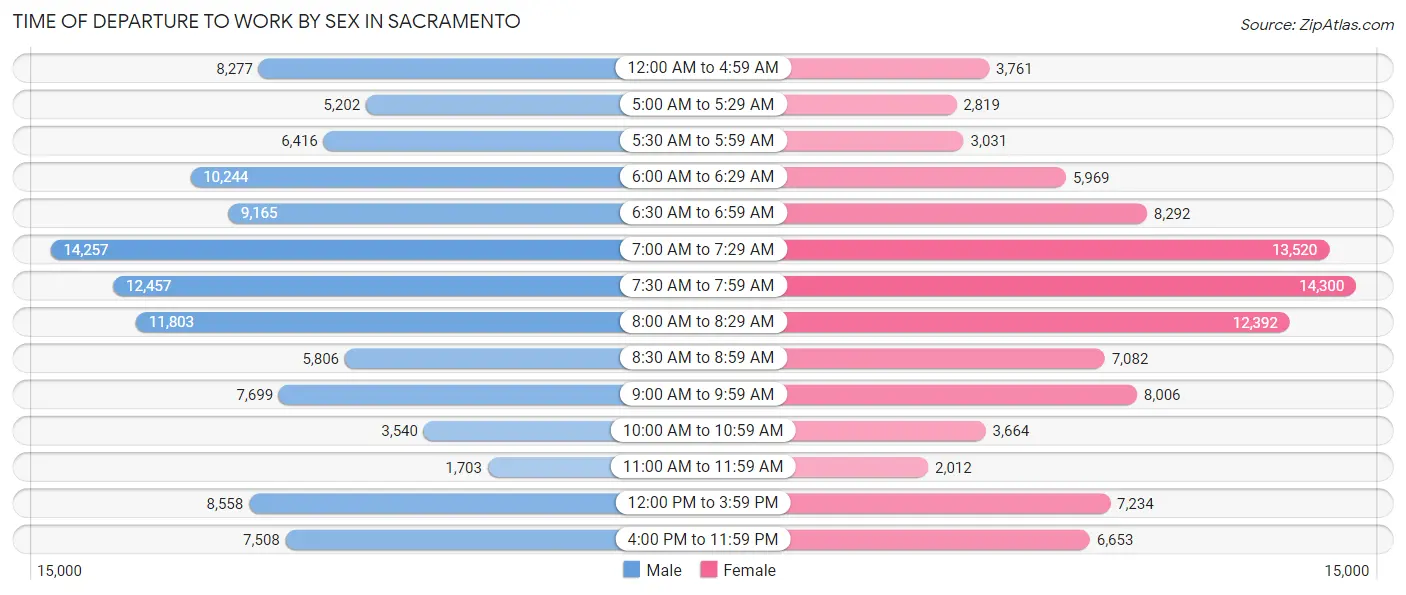
| Time of Departure | Male | Female |
| 12:00 AM to 4:59 AM | 8,277 (7.3%) | 3,761 (3.8%) |
| 5:00 AM to 5:29 AM | 5,202 (4.6%) | 2,819 (2.9%) |
| 5:30 AM to 5:59 AM | 6,416 (5.7%) | 3,031 (3.1%) |
| 6:00 AM to 6:29 AM | 10,244 (9.1%) | 5,969 (6.0%) |
| 6:30 AM to 6:59 AM | 9,165 (8.1%) | 8,292 (8.4%) |
| 7:00 AM to 7:29 AM | 14,257 (12.7%) | 13,520 (13.7%) |
| 7:30 AM to 7:59 AM | 12,457 (11.1%) | 14,300 (14.5%) |
| 8:00 AM to 8:29 AM | 11,803 (10.5%) | 12,392 (12.6%) |
| 8:30 AM to 8:59 AM | 5,806 (5.1%) | 7,082 (7.2%) |
| 9:00 AM to 9:59 AM | 7,699 (6.8%) | 8,006 (8.1%) |
| 10:00 AM to 10:59 AM | 3,540 (3.1%) | 3,664 (3.7%) |
| 11:00 AM to 11:59 AM | 1,703 (1.5%) | 2,012 (2.0%) |
| 12:00 PM to 3:59 PM | 8,558 (7.6%) | 7,234 (7.3%) |
| 4:00 PM to 11:59 PM | 7,508 (6.7%) | 6,653 (6.7%) |
| Total | 112,635 (100.0%) | 98,735 (100.0%) |
Housing Occupancy in Sacramento
Occupancy by Ownership in Sacramento
Of the total 196,524 dwellings in Sacramento, owner-occupied units account for 99,642 (50.7%), while renter-occupied units make up 96,882 (49.3%).
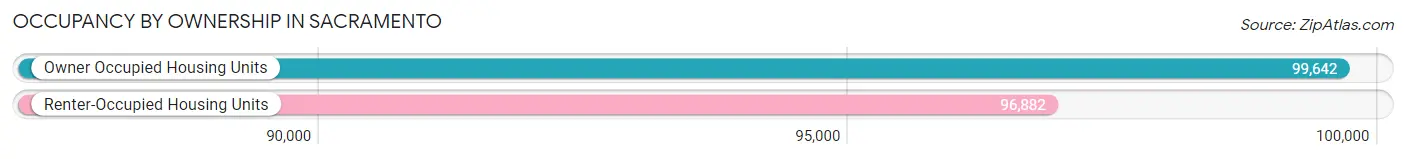
| Occupancy | # Housing Units | % Housing Units |
| Owner Occupied Housing Units | 99,642 | 50.7% |
| Renter-Occupied Housing Units | 96,882 | 49.3% |
| Total Occupied Housing Units | 196,524 | 100.0% |
Occupancy by Household Size in Sacramento
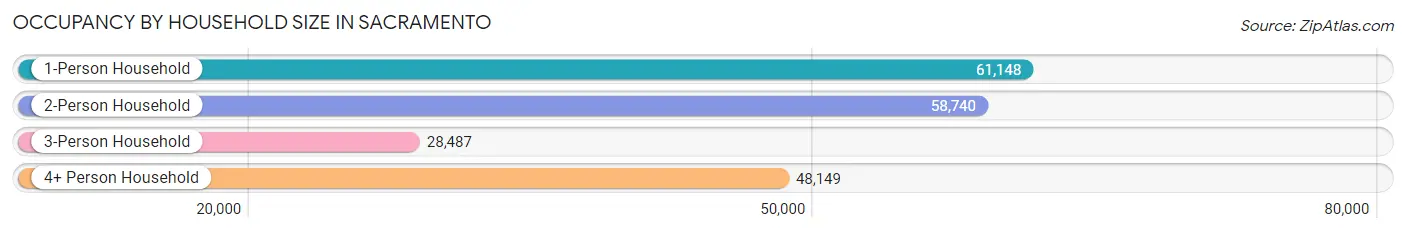
| Household Size | # Housing Units | % Housing Units |
| 1-Person Household | 61,148 | 31.1% |
| 2-Person Household | 58,740 | 29.9% |
| 3-Person Household | 28,487 | 14.5% |
| 4+ Person Household | 48,149 | 24.5% |
| Total Housing Units | 196,524 | 100.0% |
Occupancy by Ownership by Household Size in Sacramento
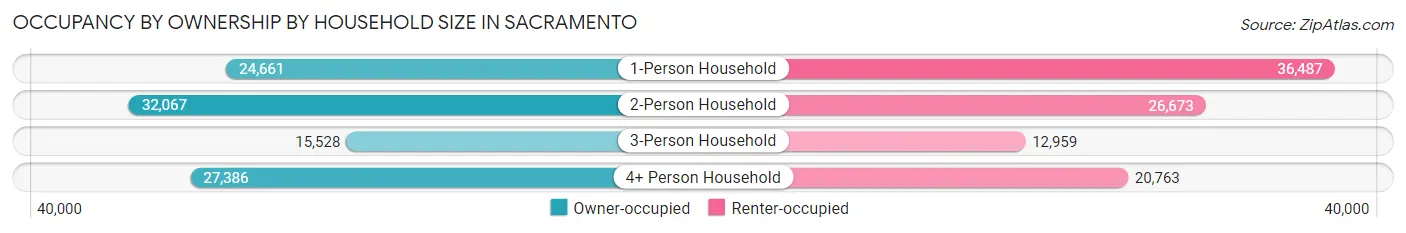
| Household Size | Owner-occupied | Renter-occupied |
| 1-Person Household | 24,661 (40.3%) | 36,487 (59.7%) |
| 2-Person Household | 32,067 (54.6%) | 26,673 (45.4%) |
| 3-Person Household | 15,528 (54.5%) | 12,959 (45.5%) |
| 4+ Person Household | 27,386 (56.9%) | 20,763 (43.1%) |
| Total Housing Units | 99,642 (50.7%) | 96,882 (49.3%) |
Occupancy by Educational Attainment in Sacramento
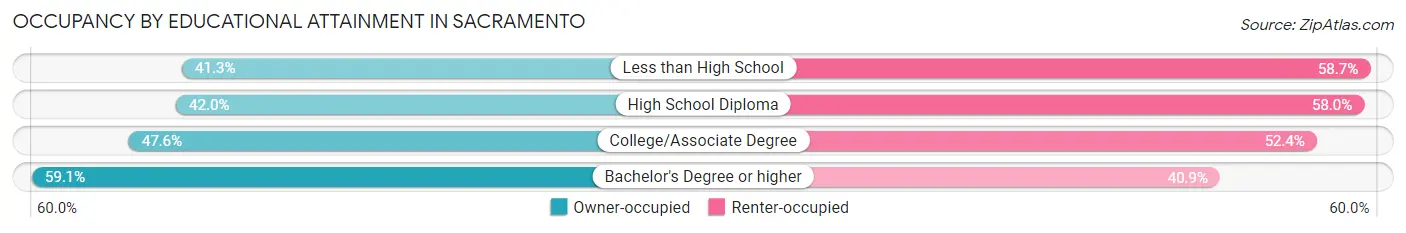
| Household Size | Owner-occupied | Renter-occupied |
| Less than High School | 7,945 (41.3%) | 11,309 (58.7%) |
| High School Diploma | 13,454 (42.0%) | 18,604 (58.0%) |
| College/Associate Degree | 31,441 (47.6%) | 34,618 (52.4%) |
| Bachelor's Degree or higher | 46,802 (59.1%) | 32,351 (40.9%) |
Occupancy by Age of Householder in Sacramento
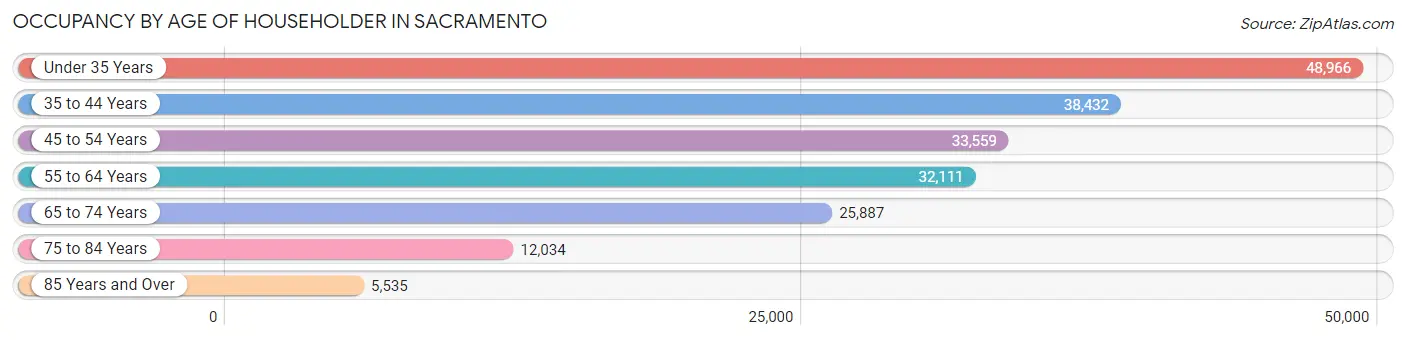
| Age Bracket | # Households | % Households |
| Under 35 Years | 48,966 | 24.9% |
| 35 to 44 Years | 38,432 | 19.6% |
| 45 to 54 Years | 33,559 | 17.1% |
| 55 to 64 Years | 32,111 | 16.3% |
| 65 to 74 Years | 25,887 | 13.2% |
| 75 to 84 Years | 12,034 | 6.1% |
| 85 Years and Over | 5,535 | 2.8% |
| Total | 196,524 | 100.0% |
Housing Finances in Sacramento
Median Income by Occupancy in Sacramento
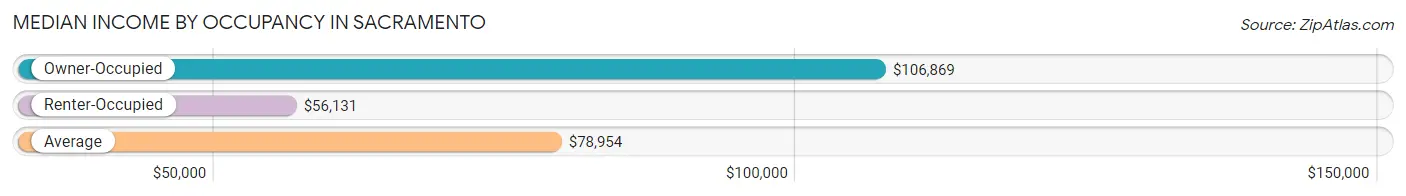
| Occupancy Type | # Households | Median Income |
| Owner-Occupied | 99,642 (50.7%) | $106,869 |
| Renter-Occupied | 96,882 (49.3%) | $56,131 |
| Average | 196,524 (100.0%) | $78,954 |
Occupancy by Householder Income Bracket in Sacramento
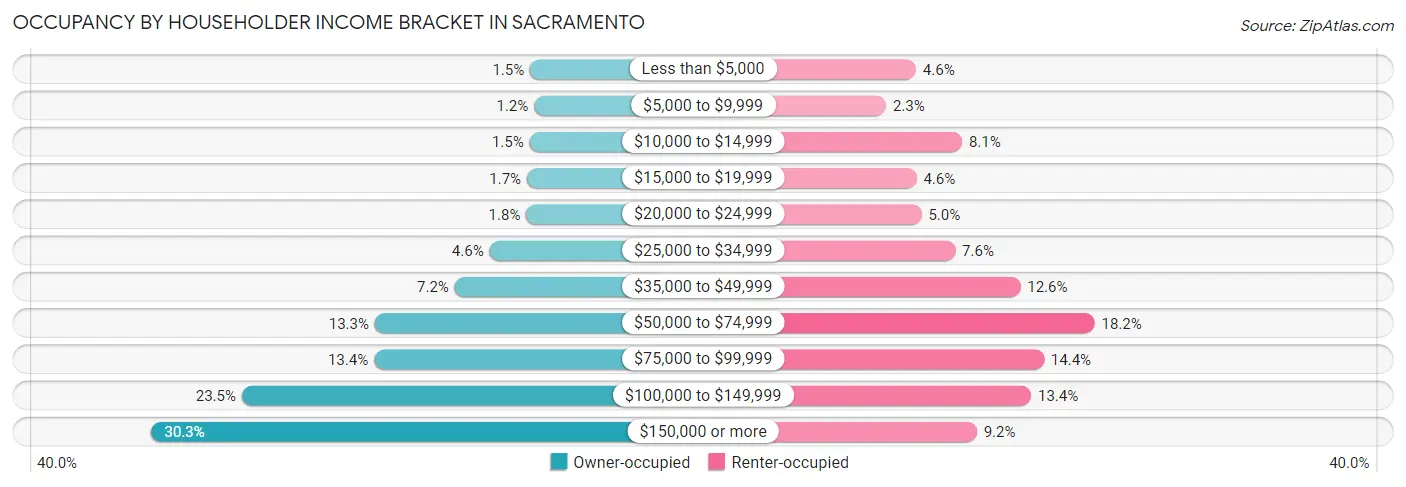
| Income Bracket | Owner-occupied | Renter-occupied |
| Less than $5,000 | 1,480 (1.5%) | 4,461 (4.6%) |
| $5,000 to $9,999 | 1,172 (1.2%) | 2,245 (2.3%) |
| $10,000 to $14,999 | 1,523 (1.5%) | 7,860 (8.1%) |
| $15,000 to $19,999 | 1,726 (1.7%) | 4,500 (4.6%) |
| $20,000 to $24,999 | 1,769 (1.8%) | 4,865 (5.0%) |
| $25,000 to $34,999 | 4,567 (4.6%) | 7,351 (7.6%) |
| $35,000 to $49,999 | 7,204 (7.2%) | 12,163 (12.6%) |
| $50,000 to $74,999 | 13,275 (13.3%) | 17,641 (18.2%) |
| $75,000 to $99,999 | 13,332 (13.4%) | 13,905 (14.3%) |
| $100,000 to $149,999 | 23,362 (23.4%) | 12,950 (13.4%) |
| $150,000 or more | 30,232 (30.3%) | 8,941 (9.2%) |
| Total | 99,642 (100.0%) | 96,882 (100.0%) |
Monthly Housing Cost Tiers in Sacramento
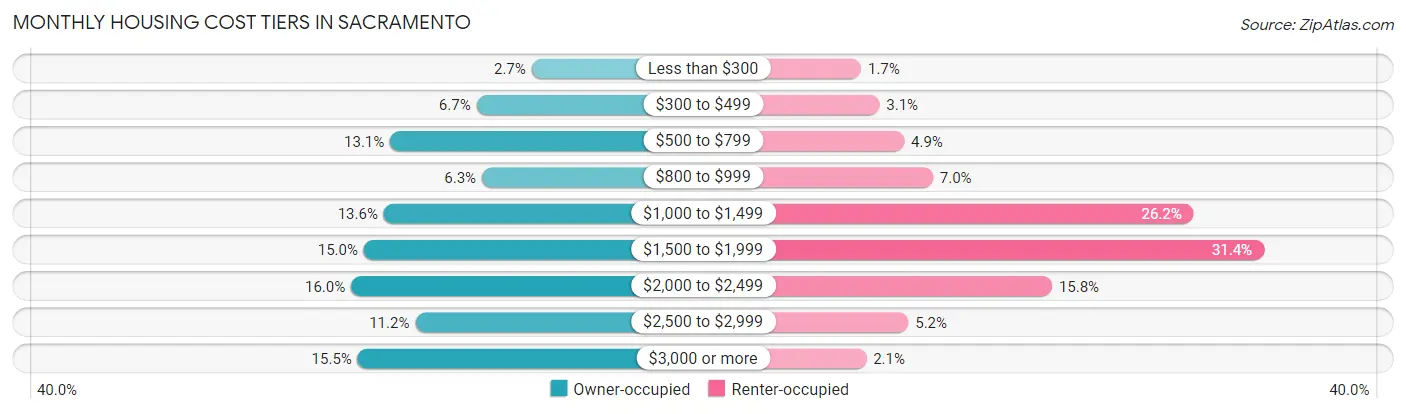
| Monthly Cost | Owner-occupied | Renter-occupied |
| Less than $300 | 2,649 (2.7%) | 1,688 (1.7%) |
| $300 to $499 | 6,694 (6.7%) | 2,993 (3.1%) |
| $500 to $799 | 13,037 (13.1%) | 4,756 (4.9%) |
| $800 to $999 | 6,293 (6.3%) | 6,815 (7.0%) |
| $1,000 to $1,499 | 13,499 (13.6%) | 25,410 (26.2%) |
| $1,500 to $1,999 | 14,963 (15.0%) | 30,431 (31.4%) |
| $2,000 to $2,499 | 15,900 (16.0%) | 15,305 (15.8%) |
| $2,500 to $2,999 | 11,190 (11.2%) | 5,059 (5.2%) |
| $3,000 or more | 15,417 (15.5%) | 2,053 (2.1%) |
| Total | 99,642 (100.0%) | 96,882 (100.0%) |
Physical Housing Characteristics in Sacramento
Housing Structures in Sacramento
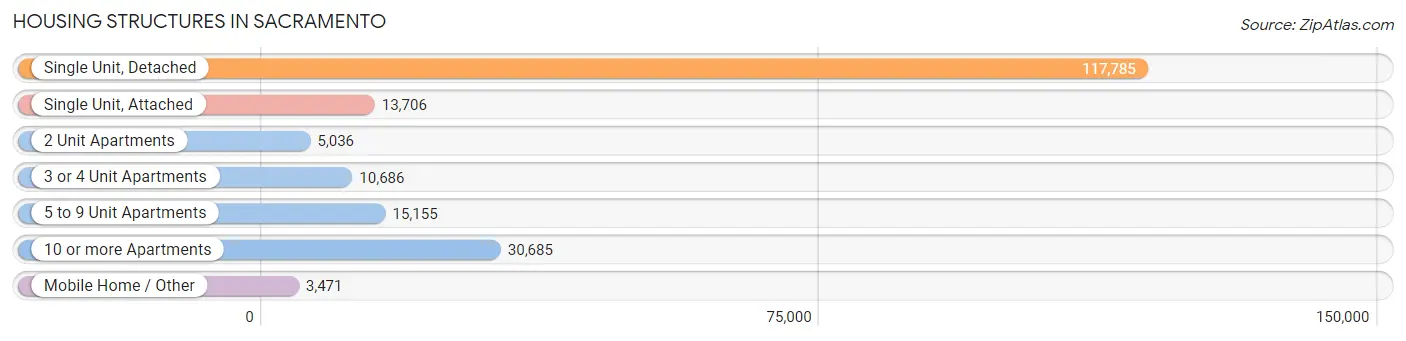
| Structure Type | # Housing Units | % Housing Units |
| Single Unit, Detached | 117,785 | 59.9% |
| Single Unit, Attached | 13,706 | 7.0% |
| 2 Unit Apartments | 5,036 | 2.6% |
| 3 or 4 Unit Apartments | 10,686 | 5.4% |
| 5 to 9 Unit Apartments | 15,155 | 7.7% |
| 10 or more Apartments | 30,685 | 15.6% |
| Mobile Home / Other | 3,471 | 1.8% |
| Total | 196,524 | 100.0% |
Housing Structures by Occupancy in Sacramento
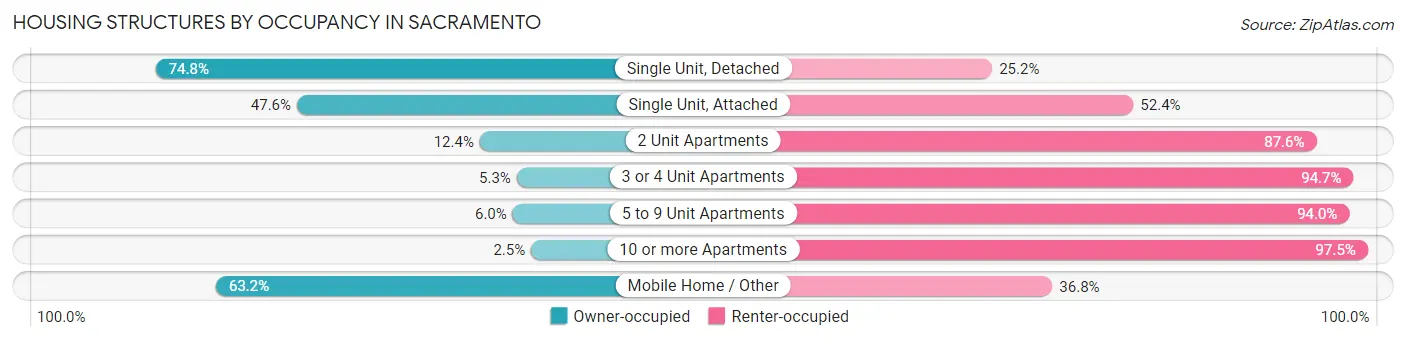
| Structure Type | Owner-occupied | Renter-occupied |
| Single Unit, Detached | 88,065 (74.8%) | 29,720 (25.2%) |
| Single Unit, Attached | 6,521 (47.6%) | 7,185 (52.4%) |
| 2 Unit Apartments | 623 (12.4%) | 4,413 (87.6%) |
| 3 or 4 Unit Apartments | 562 (5.3%) | 10,124 (94.7%) |
| 5 to 9 Unit Apartments | 915 (6.0%) | 14,240 (94.0%) |
| 10 or more Apartments | 763 (2.5%) | 29,922 (97.5%) |
| Mobile Home / Other | 2,193 (63.2%) | 1,278 (36.8%) |
| Total | 99,642 (50.7%) | 96,882 (49.3%) |
Housing Structures by Number of Rooms in Sacramento
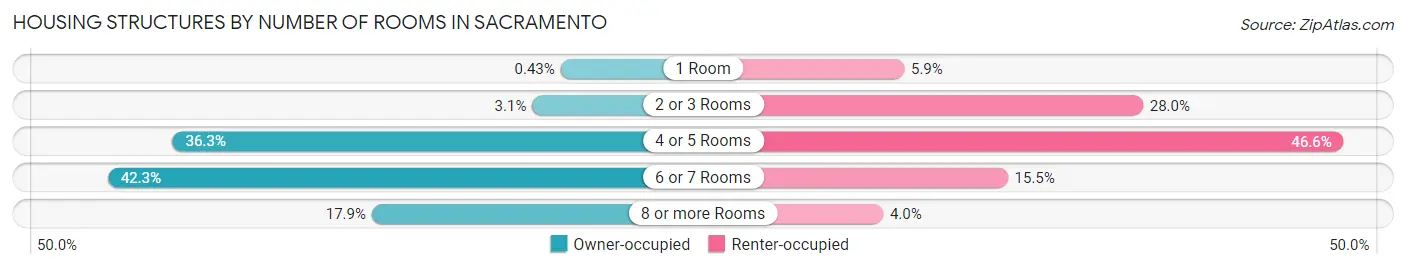
| Number of Rooms | Owner-occupied | Renter-occupied |
| 1 Room | 428 (0.4%) | 5,745 (5.9%) |
| 2 or 3 Rooms | 3,044 (3.0%) | 27,132 (28.0%) |
| 4 or 5 Rooms | 36,178 (36.3%) | 45,126 (46.6%) |
| 6 or 7 Rooms | 42,162 (42.3%) | 15,022 (15.5%) |
| 8 or more Rooms | 17,830 (17.9%) | 3,857 (4.0%) |
| Total | 99,642 (100.0%) | 96,882 (100.0%) |
Housing Structure by Heating Type in Sacramento
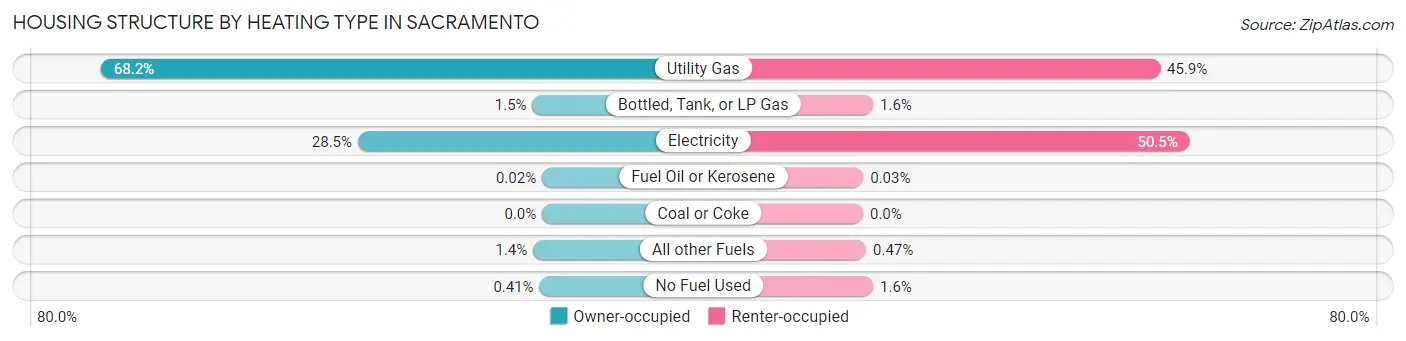
| Heating Type | Owner-occupied | Renter-occupied |
| Utility Gas | 67,955 (68.2%) | 44,493 (45.9%) |
| Bottled, Tank, or LP Gas | 1,487 (1.5%) | 1,515 (1.6%) |
| Electricity | 28,382 (28.5%) | 48,895 (50.5%) |
| Fuel Oil or Kerosene | 20 (0.0%) | 26 (0.0%) |
| Coal or Coke | 0 (0.0%) | 0 (0.0%) |
| All other Fuels | 1,390 (1.4%) | 452 (0.5%) |
| No Fuel Used | 408 (0.4%) | 1,501 (1.5%) |
| Total | 99,642 (100.0%) | 96,882 (100.0%) |
Household Vehicle Usage in Sacramento
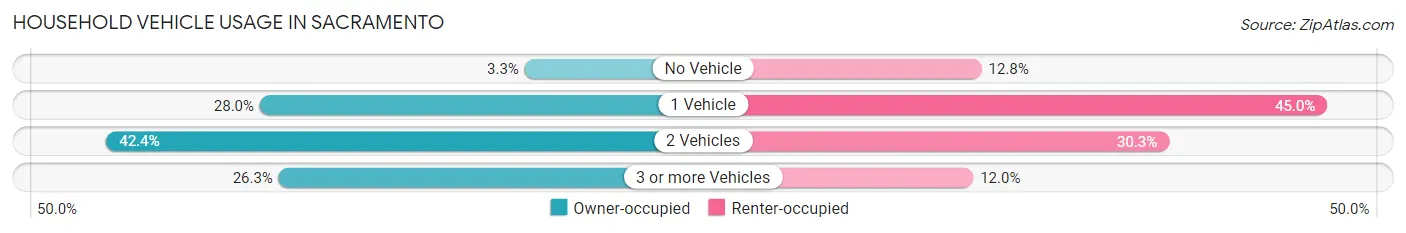
| Vehicles per Household | Owner-occupied | Renter-occupied |
| No Vehicle | 3,305 (3.3%) | 12,349 (12.8%) |
| 1 Vehicle | 27,935 (28.0%) | 43,616 (45.0%) |
| 2 Vehicles | 42,216 (42.4%) | 29,308 (30.2%) |
| 3 or more Vehicles | 26,186 (26.3%) | 11,609 (12.0%) |
| Total | 99,642 (100.0%) | 96,882 (100.0%) |
Real Estate & Mortgages in Sacramento
Real Estate and Mortgage Overview in Sacramento
| Characteristic | Without Mortgage | With Mortgage |
| Housing Units | 30,226 | 69,416 |
| Median Property Value | $434,800 | $456,600 |
| Median Household Income | $82,274 | $23,716 |
| Monthly Housing Costs | $640 | $15,252 |
| Real Estate Taxes | $2,503 | $2,009 |
Property Value by Mortgage Status in Sacramento
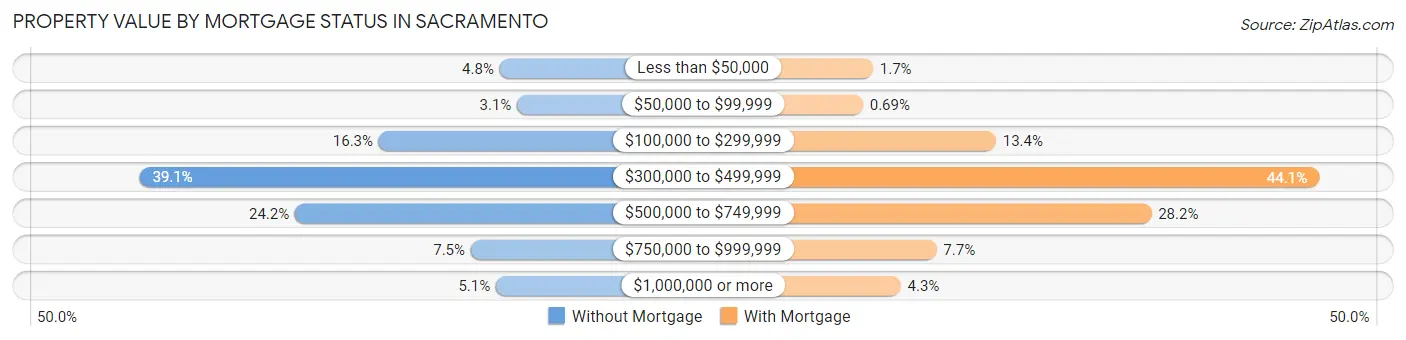
| Property Value | Without Mortgage | With Mortgage |
| Less than $50,000 | 1,437 (4.8%) | 1,144 (1.7%) |
| $50,000 to $99,999 | 933 (3.1%) | 478 (0.7%) |
| $100,000 to $299,999 | 4,914 (16.3%) | 9,277 (13.4%) |
| $300,000 to $499,999 | 11,807 (39.1%) | 30,641 (44.1%) |
| $500,000 to $749,999 | 7,326 (24.2%) | 19,550 (28.2%) |
| $750,000 to $999,999 | 2,266 (7.5%) | 5,348 (7.7%) |
| $1,000,000 or more | 1,543 (5.1%) | 2,978 (4.3%) |
| Total | 30,226 (100.0%) | 69,416 (100.0%) |
Household Income by Mortgage Status in Sacramento
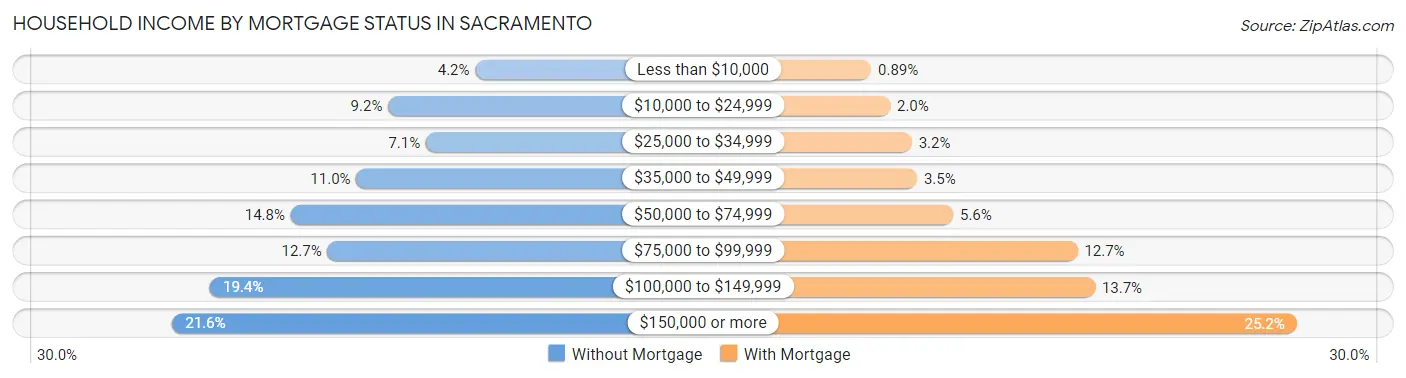
| Household Income | Without Mortgage | With Mortgage |
| Less than $10,000 | 1,283 (4.2%) | 620 (0.9%) |
| $10,000 to $24,999 | 2,788 (9.2%) | 1,369 (2.0%) |
| $25,000 to $34,999 | 2,133 (7.1%) | 2,230 (3.2%) |
| $35,000 to $49,999 | 3,336 (11.0%) | 2,434 (3.5%) |
| $50,000 to $74,999 | 4,471 (14.8%) | 3,868 (5.6%) |
| $75,000 to $99,999 | 3,835 (12.7%) | 8,804 (12.7%) |
| $100,000 to $149,999 | 5,864 (19.4%) | 9,497 (13.7%) |
| $150,000 or more | 6,516 (21.6%) | 17,498 (25.2%) |
| Total | 30,226 (100.0%) | 69,416 (100.0%) |
Property Value to Household Income Ratio in Sacramento
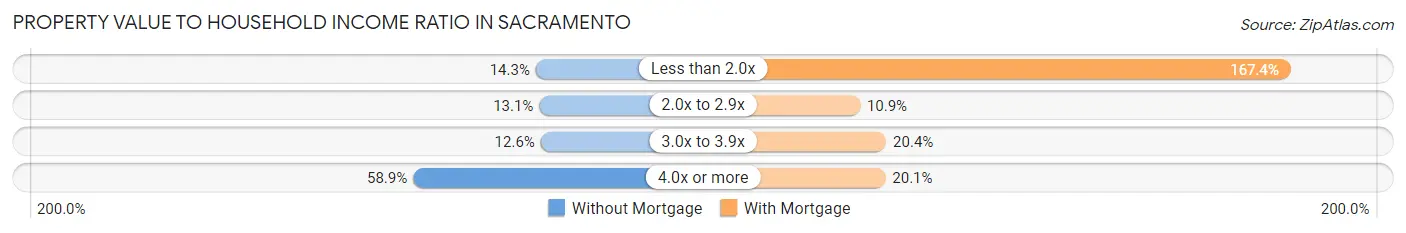
| Value-to-Income Ratio | Without Mortgage | With Mortgage |
| Less than 2.0x | 4,335 (14.3%) | 116,191 (167.4%) |
| 2.0x to 2.9x | 3,956 (13.1%) | 7,565 (10.9%) |
| 3.0x to 3.9x | 3,794 (12.6%) | 14,175 (20.4%) |
| 4.0x or more | 17,804 (58.9%) | 13,971 (20.1%) |
| Total | 30,226 (100.0%) | 69,416 (100.0%) |
Real Estate Taxes by Mortgage Status in Sacramento
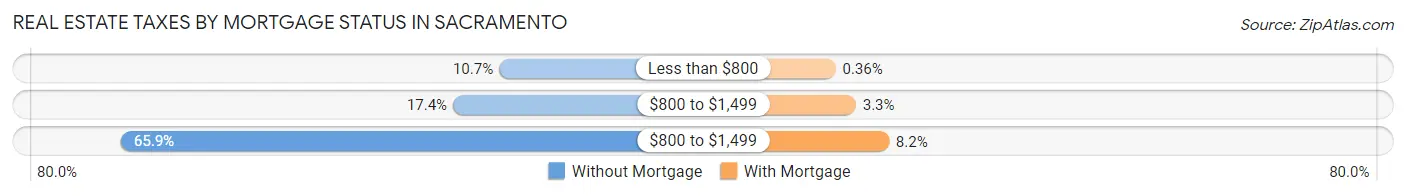
| Property Taxes | Without Mortgage | With Mortgage |
| Less than $800 | 3,229 (10.7%) | 253 (0.4%) |
| $800 to $1,499 | 5,262 (17.4%) | 2,302 (3.3%) |
| $800 to $1,499 | 19,925 (65.9%) | 5,662 (8.2%) |
| Total | 30,226 (100.0%) | 69,416 (100.0%) |
Health & Disability in Sacramento
Health Insurance Coverage by Age in Sacramento
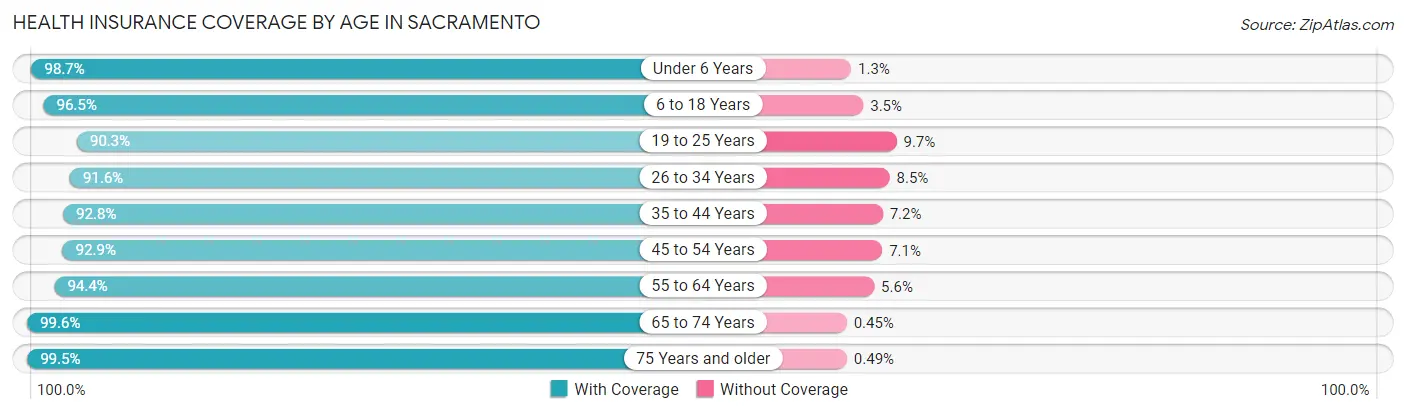
| Age Bracket | With Coverage | Without Coverage |
| Under 6 Years | 37,267 (98.7%) | 478 (1.3%) |
| 6 to 18 Years | 81,667 (96.5%) | 2,997 (3.5%) |
| 19 to 25 Years | 45,250 (90.3%) | 4,883 (9.7%) |
| 26 to 34 Years | 78,459 (91.5%) | 7,238 (8.5%) |
| 35 to 44 Years | 68,208 (92.8%) | 5,271 (7.2%) |
| 45 to 54 Years | 56,256 (92.9%) | 4,284 (7.1%) |
| 55 to 64 Years | 53,238 (94.4%) | 3,141 (5.6%) |
| 65 to 74 Years | 42,441 (99.6%) | 192 (0.4%) |
| 75 Years and older | 27,993 (99.5%) | 138 (0.5%) |
| Total | 490,779 (94.5%) | 28,622 (5.5%) |
Health Insurance Coverage by Citizenship Status in Sacramento
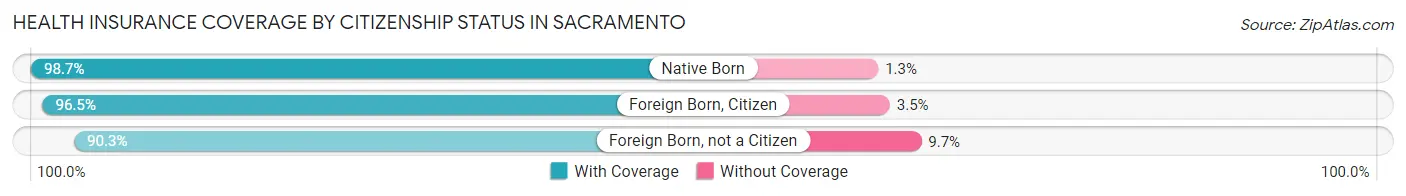
| Citizenship Status | With Coverage | Without Coverage |
| Native Born | 37,267 (98.7%) | 478 (1.3%) |
| Foreign Born, Citizen | 81,667 (96.5%) | 2,997 (3.5%) |
| Foreign Born, not a Citizen | 45,250 (90.3%) | 4,883 (9.7%) |
Health Insurance Coverage by Household Income in Sacramento
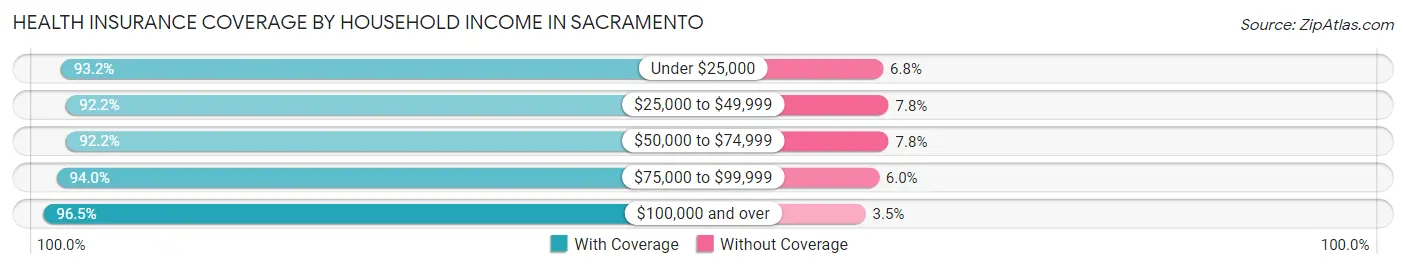
| Household Income | With Coverage | Without Coverage |
| Under $25,000 | 55,673 (93.2%) | 4,070 (6.8%) |
| $25,000 to $49,999 | 67,693 (92.2%) | 5,751 (7.8%) |
| $50,000 to $74,999 | 69,964 (92.2%) | 5,952 (7.8%) |
| $75,000 to $99,999 | 69,358 (94.0%) | 4,426 (6.0%) |
| $100,000 and over | 222,286 (96.5%) | 8,121 (3.5%) |
Public vs Private Health Insurance Coverage by Age in Sacramento
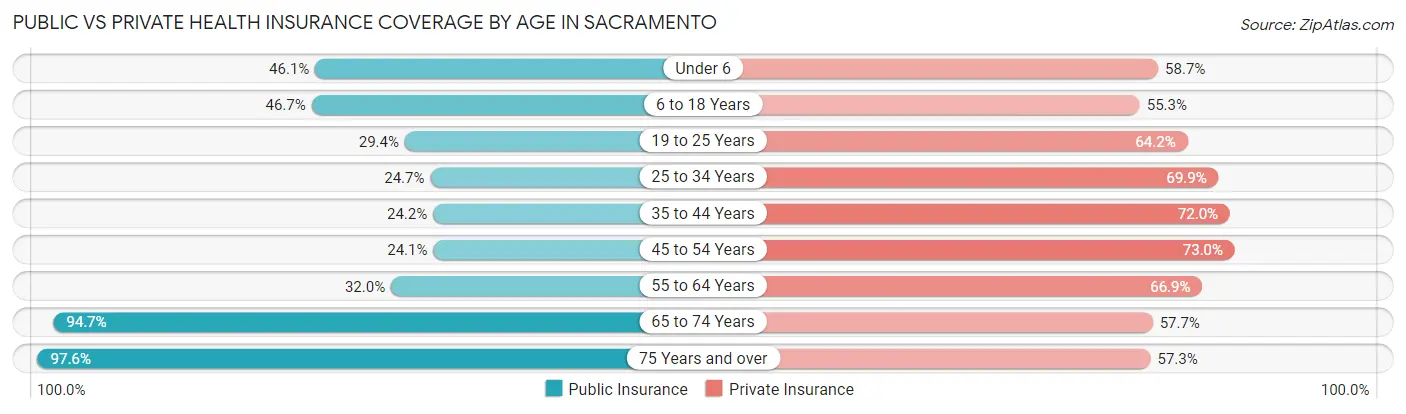
| Age Bracket | Public Insurance | Private Insurance |
| Under 6 | 17,391 (46.1%) | 22,164 (58.7%) |
| 6 to 18 Years | 39,567 (46.7%) | 46,833 (55.3%) |
| 19 to 25 Years | 14,755 (29.4%) | 32,164 (64.2%) |
| 25 to 34 Years | 21,158 (24.7%) | 59,916 (69.9%) |
| 35 to 44 Years | 17,771 (24.2%) | 52,931 (72.0%) |
| 45 to 54 Years | 14,617 (24.1%) | 44,166 (73.0%) |
| 55 to 64 Years | 18,035 (32.0%) | 37,726 (66.9%) |
| 65 to 74 Years | 40,354 (94.7%) | 24,605 (57.7%) |
| 75 Years and over | 27,451 (97.6%) | 16,121 (57.3%) |
| Total | 211,099 (40.6%) | 336,626 (64.8%) |
Disability Status by Sex by Age in Sacramento
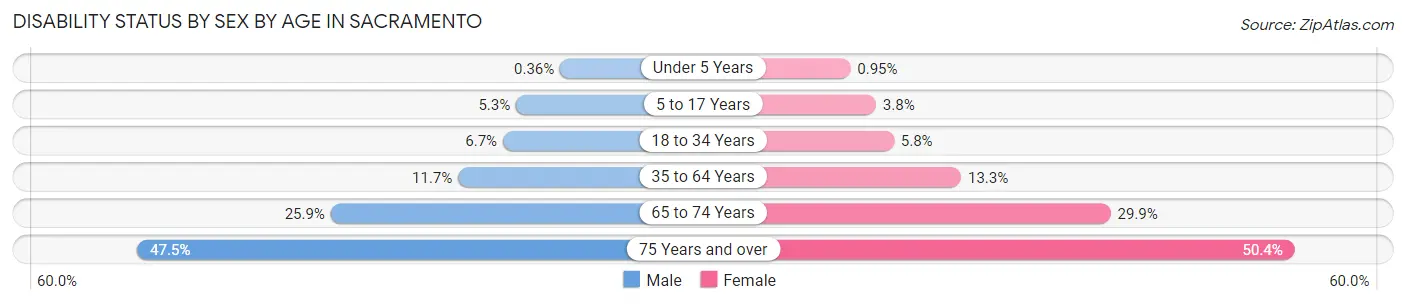
| Age Bracket | Male | Female |
| Under 5 Years | 58 (0.4%) | 146 (0.9%) |
| 5 to 17 Years | 2,264 (5.3%) | 1,538 (3.8%) |
| 18 to 34 Years | 4,824 (6.7%) | 4,159 (5.8%) |
| 35 to 64 Years | 10,914 (11.7%) | 12,915 (13.3%) |
| 65 to 74 Years | 5,268 (25.9%) | 6,674 (29.9%) |
| 75 Years and over | 5,527 (47.5%) | 8,315 (50.4%) |
Disability Class by Sex by Age in Sacramento
Disability Class: Hearing Difficulty
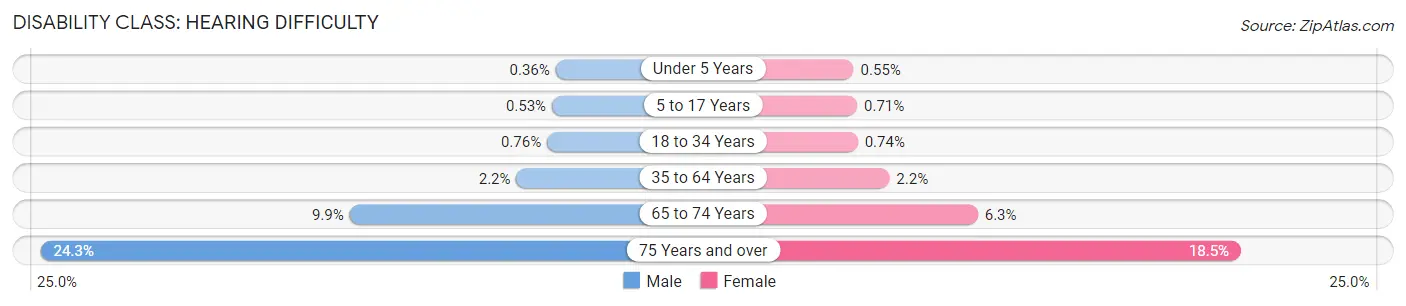
| Age Bracket | Male | Female |
| Under 5 Years | 58 (0.4%) | 85 (0.5%) |
| 5 to 17 Years | 229 (0.5%) | 288 (0.7%) |
| 18 to 34 Years | 541 (0.8%) | 533 (0.7%) |
| 35 to 64 Years | 2,029 (2.2%) | 2,145 (2.2%) |
| 65 to 74 Years | 2,017 (9.9%) | 1,407 (6.3%) |
| 75 Years and over | 2,825 (24.3%) | 3,053 (18.5%) |
Disability Class: Vision Difficulty
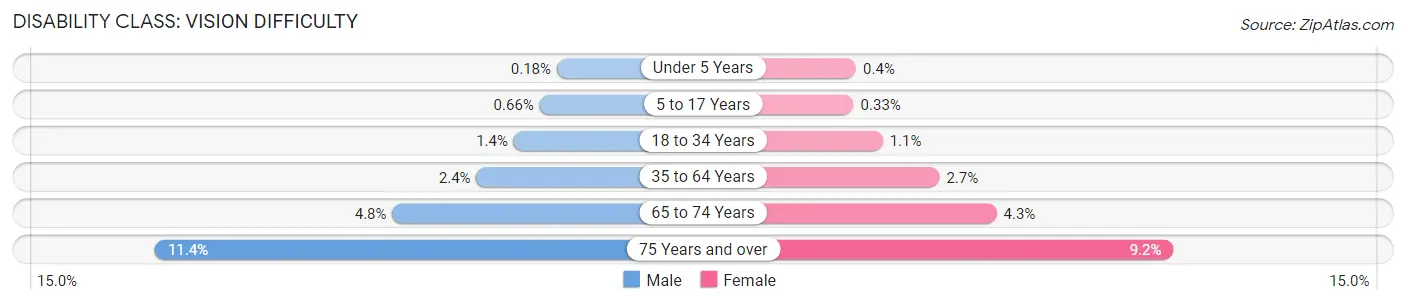
| Age Bracket | Male | Female |
| Under 5 Years | 29 (0.2%) | 61 (0.4%) |
| 5 to 17 Years | 284 (0.7%) | 133 (0.3%) |
| 18 to 34 Years | 988 (1.4%) | 819 (1.1%) |
| 35 to 64 Years | 2,254 (2.4%) | 2,647 (2.7%) |
| 65 to 74 Years | 967 (4.8%) | 962 (4.3%) |
| 75 Years and over | 1,324 (11.4%) | 1,522 (9.2%) |
Disability Class: Cognitive Difficulty
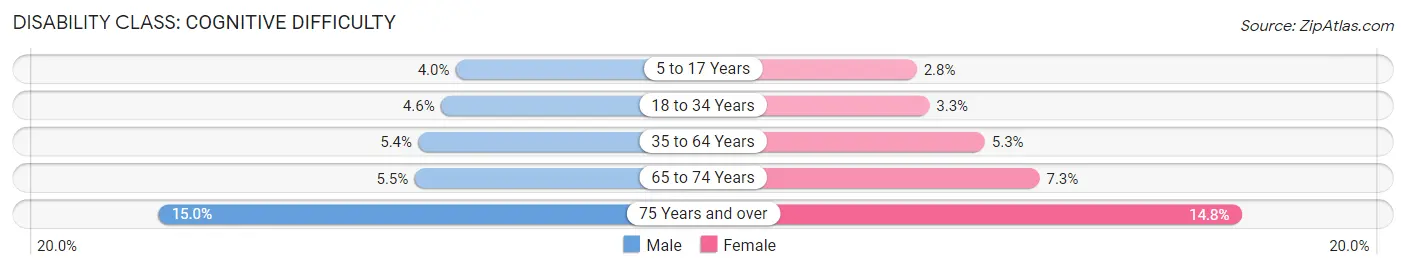
| Age Bracket | Male | Female |
| 5 to 17 Years | 1,725 (4.0%) | 1,126 (2.8%) |
| 18 to 34 Years | 3,264 (4.6%) | 2,330 (3.3%) |
| 35 to 64 Years | 5,028 (5.4%) | 5,167 (5.3%) |
| 65 to 74 Years | 1,127 (5.5%) | 1,637 (7.3%) |
| 75 Years and over | 1,749 (15.0%) | 2,445 (14.8%) |
Disability Class: Ambulatory Difficulty
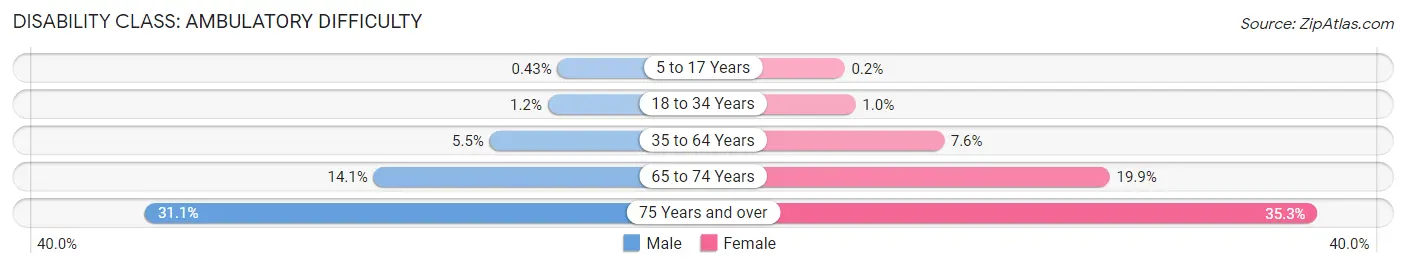
| Age Bracket | Male | Female |
| 5 to 17 Years | 184 (0.4%) | 80 (0.2%) |
| 18 to 34 Years | 832 (1.2%) | 725 (1.0%) |
| 35 to 64 Years | 5,092 (5.5%) | 7,359 (7.6%) |
| 65 to 74 Years | 2,866 (14.1%) | 4,434 (19.9%) |
| 75 Years and over | 3,616 (31.1%) | 5,822 (35.3%) |
Disability Class: Self-Care Difficulty
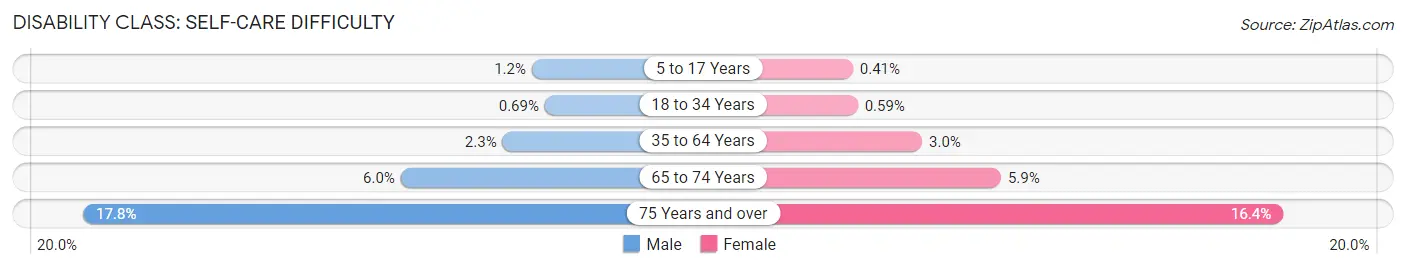
| Age Bracket | Male | Female |
| 5 to 17 Years | 502 (1.2%) | 164 (0.4%) |
| 18 to 34 Years | 494 (0.7%) | 426 (0.6%) |
| 35 to 64 Years | 2,105 (2.3%) | 2,897 (3.0%) |
| 65 to 74 Years | 1,228 (6.0%) | 1,318 (5.9%) |
| 75 Years and over | 2,076 (17.8%) | 2,700 (16.4%) |
Technology Access in Sacramento
Computing Device Access in Sacramento
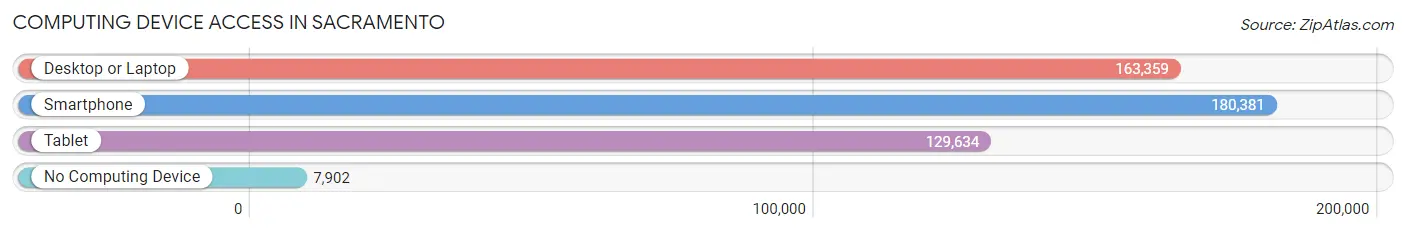
| Device Type | # Households | % Households |
| Desktop or Laptop | 163,359 | 83.1% |
| Smartphone | 180,381 | 91.8% |
| Tablet | 129,634 | 66.0% |
| No Computing Device | 7,902 | 4.0% |
| Total | 196,524 | 100.0% |
Internet Access in Sacramento
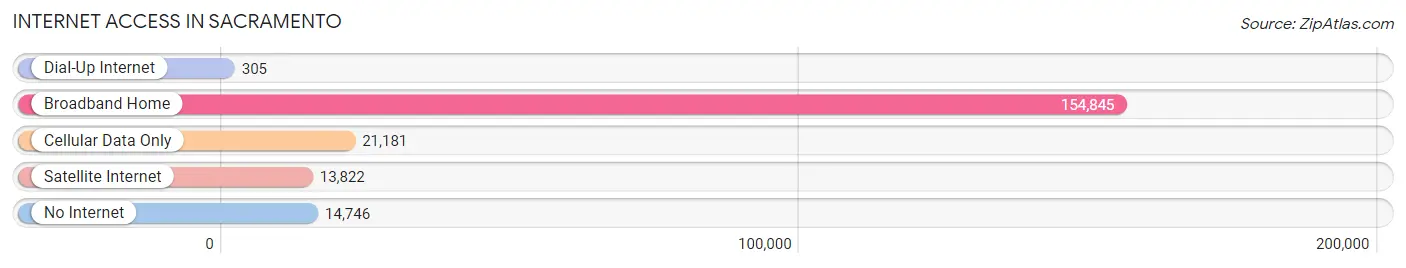
| Internet Type | # Households | % Households |
| Dial-Up Internet | 305 | 0.2% |
| Broadband Home | 154,845 | 78.8% |
| Cellular Data Only | 21,181 | 10.8% |
| Satellite Internet | 13,822 | 7.0% |
| No Internet | 14,746 | 7.5% |
| Total | 196,524 | 100.0% |
Sacramento Summary
Sacramento, California is the capital of the state of California and the county seat of Sacramento County. It is located at the confluence of the Sacramento and American Rivers in the northern portion of the Central Valley. As of 2019, the population of Sacramento was estimated to be 501,334, making it the sixth-largest city in California and the 35th-largest city in the United States.
History
Sacramento was founded in 1848 by John Sutter, a Swiss immigrant who established a fort and trading post at the confluence of the Sacramento and American Rivers. The city was named after the Sacramento River, which was named by Spanish explorer Gabriel Moraga for the Santisimo Sacramento (Most Holy Sacrament). In 1849, the city was chosen as the site of the California State Capitol, and it was incorporated as a city in 1850.
During the Gold Rush, Sacramento became a major hub for the transportation of goods and people. The city was a major center for the Pony Express and the Transcontinental Railroad, and it was the western terminus of the First Transcontinental Railroad.
In the late 19th century, Sacramento was a major center for the agricultural industry, and it was home to a large number of fruit canneries. The city was also a major center for the railroad industry, and it was home to the Western Pacific Railroad and the Southern Pacific Railroad.
Geography
Sacramento is located in the northern portion of the Central Valley, at the confluence of the Sacramento and American Rivers. The city is situated at an elevation of 30 feet (9 m) above sea level. The city covers an area of 97.2 square miles (251.6 km2), of which 95.7 square miles (247.6 km2) is land and 1.5 square miles (3.9 km2) is water.
The city is bordered by the cities of West Sacramento to the west, Davis to the north, and Folsom to the east. The city is also bordered by the Sacramento River to the south and the American River to the east.
Economy
Sacramento is a major economic center for the state of California. The city is home to a number of major corporations, including Intel, Hewlett-Packard, and Sutter Health. The city is also home to a number of government agencies, including the California State Capitol, the California Department of Motor Vehicles, and the California Department of Corrections and Rehabilitation.
The city is a major center for the agricultural industry, and it is home to a number of food processing plants and agricultural research centers. The city is also a major center for the transportation industry, and it is home to a number of trucking companies, freight companies, and railroads.
Demographics
As of 2019, the population of Sacramento was estimated to be 501,334, making it the sixth-largest city in California and the 35th-largest city in the United States. The city has a population density of 5,093 people per square mile (1,967/km2).
The racial makeup of Sacramento is 54.2% White, 24.2% Hispanic or Latino, 16.2% Asian, 8.2% African American, 0.7% Native American, 0.2% Pacific Islander, and 4.7% from other races. The median household income in Sacramento is $54,845, and the median family income is $63,945. The per capita income in Sacramento is $27,945.
Common Questions
What is Per Capita Income in Sacramento?
Per Capita income in Sacramento is $39,336.
What is the Median Family Income in Sacramento?
Median Family Income in Sacramento is $92,595.
What is the Median Household income in Sacramento?
Median Household Income in Sacramento is $78,954.
What is Income or Wage Gap in Sacramento?
Income or Wage Gap in Sacramento is 14.5%.
Women in Sacramento earn 85.5 cents for every dollar earned by a man.
What is Family Income Deficit in Sacramento?
Family Income Deficit in Sacramento is $12,144.
Families that are below poverty line in Sacramento earn $12,144 less on average than the poverty threshold level.
What is Inequality or Gini Index in Sacramento?
Inequality or Gini Index in Sacramento is 0.45.
What is the Total Population of Sacramento?
Total Population of Sacramento is 523,600.
What is the Total Male Population of Sacramento?
Total Male Population of Sacramento is 258,612.
What is the Total Female Population of Sacramento?
Total Female Population of Sacramento is 264,988.
What is the Ratio of Males per 100 Females in Sacramento?
There are 97.59 Males per 100 Females in Sacramento.
What is the Ratio of Females per 100 Males in Sacramento?
There are 102.47 Females per 100 Males in Sacramento.
What is the Median Population Age in Sacramento?
Median Population Age in Sacramento is 35.2 Years.
What is the Average Family Size in Sacramento
Average Family Size in Sacramento is 3.4 People.
What is the Average Household Size in Sacramento
Average Household Size in Sacramento is 2.6 People.
How Large is the Labor Force in Sacramento?
There are 272,517 People in the Labor Forcein in Sacramento.
What is the Percentage of People in the Labor Force in Sacramento?
64.6% of People are in the Labor Force in Sacramento.
What is the Unemployment Rate in Sacramento?
Unemployment Rate in Sacramento is 6.3%.