Milwaukee, WI Map & Demographics
Milwaukee Map
Milwaukee Overview
$28,079
PER CAPITA INCOME
$57,900
AVG FAMILY INCOME
$49,733
AVG HOUSEHOLD INCOME
17.6%
WAGE / INCOME GAP [ % ]
82.4¢/ $1
WAGE / INCOME GAP [ $ ]
$11,086
FAMILY INCOME DEFICIT
0.47
INEQUALITY / GINI INDEX
573,299
TOTAL POPULATION
278,825
MALE POPULATION
294,474
FEMALE POPULATION
94.69
MALES / 100 FEMALES
105.61
FEMALES / 100 MALES
31.8
MEDIAN AGE
3.3
AVG FAMILY SIZE
2.4
AVG HOUSEHOLD SIZE
282,388
LABOR FORCE [ PEOPLE ]
64.0%
PERCENT IN LABOR FORCE
5.9%
UNEMPLOYMENT RATE
Milwaukee Zip Codes
Income in Milwaukee
Income Overview in Milwaukee
Per Capita Income in Milwaukee is $28,079, while median incomes of families and households are $57,900 and $49,733 respectively.
| Characteristic | Number | Measure |
| Per Capita Income | 573,299 | $28,079 |
| Median Family Income | 119,399 | $57,900 |
| Mean Family Income | 119,399 | $77,456 |
| Median Household Income | 230,759 | $49,733 |
| Mean Household Income | 230,759 | $67,046 |
| Income Deficit | 119,399 | $11,086 |
| Wage / Income Gap (%) | 573,299 | 17.58% |
| Wage / Income Gap ($) | 573,299 | 82.42¢ per $1 |
| Gini / Inequality Index | 573,299 | 0.47 |
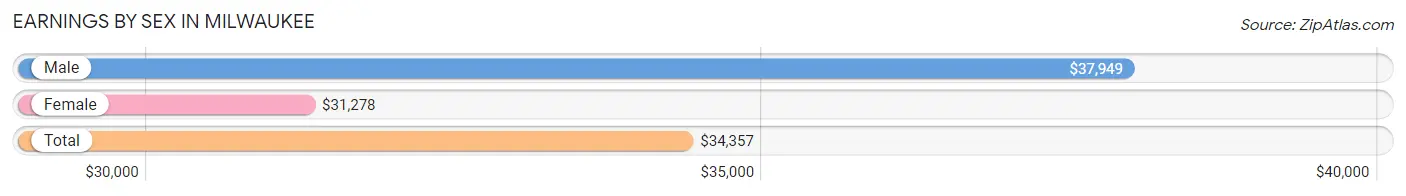
Earnings by Sex in Milwaukee
Average Earnings in Milwaukee are $34,357, $37,949 for men and $31,278 for women, a difference of 17.6%.
| Sex | Number | Average Earnings |
| Male | 147,151 (49.4%) | $37,949 |
| Female | 150,670 (50.6%) | $31,278 |
| Total | 297,821 (100.0%) | $34,357 |
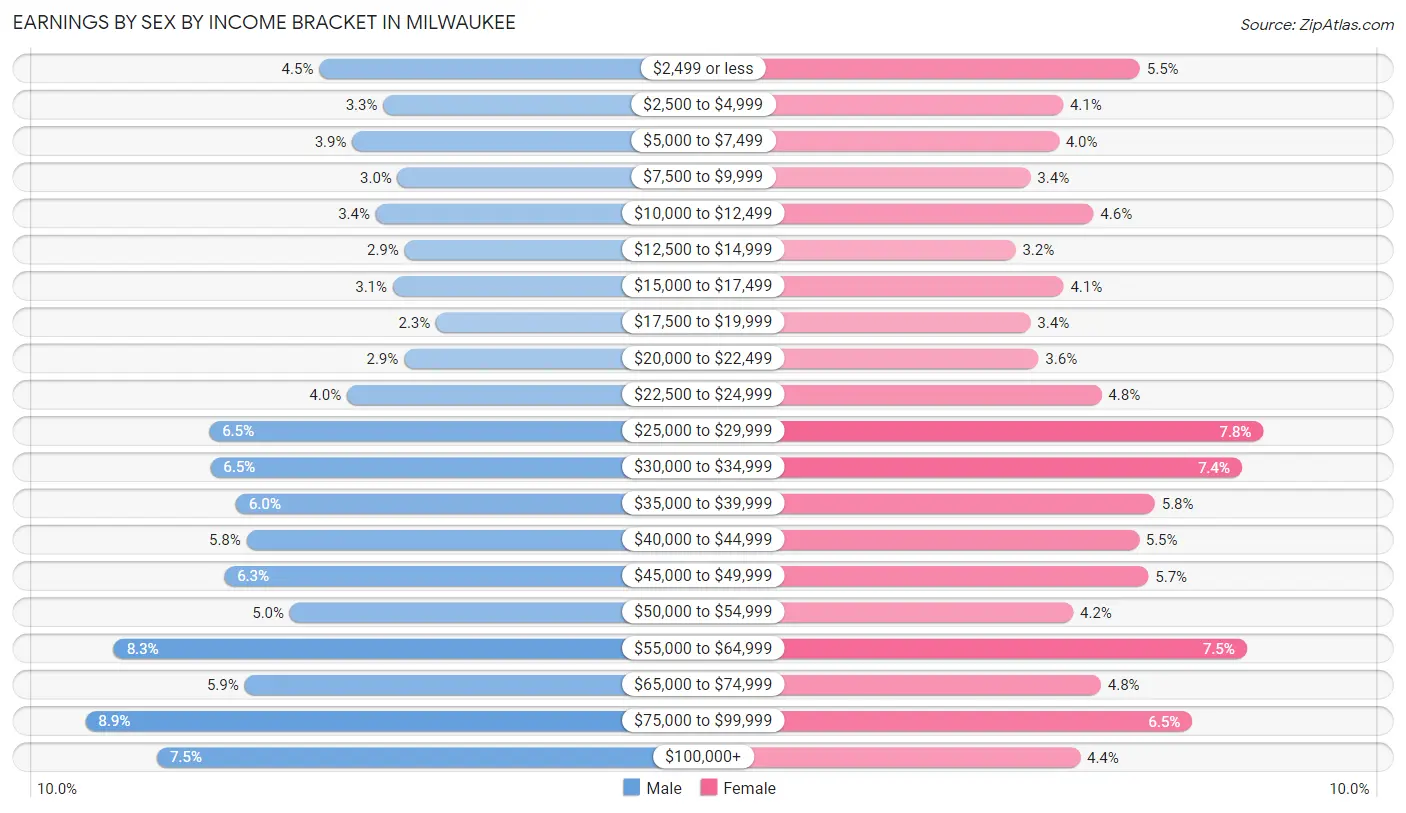
Earnings by Sex by Income Bracket in Milwaukee
The most common earnings brackets in Milwaukee are $75,000 to $99,999 for men (13,031 | 8.9%) and $25,000 to $29,999 for women (11,752 | 7.8%).
| Income | Male | Female |
| $2,499 or less | 6,590 (4.5%) | 8,270 (5.5%) |
| $2,500 to $4,999 | 4,828 (3.3%) | 6,104 (4.1%) |
| $5,000 to $7,499 | 5,686 (3.9%) | 5,983 (4.0%) |
| $7,500 to $9,999 | 4,430 (3.0%) | 5,180 (3.4%) |
| $10,000 to $12,499 | 5,028 (3.4%) | 6,960 (4.6%) |
| $12,500 to $14,999 | 4,244 (2.9%) | 4,768 (3.2%) |
| $15,000 to $17,499 | 4,559 (3.1%) | 6,112 (4.1%) |
| $17,500 to $19,999 | 3,366 (2.3%) | 5,178 (3.4%) |
| $20,000 to $22,499 | 4,258 (2.9%) | 5,406 (3.6%) |
| $22,500 to $24,999 | 5,834 (4.0%) | 7,193 (4.8%) |
| $25,000 to $29,999 | 9,630 (6.5%) | 11,752 (7.8%) |
| $30,000 to $34,999 | 9,598 (6.5%) | 11,153 (7.4%) |
| $35,000 to $39,999 | 8,882 (6.0%) | 8,690 (5.8%) |
| $40,000 to $44,999 | 8,598 (5.8%) | 8,240 (5.5%) |
| $45,000 to $49,999 | 9,210 (6.3%) | 8,507 (5.7%) |
| $50,000 to $54,999 | 7,409 (5.0%) | 6,394 (4.2%) |
| $55,000 to $64,999 | 12,262 (8.3%) | 11,282 (7.5%) |
| $65,000 to $74,999 | 8,649 (5.9%) | 7,168 (4.8%) |
| $75,000 to $99,999 | 13,031 (8.9%) | 9,741 (6.5%) |
| $100,000+ | 11,059 (7.5%) | 6,589 (4.4%) |
| Total | 147,151 (100.0%) | 150,670 (100.0%) |
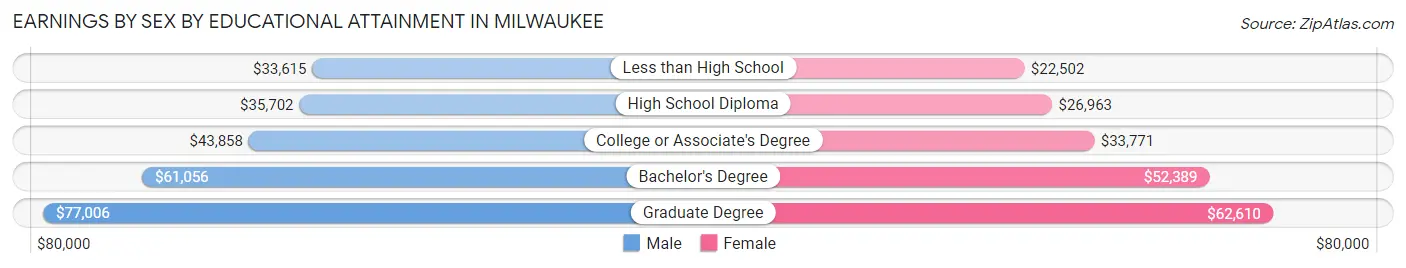
Earnings by Sex by Educational Attainment in Milwaukee
Average earnings in Milwaukee are $44,697 for men and $36,620 for women, a difference of 18.1%. Men with an educational attainment of graduate degree enjoy the highest average annual earnings of $77,006, while those with less than high school education earn the least with $33,615. Women with an educational attainment of graduate degree earn the most with the average annual earnings of $62,610, while those with less than high school education have the smallest earnings of $22,502.
| Educational Attainment | Male Income | Female Income |
| Less than High School | $33,615 | $22,502 |
| High School Diploma | $35,702 | $26,963 |
| College or Associate's Degree | $43,858 | $33,771 |
| Bachelor's Degree | $61,056 | $52,389 |
| Graduate Degree | $77,006 | $62,610 |
| Total | $44,697 | $36,620 |
Family Income in Milwaukee
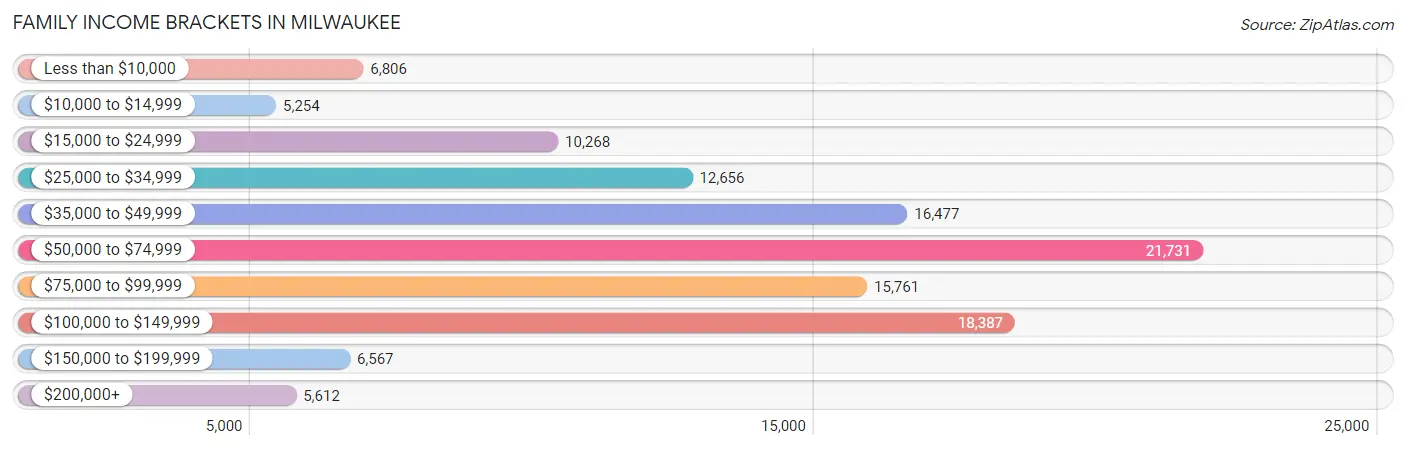
Family Income Brackets in Milwaukee
According to the Milwaukee family income data, there are 21,731 families falling into the $50,000 to $74,999 income range, which is the most common income bracket and makes up 18.2% of all families. Conversely, the $10,000 to $14,999 income bracket is the least frequent group with only 5,254 families (4.4%) belonging to this category.
| Income Bracket | # Families | % Families |
| Less than $10,000 | 6,806 | 5.7% |
| $10,000 to $14,999 | 5,254 | 4.4% |
| $15,000 to $24,999 | 10,268 | 8.6% |
| $25,000 to $34,999 | 12,656 | 10.6% |
| $35,000 to $49,999 | 16,477 | 13.8% |
| $50,000 to $74,999 | 21,731 | 18.2% |
| $75,000 to $99,999 | 15,761 | 13.2% |
| $100,000 to $149,999 | 18,387 | 15.4% |
| $150,000 to $199,999 | 6,567 | 5.5% |
| $200,000+ | 5,612 | 4.7% |
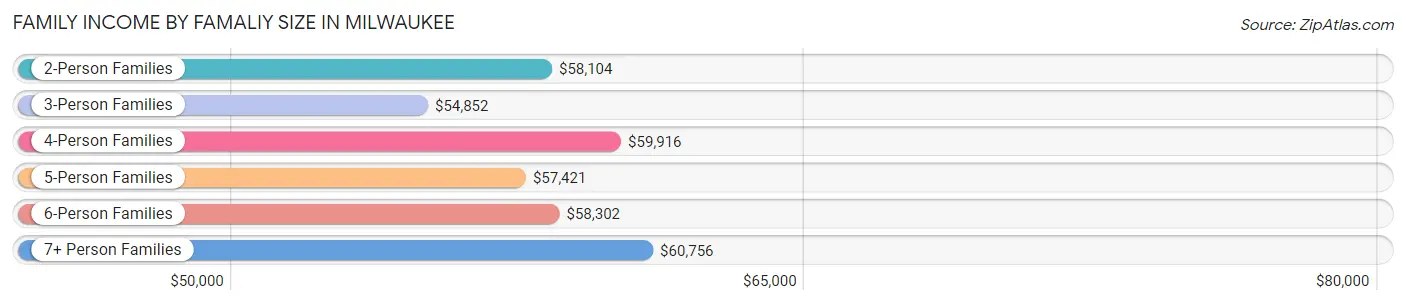
Family Income by Famaliy Size in Milwaukee
7+ person families (3,207 | 2.7%) account for the highest median family income in Milwaukee with $60,756 per family, while 2-person families (53,000 | 44.4%) have the highest median income of $29,052 per family member.
| Income Bracket | # Families | Median Income |
| 2-Person Families | 53,000 (44.4%) | $58,104 |
| 3-Person Families | 27,574 (23.1%) | $54,852 |
| 4-Person Families | 20,582 (17.2%) | $59,916 |
| 5-Person Families | 10,549 (8.8%) | $57,421 |
| 6-Person Families | 4,487 (3.8%) | $58,302 |
| 7+ Person Families | 3,207 (2.7%) | $60,756 |
| Total | 119,399 (100.0%) | $57,900 |
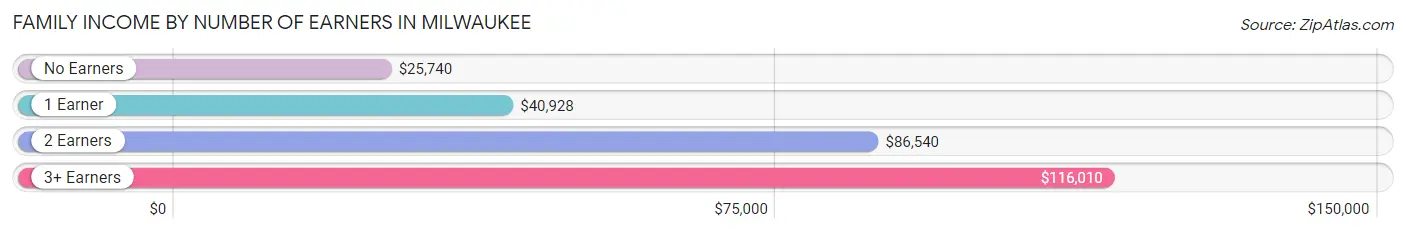
Family Income by Number of Earners in Milwaukee
The median family income in Milwaukee is $57,900, with families comprising 3+ earners (12,098) having the highest median family income of $116,010, while families with no earners (15,942) have the lowest median family income of $25,740, accounting for 10.1% and 13.4% of families, respectively.
| Number of Earners | # Families | Median Income |
| No Earners | 15,942 (13.4%) | $25,740 |
| 1 Earner | 49,981 (41.9%) | $40,928 |
| 2 Earners | 41,378 (34.7%) | $86,540 |
| 3+ Earners | 12,098 (10.1%) | $116,010 |
| Total | 119,399 (100.0%) | $57,900 |
Household Income in Milwaukee
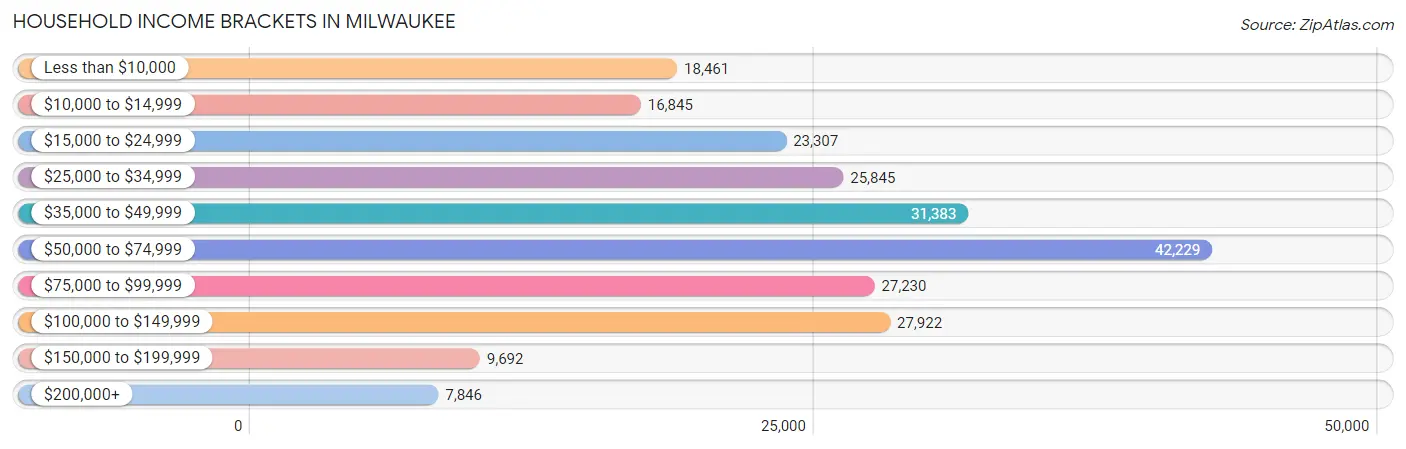
Household Income Brackets in Milwaukee
With 42,229 households falling in the category, the $50,000 to $74,999 income range is the most frequent in Milwaukee, accounting for 18.3% of all households. In contrast, only 7,846 households (3.4%) fall into the $200,000+ income bracket, making it the least populous group.
| Income Bracket | # Households | % Households |
| Less than $10,000 | 18,461 | 8.0% |
| $10,000 to $14,999 | 16,845 | 7.3% |
| $15,000 to $24,999 | 23,307 | 10.1% |
| $25,000 to $34,999 | 25,845 | 11.2% |
| $35,000 to $49,999 | 31,383 | 13.6% |
| $50,000 to $74,999 | 42,229 | 18.3% |
| $75,000 to $99,999 | 27,230 | 11.8% |
| $100,000 to $149,999 | 27,922 | 12.1% |
| $150,000 to $199,999 | 9,692 | 4.2% |
| $200,000+ | 7,846 | 3.4% |
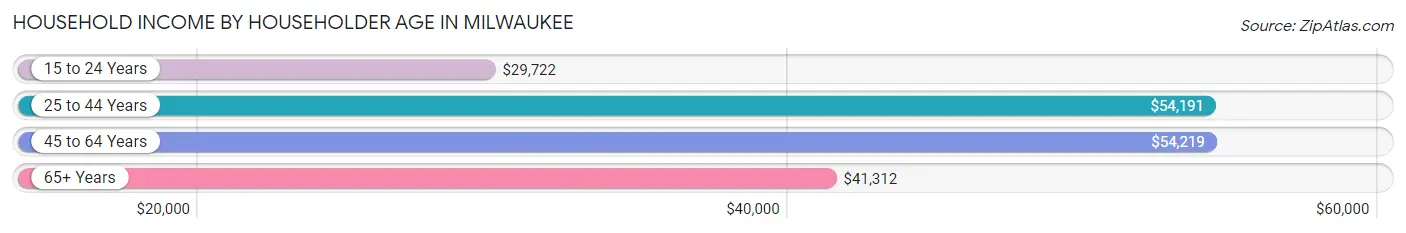
Household Income by Householder Age in Milwaukee
The median household income in Milwaukee is $49,733, with the highest median household income of $54,219 found in the 45 to 64 years age bracket for the primary householder. A total of 75,119 households (32.6%) fall into this category. Meanwhile, the 15 to 24 years age bracket for the primary householder has the lowest median household income of $29,722, with 15,986 households (6.9%) in this group.
| Income Bracket | # Households | Median Income |
| 15 to 24 Years | 15,986 (6.9%) | $29,722 |
| 25 to 44 Years | 95,867 (41.5%) | $54,191 |
| 45 to 64 Years | 75,119 (32.6%) | $54,219 |
| 65+ Years | 43,787 (19.0%) | $41,312 |
| Total | 230,759 (100.0%) | $49,733 |
Poverty in Milwaukee
Income Below Poverty by Sex and Age in Milwaukee
With 22.7% poverty level for males and 25.0% for females among the residents of Milwaukee, 6 to 11 year old males and 5 year old females are the most vulnerable to poverty, with 9,649 males (37.3%) and 1,475 females (38.5%) in their respective age groups living below the poverty level.
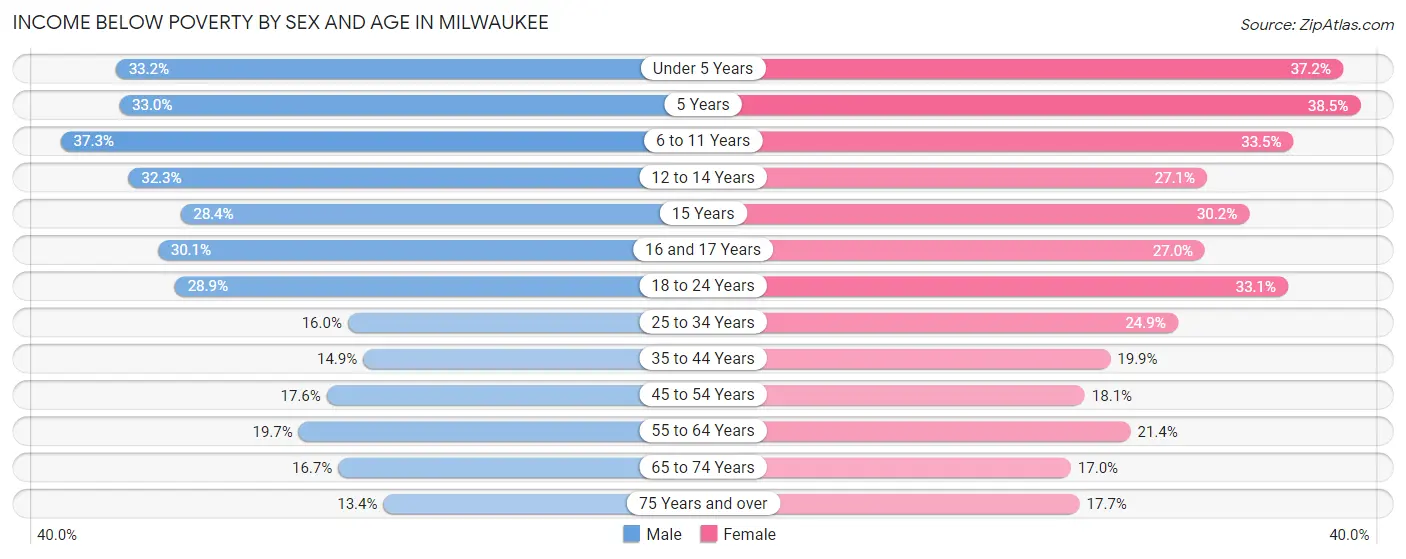
| Age Bracket | Male | Female |
| Under 5 Years | 6,821 (33.2%) | 7,401 (37.2%) |
| 5 Years | 1,216 (33.0%) | 1,475 (38.5%) |
| 6 to 11 Years | 9,649 (37.3%) | 7,844 (33.5%) |
| 12 to 14 Years | 3,933 (32.3%) | 3,323 (27.1%) |
| 15 Years | 1,185 (28.4%) | 1,162 (30.2%) |
| 16 and 17 Years | 2,302 (30.1%) | 1,983 (27.0%) |
| 18 to 24 Years | 8,767 (28.8%) | 9,901 (33.1%) |
| 25 to 34 Years | 7,523 (16.0%) | 12,420 (24.9%) |
| 35 to 44 Years | 5,174 (14.9%) | 7,678 (19.9%) |
| 45 to 54 Years | 5,164 (17.6%) | 5,667 (18.0%) |
| 55 to 64 Years | 5,556 (19.7%) | 6,639 (21.4%) |
| 65 to 74 Years | 3,101 (16.7%) | 3,568 (17.0%) |
| 75 Years and over | 1,225 (13.4%) | 2,573 (17.7%) |
| Total | 61,616 (22.7%) | 71,634 (25.0%) |
Income Above Poverty by Sex and Age in Milwaukee
According to the poverty statistics in Milwaukee, males aged 75 years and over and females aged 65 to 74 years are the age groups that are most secure financially, with 86.6% of males and 83.0% of females in these age groups living above the poverty line.
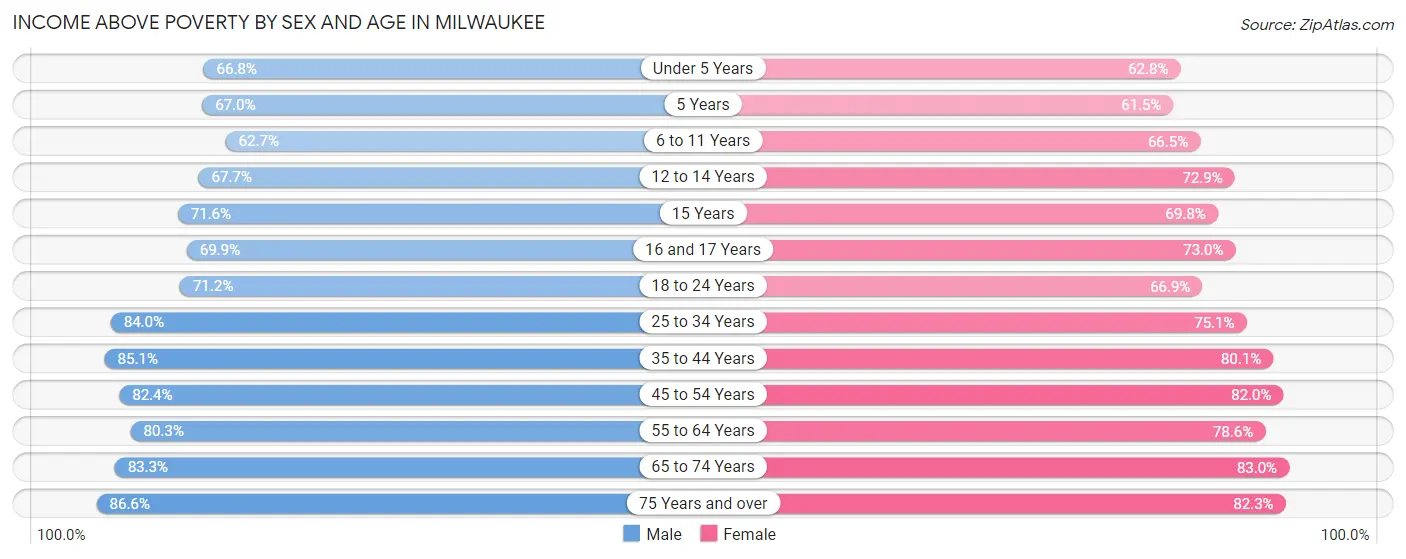
| Age Bracket | Male | Female |
| Under 5 Years | 13,705 (66.8%) | 12,502 (62.8%) |
| 5 Years | 2,471 (67.0%) | 2,358 (61.5%) |
| 6 to 11 Years | 16,205 (62.7%) | 15,558 (66.5%) |
| 12 to 14 Years | 8,245 (67.7%) | 8,941 (72.9%) |
| 15 Years | 2,981 (71.6%) | 2,680 (69.8%) |
| 16 and 17 Years | 5,344 (69.9%) | 5,372 (73.0%) |
| 18 to 24 Years | 21,622 (71.2%) | 20,006 (66.9%) |
| 25 to 34 Years | 39,455 (84.0%) | 37,410 (75.1%) |
| 35 to 44 Years | 29,616 (85.1%) | 30,818 (80.1%) |
| 45 to 54 Years | 24,218 (82.4%) | 25,736 (82.0%) |
| 55 to 64 Years | 22,702 (80.3%) | 24,326 (78.6%) |
| 65 to 74 Years | 15,432 (83.3%) | 17,402 (83.0%) |
| 75 Years and over | 7,940 (86.6%) | 11,995 (82.3%) |
| Total | 209,936 (77.3%) | 215,104 (75.0%) |
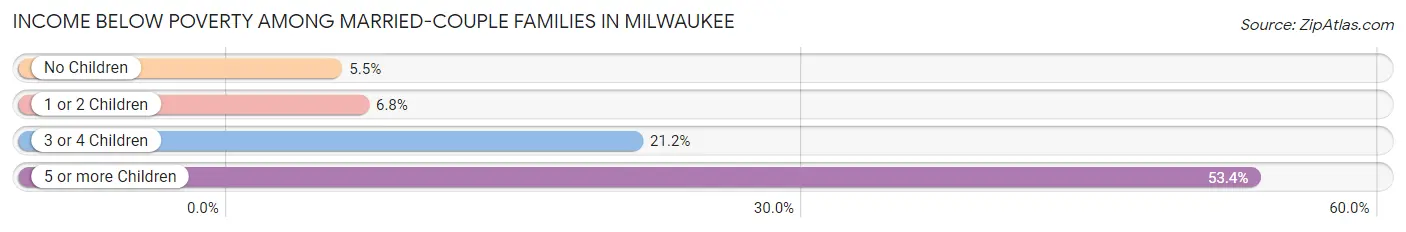
Income Below Poverty Among Married-Couple Families in Milwaukee
The poverty statistics for married-couple families in Milwaukee show that 8.7% or 5,099 of the total 58,816 families live below the poverty line. Families with 5 or more children have the highest poverty rate of 53.4%, comprising of 687 families. On the other hand, families with no children have the lowest poverty rate of 5.4%, which includes 1,781 families.
| Children | Above Poverty | Below Poverty |
| No Children | 30,904 (94.6%) | 1,781 (5.4%) |
| 1 or 2 Children | 17,085 (93.2%) | 1,255 (6.8%) |
| 3 or 4 Children | 5,128 (78.8%) | 1,376 (21.2%) |
| 5 or more Children | 600 (46.6%) | 687 (53.4%) |
| Total | 53,717 (91.3%) | 5,099 (8.7%) |
Income Below Poverty Among Single-Parent Households in Milwaukee
According to the poverty data in Milwaukee, 22.4% or 3,244 single-father households and 31.2% or 14,404 single-mother households are living below the poverty line. Among single-father households, those with 3 or 4 children have the highest poverty rate, with 778 households (47.6%) experiencing poverty. Likewise, among single-mother households, those with 5 or more children have the highest poverty rate, with 714 households (68.5%) falling below the poverty line.
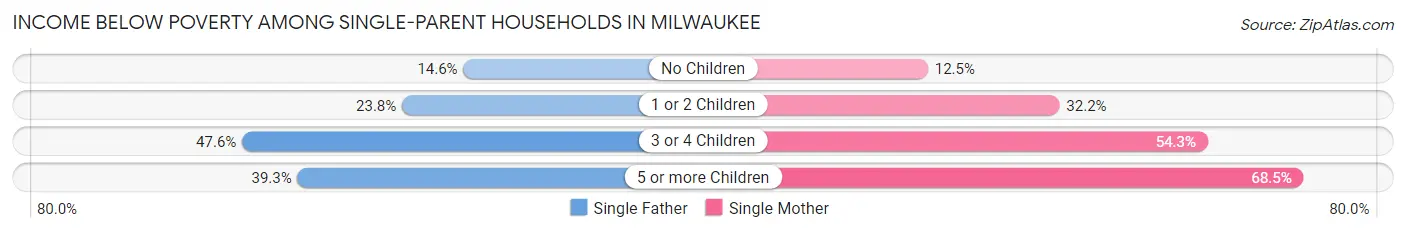
| Children | Single Father | Single Mother |
| No Children | 975 (14.6%) | 1,646 (12.5%) |
| 1 or 2 Children | 1,421 (23.7%) | 7,694 (32.2%) |
| 3 or 4 Children | 778 (47.6%) | 4,350 (54.2%) |
| 5 or more Children | 70 (39.3%) | 714 (68.5%) |
| Total | 3,244 (22.4%) | 14,404 (31.2%) |
Income Below Poverty Among Married-Couple vs Single-Parent Households in Milwaukee
The poverty data for Milwaukee shows that 5,099 of the married-couple family households (8.7%) and 17,648 of the single-parent households (29.1%) are living below the poverty level. Within the married-couple family households, those with 5 or more children have the highest poverty rate, with 687 households (53.4%) falling below the poverty line. Among the single-parent households, those with 5 or more children have the highest poverty rate, with 784 household (64.3%) living below poverty.
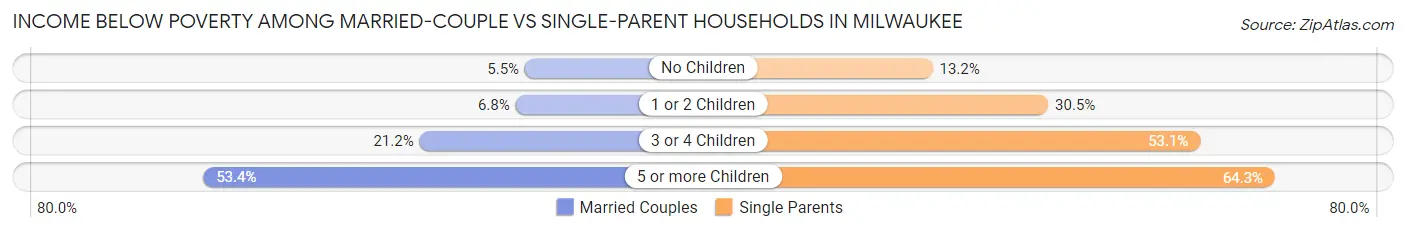
| Children | Married-Couple Families | Single-Parent Households |
| No Children | 1,781 (5.4%) | 2,621 (13.2%) |
| 1 or 2 Children | 1,255 (6.8%) | 9,115 (30.5%) |
| 3 or 4 Children | 1,376 (21.2%) | 5,128 (53.1%) |
| 5 or more Children | 687 (53.4%) | 784 (64.3%) |
| Total | 5,099 (8.7%) | 17,648 (29.1%) |
Race in Milwaukee
The most populous races in Milwaukee are White / Caucasian (222,199 | 38.8%), Black / African American (221,344 | 38.6%), and Hispanic or Latino (116,084 | 20.3%).
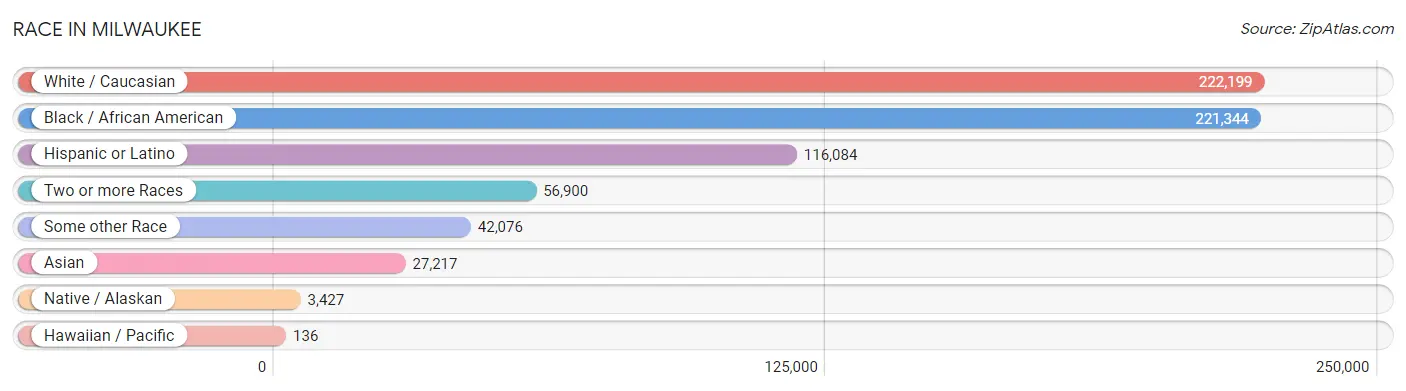
| Race | # Population | % Population |
| Asian | 27,217 | 4.8% |
| Black / African American | 221,344 | 38.6% |
| Hawaiian / Pacific | 136 | 0.0% |
| Hispanic or Latino | 116,084 | 20.3% |
| Native / Alaskan | 3,427 | 0.6% |
| White / Caucasian | 222,199 | 38.8% |
| Two or more Races | 56,900 | 9.9% |
| Some other Race | 42,076 | 7.3% |
| Total | 573,299 | 100.0% |
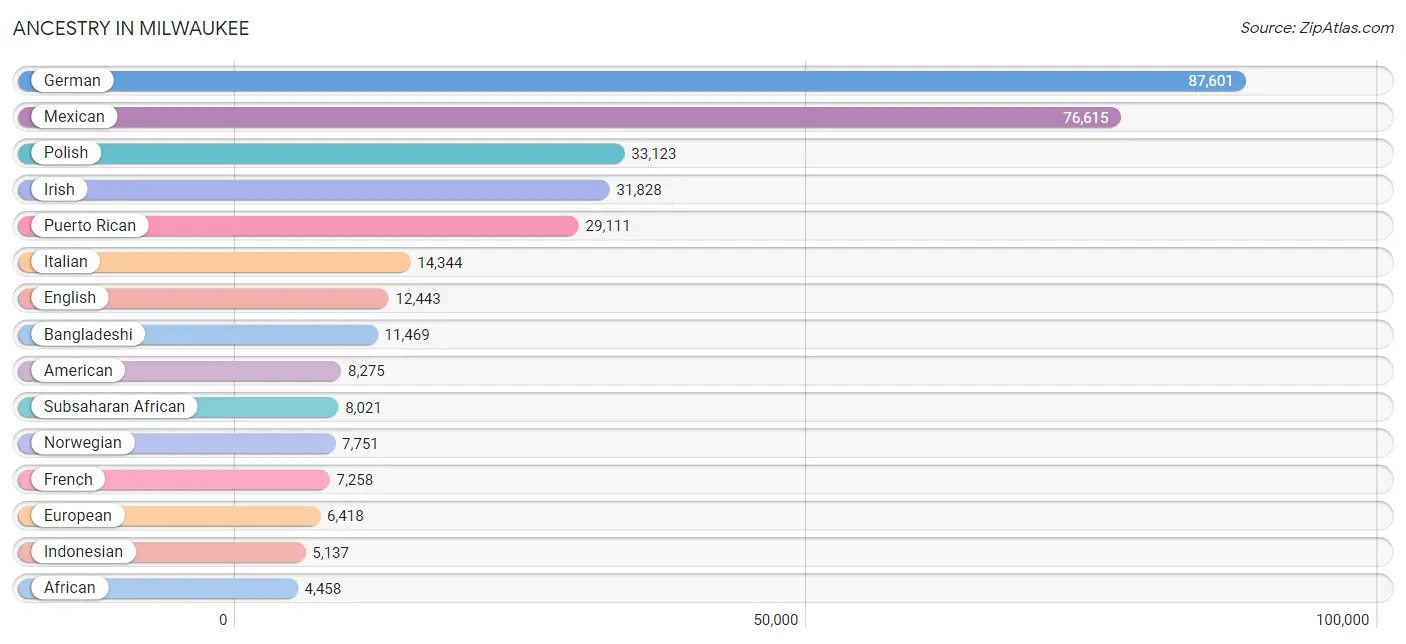
Ancestry in Milwaukee
The most populous ancestries reported in Milwaukee are German (87,601 | 15.3%), Mexican (76,615 | 13.4%), Polish (33,123 | 5.8%), Irish (31,828 | 5.6%), and Puerto Rican (29,111 | 5.1%), together accounting for 45.1% of all Milwaukee residents.
| Ancestry | # Population | % Population |
| African | 4,458 | 0.8% |
| Alaska Native | 4 | 0.0% |
| Alaskan Athabascan | 26 | 0.0% |
| Albanian | 109 | 0.0% |
| Aleut | 126 | 0.0% |
| Alsatian | 40 | 0.0% |
| American | 8,275 | 1.4% |
| Apache | 92 | 0.0% |
| Arab | 3,470 | 0.6% |
| Argentinean | 205 | 0.0% |
| Armenian | 413 | 0.1% |
| Assyrian / Chaldean / Syriac | 12 | 0.0% |
| Australian | 20 | 0.0% |
| Austrian | 1,093 | 0.2% |
| Bahamian | 25 | 0.0% |
| Bangladeshi | 11,469 | 2.0% |
| Barbadian | 9 | 0.0% |
| Belgian | 737 | 0.1% |
| Belizean | 38 | 0.0% |
| Bhutanese | 1,057 | 0.2% |
| Blackfeet | 367 | 0.1% |
| Bolivian | 311 | 0.1% |
| Brazilian | 33 | 0.0% |
| British | 1,207 | 0.2% |
| British West Indian | 41 | 0.0% |
| Bulgarian | 123 | 0.0% |
| Burmese | 893 | 0.2% |
| Cajun | 14 | 0.0% |
| Cambodian | 19 | 0.0% |
| Canadian | 300 | 0.1% |
| Cape Verdean | 34 | 0.0% |
| Carpatho Rusyn | 26 | 0.0% |
| Celtic | 20 | 0.0% |
| Central American | 3,888 | 0.7% |
| Central American Indian | 909 | 0.2% |
| Cherokee | 1,048 | 0.2% |
| Cheyenne | 12 | 0.0% |
| Chickasaw | 65 | 0.0% |
| Chilean | 49 | 0.0% |
| Chippewa | 1,103 | 0.2% |
| Choctaw | 323 | 0.1% |
| Colombian | 521 | 0.1% |
| Costa Rican | 225 | 0.0% |
| Creek | 79 | 0.0% |
| Croatian | 1,277 | 0.2% |
| Crow | 14 | 0.0% |
| Cuban | 999 | 0.2% |
| Czech | 2,883 | 0.5% |
| Czechoslovakian | 356 | 0.1% |
| Danish | 1,518 | 0.3% |
| Dominican | 1,122 | 0.2% |
| Dutch | 3,620 | 0.6% |
| Eastern European | 1,015 | 0.2% |
| Ecuadorian | 180 | 0.0% |
| Egyptian | 144 | 0.0% |
| English | 12,443 | 2.2% |
| Estonian | 20 | 0.0% |
| Ethiopian | 115 | 0.0% |
| European | 6,418 | 1.1% |
| Filipino | 129 | 0.0% |
| Finnish | 1,116 | 0.2% |
| French | 7,258 | 1.3% |
| French American Indian | 17 | 0.0% |
| French Canadian | 1,848 | 0.3% |
| German | 87,601 | 15.3% |
| German Russian | 719 | 0.1% |
| Ghanaian | 146 | 0.0% |
| Greek | 1,538 | 0.3% |
| Guamanian / Chamorro | 18 | 0.0% |
| Guatemalan | 720 | 0.1% |
| Guyanese | 19 | 0.0% |
| Haitian | 148 | 0.0% |
| Honduran | 469 | 0.1% |
| Hungarian | 1,374 | 0.2% |
| Icelander | 57 | 0.0% |
| Indian (Asian) | 2,136 | 0.4% |
| Indonesian | 5,137 | 0.9% |
| Iranian | 298 | 0.1% |
| Iraqi | 359 | 0.1% |
| Irish | 31,828 | 5.6% |
| Iroquois | 872 | 0.2% |
| Israeli | 42 | 0.0% |
| Italian | 14,344 | 2.5% |
| Jamaican | 1,592 | 0.3% |
| Japanese | 113 | 0.0% |
| Jordanian | 89 | 0.0% |
| Kenyan | 56 | 0.0% |
| Korean | 1,988 | 0.4% |
| Laotian | 223 | 0.0% |
| Latvian | 346 | 0.1% |
| Lebanese | 210 | 0.0% |
| Liberian | 22 | 0.0% |
| Lithuanian | 787 | 0.1% |
| Luxembourger | 251 | 0.0% |
| Macedonian | 76 | 0.0% |
| Malaysian | 1,790 | 0.3% |
| Maltese | 4 | 0.0% |
| Menominee | 475 | 0.1% |
| Mexican | 76,615 | 13.4% |
| Mexican American Indian | 624 | 0.1% |
| Mongolian | 702 | 0.1% |
| Moroccan | 507 | 0.1% |
| Native Hawaiian | 143 | 0.0% |
| Navajo | 126 | 0.0% |
| New Zealander | 9 | 0.0% |
| Nicaraguan | 810 | 0.1% |
| Nigerian | 1,368 | 0.2% |
| Northern European | 217 | 0.0% |
| Norwegian | 7,751 | 1.3% |
| Okinawan | 6 | 0.0% |
| Osage | 12 | 0.0% |
| Ottawa | 47 | 0.0% |
| Pakistani | 750 | 0.1% |
| Palestinian | 836 | 0.2% |
| Panamanian | 275 | 0.1% |
| Paraguayan | 5 | 0.0% |
| Pennsylvania German | 25 | 0.0% |
| Peruvian | 474 | 0.1% |
| Pima | 19 | 0.0% |
| Polish | 33,123 | 5.8% |
| Portuguese | 156 | 0.0% |
| Potawatomi | 236 | 0.0% |
| Puerto Rican | 29,111 | 5.1% |
| Romanian | 283 | 0.1% |
| Russian | 2,508 | 0.4% |
| Salvadoran | 1,389 | 0.2% |
| Samoan | 88 | 0.0% |
| Scandinavian | 1,075 | 0.2% |
| Scotch-Irish | 995 | 0.2% |
| Scottish | 2,393 | 0.4% |
| Seminole | 46 | 0.0% |
| Senegalese | 41 | 0.0% |
| Serbian | 1,196 | 0.2% |
| Sierra Leonean | 37 | 0.0% |
| Sioux | 261 | 0.1% |
| Slavic | 133 | 0.0% |
| Slovak | 849 | 0.2% |
| Slovene | 848 | 0.2% |
| Somali | 974 | 0.2% |
| South African | 60 | 0.0% |
| South American | 2,132 | 0.4% |
| South American Indian | 32 | 0.0% |
| Spaniard | 627 | 0.1% |
| Spanish | 306 | 0.1% |
| Spanish American | 15 | 0.0% |
| Sri Lankan | 965 | 0.2% |
| Subsaharan African | 8,021 | 1.4% |
| Swedish | 4,027 | 0.7% |
| Swiss | 855 | 0.2% |
| Syrian | 161 | 0.0% |
| Taiwanese | 11 | 0.0% |
| Thai | 3,071 | 0.5% |
| Tongan | 41 | 0.0% |
| Trinidadian and Tobagonian | 5 | 0.0% |
| Turkish | 94 | 0.0% |
| U.S. Virgin Islander | 10 | 0.0% |
| Ugandan | 33 | 0.0% |
| Ukrainian | 610 | 0.1% |
| Venezuelan | 350 | 0.1% |
| Vietnamese | 78 | 0.0% |
| Welsh | 1,052 | 0.2% |
| West Indian | 241 | 0.0% |
| Yugoslavian | 287 | 0.1% | View All 163 Rows |
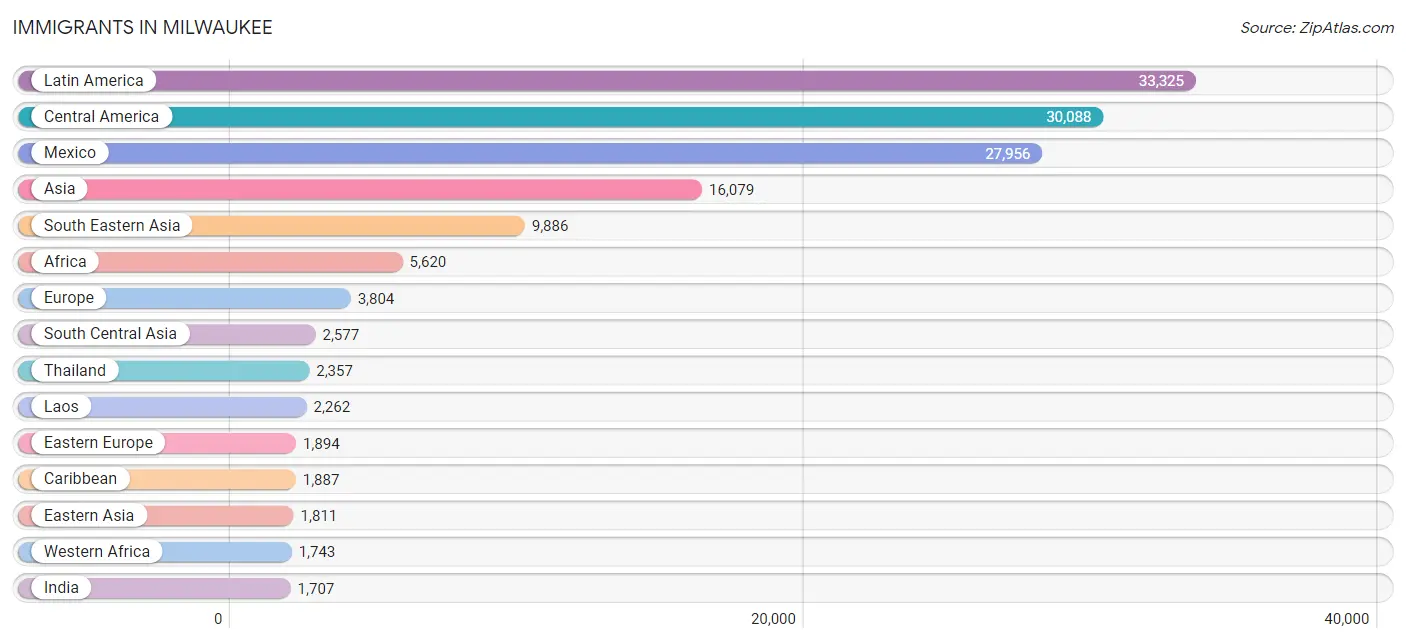
Immigrants in Milwaukee
The most numerous immigrant groups reported in Milwaukee came from Latin America (33,325 | 5.8%), Central America (30,088 | 5.2%), Mexico (27,956 | 4.9%), Asia (16,079 | 2.8%), and South Eastern Asia (9,886 | 1.7%), together accounting for 20.5% of all Milwaukee residents.
| Immigration Origin | # Population | % Population |
| Africa | 5,620 | 1.0% |
| Albania | 12 | 0.0% |
| Argentina | 98 | 0.0% |
| Asia | 16,079 | 2.8% |
| Australia | 12 | 0.0% |
| Austria | 85 | 0.0% |
| Bahamas | 4 | 0.0% |
| Bangladesh | 122 | 0.0% |
| Barbados | 9 | 0.0% |
| Belarus | 85 | 0.0% |
| Belgium | 59 | 0.0% |
| Belize | 33 | 0.0% |
| Bolivia | 228 | 0.0% |
| Bosnia and Herzegovina | 108 | 0.0% |
| Brazil | 54 | 0.0% |
| Bulgaria | 52 | 0.0% |
| Cambodia | 63 | 0.0% |
| Cameroon | 165 | 0.0% |
| Canada | 443 | 0.1% |
| Caribbean | 1,887 | 0.3% |
| Central America | 30,088 | 5.2% |
| Chile | 39 | 0.0% |
| China | 1,286 | 0.2% |
| Colombia | 315 | 0.1% |
| Congo | 367 | 0.1% |
| Costa Rica | 81 | 0.0% |
| Croatia | 128 | 0.0% |
| Cuba | 314 | 0.1% |
| Czechoslovakia | 46 | 0.0% |
| Dominica | 36 | 0.0% |
| Dominican Republic | 668 | 0.1% |
| Eastern Africa | 1,482 | 0.3% |
| Eastern Asia | 1,811 | 0.3% |
| Eastern Europe | 1,894 | 0.3% |
| Ecuador | 21 | 0.0% |
| Egypt | 91 | 0.0% |
| El Salvador | 668 | 0.1% |
| England | 147 | 0.0% |
| Eritrea | 182 | 0.0% |
| Ethiopia | 114 | 0.0% |
| Europe | 3,804 | 0.7% |
| France | 86 | 0.0% |
| Germany | 699 | 0.1% |
| Ghana | 306 | 0.1% |
| Greece | 24 | 0.0% |
| Guatemala | 473 | 0.1% |
| Haiti | 88 | 0.0% |
| Honduras | 240 | 0.0% |
| Hong Kong | 56 | 0.0% |
| Hungary | 71 | 0.0% |
| India | 1,707 | 0.3% |
| Indonesia | 77 | 0.0% |
| Iran | 176 | 0.0% |
| Iraq | 418 | 0.1% |
| Ireland | 22 | 0.0% |
| Israel | 42 | 0.0% |
| Italy | 283 | 0.1% |
| Jamaica | 763 | 0.1% |
| Japan | 102 | 0.0% |
| Jordan | 437 | 0.1% |
| Kazakhstan | 57 | 0.0% |
| Kenya | 450 | 0.1% |
| Korea | 404 | 0.1% |
| Kuwait | 233 | 0.0% |
| Laos | 2,262 | 0.4% |
| Latin America | 33,325 | 5.8% |
| Latvia | 39 | 0.0% |
| Lebanon | 23 | 0.0% |
| Liberia | 39 | 0.0% |
| Lithuania | 82 | 0.0% |
| Malaysia | 806 | 0.1% |
| Mexico | 27,956 | 4.9% |
| Middle Africa | 988 | 0.2% |
| Morocco | 368 | 0.1% |
| Nepal | 38 | 0.0% |
| Netherlands | 79 | 0.0% |
| Nicaragua | 566 | 0.1% |
| Nigeria | 967 | 0.2% |
| North Macedonia | 31 | 0.0% |
| Northern Africa | 600 | 0.1% |
| Northern Europe | 422 | 0.1% |
| Oceania | 58 | 0.0% |
| Pakistan | 460 | 0.1% |
| Panama | 71 | 0.0% |
| Peru | 359 | 0.1% |
| Philippines | 600 | 0.1% |
| Poland | 453 | 0.1% |
| Portugal | 8 | 0.0% |
| Romania | 71 | 0.0% |
| Russia | 262 | 0.1% |
| Saudi Arabia | 103 | 0.0% |
| Scotland | 73 | 0.0% |
| Senegal | 13 | 0.0% |
| Serbia | 113 | 0.0% |
| Sierra Leone | 72 | 0.0% |
| Singapore | 4 | 0.0% |
| Somalia | 568 | 0.1% |
| South Africa | 305 | 0.1% |
| South America | 1,350 | 0.2% |
| South Central Asia | 2,577 | 0.4% |
| South Eastern Asia | 9,886 | 1.7% |
| Southern Europe | 471 | 0.1% |
| Spain | 156 | 0.0% |
| Sudan | 27 | 0.0% |
| Sweden | 13 | 0.0% |
| Switzerland | 9 | 0.0% |
| Syria | 106 | 0.0% |
| Taiwan | 55 | 0.0% |
| Thailand | 2,357 | 0.4% |
| Trinidad and Tobago | 5 | 0.0% |
| Turkey | 39 | 0.0% |
| Uganda | 5 | 0.0% |
| Ukraine | 203 | 0.0% |
| Uzbekistan | 10 | 0.0% |
| Venezuela | 236 | 0.0% |
| Vietnam | 363 | 0.1% |
| Western Africa | 1,743 | 0.3% |
| Western Asia | 1,436 | 0.3% |
| Western Europe | 1,017 | 0.2% |
| Zaire | 456 | 0.1% | View All 120 Rows |
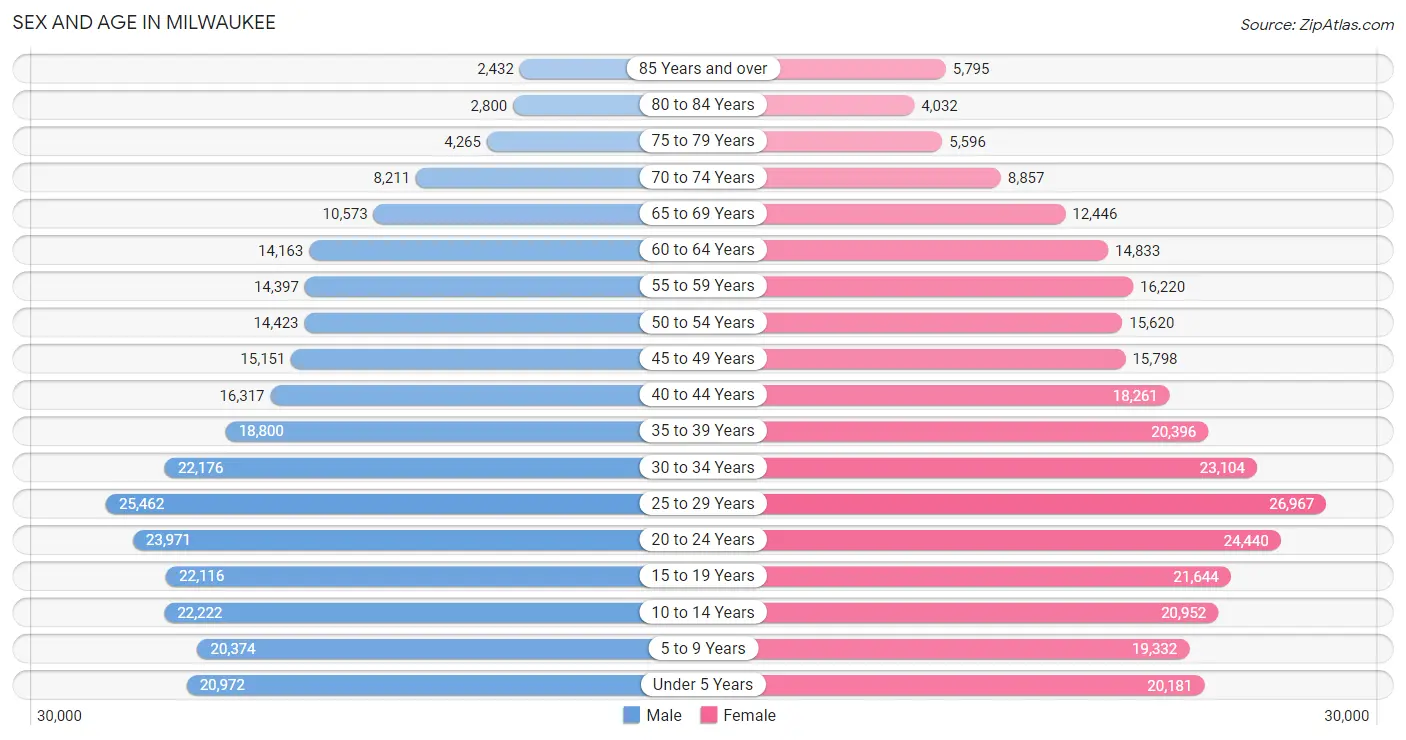
Sex and Age in Milwaukee
Sex and Age in Milwaukee
The most populous age groups in Milwaukee are 25 to 29 Years (25,462 | 9.1%) for men and 25 to 29 Years (26,967 | 9.2%) for women.
| Age Bracket | Male | Female |
| Under 5 Years | 20,972 (7.5%) | 20,181 (6.9%) |
| 5 to 9 Years | 20,374 (7.3%) | 19,332 (6.6%) |
| 10 to 14 Years | 22,222 (8.0%) | 20,952 (7.1%) |
| 15 to 19 Years | 22,116 (7.9%) | 21,644 (7.3%) |
| 20 to 24 Years | 23,971 (8.6%) | 24,440 (8.3%) |
| 25 to 29 Years | 25,462 (9.1%) | 26,967 (9.2%) |
| 30 to 34 Years | 22,176 (8.0%) | 23,104 (7.9%) |
| 35 to 39 Years | 18,800 (6.7%) | 20,396 (6.9%) |
| 40 to 44 Years | 16,317 (5.9%) | 18,261 (6.2%) |
| 45 to 49 Years | 15,151 (5.4%) | 15,798 (5.4%) |
| 50 to 54 Years | 14,423 (5.2%) | 15,620 (5.3%) |
| 55 to 59 Years | 14,397 (5.2%) | 16,220 (5.5%) |
| 60 to 64 Years | 14,163 (5.1%) | 14,833 (5.0%) |
| 65 to 69 Years | 10,573 (3.8%) | 12,446 (4.2%) |
| 70 to 74 Years | 8,211 (2.9%) | 8,857 (3.0%) |
| 75 to 79 Years | 4,265 (1.5%) | 5,596 (1.9%) |
| 80 to 84 Years | 2,800 (1.0%) | 4,032 (1.4%) |
| 85 Years and over | 2,432 (0.9%) | 5,795 (2.0%) |
| Total | 278,825 (100.0%) | 294,474 (100.0%) |
Families and Households in Milwaukee
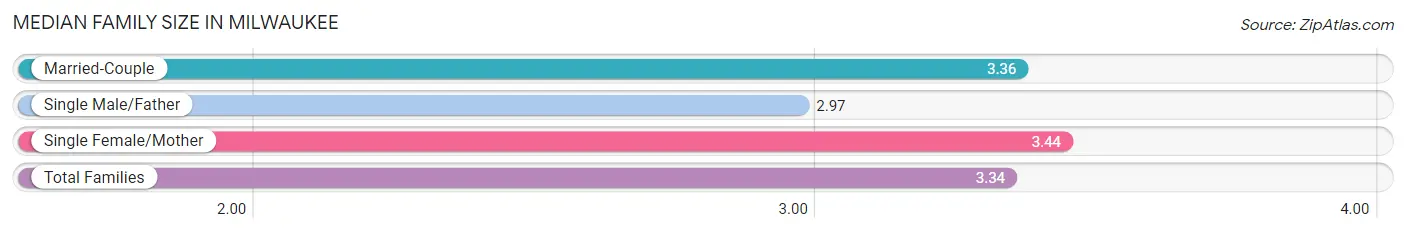
Median Family Size in Milwaukee
The median family size in Milwaukee is 3.34 persons per family, with single female/mother families (46,113 | 38.6%) accounting for the largest median family size of 3.44 persons per family. On the other hand, single male/father families (14,470 | 12.1%) represent the smallest median family size with 2.97 persons per family.
| Family Type | # Families | Family Size |
| Married-Couple | 58,816 (49.3%) | 3.36 |
| Single Male/Father | 14,470 (12.1%) | 2.97 |
| Single Female/Mother | 46,113 (38.6%) | 3.44 |
| Total Families | 119,399 (100.0%) | 3.34 |
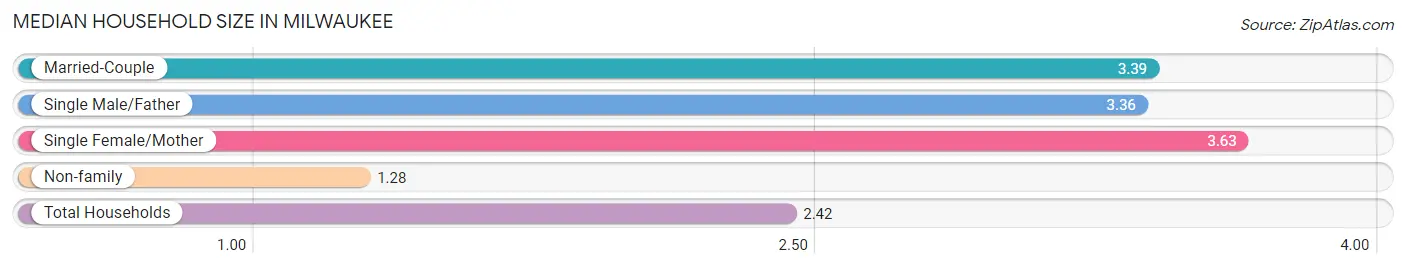
Median Household Size in Milwaukee
The median household size in Milwaukee is 2.42 persons per household, with single female/mother households (46,113 | 20.0%) accounting for the largest median household size of 3.63 persons per household. non-family households (111,360 | 48.3%) represent the smallest median household size with 1.28 persons per household.
| Household Type | # Households | Household Size |
| Married-Couple | 58,816 (25.5%) | 3.39 |
| Single Male/Father | 14,470 (6.3%) | 3.36 |
| Single Female/Mother | 46,113 (20.0%) | 3.63 |
| Non-family | 111,360 (48.3%) | 1.28 |
| Total Households | 230,759 (100.0%) | 2.42 |
Household Size by Marriage Status in Milwaukee
Out of a total of 230,759 households in Milwaukee, 119,399 (51.7%) are family households, while 111,360 (48.3%) are nonfamily households. The most numerous type of family households are 2-person households, comprising 47,320, and the most common type of nonfamily households are 1-person households, comprising 88,982.
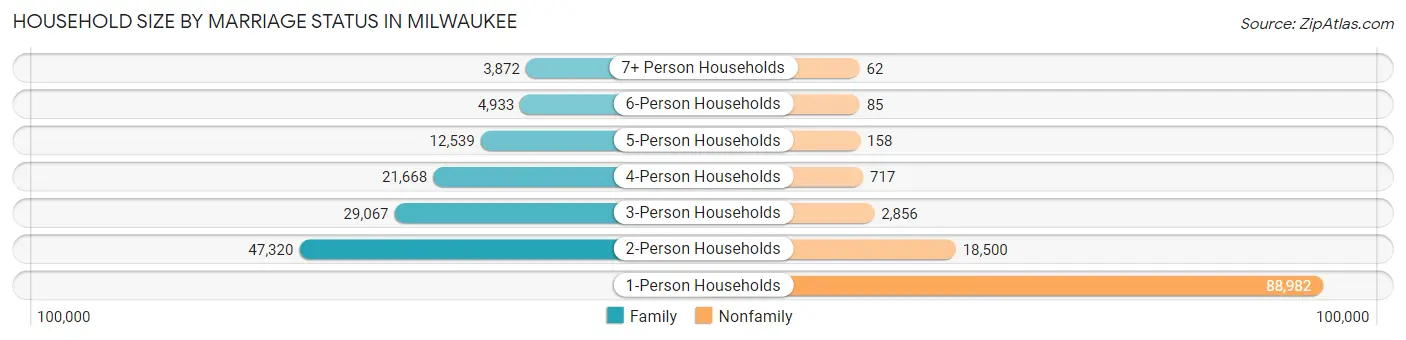
| Household Size | Family Households | Nonfamily Households |
| 1-Person Households | - | 88,982 (38.6%) |
| 2-Person Households | 47,320 (20.5%) | 18,500 (8.0%) |
| 3-Person Households | 29,067 (12.6%) | 2,856 (1.2%) |
| 4-Person Households | 21,668 (9.4%) | 717 (0.3%) |
| 5-Person Households | 12,539 (5.4%) | 158 (0.1%) |
| 6-Person Households | 4,933 (2.1%) | 85 (0.0%) |
| 7+ Person Households | 3,872 (1.7%) | 62 (0.0%) |
| Total | 119,399 (51.7%) | 111,360 (48.3%) |
Female Fertility in Milwaukee
Fertility by Age in Milwaukee
Average fertility rate in Milwaukee is 47.0 births per 1,000 women. Women in the age bracket of 20 to 34 years have the highest fertility rate with 72.0 births per 1,000 women. Women in the age bracket of 20 to 34 years acount for 74.1% of all women with births.
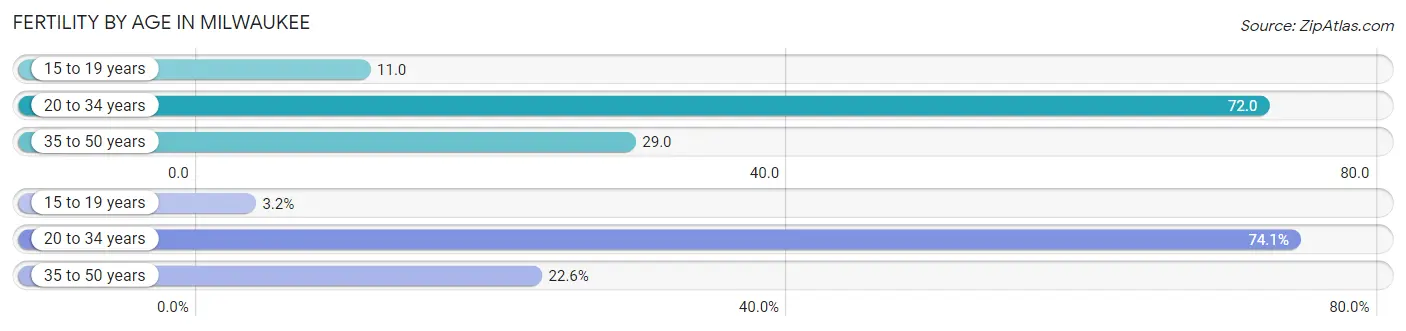
| Age Bracket | Women with Births | Births / 1,000 Women |
| 15 to 19 years | 234 (3.2%) | 11.0 |
| 20 to 34 years | 5,393 (74.1%) | 72.0 |
| 35 to 50 years | 1,647 (22.6%) | 29.0 |
| Total | 7,274 (100.0%) | 47.0 |
Fertility by Age by Marriage Status in Milwaukee
46.0% of women with births (7,274) in Milwaukee are married. The highest percentage of unmarried women with births falls into 15 to 19 years age bracket with 89.7% of them unmarried at the time of birth, while the lowest percentage of unmarried women with births belong to 35 to 50 years age bracket with 38.5% of them unmarried.
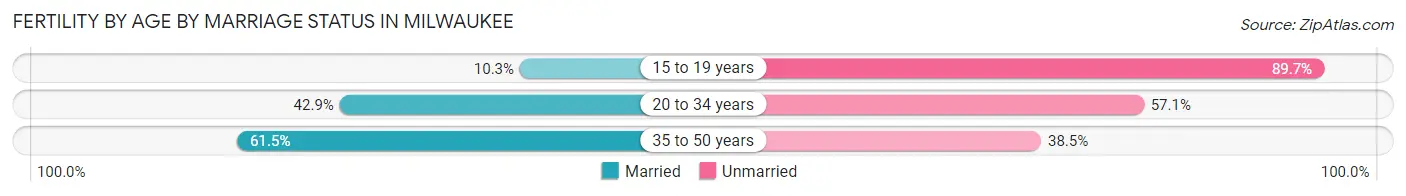
| Age Bracket | Married | Unmarried |
| 15 to 19 years | 24 (10.3%) | 210 (89.7%) |
| 20 to 34 years | 2,314 (42.9%) | 3,079 (57.1%) |
| 35 to 50 years | 1,013 (61.5%) | 634 (38.5%) |
| Total | 3,346 (46.0%) | 3,928 (54.0%) |
Fertility by Education in Milwaukee
Average fertility rate in Milwaukee is 47.0 births per 1,000 women. Women with the education attainment of high school diploma have the highest fertility rate of 59.0 births per 1,000 women, while women with the education attainment of graduate degree have the lowest fertility at 34.0 births per 1,000 women. Women with the education attainment of high school diploma represent 33.6% of all women with births.
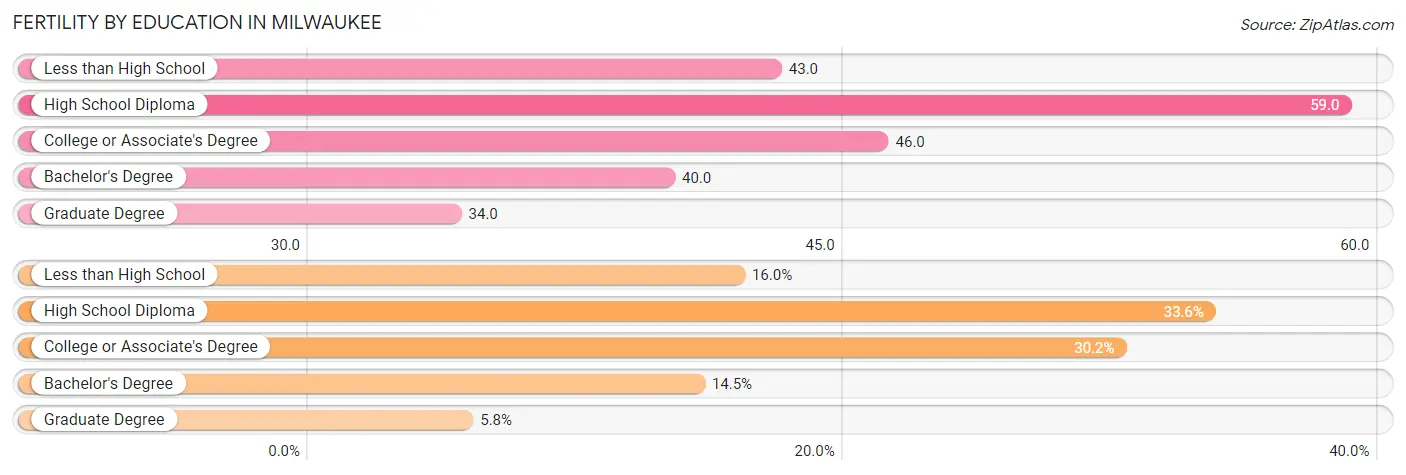
| Educational Attainment | Women with Births | Births / 1,000 Women |
| Less than High School | 1,160 (16.0%) | 43.0 |
| High School Diploma | 2,443 (33.6%) | 59.0 |
| College or Associate's Degree | 2,200 (30.2%) | 46.0 |
| Bachelor's Degree | 1,051 (14.4%) | 40.0 |
| Graduate Degree | 420 (5.8%) | 34.0 |
| Total | 7,274 (100.0%) | 47.0 |
Fertility by Education by Marriage Status in Milwaukee
54.0% of women with births in Milwaukee are unmarried. Women with the educational attainment of bachelor's degree are most likely to be married with 88.0% of them married at childbirth, while women with the educational attainment of less than high school are least likely to be married with 69.1% of them unmarried at childbirth.
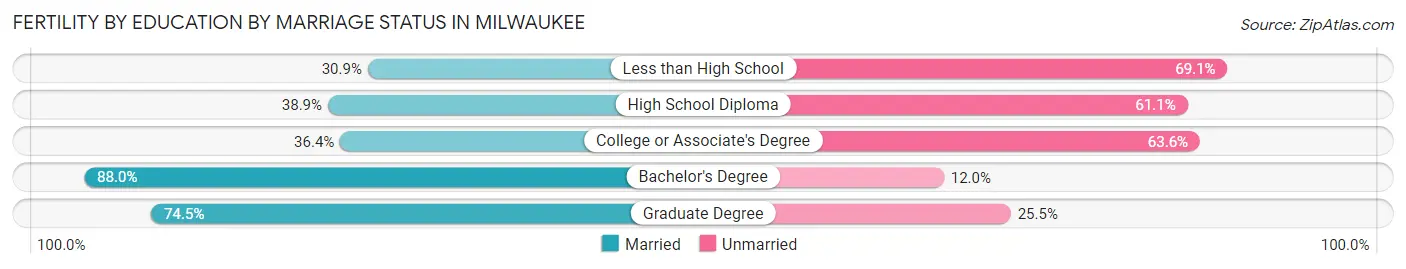
| Educational Attainment | Married | Unmarried |
| Less than High School | 358 (30.9%) | 802 (69.1%) |
| High School Diploma | 950 (38.9%) | 1,493 (61.1%) |
| College or Associate's Degree | 801 (36.4%) | 1,399 (63.6%) |
| Bachelor's Degree | 925 (88.0%) | 126 (12.0%) |
| Graduate Degree | 313 (74.5%) | 107 (25.5%) |
| Total | 3,346 (46.0%) | 3,928 (54.0%) |
Employment Characteristics in Milwaukee
Employment by Class of Employer in Milwaukee
Among the 261,078 employed individuals in Milwaukee, private company employees (187,995 | 72.0%), not-for-profit organizations (29,731 | 11.4%), and local government employees (17,319 | 6.6%) make up the most common classes of employment.
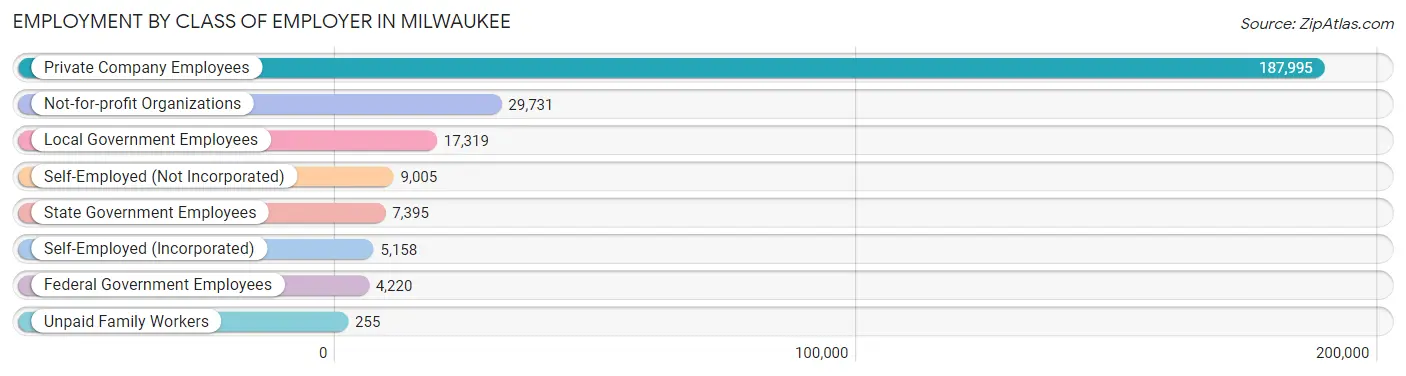
| Employer Class | # Employees | % Employees |
| Private Company Employees | 187,995 | 72.0% |
| Self-Employed (Incorporated) | 5,158 | 2.0% |
| Self-Employed (Not Incorporated) | 9,005 | 3.5% |
| Not-for-profit Organizations | 29,731 | 11.4% |
| Local Government Employees | 17,319 | 6.6% |
| State Government Employees | 7,395 | 2.8% |
| Federal Government Employees | 4,220 | 1.6% |
| Unpaid Family Workers | 255 | 0.1% |
| Total | 261,078 | 100.0% |
Employment Status by Age in Milwaukee
According to the labor force statistics for Milwaukee, out of the total population over 16 years of age (441,231), 64.0% or 282,388 individuals are in the labor force, with 5.9% or 16,661 of them unemployed. The age group with the highest labor force participation rate is 25 to 29 years, with 83.3% or 43,673 individuals in the labor force. Within the labor force, the 16 to 19 years age range has the highest percentage of unemployed individuals, with 9.4% or 1,320 of them being unemployed.
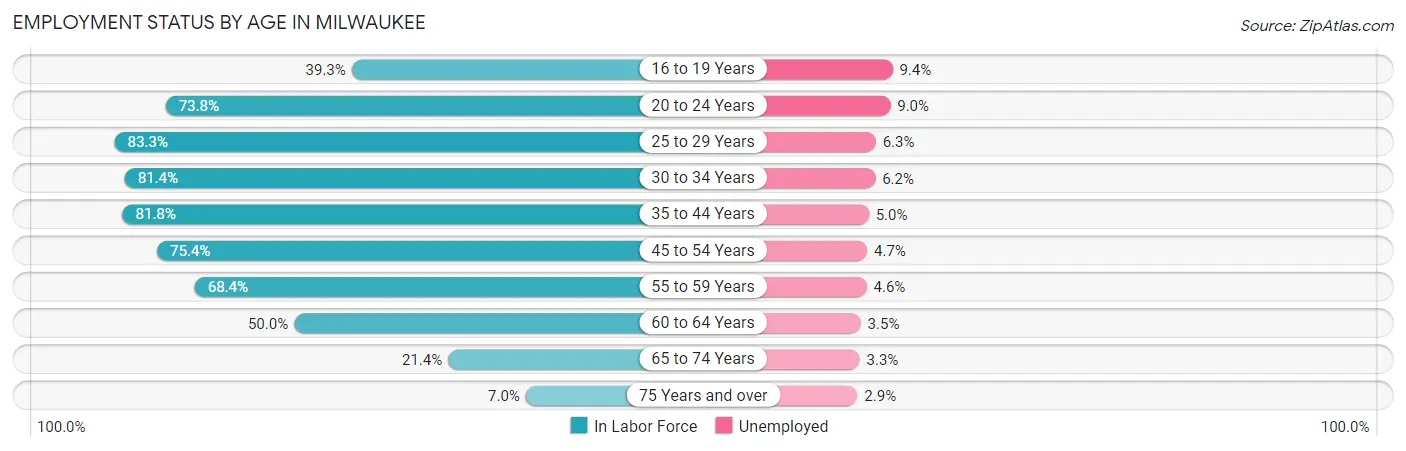
| Age Bracket | In Labor Force | Unemployed |
| 16 to 19 Years | 14,040 (39.3%) | 1,320 (9.4%) |
| 20 to 24 Years | 35,727 (73.8%) | 3,215 (9.0%) |
| 25 to 29 Years | 43,673 (83.3%) | 2,751 (6.3%) |
| 30 to 34 Years | 36,858 (81.4%) | 2,285 (6.2%) |
| 35 to 44 Years | 60,347 (81.8%) | 3,017 (5.0%) |
| 45 to 54 Years | 45,988 (75.4%) | 2,161 (4.7%) |
| 55 to 59 Years | 20,942 (68.4%) | 963 (4.6%) |
| 60 to 64 Years | 14,498 (50.0%) | 507 (3.5%) |
| 65 to 74 Years | 8,579 (21.4%) | 283 (3.3%) |
| 75 Years and over | 1,744 (7.0%) | 51 (2.9%) |
| Total | 282,388 (64.0%) | 16,661 (5.9%) |
Employment Status by Educational Attainment in Milwaukee
According to labor force statistics for Milwaukee, 76.1% of individuals (222,279) out of the total population between 25 and 64 years of age (292,088) are in the labor force, with 5.2% or 11,559 of them being unemployed. The group with the highest labor force participation rate are those with the educational attainment of bachelor's degree or higher, with 89.8% or 69,713 individuals in the labor force. Within the labor force, individuals with high school diploma education have the highest percentage of unemployment, with 7.7% or 4,614 of them being unemployed.
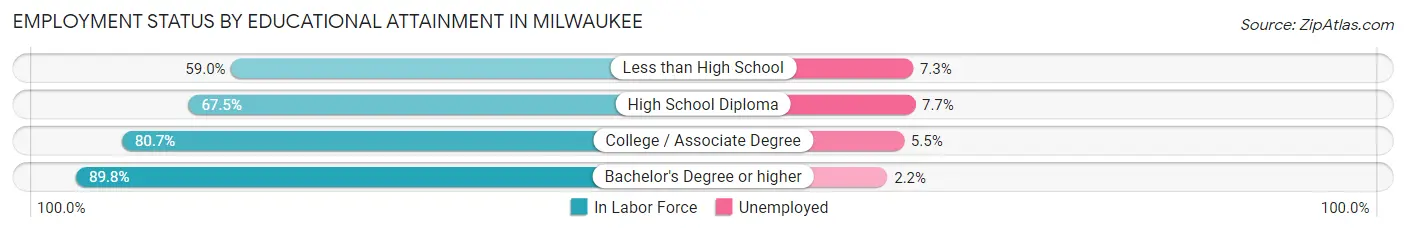
| Educational Attainment | In Labor Force | Unemployed |
| Less than High School | 23,811 (59.0%) | 2,946 (7.3%) |
| High School Diploma | 59,924 (67.5%) | 6,836 (7.7%) |
| College / Associate Degree | 68,856 (80.7%) | 4,693 (5.5%) |
| Bachelor's Degree or higher | 69,713 (89.8%) | 1,708 (2.2%) |
| Total | 222,279 (76.1%) | 15,189 (5.2%) |
Employment Occupations by Sex in Milwaukee
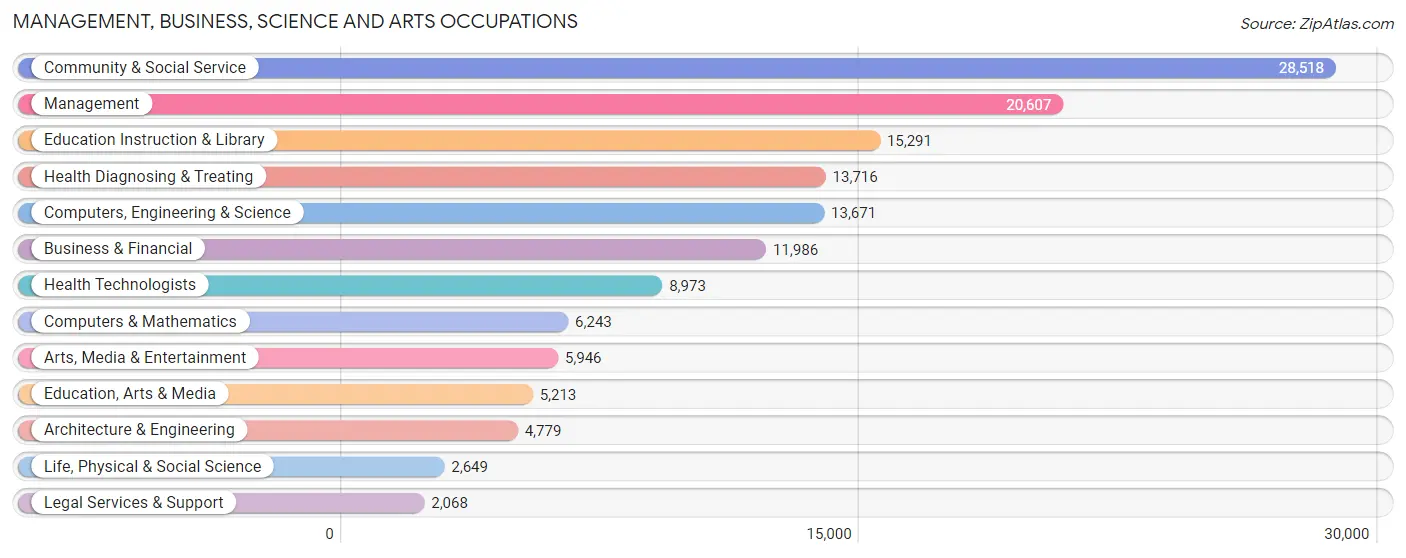
Management, Business, Science and Arts Occupations
The most common Management, Business, Science and Arts occupations in Milwaukee are Community & Social Service (28,518 | 10.7%), Management (20,607 | 7.8%), Education Instruction & Library (15,291 | 5.8%), Health Diagnosing & Treating (13,716 | 5.2%), and Computers, Engineering & Science (13,671 | 5.1%).
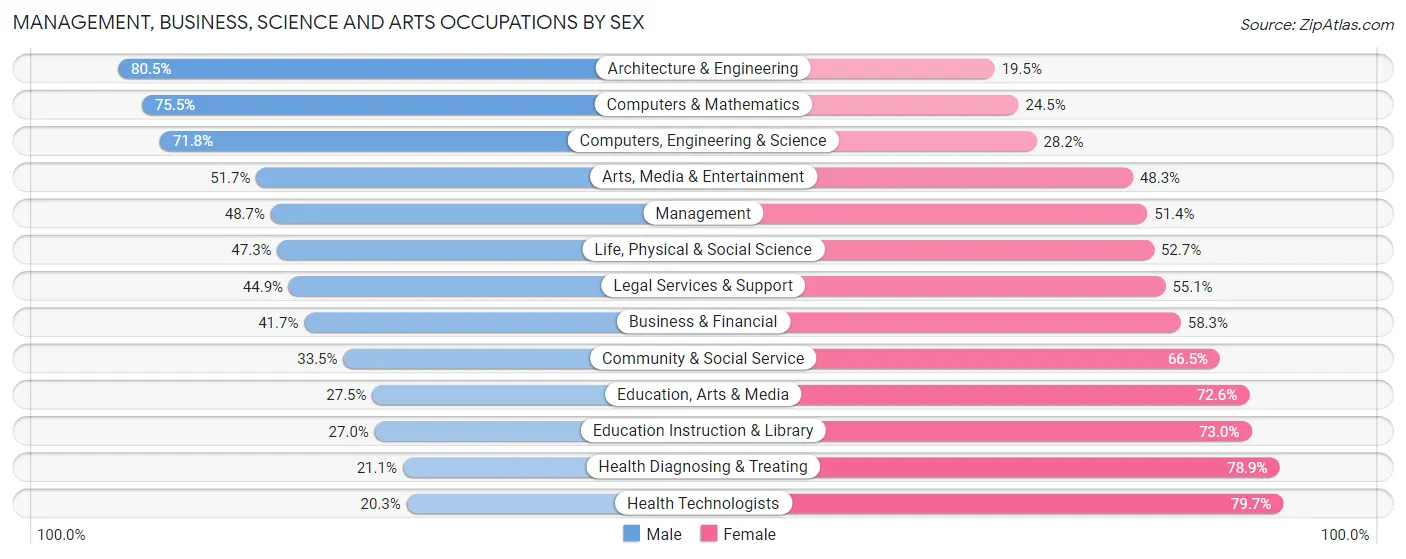
Management, Business, Science and Arts Occupations by Sex
Within the Management, Business, Science and Arts occupations in Milwaukee, the most male-oriented occupations are Architecture & Engineering (80.5%), Computers & Mathematics (75.5%), and Computers, Engineering & Science (71.8%), while the most female-oriented occupations are Health Technologists (79.7%), Health Diagnosing & Treating (78.9%), and Education Instruction & Library (73.0%).
| Occupation | Male | Female |
| Management | 10,026 (48.6%) | 10,581 (51.3%) |
| Business & Financial | 4,994 (41.7%) | 6,992 (58.3%) |
| Computers, Engineering & Science | 9,813 (71.8%) | 3,858 (28.2%) |
| Computers & Mathematics | 4,715 (75.5%) | 1,528 (24.5%) |
| Architecture & Engineering | 3,846 (80.5%) | 933 (19.5%) |
| Life, Physical & Social Science | 1,252 (47.3%) | 1,397 (52.7%) |
| Community & Social Service | 9,556 (33.5%) | 18,962 (66.5%) |
| Education, Arts & Media | 1,431 (27.5%) | 3,782 (72.6%) |
| Legal Services & Support | 928 (44.9%) | 1,140 (55.1%) |
| Education Instruction & Library | 4,125 (27.0%) | 11,166 (73.0%) |
| Arts, Media & Entertainment | 3,072 (51.7%) | 2,874 (48.3%) |
| Health Diagnosing & Treating | 2,897 (21.1%) | 10,819 (78.9%) |
| Health Technologists | 1,824 (20.3%) | 7,149 (79.7%) |
| Total (Category) | 37,286 (42.1%) | 51,212 (57.9%) |
| Total (Overall) | 131,158 (49.4%) | 134,499 (50.6%) |
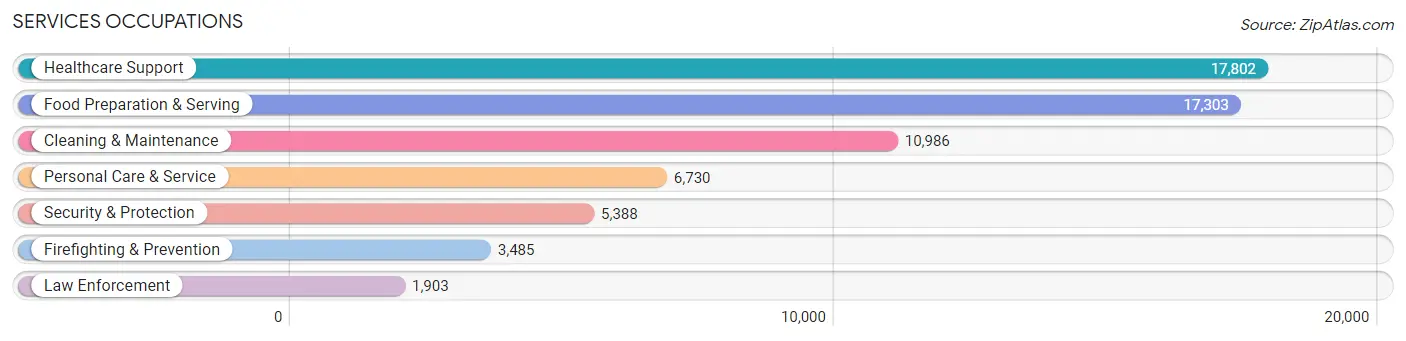
Services Occupations
The most common Services occupations in Milwaukee are Healthcare Support (17,802 | 6.7%), Food Preparation & Serving (17,303 | 6.5%), Cleaning & Maintenance (10,986 | 4.1%), Personal Care & Service (6,730 | 2.5%), and Security & Protection (5,388 | 2.0%).
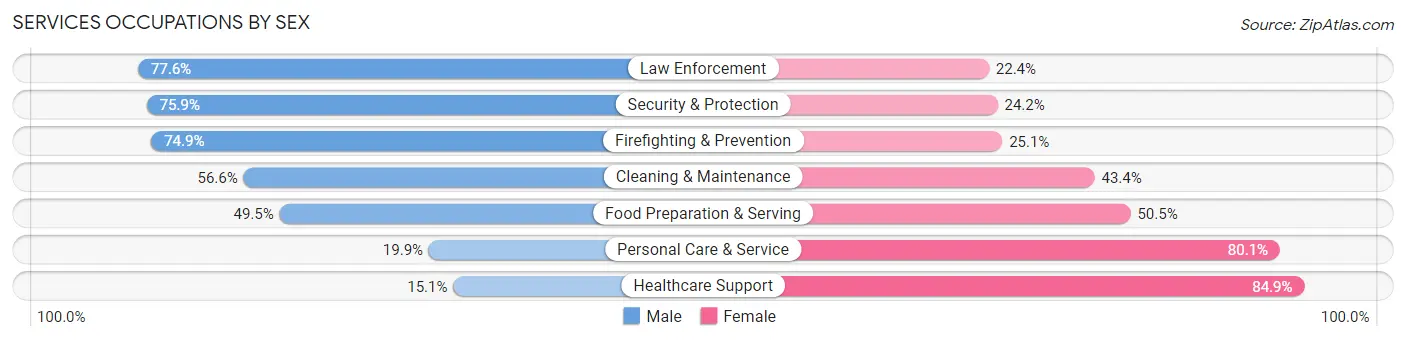
Services Occupations by Sex
Within the Services occupations in Milwaukee, the most male-oriented occupations are Law Enforcement (77.6%), Security & Protection (75.8%), and Firefighting & Prevention (74.9%), while the most female-oriented occupations are Healthcare Support (84.9%), Personal Care & Service (80.1%), and Food Preparation & Serving (50.5%).
| Occupation | Male | Female |
| Healthcare Support | 2,690 (15.1%) | 15,112 (84.9%) |
| Security & Protection | 4,087 (75.8%) | 1,301 (24.1%) |
| Firefighting & Prevention | 2,611 (74.9%) | 874 (25.1%) |
| Law Enforcement | 1,476 (77.6%) | 427 (22.4%) |
| Food Preparation & Serving | 8,569 (49.5%) | 8,734 (50.5%) |
| Cleaning & Maintenance | 6,223 (56.6%) | 4,763 (43.4%) |
| Personal Care & Service | 1,342 (19.9%) | 5,388 (80.1%) |
| Total (Category) | 22,911 (39.4%) | 35,298 (60.6%) |
| Total (Overall) | 131,158 (49.4%) | 134,499 (50.6%) |
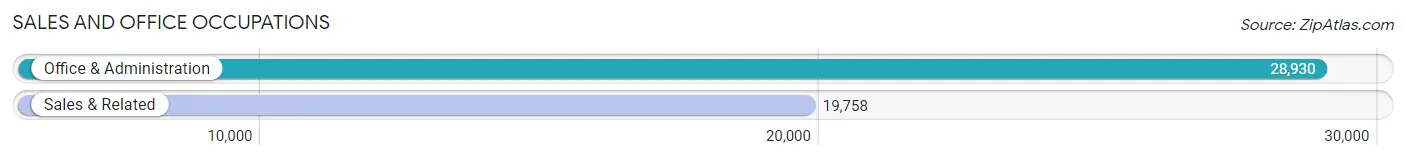
Sales and Office Occupations
The most common Sales and Office occupations in Milwaukee are Office & Administration (28,930 | 10.9%), and Sales & Related (19,758 | 7.4%).
Sales and Office Occupations by Sex
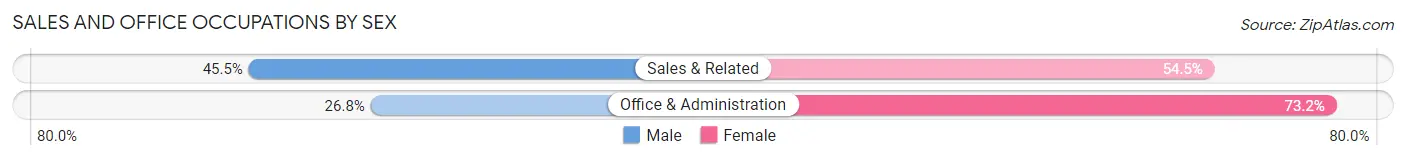
| Occupation | Male | Female |
| Sales & Related | 8,994 (45.5%) | 10,764 (54.5%) |
| Office & Administration | 7,741 (26.8%) | 21,189 (73.2%) |
| Total (Category) | 16,735 (34.4%) | 31,953 (65.6%) |
| Total (Overall) | 131,158 (49.4%) | 134,499 (50.6%) |
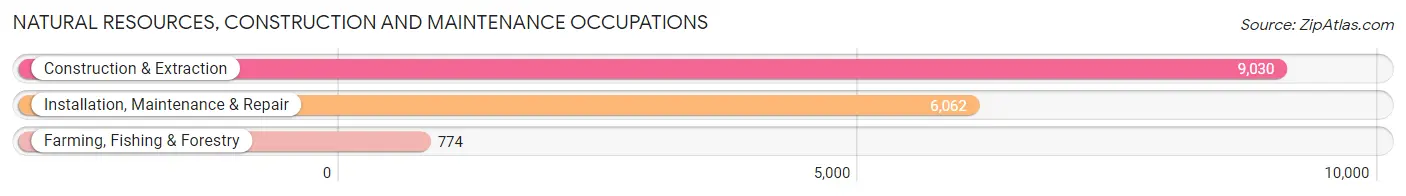
Natural Resources, Construction and Maintenance Occupations
The most common Natural Resources, Construction and Maintenance occupations in Milwaukee are Construction & Extraction (9,030 | 3.4%), Installation, Maintenance & Repair (6,062 | 2.3%), and Farming, Fishing & Forestry (774 | 0.3%).
Natural Resources, Construction and Maintenance Occupations by Sex
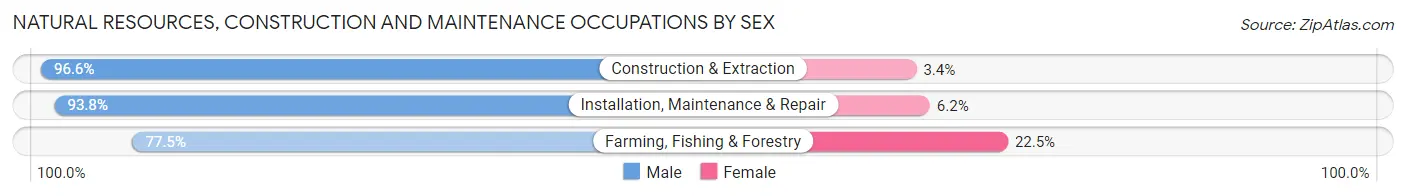
| Occupation | Male | Female |
| Farming, Fishing & Forestry | 600 (77.5%) | 174 (22.5%) |
| Construction & Extraction | 8,719 (96.6%) | 311 (3.4%) |
| Installation, Maintenance & Repair | 5,684 (93.8%) | 378 (6.2%) |
| Total (Category) | 15,003 (94.6%) | 863 (5.4%) |
| Total (Overall) | 131,158 (49.4%) | 134,499 (50.6%) |
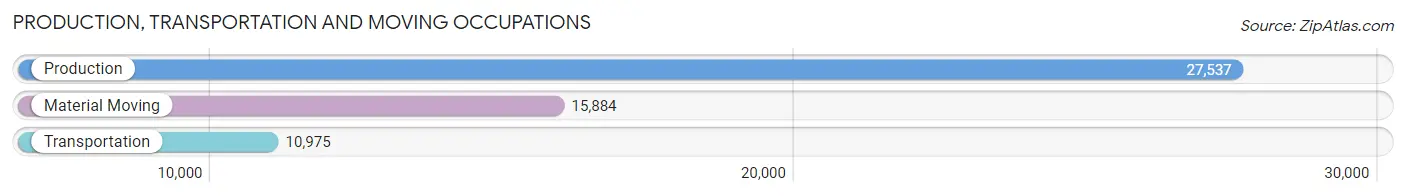
Production, Transportation and Moving Occupations
The most common Production, Transportation and Moving occupations in Milwaukee are Production (27,537 | 10.4%), Material Moving (15,884 | 6.0%), and Transportation (10,975 | 4.1%).
Production, Transportation and Moving Occupations by Sex
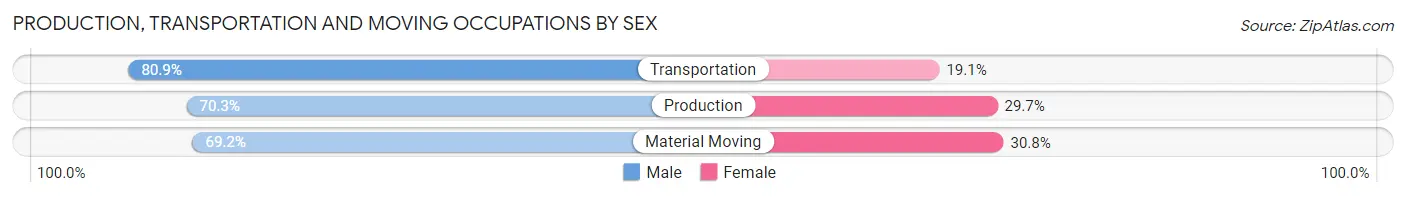
| Occupation | Male | Female |
| Production | 19,354 (70.3%) | 8,183 (29.7%) |
| Transportation | 8,882 (80.9%) | 2,093 (19.1%) |
| Material Moving | 10,987 (69.2%) | 4,897 (30.8%) |
| Total (Category) | 39,223 (72.1%) | 15,173 (27.9%) |
| Total (Overall) | 131,158 (49.4%) | 134,499 (50.6%) |
Employment Industries by Sex in Milwaukee
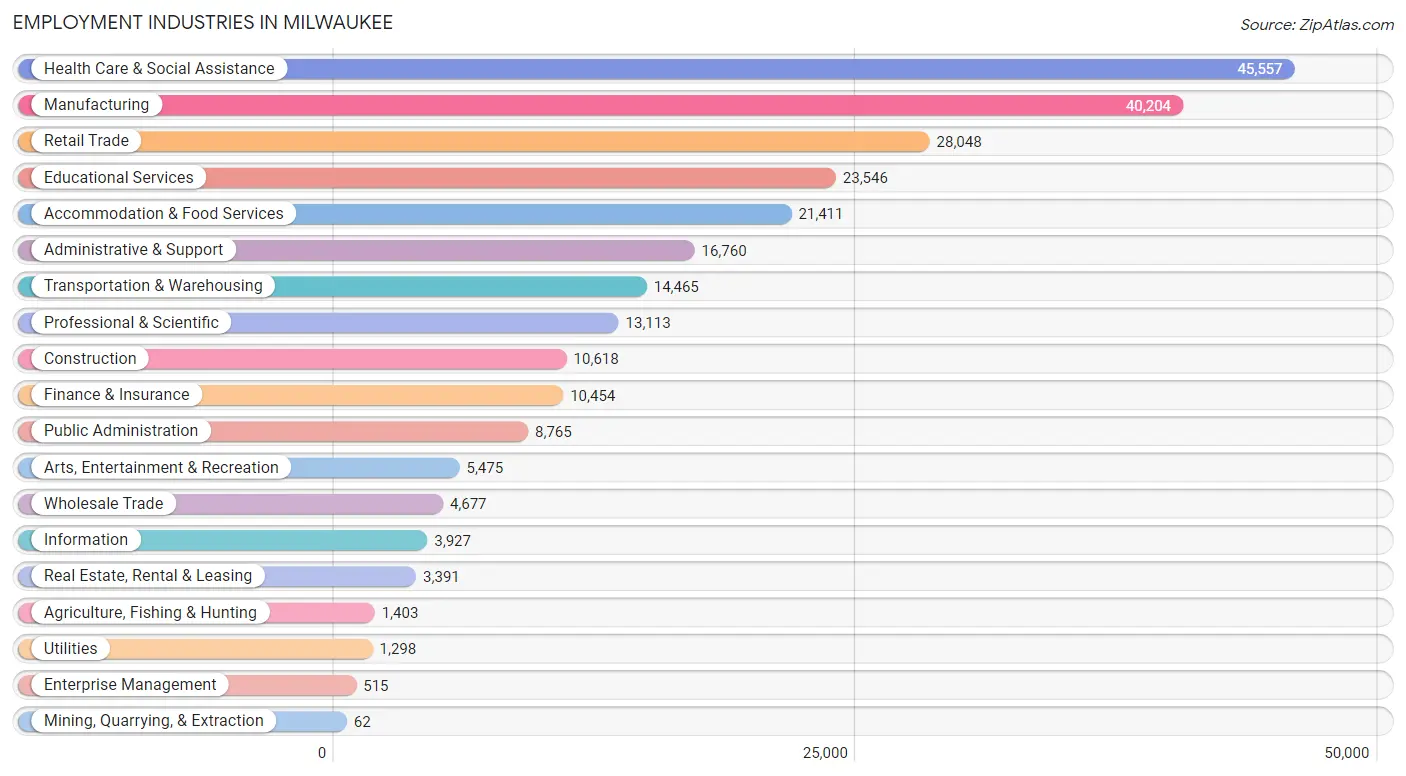
Employment Industries in Milwaukee
The major employment industries in Milwaukee include Health Care & Social Assistance (45,557 | 17.2%), Manufacturing (40,204 | 15.1%), Retail Trade (28,048 | 10.6%), Educational Services (23,546 | 8.9%), and Accommodation & Food Services (21,411 | 8.1%).
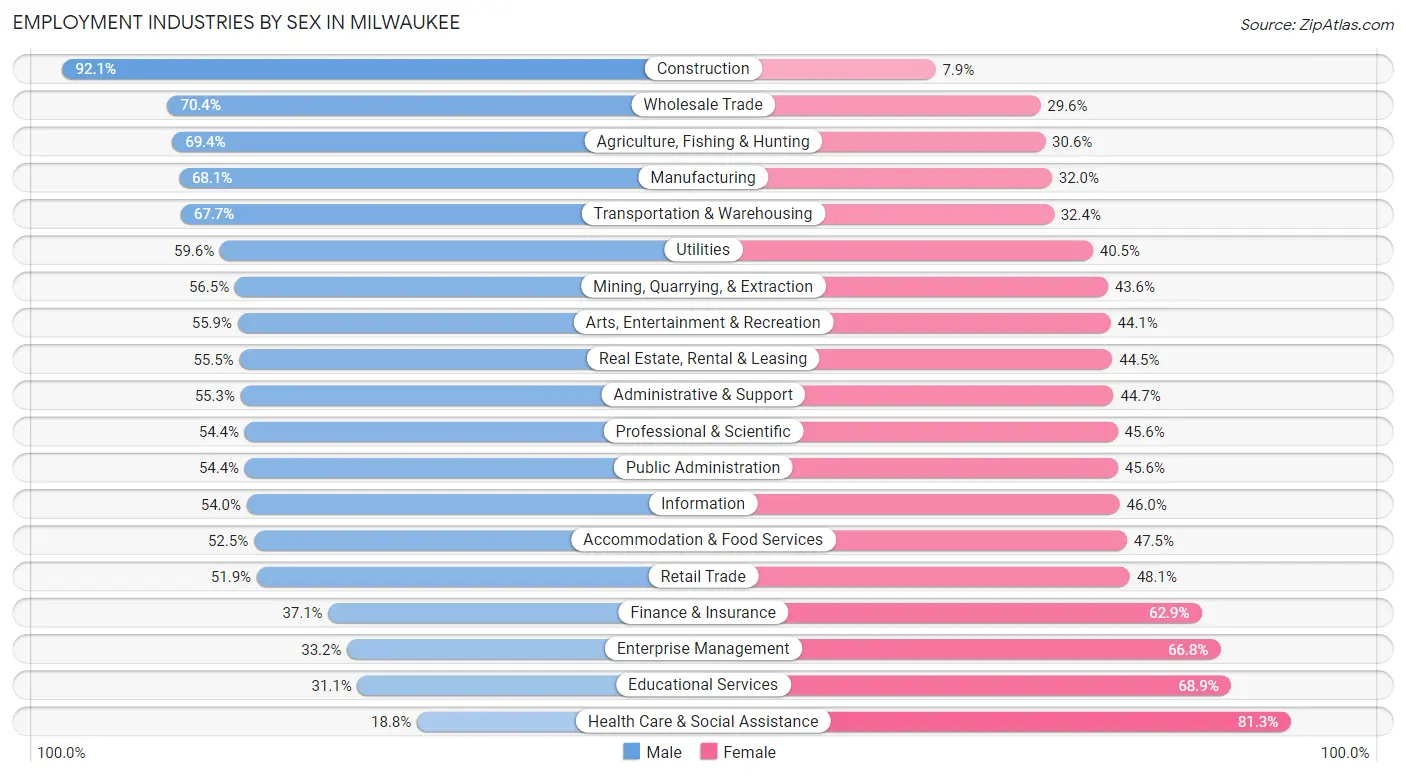
Employment Industries by Sex in Milwaukee
The Milwaukee industries that see more men than women are Construction (92.1%), Wholesale Trade (70.4%), and Agriculture, Fishing & Hunting (69.4%), whereas the industries that tend to have a higher number of women are Health Care & Social Assistance (81.2%), Educational Services (68.9%), and Enterprise Management (66.8%).
| Industry | Male | Female |
| Agriculture, Fishing & Hunting | 974 (69.4%) | 429 (30.6%) |
| Mining, Quarrying, & Extraction | 35 (56.5%) | 27 (43.5%) |
| Construction | 9,781 (92.1%) | 837 (7.9%) |
| Manufacturing | 27,358 (68.0%) | 12,846 (32.0%) |
| Wholesale Trade | 3,293 (70.4%) | 1,384 (29.6%) |
| Retail Trade | 14,562 (51.9%) | 13,486 (48.1%) |
| Transportation & Warehousing | 9,785 (67.6%) | 4,680 (32.4%) |
| Utilities | 773 (59.6%) | 525 (40.5%) |
| Information | 2,121 (54.0%) | 1,806 (46.0%) |
| Finance & Insurance | 3,879 (37.1%) | 6,575 (62.9%) |
| Real Estate, Rental & Leasing | 1,883 (55.5%) | 1,508 (44.5%) |
| Professional & Scientific | 7,138 (54.4%) | 5,975 (45.6%) |
| Enterprise Management | 171 (33.2%) | 344 (66.8%) |
| Administrative & Support | 9,262 (55.3%) | 7,498 (44.7%) |
| Educational Services | 7,315 (31.1%) | 16,231 (68.9%) |
| Health Care & Social Assistance | 8,540 (18.8%) | 37,017 (81.2%) |
| Arts, Entertainment & Recreation | 3,059 (55.9%) | 2,416 (44.1%) |
| Accommodation & Food Services | 11,244 (52.5%) | 10,167 (47.5%) |
| Public Administration | 4,767 (54.4%) | 3,998 (45.6%) |
| Total | 131,158 (49.4%) | 134,499 (50.6%) |
Education in Milwaukee
School Enrollment in Milwaukee
The most common levels of schooling among the 159,144 students in Milwaukee are middle school (35,203 | 22.1%), college / undergraduate (35,196 | 22.1%), and high school (31,361 | 19.7%).
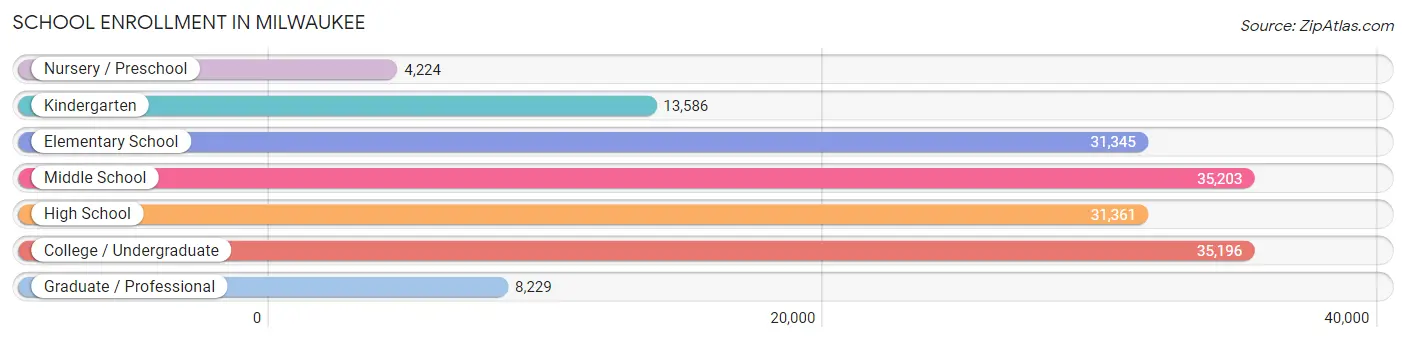
| School Level | # Students | % Students |
| Nursery / Preschool | 4,224 | 2.6% |
| Kindergarten | 13,586 | 8.5% |
| Elementary School | 31,345 | 19.7% |
| Middle School | 35,203 | 22.1% |
| High School | 31,361 | 19.7% |
| College / Undergraduate | 35,196 | 22.1% |
| Graduate / Professional | 8,229 | 5.2% |
| Total | 159,144 | 100.0% |
School Enrollment by Age by Funding Source in Milwaukee
Out of a total of 159,144 students who are enrolled in schools in Milwaukee, 44,719 (28.1%) attend a private institution, while the remaining 114,425 (71.9%) are enrolled in public schools. The age group of 20 to 24 year olds has the highest likelihood of being enrolled in private schools, with 7,099 (39.4% in the age bracket) enrolled. Conversely, the age group of 15 to 17 year olds has the lowest likelihood of being enrolled in a private school, with 17,520 (78.6% in the age bracket) attending a public institution.
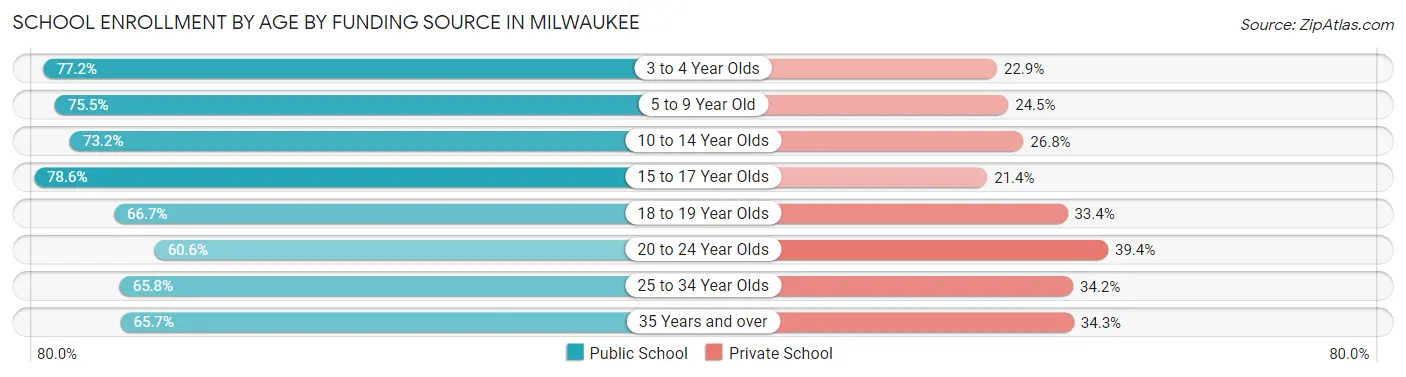
| Age Bracket | Public School | Private School |
| 3 to 4 Year Olds | 5,872 (77.1%) | 1,739 (22.9%) |
| 5 to 9 Year Old | 28,781 (75.5%) | 9,353 (24.5%) |
| 10 to 14 Year Olds | 30,522 (73.2%) | 11,166 (26.8%) |
| 15 to 17 Year Olds | 17,520 (78.6%) | 4,771 (21.4%) |
| 18 to 19 Year Olds | 9,688 (66.6%) | 4,847 (33.4%) |
| 20 to 24 Year Olds | 10,923 (60.6%) | 7,099 (39.4%) |
| 25 to 34 Year Olds | 7,040 (65.8%) | 3,658 (34.2%) |
| 35 Years and over | 4,050 (65.7%) | 2,115 (34.3%) |
| Total | 114,425 (71.9%) | 44,719 (28.1%) |
Educational Attainment by Field of Study in Milwaukee
Business (17,877 | 17.4%), education (11,016 | 10.7%), science & technology (10,045 | 9.8%), social sciences (8,480 | 8.3%), and arts & humanities (7,832 | 7.6%) are the most common fields of study among 102,523 individuals in Milwaukee who have obtained a bachelor's degree or higher.
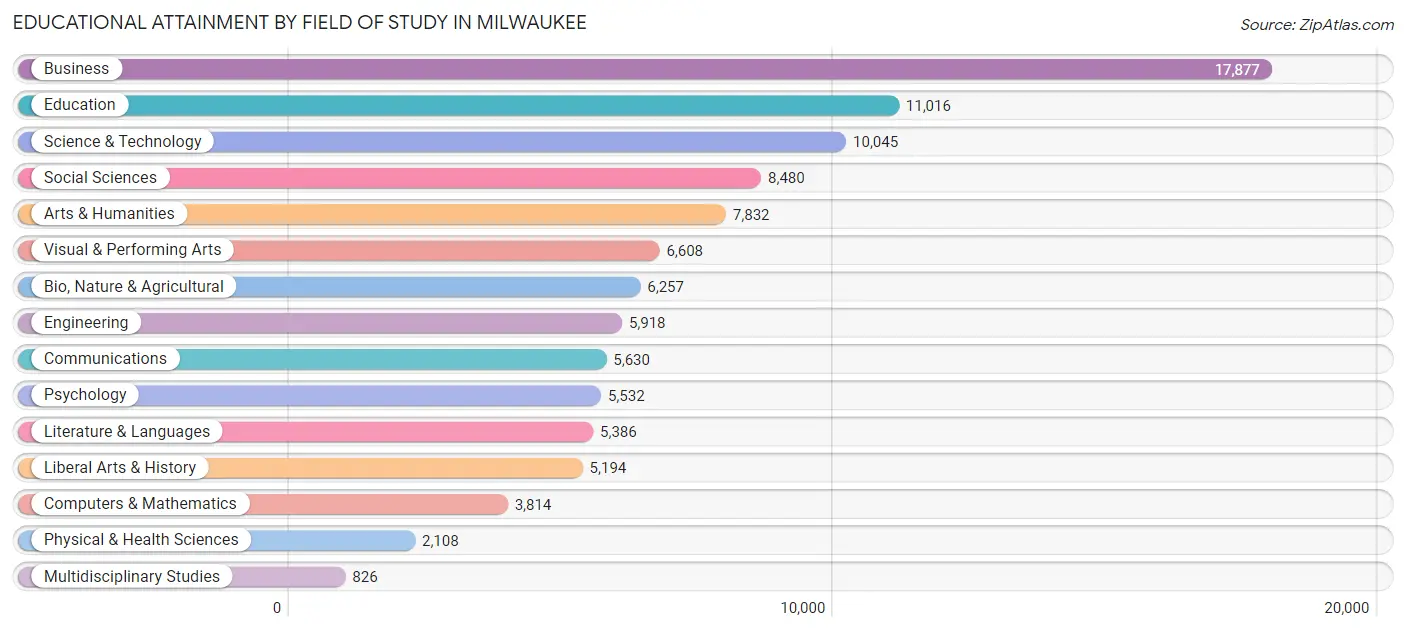
| Field of Study | # Graduates | % Graduates |
| Computers & Mathematics | 3,814 | 3.7% |
| Bio, Nature & Agricultural | 6,257 | 6.1% |
| Physical & Health Sciences | 2,108 | 2.1% |
| Psychology | 5,532 | 5.4% |
| Social Sciences | 8,480 | 8.3% |
| Engineering | 5,918 | 5.8% |
| Multidisciplinary Studies | 826 | 0.8% |
| Science & Technology | 10,045 | 9.8% |
| Business | 17,877 | 17.4% |
| Education | 11,016 | 10.7% |
| Literature & Languages | 5,386 | 5.2% |
| Liberal Arts & History | 5,194 | 5.1% |
| Visual & Performing Arts | 6,608 | 6.5% |
| Communications | 5,630 | 5.5% |
| Arts & Humanities | 7,832 | 7.6% |
| Total | 102,523 | 100.0% |
Transportation & Commute in Milwaukee
Vehicle Availability by Sex in Milwaukee
The most prevalent vehicle ownership categories in Milwaukee are males with 2 vehicles (51,537, accounting for 40.3%) and females with 2 vehicles (45,391, making up 39.7%).
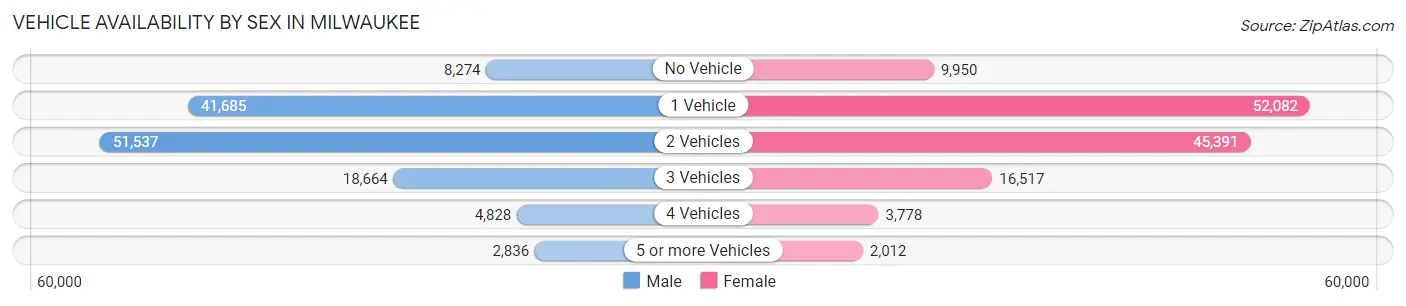
| Vehicles Available | Male | Female |
| No Vehicle | 8,274 (6.5%) | 9,950 (7.7%) |
| 1 Vehicle | 41,685 (32.6%) | 52,082 (40.2%) |
| 2 Vehicles | 51,537 (40.3%) | 45,391 (35.0%) |
| 3 Vehicles | 18,664 (14.6%) | 16,517 (12.7%) |
| 4 Vehicles | 4,828 (3.8%) | 3,778 (2.9%) |
| 5 or more Vehicles | 2,836 (2.2%) | 2,012 (1.5%) |
| Total | 127,824 (100.0%) | 129,730 (100.0%) |
Commute Time in Milwaukee
The most frequently occuring commute durations in Milwaukee are 15 to 19 minutes (49,142 commuters, 20.8%), 20 to 24 minutes (45,748 commuters, 19.3%), and 10 to 14 minutes (37,087 commuters, 15.7%).
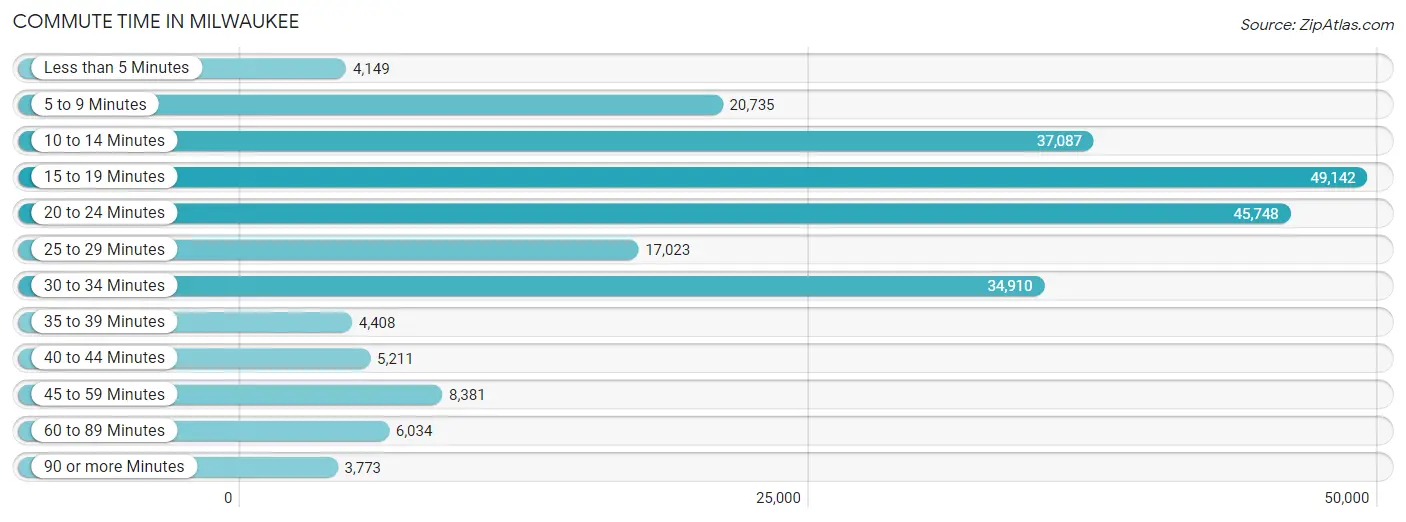
| Commute Time | # Commuters | % Commuters |
| Less than 5 Minutes | 4,149 | 1.8% |
| 5 to 9 Minutes | 20,735 | 8.8% |
| 10 to 14 Minutes | 37,087 | 15.7% |
| 15 to 19 Minutes | 49,142 | 20.8% |
| 20 to 24 Minutes | 45,748 | 19.3% |
| 25 to 29 Minutes | 17,023 | 7.2% |
| 30 to 34 Minutes | 34,910 | 14.7% |
| 35 to 39 Minutes | 4,408 | 1.9% |
| 40 to 44 Minutes | 5,211 | 2.2% |
| 45 to 59 Minutes | 8,381 | 3.5% |
| 60 to 89 Minutes | 6,034 | 2.5% |
| 90 or more Minutes | 3,773 | 1.6% |
Commute Time by Sex in Milwaukee
The most common commute times in Milwaukee are 15 to 19 minutes (23,539 commuters, 19.9%) for males and 15 to 19 minutes (25,603 commuters, 21.6%) for females.
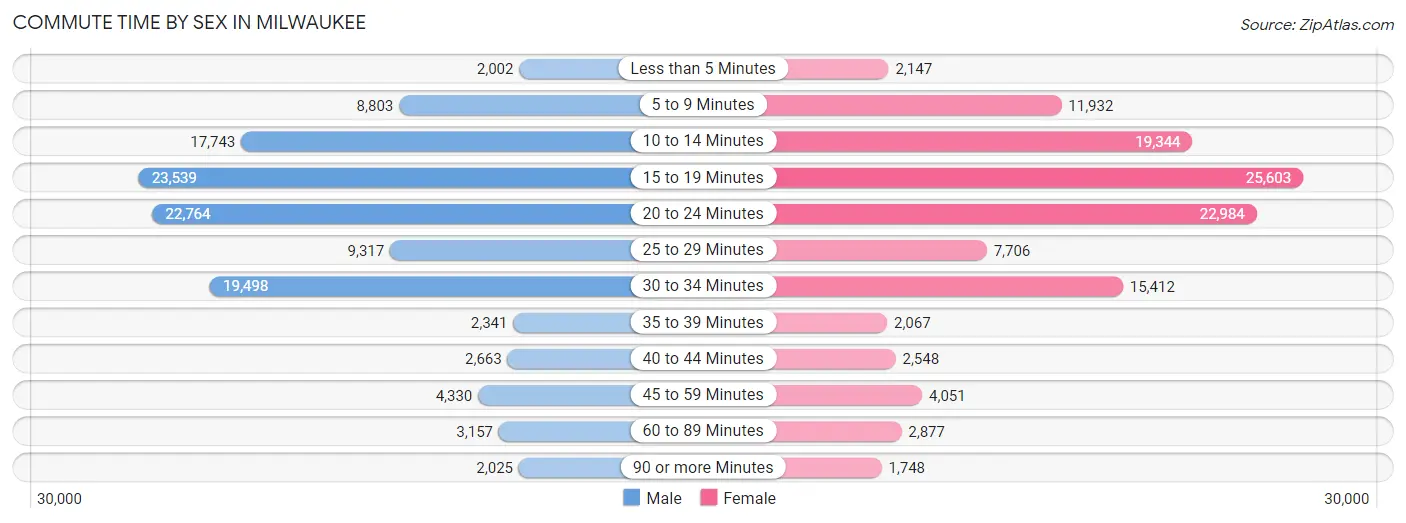
| Commute Time | Male | Female |
| Less than 5 Minutes | 2,002 (1.7%) | 2,147 (1.8%) |
| 5 to 9 Minutes | 8,803 (7.4%) | 11,932 (10.1%) |
| 10 to 14 Minutes | 17,743 (15.0%) | 19,344 (16.3%) |
| 15 to 19 Minutes | 23,539 (19.9%) | 25,603 (21.6%) |
| 20 to 24 Minutes | 22,764 (19.3%) | 22,984 (19.4%) |
| 25 to 29 Minutes | 9,317 (7.9%) | 7,706 (6.5%) |
| 30 to 34 Minutes | 19,498 (16.5%) | 15,412 (13.0%) |
| 35 to 39 Minutes | 2,341 (2.0%) | 2,067 (1.8%) |
| 40 to 44 Minutes | 2,663 (2.2%) | 2,548 (2.1%) |
| 45 to 59 Minutes | 4,330 (3.7%) | 4,051 (3.4%) |
| 60 to 89 Minutes | 3,157 (2.7%) | 2,877 (2.4%) |
| 90 or more Minutes | 2,025 (1.7%) | 1,748 (1.5%) |
Time of Departure to Work by Sex in Milwaukee
The most frequent times of departure to work in Milwaukee are 7:00 AM to 7:29 AM (16,178, 13.7%) for males and 7:00 AM to 7:29 AM (18,937, 16.0%) for females.
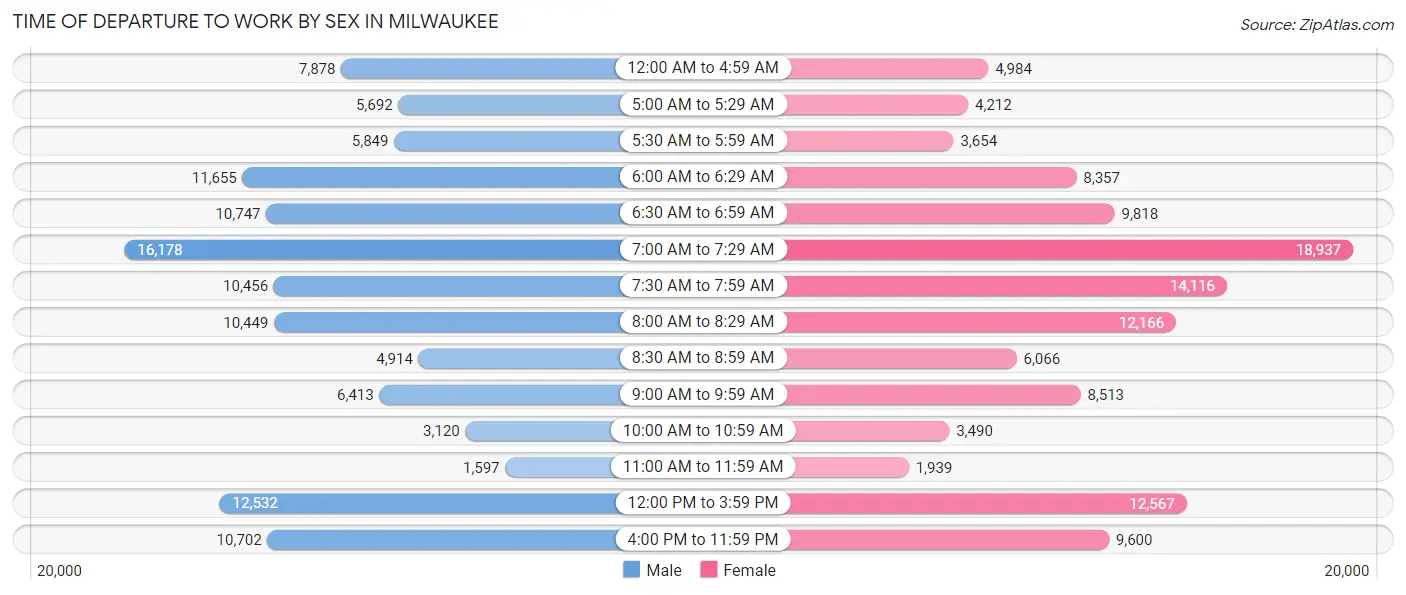
| Time of Departure | Male | Female |
| 12:00 AM to 4:59 AM | 7,878 (6.7%) | 4,984 (4.2%) |
| 5:00 AM to 5:29 AM | 5,692 (4.8%) | 4,212 (3.6%) |
| 5:30 AM to 5:59 AM | 5,849 (5.0%) | 3,654 (3.1%) |
| 6:00 AM to 6:29 AM | 11,655 (9.9%) | 8,357 (7.1%) |
| 6:30 AM to 6:59 AM | 10,747 (9.1%) | 9,818 (8.3%) |
| 7:00 AM to 7:29 AM | 16,178 (13.7%) | 18,937 (16.0%) |
| 7:30 AM to 7:59 AM | 10,456 (8.8%) | 14,116 (11.9%) |
| 8:00 AM to 8:29 AM | 10,449 (8.8%) | 12,166 (10.3%) |
| 8:30 AM to 8:59 AM | 4,914 (4.2%) | 6,066 (5.1%) |
| 9:00 AM to 9:59 AM | 6,413 (5.4%) | 8,513 (7.2%) |
| 10:00 AM to 10:59 AM | 3,120 (2.6%) | 3,490 (2.9%) |
| 11:00 AM to 11:59 AM | 1,597 (1.3%) | 1,939 (1.6%) |
| 12:00 PM to 3:59 PM | 12,532 (10.6%) | 12,567 (10.6%) |
| 4:00 PM to 11:59 PM | 10,702 (9.1%) | 9,600 (8.1%) |
| Total | 118,182 (100.0%) | 118,419 (100.0%) |
Housing Occupancy in Milwaukee
Occupancy by Ownership in Milwaukee
Of the total 230,759 dwellings in Milwaukee, owner-occupied units account for 94,975 (41.2%), while renter-occupied units make up 135,784 (58.8%).
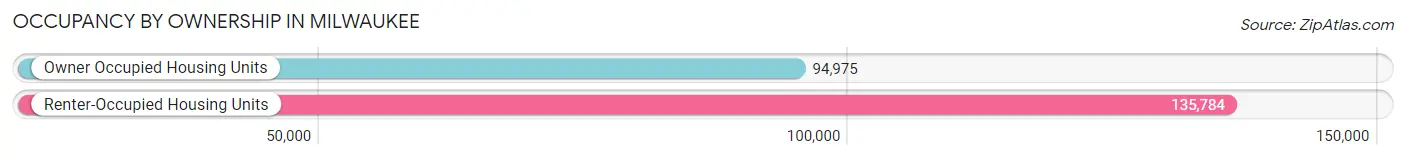
| Occupancy | # Housing Units | % Housing Units |
| Owner Occupied Housing Units | 94,975 | 41.2% |
| Renter-Occupied Housing Units | 135,784 | 58.8% |
| Total Occupied Housing Units | 230,759 | 100.0% |
Occupancy by Household Size in Milwaukee
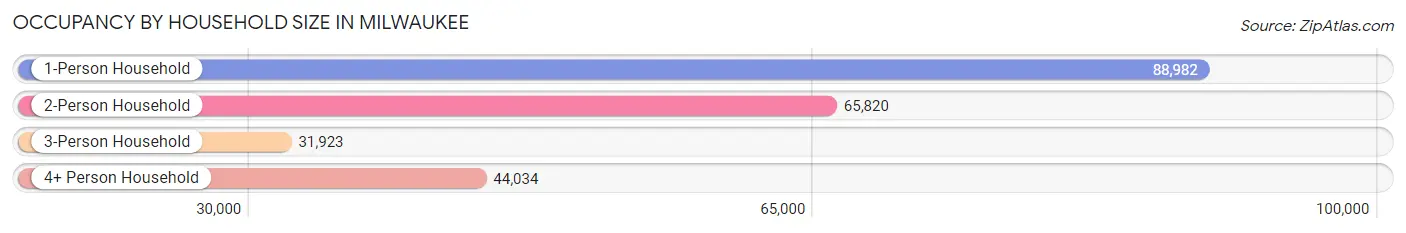
| Household Size | # Housing Units | % Housing Units |
| 1-Person Household | 88,982 | 38.6% |
| 2-Person Household | 65,820 | 28.5% |
| 3-Person Household | 31,923 | 13.8% |
| 4+ Person Household | 44,034 | 19.1% |
| Total Housing Units | 230,759 | 100.0% |
Occupancy by Ownership by Household Size in Milwaukee
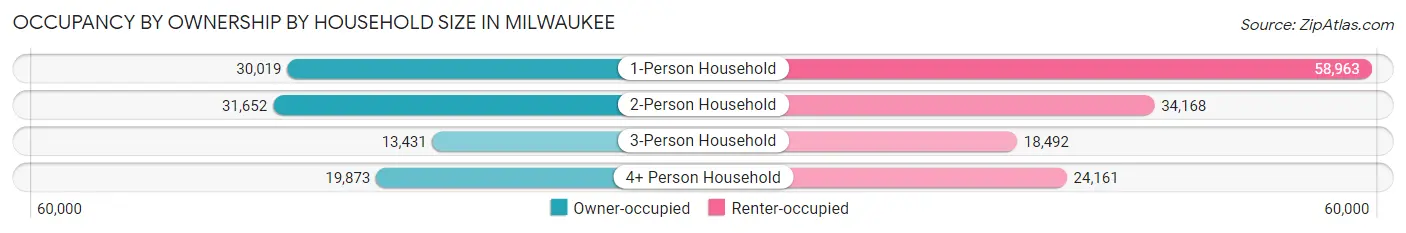
| Household Size | Owner-occupied | Renter-occupied |
| 1-Person Household | 30,019 (33.7%) | 58,963 (66.3%) |
| 2-Person Household | 31,652 (48.1%) | 34,168 (51.9%) |
| 3-Person Household | 13,431 (42.1%) | 18,492 (57.9%) |
| 4+ Person Household | 19,873 (45.1%) | 24,161 (54.9%) |
| Total Housing Units | 94,975 (41.2%) | 135,784 (58.8%) |
Occupancy by Educational Attainment in Milwaukee
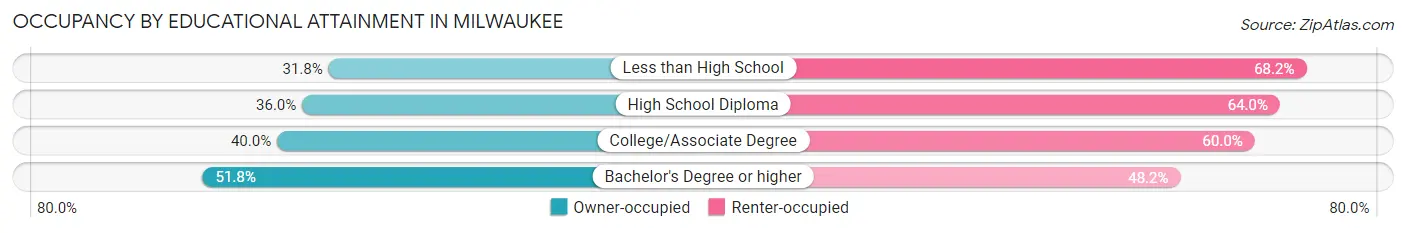
| Household Size | Owner-occupied | Renter-occupied |
| Less than High School | 9,424 (31.8%) | 20,225 (68.2%) |
| High School Diploma | 22,753 (36.0%) | 40,488 (64.0%) |
| College/Associate Degree | 29,050 (40.0%) | 43,627 (60.0%) |
| Bachelor's Degree or higher | 33,748 (51.8%) | 31,444 (48.2%) |
Occupancy by Age of Householder in Milwaukee
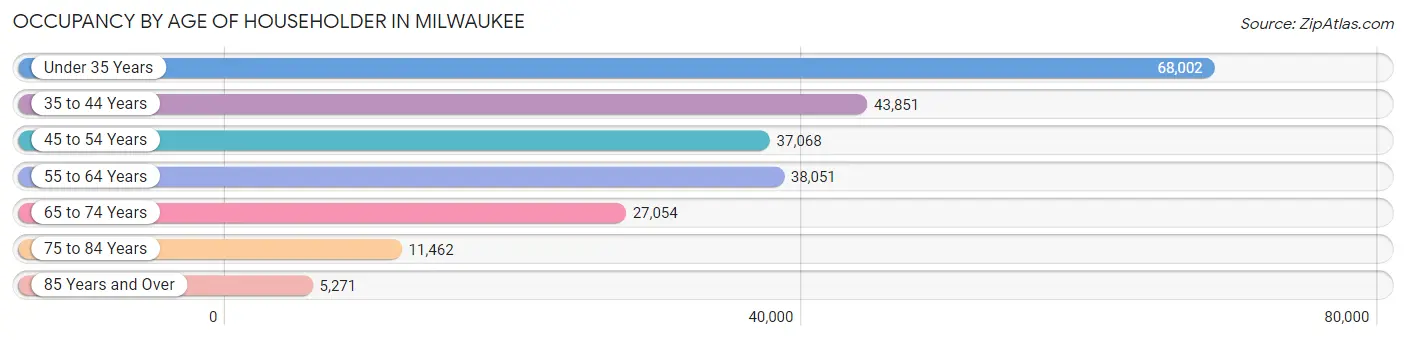
| Age Bracket | # Households | % Households |
| Under 35 Years | 68,002 | 29.5% |
| 35 to 44 Years | 43,851 | 19.0% |
| 45 to 54 Years | 37,068 | 16.1% |
| 55 to 64 Years | 38,051 | 16.5% |
| 65 to 74 Years | 27,054 | 11.7% |
| 75 to 84 Years | 11,462 | 5.0% |
| 85 Years and Over | 5,271 | 2.3% |
| Total | 230,759 | 100.0% |
Housing Finances in Milwaukee
Median Income by Occupancy in Milwaukee
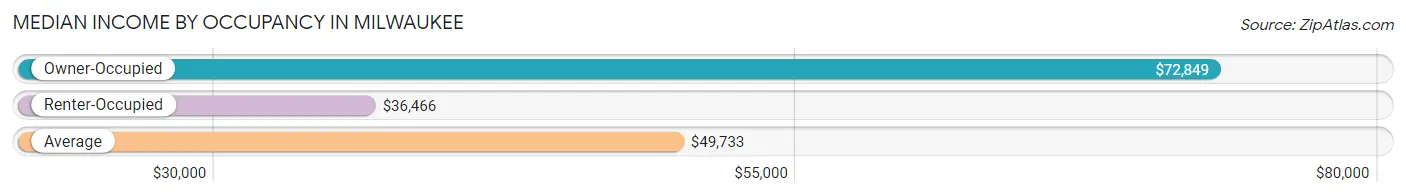
| Occupancy Type | # Households | Median Income |
| Owner-Occupied | 94,975 (41.2%) | $72,849 |
| Renter-Occupied | 135,784 (58.8%) | $36,466 |
| Average | 230,759 (100.0%) | $49,733 |
Occupancy by Householder Income Bracket in Milwaukee
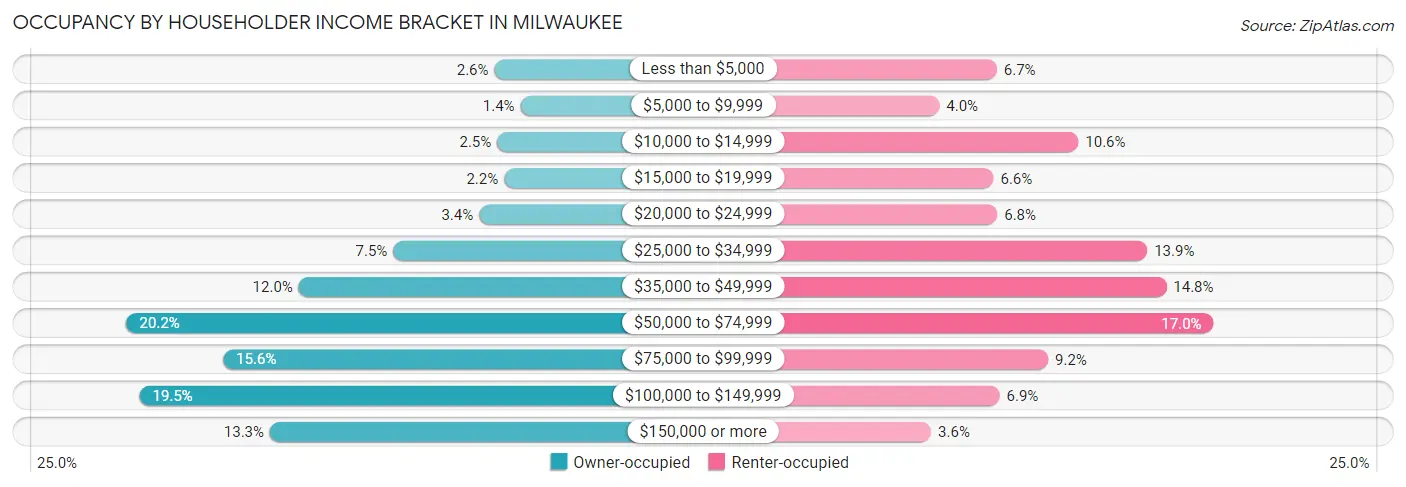
| Income Bracket | Owner-occupied | Renter-occupied |
| Less than $5,000 | 2,495 (2.6%) | 9,141 (6.7%) |
| $5,000 to $9,999 | 1,318 (1.4%) | 5,423 (4.0%) |
| $10,000 to $14,999 | 2,372 (2.5%) | 14,401 (10.6%) |
| $15,000 to $19,999 | 2,062 (2.2%) | 8,918 (6.6%) |
| $20,000 to $24,999 | 3,191 (3.4%) | 9,168 (6.8%) |
| $25,000 to $34,999 | 7,074 (7.4%) | 18,858 (13.9%) |
| $35,000 to $49,999 | 11,354 (11.9%) | 20,090 (14.8%) |
| $50,000 to $74,999 | 19,142 (20.2%) | 23,138 (17.0%) |
| $75,000 to $99,999 | 14,768 (15.5%) | 12,450 (9.2%) |
| $100,000 to $149,999 | 18,551 (19.5%) | 9,310 (6.9%) |
| $150,000 or more | 12,648 (13.3%) | 4,887 (3.6%) |
| Total | 94,975 (100.0%) | 135,784 (100.0%) |
Monthly Housing Cost Tiers in Milwaukee
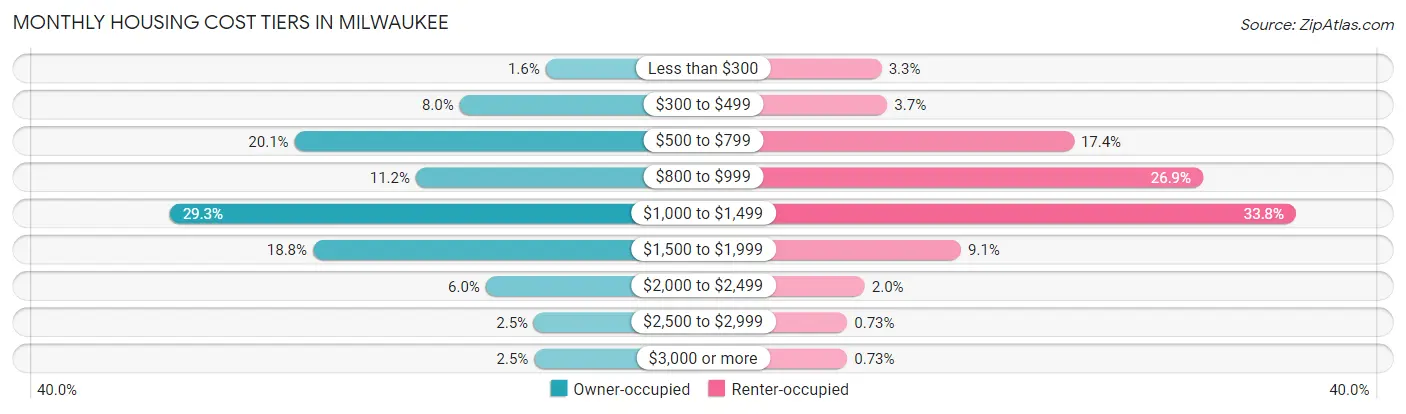
| Monthly Cost | Owner-occupied | Renter-occupied |
| Less than $300 | 1,544 (1.6%) | 4,428 (3.3%) |
| $300 to $499 | 7,571 (8.0%) | 4,991 (3.7%) |
| $500 to $799 | 19,123 (20.1%) | 23,660 (17.4%) |
| $800 to $999 | 10,626 (11.2%) | 36,534 (26.9%) |
| $1,000 to $1,499 | 27,835 (29.3%) | 45,844 (33.8%) |
| $1,500 to $1,999 | 17,831 (18.8%) | 12,368 (9.1%) |
| $2,000 to $2,499 | 5,732 (6.0%) | 2,746 (2.0%) |
| $2,500 to $2,999 | 2,366 (2.5%) | 987 (0.7%) |
| $3,000 or more | 2,347 (2.5%) | 994 (0.7%) |
| Total | 94,975 (100.0%) | 135,784 (100.0%) |
Physical Housing Characteristics in Milwaukee
Housing Structures in Milwaukee
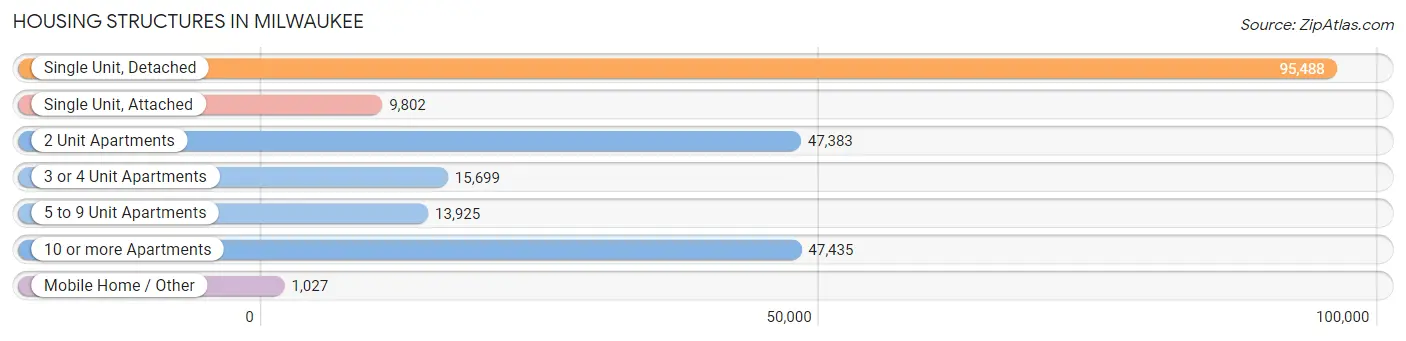
| Structure Type | # Housing Units | % Housing Units |
| Single Unit, Detached | 95,488 | 41.4% |
| Single Unit, Attached | 9,802 | 4.3% |
| 2 Unit Apartments | 47,383 | 20.5% |
| 3 or 4 Unit Apartments | 15,699 | 6.8% |
| 5 to 9 Unit Apartments | 13,925 | 6.0% |
| 10 or more Apartments | 47,435 | 20.6% |
| Mobile Home / Other | 1,027 | 0.4% |
| Total | 230,759 | 100.0% |
Housing Structures by Occupancy in Milwaukee
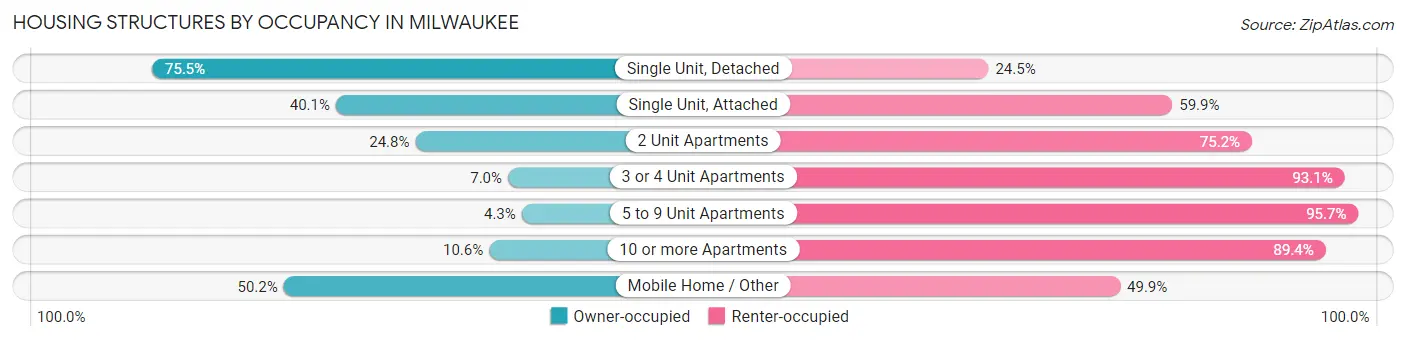
| Structure Type | Owner-occupied | Renter-occupied |
| Single Unit, Detached | 72,082 (75.5%) | 23,406 (24.5%) |
| Single Unit, Attached | 3,930 (40.1%) | 5,872 (59.9%) |
| 2 Unit Apartments | 11,738 (24.8%) | 35,645 (75.2%) |
| 3 or 4 Unit Apartments | 1,091 (7.0%) | 14,608 (93.0%) |
| 5 to 9 Unit Apartments | 599 (4.3%) | 13,326 (95.7%) |
| 10 or more Apartments | 5,020 (10.6%) | 42,415 (89.4%) |
| Mobile Home / Other | 515 (50.1%) | 512 (49.8%) |
| Total | 94,975 (41.2%) | 135,784 (58.8%) |
Housing Structures by Number of Rooms in Milwaukee
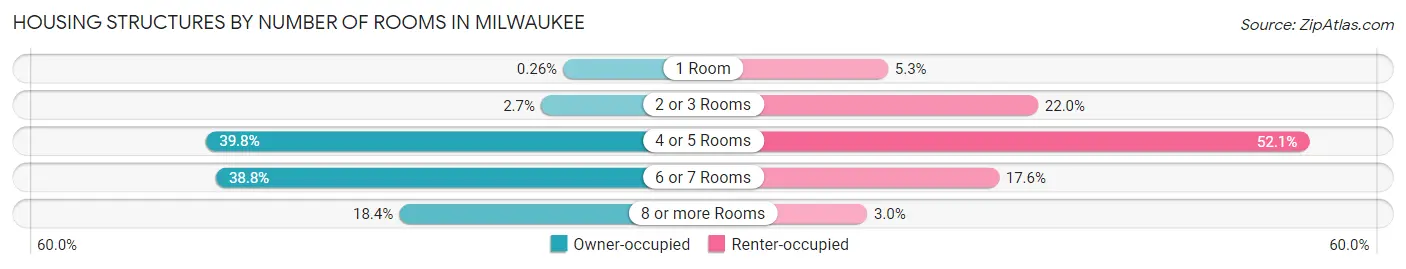
| Number of Rooms | Owner-occupied | Renter-occupied |
| 1 Room | 249 (0.3%) | 7,221 (5.3%) |
| 2 or 3 Rooms | 2,574 (2.7%) | 29,837 (22.0%) |
| 4 or 5 Rooms | 37,824 (39.8%) | 70,708 (52.1%) |
| 6 or 7 Rooms | 36,813 (38.8%) | 23,943 (17.6%) |
| 8 or more Rooms | 17,515 (18.4%) | 4,075 (3.0%) |
| Total | 94,975 (100.0%) | 135,784 (100.0%) |
Housing Structure by Heating Type in Milwaukee
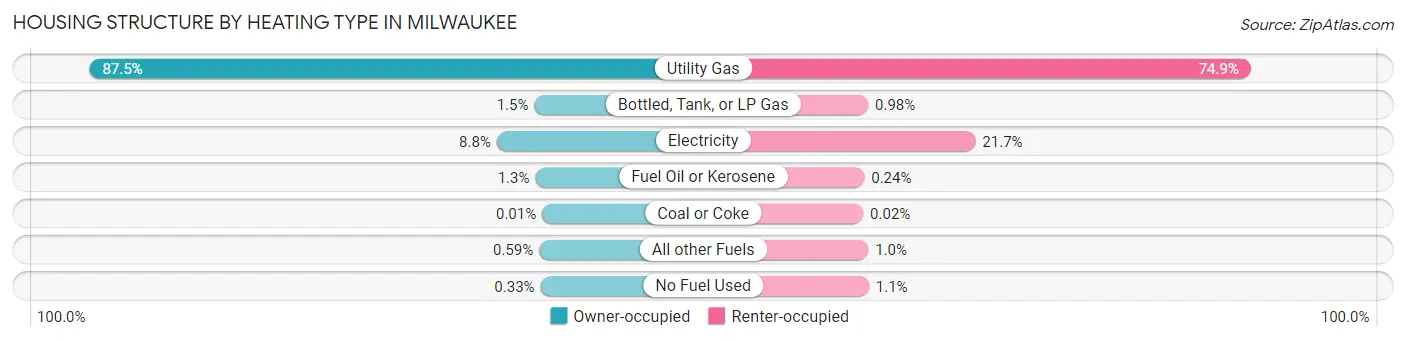
| Heating Type | Owner-occupied | Renter-occupied |
| Utility Gas | 83,062 (87.5%) | 101,722 (74.9%) |
| Bottled, Tank, or LP Gas | 1,427 (1.5%) | 1,336 (1.0%) |
| Electricity | 8,343 (8.8%) | 29,478 (21.7%) |
| Fuel Oil or Kerosene | 1,252 (1.3%) | 332 (0.2%) |
| Coal or Coke | 14 (0.0%) | 30 (0.0%) |
| All other Fuels | 565 (0.6%) | 1,368 (1.0%) |
| No Fuel Used | 312 (0.3%) | 1,518 (1.1%) |
| Total | 94,975 (100.0%) | 135,784 (100.0%) |
Household Vehicle Usage in Milwaukee
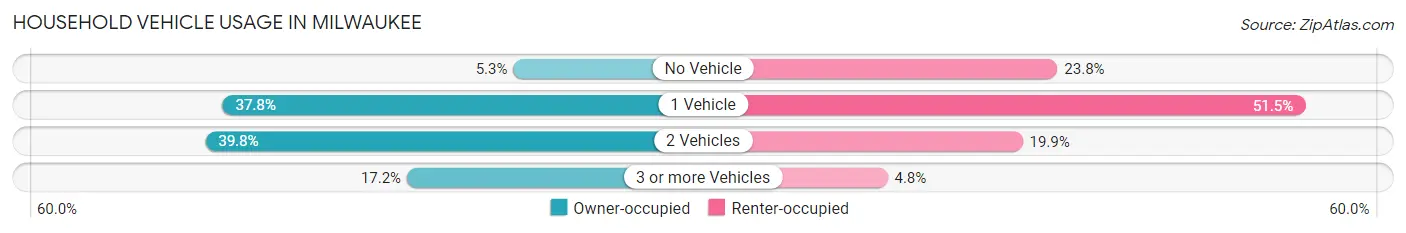
| Vehicles per Household | Owner-occupied | Renter-occupied |
| No Vehicle | 4,991 (5.3%) | 32,313 (23.8%) |
| 1 Vehicle | 35,916 (37.8%) | 69,969 (51.5%) |
| 2 Vehicles | 37,758 (39.8%) | 27,020 (19.9%) |
| 3 or more Vehicles | 16,310 (17.2%) | 6,482 (4.8%) |
| Total | 94,975 (100.0%) | 135,784 (100.0%) |
Real Estate & Mortgages in Milwaukee
Real Estate and Mortgage Overview in Milwaukee
| Characteristic | Without Mortgage | With Mortgage |
| Housing Units | 33,073 | 61,902 |
| Median Property Value | $140,300 | $164,200 |
| Median Household Income | $56,099 | $9,411 |
| Monthly Housing Costs | $619 | $2,196 |
| Real Estate Taxes | $3,142 | $723 |
Property Value by Mortgage Status in Milwaukee
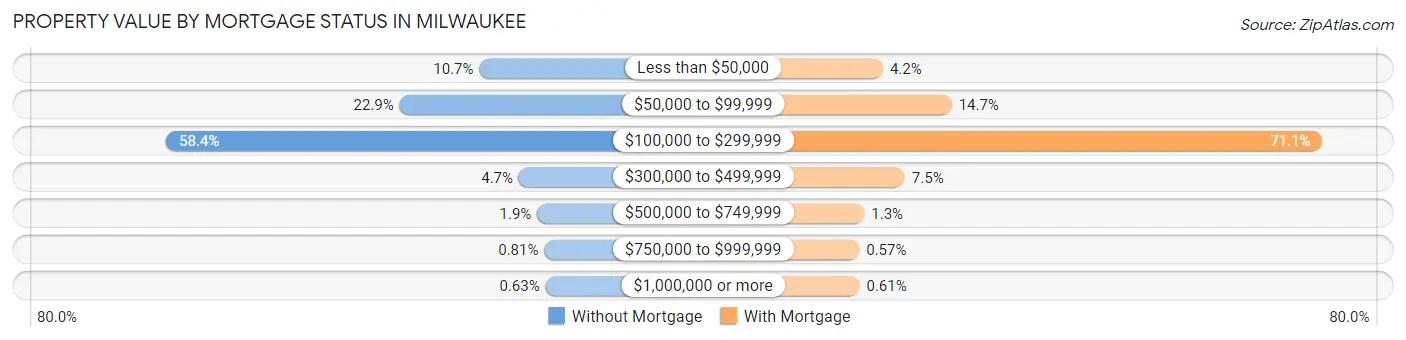
| Property Value | Without Mortgage | With Mortgage |
| Less than $50,000 | 3,543 (10.7%) | 2,586 (4.2%) |
| $50,000 to $99,999 | 7,559 (22.9%) | 9,067 (14.6%) |
| $100,000 to $299,999 | 19,320 (58.4%) | 44,038 (71.1%) |
| $300,000 to $499,999 | 1,548 (4.7%) | 4,657 (7.5%) |
| $500,000 to $749,999 | 626 (1.9%) | 828 (1.3%) |
| $750,000 to $999,999 | 269 (0.8%) | 351 (0.6%) |
| $1,000,000 or more | 208 (0.6%) | 375 (0.6%) |
| Total | 33,073 (100.0%) | 61,902 (100.0%) |
Household Income by Mortgage Status in Milwaukee
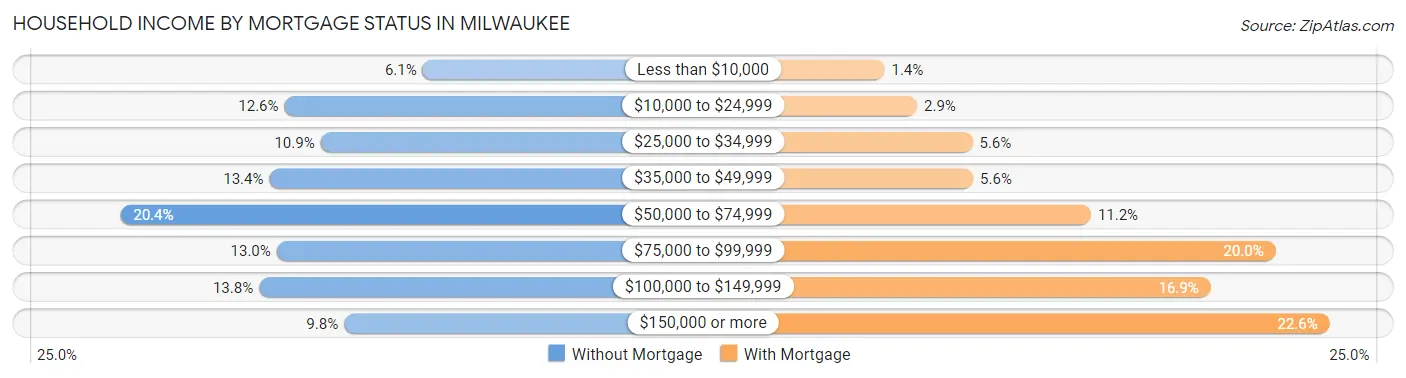
| Household Income | Without Mortgage | With Mortgage |
| Less than $10,000 | 2,000 (6.0%) | 854 (1.4%) |
| $10,000 to $24,999 | 4,178 (12.6%) | 1,813 (2.9%) |
| $25,000 to $34,999 | 3,607 (10.9%) | 3,447 (5.6%) |
| $35,000 to $49,999 | 4,415 (13.4%) | 3,467 (5.6%) |
| $50,000 to $74,999 | 6,759 (20.4%) | 6,939 (11.2%) |
| $75,000 to $99,999 | 4,300 (13.0%) | 12,383 (20.0%) |
| $100,000 to $149,999 | 4,577 (13.8%) | 10,468 (16.9%) |
| $150,000 or more | 3,237 (9.8%) | 13,974 (22.6%) |
| Total | 33,073 (100.0%) | 61,902 (100.0%) |
Property Value to Household Income Ratio in Milwaukee
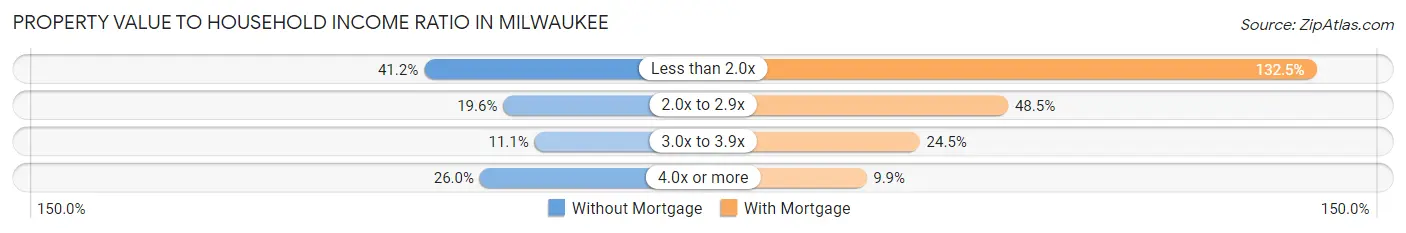
| Value-to-Income Ratio | Without Mortgage | With Mortgage |
| Less than 2.0x | 13,627 (41.2%) | 82,020 (132.5%) |
| 2.0x to 2.9x | 6,484 (19.6%) | 30,028 (48.5%) |
| 3.0x to 3.9x | 3,666 (11.1%) | 15,135 (24.4%) |
| 4.0x or more | 8,596 (26.0%) | 6,129 (9.9%) |
| Total | 33,073 (100.0%) | 61,902 (100.0%) |
Real Estate Taxes by Mortgage Status in Milwaukee
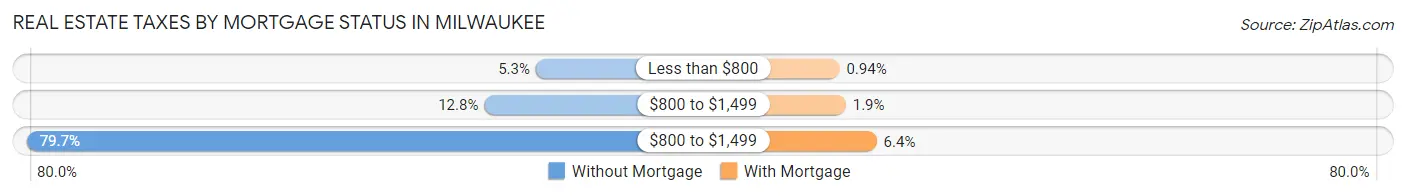
| Property Taxes | Without Mortgage | With Mortgage |
| Less than $800 | 1,753 (5.3%) | 582 (0.9%) |
| $800 to $1,499 | 4,246 (12.8%) | 1,152 (1.9%) |
| $800 to $1,499 | 26,356 (79.7%) | 3,942 (6.4%) |
| Total | 33,073 (100.0%) | 61,902 (100.0%) |
Health & Disability in Milwaukee
Health Insurance Coverage by Age in Milwaukee
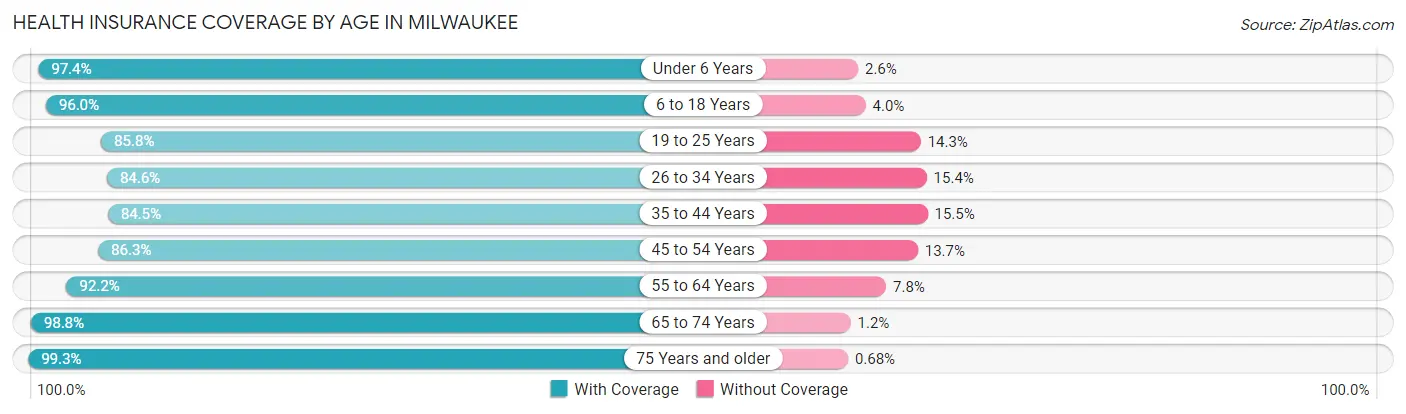
| Age Bracket | With Coverage | Without Coverage |
| Under 6 Years | 47,719 (97.4%) | 1,255 (2.6%) |
| 6 to 18 Years | 104,060 (96.0%) | 4,298 (4.0%) |
| 19 to 25 Years | 58,803 (85.8%) | 9,770 (14.2%) |
| 26 to 34 Years | 73,399 (84.6%) | 13,315 (15.4%) |
| 35 to 44 Years | 61,875 (84.5%) | 11,365 (15.5%) |
| 45 to 54 Years | 52,459 (86.3%) | 8,326 (13.7%) |
| 55 to 64 Years | 54,606 (92.2%) | 4,617 (7.8%) |
| 65 to 74 Years | 39,035 (98.8%) | 468 (1.2%) |
| 75 Years and older | 23,572 (99.3%) | 161 (0.7%) |
| Total | 515,528 (90.6%) | 53,575 (9.4%) |
Health Insurance Coverage by Citizenship Status in Milwaukee
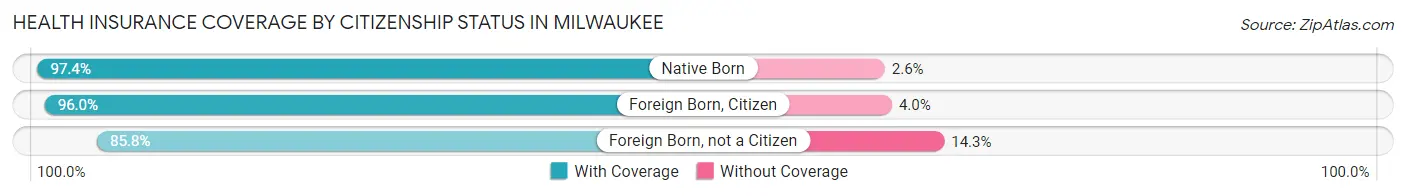
| Citizenship Status | With Coverage | Without Coverage |
| Native Born | 47,719 (97.4%) | 1,255 (2.6%) |
| Foreign Born, Citizen | 104,060 (96.0%) | 4,298 (4.0%) |
| Foreign Born, not a Citizen | 58,803 (85.8%) | 9,770 (14.2%) |
Health Insurance Coverage by Household Income in Milwaukee
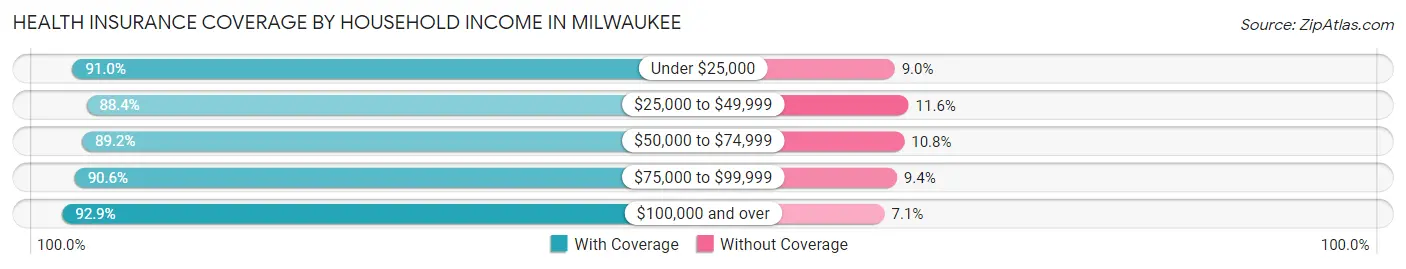
| Household Income | With Coverage | Without Coverage |
| Under $25,000 | 99,201 (91.0%) | 9,787 (9.0%) |
| $25,000 to $49,999 | 119,713 (88.4%) | 15,699 (11.6%) |
| $50,000 to $74,999 | 89,826 (89.2%) | 10,853 (10.8%) |
| $75,000 to $99,999 | 68,022 (90.6%) | 7,048 (9.4%) |
| $100,000 and over | 127,447 (92.9%) | 9,717 (7.1%) |
Public vs Private Health Insurance Coverage by Age in Milwaukee
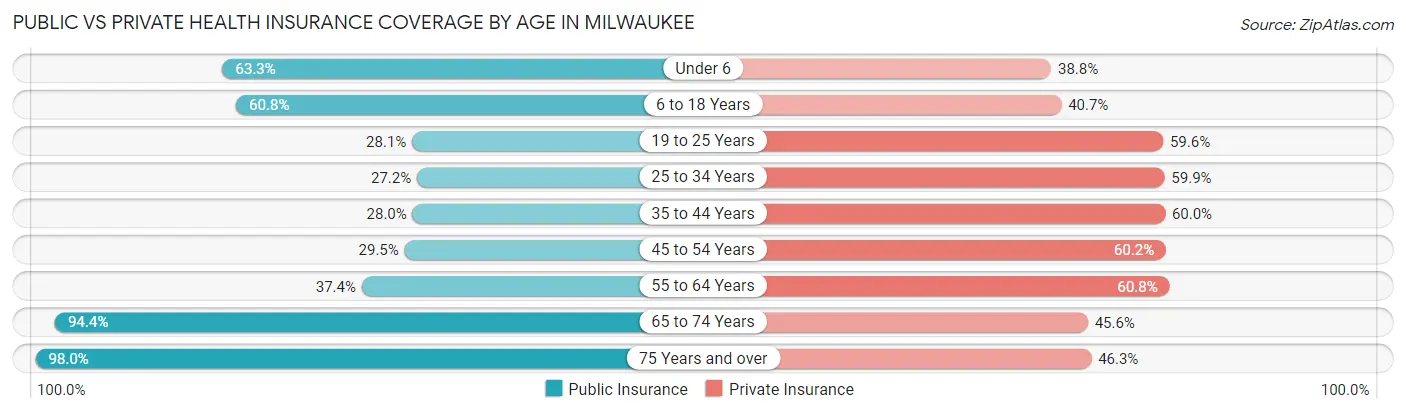
| Age Bracket | Public Insurance | Private Insurance |
| Under 6 | 30,996 (63.3%) | 19,023 (38.8%) |
| 6 to 18 Years | 65,823 (60.8%) | 44,120 (40.7%) |
| 19 to 25 Years | 19,239 (28.1%) | 40,885 (59.6%) |
| 25 to 34 Years | 23,555 (27.2%) | 51,927 (59.9%) |
| 35 to 44 Years | 20,494 (28.0%) | 43,932 (60.0%) |
| 45 to 54 Years | 17,905 (29.5%) | 36,588 (60.2%) |
| 55 to 64 Years | 22,163 (37.4%) | 36,023 (60.8%) |
| 65 to 74 Years | 37,272 (94.4%) | 18,031 (45.6%) |
| 75 Years and over | 23,254 (98.0%) | 10,986 (46.3%) |
| Total | 260,701 (45.8%) | 301,515 (53.0%) |
Disability Status by Sex by Age in Milwaukee
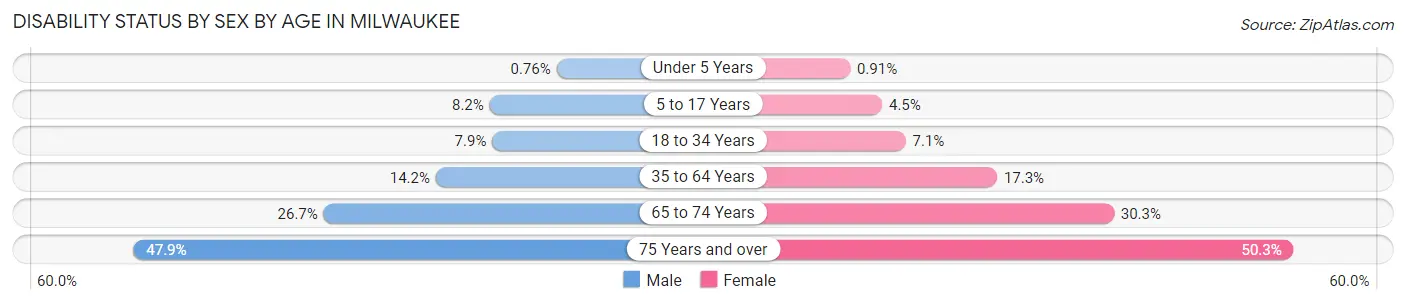
| Age Bracket | Male | Female |
| Under 5 Years | 160 (0.8%) | 184 (0.9%) |
| 5 to 17 Years | 4,465 (8.2%) | 2,308 (4.5%) |
| 18 to 34 Years | 6,404 (7.9%) | 6,021 (7.1%) |
| 35 to 64 Years | 13,125 (14.2%) | 17,429 (17.3%) |
| 65 to 74 Years | 4,949 (26.7%) | 6,352 (30.3%) |
| 75 Years and over | 4,388 (47.9%) | 7,329 (50.3%) |
Disability Class by Sex by Age in Milwaukee
Disability Class: Hearing Difficulty
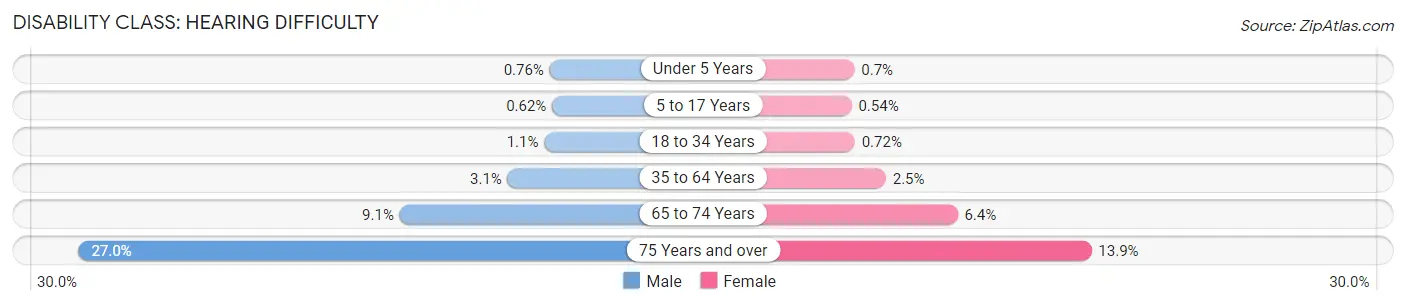
| Age Bracket | Male | Female |
| Under 5 Years | 160 (0.8%) | 142 (0.7%) |
| 5 to 17 Years | 338 (0.6%) | 279 (0.5%) |
| 18 to 34 Years | 860 (1.1%) | 610 (0.7%) |
| 35 to 64 Years | 2,868 (3.1%) | 2,474 (2.5%) |
| 65 to 74 Years | 1,688 (9.1%) | 1,351 (6.4%) |
| 75 Years and over | 2,475 (27.0%) | 2,025 (13.9%) |
Disability Class: Vision Difficulty
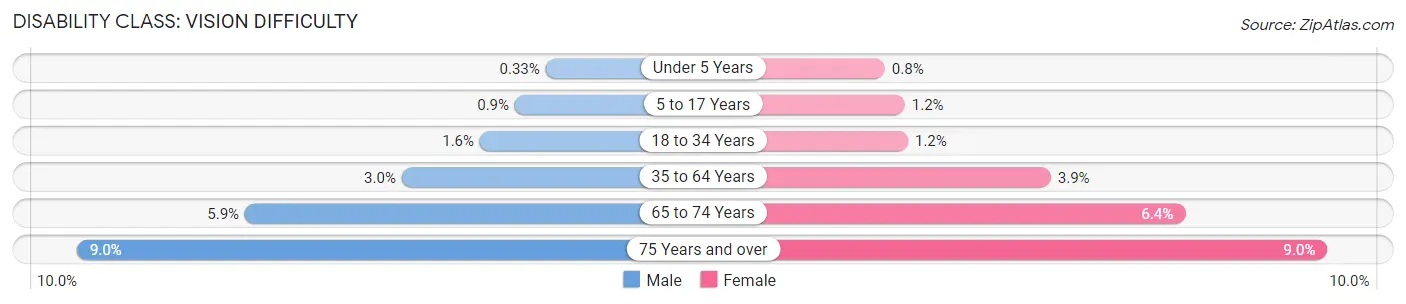
| Age Bracket | Male | Female |
| Under 5 Years | 69 (0.3%) | 161 (0.8%) |
| 5 to 17 Years | 487 (0.9%) | 603 (1.2%) |
| 18 to 34 Years | 1,257 (1.5%) | 1,041 (1.2%) |
| 35 to 64 Years | 2,770 (3.0%) | 3,911 (3.9%) |
| 65 to 74 Years | 1,095 (5.9%) | 1,336 (6.4%) |
| 75 Years and over | 828 (9.0%) | 1,312 (9.0%) |
Disability Class: Cognitive Difficulty

| Age Bracket | Male | Female |
| 5 to 17 Years | 3,649 (6.7%) | 1,563 (3.0%) |
| 18 to 34 Years | 4,435 (5.5%) | 3,887 (4.6%) |
| 35 to 64 Years | 5,901 (6.4%) | 6,730 (6.7%) |
| 65 to 74 Years | 1,174 (6.3%) | 1,260 (6.0%) |
| 75 Years and over | 1,036 (11.3%) | 1,823 (12.5%) |
Disability Class: Ambulatory Difficulty
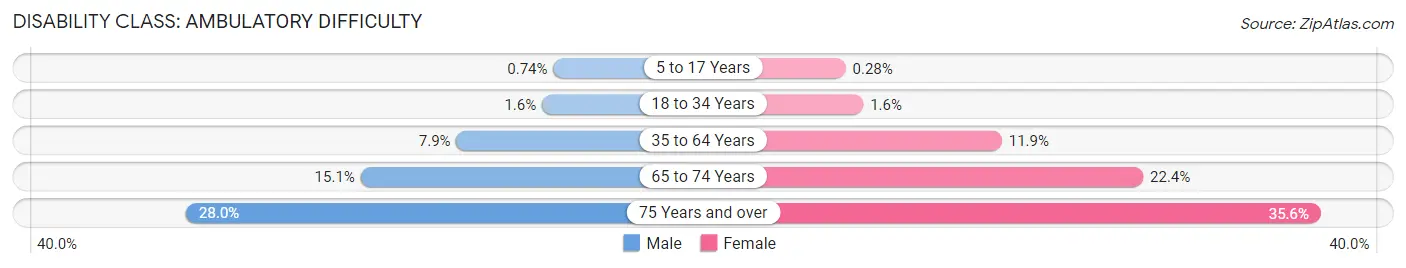
| Age Bracket | Male | Female |
| 5 to 17 Years | 400 (0.7%) | 144 (0.3%) |
| 18 to 34 Years | 1,276 (1.6%) | 1,346 (1.6%) |
| 35 to 64 Years | 7,336 (7.9%) | 11,984 (11.9%) |
| 65 to 74 Years | 2,789 (15.0%) | 4,690 (22.4%) |
| 75 Years and over | 2,568 (28.0%) | 5,181 (35.6%) |
Disability Class: Self-Care Difficulty
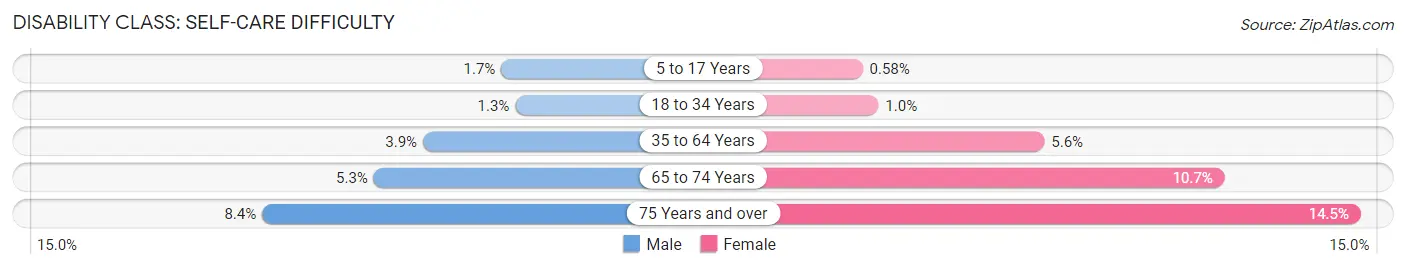
| Age Bracket | Male | Female |
| 5 to 17 Years | 940 (1.7%) | 301 (0.6%) |
| 18 to 34 Years | 1,085 (1.3%) | 866 (1.0%) |
| 35 to 64 Years | 3,614 (3.9%) | 5,688 (5.6%) |
| 65 to 74 Years | 979 (5.3%) | 2,235 (10.7%) |
| 75 Years and over | 769 (8.4%) | 2,105 (14.4%) |
Technology Access in Milwaukee
Computing Device Access in Milwaukee

| Device Type | # Households | % Households |
| Desktop or Laptop | 159,293 | 69.0% |
| Smartphone | 197,474 | 85.6% |
| Tablet | 123,672 | 53.6% |
| No Computing Device | 20,002 | 8.7% |
| Total | 230,759 | 100.0% |
Internet Access in Milwaukee
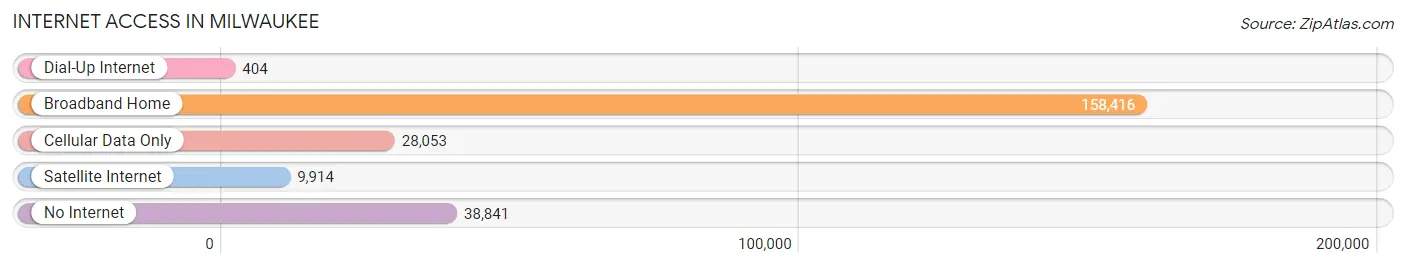
| Internet Type | # Households | % Households |
| Dial-Up Internet | 404 | 0.2% |
| Broadband Home | 158,416 | 68.6% |
| Cellular Data Only | 28,053 | 12.2% |
| Satellite Internet | 9,914 | 4.3% |
| No Internet | 38,841 | 16.8% |
| Total | 230,759 | 100.0% |
Milwaukee Summary
Milwaukee, Wisconsin is a city located in the southeastern corner of the state, on the western shore of Lake Michigan. It is the largest city in Wisconsin and the fifth-largest city in the Midwest. Milwaukee is known for its brewing industry, its diverse cultural heritage, and its vibrant music and art scenes.
History
The area that is now Milwaukee was first inhabited by Native American tribes, including the Potawatomi, Menominee, and Ho-Chunk. The first Europeans to settle in the area were French fur traders in the late 1600s. The city of Milwaukee was founded in 1846 by German immigrants, who named it after the Algonquin word for “gathering place by the water.”
In the late 1800s, Milwaukee became a major industrial center, with a large number of factories and breweries. The city was also a major center of immigration, with many immigrants from Germany, Poland, and other European countries.
In the early 1900s, Milwaukee was a major center of the labor movement, with a number of strikes and protests. The city was also a major center of the civil rights movement, with a number of protests and marches.
Geography
Milwaukee is located in the southeastern corner of Wisconsin, on the western shore of Lake Michigan. The city is situated on the Milwaukee River, which flows into the lake. The city is surrounded by several suburbs, including Wauwatosa, West Allis, and Glendale.
The city has a total area of 96.1 square miles, of which 87.3 square miles is land and 8.8 square miles is water. The city has a humid continental climate, with cold winters and hot, humid summers.
Economy
Milwaukee’s economy is largely based on manufacturing, with a number of large companies based in the city. The city is home to several major corporations, including Harley-Davidson, MillerCoors, and Johnson Controls. The city is also a major center of the health care industry, with a number of hospitals and medical centers.
The city is also a major center of tourism, with a number of attractions, including the Milwaukee Art Museum, the Milwaukee County Zoo, and the Milwaukee Public Museum.
Demographics
As of the 2010 census, Milwaukee had a population of 594,833. The city is racially and ethnically diverse, with a majority of the population being white (53.3%), followed by African American (38.2%), Hispanic or Latino (7.2%), and Asian (2.2%).
The median household income in Milwaukee is $37,724, and the median home value is $118,400. The city has a poverty rate of 28.2%, and the unemployment rate is 8.2%.
Conclusion
Milwaukee is a vibrant city with a rich history and a diverse population. The city is a major center of industry, tourism, and culture, and it is home to a number of major corporations and attractions. The city has a diverse economy and a diverse population, and it is a great place to live and work.
Common Questions
What is Per Capita Income in Milwaukee?
Per Capita income in Milwaukee is $28,079.
What is the Median Family Income in Milwaukee?
Median Family Income in Milwaukee is $57,900.
What is the Median Household income in Milwaukee?
Median Household Income in Milwaukee is $49,733.
What is Income or Wage Gap in Milwaukee?
Income or Wage Gap in Milwaukee is 17.6%.
Women in Milwaukee earn 82.4 cents for every dollar earned by a man.
What is Family Income Deficit in Milwaukee?
Family Income Deficit in Milwaukee is $11,086.
Families that are below poverty line in Milwaukee earn $11,086 less on average than the poverty threshold level.
What is Inequality or Gini Index in Milwaukee?
Inequality or Gini Index in Milwaukee is 0.47.
What is the Total Population of Milwaukee?
Total Population of Milwaukee is 573,299.
What is the Total Male Population of Milwaukee?
Total Male Population of Milwaukee is 278,825.
What is the Total Female Population of Milwaukee?
Total Female Population of Milwaukee is 294,474.
What is the Ratio of Males per 100 Females in Milwaukee?
There are 94.69 Males per 100 Females in Milwaukee.
What is the Ratio of Females per 100 Males in Milwaukee?
There are 105.61 Females per 100 Males in Milwaukee.
What is the Median Population Age in Milwaukee?
Median Population Age in Milwaukee is 31.8 Years.
What is the Average Family Size in Milwaukee
Average Family Size in Milwaukee is 3.3 People.
What is the Average Household Size in Milwaukee
Average Household Size in Milwaukee is 2.4 People.
How Large is the Labor Force in Milwaukee?
There are 282,388 People in the Labor Forcein in Milwaukee.
What is the Percentage of People in the Labor Force in Milwaukee?
64.0% of People are in the Labor Force in Milwaukee.
What is the Unemployment Rate in Milwaukee?
Unemployment Rate in Milwaukee is 5.9%.