Waterbury, CT Map & Demographics
Waterbury Map
Waterbury Overview
$28,723
PER CAPITA INCOME
$64,116
AVG FAMILY INCOME
$51,451
AVG HOUSEHOLD INCOME
21.2%
WAGE / INCOME GAP [ % ]
78.8¢/ $1
WAGE / INCOME GAP [ $ ]
$11,309
FAMILY INCOME DEFICIT
0.47
INEQUALITY / GINI INDEX
114,480
TOTAL POPULATION
55,072
MALE POPULATION
59,408
FEMALE POPULATION
92.70
MALES / 100 FEMALES
107.87
FEMALES / 100 MALES
36.7
MEDIAN AGE
3.1
AVG FAMILY SIZE
2.5
AVG HOUSEHOLD SIZE
56,236
LABOR FORCE [ PEOPLE ]
61.7%
PERCENT IN LABOR FORCE
9.8%
UNEMPLOYMENT RATE
Income in Waterbury
Income Overview in Waterbury
Per Capita Income in Waterbury is $28,723, while median incomes of families and households are $64,116 and $51,451 respectively.
| Characteristic | Number | Measure |
| Per Capita Income | 114,480 | $28,723 |
| Median Family Income | 27,583 | $64,116 |
| Mean Family Income | 27,583 | $79,824 |
| Median Household Income | 45,968 | $51,451 |
| Mean Household Income | 45,968 | $69,383 |
| Income Deficit | 27,583 | $11,309 |
| Wage / Income Gap (%) | 114,480 | 21.18% |
| Wage / Income Gap ($) | 114,480 | 78.82¢ per $1 |
| Gini / Inequality Index | 114,480 | 0.47 |
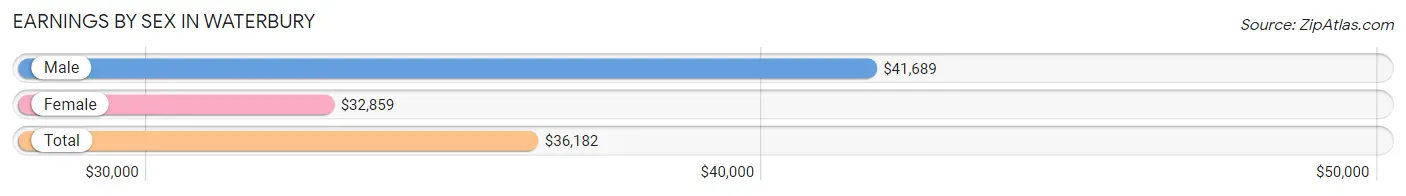
Earnings by Sex in Waterbury
Average Earnings in Waterbury are $36,182, $41,689 for men and $32,859 for women, a difference of 21.2%.
| Sex | Number | Average Earnings |
| Male | 27,818 (49.5%) | $41,689 |
| Female | 28,383 (50.5%) | $32,859 |
| Total | 56,201 (100.0%) | $36,182 |
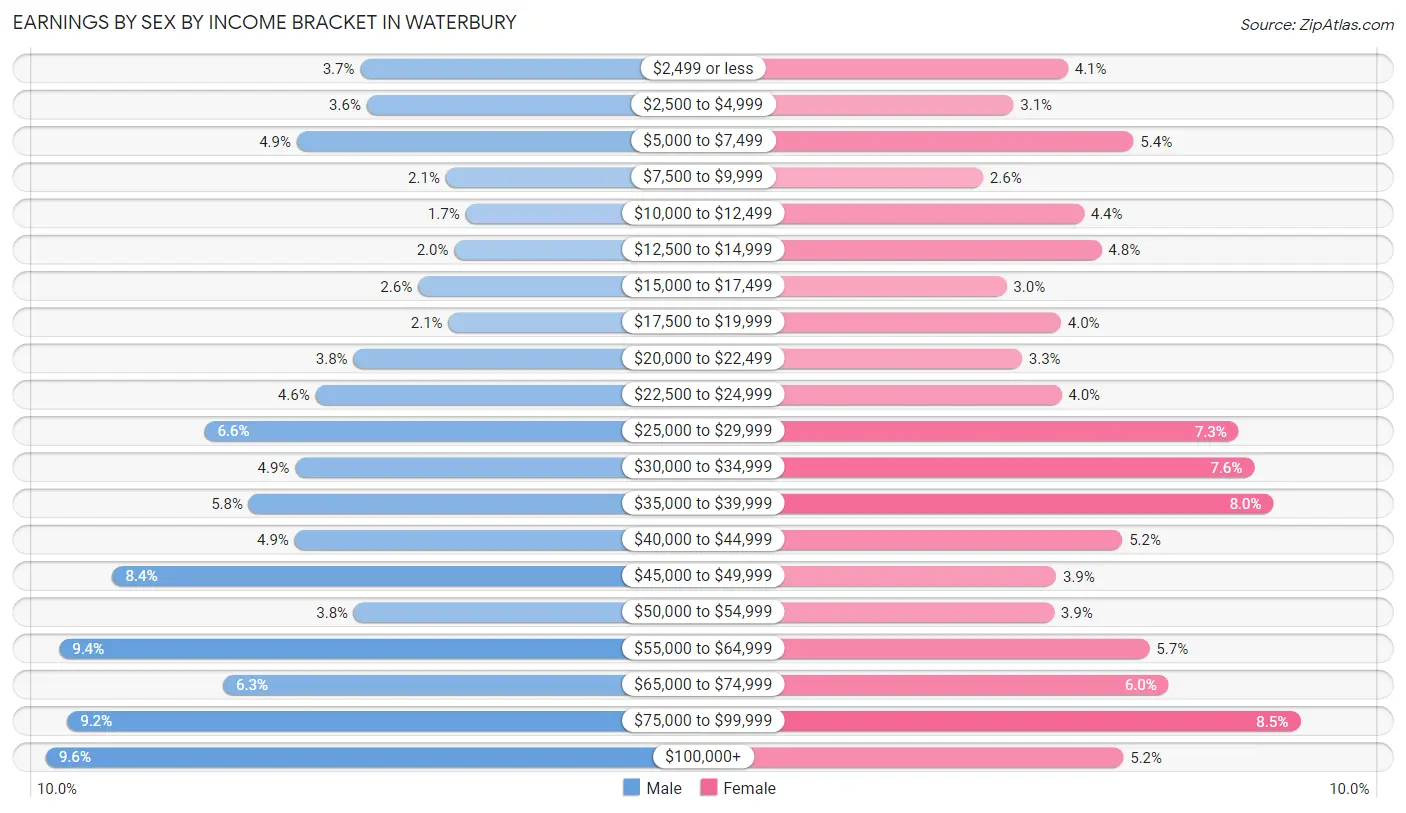
Earnings by Sex by Income Bracket in Waterbury
The most common earnings brackets in Waterbury are $100,000+ for men (2,671 | 9.6%) and $75,000 to $99,999 for women (2,410 | 8.5%).
| Income | Male | Female |
| $2,499 or less | 1,033 (3.7%) | 1,176 (4.1%) |
| $2,500 to $4,999 | 999 (3.6%) | 885 (3.1%) |
| $5,000 to $7,499 | 1,362 (4.9%) | 1,525 (5.4%) |
| $7,500 to $9,999 | 587 (2.1%) | 723 (2.5%) |
| $10,000 to $12,499 | 484 (1.7%) | 1,260 (4.4%) |
| $12,500 to $14,999 | 543 (1.9%) | 1,355 (4.8%) |
| $15,000 to $17,499 | 732 (2.6%) | 849 (3.0%) |
| $17,500 to $19,999 | 573 (2.1%) | 1,138 (4.0%) |
| $20,000 to $22,499 | 1,069 (3.8%) | 931 (3.3%) |
| $22,500 to $24,999 | 1,267 (4.5%) | 1,141 (4.0%) |
| $25,000 to $29,999 | 1,843 (6.6%) | 2,083 (7.3%) |
| $30,000 to $34,999 | 1,372 (4.9%) | 2,167 (7.6%) |
| $35,000 to $39,999 | 1,614 (5.8%) | 2,269 (8.0%) |
| $40,000 to $44,999 | 1,374 (4.9%) | 1,465 (5.2%) |
| $45,000 to $49,999 | 2,323 (8.4%) | 1,113 (3.9%) |
| $50,000 to $54,999 | 1,065 (3.8%) | 1,101 (3.9%) |
| $55,000 to $64,999 | 2,600 (9.3%) | 1,610 (5.7%) |
| $65,000 to $74,999 | 1,748 (6.3%) | 1,712 (6.0%) |
| $75,000 to $99,999 | 2,559 (9.2%) | 2,410 (8.5%) |
| $100,000+ | 2,671 (9.6%) | 1,470 (5.2%) |
| Total | 27,818 (100.0%) | 28,383 (100.0%) |
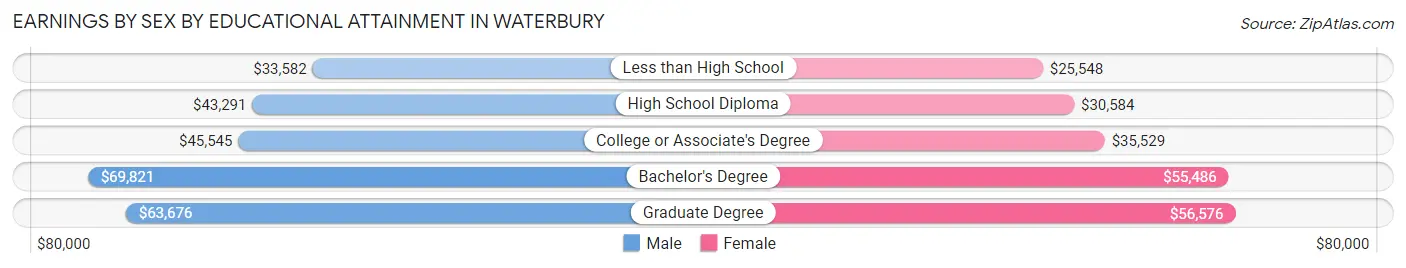
Earnings by Sex by Educational Attainment in Waterbury
Average earnings in Waterbury are $46,266 for men and $35,436 for women, a difference of 23.4%. Men with an educational attainment of bachelor's degree enjoy the highest average annual earnings of $69,821, while those with less than high school education earn the least with $33,582. Women with an educational attainment of graduate degree earn the most with the average annual earnings of $56,576, while those with less than high school education have the smallest earnings of $25,548.
| Educational Attainment | Male Income | Female Income |
| Less than High School | $33,582 | $25,548 |
| High School Diploma | $43,291 | $30,584 |
| College or Associate's Degree | $45,545 | $35,529 |
| Bachelor's Degree | $69,821 | $55,486 |
| Graduate Degree | $63,676 | $56,576 |
| Total | $46,266 | $35,436 |
Family Income in Waterbury
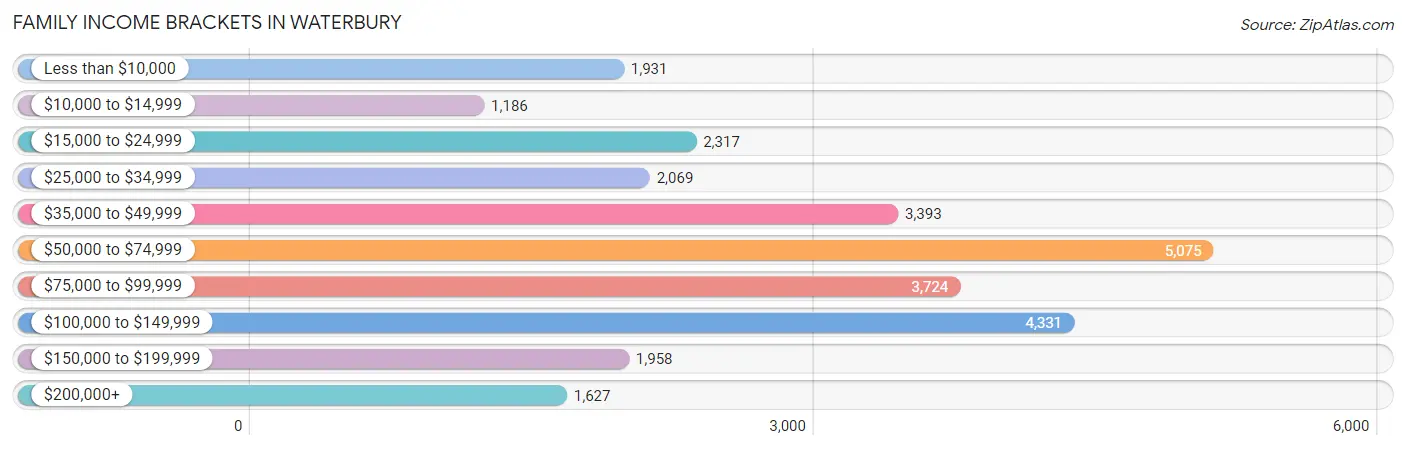
Family Income Brackets in Waterbury
According to the Waterbury family income data, there are 5,075 families falling into the $50,000 to $74,999 income range, which is the most common income bracket and makes up 18.4% of all families. Conversely, the $10,000 to $14,999 income bracket is the least frequent group with only 1,186 families (4.3%) belonging to this category.
| Income Bracket | # Families | % Families |
| Less than $10,000 | 1,931 | 7.0% |
| $10,000 to $14,999 | 1,186 | 4.3% |
| $15,000 to $24,999 | 2,317 | 8.4% |
| $25,000 to $34,999 | 2,069 | 7.5% |
| $35,000 to $49,999 | 3,393 | 12.3% |
| $50,000 to $74,999 | 5,075 | 18.4% |
| $75,000 to $99,999 | 3,724 | 13.5% |
| $100,000 to $149,999 | 4,331 | 15.7% |
| $150,000 to $199,999 | 1,958 | 7.1% |
| $200,000+ | 1,627 | 5.9% |
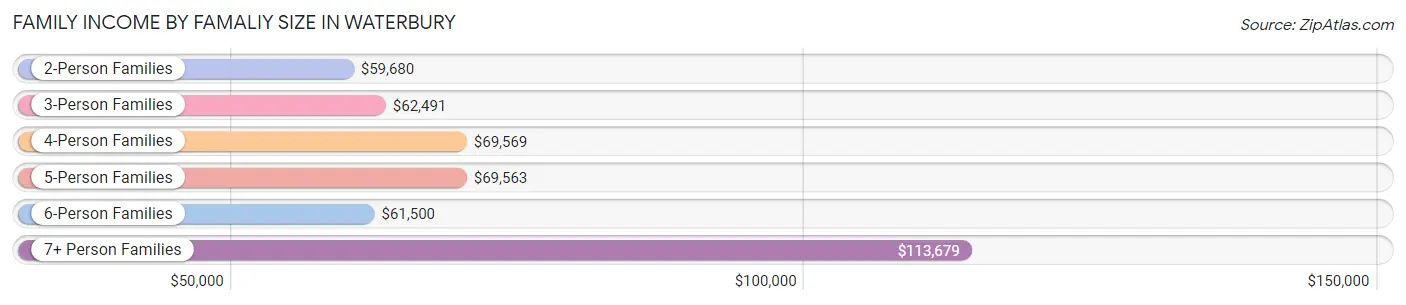
Family Income by Famaliy Size in Waterbury
7+ person families (485 | 1.8%) account for the highest median family income in Waterbury with $113,679 per family, while 2-person families (11,599 | 42.0%) have the highest median income of $29,840 per family member.
| Income Bracket | # Families | Median Income |
| 2-Person Families | 11,599 (42.0%) | $59,680 |
| 3-Person Families | 7,489 (27.2%) | $62,491 |
| 4-Person Families | 5,078 (18.4%) | $69,569 |
| 5-Person Families | 2,222 (8.1%) | $69,563 |
| 6-Person Families | 710 (2.6%) | $61,500 |
| 7+ Person Families | 485 (1.8%) | $113,679 |
| Total | 27,583 (100.0%) | $64,116 |
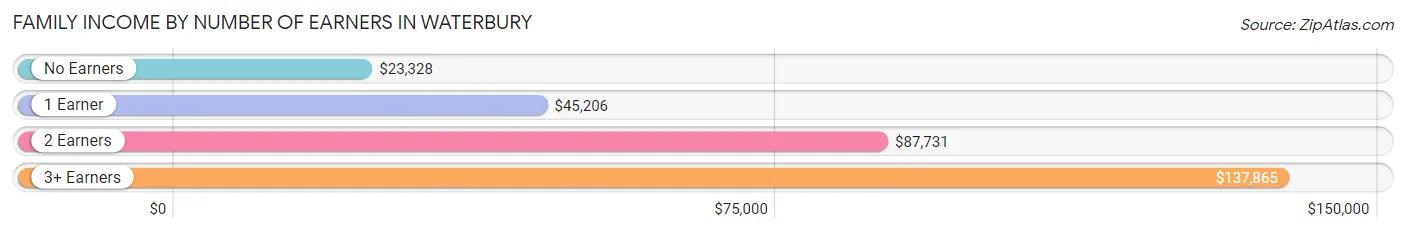
Family Income by Number of Earners in Waterbury
The median family income in Waterbury is $64,116, with families comprising 3+ earners (2,700) having the highest median family income of $137,865, while families with no earners (4,136) have the lowest median family income of $23,328, accounting for 9.8% and 15.0% of families, respectively.
| Number of Earners | # Families | Median Income |
| No Earners | 4,136 (15.0%) | $23,328 |
| 1 Earner | 11,208 (40.6%) | $45,206 |
| 2 Earners | 9,539 (34.6%) | $87,731 |
| 3+ Earners | 2,700 (9.8%) | $137,865 |
| Total | 27,583 (100.0%) | $64,116 |
Household Income in Waterbury
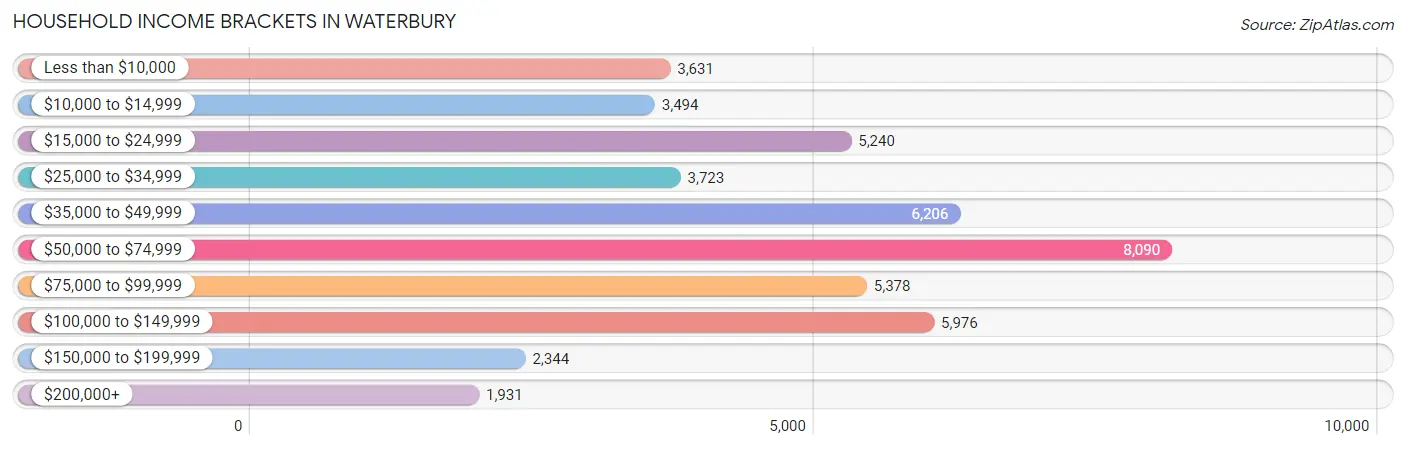
Household Income Brackets in Waterbury
With 8,090 households falling in the category, the $50,000 to $74,999 income range is the most frequent in Waterbury, accounting for 17.6% of all households. In contrast, only 1,931 households (4.2%) fall into the $200,000+ income bracket, making it the least populous group.
| Income Bracket | # Households | % Households |
| Less than $10,000 | 3,631 | 7.9% |
| $10,000 to $14,999 | 3,494 | 7.6% |
| $15,000 to $24,999 | 5,240 | 11.4% |
| $25,000 to $34,999 | 3,723 | 8.1% |
| $35,000 to $49,999 | 6,206 | 13.5% |
| $50,000 to $74,999 | 8,090 | 17.6% |
| $75,000 to $99,999 | 5,378 | 11.7% |
| $100,000 to $149,999 | 5,976 | 13.0% |
| $150,000 to $199,999 | 2,344 | 5.1% |
| $200,000+ | 1,931 | 4.2% |
Household Income by Householder Age in Waterbury
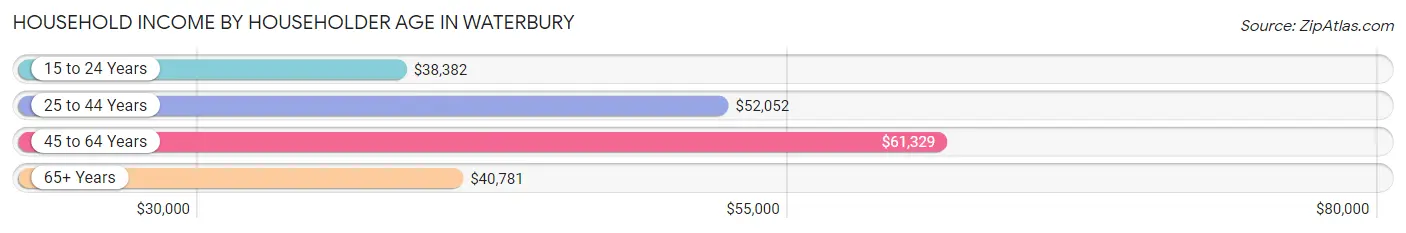
The median household income in Waterbury is $51,451, with the highest median household income of $61,329 found in the 45 to 64 years age bracket for the primary householder. A total of 18,255 households (39.7%) fall into this category. Meanwhile, the 15 to 24 years age bracket for the primary householder has the lowest median household income of $38,382, with 1,520 households (3.3%) in this group.
| Income Bracket | # Households | Median Income |
| 15 to 24 Years | 1,520 (3.3%) | $38,382 |
| 25 to 44 Years | 15,458 (33.6%) | $52,052 |
| 45 to 64 Years | 18,255 (39.7%) | $61,329 |
| 65+ Years | 10,735 (23.4%) | $40,781 |
| Total | 45,968 (100.0%) | $51,451 |
Poverty in Waterbury
Income Below Poverty by Sex and Age in Waterbury
With 20.4% poverty level for males and 23.3% for females among the residents of Waterbury, 15 year old males and 16 and 17 year old females are the most vulnerable to poverty, with 299 males (49.3%) and 495 females (41.3%) in their respective age groups living below the poverty level.
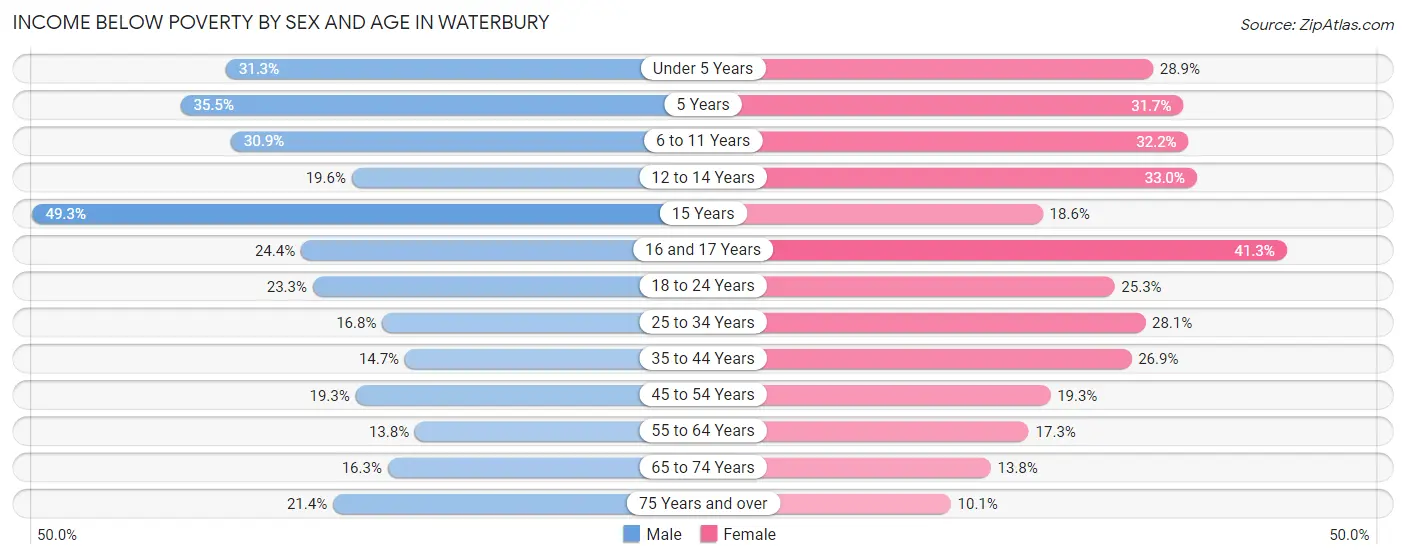
| Age Bracket | Male | Female |
| Under 5 Years | 1,106 (31.3%) | 937 (28.9%) |
| 5 Years | 361 (35.5%) | 251 (31.7%) |
| 6 to 11 Years | 1,303 (30.8%) | 1,228 (32.2%) |
| 12 to 14 Years | 425 (19.6%) | 725 (33.0%) |
| 15 Years | 299 (49.3%) | 181 (18.6%) |
| 16 and 17 Years | 344 (24.3%) | 495 (41.3%) |
| 18 to 24 Years | 1,390 (23.3%) | 1,430 (25.3%) |
| 25 to 34 Years | 1,364 (16.8%) | 2,470 (28.1%) |
| 35 to 44 Years | 937 (14.7%) | 1,949 (26.9%) |
| 45 to 54 Years | 1,331 (19.3%) | 1,541 (19.3%) |
| 55 to 64 Years | 1,009 (13.8%) | 1,301 (17.3%) |
| 65 to 74 Years | 649 (16.3%) | 698 (13.8%) |
| 75 Years and over | 516 (21.4%) | 398 (10.1%) |
| Total | 11,034 (20.4%) | 13,604 (23.3%) |
Income Above Poverty by Sex and Age in Waterbury
According to the poverty statistics in Waterbury, males aged 55 to 64 years and females aged 75 years and over are the age groups that are most secure financially, with 86.2% of males and 89.9% of females in these age groups living above the poverty line.
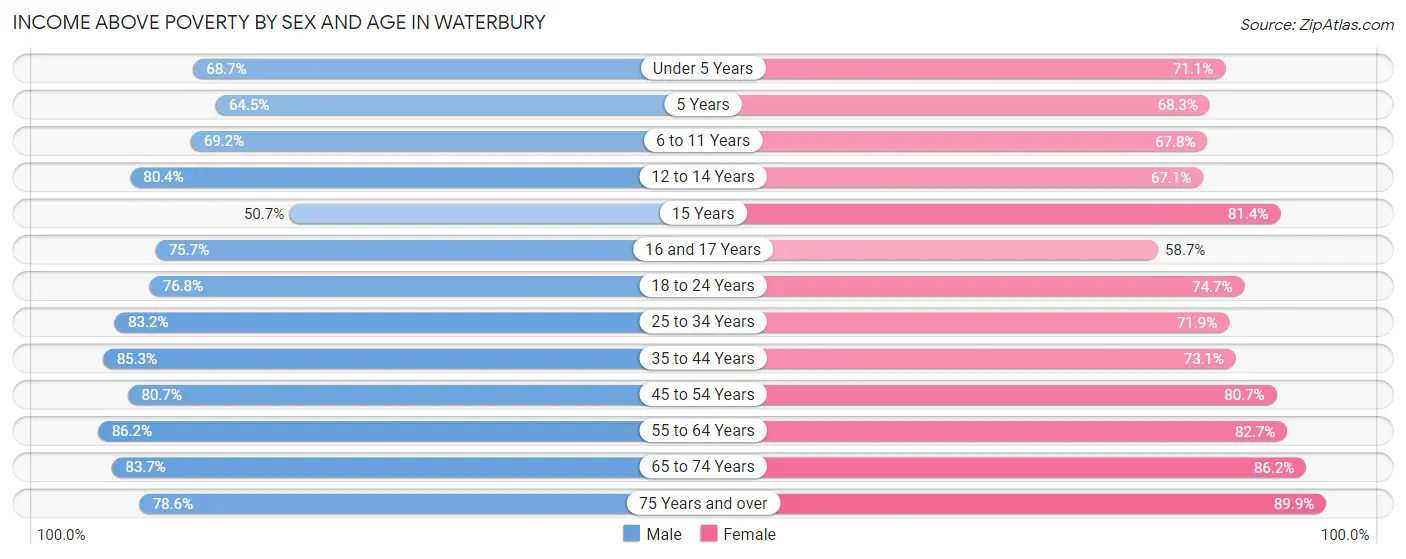
| Age Bracket | Male | Female |
| Under 5 Years | 2,425 (68.7%) | 2,310 (71.1%) |
| 5 Years | 655 (64.5%) | 541 (68.3%) |
| 6 to 11 Years | 2,920 (69.2%) | 2,589 (67.8%) |
| 12 to 14 Years | 1,739 (80.4%) | 1,475 (67.0%) |
| 15 Years | 308 (50.7%) | 790 (81.4%) |
| 16 and 17 Years | 1,069 (75.6%) | 704 (58.7%) |
| 18 to 24 Years | 4,589 (76.7%) | 4,223 (74.7%) |
| 25 to 34 Years | 6,752 (83.2%) | 6,307 (71.9%) |
| 35 to 44 Years | 5,437 (85.3%) | 5,308 (73.1%) |
| 45 to 54 Years | 5,570 (80.7%) | 6,429 (80.7%) |
| 55 to 64 Years | 6,317 (86.2%) | 6,201 (82.7%) |
| 65 to 74 Years | 3,333 (83.7%) | 4,358 (86.2%) |
| 75 Years and over | 1,898 (78.6%) | 3,541 (89.9%) |
| Total | 43,012 (79.6%) | 44,776 (76.7%) |
Income Below Poverty Among Married-Couple Families in Waterbury
The poverty statistics for married-couple families in Waterbury show that 8.6% or 1,226 of the total 14,291 families live below the poverty line. Families with 5 or more children have the highest poverty rate of 18.6%, comprising of 31 families. On the other hand, families with no children have the lowest poverty rate of 5.5%, which includes 453 families.
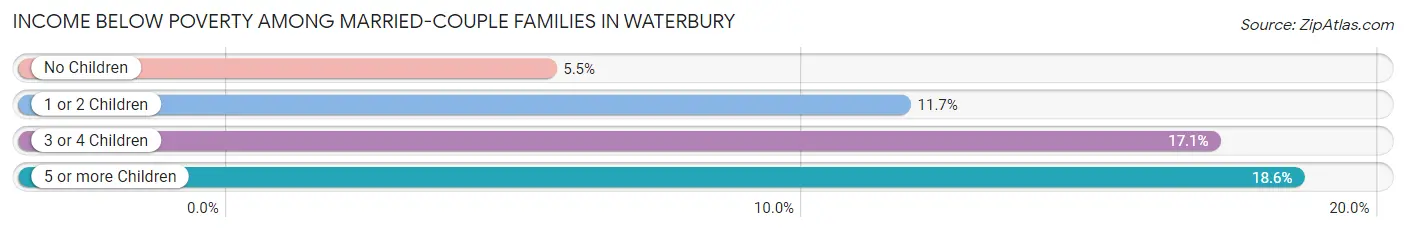
| Children | Above Poverty | Below Poverty |
| No Children | 7,724 (94.5%) | 453 (5.5%) |
| 1 or 2 Children | 4,507 (88.3%) | 598 (11.7%) |
| 3 or 4 Children | 698 (82.9%) | 144 (17.1%) |
| 5 or more Children | 136 (81.4%) | 31 (18.6%) |
| Total | 13,065 (91.4%) | 1,226 (8.6%) |
Income Below Poverty Among Single-Parent Households in Waterbury
According to the poverty data in Waterbury, 19.5% or 606 single-father households and 32.0% or 3,260 single-mother households are living below the poverty line. Among single-father households, those with 5 or more children have the highest poverty rate, with 29 households (78.4%) experiencing poverty. Likewise, among single-mother households, those with 5 or more children have the highest poverty rate, with 43 households (100.0%) falling below the poverty line.
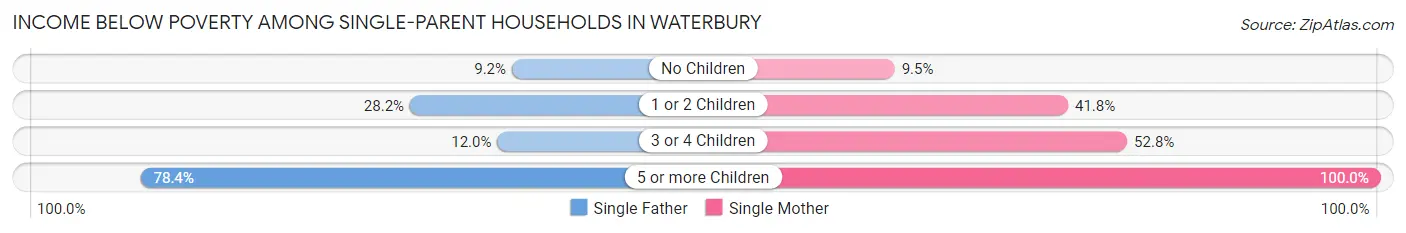
| Children | Single Father | Single Mother |
| No Children | 113 (9.2%) | 333 (9.5%) |
| 1 or 2 Children | 420 (28.2%) | 2,347 (41.8%) |
| 3 or 4 Children | 44 (12.0%) | 537 (52.8%) |
| 5 or more Children | 29 (78.4%) | 43 (100.0%) |
| Total | 606 (19.5%) | 3,260 (32.0%) |
Income Below Poverty Among Married-Couple vs Single-Parent Households in Waterbury
The poverty data for Waterbury shows that 1,226 of the married-couple family households (8.6%) and 3,866 of the single-parent households (29.1%) are living below the poverty level. Within the married-couple family households, those with 5 or more children have the highest poverty rate, with 31 households (18.6%) falling below the poverty line. Among the single-parent households, those with 5 or more children have the highest poverty rate, with 72 household (90.0%) living below poverty.
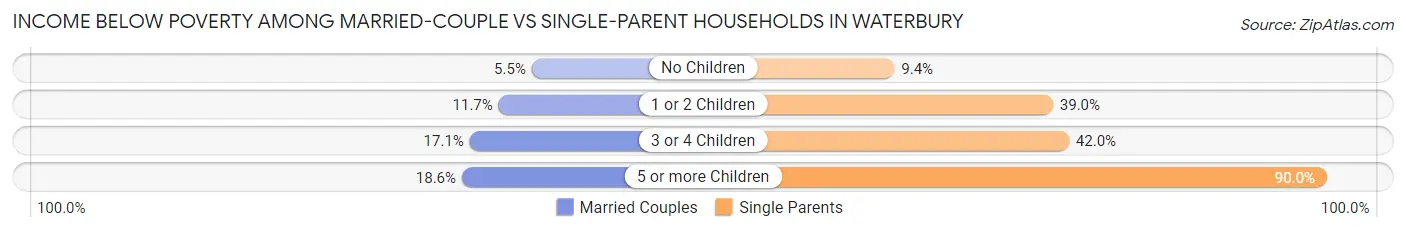
| Children | Married-Couple Families | Single-Parent Households |
| No Children | 453 (5.5%) | 446 (9.4%) |
| 1 or 2 Children | 598 (11.7%) | 2,767 (39.0%) |
| 3 or 4 Children | 144 (17.1%) | 581 (41.9%) |
| 5 or more Children | 31 (18.6%) | 72 (90.0%) |
| Total | 1,226 (8.6%) | 3,866 (29.1%) |
Race in Waterbury
The most populous races in Waterbury are White / Caucasian (51,376 | 44.9%), Hispanic or Latino (41,055 | 35.9%), and Black / African American (32,046 | 28.0%).
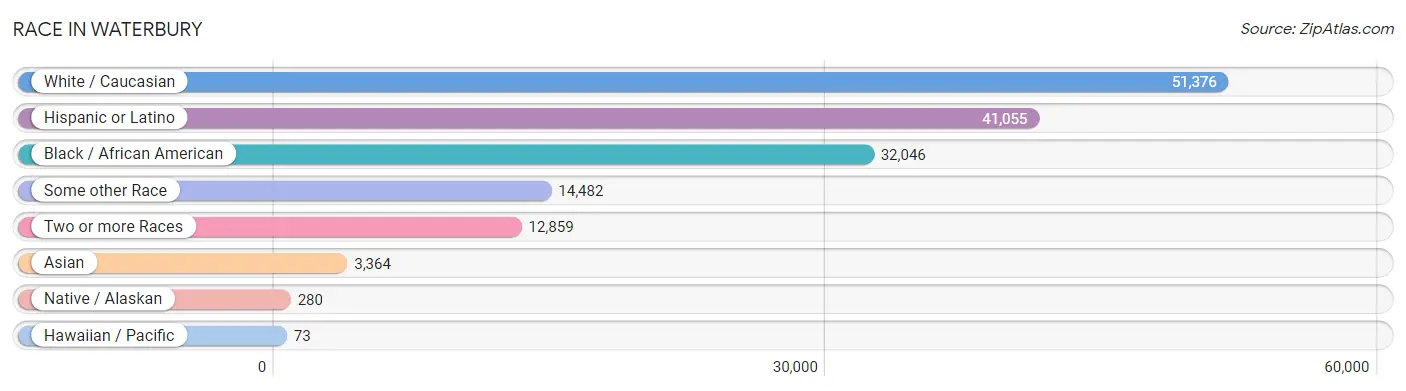
| Race | # Population | % Population |
| Asian | 3,364 | 2.9% |
| Black / African American | 32,046 | 28.0% |
| Hawaiian / Pacific | 73 | 0.1% |
| Hispanic or Latino | 41,055 | 35.9% |
| Native / Alaskan | 280 | 0.2% |
| White / Caucasian | 51,376 | 44.9% |
| Two or more Races | 12,859 | 11.2% |
| Some other Race | 14,482 | 12.7% |
| Total | 114,480 | 100.0% |
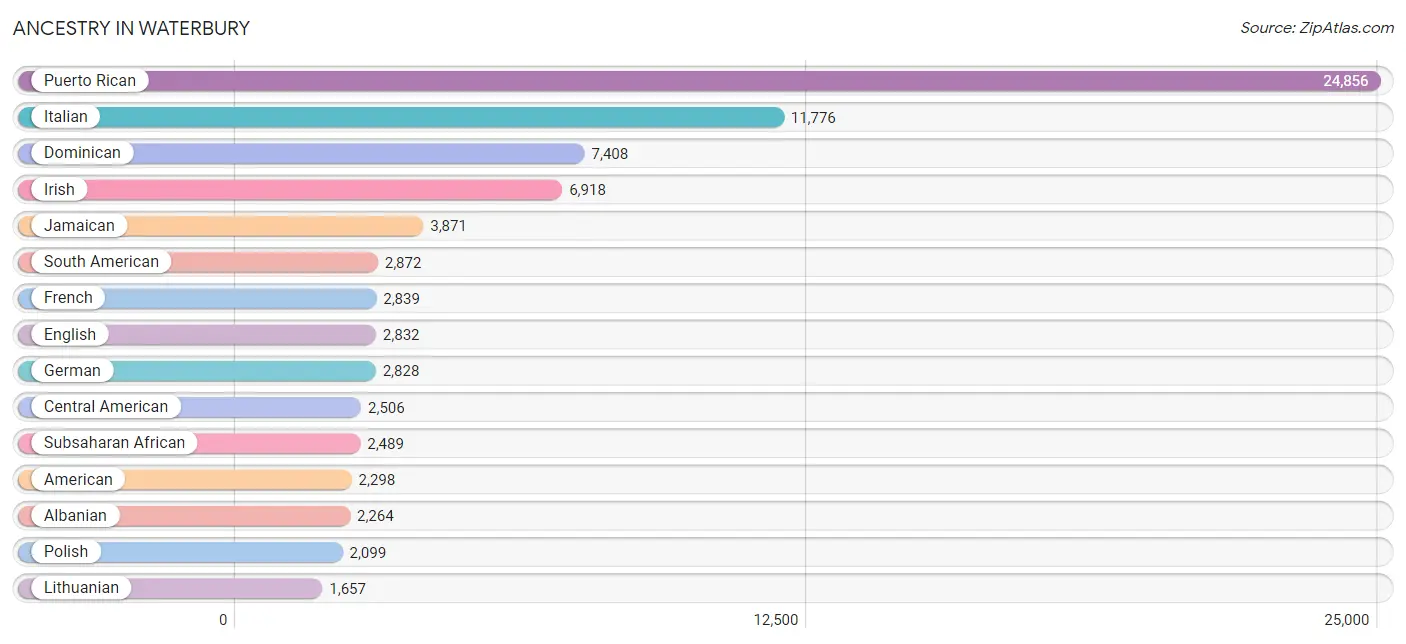
Ancestry in Waterbury
The most populous ancestries reported in Waterbury are Puerto Rican (24,856 | 21.7%), Italian (11,776 | 10.3%), Dominican (7,408 | 6.5%), Irish (6,918 | 6.0%), and Jamaican (3,871 | 3.4%), together accounting for 47.9% of all Waterbury residents.
| Ancestry | # Population | % Population |
| Afghan | 42 | 0.0% |
| African | 1,010 | 0.9% |
| Albanian | 2,264 | 2.0% |
| American | 2,298 | 2.0% |
| Arab | 360 | 0.3% |
| Argentinean | 45 | 0.0% |
| Armenian | 81 | 0.1% |
| Assyrian / Chaldean / Syriac | 15 | 0.0% |
| Australian | 4 | 0.0% |
| Austrian | 110 | 0.1% |
| Bahamian | 30 | 0.0% |
| Barbadian | 43 | 0.0% |
| Belgian | 25 | 0.0% |
| Bhutanese | 90 | 0.1% |
| Blackfeet | 18 | 0.0% |
| Brazilian | 1,323 | 1.2% |
| British | 156 | 0.1% |
| British West Indian | 743 | 0.6% |
| Burmese | 55 | 0.1% |
| Canadian | 276 | 0.2% |
| Cape Verdean | 929 | 0.8% |
| Central American | 2,506 | 2.2% |
| Central American Indian | 95 | 0.1% |
| Cherokee | 303 | 0.3% |
| Cheyenne | 7 | 0.0% |
| Chilean | 99 | 0.1% |
| Colombian | 732 | 0.6% |
| Cree | 19 | 0.0% |
| Croatian | 5 | 0.0% |
| Cuban | 345 | 0.3% |
| Cypriot | 18 | 0.0% |
| Czech | 125 | 0.1% |
| Danish | 23 | 0.0% |
| Dominican | 7,408 | 6.5% |
| Dutch | 266 | 0.2% |
| Dutch West Indian | 10 | 0.0% |
| Eastern European | 88 | 0.1% |
| Ecuadorian | 1,630 | 1.4% |
| English | 2,832 | 2.5% |
| Estonian | 64 | 0.1% |
| Ethiopian | 19 | 0.0% |
| European | 522 | 0.5% |
| Finnish | 44 | 0.0% |
| French | 2,839 | 2.5% |
| French Canadian | 1,100 | 1.0% |
| German | 2,828 | 2.5% |
| German Russian | 9 | 0.0% |
| Greek | 105 | 0.1% |
| Guamanian / Chamorro | 75 | 0.1% |
| Guatemalan | 1,257 | 1.1% |
| Guyanese | 823 | 0.7% |
| Haitian | 464 | 0.4% |
| Honduran | 666 | 0.6% |
| Hungarian | 238 | 0.2% |
| Indian (Asian) | 505 | 0.4% |
| Iranian | 9 | 0.0% |
| Irish | 6,918 | 6.0% |
| Israeli | 156 | 0.1% |
| Italian | 11,776 | 10.3% |
| Jamaican | 3,871 | 3.4% |
| Japanese | 43 | 0.0% |
| Jordanian | 75 | 0.1% |
| Korean | 278 | 0.2% |
| Lebanese | 153 | 0.1% |
| Liberian | 24 | 0.0% |
| Lithuanian | 1,657 | 1.5% |
| Macedonian | 29 | 0.0% |
| Malaysian | 11 | 0.0% |
| Mexican | 1,328 | 1.2% |
| Mexican American Indian | 26 | 0.0% |
| Moroccan | 21 | 0.0% |
| Nicaraguan | 62 | 0.1% |
| Nigerian | 341 | 0.3% |
| Northern European | 19 | 0.0% |
| Norwegian | 22 | 0.0% |
| Palestinian | 15 | 0.0% |
| Panamanian | 212 | 0.2% |
| Paraguayan | 8 | 0.0% |
| Pennsylvania German | 8 | 0.0% |
| Peruvian | 162 | 0.1% |
| Polish | 2,099 | 1.8% |
| Portuguese | 1,402 | 1.2% |
| Puerto Rican | 24,856 | 21.7% |
| Puget Sound Salish | 47 | 0.0% |
| Romanian | 13 | 0.0% |
| Russian | 649 | 0.6% |
| Salvadoran | 309 | 0.3% |
| Scandinavian | 40 | 0.0% |
| Scotch-Irish | 35 | 0.0% |
| Scottish | 291 | 0.3% |
| Serbian | 3 | 0.0% |
| Sioux | 48 | 0.0% |
| Slavic | 22 | 0.0% |
| Slovak | 54 | 0.1% |
| South American | 2,872 | 2.5% |
| South American Indian | 58 | 0.1% |
| Spaniard | 146 | 0.1% |
| Spanish | 25 | 0.0% |
| Spanish American | 12 | 0.0% |
| Sri Lankan | 244 | 0.2% |
| Subsaharan African | 2,489 | 2.2% |
| Swedish | 420 | 0.4% |
| Swiss | 62 | 0.1% |
| Syrian | 4 | 0.0% |
| Thai | 1,619 | 1.4% |
| Trinidadian and Tobagonian | 469 | 0.4% |
| Turkish | 36 | 0.0% |
| U.S. Virgin Islander | 15 | 0.0% |
| Ugandan | 23 | 0.0% |
| Ukrainian | 155 | 0.1% |
| Venezuelan | 187 | 0.2% |
| Welsh | 13 | 0.0% |
| West Indian | 1,234 | 1.1% | View All 113 Rows |
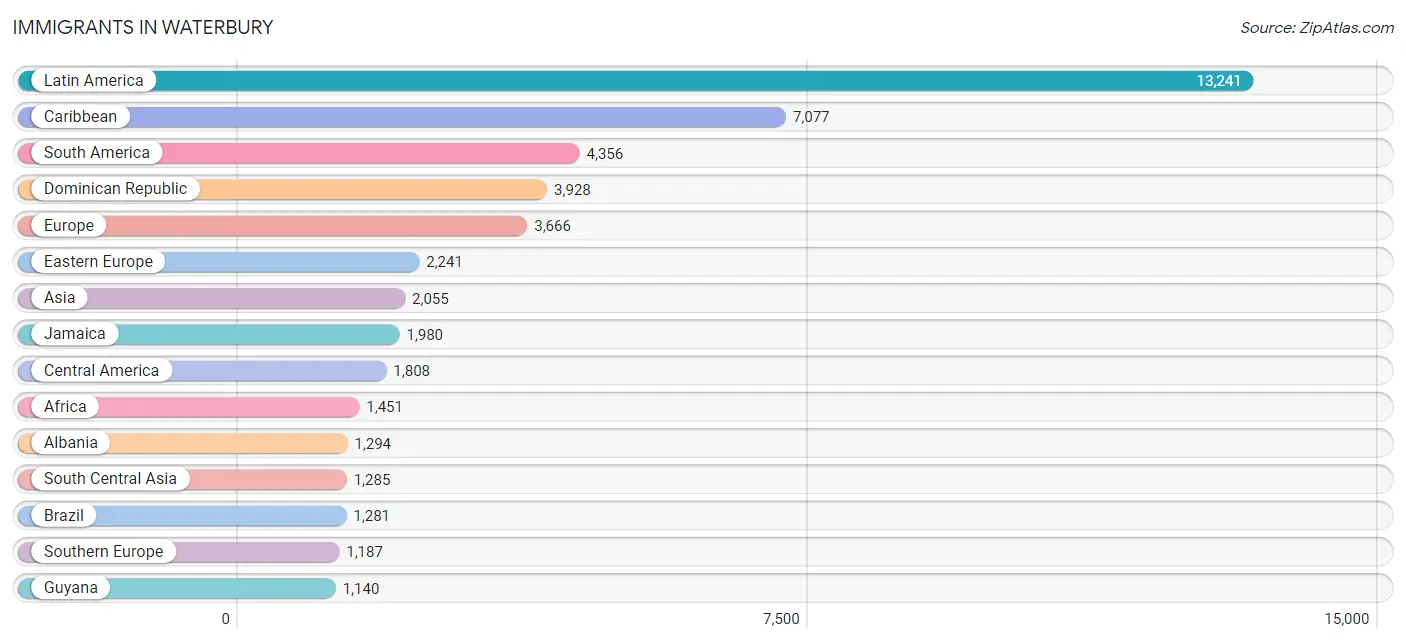
Immigrants in Waterbury
The most numerous immigrant groups reported in Waterbury came from Latin America (13,241 | 11.6%), Caribbean (7,077 | 6.2%), South America (4,356 | 3.8%), Dominican Republic (3,928 | 3.4%), and Europe (3,666 | 3.2%), together accounting for 28.2% of all Waterbury residents.
| Immigration Origin | # Population | % Population |
| Afghanistan | 50 | 0.0% |
| Africa | 1,451 | 1.3% |
| Albania | 1,294 | 1.1% |
| Argentina | 33 | 0.0% |
| Asia | 2,055 | 1.8% |
| Azores | 4 | 0.0% |
| Bahamas | 30 | 0.0% |
| Brazil | 1,281 | 1.1% |
| Cabo Verde | 407 | 0.4% |
| Cambodia | 43 | 0.0% |
| Canada | 219 | 0.2% |
| Caribbean | 7,077 | 6.2% |
| Central America | 1,808 | 1.6% |
| Chile | 79 | 0.1% |
| China | 254 | 0.2% |
| Colombia | 479 | 0.4% |
| Congo | 106 | 0.1% |
| Cuba | 256 | 0.2% |
| Dominica | 55 | 0.1% |
| Dominican Republic | 3,928 | 3.4% |
| Eastern Africa | 284 | 0.3% |
| Eastern Asia | 354 | 0.3% |
| Eastern Europe | 2,241 | 2.0% |
| Ecuador | 1,006 | 0.9% |
| Egypt | 32 | 0.0% |
| El Salvador | 166 | 0.2% |
| England | 138 | 0.1% |
| Europe | 3,666 | 3.2% |
| France | 26 | 0.0% |
| Germany | 26 | 0.0% |
| Ghana | 136 | 0.1% |
| Greece | 39 | 0.0% |
| Guatemala | 657 | 0.6% |
| Guyana | 1,140 | 1.0% |
| Haiti | 348 | 0.3% |
| Honduras | 405 | 0.4% |
| India | 619 | 0.5% |
| Iran | 9 | 0.0% |
| Ireland | 4 | 0.0% |
| Italy | 530 | 0.5% |
| Jamaica | 1,980 | 1.7% |
| Japan | 18 | 0.0% |
| Jordan | 41 | 0.0% |
| Kenya | 240 | 0.2% |
| Korea | 82 | 0.1% |
| Laos | 11 | 0.0% |
| Latin America | 13,241 | 11.6% |
| Lebanon | 30 | 0.0% |
| Lithuania | 10 | 0.0% |
| Mexico | 459 | 0.4% |
| Middle Africa | 135 | 0.1% |
| Morocco | 45 | 0.0% |
| Nicaragua | 62 | 0.1% |
| Nigeria | 207 | 0.2% |
| North Macedonia | 397 | 0.4% |
| Northern Africa | 77 | 0.1% |
| Northern Europe | 169 | 0.2% |
| Pakistan | 582 | 0.5% |
| Panama | 45 | 0.0% |
| Peru | 172 | 0.2% |
| Philippines | 129 | 0.1% |
| Poland | 200 | 0.2% |
| Portugal | 472 | 0.4% |
| Russia | 42 | 0.0% |
| Serbia | 14 | 0.0% |
| South Africa | 124 | 0.1% |
| South America | 4,356 | 3.8% |
| South Central Asia | 1,285 | 1.1% |
| South Eastern Asia | 331 | 0.3% |
| Southern Europe | 1,187 | 1.0% |
| Spain | 146 | 0.1% |
| Sri Lanka | 12 | 0.0% |
| St. Vincent and the Grenadines | 27 | 0.0% |
| Sweden | 3 | 0.0% |
| Switzerland | 17 | 0.0% |
| Trinidad and Tobago | 241 | 0.2% |
| Turkey | 14 | 0.0% |
| Uganda | 23 | 0.0% |
| Ukraine | 110 | 0.1% |
| Uruguay | 1 | 0.0% |
| Uzbekistan | 13 | 0.0% |
| Venezuela | 141 | 0.1% |
| Vietnam | 148 | 0.1% |
| West Indies | 23 | 0.0% |
| Western Africa | 750 | 0.7% |
| Western Asia | 85 | 0.1% |
| Western Europe | 69 | 0.1% |
| Zaire | 10 | 0.0% | View All 88 Rows |
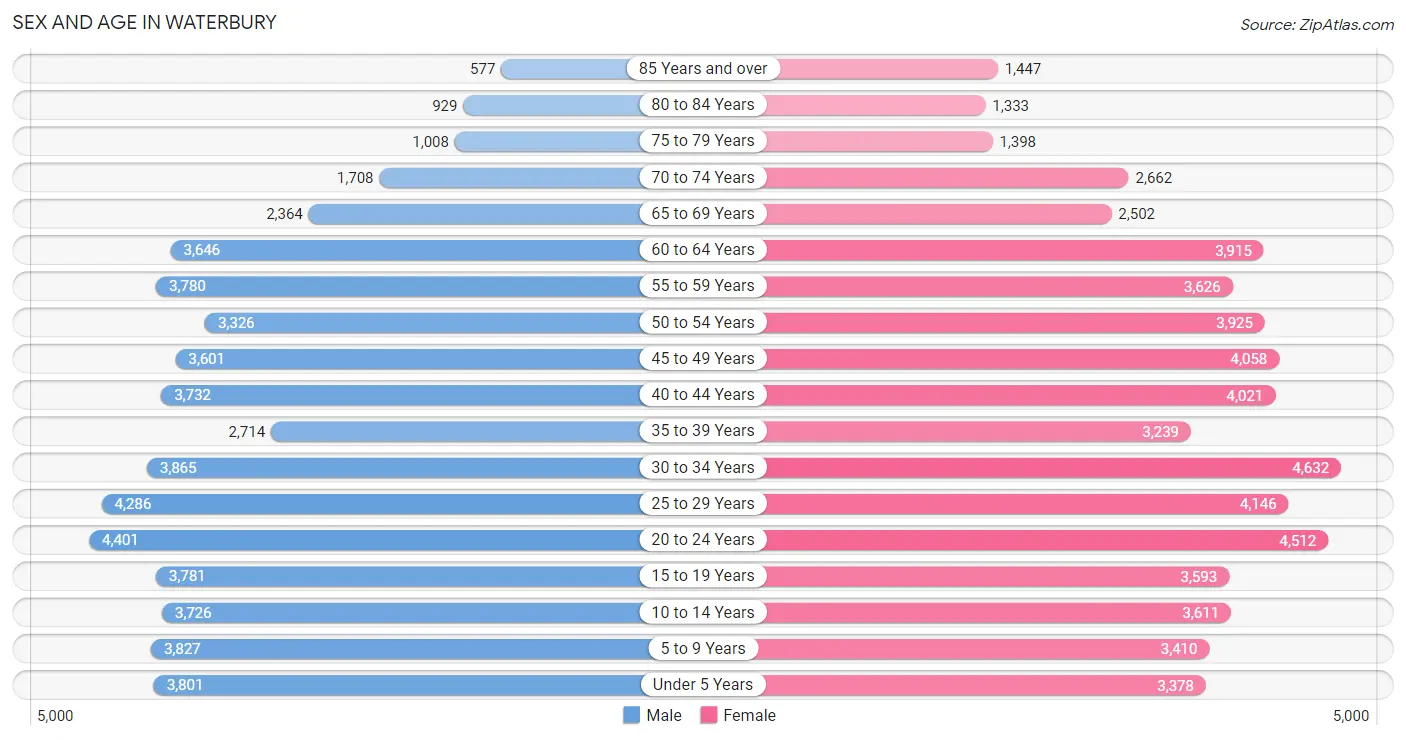
Sex and Age in Waterbury
Sex and Age in Waterbury
The most populous age groups in Waterbury are 20 to 24 Years (4,401 | 8.0%) for men and 30 to 34 Years (4,632 | 7.8%) for women.
| Age Bracket | Male | Female |
| Under 5 Years | 3,801 (6.9%) | 3,378 (5.7%) |
| 5 to 9 Years | 3,827 (7.0%) | 3,410 (5.7%) |
| 10 to 14 Years | 3,726 (6.8%) | 3,611 (6.1%) |
| 15 to 19 Years | 3,781 (6.9%) | 3,593 (6.0%) |
| 20 to 24 Years | 4,401 (8.0%) | 4,512 (7.6%) |
| 25 to 29 Years | 4,286 (7.8%) | 4,146 (7.0%) |
| 30 to 34 Years | 3,865 (7.0%) | 4,632 (7.8%) |
| 35 to 39 Years | 2,714 (4.9%) | 3,239 (5.4%) |
| 40 to 44 Years | 3,732 (6.8%) | 4,021 (6.8%) |
| 45 to 49 Years | 3,601 (6.5%) | 4,058 (6.8%) |
| 50 to 54 Years | 3,326 (6.0%) | 3,925 (6.6%) |
| 55 to 59 Years | 3,780 (6.9%) | 3,626 (6.1%) |
| 60 to 64 Years | 3,646 (6.6%) | 3,915 (6.6%) |
| 65 to 69 Years | 2,364 (4.3%) | 2,502 (4.2%) |
| 70 to 74 Years | 1,708 (3.1%) | 2,662 (4.5%) |
| 75 to 79 Years | 1,008 (1.8%) | 1,398 (2.4%) |
| 80 to 84 Years | 929 (1.7%) | 1,333 (2.2%) |
| 85 Years and over | 577 (1.1%) | 1,447 (2.4%) |
| Total | 55,072 (100.0%) | 59,408 (100.0%) |
Families and Households in Waterbury
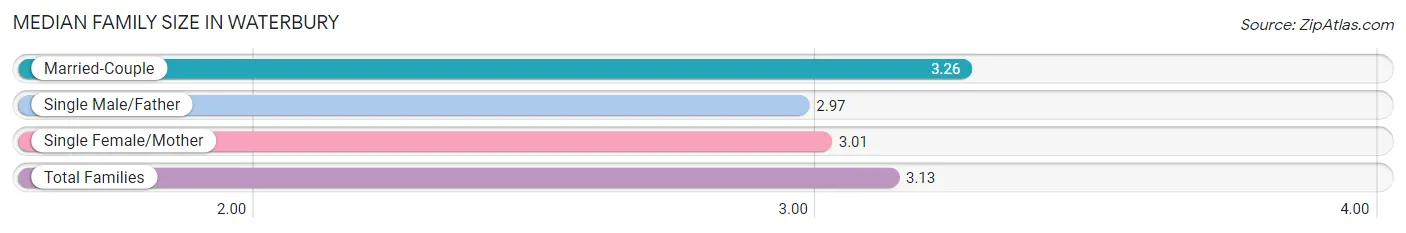
Median Family Size in Waterbury
The median family size in Waterbury is 3.13 persons per family, with married-couple families (14,291 | 51.8%) accounting for the largest median family size of 3.26 persons per family. On the other hand, single male/father families (3,116 | 11.3%) represent the smallest median family size with 2.97 persons per family.
| Family Type | # Families | Family Size |
| Married-Couple | 14,291 (51.8%) | 3.26 |
| Single Male/Father | 3,116 (11.3%) | 2.97 |
| Single Female/Mother | 10,176 (36.9%) | 3.01 |
| Total Families | 27,583 (100.0%) | 3.13 |
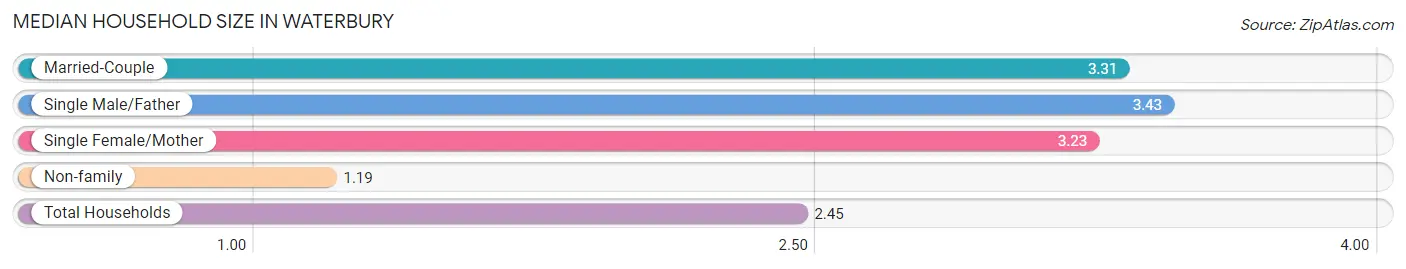
Median Household Size in Waterbury
The median household size in Waterbury is 2.45 persons per household, with single male/father households (3,116 | 6.8%) accounting for the largest median household size of 3.43 persons per household. non-family households (18,385 | 40.0%) represent the smallest median household size with 1.19 persons per household.
| Household Type | # Households | Household Size |
| Married-Couple | 14,291 (31.1%) | 3.31 |
| Single Male/Father | 3,116 (6.8%) | 3.43 |
| Single Female/Mother | 10,176 (22.1%) | 3.23 |
| Non-family | 18,385 (40.0%) | 1.19 |
| Total Households | 45,968 (100.0%) | 2.45 |
Household Size by Marriage Status in Waterbury
Out of a total of 45,968 households in Waterbury, 27,583 (60.0%) are family households, while 18,385 (40.0%) are nonfamily households. The most numerous type of family households are 2-person households, comprising 10,140, and the most common type of nonfamily households are 1-person households, comprising 15,769.
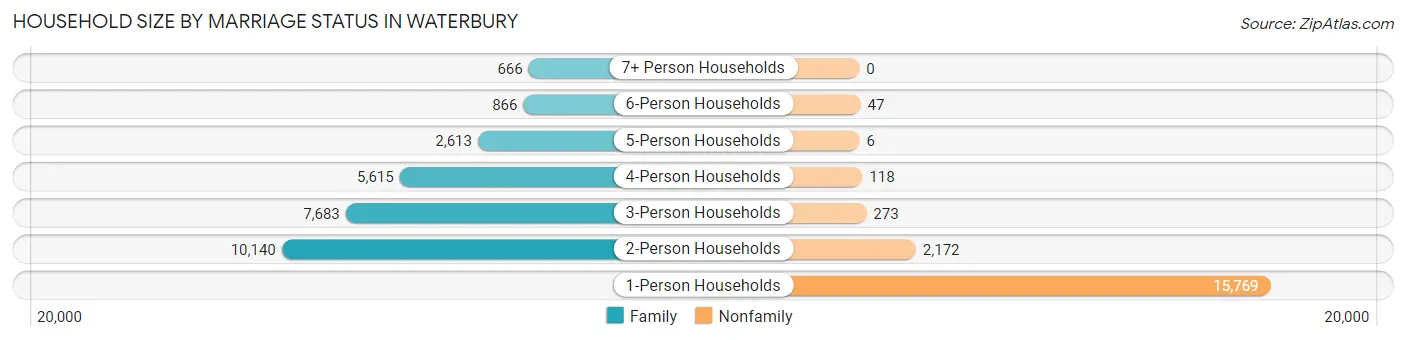
| Household Size | Family Households | Nonfamily Households |
| 1-Person Households | - | 15,769 (34.3%) |
| 2-Person Households | 10,140 (22.1%) | 2,172 (4.7%) |
| 3-Person Households | 7,683 (16.7%) | 273 (0.6%) |
| 4-Person Households | 5,615 (12.2%) | 118 (0.3%) |
| 5-Person Households | 2,613 (5.7%) | 6 (0.0%) |
| 6-Person Households | 866 (1.9%) | 47 (0.1%) |
| 7+ Person Households | 666 (1.5%) | 0 (0.0%) |
| Total | 27,583 (60.0%) | 18,385 (40.0%) |
Female Fertility in Waterbury
Fertility by Age in Waterbury
Average fertility rate in Waterbury is 53.0 births per 1,000 women. Women in the age bracket of 20 to 34 years have the highest fertility rate with 91.0 births per 1,000 women. Women in the age bracket of 20 to 34 years acount for 79.8% of all women with births.
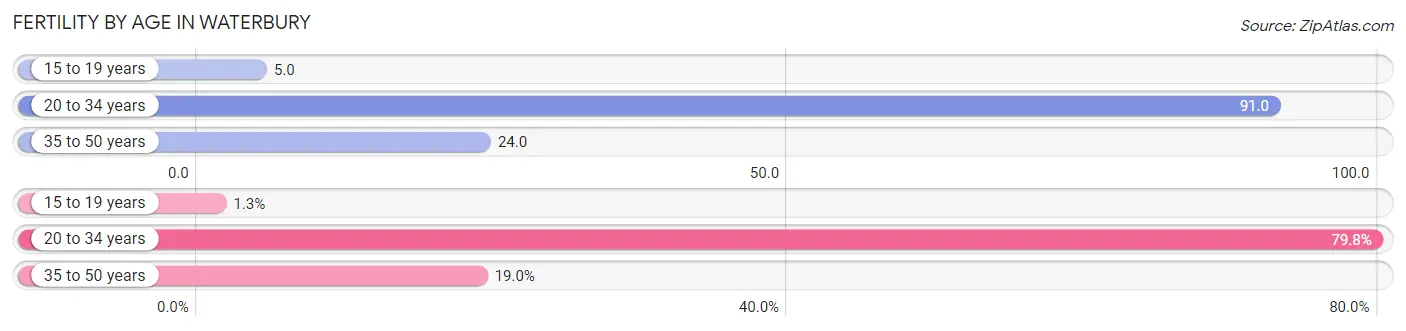
| Age Bracket | Women with Births | Births / 1,000 Women |
| 15 to 19 years | 19 (1.3%) | 5.0 |
| 20 to 34 years | 1,215 (79.8%) | 91.0 |
| 35 to 50 years | 289 (19.0%) | 24.0 |
| Total | 1,523 (100.0%) | 53.0 |
Fertility by Age by Marriage Status in Waterbury
48.5% of women with births (1,523) in Waterbury are married. The highest percentage of unmarried women with births falls into 15 to 19 years age bracket with 100.0% of them unmarried at the time of birth, while the lowest percentage of unmarried women with births belong to 35 to 50 years age bracket with 26.6% of them unmarried.
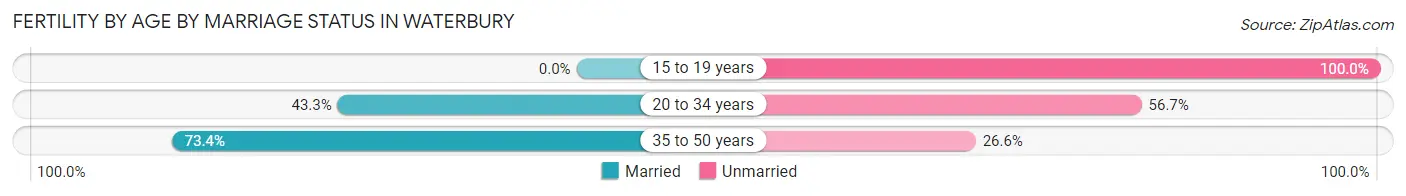
| Age Bracket | Married | Unmarried |
| 15 to 19 years | 0 (0.0%) | 19 (100.0%) |
| 20 to 34 years | 526 (43.3%) | 689 (56.7%) |
| 35 to 50 years | 212 (73.4%) | 77 (26.6%) |
| Total | 739 (48.5%) | 784 (51.5%) |
Fertility by Education in Waterbury
Average fertility rate in Waterbury is 53.0 births per 1,000 women. Women with the education attainment of college or associate's degree have the highest fertility rate of 67.0 births per 1,000 women, while women with the education attainment of bachelor's degree have the lowest fertility at 26.0 births per 1,000 women. Women with the education attainment of high school diploma represent 39.1% of all women with births.
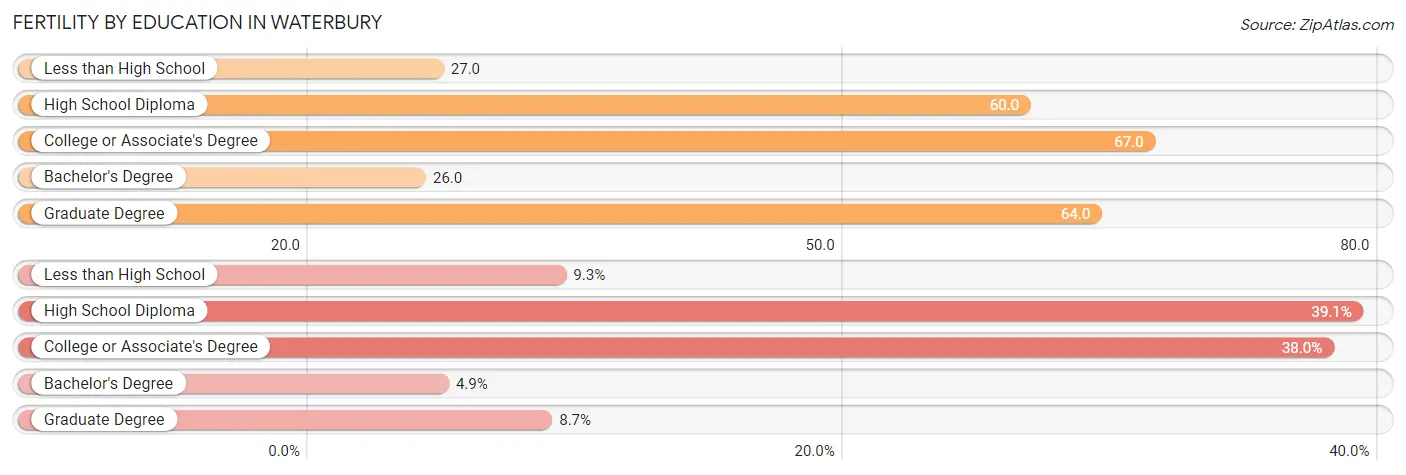
| Educational Attainment | Women with Births | Births / 1,000 Women |
| Less than High School | 141 (9.3%) | 27.0 |
| High School Diploma | 596 (39.1%) | 60.0 |
| College or Associate's Degree | 579 (38.0%) | 67.0 |
| Bachelor's Degree | 74 (4.9%) | 26.0 |
| Graduate Degree | 133 (8.7%) | 64.0 |
| Total | 1,523 (100.0%) | 53.0 |
Fertility by Education by Marriage Status in Waterbury
51.5% of women with births in Waterbury are unmarried. Women with the educational attainment of graduate degree are most likely to be married with 78.2% of them married at childbirth, while women with the educational attainment of bachelor's degree are least likely to be married with 100.0% of them unmarried at childbirth.
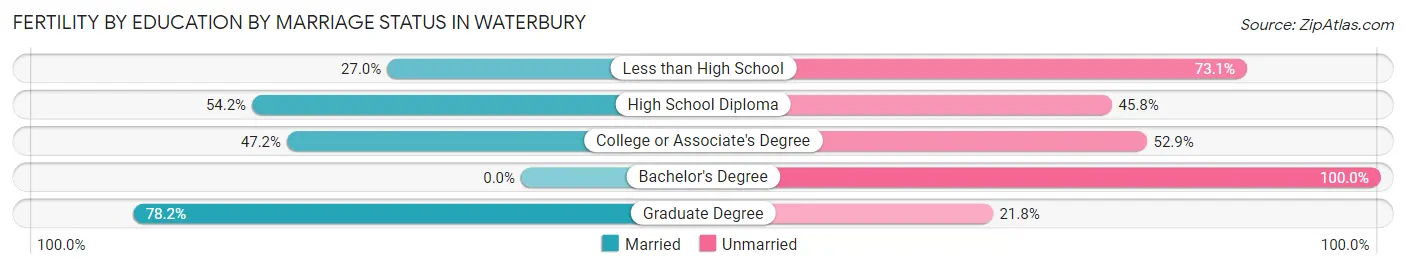
| Educational Attainment | Married | Unmarried |
| Less than High School | 38 (27.0%) | 103 (73.1%) |
| High School Diploma | 323 (54.2%) | 273 (45.8%) |
| College or Associate's Degree | 273 (47.1%) | 306 (52.8%) |
| Bachelor's Degree | 0 (0.0%) | 74 (100.0%) |
| Graduate Degree | 104 (78.2%) | 29 (21.8%) |
| Total | 739 (48.5%) | 784 (51.5%) |
Employment Characteristics in Waterbury
Employment by Class of Employer in Waterbury
Among the 49,828 employed individuals in Waterbury, private company employees (35,560 | 71.4%), not-for-profit organizations (4,313 | 8.7%), and self-employed (not incorporated) (3,138 | 6.3%) make up the most common classes of employment.
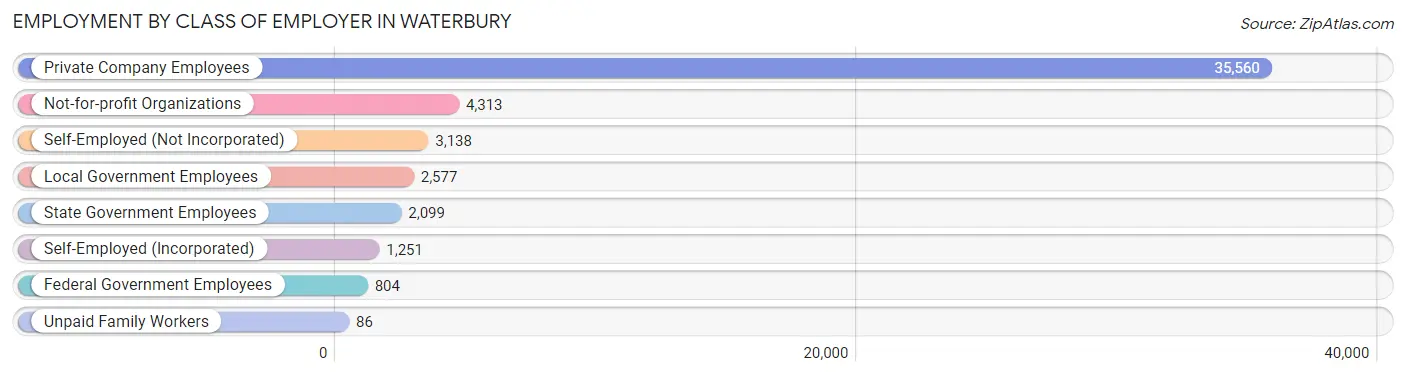
| Employer Class | # Employees | % Employees |
| Private Company Employees | 35,560 | 71.4% |
| Self-Employed (Incorporated) | 1,251 | 2.5% |
| Self-Employed (Not Incorporated) | 3,138 | 6.3% |
| Not-for-profit Organizations | 4,313 | 8.7% |
| Local Government Employees | 2,577 | 5.2% |
| State Government Employees | 2,099 | 4.2% |
| Federal Government Employees | 804 | 1.6% |
| Unpaid Family Workers | 86 | 0.2% |
| Total | 49,828 | 100.0% |
Employment Status by Age in Waterbury
According to the labor force statistics for Waterbury, out of the total population over 16 years of age (91,145), 61.7% or 56,236 individuals are in the labor force, with 9.8% or 5,511 of them unemployed. The age group with the highest labor force participation rate is 30 to 34 years, with 84.5% or 7,180 individuals in the labor force. Within the labor force, the 16 to 19 years age range has the highest percentage of unemployed individuals, with 20.4% or 438 of them being unemployed.
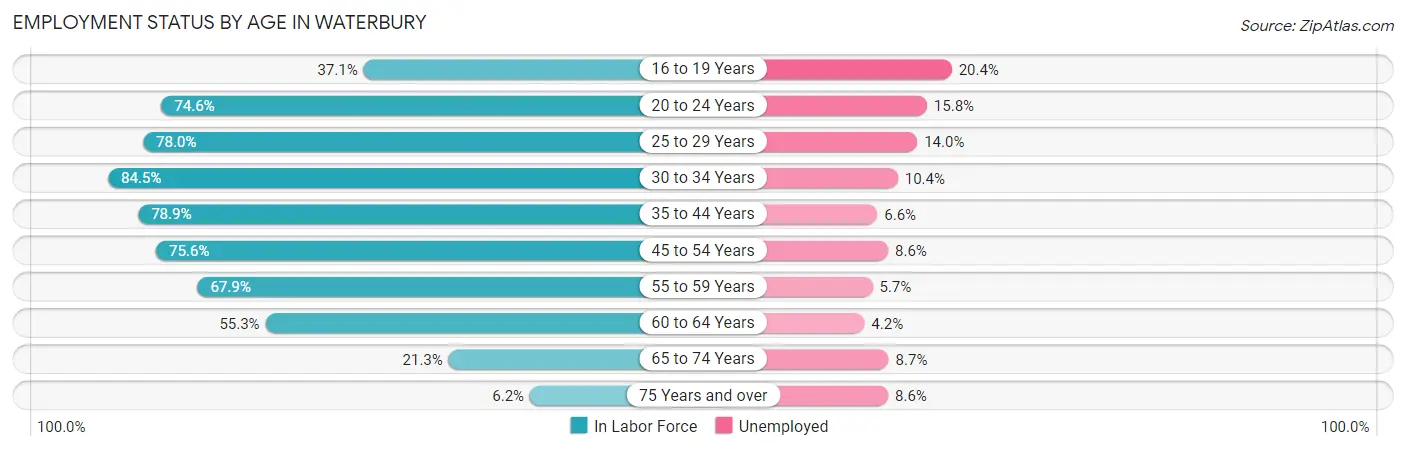
| Age Bracket | In Labor Force | Unemployed |
| 16 to 19 Years | 2,149 (37.1%) | 438 (20.4%) |
| 20 to 24 Years | 6,649 (74.6%) | 1,051 (15.8%) |
| 25 to 29 Years | 6,577 (78.0%) | 921 (14.0%) |
| 30 to 34 Years | 7,180 (84.5%) | 747 (10.4%) |
| 35 to 44 Years | 10,814 (78.9%) | 714 (6.6%) |
| 45 to 54 Years | 11,272 (75.6%) | 969 (8.6%) |
| 55 to 59 Years | 5,029 (67.9%) | 287 (5.7%) |
| 60 to 64 Years | 4,181 (55.3%) | 176 (4.2%) |
| 65 to 74 Years | 1,967 (21.3%) | 171 (8.7%) |
| 75 Years and over | 415 (6.2%) | 36 (8.6%) |
| Total | 56,236 (61.7%) | 5,511 (9.8%) |
Employment Status by Educational Attainment in Waterbury
According to labor force statistics for Waterbury, 74.4% of individuals (45,021) out of the total population between 25 and 64 years of age (60,512) are in the labor force, with 8.5% or 3,827 of them being unemployed. The group with the highest labor force participation rate are those with the educational attainment of bachelor's degree or higher, with 89.7% or 9,612 individuals in the labor force. Within the labor force, individuals with less than high school education have the highest percentage of unemployment, with 11.3% or 616 of them being unemployed.
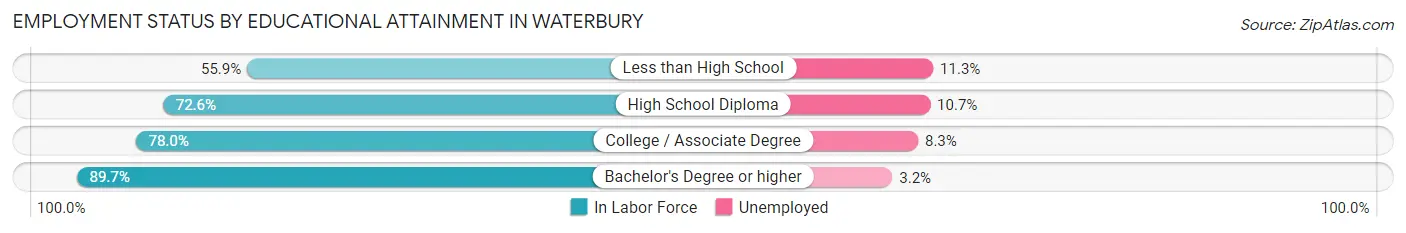
| Educational Attainment | In Labor Force | Unemployed |
| Less than High School | 5,455 (55.9%) | 1,103 (11.3%) |
| High School Diploma | 16,650 (72.6%) | 2,454 (10.7%) |
| College / Associate Degree | 13,340 (78.0%) | 1,420 (8.3%) |
| Bachelor's Degree or higher | 9,612 (89.7%) | 343 (3.2%) |
| Total | 45,021 (74.4%) | 5,144 (8.5%) |
Employment Occupations by Sex in Waterbury
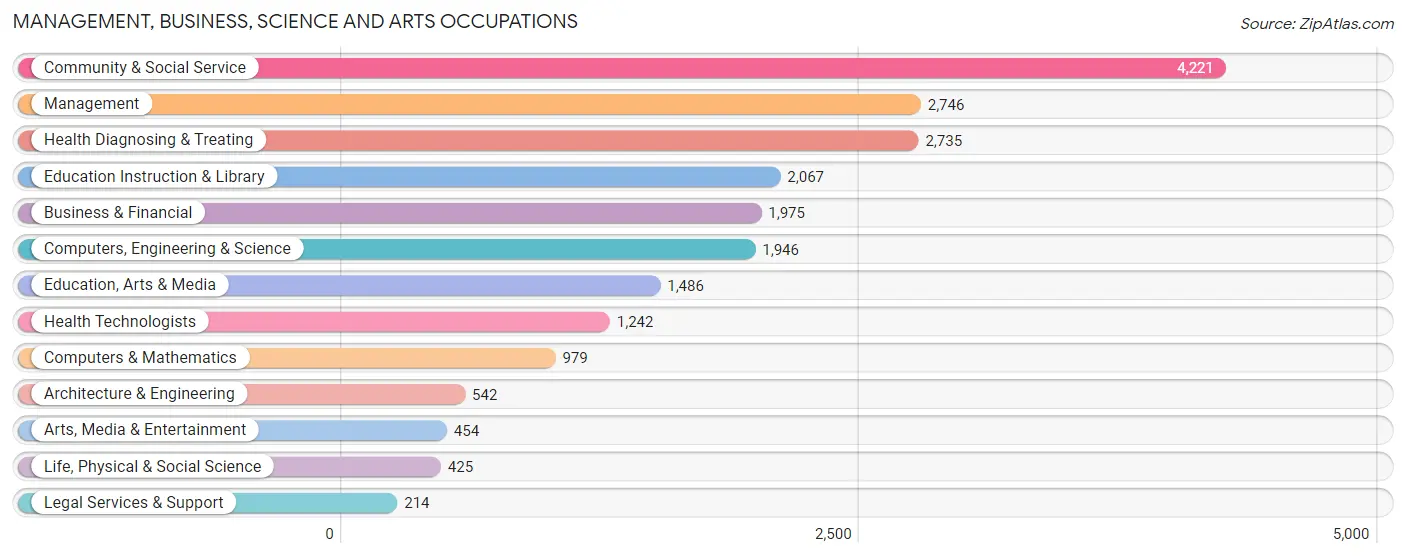
Management, Business, Science and Arts Occupations
The most common Management, Business, Science and Arts occupations in Waterbury are Community & Social Service (4,221 | 8.3%), Management (2,746 | 5.4%), Health Diagnosing & Treating (2,735 | 5.4%), Education Instruction & Library (2,067 | 4.1%), and Business & Financial (1,975 | 3.9%).
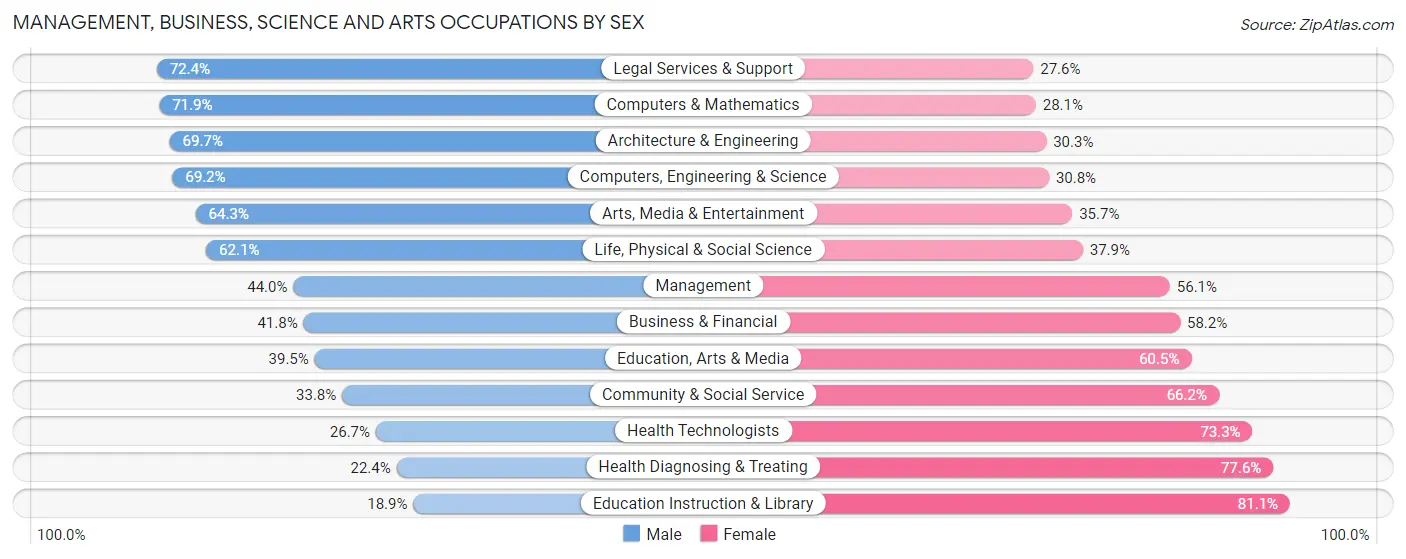
Management, Business, Science and Arts Occupations by Sex
Within the Management, Business, Science and Arts occupations in Waterbury, the most male-oriented occupations are Legal Services & Support (72.4%), Computers & Mathematics (71.9%), and Architecture & Engineering (69.7%), while the most female-oriented occupations are Education Instruction & Library (81.1%), Health Diagnosing & Treating (77.6%), and Health Technologists (73.3%).
| Occupation | Male | Female |
| Management | 1,207 (44.0%) | 1,539 (56.0%) |
| Business & Financial | 826 (41.8%) | 1,149 (58.2%) |
| Computers, Engineering & Science | 1,346 (69.2%) | 600 (30.8%) |
| Computers & Mathematics | 704 (71.9%) | 275 (28.1%) |
| Architecture & Engineering | 378 (69.7%) | 164 (30.3%) |
| Life, Physical & Social Science | 264 (62.1%) | 161 (37.9%) |
| Community & Social Service | 1,425 (33.8%) | 2,796 (66.2%) |
| Education, Arts & Media | 587 (39.5%) | 899 (60.5%) |
| Legal Services & Support | 155 (72.4%) | 59 (27.6%) |
| Education Instruction & Library | 391 (18.9%) | 1,676 (81.1%) |
| Arts, Media & Entertainment | 292 (64.3%) | 162 (35.7%) |
| Health Diagnosing & Treating | 613 (22.4%) | 2,122 (77.6%) |
| Health Technologists | 332 (26.7%) | 910 (73.3%) |
| Total (Category) | 5,417 (39.8%) | 8,206 (60.2%) |
| Total (Overall) | 25,037 (49.4%) | 25,663 (50.6%) |
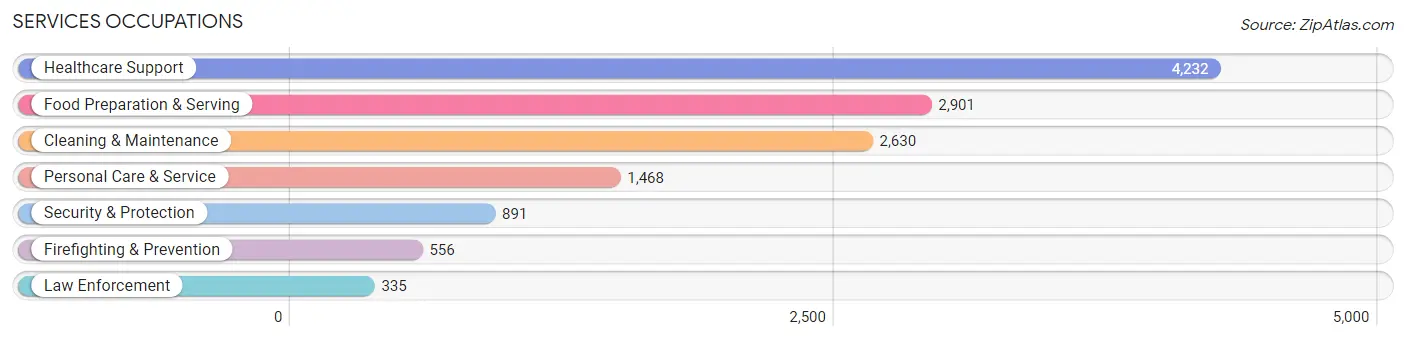
Services Occupations
The most common Services occupations in Waterbury are Healthcare Support (4,232 | 8.4%), Food Preparation & Serving (2,901 | 5.7%), Cleaning & Maintenance (2,630 | 5.2%), Personal Care & Service (1,468 | 2.9%), and Security & Protection (891 | 1.8%).
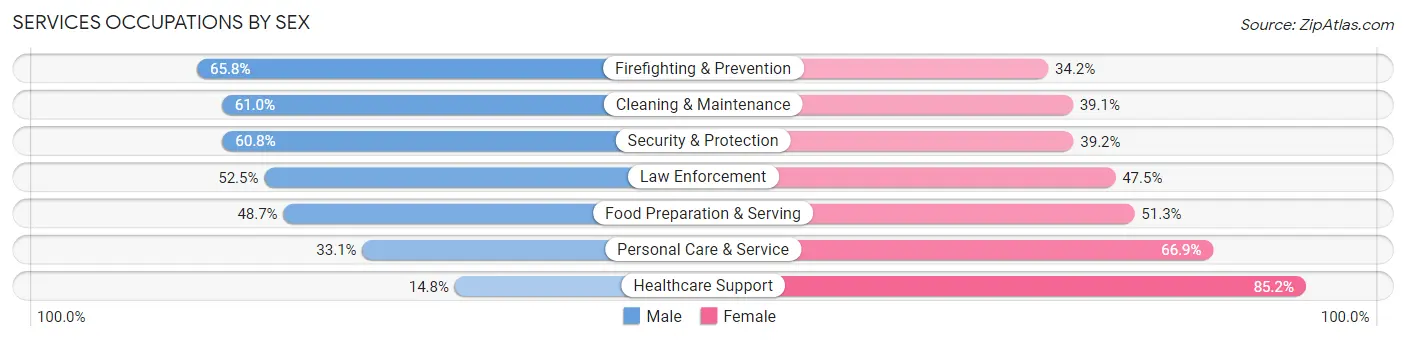
Services Occupations by Sex
Within the Services occupations in Waterbury, the most male-oriented occupations are Firefighting & Prevention (65.8%), Cleaning & Maintenance (61.0%), and Security & Protection (60.8%), while the most female-oriented occupations are Healthcare Support (85.2%), Personal Care & Service (66.9%), and Food Preparation & Serving (51.3%).
| Occupation | Male | Female |
| Healthcare Support | 627 (14.8%) | 3,605 (85.2%) |
| Security & Protection | 542 (60.8%) | 349 (39.2%) |
| Firefighting & Prevention | 366 (65.8%) | 190 (34.2%) |
| Law Enforcement | 176 (52.5%) | 159 (47.5%) |
| Food Preparation & Serving | 1,414 (48.7%) | 1,487 (51.3%) |
| Cleaning & Maintenance | 1,603 (61.0%) | 1,027 (39.1%) |
| Personal Care & Service | 486 (33.1%) | 982 (66.9%) |
| Total (Category) | 4,672 (38.5%) | 7,450 (61.5%) |
| Total (Overall) | 25,037 (49.4%) | 25,663 (50.6%) |
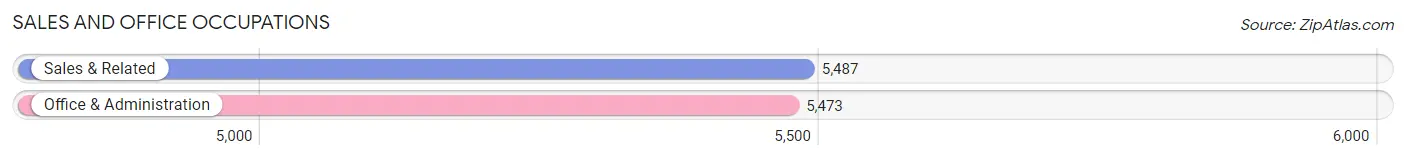
Sales and Office Occupations
The most common Sales and Office occupations in Waterbury are Sales & Related (5,487 | 10.8%), and Office & Administration (5,473 | 10.8%).
Sales and Office Occupations by Sex
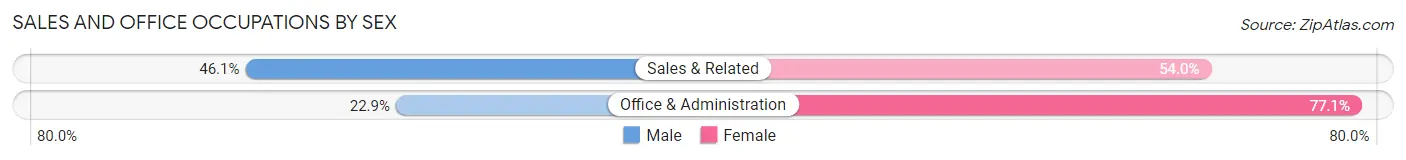
| Occupation | Male | Female |
| Sales & Related | 2,527 (46.1%) | 2,960 (53.9%) |
| Office & Administration | 1,253 (22.9%) | 4,220 (77.1%) |
| Total (Category) | 3,780 (34.5%) | 7,180 (65.5%) |
| Total (Overall) | 25,037 (49.4%) | 25,663 (50.6%) |
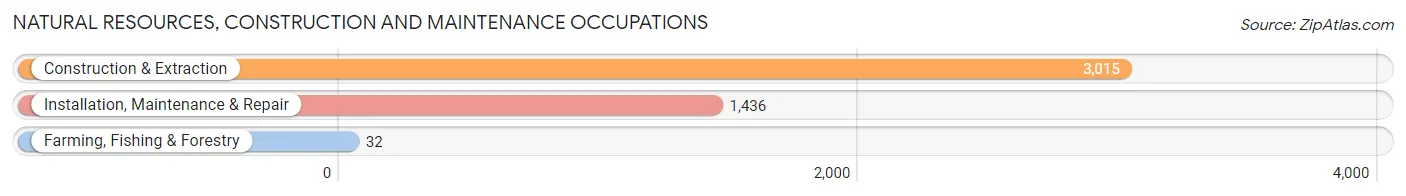
Natural Resources, Construction and Maintenance Occupations
The most common Natural Resources, Construction and Maintenance occupations in Waterbury are Construction & Extraction (3,015 | 5.9%), Installation, Maintenance & Repair (1,436 | 2.8%), and Farming, Fishing & Forestry (32 | 0.1%).
Natural Resources, Construction and Maintenance Occupations by Sex
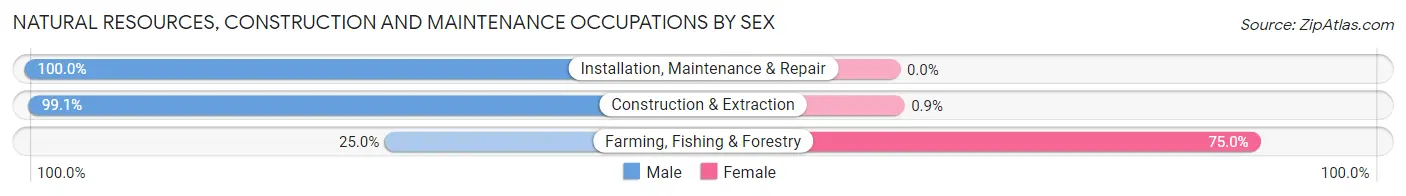
| Occupation | Male | Female |
| Farming, Fishing & Forestry | 8 (25.0%) | 24 (75.0%) |
| Construction & Extraction | 2,988 (99.1%) | 27 (0.9%) |
| Installation, Maintenance & Repair | 1,436 (100.0%) | 0 (0.0%) |
| Total (Category) | 4,432 (98.9%) | 51 (1.1%) |
| Total (Overall) | 25,037 (49.4%) | 25,663 (50.6%) |
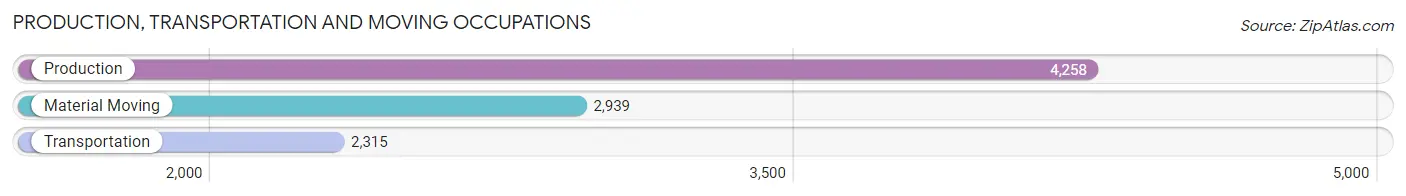
Production, Transportation and Moving Occupations
The most common Production, Transportation and Moving occupations in Waterbury are Production (4,258 | 8.4%), Material Moving (2,939 | 5.8%), and Transportation (2,315 | 4.6%).
Production, Transportation and Moving Occupations by Sex
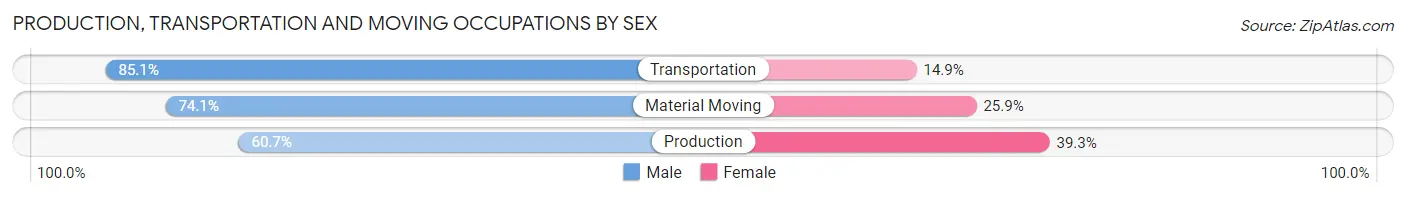
| Occupation | Male | Female |
| Production | 2,586 (60.7%) | 1,672 (39.3%) |
| Transportation | 1,971 (85.1%) | 344 (14.9%) |
| Material Moving | 2,179 (74.1%) | 760 (25.9%) |
| Total (Category) | 6,736 (70.8%) | 2,776 (29.2%) |
| Total (Overall) | 25,037 (49.4%) | 25,663 (50.6%) |
Employment Industries by Sex in Waterbury
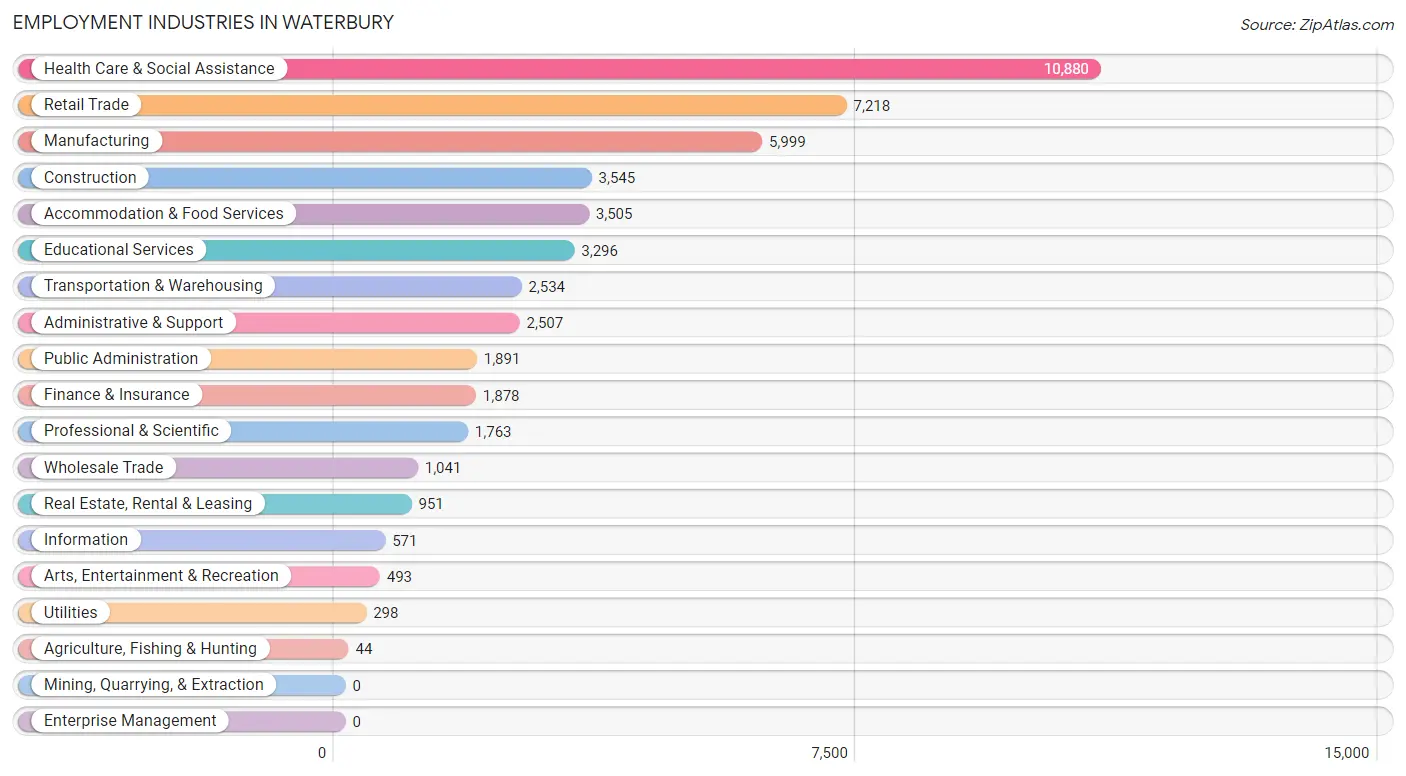
Employment Industries in Waterbury
The major employment industries in Waterbury include Health Care & Social Assistance (10,880 | 21.5%), Retail Trade (7,218 | 14.2%), Manufacturing (5,999 | 11.8%), Construction (3,545 | 7.0%), and Accommodation & Food Services (3,505 | 6.9%).
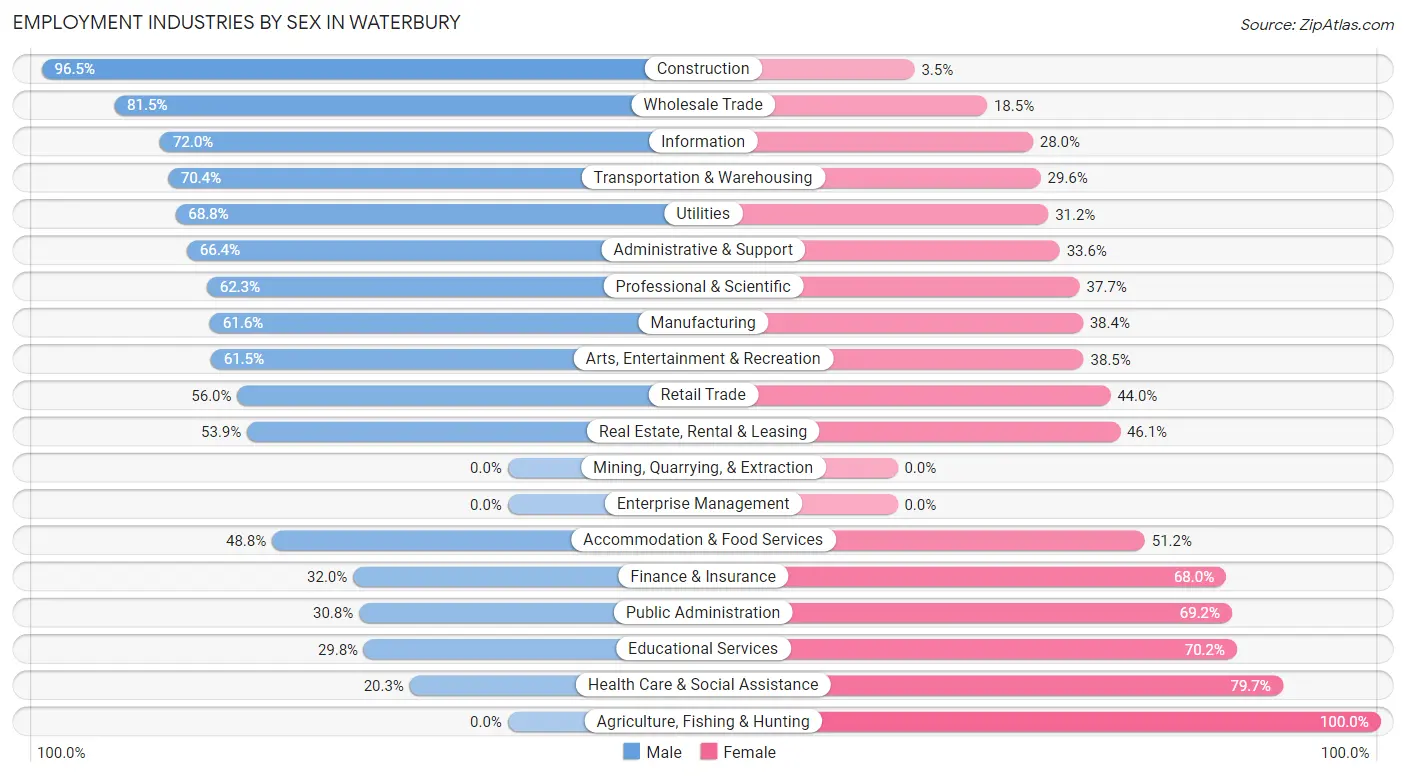
Employment Industries by Sex in Waterbury
The Waterbury industries that see more men than women are Construction (96.5%), Wholesale Trade (81.5%), and Information (72.0%), whereas the industries that tend to have a higher number of women are Agriculture, Fishing & Hunting (100.0%), Health Care & Social Assistance (79.7%), and Educational Services (70.2%).
| Industry | Male | Female |
| Agriculture, Fishing & Hunting | 0 (0.0%) | 44 (100.0%) |
| Mining, Quarrying, & Extraction | 0 (0.0%) | 0 (0.0%) |
| Construction | 3,420 (96.5%) | 125 (3.5%) |
| Manufacturing | 3,698 (61.6%) | 2,301 (38.4%) |
| Wholesale Trade | 848 (81.5%) | 193 (18.5%) |
| Retail Trade | 4,039 (56.0%) | 3,179 (44.0%) |
| Transportation & Warehousing | 1,783 (70.4%) | 751 (29.6%) |
| Utilities | 205 (68.8%) | 93 (31.2%) |
| Information | 411 (72.0%) | 160 (28.0%) |
| Finance & Insurance | 601 (32.0%) | 1,277 (68.0%) |
| Real Estate, Rental & Leasing | 513 (53.9%) | 438 (46.1%) |
| Professional & Scientific | 1,098 (62.3%) | 665 (37.7%) |
| Enterprise Management | 0 (0.0%) | 0 (0.0%) |
| Administrative & Support | 1,665 (66.4%) | 842 (33.6%) |
| Educational Services | 981 (29.8%) | 2,315 (70.2%) |
| Health Care & Social Assistance | 2,208 (20.3%) | 8,672 (79.7%) |
| Arts, Entertainment & Recreation | 303 (61.5%) | 190 (38.5%) |
| Accommodation & Food Services | 1,710 (48.8%) | 1,795 (51.2%) |
| Public Administration | 582 (30.8%) | 1,309 (69.2%) |
| Total | 25,037 (49.4%) | 25,663 (50.6%) |
Education in Waterbury
School Enrollment in Waterbury
The most common levels of schooling among the 27,961 students in Waterbury are college / undergraduate (6,535 | 23.4%), middle school (5,952 | 21.3%), and high school (5,695 | 20.4%).
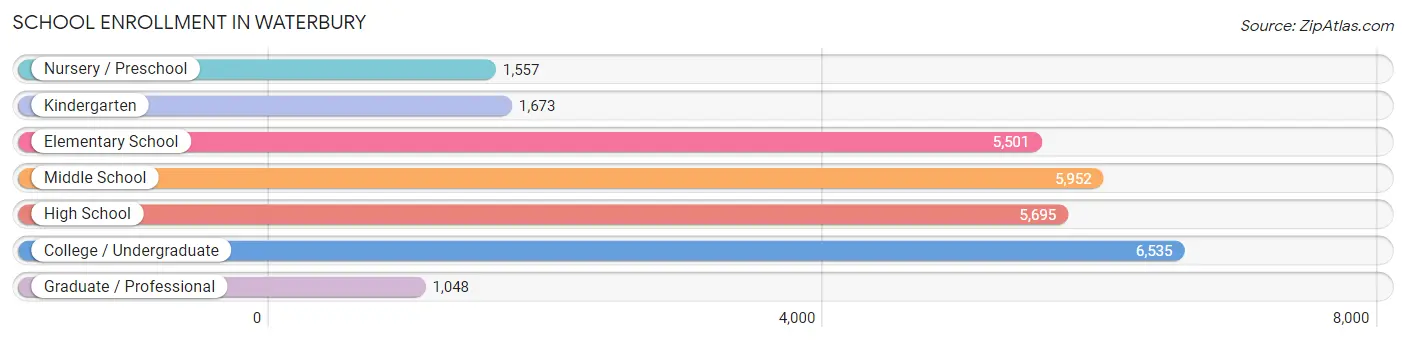
| School Level | # Students | % Students |
| Nursery / Preschool | 1,557 | 5.6% |
| Kindergarten | 1,673 | 6.0% |
| Elementary School | 5,501 | 19.7% |
| Middle School | 5,952 | 21.3% |
| High School | 5,695 | 20.4% |
| College / Undergraduate | 6,535 | 23.4% |
| Graduate / Professional | 1,048 | 3.7% |
| Total | 27,961 | 100.0% |
School Enrollment by Age by Funding Source in Waterbury
Out of a total of 27,961 students who are enrolled in schools in Waterbury, 4,865 (17.4%) attend a private institution, while the remaining 23,096 (82.6%) are enrolled in public schools. The age group of 35 years and over has the highest likelihood of being enrolled in private schools, with 523 (45.1% in the age bracket) enrolled. Conversely, the age group of 15 to 17 year olds has the lowest likelihood of being enrolled in a private school, with 3,918 (94.3% in the age bracket) attending a public institution.
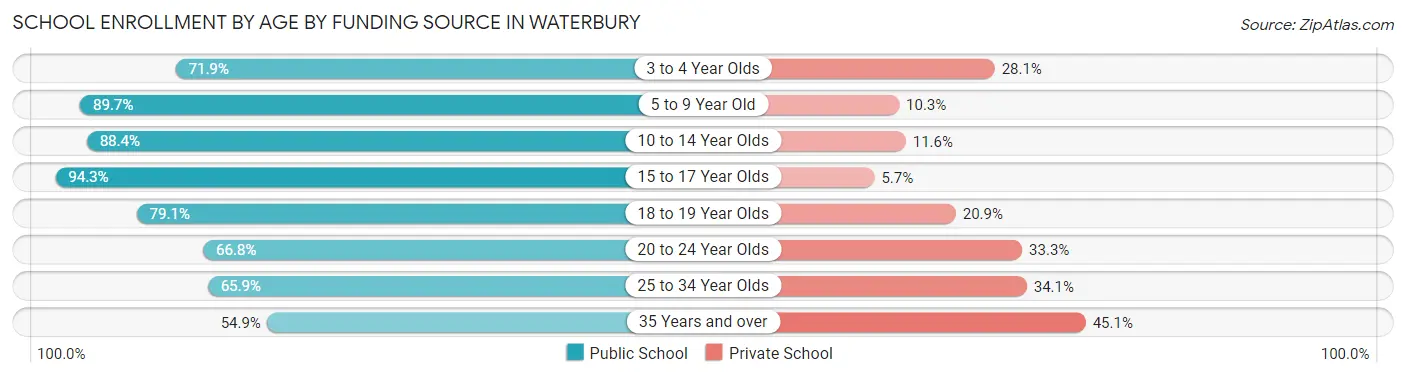
| Age Bracket | Public School | Private School |
| 3 to 4 Year Olds | 1,073 (71.9%) | 420 (28.1%) |
| 5 to 9 Year Old | 6,182 (89.7%) | 712 (10.3%) |
| 10 to 14 Year Olds | 6,221 (88.4%) | 814 (11.6%) |
| 15 to 17 Year Olds | 3,918 (94.3%) | 238 (5.7%) |
| 18 to 19 Year Olds | 1,701 (79.1%) | 449 (20.9%) |
| 20 to 24 Year Olds | 2,218 (66.7%) | 1,105 (33.3%) |
| 25 to 34 Year Olds | 1,153 (65.9%) | 597 (34.1%) |
| 35 Years and over | 637 (54.9%) | 523 (45.1%) |
| Total | 23,096 (82.6%) | 4,865 (17.4%) |
Educational Attainment by Field of Study in Waterbury
Business (2,295 | 17.2%), education (1,556 | 11.7%), arts & humanities (1,505 | 11.3%), science & technology (1,499 | 11.3%), and computers & mathematics (1,027 | 7.7%) are the most common fields of study among 13,311 individuals in Waterbury who have obtained a bachelor's degree or higher.
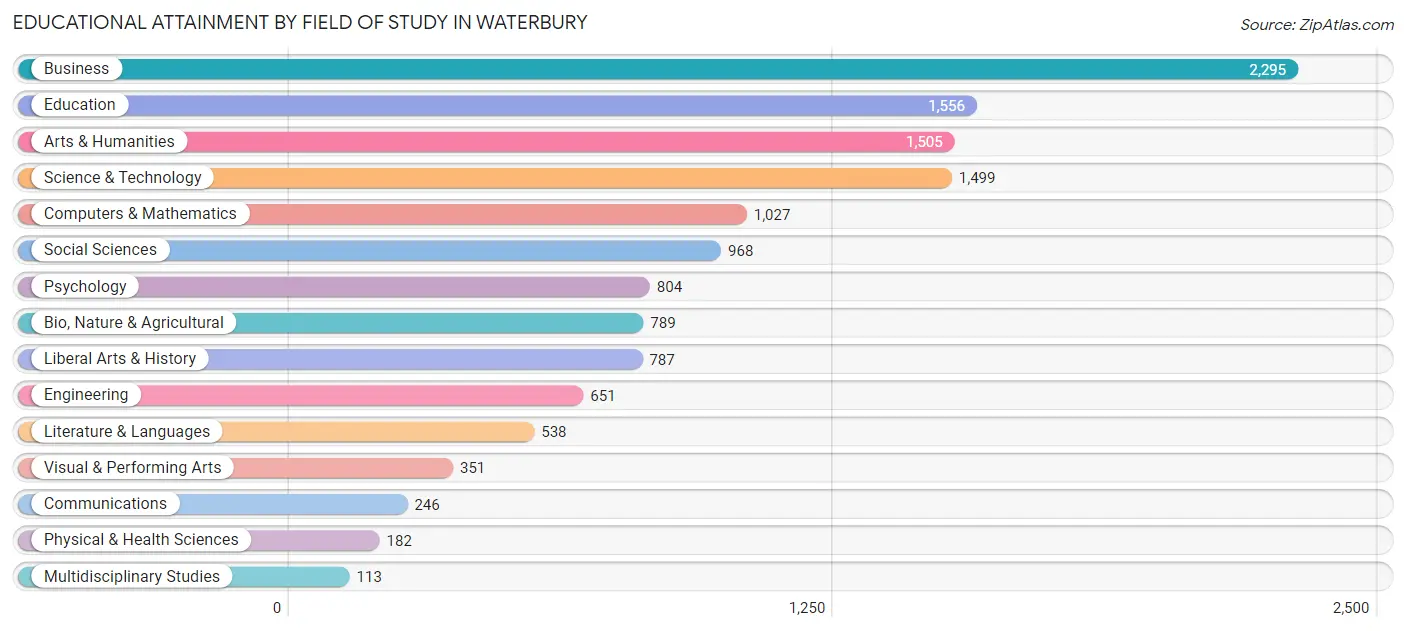
| Field of Study | # Graduates | % Graduates |
| Computers & Mathematics | 1,027 | 7.7% |
| Bio, Nature & Agricultural | 789 | 5.9% |
| Physical & Health Sciences | 182 | 1.4% |
| Psychology | 804 | 6.0% |
| Social Sciences | 968 | 7.3% |
| Engineering | 651 | 4.9% |
| Multidisciplinary Studies | 113 | 0.9% |
| Science & Technology | 1,499 | 11.3% |
| Business | 2,295 | 17.2% |
| Education | 1,556 | 11.7% |
| Literature & Languages | 538 | 4.0% |
| Liberal Arts & History | 787 | 5.9% |
| Visual & Performing Arts | 351 | 2.6% |
| Communications | 246 | 1.8% |
| Arts & Humanities | 1,505 | 11.3% |
| Total | 13,311 | 100.0% |
Transportation & Commute in Waterbury
Vehicle Availability by Sex in Waterbury
The most prevalent vehicle ownership categories in Waterbury are males with 2 vehicles (9,498, accounting for 38.8%) and females with 2 vehicles (8,291, making up 37.8%).
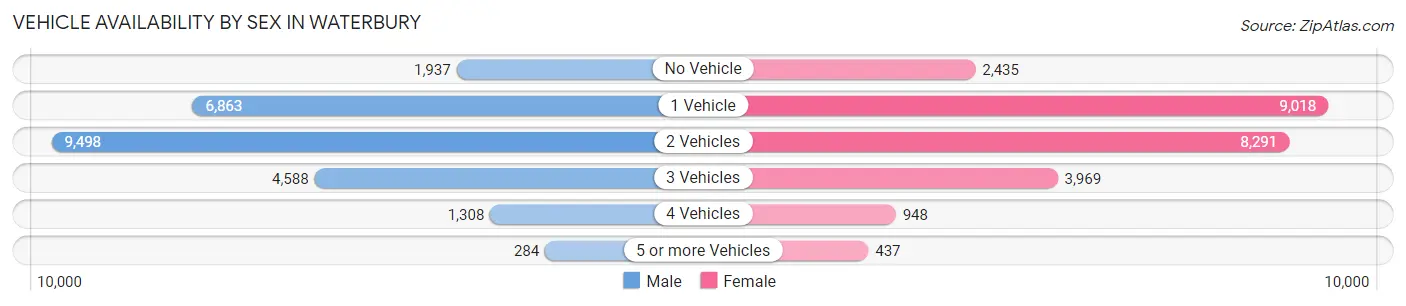
| Vehicles Available | Male | Female |
| No Vehicle | 1,937 (7.9%) | 2,435 (9.7%) |
| 1 Vehicle | 6,863 (28.0%) | 9,018 (35.9%) |
| 2 Vehicles | 9,498 (38.8%) | 8,291 (33.0%) |
| 3 Vehicles | 4,588 (18.7%) | 3,969 (15.8%) |
| 4 Vehicles | 1,308 (5.3%) | 948 (3.8%) |
| 5 or more Vehicles | 284 (1.2%) | 437 (1.7%) |
| Total | 24,478 (100.0%) | 25,098 (100.0%) |
Commute Time in Waterbury
The most frequently occuring commute durations in Waterbury are 15 to 19 minutes (7,703 commuters, 16.5%), 10 to 14 minutes (7,174 commuters, 15.3%), and 20 to 24 minutes (5,985 commuters, 12.8%).
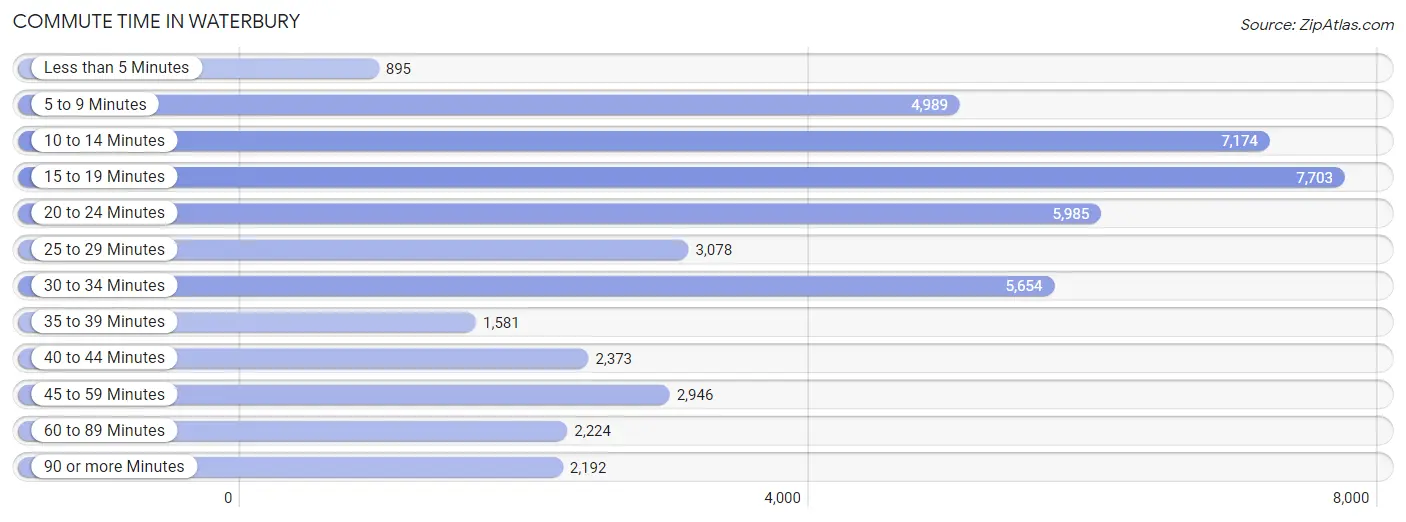
| Commute Time | # Commuters | % Commuters |
| Less than 5 Minutes | 895 | 1.9% |
| 5 to 9 Minutes | 4,989 | 10.7% |
| 10 to 14 Minutes | 7,174 | 15.3% |
| 15 to 19 Minutes | 7,703 | 16.5% |
| 20 to 24 Minutes | 5,985 | 12.8% |
| 25 to 29 Minutes | 3,078 | 6.6% |
| 30 to 34 Minutes | 5,654 | 12.1% |
| 35 to 39 Minutes | 1,581 | 3.4% |
| 40 to 44 Minutes | 2,373 | 5.1% |
| 45 to 59 Minutes | 2,946 | 6.3% |
| 60 to 89 Minutes | 2,224 | 4.8% |
| 90 or more Minutes | 2,192 | 4.7% |
Commute Time by Sex in Waterbury
The most common commute times in Waterbury are 15 to 19 minutes (3,448 commuters, 14.8%) for males and 15 to 19 minutes (4,255 commuters, 18.1%) for females.
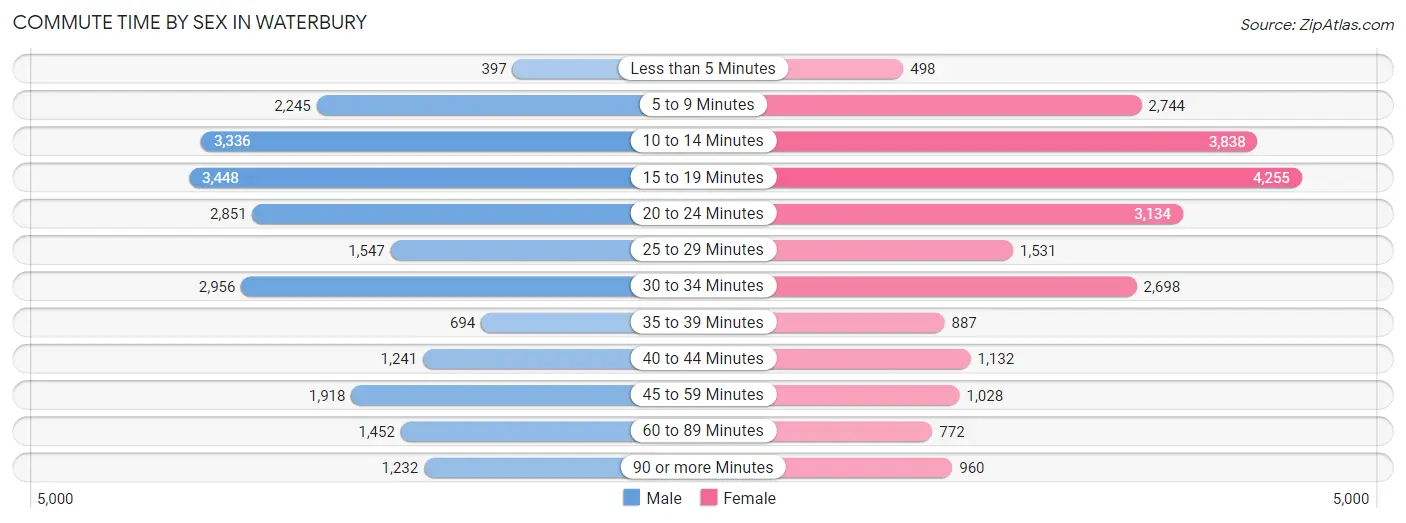
| Commute Time | Male | Female |
| Less than 5 Minutes | 397 (1.7%) | 498 (2.1%) |
| 5 to 9 Minutes | 2,245 (9.6%) | 2,744 (11.7%) |
| 10 to 14 Minutes | 3,336 (14.3%) | 3,838 (16.4%) |
| 15 to 19 Minutes | 3,448 (14.8%) | 4,255 (18.1%) |
| 20 to 24 Minutes | 2,851 (12.2%) | 3,134 (13.4%) |
| 25 to 29 Minutes | 1,547 (6.6%) | 1,531 (6.5%) |
| 30 to 34 Minutes | 2,956 (12.7%) | 2,698 (11.5%) |
| 35 to 39 Minutes | 694 (3.0%) | 887 (3.8%) |
| 40 to 44 Minutes | 1,241 (5.3%) | 1,132 (4.8%) |
| 45 to 59 Minutes | 1,918 (8.2%) | 1,028 (4.4%) |
| 60 to 89 Minutes | 1,452 (6.2%) | 772 (3.3%) |
| 90 or more Minutes | 1,232 (5.3%) | 960 (4.1%) |
Time of Departure to Work by Sex in Waterbury
The most frequent times of departure to work in Waterbury are 12:00 PM to 3:59 PM (2,940, 12.6%) for males and 8:00 AM to 8:29 AM (3,104, 13.2%) for females.
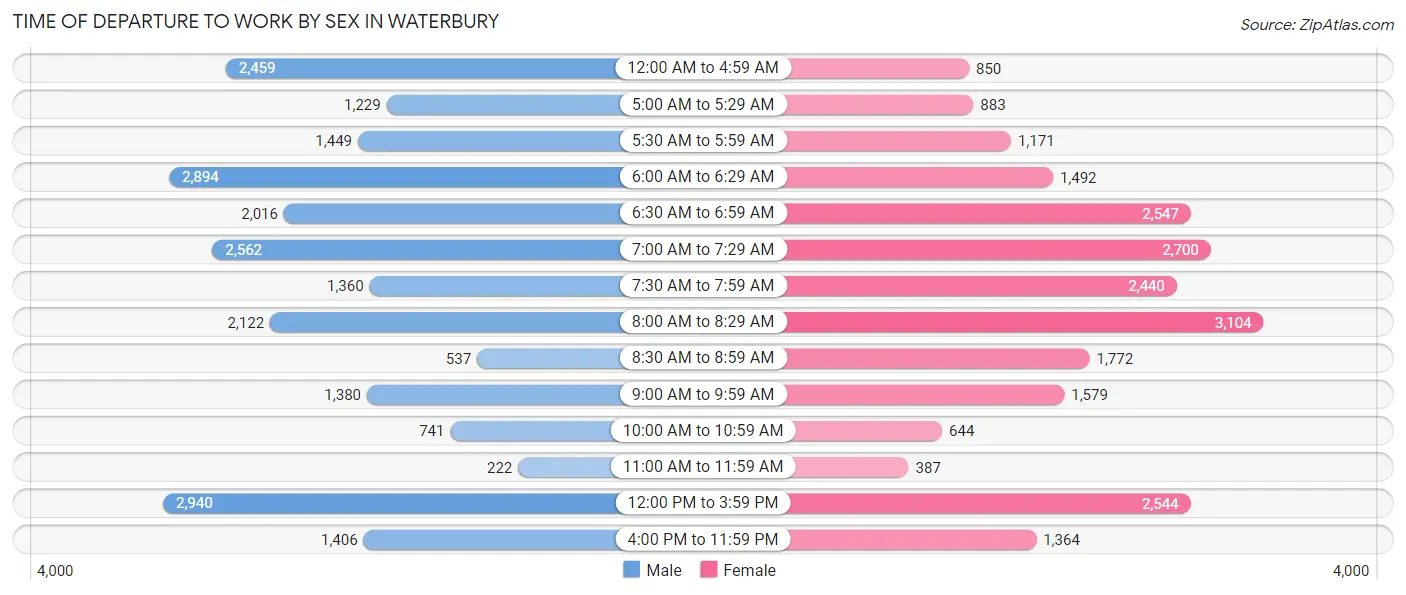
| Time of Departure | Male | Female |
| 12:00 AM to 4:59 AM | 2,459 (10.5%) | 850 (3.6%) |
| 5:00 AM to 5:29 AM | 1,229 (5.3%) | 883 (3.8%) |
| 5:30 AM to 5:59 AM | 1,449 (6.2%) | 1,171 (5.0%) |
| 6:00 AM to 6:29 AM | 2,894 (12.4%) | 1,492 (6.4%) |
| 6:30 AM to 6:59 AM | 2,016 (8.6%) | 2,547 (10.8%) |
| 7:00 AM to 7:29 AM | 2,562 (11.0%) | 2,700 (11.5%) |
| 7:30 AM to 7:59 AM | 1,360 (5.8%) | 2,440 (10.4%) |
| 8:00 AM to 8:29 AM | 2,122 (9.1%) | 3,104 (13.2%) |
| 8:30 AM to 8:59 AM | 537 (2.3%) | 1,772 (7.5%) |
| 9:00 AM to 9:59 AM | 1,380 (5.9%) | 1,579 (6.7%) |
| 10:00 AM to 10:59 AM | 741 (3.2%) | 644 (2.7%) |
| 11:00 AM to 11:59 AM | 222 (0.9%) | 387 (1.7%) |
| 12:00 PM to 3:59 PM | 2,940 (12.6%) | 2,544 (10.8%) |
| 4:00 PM to 11:59 PM | 1,406 (6.0%) | 1,364 (5.8%) |
| Total | 23,317 (100.0%) | 23,477 (100.0%) |
Housing Occupancy in Waterbury
Occupancy by Ownership in Waterbury
Of the total 45,968 dwellings in Waterbury, owner-occupied units account for 20,151 (43.8%), while renter-occupied units make up 25,817 (56.2%).
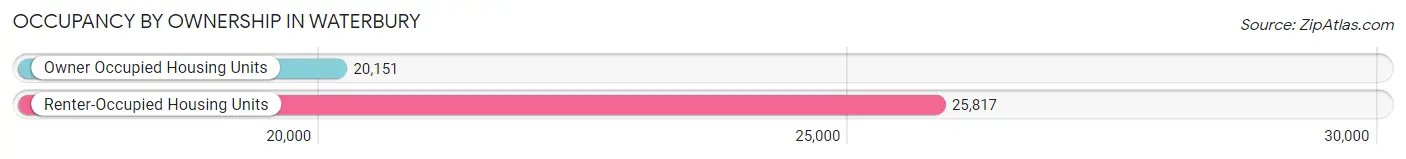
| Occupancy | # Housing Units | % Housing Units |
| Owner Occupied Housing Units | 20,151 | 43.8% |
| Renter-Occupied Housing Units | 25,817 | 56.2% |
| Total Occupied Housing Units | 45,968 | 100.0% |
Occupancy by Household Size in Waterbury
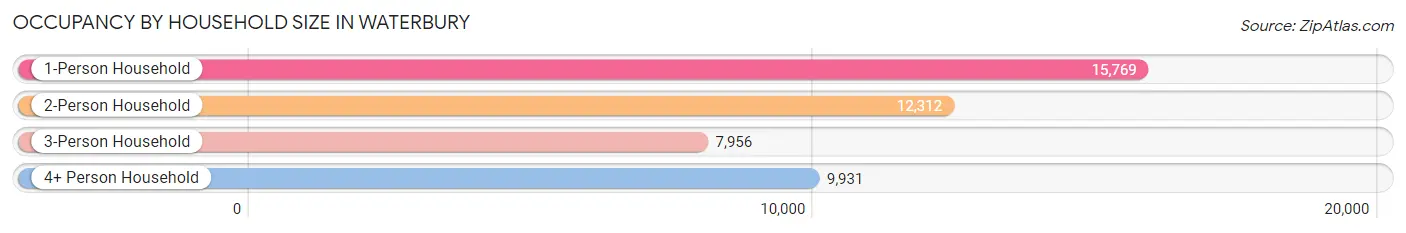
| Household Size | # Housing Units | % Housing Units |
| 1-Person Household | 15,769 | 34.3% |
| 2-Person Household | 12,312 | 26.8% |
| 3-Person Household | 7,956 | 17.3% |
| 4+ Person Household | 9,931 | 21.6% |
| Total Housing Units | 45,968 | 100.0% |
Occupancy by Ownership by Household Size in Waterbury
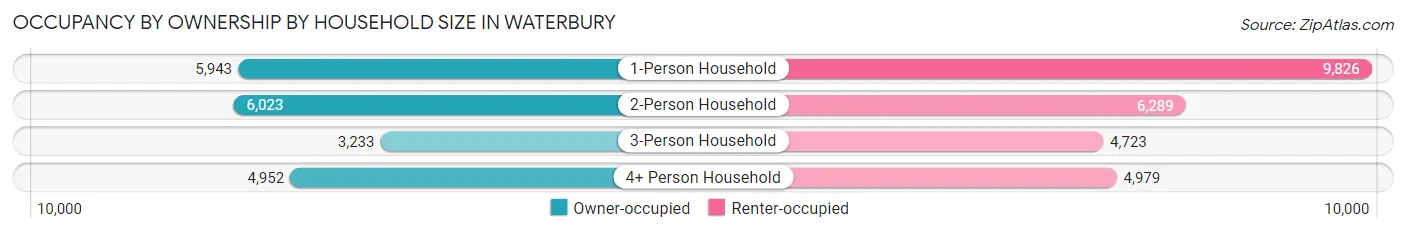
| Household Size | Owner-occupied | Renter-occupied |
| 1-Person Household | 5,943 (37.7%) | 9,826 (62.3%) |
| 2-Person Household | 6,023 (48.9%) | 6,289 (51.1%) |
| 3-Person Household | 3,233 (40.6%) | 4,723 (59.4%) |
| 4+ Person Household | 4,952 (49.9%) | 4,979 (50.1%) |
| Total Housing Units | 20,151 (43.8%) | 25,817 (56.2%) |
Occupancy by Educational Attainment in Waterbury
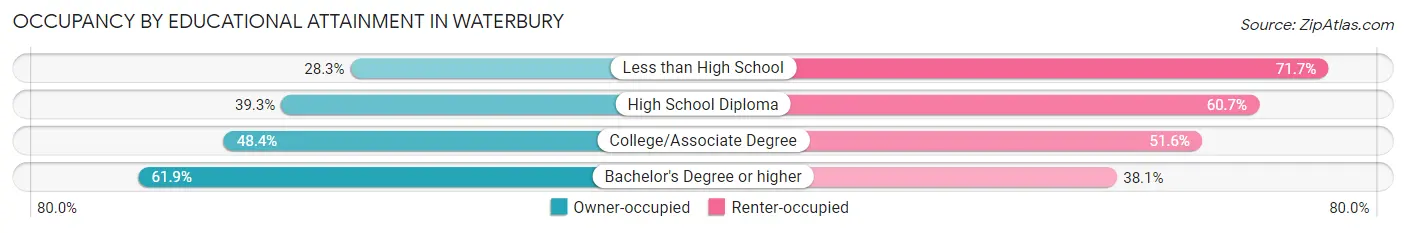
| Household Size | Owner-occupied | Renter-occupied |
| Less than High School | 2,282 (28.3%) | 5,772 (71.7%) |
| High School Diploma | 6,708 (39.3%) | 10,354 (60.7%) |
| College/Associate Degree | 6,253 (48.4%) | 6,672 (51.6%) |
| Bachelor's Degree or higher | 4,908 (61.9%) | 3,019 (38.1%) |
Occupancy by Age of Householder in Waterbury
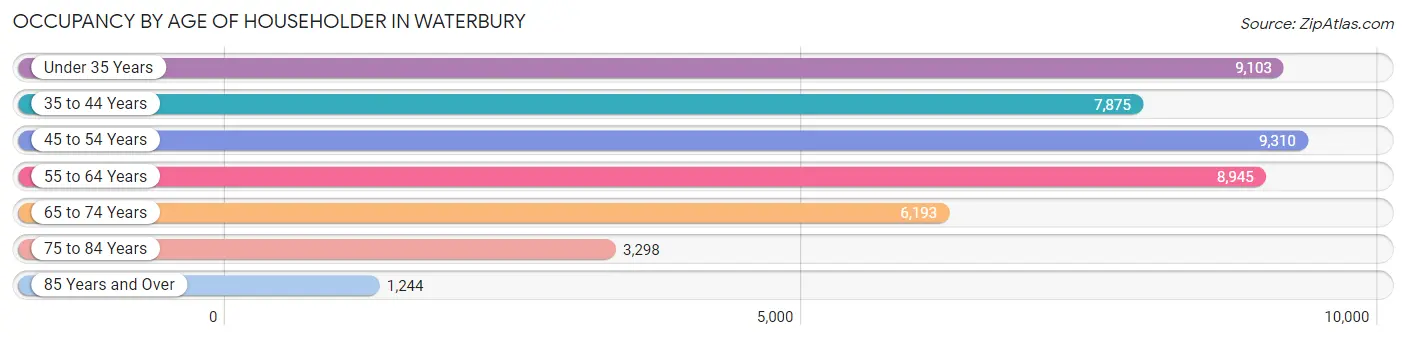
| Age Bracket | # Households | % Households |
| Under 35 Years | 9,103 | 19.8% |
| 35 to 44 Years | 7,875 | 17.1% |
| 45 to 54 Years | 9,310 | 20.3% |
| 55 to 64 Years | 8,945 | 19.5% |
| 65 to 74 Years | 6,193 | 13.5% |
| 75 to 84 Years | 3,298 | 7.2% |
| 85 Years and Over | 1,244 | 2.7% |
| Total | 45,968 | 100.0% |
Housing Finances in Waterbury
Median Income by Occupancy in Waterbury
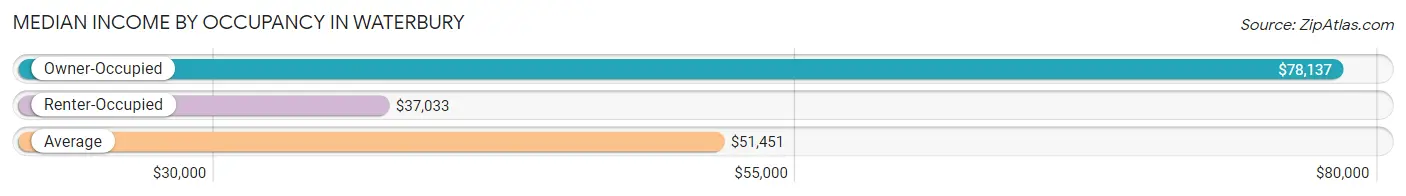
| Occupancy Type | # Households | Median Income |
| Owner-Occupied | 20,151 (43.8%) | $78,137 |
| Renter-Occupied | 25,817 (56.2%) | $37,033 |
| Average | 45,968 (100.0%) | $51,451 |
Occupancy by Householder Income Bracket in Waterbury
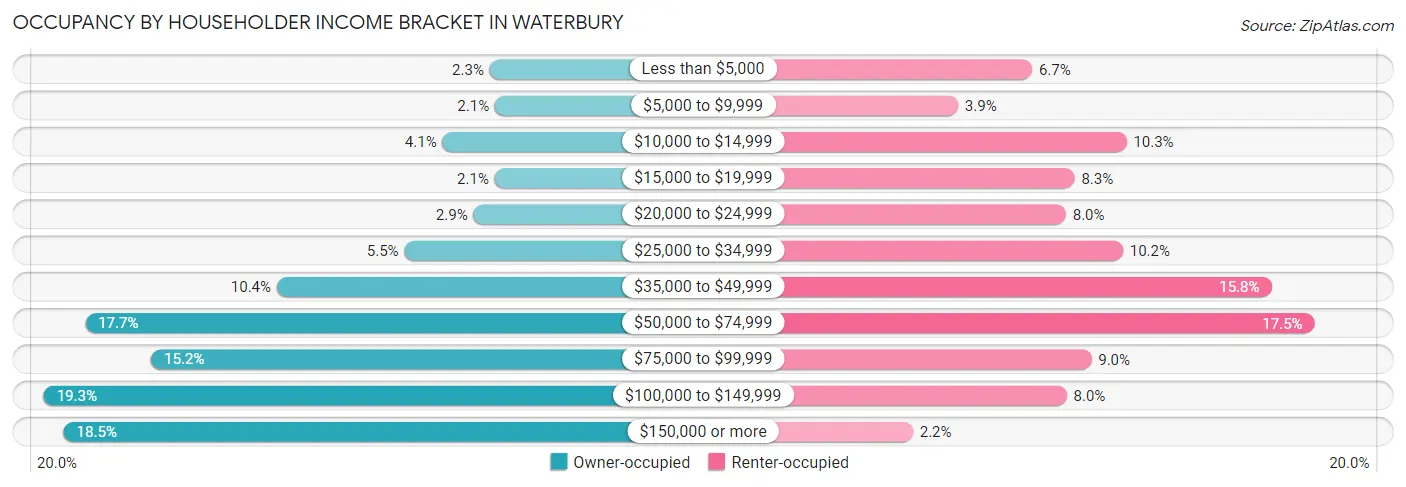
| Income Bracket | Owner-occupied | Renter-occupied |
| Less than $5,000 | 459 (2.3%) | 1,736 (6.7%) |
| $5,000 to $9,999 | 419 (2.1%) | 1,006 (3.9%) |
| $10,000 to $14,999 | 823 (4.1%) | 2,665 (10.3%) |
| $15,000 to $19,999 | 421 (2.1%) | 2,152 (8.3%) |
| $20,000 to $24,999 | 585 (2.9%) | 2,067 (8.0%) |
| $25,000 to $34,999 | 1,114 (5.5%) | 2,628 (10.2%) |
| $35,000 to $49,999 | 2,094 (10.4%) | 4,090 (15.8%) |
| $50,000 to $74,999 | 3,564 (17.7%) | 4,514 (17.5%) |
| $75,000 to $99,999 | 3,059 (15.2%) | 2,319 (9.0%) |
| $100,000 to $149,999 | 3,883 (19.3%) | 2,076 (8.0%) |
| $150,000 or more | 3,730 (18.5%) | 564 (2.2%) |
| Total | 20,151 (100.0%) | 25,817 (100.0%) |
Monthly Housing Cost Tiers in Waterbury
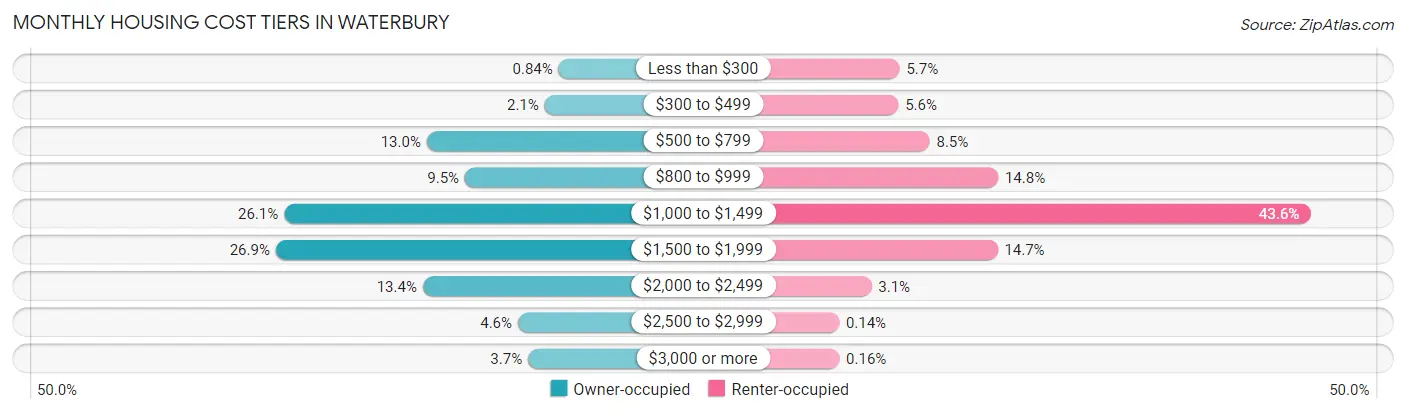
| Monthly Cost | Owner-occupied | Renter-occupied |
| Less than $300 | 169 (0.8%) | 1,475 (5.7%) |
| $300 to $499 | 430 (2.1%) | 1,445 (5.6%) |
| $500 to $799 | 2,616 (13.0%) | 2,190 (8.5%) |
| $800 to $999 | 1,906 (9.5%) | 3,815 (14.8%) |
| $1,000 to $1,499 | 5,261 (26.1%) | 11,258 (43.6%) |
| $1,500 to $1,999 | 5,417 (26.9%) | 3,804 (14.7%) |
| $2,000 to $2,499 | 2,690 (13.4%) | 806 (3.1%) |
| $2,500 to $2,999 | 925 (4.6%) | 37 (0.1%) |
| $3,000 or more | 737 (3.7%) | 41 (0.2%) |
| Total | 20,151 (100.0%) | 25,817 (100.0%) |
Physical Housing Characteristics in Waterbury
Housing Structures in Waterbury
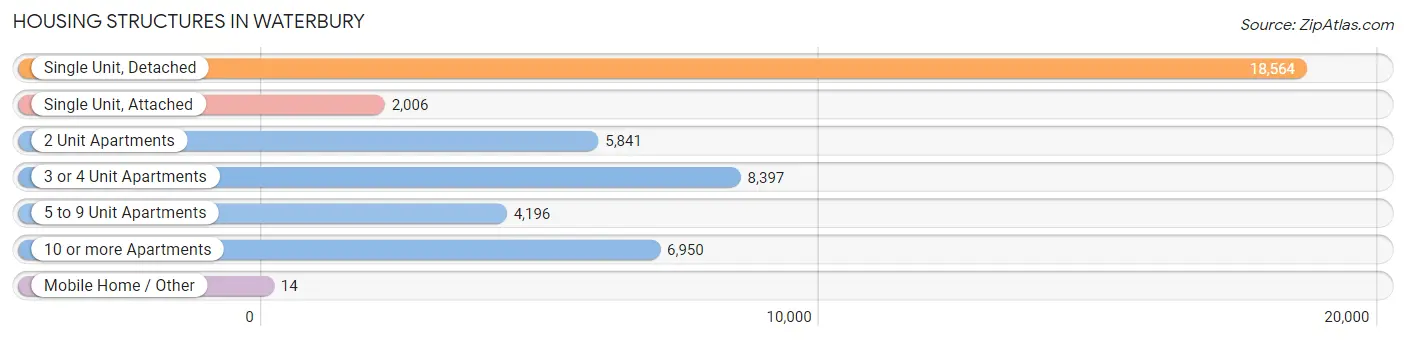
| Structure Type | # Housing Units | % Housing Units |
| Single Unit, Detached | 18,564 | 40.4% |
| Single Unit, Attached | 2,006 | 4.4% |
| 2 Unit Apartments | 5,841 | 12.7% |
| 3 or 4 Unit Apartments | 8,397 | 18.3% |
| 5 to 9 Unit Apartments | 4,196 | 9.1% |
| 10 or more Apartments | 6,950 | 15.1% |
| Mobile Home / Other | 14 | 0.0% |
| Total | 45,968 | 100.0% |
Housing Structures by Occupancy in Waterbury
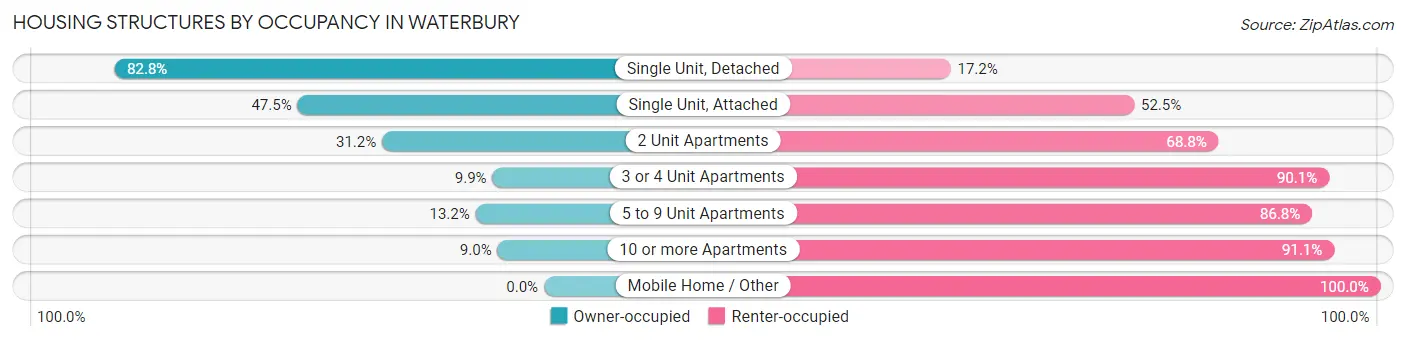
| Structure Type | Owner-occupied | Renter-occupied |
| Single Unit, Detached | 15,369 (82.8%) | 3,195 (17.2%) |
| Single Unit, Attached | 952 (47.5%) | 1,054 (52.5%) |
| 2 Unit Apartments | 1,821 (31.2%) | 4,020 (68.8%) |
| 3 or 4 Unit Apartments | 834 (9.9%) | 7,563 (90.1%) |
| 5 to 9 Unit Apartments | 553 (13.2%) | 3,643 (86.8%) |
| 10 or more Apartments | 622 (8.9%) | 6,328 (91.0%) |
| Mobile Home / Other | 0 (0.0%) | 14 (100.0%) |
| Total | 20,151 (43.8%) | 25,817 (56.2%) |
Housing Structures by Number of Rooms in Waterbury
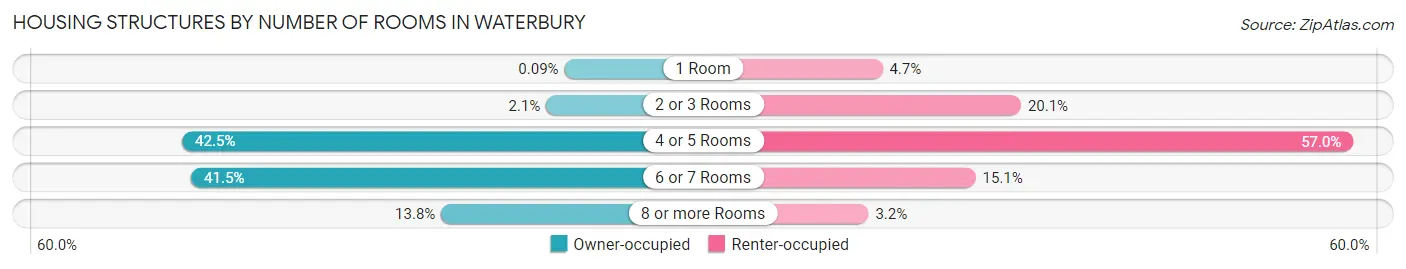
| Number of Rooms | Owner-occupied | Renter-occupied |
| 1 Room | 18 (0.1%) | 1,218 (4.7%) |
| 2 or 3 Rooms | 426 (2.1%) | 5,187 (20.1%) |
| 4 or 5 Rooms | 8,568 (42.5%) | 14,705 (57.0%) |
| 6 or 7 Rooms | 8,365 (41.5%) | 3,888 (15.1%) |
| 8 or more Rooms | 2,774 (13.8%) | 819 (3.2%) |
| Total | 20,151 (100.0%) | 25,817 (100.0%) |
Housing Structure by Heating Type in Waterbury
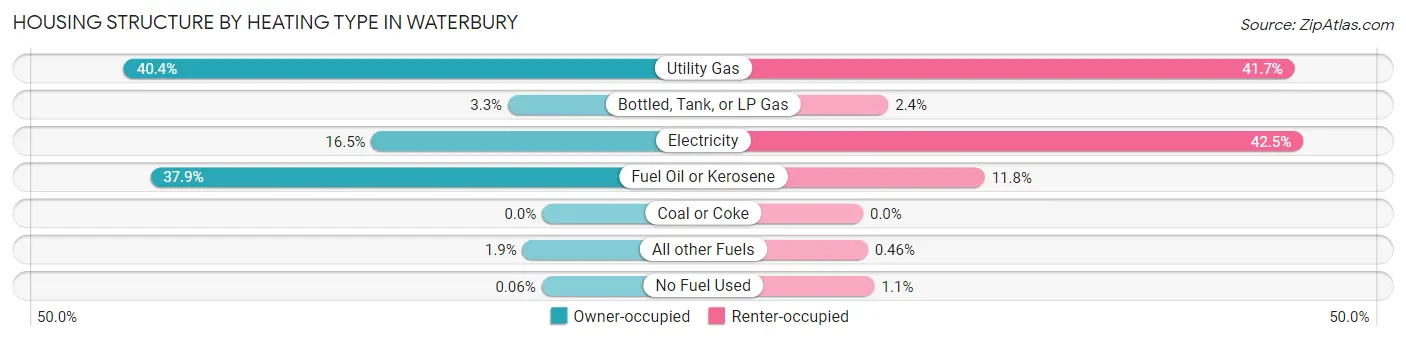
| Heating Type | Owner-occupied | Renter-occupied |
| Utility Gas | 8,143 (40.4%) | 10,766 (41.7%) |
| Bottled, Tank, or LP Gas | 664 (3.3%) | 630 (2.4%) |
| Electricity | 3,323 (16.5%) | 10,974 (42.5%) |
| Fuel Oil or Kerosene | 7,629 (37.9%) | 3,037 (11.8%) |
| Coal or Coke | 0 (0.0%) | 0 (0.0%) |
| All other Fuels | 379 (1.9%) | 120 (0.5%) |
| No Fuel Used | 13 (0.1%) | 290 (1.1%) |
| Total | 20,151 (100.0%) | 25,817 (100.0%) |
Household Vehicle Usage in Waterbury
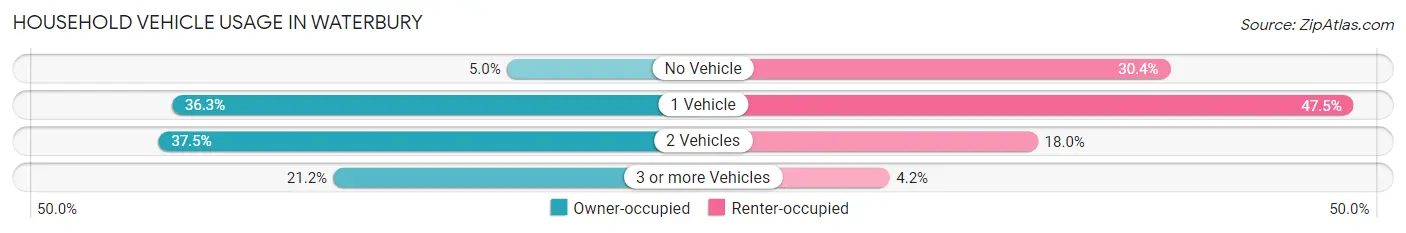
| Vehicles per Household | Owner-occupied | Renter-occupied |
| No Vehicle | 1,009 (5.0%) | 7,842 (30.4%) |
| 1 Vehicle | 7,305 (36.2%) | 12,259 (47.5%) |
| 2 Vehicles | 7,560 (37.5%) | 4,644 (18.0%) |
| 3 or more Vehicles | 4,277 (21.2%) | 1,072 (4.2%) |
| Total | 20,151 (100.0%) | 25,817 (100.0%) |
Real Estate & Mortgages in Waterbury
Real Estate and Mortgage Overview in Waterbury
| Characteristic | Without Mortgage | With Mortgage |
| Housing Units | 6,785 | 13,366 |
| Median Property Value | $148,700 | $171,500 |
| Median Household Income | $65,478 | $2,931 |
| Monthly Housing Costs | $843 | $720 |
| Real Estate Taxes | $4,974 | $186 |
Property Value by Mortgage Status in Waterbury
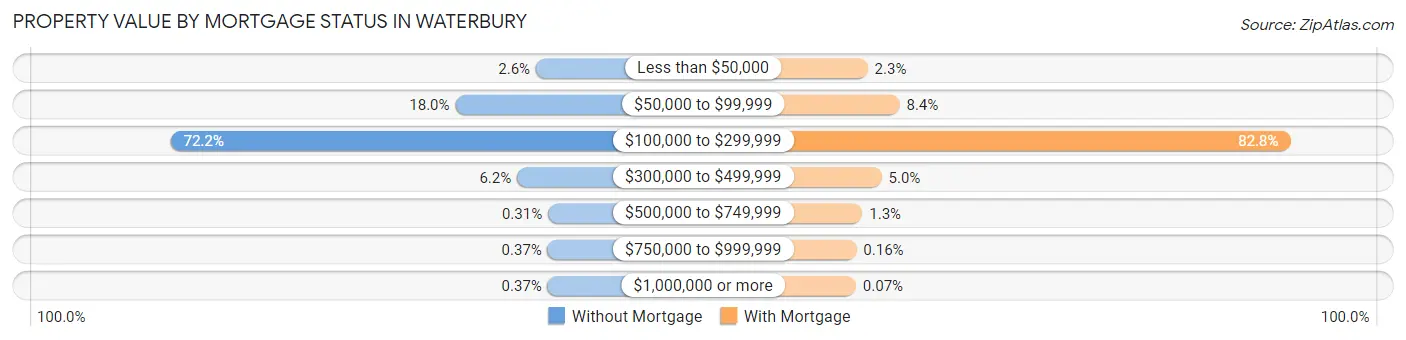
| Property Value | Without Mortgage | With Mortgage |
| Less than $50,000 | 177 (2.6%) | 309 (2.3%) |
| $50,000 to $99,999 | 1,218 (17.9%) | 1,120 (8.4%) |
| $100,000 to $299,999 | 4,898 (72.2%) | 11,069 (82.8%) |
| $300,000 to $499,999 | 421 (6.2%) | 663 (5.0%) |
| $500,000 to $749,999 | 21 (0.3%) | 174 (1.3%) |
| $750,000 to $999,999 | 25 (0.4%) | 22 (0.2%) |
| $1,000,000 or more | 25 (0.4%) | 9 (0.1%) |
| Total | 6,785 (100.0%) | 13,366 (100.0%) |
Household Income by Mortgage Status in Waterbury
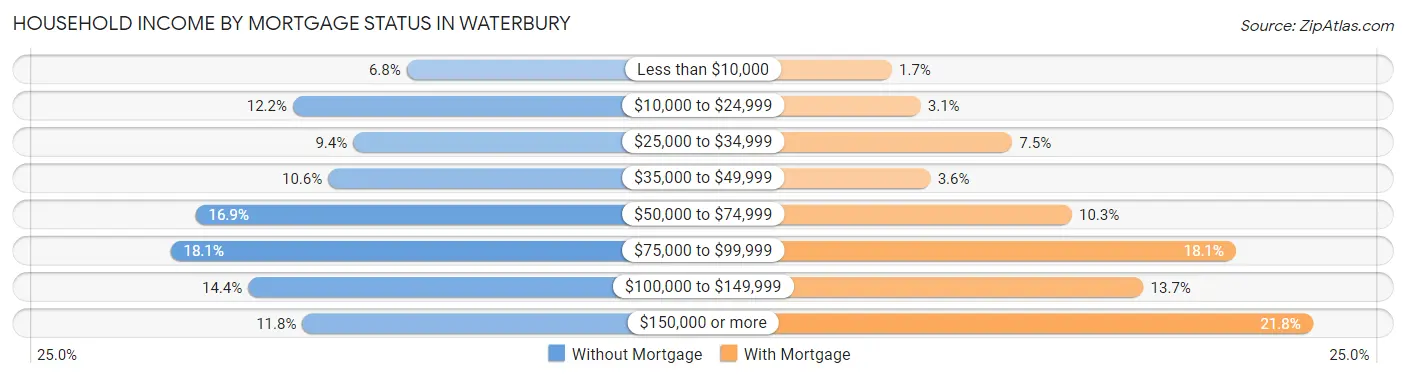
| Household Income | Without Mortgage | With Mortgage |
| Less than $10,000 | 462 (6.8%) | 232 (1.7%) |
| $10,000 to $24,999 | 830 (12.2%) | 416 (3.1%) |
| $25,000 to $34,999 | 635 (9.4%) | 999 (7.5%) |
| $35,000 to $49,999 | 716 (10.5%) | 479 (3.6%) |
| $50,000 to $74,999 | 1,144 (16.9%) | 1,378 (10.3%) |
| $75,000 to $99,999 | 1,225 (18.0%) | 2,420 (18.1%) |
| $100,000 to $149,999 | 974 (14.4%) | 1,834 (13.7%) |
| $150,000 or more | 799 (11.8%) | 2,909 (21.8%) |
| Total | 6,785 (100.0%) | 13,366 (100.0%) |
Property Value to Household Income Ratio in Waterbury
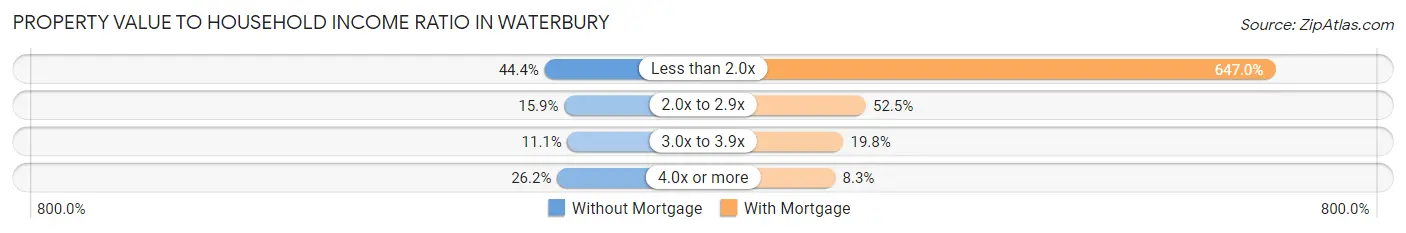
| Value-to-Income Ratio | Without Mortgage | With Mortgage |
| Less than 2.0x | 3,011 (44.4%) | 86,477 (647.0%) |
| 2.0x to 2.9x | 1,078 (15.9%) | 7,014 (52.5%) |
| 3.0x to 3.9x | 751 (11.1%) | 2,646 (19.8%) |
| 4.0x or more | 1,775 (26.2%) | 1,105 (8.3%) |
| Total | 6,785 (100.0%) | 13,366 (100.0%) |
Real Estate Taxes by Mortgage Status in Waterbury
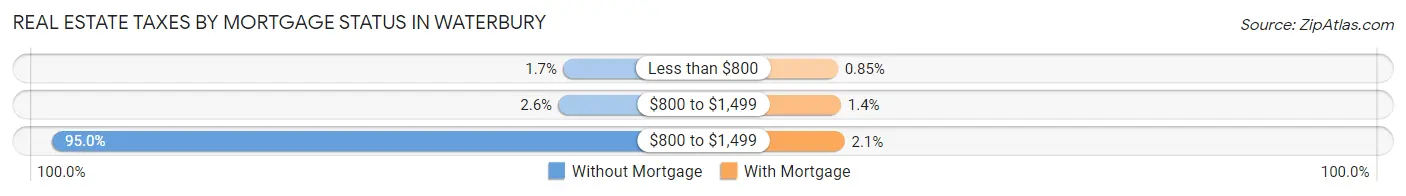
| Property Taxes | Without Mortgage | With Mortgage |
| Less than $800 | 115 (1.7%) | 114 (0.9%) |
| $800 to $1,499 | 176 (2.6%) | 191 (1.4%) |
| $800 to $1,499 | 6,443 (95.0%) | 281 (2.1%) |
| Total | 6,785 (100.0%) | 13,366 (100.0%) |
Health & Disability in Waterbury
Health Insurance Coverage by Age in Waterbury
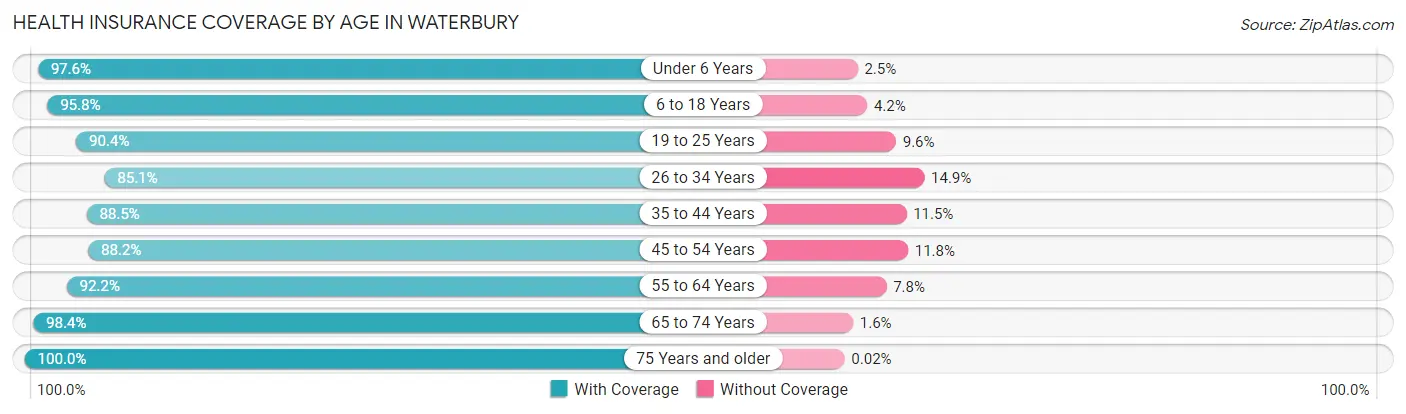
| Age Bracket | With Coverage | Without Coverage |
| Under 6 Years | 8,826 (97.6%) | 222 (2.5%) |
| 6 to 18 Years | 17,587 (95.8%) | 777 (4.2%) |
| 19 to 25 Years | 11,391 (90.4%) | 1,210 (9.6%) |
| 26 to 34 Years | 12,650 (85.1%) | 2,212 (14.9%) |
| 35 to 44 Years | 12,043 (88.5%) | 1,571 (11.5%) |
| 45 to 54 Years | 13,110 (88.2%) | 1,761 (11.8%) |
| 55 to 64 Years | 13,668 (92.2%) | 1,160 (7.8%) |
| 65 to 74 Years | 8,894 (98.4%) | 144 (1.6%) |
| 75 Years and older | 6,352 (100.0%) | 1 (0.0%) |
| Total | 104,521 (92.0%) | 9,058 (8.0%) |
Health Insurance Coverage by Citizenship Status in Waterbury
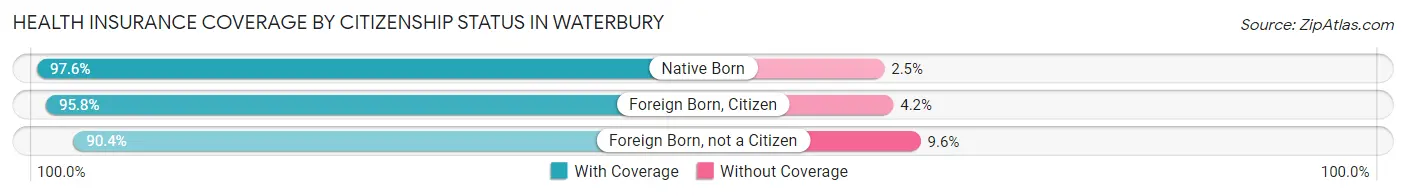
| Citizenship Status | With Coverage | Without Coverage |
| Native Born | 8,826 (97.6%) | 222 (2.5%) |
| Foreign Born, Citizen | 17,587 (95.8%) | 777 (4.2%) |
| Foreign Born, not a Citizen | 11,391 (90.4%) | 1,210 (9.6%) |
Health Insurance Coverage by Household Income in Waterbury
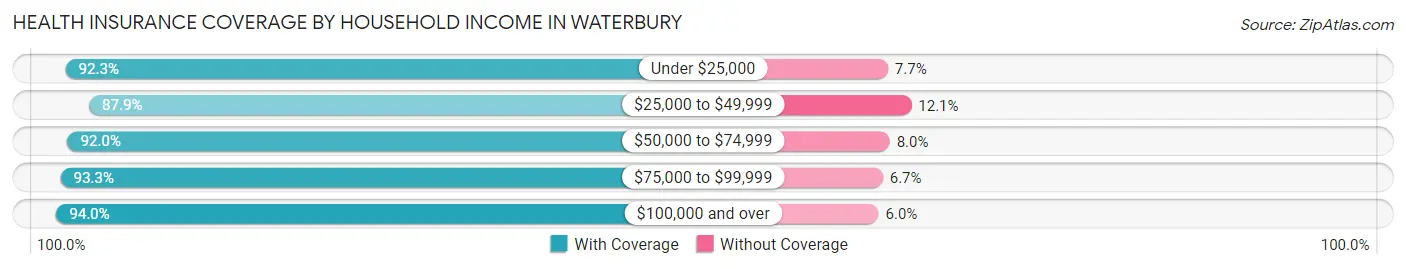
| Household Income | With Coverage | Without Coverage |
| Under $25,000 | 21,561 (92.3%) | 1,798 (7.7%) |
| $25,000 to $49,999 | 19,746 (87.9%) | 2,719 (12.1%) |
| $50,000 to $74,999 | 18,952 (92.0%) | 1,657 (8.0%) |
| $75,000 to $99,999 | 13,244 (93.3%) | 957 (6.7%) |
| $100,000 and over | 30,089 (94.0%) | 1,906 (6.0%) |
Public vs Private Health Insurance Coverage by Age in Waterbury
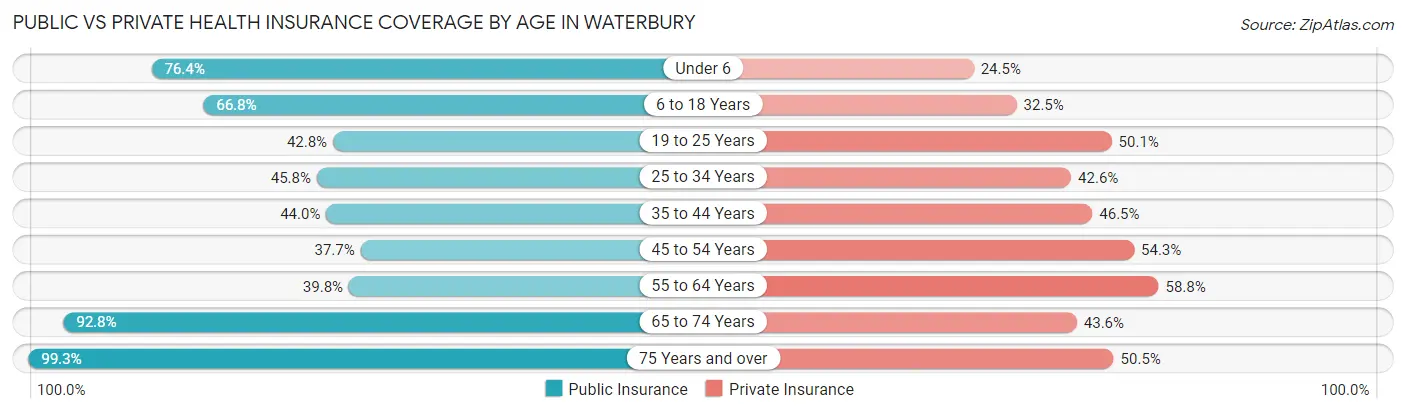
| Age Bracket | Public Insurance | Private Insurance |
| Under 6 | 6,916 (76.4%) | 2,216 (24.5%) |
| 6 to 18 Years | 12,272 (66.8%) | 5,960 (32.5%) |
| 19 to 25 Years | 5,390 (42.8%) | 6,312 (50.1%) |
| 25 to 34 Years | 6,801 (45.8%) | 6,327 (42.6%) |
| 35 to 44 Years | 5,991 (44.0%) | 6,332 (46.5%) |
| 45 to 54 Years | 5,599 (37.7%) | 8,069 (54.3%) |
| 55 to 64 Years | 5,901 (39.8%) | 8,719 (58.8%) |
| 65 to 74 Years | 8,388 (92.8%) | 3,943 (43.6%) |
| 75 Years and over | 6,309 (99.3%) | 3,206 (50.5%) |
| Total | 63,567 (56.0%) | 51,084 (45.0%) |
Disability Status by Sex by Age in Waterbury
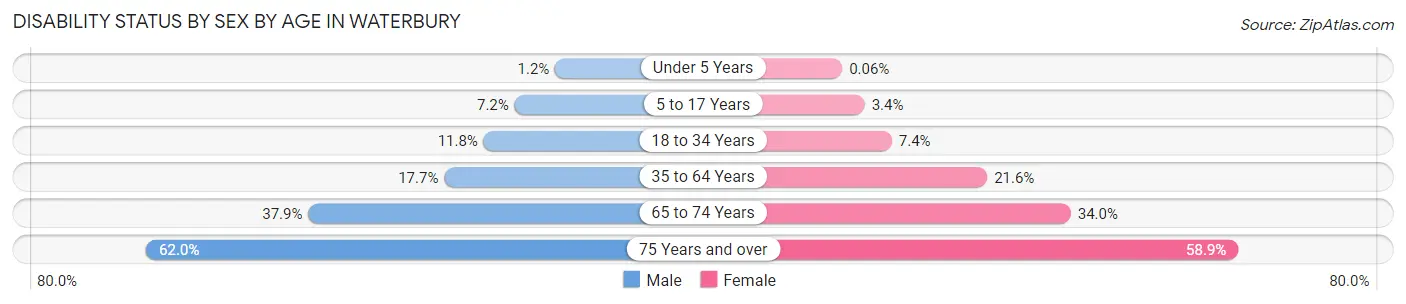
| Age Bracket | Male | Female |
| Under 5 Years | 46 (1.2%) | 2 (0.1%) |
| 5 to 17 Years | 693 (7.2%) | 312 (3.4%) |
| 18 to 34 Years | 1,684 (11.8%) | 1,092 (7.4%) |
| 35 to 64 Years | 3,642 (17.7%) | 4,908 (21.6%) |
| 65 to 74 Years | 1,508 (37.9%) | 1,719 (34.0%) |
| 75 Years and over | 1,496 (62.0%) | 2,318 (58.9%) |
Disability Class by Sex by Age in Waterbury
Disability Class: Hearing Difficulty
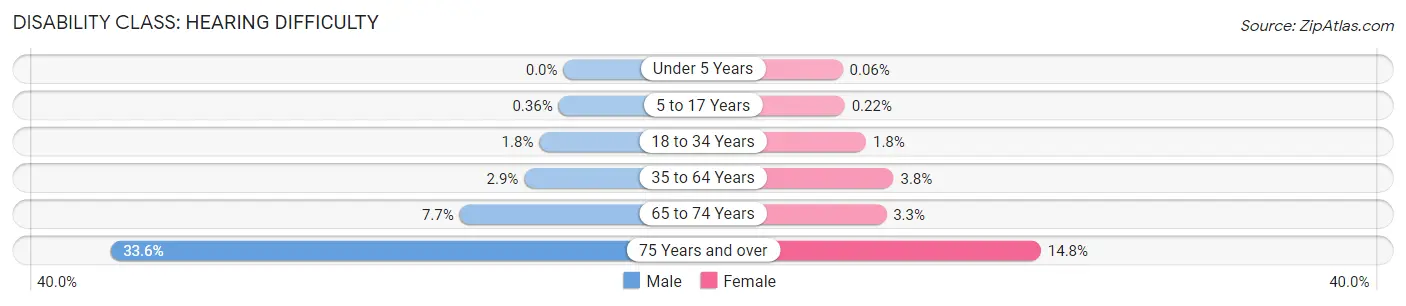
| Age Bracket | Male | Female |
| Under 5 Years | 0 (0.0%) | 2 (0.1%) |
| 5 to 17 Years | 34 (0.4%) | 20 (0.2%) |
| 18 to 34 Years | 255 (1.8%) | 265 (1.8%) |
| 35 to 64 Years | 600 (2.9%) | 872 (3.8%) |
| 65 to 74 Years | 307 (7.7%) | 167 (3.3%) |
| 75 Years and over | 812 (33.6%) | 582 (14.8%) |
Disability Class: Vision Difficulty
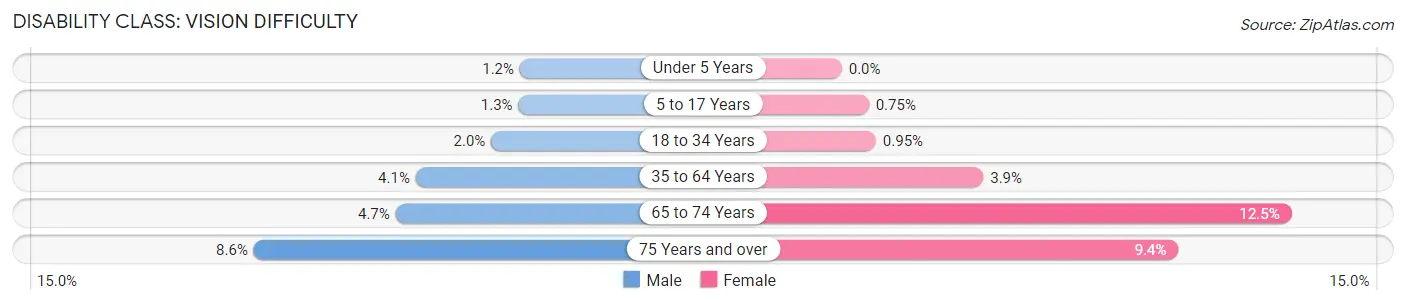
| Age Bracket | Male | Female |
| Under 5 Years | 46 (1.2%) | 0 (0.0%) |
| 5 to 17 Years | 120 (1.3%) | 69 (0.7%) |
| 18 to 34 Years | 286 (2.0%) | 139 (0.9%) |
| 35 to 64 Years | 847 (4.1%) | 895 (3.9%) |
| 65 to 74 Years | 186 (4.7%) | 633 (12.5%) |
| 75 Years and over | 208 (8.6%) | 369 (9.4%) |
Disability Class: Cognitive Difficulty
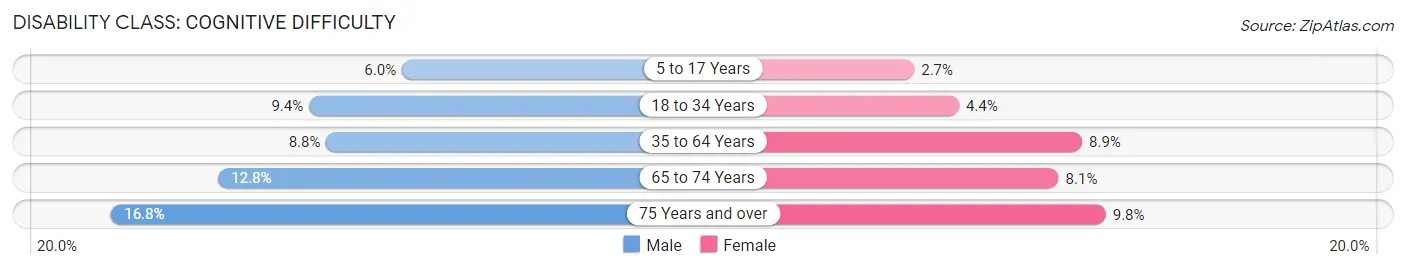
| Age Bracket | Male | Female |
| 5 to 17 Years | 573 (6.0%) | 247 (2.7%) |
| 18 to 34 Years | 1,345 (9.4%) | 639 (4.3%) |
| 35 to 64 Years | 1,811 (8.8%) | 2,027 (8.9%) |
| 65 to 74 Years | 510 (12.8%) | 407 (8.1%) |
| 75 Years and over | 405 (16.8%) | 386 (9.8%) |
Disability Class: Ambulatory Difficulty
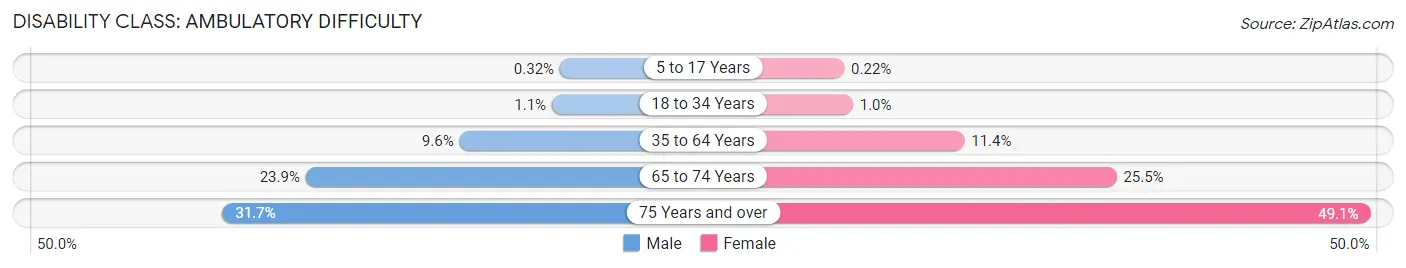
| Age Bracket | Male | Female |
| 5 to 17 Years | 31 (0.3%) | 20 (0.2%) |
| 18 to 34 Years | 151 (1.1%) | 150 (1.0%) |
| 35 to 64 Years | 1,984 (9.6%) | 2,584 (11.4%) |
| 65 to 74 Years | 952 (23.9%) | 1,289 (25.5%) |
| 75 Years and over | 764 (31.7%) | 1,932 (49.0%) |
Disability Class: Self-Care Difficulty
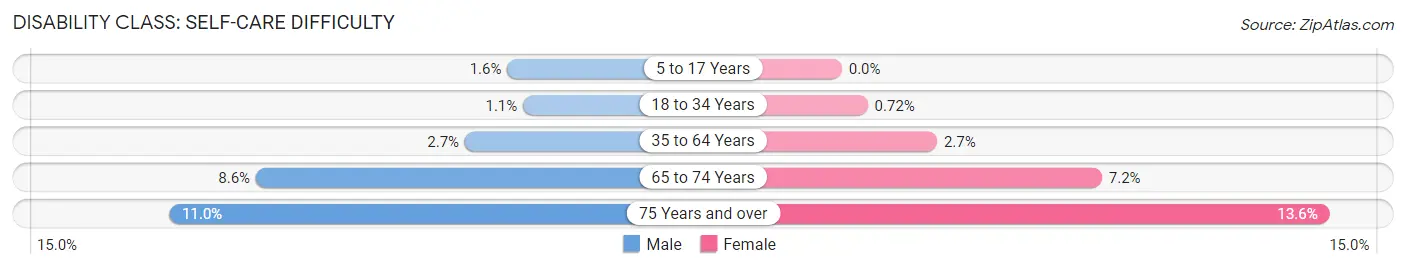
| Age Bracket | Male | Female |
| 5 to 17 Years | 149 (1.6%) | 0 (0.0%) |
| 18 to 34 Years | 160 (1.1%) | 106 (0.7%) |
| 35 to 64 Years | 564 (2.7%) | 603 (2.6%) |
| 65 to 74 Years | 341 (8.6%) | 366 (7.2%) |
| 75 Years and over | 265 (11.0%) | 535 (13.6%) |
Technology Access in Waterbury
Computing Device Access in Waterbury
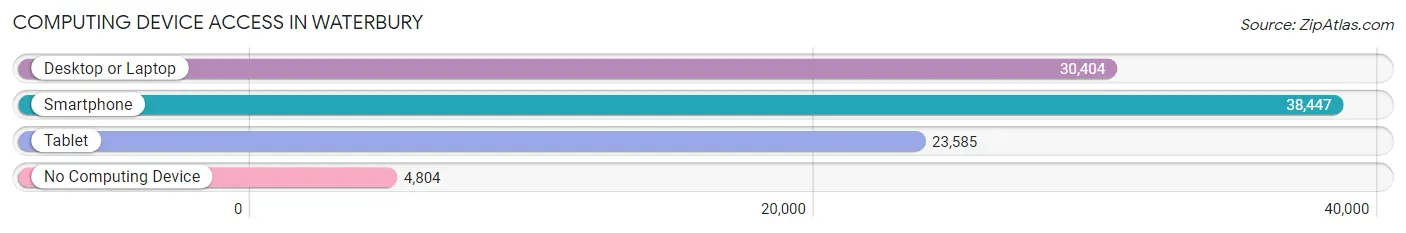
| Device Type | # Households | % Households |
| Desktop or Laptop | 30,404 | 66.1% |
| Smartphone | 38,447 | 83.6% |
| Tablet | 23,585 | 51.3% |
| No Computing Device | 4,804 | 10.4% |
| Total | 45,968 | 100.0% |
Internet Access in Waterbury
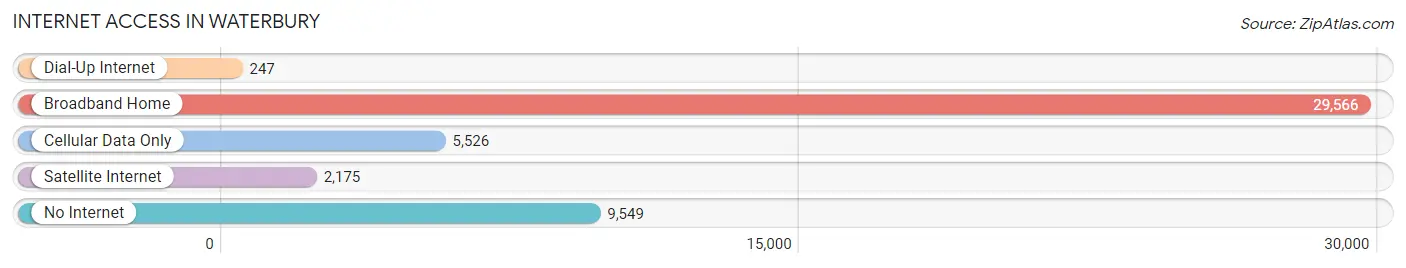
| Internet Type | # Households | % Households |
| Dial-Up Internet | 247 | 0.5% |
| Broadband Home | 29,566 | 64.3% |
| Cellular Data Only | 5,526 | 12.0% |
| Satellite Internet | 2,175 | 4.7% |
| No Internet | 9,549 | 20.8% |
| Total | 45,968 | 100.0% |
Waterbury Summary
Waterbury, Connecticut is a city located in New Haven County, Connecticut. It is the fifth-largest city in the state and the second-largest city in the county. The city is situated in the Naugatuck River Valley, which is part of the Great Valley of Connecticut. Waterbury is located approximately 80 miles northeast of New York City and 40 miles southwest of Hartford, Connecticut.
History
Waterbury was founded in 1674 by a group of settlers from Farmington, Connecticut. The settlers named the area “Mattatuck” after the local Native American tribe. The area was later renamed “Waterbury” in 1686 after the nearby Waterbury River.
In the late 1700s, Waterbury began to develop as an industrial center. The city was home to several factories, including the first brass mill in the United States. The city was also home to the first American-made pocket watch, which was produced by the Waterbury Clock Company in 1853.
In the late 1800s, Waterbury experienced a period of rapid growth and development. The city was home to several large factories, including the American Brass Company, the Scovill Manufacturing Company, and the Chase Brass and Copper Company. The city also became a major center for the production of brass products, including buttons, buckles, and coins.
Geography
Waterbury is located in the Naugatuck River Valley, which is part of the Great Valley of Connecticut. The city is situated at the confluence of the Naugatuck and Mad Rivers. The city is located approximately 80 miles northeast of New York City and 40 miles southwest of Hartford, Connecticut.
The city has a total area of 24.2 square miles, of which 23.7 square miles is land and 0.5 square miles is water. The city is located in a hilly region of the state, with elevations ranging from 200 to 500 feet above sea level.
Economy
Waterbury has a diverse economy that is driven by manufacturing, healthcare, education, and retail. The city is home to several large employers, including the Waterbury Hospital, the University of Connecticut, and the Waterbury Public Schools.
The city is also home to several large manufacturing companies, including the American Brass Company, the Scovill Manufacturing Company, and the Chase Brass and Copper Company. These companies produce a variety of products, including brass products, buttons, buckles, and coins.
Demographics
As of the 2010 census, Waterbury had a population of 110,366. The city has a population density of 4,541 people per square mile. The racial makeup of the city is 63.2% White, 22.3% African American, 0.5% Native American, 2.2% Asian, 0.1% Pacific Islander, 8.7% from other races, and 3.1% from two or more races.
The median household income in Waterbury is $41,945, and the median family income is $50,945. The city has a poverty rate of 24.3%. The city has a high rate of homeownership, with 63.3% of households owning their own homes.
Waterbury is a diverse city with a rich history and a vibrant economy. The city is home to several large employers, including the Waterbury Hospital, the University of Connecticut, and the Waterbury Public Schools. The city is also home to several large manufacturing companies, including the American Brass Company, the Scovill Manufacturing Company, and the Chase Brass and Copper Company. Waterbury is a great place to live, work, and visit.
Common Questions
What is Per Capita Income in Waterbury?
Per Capita income in Waterbury is $28,723.
What is the Median Family Income in Waterbury?
Median Family Income in Waterbury is $64,116.
What is the Median Household income in Waterbury?
Median Household Income in Waterbury is $51,451.
What is Income or Wage Gap in Waterbury?
Income or Wage Gap in Waterbury is 21.2%.
Women in Waterbury earn 78.8 cents for every dollar earned by a man.
What is Family Income Deficit in Waterbury?
Family Income Deficit in Waterbury is $11,309.
Families that are below poverty line in Waterbury earn $11,309 less on average than the poverty threshold level.
What is Inequality or Gini Index in Waterbury?
Inequality or Gini Index in Waterbury is 0.47.
What is the Total Population of Waterbury?
Total Population of Waterbury is 114,480.
What is the Total Male Population of Waterbury?
Total Male Population of Waterbury is 55,072.
What is the Total Female Population of Waterbury?
Total Female Population of Waterbury is 59,408.
What is the Ratio of Males per 100 Females in Waterbury?
There are 92.70 Males per 100 Females in Waterbury.
What is the Ratio of Females per 100 Males in Waterbury?
There are 107.87 Females per 100 Males in Waterbury.
What is the Median Population Age in Waterbury?
Median Population Age in Waterbury is 36.7 Years.
What is the Average Family Size in Waterbury
Average Family Size in Waterbury is 3.1 People.
What is the Average Household Size in Waterbury
Average Household Size in Waterbury is 2.5 People.
How Large is the Labor Force in Waterbury?
There are 56,236 People in the Labor Forcein in Waterbury.
What is the Percentage of People in the Labor Force in Waterbury?
61.7% of People are in the Labor Force in Waterbury.
What is the Unemployment Rate in Waterbury?
Unemployment Rate in Waterbury is 9.8%.