Palos Hills, IL Map & Demographics
Palos Hills Map
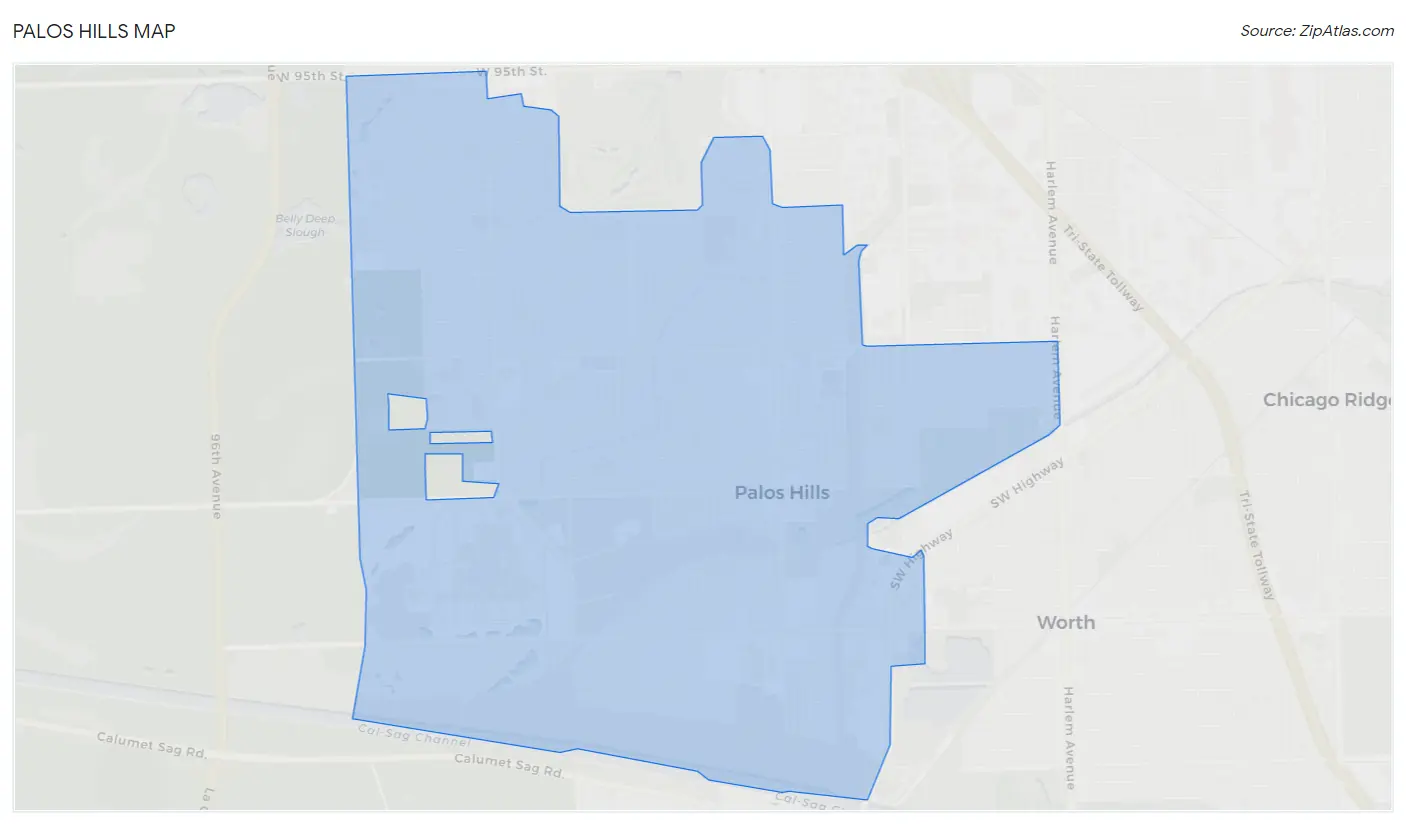
Palos Hills Overview
$39,791
PER CAPITA INCOME
$92,534
AVG FAMILY INCOME
$79,306
AVG HOUSEHOLD INCOME
33.4%
WAGE / INCOME GAP [ % ]
66.6¢/ $1
WAGE / INCOME GAP [ $ ]
$10,362
FAMILY INCOME DEFICIT
0.40
INEQUALITY / GINI INDEX
18,278
TOTAL POPULATION
9,242
MALE POPULATION
9,036
FEMALE POPULATION
102.28
MALES / 100 FEMALES
97.77
FEMALES / 100 MALES
42.2
MEDIAN AGE
3.2
AVG FAMILY SIZE
2.5
AVG HOUSEHOLD SIZE
9,146
LABOR FORCE [ PEOPLE ]
60.8%
PERCENT IN LABOR FORCE
4.9%
UNEMPLOYMENT RATE
Palos Hills Zip Codes
Income in Palos Hills
Income Overview in Palos Hills
Per Capita Income in Palos Hills is $39,791, while median incomes of families and households are $92,534 and $79,306 respectively.
| Characteristic | Number | Measure |
| Per Capita Income | 18,278 | $39,791 |
| Median Family Income | 4,618 | $92,534 |
| Mean Family Income | 4,618 | $107,669 |
| Median Household Income | 7,356 | $79,306 |
| Mean Household Income | 7,356 | $97,604 |
| Income Deficit | 4,618 | $10,362 |
| Wage / Income Gap (%) | 18,278 | 33.44% |
| Wage / Income Gap ($) | 18,278 | 66.56¢ per $1 |
| Gini / Inequality Index | 18,278 | 0.40 |
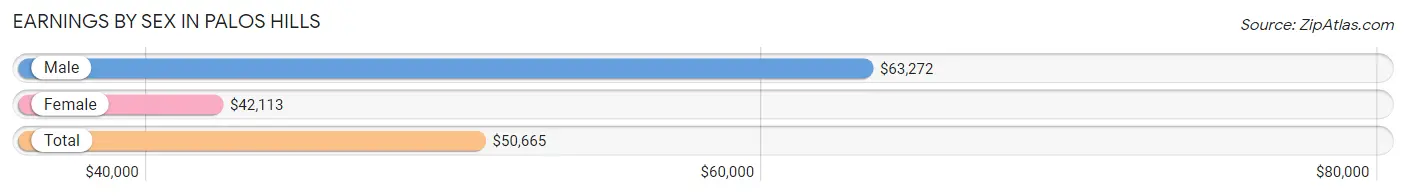
Earnings by Sex in Palos Hills
Average Earnings in Palos Hills are $50,665, $63,272 for men and $42,113 for women, a difference of 33.4%.
| Sex | Number | Average Earnings |
| Male | 5,175 (53.5%) | $63,272 |
| Female | 4,500 (46.5%) | $42,113 |
| Total | 9,675 (100.0%) | $50,665 |
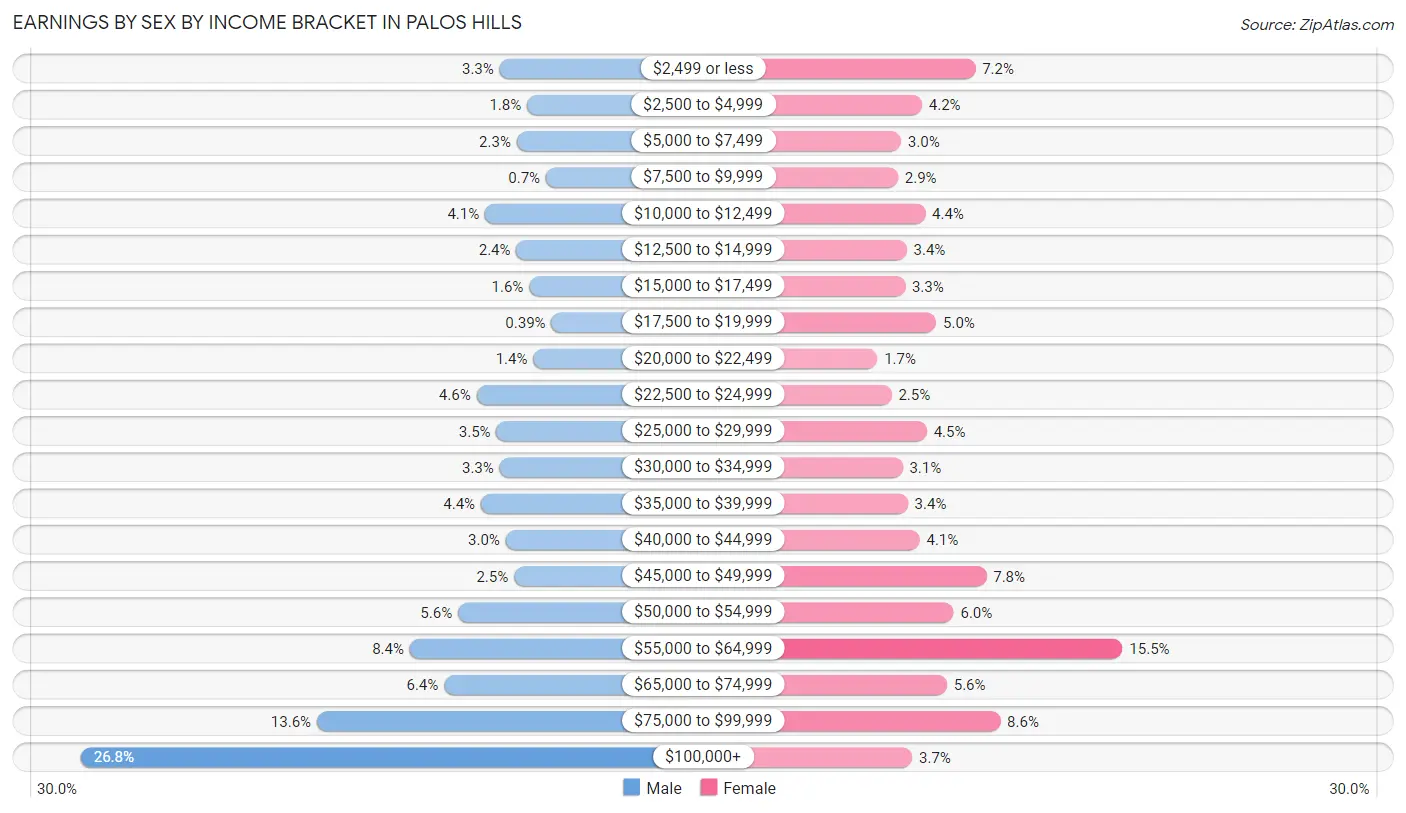
Earnings by Sex by Income Bracket in Palos Hills
The most common earnings brackets in Palos Hills are $100,000+ for men (1,389 | 26.8%) and $55,000 to $64,999 for women (697 | 15.5%).
| Income | Male | Female |
| $2,499 or less | 171 (3.3%) | 325 (7.2%) |
| $2,500 to $4,999 | 91 (1.8%) | 190 (4.2%) |
| $5,000 to $7,499 | 121 (2.3%) | 137 (3.0%) |
| $7,500 to $9,999 | 36 (0.7%) | 129 (2.9%) |
| $10,000 to $12,499 | 213 (4.1%) | 198 (4.4%) |
| $12,500 to $14,999 | 122 (2.4%) | 151 (3.4%) |
| $15,000 to $17,499 | 85 (1.6%) | 147 (3.3%) |
| $17,500 to $19,999 | 20 (0.4%) | 226 (5.0%) |
| $20,000 to $22,499 | 73 (1.4%) | 77 (1.7%) |
| $22,500 to $24,999 | 238 (4.6%) | 113 (2.5%) |
| $25,000 to $29,999 | 180 (3.5%) | 202 (4.5%) |
| $30,000 to $34,999 | 171 (3.3%) | 141 (3.1%) |
| $35,000 to $39,999 | 225 (4.3%) | 154 (3.4%) |
| $40,000 to $44,999 | 153 (3.0%) | 184 (4.1%) |
| $45,000 to $49,999 | 129 (2.5%) | 353 (7.8%) |
| $50,000 to $54,999 | 292 (5.6%) | 270 (6.0%) |
| $55,000 to $64,999 | 432 (8.4%) | 697 (15.5%) |
| $65,000 to $74,999 | 332 (6.4%) | 253 (5.6%) |
| $75,000 to $99,999 | 702 (13.6%) | 388 (8.6%) |
| $100,000+ | 1,389 (26.8%) | 165 (3.7%) |
| Total | 5,175 (100.0%) | 4,500 (100.0%) |
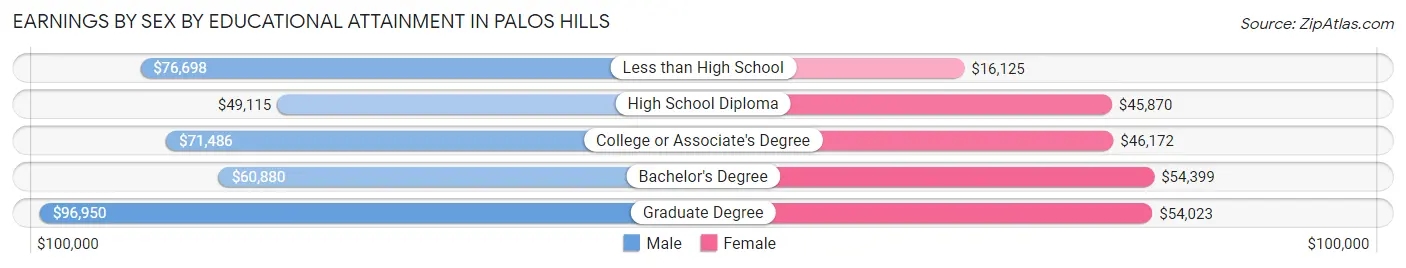
Earnings by Sex by Educational Attainment in Palos Hills
Average earnings in Palos Hills are $68,350 for men and $47,010 for women, a difference of 31.2%. Men with an educational attainment of graduate degree enjoy the highest average annual earnings of $96,950, while those with high school diploma education earn the least with $49,115. Women with an educational attainment of bachelor's degree earn the most with the average annual earnings of $54,399, while those with less than high school education have the smallest earnings of $16,125.
| Educational Attainment | Male Income | Female Income |
| Less than High School | $76,698 | $16,125 |
| High School Diploma | $49,115 | $45,870 |
| College or Associate's Degree | $71,486 | $46,172 |
| Bachelor's Degree | $60,880 | $54,399 |
| Graduate Degree | $96,950 | $54,023 |
| Total | $68,350 | $47,010 |
Family Income in Palos Hills
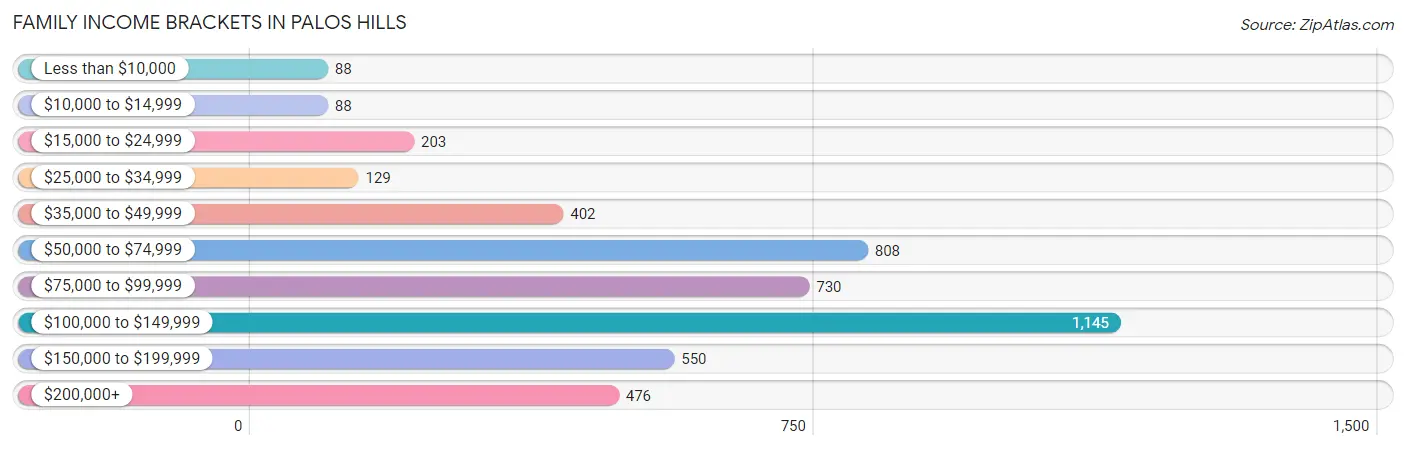
Family Income Brackets in Palos Hills
According to the Palos Hills family income data, there are 1,145 families falling into the $100,000 to $149,999 income range, which is the most common income bracket and makes up 24.8% of all families. Conversely, the less than $10,000 income bracket is the least frequent group with only 88 families (1.9%) belonging to this category.
| Income Bracket | # Families | % Families |
| Less than $10,000 | 88 | 1.9% |
| $10,000 to $14,999 | 88 | 1.9% |
| $15,000 to $24,999 | 203 | 4.4% |
| $25,000 to $34,999 | 129 | 2.8% |
| $35,000 to $49,999 | 402 | 8.7% |
| $50,000 to $74,999 | 808 | 17.5% |
| $75,000 to $99,999 | 730 | 15.8% |
| $100,000 to $149,999 | 1,145 | 24.8% |
| $150,000 to $199,999 | 550 | 11.9% |
| $200,000+ | 476 | 10.3% |
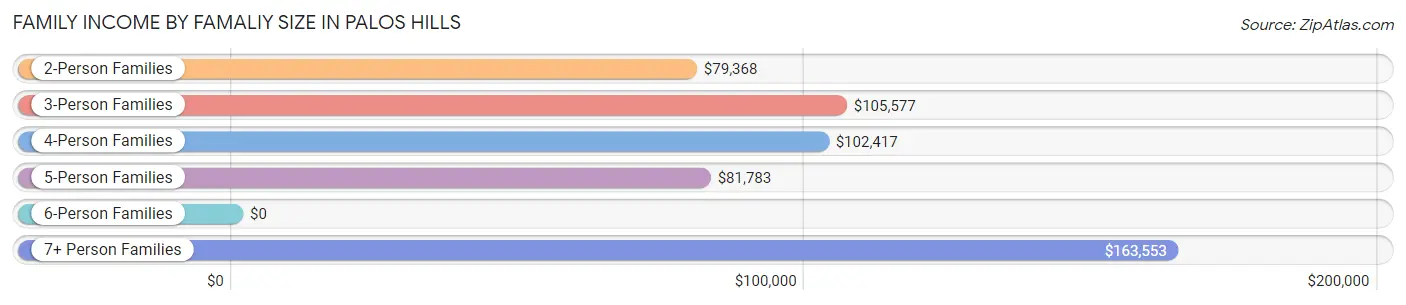
Family Income by Famaliy Size in Palos Hills
7+ person families (74 | 1.6%) account for the highest median family income in Palos Hills with $163,553 per family, while 2-person families (1,943 | 42.1%) have the highest median income of $39,684 per family member.
| Income Bracket | # Families | Median Income |
| 2-Person Families | 1,943 (42.1%) | $79,368 |
| 3-Person Families | 1,204 (26.1%) | $105,577 |
| 4-Person Families | 970 (21.0%) | $102,417 |
| 5-Person Families | 279 (6.0%) | $81,783 |
| 6-Person Families | 148 (3.2%) | $0 |
| 7+ Person Families | 74 (1.6%) | $163,553 |
| Total | 4,618 (100.0%) | $92,534 |
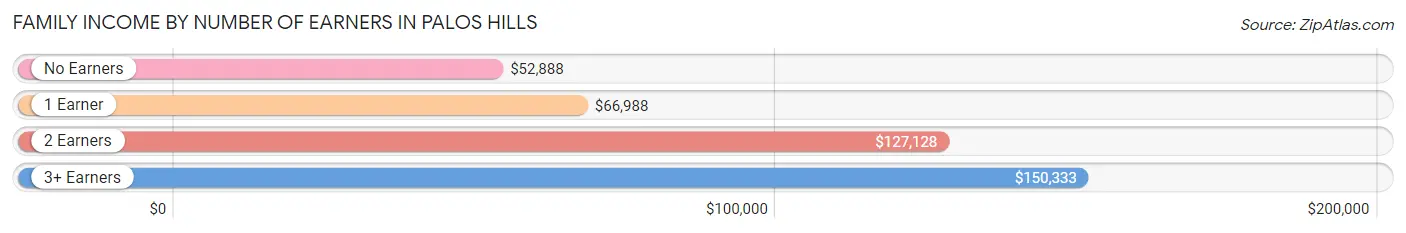
Family Income by Number of Earners in Palos Hills
The median family income in Palos Hills is $92,534, with families comprising 3+ earners (700) having the highest median family income of $150,333, while families with no earners (593) have the lowest median family income of $52,888, accounting for 15.2% and 12.8% of families, respectively.
| Number of Earners | # Families | Median Income |
| No Earners | 593 (12.8%) | $52,888 |
| 1 Earner | 1,705 (36.9%) | $66,988 |
| 2 Earners | 1,620 (35.1%) | $127,128 |
| 3+ Earners | 700 (15.2%) | $150,333 |
| Total | 4,618 (100.0%) | $92,534 |
Household Income in Palos Hills
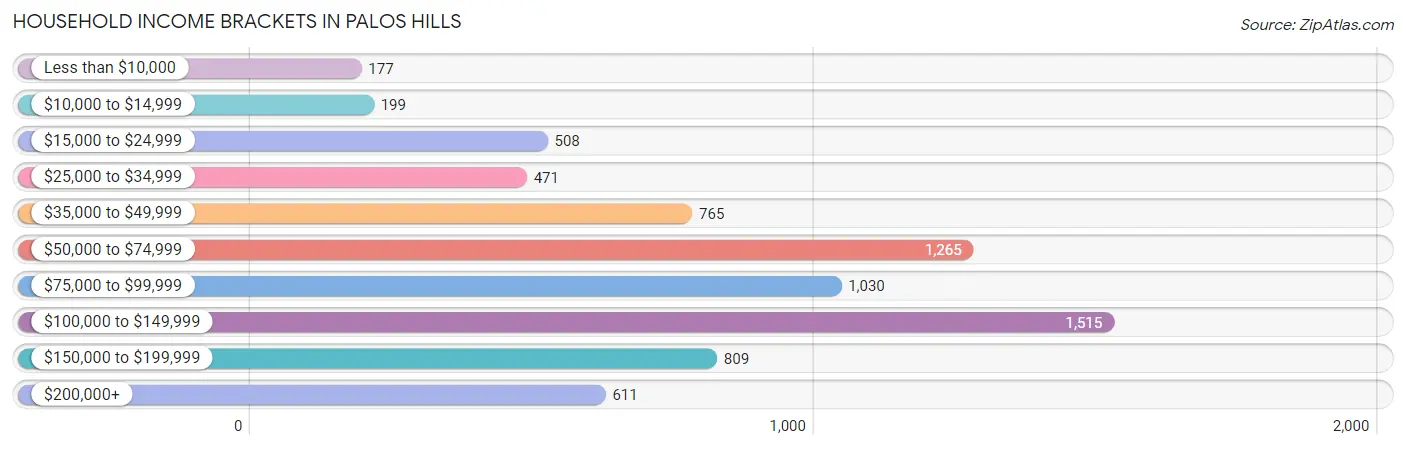
Household Income Brackets in Palos Hills
With 1,515 households falling in the category, the $100,000 to $149,999 income range is the most frequent in Palos Hills, accounting for 20.6% of all households. In contrast, only 177 households (2.4%) fall into the less than $10,000 income bracket, making it the least populous group.
| Income Bracket | # Households | % Households |
| Less than $10,000 | 177 | 2.4% |
| $10,000 to $14,999 | 199 | 2.7% |
| $15,000 to $24,999 | 508 | 6.9% |
| $25,000 to $34,999 | 471 | 6.4% |
| $35,000 to $49,999 | 765 | 10.4% |
| $50,000 to $74,999 | 1,265 | 17.2% |
| $75,000 to $99,999 | 1,030 | 14.0% |
| $100,000 to $149,999 | 1,515 | 20.6% |
| $150,000 to $199,999 | 809 | 11.0% |
| $200,000+ | 611 | 8.3% |
Household Income by Householder Age in Palos Hills
The median household income in Palos Hills is $79,306, with the highest median household income of $106,058 found in the 45 to 64 years age bracket for the primary householder. A total of 2,575 households (35.0%) fall into this category. Meanwhile, the 65+ years age bracket for the primary householder has the lowest median household income of $54,649, with 2,356 households (32.0%) in this group.
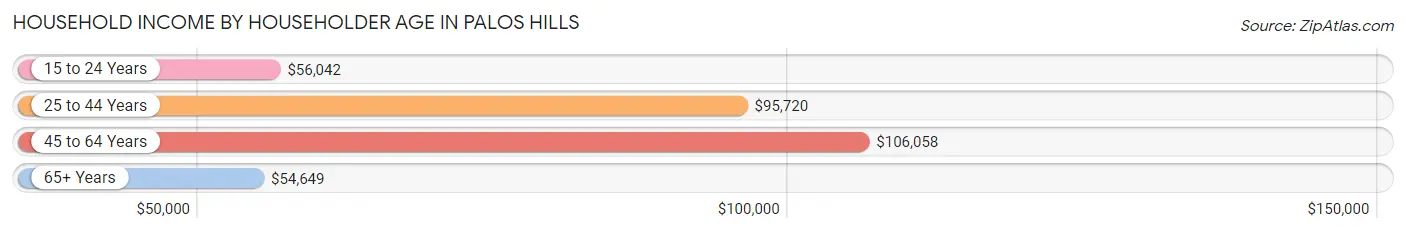
| Income Bracket | # Households | Median Income |
| 15 to 24 Years | 93 (1.3%) | $56,042 |
| 25 to 44 Years | 2,332 (31.7%) | $95,720 |
| 45 to 64 Years | 2,575 (35.0%) | $106,058 |
| 65+ Years | 2,356 (32.0%) | $54,649 |
| Total | 7,356 (100.0%) | $79,306 |
Poverty in Palos Hills
Income Below Poverty by Sex and Age in Palos Hills
With 6.8% poverty level for males and 13.6% for females among the residents of Palos Hills, 6 to 11 year old males and 15 year old females are the most vulnerable to poverty, with 111 males (14.8%) and 162 females (83.1%) in their respective age groups living below the poverty level.
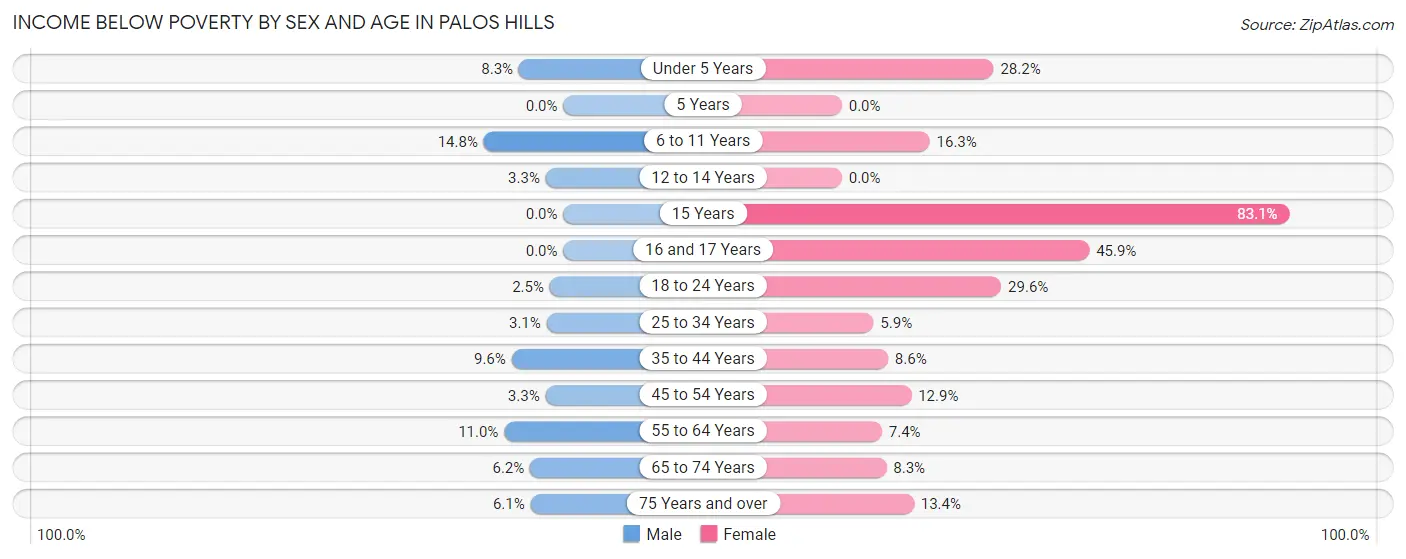
| Age Bracket | Male | Female |
| Under 5 Years | 35 (8.3%) | 58 (28.2%) |
| 5 Years | 0 (0.0%) | 0 (0.0%) |
| 6 to 11 Years | 111 (14.8%) | 44 (16.3%) |
| 12 to 14 Years | 16 (3.3%) | 0 (0.0%) |
| 15 Years | 0 (0.0%) | 162 (83.1%) |
| 16 and 17 Years | 0 (0.0%) | 107 (45.9%) |
| 18 to 24 Years | 14 (2.5%) | 210 (29.6%) |
| 25 to 34 Years | 31 (3.1%) | 58 (5.9%) |
| 35 to 44 Years | 150 (9.6%) | 110 (8.6%) |
| 45 to 54 Years | 33 (3.3%) | 146 (12.9%) |
| 55 to 64 Years | 137 (11.0%) | 97 (7.4%) |
| 65 to 74 Years | 64 (6.2%) | 86 (8.3%) |
| 75 Years and over | 33 (6.1%) | 138 (13.4%) |
| Total | 624 (6.8%) | 1,216 (13.6%) |
Income Above Poverty by Sex and Age in Palos Hills
According to the poverty statistics in Palos Hills, males aged 5 years and females aged 5 years are the age groups that are most secure financially, with 100.0% of males and 100.0% of females in these age groups living above the poverty line.
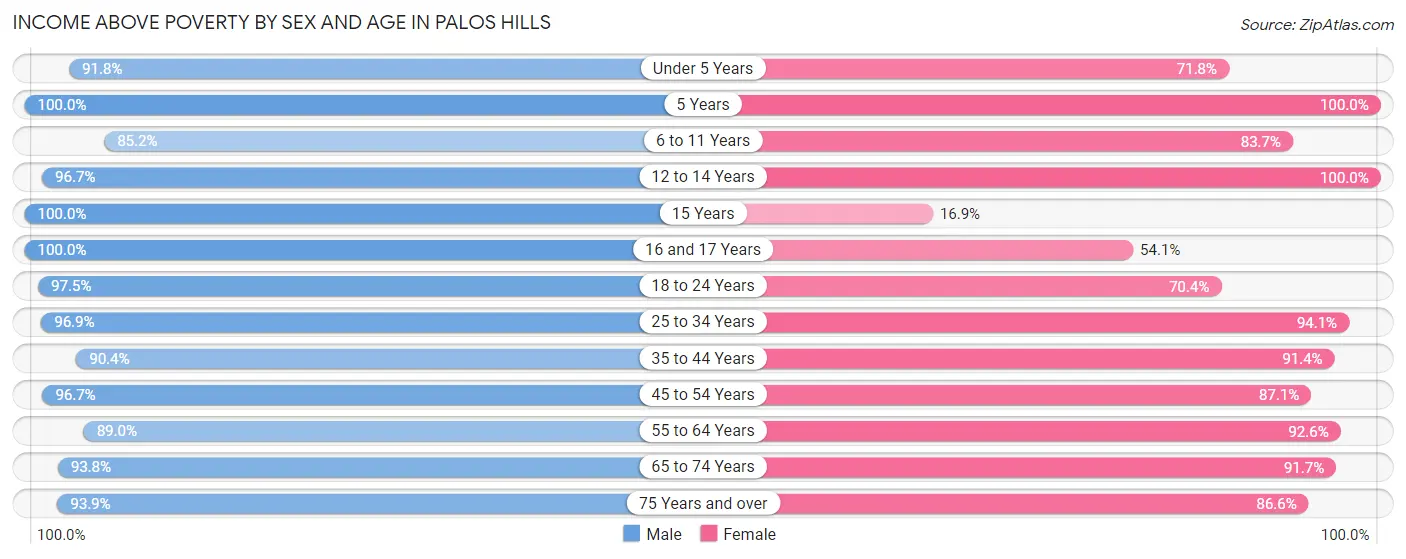
| Age Bracket | Male | Female |
| Under 5 Years | 389 (91.7%) | 148 (71.8%) |
| 5 Years | 185 (100.0%) | 185 (100.0%) |
| 6 to 11 Years | 640 (85.2%) | 226 (83.7%) |
| 12 to 14 Years | 473 (96.7%) | 363 (100.0%) |
| 15 Years | 126 (100.0%) | 33 (16.9%) |
| 16 and 17 Years | 236 (100.0%) | 126 (54.1%) |
| 18 to 24 Years | 544 (97.5%) | 500 (70.4%) |
| 25 to 34 Years | 967 (96.9%) | 930 (94.1%) |
| 35 to 44 Years | 1,412 (90.4%) | 1,175 (91.4%) |
| 45 to 54 Years | 962 (96.7%) | 987 (87.1%) |
| 55 to 64 Years | 1,111 (89.0%) | 1,207 (92.6%) |
| 65 to 74 Years | 974 (93.8%) | 954 (91.7%) |
| 75 Years and over | 509 (93.9%) | 894 (86.6%) |
| Total | 8,528 (93.2%) | 7,728 (86.4%) |
Income Below Poverty Among Married-Couple Families in Palos Hills
The poverty statistics for married-couple families in Palos Hills show that 8.0% or 264 of the total 3,308 families live below the poverty line. Families with 5 or more children have the highest poverty rate of 100.0%, comprising of 21 families. On the other hand, families with no children have the lowest poverty rate of 3.8%, which includes 79 families.
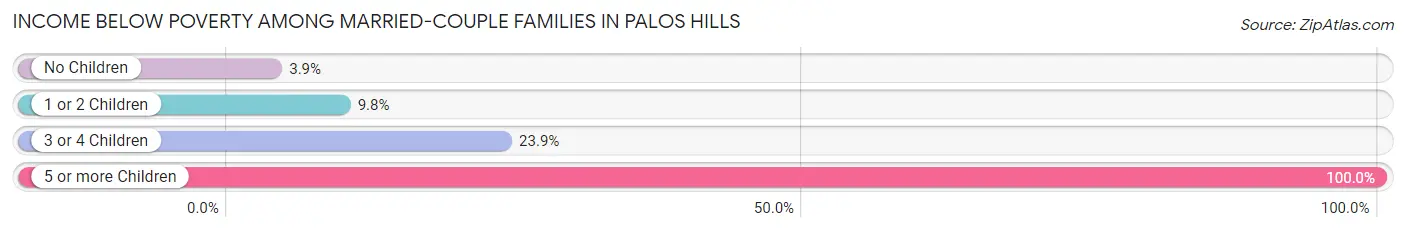
| Children | Above Poverty | Below Poverty |
| No Children | 1,974 (96.2%) | 79 (3.8%) |
| 1 or 2 Children | 837 (90.2%) | 91 (9.8%) |
| 3 or 4 Children | 233 (76.1%) | 73 (23.9%) |
| 5 or more Children | 0 (0.0%) | 21 (100.0%) |
| Total | 3,044 (92.0%) | 264 (8.0%) |
Income Below Poverty Among Single-Parent Households in Palos Hills
According to the poverty data in Palos Hills, 10.3% or 54 single-father households and 8.3% or 65 single-mother households are living below the poverty line. Among single-father households, those with 1 or 2 children have the highest poverty rate, with 38 households (29.9%) experiencing poverty. Likewise, among single-mother households, those with no children have the highest poverty rate, with 41 households (9.2%) falling below the poverty line.
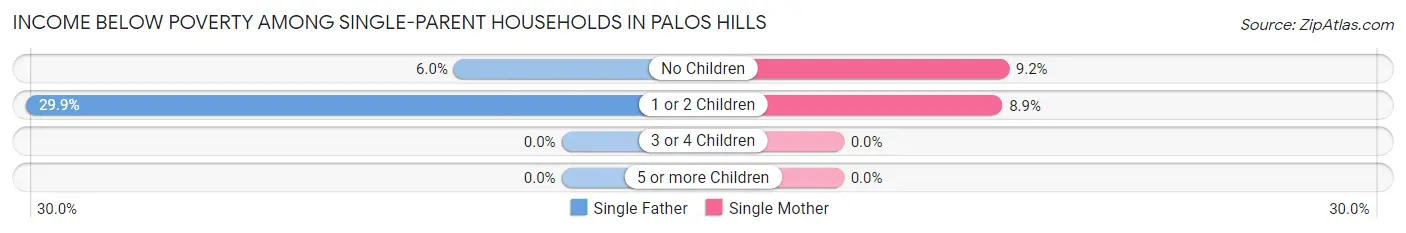
| Children | Single Father | Single Mother |
| No Children | 16 (6.0%) | 41 (9.2%) |
| 1 or 2 Children | 38 (29.9%) | 24 (8.9%) |
| 3 or 4 Children | 0 (0.0%) | 0 (0.0%) |
| 5 or more Children | 0 (0.0%) | 0 (0.0%) |
| Total | 54 (10.3%) | 65 (8.3%) |
Income Below Poverty Among Married-Couple vs Single-Parent Households in Palos Hills
The poverty data for Palos Hills shows that 264 of the married-couple family households (8.0%) and 119 of the single-parent households (9.1%) are living below the poverty level. Within the married-couple family households, those with 5 or more children have the highest poverty rate, with 21 households (100.0%) falling below the poverty line. Among the single-parent households, those with 1 or 2 children have the highest poverty rate, with 62 household (15.6%) living below poverty.
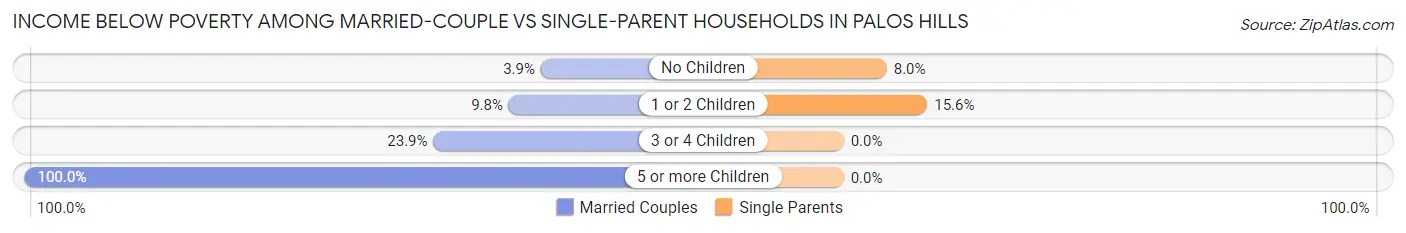
| Children | Married-Couple Families | Single-Parent Households |
| No Children | 79 (3.8%) | 57 (8.0%) |
| 1 or 2 Children | 91 (9.8%) | 62 (15.6%) |
| 3 or 4 Children | 73 (23.9%) | 0 (0.0%) |
| 5 or more Children | 21 (100.0%) | 0 (0.0%) |
| Total | 264 (8.0%) | 119 (9.1%) |
Race in Palos Hills
The most populous races in Palos Hills are White / Caucasian (15,947 | 87.3%), Hispanic or Latino (1,456 | 8.0%), and Black / African American (987 | 5.4%).
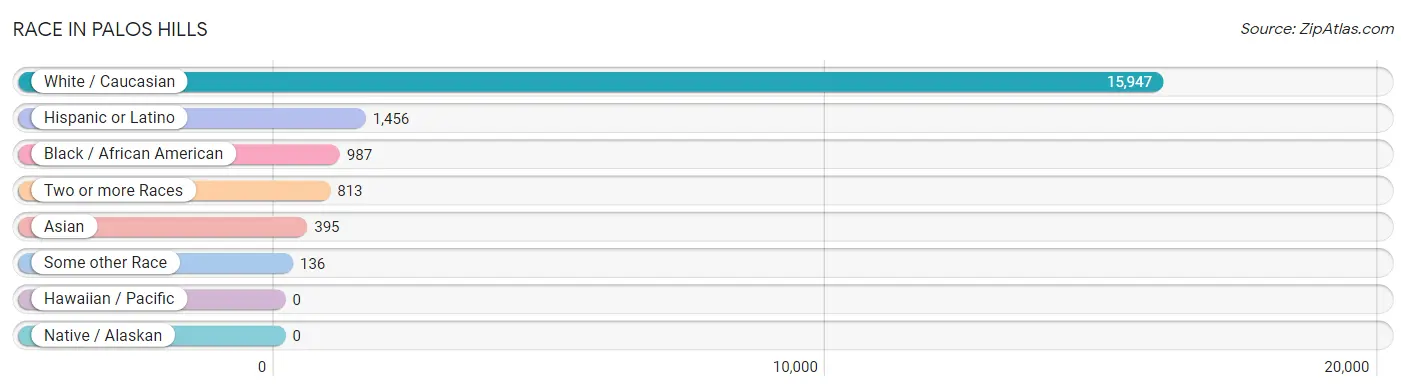
| Race | # Population | % Population |
| Asian | 395 | 2.2% |
| Black / African American | 987 | 5.4% |
| Hawaiian / Pacific | 0 | 0.0% |
| Hispanic or Latino | 1,456 | 8.0% |
| Native / Alaskan | 0 | 0.0% |
| White / Caucasian | 15,947 | 87.3% |
| Two or more Races | 813 | 4.4% |
| Some other Race | 136 | 0.7% |
| Total | 18,278 | 100.0% |
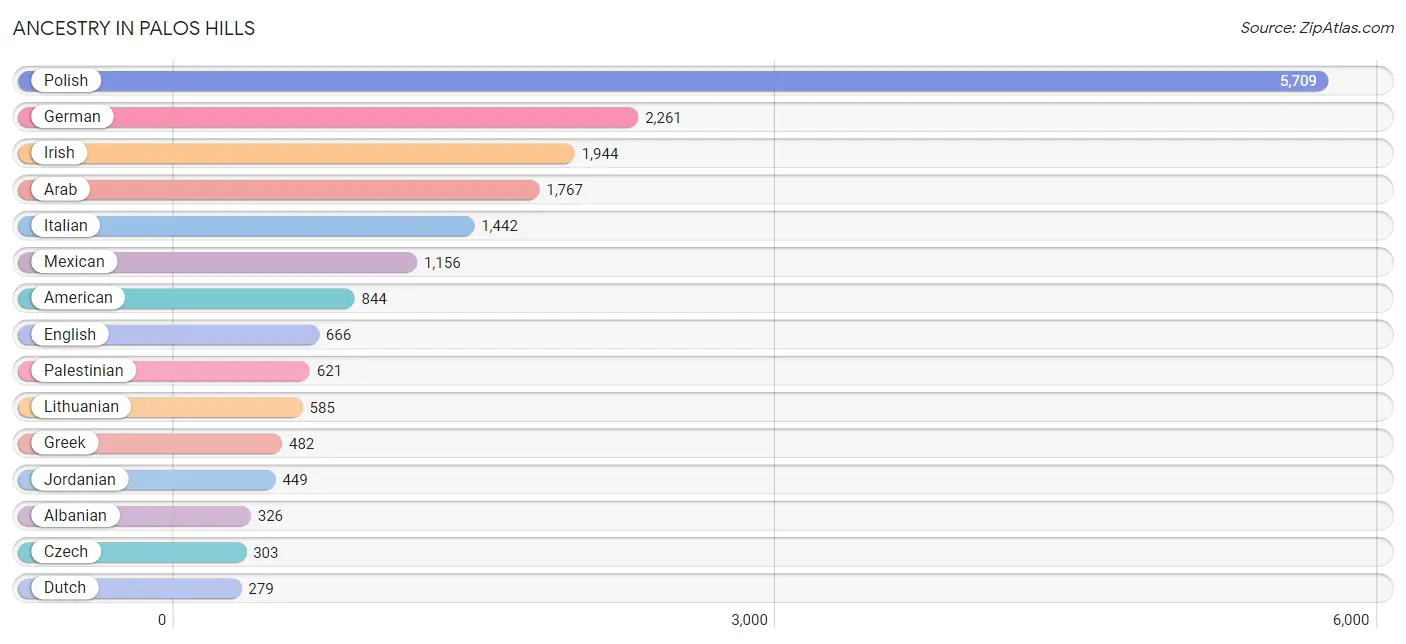
Ancestry in Palos Hills
The most populous ancestries reported in Palos Hills are Polish (5,709 | 31.2%), German (2,261 | 12.4%), Irish (1,944 | 10.6%), Arab (1,767 | 9.7%), and Italian (1,442 | 7.9%), together accounting for 71.8% of all Palos Hills residents.
| Ancestry | # Population | % Population |
| African | 17 | 0.1% |
| Albanian | 326 | 1.8% |
| American | 844 | 4.6% |
| Arab | 1,767 | 9.7% |
| Austrian | 35 | 0.2% |
| Bhutanese | 30 | 0.2% |
| British | 38 | 0.2% |
| Burmese | 78 | 0.4% |
| Celtic | 16 | 0.1% |
| Central American | 68 | 0.4% |
| Cherokee | 16 | 0.1% |
| Colombian | 72 | 0.4% |
| Croatian | 204 | 1.1% |
| Czech | 303 | 1.7% |
| Czechoslovakian | 41 | 0.2% |
| Danish | 113 | 0.6% |
| Dutch | 279 | 1.5% |
| Egyptian | 82 | 0.4% |
| English | 666 | 3.6% |
| European | 59 | 0.3% |
| French | 68 | 0.4% |
| French Canadian | 30 | 0.2% |
| German | 2,261 | 12.4% |
| Greek | 482 | 2.6% |
| Haitian | 12 | 0.1% |
| Hungarian | 35 | 0.2% |
| Indian (Asian) | 6 | 0.0% |
| Irish | 1,944 | 10.6% |
| Italian | 1,442 | 7.9% |
| Jordanian | 449 | 2.5% |
| Korean | 137 | 0.7% |
| Lebanese | 11 | 0.1% |
| Lithuanian | 585 | 3.2% |
| Macedonian | 178 | 1.0% |
| Mexican | 1,156 | 6.3% |
| Nigerian | 10 | 0.1% |
| Norwegian | 123 | 0.7% |
| Pakistani | 34 | 0.2% |
| Palestinian | 621 | 3.4% |
| Panamanian | 8 | 0.0% |
| Polish | 5,709 | 31.2% |
| Puerto Rican | 57 | 0.3% |
| Romanian | 42 | 0.2% |
| Russian | 158 | 0.9% |
| Salvadoran | 60 | 0.3% |
| Scotch-Irish | 66 | 0.4% |
| Scottish | 42 | 0.2% |
| Serbian | 100 | 0.5% |
| Slavic | 13 | 0.1% |
| Slovak | 89 | 0.5% |
| Slovene | 14 | 0.1% |
| South American | 132 | 0.7% |
| Spaniard | 38 | 0.2% |
| Subsaharan African | 27 | 0.2% |
| Swedish | 202 | 1.1% |
| Swiss | 165 | 0.9% |
| Syrian | 58 | 0.3% |
| Thai | 71 | 0.4% |
| Ukrainian | 139 | 0.8% |
| Venezuelan | 60 | 0.3% |
| Welsh | 15 | 0.1% | View All 61 Rows |
Immigrants in Palos Hills
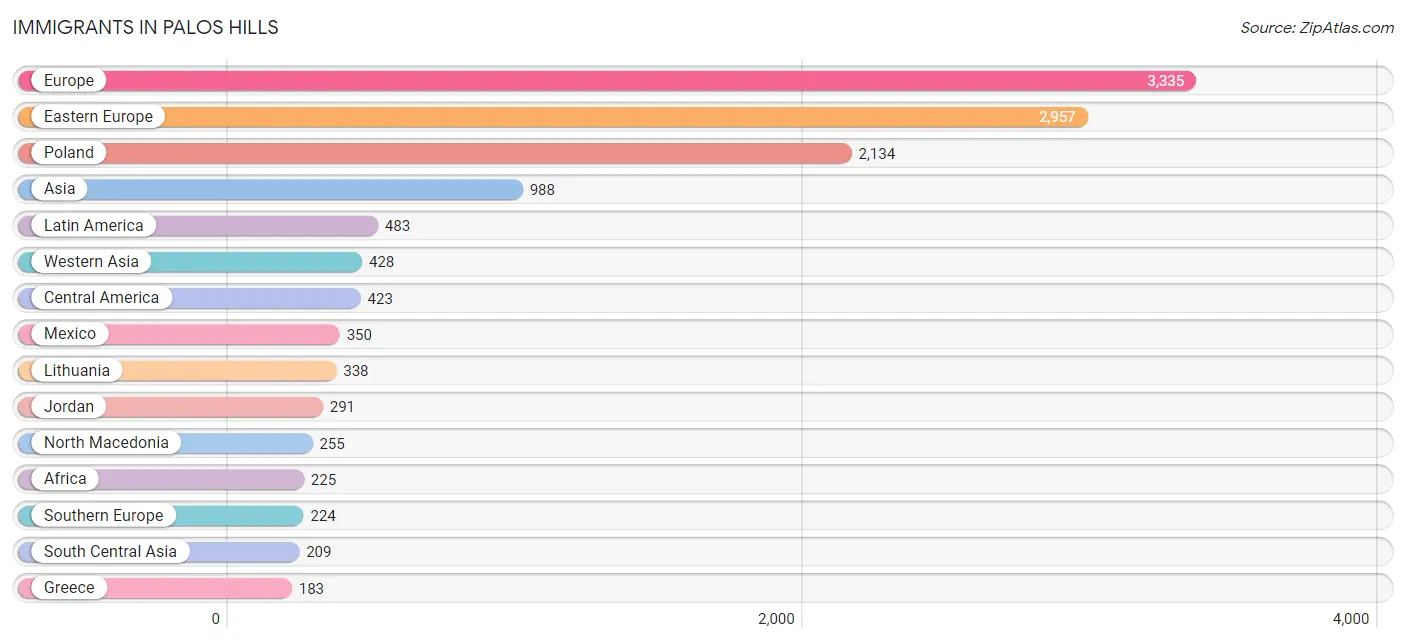
The most numerous immigrant groups reported in Palos Hills came from Europe (3,335 | 18.2%), Eastern Europe (2,957 | 16.2%), Poland (2,134 | 11.7%), Asia (988 | 5.4%), and Latin America (483 | 2.6%), together accounting for 54.2% of all Palos Hills residents.
| Immigration Origin | # Population | % Population |
| Africa | 225 | 1.2% |
| Asia | 988 | 5.4% |
| Cameroon | 49 | 0.3% |
| Canada | 32 | 0.2% |
| Central America | 423 | 2.3% |
| China | 6 | 0.0% |
| Czechoslovakia | 27 | 0.2% |
| Eastern Asia | 6 | 0.0% |
| Eastern Europe | 2,957 | 16.2% |
| Egypt | 166 | 0.9% |
| El Salvador | 60 | 0.3% |
| Europe | 3,335 | 18.2% |
| Germany | 39 | 0.2% |
| Greece | 183 | 1.0% |
| Hungary | 7 | 0.0% |
| India | 150 | 0.8% |
| Ireland | 34 | 0.2% |
| Israel | 14 | 0.1% |
| Italy | 41 | 0.2% |
| Jordan | 291 | 1.6% |
| Latin America | 483 | 2.6% |
| Lebanon | 34 | 0.2% |
| Lithuania | 338 | 1.8% |
| Mexico | 350 | 1.9% |
| Middle Africa | 49 | 0.3% |
| Nigeria | 10 | 0.1% |
| North Macedonia | 255 | 1.4% |
| Northern Africa | 166 | 0.9% |
| Northern Europe | 95 | 0.5% |
| Oceania | 19 | 0.1% |
| Pakistan | 59 | 0.3% |
| Panama | 13 | 0.1% |
| Philippines | 39 | 0.2% |
| Poland | 2,134 | 11.7% |
| Romania | 16 | 0.1% |
| Russia | 33 | 0.2% |
| Saudi Arabia | 58 | 0.3% |
| Serbia | 61 | 0.3% |
| South America | 60 | 0.3% |
| South Central Asia | 209 | 1.1% |
| South Eastern Asia | 73 | 0.4% |
| Southern Europe | 224 | 1.2% |
| Syria | 31 | 0.2% |
| Thailand | 34 | 0.2% |
| Ukraine | 62 | 0.3% |
| Venezuela | 60 | 0.3% |
| Western Africa | 10 | 0.1% |
| Western Asia | 428 | 2.3% |
| Western Europe | 39 | 0.2% | View All 49 Rows |
Sex and Age in Palos Hills
Sex and Age in Palos Hills
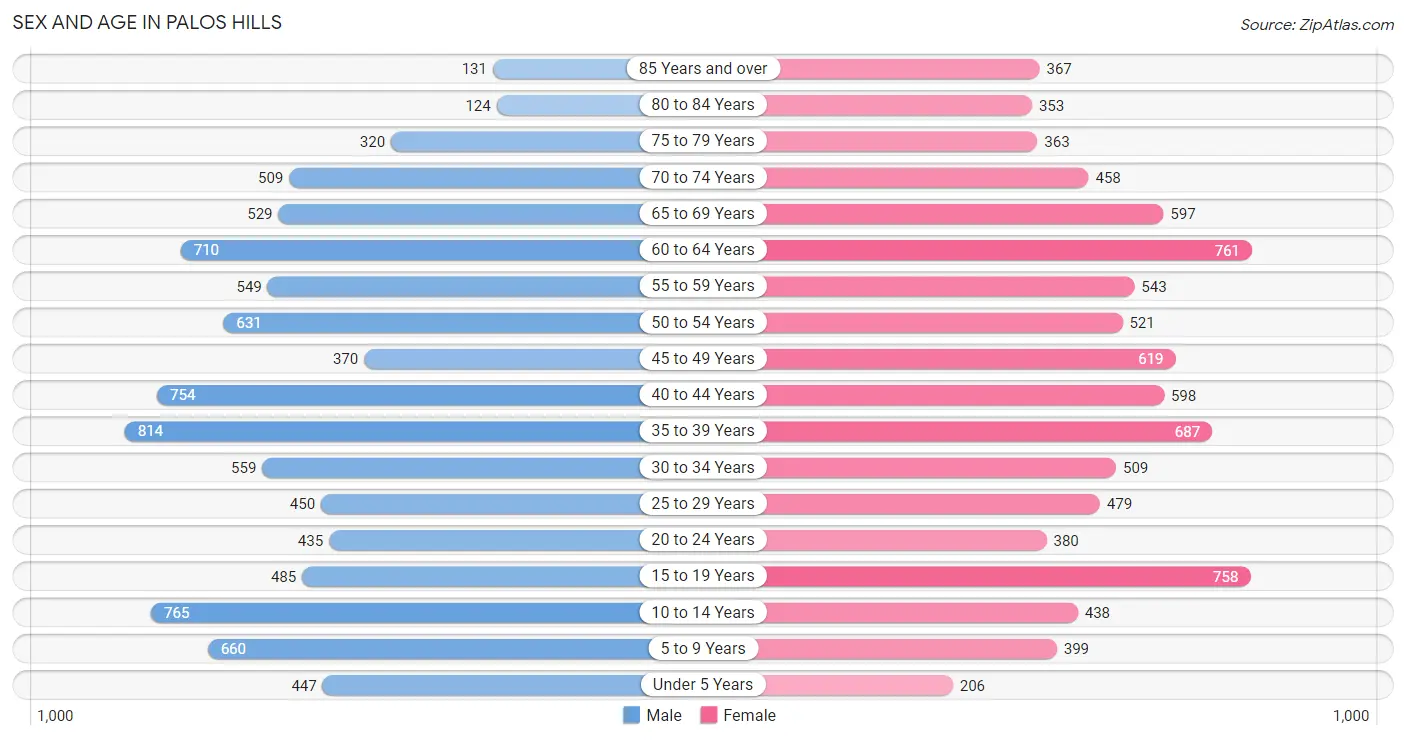
The most populous age groups in Palos Hills are 35 to 39 Years (814 | 8.8%) for men and 60 to 64 Years (761 | 8.4%) for women.
| Age Bracket | Male | Female |
| Under 5 Years | 447 (4.8%) | 206 (2.3%) |
| 5 to 9 Years | 660 (7.1%) | 399 (4.4%) |
| 10 to 14 Years | 765 (8.3%) | 438 (4.9%) |
| 15 to 19 Years | 485 (5.2%) | 758 (8.4%) |
| 20 to 24 Years | 435 (4.7%) | 380 (4.2%) |
| 25 to 29 Years | 450 (4.9%) | 479 (5.3%) |
| 30 to 34 Years | 559 (6.0%) | 509 (5.6%) |
| 35 to 39 Years | 814 (8.8%) | 687 (7.6%) |
| 40 to 44 Years | 754 (8.2%) | 598 (6.6%) |
| 45 to 49 Years | 370 (4.0%) | 619 (6.9%) |
| 50 to 54 Years | 631 (6.8%) | 521 (5.8%) |
| 55 to 59 Years | 549 (5.9%) | 543 (6.0%) |
| 60 to 64 Years | 710 (7.7%) | 761 (8.4%) |
| 65 to 69 Years | 529 (5.7%) | 597 (6.6%) |
| 70 to 74 Years | 509 (5.5%) | 458 (5.1%) |
| 75 to 79 Years | 320 (3.5%) | 363 (4.0%) |
| 80 to 84 Years | 124 (1.3%) | 353 (3.9%) |
| 85 Years and over | 131 (1.4%) | 367 (4.1%) |
| Total | 9,242 (100.0%) | 9,036 (100.0%) |
Families and Households in Palos Hills
Median Family Size in Palos Hills
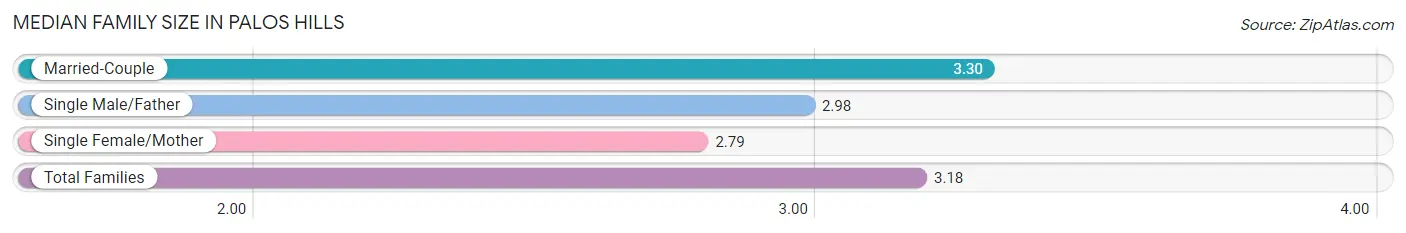
The median family size in Palos Hills is 3.18 persons per family, with married-couple families (3,308 | 71.6%) accounting for the largest median family size of 3.3 persons per family. On the other hand, single female/mother families (786 | 17.0%) represent the smallest median family size with 2.79 persons per family.
| Family Type | # Families | Family Size |
| Married-Couple | 3,308 (71.6%) | 3.30 |
| Single Male/Father | 524 (11.4%) | 2.98 |
| Single Female/Mother | 786 (17.0%) | 2.79 |
| Total Families | 4,618 (100.0%) | 3.18 |
Median Household Size in Palos Hills
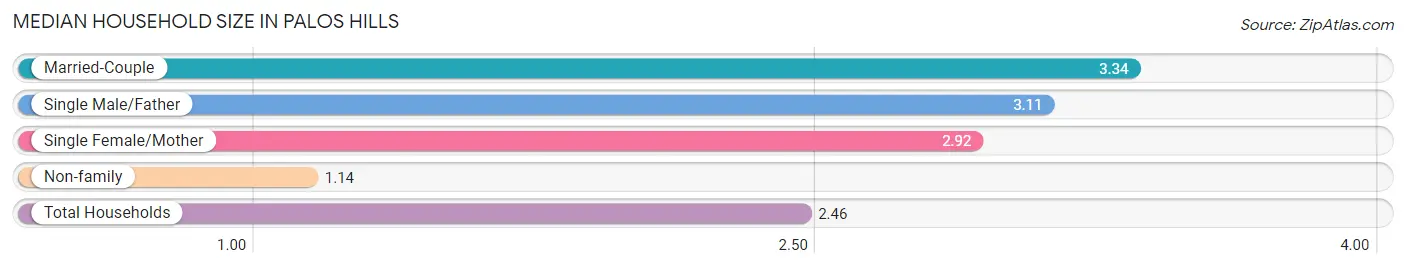
The median household size in Palos Hills is 2.46 persons per household, with married-couple households (3,308 | 45.0%) accounting for the largest median household size of 3.34 persons per household. non-family households (2,738 | 37.2%) represent the smallest median household size with 1.14 persons per household.
| Household Type | # Households | Household Size |
| Married-Couple | 3,308 (45.0%) | 3.34 |
| Single Male/Father | 524 (7.1%) | 3.11 |
| Single Female/Mother | 786 (10.7%) | 2.92 |
| Non-family | 2,738 (37.2%) | 1.14 |
| Total Households | 7,356 (100.0%) | 2.46 |
Household Size by Marriage Status in Palos Hills
Out of a total of 7,356 households in Palos Hills, 4,618 (62.8%) are family households, while 2,738 (37.2%) are nonfamily households. The most numerous type of family households are 2-person households, comprising 1,832, and the most common type of nonfamily households are 1-person households, comprising 2,424.
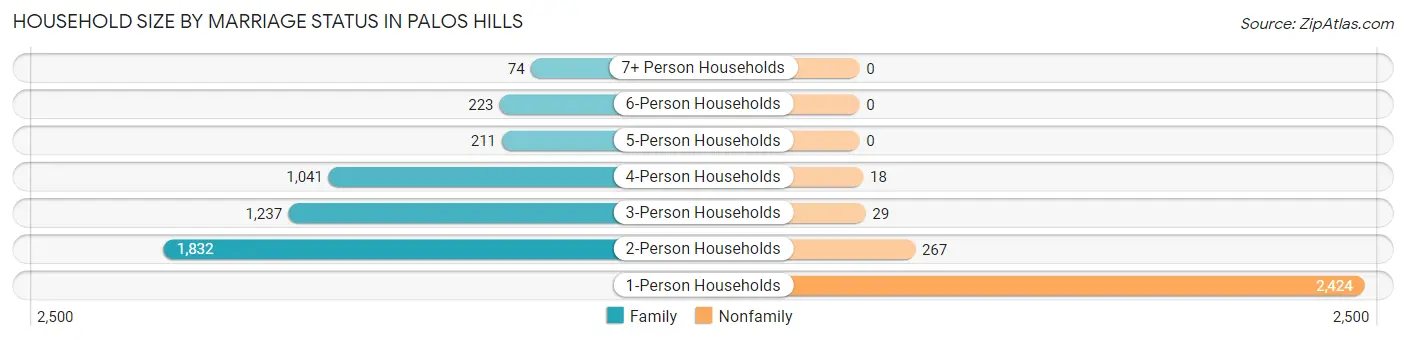
| Household Size | Family Households | Nonfamily Households |
| 1-Person Households | - | 2,424 (33.0%) |
| 2-Person Households | 1,832 (24.9%) | 267 (3.6%) |
| 3-Person Households | 1,237 (16.8%) | 29 (0.4%) |
| 4-Person Households | 1,041 (14.1%) | 18 (0.2%) |
| 5-Person Households | 211 (2.9%) | 0 (0.0%) |
| 6-Person Households | 223 (3.0%) | 0 (0.0%) |
| 7+ Person Households | 74 (1.0%) | 0 (0.0%) |
| Total | 4,618 (62.8%) | 2,738 (37.2%) |
Female Fertility in Palos Hills
Fertility by Age in Palos Hills
Average fertility rate in Palos Hills is 36.0 births per 1,000 women. Women in the age bracket of 20 to 34 years have the highest fertility rate with 65.0 births per 1,000 women. Women in the age bracket of 20 to 34 years acount for 59.7% of all women with births.
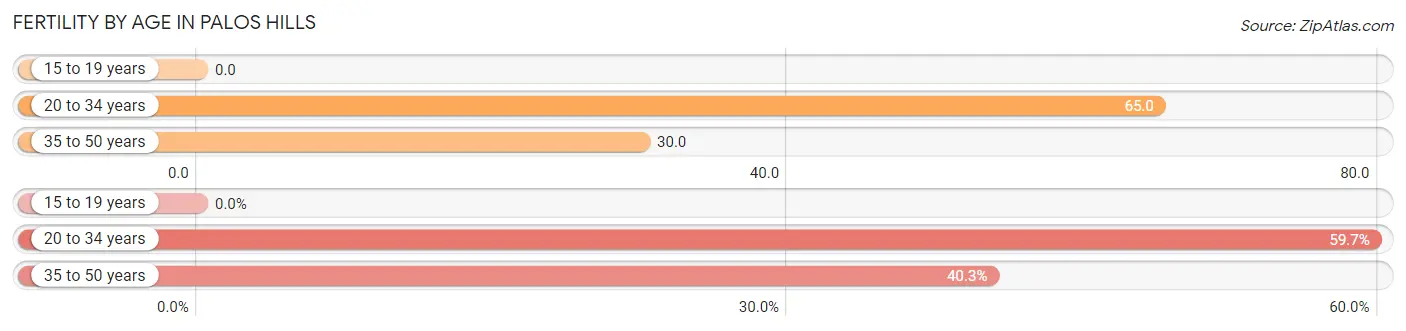
| Age Bracket | Women with Births | Births / 1,000 Women |
| 15 to 19 years | 0 (0.0%) | 0.0 |
| 20 to 34 years | 89 (59.7%) | 65.0 |
| 35 to 50 years | 60 (40.3%) | 30.0 |
| Total | 149 (100.0%) | 36.0 |
Fertility by Age by Marriage Status in Palos Hills
81.9% of women with births (149) in Palos Hills are married. The highest percentage of unmarried women with births falls into 20 to 34 years age bracket with 30.3% of them unmarried at the time of birth, while the lowest percentage of unmarried women with births belong to 35 to 50 years age bracket with 0.0% of them unmarried.
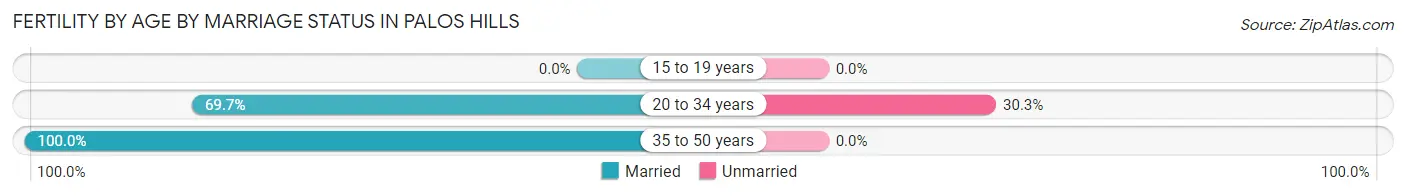
| Age Bracket | Married | Unmarried |
| 15 to 19 years | 0 (0.0%) | 0 (0.0%) |
| 20 to 34 years | 62 (69.7%) | 27 (30.3%) |
| 35 to 50 years | 60 (100.0%) | 0 (0.0%) |
| Total | 122 (81.9%) | 27 (18.1%) |
Fertility by Education in Palos Hills
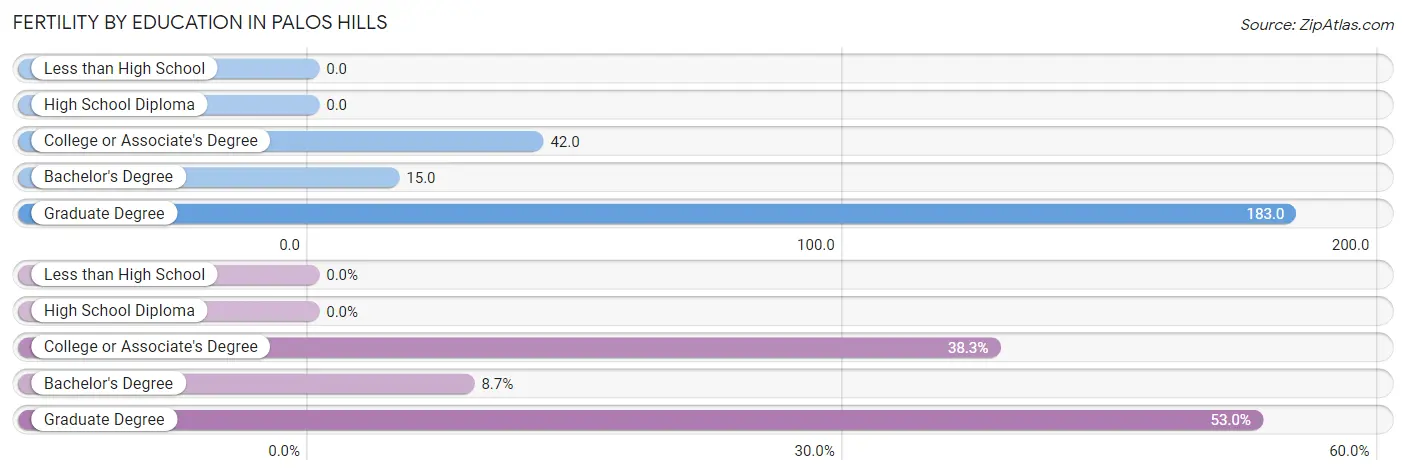
| Educational Attainment | Women with Births | Births / 1,000 Women |
| Less than High School | 0 (0.0%) | 0.0 |
| High School Diploma | 0 (0.0%) | 0.0 |
| College or Associate's Degree | 57 (38.3%) | 42.0 |
| Bachelor's Degree | 13 (8.7%) | 15.0 |
| Graduate Degree | 79 (53.0%) | 183.0 |
| Total | 149 (100.0%) | 36.0 |
Fertility by Education by Marriage Status in Palos Hills
18.1% of women with births in Palos Hills are unmarried. Women with the educational attainment of bachelor's degree are most likely to be married with 100.0% of them married at childbirth, while women with the educational attainment of college or associate's degree are least likely to be married with 47.4% of them unmarried at childbirth.
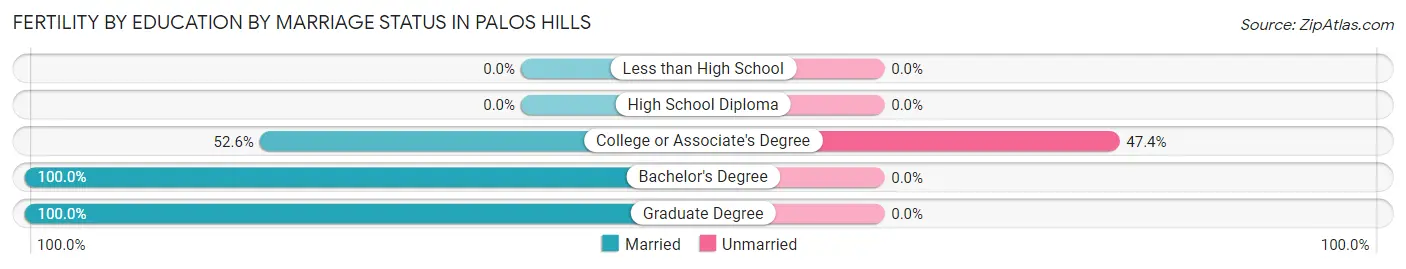
| Educational Attainment | Married | Unmarried |
| Less than High School | 0 (0.0%) | 0 (0.0%) |
| High School Diploma | 0 (0.0%) | 0 (0.0%) |
| College or Associate's Degree | 30 (52.6%) | 27 (47.4%) |
| Bachelor's Degree | 13 (100.0%) | 0 (0.0%) |
| Graduate Degree | 79 (100.0%) | 0 (0.0%) |
| Total | 122 (81.9%) | 27 (18.1%) |
Employment Characteristics in Palos Hills
Employment by Class of Employer in Palos Hills
Among the 8,335 employed individuals in Palos Hills, private company employees (5,821 | 69.8%), self-employed (incorporated) (789 | 9.5%), and local government employees (568 | 6.8%) make up the most common classes of employment.
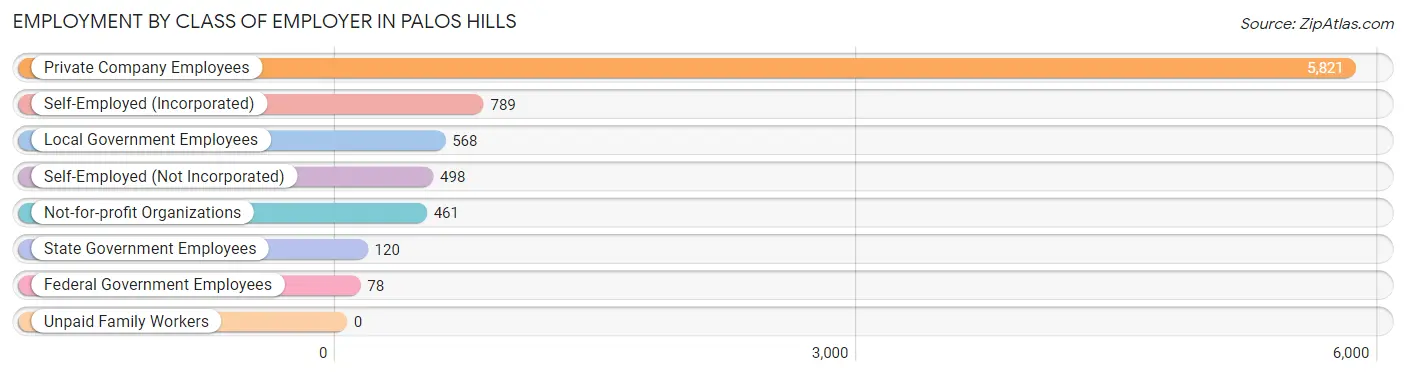
| Employer Class | # Employees | % Employees |
| Private Company Employees | 5,821 | 69.8% |
| Self-Employed (Incorporated) | 789 | 9.5% |
| Self-Employed (Not Incorporated) | 498 | 6.0% |
| Not-for-profit Organizations | 461 | 5.5% |
| Local Government Employees | 568 | 6.8% |
| State Government Employees | 120 | 1.4% |
| Federal Government Employees | 78 | 0.9% |
| Unpaid Family Workers | 0 | 0.0% |
| Total | 8,335 | 100.0% |
Employment Status by Age in Palos Hills
According to the labor force statistics for Palos Hills, out of the total population over 16 years of age (15,042), 60.8% or 9,146 individuals are in the labor force, with 4.9% or 448 of them unemployed. The age group with the highest labor force participation rate is 25 to 29 years, with 93.4% or 868 individuals in the labor force. Within the labor force, the 20 to 24 years age range has the highest percentage of unemployed individuals, with 17.3% or 115 of them being unemployed.
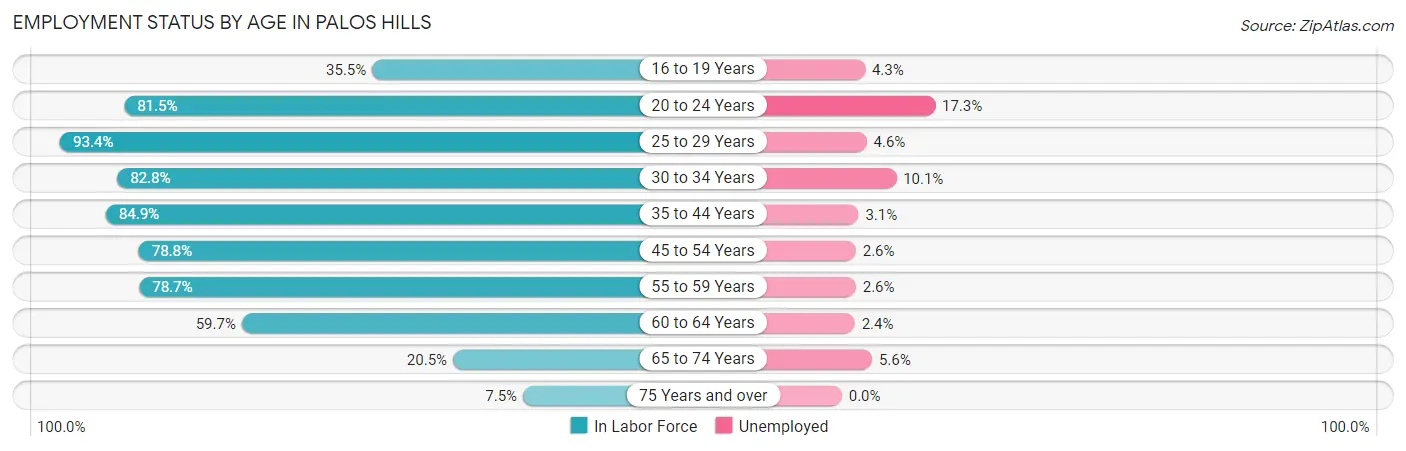
| Age Bracket | In Labor Force | Unemployed |
| 16 to 19 Years | 327 (35.5%) | 14 (4.3%) |
| 20 to 24 Years | 664 (81.5%) | 115 (17.3%) |
| 25 to 29 Years | 868 (93.4%) | 40 (4.6%) |
| 30 to 34 Years | 884 (82.8%) | 89 (10.1%) |
| 35 to 44 Years | 2,422 (84.9%) | 75 (3.1%) |
| 45 to 54 Years | 1,687 (78.8%) | 44 (2.6%) |
| 55 to 59 Years | 859 (78.7%) | 22 (2.6%) |
| 60 to 64 Years | 878 (59.7%) | 21 (2.4%) |
| 65 to 74 Years | 429 (20.5%) | 24 (5.6%) |
| 75 Years and over | 124 (7.5%) | 0 (0.0%) |
| Total | 9,146 (60.8%) | 448 (4.9%) |
Employment Status by Educational Attainment in Palos Hills
According to labor force statistics for Palos Hills, 79.5% of individuals (7,595) out of the total population between 25 and 64 years of age (9,554) are in the labor force, with 3.8% or 289 of them being unemployed. The group with the highest labor force participation rate are those with the educational attainment of bachelor's degree or higher, with 84.4% or 2,327 individuals in the labor force. Within the labor force, individuals with high school diploma education have the highest percentage of unemployment, with 6.3% or 129 of them being unemployed.
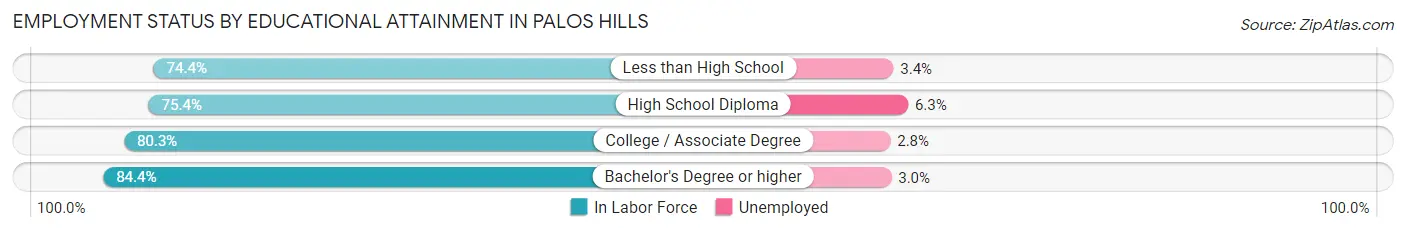
| Educational Attainment | In Labor Force | Unemployed |
| Less than High School | 676 (74.4%) | 31 (3.4%) |
| High School Diploma | 2,050 (75.4%) | 171 (6.3%) |
| College / Associate Degree | 2,546 (80.3%) | 89 (2.8%) |
| Bachelor's Degree or higher | 2,327 (84.4%) | 83 (3.0%) |
| Total | 7,595 (79.5%) | 363 (3.8%) |
Employment Occupations by Sex in Palos Hills
Management, Business, Science and Arts Occupations
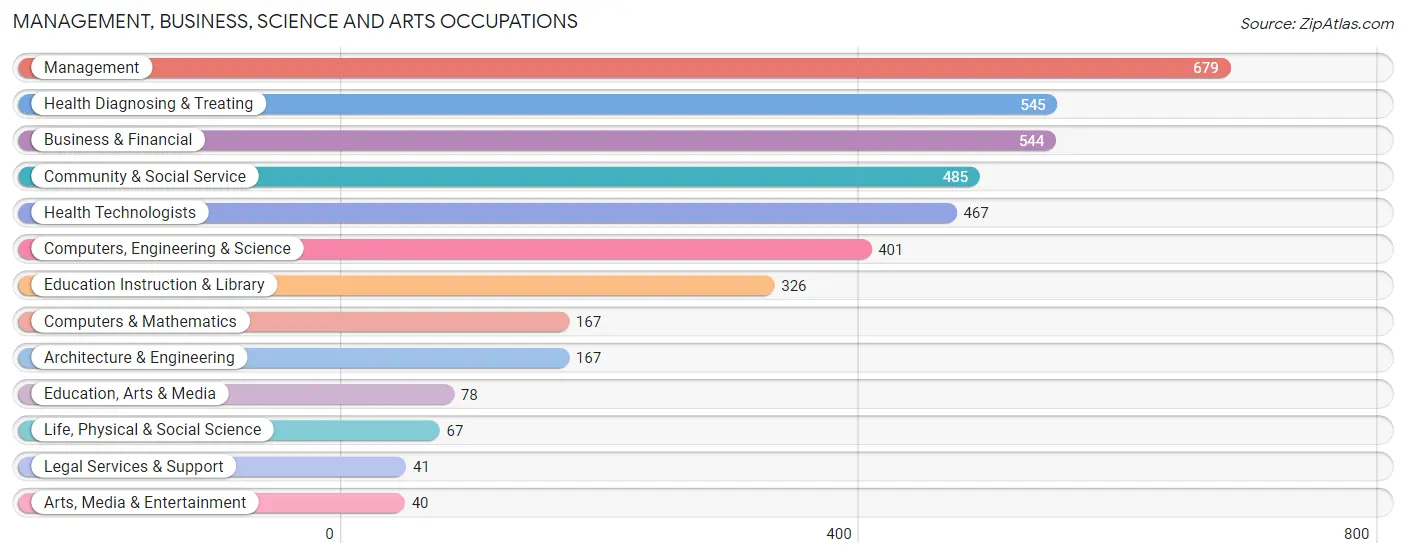
The most common Management, Business, Science and Arts occupations in Palos Hills are Management (679 | 7.8%), Health Diagnosing & Treating (545 | 6.3%), Business & Financial (544 | 6.3%), Community & Social Service (485 | 5.6%), and Health Technologists (467 | 5.4%).
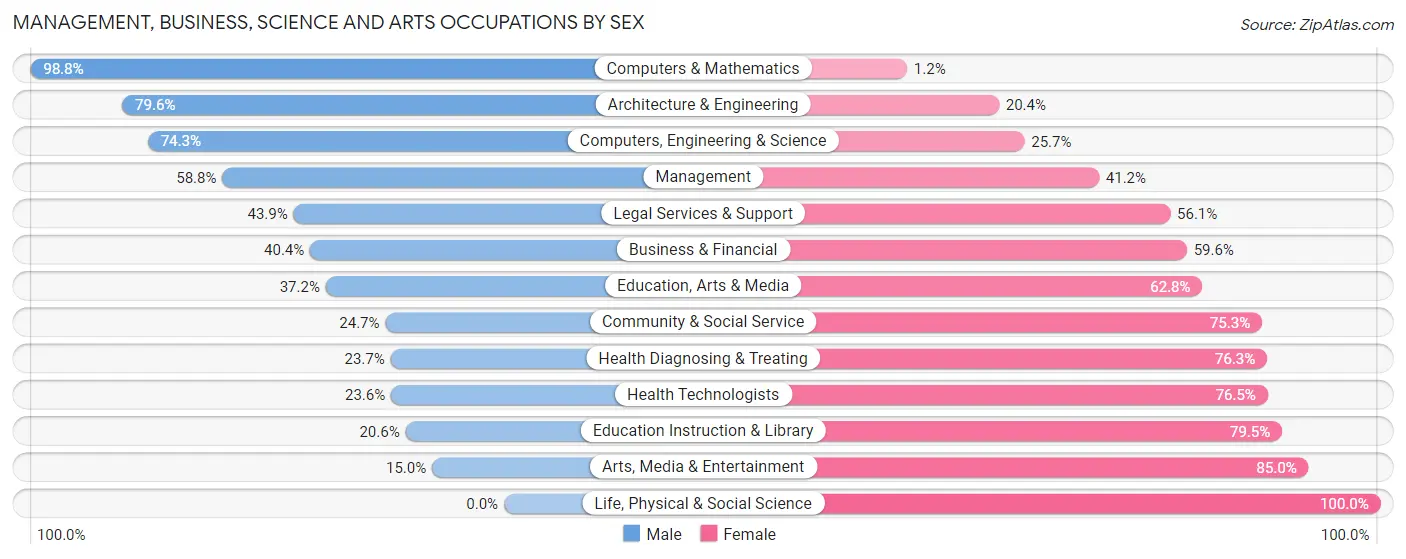
Management, Business, Science and Arts Occupations by Sex
Within the Management, Business, Science and Arts occupations in Palos Hills, the most male-oriented occupations are Computers & Mathematics (98.8%), Architecture & Engineering (79.6%), and Computers, Engineering & Science (74.3%), while the most female-oriented occupations are Life, Physical & Social Science (100.0%), Arts, Media & Entertainment (85.0%), and Education Instruction & Library (79.4%).
| Occupation | Male | Female |
| Management | 399 (58.8%) | 280 (41.2%) |
| Business & Financial | 220 (40.4%) | 324 (59.6%) |
| Computers, Engineering & Science | 298 (74.3%) | 103 (25.7%) |
| Computers & Mathematics | 165 (98.8%) | 2 (1.2%) |
| Architecture & Engineering | 133 (79.6%) | 34 (20.4%) |
| Life, Physical & Social Science | 0 (0.0%) | 67 (100.0%) |
| Community & Social Service | 120 (24.7%) | 365 (75.3%) |
| Education, Arts & Media | 29 (37.2%) | 49 (62.8%) |
| Legal Services & Support | 18 (43.9%) | 23 (56.1%) |
| Education Instruction & Library | 67 (20.5%) | 259 (79.4%) |
| Arts, Media & Entertainment | 6 (15.0%) | 34 (85.0%) |
| Health Diagnosing & Treating | 129 (23.7%) | 416 (76.3%) |
| Health Technologists | 110 (23.5%) | 357 (76.4%) |
| Total (Category) | 1,166 (43.9%) | 1,488 (56.1%) |
| Total (Overall) | 4,775 (54.9%) | 3,921 (45.1%) |
Services Occupations
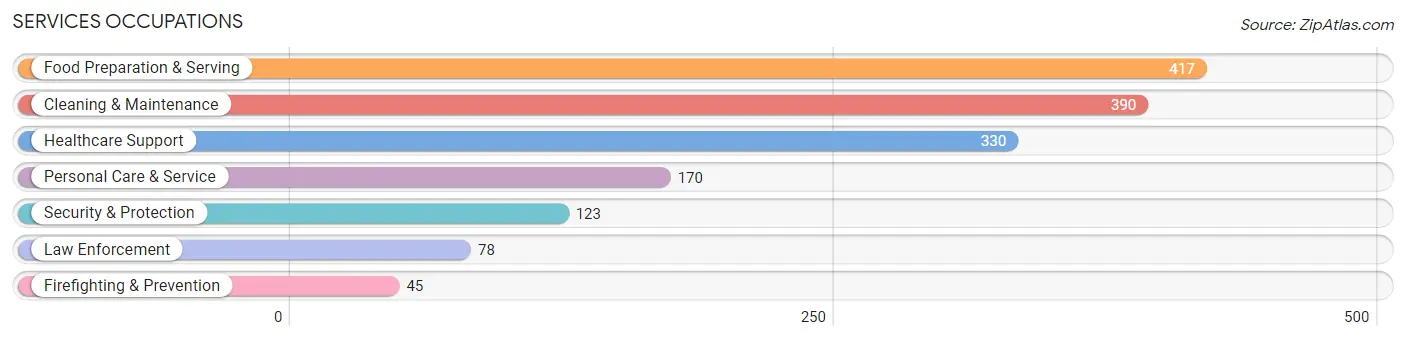
The most common Services occupations in Palos Hills are Food Preparation & Serving (417 | 4.8%), Cleaning & Maintenance (390 | 4.5%), Healthcare Support (330 | 3.8%), Personal Care & Service (170 | 1.9%), and Security & Protection (123 | 1.4%).
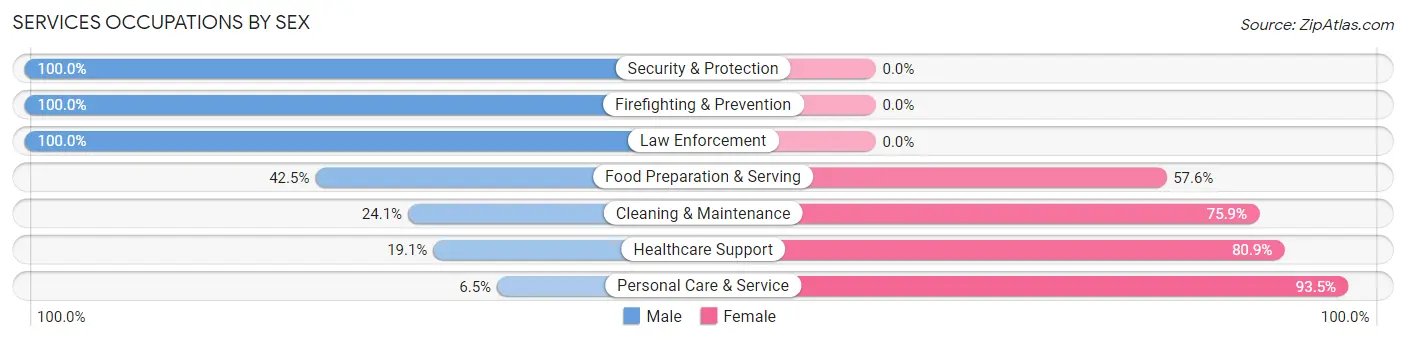
Services Occupations by Sex
Within the Services occupations in Palos Hills, the most male-oriented occupations are Security & Protection (100.0%), Firefighting & Prevention (100.0%), and Law Enforcement (100.0%), while the most female-oriented occupations are Personal Care & Service (93.5%), Healthcare Support (80.9%), and Cleaning & Maintenance (75.9%).
| Occupation | Male | Female |
| Healthcare Support | 63 (19.1%) | 267 (80.9%) |
| Security & Protection | 123 (100.0%) | 0 (0.0%) |
| Firefighting & Prevention | 45 (100.0%) | 0 (0.0%) |
| Law Enforcement | 78 (100.0%) | 0 (0.0%) |
| Food Preparation & Serving | 177 (42.4%) | 240 (57.6%) |
| Cleaning & Maintenance | 94 (24.1%) | 296 (75.9%) |
| Personal Care & Service | 11 (6.5%) | 159 (93.5%) |
| Total (Category) | 468 (32.7%) | 962 (67.3%) |
| Total (Overall) | 4,775 (54.9%) | 3,921 (45.1%) |
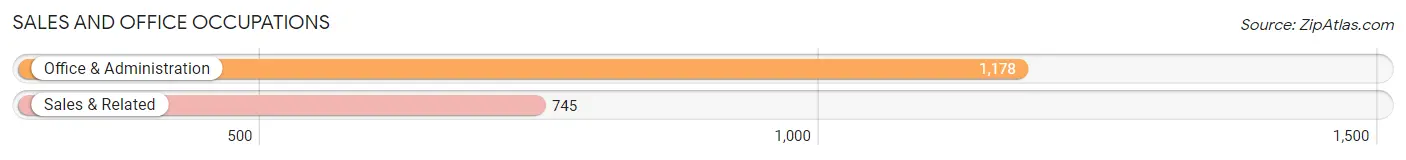
Sales and Office Occupations
The most common Sales and Office occupations in Palos Hills are Office & Administration (1,178 | 13.6%), and Sales & Related (745 | 8.6%).
Sales and Office Occupations by Sex
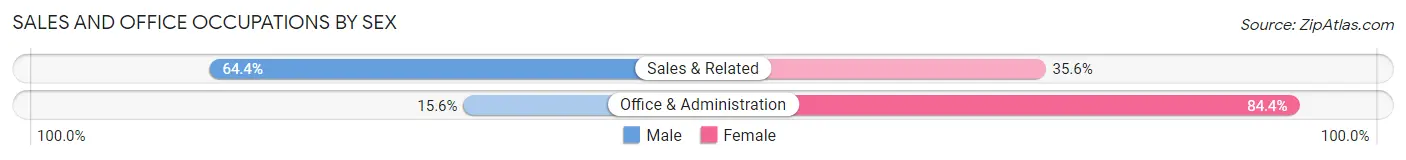
| Occupation | Male | Female |
| Sales & Related | 480 (64.4%) | 265 (35.6%) |
| Office & Administration | 184 (15.6%) | 994 (84.4%) |
| Total (Category) | 664 (34.5%) | 1,259 (65.5%) |
| Total (Overall) | 4,775 (54.9%) | 3,921 (45.1%) |
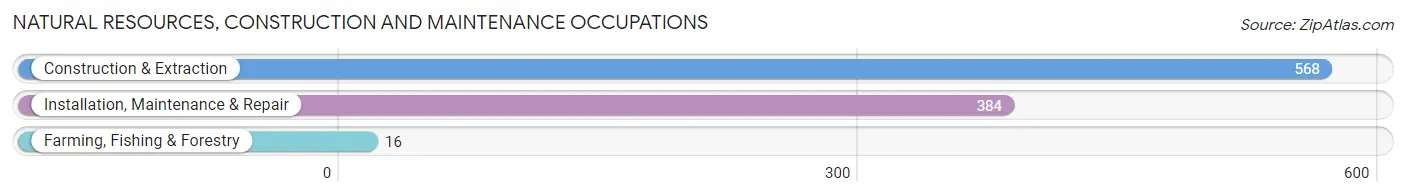
Natural Resources, Construction and Maintenance Occupations
The most common Natural Resources, Construction and Maintenance occupations in Palos Hills are Construction & Extraction (568 | 6.5%), Installation, Maintenance & Repair (384 | 4.4%), and Farming, Fishing & Forestry (16 | 0.2%).
Natural Resources, Construction and Maintenance Occupations by Sex
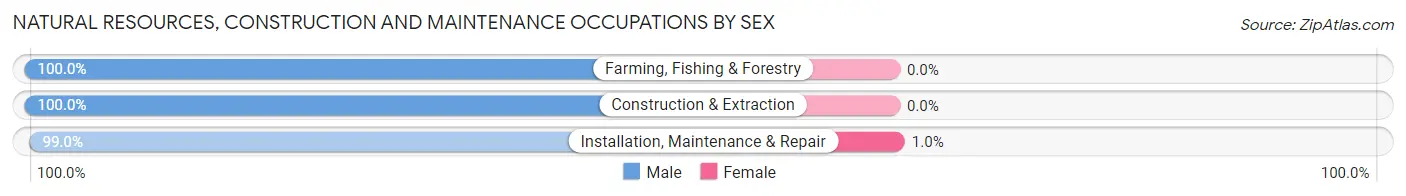
| Occupation | Male | Female |
| Farming, Fishing & Forestry | 16 (100.0%) | 0 (0.0%) |
| Construction & Extraction | 568 (100.0%) | 0 (0.0%) |
| Installation, Maintenance & Repair | 380 (99.0%) | 4 (1.0%) |
| Total (Category) | 964 (99.6%) | 4 (0.4%) |
| Total (Overall) | 4,775 (54.9%) | 3,921 (45.1%) |
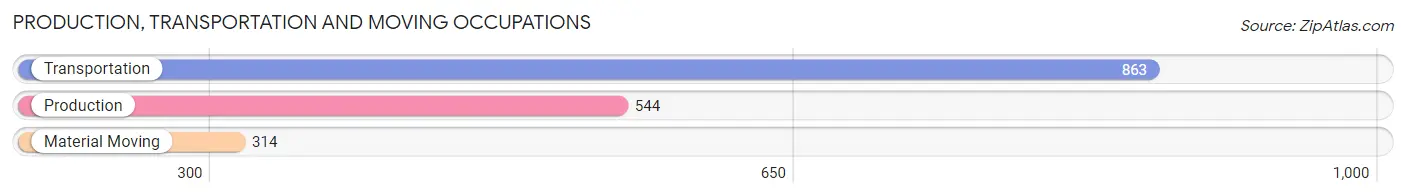
Production, Transportation and Moving Occupations
The most common Production, Transportation and Moving occupations in Palos Hills are Transportation (863 | 9.9%), Production (544 | 6.3%), and Material Moving (314 | 3.6%).
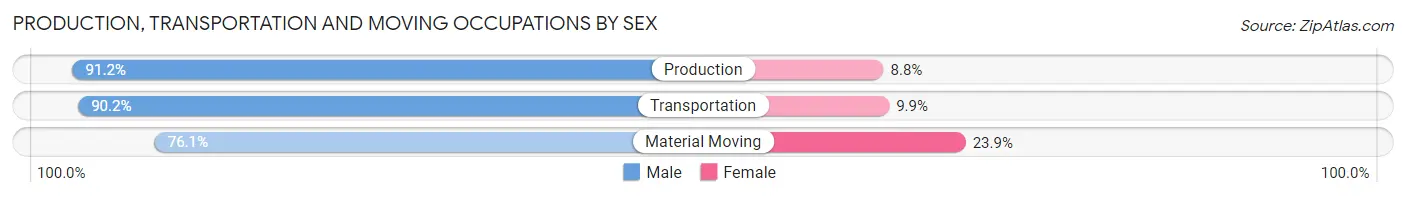
Production, Transportation and Moving Occupations by Sex
| Occupation | Male | Female |
| Production | 496 (91.2%) | 48 (8.8%) |
| Transportation | 778 (90.1%) | 85 (9.9%) |
| Material Moving | 239 (76.1%) | 75 (23.9%) |
| Total (Category) | 1,513 (87.9%) | 208 (12.1%) |
| Total (Overall) | 4,775 (54.9%) | 3,921 (45.1%) |
Employment Industries by Sex in Palos Hills
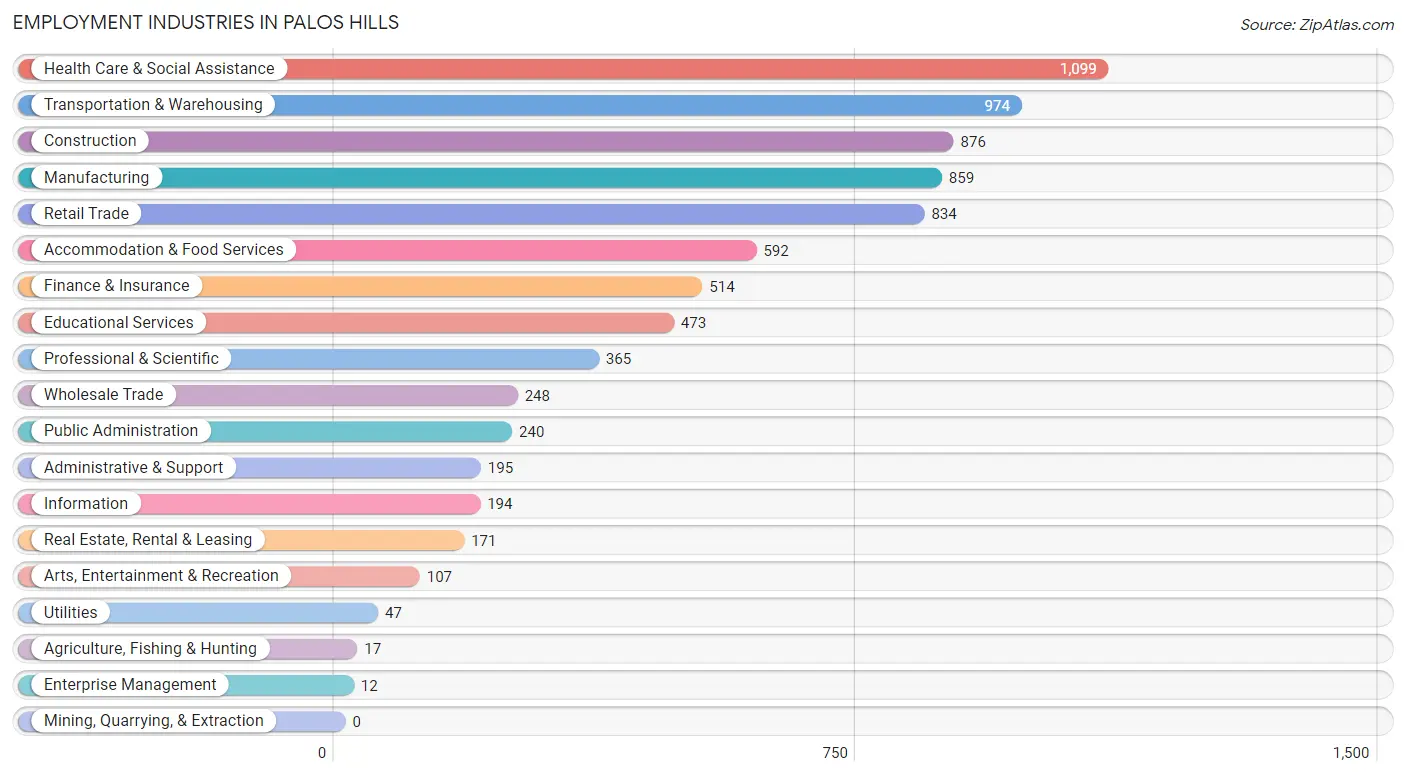
Employment Industries in Palos Hills
The major employment industries in Palos Hills include Health Care & Social Assistance (1,099 | 12.6%), Transportation & Warehousing (974 | 11.2%), Construction (876 | 10.1%), Manufacturing (859 | 9.9%), and Retail Trade (834 | 9.6%).
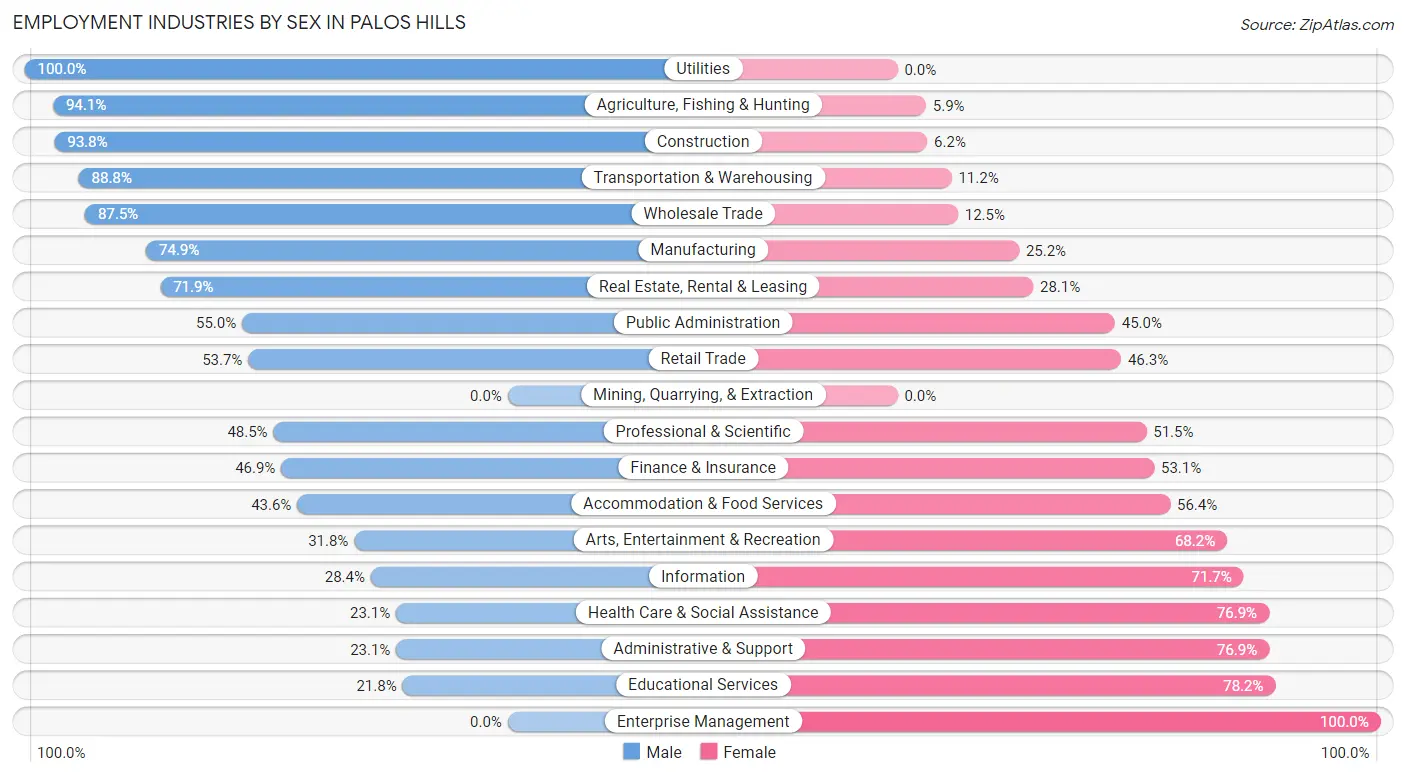
Employment Industries by Sex in Palos Hills
The Palos Hills industries that see more men than women are Utilities (100.0%), Agriculture, Fishing & Hunting (94.1%), and Construction (93.8%), whereas the industries that tend to have a higher number of women are Enterprise Management (100.0%), Educational Services (78.2%), and Administrative & Support (76.9%).
| Industry | Male | Female |
| Agriculture, Fishing & Hunting | 16 (94.1%) | 1 (5.9%) |
| Mining, Quarrying, & Extraction | 0 (0.0%) | 0 (0.0%) |
| Construction | 822 (93.8%) | 54 (6.2%) |
| Manufacturing | 643 (74.9%) | 216 (25.2%) |
| Wholesale Trade | 217 (87.5%) | 31 (12.5%) |
| Retail Trade | 448 (53.7%) | 386 (46.3%) |
| Transportation & Warehousing | 865 (88.8%) | 109 (11.2%) |
| Utilities | 47 (100.0%) | 0 (0.0%) |
| Information | 55 (28.3%) | 139 (71.7%) |
| Finance & Insurance | 241 (46.9%) | 273 (53.1%) |
| Real Estate, Rental & Leasing | 123 (71.9%) | 48 (28.1%) |
| Professional & Scientific | 177 (48.5%) | 188 (51.5%) |
| Enterprise Management | 0 (0.0%) | 12 (100.0%) |
| Administrative & Support | 45 (23.1%) | 150 (76.9%) |
| Educational Services | 103 (21.8%) | 370 (78.2%) |
| Health Care & Social Assistance | 254 (23.1%) | 845 (76.9%) |
| Arts, Entertainment & Recreation | 34 (31.8%) | 73 (68.2%) |
| Accommodation & Food Services | 258 (43.6%) | 334 (56.4%) |
| Public Administration | 132 (55.0%) | 108 (45.0%) |
| Total | 4,775 (54.9%) | 3,921 (45.1%) |
Education in Palos Hills
School Enrollment in Palos Hills
The most common levels of schooling among the 4,075 students in Palos Hills are high school (1,141 | 28.0%), middle school (916 | 22.5%), and college / undergraduate (831 | 20.4%).
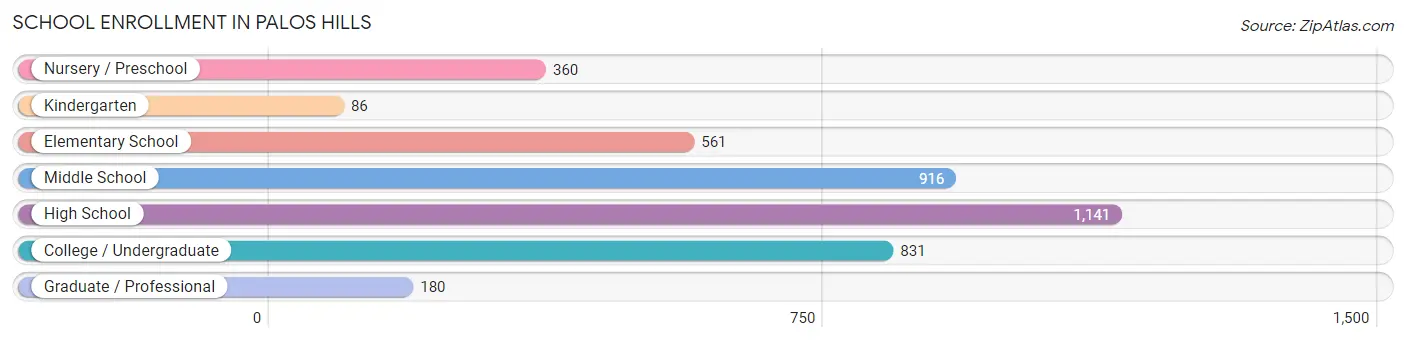
| School Level | # Students | % Students |
| Nursery / Preschool | 360 | 8.8% |
| Kindergarten | 86 | 2.1% |
| Elementary School | 561 | 13.8% |
| Middle School | 916 | 22.5% |
| High School | 1,141 | 28.0% |
| College / Undergraduate | 831 | 20.4% |
| Graduate / Professional | 180 | 4.4% |
| Total | 4,075 | 100.0% |
School Enrollment by Age by Funding Source in Palos Hills
Out of a total of 4,075 students who are enrolled in schools in Palos Hills, 705 (17.3%) attend a private institution, while the remaining 3,370 (82.7%) are enrolled in public schools. The age group of 3 to 4 year olds has the highest likelihood of being enrolled in private schools, with 43 (56.6% in the age bracket) enrolled. Conversely, the age group of 10 to 14 year olds has the lowest likelihood of being enrolled in a private school, with 1,002 (92.6% in the age bracket) attending a public institution.
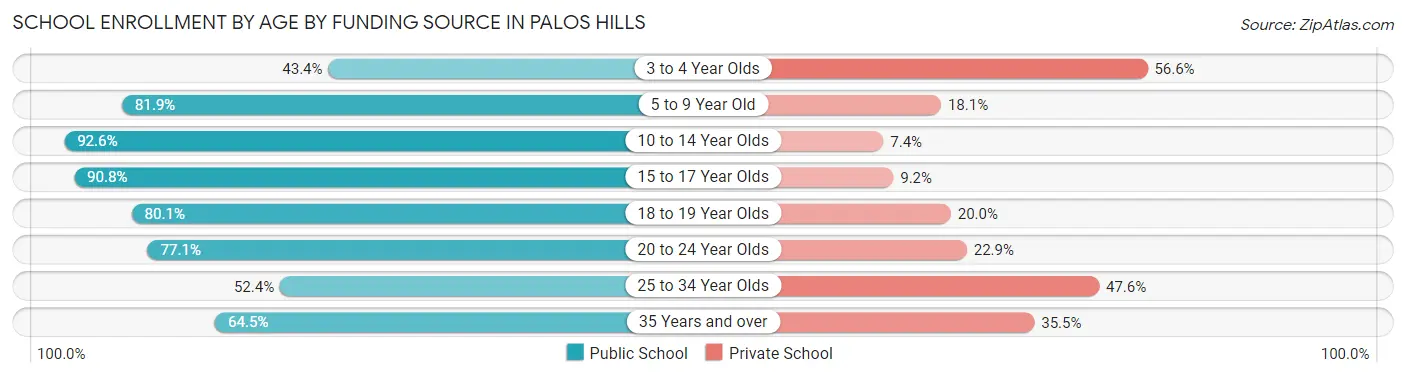
| Age Bracket | Public School | Private School |
| 3 to 4 Year Olds | 33 (43.4%) | 43 (56.6%) |
| 5 to 9 Year Old | 745 (81.9%) | 165 (18.1%) |
| 10 to 14 Year Olds | 1,002 (92.6%) | 80 (7.4%) |
| 15 to 17 Year Olds | 717 (90.8%) | 73 (9.2%) |
| 18 to 19 Year Olds | 349 (80.0%) | 87 (20.0%) |
| 20 to 24 Year Olds | 289 (77.1%) | 86 (22.9%) |
| 25 to 34 Year Olds | 108 (52.4%) | 98 (47.6%) |
| 35 Years and over | 129 (64.5%) | 71 (35.5%) |
| Total | 3,370 (82.7%) | 705 (17.3%) |
Educational Attainment by Field of Study in Palos Hills
Business (817 | 20.7%), science & technology (697 | 17.7%), education (332 | 8.4%), bio, nature & agricultural (303 | 7.7%), and liberal arts & history (262 | 6.7%) are the most common fields of study among 3,938 individuals in Palos Hills who have obtained a bachelor's degree or higher.
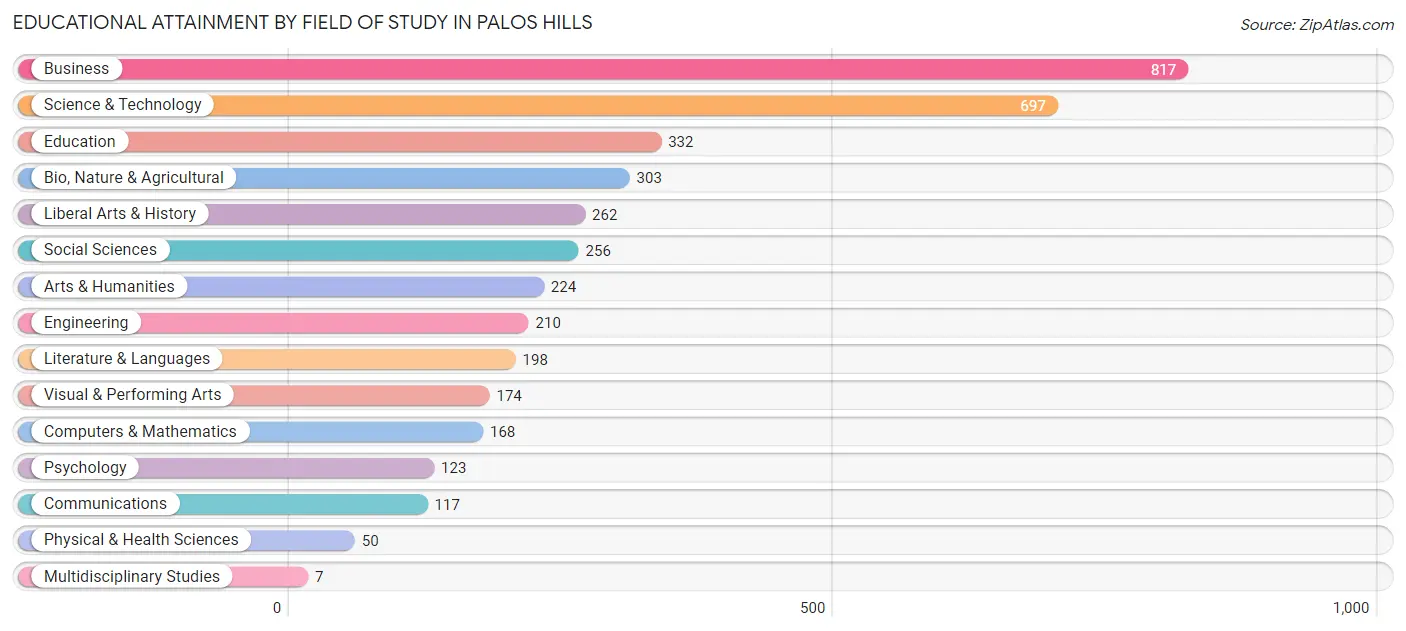
| Field of Study | # Graduates | % Graduates |
| Computers & Mathematics | 168 | 4.3% |
| Bio, Nature & Agricultural | 303 | 7.7% |
| Physical & Health Sciences | 50 | 1.3% |
| Psychology | 123 | 3.1% |
| Social Sciences | 256 | 6.5% |
| Engineering | 210 | 5.3% |
| Multidisciplinary Studies | 7 | 0.2% |
| Science & Technology | 697 | 17.7% |
| Business | 817 | 20.7% |
| Education | 332 | 8.4% |
| Literature & Languages | 198 | 5.0% |
| Liberal Arts & History | 262 | 6.7% |
| Visual & Performing Arts | 174 | 4.4% |
| Communications | 117 | 3.0% |
| Arts & Humanities | 224 | 5.7% |
| Total | 3,938 | 100.0% |
Transportation & Commute in Palos Hills
Vehicle Availability by Sex in Palos Hills
The most prevalent vehicle ownership categories in Palos Hills are males with 2 vehicles (1,918, accounting for 41.6%) and females with 2 vehicles (1,377, making up 51.6%).
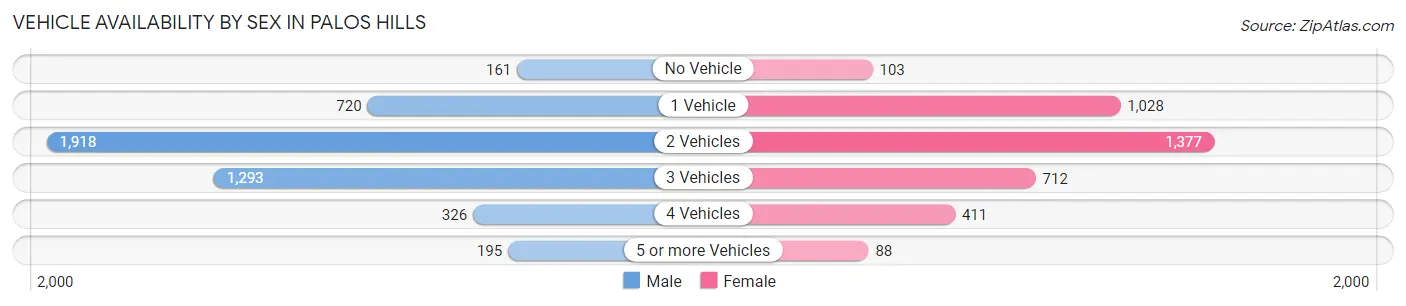
| Vehicles Available | Male | Female |
| No Vehicle | 161 (3.5%) | 103 (2.8%) |
| 1 Vehicle | 720 (15.6%) | 1,028 (27.6%) |
| 2 Vehicles | 1,918 (41.6%) | 1,377 (37.0%) |
| 3 Vehicles | 1,293 (28.0%) | 712 (19.1%) |
| 4 Vehicles | 326 (7.1%) | 411 (11.1%) |
| 5 or more Vehicles | 195 (4.2%) | 88 (2.4%) |
| Total | 4,613 (100.0%) | 3,719 (100.0%) |
Commute Time in Palos Hills
The most frequently occuring commute durations in Palos Hills are 45 to 59 minutes (1,382 commuters, 17.9%), 30 to 34 minutes (1,303 commuters, 16.9%), and 60 to 89 minutes (829 commuters, 10.8%).
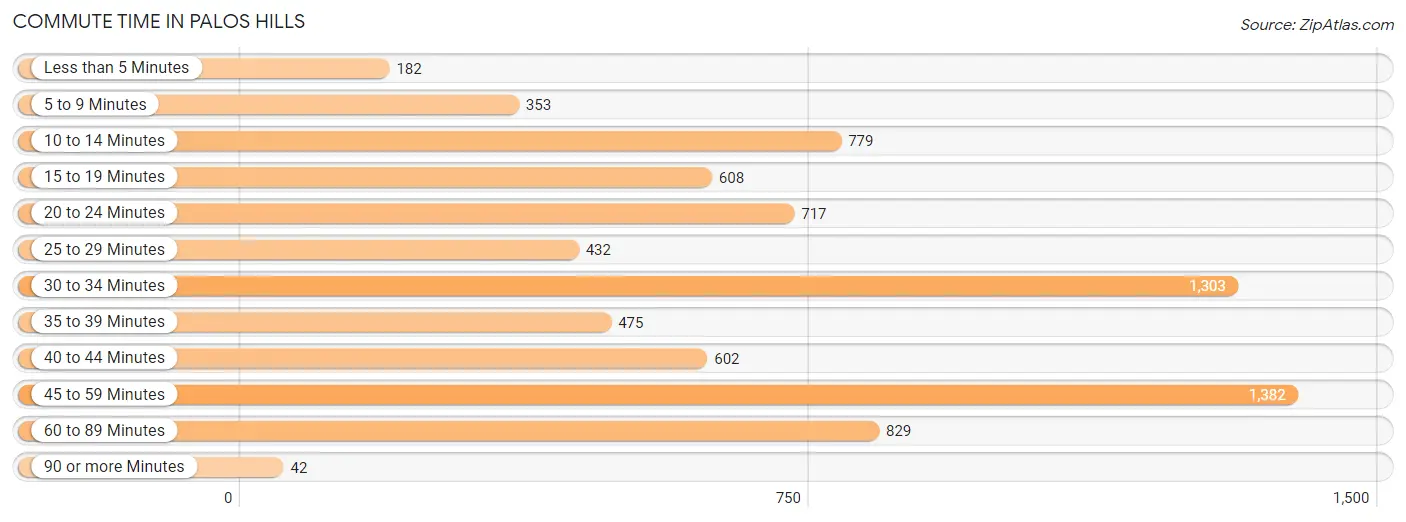
| Commute Time | # Commuters | % Commuters |
| Less than 5 Minutes | 182 | 2.4% |
| 5 to 9 Minutes | 353 | 4.6% |
| 10 to 14 Minutes | 779 | 10.1% |
| 15 to 19 Minutes | 608 | 7.9% |
| 20 to 24 Minutes | 717 | 9.3% |
| 25 to 29 Minutes | 432 | 5.6% |
| 30 to 34 Minutes | 1,303 | 16.9% |
| 35 to 39 Minutes | 475 | 6.2% |
| 40 to 44 Minutes | 602 | 7.8% |
| 45 to 59 Minutes | 1,382 | 17.9% |
| 60 to 89 Minutes | 829 | 10.8% |
| 90 or more Minutes | 42 | 0.5% |
Commute Time by Sex in Palos Hills
The most common commute times in Palos Hills are 45 to 59 minutes (904 commuters, 20.8%) for males and 30 to 34 minutes (717 commuters, 21.3%) for females.
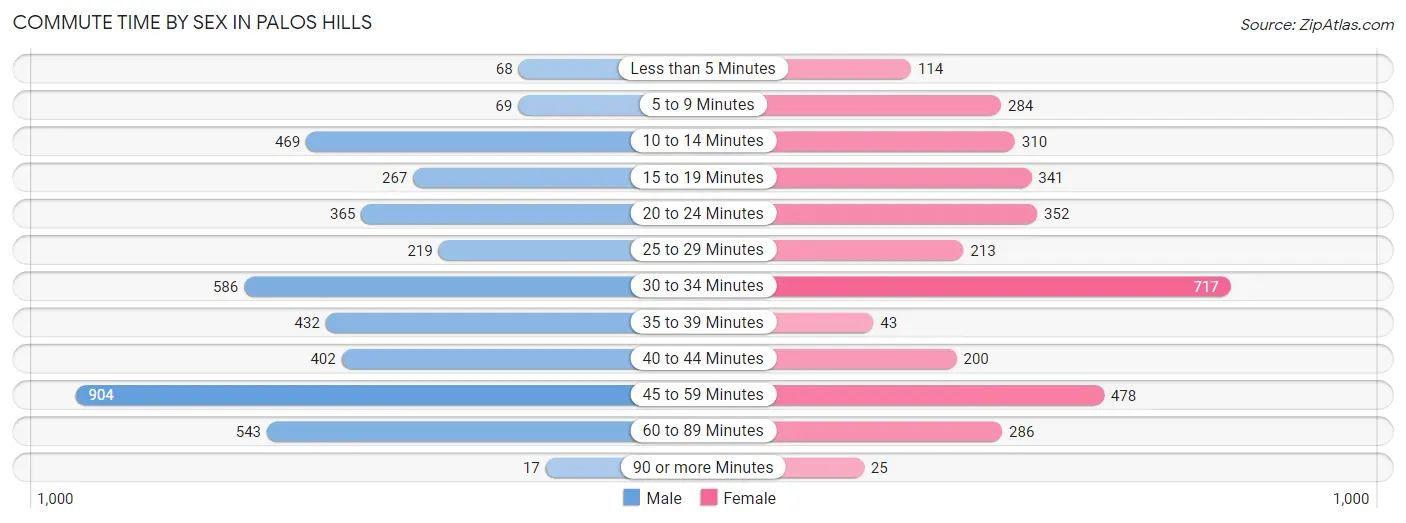
| Commute Time | Male | Female |
| Less than 5 Minutes | 68 (1.6%) | 114 (3.4%) |
| 5 to 9 Minutes | 69 (1.6%) | 284 (8.4%) |
| 10 to 14 Minutes | 469 (10.8%) | 310 (9.2%) |
| 15 to 19 Minutes | 267 (6.1%) | 341 (10.1%) |
| 20 to 24 Minutes | 365 (8.4%) | 352 (10.5%) |
| 25 to 29 Minutes | 219 (5.0%) | 213 (6.3%) |
| 30 to 34 Minutes | 586 (13.5%) | 717 (21.3%) |
| 35 to 39 Minutes | 432 (10.0%) | 43 (1.3%) |
| 40 to 44 Minutes | 402 (9.3%) | 200 (5.9%) |
| 45 to 59 Minutes | 904 (20.8%) | 478 (14.2%) |
| 60 to 89 Minutes | 543 (12.5%) | 286 (8.5%) |
| 90 or more Minutes | 17 (0.4%) | 25 (0.7%) |
Time of Departure to Work by Sex in Palos Hills
The most frequent times of departure to work in Palos Hills are 5:00 AM to 5:29 AM (757, 17.4%) for males and 7:00 AM to 7:29 AM (501, 14.9%) for females.
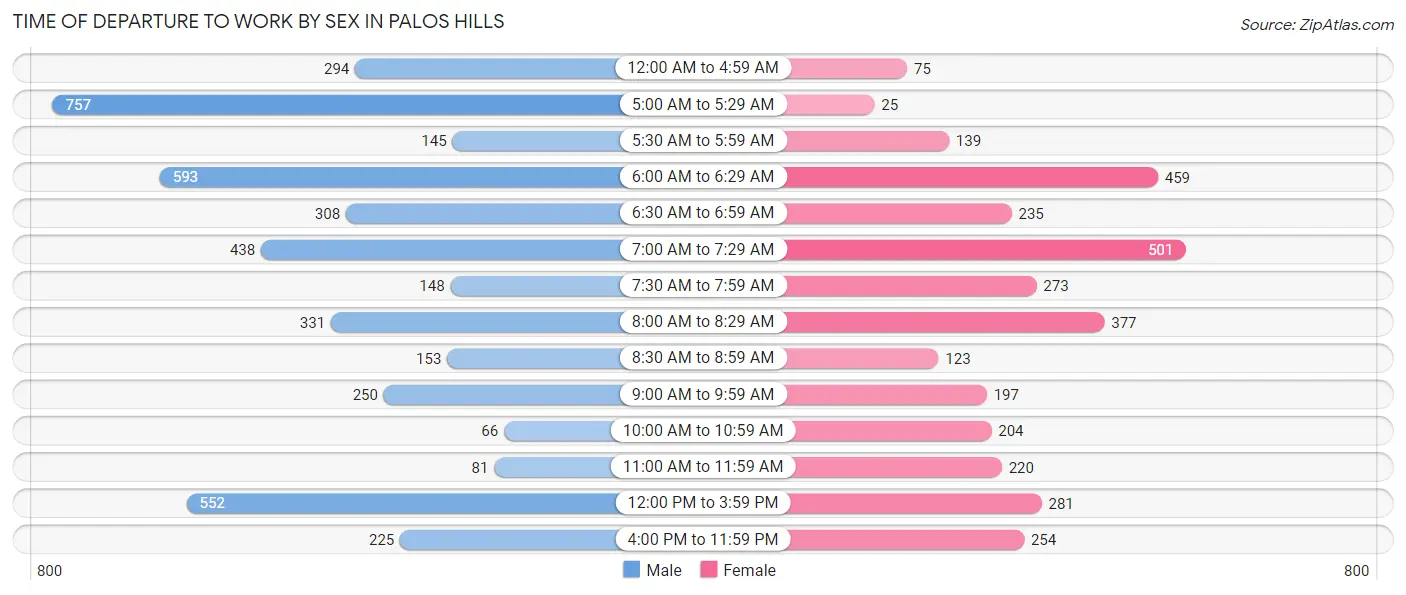
| Time of Departure | Male | Female |
| 12:00 AM to 4:59 AM | 294 (6.8%) | 75 (2.2%) |
| 5:00 AM to 5:29 AM | 757 (17.4%) | 25 (0.7%) |
| 5:30 AM to 5:59 AM | 145 (3.3%) | 139 (4.1%) |
| 6:00 AM to 6:29 AM | 593 (13.7%) | 459 (13.7%) |
| 6:30 AM to 6:59 AM | 308 (7.1%) | 235 (7.0%) |
| 7:00 AM to 7:29 AM | 438 (10.1%) | 501 (14.9%) |
| 7:30 AM to 7:59 AM | 148 (3.4%) | 273 (8.1%) |
| 8:00 AM to 8:29 AM | 331 (7.6%) | 377 (11.2%) |
| 8:30 AM to 8:59 AM | 153 (3.5%) | 123 (3.7%) |
| 9:00 AM to 9:59 AM | 250 (5.8%) | 197 (5.9%) |
| 10:00 AM to 10:59 AM | 66 (1.5%) | 204 (6.1%) |
| 11:00 AM to 11:59 AM | 81 (1.9%) | 220 (6.5%) |
| 12:00 PM to 3:59 PM | 552 (12.7%) | 281 (8.4%) |
| 4:00 PM to 11:59 PM | 225 (5.2%) | 254 (7.5%) |
| Total | 4,341 (100.0%) | 3,363 (100.0%) |
Housing Occupancy in Palos Hills
Occupancy by Ownership in Palos Hills
Of the total 7,356 dwellings in Palos Hills, owner-occupied units account for 5,814 (79.0%), while renter-occupied units make up 1,542 (21.0%).
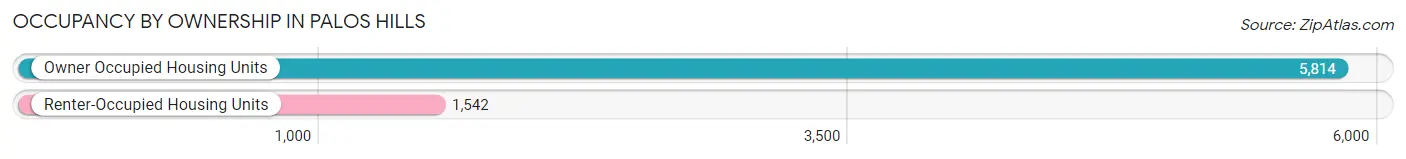
| Occupancy | # Housing Units | % Housing Units |
| Owner Occupied Housing Units | 5,814 | 79.0% |
| Renter-Occupied Housing Units | 1,542 | 21.0% |
| Total Occupied Housing Units | 7,356 | 100.0% |
Occupancy by Household Size in Palos Hills
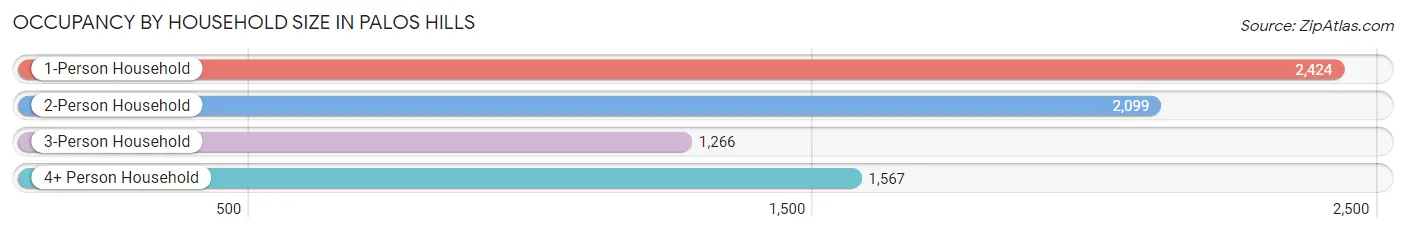
| Household Size | # Housing Units | % Housing Units |
| 1-Person Household | 2,424 | 33.0% |
| 2-Person Household | 2,099 | 28.5% |
| 3-Person Household | 1,266 | 17.2% |
| 4+ Person Household | 1,567 | 21.3% |
| Total Housing Units | 7,356 | 100.0% |
Occupancy by Ownership by Household Size in Palos Hills
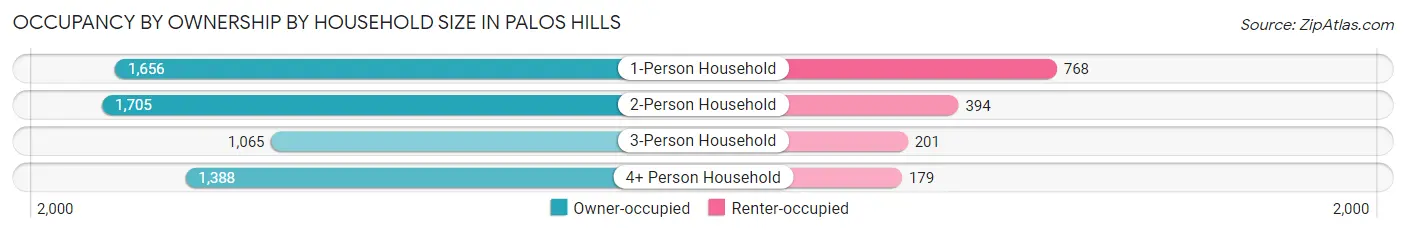
| Household Size | Owner-occupied | Renter-occupied |
| 1-Person Household | 1,656 (68.3%) | 768 (31.7%) |
| 2-Person Household | 1,705 (81.2%) | 394 (18.8%) |
| 3-Person Household | 1,065 (84.1%) | 201 (15.9%) |
| 4+ Person Household | 1,388 (88.6%) | 179 (11.4%) |
| Total Housing Units | 5,814 (79.0%) | 1,542 (21.0%) |
Occupancy by Educational Attainment in Palos Hills
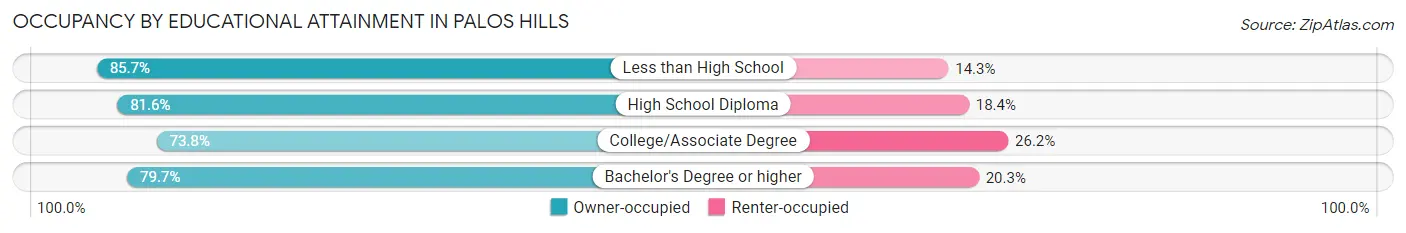
| Household Size | Owner-occupied | Renter-occupied |
| Less than High School | 689 (85.7%) | 115 (14.3%) |
| High School Diploma | 1,764 (81.6%) | 397 (18.4%) |
| College/Associate Degree | 1,739 (73.8%) | 616 (26.2%) |
| Bachelor's Degree or higher | 1,622 (79.7%) | 414 (20.3%) |
Occupancy by Age of Householder in Palos Hills
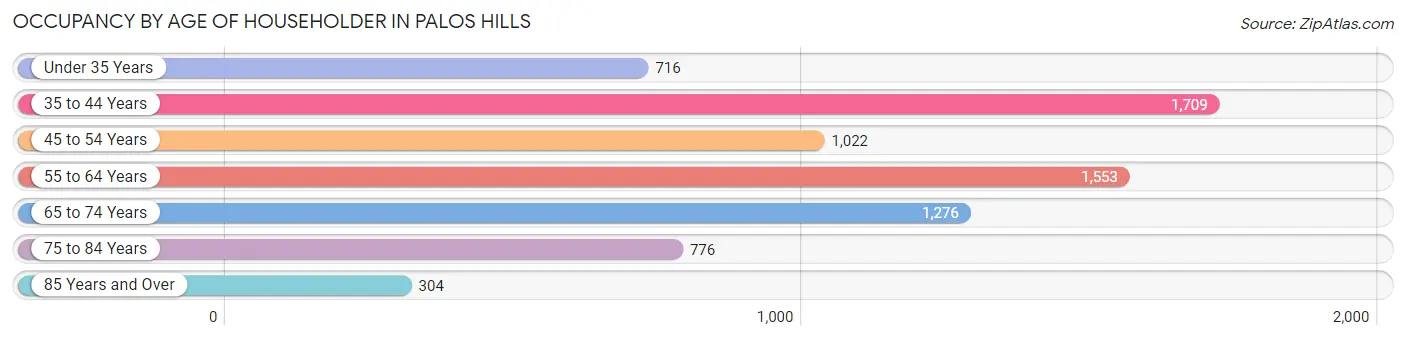
| Age Bracket | # Households | % Households |
| Under 35 Years | 716 | 9.7% |
| 35 to 44 Years | 1,709 | 23.2% |
| 45 to 54 Years | 1,022 | 13.9% |
| 55 to 64 Years | 1,553 | 21.1% |
| 65 to 74 Years | 1,276 | 17.3% |
| 75 to 84 Years | 776 | 10.5% |
| 85 Years and Over | 304 | 4.1% |
| Total | 7,356 | 100.0% |
Housing Finances in Palos Hills
Median Income by Occupancy in Palos Hills
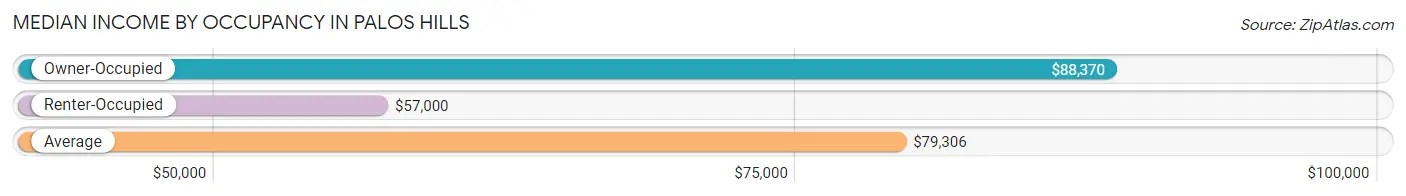
| Occupancy Type | # Households | Median Income |
| Owner-Occupied | 5,814 (79.0%) | $88,370 |
| Renter-Occupied | 1,542 (21.0%) | $57,000 |
| Average | 7,356 (100.0%) | $79,306 |
Occupancy by Householder Income Bracket in Palos Hills
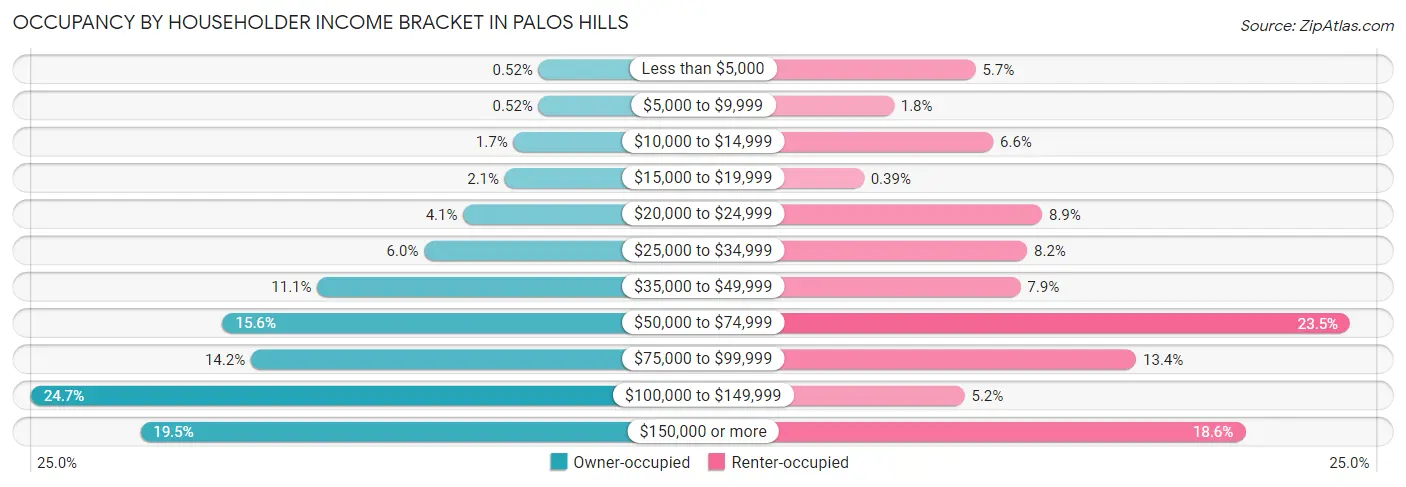
| Income Bracket | Owner-occupied | Renter-occupied |
| Less than $5,000 | 30 (0.5%) | 88 (5.7%) |
| $5,000 to $9,999 | 30 (0.5%) | 28 (1.8%) |
| $10,000 to $14,999 | 100 (1.7%) | 101 (6.6%) |
| $15,000 to $19,999 | 124 (2.1%) | 6 (0.4%) |
| $20,000 to $24,999 | 239 (4.1%) | 137 (8.9%) |
| $25,000 to $34,999 | 347 (6.0%) | 126 (8.2%) |
| $35,000 to $49,999 | 643 (11.1%) | 121 (7.9%) |
| $50,000 to $74,999 | 905 (15.6%) | 363 (23.5%) |
| $75,000 to $99,999 | 827 (14.2%) | 206 (13.4%) |
| $100,000 to $149,999 | 1,436 (24.7%) | 80 (5.2%) |
| $150,000 or more | 1,133 (19.5%) | 286 (18.5%) |
| Total | 5,814 (100.0%) | 1,542 (100.0%) |
Monthly Housing Cost Tiers in Palos Hills
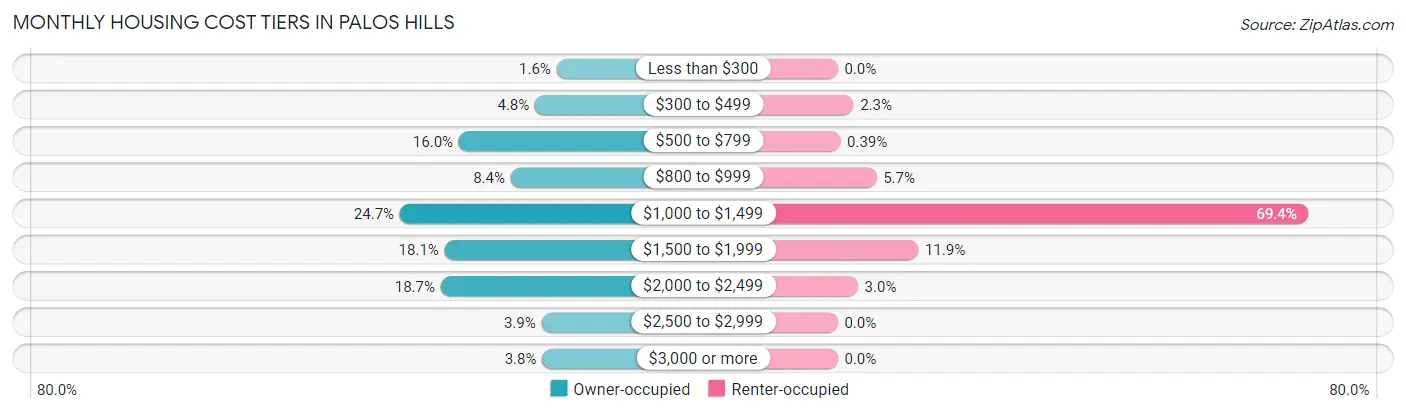
| Monthly Cost | Owner-occupied | Renter-occupied |
| Less than $300 | 95 (1.6%) | 0 (0.0%) |
| $300 to $499 | 279 (4.8%) | 36 (2.3%) |
| $500 to $799 | 932 (16.0%) | 6 (0.4%) |
| $800 to $999 | 488 (8.4%) | 88 (5.7%) |
| $1,000 to $1,499 | 1,437 (24.7%) | 1,070 (69.4%) |
| $1,500 to $1,999 | 1,054 (18.1%) | 183 (11.9%) |
| $2,000 to $2,499 | 1,087 (18.7%) | 46 (3.0%) |
| $2,500 to $2,999 | 224 (3.8%) | 0 (0.0%) |
| $3,000 or more | 218 (3.7%) | 0 (0.0%) |
| Total | 5,814 (100.0%) | 1,542 (100.0%) |
Physical Housing Characteristics in Palos Hills
Housing Structures in Palos Hills
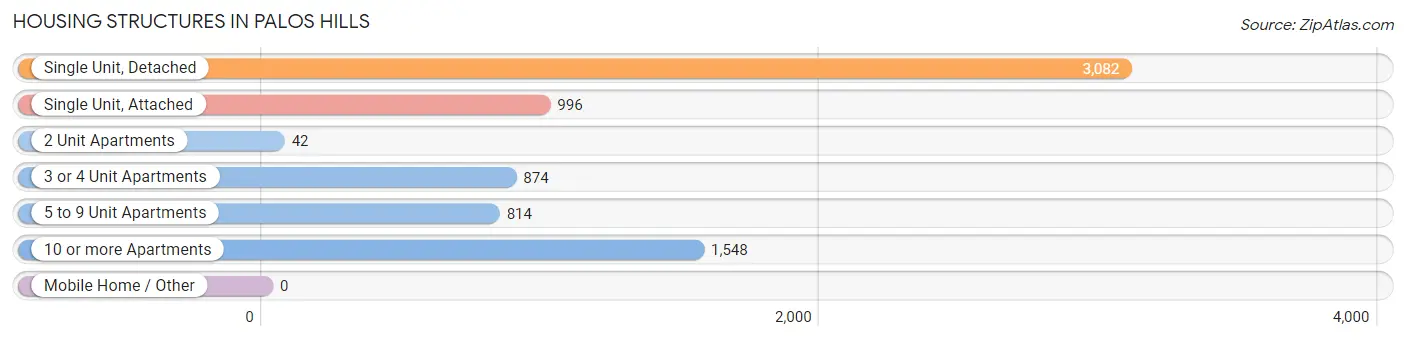
| Structure Type | # Housing Units | % Housing Units |
| Single Unit, Detached | 3,082 | 41.9% |
| Single Unit, Attached | 996 | 13.5% |
| 2 Unit Apartments | 42 | 0.6% |
| 3 or 4 Unit Apartments | 874 | 11.9% |
| 5 to 9 Unit Apartments | 814 | 11.1% |
| 10 or more Apartments | 1,548 | 21.0% |
| Mobile Home / Other | 0 | 0.0% |
| Total | 7,356 | 100.0% |
Housing Structures by Occupancy in Palos Hills
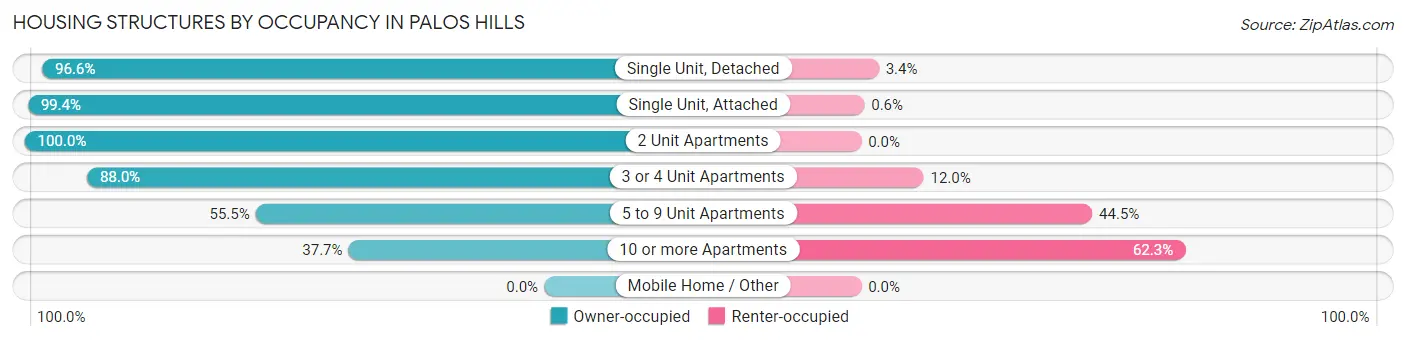
| Structure Type | Owner-occupied | Renter-occupied |
| Single Unit, Detached | 2,978 (96.6%) | 104 (3.4%) |
| Single Unit, Attached | 990 (99.4%) | 6 (0.6%) |
| 2 Unit Apartments | 42 (100.0%) | 0 (0.0%) |
| 3 or 4 Unit Apartments | 769 (88.0%) | 105 (12.0%) |
| 5 to 9 Unit Apartments | 452 (55.5%) | 362 (44.5%) |
| 10 or more Apartments | 583 (37.7%) | 965 (62.3%) |
| Mobile Home / Other | 0 (0.0%) | 0 (0.0%) |
| Total | 5,814 (79.0%) | 1,542 (21.0%) |
Housing Structures by Number of Rooms in Palos Hills
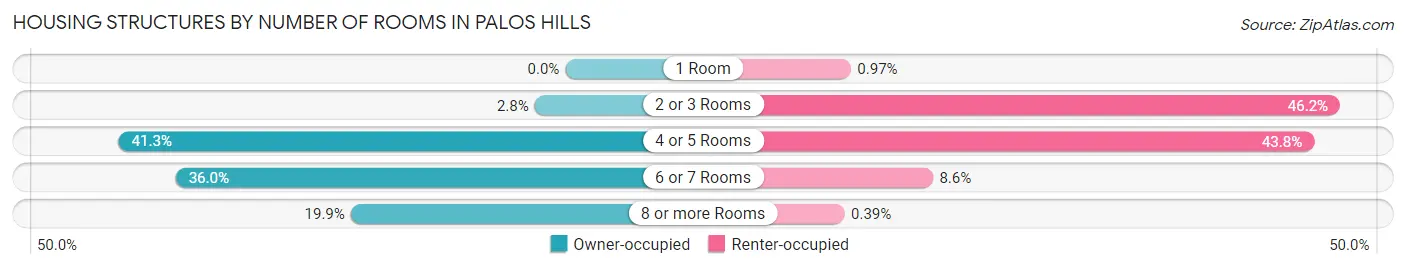
| Number of Rooms | Owner-occupied | Renter-occupied |
| 1 Room | 0 (0.0%) | 15 (1.0%) |
| 2 or 3 Rooms | 165 (2.8%) | 713 (46.2%) |
| 4 or 5 Rooms | 2,401 (41.3%) | 676 (43.8%) |
| 6 or 7 Rooms | 2,094 (36.0%) | 132 (8.6%) |
| 8 or more Rooms | 1,154 (19.9%) | 6 (0.4%) |
| Total | 5,814 (100.0%) | 1,542 (100.0%) |
Housing Structure by Heating Type in Palos Hills
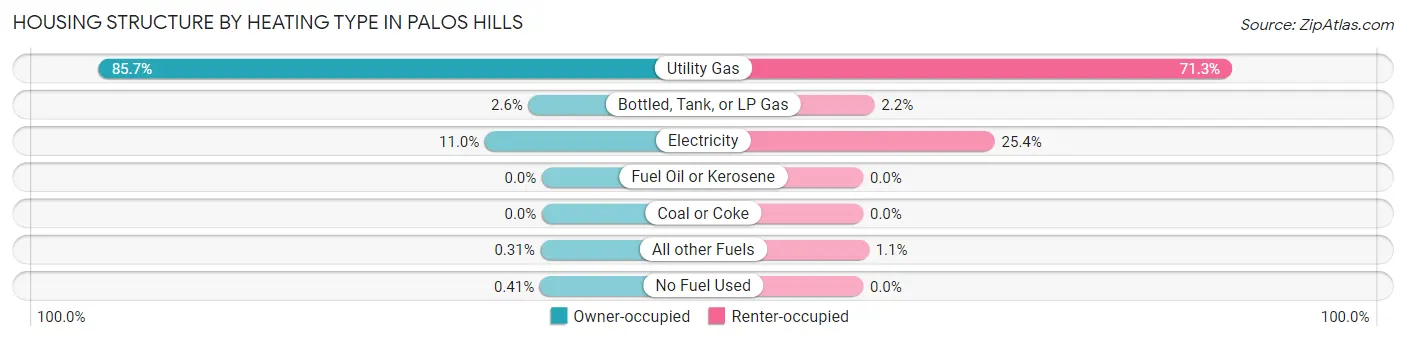
| Heating Type | Owner-occupied | Renter-occupied |
| Utility Gas | 4,981 (85.7%) | 1,099 (71.3%) |
| Bottled, Tank, or LP Gas | 151 (2.6%) | 34 (2.2%) |
| Electricity | 640 (11.0%) | 392 (25.4%) |
| Fuel Oil or Kerosene | 0 (0.0%) | 0 (0.0%) |
| Coal or Coke | 0 (0.0%) | 0 (0.0%) |
| All other Fuels | 18 (0.3%) | 17 (1.1%) |
| No Fuel Used | 24 (0.4%) | 0 (0.0%) |
| Total | 5,814 (100.0%) | 1,542 (100.0%) |
Household Vehicle Usage in Palos Hills
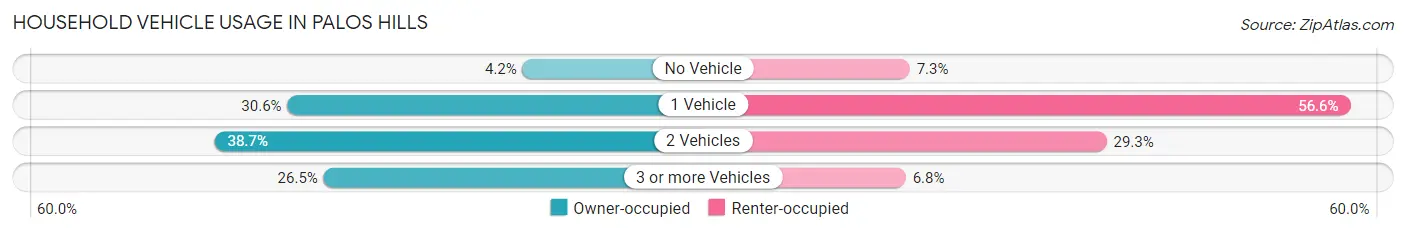
| Vehicles per Household | Owner-occupied | Renter-occupied |
| No Vehicle | 245 (4.2%) | 112 (7.3%) |
| 1 Vehicle | 1,777 (30.6%) | 873 (56.6%) |
| 2 Vehicles | 2,251 (38.7%) | 452 (29.3%) |
| 3 or more Vehicles | 1,541 (26.5%) | 105 (6.8%) |
| Total | 5,814 (100.0%) | 1,542 (100.0%) |
Real Estate & Mortgages in Palos Hills
Real Estate and Mortgage Overview in Palos Hills
| Characteristic | Without Mortgage | With Mortgage |
| Housing Units | 1,968 | 3,846 |
| Median Property Value | $234,600 | $243,400 |
| Median Household Income | $61,338 | $859 |
| Monthly Housing Costs | $737 | $218 |
| Real Estate Taxes | $4,473 | $0 |
Property Value by Mortgage Status in Palos Hills
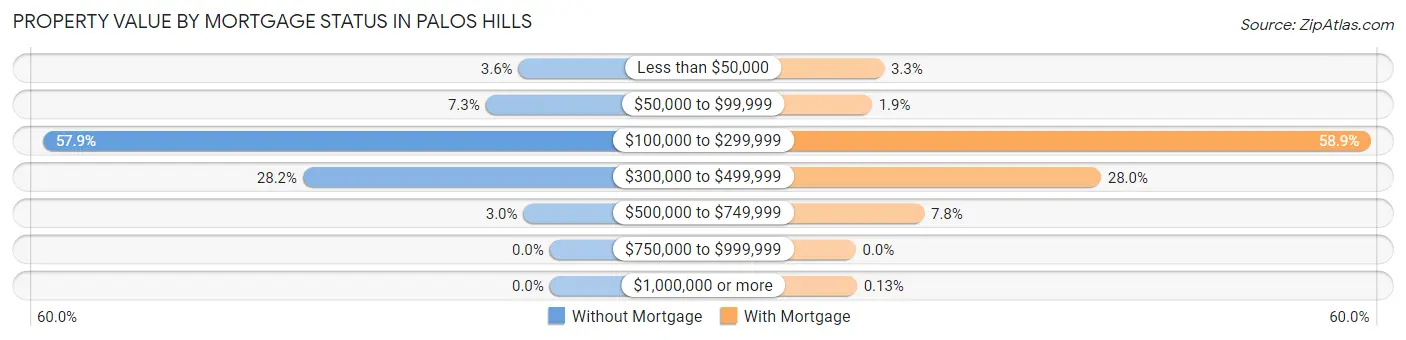
| Property Value | Without Mortgage | With Mortgage |
| Less than $50,000 | 70 (3.6%) | 125 (3.3%) |
| $50,000 to $99,999 | 144 (7.3%) | 71 (1.8%) |
| $100,000 to $299,999 | 1,140 (57.9%) | 2,266 (58.9%) |
| $300,000 to $499,999 | 555 (28.2%) | 1,078 (28.0%) |
| $500,000 to $749,999 | 59 (3.0%) | 301 (7.8%) |
| $750,000 to $999,999 | 0 (0.0%) | 0 (0.0%) |
| $1,000,000 or more | 0 (0.0%) | 5 (0.1%) |
| Total | 1,968 (100.0%) | 3,846 (100.0%) |
Household Income by Mortgage Status in Palos Hills
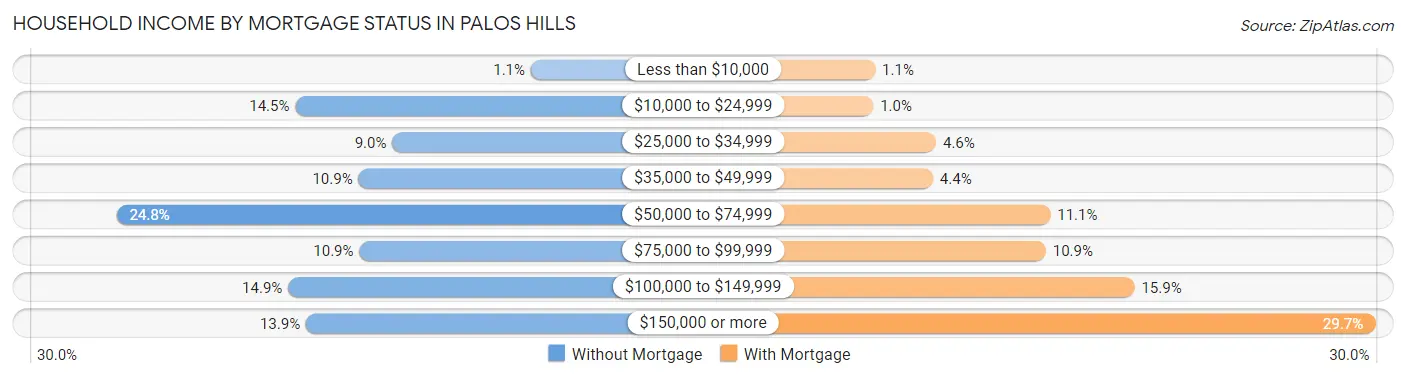
| Household Income | Without Mortgage | With Mortgage |
| Less than $10,000 | 21 (1.1%) | 43 (1.1%) |
| $10,000 to $24,999 | 286 (14.5%) | 39 (1.0%) |
| $25,000 to $34,999 | 177 (9.0%) | 177 (4.6%) |
| $35,000 to $49,999 | 215 (10.9%) | 170 (4.4%) |
| $50,000 to $74,999 | 487 (24.7%) | 428 (11.1%) |
| $75,000 to $99,999 | 214 (10.9%) | 418 (10.9%) |
| $100,000 to $149,999 | 294 (14.9%) | 613 (15.9%) |
| $150,000 or more | 274 (13.9%) | 1,142 (29.7%) |
| Total | 1,968 (100.0%) | 3,846 (100.0%) |
Property Value to Household Income Ratio in Palos Hills
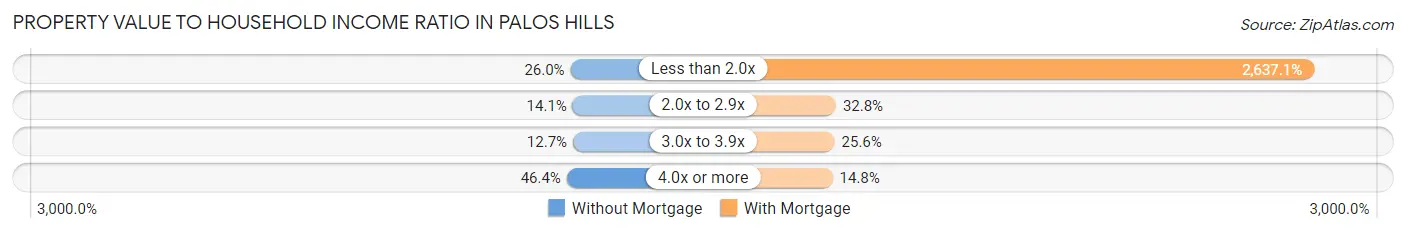
| Value-to-Income Ratio | Without Mortgage | With Mortgage |
| Less than 2.0x | 512 (26.0%) | 101,423 (2,637.1%) |
| 2.0x to 2.9x | 278 (14.1%) | 1,261 (32.8%) |
| 3.0x to 3.9x | 250 (12.7%) | 986 (25.6%) |
| 4.0x or more | 914 (46.4%) | 569 (14.8%) |
| Total | 1,968 (100.0%) | 3,846 (100.0%) |
Real Estate Taxes by Mortgage Status in Palos Hills
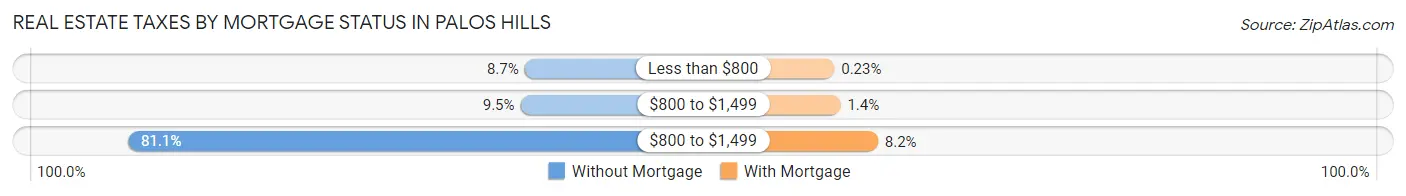
| Property Taxes | Without Mortgage | With Mortgage |
| Less than $800 | 171 (8.7%) | 9 (0.2%) |
| $800 to $1,499 | 186 (9.5%) | 52 (1.3%) |
| $800 to $1,499 | 1,596 (81.1%) | 315 (8.2%) |
| Total | 1,968 (100.0%) | 3,846 (100.0%) |
Health & Disability in Palos Hills
Health Insurance Coverage by Age in Palos Hills
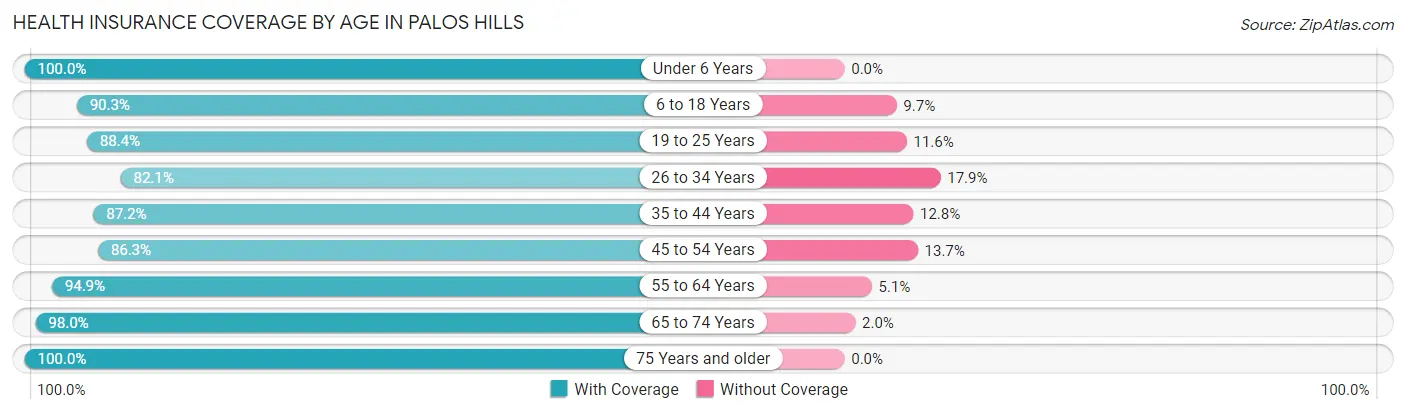
| Age Bracket | With Coverage | Without Coverage |
| Under 6 Years | 1,023 (100.0%) | 0 (0.0%) |
| 6 to 18 Years | 2,656 (90.3%) | 286 (9.7%) |
| 19 to 25 Years | 997 (88.4%) | 131 (11.6%) |
| 26 to 34 Years | 1,532 (82.1%) | 334 (17.9%) |
| 35 to 44 Years | 2,482 (87.2%) | 365 (12.8%) |
| 45 to 54 Years | 1,837 (86.3%) | 291 (13.7%) |
| 55 to 64 Years | 2,422 (94.9%) | 130 (5.1%) |
| 65 to 74 Years | 2,036 (98.0%) | 42 (2.0%) |
| 75 Years and older | 1,574 (100.0%) | 0 (0.0%) |
| Total | 16,559 (91.3%) | 1,579 (8.7%) |
Health Insurance Coverage by Citizenship Status in Palos Hills
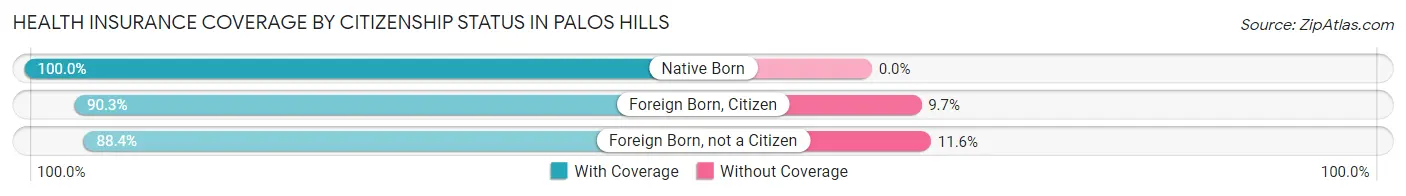
| Citizenship Status | With Coverage | Without Coverage |
| Native Born | 1,023 (100.0%) | 0 (0.0%) |
| Foreign Born, Citizen | 2,656 (90.3%) | 286 (9.7%) |
| Foreign Born, not a Citizen | 997 (88.4%) | 131 (11.6%) |
Health Insurance Coverage by Household Income in Palos Hills
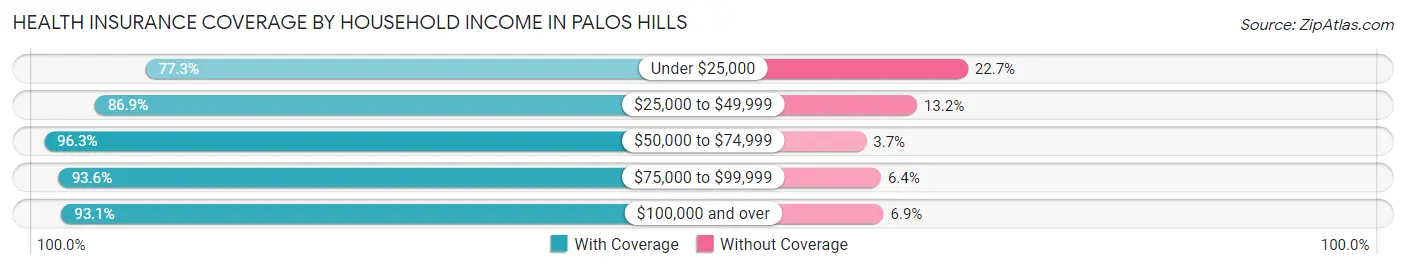
| Household Income | With Coverage | Without Coverage |
| Under $25,000 | 1,400 (77.3%) | 411 (22.7%) |
| $25,000 to $49,999 | 1,975 (86.9%) | 299 (13.2%) |
| $50,000 to $74,999 | 2,622 (96.3%) | 100 (3.7%) |
| $75,000 to $99,999 | 2,281 (93.6%) | 156 (6.4%) |
| $100,000 and over | 8,242 (93.1%) | 610 (6.9%) |
Public vs Private Health Insurance Coverage by Age in Palos Hills
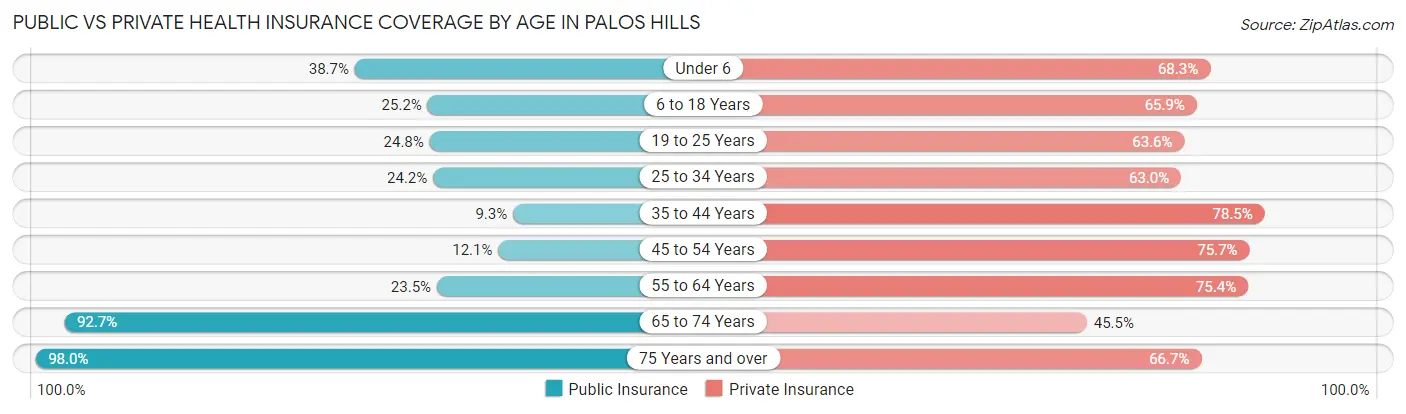
| Age Bracket | Public Insurance | Private Insurance |
| Under 6 | 396 (38.7%) | 699 (68.3%) |
| 6 to 18 Years | 741 (25.2%) | 1,938 (65.9%) |
| 19 to 25 Years | 280 (24.8%) | 717 (63.6%) |
| 25 to 34 Years | 451 (24.2%) | 1,175 (63.0%) |
| 35 to 44 Years | 266 (9.3%) | 2,234 (78.5%) |
| 45 to 54 Years | 257 (12.1%) | 1,610 (75.7%) |
| 55 to 64 Years | 599 (23.5%) | 1,924 (75.4%) |
| 65 to 74 Years | 1,926 (92.7%) | 945 (45.5%) |
| 75 Years and over | 1,543 (98.0%) | 1,050 (66.7%) |
| Total | 6,459 (35.6%) | 12,292 (67.8%) |
Disability Status by Sex by Age in Palos Hills
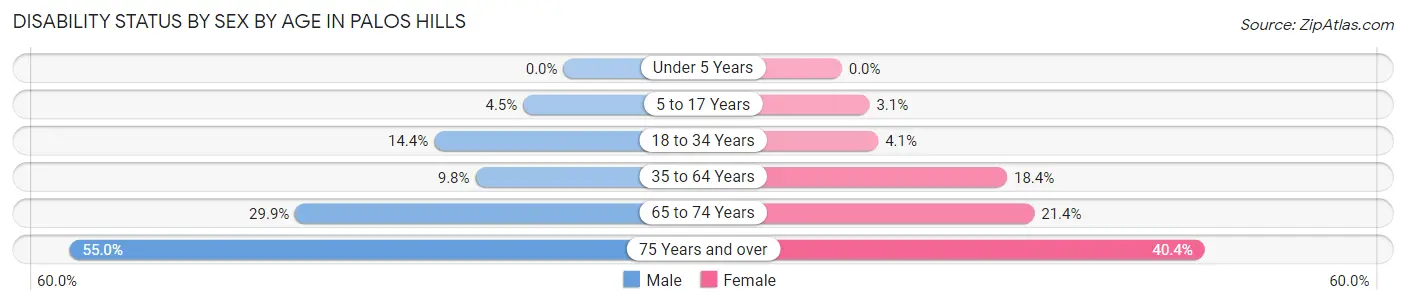
| Age Bracket | Male | Female |
| Under 5 Years | 0 (0.0%) | 0 (0.0%) |
| 5 to 17 Years | 80 (4.5%) | 39 (3.1%) |
| 18 to 34 Years | 224 (14.4%) | 69 (4.1%) |
| 35 to 64 Years | 373 (9.8%) | 685 (18.4%) |
| 65 to 74 Years | 310 (29.9%) | 223 (21.4%) |
| 75 Years and over | 298 (55.0%) | 417 (40.4%) |
Disability Class by Sex by Age in Palos Hills
Disability Class: Hearing Difficulty
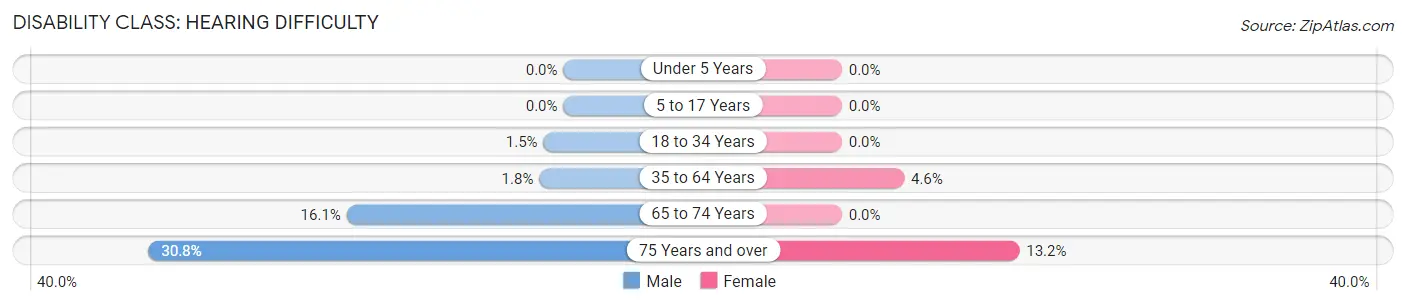
| Age Bracket | Male | Female |
| Under 5 Years | 0 (0.0%) | 0 (0.0%) |
| 5 to 17 Years | 0 (0.0%) | 0 (0.0%) |
| 18 to 34 Years | 23 (1.5%) | 0 (0.0%) |
| 35 to 64 Years | 68 (1.8%) | 172 (4.6%) |
| 65 to 74 Years | 167 (16.1%) | 0 (0.0%) |
| 75 Years and over | 167 (30.8%) | 136 (13.2%) |
Disability Class: Vision Difficulty
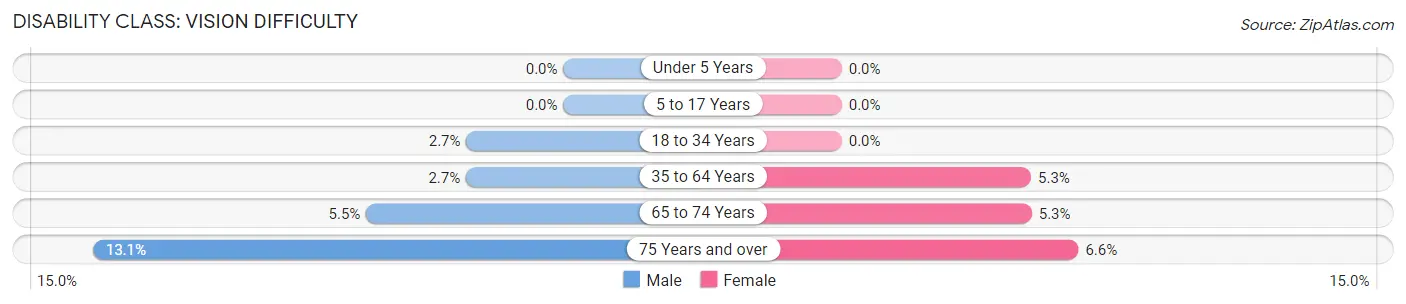
| Age Bracket | Male | Female |
| Under 5 Years | 0 (0.0%) | 0 (0.0%) |
| 5 to 17 Years | 0 (0.0%) | 0 (0.0%) |
| 18 to 34 Years | 42 (2.7%) | 0 (0.0%) |
| 35 to 64 Years | 103 (2.7%) | 196 (5.3%) |
| 65 to 74 Years | 57 (5.5%) | 55 (5.3%) |
| 75 Years and over | 71 (13.1%) | 68 (6.6%) |
Disability Class: Cognitive Difficulty
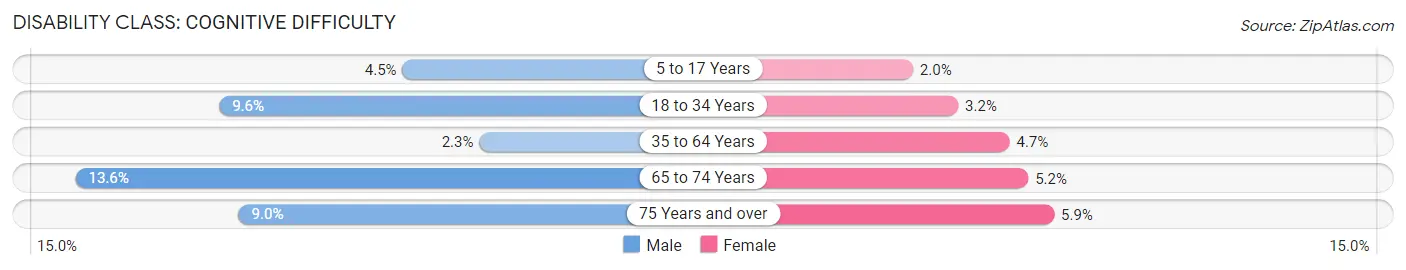
| Age Bracket | Male | Female |
| 5 to 17 Years | 80 (4.5%) | 25 (2.0%) |
| 18 to 34 Years | 149 (9.6%) | 55 (3.2%) |
| 35 to 64 Years | 89 (2.3%) | 174 (4.7%) |
| 65 to 74 Years | 141 (13.6%) | 54 (5.2%) |
| 75 Years and over | 49 (9.0%) | 61 (5.9%) |
Disability Class: Ambulatory Difficulty
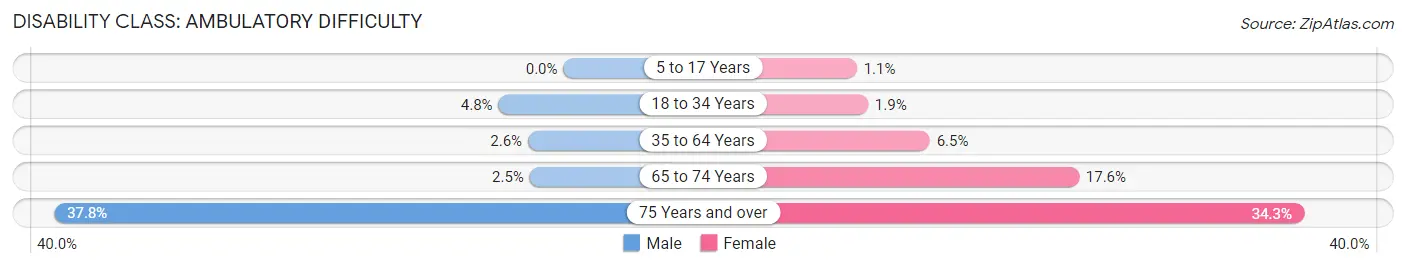
| Age Bracket | Male | Female |
| 5 to 17 Years | 0 (0.0%) | 14 (1.1%) |
| 18 to 34 Years | 75 (4.8%) | 33 (1.9%) |
| 35 to 64 Years | 100 (2.6%) | 243 (6.5%) |
| 65 to 74 Years | 26 (2.5%) | 183 (17.6%) |
| 75 Years and over | 205 (37.8%) | 354 (34.3%) |
Disability Class: Self-Care Difficulty
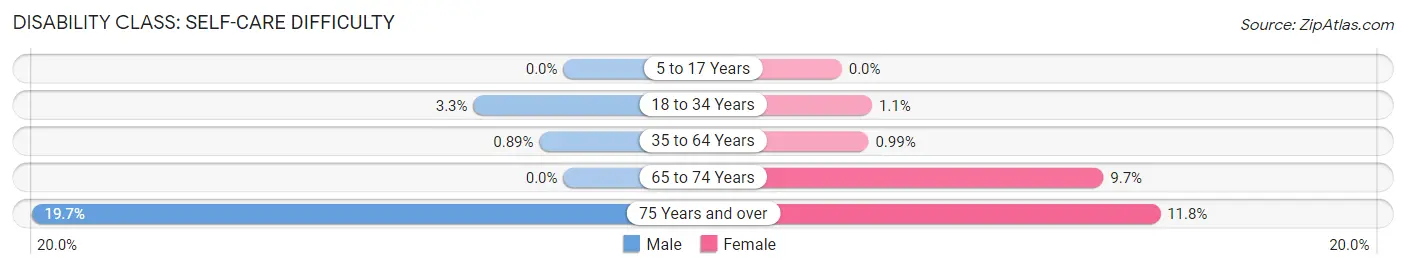
| Age Bracket | Male | Female |
| 5 to 17 Years | 0 (0.0%) | 0 (0.0%) |
| 18 to 34 Years | 52 (3.3%) | 19 (1.1%) |
| 35 to 64 Years | 34 (0.9%) | 37 (1.0%) |
| 65 to 74 Years | 0 (0.0%) | 101 (9.7%) |
| 75 Years and over | 107 (19.7%) | 122 (11.8%) |
Technology Access in Palos Hills
Computing Device Access in Palos Hills
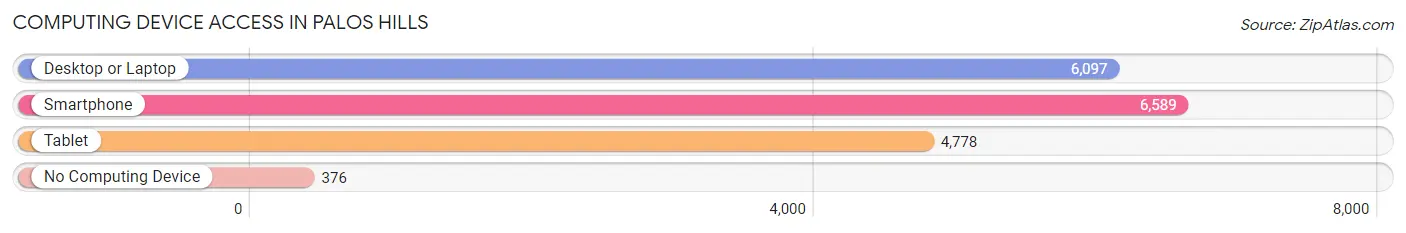
| Device Type | # Households | % Households |
| Desktop or Laptop | 6,097 | 82.9% |
| Smartphone | 6,589 | 89.6% |
| Tablet | 4,778 | 64.9% |
| No Computing Device | 376 | 5.1% |
| Total | 7,356 | 100.0% |
Internet Access in Palos Hills
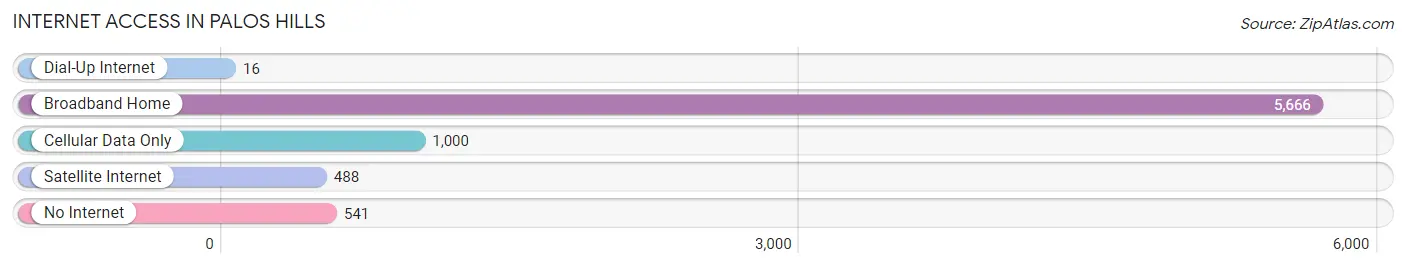
| Internet Type | # Households | % Households |
| Dial-Up Internet | 16 | 0.2% |
| Broadband Home | 5,666 | 77.0% |
| Cellular Data Only | 1,000 | 13.6% |
| Satellite Internet | 488 | 6.6% |
| No Internet | 541 | 7.3% |
| Total | 7,356 | 100.0% |
Palos Hills Summary
Palos Hills, Illinois is a city located in Cook County, Illinois, United States. It is a suburb of Chicago, located about 20 miles southwest of the city. The population was 17,484 at the 2010 census.
History
Palos Hills was first settled in the late 1800s by German and Irish immigrants. The area was originally known as "Palos Township" and was part of the larger Palos Township. In the early 1900s, the area was annexed by the City of Chicago. In the 1950s, the area was re-annexed by Cook County and became the City of Palos Hills.
Geography
Palos Hills is located at 41°41'17" North, 87°48'17" West (41.6879, -87.8047). According to the United States Census Bureau, the city has a total area of 5.2 square miles, all of it land.
Economy
Palos Hills is home to a variety of businesses, including manufacturing, retail, and service industries. The city is also home to a number of corporate headquarters, including the headquarters of the American Academy of Pediatrics.
Demographics
As of the 2010 census, there were 17,484 people, 6,845 households, and 4,845 families residing in the city. The population density was 3,364.2 people per square mile. The racial makeup of the city was 79.2% White, 8.2% African American, 0.2% Native American, 6.3% Asian, 0.1% Pacific Islander, 3.2% from other races, and 2.9% from two or more races. Hispanic or Latino of any race were 8.7% of the population.
The median income for a household in the city was $60,945, and the median income for a family was $71,945. The per capita income for the city was $27,945. About 4.2% of families and 5.7% of the population were below the poverty line, including 6.7% of those under age 18 and 4.2% of those age 65 or over.
Conclusion
Palos Hills, Illinois is a city located in Cook County, Illinois, United States. It is a suburb of Chicago, located about 20 miles southwest of the city. The population was 17,484 at the 2010 census. Palos Hills was first settled in the late 1800s by German and Irish immigrants. The city is home to a variety of businesses, including manufacturing, retail, and service industries. The racial makeup of the city was 79.2% White, 8.2% African American, 0.2% Native American, 6.3% Asian, 0.1% Pacific Islander, 3.2% from other races, and 2.9% from two or more races. The median income for a household in the city was $60,945, and the median income for a family was $71,945. Palos Hills is a diverse and vibrant city with a rich history and a bright future.
Common Questions
What is Per Capita Income in Palos Hills?
Per Capita income in Palos Hills is $39,791.
What is the Median Family Income in Palos Hills?
Median Family Income in Palos Hills is $92,534.
What is the Median Household income in Palos Hills?
Median Household Income in Palos Hills is $79,306.
What is Income or Wage Gap in Palos Hills?
Income or Wage Gap in Palos Hills is 33.4%.
Women in Palos Hills earn 66.6 cents for every dollar earned by a man.
What is Family Income Deficit in Palos Hills?
Family Income Deficit in Palos Hills is $10,362.
Families that are below poverty line in Palos Hills earn $10,362 less on average than the poverty threshold level.
What is Inequality or Gini Index in Palos Hills?
Inequality or Gini Index in Palos Hills is 0.40.
What is the Total Population of Palos Hills?
Total Population of Palos Hills is 18,278.
What is the Total Male Population of Palos Hills?
Total Male Population of Palos Hills is 9,242.
What is the Total Female Population of Palos Hills?
Total Female Population of Palos Hills is 9,036.
What is the Ratio of Males per 100 Females in Palos Hills?
There are 102.28 Males per 100 Females in Palos Hills.
What is the Ratio of Females per 100 Males in Palos Hills?
There are 97.77 Females per 100 Males in Palos Hills.
What is the Median Population Age in Palos Hills?
Median Population Age in Palos Hills is 42.2 Years.
What is the Average Family Size in Palos Hills
Average Family Size in Palos Hills is 3.2 People.
What is the Average Household Size in Palos Hills
Average Household Size in Palos Hills is 2.5 People.
How Large is the Labor Force in Palos Hills?
There are 9,146 People in the Labor Forcein in Palos Hills.
What is the Percentage of People in the Labor Force in Palos Hills?
60.8% of People are in the Labor Force in Palos Hills.
What is the Unemployment Rate in Palos Hills?
Unemployment Rate in Palos Hills is 4.9%.