Columbus, OH Map & Demographics
Columbus Map
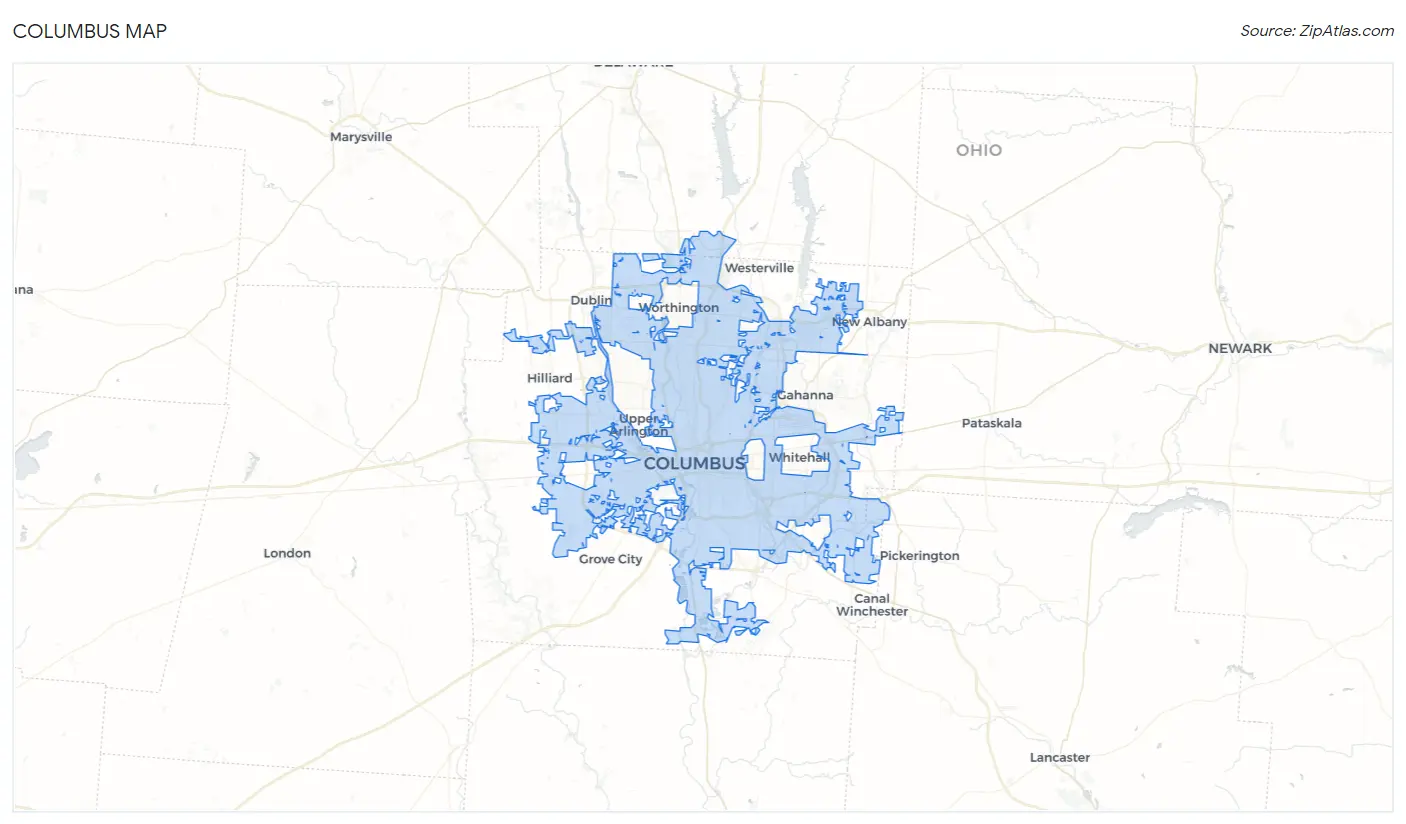
Columbus Overview
$35,640
PER CAPITA INCOME
$77,105
AVG FAMILY INCOME
$62,994
AVG HOUSEHOLD INCOME
19.0%
WAGE / INCOME GAP [ % ]
81.0¢/ $1
WAGE / INCOME GAP [ $ ]
$11,507
FAMILY INCOME DEFICIT
0.44
INEQUALITY / GINI INDEX
902,449
TOTAL POPULATION
443,734
MALE POPULATION
458,715
FEMALE POPULATION
96.73
MALES / 100 FEMALES
103.38
FEMALES / 100 MALES
32.7
MEDIAN AGE
3.1
AVG FAMILY SIZE
2.3
AVG HOUSEHOLD SIZE
510,323
LABOR FORCE [ PEOPLE ]
70.5%
PERCENT IN LABOR FORCE
5.2%
UNEMPLOYMENT RATE
Columbus Zip Codes
Income in Columbus
Income Overview in Columbus
Per Capita Income in Columbus is $35,640, while median incomes of families and households are $77,105 and $62,994 respectively.
| Characteristic | Number | Measure |
| Per Capita Income | 902,449 | $35,640 |
| Median Family Income | 199,675 | $77,105 |
| Mean Family Income | 199,675 | $95,014 |
| Median Household Income | 382,140 | $62,994 |
| Mean Household Income | 382,140 | $82,282 |
| Income Deficit | 199,675 | $11,507 |
| Wage / Income Gap (%) | 902,449 | 19.03% |
| Wage / Income Gap ($) | 902,449 | 80.97¢ per $1 |
| Gini / Inequality Index | 902,449 | 0.44 |
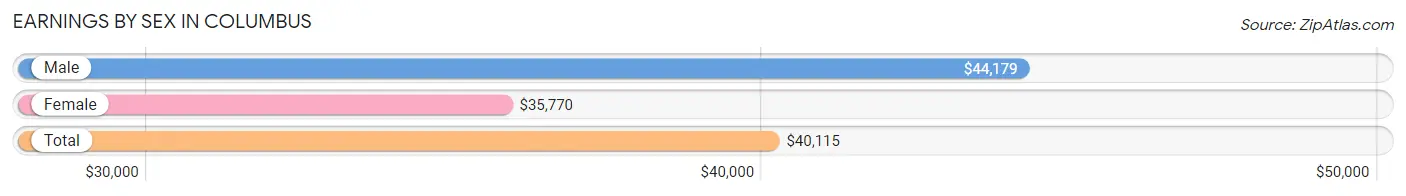
Earnings by Sex in Columbus
Average Earnings in Columbus are $40,115, $44,179 for men and $35,770 for women, a difference of 19.0%.
| Sex | Number | Average Earnings |
| Male | 276,542 (51.5%) | $44,179 |
| Female | 260,334 (48.5%) | $35,770 |
| Total | 536,876 (100.0%) | $40,115 |
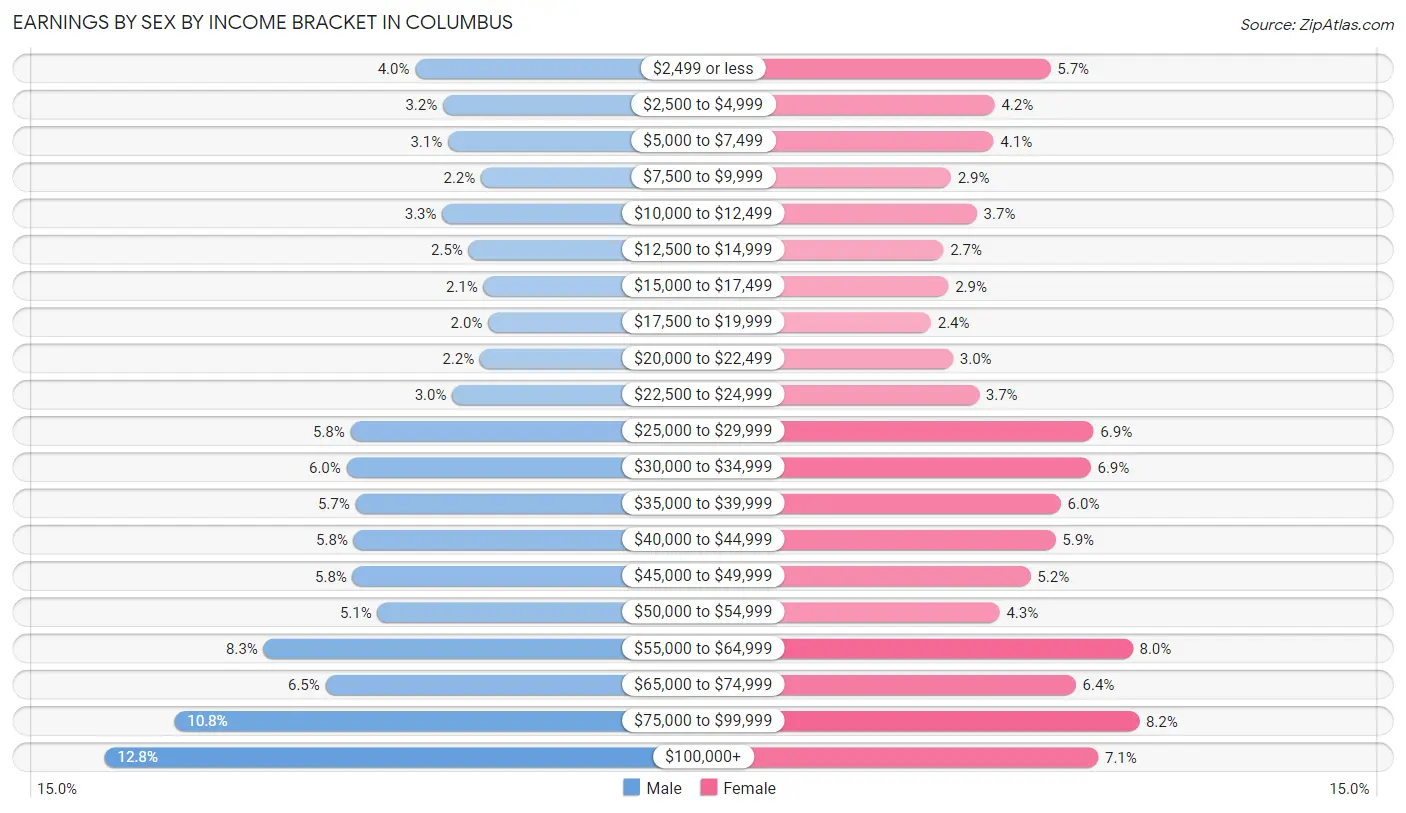
Earnings by Sex by Income Bracket in Columbus
The most common earnings brackets in Columbus are $100,000+ for men (35,249 | 12.8%) and $75,000 to $99,999 for women (21,376 | 8.2%).
| Income | Male | Female |
| $2,499 or less | 11,120 (4.0%) | 14,895 (5.7%) |
| $2,500 to $4,999 | 8,961 (3.2%) | 10,813 (4.2%) |
| $5,000 to $7,499 | 8,570 (3.1%) | 10,716 (4.1%) |
| $7,500 to $9,999 | 6,003 (2.2%) | 7,600 (2.9%) |
| $10,000 to $12,499 | 9,004 (3.3%) | 9,493 (3.6%) |
| $12,500 to $14,999 | 6,974 (2.5%) | 7,044 (2.7%) |
| $15,000 to $17,499 | 5,798 (2.1%) | 7,408 (2.9%) |
| $17,500 to $19,999 | 5,437 (2.0%) | 6,136 (2.4%) |
| $20,000 to $22,499 | 6,072 (2.2%) | 7,764 (3.0%) |
| $22,500 to $24,999 | 8,240 (3.0%) | 9,663 (3.7%) |
| $25,000 to $29,999 | 16,146 (5.8%) | 18,052 (6.9%) |
| $30,000 to $34,999 | 16,446 (5.9%) | 17,826 (6.9%) |
| $35,000 to $39,999 | 15,759 (5.7%) | 15,659 (6.0%) |
| $40,000 to $44,999 | 15,911 (5.8%) | 15,253 (5.9%) |
| $45,000 to $49,999 | 15,977 (5.8%) | 13,441 (5.2%) |
| $50,000 to $54,999 | 14,052 (5.1%) | 11,158 (4.3%) |
| $55,000 to $64,999 | 22,889 (8.3%) | 20,911 (8.0%) |
| $65,000 to $74,999 | 18,092 (6.5%) | 16,746 (6.4%) |
| $75,000 to $99,999 | 29,842 (10.8%) | 21,376 (8.2%) |
| $100,000+ | 35,249 (12.8%) | 18,380 (7.1%) |
| Total | 276,542 (100.0%) | 260,334 (100.0%) |
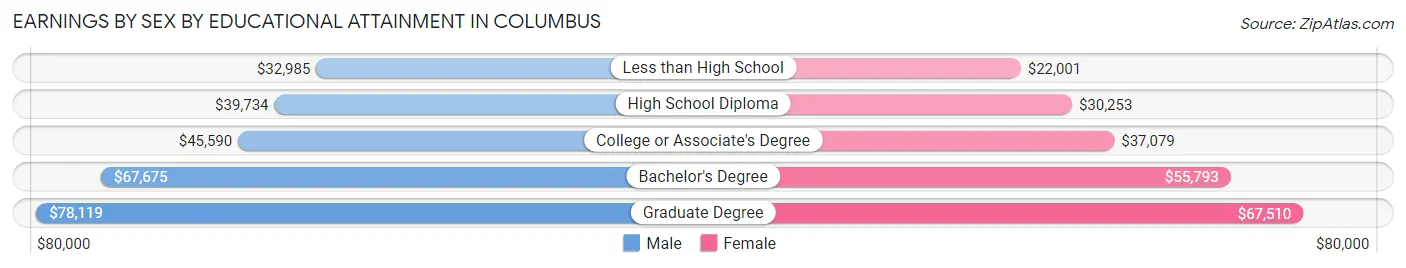
Earnings by Sex by Educational Attainment in Columbus
Average earnings in Columbus are $50,220 for men and $41,832 for women, a difference of 16.7%. Men with an educational attainment of graduate degree enjoy the highest average annual earnings of $78,119, while those with less than high school education earn the least with $32,985. Women with an educational attainment of graduate degree earn the most with the average annual earnings of $67,510, while those with less than high school education have the smallest earnings of $22,001.
| Educational Attainment | Male Income | Female Income |
| Less than High School | $32,985 | $22,001 |
| High School Diploma | $39,734 | $30,253 |
| College or Associate's Degree | $45,590 | $37,079 |
| Bachelor's Degree | $67,675 | $55,793 |
| Graduate Degree | $78,119 | $67,510 |
| Total | $50,220 | $41,832 |
Family Income in Columbus
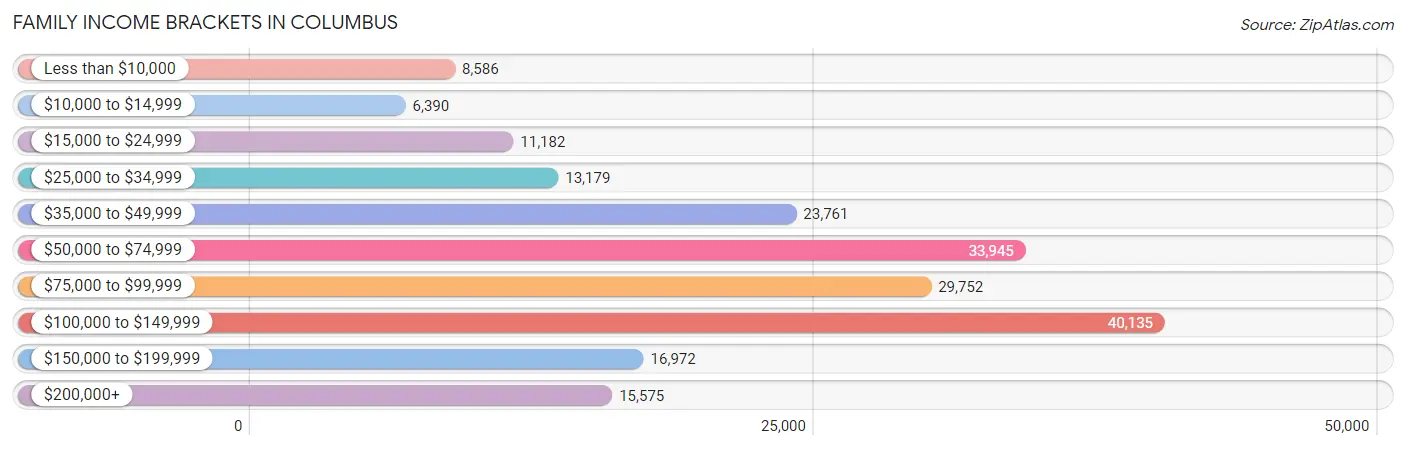
Family Income Brackets in Columbus
According to the Columbus family income data, there are 40,135 families falling into the $100,000 to $149,999 income range, which is the most common income bracket and makes up 20.1% of all families. Conversely, the $10,000 to $14,999 income bracket is the least frequent group with only 6,390 families (3.2%) belonging to this category.
| Income Bracket | # Families | % Families |
| Less than $10,000 | 8,586 | 4.3% |
| $10,000 to $14,999 | 6,390 | 3.2% |
| $15,000 to $24,999 | 11,182 | 5.6% |
| $25,000 to $34,999 | 13,179 | 6.6% |
| $35,000 to $49,999 | 23,761 | 11.9% |
| $50,000 to $74,999 | 33,945 | 17.0% |
| $75,000 to $99,999 | 29,752 | 14.9% |
| $100,000 to $149,999 | 40,135 | 20.1% |
| $150,000 to $199,999 | 16,972 | 8.5% |
| $200,000+ | 15,575 | 7.8% |
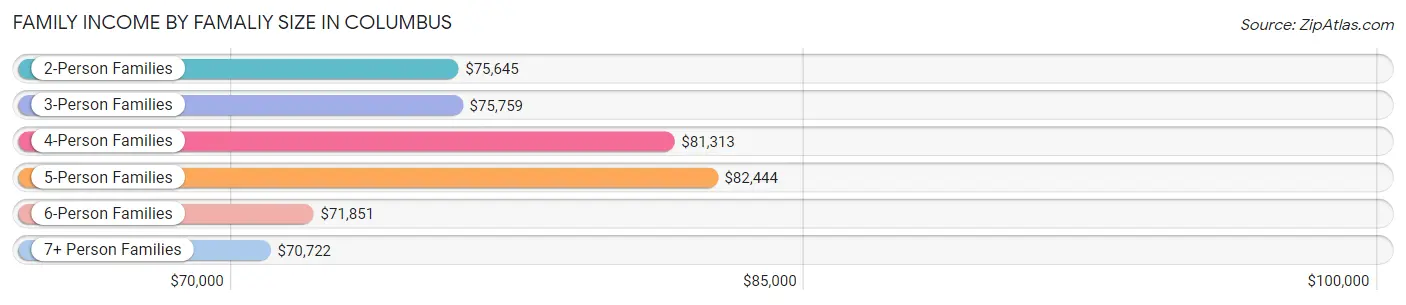
Family Income by Famaliy Size in Columbus
5-person families (14,695 | 7.4%) account for the highest median family income in Columbus with $82,444 per family, while 2-person families (97,296 | 48.7%) have the highest median income of $37,822 per family member.
| Income Bracket | # Families | Median Income |
| 2-Person Families | 97,296 (48.7%) | $75,645 |
| 3-Person Families | 43,898 (22.0%) | $75,759 |
| 4-Person Families | 34,003 (17.0%) | $81,313 |
| 5-Person Families | 14,695 (7.4%) | $82,444 |
| 6-Person Families | 5,733 (2.9%) | $71,851 |
| 7+ Person Families | 4,050 (2.0%) | $70,722 |
| Total | 199,675 (100.0%) | $77,105 |
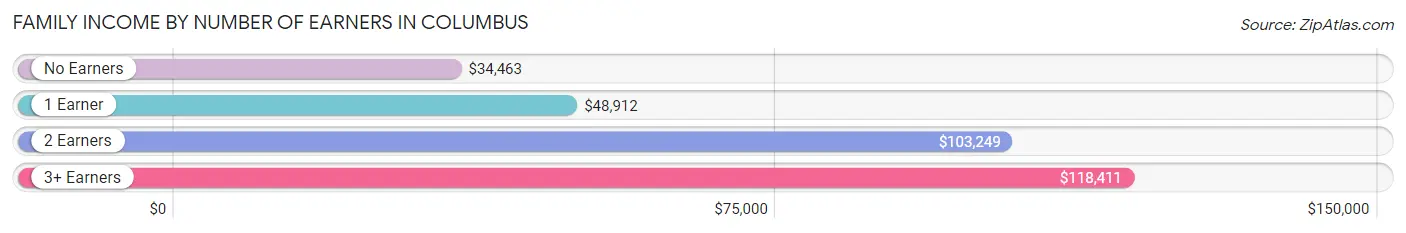
Family Income by Number of Earners in Columbus
The median family income in Columbus is $77,105, with families comprising 3+ earners (18,778) having the highest median family income of $118,411, while families with no earners (20,850) have the lowest median family income of $34,463, accounting for 9.4% and 10.4% of families, respectively.
| Number of Earners | # Families | Median Income |
| No Earners | 20,850 (10.4%) | $34,463 |
| 1 Earner | 71,249 (35.7%) | $48,912 |
| 2 Earners | 88,798 (44.5%) | $103,249 |
| 3+ Earners | 18,778 (9.4%) | $118,411 |
| Total | 199,675 (100.0%) | $77,105 |
Household Income in Columbus
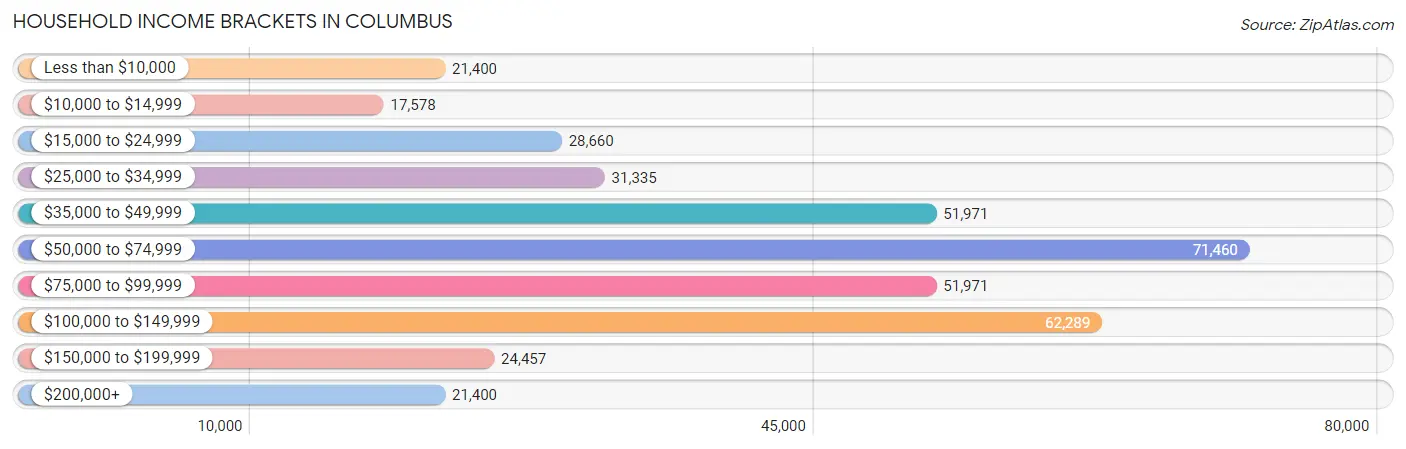
Household Income Brackets in Columbus
With 71,460 households falling in the category, the $50,000 to $74,999 income range is the most frequent in Columbus, accounting for 18.7% of all households. In contrast, only 17,578 households (4.6%) fall into the $10,000 to $14,999 income bracket, making it the least populous group.
| Income Bracket | # Households | % Households |
| Less than $10,000 | 21,400 | 5.6% |
| $10,000 to $14,999 | 17,578 | 4.6% |
| $15,000 to $24,999 | 28,660 | 7.5% |
| $25,000 to $34,999 | 31,335 | 8.2% |
| $35,000 to $49,999 | 51,971 | 13.6% |
| $50,000 to $74,999 | 71,460 | 18.7% |
| $75,000 to $99,999 | 51,971 | 13.6% |
| $100,000 to $149,999 | 62,289 | 16.3% |
| $150,000 to $199,999 | 24,457 | 6.4% |
| $200,000+ | 21,400 | 5.6% |
Household Income by Householder Age in Columbus
The median household income in Columbus is $62,994, with the highest median household income of $69,749 found in the 45 to 64 years age bracket for the primary householder. A total of 121,890 households (31.9%) fall into this category. Meanwhile, the 15 to 24 years age bracket for the primary householder has the lowest median household income of $37,086, with 26,381 households (6.9%) in this group.
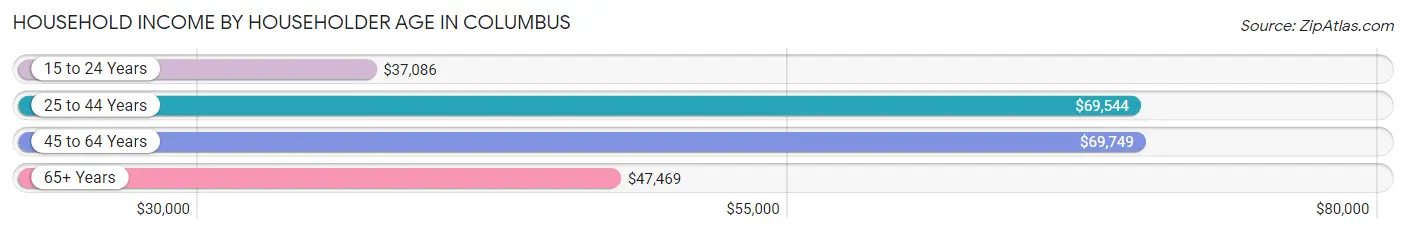
| Income Bracket | # Households | Median Income |
| 15 to 24 Years | 26,381 (6.9%) | $37,086 |
| 25 to 44 Years | 169,129 (44.3%) | $69,544 |
| 45 to 64 Years | 121,890 (31.9%) | $69,749 |
| 65+ Years | 64,740 (16.9%) | $47,469 |
| Total | 382,140 (100.0%) | $62,994 |
Poverty in Columbus
Income Below Poverty by Sex and Age in Columbus
With 17.2% poverty level for males and 19.0% for females among the residents of Columbus, 5 year old males and 18 to 24 year old females are the most vulnerable to poverty, with 1,860 males (32.4%) and 14,705 females (31.8%) in their respective age groups living below the poverty level.
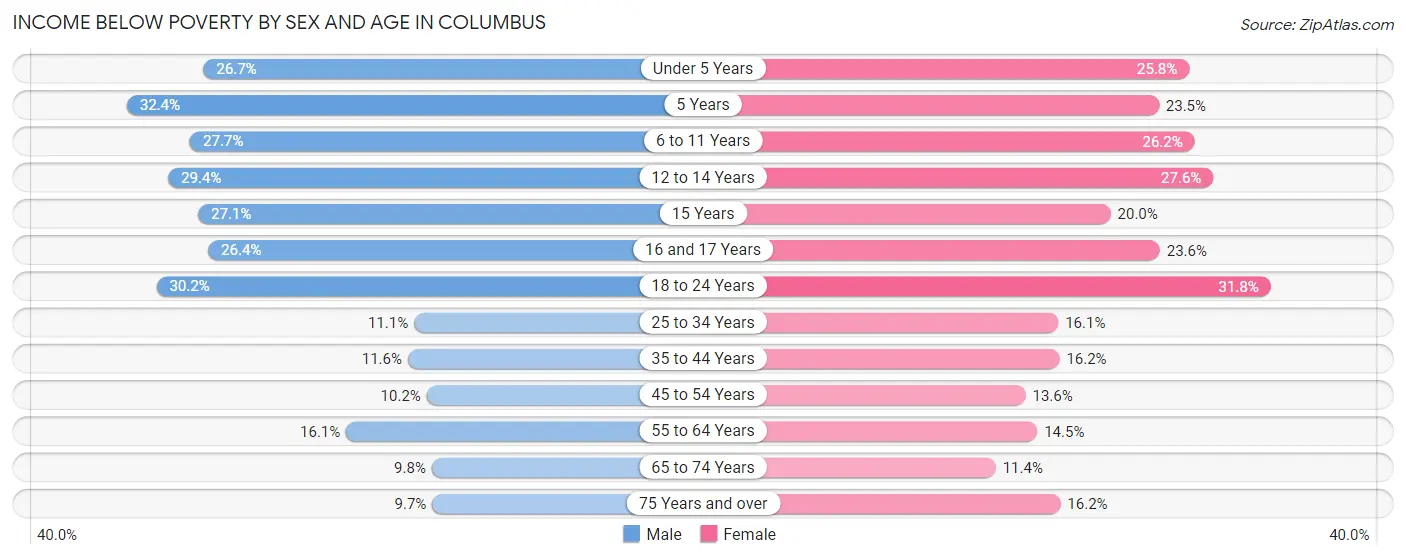
| Age Bracket | Male | Female |
| Under 5 Years | 8,173 (26.7%) | 7,687 (25.8%) |
| 5 Years | 1,860 (32.4%) | 1,135 (23.5%) |
| 6 to 11 Years | 8,967 (27.7%) | 8,600 (26.2%) |
| 12 to 14 Years | 4,669 (29.3%) | 3,932 (27.6%) |
| 15 Years | 1,255 (27.1%) | 1,016 (20.0%) |
| 16 and 17 Years | 2,531 (26.4%) | 2,281 (23.6%) |
| 18 to 24 Years | 13,461 (30.2%) | 14,705 (31.8%) |
| 25 to 34 Years | 10,213 (11.1%) | 14,780 (16.1%) |
| 35 to 44 Years | 7,234 (11.6%) | 9,590 (16.2%) |
| 45 to 54 Years | 4,909 (10.2%) | 6,841 (13.6%) |
| 55 to 64 Years | 7,517 (16.1%) | 6,998 (14.5%) |
| 65 to 74 Years | 2,632 (9.8%) | 3,754 (11.4%) |
| 75 Years and over | 1,262 (9.7%) | 3,539 (16.2%) |
| Total | 74,683 (17.2%) | 84,858 (19.0%) |
Income Above Poverty by Sex and Age in Columbus
According to the poverty statistics in Columbus, males aged 75 years and over and females aged 65 to 74 years are the age groups that are most secure financially, with 90.3% of males and 88.6% of females in these age groups living above the poverty line.
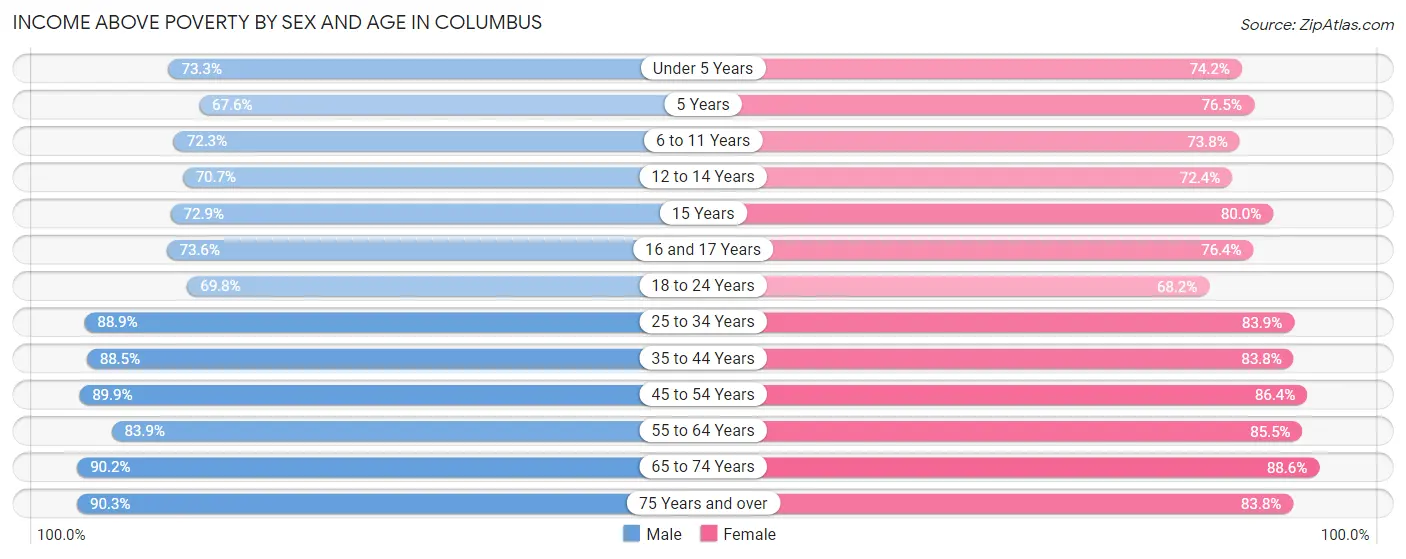
| Age Bracket | Male | Female |
| Under 5 Years | 22,415 (73.3%) | 22,130 (74.2%) |
| 5 Years | 3,879 (67.6%) | 3,687 (76.5%) |
| 6 to 11 Years | 23,397 (72.3%) | 24,243 (73.8%) |
| 12 to 14 Years | 11,237 (70.7%) | 10,329 (72.4%) |
| 15 Years | 3,372 (72.9%) | 4,073 (80.0%) |
| 16 and 17 Years | 7,068 (73.6%) | 7,382 (76.4%) |
| 18 to 24 Years | 31,100 (69.8%) | 31,482 (68.2%) |
| 25 to 34 Years | 81,886 (88.9%) | 77,170 (83.9%) |
| 35 to 44 Years | 55,380 (88.4%) | 49,757 (83.8%) |
| 45 to 54 Years | 43,476 (89.8%) | 43,315 (86.4%) |
| 55 to 64 Years | 39,093 (83.9%) | 41,217 (85.5%) |
| 65 to 74 Years | 24,301 (90.2%) | 29,090 (88.6%) |
| 75 Years and over | 11,698 (90.3%) | 18,261 (83.8%) |
| Total | 358,302 (82.8%) | 362,136 (81.0%) |
Income Below Poverty Among Married-Couple Families in Columbus
The poverty statistics for married-couple families in Columbus show that 5.5% or 6,689 of the total 122,080 families live below the poverty line. Families with 5 or more children have the highest poverty rate of 31.2%, comprising of 439 families. On the other hand, families with no children have the lowest poverty rate of 3.1%, which includes 2,136 families.
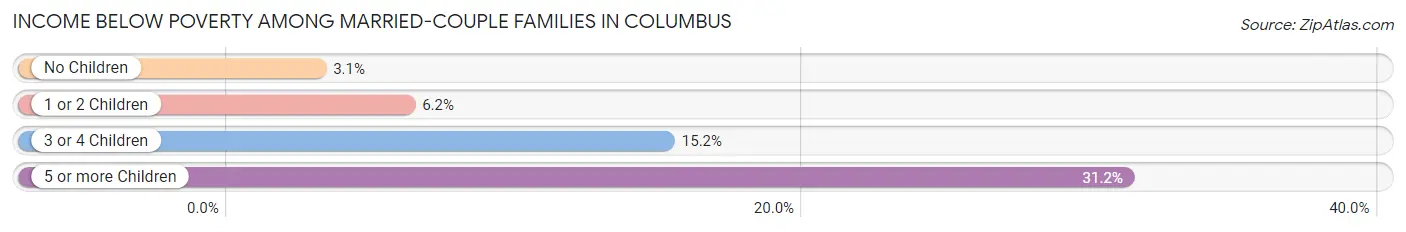
| Children | Above Poverty | Below Poverty |
| No Children | 67,350 (96.9%) | 2,136 (3.1%) |
| 1 or 2 Children | 38,101 (93.8%) | 2,505 (6.2%) |
| 3 or 4 Children | 8,973 (84.8%) | 1,609 (15.2%) |
| 5 or more Children | 967 (68.8%) | 439 (31.2%) |
| Total | 115,391 (94.5%) | 6,689 (5.5%) |
Income Below Poverty Among Single-Parent Households in Columbus
According to the poverty data in Columbus, 14.6% or 2,934 single-father households and 30.8% or 17,691 single-mother households are living below the poverty line. Among single-father households, those with 5 or more children have the highest poverty rate, with 155 households (71.1%) experiencing poverty. Likewise, among single-mother households, those with 5 or more children have the highest poverty rate, with 893 households (87.3%) falling below the poverty line.
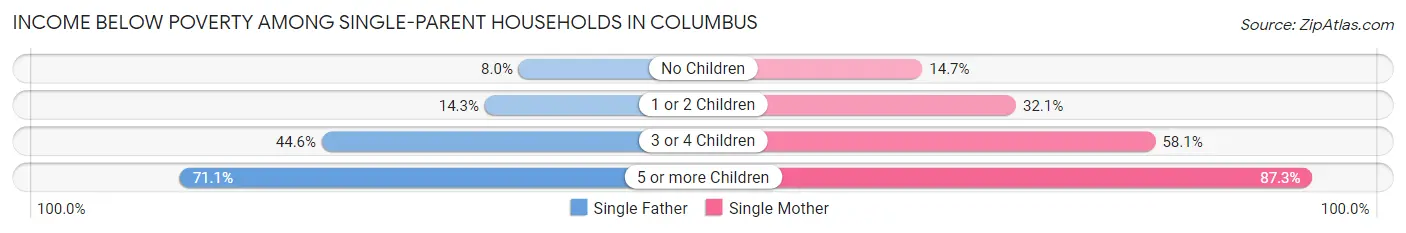
| Children | Single Father | Single Mother |
| No Children | 655 (8.0%) | 2,731 (14.7%) |
| 1 or 2 Children | 1,443 (14.3%) | 9,794 (32.1%) |
| 3 or 4 Children | 681 (44.6%) | 4,273 (58.1%) |
| 5 or more Children | 155 (71.1%) | 893 (87.3%) |
| Total | 2,934 (14.6%) | 17,691 (30.8%) |
Income Below Poverty Among Married-Couple vs Single-Parent Households in Columbus
The poverty data for Columbus shows that 6,689 of the married-couple family households (5.5%) and 20,625 of the single-parent households (26.6%) are living below the poverty level. Within the married-couple family households, those with 5 or more children have the highest poverty rate, with 439 households (31.2%) falling below the poverty line. Among the single-parent households, those with 5 or more children have the highest poverty rate, with 1,048 household (84.5%) living below poverty.
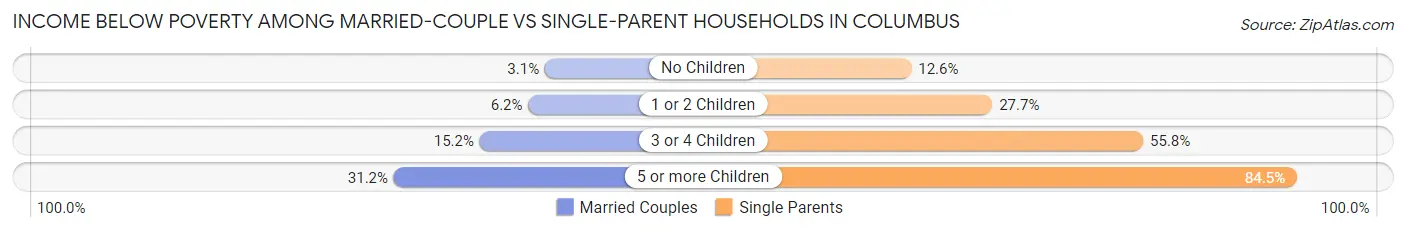
| Children | Married-Couple Families | Single-Parent Households |
| No Children | 2,136 (3.1%) | 3,386 (12.6%) |
| 1 or 2 Children | 2,505 (6.2%) | 11,237 (27.7%) |
| 3 or 4 Children | 1,609 (15.2%) | 4,954 (55.8%) |
| 5 or more Children | 439 (31.2%) | 1,048 (84.5%) |
| Total | 6,689 (5.5%) | 20,625 (26.6%) |
Race in Columbus
The most populous races in Columbus are White / Caucasian (495,311 | 54.9%), Black / African American (263,000 | 29.1%), and Two or more Races (63,928 | 7.1%).
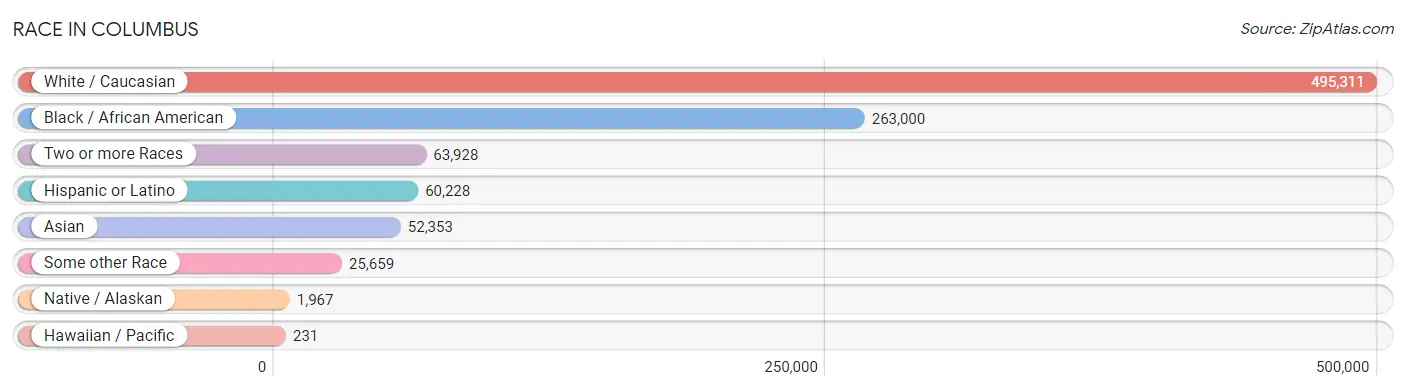
| Race | # Population | % Population |
| Asian | 52,353 | 5.8% |
| Black / African American | 263,000 | 29.1% |
| Hawaiian / Pacific | 231 | 0.0% |
| Hispanic or Latino | 60,228 | 6.7% |
| Native / Alaskan | 1,967 | 0.2% |
| White / Caucasian | 495,311 | 54.9% |
| Two or more Races | 63,928 | 7.1% |
| Some other Race | 25,659 | 2.8% |
| Total | 902,449 | 100.0% |
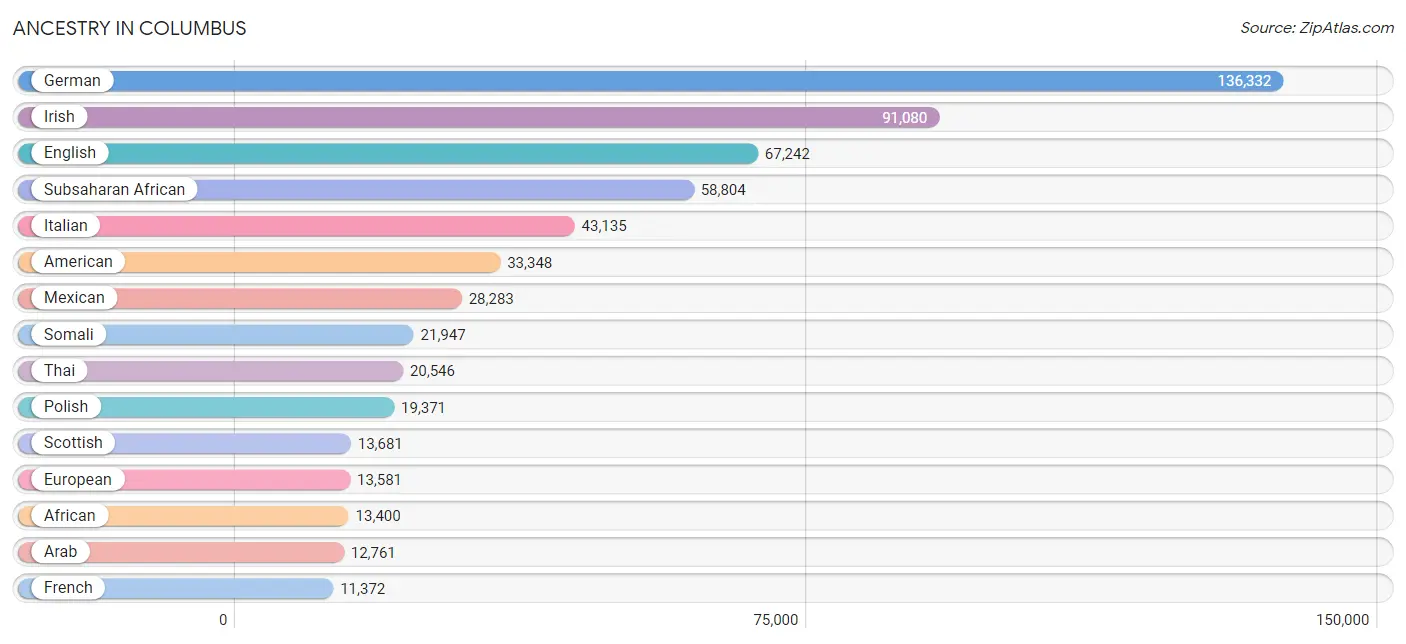
Ancestry in Columbus
The most populous ancestries reported in Columbus are German (136,332 | 15.1%), Irish (91,080 | 10.1%), English (67,242 | 7.4%), Subsaharan African (58,804 | 6.5%), and Italian (43,135 | 4.8%), together accounting for 44.0% of all Columbus residents.
| Ancestry | # Population | % Population |
| Afghan | 340 | 0.0% |
| African | 13,400 | 1.5% |
| Alaska Native | 13 | 0.0% |
| Albanian | 88 | 0.0% |
| Aleut | 20 | 0.0% |
| Alsatian | 118 | 0.0% |
| American | 33,348 | 3.7% |
| Apache | 115 | 0.0% |
| Arab | 12,761 | 1.4% |
| Argentinean | 497 | 0.1% |
| Armenian | 363 | 0.0% |
| Australian | 186 | 0.0% |
| Austrian | 1,331 | 0.2% |
| Bahamian | 50 | 0.0% |
| Bangladeshi | 60 | 0.0% |
| Barbadian | 133 | 0.0% |
| Basque | 23 | 0.0% |
| Belgian | 646 | 0.1% |
| Belizean | 59 | 0.0% |
| Bermudan | 21 | 0.0% |
| Bhutanese | 3,542 | 0.4% |
| Blackfeet | 2,004 | 0.2% |
| Bolivian | 101 | 0.0% |
| Brazilian | 1,011 | 0.1% |
| British | 5,193 | 0.6% |
| British West Indian | 27 | 0.0% |
| Bulgarian | 279 | 0.0% |
| Burmese | 4,280 | 0.5% |
| Cajun | 23 | 0.0% |
| Cambodian | 39 | 0.0% |
| Canadian | 914 | 0.1% |
| Cape Verdean | 73 | 0.0% |
| Carpatho Rusyn | 19 | 0.0% |
| Celtic | 114 | 0.0% |
| Central American | 9,557 | 1.1% |
| Central American Indian | 676 | 0.1% |
| Cherokee | 3,430 | 0.4% |
| Cheyenne | 1 | 0.0% |
| Chilean | 120 | 0.0% |
| Chippewa | 113 | 0.0% |
| Choctaw | 31 | 0.0% |
| Colombian | 1,207 | 0.1% |
| Comanche | 4 | 0.0% |
| Costa Rican | 204 | 0.0% |
| Cree | 30 | 0.0% |
| Creek | 34 | 0.0% |
| Croatian | 1,241 | 0.1% |
| Crow | 32 | 0.0% |
| Cuban | 664 | 0.1% |
| Czech | 2,154 | 0.2% |
| Czechoslovakian | 898 | 0.1% |
| Danish | 1,101 | 0.1% |
| Dominican | 3,671 | 0.4% |
| Dutch | 6,440 | 0.7% |
| Dutch West Indian | 19 | 0.0% |
| Eastern European | 2,550 | 0.3% |
| Ecuadorian | 478 | 0.1% |
| Egyptian | 1,781 | 0.2% |
| English | 67,242 | 7.4% |
| Estonian | 31 | 0.0% |
| Ethiopian | 4,634 | 0.5% |
| European | 13,581 | 1.5% |
| Filipino | 478 | 0.1% |
| Finnish | 732 | 0.1% |
| French | 11,372 | 1.3% |
| French American Indian | 96 | 0.0% |
| French Canadian | 1,551 | 0.2% |
| German | 136,332 | 15.1% |
| German Russian | 135 | 0.0% |
| Ghanaian | 5,694 | 0.6% |
| Greek | 3,212 | 0.4% |
| Guamanian / Chamorro | 10 | 0.0% |
| Guatemalan | 1,263 | 0.1% |
| Guyanese | 49 | 0.0% |
| Haitian | 2,087 | 0.2% |
| Honduran | 2,110 | 0.2% |
| Hopi | 4 | 0.0% |
| Hungarian | 6,063 | 0.7% |
| Icelander | 47 | 0.0% |
| Indian (Asian) | 11,368 | 1.3% |
| Indonesian | 180 | 0.0% |
| Inupiat | 8 | 0.0% |
| Iranian | 689 | 0.1% |
| Iraqi | 1,111 | 0.1% |
| Irish | 91,080 | 10.1% |
| Iroquois | 171 | 0.0% |
| Israeli | 457 | 0.1% |
| Italian | 43,135 | 4.8% |
| Jamaican | 1,312 | 0.2% |
| Japanese | 1,847 | 0.2% |
| Jordanian | 1,153 | 0.1% |
| Kenyan | 1,050 | 0.1% |
| Kiowa | 1 | 0.0% |
| Korean | 4,767 | 0.5% |
| Laotian | 175 | 0.0% |
| Latvian | 142 | 0.0% |
| Lebanese | 1,420 | 0.2% |
| Liberian | 2,000 | 0.2% |
| Lithuanian | 1,513 | 0.2% |
| Lumbee | 132 | 0.0% |
| Luxembourger | 8 | 0.0% |
| Macedonian | 652 | 0.1% |
| Malaysian | 1,673 | 0.2% |
| Maltese | 68 | 0.0% |
| Mexican | 28,283 | 3.1% |
| Mexican American Indian | 819 | 0.1% |
| Mongolian | 176 | 0.0% |
| Moroccan | 1,409 | 0.2% |
| Native Hawaiian | 420 | 0.1% |
| Navajo | 170 | 0.0% |
| New Zealander | 109 | 0.0% |
| Nicaraguan | 52 | 0.0% |
| Nigerian | 3,090 | 0.3% |
| Northern European | 590 | 0.1% |
| Norwegian | 3,375 | 0.4% |
| Okinawan | 16 | 0.0% |
| Ottawa | 16 | 0.0% |
| Pakistani | 651 | 0.1% |
| Palestinian | 1,211 | 0.1% |
| Panamanian | 668 | 0.1% |
| Paraguayan | 32 | 0.0% |
| Pennsylvania German | 399 | 0.0% |
| Peruvian | 488 | 0.1% |
| Polish | 19,371 | 2.1% |
| Portuguese | 516 | 0.1% |
| Potawatomi | 29 | 0.0% |
| Puerto Rican | 8,797 | 1.0% |
| Romanian | 1,037 | 0.1% |
| Russian | 4,161 | 0.5% |
| Salvadoran | 5,260 | 0.6% |
| Samoan | 130 | 0.0% |
| Scandinavian | 2,218 | 0.3% |
| Scotch-Irish | 6,803 | 0.7% |
| Scottish | 13,681 | 1.5% |
| Seminole | 128 | 0.0% |
| Senegalese | 425 | 0.1% |
| Serbian | 719 | 0.1% |
| Sierra Leonean | 1,538 | 0.2% |
| Sioux | 234 | 0.0% |
| Slavic | 387 | 0.0% |
| Slovak | 3,172 | 0.4% |
| Slovene | 1,385 | 0.2% |
| Somali | 21,947 | 2.4% |
| South African | 129 | 0.0% |
| South American | 4,640 | 0.5% |
| South American Indian | 35 | 0.0% |
| Spaniard | 624 | 0.1% |
| Spanish | 528 | 0.1% |
| Spanish American | 31 | 0.0% |
| Sri Lankan | 4,303 | 0.5% |
| Subsaharan African | 58,804 | 6.5% |
| Sudanese | 379 | 0.0% |
| Swedish | 3,846 | 0.4% |
| Swiss | 2,604 | 0.3% |
| Syrian | 577 | 0.1% |
| Taiwanese | 13 | 0.0% |
| Thai | 20,546 | 2.3% |
| Tlingit-Haida | 27 | 0.0% |
| Tongan | 148 | 0.0% |
| Trinidadian and Tobagonian | 297 | 0.0% |
| Turkish | 861 | 0.1% |
| U.S. Virgin Islander | 57 | 0.0% |
| Ugandan | 52 | 0.0% |
| Ukrainian | 2,917 | 0.3% |
| Uruguayan | 25 | 0.0% |
| Venezuelan | 1,692 | 0.2% |
| Vietnamese | 651 | 0.1% |
| Welsh | 9,527 | 1.1% |
| West Indian | 801 | 0.1% |
| Yaqui | 27 | 0.0% |
| Yugoslavian | 485 | 0.1% |
| Zimbabwean | 5 | 0.0% | View All 172 Rows |
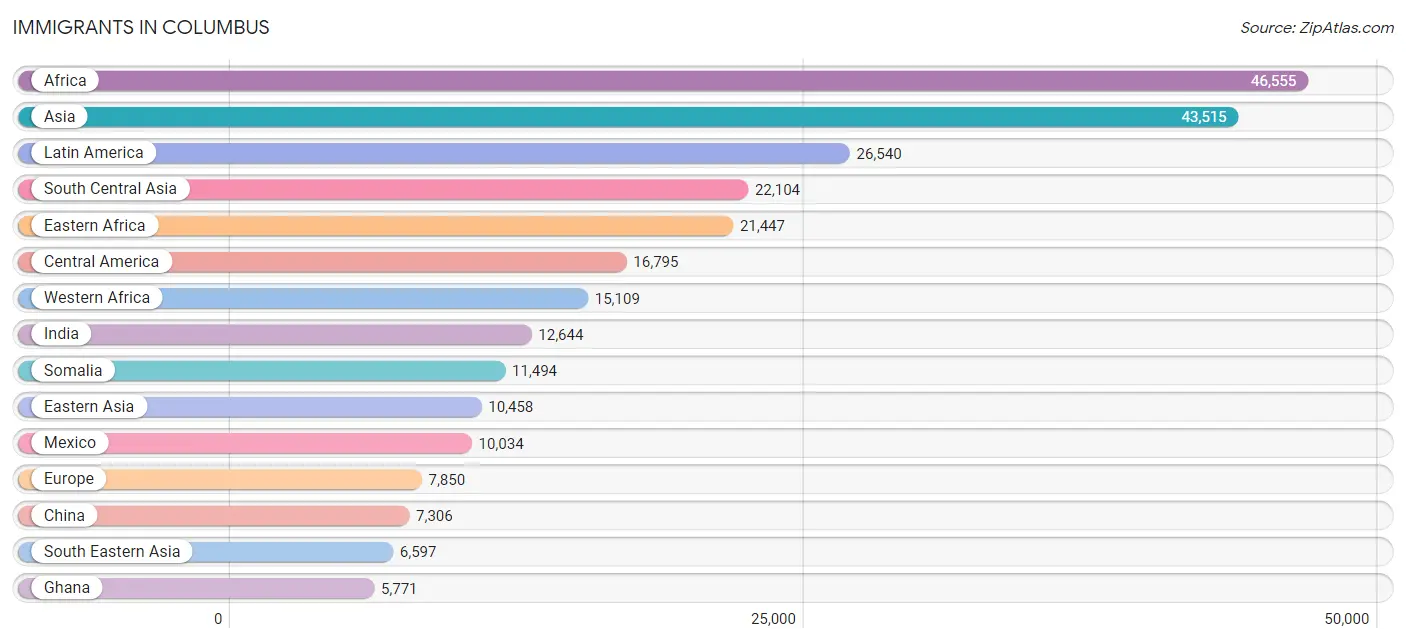
Immigrants in Columbus
The most numerous immigrant groups reported in Columbus came from Africa (46,555 | 5.2%), Asia (43,515 | 4.8%), Latin America (26,540 | 2.9%), South Central Asia (22,104 | 2.5%), and Eastern Africa (21,447 | 2.4%), together accounting for 17.7% of all Columbus residents.
| Immigration Origin | # Population | % Population |
| Afghanistan | 314 | 0.0% |
| Africa | 46,555 | 5.2% |
| Albania | 113 | 0.0% |
| Argentina | 109 | 0.0% |
| Armenia | 35 | 0.0% |
| Asia | 43,515 | 4.8% |
| Australia | 186 | 0.0% |
| Austria | 45 | 0.0% |
| Bahamas | 50 | 0.0% |
| Bangladesh | 532 | 0.1% |
| Barbados | 129 | 0.0% |
| Belarus | 136 | 0.0% |
| Belgium | 35 | 0.0% |
| Belize | 69 | 0.0% |
| Bolivia | 5 | 0.0% |
| Bosnia and Herzegovina | 102 | 0.0% |
| Brazil | 1,076 | 0.1% |
| Bulgaria | 179 | 0.0% |
| Cambodia | 817 | 0.1% |
| Cameroon | 1,207 | 0.1% |
| Canada | 1,311 | 0.2% |
| Caribbean | 5,544 | 0.6% |
| Central America | 16,795 | 1.9% |
| Chile | 64 | 0.0% |
| China | 7,306 | 0.8% |
| Colombia | 777 | 0.1% |
| Congo | 219 | 0.0% |
| Costa Rica | 102 | 0.0% |
| Croatia | 38 | 0.0% |
| Cuba | 142 | 0.0% |
| Czechoslovakia | 120 | 0.0% |
| Denmark | 7 | 0.0% |
| Dominican Republic | 2,584 | 0.3% |
| Eastern Africa | 21,447 | 2.4% |
| Eastern Asia | 10,458 | 1.2% |
| Eastern Europe | 4,167 | 0.5% |
| Ecuador | 544 | 0.1% |
| Egypt | 1,062 | 0.1% |
| El Salvador | 3,404 | 0.4% |
| England | 537 | 0.1% |
| Eritrea | 1,270 | 0.1% |
| Ethiopia | 3,694 | 0.4% |
| Europe | 7,850 | 0.9% |
| France | 374 | 0.0% |
| Germany | 852 | 0.1% |
| Ghana | 5,771 | 0.6% |
| Greece | 245 | 0.0% |
| Guatemala | 1,001 | 0.1% |
| Guyana | 152 | 0.0% |
| Haiti | 1,581 | 0.2% |
| Honduras | 1,763 | 0.2% |
| Hong Kong | 328 | 0.0% |
| Hungary | 97 | 0.0% |
| India | 12,644 | 1.4% |
| Indonesia | 141 | 0.0% |
| Iran | 471 | 0.1% |
| Iraq | 977 | 0.1% |
| Ireland | 167 | 0.0% |
| Israel | 303 | 0.0% |
| Italy | 314 | 0.0% |
| Jamaica | 606 | 0.1% |
| Japan | 1,261 | 0.1% |
| Jordan | 812 | 0.1% |
| Kazakhstan | 47 | 0.0% |
| Kenya | 3,232 | 0.4% |
| Korea | 1,865 | 0.2% |
| Kuwait | 118 | 0.0% |
| Laos | 1,102 | 0.1% |
| Latin America | 26,540 | 2.9% |
| Latvia | 12 | 0.0% |
| Lebanon | 281 | 0.0% |
| Liberia | 1,635 | 0.2% |
| Lithuania | 91 | 0.0% |
| Malaysia | 239 | 0.0% |
| Mexico | 10,034 | 1.1% |
| Middle Africa | 2,254 | 0.3% |
| Moldova | 4 | 0.0% |
| Morocco | 1,136 | 0.1% |
| Nepal | 2,662 | 0.3% |
| Netherlands | 240 | 0.0% |
| Nicaragua | 15 | 0.0% |
| Nigeria | 1,642 | 0.2% |
| North Macedonia | 438 | 0.1% |
| Northern Africa | 4,243 | 0.5% |
| Northern Europe | 1,329 | 0.2% |
| Norway | 16 | 0.0% |
| Oceania | 423 | 0.1% |
| Pakistan | 864 | 0.1% |
| Panama | 308 | 0.0% |
| Peru | 185 | 0.0% |
| Philippines | 2,064 | 0.2% |
| Poland | 374 | 0.0% |
| Portugal | 8 | 0.0% |
| Romania | 283 | 0.0% |
| Russia | 829 | 0.1% |
| Saudi Arabia | 493 | 0.1% |
| Scotland | 81 | 0.0% |
| Senegal | 954 | 0.1% |
| Serbia | 61 | 0.0% |
| Sierra Leone | 2,093 | 0.2% |
| Singapore | 27 | 0.0% |
| Somalia | 11,494 | 1.3% |
| South Africa | 512 | 0.1% |
| South America | 4,201 | 0.5% |
| South Central Asia | 22,104 | 2.5% |
| South Eastern Asia | 6,597 | 0.7% |
| Southern Europe | 744 | 0.1% |
| Spain | 140 | 0.0% |
| Sri Lanka | 108 | 0.0% |
| Sudan | 558 | 0.1% |
| Switzerland | 64 | 0.0% |
| Syria | 544 | 0.1% |
| Taiwan | 562 | 0.1% |
| Thailand | 351 | 0.0% |
| Trinidad and Tobago | 388 | 0.0% |
| Turkey | 420 | 0.1% |
| Uganda | 141 | 0.0% |
| Ukraine | 1,147 | 0.1% |
| Uruguay | 25 | 0.0% |
| Uzbekistan | 259 | 0.0% |
| Venezuela | 1,264 | 0.1% |
| Vietnam | 1,706 | 0.2% |
| Western Africa | 15,109 | 1.7% |
| Western Asia | 4,200 | 0.5% |
| Western Europe | 1,610 | 0.2% |
| Yemen | 42 | 0.0% |
| Zaire | 776 | 0.1% |
| Zimbabwe | 228 | 0.0% | View All 128 Rows |
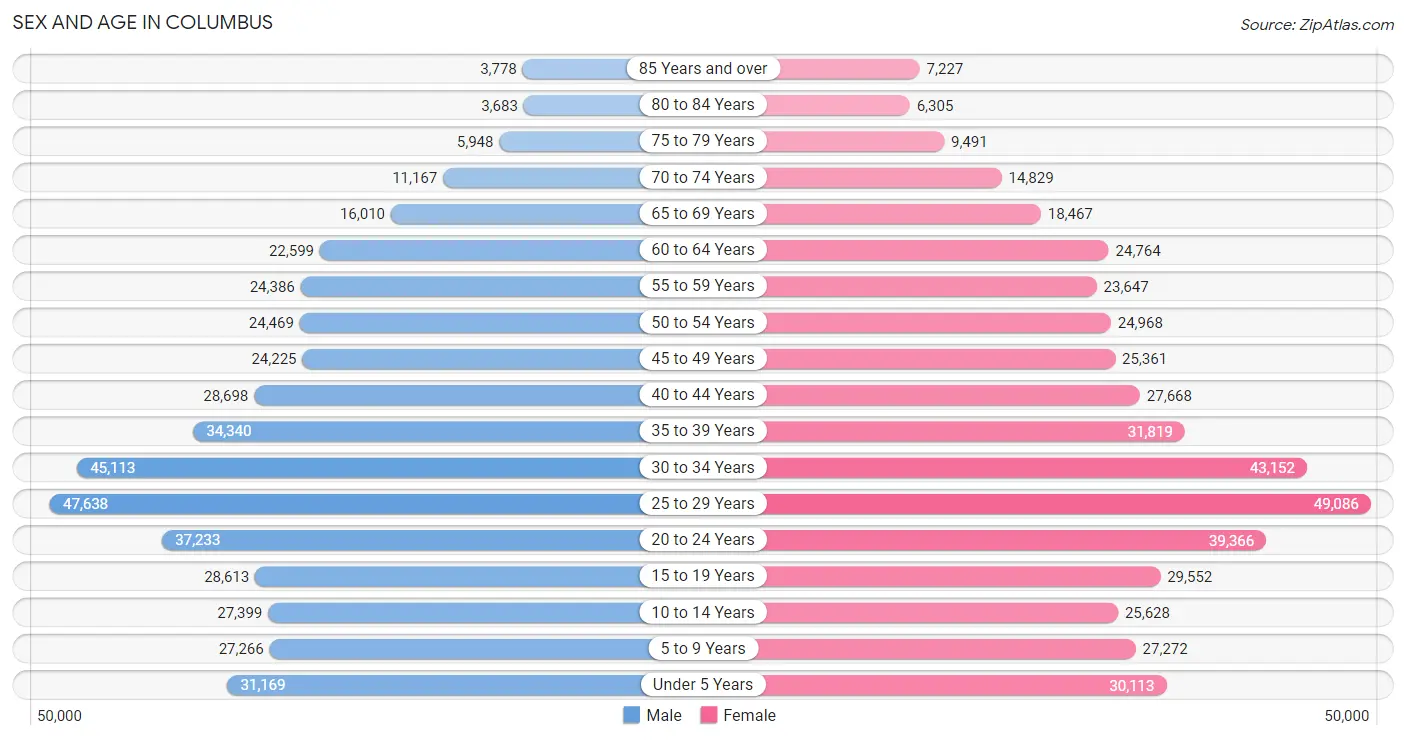
Sex and Age in Columbus
Sex and Age in Columbus
The most populous age groups in Columbus are 25 to 29 Years (47,638 | 10.7%) for men and 25 to 29 Years (49,086 | 10.7%) for women.
| Age Bracket | Male | Female |
| Under 5 Years | 31,169 (7.0%) | 30,113 (6.6%) |
| 5 to 9 Years | 27,266 (6.1%) | 27,272 (5.9%) |
| 10 to 14 Years | 27,399 (6.2%) | 25,628 (5.6%) |
| 15 to 19 Years | 28,613 (6.5%) | 29,552 (6.4%) |
| 20 to 24 Years | 37,233 (8.4%) | 39,366 (8.6%) |
| 25 to 29 Years | 47,638 (10.7%) | 49,086 (10.7%) |
| 30 to 34 Years | 45,113 (10.2%) | 43,152 (9.4%) |
| 35 to 39 Years | 34,340 (7.7%) | 31,819 (6.9%) |
| 40 to 44 Years | 28,698 (6.5%) | 27,668 (6.0%) |
| 45 to 49 Years | 24,225 (5.5%) | 25,361 (5.5%) |
| 50 to 54 Years | 24,469 (5.5%) | 24,968 (5.4%) |
| 55 to 59 Years | 24,386 (5.5%) | 23,647 (5.2%) |
| 60 to 64 Years | 22,599 (5.1%) | 24,764 (5.4%) |
| 65 to 69 Years | 16,010 (3.6%) | 18,467 (4.0%) |
| 70 to 74 Years | 11,167 (2.5%) | 14,829 (3.2%) |
| 75 to 79 Years | 5,948 (1.3%) | 9,491 (2.1%) |
| 80 to 84 Years | 3,683 (0.8%) | 6,305 (1.4%) |
| 85 Years and over | 3,778 (0.9%) | 7,227 (1.6%) |
| Total | 443,734 (100.0%) | 458,715 (100.0%) |
Families and Households in Columbus
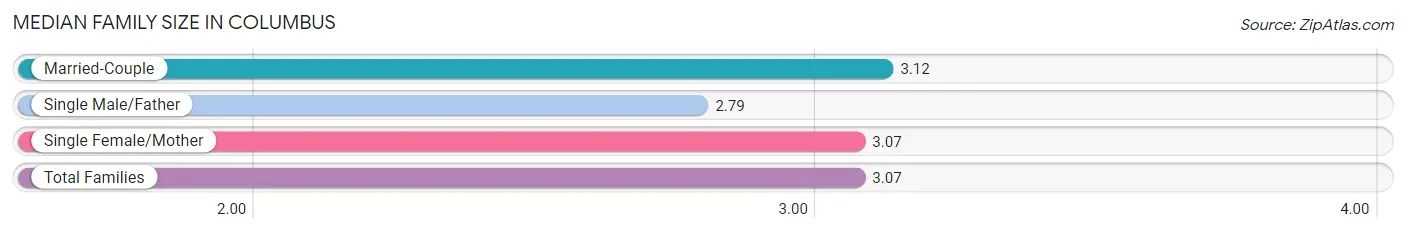
Median Family Size in Columbus
The median family size in Columbus is 3.07 persons per family, with married-couple families (122,080 | 61.1%) accounting for the largest median family size of 3.12 persons per family. On the other hand, single male/father families (20,078 | 10.1%) represent the smallest median family size with 2.79 persons per family.
| Family Type | # Families | Family Size |
| Married-Couple | 122,080 (61.1%) | 3.12 |
| Single Male/Father | 20,078 (10.1%) | 2.79 |
| Single Female/Mother | 57,517 (28.8%) | 3.07 |
| Total Families | 199,675 (100.0%) | 3.07 |
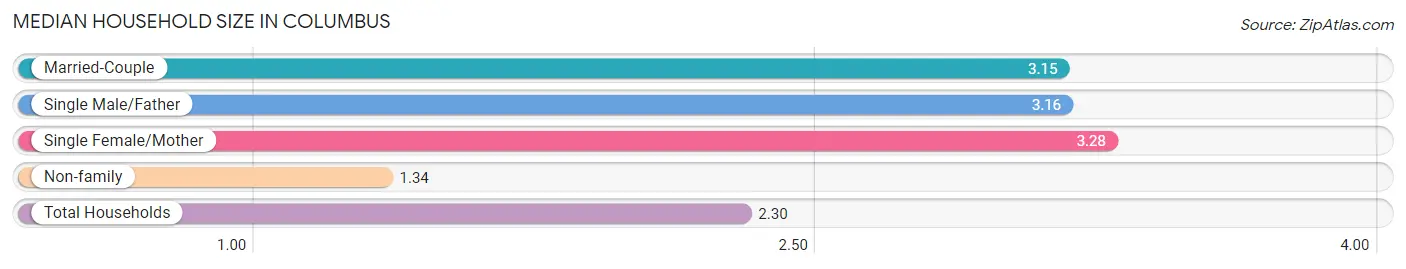
Median Household Size in Columbus
The median household size in Columbus is 2.30 persons per household, with single female/mother households (57,517 | 15.0%) accounting for the largest median household size of 3.28 persons per household. non-family households (182,465 | 47.7%) represent the smallest median household size with 1.34 persons per household.
| Household Type | # Households | Household Size |
| Married-Couple | 122,080 (32.0%) | 3.15 |
| Single Male/Father | 20,078 (5.2%) | 3.16 |
| Single Female/Mother | 57,517 (15.0%) | 3.28 |
| Non-family | 182,465 (47.7%) | 1.34 |
| Total Households | 382,140 (100.0%) | 2.30 |
Household Size by Marriage Status in Columbus
Out of a total of 382,140 households in Columbus, 199,675 (52.2%) are family households, while 182,465 (47.7%) are nonfamily households. The most numerous type of family households are 2-person households, comprising 88,365, and the most common type of nonfamily households are 1-person households, comprising 138,163.
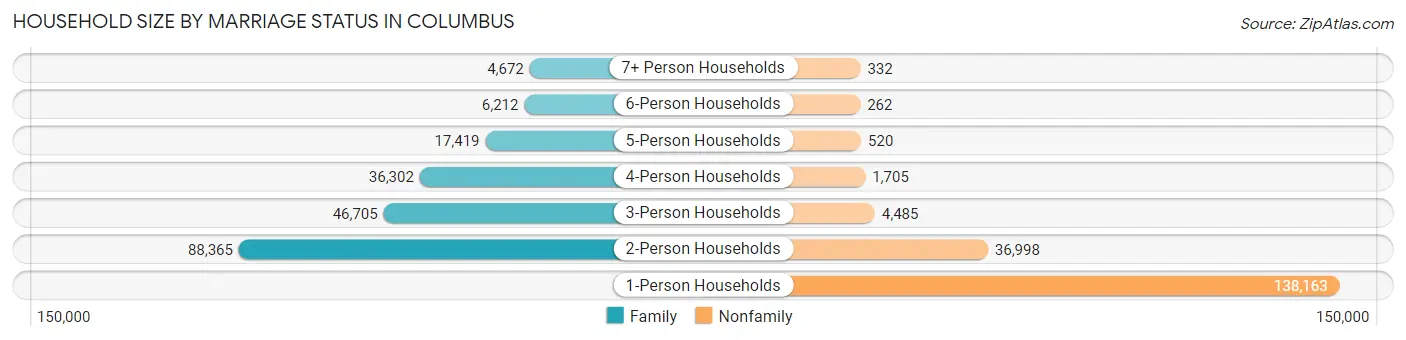
| Household Size | Family Households | Nonfamily Households |
| 1-Person Households | - | 138,163 (36.2%) |
| 2-Person Households | 88,365 (23.1%) | 36,998 (9.7%) |
| 3-Person Households | 46,705 (12.2%) | 4,485 (1.2%) |
| 4-Person Households | 36,302 (9.5%) | 1,705 (0.4%) |
| 5-Person Households | 17,419 (4.6%) | 520 (0.1%) |
| 6-Person Households | 6,212 (1.6%) | 262 (0.1%) |
| 7+ Person Households | 4,672 (1.2%) | 332 (0.1%) |
| Total | 199,675 (52.2%) | 182,465 (47.7%) |
Female Fertility in Columbus
Fertility by Age in Columbus
Average fertility rate in Columbus is 58.0 births per 1,000 women. Women in the age bracket of 20 to 34 years have the highest fertility rate with 81.0 births per 1,000 women. Women in the age bracket of 20 to 34 years acount for 73.1% of all women with births.
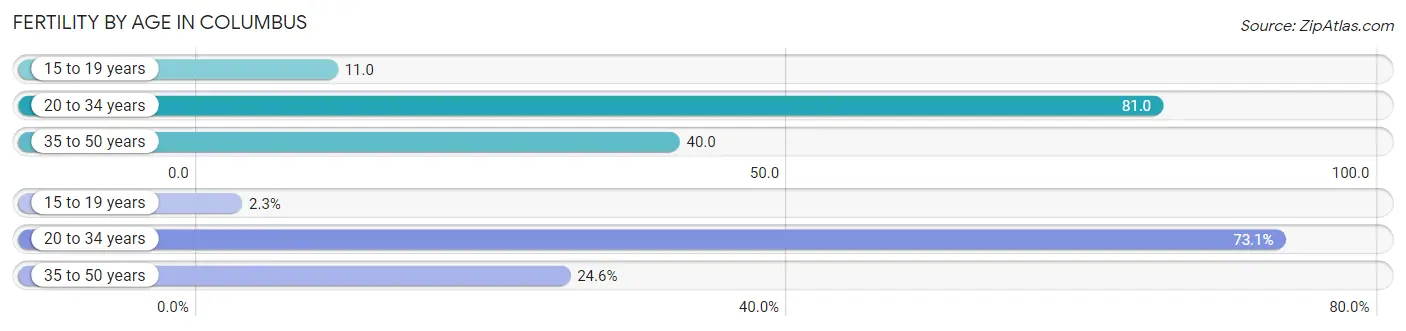
| Age Bracket | Women with Births | Births / 1,000 Women |
| 15 to 19 years | 335 (2.3%) | 11.0 |
| 20 to 34 years | 10,623 (73.1%) | 81.0 |
| 35 to 50 years | 3,572 (24.6%) | 40.0 |
| Total | 14,530 (100.0%) | 58.0 |
Fertility by Age by Marriage Status in Columbus
64.3% of women with births (14,530) in Columbus are married. The highest percentage of unmarried women with births falls into 15 to 19 years age bracket with 100.0% of them unmarried at the time of birth, while the lowest percentage of unmarried women with births belong to 35 to 50 years age bracket with 19.7% of them unmarried.
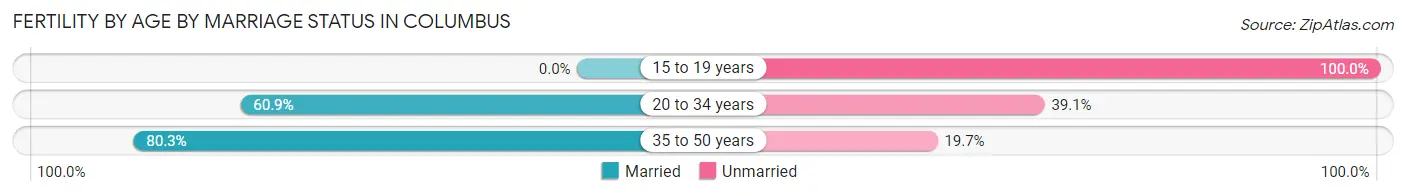
| Age Bracket | Married | Unmarried |
| 15 to 19 years | 0 (0.0%) | 335 (100.0%) |
| 20 to 34 years | 6,469 (60.9%) | 4,154 (39.1%) |
| 35 to 50 years | 2,868 (80.3%) | 704 (19.7%) |
| Total | 9,343 (64.3%) | 5,187 (35.7%) |
Fertility by Education in Columbus
Average fertility rate in Columbus is 58.0 births per 1,000 women. Women with the education attainment of high school diploma have the highest fertility rate of 71.0 births per 1,000 women, while women with the education attainment of bachelor's degree have the lowest fertility at 49.0 births per 1,000 women. Women with the education attainment of college or associate's degree represent 29.0% of all women with births.
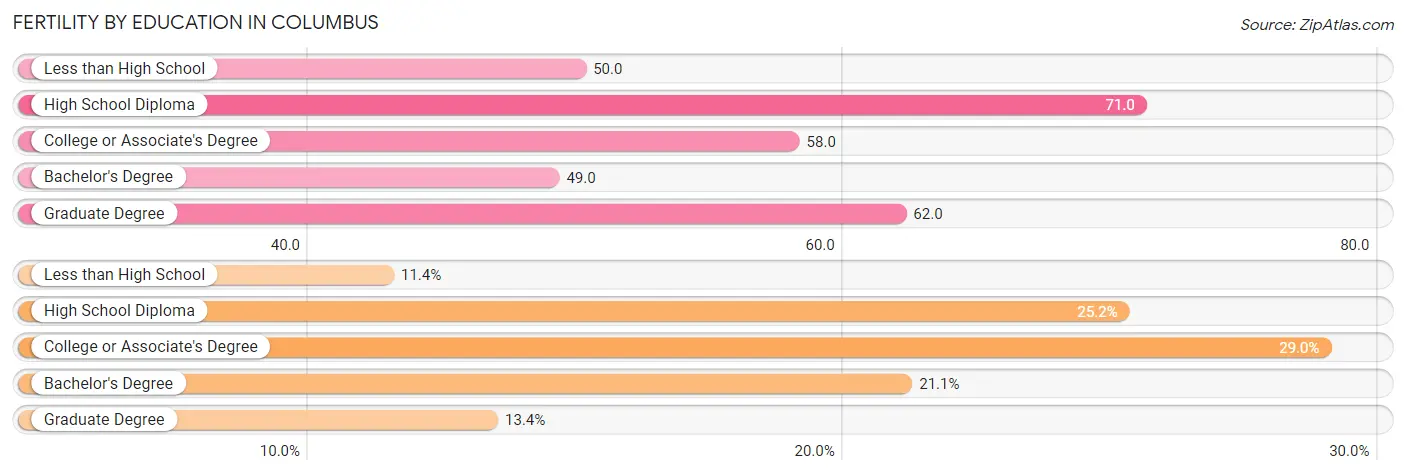
| Educational Attainment | Women with Births | Births / 1,000 Women |
| Less than High School | 1,656 (11.4%) | 50.0 |
| High School Diploma | 3,658 (25.2%) | 71.0 |
| College or Associate's Degree | 4,208 (29.0%) | 58.0 |
| Bachelor's Degree | 3,068 (21.1%) | 49.0 |
| Graduate Degree | 1,940 (13.4%) | 62.0 |
| Total | 14,530 (100.0%) | 58.0 |
Fertility by Education by Marriage Status in Columbus
35.7% of women with births in Columbus are unmarried. Women with the educational attainment of graduate degree are most likely to be married with 92.5% of them married at childbirth, while women with the educational attainment of less than high school are least likely to be married with 57.5% of them unmarried at childbirth.
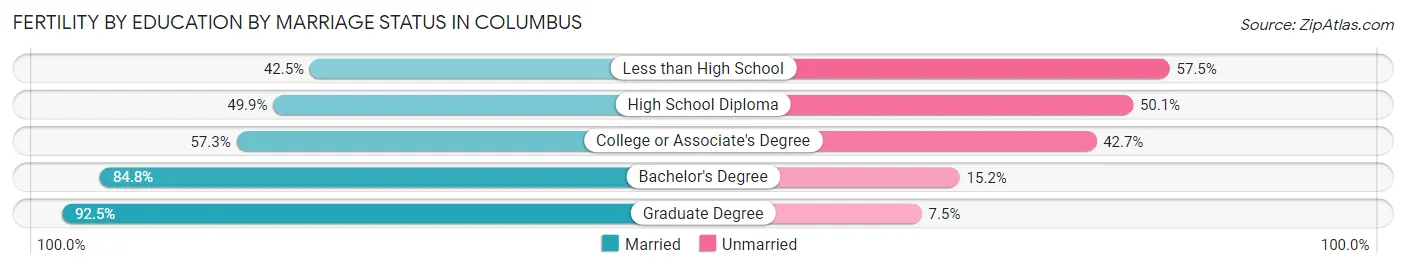
| Educational Attainment | Married | Unmarried |
| Less than High School | 704 (42.5%) | 952 (57.5%) |
| High School Diploma | 1,825 (49.9%) | 1,833 (50.1%) |
| College or Associate's Degree | 2,411 (57.3%) | 1,797 (42.7%) |
| Bachelor's Degree | 2,602 (84.8%) | 466 (15.2%) |
| Graduate Degree | 1,794 (92.5%) | 146 (7.5%) |
| Total | 9,343 (64.3%) | 5,187 (35.7%) |
Employment Characteristics in Columbus
Employment by Class of Employer in Columbus
Among the 473,763 employed individuals in Columbus, private company employees (331,725 | 70.0%), not-for-profit organizations (45,761 | 9.7%), and state government employees (33,446 | 7.1%) make up the most common classes of employment.
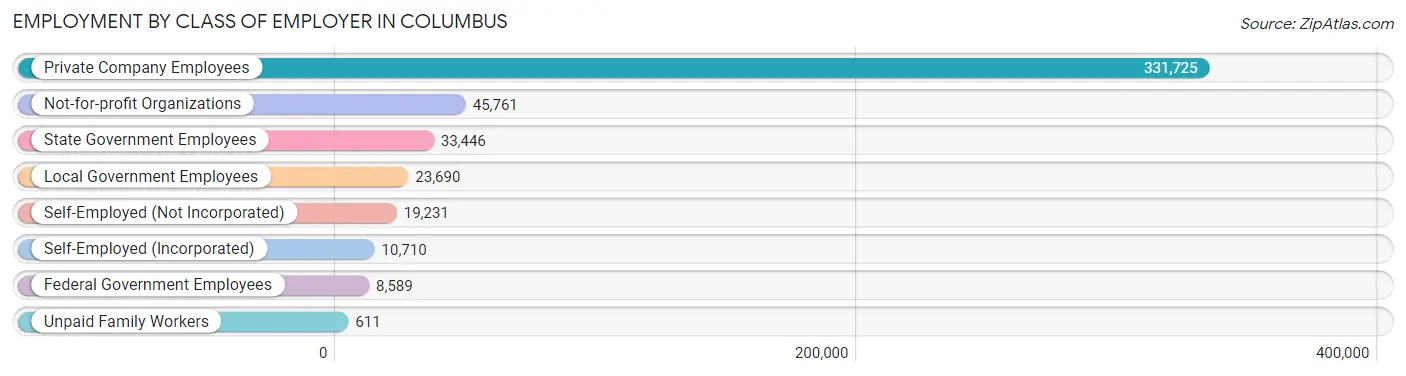
| Employer Class | # Employees | % Employees |
| Private Company Employees | 331,725 | 70.0% |
| Self-Employed (Incorporated) | 10,710 | 2.3% |
| Self-Employed (Not Incorporated) | 19,231 | 4.1% |
| Not-for-profit Organizations | 45,761 | 9.7% |
| Local Government Employees | 23,690 | 5.0% |
| State Government Employees | 33,446 | 7.1% |
| Federal Government Employees | 8,589 | 1.8% |
| Unpaid Family Workers | 611 | 0.1% |
| Total | 473,763 | 100.0% |
Employment Status by Age in Columbus
According to the labor force statistics for Columbus, out of the total population over 16 years of age (723,863), 70.5% or 510,323 individuals are in the labor force, with 5.2% or 26,537 of them unemployed. The age group with the highest labor force participation rate is 25 to 29 years, with 87.6% or 84,730 individuals in the labor force. Within the labor force, the 16 to 19 years age range has the highest percentage of unemployed individuals, with 15.3% or 3,156 of them being unemployed.
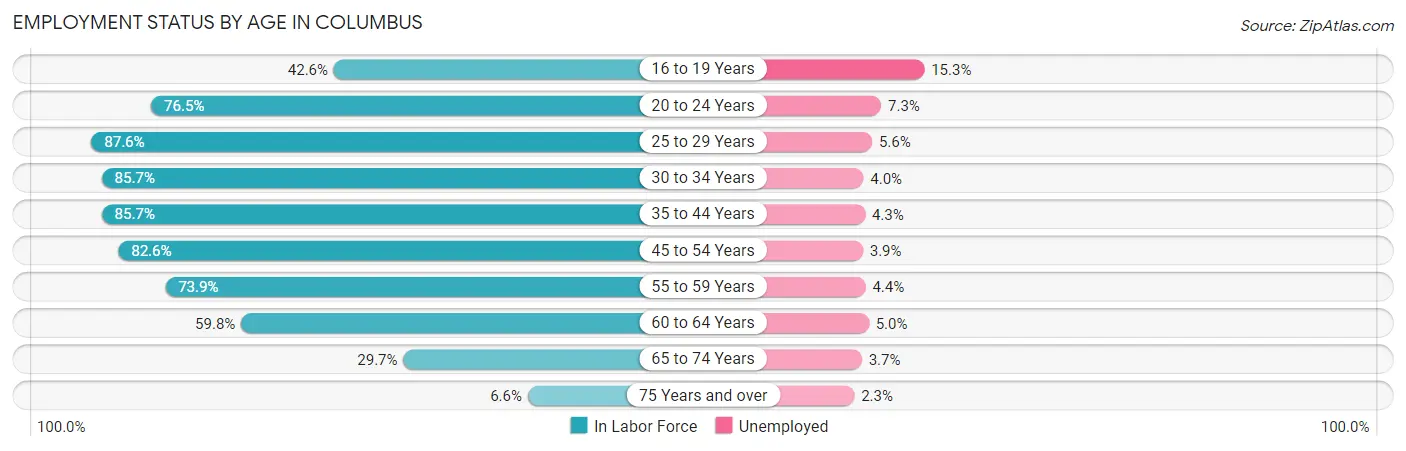
| Age Bracket | In Labor Force | Unemployed |
| 16 to 19 Years | 20,629 (42.6%) | 3,156 (15.3%) |
| 20 to 24 Years | 58,598 (76.5%) | 4,278 (7.3%) |
| 25 to 29 Years | 84,730 (87.6%) | 4,745 (5.6%) |
| 30 to 34 Years | 75,643 (85.7%) | 3,026 (4.0%) |
| 35 to 44 Years | 105,004 (85.7%) | 4,515 (4.3%) |
| 45 to 54 Years | 81,793 (82.6%) | 3,190 (3.9%) |
| 55 to 59 Years | 35,496 (73.9%) | 1,562 (4.4%) |
| 60 to 64 Years | 28,323 (59.8%) | 1,416 (5.0%) |
| 65 to 74 Years | 17,960 (29.7%) | 665 (3.7%) |
| 75 Years and over | 2,405 (6.6%) | 55 (2.3%) |
| Total | 510,323 (70.5%) | 26,537 (5.2%) |
Employment Status by Educational Attainment in Columbus
According to labor force statistics for Columbus, 81.9% of individuals (411,083) out of the total population between 25 and 64 years of age (501,933) are in the labor force, with 4.5% or 18,499 of them being unemployed. The group with the highest labor force participation rate are those with the educational attainment of bachelor's degree or higher, with 90.5% or 180,660 individuals in the labor force. Within the labor force, individuals with less than high school education have the highest percentage of unemployment, with 9.0% or 2,396 of them being unemployed.
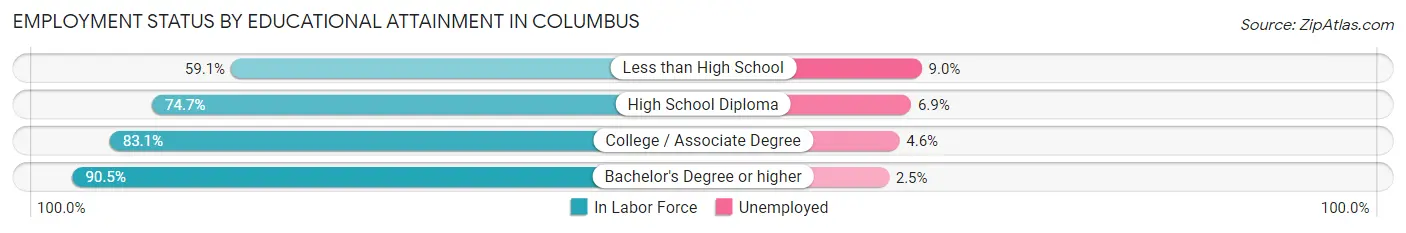
| Educational Attainment | In Labor Force | Unemployed |
| Less than High School | 26,623 (59.1%) | 4,054 (9.0%) |
| High School Diploma | 90,170 (74.7%) | 8,329 (6.9%) |
| College / Associate Degree | 113,474 (83.1%) | 6,281 (4.6%) |
| Bachelor's Degree or higher | 180,660 (90.5%) | 4,991 (2.5%) |
| Total | 411,083 (81.9%) | 22,587 (4.5%) |
Employment Occupations by Sex in Columbus
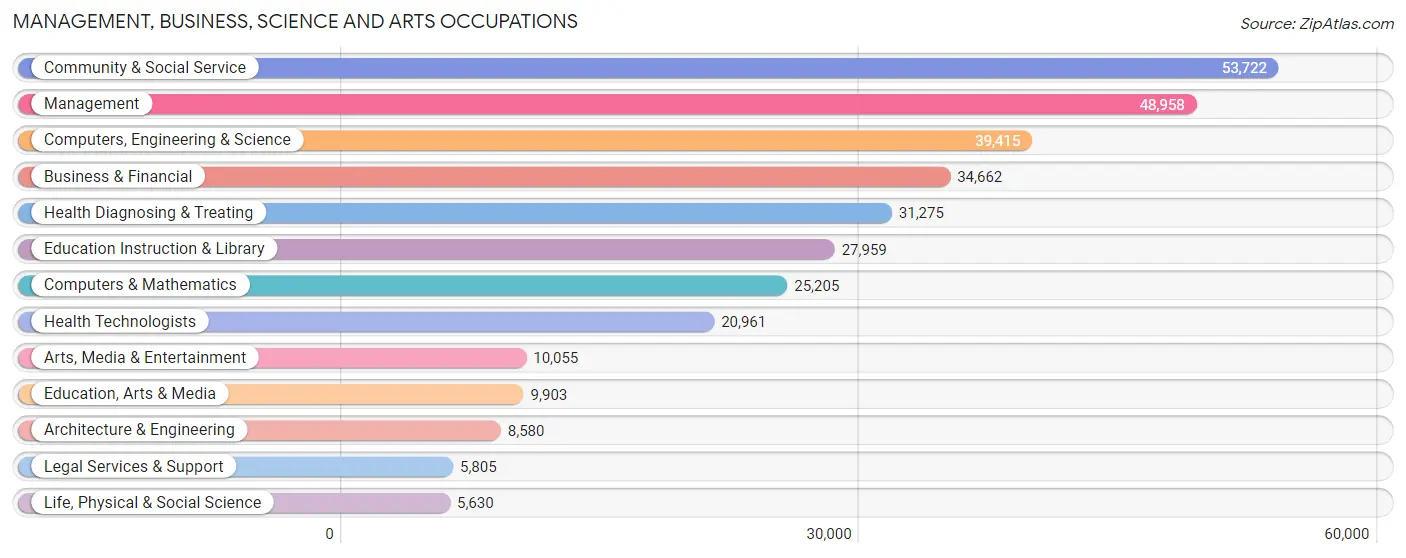
Management, Business, Science and Arts Occupations
The most common Management, Business, Science and Arts occupations in Columbus are Community & Social Service (53,722 | 11.1%), Management (48,958 | 10.1%), Computers, Engineering & Science (39,415 | 8.2%), Business & Financial (34,662 | 7.2%), and Health Diagnosing & Treating (31,275 | 6.5%).
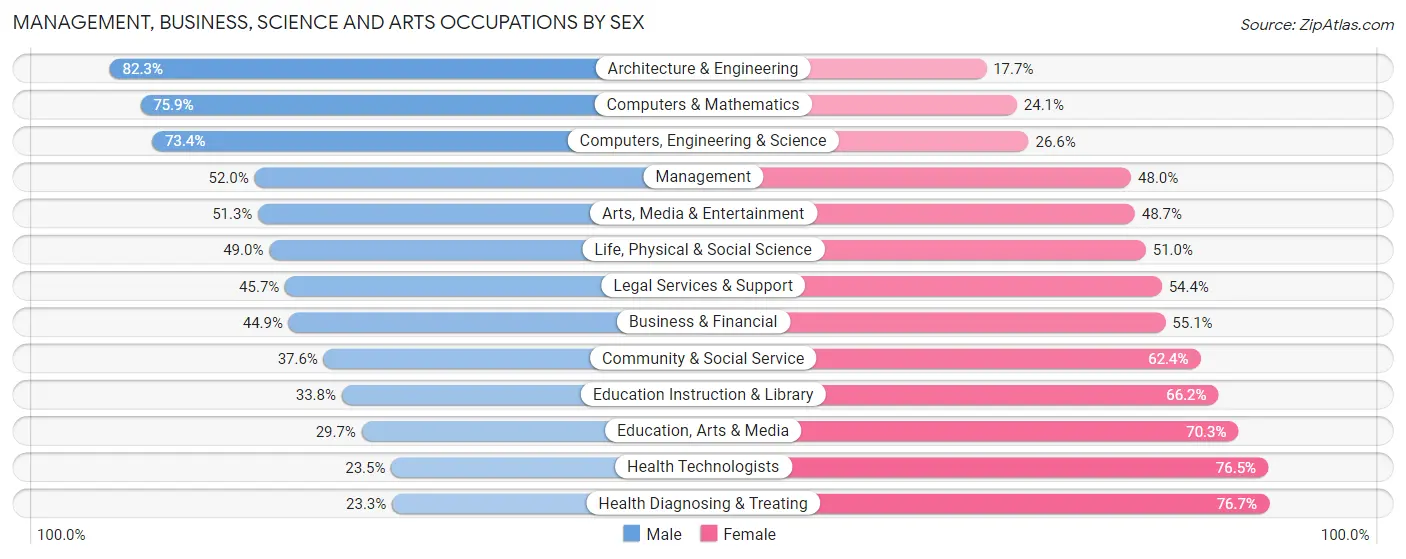
Management, Business, Science and Arts Occupations by Sex
Within the Management, Business, Science and Arts occupations in Columbus, the most male-oriented occupations are Architecture & Engineering (82.3%), Computers & Mathematics (75.9%), and Computers, Engineering & Science (73.4%), while the most female-oriented occupations are Health Diagnosing & Treating (76.7%), Health Technologists (76.5%), and Education, Arts & Media (70.3%).
| Occupation | Male | Female |
| Management | 25,472 (52.0%) | 23,486 (48.0%) |
| Business & Financial | 15,555 (44.9%) | 19,107 (55.1%) |
| Computers, Engineering & Science | 28,938 (73.4%) | 10,477 (26.6%) |
| Computers & Mathematics | 19,123 (75.9%) | 6,082 (24.1%) |
| Architecture & Engineering | 7,058 (82.3%) | 1,522 (17.7%) |
| Life, Physical & Social Science | 2,757 (49.0%) | 2,873 (51.0%) |
| Community & Social Service | 20,205 (37.6%) | 33,517 (62.4%) |
| Education, Arts & Media | 2,939 (29.7%) | 6,964 (70.3%) |
| Legal Services & Support | 2,650 (45.7%) | 3,155 (54.3%) |
| Education Instruction & Library | 9,461 (33.8%) | 18,498 (66.2%) |
| Arts, Media & Entertainment | 5,155 (51.3%) | 4,900 (48.7%) |
| Health Diagnosing & Treating | 7,296 (23.3%) | 23,979 (76.7%) |
| Health Technologists | 4,925 (23.5%) | 16,036 (76.5%) |
| Total (Category) | 97,466 (46.9%) | 110,566 (53.1%) |
| Total (Overall) | 249,082 (51.5%) | 234,399 (48.5%) |
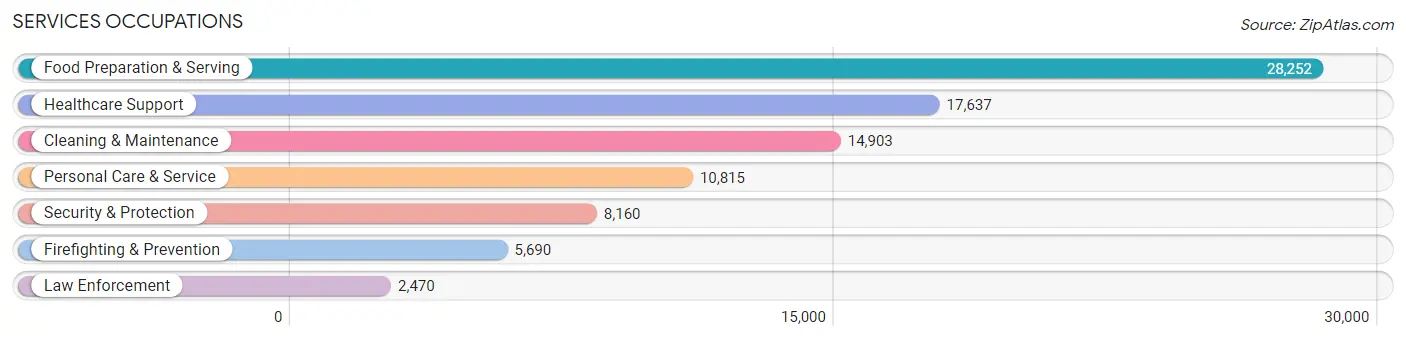
Services Occupations
The most common Services occupations in Columbus are Food Preparation & Serving (28,252 | 5.8%), Healthcare Support (17,637 | 3.6%), Cleaning & Maintenance (14,903 | 3.1%), Personal Care & Service (10,815 | 2.2%), and Security & Protection (8,160 | 1.7%).
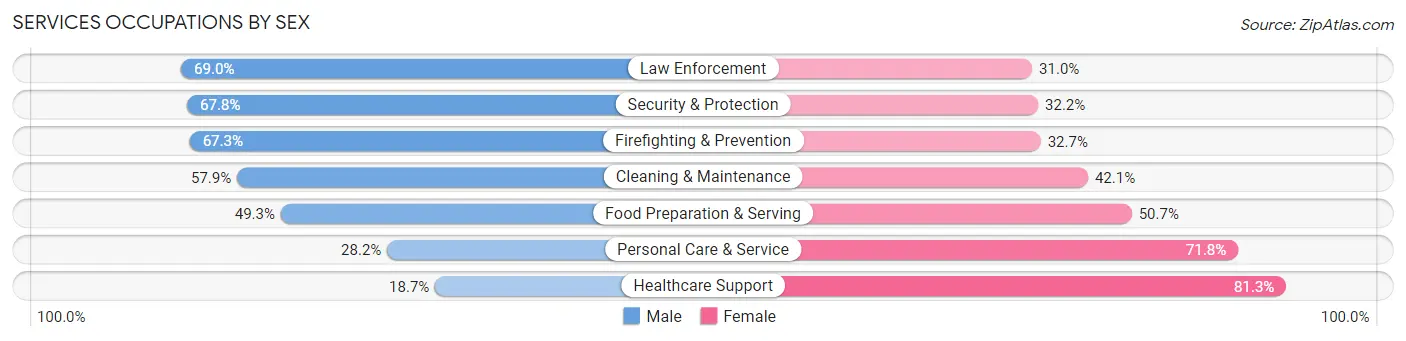
Services Occupations by Sex
Within the Services occupations in Columbus, the most male-oriented occupations are Law Enforcement (69.0%), Security & Protection (67.8%), and Firefighting & Prevention (67.3%), while the most female-oriented occupations are Healthcare Support (81.3%), Personal Care & Service (71.8%), and Food Preparation & Serving (50.7%).
| Occupation | Male | Female |
| Healthcare Support | 3,298 (18.7%) | 14,339 (81.3%) |
| Security & Protection | 5,533 (67.8%) | 2,627 (32.2%) |
| Firefighting & Prevention | 3,829 (67.3%) | 1,861 (32.7%) |
| Law Enforcement | 1,704 (69.0%) | 766 (31.0%) |
| Food Preparation & Serving | 13,921 (49.3%) | 14,331 (50.7%) |
| Cleaning & Maintenance | 8,634 (57.9%) | 6,269 (42.1%) |
| Personal Care & Service | 3,051 (28.2%) | 7,764 (71.8%) |
| Total (Category) | 34,437 (43.2%) | 45,330 (56.8%) |
| Total (Overall) | 249,082 (51.5%) | 234,399 (48.5%) |
Sales and Office Occupations
The most common Sales and Office occupations in Columbus are Office & Administration (57,321 | 11.9%), and Sales & Related (43,639 | 9.0%).

Sales and Office Occupations by Sex
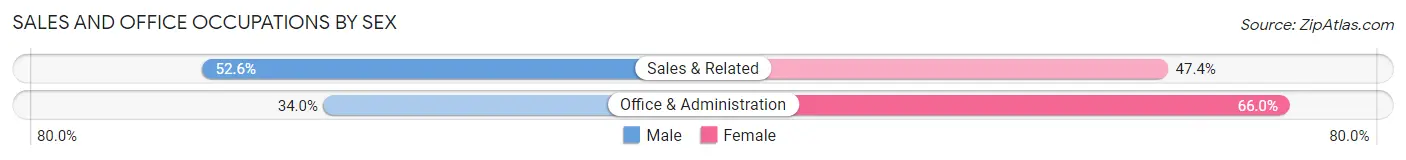
| Occupation | Male | Female |
| Sales & Related | 22,952 (52.6%) | 20,687 (47.4%) |
| Office & Administration | 19,474 (34.0%) | 37,847 (66.0%) |
| Total (Category) | 42,426 (42.0%) | 58,534 (58.0%) |
| Total (Overall) | 249,082 (51.5%) | 234,399 (48.5%) |
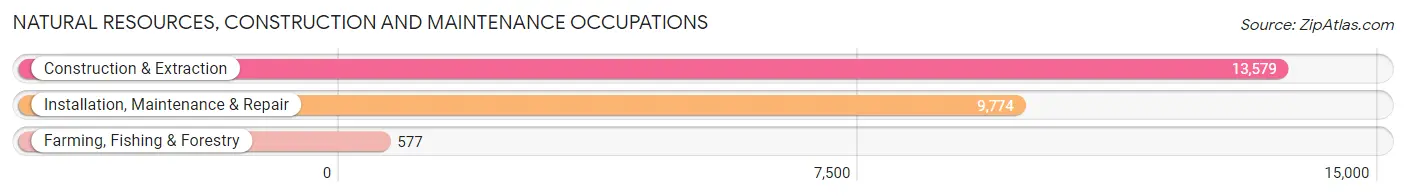
Natural Resources, Construction and Maintenance Occupations
The most common Natural Resources, Construction and Maintenance occupations in Columbus are Construction & Extraction (13,579 | 2.8%), Installation, Maintenance & Repair (9,774 | 2.0%), and Farming, Fishing & Forestry (577 | 0.1%).
Natural Resources, Construction and Maintenance Occupations by Sex
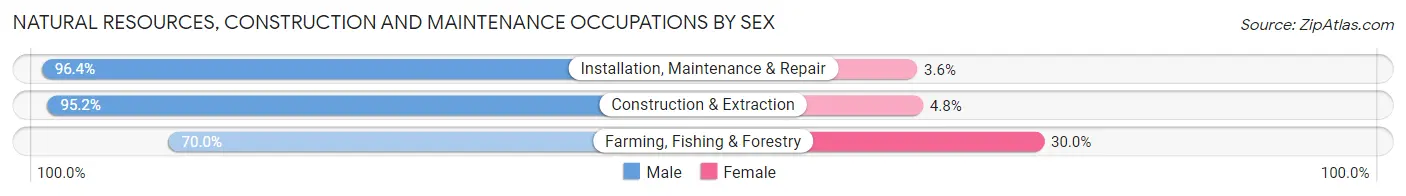
| Occupation | Male | Female |
| Farming, Fishing & Forestry | 404 (70.0%) | 173 (30.0%) |
| Construction & Extraction | 12,930 (95.2%) | 649 (4.8%) |
| Installation, Maintenance & Repair | 9,423 (96.4%) | 351 (3.6%) |
| Total (Category) | 22,757 (95.1%) | 1,173 (4.9%) |
| Total (Overall) | 249,082 (51.5%) | 234,399 (48.5%) |
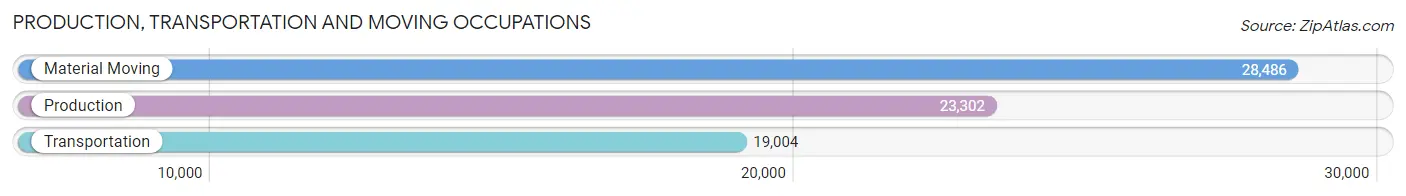
Production, Transportation and Moving Occupations
The most common Production, Transportation and Moving occupations in Columbus are Material Moving (28,486 | 5.9%), Production (23,302 | 4.8%), and Transportation (19,004 | 3.9%).
Production, Transportation and Moving Occupations by Sex
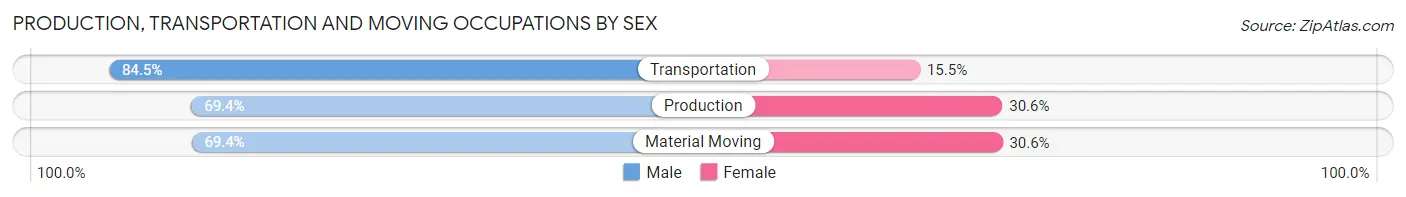
| Occupation | Male | Female |
| Production | 16,171 (69.4%) | 7,131 (30.6%) |
| Transportation | 16,060 (84.5%) | 2,944 (15.5%) |
| Material Moving | 19,765 (69.4%) | 8,721 (30.6%) |
| Total (Category) | 51,996 (73.5%) | 18,796 (26.6%) |
| Total (Overall) | 249,082 (51.5%) | 234,399 (48.5%) |
Employment Industries by Sex in Columbus
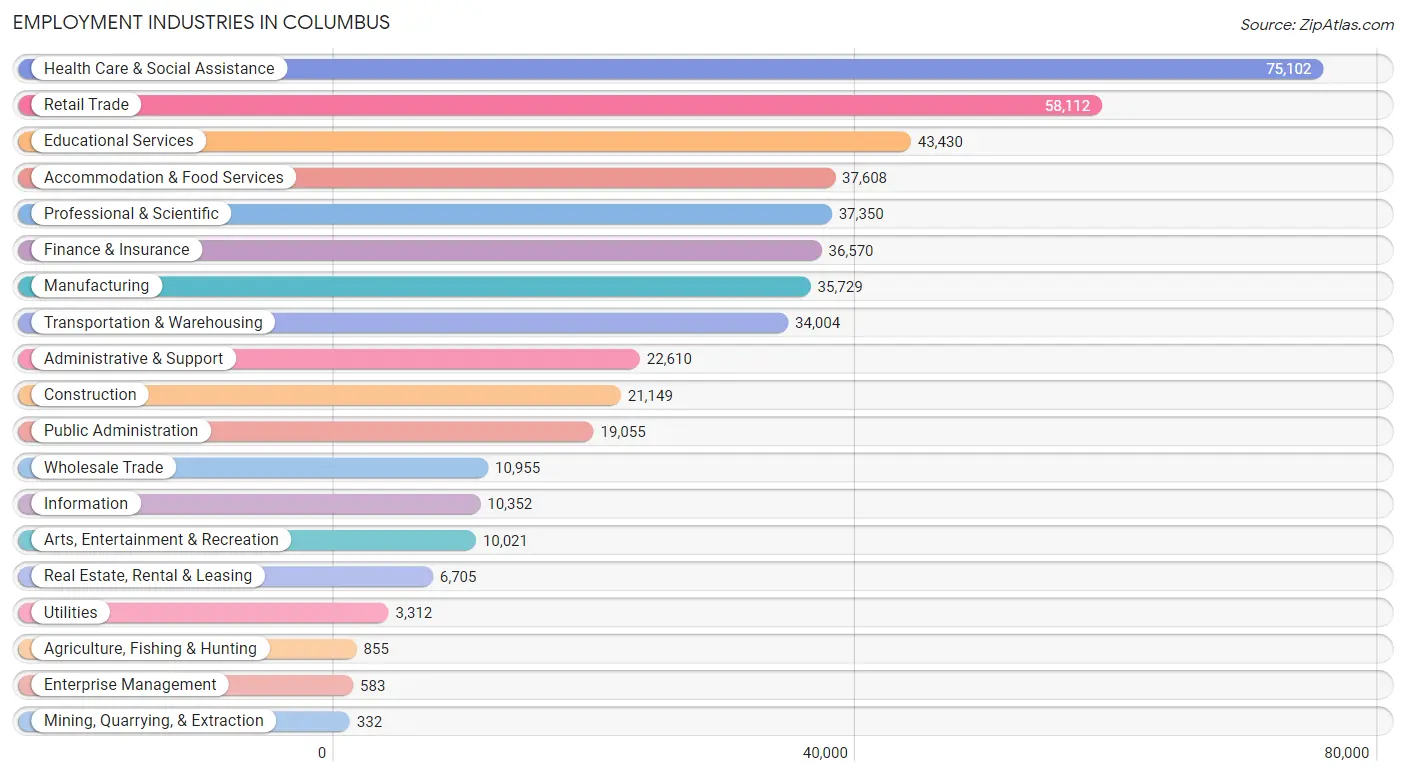
Employment Industries in Columbus
The major employment industries in Columbus include Health Care & Social Assistance (75,102 | 15.5%), Retail Trade (58,112 | 12.0%), Educational Services (43,430 | 9.0%), Accommodation & Food Services (37,608 | 7.8%), and Professional & Scientific (37,350 | 7.7%).
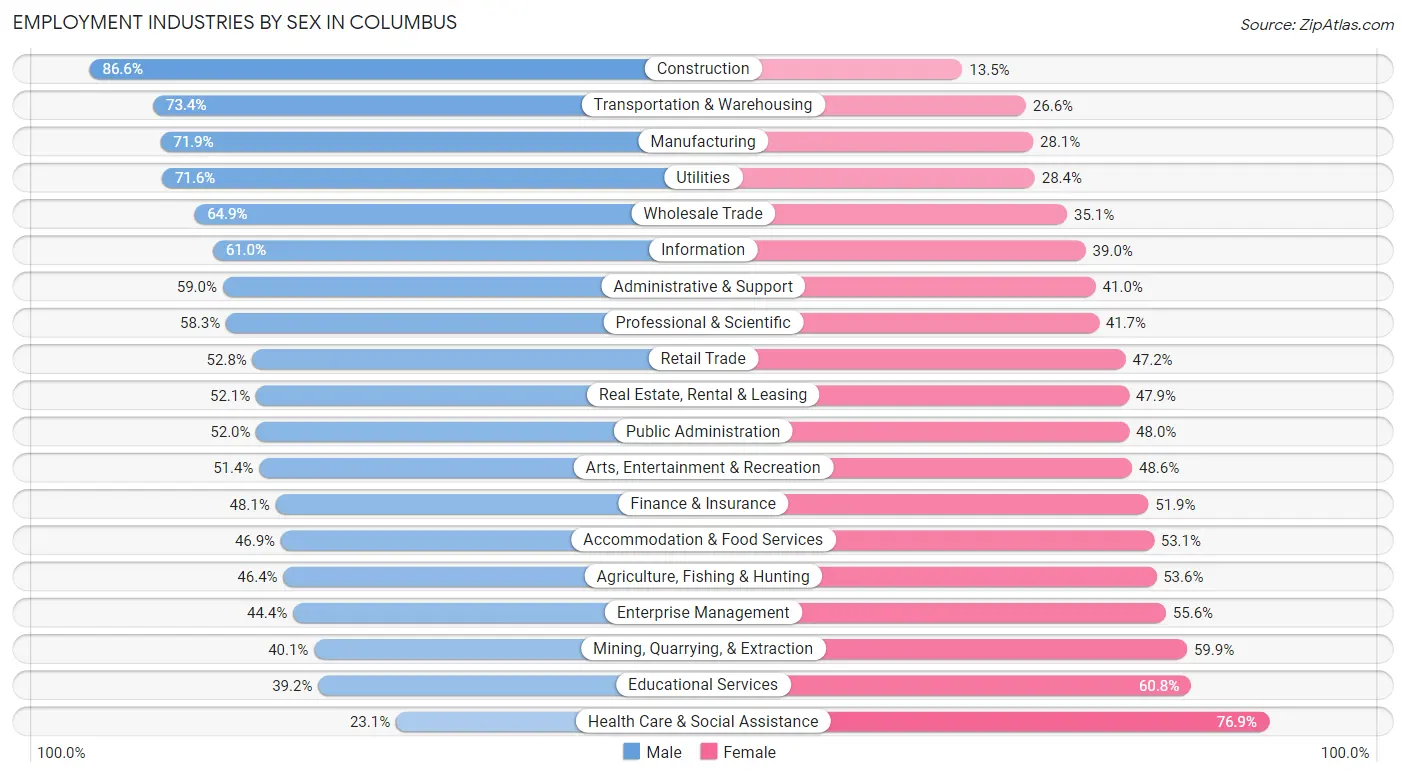
Employment Industries by Sex in Columbus
The Columbus industries that see more men than women are Construction (86.6%), Transportation & Warehousing (73.4%), and Manufacturing (71.9%), whereas the industries that tend to have a higher number of women are Health Care & Social Assistance (76.9%), Educational Services (60.8%), and Mining, Quarrying, & Extraction (59.9%).
| Industry | Male | Female |
| Agriculture, Fishing & Hunting | 397 (46.4%) | 458 (53.6%) |
| Mining, Quarrying, & Extraction | 133 (40.1%) | 199 (59.9%) |
| Construction | 18,304 (86.6%) | 2,845 (13.5%) |
| Manufacturing | 25,694 (71.9%) | 10,035 (28.1%) |
| Wholesale Trade | 7,109 (64.9%) | 3,846 (35.1%) |
| Retail Trade | 30,681 (52.8%) | 27,431 (47.2%) |
| Transportation & Warehousing | 24,961 (73.4%) | 9,043 (26.6%) |
| Utilities | 2,370 (71.6%) | 942 (28.4%) |
| Information | 6,319 (61.0%) | 4,033 (39.0%) |
| Finance & Insurance | 17,575 (48.1%) | 18,995 (51.9%) |
| Real Estate, Rental & Leasing | 3,493 (52.1%) | 3,212 (47.9%) |
| Professional & Scientific | 21,780 (58.3%) | 15,570 (41.7%) |
| Enterprise Management | 259 (44.4%) | 324 (55.6%) |
| Administrative & Support | 13,332 (59.0%) | 9,278 (41.0%) |
| Educational Services | 17,034 (39.2%) | 26,396 (60.8%) |
| Health Care & Social Assistance | 17,371 (23.1%) | 57,731 (76.9%) |
| Arts, Entertainment & Recreation | 5,155 (51.4%) | 4,866 (48.6%) |
| Accommodation & Food Services | 17,655 (46.9%) | 19,953 (53.1%) |
| Public Administration | 9,914 (52.0%) | 9,141 (48.0%) |
| Total | 249,082 (51.5%) | 234,399 (48.5%) |
Education in Columbus
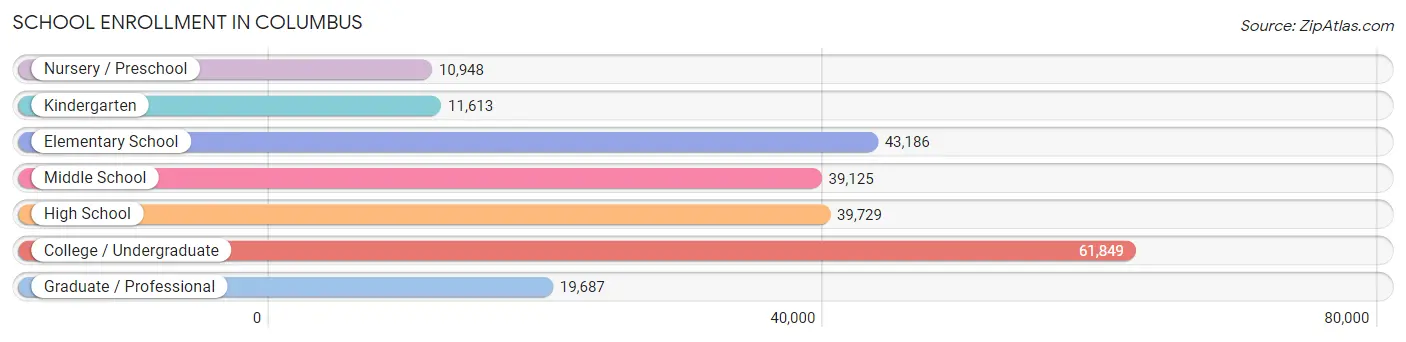
School Enrollment in Columbus
The most common levels of schooling among the 226,137 students in Columbus are college / undergraduate (61,849 | 27.4%), elementary school (43,186 | 19.1%), and high school (39,729 | 17.6%).
| School Level | # Students | % Students |
| Nursery / Preschool | 10,948 | 4.8% |
| Kindergarten | 11,613 | 5.1% |
| Elementary School | 43,186 | 19.1% |
| Middle School | 39,125 | 17.3% |
| High School | 39,729 | 17.6% |
| College / Undergraduate | 61,849 | 27.4% |
| Graduate / Professional | 19,687 | 8.7% |
| Total | 226,137 | 100.0% |
School Enrollment by Age by Funding Source in Columbus
Out of a total of 226,137 students who are enrolled in schools in Columbus, 38,217 (16.9%) attend a private institution, while the remaining 187,920 (83.1%) are enrolled in public schools. The age group of 3 to 4 year olds has the highest likelihood of being enrolled in private schools, with 3,213 (37.0% in the age bracket) enrolled. Conversely, the age group of 18 to 19 year olds has the lowest likelihood of being enrolled in a private school, with 19,614 (89.1% in the age bracket) attending a public institution.
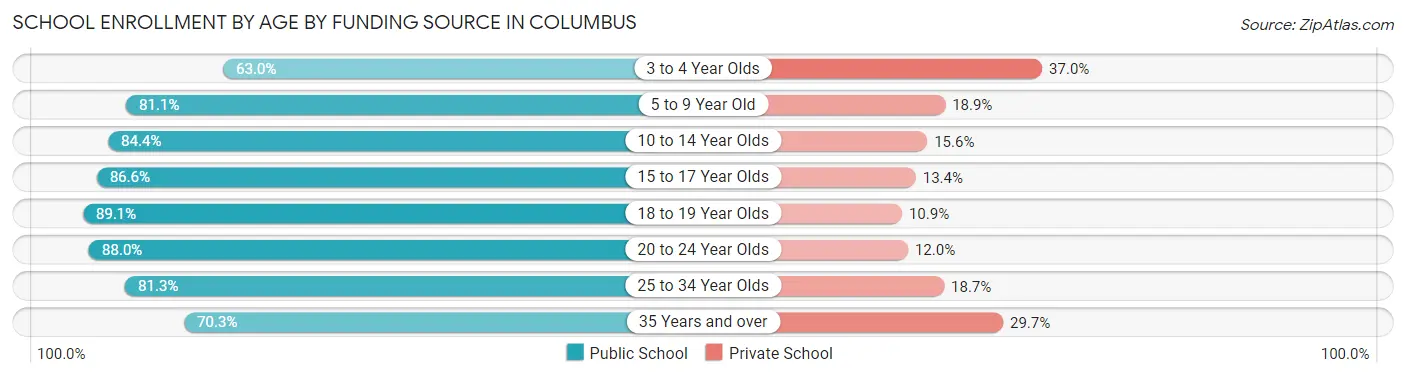
| Age Bracket | Public School | Private School |
| 3 to 4 Year Olds | 5,478 (63.0%) | 3,213 (37.0%) |
| 5 to 9 Year Old | 40,480 (81.1%) | 9,440 (18.9%) |
| 10 to 14 Year Olds | 43,103 (84.4%) | 7,945 (15.6%) |
| 15 to 17 Year Olds | 24,284 (86.6%) | 3,770 (13.4%) |
| 18 to 19 Year Olds | 19,614 (89.1%) | 2,389 (10.9%) |
| 20 to 24 Year Olds | 29,711 (88.0%) | 4,042 (12.0%) |
| 25 to 34 Year Olds | 17,499 (81.3%) | 4,027 (18.7%) |
| 35 Years and over | 7,834 (70.3%) | 3,308 (29.7%) |
| Total | 187,920 (83.1%) | 38,217 (16.9%) |
Educational Attainment by Field of Study in Columbus
Business (49,296 | 19.7%), education (23,019 | 9.2%), science & technology (22,679 | 9.1%), social sciences (20,007 | 8.0%), and bio, nature & agricultural (17,959 | 7.2%) are the most common fields of study among 250,150 individuals in Columbus who have obtained a bachelor's degree or higher.
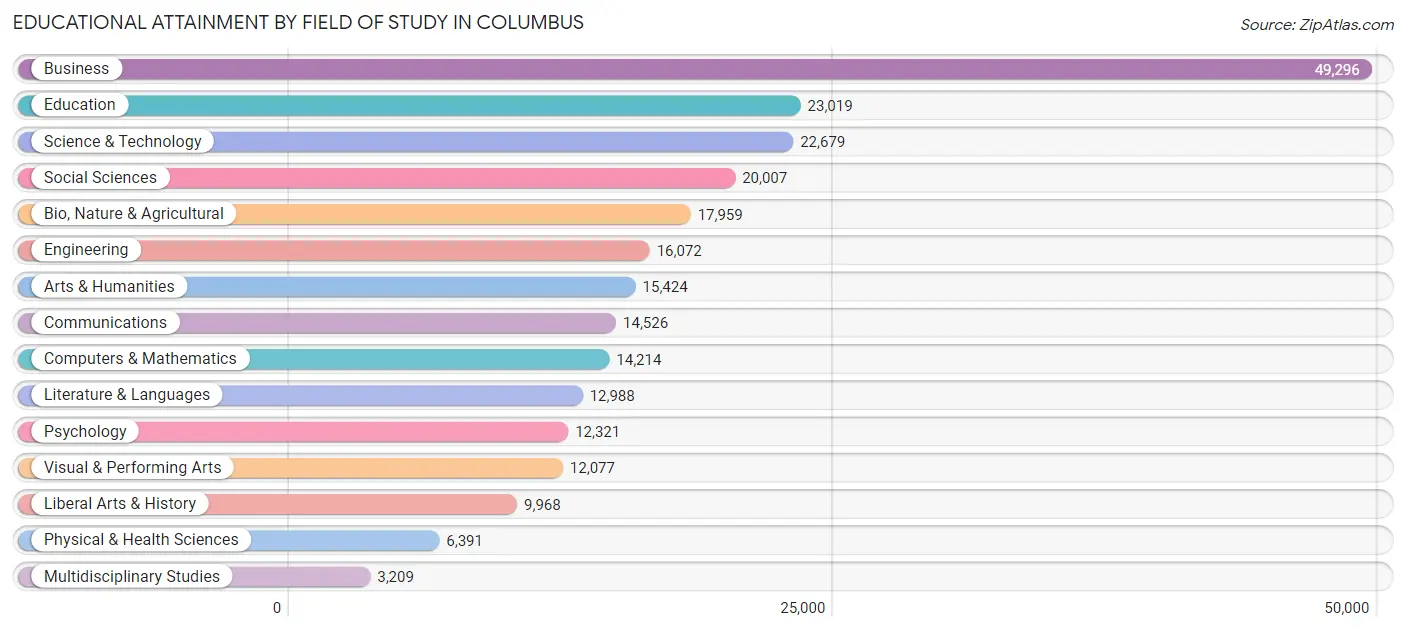
| Field of Study | # Graduates | % Graduates |
| Computers & Mathematics | 14,214 | 5.7% |
| Bio, Nature & Agricultural | 17,959 | 7.2% |
| Physical & Health Sciences | 6,391 | 2.5% |
| Psychology | 12,321 | 4.9% |
| Social Sciences | 20,007 | 8.0% |
| Engineering | 16,072 | 6.4% |
| Multidisciplinary Studies | 3,209 | 1.3% |
| Science & Technology | 22,679 | 9.1% |
| Business | 49,296 | 19.7% |
| Education | 23,019 | 9.2% |
| Literature & Languages | 12,988 | 5.2% |
| Liberal Arts & History | 9,968 | 4.0% |
| Visual & Performing Arts | 12,077 | 4.8% |
| Communications | 14,526 | 5.8% |
| Arts & Humanities | 15,424 | 6.2% |
| Total | 250,150 | 100.0% |
Transportation & Commute in Columbus
Vehicle Availability by Sex in Columbus
The most prevalent vehicle ownership categories in Columbus are males with 2 vehicles (113,555, accounting for 46.8%) and females with 2 vehicles (99,378, making up 50.2%).
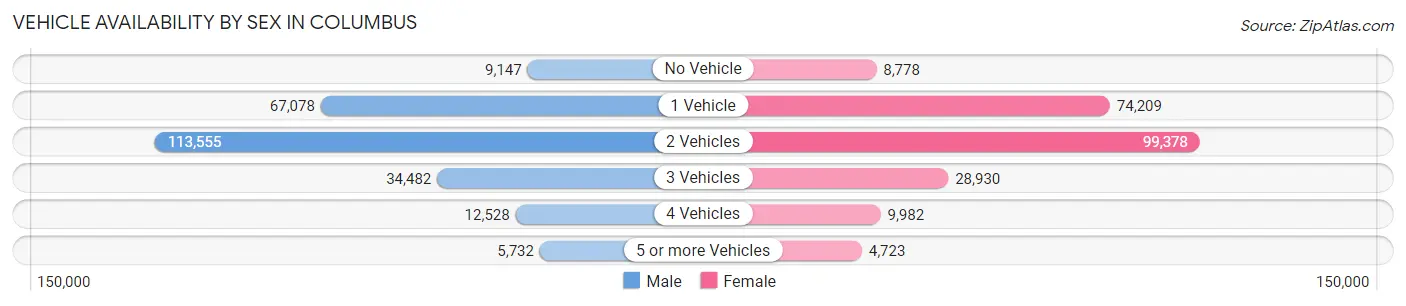
| Vehicles Available | Male | Female |
| No Vehicle | 9,147 (3.8%) | 8,778 (3.9%) |
| 1 Vehicle | 67,078 (27.7%) | 74,209 (32.8%) |
| 2 Vehicles | 113,555 (46.8%) | 99,378 (44.0%) |
| 3 Vehicles | 34,482 (14.2%) | 28,930 (12.8%) |
| 4 Vehicles | 12,528 (5.2%) | 9,982 (4.4%) |
| 5 or more Vehicles | 5,732 (2.4%) | 4,723 (2.1%) |
| Total | 242,522 (100.0%) | 226,000 (100.0%) |
Commute Time in Columbus
The most frequently occuring commute durations in Columbus are 20 to 24 minutes (86,966 commuters, 21.3%), 15 to 19 minutes (82,702 commuters, 20.3%), and 10 to 14 minutes (58,298 commuters, 14.3%).
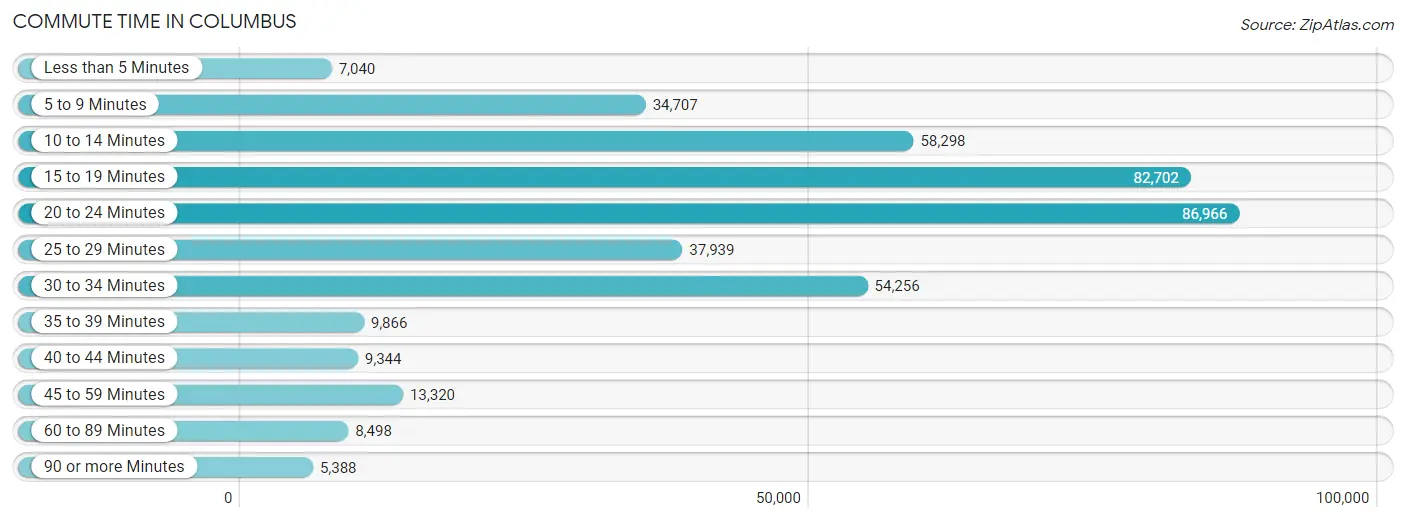
| Commute Time | # Commuters | % Commuters |
| Less than 5 Minutes | 7,040 | 1.7% |
| 5 to 9 Minutes | 34,707 | 8.5% |
| 10 to 14 Minutes | 58,298 | 14.3% |
| 15 to 19 Minutes | 82,702 | 20.3% |
| 20 to 24 Minutes | 86,966 | 21.3% |
| 25 to 29 Minutes | 37,939 | 9.3% |
| 30 to 34 Minutes | 54,256 | 13.3% |
| 35 to 39 Minutes | 9,866 | 2.4% |
| 40 to 44 Minutes | 9,344 | 2.3% |
| 45 to 59 Minutes | 13,320 | 3.3% |
| 60 to 89 Minutes | 8,498 | 2.1% |
| 90 or more Minutes | 5,388 | 1.3% |
Commute Time by Sex in Columbus
The most common commute times in Columbus are 20 to 24 minutes (46,100 commuters, 21.5%) for males and 15 to 19 minutes (41,111 commuters, 21.1%) for females.
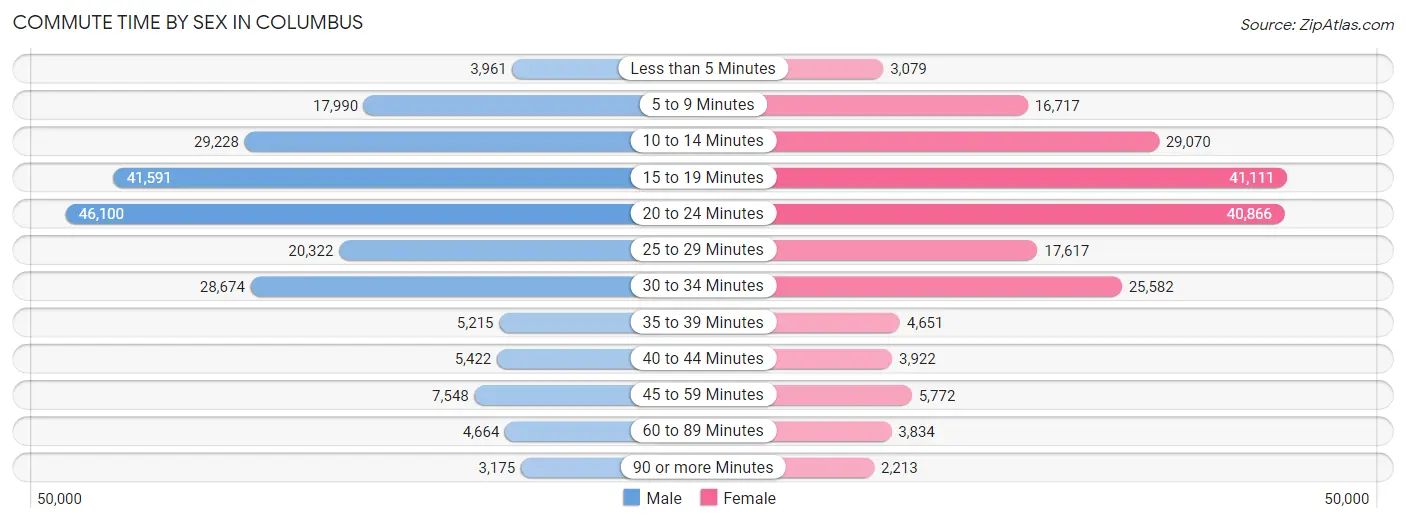
| Commute Time | Male | Female |
| Less than 5 Minutes | 3,961 (1.8%) | 3,079 (1.6%) |
| 5 to 9 Minutes | 17,990 (8.4%) | 16,717 (8.6%) |
| 10 to 14 Minutes | 29,228 (13.7%) | 29,070 (14.9%) |
| 15 to 19 Minutes | 41,591 (19.5%) | 41,111 (21.1%) |
| 20 to 24 Minutes | 46,100 (21.5%) | 40,866 (21.0%) |
| 25 to 29 Minutes | 20,322 (9.5%) | 17,617 (9.1%) |
| 30 to 34 Minutes | 28,674 (13.4%) | 25,582 (13.2%) |
| 35 to 39 Minutes | 5,215 (2.4%) | 4,651 (2.4%) |
| 40 to 44 Minutes | 5,422 (2.5%) | 3,922 (2.0%) |
| 45 to 59 Minutes | 7,548 (3.5%) | 5,772 (3.0%) |
| 60 to 89 Minutes | 4,664 (2.2%) | 3,834 (2.0%) |
| 90 or more Minutes | 3,175 (1.5%) | 2,213 (1.1%) |
Time of Departure to Work by Sex in Columbus
The most frequent times of departure to work in Columbus are 7:00 AM to 7:29 AM (26,476, 12.4%) for males and 7:00 AM to 7:29 AM (27,203, 14.0%) for females.
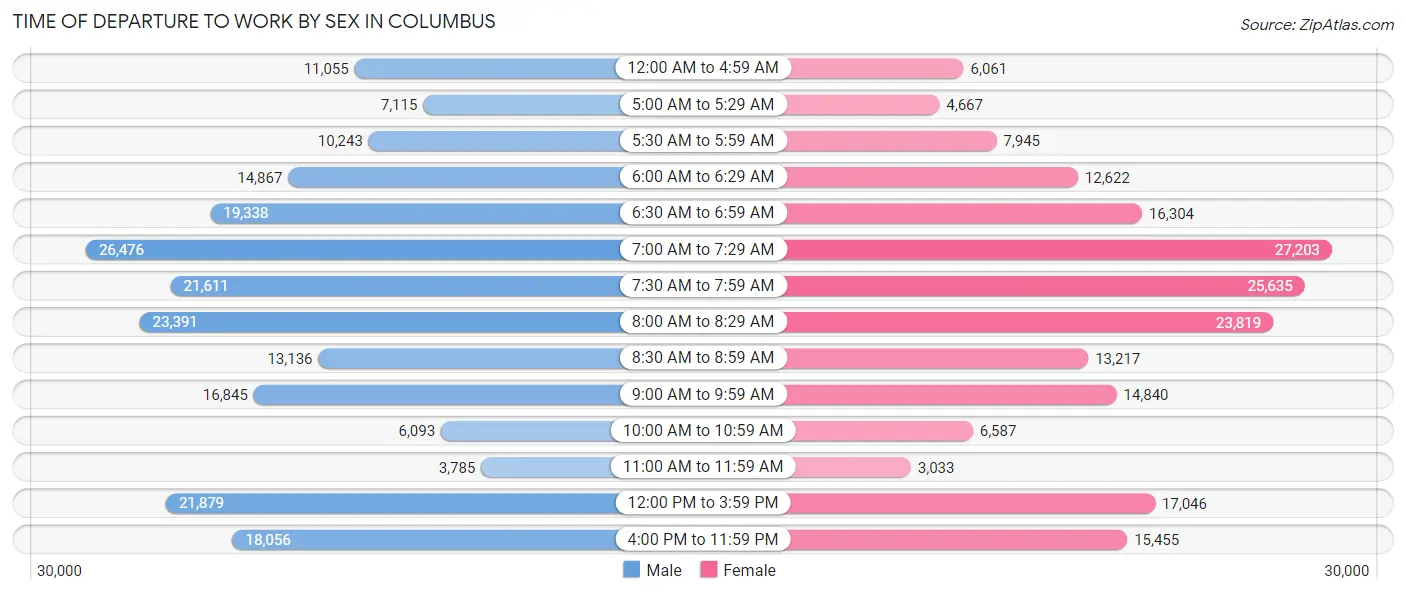
| Time of Departure | Male | Female |
| 12:00 AM to 4:59 AM | 11,055 (5.2%) | 6,061 (3.1%) |
| 5:00 AM to 5:29 AM | 7,115 (3.3%) | 4,667 (2.4%) |
| 5:30 AM to 5:59 AM | 10,243 (4.8%) | 7,945 (4.1%) |
| 6:00 AM to 6:29 AM | 14,867 (7.0%) | 12,622 (6.5%) |
| 6:30 AM to 6:59 AM | 19,338 (9.0%) | 16,304 (8.4%) |
| 7:00 AM to 7:29 AM | 26,476 (12.4%) | 27,203 (14.0%) |
| 7:30 AM to 7:59 AM | 21,611 (10.1%) | 25,635 (13.2%) |
| 8:00 AM to 8:29 AM | 23,391 (10.9%) | 23,819 (12.2%) |
| 8:30 AM to 8:59 AM | 13,136 (6.1%) | 13,217 (6.8%) |
| 9:00 AM to 9:59 AM | 16,845 (7.9%) | 14,840 (7.6%) |
| 10:00 AM to 10:59 AM | 6,093 (2.9%) | 6,587 (3.4%) |
| 11:00 AM to 11:59 AM | 3,785 (1.8%) | 3,033 (1.6%) |
| 12:00 PM to 3:59 PM | 21,879 (10.2%) | 17,046 (8.8%) |
| 4:00 PM to 11:59 PM | 18,056 (8.4%) | 15,455 (8.0%) |
| Total | 213,890 (100.0%) | 194,434 (100.0%) |
Housing Occupancy in Columbus
Occupancy by Ownership in Columbus
Of the total 382,140 dwellings in Columbus, owner-occupied units account for 170,936 (44.7%), while renter-occupied units make up 211,204 (55.3%).
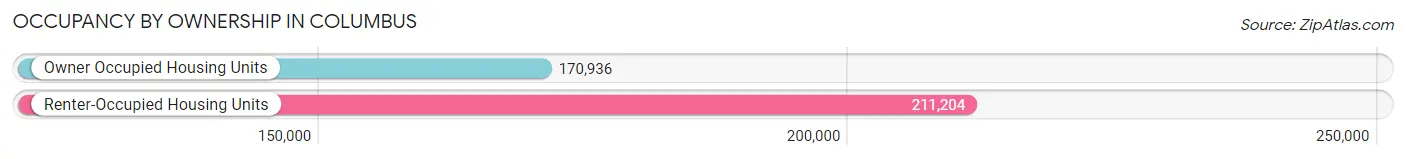
| Occupancy | # Housing Units | % Housing Units |
| Owner Occupied Housing Units | 170,936 | 44.7% |
| Renter-Occupied Housing Units | 211,204 | 55.3% |
| Total Occupied Housing Units | 382,140 | 100.0% |
Occupancy by Household Size in Columbus
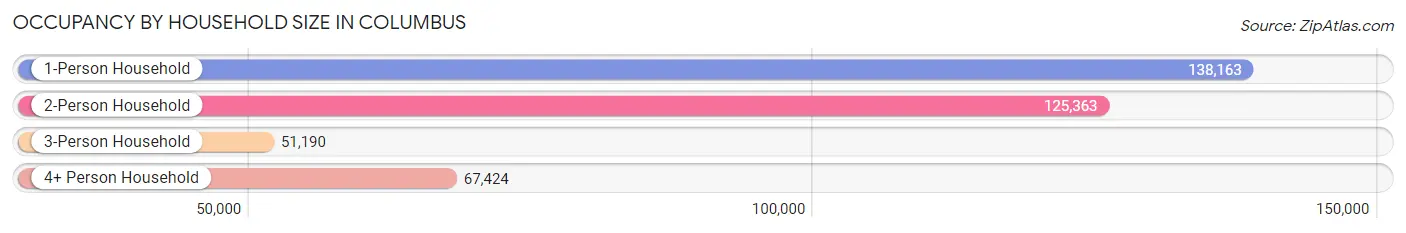
| Household Size | # Housing Units | % Housing Units |
| 1-Person Household | 138,163 | 36.2% |
| 2-Person Household | 125,363 | 32.8% |
| 3-Person Household | 51,190 | 13.4% |
| 4+ Person Household | 67,424 | 17.6% |
| Total Housing Units | 382,140 | 100.0% |
Occupancy by Ownership by Household Size in Columbus
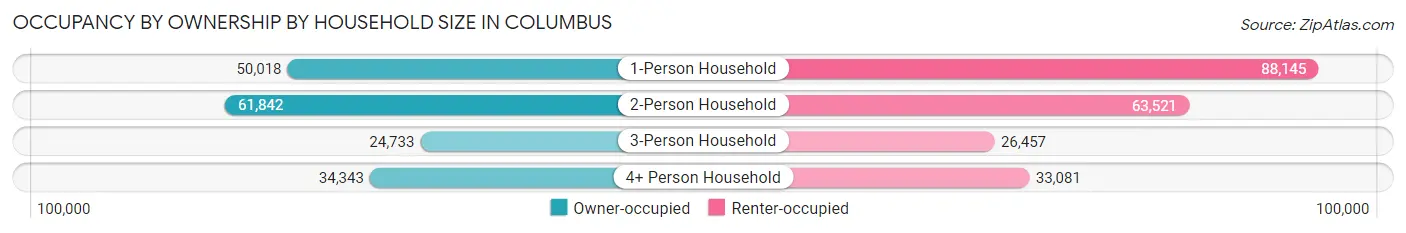
| Household Size | Owner-occupied | Renter-occupied |
| 1-Person Household | 50,018 (36.2%) | 88,145 (63.8%) |
| 2-Person Household | 61,842 (49.3%) | 63,521 (50.7%) |
| 3-Person Household | 24,733 (48.3%) | 26,457 (51.7%) |
| 4+ Person Household | 34,343 (50.9%) | 33,081 (49.1%) |
| Total Housing Units | 170,936 (44.7%) | 211,204 (55.3%) |
Occupancy by Educational Attainment in Columbus
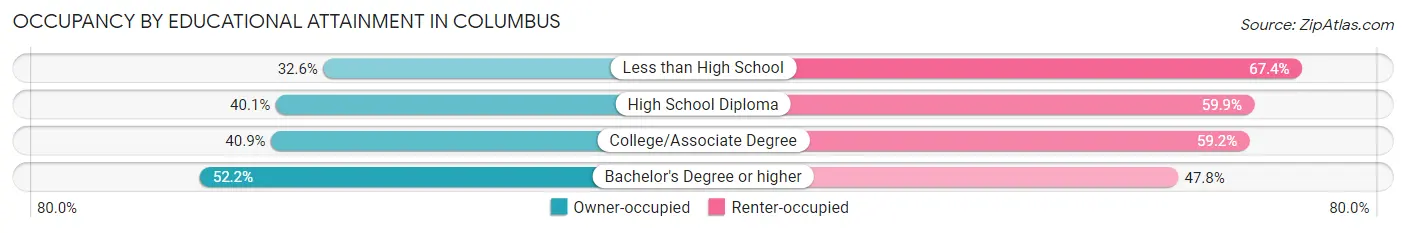
| Household Size | Owner-occupied | Renter-occupied |
| Less than High School | 9,506 (32.6%) | 19,685 (67.4%) |
| High School Diploma | 33,561 (40.1%) | 50,139 (59.9%) |
| College/Associate Degree | 45,648 (40.8%) | 66,084 (59.2%) |
| Bachelor's Degree or higher | 82,221 (52.2%) | 75,296 (47.8%) |
Occupancy by Age of Householder in Columbus
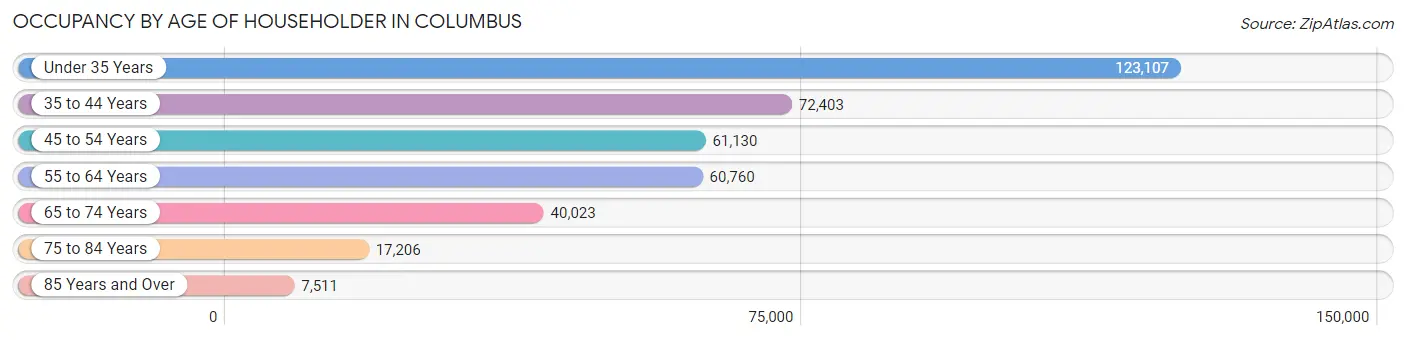
| Age Bracket | # Households | % Households |
| Under 35 Years | 123,107 | 32.2% |
| 35 to 44 Years | 72,403 | 19.0% |
| 45 to 54 Years | 61,130 | 16.0% |
| 55 to 64 Years | 60,760 | 15.9% |
| 65 to 74 Years | 40,023 | 10.5% |
| 75 to 84 Years | 17,206 | 4.5% |
| 85 Years and Over | 7,511 | 2.0% |
| Total | 382,140 | 100.0% |
Housing Finances in Columbus
Median Income by Occupancy in Columbus
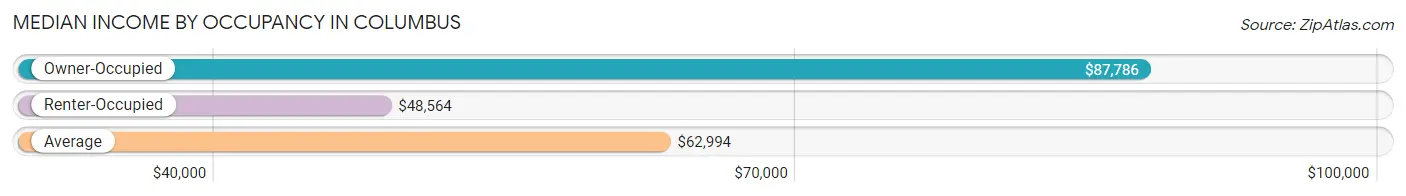
| Occupancy Type | # Households | Median Income |
| Owner-Occupied | 170,936 (44.7%) | $87,786 |
| Renter-Occupied | 211,204 (55.3%) | $48,564 |
| Average | 382,140 (100.0%) | $62,994 |
Occupancy by Householder Income Bracket in Columbus
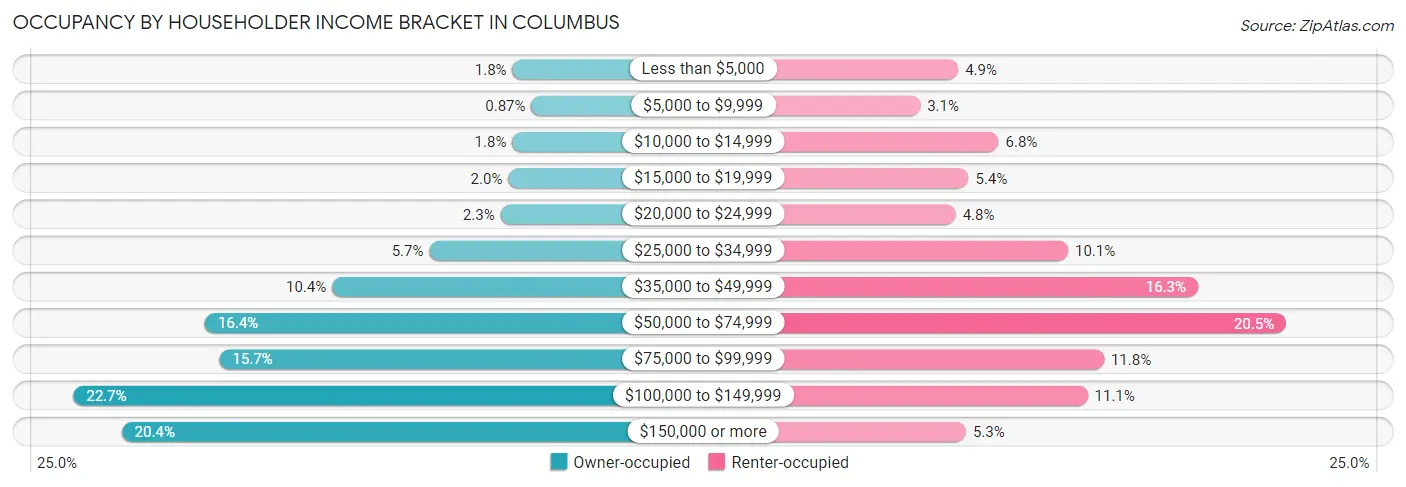
| Income Bracket | Owner-occupied | Renter-occupied |
| Less than $5,000 | 3,025 (1.8%) | 10,332 (4.9%) |
| $5,000 to $9,999 | 1,491 (0.9%) | 6,514 (3.1%) |
| $10,000 to $14,999 | 3,037 (1.8%) | 14,376 (6.8%) |
| $15,000 to $19,999 | 3,362 (2.0%) | 11,371 (5.4%) |
| $20,000 to $24,999 | 4,005 (2.3%) | 10,080 (4.8%) |
| $25,000 to $34,999 | 9,789 (5.7%) | 21,379 (10.1%) |
| $35,000 to $49,999 | 17,708 (10.4%) | 34,436 (16.3%) |
| $50,000 to $74,999 | 28,046 (16.4%) | 43,295 (20.5%) |
| $75,000 to $99,999 | 26,872 (15.7%) | 24,987 (11.8%) |
| $100,000 to $149,999 | 38,766 (22.7%) | 23,334 (11.1%) |
| $150,000 or more | 34,835 (20.4%) | 11,100 (5.3%) |
| Total | 170,936 (100.0%) | 211,204 (100.0%) |
Monthly Housing Cost Tiers in Columbus
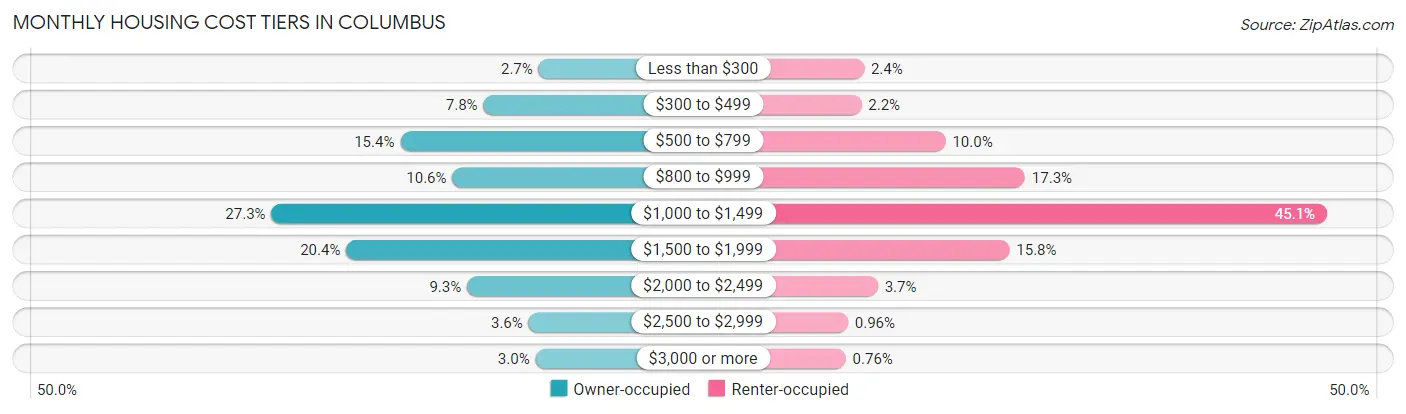
| Monthly Cost | Owner-occupied | Renter-occupied |
| Less than $300 | 4,579 (2.7%) | 5,146 (2.4%) |
| $300 to $499 | 13,269 (7.8%) | 4,644 (2.2%) |
| $500 to $799 | 26,358 (15.4%) | 21,019 (10.0%) |
| $800 to $999 | 18,160 (10.6%) | 36,444 (17.3%) |
| $1,000 to $1,499 | 46,639 (27.3%) | 95,164 (45.1%) |
| $1,500 to $1,999 | 34,854 (20.4%) | 33,428 (15.8%) |
| $2,000 to $2,499 | 15,854 (9.3%) | 7,835 (3.7%) |
| $2,500 to $2,999 | 6,151 (3.6%) | 2,023 (1.0%) |
| $3,000 or more | 5,072 (3.0%) | 1,599 (0.8%) |
| Total | 170,936 (100.0%) | 211,204 (100.0%) |
Physical Housing Characteristics in Columbus
Housing Structures in Columbus
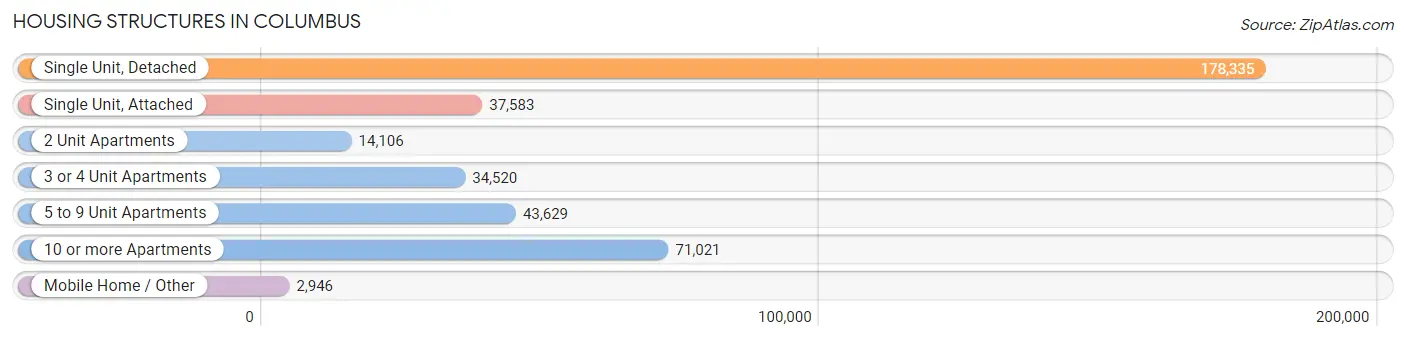
| Structure Type | # Housing Units | % Housing Units |
| Single Unit, Detached | 178,335 | 46.7% |
| Single Unit, Attached | 37,583 | 9.8% |
| 2 Unit Apartments | 14,106 | 3.7% |
| 3 or 4 Unit Apartments | 34,520 | 9.0% |
| 5 to 9 Unit Apartments | 43,629 | 11.4% |
| 10 or more Apartments | 71,021 | 18.6% |
| Mobile Home / Other | 2,946 | 0.8% |
| Total | 382,140 | 100.0% |
Housing Structures by Occupancy in Columbus
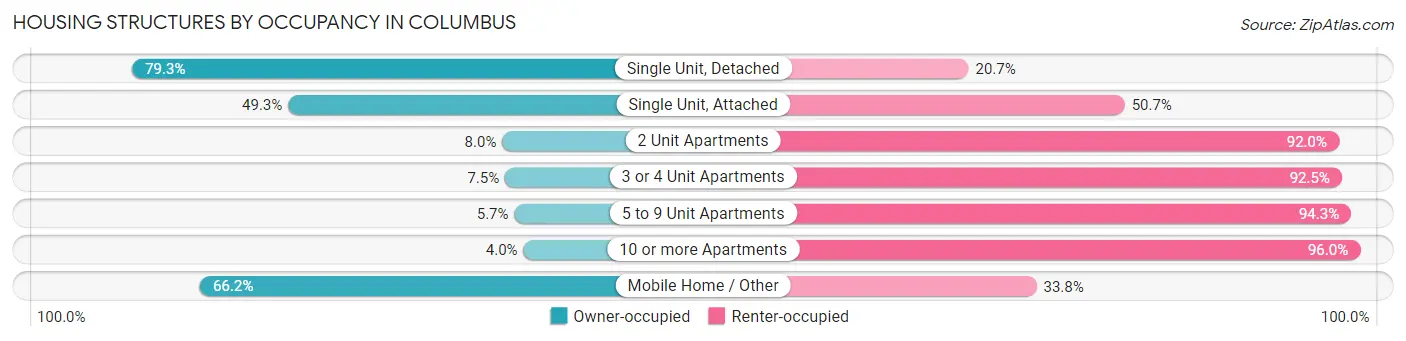
| Structure Type | Owner-occupied | Renter-occupied |
| Single Unit, Detached | 141,453 (79.3%) | 36,882 (20.7%) |
| Single Unit, Attached | 18,515 (49.3%) | 19,068 (50.7%) |
| 2 Unit Apartments | 1,134 (8.0%) | 12,972 (92.0%) |
| 3 or 4 Unit Apartments | 2,587 (7.5%) | 31,933 (92.5%) |
| 5 to 9 Unit Apartments | 2,486 (5.7%) | 41,143 (94.3%) |
| 10 or more Apartments | 2,810 (4.0%) | 68,211 (96.0%) |
| Mobile Home / Other | 1,951 (66.2%) | 995 (33.8%) |
| Total | 170,936 (44.7%) | 211,204 (55.3%) |
Housing Structures by Number of Rooms in Columbus
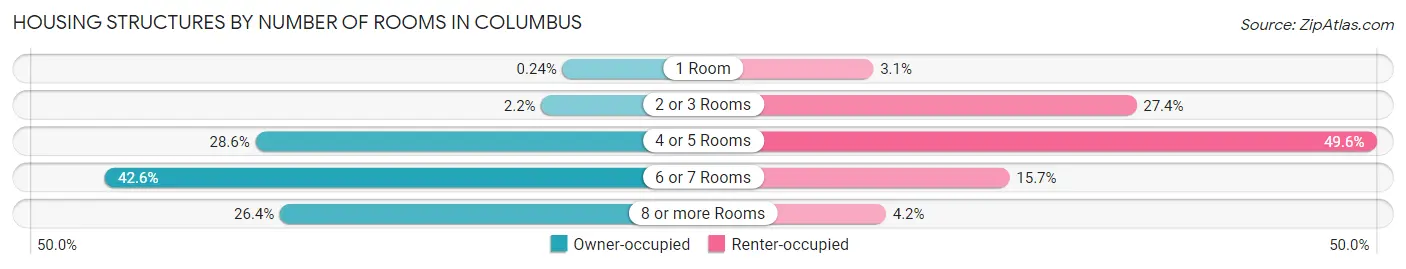
| Number of Rooms | Owner-occupied | Renter-occupied |
| 1 Room | 414 (0.2%) | 6,508 (3.1%) |
| 2 or 3 Rooms | 3,757 (2.2%) | 57,882 (27.4%) |
| 4 or 5 Rooms | 48,960 (28.6%) | 104,758 (49.6%) |
| 6 or 7 Rooms | 72,730 (42.5%) | 33,098 (15.7%) |
| 8 or more Rooms | 45,075 (26.4%) | 8,958 (4.2%) |
| Total | 170,936 (100.0%) | 211,204 (100.0%) |
Housing Structure by Heating Type in Columbus
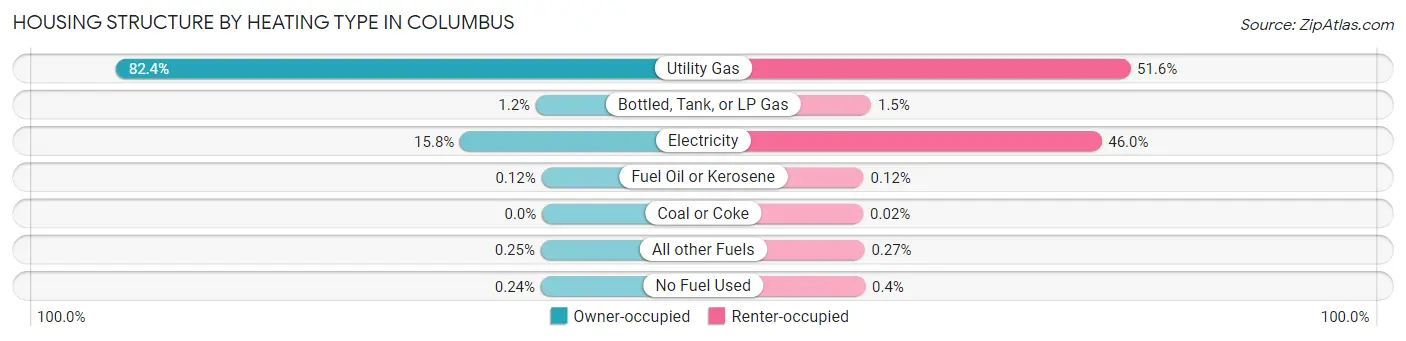
| Heating Type | Owner-occupied | Renter-occupied |
| Utility Gas | 140,802 (82.4%) | 108,986 (51.6%) |
| Bottled, Tank, or LP Gas | 2,032 (1.2%) | 3,260 (1.5%) |
| Electricity | 27,052 (15.8%) | 97,236 (46.0%) |
| Fuel Oil or Kerosene | 208 (0.1%) | 262 (0.1%) |
| Coal or Coke | 5 (0.0%) | 47 (0.0%) |
| All other Fuels | 419 (0.3%) | 562 (0.3%) |
| No Fuel Used | 418 (0.2%) | 851 (0.4%) |
| Total | 170,936 (100.0%) | 211,204 (100.0%) |
Household Vehicle Usage in Columbus
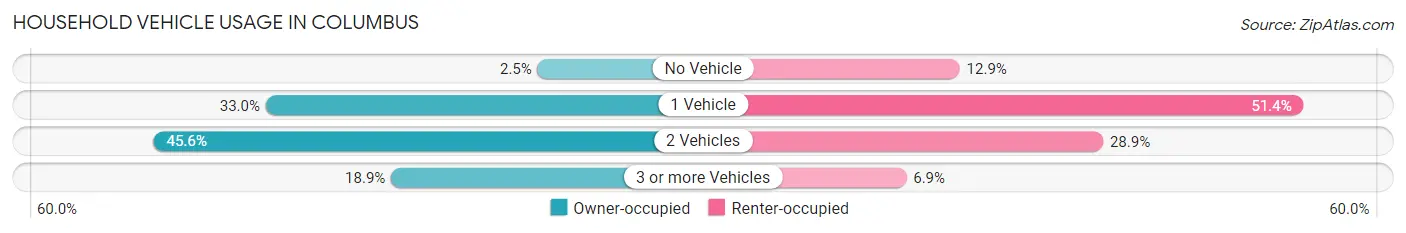
| Vehicles per Household | Owner-occupied | Renter-occupied |
| No Vehicle | 4,322 (2.5%) | 27,136 (12.9%) |
| 1 Vehicle | 56,379 (33.0%) | 108,497 (51.4%) |
| 2 Vehicles | 77,855 (45.6%) | 61,068 (28.9%) |
| 3 or more Vehicles | 32,380 (18.9%) | 14,503 (6.9%) |
| Total | 170,936 (100.0%) | 211,204 (100.0%) |
Real Estate & Mortgages in Columbus
Real Estate and Mortgage Overview in Columbus
| Characteristic | Without Mortgage | With Mortgage |
| Housing Units | 50,231 | 120,705 |
| Median Property Value | $186,000 | $221,200 |
| Median Household Income | $63,175 | $27,770 |
| Monthly Housing Costs | $597 | $4,753 |
| Real Estate Taxes | $2,734 | $2,350 |
Property Value by Mortgage Status in Columbus
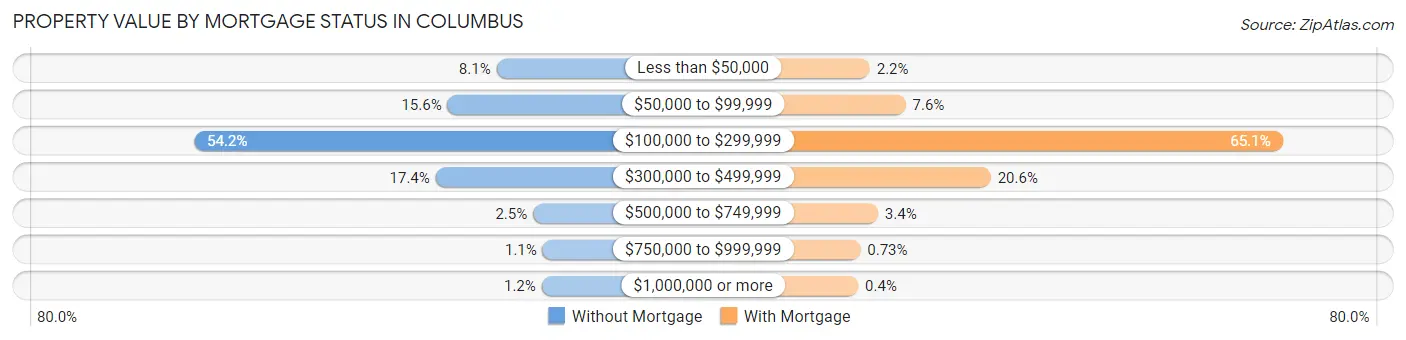
| Property Value | Without Mortgage | With Mortgage |
| Less than $50,000 | 4,064 (8.1%) | 2,615 (2.2%) |
| $50,000 to $99,999 | 7,816 (15.6%) | 9,207 (7.6%) |
| $100,000 to $299,999 | 27,210 (54.2%) | 78,531 (65.1%) |
| $300,000 to $499,999 | 8,727 (17.4%) | 24,869 (20.6%) |
| $500,000 to $749,999 | 1,268 (2.5%) | 4,111 (3.4%) |
| $750,000 to $999,999 | 531 (1.1%) | 886 (0.7%) |
| $1,000,000 or more | 615 (1.2%) | 486 (0.4%) |
| Total | 50,231 (100.0%) | 120,705 (100.0%) |
Household Income by Mortgage Status in Columbus
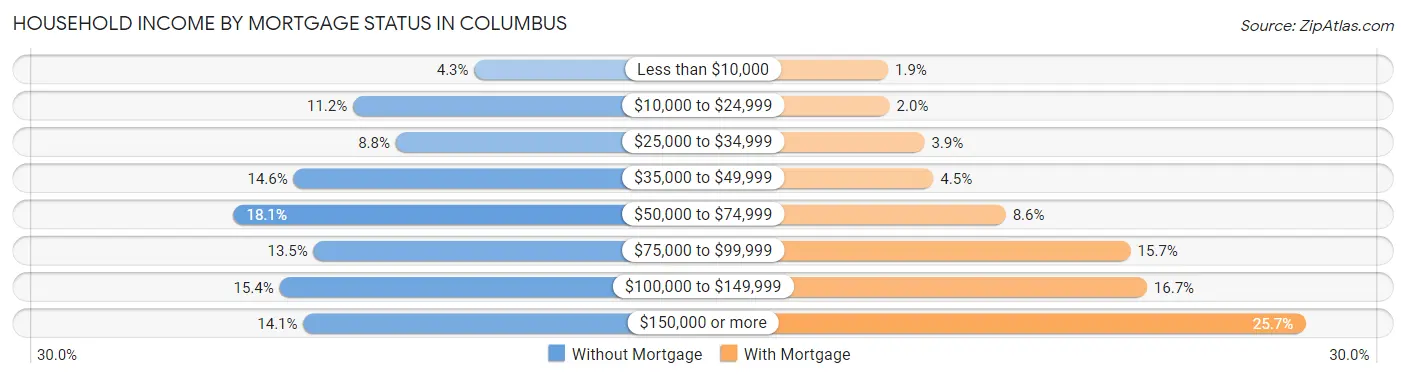
| Household Income | Without Mortgage | With Mortgage |
| Less than $10,000 | 2,160 (4.3%) | 2,242 (1.9%) |
| $10,000 to $24,999 | 5,643 (11.2%) | 2,356 (1.9%) |
| $25,000 to $34,999 | 4,417 (8.8%) | 4,761 (3.9%) |
| $35,000 to $49,999 | 7,347 (14.6%) | 5,372 (4.4%) |
| $50,000 to $74,999 | 9,072 (18.1%) | 10,361 (8.6%) |
| $75,000 to $99,999 | 6,774 (13.5%) | 18,974 (15.7%) |
| $100,000 to $149,999 | 7,753 (15.4%) | 20,098 (16.7%) |
| $150,000 or more | 7,065 (14.1%) | 31,013 (25.7%) |
| Total | 50,231 (100.0%) | 120,705 (100.0%) |
Property Value to Household Income Ratio in Columbus
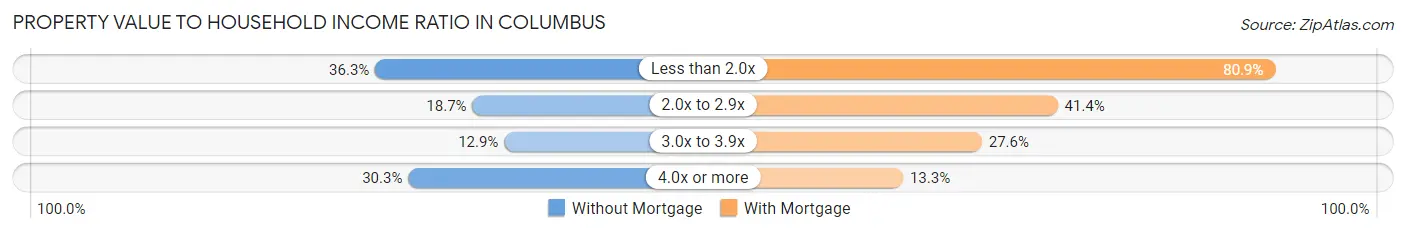
| Value-to-Income Ratio | Without Mortgage | With Mortgage |
| Less than 2.0x | 18,254 (36.3%) | 97,642 (80.9%) |
| 2.0x to 2.9x | 9,377 (18.7%) | 49,910 (41.3%) |
| 3.0x to 3.9x | 6,481 (12.9%) | 33,290 (27.6%) |
| 4.0x or more | 15,233 (30.3%) | 16,019 (13.3%) |
| Total | 50,231 (100.0%) | 120,705 (100.0%) |
Real Estate Taxes by Mortgage Status in Columbus
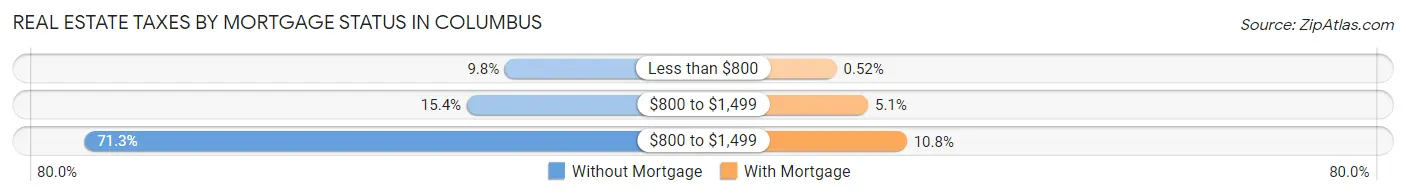
| Property Taxes | Without Mortgage | With Mortgage |
| Less than $800 | 4,924 (9.8%) | 628 (0.5%) |
| $800 to $1,499 | 7,719 (15.4%) | 6,186 (5.1%) |
| $800 to $1,499 | 35,805 (71.3%) | 13,001 (10.8%) |
| Total | 50,231 (100.0%) | 120,705 (100.0%) |
Health & Disability in Columbus
Health Insurance Coverage by Age in Columbus
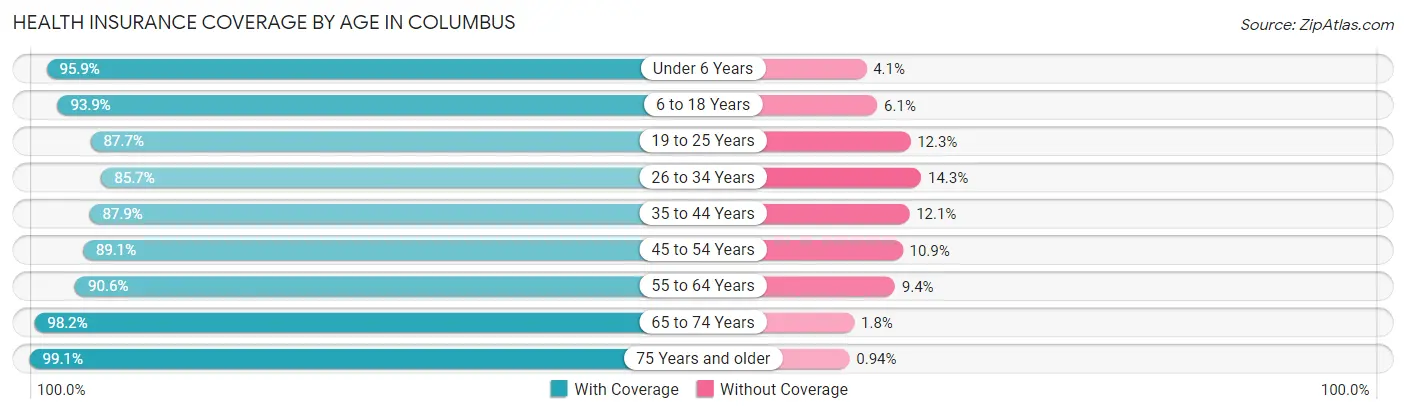
| Age Bracket | With Coverage | Without Coverage |
| Under 6 Years | 69,017 (95.9%) | 2,938 (4.1%) |
| 6 to 18 Years | 130,985 (93.9%) | 8,548 (6.1%) |
| 19 to 25 Years | 97,584 (87.7%) | 13,672 (12.3%) |
| 26 to 34 Years | 140,737 (85.7%) | 23,524 (14.3%) |
| 35 to 44 Years | 107,109 (87.9%) | 14,738 (12.1%) |
| 45 to 54 Years | 87,808 (89.1%) | 10,697 (10.9%) |
| 55 to 64 Years | 85,883 (90.6%) | 8,942 (9.4%) |
| 65 to 74 Years | 58,684 (98.2%) | 1,093 (1.8%) |
| 75 Years and older | 34,434 (99.1%) | 326 (0.9%) |
| Total | 812,241 (90.6%) | 84,478 (9.4%) |
Health Insurance Coverage by Citizenship Status in Columbus
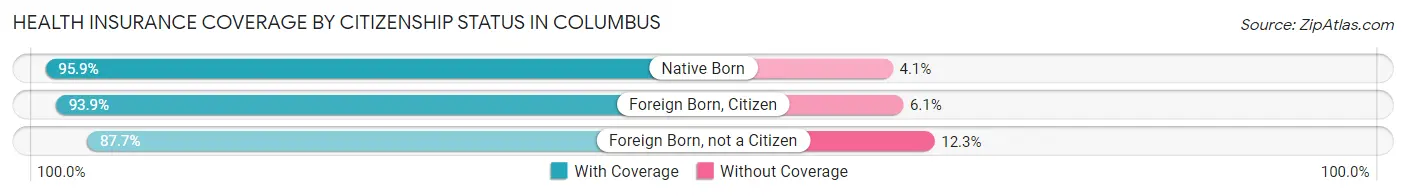
| Citizenship Status | With Coverage | Without Coverage |
| Native Born | 69,017 (95.9%) | 2,938 (4.1%) |
| Foreign Born, Citizen | 130,985 (93.9%) | 8,548 (6.1%) |
| Foreign Born, not a Citizen | 97,584 (87.7%) | 13,672 (12.3%) |
Health Insurance Coverage by Household Income in Columbus
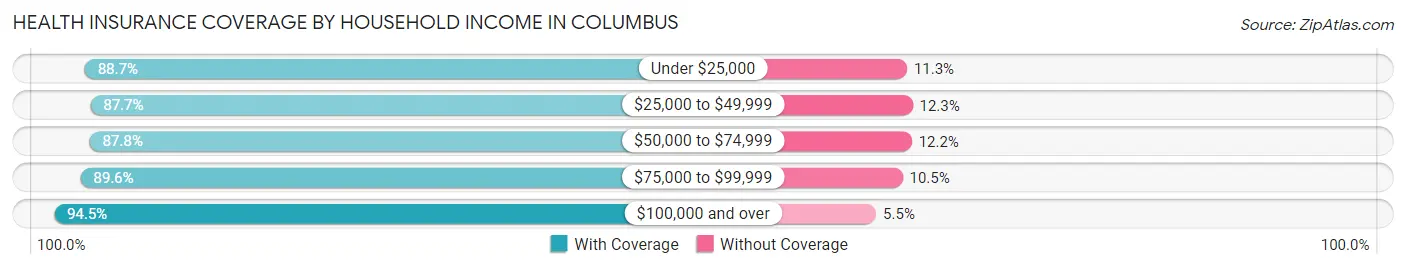
| Household Income | With Coverage | Without Coverage |
| Under $25,000 | 111,803 (88.7%) | 14,201 (11.3%) |
| $25,000 to $49,999 | 149,607 (87.7%) | 21,025 (12.3%) |
| $50,000 to $74,999 | 135,546 (87.8%) | 18,759 (12.2%) |
| $75,000 to $99,999 | 115,712 (89.5%) | 13,498 (10.4%) |
| $100,000 and over | 282,752 (94.5%) | 16,451 (5.5%) |
Public vs Private Health Insurance Coverage by Age in Columbus
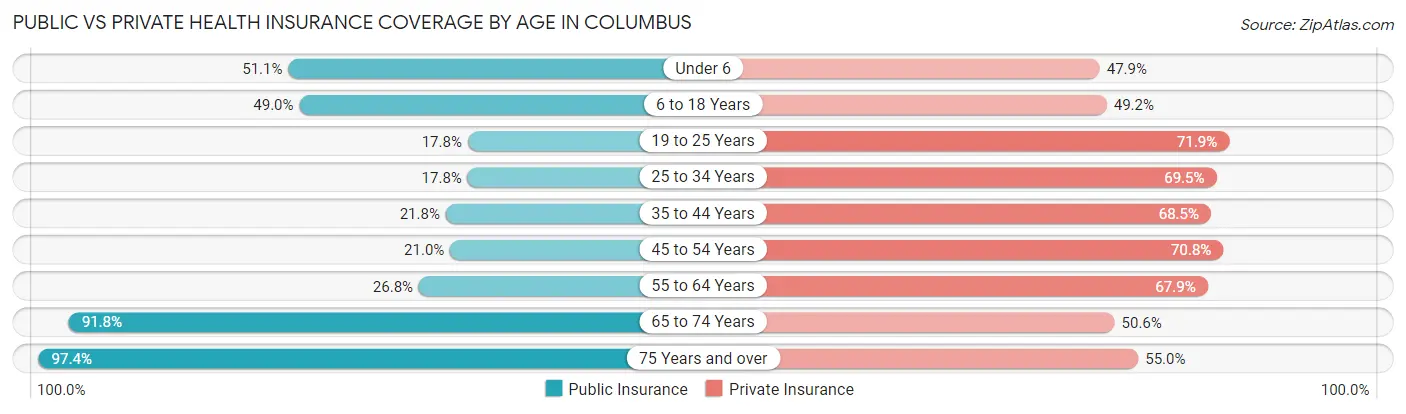
| Age Bracket | Public Insurance | Private Insurance |
| Under 6 | 36,736 (51.0%) | 34,459 (47.9%) |
| 6 to 18 Years | 68,365 (49.0%) | 68,636 (49.2%) |
| 19 to 25 Years | 19,749 (17.7%) | 79,975 (71.9%) |
| 25 to 34 Years | 29,165 (17.8%) | 114,180 (69.5%) |
| 35 to 44 Years | 26,599 (21.8%) | 83,440 (68.5%) |
| 45 to 54 Years | 20,692 (21.0%) | 69,726 (70.8%) |
| 55 to 64 Years | 25,421 (26.8%) | 64,354 (67.9%) |
| 65 to 74 Years | 54,872 (91.8%) | 30,271 (50.6%) |
| 75 Years and over | 33,851 (97.4%) | 19,130 (55.0%) |
| Total | 315,450 (35.2%) | 564,171 (62.9%) |
Disability Status by Sex by Age in Columbus
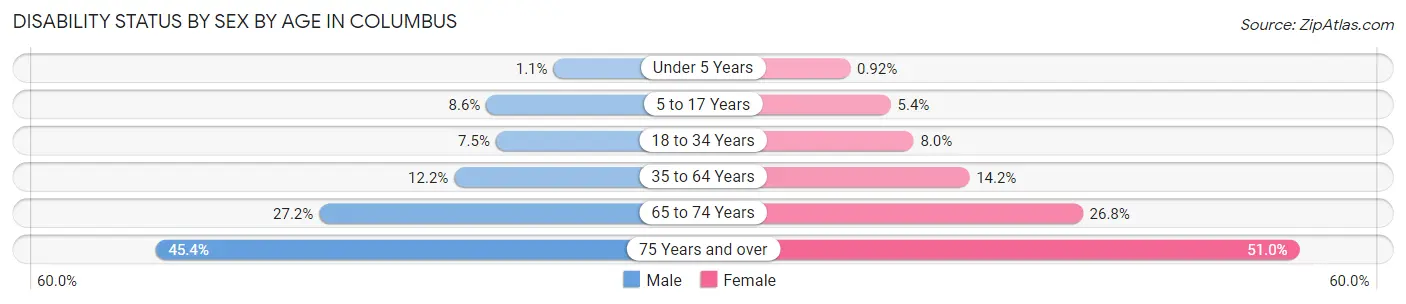
| Age Bracket | Male | Female |
| Under 5 Years | 347 (1.1%) | 278 (0.9%) |
| 5 to 17 Years | 5,921 (8.6%) | 3,687 (5.4%) |
| 18 to 34 Years | 10,785 (7.5%) | 11,645 (8.0%) |
| 35 to 64 Years | 19,147 (12.2%) | 22,378 (14.2%) |
| 65 to 74 Years | 7,326 (27.2%) | 8,809 (26.8%) |
| 75 Years and over | 5,886 (45.4%) | 11,109 (51.0%) |
Disability Class by Sex by Age in Columbus
Disability Class: Hearing Difficulty
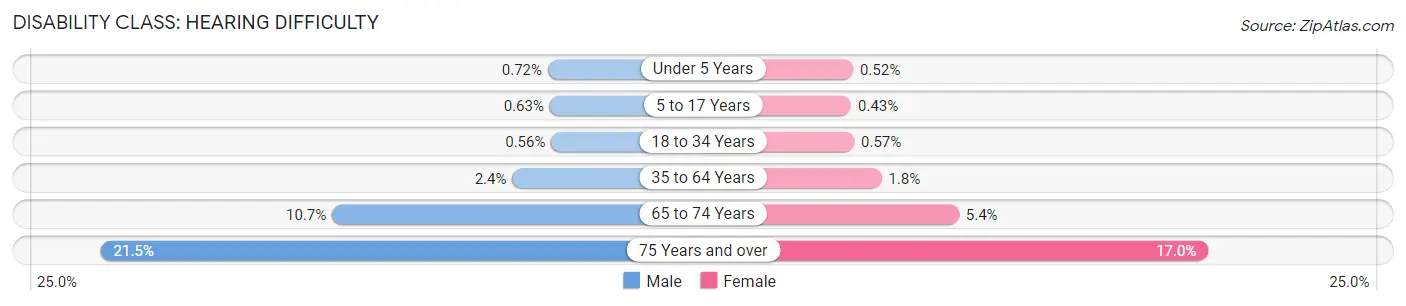
| Age Bracket | Male | Female |
| Under 5 Years | 223 (0.7%) | 157 (0.5%) |
| 5 to 17 Years | 432 (0.6%) | 292 (0.4%) |
| 18 to 34 Years | 797 (0.6%) | 838 (0.6%) |
| 35 to 64 Years | 3,728 (2.4%) | 2,901 (1.8%) |
| 65 to 74 Years | 2,891 (10.7%) | 1,785 (5.4%) |
| 75 Years and over | 2,783 (21.5%) | 3,705 (17.0%) |
Disability Class: Vision Difficulty
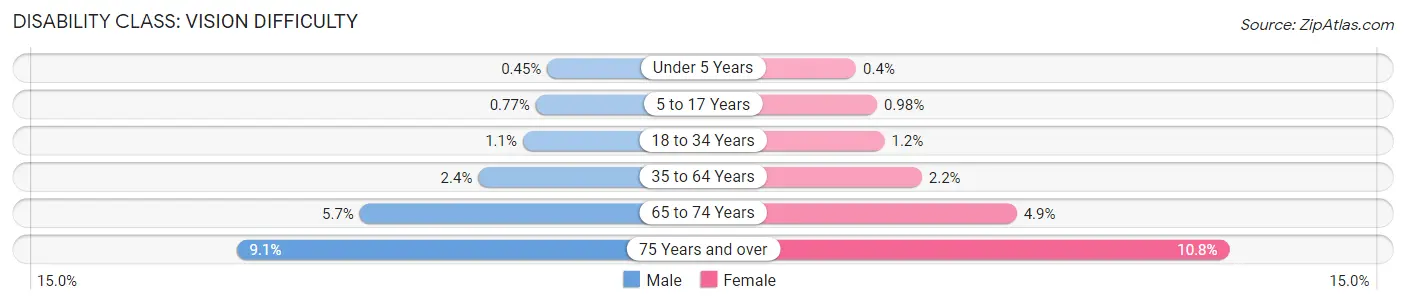
| Age Bracket | Male | Female |
| Under 5 Years | 141 (0.4%) | 121 (0.4%) |
| 5 to 17 Years | 532 (0.8%) | 661 (1.0%) |
| 18 to 34 Years | 1,618 (1.1%) | 1,730 (1.2%) |
| 35 to 64 Years | 3,737 (2.4%) | 3,516 (2.2%) |
| 65 to 74 Years | 1,528 (5.7%) | 1,598 (4.9%) |
| 75 Years and over | 1,179 (9.1%) | 2,353 (10.8%) |
Disability Class: Cognitive Difficulty
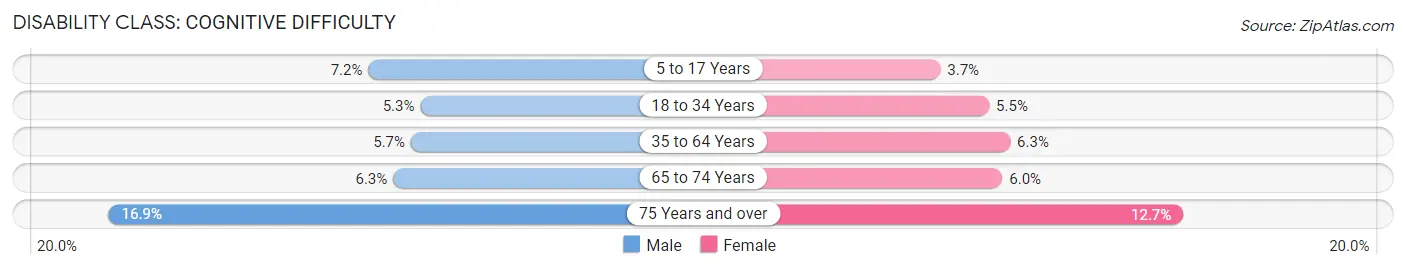
| Age Bracket | Male | Female |
| 5 to 17 Years | 4,988 (7.2%) | 2,477 (3.7%) |
| 18 to 34 Years | 7,603 (5.3%) | 7,984 (5.5%) |
| 35 to 64 Years | 8,918 (5.7%) | 9,854 (6.2%) |
| 65 to 74 Years | 1,703 (6.3%) | 1,958 (6.0%) |
| 75 Years and over | 2,187 (16.9%) | 2,761 (12.7%) |
Disability Class: Ambulatory Difficulty
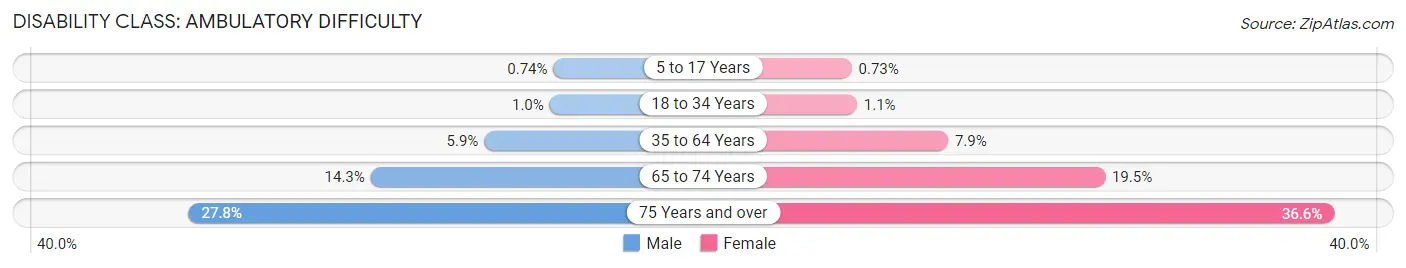
| Age Bracket | Male | Female |
| 5 to 17 Years | 510 (0.7%) | 492 (0.7%) |
| 18 to 34 Years | 1,460 (1.0%) | 1,633 (1.1%) |
| 35 to 64 Years | 9,254 (5.9%) | 12,424 (7.9%) |
| 65 to 74 Years | 3,854 (14.3%) | 6,418 (19.5%) |
| 75 Years and over | 3,606 (27.8%) | 7,968 (36.5%) |
Disability Class: Self-Care Difficulty
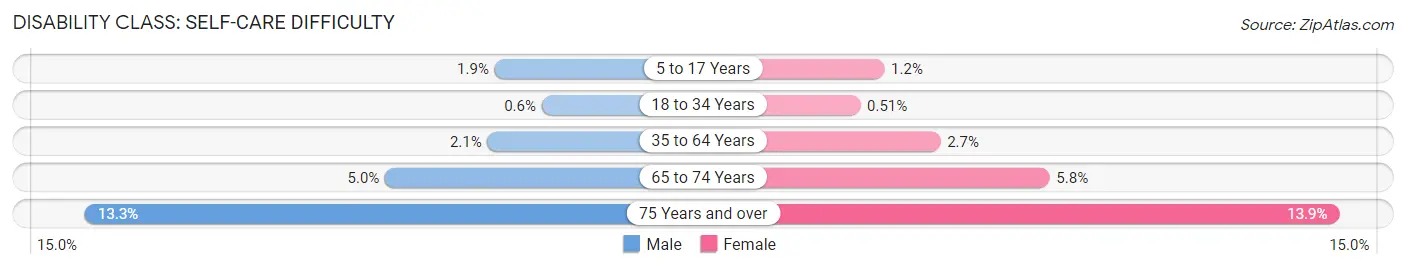
| Age Bracket | Male | Female |
| 5 to 17 Years | 1,319 (1.9%) | 801 (1.2%) |
| 18 to 34 Years | 866 (0.6%) | 743 (0.5%) |
| 35 to 64 Years | 3,315 (2.1%) | 4,322 (2.7%) |
| 65 to 74 Years | 1,335 (5.0%) | 1,898 (5.8%) |
| 75 Years and over | 1,726 (13.3%) | 3,020 (13.9%) |
Technology Access in Columbus
Computing Device Access in Columbus
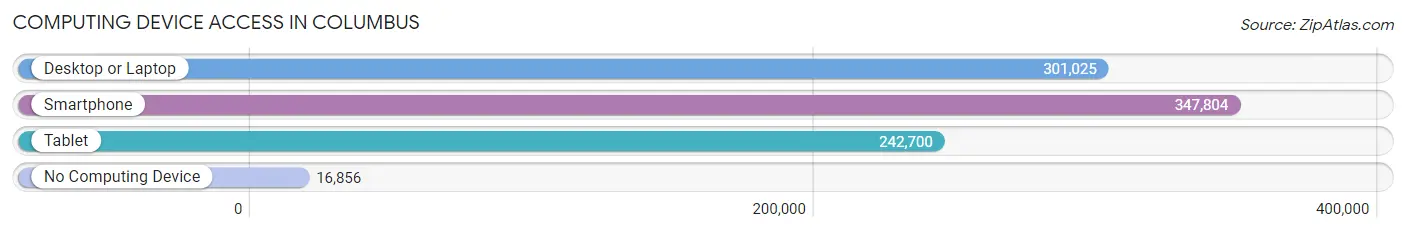
| Device Type | # Households | % Households |
| Desktop or Laptop | 301,025 | 78.8% |
| Smartphone | 347,804 | 91.0% |
| Tablet | 242,700 | 63.5% |
| No Computing Device | 16,856 | 4.4% |
| Total | 382,140 | 100.0% |
Internet Access in Columbus
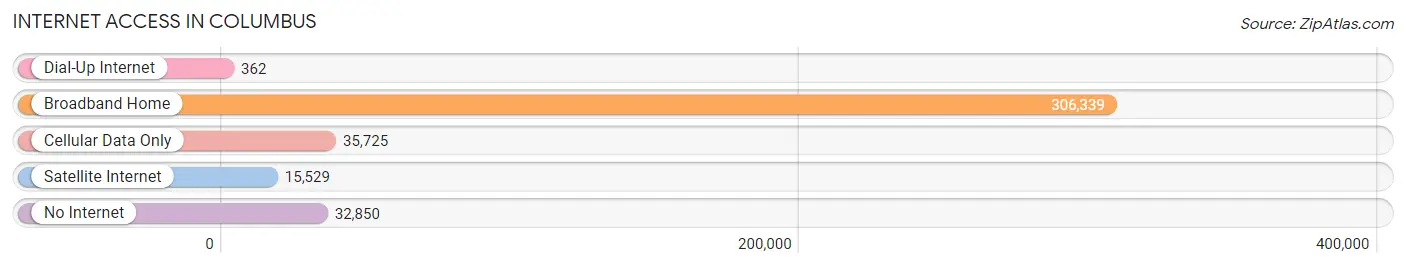
| Internet Type | # Households | % Households |
| Dial-Up Internet | 362 | 0.1% |
| Broadband Home | 306,339 | 80.2% |
| Cellular Data Only | 35,725 | 9.3% |
| Satellite Internet | 15,529 | 4.1% |
| No Internet | 32,850 | 8.6% |
| Total | 382,140 | 100.0% |
Columbus Summary
Columbus, Ohio is the capital of the state of Ohio and the most populous city in the state. It is located in the center of the state, along the Scioto River. The city has a population of 879,170 as of 2019, making it the 14th most populous city in the United States.
History
The area that is now Columbus was first settled by Native Americans in the late 17th century. The first European settlers arrived in the area in 1797, led by Christopher Columbus. The city was founded in 1812 and named after the explorer.
In the 19th century, Columbus became an important industrial center, with the construction of the Ohio and Erie Canal and the National Road. The city also became a major transportation hub, with the completion of the Columbus and Xenia Railroad in 1851.
In the 20th century, Columbus experienced a period of rapid growth, becoming the largest city in Ohio by 1950. The city has continued to grow since then, becoming a major center for business, education, and culture.
Geography
Columbus is located in the center of the state of Ohio, along the Scioto River. The city is situated in the Appalachian Plateau region, with rolling hills and valleys. The city is located at an elevation of 797 feet above sea level.
The city has a total area of 217.2 square miles, of which 214.5 square miles is land and 2.7 square miles is water. The city is divided into four quadrants: North, South, East, and West.
Economy
Columbus is a major economic center in the Midwest. The city is home to several Fortune 500 companies, including Nationwide Insurance, American Electric Power, and Cardinal Health. The city is also home to several major universities, including Ohio State University, which is the largest university in the state.
The city's economy is also driven by the service industry, with a large number of restaurants, hotels, and other businesses. The city is also home to several major sports teams, including the Columbus Blue Jackets of the National Hockey League and the Columbus Crew of Major League Soccer.
Demographics
As of 2019, the population of Columbus was 879,170. The city has a population density of 4,068 people per square mile. The racial makeup of the city is 63.2% White, 28.2% African American, 3.3% Asian, and 5.3% other.
The median household income in Columbus is $50,867, and the median age is 33. The city has a poverty rate of 22.3%, and the unemployment rate is 4.2%.
Conclusion
Columbus, Ohio is the capital of the state of Ohio and the most populous city in the state. It is located in the center of the state, along the Scioto River. The city has a population of 879,170 as of 2019, making it the 14th most populous city in the United States. Columbus is a major economic center in the Midwest, with several Fortune 500 companies and major universities. The city also has a diverse population, with a median household income of $50,867 and a poverty rate of 22.3%.
Common Questions
What is Per Capita Income in Columbus?
Per Capita income in Columbus is $35,640.
What is the Median Family Income in Columbus?
Median Family Income in Columbus is $77,105.
What is the Median Household income in Columbus?
Median Household Income in Columbus is $62,994.
What is Income or Wage Gap in Columbus?
Income or Wage Gap in Columbus is 19.0%.
Women in Columbus earn 81.0 cents for every dollar earned by a man.
What is Family Income Deficit in Columbus?
Family Income Deficit in Columbus is $11,507.
Families that are below poverty line in Columbus earn $11,507 less on average than the poverty threshold level.
What is Inequality or Gini Index in Columbus?
Inequality or Gini Index in Columbus is 0.44.
What is the Total Population of Columbus?
Total Population of Columbus is 902,449.
What is the Total Male Population of Columbus?
Total Male Population of Columbus is 443,734.
What is the Total Female Population of Columbus?
Total Female Population of Columbus is 458,715.
What is the Ratio of Males per 100 Females in Columbus?
There are 96.73 Males per 100 Females in Columbus.
What is the Ratio of Females per 100 Males in Columbus?
There are 103.38 Females per 100 Males in Columbus.
What is the Median Population Age in Columbus?
Median Population Age in Columbus is 32.7 Years.
What is the Average Family Size in Columbus
Average Family Size in Columbus is 3.1 People.
What is the Average Household Size in Columbus
Average Household Size in Columbus is 2.3 People.
How Large is the Labor Force in Columbus?
There are 510,323 People in the Labor Forcein in Columbus.
What is the Percentage of People in the Labor Force in Columbus?
70.5% of People are in the Labor Force in Columbus.
What is the Unemployment Rate in Columbus?
Unemployment Rate in Columbus is 5.2%.