Tucson, AZ Map & Demographics
Tucson Map
Tucson Overview
$29,009
PER CAPITA INCOME
$66,855
AVG FAMILY INCOME
$52,049
AVG HOUSEHOLD INCOME
16.3%
WAGE / INCOME GAP [ % ]
83.7¢/ $1
WAGE / INCOME GAP [ $ ]
$11,584
FAMILY INCOME DEFICIT
0.45
INEQUALITY / GINI INDEX
541,033
TOTAL POPULATION
268,922
MALE POPULATION
272,111
FEMALE POPULATION
98.83
MALES / 100 FEMALES
101.19
FEMALES / 100 MALES
33.9
MEDIAN AGE
3.1
AVG FAMILY SIZE
2.3
AVG HOUSEHOLD SIZE
274,746
LABOR FORCE [ PEOPLE ]
62.0%
PERCENT IN LABOR FORCE
6.5%
UNEMPLOYMENT RATE
Tucson Zip Codes
Income in Tucson
Income Overview in Tucson
Per Capita Income in Tucson is $29,009, while median incomes of families and households are $66,855 and $52,049 respectively.
| Characteristic | Number | Measure |
| Per Capita Income | 541,033 | $29,009 |
| Median Family Income | 119,729 | $66,855 |
| Mean Family Income | 119,729 | $83,873 |
| Median Household Income | 220,769 | $52,049 |
| Mean Household Income | 220,769 | $69,553 |
| Income Deficit | 119,729 | $11,584 |
| Wage / Income Gap (%) | 541,033 | 16.30% |
| Wage / Income Gap ($) | 541,033 | 83.70¢ per $1 |
| Gini / Inequality Index | 541,033 | 0.45 |
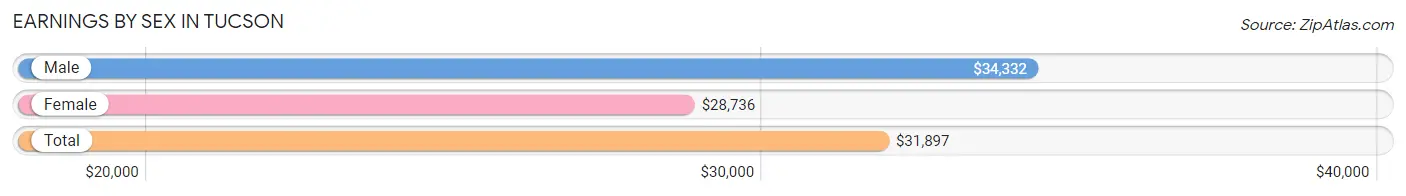
Earnings by Sex in Tucson
Average Earnings in Tucson are $31,897, $34,332 for men and $28,736 for women, a difference of 16.3%.
| Sex | Number | Average Earnings |
| Male | 151,562 (52.4%) | $34,332 |
| Female | 137,481 (47.6%) | $28,736 |
| Total | 289,043 (100.0%) | $31,897 |
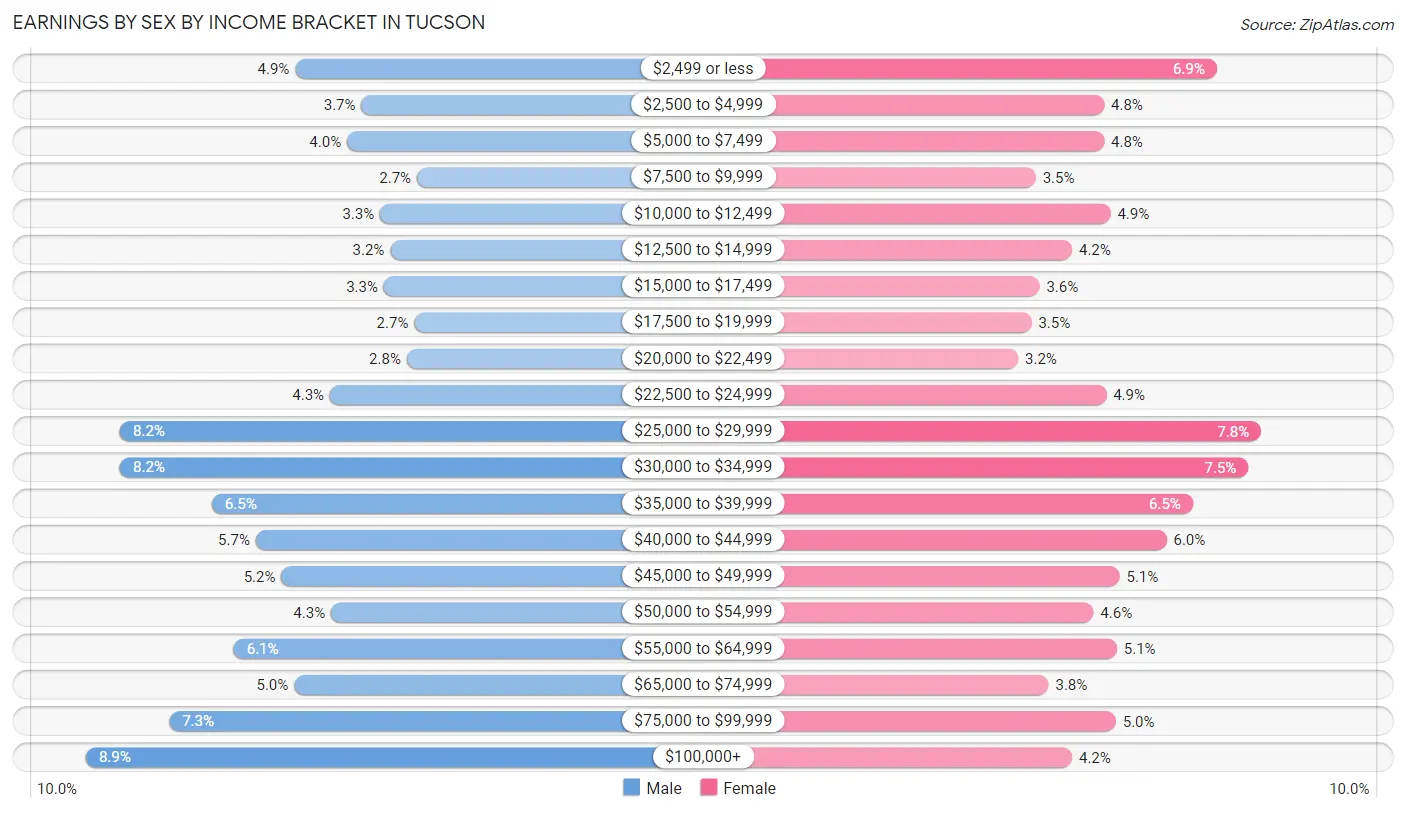
Earnings by Sex by Income Bracket in Tucson
The most common earnings brackets in Tucson are $100,000+ for men (13,416 | 8.8%) and $25,000 to $29,999 for women (10,663 | 7.8%).
| Income | Male | Female |
| $2,499 or less | 7,479 (4.9%) | 9,527 (6.9%) |
| $2,500 to $4,999 | 5,596 (3.7%) | 6,628 (4.8%) |
| $5,000 to $7,499 | 5,999 (4.0%) | 6,633 (4.8%) |
| $7,500 to $9,999 | 4,013 (2.6%) | 4,873 (3.5%) |
| $10,000 to $12,499 | 5,065 (3.3%) | 6,794 (4.9%) |
| $12,500 to $14,999 | 4,769 (3.2%) | 5,803 (4.2%) |
| $15,000 to $17,499 | 4,955 (3.3%) | 4,958 (3.6%) |
| $17,500 to $19,999 | 4,090 (2.7%) | 4,760 (3.5%) |
| $20,000 to $22,499 | 4,299 (2.8%) | 4,409 (3.2%) |
| $22,500 to $24,999 | 6,483 (4.3%) | 6,688 (4.9%) |
| $25,000 to $29,999 | 12,445 (8.2%) | 10,663 (7.8%) |
| $30,000 to $34,999 | 12,440 (8.2%) | 10,340 (7.5%) |
| $35,000 to $39,999 | 9,836 (6.5%) | 8,909 (6.5%) |
| $40,000 to $44,999 | 8,593 (5.7%) | 8,234 (6.0%) |
| $45,000 to $49,999 | 7,871 (5.2%) | 7,031 (5.1%) |
| $50,000 to $54,999 | 6,456 (4.3%) | 6,345 (4.6%) |
| $55,000 to $64,999 | 9,214 (6.1%) | 6,958 (5.1%) |
| $65,000 to $74,999 | 7,500 (5.0%) | 5,196 (3.8%) |
| $75,000 to $99,999 | 11,043 (7.3%) | 6,925 (5.0%) |
| $100,000+ | 13,416 (8.8%) | 5,807 (4.2%) |
| Total | 151,562 (100.0%) | 137,481 (100.0%) |
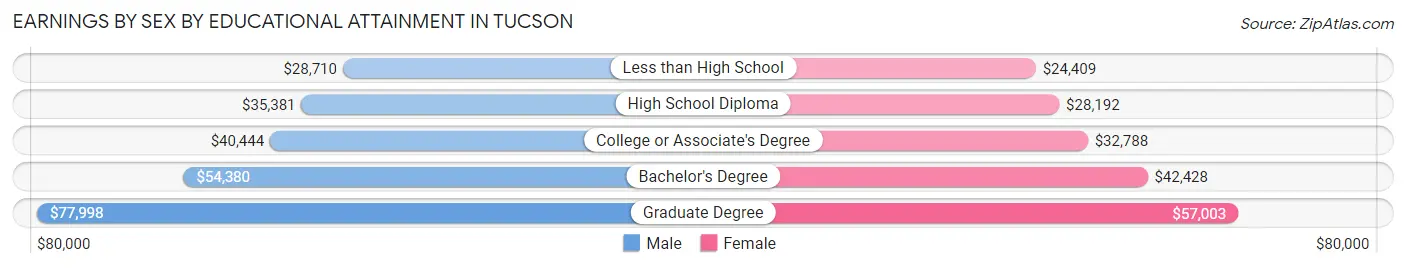
Earnings by Sex by Educational Attainment in Tucson
Average earnings in Tucson are $41,038 for men and $34,517 for women, a difference of 15.9%. Men with an educational attainment of graduate degree enjoy the highest average annual earnings of $77,998, while those with less than high school education earn the least with $28,710. Women with an educational attainment of graduate degree earn the most with the average annual earnings of $57,003, while those with less than high school education have the smallest earnings of $24,409.
| Educational Attainment | Male Income | Female Income |
| Less than High School | $28,710 | $24,409 |
| High School Diploma | $35,381 | $28,192 |
| College or Associate's Degree | $40,444 | $32,788 |
| Bachelor's Degree | $54,380 | $42,428 |
| Graduate Degree | $77,998 | $57,003 |
| Total | $41,038 | $34,517 |
Family Income in Tucson
Family Income Brackets in Tucson
According to the Tucson family income data, there are 22,749 families falling into the $50,000 to $74,999 income range, which is the most common income bracket and makes up 19.0% of all families. Conversely, the $10,000 to $14,999 income bracket is the least frequent group with only 3,592 families (3.0%) belonging to this category.
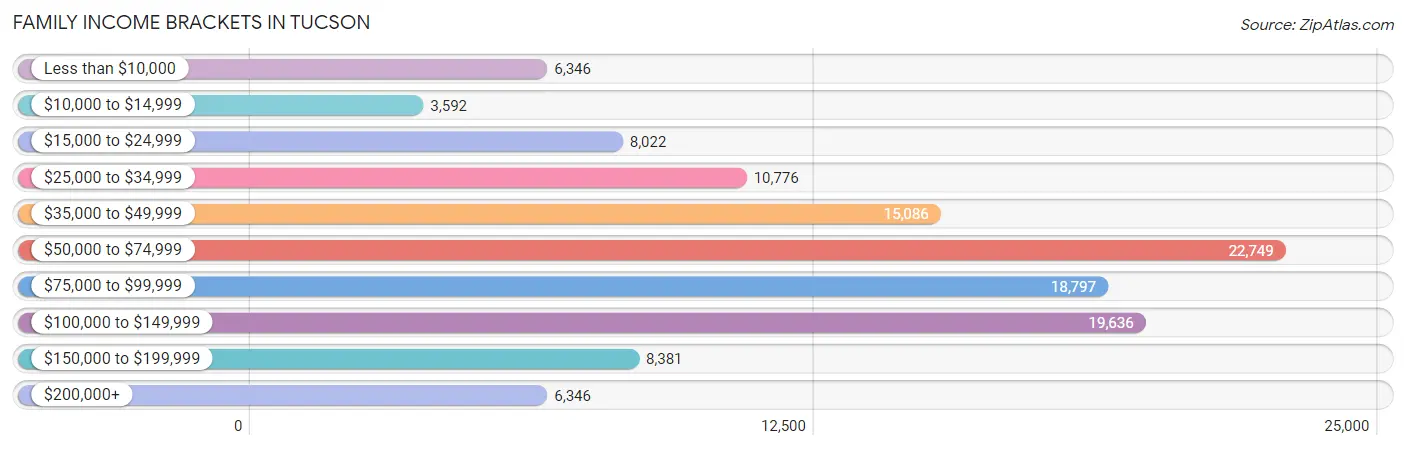
| Income Bracket | # Families | % Families |
| Less than $10,000 | 6,346 | 5.3% |
| $10,000 to $14,999 | 3,592 | 3.0% |
| $15,000 to $24,999 | 8,022 | 6.7% |
| $25,000 to $34,999 | 10,776 | 9.0% |
| $35,000 to $49,999 | 15,086 | 12.6% |
| $50,000 to $74,999 | 22,749 | 19.0% |
| $75,000 to $99,999 | 18,797 | 15.7% |
| $100,000 to $149,999 | 19,636 | 16.4% |
| $150,000 to $199,999 | 8,381 | 7.0% |
| $200,000+ | 6,346 | 5.3% |
Family Income by Famaliy Size in Tucson
6-person families (3,799 | 3.2%) account for the highest median family income in Tucson with $80,609 per family, while 2-person families (55,317 | 46.2%) have the highest median income of $30,948 per family member.
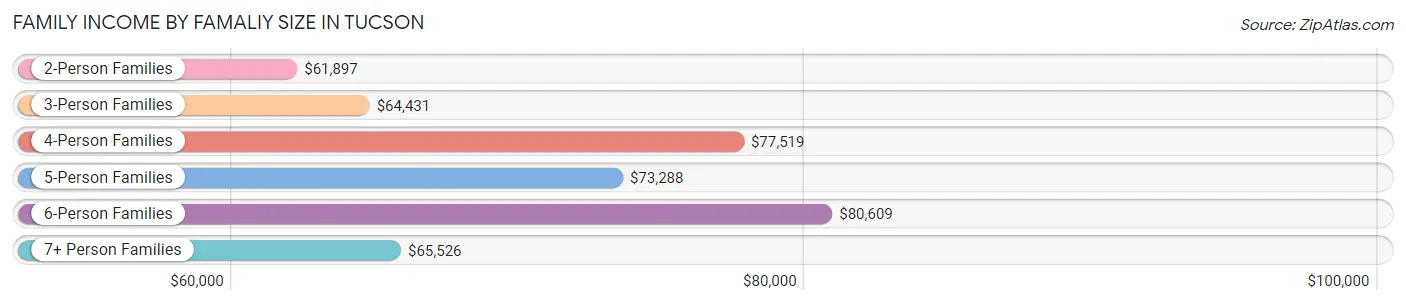
| Income Bracket | # Families | Median Income |
| 2-Person Families | 55,317 (46.2%) | $61,897 |
| 3-Person Families | 27,101 (22.6%) | $64,431 |
| 4-Person Families | 21,490 (17.9%) | $77,519 |
| 5-Person Families | 9,774 (8.2%) | $73,288 |
| 6-Person Families | 3,799 (3.2%) | $80,609 |
| 7+ Person Families | 2,248 (1.9%) | $65,526 |
| Total | 119,729 (100.0%) | $66,855 |
Family Income by Number of Earners in Tucson
The median family income in Tucson is $66,855, with families comprising 3+ earners (10,967) having the highest median family income of $115,017, while families with no earners (17,790) have the lowest median family income of $36,962, accounting for 9.2% and 14.9% of families, respectively.
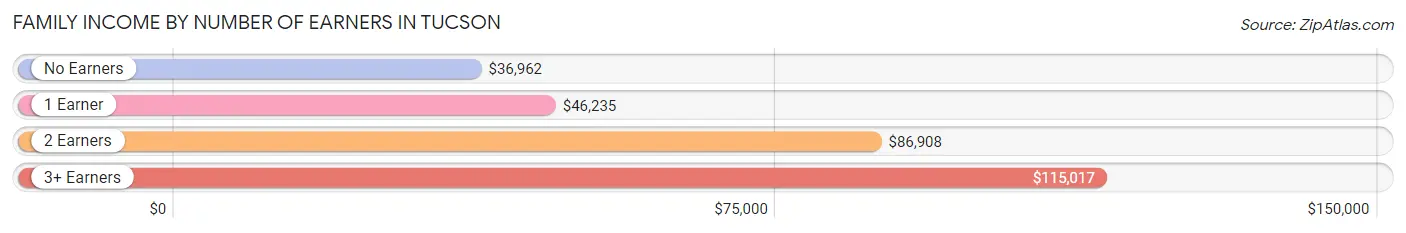
| Number of Earners | # Families | Median Income |
| No Earners | 17,790 (14.9%) | $36,962 |
| 1 Earner | 44,252 (37.0%) | $46,235 |
| 2 Earners | 46,720 (39.0%) | $86,908 |
| 3+ Earners | 10,967 (9.2%) | $115,017 |
| Total | 119,729 (100.0%) | $66,855 |
Household Income in Tucson
Household Income Brackets in Tucson
With 40,180 households falling in the category, the $50,000 to $74,999 income range is the most frequent in Tucson, accounting for 18.2% of all households. In contrast, only 8,168 households (3.7%) fall into the $200,000+ income bracket, making it the least populous group.
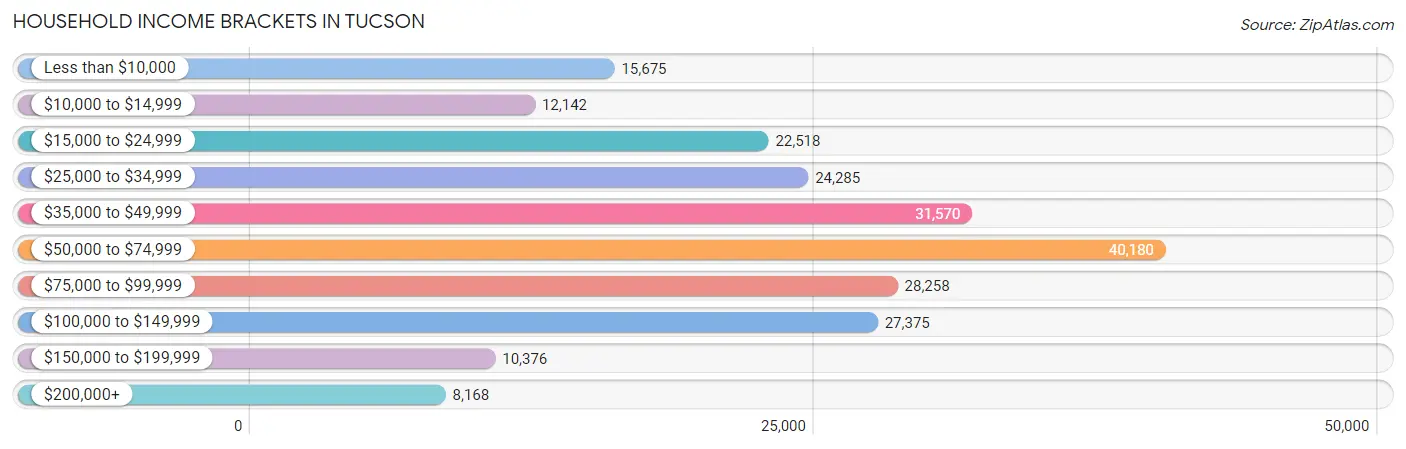
| Income Bracket | # Households | % Households |
| Less than $10,000 | 15,675 | 7.1% |
| $10,000 to $14,999 | 12,142 | 5.5% |
| $15,000 to $24,999 | 22,518 | 10.2% |
| $25,000 to $34,999 | 24,285 | 11.0% |
| $35,000 to $49,999 | 31,570 | 14.3% |
| $50,000 to $74,999 | 40,180 | 18.2% |
| $75,000 to $99,999 | 28,258 | 12.8% |
| $100,000 to $149,999 | 27,375 | 12.4% |
| $150,000 to $199,999 | 10,376 | 4.7% |
| $200,000+ | 8,168 | 3.7% |
Household Income by Householder Age in Tucson
The median household income in Tucson is $52,049, with the highest median household income of $62,264 found in the 45 to 64 years age bracket for the primary householder. A total of 67,181 households (30.4%) fall into this category. Meanwhile, the 15 to 24 years age bracket for the primary householder has the lowest median household income of $33,337, with 23,334 households (10.6%) in this group.
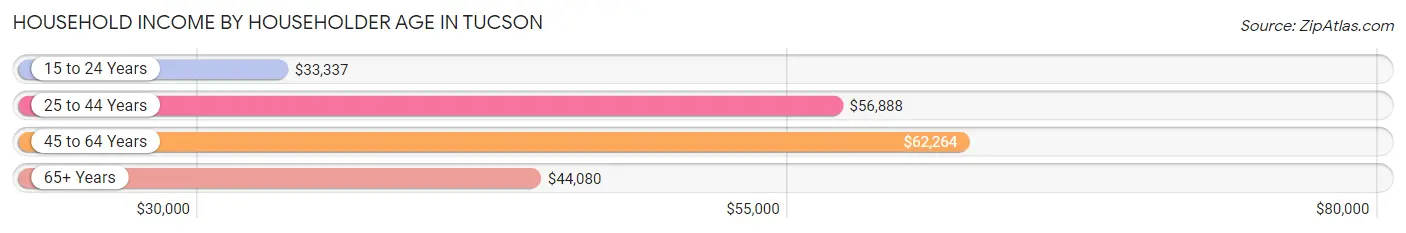
| Income Bracket | # Households | Median Income |
| 15 to 24 Years | 23,334 (10.6%) | $33,337 |
| 25 to 44 Years | 75,239 (34.1%) | $56,888 |
| 45 to 64 Years | 67,181 (30.4%) | $62,264 |
| 65+ Years | 55,015 (24.9%) | $44,080 |
| Total | 220,769 (100.0%) | $52,049 |
Poverty in Tucson
Income Below Poverty by Sex and Age in Tucson
With 18.1% poverty level for males and 21.0% for females among the residents of Tucson, 6 to 11 year old males and 18 to 24 year old females are the most vulnerable to poverty, with 5,214 males (29.3%) and 12,449 females (33.8%) in their respective age groups living below the poverty level.
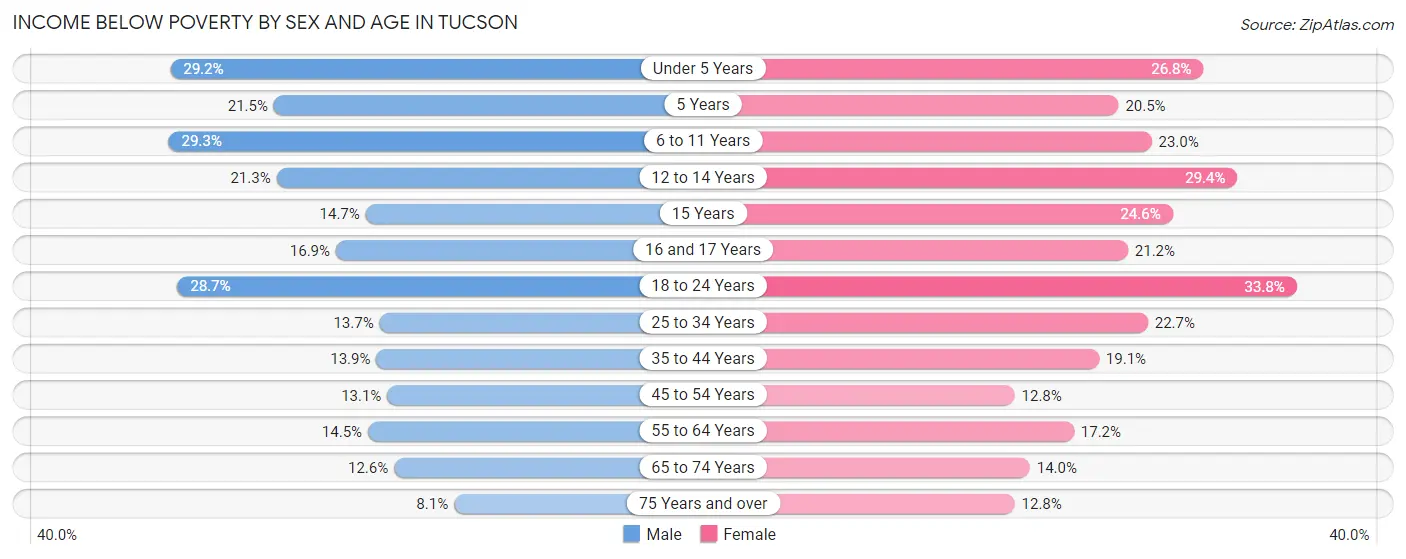
| Age Bracket | Male | Female |
| Under 5 Years | 4,357 (29.2%) | 3,761 (26.8%) |
| 5 Years | 737 (21.5%) | 568 (20.5%) |
| 6 to 11 Years | 5,214 (29.3%) | 4,304 (23.0%) |
| 12 to 14 Years | 2,024 (21.3%) | 2,433 (29.4%) |
| 15 Years | 506 (14.7%) | 864 (24.5%) |
| 16 and 17 Years | 989 (16.9%) | 1,114 (21.2%) |
| 18 to 24 Years | 11,009 (28.7%) | 12,449 (33.8%) |
| 25 to 34 Years | 5,732 (13.7%) | 8,890 (22.7%) |
| 35 to 44 Years | 4,327 (13.9%) | 6,164 (19.1%) |
| 45 to 54 Years | 3,472 (13.1%) | 3,592 (12.8%) |
| 55 to 64 Years | 3,902 (14.5%) | 5,102 (17.2%) |
| 65 to 74 Years | 2,607 (12.6%) | 3,464 (14.0%) |
| 75 Years and over | 1,115 (8.1%) | 2,638 (12.8%) |
| Total | 45,991 (18.1%) | 55,343 (21.0%) |
Income Above Poverty by Sex and Age in Tucson
According to the poverty statistics in Tucson, males aged 75 years and over and females aged 45 to 54 years are the age groups that are most secure financially, with 91.9% of males and 87.2% of females in these age groups living above the poverty line.
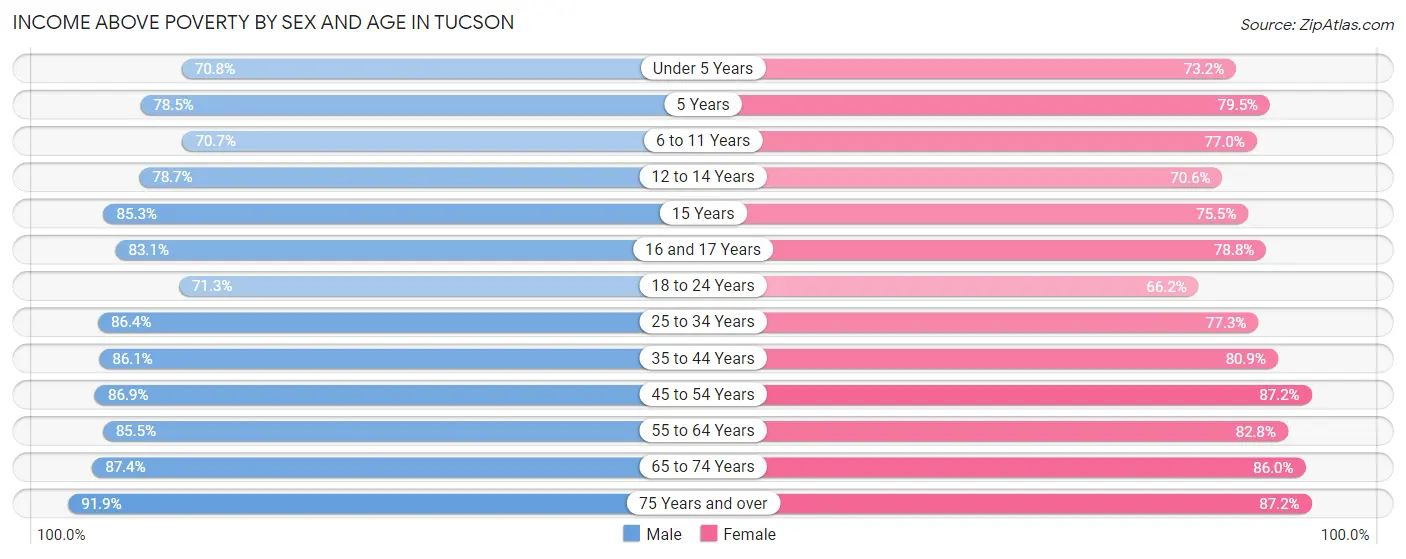
| Age Bracket | Male | Female |
| Under 5 Years | 10,577 (70.8%) | 10,253 (73.2%) |
| 5 Years | 2,691 (78.5%) | 2,198 (79.5%) |
| 6 to 11 Years | 12,573 (70.7%) | 14,409 (77.0%) |
| 12 to 14 Years | 7,480 (78.7%) | 5,853 (70.6%) |
| 15 Years | 2,940 (85.3%) | 2,656 (75.4%) |
| 16 and 17 Years | 4,866 (83.1%) | 4,131 (78.8%) |
| 18 to 24 Years | 27,398 (71.3%) | 24,416 (66.2%) |
| 25 to 34 Years | 36,273 (86.4%) | 30,232 (77.3%) |
| 35 to 44 Years | 26,819 (86.1%) | 26,126 (80.9%) |
| 45 to 54 Years | 23,063 (86.9%) | 24,409 (87.2%) |
| 55 to 64 Years | 22,986 (85.5%) | 24,507 (82.8%) |
| 65 to 74 Years | 18,125 (87.4%) | 21,342 (86.0%) |
| 75 Years and over | 12,616 (91.9%) | 17,917 (87.2%) |
| Total | 208,407 (81.9%) | 208,449 (79.0%) |
Income Below Poverty Among Married-Couple Families in Tucson
The poverty statistics for married-couple families in Tucson show that 7.3% or 5,395 of the total 73,609 families live below the poverty line. Families with 5 or more children have the highest poverty rate of 41.4%, comprising of 213 families. On the other hand, families with no children have the lowest poverty rate of 4.8%, which includes 1,971 families.
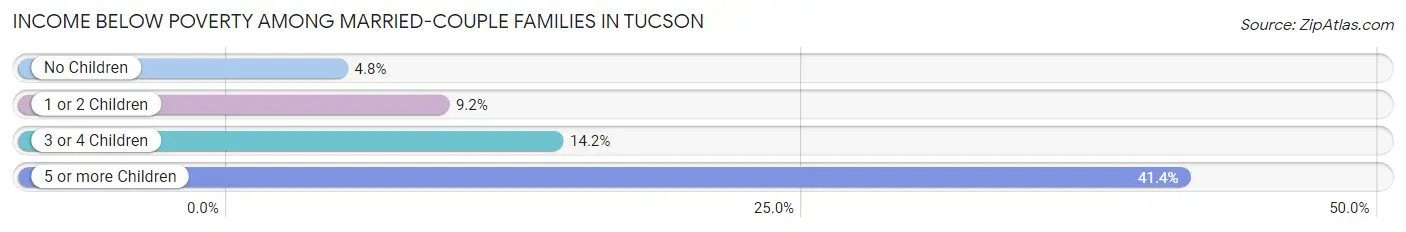
| Children | Above Poverty | Below Poverty |
| No Children | 39,365 (95.2%) | 1,971 (4.8%) |
| 1 or 2 Children | 23,420 (90.8%) | 2,366 (9.2%) |
| 3 or 4 Children | 5,128 (85.9%) | 845 (14.1%) |
| 5 or more Children | 301 (58.6%) | 213 (41.4%) |
| Total | 68,214 (92.7%) | 5,395 (7.3%) |
Income Below Poverty Among Single-Parent Households in Tucson
According to the poverty data in Tucson, 17.0% or 2,362 single-father households and 28.1% or 9,052 single-mother households are living below the poverty line. Among single-father households, those with 5 or more children have the highest poverty rate, with 97 households (57.1%) experiencing poverty. Likewise, among single-mother households, those with 5 or more children have the highest poverty rate, with 226 households (64.6%) falling below the poverty line.
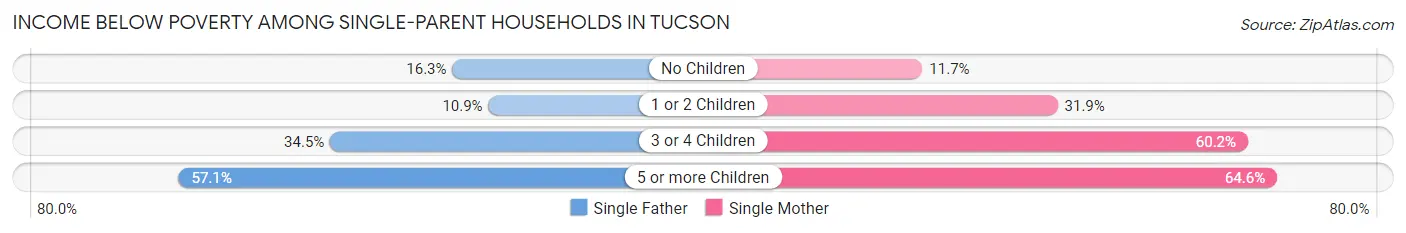
| Children | Single Father | Single Mother |
| No Children | 953 (16.3%) | 1,401 (11.7%) |
| 1 or 2 Children | 643 (10.9%) | 5,160 (31.9%) |
| 3 or 4 Children | 669 (34.5%) | 2,265 (60.2%) |
| 5 or more Children | 97 (57.1%) | 226 (64.6%) |
| Total | 2,362 (17.0%) | 9,052 (28.1%) |
Income Below Poverty Among Married-Couple vs Single-Parent Households in Tucson
The poverty data for Tucson shows that 5,395 of the married-couple family households (7.3%) and 11,414 of the single-parent households (24.7%) are living below the poverty level. Within the married-couple family households, those with 5 or more children have the highest poverty rate, with 213 households (41.4%) falling below the poverty line. Among the single-parent households, those with 5 or more children have the highest poverty rate, with 323 household (62.1%) living below poverty.
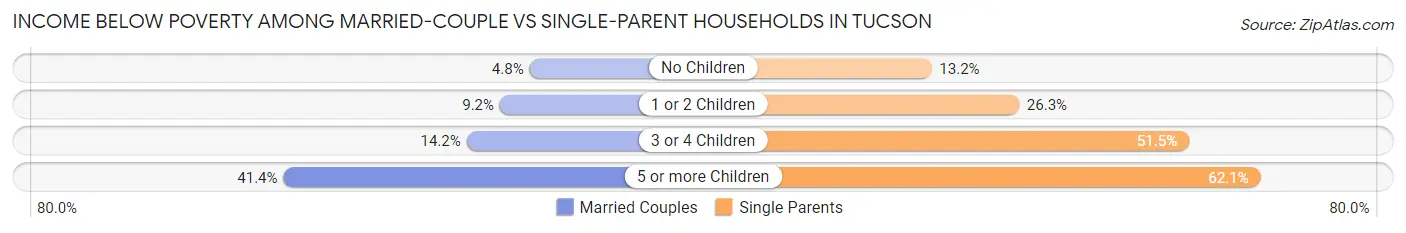
| Children | Married-Couple Families | Single-Parent Households |
| No Children | 1,971 (4.8%) | 2,354 (13.2%) |
| 1 or 2 Children | 2,366 (9.2%) | 5,803 (26.3%) |
| 3 or 4 Children | 845 (14.1%) | 2,934 (51.5%) |
| 5 or more Children | 213 (41.4%) | 323 (62.1%) |
| Total | 5,395 (7.3%) | 11,414 (24.7%) |
Race in Tucson
The most populous races in Tucson are White / Caucasian (329,262 | 60.9%), Hispanic or Latino (242,228 | 44.8%), and Two or more Races (85,724 | 15.8%).
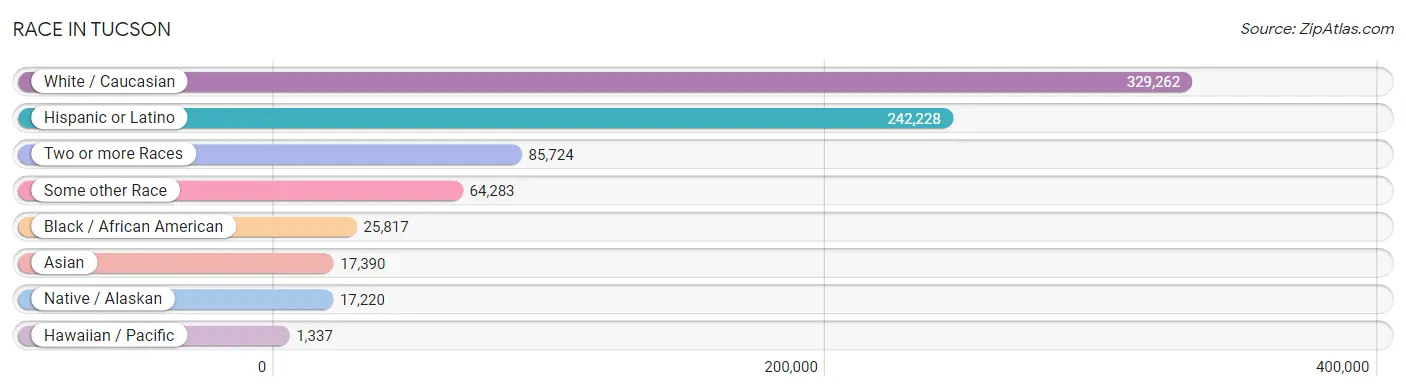
| Race | # Population | % Population |
| Asian | 17,390 | 3.2% |
| Black / African American | 25,817 | 4.8% |
| Hawaiian / Pacific | 1,337 | 0.3% |
| Hispanic or Latino | 242,228 | 44.8% |
| Native / Alaskan | 17,220 | 3.2% |
| White / Caucasian | 329,262 | 60.9% |
| Two or more Races | 85,724 | 15.8% |
| Some other Race | 64,283 | 11.9% |
| Total | 541,033 | 100.0% |
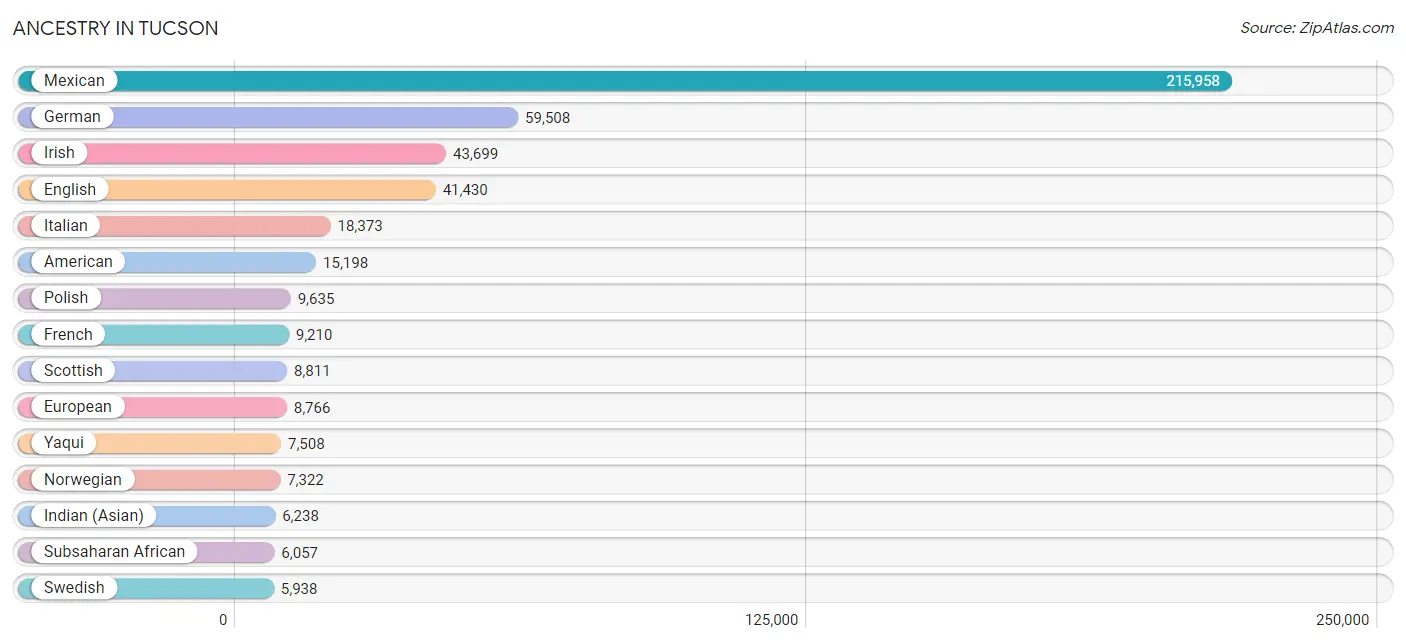
Ancestry in Tucson
The most populous ancestries reported in Tucson are Mexican (215,958 | 39.9%), German (59,508 | 11.0%), Irish (43,699 | 8.1%), English (41,430 | 7.7%), and Italian (18,373 | 3.4%), together accounting for 70.1% of all Tucson residents.
| Ancestry | # Population | % Population |
| Afghan | 303 | 0.1% |
| African | 2,088 | 0.4% |
| Alaska Native | 13 | 0.0% |
| Alaskan Athabascan | 11 | 0.0% |
| Albanian | 7 | 0.0% |
| Aleut | 13 | 0.0% |
| Alsatian | 36 | 0.0% |
| American | 15,198 | 2.8% |
| Apache | 1,319 | 0.2% |
| Arab | 3,560 | 0.7% |
| Argentinean | 111 | 0.0% |
| Armenian | 448 | 0.1% |
| Assyrian / Chaldean / Syriac | 153 | 0.0% |
| Australian | 133 | 0.0% |
| Austrian | 932 | 0.2% |
| Bahamian | 12 | 0.0% |
| Barbadian | 23 | 0.0% |
| Basque | 76 | 0.0% |
| Belgian | 361 | 0.1% |
| Belizean | 56 | 0.0% |
| Bermudan | 11 | 0.0% |
| Bhutanese | 2,419 | 0.4% |
| Blackfeet | 230 | 0.0% |
| Bolivian | 33 | 0.0% |
| Brazilian | 430 | 0.1% |
| British | 3,385 | 0.6% |
| Bulgarian | 16 | 0.0% |
| Burmese | 2,358 | 0.4% |
| Cajun | 92 | 0.0% |
| Cambodian | 28 | 0.0% |
| Canadian | 914 | 0.2% |
| Cape Verdean | 9 | 0.0% |
| Carpatho Rusyn | 44 | 0.0% |
| Celtic | 244 | 0.1% |
| Central American | 3,932 | 0.7% |
| Central American Indian | 676 | 0.1% |
| Cherokee | 1,471 | 0.3% |
| Cheyenne | 11 | 0.0% |
| Chickasaw | 46 | 0.0% |
| Chilean | 252 | 0.1% |
| Chinese | 34 | 0.0% |
| Chippewa | 191 | 0.0% |
| Choctaw | 376 | 0.1% |
| Colombian | 972 | 0.2% |
| Comanche | 45 | 0.0% |
| Costa Rican | 160 | 0.0% |
| Cree | 5 | 0.0% |
| Creek | 47 | 0.0% |
| Croatian | 721 | 0.1% |
| Cuban | 1,131 | 0.2% |
| Czech | 1,520 | 0.3% |
| Czechoslovakian | 280 | 0.1% |
| Danish | 2,077 | 0.4% |
| Delaware | 90 | 0.0% |
| Dominican | 264 | 0.1% |
| Dutch | 4,942 | 0.9% |
| Dutch West Indian | 44 | 0.0% |
| Eastern European | 1,428 | 0.3% |
| Ecuadorian | 152 | 0.0% |
| Egyptian | 523 | 0.1% |
| English | 41,430 | 7.7% |
| Estonian | 24 | 0.0% |
| Ethiopian | 706 | 0.1% |
| European | 8,766 | 1.6% |
| Fijian | 329 | 0.1% |
| Filipino | 213 | 0.0% |
| Finnish | 822 | 0.2% |
| French | 9,210 | 1.7% |
| French American Indian | 139 | 0.0% |
| French Canadian | 1,724 | 0.3% |
| German | 59,508 | 11.0% |
| German Russian | 20 | 0.0% |
| Ghanaian | 13 | 0.0% |
| Greek | 1,258 | 0.2% |
| Guamanian / Chamorro | 361 | 0.1% |
| Guatemalan | 1,145 | 0.2% |
| Guyanese | 47 | 0.0% |
| Haitian | 102 | 0.0% |
| Honduran | 666 | 0.1% |
| Hopi | 190 | 0.0% |
| Hungarian | 2,181 | 0.4% |
| Icelander | 132 | 0.0% |
| Indian (Asian) | 6,238 | 1.1% |
| Indonesian | 73 | 0.0% |
| Inupiat | 23 | 0.0% |
| Iranian | 589 | 0.1% |
| Iraqi | 304 | 0.1% |
| Irish | 43,699 | 8.1% |
| Iroquois | 157 | 0.0% |
| Israeli | 368 | 0.1% |
| Italian | 18,373 | 3.4% |
| Jamaican | 448 | 0.1% |
| Japanese | 23 | 0.0% |
| Jordanian | 114 | 0.0% |
| Kenyan | 296 | 0.1% |
| Kiowa | 16 | 0.0% |
| Korean | 5,904 | 1.1% |
| Laotian | 128 | 0.0% |
| Latvian | 191 | 0.0% |
| Lebanese | 983 | 0.2% |
| Liberian | 119 | 0.0% |
| Lithuanian | 816 | 0.2% |
| Luxembourger | 34 | 0.0% |
| Macedonian | 41 | 0.0% |
| Malaysian | 274 | 0.1% |
| Maltese | 14 | 0.0% |
| Menominee | 91 | 0.0% |
| Mexican | 215,958 | 39.9% |
| Mexican American Indian | 1,346 | 0.3% |
| Mongolian | 32 | 0.0% |
| Moroccan | 48 | 0.0% |
| Native Hawaiian | 817 | 0.2% |
| Navajo | 2,238 | 0.4% |
| New Zealander | 20 | 0.0% |
| Nicaraguan | 436 | 0.1% |
| Nigerian | 194 | 0.0% |
| Northern European | 865 | 0.2% |
| Norwegian | 7,322 | 1.3% |
| Ottawa | 10 | 0.0% |
| Paiute | 22 | 0.0% |
| Pakistani | 771 | 0.1% |
| Palestinian | 146 | 0.0% |
| Panamanian | 335 | 0.1% |
| Paraguayan | 7 | 0.0% |
| Pennsylvania German | 122 | 0.0% |
| Peruvian | 753 | 0.1% |
| Pima | 629 | 0.1% |
| Polish | 9,635 | 1.8% |
| Portuguese | 804 | 0.2% |
| Potawatomi | 10 | 0.0% |
| Pueblo | 71 | 0.0% |
| Puerto Rican | 4,806 | 0.9% |
| Puget Sound Salish | 1 | 0.0% |
| Romanian | 440 | 0.1% |
| Russian | 3,629 | 0.7% |
| Salvadoran | 1,177 | 0.2% |
| Samoan | 227 | 0.0% |
| Scandinavian | 1,739 | 0.3% |
| Scotch-Irish | 4,209 | 0.8% |
| Scottish | 8,811 | 1.6% |
| Seminole | 55 | 0.0% |
| Serbian | 205 | 0.0% |
| Shoshone | 25 | 0.0% |
| Sioux | 338 | 0.1% |
| Slavic | 181 | 0.0% |
| Slovak | 449 | 0.1% |
| Slovene | 131 | 0.0% |
| Somali | 643 | 0.1% |
| South African | 137 | 0.0% |
| South American | 2,513 | 0.5% |
| South American Indian | 36 | 0.0% |
| Soviet Union | 17 | 0.0% |
| Spaniard | 3,974 | 0.7% |
| Spanish | 2,723 | 0.5% |
| Spanish American | 8 | 0.0% |
| Spanish American Indian | 43 | 0.0% |
| Sri Lankan | 3,450 | 0.6% |
| Subsaharan African | 6,057 | 1.1% |
| Sudanese | 232 | 0.0% |
| Swedish | 5,938 | 1.1% |
| Swiss | 1,081 | 0.2% |
| Syrian | 468 | 0.1% |
| Thai | 2,724 | 0.5% |
| Tlingit-Haida | 22 | 0.0% |
| Tohono O'Odham | 3,906 | 0.7% |
| Trinidadian and Tobagonian | 114 | 0.0% |
| Turkish | 219 | 0.0% |
| U.S. Virgin Islander | 56 | 0.0% |
| Ugandan | 21 | 0.0% |
| Ukrainian | 1,515 | 0.3% |
| Ute | 35 | 0.0% |
| Venezuelan | 192 | 0.0% |
| Vietnamese | 115 | 0.0% |
| Welsh | 3,511 | 0.6% |
| West Indian | 146 | 0.0% |
| Yakama | 9 | 0.0% |
| Yaqui | 7,508 | 1.4% |
| Yugoslavian | 428 | 0.1% |
| Yuman | 150 | 0.0% |
| Yup'ik | 151 | 0.0% |
| Zimbabwean | 86 | 0.0% | View All 181 Rows |
Immigrants in Tucson
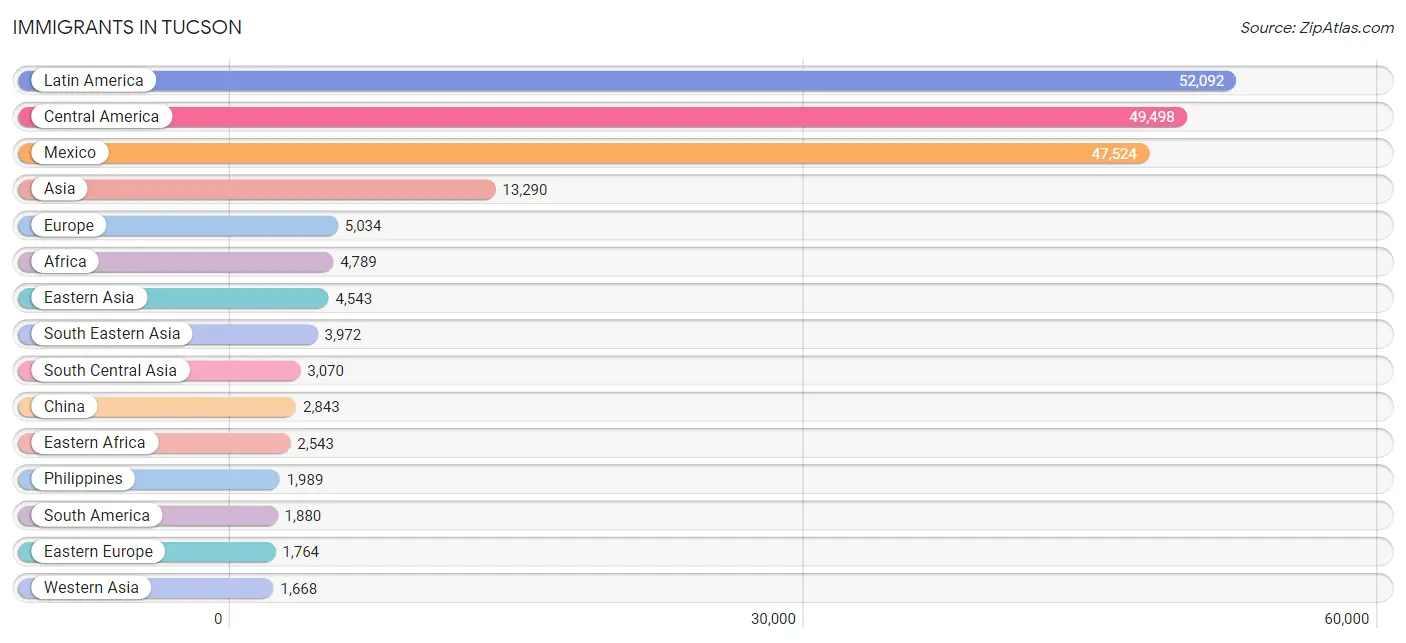
The most numerous immigrant groups reported in Tucson came from Latin America (52,092 | 9.6%), Central America (49,498 | 9.1%), Mexico (47,524 | 8.8%), Asia (13,290 | 2.5%), and Europe (5,034 | 0.9%), together accounting for 30.9% of all Tucson residents.
| Immigration Origin | # Population | % Population |
| Afghanistan | 125 | 0.0% |
| Africa | 4,789 | 0.9% |
| Argentina | 148 | 0.0% |
| Armenia | 11 | 0.0% |
| Asia | 13,290 | 2.5% |
| Australia | 146 | 0.0% |
| Austria | 60 | 0.0% |
| Bangladesh | 144 | 0.0% |
| Belarus | 65 | 0.0% |
| Belgium | 64 | 0.0% |
| Bolivia | 32 | 0.0% |
| Bosnia and Herzegovina | 136 | 0.0% |
| Brazil | 328 | 0.1% |
| Bulgaria | 30 | 0.0% |
| Cabo Verde | 9 | 0.0% |
| Cameroon | 240 | 0.0% |
| Canada | 939 | 0.2% |
| Caribbean | 714 | 0.1% |
| Central America | 49,498 | 9.1% |
| Chile | 91 | 0.0% |
| China | 2,843 | 0.5% |
| Colombia | 621 | 0.1% |
| Congo | 473 | 0.1% |
| Costa Rica | 97 | 0.0% |
| Croatia | 93 | 0.0% |
| Cuba | 239 | 0.0% |
| Czechoslovakia | 40 | 0.0% |
| Denmark | 10 | 0.0% |
| Dominican Republic | 187 | 0.0% |
| Eastern Africa | 2,543 | 0.5% |
| Eastern Asia | 4,543 | 0.8% |
| Eastern Europe | 1,764 | 0.3% |
| Ecuador | 53 | 0.0% |
| Egypt | 139 | 0.0% |
| El Salvador | 567 | 0.1% |
| England | 702 | 0.1% |
| Eritrea | 135 | 0.0% |
| Ethiopia | 98 | 0.0% |
| Europe | 5,034 | 0.9% |
| Fiji | 92 | 0.0% |
| France | 197 | 0.0% |
| Germany | 808 | 0.2% |
| Ghana | 44 | 0.0% |
| Greece | 15 | 0.0% |
| Grenada | 27 | 0.0% |
| Guatemala | 615 | 0.1% |
| Guyana | 92 | 0.0% |
| Haiti | 56 | 0.0% |
| Honduras | 333 | 0.1% |
| Hong Kong | 196 | 0.0% |
| Hungary | 7 | 0.0% |
| India | 1,470 | 0.3% |
| Indonesia | 64 | 0.0% |
| Iran | 305 | 0.1% |
| Iraq | 310 | 0.1% |
| Ireland | 81 | 0.0% |
| Israel | 85 | 0.0% |
| Italy | 119 | 0.0% |
| Jamaica | 168 | 0.0% |
| Japan | 832 | 0.2% |
| Jordan | 65 | 0.0% |
| Kazakhstan | 55 | 0.0% |
| Kenya | 978 | 0.2% |
| Korea | 868 | 0.2% |
| Kuwait | 272 | 0.1% |
| Laos | 27 | 0.0% |
| Latin America | 52,092 | 9.6% |
| Lebanon | 278 | 0.1% |
| Liberia | 66 | 0.0% |
| Lithuania | 160 | 0.0% |
| Malaysia | 98 | 0.0% |
| Mexico | 47,524 | 8.8% |
| Micronesia | 51 | 0.0% |
| Middle Africa | 982 | 0.2% |
| Moldova | 21 | 0.0% |
| Morocco | 89 | 0.0% |
| Nepal | 541 | 0.1% |
| Netherlands | 300 | 0.1% |
| Nicaragua | 275 | 0.1% |
| Nigeria | 112 | 0.0% |
| North Macedonia | 12 | 0.0% |
| Northern Africa | 399 | 0.1% |
| Northern Europe | 1,379 | 0.3% |
| Norway | 6 | 0.0% |
| Oceania | 567 | 0.1% |
| Pakistan | 158 | 0.0% |
| Panama | 87 | 0.0% |
| Peru | 440 | 0.1% |
| Philippines | 1,989 | 0.4% |
| Poland | 251 | 0.1% |
| Portugal | 45 | 0.0% |
| Romania | 97 | 0.0% |
| Russia | 336 | 0.1% |
| Saudi Arabia | 138 | 0.0% |
| Scotland | 53 | 0.0% |
| Senegal | 28 | 0.0% |
| Serbia | 134 | 0.0% |
| Singapore | 50 | 0.0% |
| Somalia | 585 | 0.1% |
| South Africa | 194 | 0.0% |
| South America | 1,880 | 0.4% |
| South Central Asia | 3,070 | 0.6% |
| South Eastern Asia | 3,972 | 0.7% |
| Southern Europe | 403 | 0.1% |
| Spain | 224 | 0.0% |
| Sri Lanka | 14 | 0.0% |
| Sudan | 152 | 0.0% |
| Sweden | 45 | 0.0% |
| Switzerland | 27 | 0.0% |
| Syria | 329 | 0.1% |
| Taiwan | 213 | 0.0% |
| Thailand | 405 | 0.1% |
| Trinidad and Tobago | 20 | 0.0% |
| Turkey | 76 | 0.0% |
| Uganda | 21 | 0.0% |
| Ukraine | 213 | 0.0% |
| Uzbekistan | 82 | 0.0% |
| Venezuela | 59 | 0.0% |
| Vietnam | 1,259 | 0.2% |
| Western Africa | 536 | 0.1% |
| Western Asia | 1,668 | 0.3% |
| Western Europe | 1,475 | 0.3% |
| Yemen | 49 | 0.0% |
| Zaire | 190 | 0.0% |
| Zimbabwe | 85 | 0.0% | View All 125 Rows |
Sex and Age in Tucson
Sex and Age in Tucson
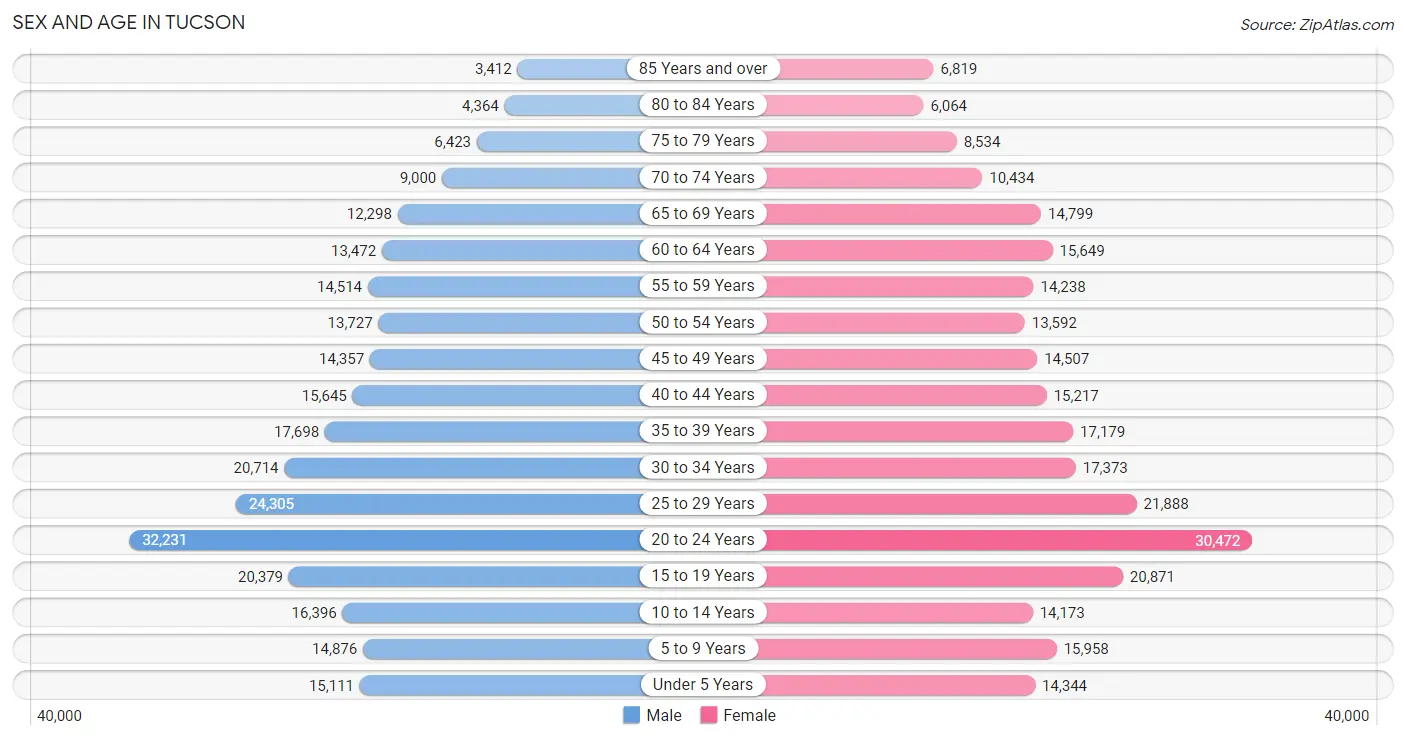
The most populous age groups in Tucson are 20 to 24 Years (32,231 | 12.0%) for men and 20 to 24 Years (30,472 | 11.2%) for women.
| Age Bracket | Male | Female |
| Under 5 Years | 15,111 (5.6%) | 14,344 (5.3%) |
| 5 to 9 Years | 14,876 (5.5%) | 15,958 (5.9%) |
| 10 to 14 Years | 16,396 (6.1%) | 14,173 (5.2%) |
| 15 to 19 Years | 20,379 (7.6%) | 20,871 (7.7%) |
| 20 to 24 Years | 32,231 (12.0%) | 30,472 (11.2%) |
| 25 to 29 Years | 24,305 (9.0%) | 21,888 (8.0%) |
| 30 to 34 Years | 20,714 (7.7%) | 17,373 (6.4%) |
| 35 to 39 Years | 17,698 (6.6%) | 17,179 (6.3%) |
| 40 to 44 Years | 15,645 (5.8%) | 15,217 (5.6%) |
| 45 to 49 Years | 14,357 (5.3%) | 14,507 (5.3%) |
| 50 to 54 Years | 13,727 (5.1%) | 13,592 (5.0%) |
| 55 to 59 Years | 14,514 (5.4%) | 14,238 (5.2%) |
| 60 to 64 Years | 13,472 (5.0%) | 15,649 (5.8%) |
| 65 to 69 Years | 12,298 (4.6%) | 14,799 (5.4%) |
| 70 to 74 Years | 9,000 (3.4%) | 10,434 (3.8%) |
| 75 to 79 Years | 6,423 (2.4%) | 8,534 (3.1%) |
| 80 to 84 Years | 4,364 (1.6%) | 6,064 (2.2%) |
| 85 Years and over | 3,412 (1.3%) | 6,819 (2.5%) |
| Total | 268,922 (100.0%) | 272,111 (100.0%) |
Families and Households in Tucson
Median Family Size in Tucson
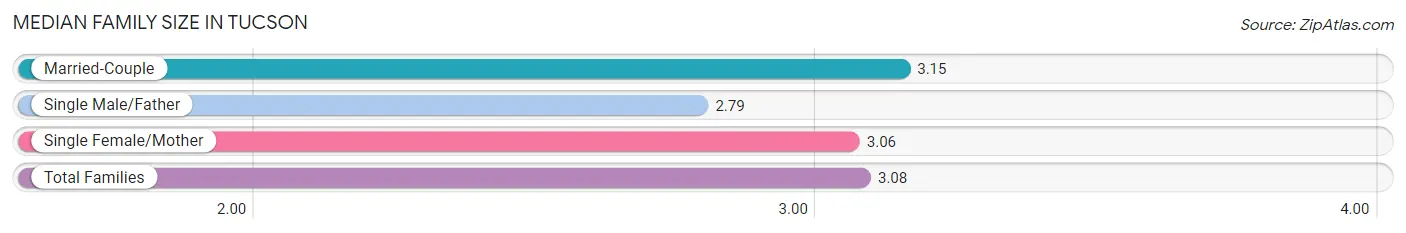
The median family size in Tucson is 3.08 persons per family, with married-couple families (73,609 | 61.5%) accounting for the largest median family size of 3.15 persons per family. On the other hand, single male/father families (13,882 | 11.6%) represent the smallest median family size with 2.79 persons per family.
| Family Type | # Families | Family Size |
| Married-Couple | 73,609 (61.5%) | 3.15 |
| Single Male/Father | 13,882 (11.6%) | 2.79 |
| Single Female/Mother | 32,238 (26.9%) | 3.06 |
| Total Families | 119,729 (100.0%) | 3.08 |
Median Household Size in Tucson
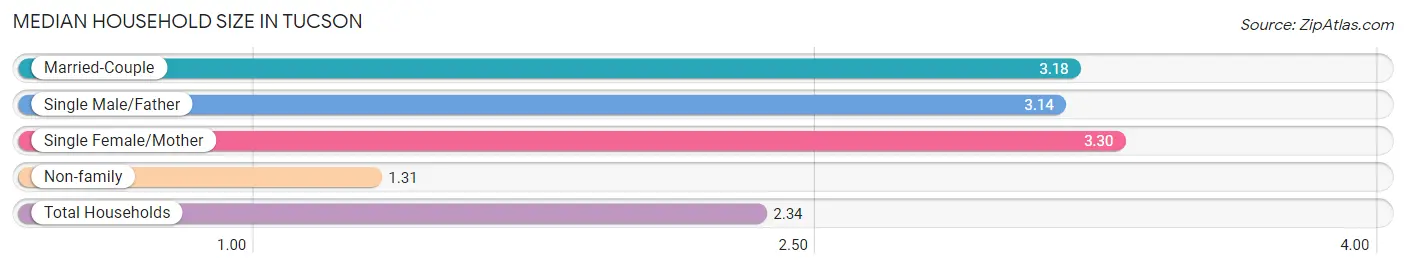
The median household size in Tucson is 2.34 persons per household, with single female/mother households (32,238 | 14.6%) accounting for the largest median household size of 3.3 persons per household. non-family households (101,040 | 45.8%) represent the smallest median household size with 1.31 persons per household.
| Household Type | # Households | Household Size |
| Married-Couple | 73,609 (33.3%) | 3.18 |
| Single Male/Father | 13,882 (6.3%) | 3.14 |
| Single Female/Mother | 32,238 (14.6%) | 3.30 |
| Non-family | 101,040 (45.8%) | 1.31 |
| Total Households | 220,769 (100.0%) | 2.34 |
Household Size by Marriage Status in Tucson
Out of a total of 220,769 households in Tucson, 119,729 (54.2%) are family households, while 101,040 (45.8%) are nonfamily households. The most numerous type of family households are 2-person households, comprising 49,567, and the most common type of nonfamily households are 1-person households, comprising 78,008.
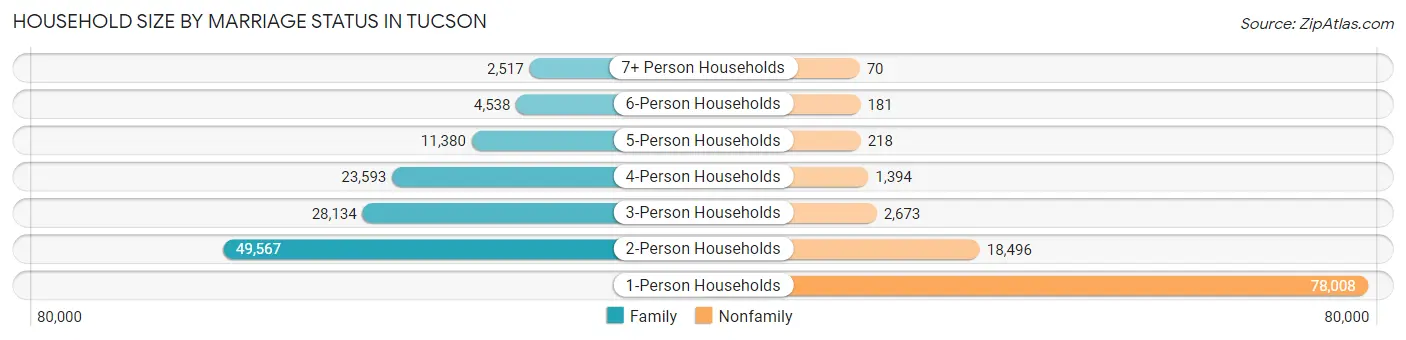
| Household Size | Family Households | Nonfamily Households |
| 1-Person Households | - | 78,008 (35.3%) |
| 2-Person Households | 49,567 (22.5%) | 18,496 (8.4%) |
| 3-Person Households | 28,134 (12.7%) | 2,673 (1.2%) |
| 4-Person Households | 23,593 (10.7%) | 1,394 (0.6%) |
| 5-Person Households | 11,380 (5.1%) | 218 (0.1%) |
| 6-Person Households | 4,538 (2.1%) | 181 (0.1%) |
| 7+ Person Households | 2,517 (1.1%) | 70 (0.0%) |
| Total | 119,729 (54.2%) | 101,040 (45.8%) |
Female Fertility in Tucson
Fertility by Age in Tucson
Average fertility rate in Tucson is 50.0 births per 1,000 women. Women in the age bracket of 20 to 34 years have the highest fertility rate with 73.0 births per 1,000 women. Women in the age bracket of 20 to 34 years acount for 72.4% of all women with births.
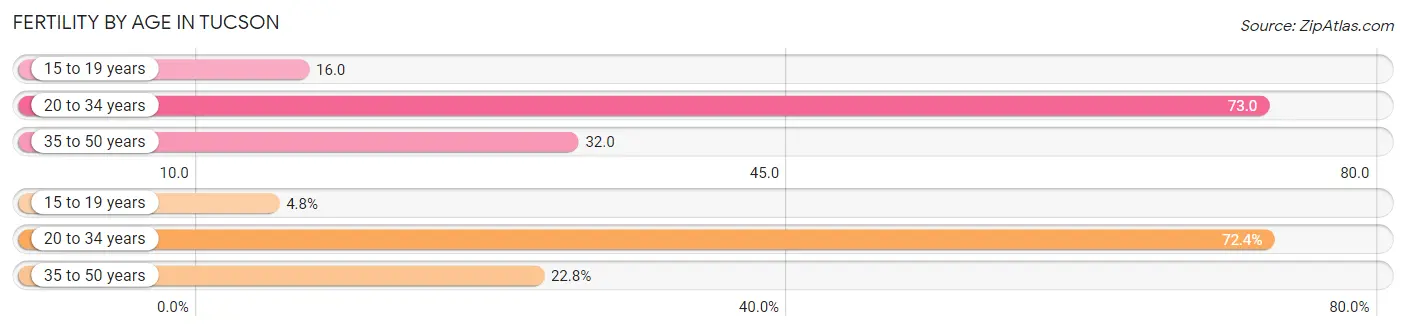
| Age Bracket | Women with Births | Births / 1,000 Women |
| 15 to 19 years | 340 (4.8%) | 16.0 |
| 20 to 34 years | 5,090 (72.4%) | 73.0 |
| 35 to 50 years | 1,604 (22.8%) | 32.0 |
| Total | 7,034 (100.0%) | 50.0 |
Fertility by Age by Marriage Status in Tucson
53.6% of women with births (7,034) in Tucson are married. The highest percentage of unmarried women with births falls into 15 to 19 years age bracket with 90.3% of them unmarried at the time of birth, while the lowest percentage of unmarried women with births belong to 35 to 50 years age bracket with 35.1% of them unmarried.
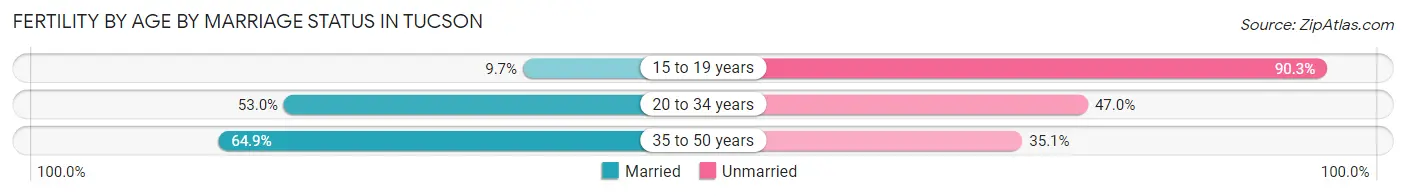
| Age Bracket | Married | Unmarried |
| 15 to 19 years | 33 (9.7%) | 307 (90.3%) |
| 20 to 34 years | 2,698 (53.0%) | 2,392 (47.0%) |
| 35 to 50 years | 1,041 (64.9%) | 563 (35.1%) |
| Total | 3,770 (53.6%) | 3,264 (46.4%) |
Fertility by Education in Tucson
Average fertility rate in Tucson is 50.0 births per 1,000 women. Women with the education attainment of high school diploma have the highest fertility rate of 61.0 births per 1,000 women, while women with the education attainment of bachelor's degree have the lowest fertility at 43.0 births per 1,000 women. Women with the education attainment of college or associate's degree represent 34.8% of all women with births.
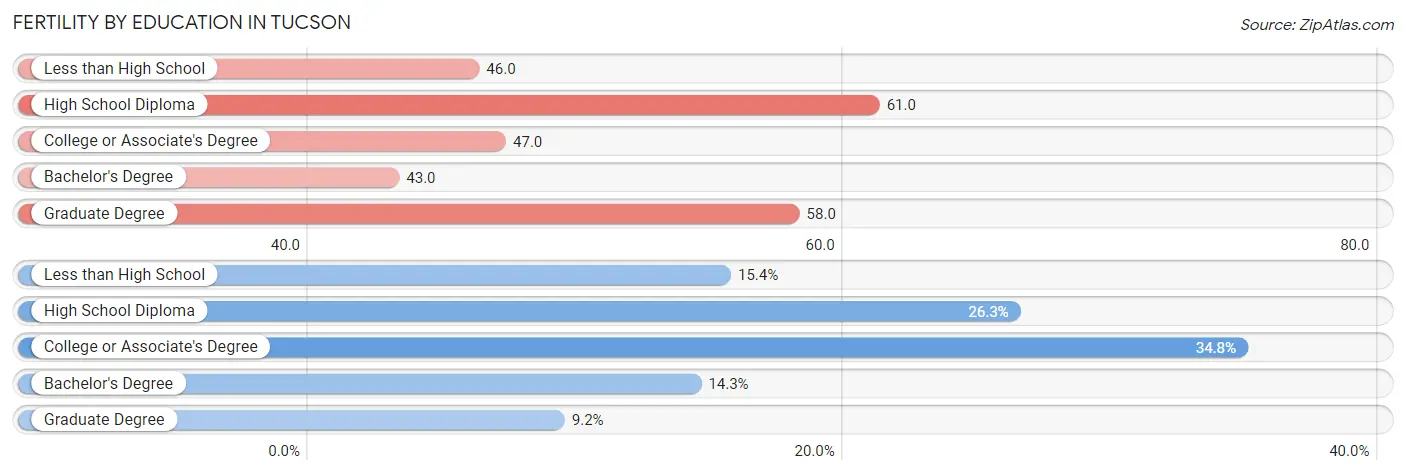
| Educational Attainment | Women with Births | Births / 1,000 Women |
| Less than High School | 1,085 (15.4%) | 46.0 |
| High School Diploma | 1,848 (26.3%) | 61.0 |
| College or Associate's Degree | 2,447 (34.8%) | 47.0 |
| Bachelor's Degree | 1,007 (14.3%) | 43.0 |
| Graduate Degree | 647 (9.2%) | 58.0 |
| Total | 7,034 (100.0%) | 50.0 |
Fertility by Education by Marriage Status in Tucson
46.4% of women with births in Tucson are unmarried. Women with the educational attainment of graduate degree are most likely to be married with 77.7% of them married at childbirth, while women with the educational attainment of high school diploma are least likely to be married with 56.7% of them unmarried at childbirth.
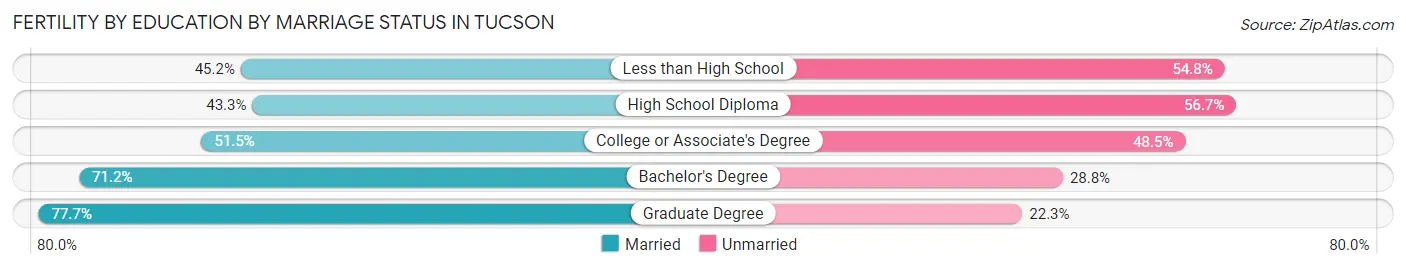
| Educational Attainment | Married | Unmarried |
| Less than High School | 490 (45.2%) | 595 (54.8%) |
| High School Diploma | 800 (43.3%) | 1,048 (56.7%) |
| College or Associate's Degree | 1,260 (51.5%) | 1,187 (48.5%) |
| Bachelor's Degree | 717 (71.2%) | 290 (28.8%) |
| Graduate Degree | 503 (77.7%) | 144 (22.3%) |
| Total | 3,770 (53.6%) | 3,264 (46.4%) |
Employment Characteristics in Tucson
Employment by Class of Employer in Tucson
Among the 251,983 employed individuals in Tucson, private company employees (163,467 | 64.9%), not-for-profit organizations (20,888 | 8.3%), and state government employees (16,989 | 6.7%) make up the most common classes of employment.
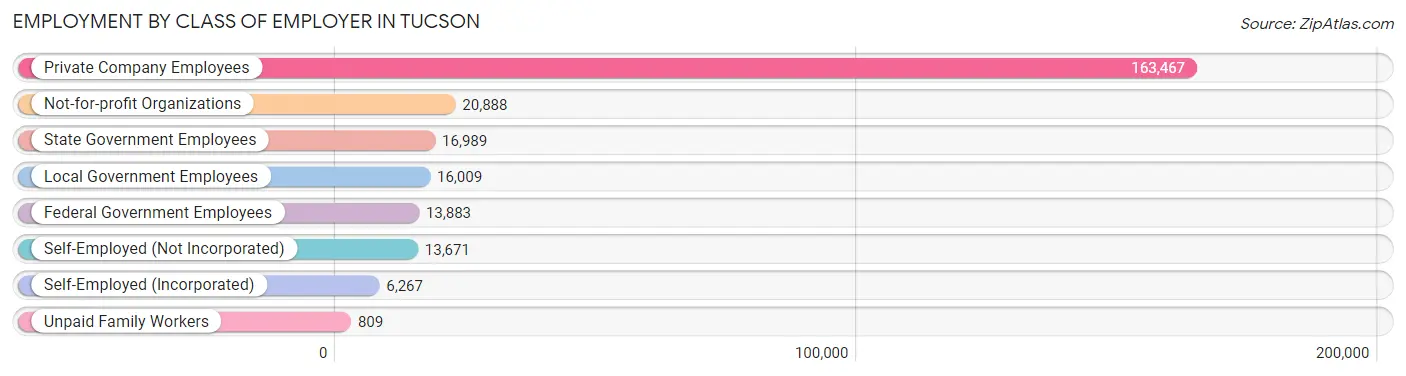
| Employer Class | # Employees | % Employees |
| Private Company Employees | 163,467 | 64.9% |
| Self-Employed (Incorporated) | 6,267 | 2.5% |
| Self-Employed (Not Incorporated) | 13,671 | 5.4% |
| Not-for-profit Organizations | 20,888 | 8.3% |
| Local Government Employees | 16,009 | 6.4% |
| State Government Employees | 16,989 | 6.7% |
| Federal Government Employees | 13,883 | 5.5% |
| Unpaid Family Workers | 809 | 0.3% |
| Total | 251,983 | 100.0% |
Employment Status by Age in Tucson
According to the labor force statistics for Tucson, out of the total population over 16 years of age (443,138), 62.0% or 274,746 individuals are in the labor force, with 6.5% or 17,858 of them unemployed. The age group with the highest labor force participation rate is 25 to 29 years, with 82.7% or 38,202 individuals in the labor force. Within the labor force, the 16 to 19 years age range has the highest percentage of unemployed individuals, with 21.2% or 3,025 of them being unemployed.
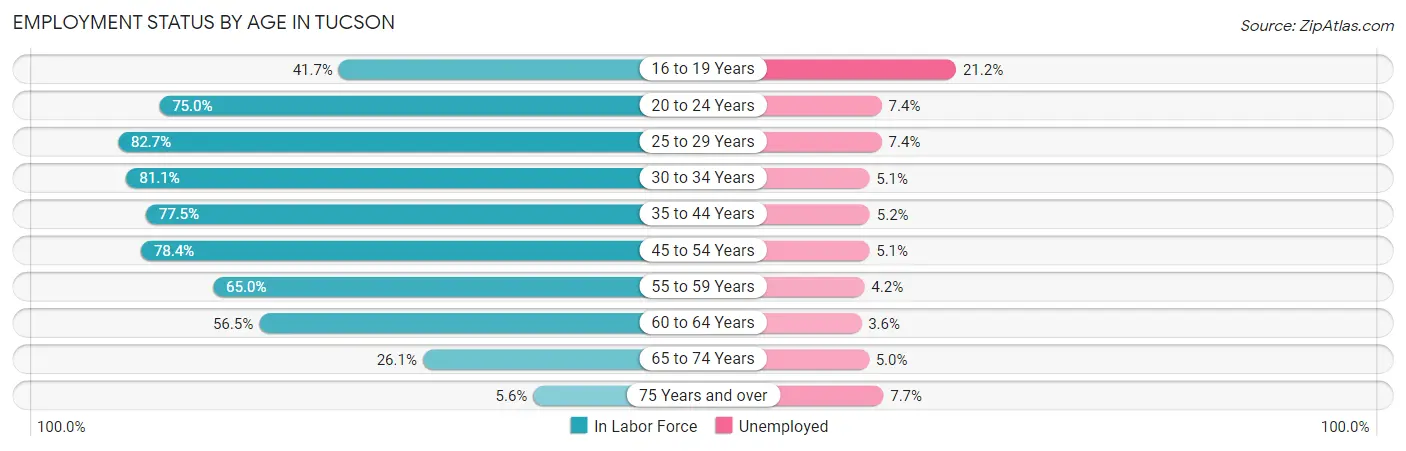
| Age Bracket | In Labor Force | Unemployed |
| 16 to 19 Years | 14,267 (41.7%) | 3,025 (21.2%) |
| 20 to 24 Years | 47,027 (75.0%) | 3,480 (7.4%) |
| 25 to 29 Years | 38,202 (82.7%) | 2,827 (7.4%) |
| 30 to 34 Years | 30,889 (81.1%) | 1,575 (5.1%) |
| 35 to 44 Years | 50,948 (77.5%) | 2,649 (5.2%) |
| 45 to 54 Years | 44,047 (78.4%) | 2,246 (5.1%) |
| 55 to 59 Years | 18,689 (65.0%) | 785 (4.2%) |
| 60 to 64 Years | 16,453 (56.5%) | 592 (3.6%) |
| 65 to 74 Years | 12,145 (26.1%) | 607 (5.0%) |
| 75 Years and over | 1,994 (5.6%) | 154 (7.7%) |
| Total | 274,746 (62.0%) | 17,858 (6.5%) |
Employment Status by Educational Attainment in Tucson
According to labor force statistics for Tucson, 75.4% of individuals (199,113) out of the total population between 25 and 64 years of age (264,075) are in the labor force, with 5.3% or 10,553 of them being unemployed. The group with the highest labor force participation rate are those with the educational attainment of bachelor's degree or higher, with 84.8% or 64,222 individuals in the labor force. Within the labor force, individuals with less than high school education have the highest percentage of unemployment, with 7.0% or 1,428 of them being unemployed.
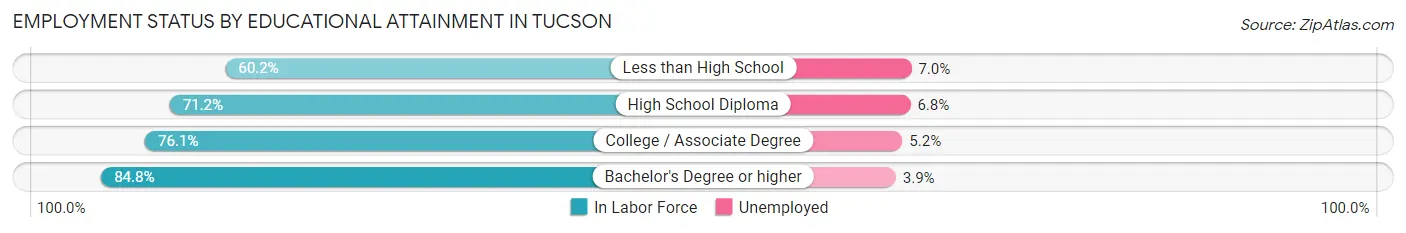
| Educational Attainment | In Labor Force | Unemployed |
| Less than High School | 20,403 (60.2%) | 2,372 (7.0%) |
| High School Diploma | 43,829 (71.2%) | 4,186 (6.8%) |
| College / Associate Degree | 70,692 (76.1%) | 4,830 (5.2%) |
| Bachelor's Degree or higher | 64,222 (84.8%) | 2,954 (3.9%) |
| Total | 199,113 (75.4%) | 13,996 (5.3%) |
Employment Occupations by Sex in Tucson
Management, Business, Science and Arts Occupations
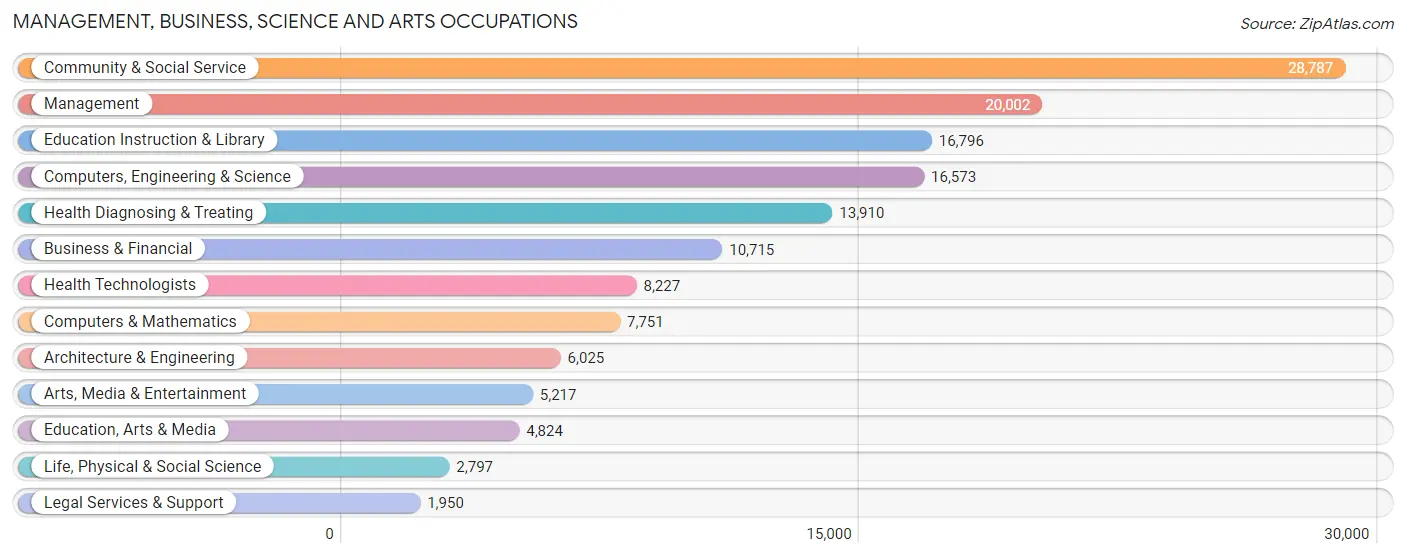
The most common Management, Business, Science and Arts occupations in Tucson are Community & Social Service (28,787 | 11.4%), Management (20,002 | 8.0%), Education Instruction & Library (16,796 | 6.7%), Computers, Engineering & Science (16,573 | 6.6%), and Health Diagnosing & Treating (13,910 | 5.5%).
Management, Business, Science and Arts Occupations by Sex
Within the Management, Business, Science and Arts occupations in Tucson, the most male-oriented occupations are Architecture & Engineering (88.0%), Computers, Engineering & Science (76.5%), and Computers & Mathematics (75.8%), while the most female-oriented occupations are Health Technologists (78.9%), Education, Arts & Media (71.8%), and Health Diagnosing & Treating (71.4%).
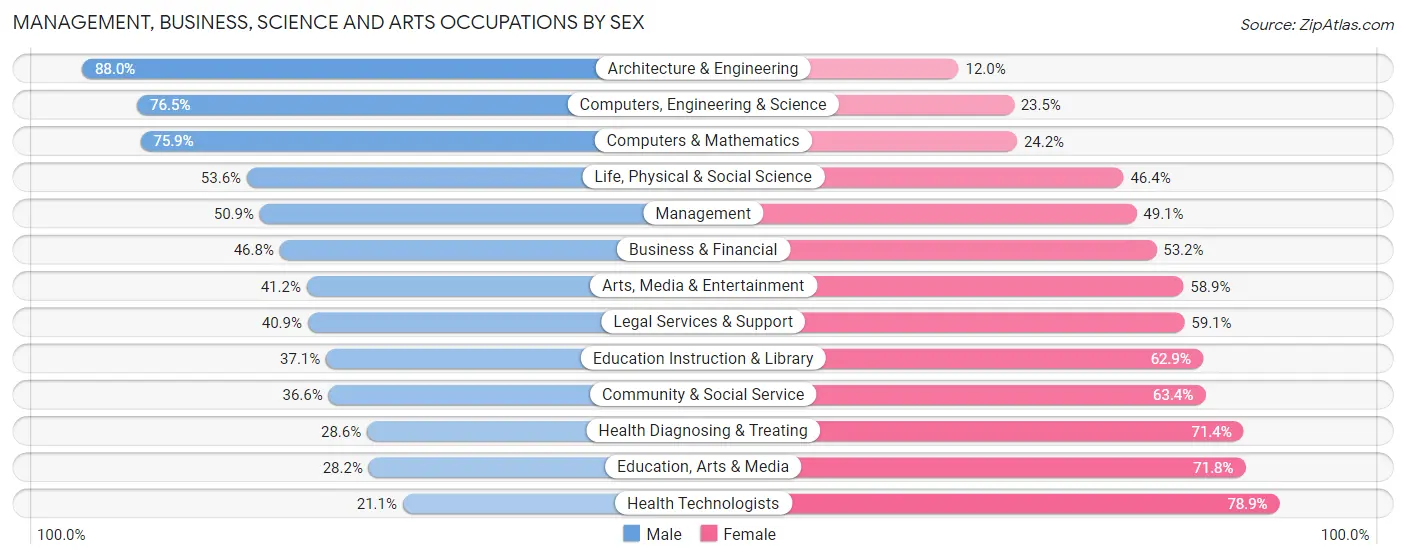
| Occupation | Male | Female |
| Management | 10,189 (50.9%) | 9,813 (49.1%) |
| Business & Financial | 5,013 (46.8%) | 5,702 (53.2%) |
| Computers, Engineering & Science | 12,683 (76.5%) | 3,890 (23.5%) |
| Computers & Mathematics | 5,879 (75.8%) | 1,872 (24.1%) |
| Architecture & Engineering | 5,304 (88.0%) | 721 (12.0%) |
| Life, Physical & Social Science | 1,500 (53.6%) | 1,297 (46.4%) |
| Community & Social Service | 10,537 (36.6%) | 18,250 (63.4%) |
| Education, Arts & Media | 1,361 (28.2%) | 3,463 (71.8%) |
| Legal Services & Support | 798 (40.9%) | 1,152 (59.1%) |
| Education Instruction & Library | 6,231 (37.1%) | 10,565 (62.9%) |
| Arts, Media & Entertainment | 2,147 (41.1%) | 3,070 (58.9%) |
| Health Diagnosing & Treating | 3,974 (28.6%) | 9,936 (71.4%) |
| Health Technologists | 1,736 (21.1%) | 6,491 (78.9%) |
| Total (Category) | 42,396 (47.1%) | 47,591 (52.9%) |
| Total (Overall) | 131,531 (52.3%) | 120,148 (47.7%) |
Services Occupations
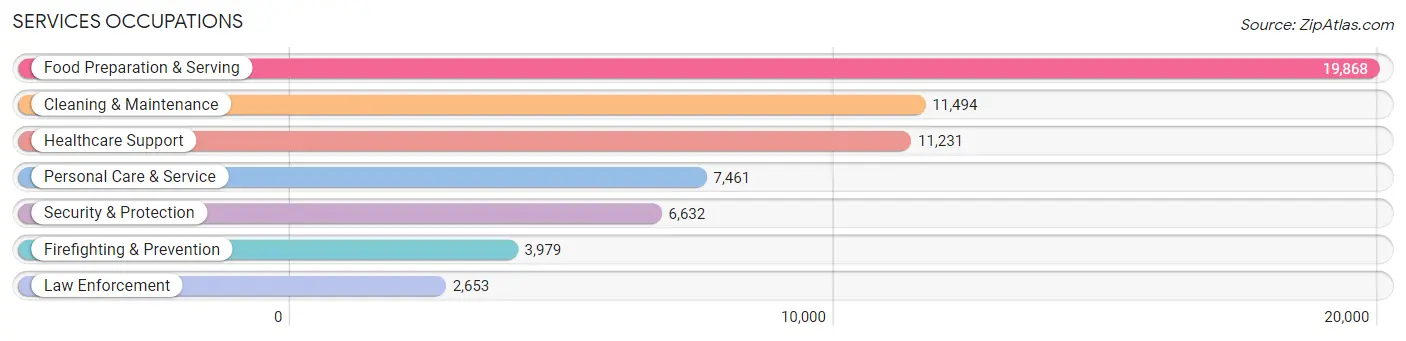
The most common Services occupations in Tucson are Food Preparation & Serving (19,868 | 7.9%), Cleaning & Maintenance (11,494 | 4.6%), Healthcare Support (11,231 | 4.5%), Personal Care & Service (7,461 | 3.0%), and Security & Protection (6,632 | 2.6%).
Services Occupations by Sex
Within the Services occupations in Tucson, the most male-oriented occupations are Law Enforcement (82.5%), Security & Protection (80.9%), and Firefighting & Prevention (79.8%), while the most female-oriented occupations are Healthcare Support (77.5%), Personal Care & Service (73.6%), and Food Preparation & Serving (49.1%).
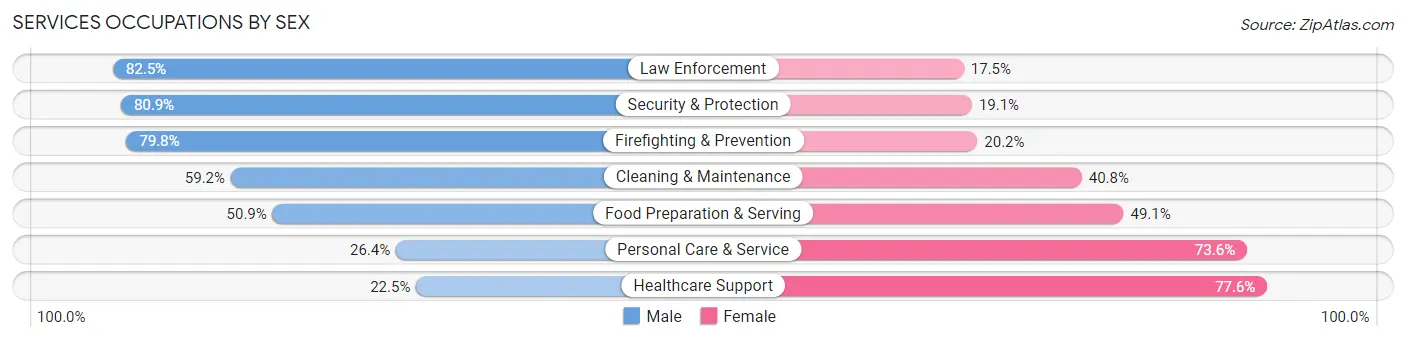
| Occupation | Male | Female |
| Healthcare Support | 2,521 (22.5%) | 8,710 (77.5%) |
| Security & Protection | 5,366 (80.9%) | 1,266 (19.1%) |
| Firefighting & Prevention | 3,177 (79.8%) | 802 (20.2%) |
| Law Enforcement | 2,189 (82.5%) | 464 (17.5%) |
| Food Preparation & Serving | 10,111 (50.9%) | 9,757 (49.1%) |
| Cleaning & Maintenance | 6,800 (59.2%) | 4,694 (40.8%) |
| Personal Care & Service | 1,973 (26.4%) | 5,488 (73.6%) |
| Total (Category) | 26,771 (47.2%) | 29,915 (52.8%) |
| Total (Overall) | 131,531 (52.3%) | 120,148 (47.7%) |
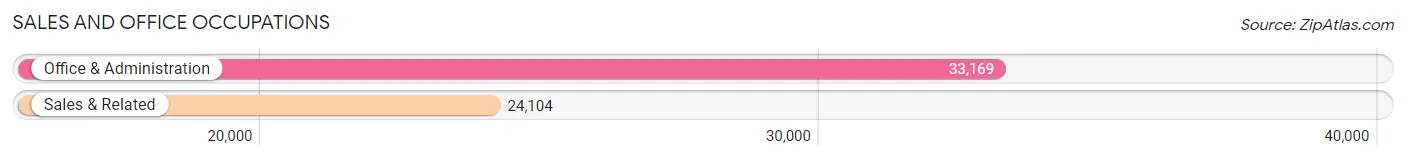
Sales and Office Occupations
The most common Sales and Office occupations in Tucson are Office & Administration (33,169 | 13.2%), and Sales & Related (24,104 | 9.6%).
Sales and Office Occupations by Sex
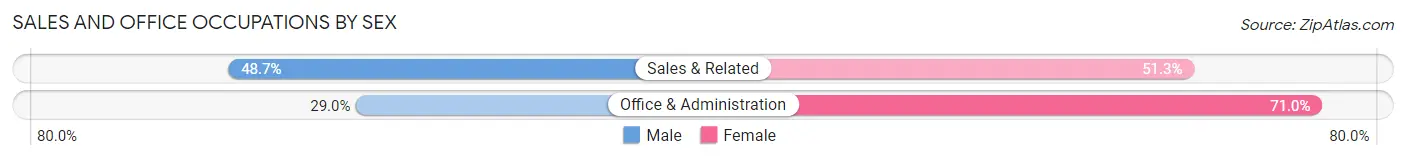
| Occupation | Male | Female |
| Sales & Related | 11,732 (48.7%) | 12,372 (51.3%) |
| Office & Administration | 9,610 (29.0%) | 23,559 (71.0%) |
| Total (Category) | 21,342 (37.3%) | 35,931 (62.7%) |
| Total (Overall) | 131,531 (52.3%) | 120,148 (47.7%) |
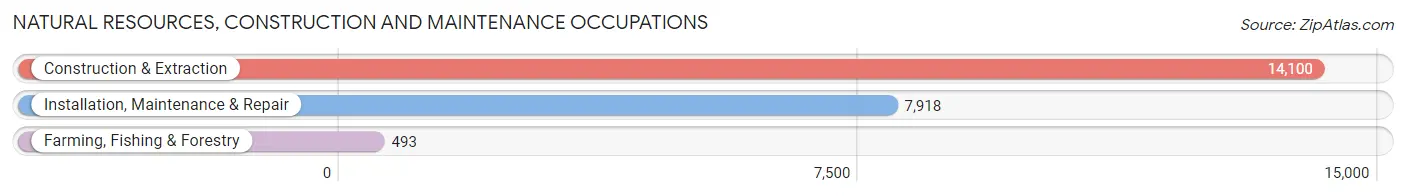
Natural Resources, Construction and Maintenance Occupations
The most common Natural Resources, Construction and Maintenance occupations in Tucson are Construction & Extraction (14,100 | 5.6%), Installation, Maintenance & Repair (7,918 | 3.2%), and Farming, Fishing & Forestry (493 | 0.2%).
Natural Resources, Construction and Maintenance Occupations by Sex
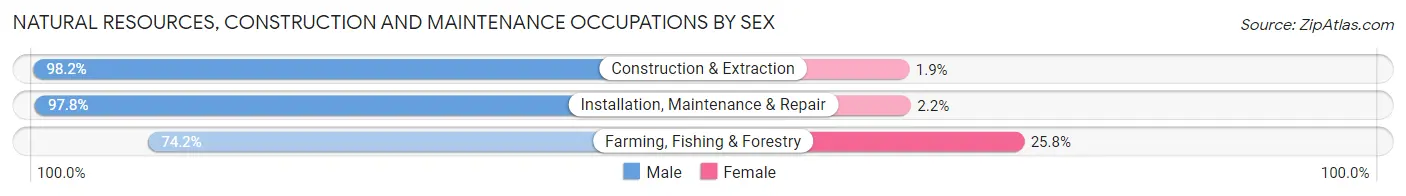
| Occupation | Male | Female |
| Farming, Fishing & Forestry | 366 (74.2%) | 127 (25.8%) |
| Construction & Extraction | 13,839 (98.2%) | 261 (1.8%) |
| Installation, Maintenance & Repair | 7,745 (97.8%) | 173 (2.2%) |
| Total (Category) | 21,950 (97.5%) | 561 (2.5%) |
| Total (Overall) | 131,531 (52.3%) | 120,148 (47.7%) |
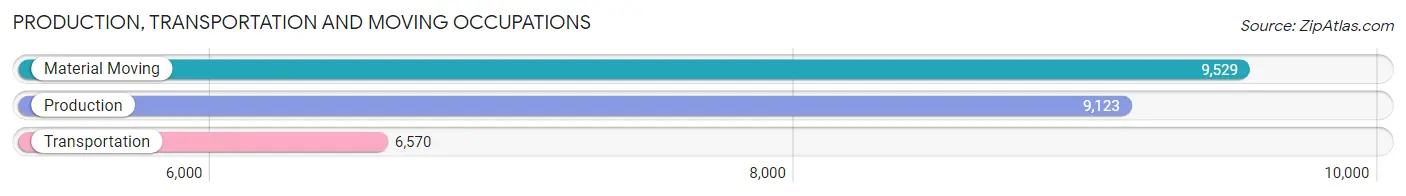
Production, Transportation and Moving Occupations
The most common Production, Transportation and Moving occupations in Tucson are Material Moving (9,529 | 3.8%), Production (9,123 | 3.6%), and Transportation (6,570 | 2.6%).
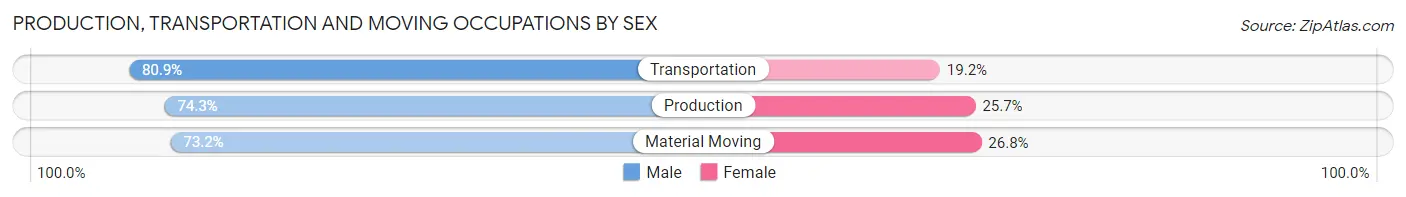
Production, Transportation and Moving Occupations by Sex
| Occupation | Male | Female |
| Production | 6,781 (74.3%) | 2,342 (25.7%) |
| Transportation | 5,312 (80.8%) | 1,258 (19.2%) |
| Material Moving | 6,979 (73.2%) | 2,550 (26.8%) |
| Total (Category) | 19,072 (75.6%) | 6,150 (24.4%) |
| Total (Overall) | 131,531 (52.3%) | 120,148 (47.7%) |
Employment Industries by Sex in Tucson
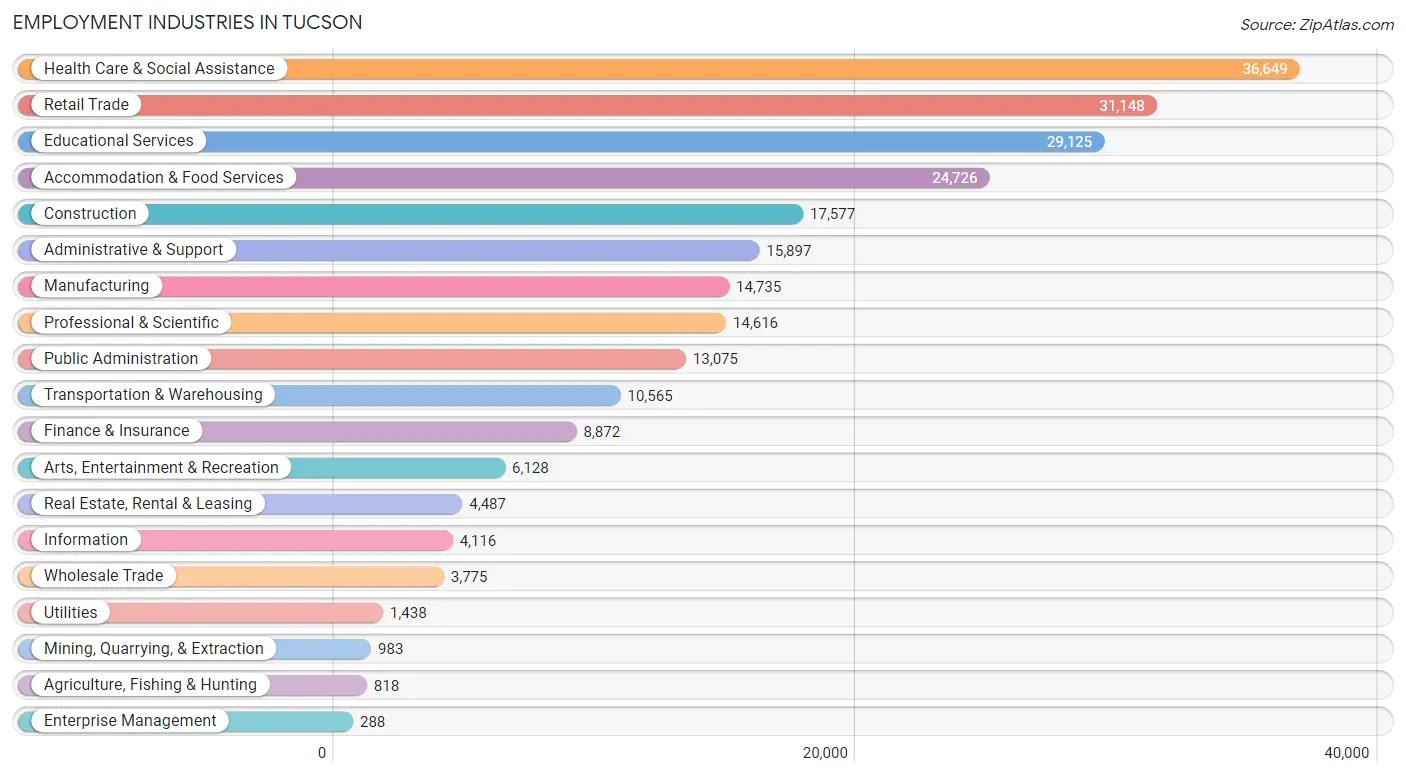
Employment Industries in Tucson
The major employment industries in Tucson include Health Care & Social Assistance (36,649 | 14.6%), Retail Trade (31,148 | 12.4%), Educational Services (29,125 | 11.6%), Accommodation & Food Services (24,726 | 9.8%), and Construction (17,577 | 7.0%).
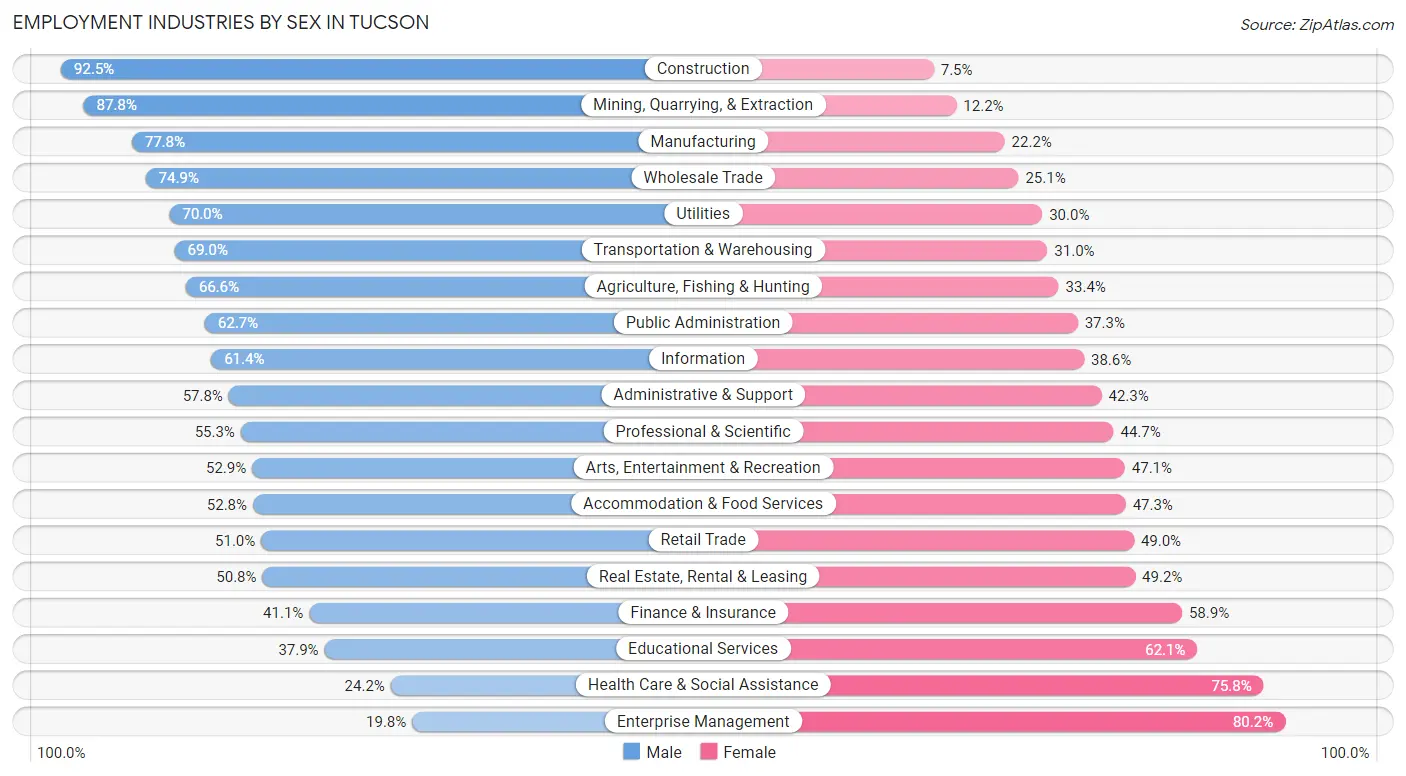
Employment Industries by Sex in Tucson
The Tucson industries that see more men than women are Construction (92.5%), Mining, Quarrying, & Extraction (87.8%), and Manufacturing (77.8%), whereas the industries that tend to have a higher number of women are Enterprise Management (80.2%), Health Care & Social Assistance (75.8%), and Educational Services (62.1%).
| Industry | Male | Female |
| Agriculture, Fishing & Hunting | 545 (66.6%) | 273 (33.4%) |
| Mining, Quarrying, & Extraction | 863 (87.8%) | 120 (12.2%) |
| Construction | 16,256 (92.5%) | 1,321 (7.5%) |
| Manufacturing | 11,464 (77.8%) | 3,271 (22.2%) |
| Wholesale Trade | 2,829 (74.9%) | 946 (25.1%) |
| Retail Trade | 15,898 (51.0%) | 15,250 (49.0%) |
| Transportation & Warehousing | 7,286 (69.0%) | 3,279 (31.0%) |
| Utilities | 1,007 (70.0%) | 431 (30.0%) |
| Information | 2,526 (61.4%) | 1,590 (38.6%) |
| Finance & Insurance | 3,646 (41.1%) | 5,226 (58.9%) |
| Real Estate, Rental & Leasing | 2,279 (50.8%) | 2,208 (49.2%) |
| Professional & Scientific | 8,078 (55.3%) | 6,538 (44.7%) |
| Enterprise Management | 57 (19.8%) | 231 (80.2%) |
| Administrative & Support | 9,180 (57.8%) | 6,717 (42.2%) |
| Educational Services | 11,050 (37.9%) | 18,075 (62.1%) |
| Health Care & Social Assistance | 8,879 (24.2%) | 27,770 (75.8%) |
| Arts, Entertainment & Recreation | 3,243 (52.9%) | 2,885 (47.1%) |
| Accommodation & Food Services | 13,042 (52.7%) | 11,684 (47.2%) |
| Public Administration | 8,195 (62.7%) | 4,880 (37.3%) |
| Total | 131,531 (52.3%) | 120,148 (47.7%) |
Education in Tucson
School Enrollment in Tucson
The most common levels of schooling among the 144,557 students in Tucson are college / undergraduate (47,253 | 32.7%), high school (27,096 | 18.7%), and middle school (24,902 | 17.2%).
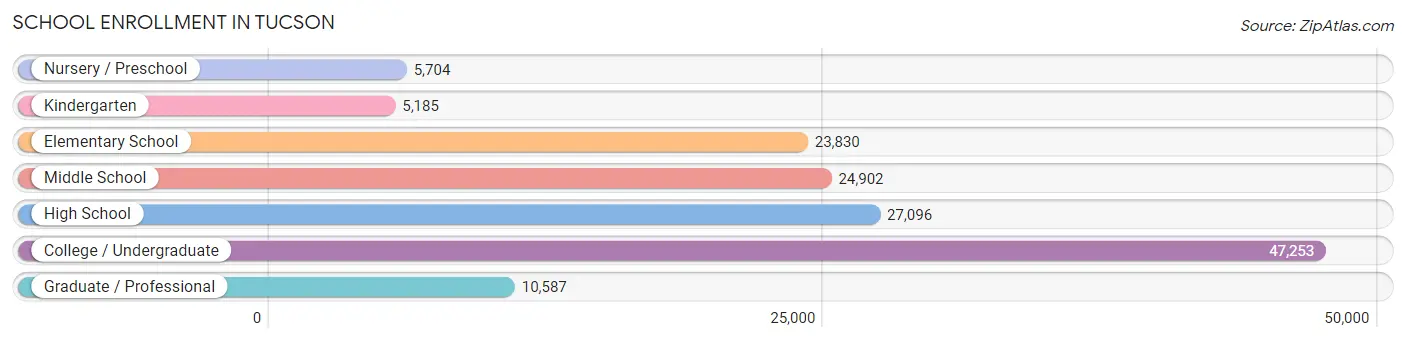
| School Level | # Students | % Students |
| Nursery / Preschool | 5,704 | 4.0% |
| Kindergarten | 5,185 | 3.6% |
| Elementary School | 23,830 | 16.5% |
| Middle School | 24,902 | 17.2% |
| High School | 27,096 | 18.7% |
| College / Undergraduate | 47,253 | 32.7% |
| Graduate / Professional | 10,587 | 7.3% |
| Total | 144,557 | 100.0% |
School Enrollment by Age by Funding Source in Tucson
Out of a total of 144,557 students who are enrolled in schools in Tucson, 14,745 (10.2%) attend a private institution, while the remaining 129,812 (89.8%) are enrolled in public schools. The age group of 3 to 4 year olds has the highest likelihood of being enrolled in private schools, with 1,383 (32.8% in the age bracket) enrolled. Conversely, the age group of 18 to 19 year olds has the lowest likelihood of being enrolled in a private school, with 17,064 (96.5% in the age bracket) attending a public institution.
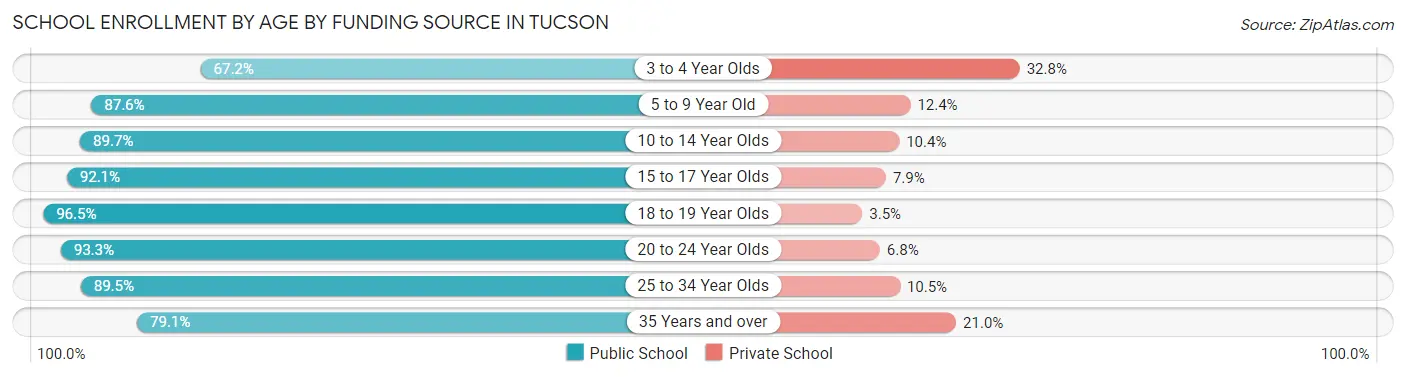
| Age Bracket | Public School | Private School |
| 3 to 4 Year Olds | 2,835 (67.2%) | 1,383 (32.8%) |
| 5 to 9 Year Old | 24,493 (87.6%) | 3,480 (12.4%) |
| 10 to 14 Year Olds | 26,843 (89.6%) | 3,100 (10.3%) |
| 15 to 17 Year Olds | 16,298 (92.1%) | 1,394 (7.9%) |
| 18 to 19 Year Olds | 17,064 (96.5%) | 615 (3.5%) |
| 20 to 24 Year Olds | 24,808 (93.2%) | 1,797 (6.8%) |
| 25 to 34 Year Olds | 11,229 (89.5%) | 1,314 (10.5%) |
| 35 Years and over | 6,248 (79.0%) | 1,656 (20.9%) |
| Total | 129,812 (89.8%) | 14,745 (10.2%) |
Educational Attainment by Field of Study in Tucson
Business (16,050 | 14.4%), education (12,726 | 11.4%), science & technology (10,831 | 9.7%), social sciences (9,945 | 8.9%), and engineering (8,649 | 7.8%) are the most common fields of study among 111,375 individuals in Tucson who have obtained a bachelor's degree or higher.
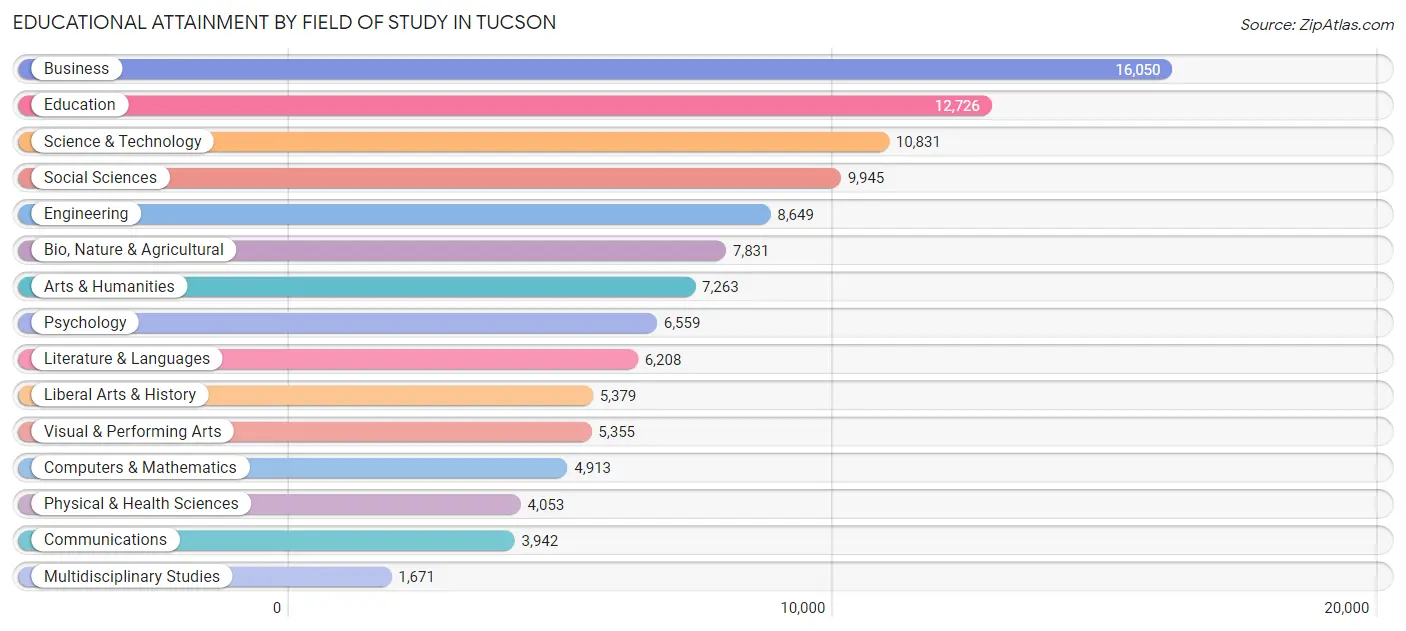
| Field of Study | # Graduates | % Graduates |
| Computers & Mathematics | 4,913 | 4.4% |
| Bio, Nature & Agricultural | 7,831 | 7.0% |
| Physical & Health Sciences | 4,053 | 3.6% |
| Psychology | 6,559 | 5.9% |
| Social Sciences | 9,945 | 8.9% |
| Engineering | 8,649 | 7.8% |
| Multidisciplinary Studies | 1,671 | 1.5% |
| Science & Technology | 10,831 | 9.7% |
| Business | 16,050 | 14.4% |
| Education | 12,726 | 11.4% |
| Literature & Languages | 6,208 | 5.6% |
| Liberal Arts & History | 5,379 | 4.8% |
| Visual & Performing Arts | 5,355 | 4.8% |
| Communications | 3,942 | 3.5% |
| Arts & Humanities | 7,263 | 6.5% |
| Total | 111,375 | 100.0% |
Transportation & Commute in Tucson
Vehicle Availability by Sex in Tucson
The most prevalent vehicle ownership categories in Tucson are males with 2 vehicles (52,138, accounting for 39.5%) and females with 2 vehicles (46,102, making up 45.0%).
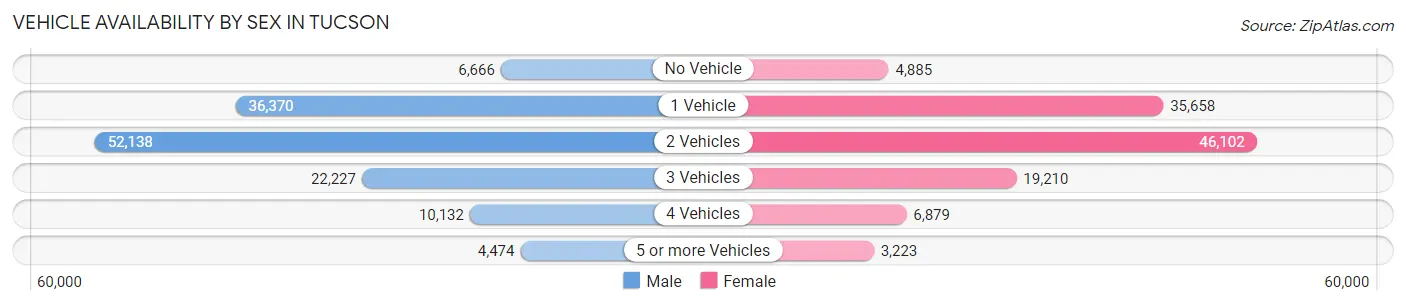
| Vehicles Available | Male | Female |
| No Vehicle | 6,666 (5.1%) | 4,885 (4.2%) |
| 1 Vehicle | 36,370 (27.6%) | 35,658 (30.7%) |
| 2 Vehicles | 52,138 (39.5%) | 46,102 (39.8%) |
| 3 Vehicles | 22,227 (16.8%) | 19,210 (16.6%) |
| 4 Vehicles | 10,132 (7.7%) | 6,879 (5.9%) |
| 5 or more Vehicles | 4,474 (3.4%) | 3,223 (2.8%) |
| Total | 132,007 (100.0%) | 115,957 (100.0%) |
Commute Time in Tucson
The most frequently occuring commute durations in Tucson are 15 to 19 minutes (44,955 commuters, 20.0%), 20 to 24 minutes (40,136 commuters, 17.8%), and 10 to 14 minutes (32,857 commuters, 14.6%).
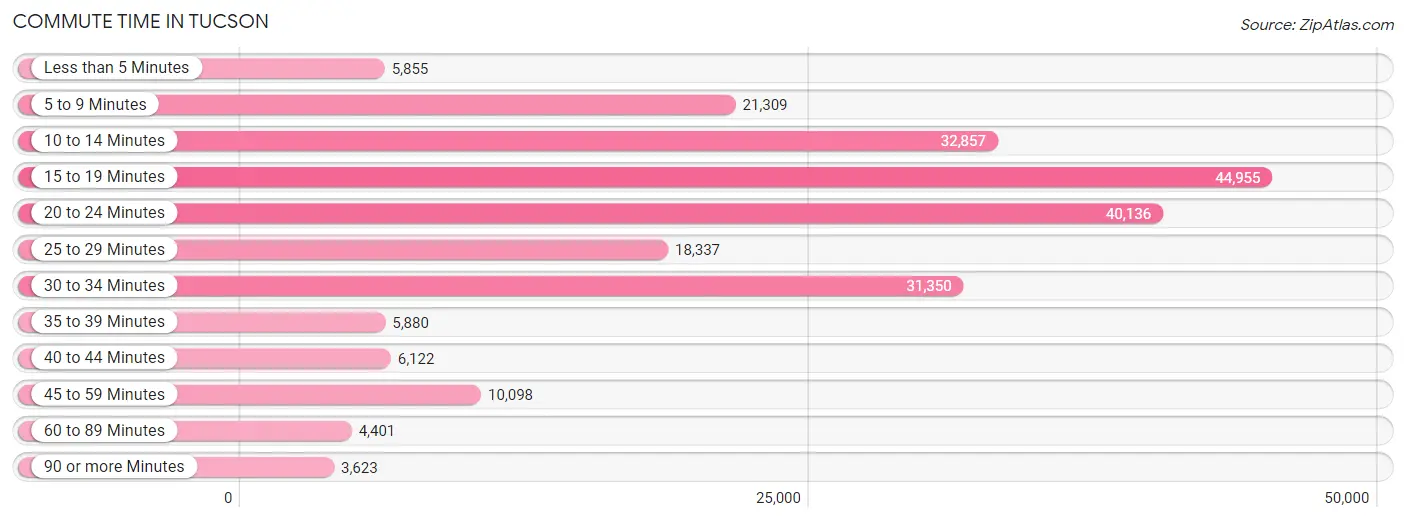
| Commute Time | # Commuters | % Commuters |
| Less than 5 Minutes | 5,855 | 2.6% |
| 5 to 9 Minutes | 21,309 | 9.5% |
| 10 to 14 Minutes | 32,857 | 14.6% |
| 15 to 19 Minutes | 44,955 | 20.0% |
| 20 to 24 Minutes | 40,136 | 17.8% |
| 25 to 29 Minutes | 18,337 | 8.2% |
| 30 to 34 Minutes | 31,350 | 13.9% |
| 35 to 39 Minutes | 5,880 | 2.6% |
| 40 to 44 Minutes | 6,122 | 2.7% |
| 45 to 59 Minutes | 10,098 | 4.5% |
| 60 to 89 Minutes | 4,401 | 2.0% |
| 90 or more Minutes | 3,623 | 1.6% |
Commute Time by Sex in Tucson
The most common commute times in Tucson are 15 to 19 minutes (23,866 commuters, 19.6%) for males and 15 to 19 minutes (21,089 commuters, 20.5%) for females.
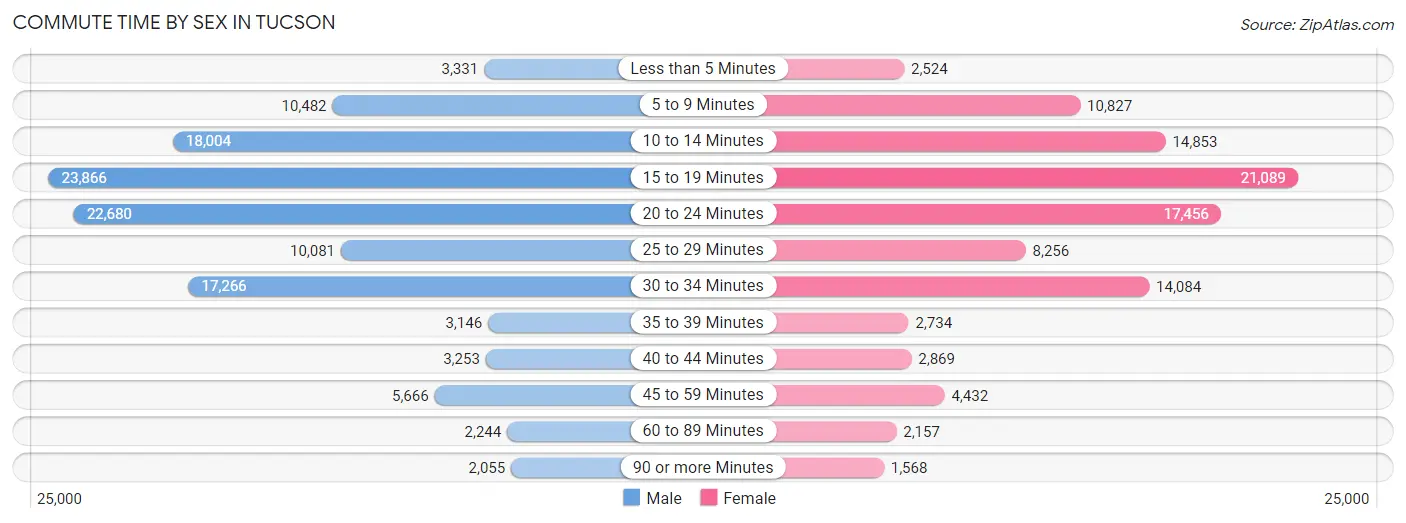
| Commute Time | Male | Female |
| Less than 5 Minutes | 3,331 (2.7%) | 2,524 (2.5%) |
| 5 to 9 Minutes | 10,482 (8.6%) | 10,827 (10.5%) |
| 10 to 14 Minutes | 18,004 (14.7%) | 14,853 (14.4%) |
| 15 to 19 Minutes | 23,866 (19.6%) | 21,089 (20.5%) |
| 20 to 24 Minutes | 22,680 (18.6%) | 17,456 (17.0%) |
| 25 to 29 Minutes | 10,081 (8.3%) | 8,256 (8.0%) |
| 30 to 34 Minutes | 17,266 (14.1%) | 14,084 (13.7%) |
| 35 to 39 Minutes | 3,146 (2.6%) | 2,734 (2.7%) |
| 40 to 44 Minutes | 3,253 (2.7%) | 2,869 (2.8%) |
| 45 to 59 Minutes | 5,666 (4.6%) | 4,432 (4.3%) |
| 60 to 89 Minutes | 2,244 (1.8%) | 2,157 (2.1%) |
| 90 or more Minutes | 2,055 (1.7%) | 1,568 (1.5%) |
Time of Departure to Work by Sex in Tucson
The most frequent times of departure to work in Tucson are 7:00 AM to 7:29 AM (13,763, 11.3%) for males and 7:30 AM to 7:59 AM (14,849, 14.4%) for females.
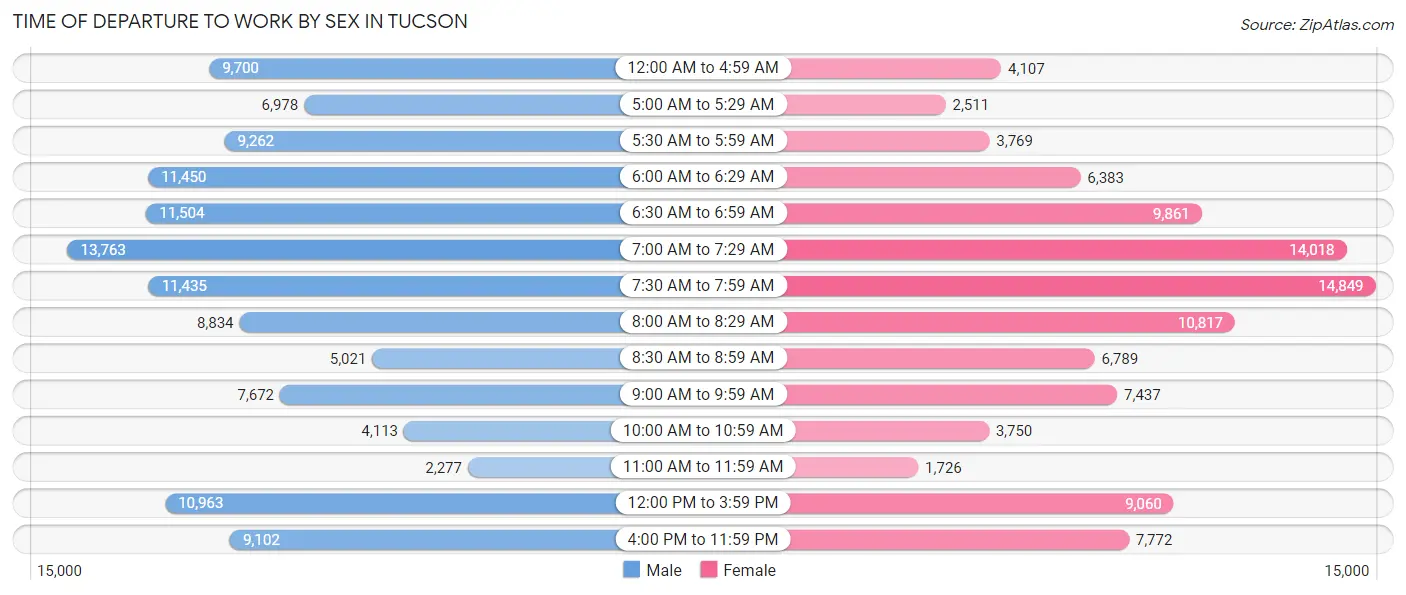
| Time of Departure | Male | Female |
| 12:00 AM to 4:59 AM | 9,700 (8.0%) | 4,107 (4.0%) |
| 5:00 AM to 5:29 AM | 6,978 (5.7%) | 2,511 (2.4%) |
| 5:30 AM to 5:59 AM | 9,262 (7.6%) | 3,769 (3.7%) |
| 6:00 AM to 6:29 AM | 11,450 (9.4%) | 6,383 (6.2%) |
| 6:30 AM to 6:59 AM | 11,504 (9.4%) | 9,861 (9.6%) |
| 7:00 AM to 7:29 AM | 13,763 (11.3%) | 14,018 (13.6%) |
| 7:30 AM to 7:59 AM | 11,435 (9.4%) | 14,849 (14.4%) |
| 8:00 AM to 8:29 AM | 8,834 (7.2%) | 10,817 (10.5%) |
| 8:30 AM to 8:59 AM | 5,021 (4.1%) | 6,789 (6.6%) |
| 9:00 AM to 9:59 AM | 7,672 (6.3%) | 7,437 (7.2%) |
| 10:00 AM to 10:59 AM | 4,113 (3.4%) | 3,750 (3.6%) |
| 11:00 AM to 11:59 AM | 2,277 (1.9%) | 1,726 (1.7%) |
| 12:00 PM to 3:59 PM | 10,963 (9.0%) | 9,060 (8.8%) |
| 4:00 PM to 11:59 PM | 9,102 (7.5%) | 7,772 (7.6%) |
| Total | 122,074 (100.0%) | 102,849 (100.0%) |
Housing Occupancy in Tucson
Occupancy by Ownership in Tucson
Of the total 220,769 dwellings in Tucson, owner-occupied units account for 112,458 (50.9%), while renter-occupied units make up 108,311 (49.1%).
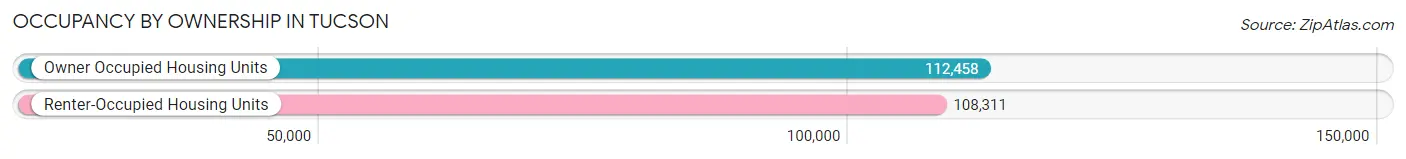
| Occupancy | # Housing Units | % Housing Units |
| Owner Occupied Housing Units | 112,458 | 50.9% |
| Renter-Occupied Housing Units | 108,311 | 49.1% |
| Total Occupied Housing Units | 220,769 | 100.0% |
Occupancy by Household Size in Tucson
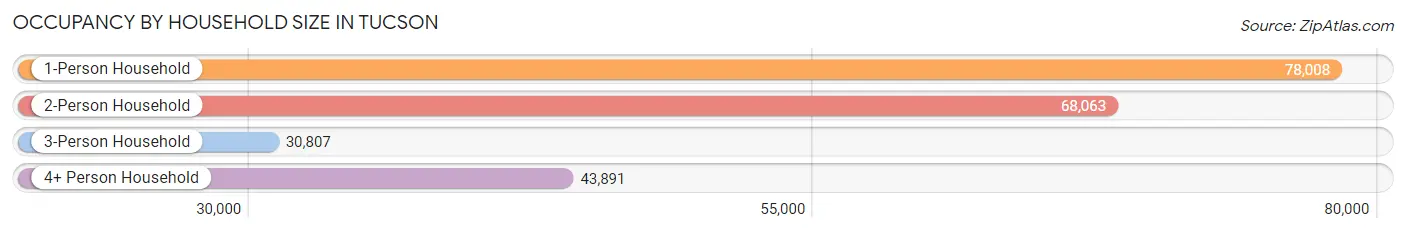
| Household Size | # Housing Units | % Housing Units |
| 1-Person Household | 78,008 | 35.3% |
| 2-Person Household | 68,063 | 30.8% |
| 3-Person Household | 30,807 | 14.0% |
| 4+ Person Household | 43,891 | 19.9% |
| Total Housing Units | 220,769 | 100.0% |
Occupancy by Ownership by Household Size in Tucson
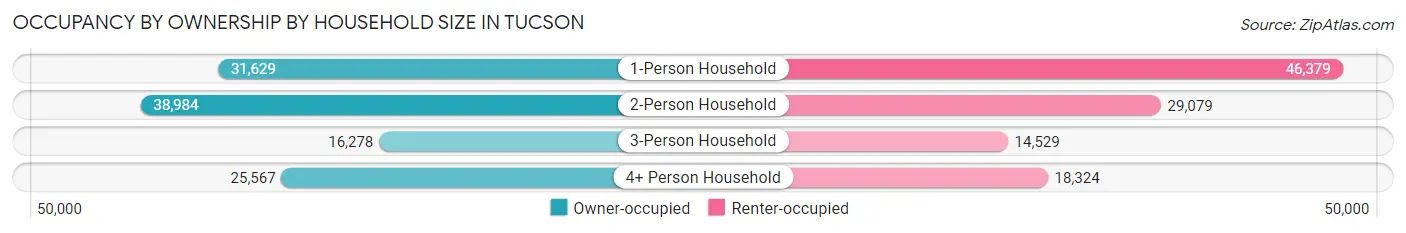
| Household Size | Owner-occupied | Renter-occupied |
| 1-Person Household | 31,629 (40.6%) | 46,379 (59.5%) |
| 2-Person Household | 38,984 (57.3%) | 29,079 (42.7%) |
| 3-Person Household | 16,278 (52.8%) | 14,529 (47.2%) |
| 4+ Person Household | 25,567 (58.3%) | 18,324 (41.7%) |
| Total Housing Units | 112,458 (50.9%) | 108,311 (49.1%) |
Occupancy by Educational Attainment in Tucson
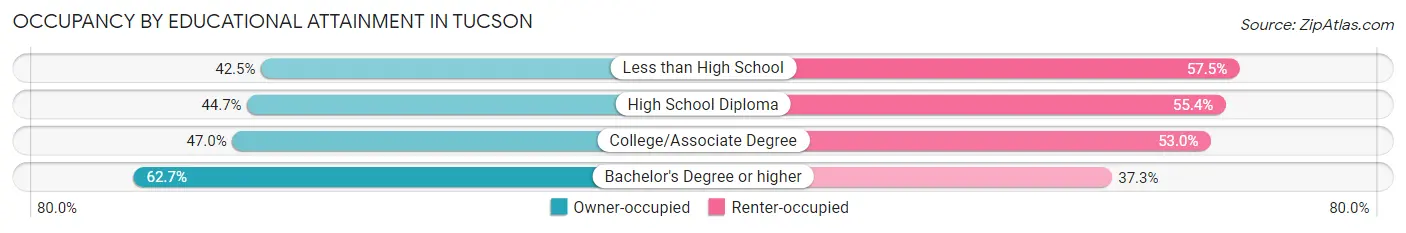
| Household Size | Owner-occupied | Renter-occupied |
| Less than High School | 10,309 (42.5%) | 13,971 (57.5%) |
| High School Diploma | 20,100 (44.7%) | 24,917 (55.3%) |
| College/Associate Degree | 38,755 (47.0%) | 43,675 (53.0%) |
| Bachelor's Degree or higher | 43,294 (62.7%) | 25,748 (37.3%) |
Occupancy by Age of Householder in Tucson
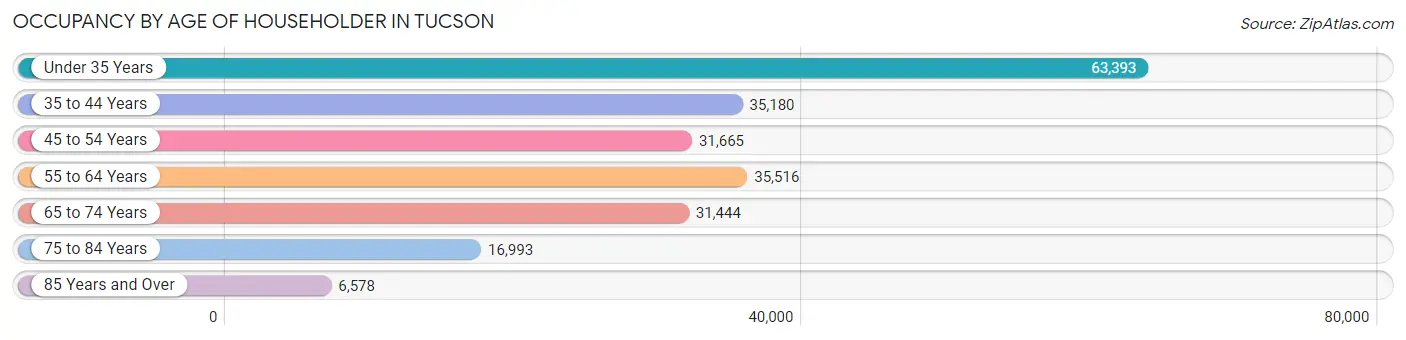
| Age Bracket | # Households | % Households |
| Under 35 Years | 63,393 | 28.7% |
| 35 to 44 Years | 35,180 | 15.9% |
| 45 to 54 Years | 31,665 | 14.3% |
| 55 to 64 Years | 35,516 | 16.1% |
| 65 to 74 Years | 31,444 | 14.2% |
| 75 to 84 Years | 16,993 | 7.7% |
| 85 Years and Over | 6,578 | 3.0% |
| Total | 220,769 | 100.0% |
Housing Finances in Tucson
Median Income by Occupancy in Tucson
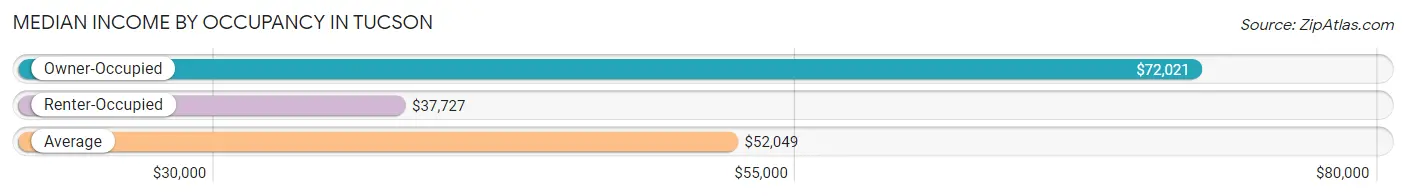
| Occupancy Type | # Households | Median Income |
| Owner-Occupied | 112,458 (50.9%) | $72,021 |
| Renter-Occupied | 108,311 (49.1%) | $37,727 |
| Average | 220,769 (100.0%) | $52,049 |
Occupancy by Householder Income Bracket in Tucson
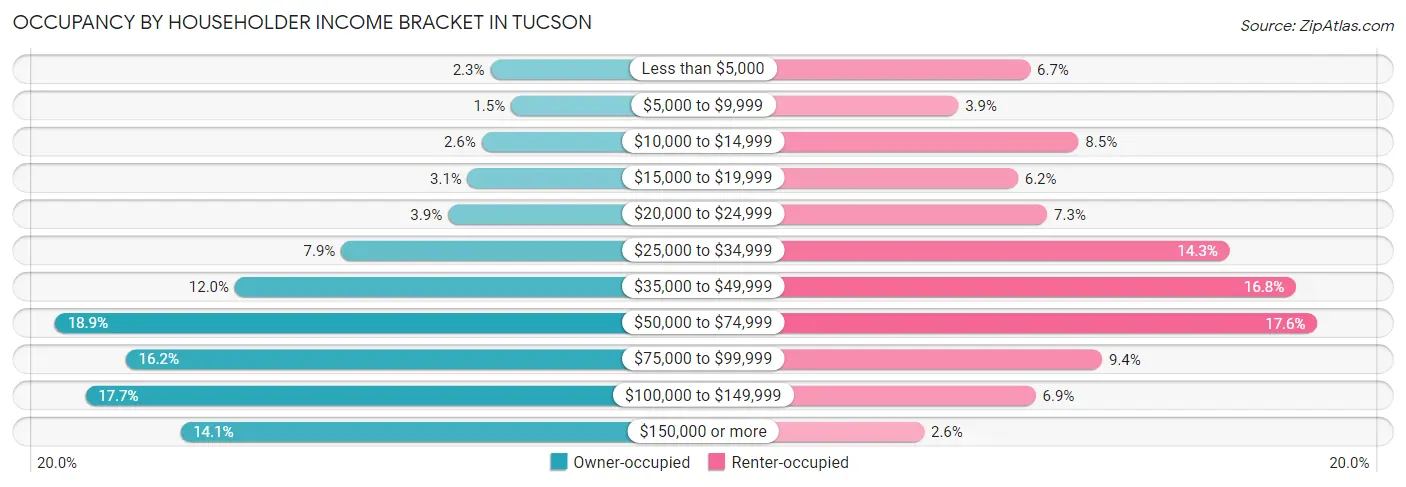
| Income Bracket | Owner-occupied | Renter-occupied |
| Less than $5,000 | 2,539 (2.3%) | 7,200 (6.7%) |
| $5,000 to $9,999 | 1,653 (1.5%) | 4,230 (3.9%) |
| $10,000 to $14,999 | 2,914 (2.6%) | 9,199 (8.5%) |
| $15,000 to $19,999 | 3,510 (3.1%) | 6,691 (6.2%) |
| $20,000 to $24,999 | 4,357 (3.9%) | 7,912 (7.3%) |
| $25,000 to $34,999 | 8,927 (7.9%) | 15,435 (14.2%) |
| $35,000 to $49,999 | 13,481 (12.0%) | 18,170 (16.8%) |
| $50,000 to $74,999 | 21,203 (18.9%) | 19,048 (17.6%) |
| $75,000 to $99,999 | 18,161 (16.2%) | 10,171 (9.4%) |
| $100,000 to $149,999 | 19,889 (17.7%) | 7,428 (6.9%) |
| $150,000 or more | 15,824 (14.1%) | 2,827 (2.6%) |
| Total | 112,458 (100.0%) | 108,311 (100.0%) |
Monthly Housing Cost Tiers in Tucson
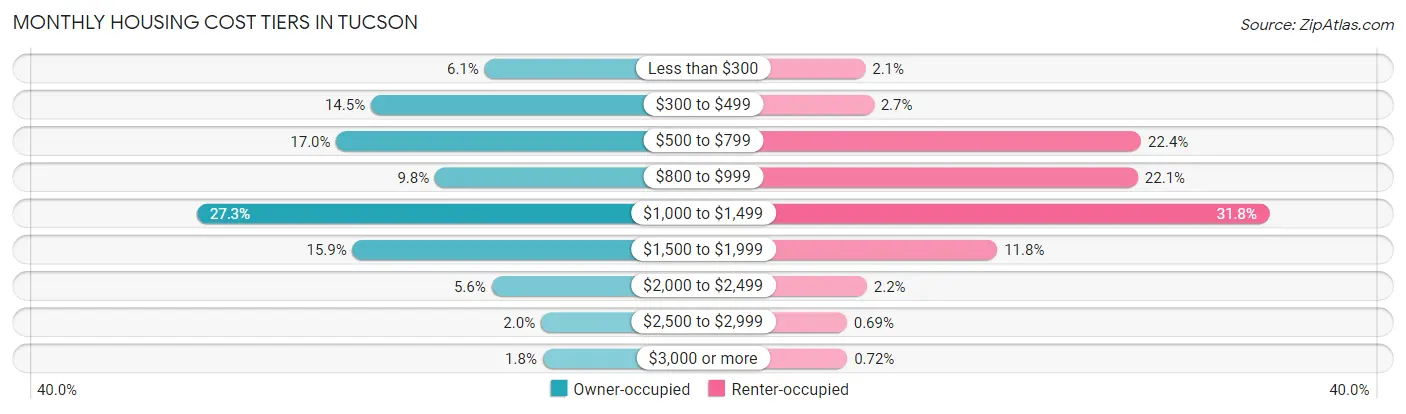
| Monthly Cost | Owner-occupied | Renter-occupied |
| Less than $300 | 6,886 (6.1%) | 2,225 (2.1%) |
| $300 to $499 | 16,299 (14.5%) | 2,891 (2.7%) |
| $500 to $799 | 19,163 (17.0%) | 24,233 (22.4%) |
| $800 to $999 | 10,990 (9.8%) | 23,969 (22.1%) |
| $1,000 to $1,499 | 30,714 (27.3%) | 34,411 (31.8%) |
| $1,500 to $1,999 | 17,820 (15.9%) | 12,753 (11.8%) |
| $2,000 to $2,499 | 6,304 (5.6%) | 2,353 (2.2%) |
| $2,500 to $2,999 | 2,216 (2.0%) | 747 (0.7%) |
| $3,000 or more | 2,066 (1.8%) | 779 (0.7%) |
| Total | 112,458 (100.0%) | 108,311 (100.0%) |
Physical Housing Characteristics in Tucson
Housing Structures in Tucson
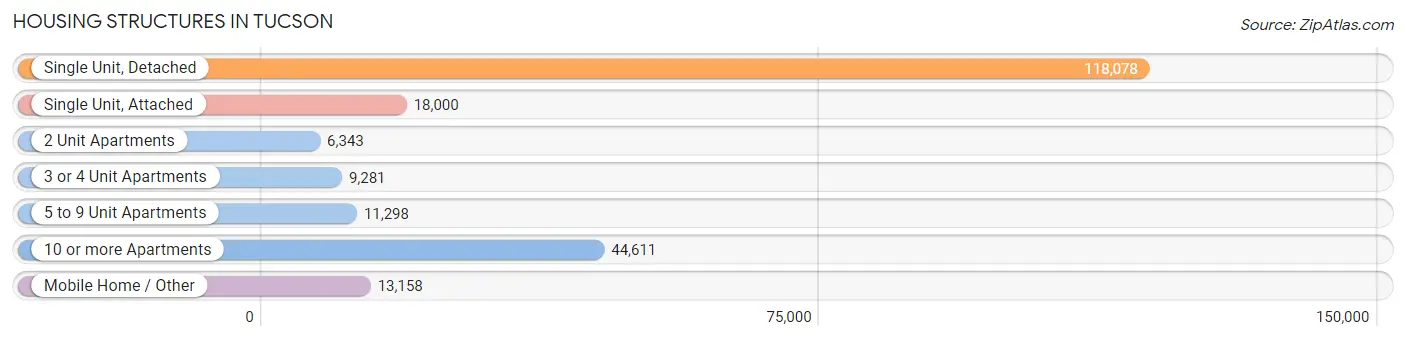
| Structure Type | # Housing Units | % Housing Units |
| Single Unit, Detached | 118,078 | 53.5% |
| Single Unit, Attached | 18,000 | 8.2% |
| 2 Unit Apartments | 6,343 | 2.9% |
| 3 or 4 Unit Apartments | 9,281 | 4.2% |
| 5 to 9 Unit Apartments | 11,298 | 5.1% |
| 10 or more Apartments | 44,611 | 20.2% |
| Mobile Home / Other | 13,158 | 6.0% |
| Total | 220,769 | 100.0% |
Housing Structures by Occupancy in Tucson
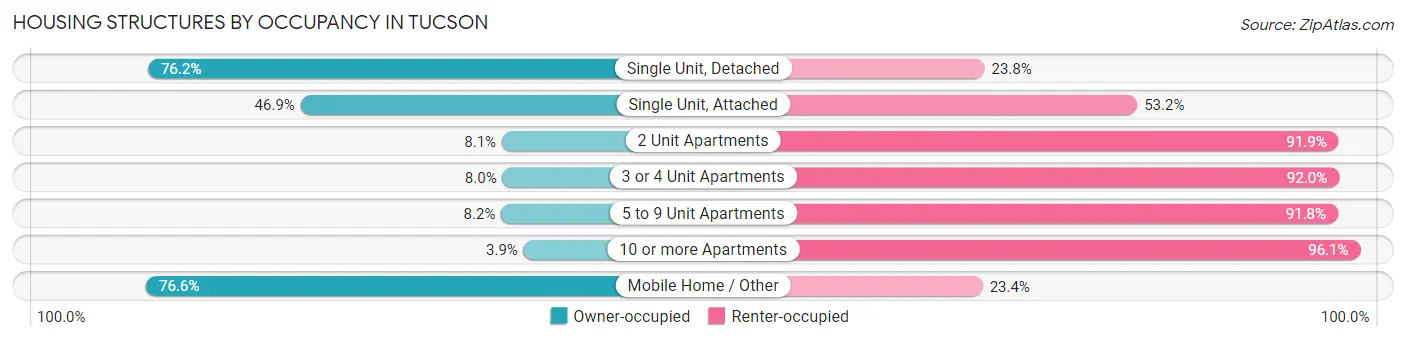
| Structure Type | Owner-occupied | Renter-occupied |
| Single Unit, Detached | 90,021 (76.2%) | 28,057 (23.8%) |
| Single Unit, Attached | 8,433 (46.9%) | 9,567 (53.1%) |
| 2 Unit Apartments | 513 (8.1%) | 5,830 (91.9%) |
| 3 or 4 Unit Apartments | 742 (8.0%) | 8,539 (92.0%) |
| 5 to 9 Unit Apartments | 930 (8.2%) | 10,368 (91.8%) |
| 10 or more Apartments | 1,740 (3.9%) | 42,871 (96.1%) |
| Mobile Home / Other | 10,079 (76.6%) | 3,079 (23.4%) |
| Total | 112,458 (50.9%) | 108,311 (49.1%) |
Housing Structures by Number of Rooms in Tucson
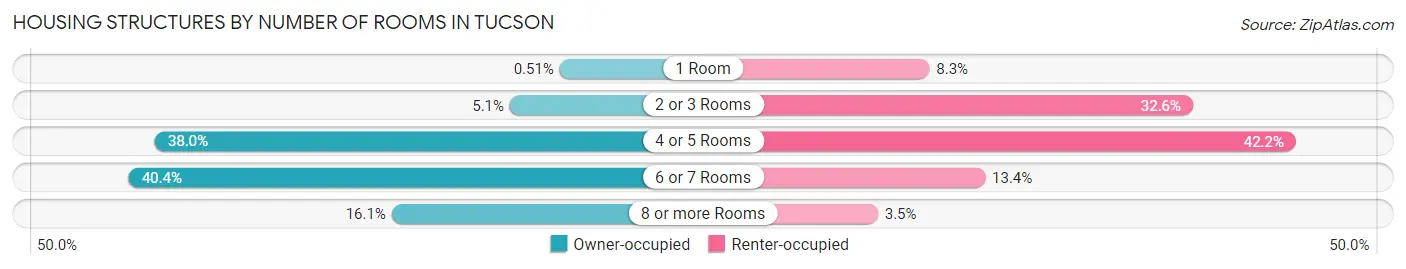
| Number of Rooms | Owner-occupied | Renter-occupied |
| 1 Room | 578 (0.5%) | 8,953 (8.3%) |
| 2 or 3 Rooms | 5,753 (5.1%) | 35,353 (32.6%) |
| 4 or 5 Rooms | 42,678 (38.0%) | 45,668 (42.2%) |
| 6 or 7 Rooms | 45,398 (40.4%) | 14,551 (13.4%) |
| 8 or more Rooms | 18,051 (16.1%) | 3,786 (3.5%) |
| Total | 112,458 (100.0%) | 108,311 (100.0%) |
Housing Structure by Heating Type in Tucson
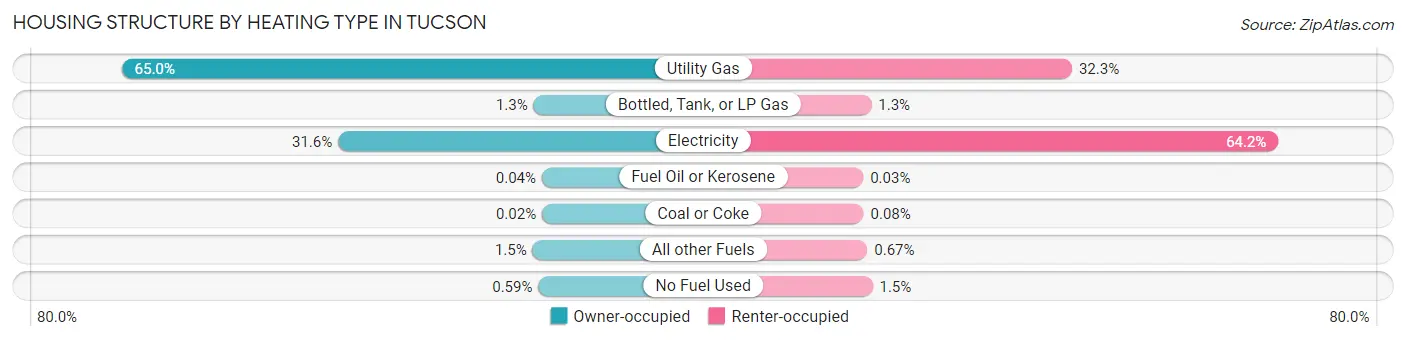
| Heating Type | Owner-occupied | Renter-occupied |
| Utility Gas | 73,096 (65.0%) | 34,984 (32.3%) |
| Bottled, Tank, or LP Gas | 1,481 (1.3%) | 1,390 (1.3%) |
| Electricity | 35,484 (31.6%) | 69,502 (64.2%) |
| Fuel Oil or Kerosene | 45 (0.0%) | 31 (0.0%) |
| Coal or Coke | 22 (0.0%) | 90 (0.1%) |
| All other Fuels | 1,665 (1.5%) | 723 (0.7%) |
| No Fuel Used | 665 (0.6%) | 1,591 (1.5%) |
| Total | 112,458 (100.0%) | 108,311 (100.0%) |
Household Vehicle Usage in Tucson
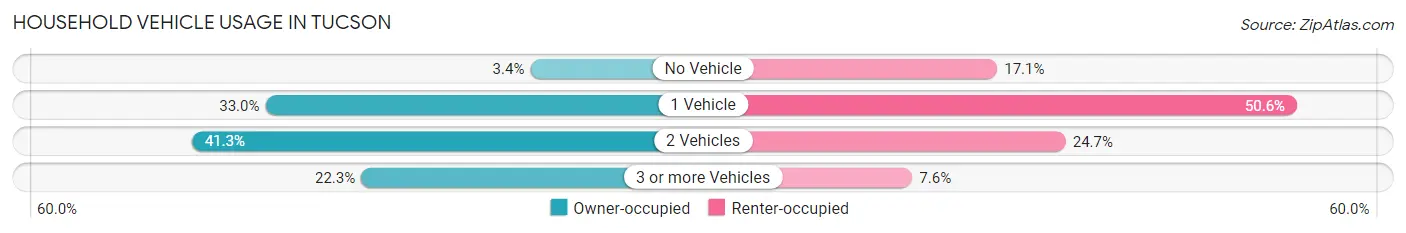
| Vehicles per Household | Owner-occupied | Renter-occupied |
| No Vehicle | 3,780 (3.4%) | 18,491 (17.1%) |
| 1 Vehicle | 37,158 (33.0%) | 54,837 (50.6%) |
| 2 Vehicles | 46,427 (41.3%) | 26,796 (24.7%) |
| 3 or more Vehicles | 25,093 (22.3%) | 8,187 (7.6%) |
| Total | 112,458 (100.0%) | 108,311 (100.0%) |
Real Estate & Mortgages in Tucson
Real Estate and Mortgage Overview in Tucson
| Characteristic | Without Mortgage | With Mortgage |
| Housing Units | 41,480 | 70,978 |
| Median Property Value | $198,700 | $227,700 |
| Median Household Income | $55,757 | $11,853 |
| Monthly Housing Costs | $479 | $2,015 |
| Real Estate Taxes | $1,604 | $2,882 |
Property Value by Mortgage Status in Tucson
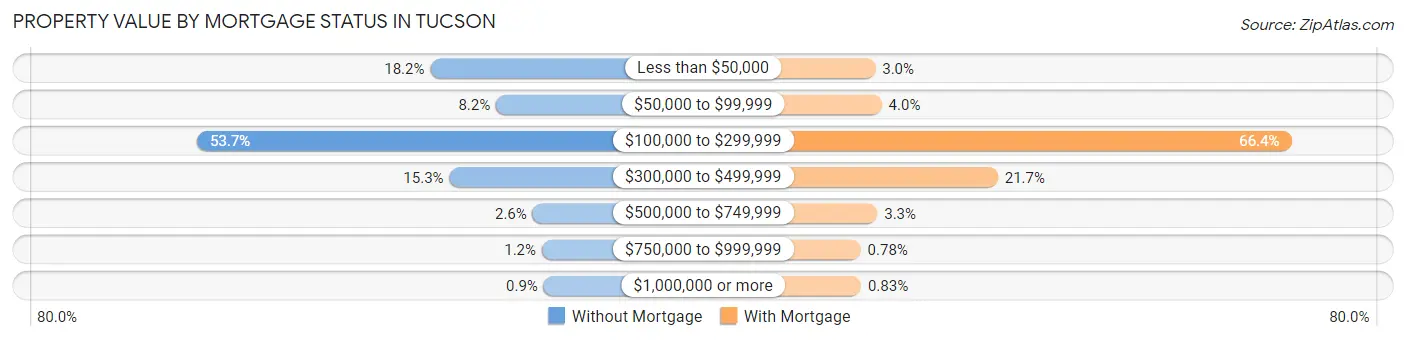
| Property Value | Without Mortgage | With Mortgage |
| Less than $50,000 | 7,542 (18.2%) | 2,135 (3.0%) |
| $50,000 to $99,999 | 3,383 (8.2%) | 2,828 (4.0%) |
| $100,000 to $299,999 | 22,286 (53.7%) | 47,137 (66.4%) |
| $300,000 to $499,999 | 6,332 (15.3%) | 15,383 (21.7%) |
| $500,000 to $749,999 | 1,075 (2.6%) | 2,347 (3.3%) |
| $750,000 to $999,999 | 488 (1.2%) | 557 (0.8%) |
| $1,000,000 or more | 374 (0.9%) | 591 (0.8%) |
| Total | 41,480 (100.0%) | 70,978 (100.0%) |
Household Income by Mortgage Status in Tucson
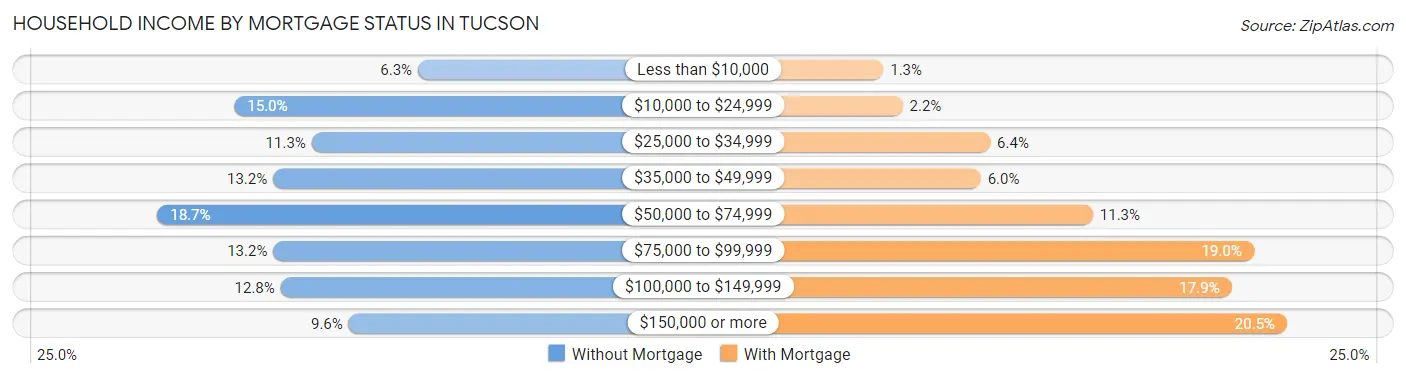
| Household Income | Without Mortgage | With Mortgage |
| Less than $10,000 | 2,600 (6.3%) | 939 (1.3%) |
| $10,000 to $24,999 | 6,228 (15.0%) | 1,592 (2.2%) |
| $25,000 to $34,999 | 4,699 (11.3%) | 4,553 (6.4%) |
| $35,000 to $49,999 | 5,463 (13.2%) | 4,228 (6.0%) |
| $50,000 to $74,999 | 7,748 (18.7%) | 8,018 (11.3%) |
| $75,000 to $99,999 | 5,458 (13.2%) | 13,455 (19.0%) |
| $100,000 to $149,999 | 5,313 (12.8%) | 12,703 (17.9%) |
| $150,000 or more | 3,971 (9.6%) | 14,576 (20.5%) |
| Total | 41,480 (100.0%) | 70,978 (100.0%) |
Property Value to Household Income Ratio in Tucson
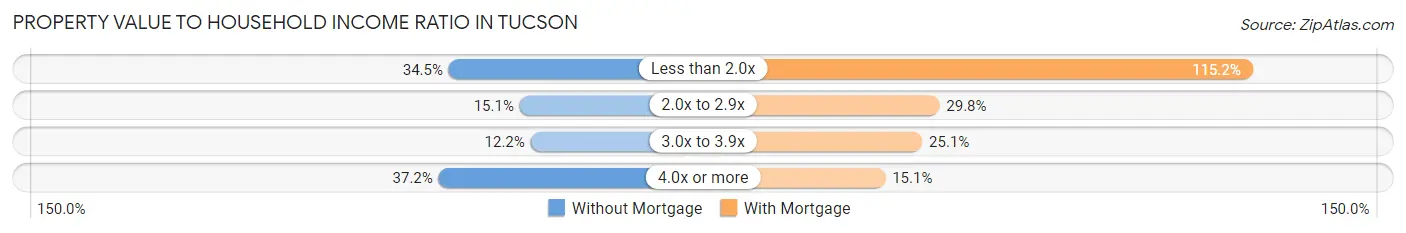
| Value-to-Income Ratio | Without Mortgage | With Mortgage |
| Less than 2.0x | 14,290 (34.4%) | 81,744 (115.2%) |
| 2.0x to 2.9x | 6,270 (15.1%) | 21,157 (29.8%) |
| 3.0x to 3.9x | 5,042 (12.2%) | 17,829 (25.1%) |
| 4.0x or more | 15,440 (37.2%) | 10,696 (15.1%) |
| Total | 41,480 (100.0%) | 70,978 (100.0%) |
Real Estate Taxes by Mortgage Status in Tucson
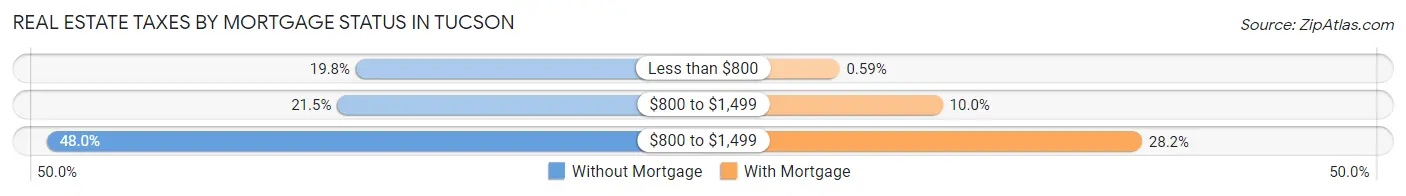
| Property Taxes | Without Mortgage | With Mortgage |
| Less than $800 | 8,191 (19.8%) | 416 (0.6%) |
| $800 to $1,499 | 8,898 (21.4%) | 7,108 (10.0%) |
| $800 to $1,499 | 19,902 (48.0%) | 20,014 (28.2%) |
| Total | 41,480 (100.0%) | 70,978 (100.0%) |
Health & Disability in Tucson
Health Insurance Coverage by Age in Tucson
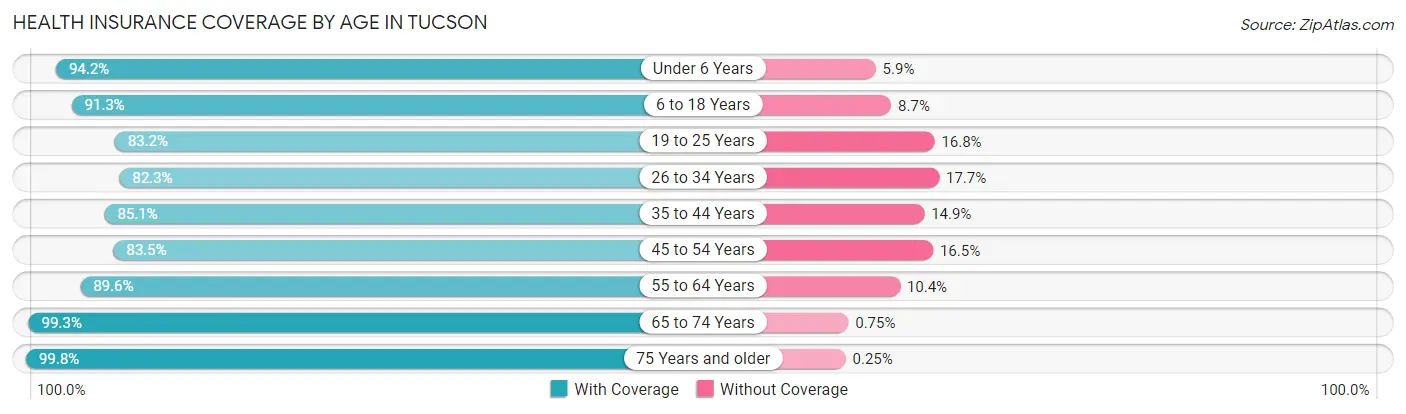
| Age Bracket | With Coverage | Without Coverage |
| Under 6 Years | 33,598 (94.2%) | 2,089 (5.9%) |
| 6 to 18 Years | 76,818 (91.3%) | 7,356 (8.7%) |
| 19 to 25 Years | 66,280 (83.2%) | 13,389 (16.8%) |
| 26 to 34 Years | 58,178 (82.3%) | 12,483 (17.7%) |
| 35 to 44 Years | 53,179 (85.1%) | 9,313 (14.9%) |
| 45 to 54 Years | 45,359 (83.5%) | 8,988 (16.5%) |
| 55 to 64 Years | 50,602 (89.6%) | 5,860 (10.4%) |
| 65 to 74 Years | 45,196 (99.3%) | 342 (0.7%) |
| 75 Years and older | 34,201 (99.8%) | 85 (0.3%) |
| Total | 463,411 (88.5%) | 59,905 (11.5%) |
Health Insurance Coverage by Citizenship Status in Tucson
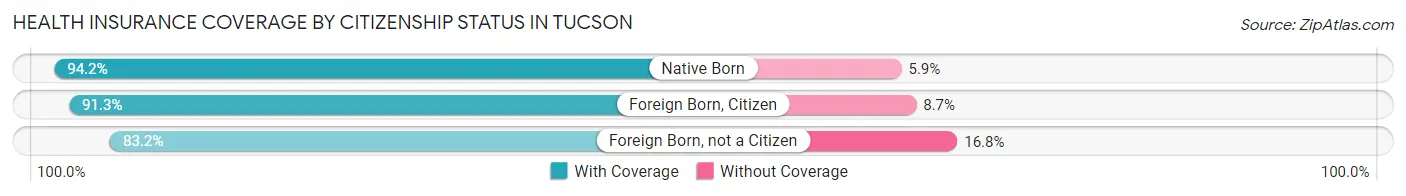
| Citizenship Status | With Coverage | Without Coverage |
| Native Born | 33,598 (94.2%) | 2,089 (5.9%) |
| Foreign Born, Citizen | 76,818 (91.3%) | 7,356 (8.7%) |
| Foreign Born, not a Citizen | 66,280 (83.2%) | 13,389 (16.8%) |
Health Insurance Coverage by Household Income in Tucson
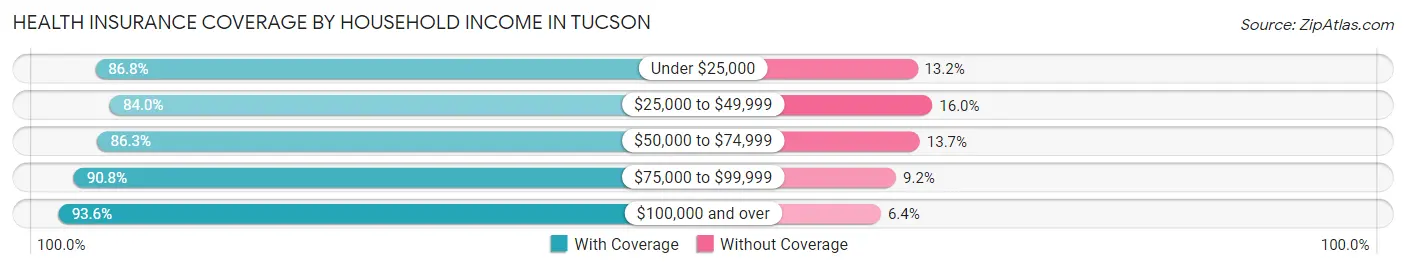
| Household Income | With Coverage | Without Coverage |
| Under $25,000 | 75,097 (86.8%) | 11,465 (13.2%) |
| $25,000 to $49,999 | 94,962 (84.0%) | 18,123 (16.0%) |
| $50,000 to $74,999 | 86,102 (86.3%) | 13,658 (13.7%) |
| $75,000 to $99,999 | 68,151 (90.8%) | 6,931 (9.2%) |
| $100,000 and over | 127,908 (93.6%) | 8,744 (6.4%) |
Public vs Private Health Insurance Coverage by Age in Tucson
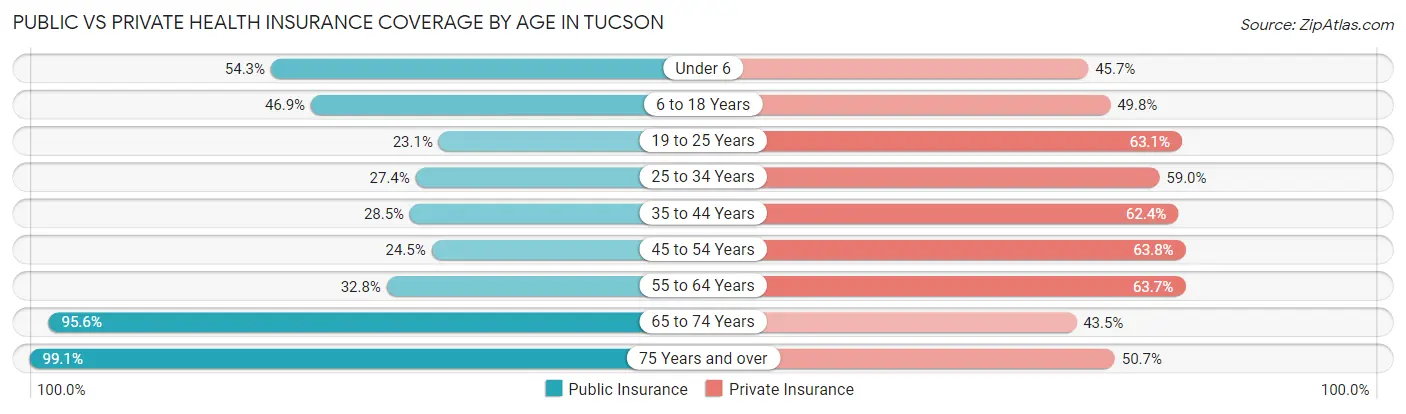
| Age Bracket | Public Insurance | Private Insurance |
| Under 6 | 19,374 (54.3%) | 16,324 (45.7%) |
| 6 to 18 Years | 39,437 (46.9%) | 41,939 (49.8%) |
| 19 to 25 Years | 18,430 (23.1%) | 50,269 (63.1%) |
| 25 to 34 Years | 19,376 (27.4%) | 41,657 (59.0%) |
| 35 to 44 Years | 17,794 (28.5%) | 39,015 (62.4%) |
| 45 to 54 Years | 13,295 (24.5%) | 34,664 (63.8%) |
| 55 to 64 Years | 18,512 (32.8%) | 35,959 (63.7%) |
| 65 to 74 Years | 43,512 (95.6%) | 19,813 (43.5%) |
| 75 Years and over | 33,971 (99.1%) | 17,374 (50.7%) |
| Total | 223,701 (42.7%) | 297,014 (56.8%) |
Disability Status by Sex by Age in Tucson
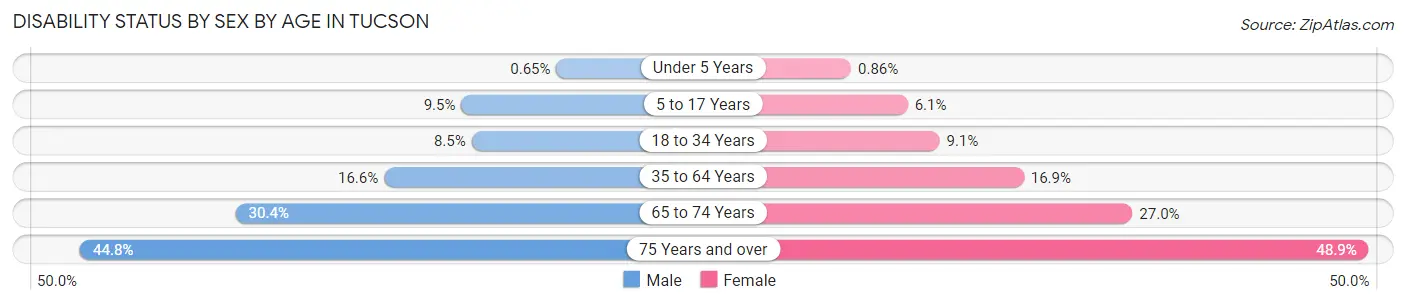
| Age Bracket | Male | Female |
| Under 5 Years | 98 (0.6%) | 124 (0.9%) |
| 5 to 17 Years | 3,839 (9.5%) | 2,384 (6.1%) |
| 18 to 34 Years | 6,856 (8.5%) | 7,320 (9.1%) |
| 35 to 64 Years | 13,893 (16.6%) | 15,166 (16.9%) |
| 65 to 74 Years | 6,305 (30.4%) | 6,691 (27.0%) |
| 75 Years and over | 6,157 (44.8%) | 10,050 (48.9%) |
Disability Class by Sex by Age in Tucson
Disability Class: Hearing Difficulty
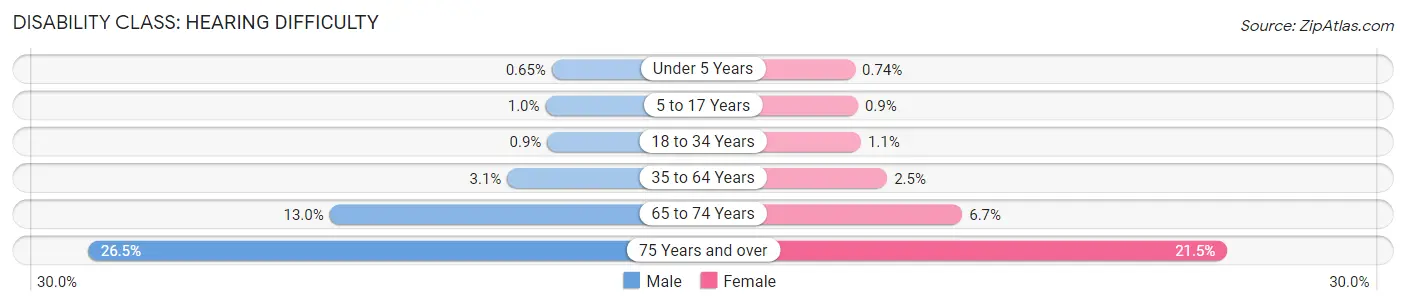
| Age Bracket | Male | Female |
| Under 5 Years | 98 (0.6%) | 106 (0.7%) |
| 5 to 17 Years | 407 (1.0%) | 352 (0.9%) |
| 18 to 34 Years | 725 (0.9%) | 863 (1.1%) |
| 35 to 64 Years | 2,618 (3.1%) | 2,271 (2.5%) |
| 65 to 74 Years | 2,700 (13.0%) | 1,664 (6.7%) |
| 75 Years and over | 3,636 (26.5%) | 4,412 (21.5%) |
Disability Class: Vision Difficulty
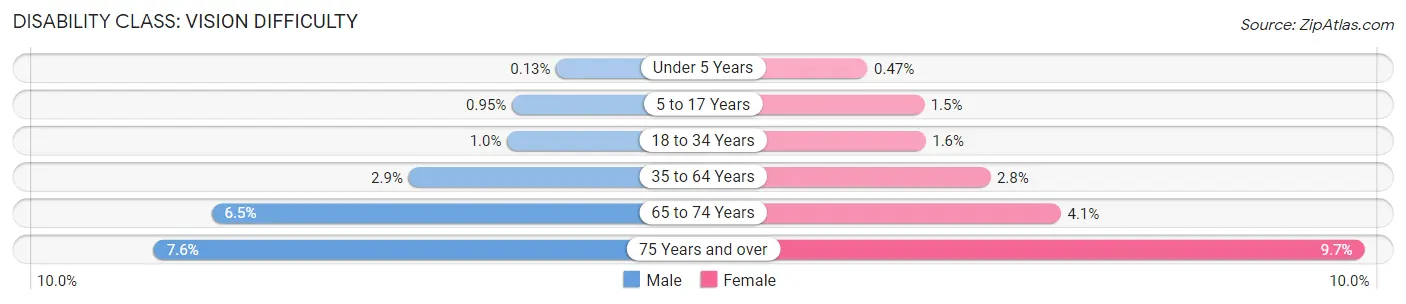
| Age Bracket | Male | Female |
| Under 5 Years | 20 (0.1%) | 67 (0.5%) |
| 5 to 17 Years | 387 (0.9%) | 593 (1.5%) |
| 18 to 34 Years | 839 (1.0%) | 1,251 (1.5%) |
| 35 to 64 Years | 2,398 (2.9%) | 2,471 (2.8%) |
| 65 to 74 Years | 1,354 (6.5%) | 1,007 (4.1%) |
| 75 Years and over | 1,044 (7.6%) | 1,994 (9.7%) |
Disability Class: Cognitive Difficulty
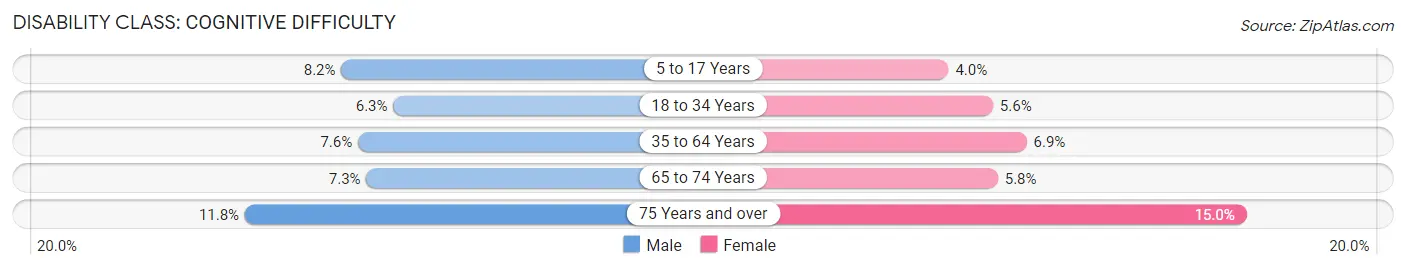
| Age Bracket | Male | Female |
| 5 to 17 Years | 3,341 (8.2%) | 1,544 (4.0%) |
| 18 to 34 Years | 5,081 (6.3%) | 4,529 (5.6%) |
| 35 to 64 Years | 6,368 (7.6%) | 6,162 (6.9%) |
| 65 to 74 Years | 1,515 (7.3%) | 1,436 (5.8%) |
| 75 Years and over | 1,623 (11.8%) | 3,090 (15.0%) |
Disability Class: Ambulatory Difficulty
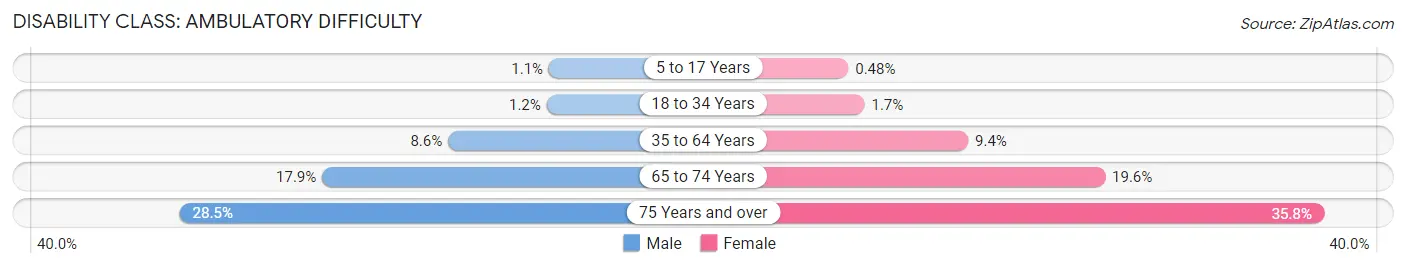
| Age Bracket | Male | Female |
| 5 to 17 Years | 433 (1.1%) | 187 (0.5%) |
| 18 to 34 Years | 998 (1.2%) | 1,364 (1.7%) |
| 35 to 64 Years | 7,150 (8.6%) | 8,423 (9.4%) |
| 65 to 74 Years | 3,713 (17.9%) | 4,850 (19.6%) |
| 75 Years and over | 3,912 (28.5%) | 7,355 (35.8%) |
Disability Class: Self-Care Difficulty
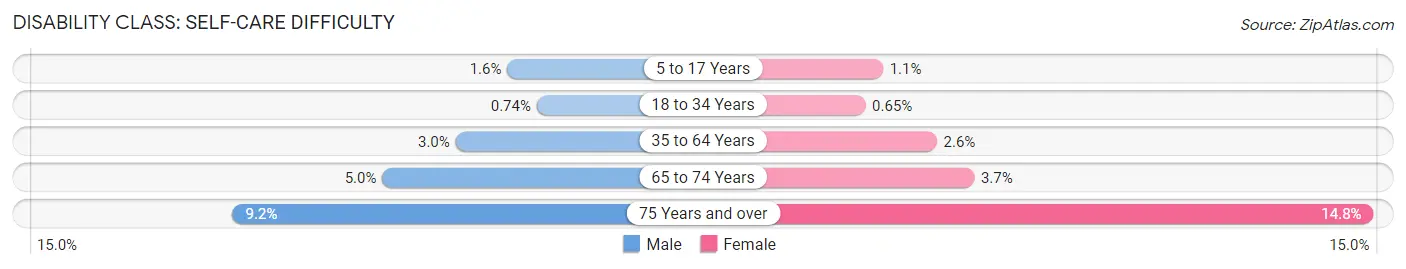
| Age Bracket | Male | Female |
| 5 to 17 Years | 632 (1.6%) | 443 (1.1%) |
| 18 to 34 Years | 597 (0.7%) | 521 (0.6%) |
| 35 to 64 Years | 2,506 (3.0%) | 2,367 (2.6%) |
| 65 to 74 Years | 1,045 (5.0%) | 912 (3.7%) |
| 75 Years and over | 1,265 (9.2%) | 3,043 (14.8%) |
Technology Access in Tucson
Computing Device Access in Tucson
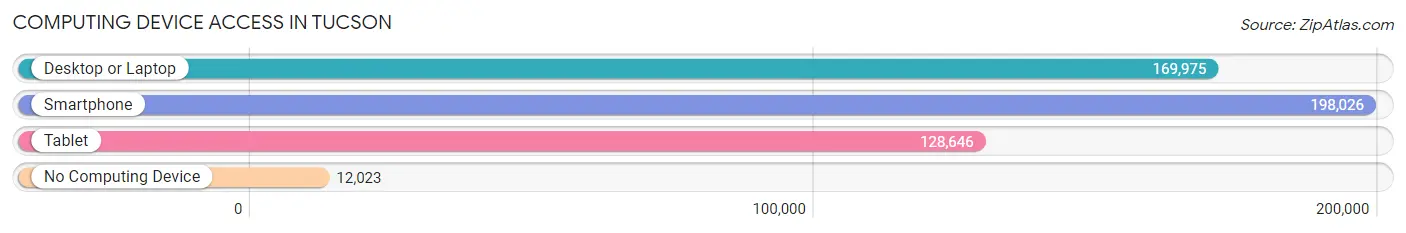
| Device Type | # Households | % Households |
| Desktop or Laptop | 169,975 | 77.0% |
| Smartphone | 198,026 | 89.7% |
| Tablet | 128,646 | 58.3% |
| No Computing Device | 12,023 | 5.4% |
| Total | 220,769 | 100.0% |
Internet Access in Tucson
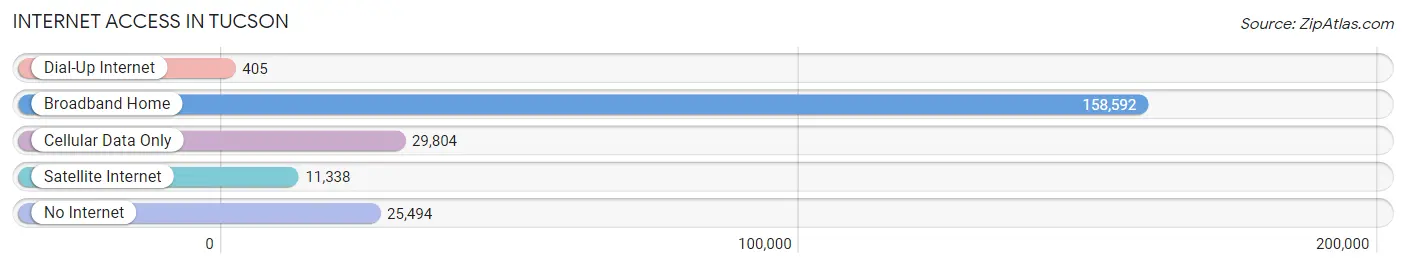
| Internet Type | # Households | % Households |
| Dial-Up Internet | 405 | 0.2% |
| Broadband Home | 158,592 | 71.8% |
| Cellular Data Only | 29,804 | 13.5% |
| Satellite Internet | 11,338 | 5.1% |
| No Internet | 25,494 | 11.6% |
| Total | 220,769 | 100.0% |
Tucson Summary
Tucson, Arizona is a city located in the Sonoran Desert in the southwestern United States. It is the county seat of Pima County and the second largest city in Arizona. Tucson is located approximately 100 miles southeast of Phoenix and is the 33rd largest city in the United States.
History
Tucson was first settled by the Hohokam people in the 4th century AD. The Hohokam were a Native American tribe that lived in the area for centuries before the arrival of the Spanish in the 16th century. The Spanish established a presidio in Tucson in 1775, and the city was incorporated in 1877. Tucson was an important stop on the Butterfield Overland Mail route, and the city grew rapidly in the late 19th century.
Geography
Tucson is located in the Sonoran Desert in the southwestern United States. It is situated in the foothills of the Santa Catalina Mountains and is surrounded by five mountain ranges. The city is located at an elevation of 2,389 feet above sea level. Tucson has a semi-arid climate with hot summers and mild winters. The average annual temperature is 70.5°F.
Economy
Tucson’s economy is largely based on the service industry, with the University of Arizona, Davis-Monthan Air Force Base, and Raytheon Missile Systems providing the largest sources of employment. The city is also home to several major corporations, including IBM, Honeywell, and Caterpillar. Tourism is also an important part of the economy, with visitors drawn to the city’s many attractions, including the Arizona-Sonora Desert Museum, Saguaro National Park, and the Pima Air & Space Museum.
Demographics
As of the 2010 census, Tucson had a population of 520,116. The city is racially and ethnically diverse, with the largest racial groups being White (48.2%), Hispanic or Latino (41.3%), and Native American (4.2%). The median household income in Tucson is $45,890, and the median age is 32.7 years.
Tucson is a vibrant and diverse city with a rich history and a bright future. It is home to a variety of industries, attractions, and people, making it an ideal place to live and work.
Common Questions
What is Per Capita Income in Tucson?
Per Capita income in Tucson is $29,009.
What is the Median Family Income in Tucson?
Median Family Income in Tucson is $66,855.
What is the Median Household income in Tucson?
Median Household Income in Tucson is $52,049.
What is Income or Wage Gap in Tucson?
Income or Wage Gap in Tucson is 16.3%.
Women in Tucson earn 83.7 cents for every dollar earned by a man.
What is Family Income Deficit in Tucson?
Family Income Deficit in Tucson is $11,584.
Families that are below poverty line in Tucson earn $11,584 less on average than the poverty threshold level.
What is Inequality or Gini Index in Tucson?
Inequality or Gini Index in Tucson is 0.45.
What is the Total Population of Tucson?
Total Population of Tucson is 541,033.
What is the Total Male Population of Tucson?
Total Male Population of Tucson is 268,922.
What is the Total Female Population of Tucson?
Total Female Population of Tucson is 272,111.
What is the Ratio of Males per 100 Females in Tucson?
There are 98.83 Males per 100 Females in Tucson.
What is the Ratio of Females per 100 Males in Tucson?
There are 101.19 Females per 100 Males in Tucson.
What is the Median Population Age in Tucson?
Median Population Age in Tucson is 33.9 Years.
What is the Average Family Size in Tucson
Average Family Size in Tucson is 3.1 People.
What is the Average Household Size in Tucson
Average Household Size in Tucson is 2.3 People.
How Large is the Labor Force in Tucson?
There are 274,746 People in the Labor Forcein in Tucson.
What is the Percentage of People in the Labor Force in Tucson?
62.0% of People are in the Labor Force in Tucson.
What is the Unemployment Rate in Tucson?
Unemployment Rate in Tucson is 6.5%.