Minneapolis, MN Map & Demographics
Minneapolis Map
Minneapolis Overview
$48,373
PER CAPITA INCOME
$109,514
AVG FAMILY INCOME
$76,332
AVG HOUSEHOLD INCOME
14.4%
WAGE / INCOME GAP [ % ]
85.6¢/ $1
WAGE / INCOME GAP [ $ ]
$11,124
FAMILY INCOME DEFICIT
0.49
INEQUALITY / GINI INDEX
426,877
TOTAL POPULATION
218,662
MALE POPULATION
208,215
FEMALE POPULATION
105.02
MALES / 100 FEMALES
95.22
FEMALES / 100 MALES
32.8
MEDIAN AGE
3.1
AVG FAMILY SIZE
2.2
AVG HOUSEHOLD SIZE
259,586
LABOR FORCE [ PEOPLE ]
73.5%
PERCENT IN LABOR FORCE
5.8%
UNEMPLOYMENT RATE
Minneapolis Zip Codes
Income in Minneapolis
Income Overview in Minneapolis
Per Capita Income in Minneapolis is $48,373, while median incomes of families and households are $109,514 and $76,332 respectively.
| Characteristic | Number | Measure |
| Per Capita Income | 426,877 | $48,373 |
| Median Family Income | 80,275 | $109,514 |
| Mean Family Income | 80,275 | $144,046 |
| Median Household Income | 185,674 | $76,332 |
| Mean Household Income | 185,674 | $108,980 |
| Income Deficit | 80,275 | $11,124 |
| Wage / Income Gap (%) | 426,877 | 14.42% |
| Wage / Income Gap ($) | 426,877 | 85.58¢ per $1 |
| Gini / Inequality Index | 426,877 | 0.49 |
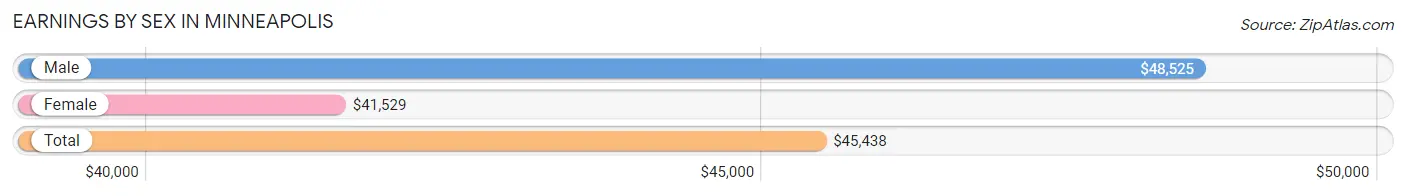
Earnings by Sex in Minneapolis
Average Earnings in Minneapolis are $45,438, $48,525 for men and $41,529 for women, a difference of 14.4%.
| Sex | Number | Average Earnings |
| Male | 145,639 (52.9%) | $48,525 |
| Female | 129,882 (47.1%) | $41,529 |
| Total | 275,521 (100.0%) | $45,438 |
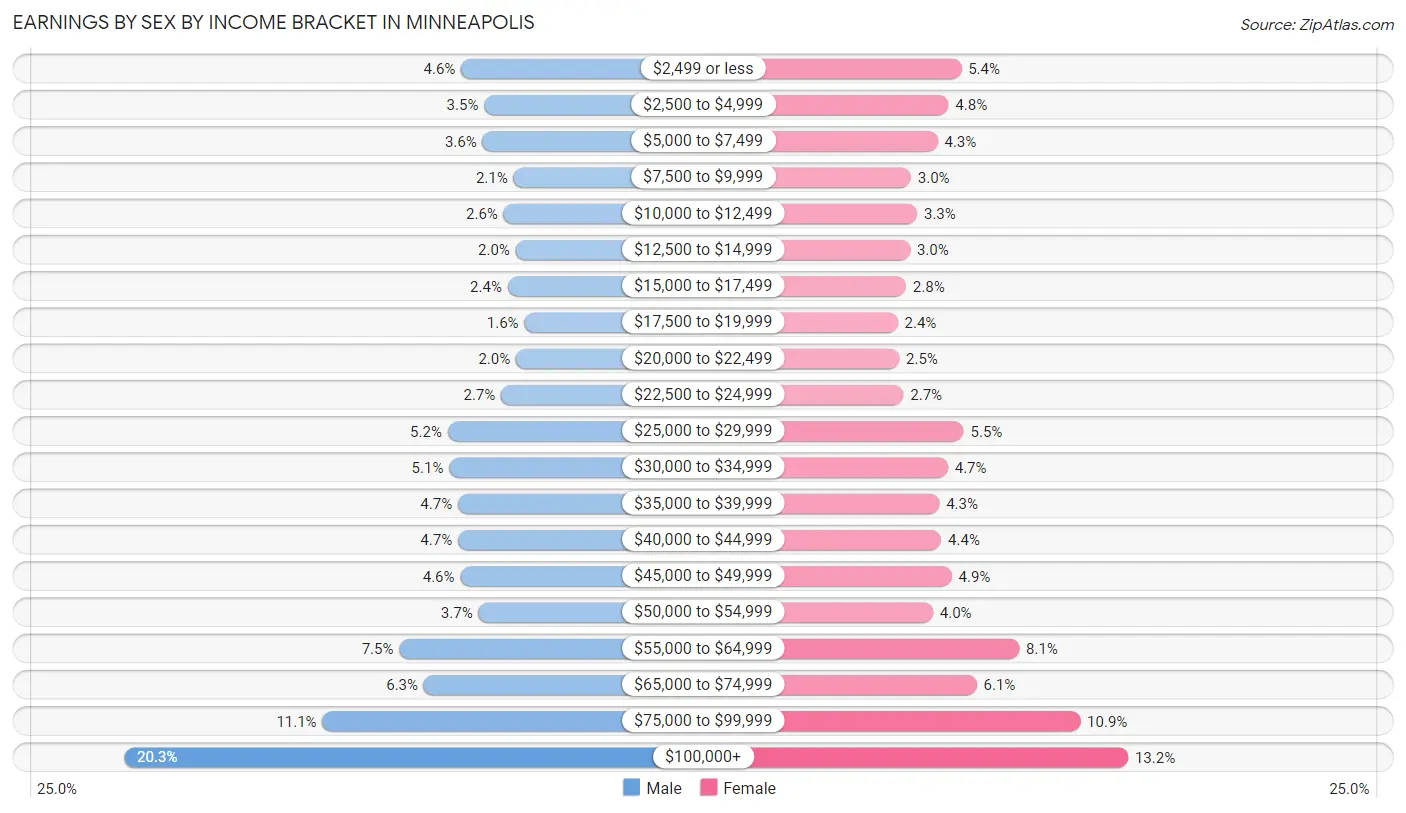
Earnings by Sex by Income Bracket in Minneapolis
The most common earnings brackets in Minneapolis are $100,000+ for men (29,621 | 20.3%) and $100,000+ for women (17,109 | 13.2%).
| Income | Male | Female |
| $2,499 or less | 6,633 (4.5%) | 6,964 (5.4%) |
| $2,500 to $4,999 | 5,054 (3.5%) | 6,177 (4.8%) |
| $5,000 to $7,499 | 5,164 (3.5%) | 5,522 (4.3%) |
| $7,500 to $9,999 | 3,057 (2.1%) | 3,898 (3.0%) |
| $10,000 to $12,499 | 3,732 (2.6%) | 4,268 (3.3%) |
| $12,500 to $14,999 | 2,916 (2.0%) | 3,850 (3.0%) |
| $15,000 to $17,499 | 3,447 (2.4%) | 3,596 (2.8%) |
| $17,500 to $19,999 | 2,311 (1.6%) | 3,088 (2.4%) |
| $20,000 to $22,499 | 2,878 (2.0%) | 3,178 (2.5%) |
| $22,500 to $24,999 | 3,903 (2.7%) | 3,442 (2.6%) |
| $25,000 to $29,999 | 7,545 (5.2%) | 7,101 (5.5%) |
| $30,000 to $34,999 | 7,447 (5.1%) | 6,142 (4.7%) |
| $35,000 to $39,999 | 6,839 (4.7%) | 5,624 (4.3%) |
| $40,000 to $44,999 | 6,850 (4.7%) | 5,735 (4.4%) |
| $45,000 to $49,999 | 6,690 (4.6%) | 6,383 (4.9%) |
| $50,000 to $54,999 | 5,448 (3.7%) | 5,235 (4.0%) |
| $55,000 to $64,999 | 10,848 (7.4%) | 10,475 (8.1%) |
| $65,000 to $74,999 | 9,169 (6.3%) | 7,893 (6.1%) |
| $75,000 to $99,999 | 16,087 (11.1%) | 14,202 (10.9%) |
| $100,000+ | 29,621 (20.3%) | 17,109 (13.2%) |
| Total | 145,639 (100.0%) | 129,882 (100.0%) |
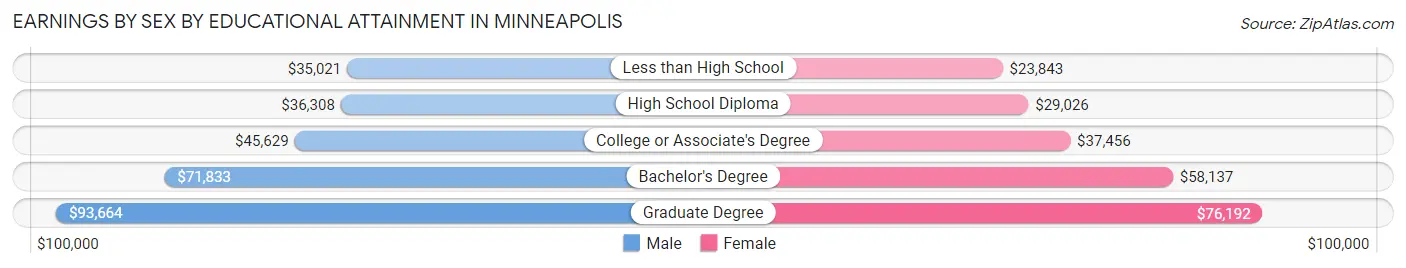
Earnings by Sex by Educational Attainment in Minneapolis
Average earnings in Minneapolis are $57,460 for men and $51,505 for women, a difference of 10.4%. Men with an educational attainment of graduate degree enjoy the highest average annual earnings of $93,664, while those with less than high school education earn the least with $35,021. Women with an educational attainment of graduate degree earn the most with the average annual earnings of $76,192, while those with less than high school education have the smallest earnings of $23,843.
| Educational Attainment | Male Income | Female Income |
| Less than High School | $35,021 | $23,843 |
| High School Diploma | $36,308 | $29,026 |
| College or Associate's Degree | $45,629 | $37,456 |
| Bachelor's Degree | $71,833 | $58,137 |
| Graduate Degree | $93,664 | $76,192 |
| Total | $57,460 | $51,505 |
Family Income in Minneapolis
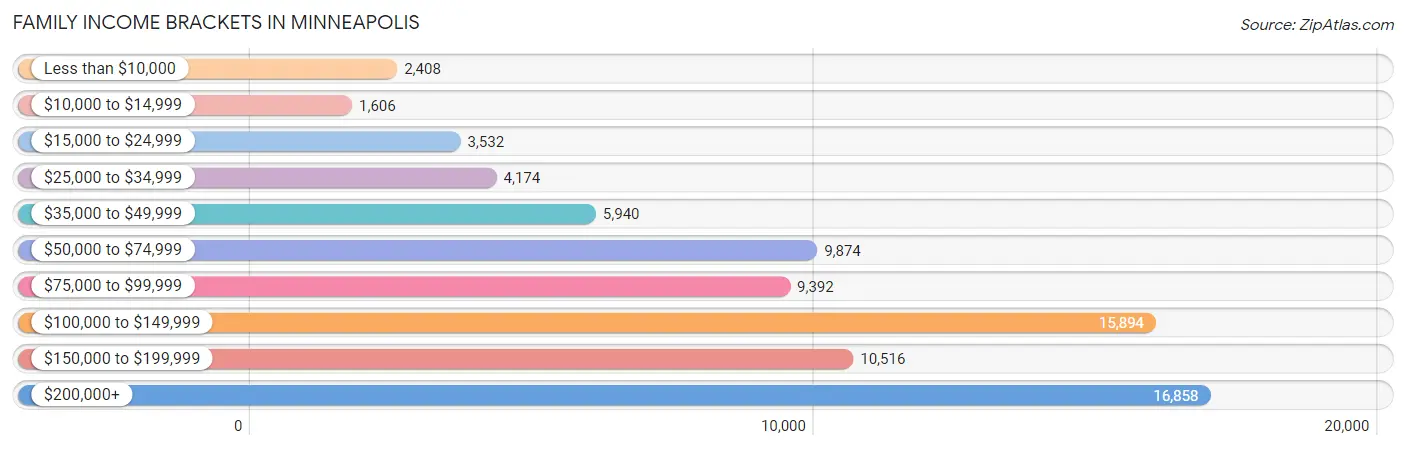
Family Income Brackets in Minneapolis
According to the Minneapolis family income data, there are 16,858 families falling into the $200,000+ income range, which is the most common income bracket and makes up 21.0% of all families. Conversely, the $10,000 to $14,999 income bracket is the least frequent group with only 1,606 families (2.0%) belonging to this category.
| Income Bracket | # Families | % Families |
| Less than $10,000 | 2,408 | 3.0% |
| $10,000 to $14,999 | 1,606 | 2.0% |
| $15,000 to $24,999 | 3,532 | 4.4% |
| $25,000 to $34,999 | 4,174 | 5.2% |
| $35,000 to $49,999 | 5,940 | 7.4% |
| $50,000 to $74,999 | 9,874 | 12.3% |
| $75,000 to $99,999 | 9,392 | 11.7% |
| $100,000 to $149,999 | 15,894 | 19.8% |
| $150,000 to $199,999 | 10,516 | 13.1% |
| $200,000+ | 16,858 | 21.0% |
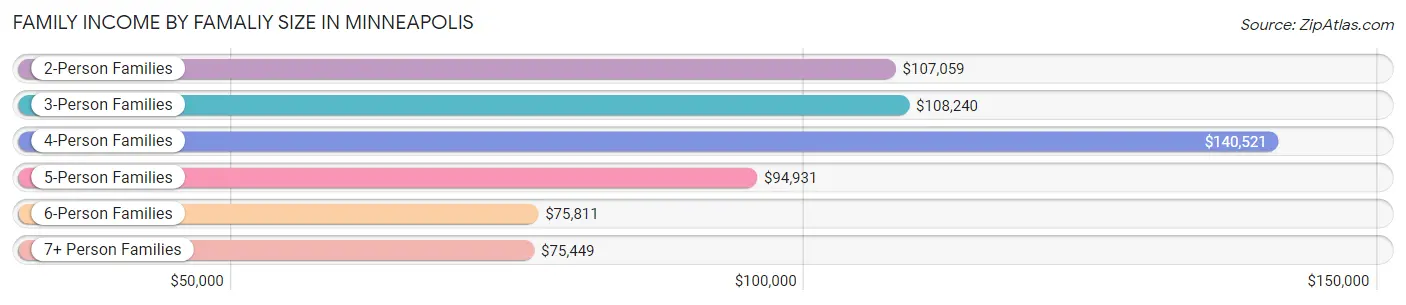
Family Income by Famaliy Size in Minneapolis
4-person families (14,391 | 17.9%) account for the highest median family income in Minneapolis with $140,521 per family, while 2-person families (39,236 | 48.9%) have the highest median income of $53,530 per family member.
| Income Bracket | # Families | Median Income |
| 2-Person Families | 39,236 (48.9%) | $107,059 |
| 3-Person Families | 16,713 (20.8%) | $108,240 |
| 4-Person Families | 14,391 (17.9%) | $140,521 |
| 5-Person Families | 5,439 (6.8%) | $94,931 |
| 6-Person Families | 2,252 (2.8%) | $75,811 |
| 7+ Person Families | 2,244 (2.8%) | $75,449 |
| Total | 80,275 (100.0%) | $109,514 |
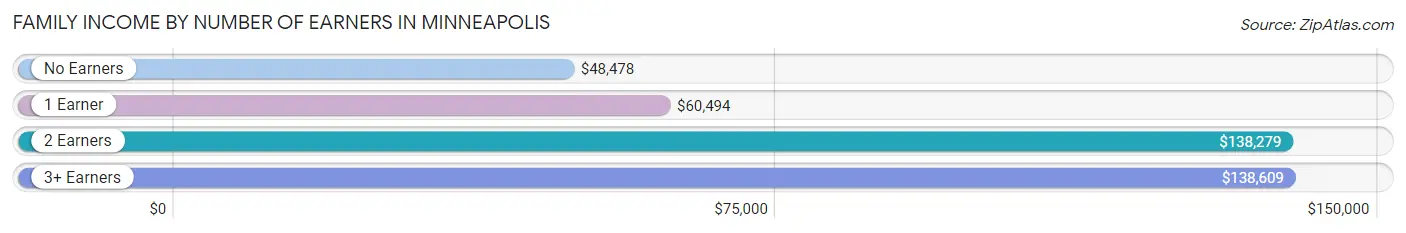
Family Income by Number of Earners in Minneapolis
The median family income in Minneapolis is $109,514, with families comprising 3+ earners (8,112) having the highest median family income of $138,609, while families with no earners (6,937) have the lowest median family income of $48,478, accounting for 10.1% and 8.6% of families, respectively.
| Number of Earners | # Families | Median Income |
| No Earners | 6,937 (8.6%) | $48,478 |
| 1 Earner | 22,785 (28.4%) | $60,494 |
| 2 Earners | 42,441 (52.9%) | $138,279 |
| 3+ Earners | 8,112 (10.1%) | $138,609 |
| Total | 80,275 (100.0%) | $109,514 |
Household Income in Minneapolis
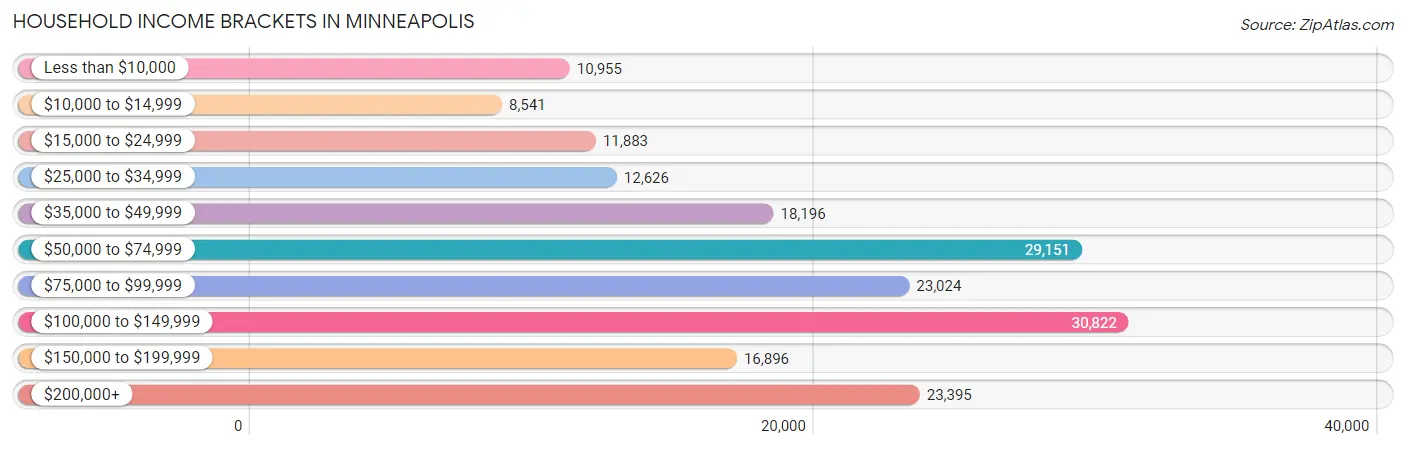
Household Income Brackets in Minneapolis
With 30,822 households falling in the category, the $100,000 to $149,999 income range is the most frequent in Minneapolis, accounting for 16.6% of all households. In contrast, only 8,541 households (4.6%) fall into the $10,000 to $14,999 income bracket, making it the least populous group.
| Income Bracket | # Households | % Households |
| Less than $10,000 | 10,955 | 5.9% |
| $10,000 to $14,999 | 8,541 | 4.6% |
| $15,000 to $24,999 | 11,883 | 6.4% |
| $25,000 to $34,999 | 12,626 | 6.8% |
| $35,000 to $49,999 | 18,196 | 9.8% |
| $50,000 to $74,999 | 29,151 | 15.7% |
| $75,000 to $99,999 | 23,024 | 12.4% |
| $100,000 to $149,999 | 30,822 | 16.6% |
| $150,000 to $199,999 | 16,896 | 9.1% |
| $200,000+ | 23,395 | 12.6% |
Household Income by Householder Age in Minneapolis
The median household income in Minneapolis is $76,332, with the highest median household income of $86,818 found in the 45 to 64 years age bracket for the primary householder. A total of 53,791 households (29.0%) fall into this category. Meanwhile, the 15 to 24 years age bracket for the primary householder has the lowest median household income of $41,369, with 15,487 households (8.3%) in this group.
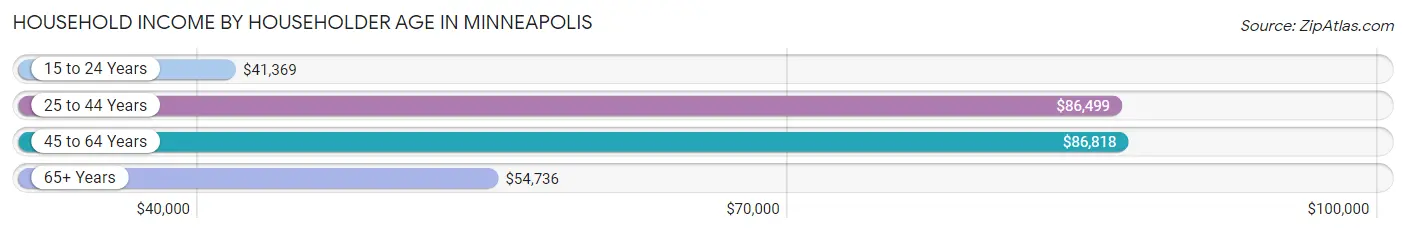
| Income Bracket | # Households | Median Income |
| 15 to 24 Years | 15,487 (8.3%) | $41,369 |
| 25 to 44 Years | 85,791 (46.2%) | $86,499 |
| 45 to 64 Years | 53,791 (29.0%) | $86,818 |
| 65+ Years | 30,605 (16.5%) | $54,736 |
| Total | 185,674 (100.0%) | $76,332 |
Poverty in Minneapolis
Income Below Poverty by Sex and Age in Minneapolis
With 15.7% poverty level for males and 17.9% for females among the residents of Minneapolis, 18 to 24 year old males and 18 to 24 year old females are the most vulnerable to poverty, with 7,561 males (31.5%) and 10,499 females (42.1%) in their respective age groups living below the poverty level.
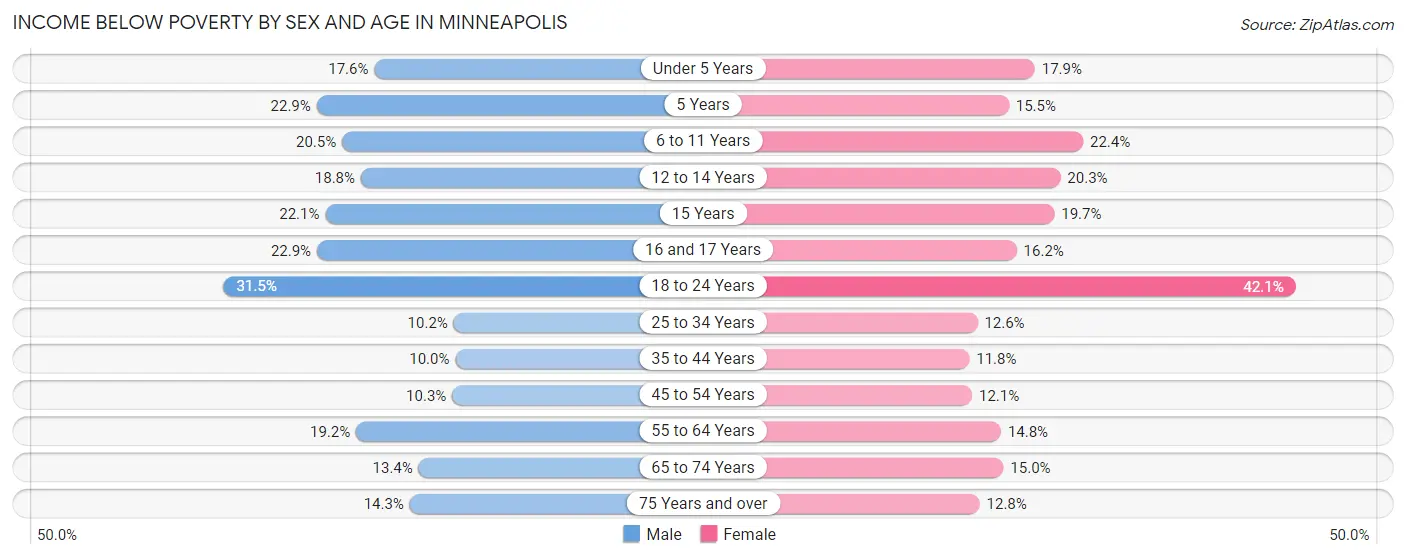
| Age Bracket | Male | Female |
| Under 5 Years | 2,071 (17.5%) | 2,151 (17.9%) |
| 5 Years | 510 (22.9%) | 351 (15.5%) |
| 6 to 11 Years | 2,741 (20.5%) | 2,939 (22.4%) |
| 12 to 14 Years | 1,128 (18.8%) | 1,244 (20.3%) |
| 15 Years | 529 (22.1%) | 380 (19.7%) |
| 16 and 17 Years | 906 (22.9%) | 628 (16.2%) |
| 18 to 24 Years | 7,561 (31.5%) | 10,499 (42.1%) |
| 25 to 34 Years | 4,896 (10.2%) | 5,504 (12.6%) |
| 35 to 44 Years | 3,292 (10.0%) | 3,436 (11.8%) |
| 45 to 54 Years | 2,446 (10.3%) | 2,468 (12.1%) |
| 55 to 64 Years | 4,303 (19.2%) | 2,979 (14.8%) |
| 65 to 74 Years | 1,878 (13.4%) | 2,214 (15.0%) |
| 75 Years and over | 861 (14.3%) | 1,120 (12.8%) |
| Total | 33,122 (15.7%) | 35,913 (17.9%) |
Income Above Poverty by Sex and Age in Minneapolis
According to the poverty statistics in Minneapolis, males aged 35 to 44 years and females aged 35 to 44 years are the age groups that are most secure financially, with 90.0% of males and 88.2% of females in these age groups living above the poverty line.
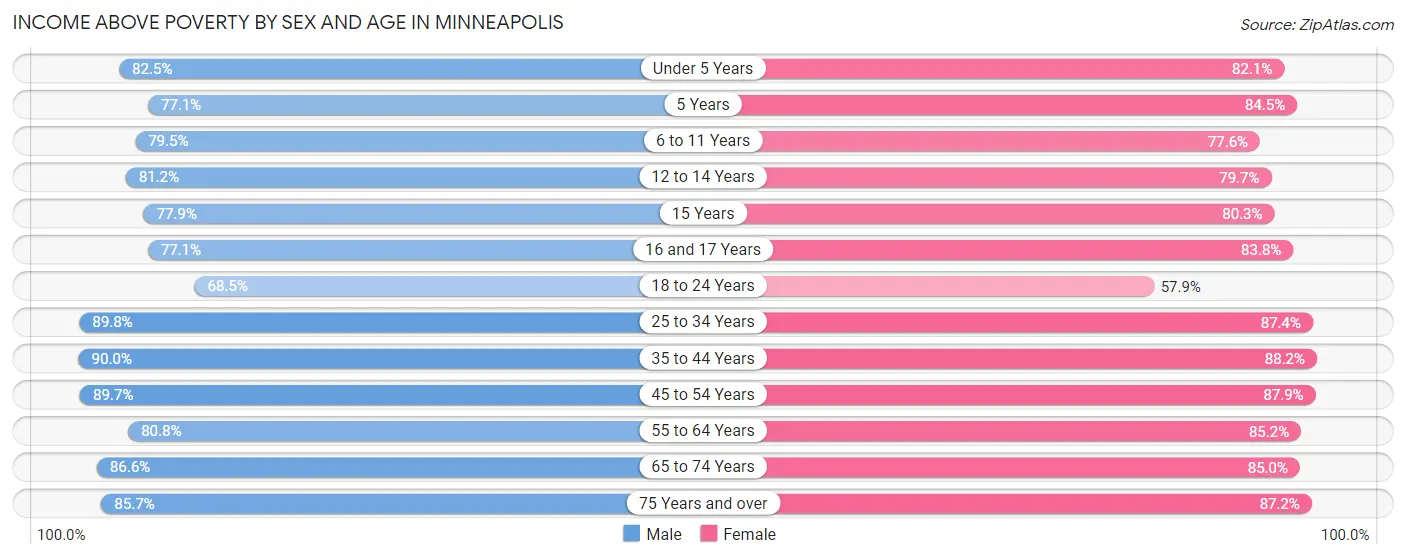
| Age Bracket | Male | Female |
| Under 5 Years | 9,727 (82.5%) | 9,860 (82.1%) |
| 5 Years | 1,717 (77.1%) | 1,913 (84.5%) |
| 6 to 11 Years | 10,603 (79.5%) | 10,185 (77.6%) |
| 12 to 14 Years | 4,876 (81.2%) | 4,888 (79.7%) |
| 15 Years | 1,866 (77.9%) | 1,547 (80.3%) |
| 16 and 17 Years | 3,055 (77.1%) | 3,241 (83.8%) |
| 18 to 24 Years | 16,412 (68.5%) | 14,431 (57.9%) |
| 25 to 34 Years | 43,211 (89.8%) | 38,212 (87.4%) |
| 35 to 44 Years | 29,543 (90.0%) | 25,616 (88.2%) |
| 45 to 54 Years | 21,246 (89.7%) | 17,947 (87.9%) |
| 55 to 64 Years | 18,063 (80.8%) | 17,186 (85.2%) |
| 65 to 74 Years | 12,106 (86.6%) | 12,548 (85.0%) |
| 75 Years and over | 5,178 (85.7%) | 7,640 (87.2%) |
| Total | 177,603 (84.3%) | 165,214 (82.1%) |
Income Below Poverty Among Married-Couple Families in Minneapolis
The poverty statistics for married-couple families in Minneapolis show that 3.6% or 2,017 of the total 56,393 families live below the poverty line. Families with 5 or more children have the highest poverty rate of 36.1%, comprising of 320 families. On the other hand, families with no children have the lowest poverty rate of 2.4%, which includes 752 families.
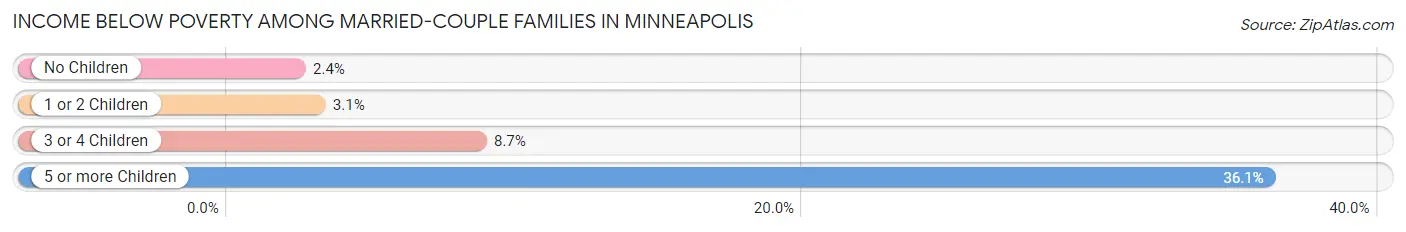
| Children | Above Poverty | Below Poverty |
| No Children | 31,019 (97.6%) | 752 (2.4%) |
| 1 or 2 Children | 19,242 (96.9%) | 608 (3.1%) |
| 3 or 4 Children | 3,549 (91.3%) | 337 (8.7%) |
| 5 or more Children | 566 (63.9%) | 320 (36.1%) |
| Total | 54,376 (96.4%) | 2,017 (3.6%) |
Income Below Poverty Among Single-Parent Households in Minneapolis
According to the poverty data in Minneapolis, 13.3% or 987 single-father households and 28.7% or 4,719 single-mother households are living below the poverty line. Among single-father households, those with 5 or more children have the highest poverty rate, with 37 households (37.0%) experiencing poverty. Likewise, among single-mother households, those with 5 or more children have the highest poverty rate, with 605 households (85.2%) falling below the poverty line.
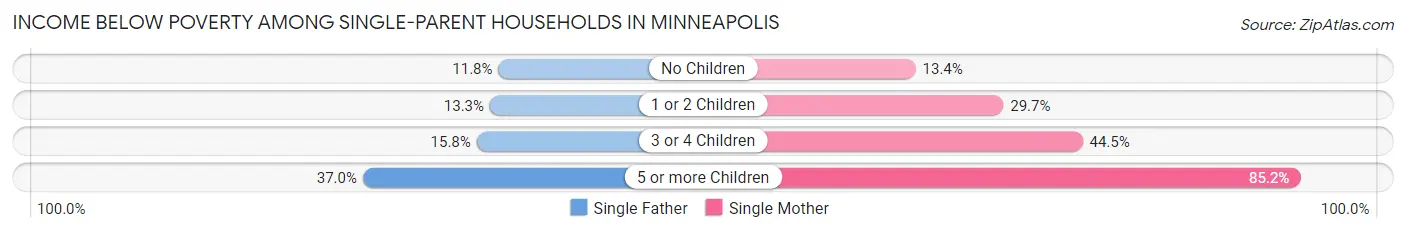
| Children | Single Father | Single Mother |
| No Children | 369 (11.8%) | 733 (13.4%) |
| 1 or 2 Children | 431 (13.3%) | 2,408 (29.7%) |
| 3 or 4 Children | 150 (15.8%) | 973 (44.5%) |
| 5 or more Children | 37 (37.0%) | 605 (85.2%) |
| Total | 987 (13.3%) | 4,719 (28.7%) |
Income Below Poverty Among Married-Couple vs Single-Parent Households in Minneapolis
The poverty data for Minneapolis shows that 2,017 of the married-couple family households (3.6%) and 5,706 of the single-parent households (23.9%) are living below the poverty level. Within the married-couple family households, those with 5 or more children have the highest poverty rate, with 320 households (36.1%) falling below the poverty line. Among the single-parent households, those with 5 or more children have the highest poverty rate, with 642 household (79.3%) living below poverty.
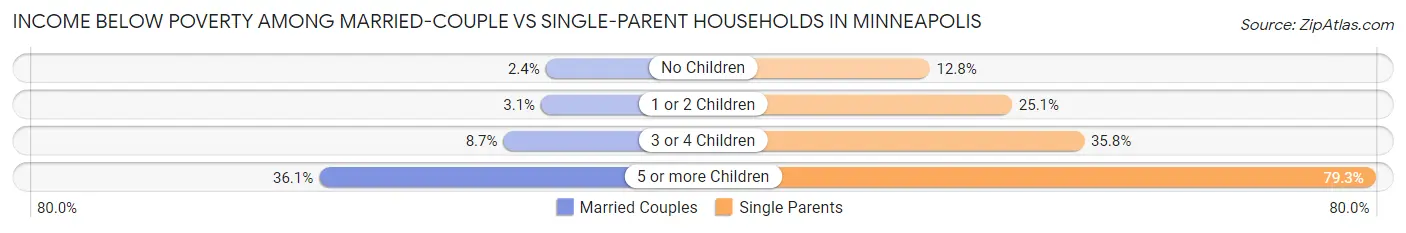
| Children | Married-Couple Families | Single-Parent Households |
| No Children | 752 (2.4%) | 1,102 (12.8%) |
| 1 or 2 Children | 608 (3.1%) | 2,839 (25.1%) |
| 3 or 4 Children | 337 (8.7%) | 1,123 (35.8%) |
| 5 or more Children | 320 (36.1%) | 642 (79.3%) |
| Total | 2,017 (3.6%) | 5,706 (23.9%) |
Race in Minneapolis
The most populous races in Minneapolis are White / Caucasian (267,854 | 62.7%), Black / African American (79,138 | 18.5%), and Hispanic or Latino (42,067 | 9.9%).
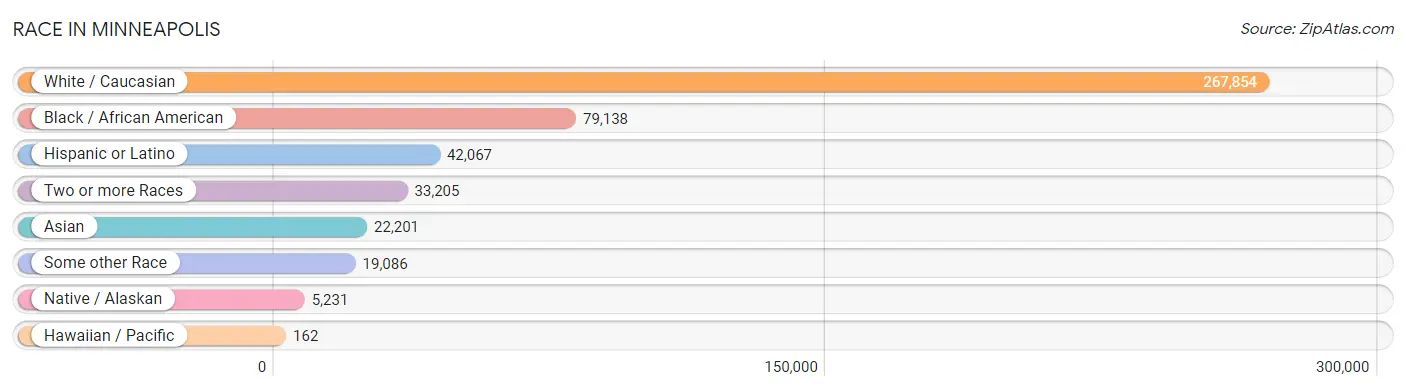
| Race | # Population | % Population |
| Asian | 22,201 | 5.2% |
| Black / African American | 79,138 | 18.5% |
| Hawaiian / Pacific | 162 | 0.0% |
| Hispanic or Latino | 42,067 | 9.9% |
| Native / Alaskan | 5,231 | 1.2% |
| White / Caucasian | 267,854 | 62.7% |
| Two or more Races | 33,205 | 7.8% |
| Some other Race | 19,086 | 4.5% |
| Total | 426,877 | 100.0% |
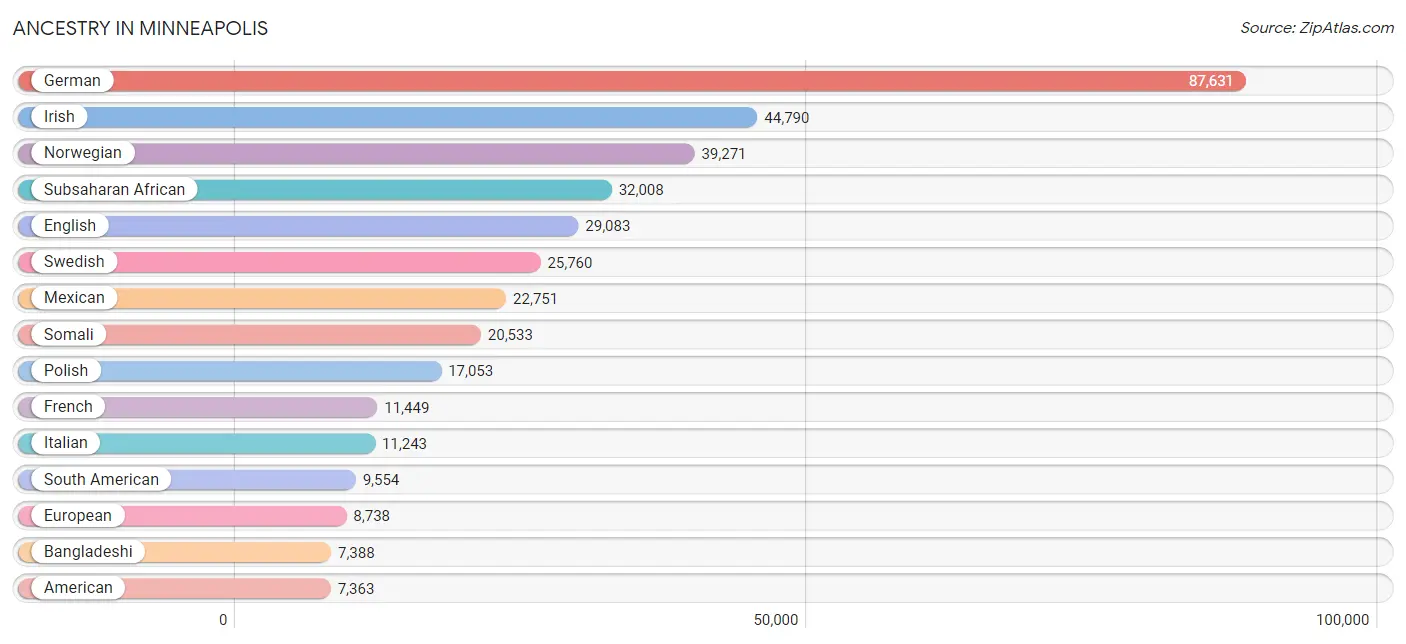
Ancestry in Minneapolis
The most populous ancestries reported in Minneapolis are German (87,631 | 20.5%), Irish (44,790 | 10.5%), Norwegian (39,271 | 9.2%), Subsaharan African (32,008 | 7.5%), and English (29,083 | 6.8%), together accounting for 54.5% of all Minneapolis residents.
| Ancestry | # Population | % Population |
| African | 4,182 | 1.0% |
| Alaska Native | 22 | 0.0% |
| Alaskan Athabascan | 21 | 0.0% |
| Albanian | 127 | 0.0% |
| Alsatian | 18 | 0.0% |
| American | 7,363 | 1.7% |
| Apache | 52 | 0.0% |
| Arab | 3,822 | 0.9% |
| Argentinean | 323 | 0.1% |
| Armenian | 212 | 0.1% |
| Assyrian / Chaldean / Syriac | 8 | 0.0% |
| Australian | 98 | 0.0% |
| Austrian | 1,530 | 0.4% |
| Bahamian | 125 | 0.0% |
| Bangladeshi | 7,388 | 1.7% |
| Barbadian | 22 | 0.0% |
| Basque | 10 | 0.0% |
| Belgian | 692 | 0.2% |
| Belizean | 31 | 0.0% |
| Bhutanese | 1,324 | 0.3% |
| Blackfeet | 162 | 0.0% |
| Bolivian | 159 | 0.0% |
| Brazilian | 326 | 0.1% |
| British | 2,470 | 0.6% |
| British West Indian | 25 | 0.0% |
| Bulgarian | 92 | 0.0% |
| Burmese | 2,900 | 0.7% |
| Cajun | 102 | 0.0% |
| Cambodian | 54 | 0.0% |
| Canadian | 634 | 0.2% |
| Cape Verdean | 41 | 0.0% |
| Carpatho Rusyn | 74 | 0.0% |
| Celtic | 14 | 0.0% |
| Central American | 3,004 | 0.7% |
| Central American Indian | 358 | 0.1% |
| Cherokee | 847 | 0.2% |
| Cheyenne | 29 | 0.0% |
| Chickasaw | 11 | 0.0% |
| Chilean | 157 | 0.0% |
| Chinese | 9 | 0.0% |
| Chippewa | 4,274 | 1.0% |
| Choctaw | 110 | 0.0% |
| Colombian | 1,215 | 0.3% |
| Costa Rican | 137 | 0.0% |
| Cree | 95 | 0.0% |
| Creek | 62 | 0.0% |
| Croatian | 772 | 0.2% |
| Crow | 14 | 0.0% |
| Cuban | 1,030 | 0.2% |
| Cypriot | 89 | 0.0% |
| Czech | 4,611 | 1.1% |
| Czechoslovakian | 611 | 0.1% |
| Danish | 5,106 | 1.2% |
| Dominican | 312 | 0.1% |
| Dutch | 5,240 | 1.2% |
| Eastern European | 2,090 | 0.5% |
| Ecuadorian | 6,798 | 1.6% |
| Egyptian | 326 | 0.1% |
| English | 29,083 | 6.8% |
| Estonian | 50 | 0.0% |
| Ethiopian | 3,928 | 0.9% |
| European | 8,738 | 2.1% |
| Filipino | 366 | 0.1% |
| Finnish | 4,500 | 1.1% |
| French | 11,449 | 2.7% |
| French American Indian | 93 | 0.0% |
| French Canadian | 3,142 | 0.7% |
| German | 87,631 | 20.5% |
| German Russian | 205 | 0.1% |
| Ghanaian | 263 | 0.1% |
| Greek | 1,572 | 0.4% |
| Guamanian / Chamorro | 18 | 0.0% |
| Guatemalan | 1,061 | 0.3% |
| Guyanese | 282 | 0.1% |
| Haitian | 273 | 0.1% |
| Honduran | 386 | 0.1% |
| Hungarian | 958 | 0.2% |
| Icelander | 365 | 0.1% |
| Indian (Asian) | 5,387 | 1.3% |
| Indonesian | 17 | 0.0% |
| Inupiat | 8 | 0.0% |
| Iranian | 356 | 0.1% |
| Iraqi | 56 | 0.0% |
| Irish | 44,790 | 10.5% |
| Iroquois | 165 | 0.0% |
| Israeli | 67 | 0.0% |
| Italian | 11,243 | 2.6% |
| Jamaican | 576 | 0.1% |
| Japanese | 289 | 0.1% |
| Jordanian | 89 | 0.0% |
| Kenyan | 217 | 0.1% |
| Kiowa | 8 | 0.0% |
| Korean | 1,786 | 0.4% |
| Laotian | 252 | 0.1% |
| Latvian | 389 | 0.1% |
| Lebanese | 1,448 | 0.3% |
| Liberian | 440 | 0.1% |
| Lithuanian | 730 | 0.2% |
| Luxembourger | 368 | 0.1% |
| Macedonian | 85 | 0.0% |
| Malaysian | 1,088 | 0.3% |
| Maltese | 14 | 0.0% |
| Menominee | 36 | 0.0% |
| Mexican | 22,751 | 5.3% |
| Mexican American Indian | 518 | 0.1% |
| Mongolian | 119 | 0.0% |
| Moroccan | 361 | 0.1% |
| Native Hawaiian | 177 | 0.0% |
| Navajo | 40 | 0.0% |
| New Zealander | 16 | 0.0% |
| Nicaraguan | 237 | 0.1% |
| Nigerian | 852 | 0.2% |
| Northern European | 1,606 | 0.4% |
| Norwegian | 39,271 | 9.2% |
| Okinawan | 27 | 0.0% |
| Osage | 37 | 0.0% |
| Paiute | 6 | 0.0% |
| Pakistani | 234 | 0.1% |
| Palestinian | 432 | 0.1% |
| Panamanian | 255 | 0.1% |
| Paraguayan | 28 | 0.0% |
| Pennsylvania German | 76 | 0.0% |
| Peruvian | 329 | 0.1% |
| Polish | 17,053 | 4.0% |
| Portuguese | 467 | 0.1% |
| Potawatomi | 107 | 0.0% |
| Pueblo | 8 | 0.0% |
| Puerto Rican | 1,932 | 0.4% |
| Romanian | 502 | 0.1% |
| Russian | 3,811 | 0.9% |
| Salvadoran | 921 | 0.2% |
| Samoan | 96 | 0.0% |
| Scandinavian | 7,286 | 1.7% |
| Scotch-Irish | 2,160 | 0.5% |
| Scottish | 6,170 | 1.5% |
| Senegalese | 26 | 0.0% |
| Serbian | 338 | 0.1% |
| Sierra Leonean | 89 | 0.0% |
| Sioux | 1,296 | 0.3% |
| Slavic | 261 | 0.1% |
| Slovak | 1,038 | 0.2% |
| Slovene | 401 | 0.1% |
| Somali | 20,533 | 4.8% |
| South African | 56 | 0.0% |
| South American | 9,554 | 2.2% |
| South American Indian | 119 | 0.0% |
| Spaniard | 1,011 | 0.2% |
| Spanish | 560 | 0.1% |
| Sri Lankan | 2,256 | 0.5% |
| Subsaharan African | 32,008 | 7.5% |
| Sudanese | 26 | 0.0% |
| Swedish | 25,760 | 6.0% |
| Swiss | 1,966 | 0.5% |
| Syrian | 292 | 0.1% |
| Thai | 4,499 | 1.1% |
| Tlingit-Haida | 41 | 0.0% |
| Tongan | 32 | 0.0% |
| Trinidadian and Tobagonian | 220 | 0.1% |
| Tsimshian | 41 | 0.0% |
| Turkish | 182 | 0.0% |
| Ugandan | 86 | 0.0% |
| Ukrainian | 1,818 | 0.4% |
| Uruguayan | 278 | 0.1% |
| Venezuelan | 267 | 0.1% |
| Vietnamese | 73 | 0.0% |
| Welsh | 2,392 | 0.6% |
| West Indian | 186 | 0.0% |
| Yaqui | 32 | 0.0% |
| Yugoslavian | 236 | 0.1% | View All 169 Rows |
Immigrants in Minneapolis
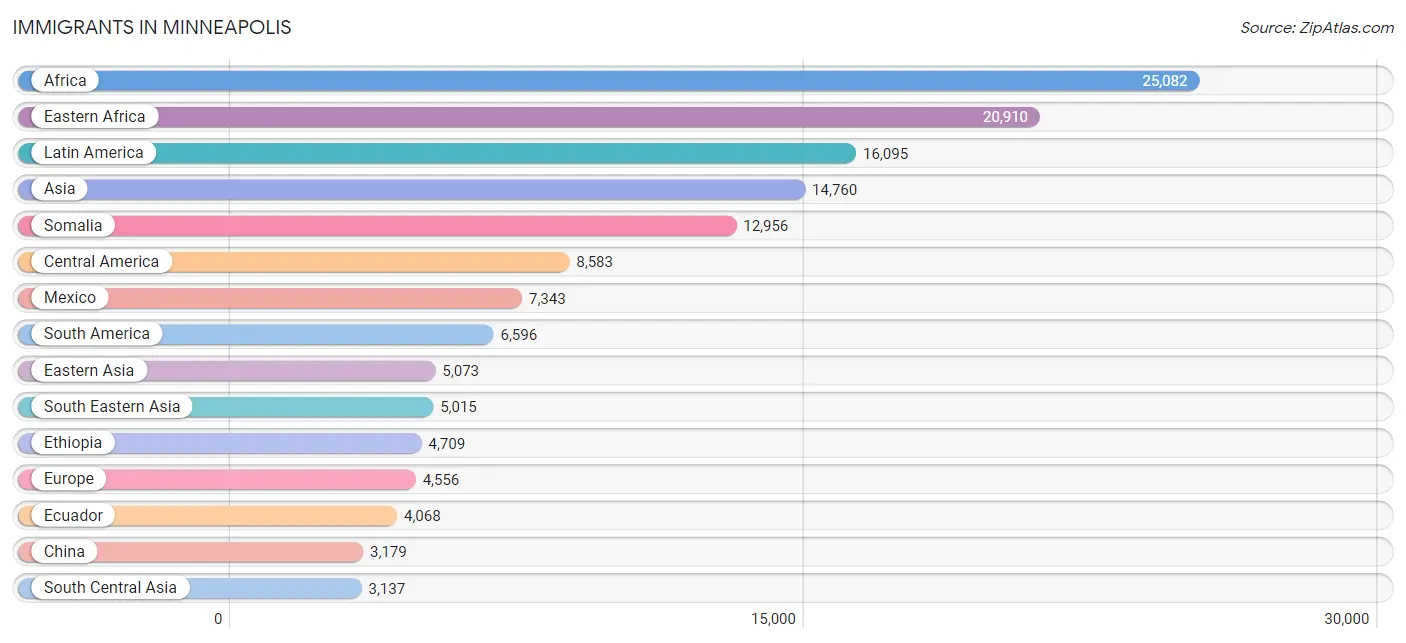
The most numerous immigrant groups reported in Minneapolis came from Africa (25,082 | 5.9%), Eastern Africa (20,910 | 4.9%), Latin America (16,095 | 3.8%), Asia (14,760 | 3.5%), and Somalia (12,956 | 3.0%), together accounting for 21.1% of all Minneapolis residents.
| Immigration Origin | # Population | % Population |
| Africa | 25,082 | 5.9% |
| Albania | 65 | 0.0% |
| Argentina | 211 | 0.1% |
| Asia | 14,760 | 3.5% |
| Australia | 96 | 0.0% |
| Austria | 68 | 0.0% |
| Bahamas | 90 | 0.0% |
| Bangladesh | 5 | 0.0% |
| Barbados | 8 | 0.0% |
| Belarus | 101 | 0.0% |
| Belgium | 40 | 0.0% |
| Belize | 31 | 0.0% |
| Bolivia | 81 | 0.0% |
| Bosnia and Herzegovina | 83 | 0.0% |
| Brazil | 595 | 0.1% |
| Bulgaria | 33 | 0.0% |
| Cabo Verde | 24 | 0.0% |
| Cambodia | 112 | 0.0% |
| Cameroon | 133 | 0.0% |
| Canada | 1,141 | 0.3% |
| Caribbean | 916 | 0.2% |
| Central America | 8,583 | 2.0% |
| Chile | 60 | 0.0% |
| China | 3,179 | 0.7% |
| Colombia | 624 | 0.2% |
| Congo | 10 | 0.0% |
| Costa Rica | 49 | 0.0% |
| Cuba | 145 | 0.0% |
| Czechoslovakia | 72 | 0.0% |
| Denmark | 15 | 0.0% |
| Dominican Republic | 38 | 0.0% |
| Eastern Africa | 20,910 | 4.9% |
| Eastern Asia | 5,073 | 1.2% |
| Eastern Europe | 1,834 | 0.4% |
| Ecuador | 4,068 | 0.9% |
| Egypt | 179 | 0.0% |
| El Salvador | 348 | 0.1% |
| England | 310 | 0.1% |
| Eritrea | 212 | 0.1% |
| Ethiopia | 4,709 | 1.1% |
| Europe | 4,556 | 1.1% |
| France | 222 | 0.1% |
| Germany | 520 | 0.1% |
| Ghana | 147 | 0.0% |
| Greece | 71 | 0.0% |
| Guatemala | 619 | 0.2% |
| Guyana | 433 | 0.1% |
| Haiti | 102 | 0.0% |
| Honduras | 125 | 0.0% |
| Hong Kong | 97 | 0.0% |
| Hungary | 27 | 0.0% |
| India | 2,440 | 0.6% |
| Indonesia | 20 | 0.0% |
| Iran | 281 | 0.1% |
| Iraq | 45 | 0.0% |
| Ireland | 135 | 0.0% |
| Israel | 72 | 0.0% |
| Italy | 153 | 0.0% |
| Jamaica | 166 | 0.0% |
| Japan | 277 | 0.1% |
| Jordan | 112 | 0.0% |
| Kenya | 2,494 | 0.6% |
| Korea | 1,578 | 0.4% |
| Kuwait | 67 | 0.0% |
| Laos | 2,044 | 0.5% |
| Latin America | 16,095 | 3.8% |
| Latvia | 85 | 0.0% |
| Lebanon | 123 | 0.0% |
| Liberia | 603 | 0.1% |
| Lithuania | 22 | 0.0% |
| Malaysia | 136 | 0.0% |
| Mexico | 7,343 | 1.7% |
| Micronesia | 3 | 0.0% |
| Middle Africa | 143 | 0.0% |
| Moldova | 7 | 0.0% |
| Morocco | 154 | 0.0% |
| Nepal | 225 | 0.1% |
| Netherlands | 129 | 0.0% |
| Nigeria | 579 | 0.1% |
| Northern Africa | 643 | 0.2% |
| Northern Europe | 1,100 | 0.3% |
| Norway | 69 | 0.0% |
| Oceania | 147 | 0.0% |
| Pakistan | 161 | 0.0% |
| Panama | 68 | 0.0% |
| Peru | 184 | 0.0% |
| Philippines | 638 | 0.2% |
| Poland | 127 | 0.0% |
| Portugal | 15 | 0.0% |
| Romania | 144 | 0.0% |
| Russia | 580 | 0.1% |
| Saudi Arabia | 228 | 0.1% |
| Scotland | 55 | 0.0% |
| Senegal | 76 | 0.0% |
| Serbia | 45 | 0.0% |
| Sierra Leone | 251 | 0.1% |
| Singapore | 34 | 0.0% |
| Somalia | 12,956 | 3.0% |
| South Africa | 288 | 0.1% |
| South America | 6,596 | 1.5% |
| South Central Asia | 3,137 | 0.7% |
| South Eastern Asia | 5,015 | 1.2% |
| Southern Europe | 589 | 0.1% |
| Spain | 350 | 0.1% |
| Sri Lanka | 18 | 0.0% |
| Sudan | 176 | 0.0% |
| Sweden | 57 | 0.0% |
| Switzerland | 54 | 0.0% |
| Syria | 134 | 0.0% |
| Taiwan | 412 | 0.1% |
| Thailand | 1,071 | 0.3% |
| Trinidad and Tobago | 238 | 0.1% |
| Turkey | 91 | 0.0% |
| Uganda | 160 | 0.0% |
| Ukraine | 376 | 0.1% |
| Uruguay | 113 | 0.0% |
| Venezuela | 167 | 0.0% |
| Vietnam | 947 | 0.2% |
| Western Africa | 2,801 | 0.7% |
| Western Asia | 1,499 | 0.4% |
| Western Europe | 1,033 | 0.2% |
| Yemen | 116 | 0.0% |
| Zimbabwe | 93 | 0.0% | View All 123 Rows |
Sex and Age in Minneapolis
Sex and Age in Minneapolis
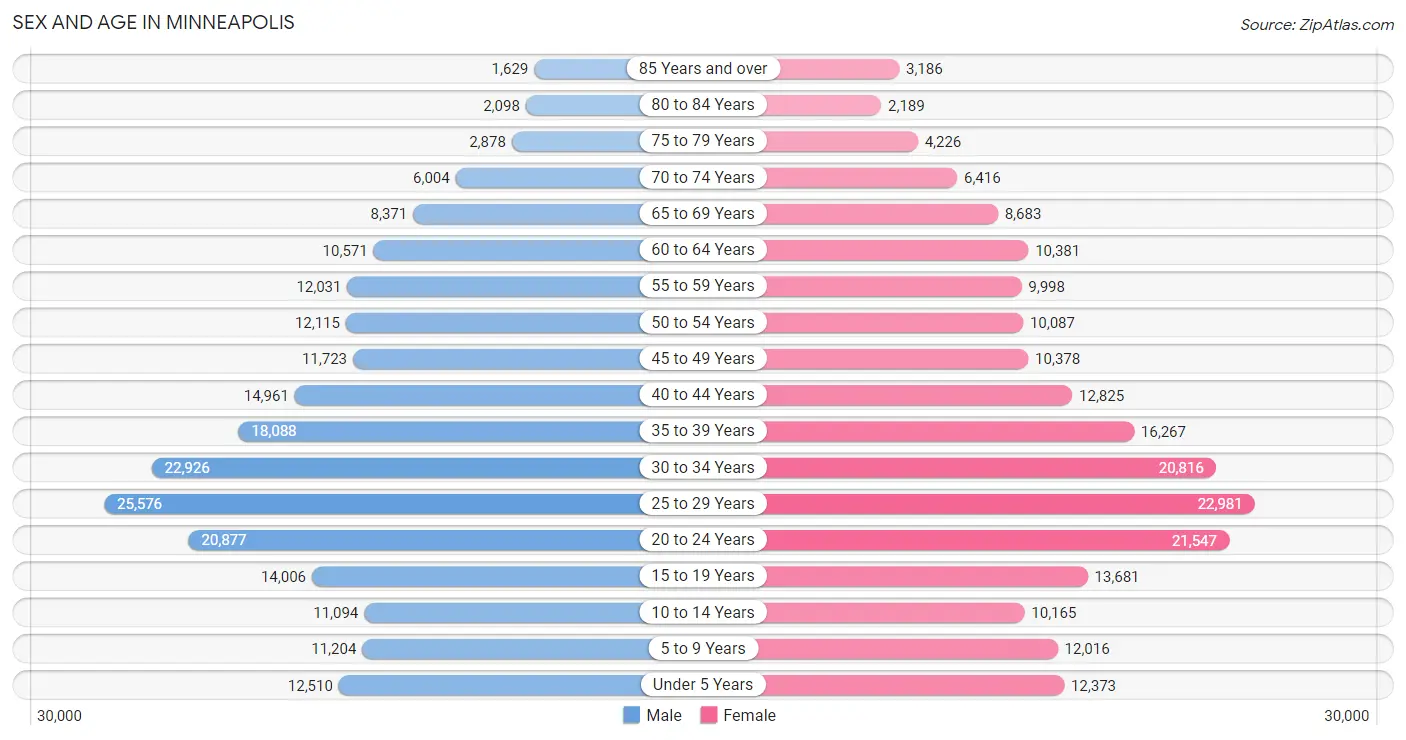
The most populous age groups in Minneapolis are 25 to 29 Years (25,576 | 11.7%) for men and 25 to 29 Years (22,981 | 11.0%) for women.
| Age Bracket | Male | Female |
| Under 5 Years | 12,510 (5.7%) | 12,373 (5.9%) |
| 5 to 9 Years | 11,204 (5.1%) | 12,016 (5.8%) |
| 10 to 14 Years | 11,094 (5.1%) | 10,165 (4.9%) |
| 15 to 19 Years | 14,006 (6.4%) | 13,681 (6.6%) |
| 20 to 24 Years | 20,877 (9.6%) | 21,547 (10.3%) |
| 25 to 29 Years | 25,576 (11.7%) | 22,981 (11.0%) |
| 30 to 34 Years | 22,926 (10.5%) | 20,816 (10.0%) |
| 35 to 39 Years | 18,088 (8.3%) | 16,267 (7.8%) |
| 40 to 44 Years | 14,961 (6.8%) | 12,825 (6.2%) |
| 45 to 49 Years | 11,723 (5.4%) | 10,378 (5.0%) |
| 50 to 54 Years | 12,115 (5.5%) | 10,087 (4.8%) |
| 55 to 59 Years | 12,031 (5.5%) | 9,998 (4.8%) |
| 60 to 64 Years | 10,571 (4.8%) | 10,381 (5.0%) |
| 65 to 69 Years | 8,371 (3.8%) | 8,683 (4.2%) |
| 70 to 74 Years | 6,004 (2.8%) | 6,416 (3.1%) |
| 75 to 79 Years | 2,878 (1.3%) | 4,226 (2.0%) |
| 80 to 84 Years | 2,098 (1.0%) | 2,189 (1.1%) |
| 85 Years and over | 1,629 (0.7%) | 3,186 (1.5%) |
| Total | 218,662 (100.0%) | 208,215 (100.0%) |
Families and Households in Minneapolis
Median Family Size in Minneapolis
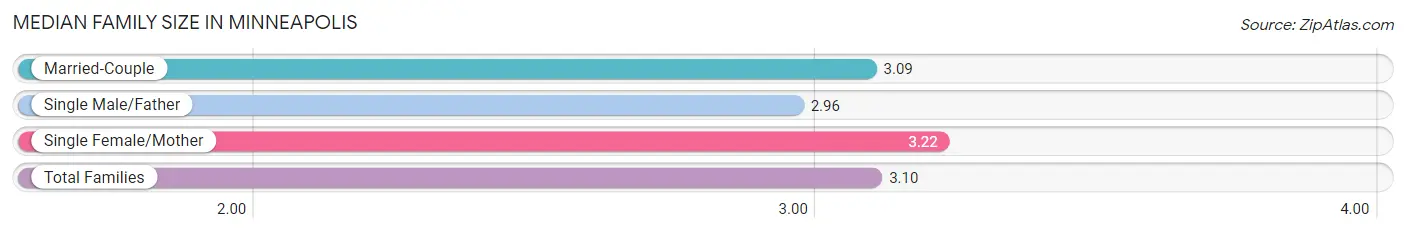
The median family size in Minneapolis is 3.10 persons per family, with single female/mother families (16,465 | 20.5%) accounting for the largest median family size of 3.22 persons per family. On the other hand, single male/father families (7,417 | 9.2%) represent the smallest median family size with 2.96 persons per family.
| Family Type | # Families | Family Size |
| Married-Couple | 56,393 (70.3%) | 3.09 |
| Single Male/Father | 7,417 (9.2%) | 2.96 |
| Single Female/Mother | 16,465 (20.5%) | 3.22 |
| Total Families | 80,275 (100.0%) | 3.10 |
Median Household Size in Minneapolis
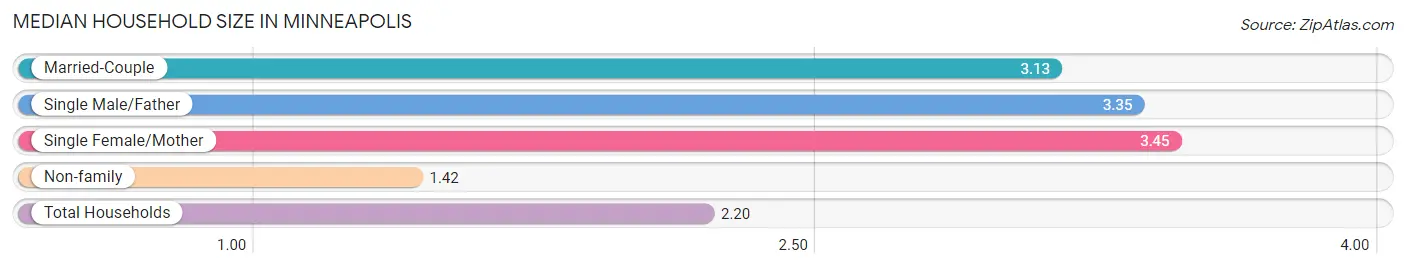
The median household size in Minneapolis is 2.20 persons per household, with single female/mother households (16,465 | 8.9%) accounting for the largest median household size of 3.45 persons per household. non-family households (105,399 | 56.8%) represent the smallest median household size with 1.42 persons per household.
| Household Type | # Households | Household Size |
| Married-Couple | 56,393 (30.4%) | 3.13 |
| Single Male/Father | 7,417 (4.0%) | 3.35 |
| Single Female/Mother | 16,465 (8.9%) | 3.45 |
| Non-family | 105,399 (56.8%) | 1.42 |
| Total Households | 185,674 (100.0%) | 2.20 |
Household Size by Marriage Status in Minneapolis
Out of a total of 185,674 households in Minneapolis, 80,275 (43.2%) are family households, while 105,399 (56.8%) are nonfamily households. The most numerous type of family households are 2-person households, comprising 36,227, and the most common type of nonfamily households are 1-person households, comprising 75,918.
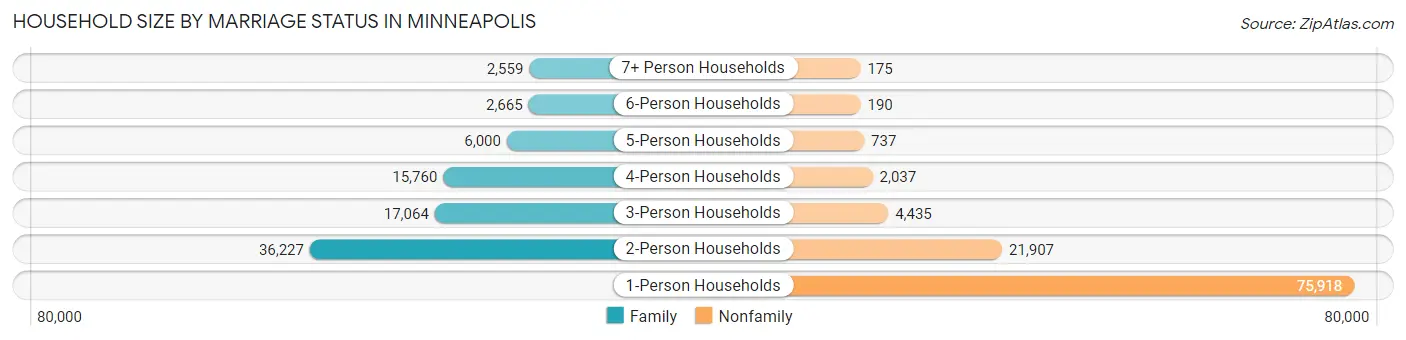
| Household Size | Family Households | Nonfamily Households |
| 1-Person Households | - | 75,918 (40.9%) |
| 2-Person Households | 36,227 (19.5%) | 21,907 (11.8%) |
| 3-Person Households | 17,064 (9.2%) | 4,435 (2.4%) |
| 4-Person Households | 15,760 (8.5%) | 2,037 (1.1%) |
| 5-Person Households | 6,000 (3.2%) | 737 (0.4%) |
| 6-Person Households | 2,665 (1.4%) | 190 (0.1%) |
| 7+ Person Households | 2,559 (1.4%) | 175 (0.1%) |
| Total | 80,275 (43.2%) | 105,399 (56.8%) |
Female Fertility in Minneapolis
Fertility by Age in Minneapolis
Average fertility rate in Minneapolis is 43.0 births per 1,000 women. Women in the age bracket of 20 to 34 years have the highest fertility rate with 50.0 births per 1,000 women. Women in the age bracket of 20 to 34 years acount for 62.7% of all women with births.
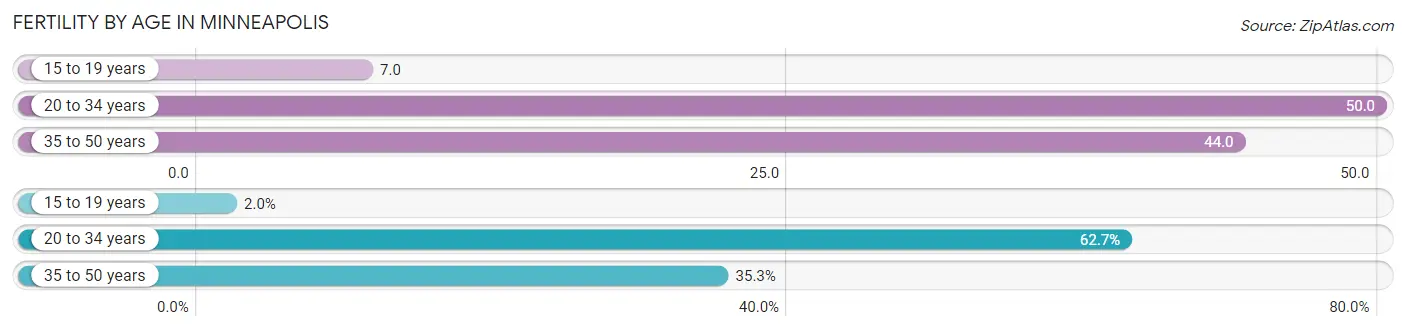
| Age Bracket | Women with Births | Births / 1,000 Women |
| 15 to 19 years | 102 (2.0%) | 7.0 |
| 20 to 34 years | 3,253 (62.7%) | 50.0 |
| 35 to 50 years | 1,833 (35.3%) | 44.0 |
| Total | 5,188 (100.0%) | 43.0 |
Fertility by Age by Marriage Status in Minneapolis
75.5% of women with births (5,188) in Minneapolis are married. The highest percentage of unmarried women with births falls into 15 to 19 years age bracket with 64.7% of them unmarried at the time of birth, while the lowest percentage of unmarried women with births belong to 35 to 50 years age bracket with 17.9% of them unmarried.
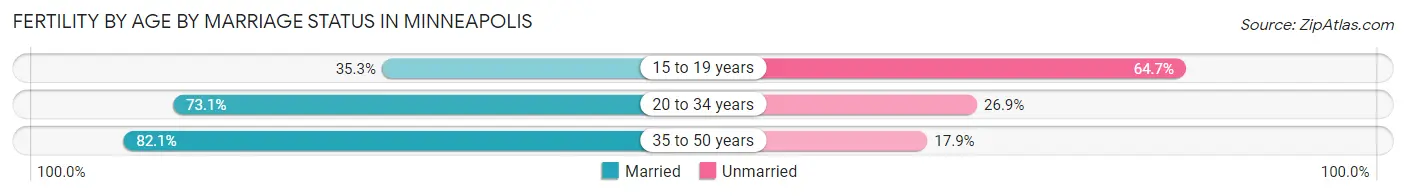
| Age Bracket | Married | Unmarried |
| 15 to 19 years | 36 (35.3%) | 66 (64.7%) |
| 20 to 34 years | 2,378 (73.1%) | 875 (26.9%) |
| 35 to 50 years | 1,505 (82.1%) | 328 (17.9%) |
| Total | 3,917 (75.5%) | 1,271 (24.5%) |
Fertility by Education in Minneapolis
Average fertility rate in Minneapolis is 43.0 births per 1,000 women. Women with the education attainment of less than high school have the highest fertility rate of 66.0 births per 1,000 women, while women with the education attainment of college or associate's degree have the lowest fertility at 26.0 births per 1,000 women. Women with the education attainment of graduate degree represent 27.0% of all women with births.
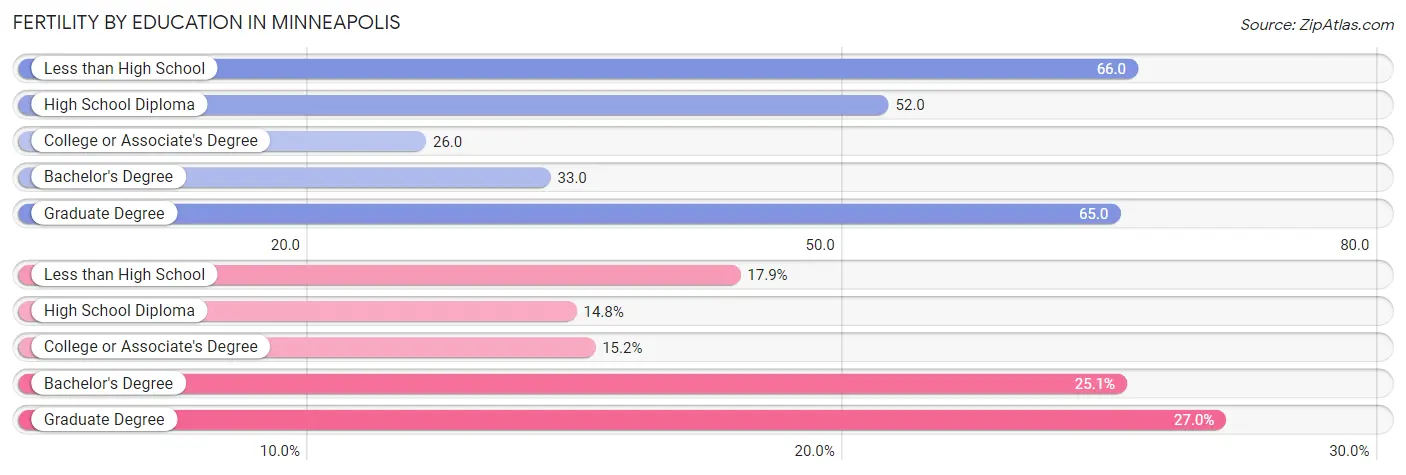
| Educational Attainment | Women with Births | Births / 1,000 Women |
| Less than High School | 928 (17.9%) | 66.0 |
| High School Diploma | 769 (14.8%) | 52.0 |
| College or Associate's Degree | 787 (15.2%) | 26.0 |
| Bachelor's Degree | 1,304 (25.1%) | 33.0 |
| Graduate Degree | 1,400 (27.0%) | 65.0 |
| Total | 5,188 (100.0%) | 43.0 |
Fertility by Education by Marriage Status in Minneapolis
24.5% of women with births in Minneapolis are unmarried. Women with the educational attainment of graduate degree are most likely to be married with 95.9% of them married at childbirth, while women with the educational attainment of college or associate's degree are least likely to be married with 53.1% of them unmarried at childbirth.
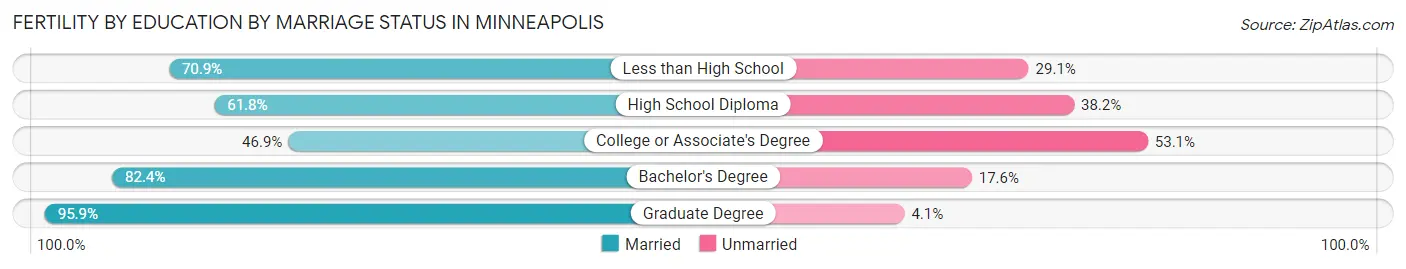
| Educational Attainment | Married | Unmarried |
| Less than High School | 658 (70.9%) | 270 (29.1%) |
| High School Diploma | 475 (61.8%) | 294 (38.2%) |
| College or Associate's Degree | 369 (46.9%) | 418 (53.1%) |
| Bachelor's Degree | 1,074 (82.4%) | 230 (17.6%) |
| Graduate Degree | 1,343 (95.9%) | 57 (4.1%) |
| Total | 3,917 (75.5%) | 1,271 (24.5%) |
Employment Characteristics in Minneapolis
Employment by Class of Employer in Minneapolis
Among the 239,114 employed individuals in Minneapolis, private company employees (153,166 | 64.1%), not-for-profit organizations (33,616 | 14.1%), and local government employees (14,767 | 6.2%) make up the most common classes of employment.
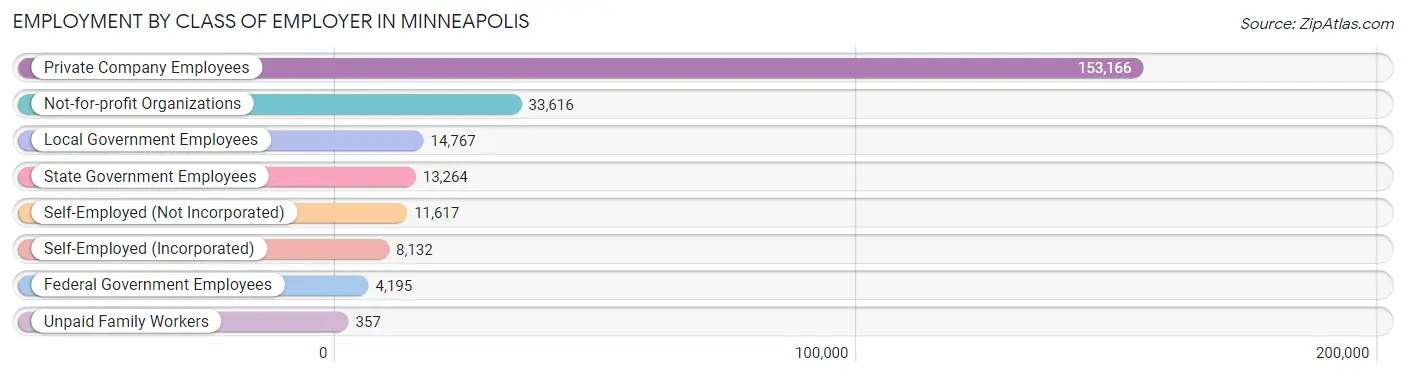
| Employer Class | # Employees | % Employees |
| Private Company Employees | 153,166 | 64.1% |
| Self-Employed (Incorporated) | 8,132 | 3.4% |
| Self-Employed (Not Incorporated) | 11,617 | 4.9% |
| Not-for-profit Organizations | 33,616 | 14.1% |
| Local Government Employees | 14,767 | 6.2% |
| State Government Employees | 13,264 | 5.6% |
| Federal Government Employees | 4,195 | 1.8% |
| Unpaid Family Workers | 357 | 0.2% |
| Total | 239,114 | 100.0% |
Employment Status by Age in Minneapolis
According to the labor force statistics for Minneapolis, out of the total population over 16 years of age (353,178), 73.5% or 259,586 individuals are in the labor force, with 5.8% or 15,056 of them unemployed. The age group with the highest labor force participation rate is 30 to 34 years, with 91.5% or 40,024 individuals in the labor force. Within the labor force, the 16 to 19 years age range has the highest percentage of unemployed individuals, with 19.2% or 2,053 of them being unemployed.
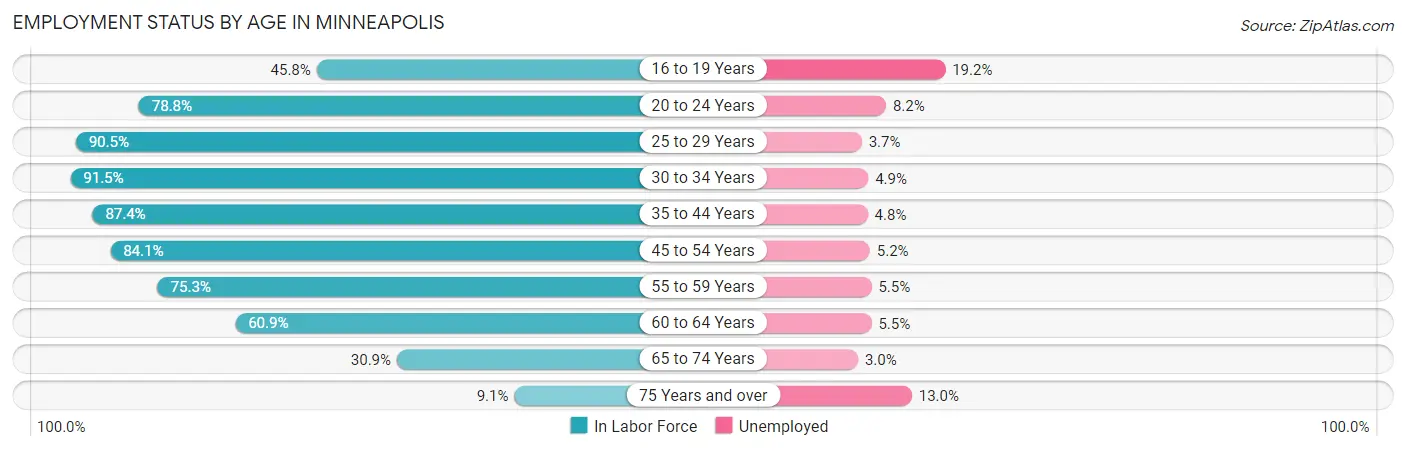
| Age Bracket | In Labor Force | Unemployed |
| 16 to 19 Years | 10,694 (45.8%) | 2,053 (19.2%) |
| 20 to 24 Years | 33,430 (78.8%) | 2,741 (8.2%) |
| 25 to 29 Years | 43,944 (90.5%) | 1,626 (3.7%) |
| 30 to 34 Years | 40,024 (91.5%) | 1,961 (4.9%) |
| 35 to 44 Years | 54,311 (87.4%) | 2,607 (4.8%) |
| 45 to 54 Years | 37,259 (84.1%) | 1,937 (5.2%) |
| 55 to 59 Years | 16,588 (75.3%) | 912 (5.5%) |
| 60 to 64 Years | 12,760 (60.9%) | 702 (5.5%) |
| 65 to 74 Years | 9,107 (30.9%) | 273 (3.0%) |
| 75 Years and over | 1,475 (9.1%) | 192 (13.0%) |
| Total | 259,586 (73.5%) | 15,056 (5.8%) |
Employment Status by Educational Attainment in Minneapolis
According to labor force statistics for Minneapolis, 84.8% of individuals (204,982) out of the total population between 25 and 64 years of age (241,724) are in the labor force, with 4.8% or 9,839 of them being unemployed. The group with the highest labor force participation rate are those with the educational attainment of bachelor's degree or higher, with 92.5% or 123,240 individuals in the labor force. Within the labor force, individuals with less than high school education have the highest percentage of unemployment, with 10.3% or 1,366 of them being unemployed.
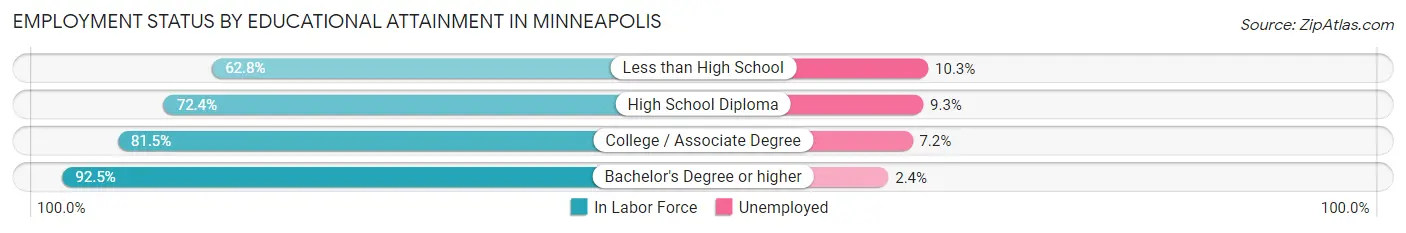
| Educational Attainment | In Labor Force | Unemployed |
| Less than High School | 13,260 (62.8%) | 2,175 (10.3%) |
| High School Diploma | 22,879 (72.4%) | 2,939 (9.3%) |
| College / Associate Degree | 45,457 (81.5%) | 4,016 (7.2%) |
| Bachelor's Degree or higher | 123,240 (92.5%) | 3,198 (2.4%) |
| Total | 204,982 (84.8%) | 11,603 (4.8%) |
Employment Occupations by Sex in Minneapolis
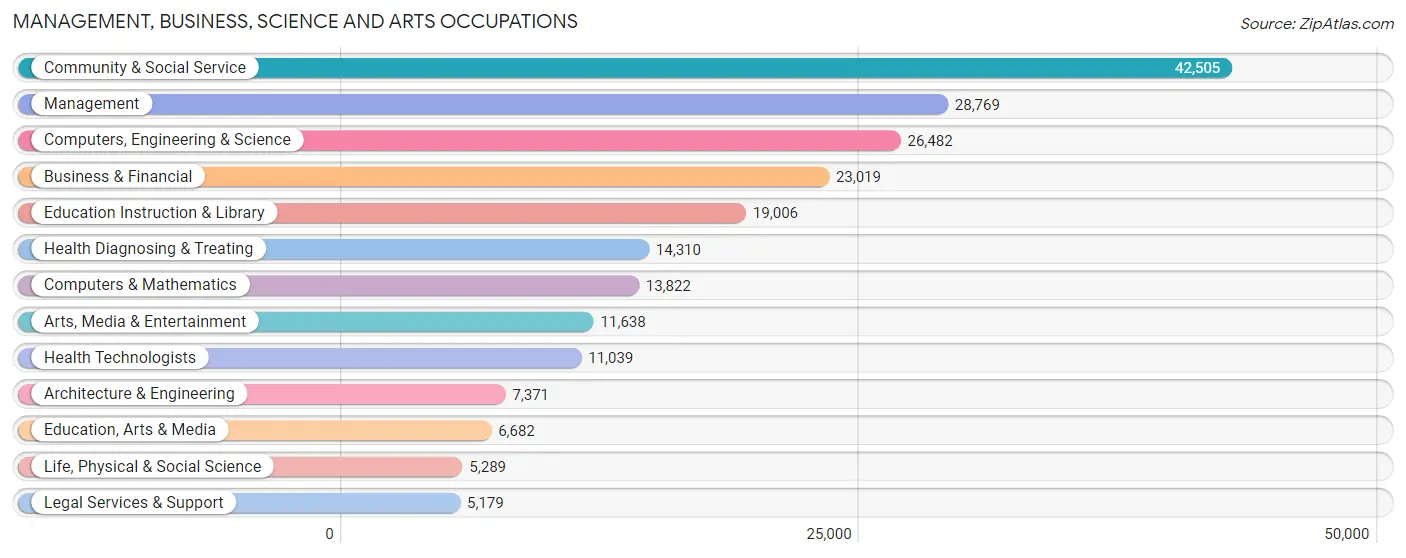
Management, Business, Science and Arts Occupations
The most common Management, Business, Science and Arts occupations in Minneapolis are Community & Social Service (42,505 | 17.4%), Management (28,769 | 11.8%), Computers, Engineering & Science (26,482 | 10.8%), Business & Financial (23,019 | 9.4%), and Education Instruction & Library (19,006 | 7.8%).
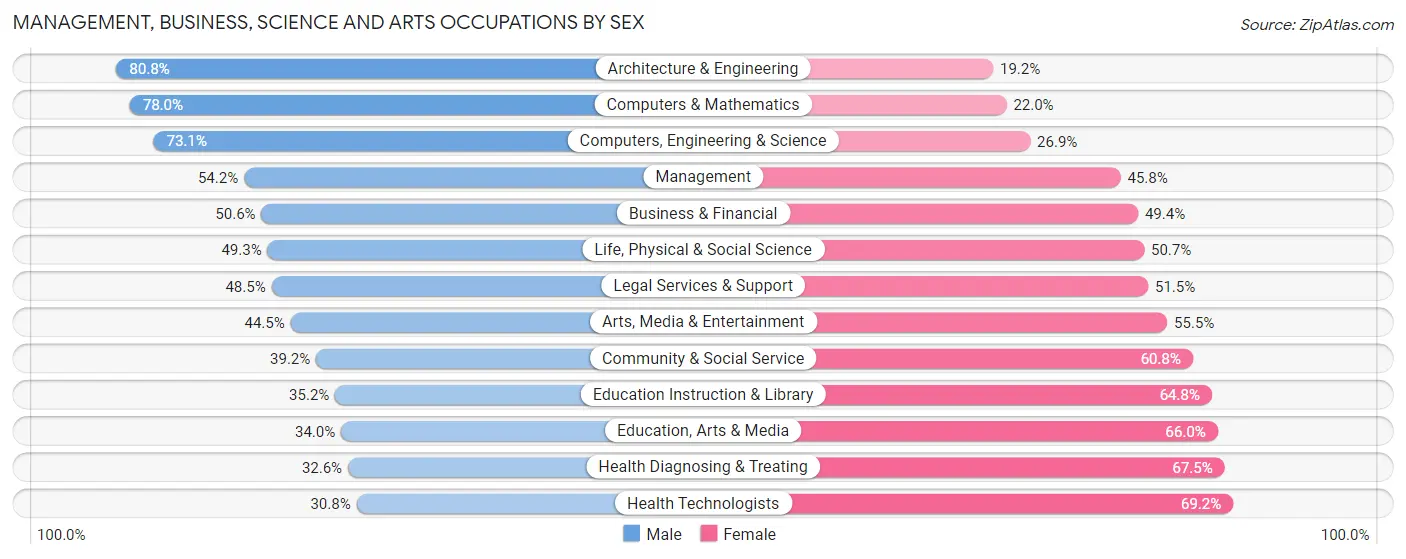
Management, Business, Science and Arts Occupations by Sex
Within the Management, Business, Science and Arts occupations in Minneapolis, the most male-oriented occupations are Architecture & Engineering (80.8%), Computers & Mathematics (78.0%), and Computers, Engineering & Science (73.1%), while the most female-oriented occupations are Health Technologists (69.2%), Health Diagnosing & Treating (67.4%), and Education, Arts & Media (66.0%).
| Occupation | Male | Female |
| Management | 15,605 (54.2%) | 13,164 (45.8%) |
| Business & Financial | 11,647 (50.6%) | 11,372 (49.4%) |
| Computers, Engineering & Science | 19,355 (73.1%) | 7,127 (26.9%) |
| Computers & Mathematics | 10,787 (78.0%) | 3,035 (22.0%) |
| Architecture & Engineering | 5,959 (80.8%) | 1,412 (19.2%) |
| Life, Physical & Social Science | 2,609 (49.3%) | 2,680 (50.7%) |
| Community & Social Service | 16,658 (39.2%) | 25,847 (60.8%) |
| Education, Arts & Media | 2,271 (34.0%) | 4,411 (66.0%) |
| Legal Services & Support | 2,512 (48.5%) | 2,667 (51.5%) |
| Education Instruction & Library | 6,694 (35.2%) | 12,312 (64.8%) |
| Arts, Media & Entertainment | 5,181 (44.5%) | 6,457 (55.5%) |
| Health Diagnosing & Treating | 4,658 (32.6%) | 9,652 (67.4%) |
| Health Technologists | 3,397 (30.8%) | 7,642 (69.2%) |
| Total (Category) | 67,923 (50.3%) | 67,162 (49.7%) |
| Total (Overall) | 128,452 (52.6%) | 115,760 (47.4%) |
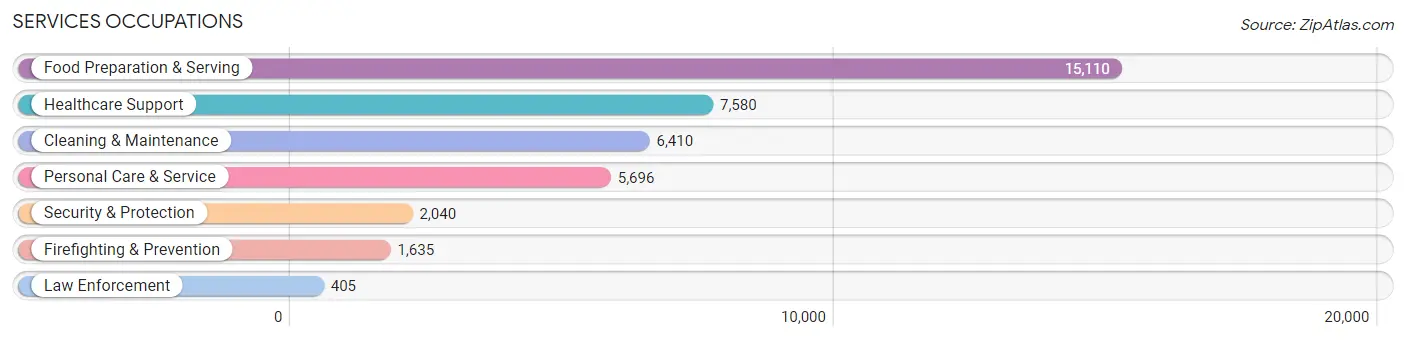
Services Occupations
The most common Services occupations in Minneapolis are Food Preparation & Serving (15,110 | 6.2%), Healthcare Support (7,580 | 3.1%), Cleaning & Maintenance (6,410 | 2.6%), Personal Care & Service (5,696 | 2.3%), and Security & Protection (2,040 | 0.8%).
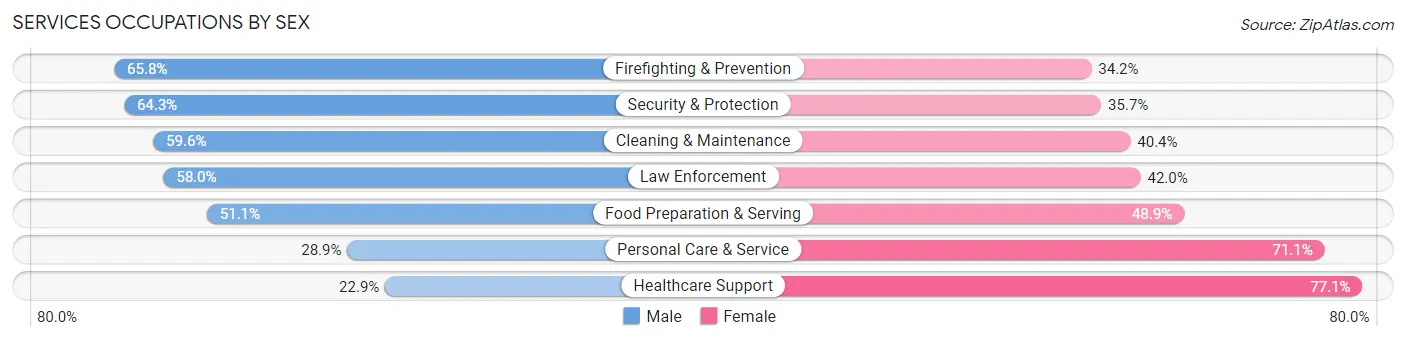
Services Occupations by Sex
Within the Services occupations in Minneapolis, the most male-oriented occupations are Firefighting & Prevention (65.8%), Security & Protection (64.3%), and Cleaning & Maintenance (59.6%), while the most female-oriented occupations are Healthcare Support (77.1%), Personal Care & Service (71.1%), and Food Preparation & Serving (48.9%).
| Occupation | Male | Female |
| Healthcare Support | 1,734 (22.9%) | 5,846 (77.1%) |
| Security & Protection | 1,311 (64.3%) | 729 (35.7%) |
| Firefighting & Prevention | 1,076 (65.8%) | 559 (34.2%) |
| Law Enforcement | 235 (58.0%) | 170 (42.0%) |
| Food Preparation & Serving | 7,724 (51.1%) | 7,386 (48.9%) |
| Cleaning & Maintenance | 3,822 (59.6%) | 2,588 (40.4%) |
| Personal Care & Service | 1,645 (28.9%) | 4,051 (71.1%) |
| Total (Category) | 16,236 (44.1%) | 20,600 (55.9%) |
| Total (Overall) | 128,452 (52.6%) | 115,760 (47.4%) |
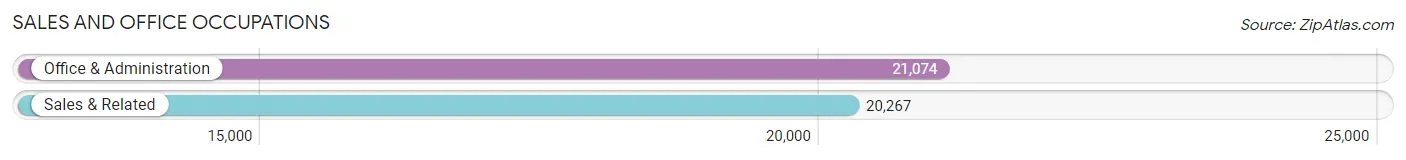
Sales and Office Occupations
The most common Sales and Office occupations in Minneapolis are Office & Administration (21,074 | 8.6%), and Sales & Related (20,267 | 8.3%).
Sales and Office Occupations by Sex
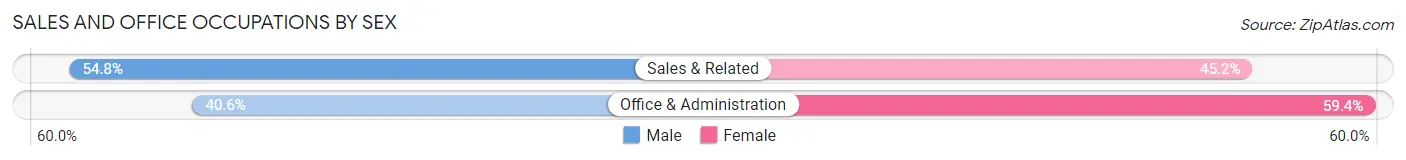
| Occupation | Male | Female |
| Sales & Related | 11,106 (54.8%) | 9,161 (45.2%) |
| Office & Administration | 8,563 (40.6%) | 12,511 (59.4%) |
| Total (Category) | 19,669 (47.6%) | 21,672 (52.4%) |
| Total (Overall) | 128,452 (52.6%) | 115,760 (47.4%) |
Natural Resources, Construction and Maintenance Occupations
The most common Natural Resources, Construction and Maintenance occupations in Minneapolis are Construction & Extraction (4,541 | 1.9%), Installation, Maintenance & Repair (2,831 | 1.2%), and Farming, Fishing & Forestry (472 | 0.2%).

Natural Resources, Construction and Maintenance Occupations by Sex
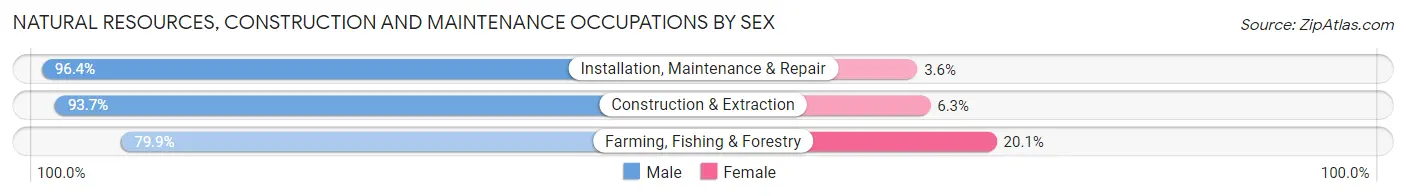
| Occupation | Male | Female |
| Farming, Fishing & Forestry | 377 (79.9%) | 95 (20.1%) |
| Construction & Extraction | 4,254 (93.7%) | 287 (6.3%) |
| Installation, Maintenance & Repair | 2,729 (96.4%) | 102 (3.6%) |
| Total (Category) | 7,360 (93.8%) | 484 (6.2%) |
| Total (Overall) | 128,452 (52.6%) | 115,760 (47.4%) |
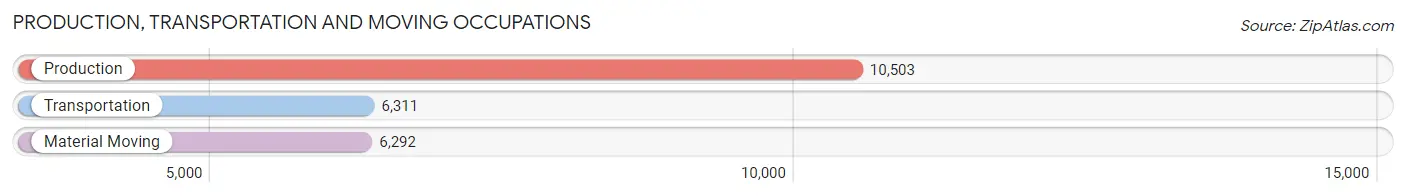
Production, Transportation and Moving Occupations
The most common Production, Transportation and Moving occupations in Minneapolis are Production (10,503 | 4.3%), Transportation (6,311 | 2.6%), and Material Moving (6,292 | 2.6%).
Production, Transportation and Moving Occupations by Sex
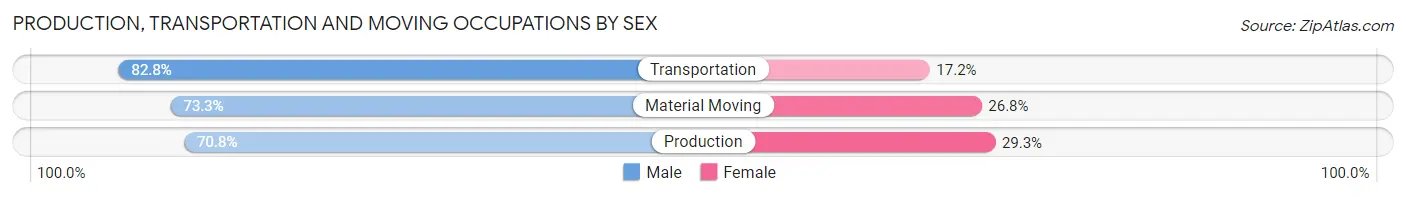
| Occupation | Male | Female |
| Production | 7,431 (70.8%) | 3,072 (29.2%) |
| Transportation | 5,224 (82.8%) | 1,087 (17.2%) |
| Material Moving | 4,609 (73.3%) | 1,683 (26.8%) |
| Total (Category) | 17,264 (74.7%) | 5,842 (25.3%) |
| Total (Overall) | 128,452 (52.6%) | 115,760 (47.4%) |
Employment Industries by Sex in Minneapolis
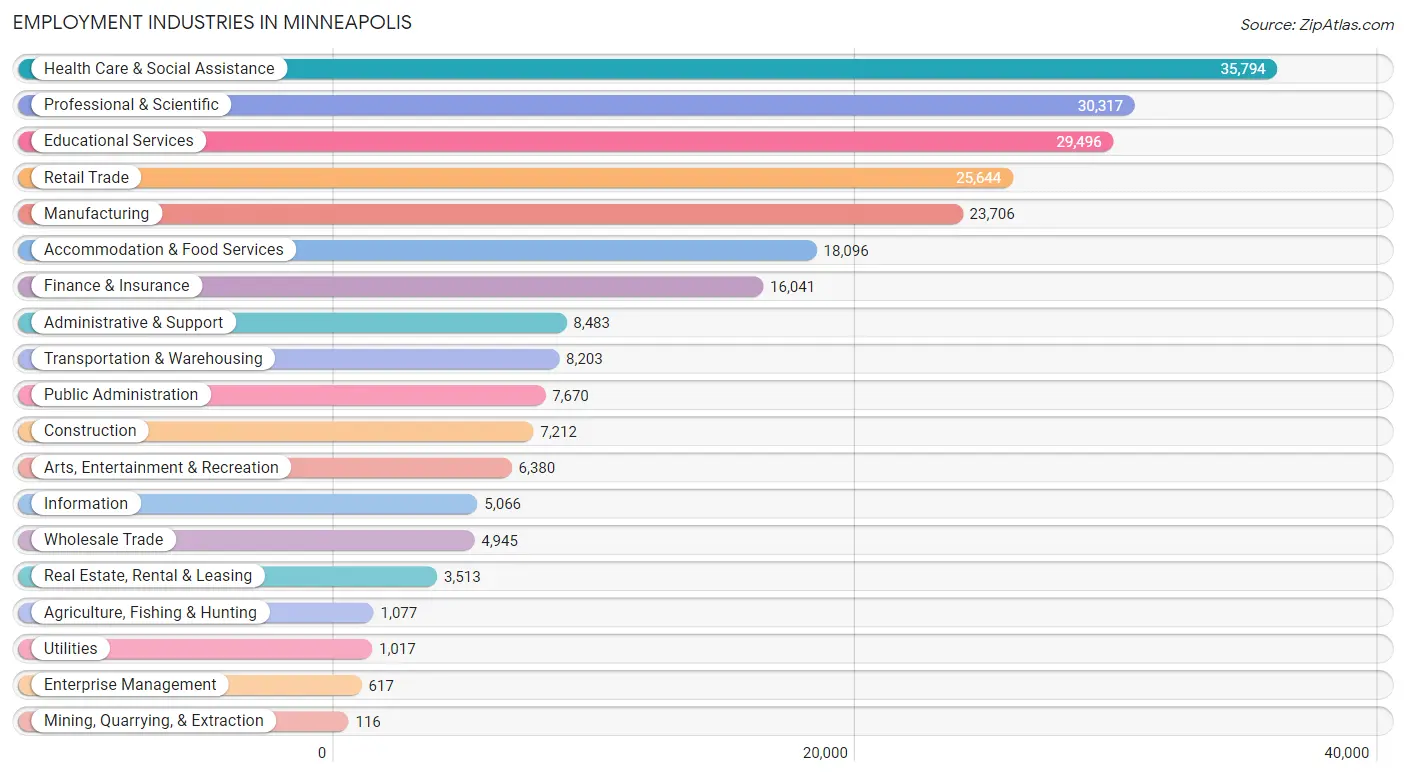
Employment Industries in Minneapolis
The major employment industries in Minneapolis include Health Care & Social Assistance (35,794 | 14.7%), Professional & Scientific (30,317 | 12.4%), Educational Services (29,496 | 12.1%), Retail Trade (25,644 | 10.5%), and Manufacturing (23,706 | 9.7%).
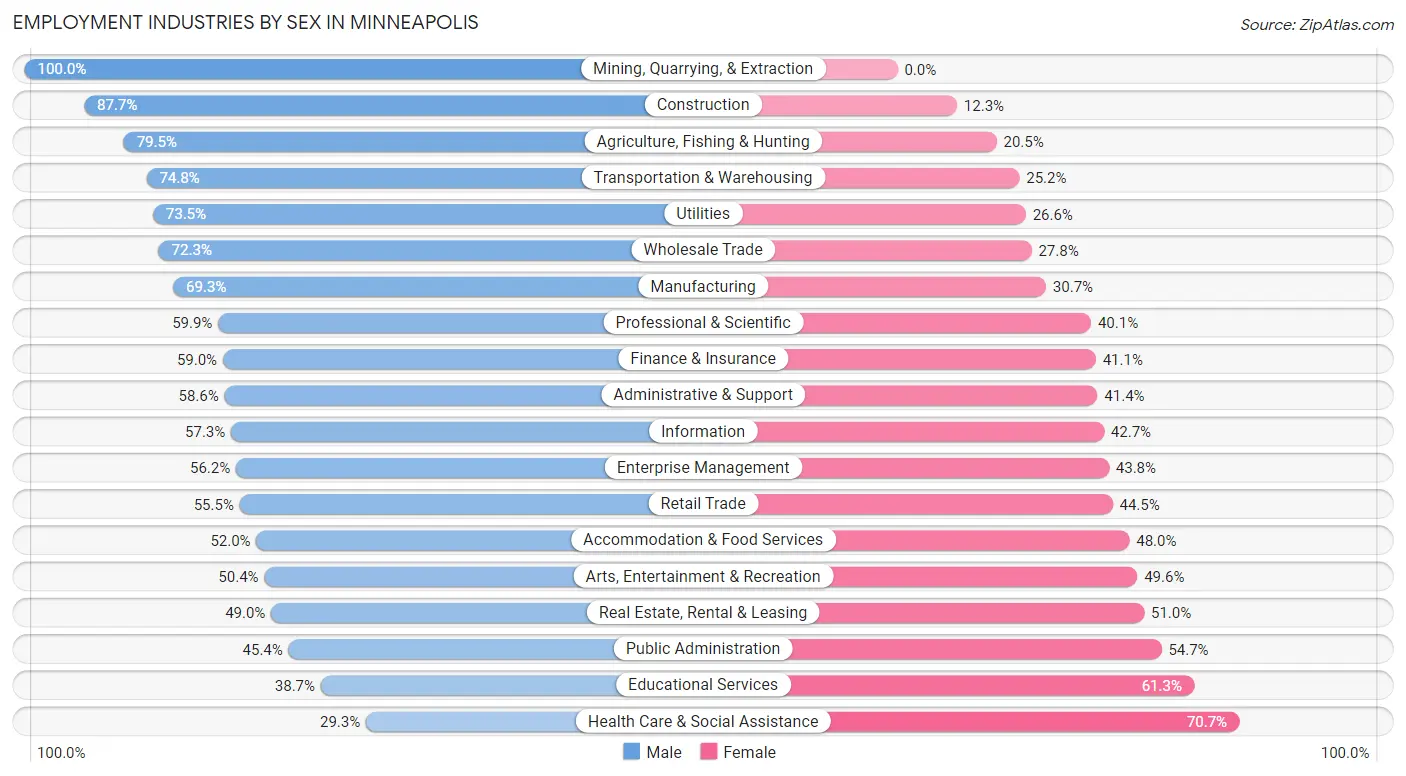
Employment Industries by Sex in Minneapolis
The Minneapolis industries that see more men than women are Mining, Quarrying, & Extraction (100.0%), Construction (87.7%), and Agriculture, Fishing & Hunting (79.5%), whereas the industries that tend to have a higher number of women are Health Care & Social Assistance (70.7%), Educational Services (61.3%), and Public Administration (54.6%).
| Industry | Male | Female |
| Agriculture, Fishing & Hunting | 856 (79.5%) | 221 (20.5%) |
| Mining, Quarrying, & Extraction | 116 (100.0%) | 0 (0.0%) |
| Construction | 6,324 (87.7%) | 888 (12.3%) |
| Manufacturing | 16,418 (69.3%) | 7,288 (30.7%) |
| Wholesale Trade | 3,573 (72.3%) | 1,372 (27.8%) |
| Retail Trade | 14,225 (55.5%) | 11,419 (44.5%) |
| Transportation & Warehousing | 6,133 (74.8%) | 2,070 (25.2%) |
| Utilities | 747 (73.5%) | 270 (26.6%) |
| Information | 2,901 (57.3%) | 2,165 (42.7%) |
| Finance & Insurance | 9,456 (59.0%) | 6,585 (41.0%) |
| Real Estate, Rental & Leasing | 1,720 (49.0%) | 1,793 (51.0%) |
| Professional & Scientific | 18,170 (59.9%) | 12,147 (40.1%) |
| Enterprise Management | 347 (56.2%) | 270 (43.8%) |
| Administrative & Support | 4,972 (58.6%) | 3,511 (41.4%) |
| Educational Services | 11,409 (38.7%) | 18,087 (61.3%) |
| Health Care & Social Assistance | 10,494 (29.3%) | 25,300 (70.7%) |
| Arts, Entertainment & Recreation | 3,213 (50.4%) | 3,167 (49.6%) |
| Accommodation & Food Services | 9,411 (52.0%) | 8,685 (48.0%) |
| Public Administration | 3,478 (45.4%) | 4,192 (54.6%) |
| Total | 128,452 (52.6%) | 115,760 (47.4%) |
Education in Minneapolis
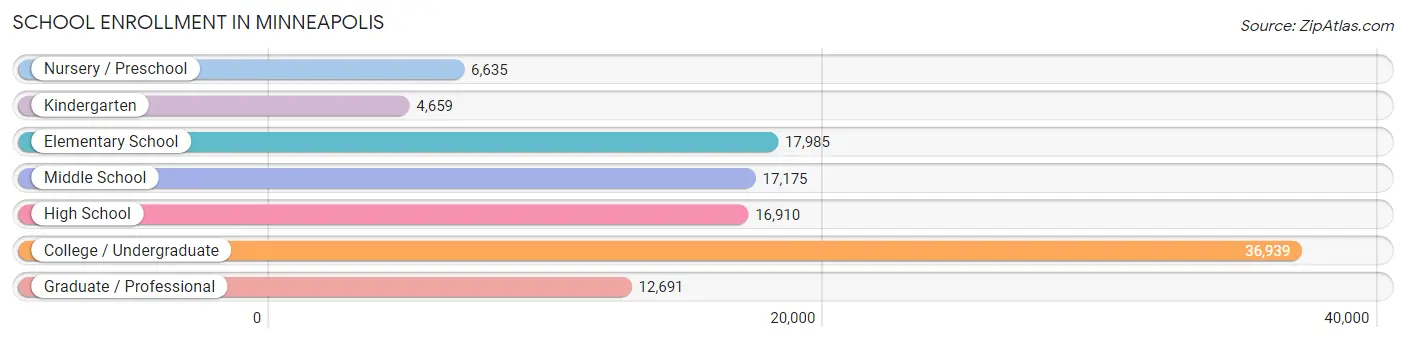
School Enrollment in Minneapolis
The most common levels of schooling among the 112,994 students in Minneapolis are college / undergraduate (36,939 | 32.7%), elementary school (17,985 | 15.9%), and middle school (17,175 | 15.2%).
| School Level | # Students | % Students |
| Nursery / Preschool | 6,635 | 5.9% |
| Kindergarten | 4,659 | 4.1% |
| Elementary School | 17,985 | 15.9% |
| Middle School | 17,175 | 15.2% |
| High School | 16,910 | 15.0% |
| College / Undergraduate | 36,939 | 32.7% |
| Graduate / Professional | 12,691 | 11.2% |
| Total | 112,994 | 100.0% |
School Enrollment by Age by Funding Source in Minneapolis
Out of a total of 112,994 students who are enrolled in schools in Minneapolis, 19,661 (17.4%) attend a private institution, while the remaining 93,333 (82.6%) are enrolled in public schools. The age group of 3 to 4 year olds has the highest likelihood of being enrolled in private schools, with 2,236 (45.8% in the age bracket) enrolled. Conversely, the age group of 10 to 14 year olds has the lowest likelihood of being enrolled in a private school, with 18,899 (89.6% in the age bracket) attending a public institution.
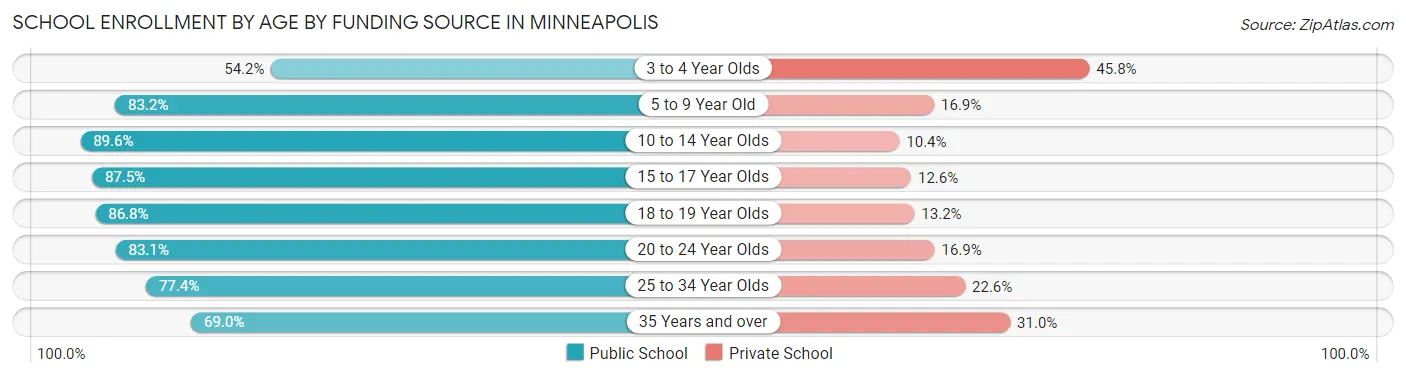
| Age Bracket | Public School | Private School |
| 3 to 4 Year Olds | 2,649 (54.2%) | 2,236 (45.8%) |
| 5 to 9 Year Old | 18,319 (83.2%) | 3,712 (16.9%) |
| 10 to 14 Year Olds | 18,899 (89.6%) | 2,187 (10.4%) |
| 15 to 17 Year Olds | 10,424 (87.5%) | 1,496 (12.6%) |
| 18 to 19 Year Olds | 11,638 (86.8%) | 1,767 (13.2%) |
| 20 to 24 Year Olds | 17,465 (83.1%) | 3,562 (16.9%) |
| 25 to 34 Year Olds | 10,184 (77.4%) | 2,977 (22.6%) |
| 35 Years and over | 3,780 (69.0%) | 1,699 (31.0%) |
| Total | 93,333 (82.6%) | 19,661 (17.4%) |
Educational Attainment by Field of Study in Minneapolis
Business (25,080 | 14.3%), social sciences (22,959 | 13.1%), visual & performing arts (15,400 | 8.7%), literature & languages (14,133 | 8.0%), and bio, nature & agricultural (12,103 | 6.9%) are the most common fields of study among 175,918 individuals in Minneapolis who have obtained a bachelor's degree or higher.
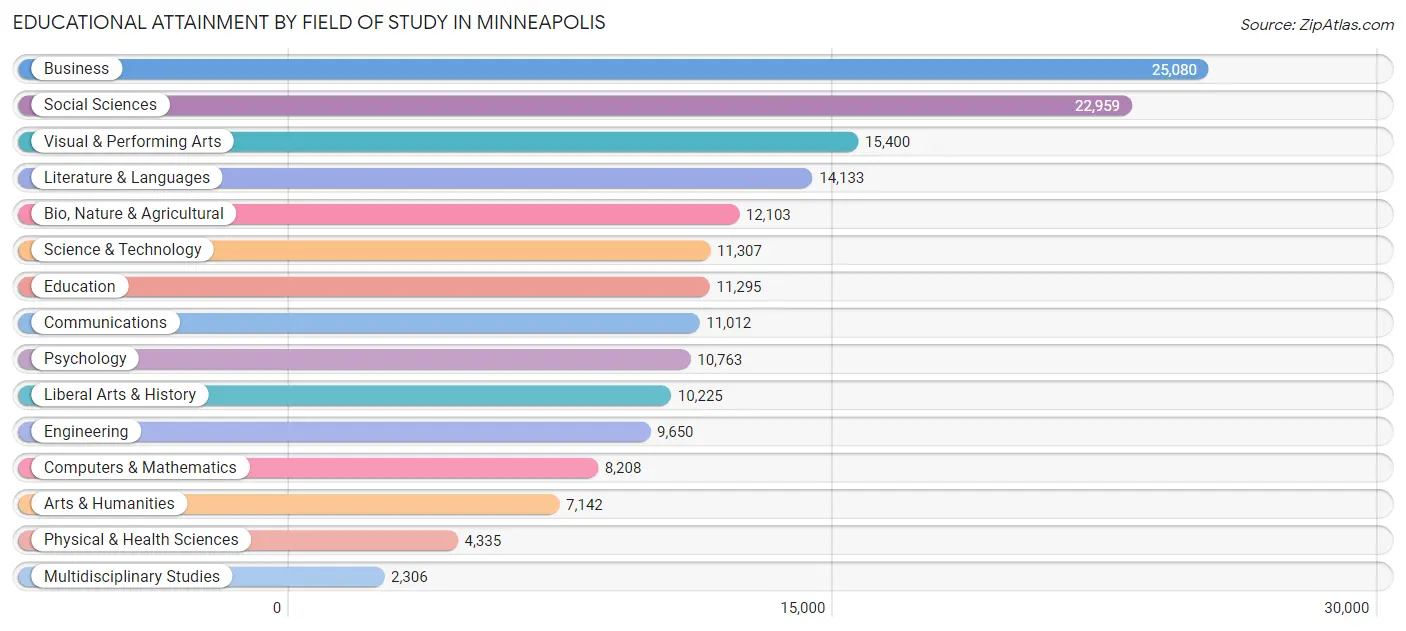
| Field of Study | # Graduates | % Graduates |
| Computers & Mathematics | 8,208 | 4.7% |
| Bio, Nature & Agricultural | 12,103 | 6.9% |
| Physical & Health Sciences | 4,335 | 2.5% |
| Psychology | 10,763 | 6.1% |
| Social Sciences | 22,959 | 13.1% |
| Engineering | 9,650 | 5.5% |
| Multidisciplinary Studies | 2,306 | 1.3% |
| Science & Technology | 11,307 | 6.4% |
| Business | 25,080 | 14.3% |
| Education | 11,295 | 6.4% |
| Literature & Languages | 14,133 | 8.0% |
| Liberal Arts & History | 10,225 | 5.8% |
| Visual & Performing Arts | 15,400 | 8.7% |
| Communications | 11,012 | 6.3% |
| Arts & Humanities | 7,142 | 4.1% |
| Total | 175,918 | 100.0% |
Transportation & Commute in Minneapolis
Vehicle Availability by Sex in Minneapolis
The most prevalent vehicle ownership categories in Minneapolis are males with 2 vehicles (49,043, accounting for 39.5%) and females with 2 vehicles (44,415, making up 44.3%).
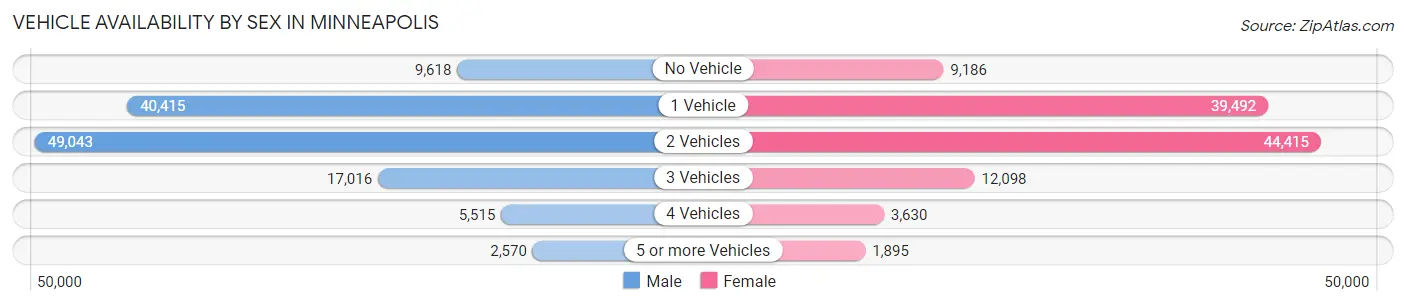
| Vehicles Available | Male | Female |
| No Vehicle | 9,618 (7.7%) | 9,186 (8.3%) |
| 1 Vehicle | 40,415 (32.6%) | 39,492 (35.7%) |
| 2 Vehicles | 49,043 (39.5%) | 44,415 (40.1%) |
| 3 Vehicles | 17,016 (13.7%) | 12,098 (10.9%) |
| 4 Vehicles | 5,515 (4.4%) | 3,630 (3.3%) |
| 5 or more Vehicles | 2,570 (2.1%) | 1,895 (1.7%) |
| Total | 124,177 (100.0%) | 110,716 (100.0%) |
Commute Time in Minneapolis
The most frequently occuring commute durations in Minneapolis are 15 to 19 minutes (38,403 commuters, 20.0%), 20 to 24 minutes (38,184 commuters, 19.9%), and 30 to 34 minutes (27,947 commuters, 14.5%).
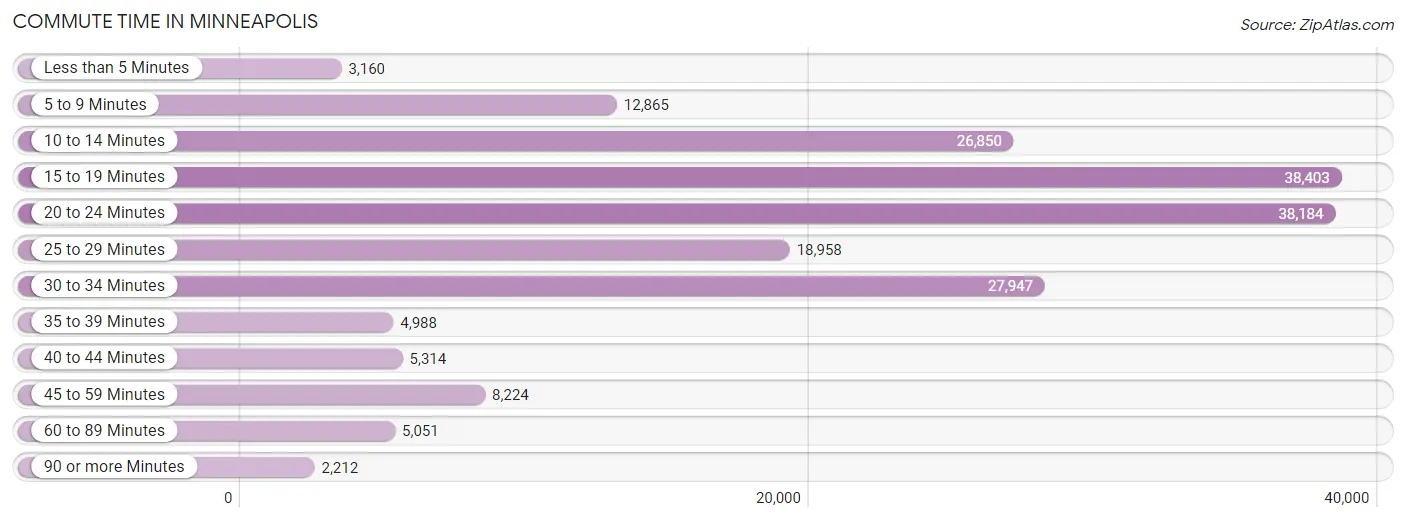
| Commute Time | # Commuters | % Commuters |
| Less than 5 Minutes | 3,160 | 1.6% |
| 5 to 9 Minutes | 12,865 | 6.7% |
| 10 to 14 Minutes | 26,850 | 14.0% |
| 15 to 19 Minutes | 38,403 | 20.0% |
| 20 to 24 Minutes | 38,184 | 19.9% |
| 25 to 29 Minutes | 18,958 | 9.9% |
| 30 to 34 Minutes | 27,947 | 14.5% |
| 35 to 39 Minutes | 4,988 | 2.6% |
| 40 to 44 Minutes | 5,314 | 2.8% |
| 45 to 59 Minutes | 8,224 | 4.3% |
| 60 to 89 Minutes | 5,051 | 2.6% |
| 90 or more Minutes | 2,212 | 1.1% |
Commute Time by Sex in Minneapolis
The most common commute times in Minneapolis are 15 to 19 minutes (19,803 commuters, 19.3%) for males and 15 to 19 minutes (18,600 commuters, 20.7%) for females.
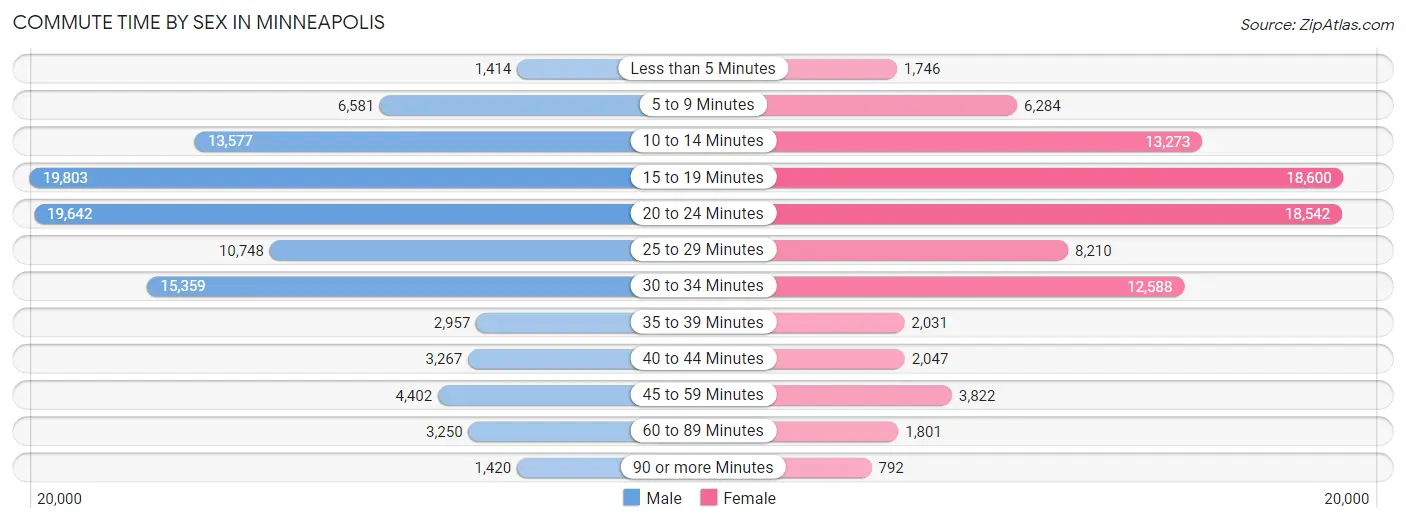
| Commute Time | Male | Female |
| Less than 5 Minutes | 1,414 (1.4%) | 1,746 (1.9%) |
| 5 to 9 Minutes | 6,581 (6.4%) | 6,284 (7.0%) |
| 10 to 14 Minutes | 13,577 (13.3%) | 13,273 (14.8%) |
| 15 to 19 Minutes | 19,803 (19.3%) | 18,600 (20.7%) |
| 20 to 24 Minutes | 19,642 (19.2%) | 18,542 (20.7%) |
| 25 to 29 Minutes | 10,748 (10.5%) | 8,210 (9.1%) |
| 30 to 34 Minutes | 15,359 (15.0%) | 12,588 (14.0%) |
| 35 to 39 Minutes | 2,957 (2.9%) | 2,031 (2.3%) |
| 40 to 44 Minutes | 3,267 (3.2%) | 2,047 (2.3%) |
| 45 to 59 Minutes | 4,402 (4.3%) | 3,822 (4.3%) |
| 60 to 89 Minutes | 3,250 (3.2%) | 1,801 (2.0%) |
| 90 or more Minutes | 1,420 (1.4%) | 792 (0.9%) |
Time of Departure to Work by Sex in Minneapolis
The most frequent times of departure to work in Minneapolis are 7:30 AM to 7:59 AM (14,147, 13.8%) for males and 7:30 AM to 7:59 AM (14,243, 15.9%) for females.
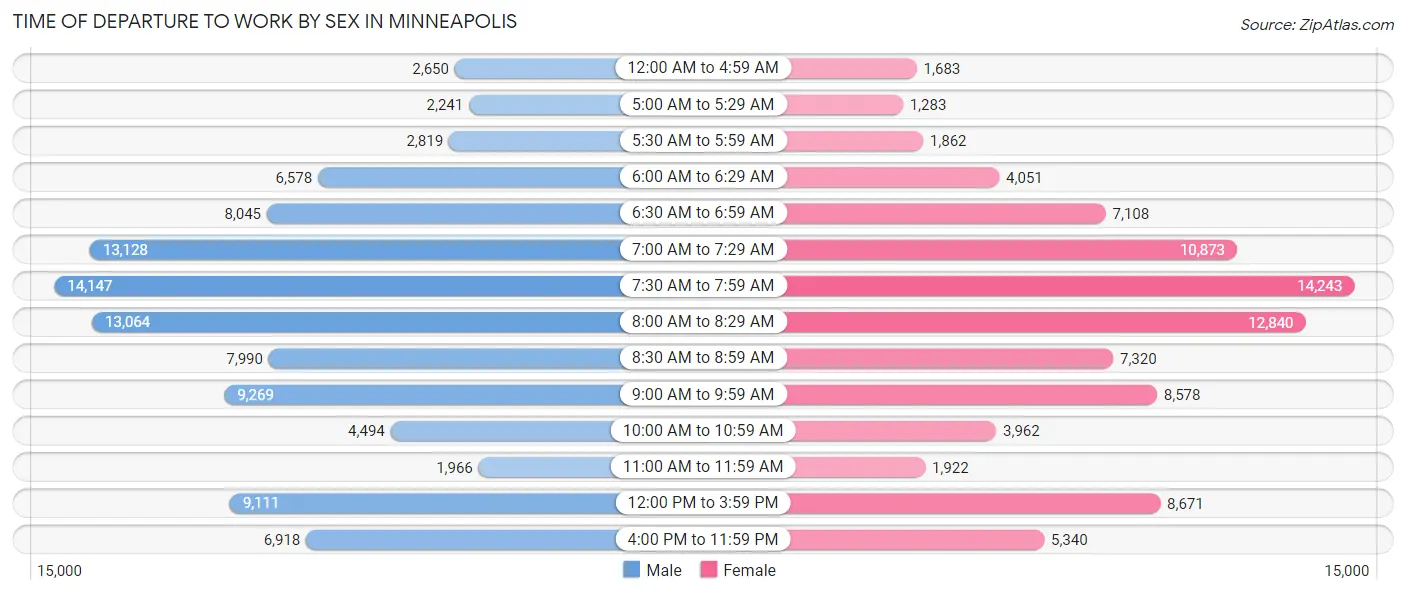
| Time of Departure | Male | Female |
| 12:00 AM to 4:59 AM | 2,650 (2.6%) | 1,683 (1.9%) |
| 5:00 AM to 5:29 AM | 2,241 (2.2%) | 1,283 (1.4%) |
| 5:30 AM to 5:59 AM | 2,819 (2.8%) | 1,862 (2.1%) |
| 6:00 AM to 6:29 AM | 6,578 (6.4%) | 4,051 (4.5%) |
| 6:30 AM to 6:59 AM | 8,045 (7.9%) | 7,108 (7.9%) |
| 7:00 AM to 7:29 AM | 13,128 (12.8%) | 10,873 (12.1%) |
| 7:30 AM to 7:59 AM | 14,147 (13.8%) | 14,243 (15.9%) |
| 8:00 AM to 8:29 AM | 13,064 (12.8%) | 12,840 (14.3%) |
| 8:30 AM to 8:59 AM | 7,990 (7.8%) | 7,320 (8.2%) |
| 9:00 AM to 9:59 AM | 9,269 (9.0%) | 8,578 (9.6%) |
| 10:00 AM to 10:59 AM | 4,494 (4.4%) | 3,962 (4.4%) |
| 11:00 AM to 11:59 AM | 1,966 (1.9%) | 1,922 (2.1%) |
| 12:00 PM to 3:59 PM | 9,111 (8.9%) | 8,671 (9.7%) |
| 4:00 PM to 11:59 PM | 6,918 (6.8%) | 5,340 (5.9%) |
| Total | 102,420 (100.0%) | 89,736 (100.0%) |
Housing Occupancy in Minneapolis
Occupancy by Ownership in Minneapolis
Of the total 185,674 dwellings in Minneapolis, owner-occupied units account for 89,348 (48.1%), while renter-occupied units make up 96,326 (51.9%).
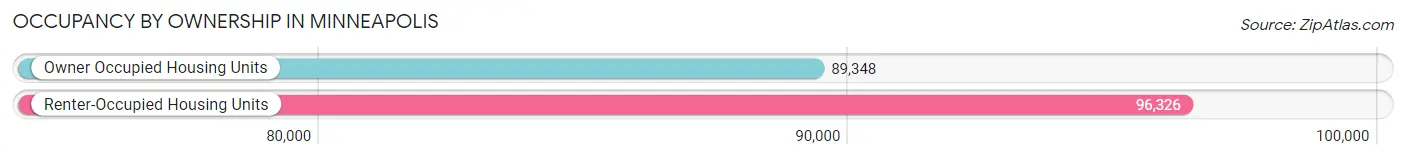
| Occupancy | # Housing Units | % Housing Units |
| Owner Occupied Housing Units | 89,348 | 48.1% |
| Renter-Occupied Housing Units | 96,326 | 51.9% |
| Total Occupied Housing Units | 185,674 | 100.0% |
Occupancy by Household Size in Minneapolis
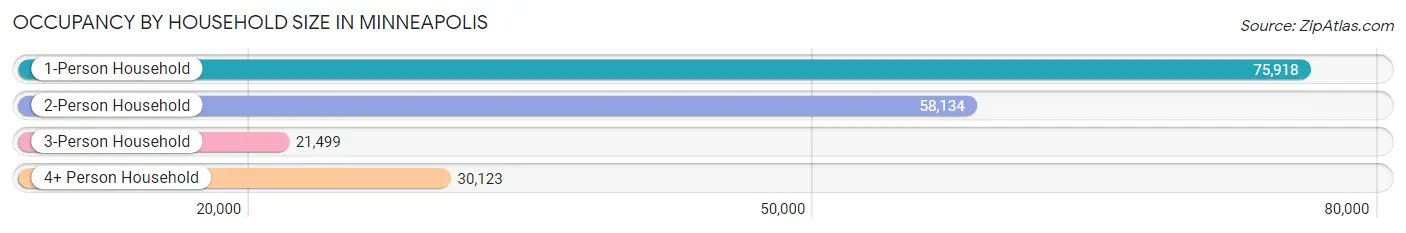
| Household Size | # Housing Units | % Housing Units |
| 1-Person Household | 75,918 | 40.9% |
| 2-Person Household | 58,134 | 31.3% |
| 3-Person Household | 21,499 | 11.6% |
| 4+ Person Household | 30,123 | 16.2% |
| Total Housing Units | 185,674 | 100.0% |
Occupancy by Ownership by Household Size in Minneapolis
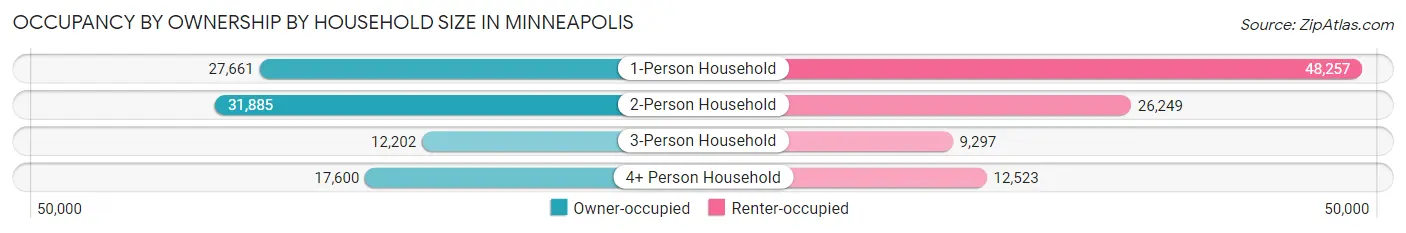
| Household Size | Owner-occupied | Renter-occupied |
| 1-Person Household | 27,661 (36.4%) | 48,257 (63.6%) |
| 2-Person Household | 31,885 (54.8%) | 26,249 (45.2%) |
| 3-Person Household | 12,202 (56.8%) | 9,297 (43.2%) |
| 4+ Person Household | 17,600 (58.4%) | 12,523 (41.6%) |
| Total Housing Units | 89,348 (48.1%) | 96,326 (51.9%) |
Occupancy by Educational Attainment in Minneapolis
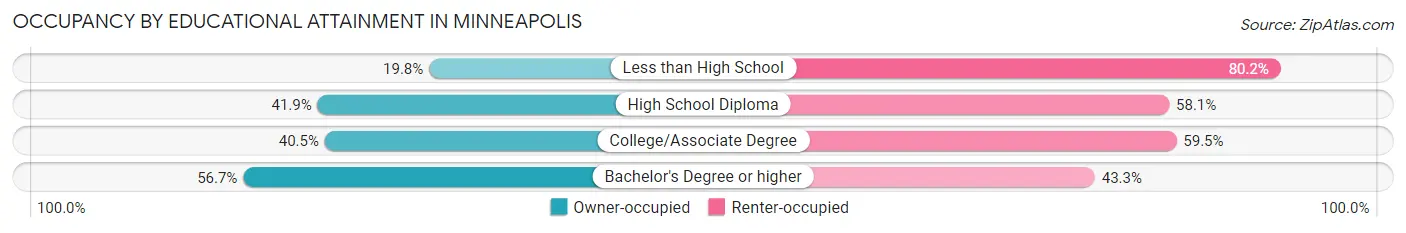
| Household Size | Owner-occupied | Renter-occupied |
| Less than High School | 2,865 (19.8%) | 11,606 (80.2%) |
| High School Diploma | 8,857 (41.9%) | 12,272 (58.1%) |
| College/Associate Degree | 18,532 (40.5%) | 27,246 (59.5%) |
| Bachelor's Degree or higher | 59,094 (56.7%) | 45,202 (43.3%) |
Occupancy by Age of Householder in Minneapolis
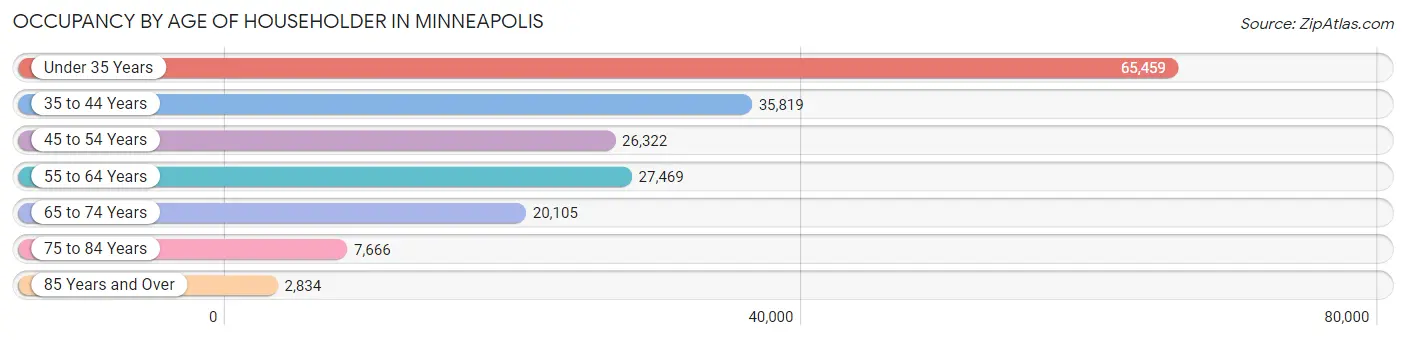
| Age Bracket | # Households | % Households |
| Under 35 Years | 65,459 | 35.2% |
| 35 to 44 Years | 35,819 | 19.3% |
| 45 to 54 Years | 26,322 | 14.2% |
| 55 to 64 Years | 27,469 | 14.8% |
| 65 to 74 Years | 20,105 | 10.8% |
| 75 to 84 Years | 7,666 | 4.1% |
| 85 Years and Over | 2,834 | 1.5% |
| Total | 185,674 | 100.0% |
Housing Finances in Minneapolis
Median Income by Occupancy in Minneapolis
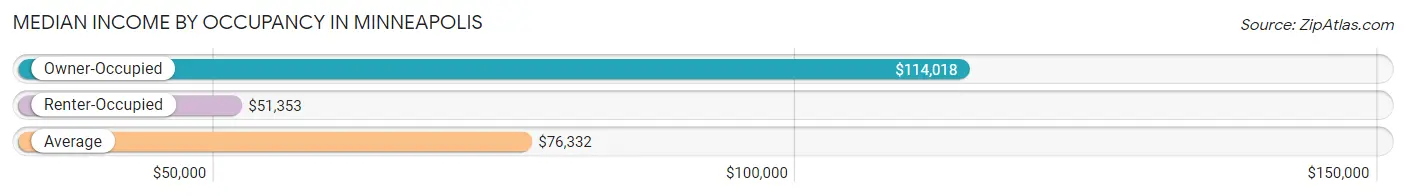
| Occupancy Type | # Households | Median Income |
| Owner-Occupied | 89,348 (48.1%) | $114,018 |
| Renter-Occupied | 96,326 (51.9%) | $51,353 |
| Average | 185,674 (100.0%) | $76,332 |
Occupancy by Householder Income Bracket in Minneapolis
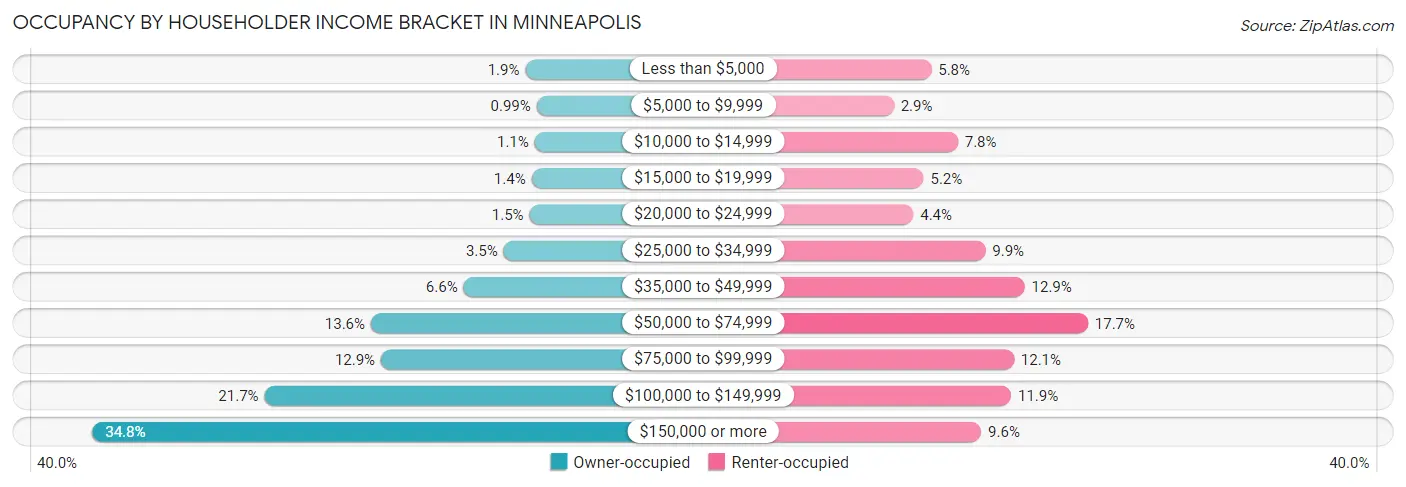
| Income Bracket | Owner-occupied | Renter-occupied |
| Less than $5,000 | 1,649 (1.8%) | 5,559 (5.8%) |
| $5,000 to $9,999 | 881 (1.0%) | 2,799 (2.9%) |
| $10,000 to $14,999 | 1,021 (1.1%) | 7,500 (7.8%) |
| $15,000 to $19,999 | 1,233 (1.4%) | 4,992 (5.2%) |
| $20,000 to $24,999 | 1,374 (1.5%) | 4,236 (4.4%) |
| $25,000 to $34,999 | 3,134 (3.5%) | 9,531 (9.9%) |
| $35,000 to $49,999 | 5,862 (6.6%) | 12,402 (12.9%) |
| $50,000 to $74,999 | 12,165 (13.6%) | 17,052 (17.7%) |
| $75,000 to $99,999 | 11,483 (12.9%) | 11,621 (12.1%) |
| $100,000 to $149,999 | 19,413 (21.7%) | 11,412 (11.8%) |
| $150,000 or more | 31,133 (34.8%) | 9,222 (9.6%) |
| Total | 89,348 (100.0%) | 96,326 (100.0%) |
Monthly Housing Cost Tiers in Minneapolis
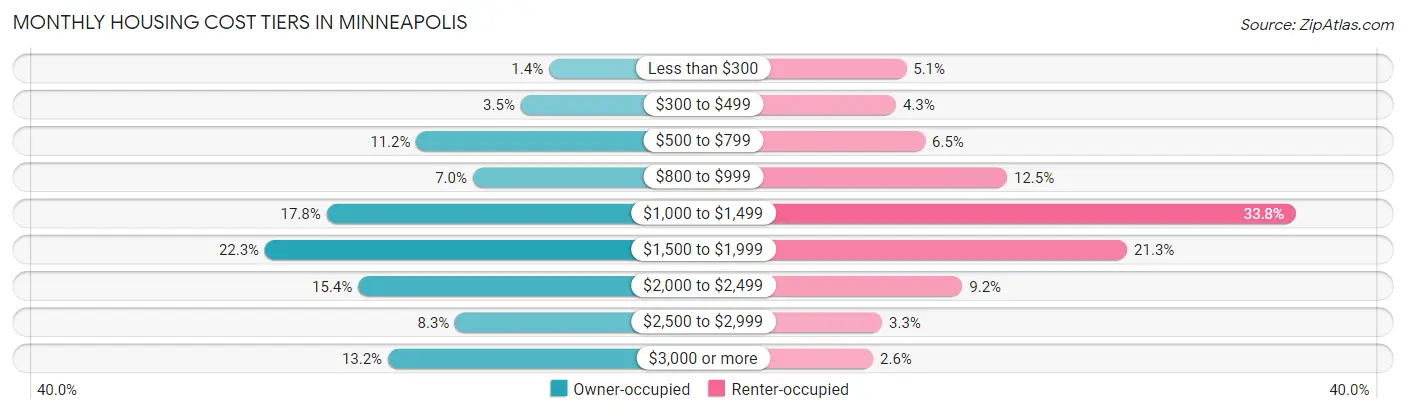
| Monthly Cost | Owner-occupied | Renter-occupied |
| Less than $300 | 1,231 (1.4%) | 4,887 (5.1%) |
| $300 to $499 | 3,095 (3.5%) | 4,148 (4.3%) |
| $500 to $799 | 9,959 (11.2%) | 6,220 (6.5%) |
| $800 to $999 | 6,246 (7.0%) | 12,033 (12.5%) |
| $1,000 to $1,499 | 15,864 (17.8%) | 32,522 (33.8%) |
| $1,500 to $1,999 | 19,923 (22.3%) | 20,552 (21.3%) |
| $2,000 to $2,499 | 13,797 (15.4%) | 8,862 (9.2%) |
| $2,500 to $2,999 | 7,405 (8.3%) | 3,166 (3.3%) |
| $3,000 or more | 11,828 (13.2%) | 2,534 (2.6%) |
| Total | 89,348 (100.0%) | 96,326 (100.0%) |
Physical Housing Characteristics in Minneapolis
Housing Structures in Minneapolis
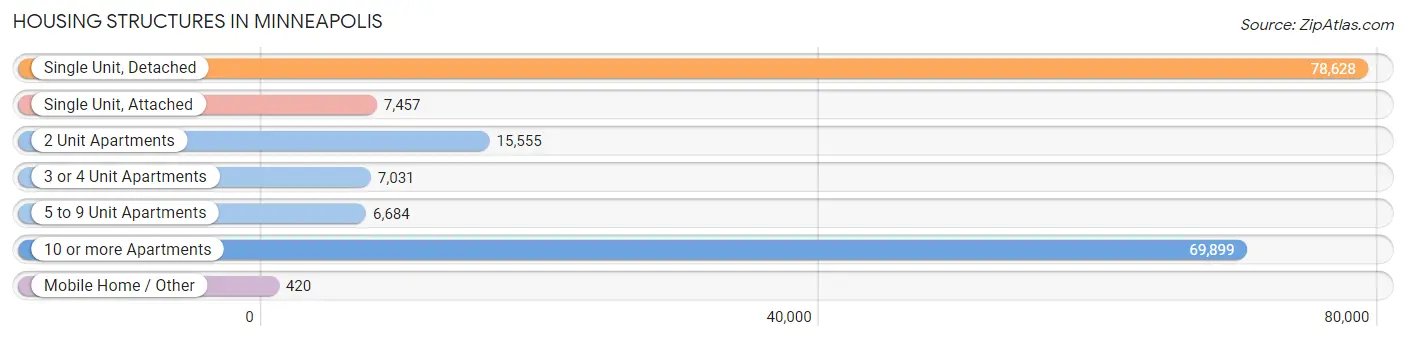
| Structure Type | # Housing Units | % Housing Units |
| Single Unit, Detached | 78,628 | 42.3% |
| Single Unit, Attached | 7,457 | 4.0% |
| 2 Unit Apartments | 15,555 | 8.4% |
| 3 or 4 Unit Apartments | 7,031 | 3.8% |
| 5 to 9 Unit Apartments | 6,684 | 3.6% |
| 10 or more Apartments | 69,899 | 37.7% |
| Mobile Home / Other | 420 | 0.2% |
| Total | 185,674 | 100.0% |
Housing Structures by Occupancy in Minneapolis
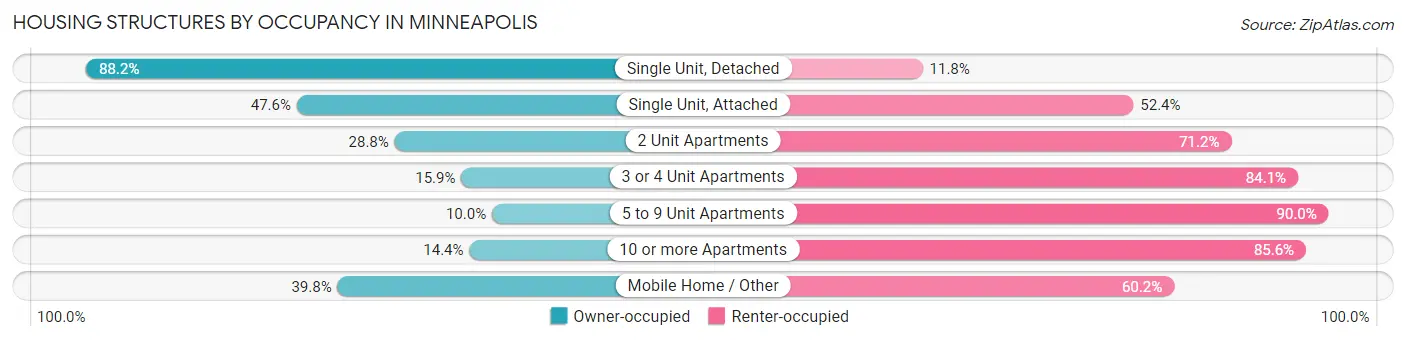
| Structure Type | Owner-occupied | Renter-occupied |
| Single Unit, Detached | 69,330 (88.2%) | 9,298 (11.8%) |
| Single Unit, Attached | 3,549 (47.6%) | 3,908 (52.4%) |
| 2 Unit Apartments | 4,473 (28.8%) | 11,082 (71.2%) |
| 3 or 4 Unit Apartments | 1,119 (15.9%) | 5,912 (84.1%) |
| 5 to 9 Unit Apartments | 669 (10.0%) | 6,015 (90.0%) |
| 10 or more Apartments | 10,041 (14.4%) | 59,858 (85.6%) |
| Mobile Home / Other | 167 (39.8%) | 253 (60.2%) |
| Total | 89,348 (48.1%) | 96,326 (51.9%) |
Housing Structures by Number of Rooms in Minneapolis
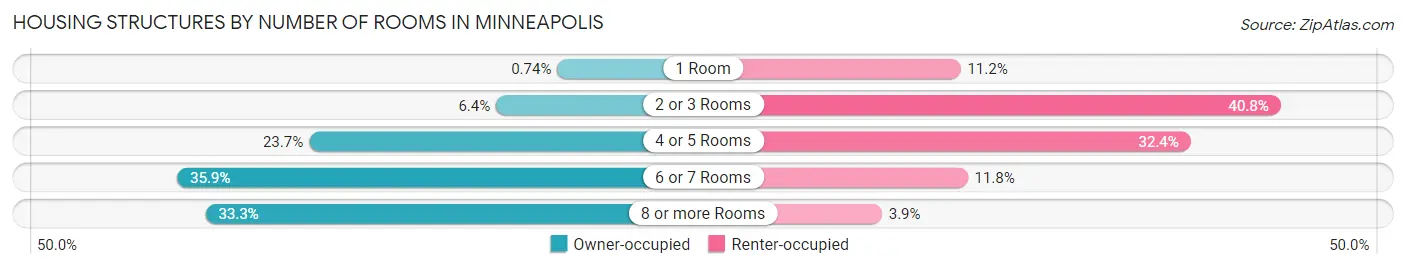
| Number of Rooms | Owner-occupied | Renter-occupied |
| 1 Room | 664 (0.7%) | 10,737 (11.2%) |
| 2 or 3 Rooms | 5,720 (6.4%) | 39,260 (40.8%) |
| 4 or 5 Rooms | 21,176 (23.7%) | 31,242 (32.4%) |
| 6 or 7 Rooms | 32,066 (35.9%) | 11,364 (11.8%) |
| 8 or more Rooms | 29,722 (33.3%) | 3,723 (3.9%) |
| Total | 89,348 (100.0%) | 96,326 (100.0%) |
Housing Structure by Heating Type in Minneapolis
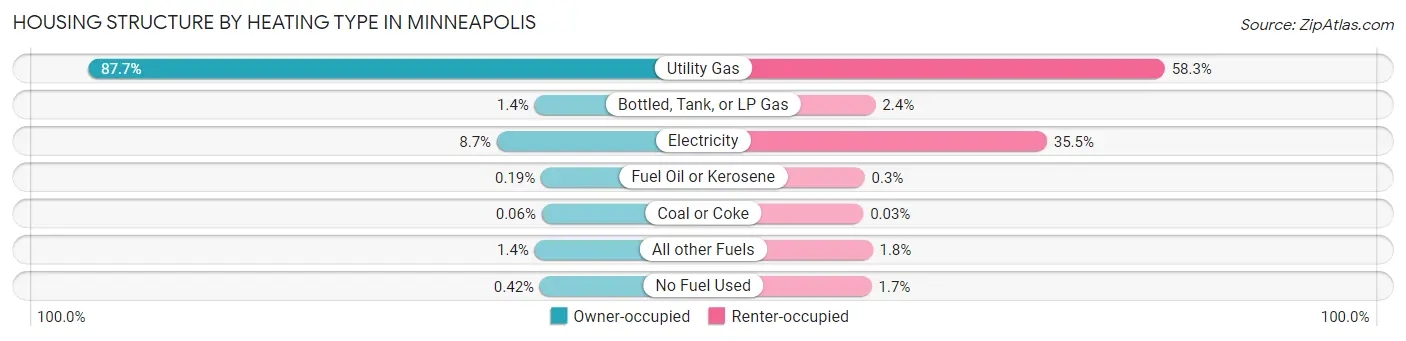
| Heating Type | Owner-occupied | Renter-occupied |
| Utility Gas | 78,386 (87.7%) | 56,152 (58.3%) |
| Bottled, Tank, or LP Gas | 1,283 (1.4%) | 2,301 (2.4%) |
| Electricity | 7,804 (8.7%) | 34,205 (35.5%) |
| Fuel Oil or Kerosene | 173 (0.2%) | 289 (0.3%) |
| Coal or Coke | 51 (0.1%) | 33 (0.0%) |
| All other Fuels | 1,275 (1.4%) | 1,759 (1.8%) |
| No Fuel Used | 376 (0.4%) | 1,587 (1.7%) |
| Total | 89,348 (100.0%) | 96,326 (100.0%) |
Household Vehicle Usage in Minneapolis
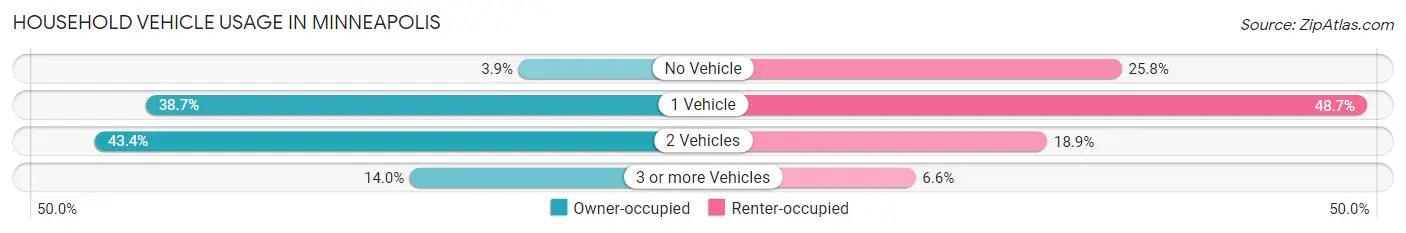
| Vehicles per Household | Owner-occupied | Renter-occupied |
| No Vehicle | 3,448 (3.9%) | 24,871 (25.8%) |
| 1 Vehicle | 34,569 (38.7%) | 46,932 (48.7%) |
| 2 Vehicles | 38,802 (43.4%) | 18,181 (18.9%) |
| 3 or more Vehicles | 12,529 (14.0%) | 6,342 (6.6%) |
| Total | 89,348 (100.0%) | 96,326 (100.0%) |
Real Estate & Mortgages in Minneapolis
Real Estate and Mortgage Overview in Minneapolis
| Characteristic | Without Mortgage | With Mortgage |
| Housing Units | 24,210 | 65,138 |
| Median Property Value | $308,300 | $334,900 |
| Median Household Income | $80,976 | $25,721 |
| Monthly Housing Costs | $771 | $11,451 |
| Real Estate Taxes | $4,015 | $942 |
Property Value by Mortgage Status in Minneapolis
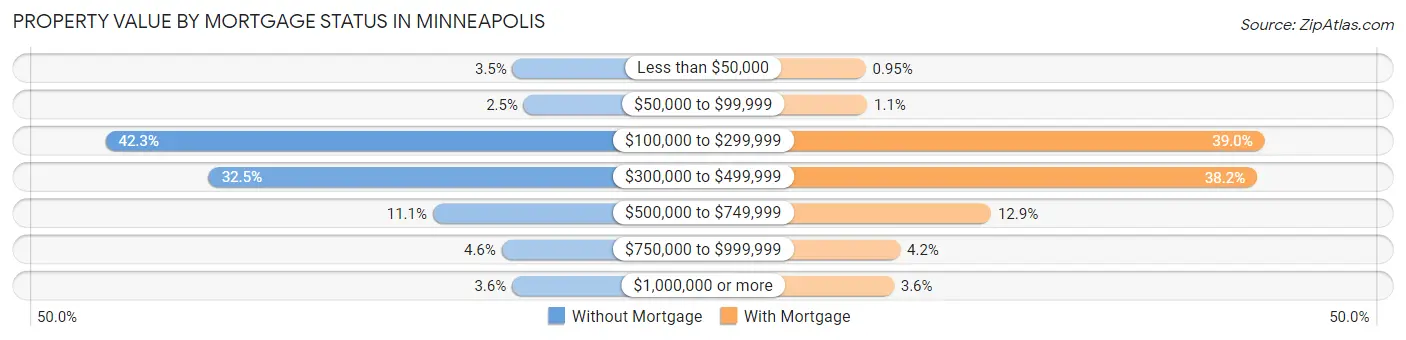
| Property Value | Without Mortgage | With Mortgage |
| Less than $50,000 | 851 (3.5%) | 616 (0.9%) |
| $50,000 to $99,999 | 595 (2.5%) | 717 (1.1%) |
| $100,000 to $299,999 | 10,239 (42.3%) | 25,370 (39.0%) |
| $300,000 to $499,999 | 7,859 (32.5%) | 24,902 (38.2%) |
| $500,000 to $749,999 | 2,692 (11.1%) | 8,402 (12.9%) |
| $750,000 to $999,999 | 1,107 (4.6%) | 2,760 (4.2%) |
| $1,000,000 or more | 867 (3.6%) | 2,371 (3.6%) |
| Total | 24,210 (100.0%) | 65,138 (100.0%) |
Household Income by Mortgage Status in Minneapolis
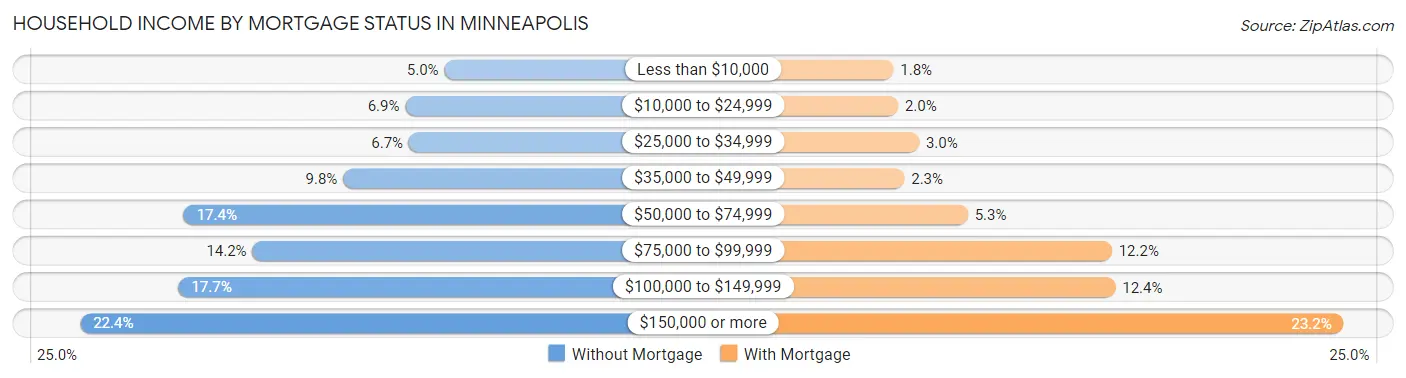
| Household Income | Without Mortgage | With Mortgage |
| Less than $10,000 | 1,213 (5.0%) | 1,173 (1.8%) |
| $10,000 to $24,999 | 1,663 (6.9%) | 1,317 (2.0%) |
| $25,000 to $34,999 | 1,621 (6.7%) | 1,965 (3.0%) |
| $35,000 to $49,999 | 2,381 (9.8%) | 1,513 (2.3%) |
| $50,000 to $74,999 | 4,217 (17.4%) | 3,481 (5.3%) |
| $75,000 to $99,999 | 3,425 (14.1%) | 7,948 (12.2%) |
| $100,000 to $149,999 | 4,278 (17.7%) | 8,058 (12.4%) |
| $150,000 or more | 5,412 (22.4%) | 15,135 (23.2%) |
| Total | 24,210 (100.0%) | 65,138 (100.0%) |
Property Value to Household Income Ratio in Minneapolis
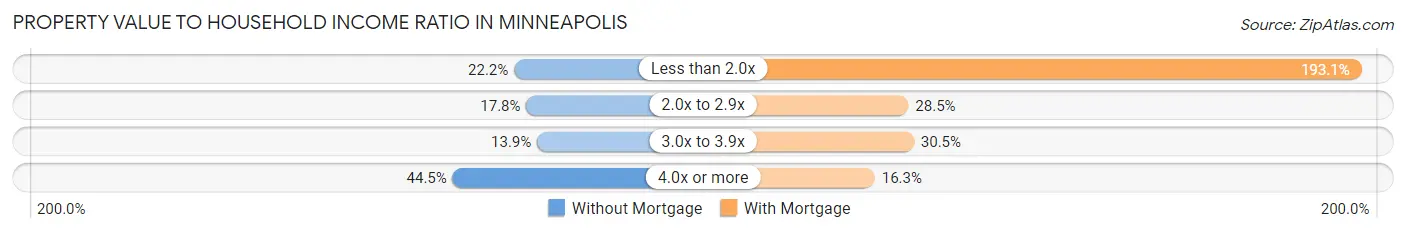
| Value-to-Income Ratio | Without Mortgage | With Mortgage |
| Less than 2.0x | 5,375 (22.2%) | 125,799 (193.1%) |
| 2.0x to 2.9x | 4,298 (17.7%) | 18,565 (28.5%) |
| 3.0x to 3.9x | 3,354 (13.9%) | 19,858 (30.5%) |
| 4.0x or more | 10,784 (44.5%) | 10,619 (16.3%) |
| Total | 24,210 (100.0%) | 65,138 (100.0%) |
Real Estate Taxes by Mortgage Status in Minneapolis

| Property Taxes | Without Mortgage | With Mortgage |
| Less than $800 | 772 (3.2%) | 510 (0.8%) |
| $800 to $1,499 | 1,346 (5.6%) | 1,322 (2.0%) |
| $800 to $1,499 | 21,219 (87.6%) | 3,949 (6.1%) |
| Total | 24,210 (100.0%) | 65,138 (100.0%) |
Health & Disability in Minneapolis
Health Insurance Coverage by Age in Minneapolis
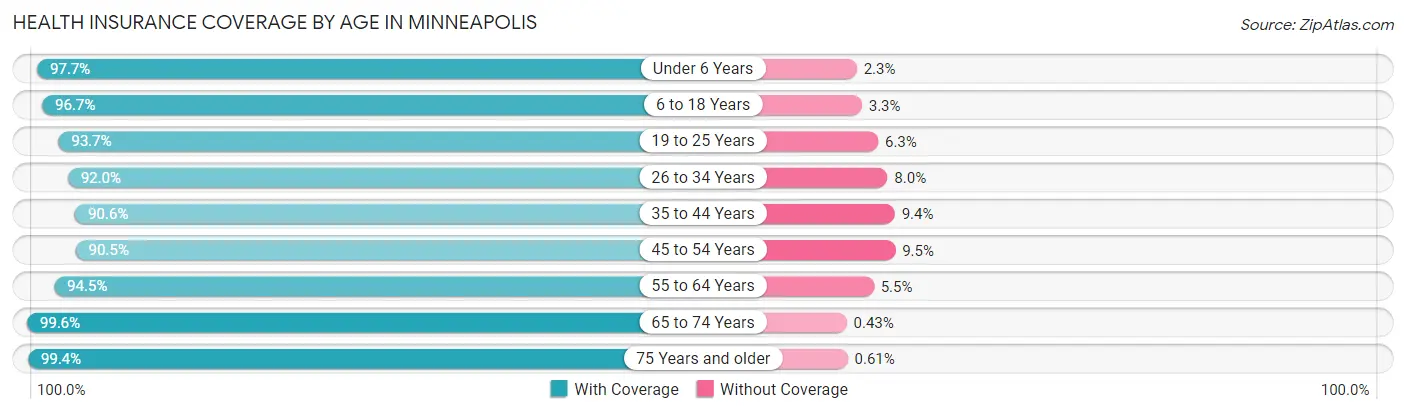
| Age Bracket | With Coverage | Without Coverage |
| Under 6 Years | 28,859 (97.7%) | 682 (2.3%) |
| 6 to 18 Years | 57,777 (96.7%) | 1,945 (3.3%) |
| 19 to 25 Years | 57,586 (93.7%) | 3,866 (6.3%) |
| 26 to 34 Years | 73,841 (92.0%) | 6,459 (8.0%) |
| 35 to 44 Years | 56,043 (90.6%) | 5,814 (9.4%) |
| 45 to 54 Years | 39,719 (90.5%) | 4,170 (9.5%) |
| 55 to 64 Years | 40,198 (94.5%) | 2,333 (5.5%) |
| 65 to 74 Years | 28,621 (99.6%) | 125 (0.4%) |
| 75 Years and older | 14,708 (99.4%) | 91 (0.6%) |
| Total | 397,352 (94.0%) | 25,485 (6.0%) |
Health Insurance Coverage by Citizenship Status in Minneapolis
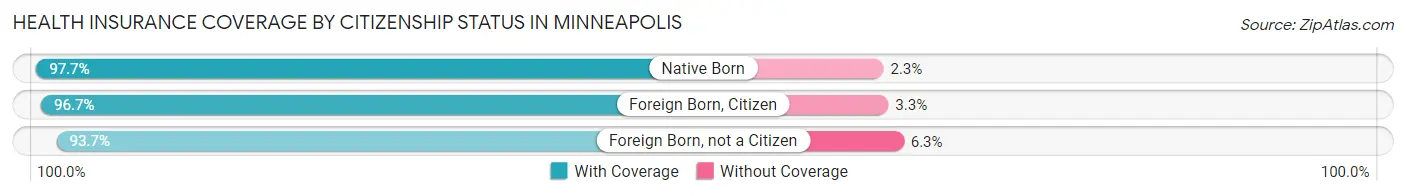
| Citizenship Status | With Coverage | Without Coverage |
| Native Born | 28,859 (97.7%) | 682 (2.3%) |
| Foreign Born, Citizen | 57,777 (96.7%) | 1,945 (3.3%) |
| Foreign Born, not a Citizen | 57,586 (93.7%) | 3,866 (6.3%) |
Health Insurance Coverage by Household Income in Minneapolis
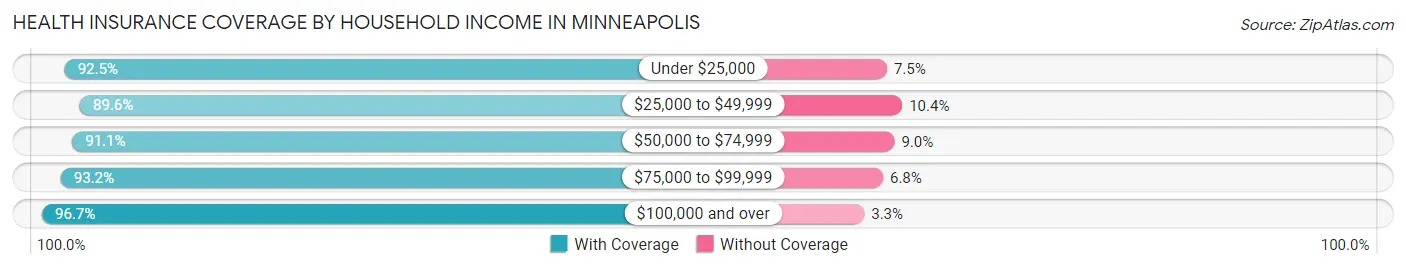
| Household Income | With Coverage | Without Coverage |
| Under $25,000 | 46,219 (92.5%) | 3,760 (7.5%) |
| $25,000 to $49,999 | 54,384 (89.6%) | 6,307 (10.4%) |
| $50,000 to $74,999 | 53,459 (91.0%) | 5,253 (8.9%) |
| $75,000 to $99,999 | 48,518 (93.2%) | 3,536 (6.8%) |
| $100,000 and over | 180,127 (96.7%) | 6,117 (3.3%) |
Public vs Private Health Insurance Coverage by Age in Minneapolis
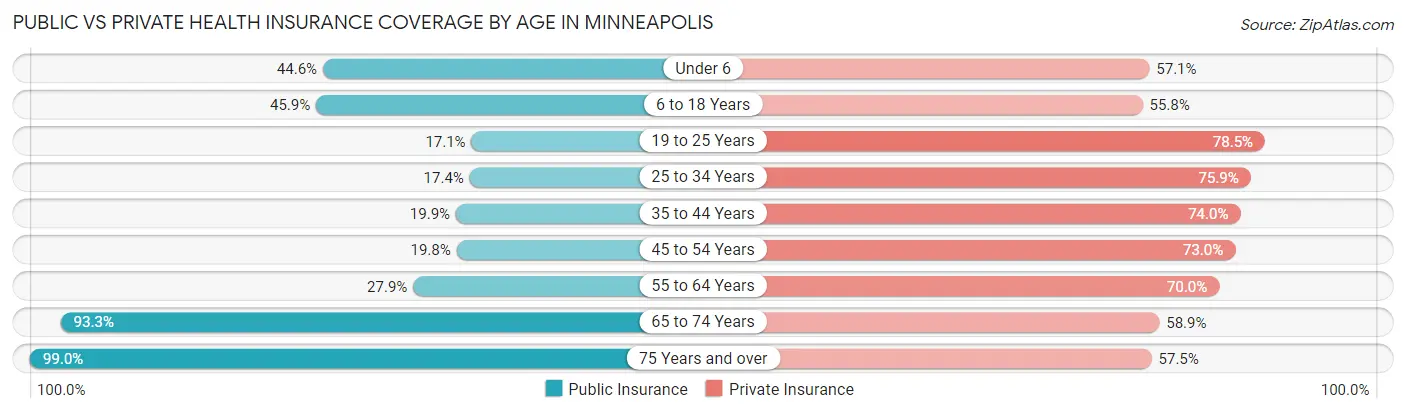
| Age Bracket | Public Insurance | Private Insurance |
| Under 6 | 13,183 (44.6%) | 16,865 (57.1%) |
| 6 to 18 Years | 27,411 (45.9%) | 33,346 (55.8%) |
| 19 to 25 Years | 10,485 (17.1%) | 48,257 (78.5%) |
| 25 to 34 Years | 13,961 (17.4%) | 60,932 (75.9%) |
| 35 to 44 Years | 12,336 (19.9%) | 45,745 (74.0%) |
| 45 to 54 Years | 8,705 (19.8%) | 32,035 (73.0%) |
| 55 to 64 Years | 11,859 (27.9%) | 29,785 (70.0%) |
| 65 to 74 Years | 26,824 (93.3%) | 16,940 (58.9%) |
| 75 Years and over | 14,653 (99.0%) | 8,511 (57.5%) |
| Total | 139,417 (33.0%) | 292,416 (69.2%) |
Disability Status by Sex by Age in Minneapolis
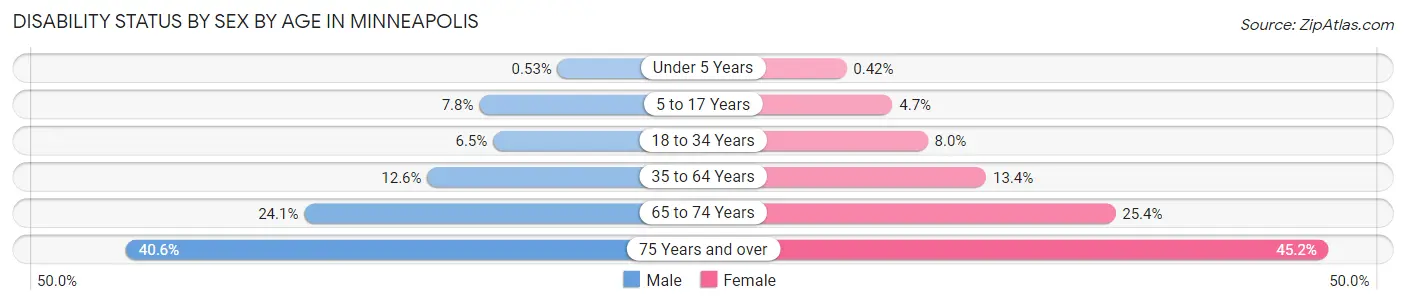
| Age Bracket | Male | Female |
| Under 5 Years | 66 (0.5%) | 52 (0.4%) |
| 5 to 17 Years | 2,238 (7.8%) | 1,313 (4.7%) |
| 18 to 34 Years | 4,976 (6.5%) | 5,816 (8.0%) |
| 35 to 64 Years | 9,925 (12.6%) | 9,324 (13.4%) |
| 65 to 74 Years | 3,363 (24.0%) | 3,746 (25.4%) |
| 75 Years and over | 2,452 (40.6%) | 3,958 (45.2%) |
Disability Class by Sex by Age in Minneapolis
Disability Class: Hearing Difficulty
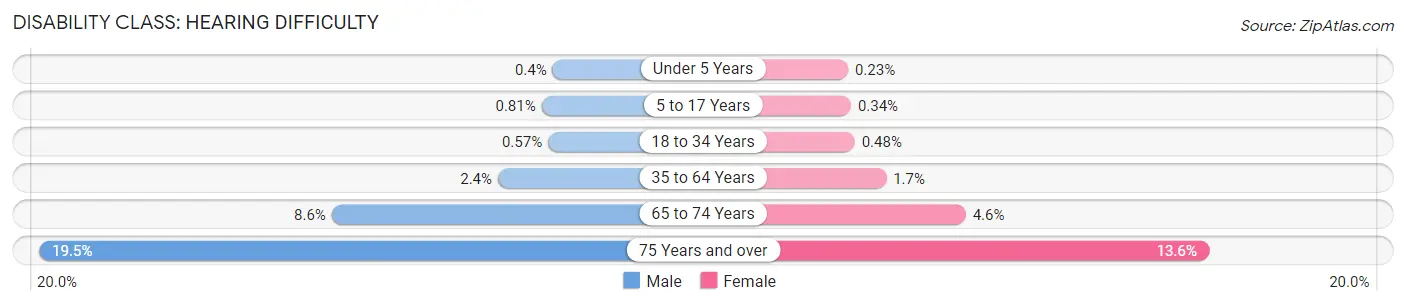
| Age Bracket | Male | Female |
| Under 5 Years | 50 (0.4%) | 29 (0.2%) |
| 5 to 17 Years | 231 (0.8%) | 96 (0.3%) |
| 18 to 34 Years | 432 (0.6%) | 354 (0.5%) |
| 35 to 64 Years | 1,908 (2.4%) | 1,152 (1.7%) |
| 65 to 74 Years | 1,203 (8.6%) | 679 (4.6%) |
| 75 Years and over | 1,175 (19.5%) | 1,193 (13.6%) |
Disability Class: Vision Difficulty
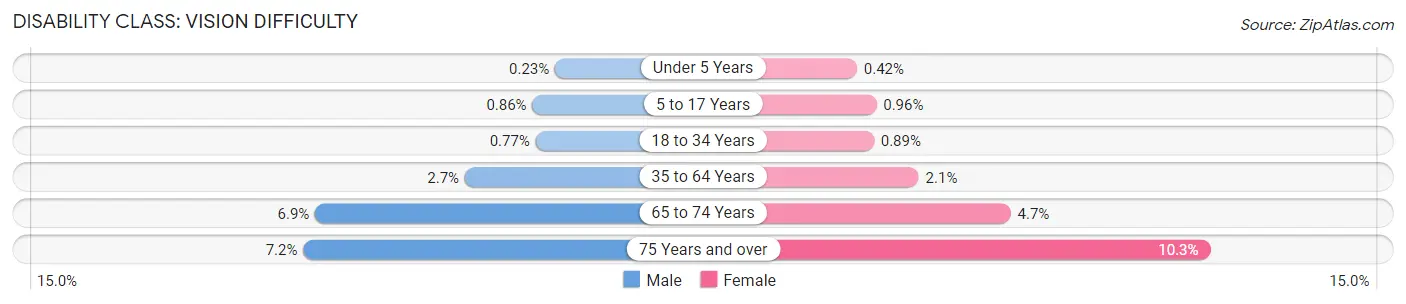
| Age Bracket | Male | Female |
| Under 5 Years | 29 (0.2%) | 52 (0.4%) |
| 5 to 17 Years | 248 (0.9%) | 268 (1.0%) |
| 18 to 34 Years | 589 (0.8%) | 648 (0.9%) |
| 35 to 64 Years | 2,158 (2.7%) | 1,487 (2.1%) |
| 65 to 74 Years | 966 (6.9%) | 694 (4.7%) |
| 75 Years and over | 437 (7.2%) | 899 (10.3%) |
Disability Class: Cognitive Difficulty
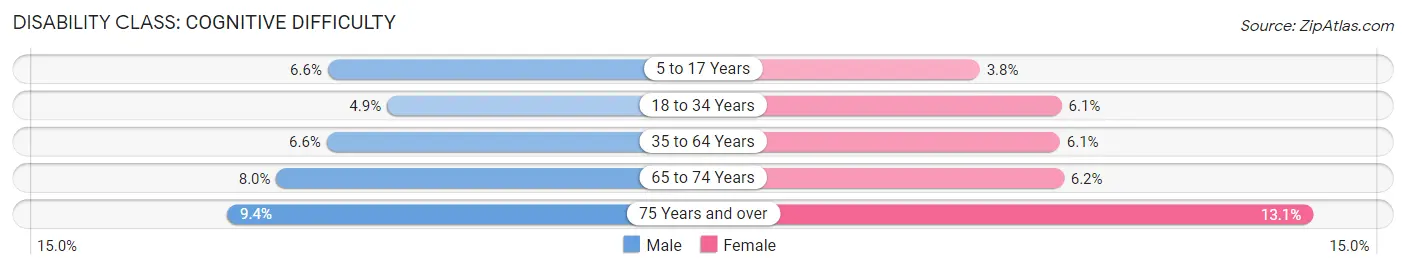
| Age Bracket | Male | Female |
| 5 to 17 Years | 1,881 (6.6%) | 1,075 (3.8%) |
| 18 to 34 Years | 3,747 (4.9%) | 4,474 (6.1%) |
| 35 to 64 Years | 5,185 (6.6%) | 4,227 (6.1%) |
| 65 to 74 Years | 1,118 (8.0%) | 913 (6.2%) |
| 75 Years and over | 565 (9.4%) | 1,149 (13.1%) |
Disability Class: Ambulatory Difficulty
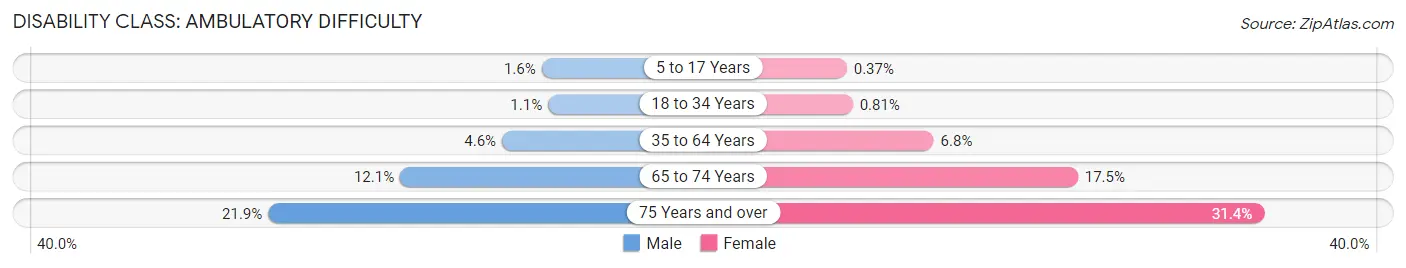
| Age Bracket | Male | Female |
| 5 to 17 Years | 465 (1.6%) | 103 (0.4%) |
| 18 to 34 Years | 873 (1.1%) | 589 (0.8%) |
| 35 to 64 Years | 3,583 (4.6%) | 4,752 (6.8%) |
| 65 to 74 Years | 1,696 (12.1%) | 2,587 (17.5%) |
| 75 Years and over | 1,324 (21.9%) | 2,746 (31.4%) |
Disability Class: Self-Care Difficulty
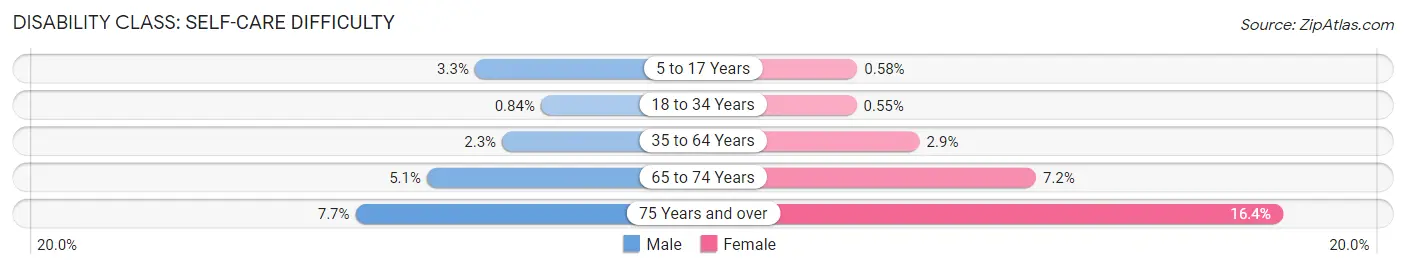
| Age Bracket | Male | Female |
| 5 to 17 Years | 943 (3.3%) | 163 (0.6%) |
| 18 to 34 Years | 641 (0.8%) | 404 (0.5%) |
| 35 to 64 Years | 1,795 (2.3%) | 2,014 (2.9%) |
| 65 to 74 Years | 709 (5.1%) | 1,064 (7.2%) |
| 75 Years and over | 466 (7.7%) | 1,433 (16.4%) |
Technology Access in Minneapolis
Computing Device Access in Minneapolis
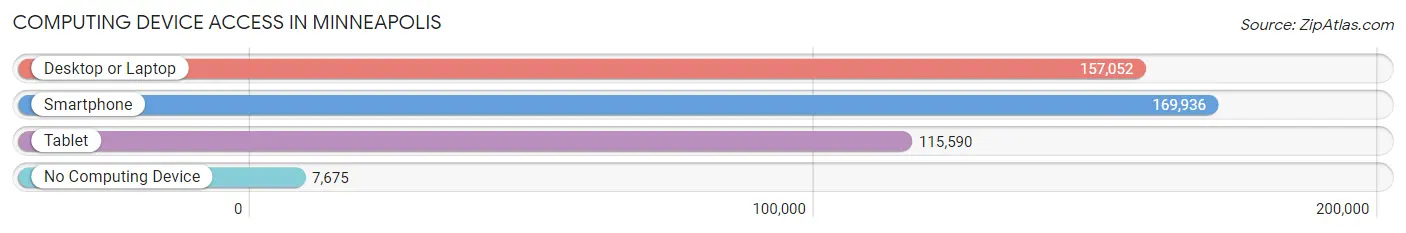
| Device Type | # Households | % Households |
| Desktop or Laptop | 157,052 | 84.6% |
| Smartphone | 169,936 | 91.5% |
| Tablet | 115,590 | 62.3% |
| No Computing Device | 7,675 | 4.1% |
| Total | 185,674 | 100.0% |
Internet Access in Minneapolis
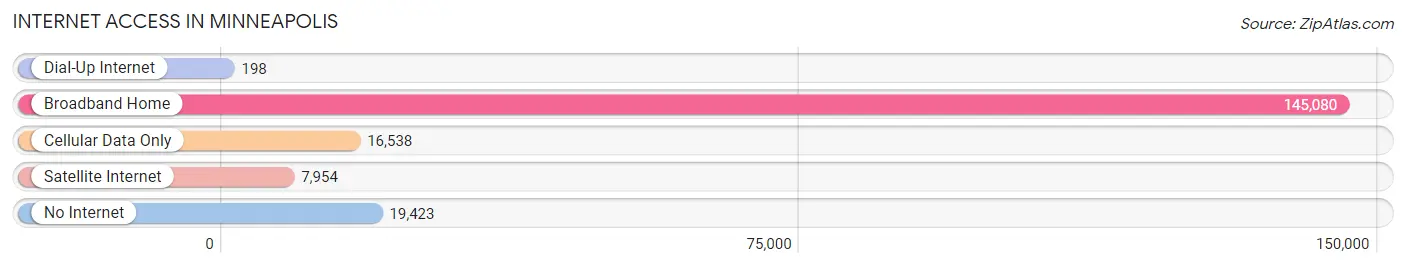
| Internet Type | # Households | % Households |
| Dial-Up Internet | 198 | 0.1% |
| Broadband Home | 145,080 | 78.1% |
| Cellular Data Only | 16,538 | 8.9% |
| Satellite Internet | 7,954 | 4.3% |
| No Internet | 19,423 | 10.5% |
| Total | 185,674 | 100.0% |
Minneapolis Summary
Minneapolis is the largest city in the state of Minnesota and the county seat of Hennepin County. It is located on the banks of the Mississippi River and is the largest city in the Twin Cities metropolitan area, which is the 16th-largest metropolitan area in the United States. Minneapolis is known for its vibrant culture, diverse economy, and its many parks and lakes.
Geography
Minneapolis is located in the center of the Twin Cities metropolitan area, which is the 16th-largest metropolitan area in the United States. The city is situated on both banks of the Mississippi River, just north of the confluence with the Minnesota River. Minneapolis is surrounded by several lakes and wetlands, the largest being Lake Calhoun and Lake Harriet. The city is also home to the Chain of Lakes, a series of interconnected lakes and wetlands covering over 2,000 acres.
The city has a total area of 58.4 square miles, of which 55.6 square miles is land and 2.8 square miles is water. The city is divided into 11 communities, each with its own distinct character and amenities.
History
The area that is now Minneapolis was first settled by the Dakota and Ojibwe Native American tribes in the early 1800s. The first European settlers arrived in the area in the mid-1800s, and the city was officially incorporated in 1867.
In the late 1800s, Minneapolis became a major industrial center, with the flour milling industry becoming the city’s largest employer. The city also became a major transportation hub, with the completion of the first rail line in 1862 and the first bridge across the Mississippi River in 1876.
In the early 1900s, Minneapolis experienced a period of rapid growth, with the population increasing from just over 200,000 in 1900 to over 500,000 by 1930. The city also became a major center for the arts, with the opening of the Minneapolis Institute of Arts in 1915 and the Guthrie Theater in 1963.
Economy
Minneapolis is a major economic center in the Midwest, with a diverse economy that includes finance, healthcare, manufacturing, and technology. The city is home to several Fortune 500 companies, including Target, U.S. Bancorp, and Xcel Energy.
The city’s largest employer is the University of Minnesota, which employs over 30,000 people. Other major employers include Allina Health, Hennepin County Medical Center, and the Minneapolis Public Schools.
The city’s economy is also supported by a thriving tourism industry, with over 16 million visitors each year. Major attractions include the Minneapolis Institute of Arts, the Walker Art Center, and the Minneapolis Sculpture Garden.
Demographics
As of the 2019 American Community Survey, the population of Minneapolis was estimated to be 429,606. The city is racially and ethnically diverse, with the largest racial/ethnic groups being White (63.2%), Black or African American (19.2%), Asian (7.7%), and Hispanic or Latino (7.2%).
The median household income in Minneapolis is $63,945, and the median home value is $269,400. The city has a poverty rate of 22.2%, and the unemployment rate is 3.7%.
Conclusion
Minneapolis is a vibrant city with a rich history, diverse economy, and diverse population. The city is home to several Fortune 500 companies, a thriving tourism industry, and a variety of cultural attractions. Minneapolis is also home to the University of Minnesota, which is the city’s largest employer. The city’s economy is supported by a diverse range of industries, and the city has a median household income of $63,945 and a median home value of $269,400.
Common Questions
What is Per Capita Income in Minneapolis?
Per Capita income in Minneapolis is $48,373.
What is the Median Family Income in Minneapolis?
Median Family Income in Minneapolis is $109,514.
What is the Median Household income in Minneapolis?
Median Household Income in Minneapolis is $76,332.
What is Income or Wage Gap in Minneapolis?
Income or Wage Gap in Minneapolis is 14.4%.
Women in Minneapolis earn 85.6 cents for every dollar earned by a man.
What is Family Income Deficit in Minneapolis?
Family Income Deficit in Minneapolis is $11,124.
Families that are below poverty line in Minneapolis earn $11,124 less on average than the poverty threshold level.
What is Inequality or Gini Index in Minneapolis?
Inequality or Gini Index in Minneapolis is 0.49.
What is the Total Population of Minneapolis?
Total Population of Minneapolis is 426,877.
What is the Total Male Population of Minneapolis?
Total Male Population of Minneapolis is 218,662.
What is the Total Female Population of Minneapolis?
Total Female Population of Minneapolis is 208,215.
What is the Ratio of Males per 100 Females in Minneapolis?
There are 105.02 Males per 100 Females in Minneapolis.
What is the Ratio of Females per 100 Males in Minneapolis?
There are 95.22 Females per 100 Males in Minneapolis.
What is the Median Population Age in Minneapolis?
Median Population Age in Minneapolis is 32.8 Years.
What is the Average Family Size in Minneapolis
Average Family Size in Minneapolis is 3.1 People.
What is the Average Household Size in Minneapolis
Average Household Size in Minneapolis is 2.2 People.
How Large is the Labor Force in Minneapolis?
There are 259,586 People in the Labor Forcein in Minneapolis.
What is the Percentage of People in the Labor Force in Minneapolis?
73.5% of People are in the Labor Force in Minneapolis.
What is the Unemployment Rate in Minneapolis?
Unemployment Rate in Minneapolis is 5.8%.