Tampa, FL Map & Demographics
Tampa Map
Tampa Overview
$45,586
PER CAPITA INCOME
$84,185
AVG FAMILY INCOME
$66,802
AVG HOUSEHOLD INCOME
25.1%
WAGE / INCOME GAP [ % ]
74.9¢/ $1
WAGE / INCOME GAP [ $ ]
$12,091
FAMILY INCOME DEFICIT
0.54
INEQUALITY / GINI INDEX
388,768
TOTAL POPULATION
193,981
MALE POPULATION
194,787
FEMALE POPULATION
99.59
MALES / 100 FEMALES
100.42
FEMALES / 100 MALES
35.5
MEDIAN AGE
3.1
AVG FAMILY SIZE
2.4
AVG HOUSEHOLD SIZE
208,879
LABOR FORCE [ PEOPLE ]
66.0%
PERCENT IN LABOR FORCE
5.2%
UNEMPLOYMENT RATE
Tampa Zip Codes
Income in Tampa
Income Overview in Tampa
Per Capita Income in Tampa is $45,586, while median incomes of families and households are $84,185 and $66,802 respectively.
| Characteristic | Number | Measure |
| Per Capita Income | 388,768 | $45,586 |
| Median Family Income | 85,226 | $84,185 |
| Mean Family Income | 85,226 | $137,140 |
| Median Household Income | 157,066 | $66,802 |
| Mean Household Income | 157,066 | $109,168 |
| Income Deficit | 85,226 | $12,091 |
| Wage / Income Gap (%) | 388,768 | 25.10% |
| Wage / Income Gap ($) | 388,768 | 74.90¢ per $1 |
| Gini / Inequality Index | 388,768 | 0.54 |
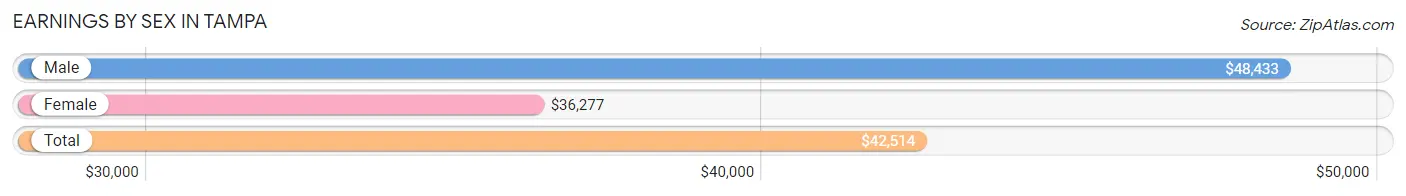
Earnings by Sex in Tampa
Average Earnings in Tampa are $42,514, $48,433 for men and $36,277 for women, a difference of 25.1%.
| Sex | Number | Average Earnings |
| Male | 113,277 (52.3%) | $48,433 |
| Female | 103,260 (47.7%) | $36,277 |
| Total | 216,537 (100.0%) | $42,514 |
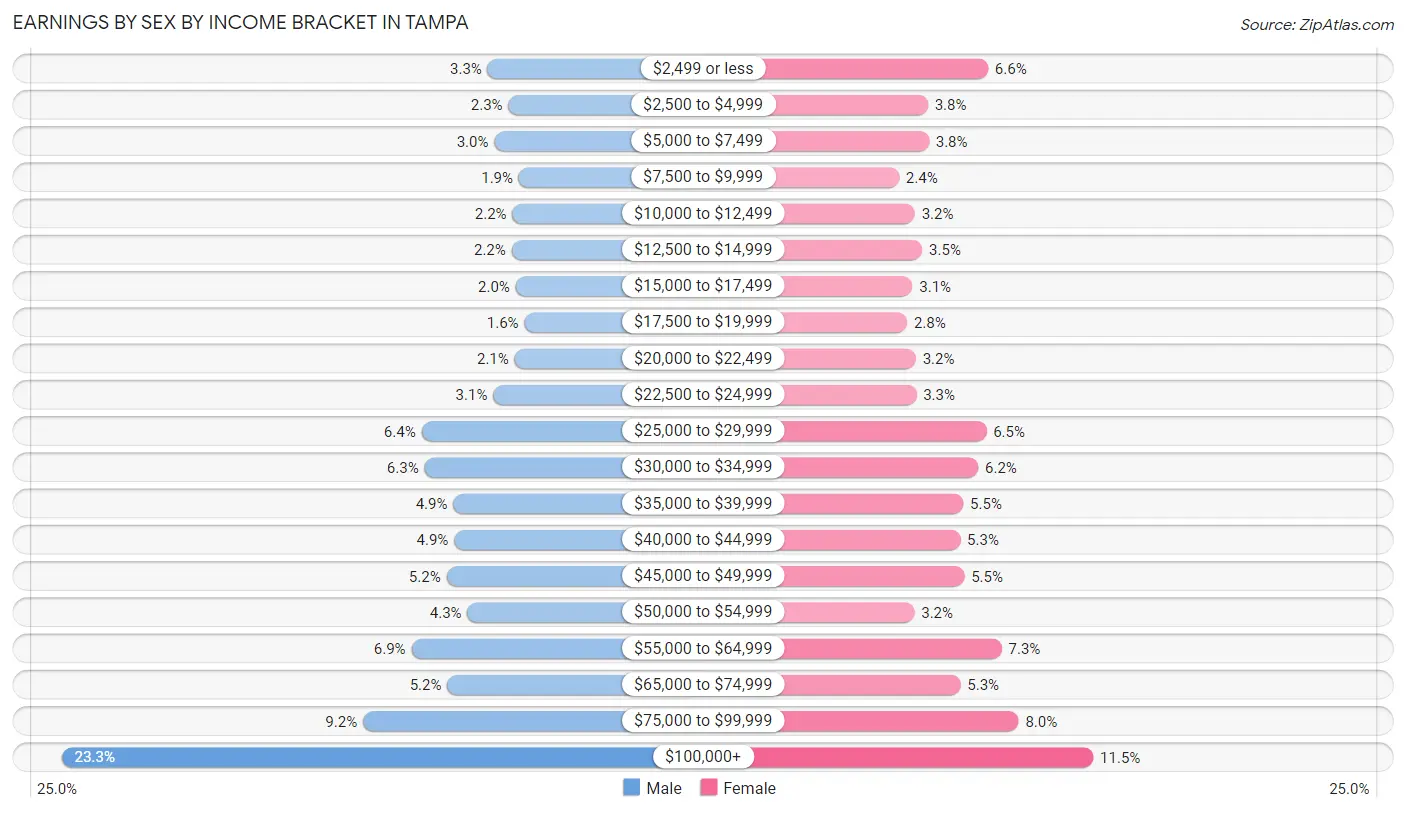
Earnings by Sex by Income Bracket in Tampa
The most common earnings brackets in Tampa are $100,000+ for men (26,363 | 23.3%) and $100,000+ for women (11,912 | 11.5%).
| Income | Male | Female |
| $2,499 or less | 3,745 (3.3%) | 6,821 (6.6%) |
| $2,500 to $4,999 | 2,653 (2.3%) | 3,909 (3.8%) |
| $5,000 to $7,499 | 3,401 (3.0%) | 3,969 (3.8%) |
| $7,500 to $9,999 | 2,099 (1.8%) | 2,516 (2.4%) |
| $10,000 to $12,499 | 2,430 (2.1%) | 3,284 (3.2%) |
| $12,500 to $14,999 | 2,484 (2.2%) | 3,642 (3.5%) |
| $15,000 to $17,499 | 2,270 (2.0%) | 3,169 (3.1%) |
| $17,500 to $19,999 | 1,801 (1.6%) | 2,907 (2.8%) |
| $20,000 to $22,499 | 2,323 (2.1%) | 3,338 (3.2%) |
| $22,500 to $24,999 | 3,452 (3.0%) | 3,356 (3.3%) |
| $25,000 to $29,999 | 7,259 (6.4%) | 6,748 (6.5%) |
| $30,000 to $34,999 | 7,097 (6.3%) | 6,347 (6.1%) |
| $35,000 to $39,999 | 5,576 (4.9%) | 5,630 (5.4%) |
| $40,000 to $44,999 | 5,527 (4.9%) | 5,484 (5.3%) |
| $45,000 to $49,999 | 5,935 (5.2%) | 5,675 (5.5%) |
| $50,000 to $54,999 | 4,821 (4.3%) | 3,268 (3.2%) |
| $55,000 to $64,999 | 7,794 (6.9%) | 7,489 (7.2%) |
| $65,000 to $74,999 | 5,886 (5.2%) | 5,491 (5.3%) |
| $75,000 to $99,999 | 10,361 (9.1%) | 8,305 (8.0%) |
| $100,000+ | 26,363 (23.3%) | 11,912 (11.5%) |
| Total | 113,277 (100.0%) | 103,260 (100.0%) |
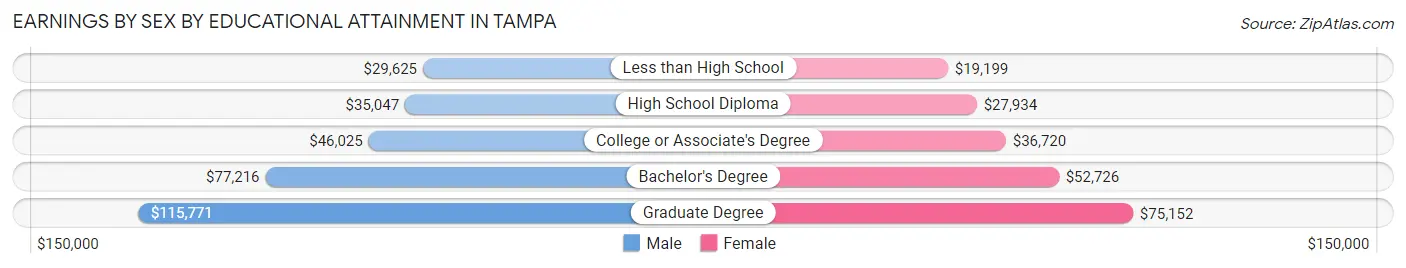
Earnings by Sex by Educational Attainment in Tampa
Average earnings in Tampa are $54,613 for men and $42,796 for women, a difference of 21.6%. Men with an educational attainment of graduate degree enjoy the highest average annual earnings of $115,771, while those with less than high school education earn the least with $29,625. Women with an educational attainment of graduate degree earn the most with the average annual earnings of $75,152, while those with less than high school education have the smallest earnings of $19,199.
| Educational Attainment | Male Income | Female Income |
| Less than High School | $29,625 | $19,199 |
| High School Diploma | $35,047 | $27,934 |
| College or Associate's Degree | $46,025 | $36,720 |
| Bachelor's Degree | $77,216 | $52,726 |
| Graduate Degree | $115,771 | $75,152 |
| Total | $54,613 | $42,796 |
Family Income in Tampa
Family Income Brackets in Tampa
According to the Tampa family income data, there are 16,022 families falling into the $200,000+ income range, which is the most common income bracket and makes up 18.8% of all families. Conversely, the $10,000 to $14,999 income bracket is the least frequent group with only 1,960 families (2.3%) belonging to this category.
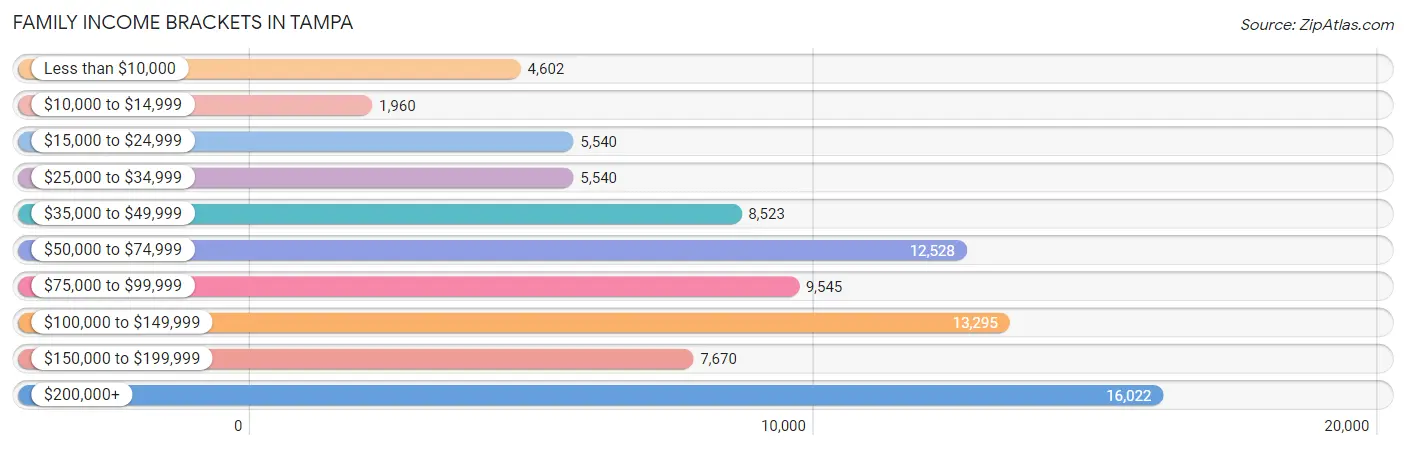
| Income Bracket | # Families | % Families |
| Less than $10,000 | 4,602 | 5.4% |
| $10,000 to $14,999 | 1,960 | 2.3% |
| $15,000 to $24,999 | 5,540 | 6.5% |
| $25,000 to $34,999 | 5,540 | 6.5% |
| $35,000 to $49,999 | 8,523 | 10.0% |
| $50,000 to $74,999 | 12,528 | 14.7% |
| $75,000 to $99,999 | 9,545 | 11.2% |
| $100,000 to $149,999 | 13,295 | 15.6% |
| $150,000 to $199,999 | 7,670 | 9.0% |
| $200,000+ | 16,022 | 18.8% |
Family Income by Famaliy Size in Tampa
5-person families (5,834 | 6.9%) account for the highest median family income in Tampa with $100,265 per family, while 2-person families (40,060 | 47.0%) have the highest median income of $37,876 per family member.
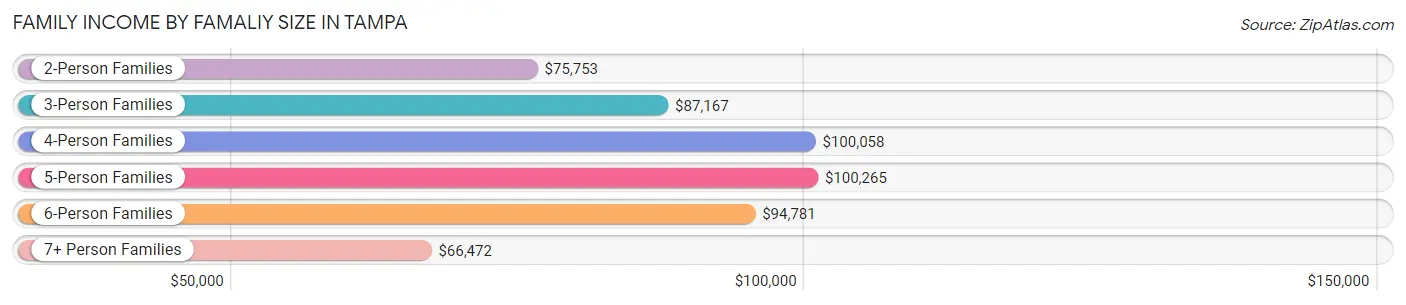
| Income Bracket | # Families | Median Income |
| 2-Person Families | 40,060 (47.0%) | $75,753 |
| 3-Person Families | 21,340 (25.0%) | $87,167 |
| 4-Person Families | 15,524 (18.2%) | $100,058 |
| 5-Person Families | 5,834 (6.9%) | $100,265 |
| 6-Person Families | 1,729 (2.0%) | $94,781 |
| 7+ Person Families | 739 (0.9%) | $66,472 |
| Total | 85,226 (100.0%) | $84,185 |
Family Income by Number of Earners in Tampa
The median family income in Tampa is $84,185, with families comprising 3+ earners (6,597) having the highest median family income of $134,821, while families with no earners (11,591) have the lowest median family income of $29,934, accounting for 7.7% and 13.6% of families, respectively.
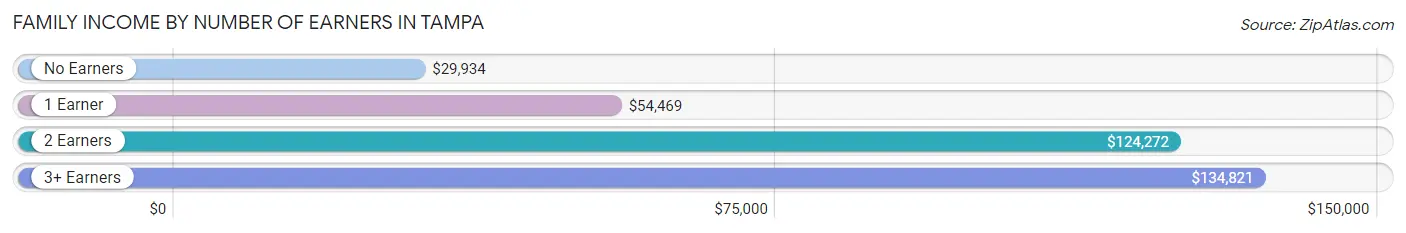
| Number of Earners | # Families | Median Income |
| No Earners | 11,591 (13.6%) | $29,934 |
| 1 Earner | 30,714 (36.0%) | $54,469 |
| 2 Earners | 36,324 (42.6%) | $124,272 |
| 3+ Earners | 6,597 (7.7%) | $134,821 |
| Total | 85,226 (100.0%) | $84,185 |
Household Income in Tampa
Household Income Brackets in Tampa
With 24,188 households falling in the category, the $50,000 to $74,999 income range is the most frequent in Tampa, accounting for 15.4% of all households. In contrast, only 6,911 households (4.4%) fall into the $10,000 to $14,999 income bracket, making it the least populous group.
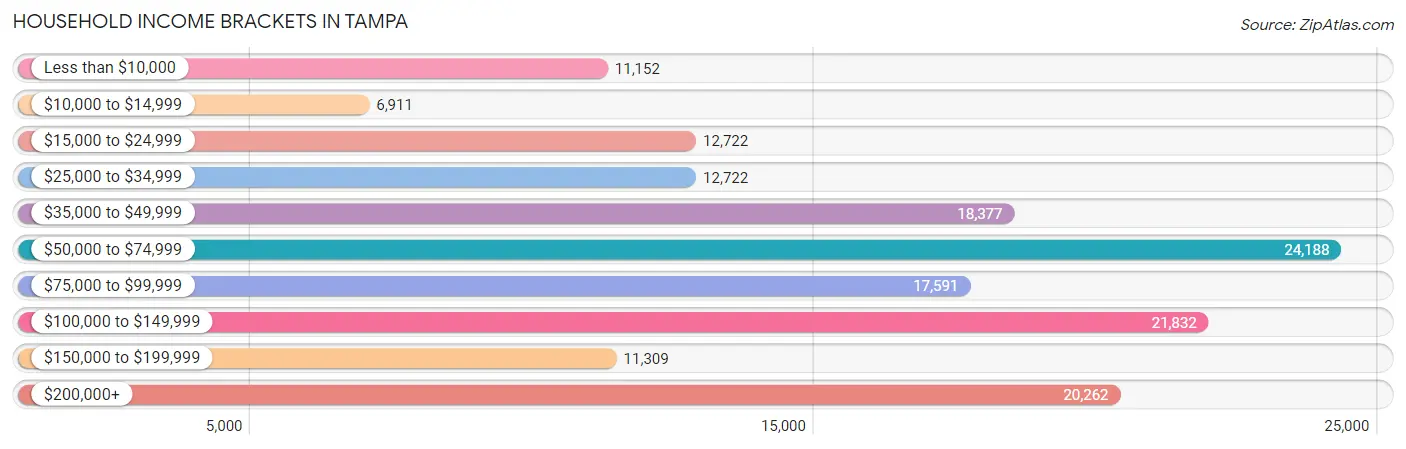
| Income Bracket | # Households | % Households |
| Less than $10,000 | 11,152 | 7.1% |
| $10,000 to $14,999 | 6,911 | 4.4% |
| $15,000 to $24,999 | 12,722 | 8.1% |
| $25,000 to $34,999 | 12,722 | 8.1% |
| $35,000 to $49,999 | 18,377 | 11.7% |
| $50,000 to $74,999 | 24,188 | 15.4% |
| $75,000 to $99,999 | 17,591 | 11.2% |
| $100,000 to $149,999 | 21,832 | 13.9% |
| $150,000 to $199,999 | 11,309 | 7.2% |
| $200,000+ | 20,262 | 12.9% |
Household Income by Householder Age in Tampa
The median household income in Tampa is $66,802, with the highest median household income of $82,485 found in the 45 to 64 years age bracket for the primary householder. A total of 53,597 households (34.1%) fall into this category. Meanwhile, the 15 to 24 years age bracket for the primary householder has the lowest median household income of $37,750, with 7,737 households (4.9%) in this group.
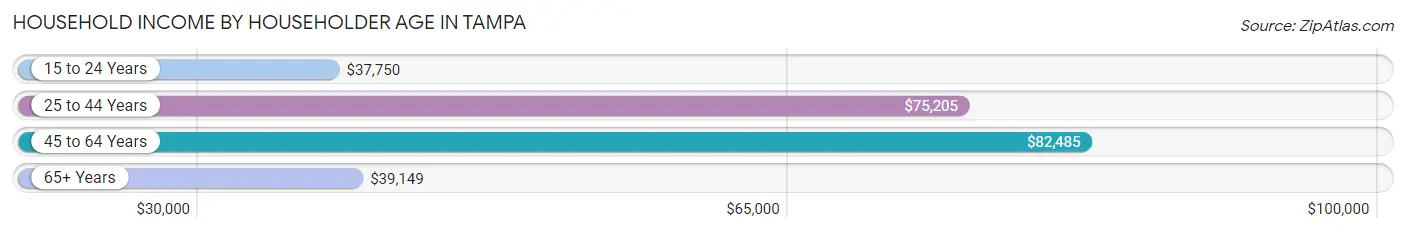
| Income Bracket | # Households | Median Income |
| 15 to 24 Years | 7,737 (4.9%) | $37,750 |
| 25 to 44 Years | 64,742 (41.2%) | $75,205 |
| 45 to 64 Years | 53,597 (34.1%) | $82,485 |
| 65+ Years | 30,990 (19.7%) | $39,149 |
| Total | 157,066 (100.0%) | $66,802 |
Poverty in Tampa
Income Below Poverty by Sex and Age in Tampa
With 15.3% poverty level for males and 18.4% for females among the residents of Tampa, 6 to 11 year old males and 18 to 24 year old females are the most vulnerable to poverty, with 3,566 males (24.9%) and 4,386 females (27.9%) in their respective age groups living below the poverty level.
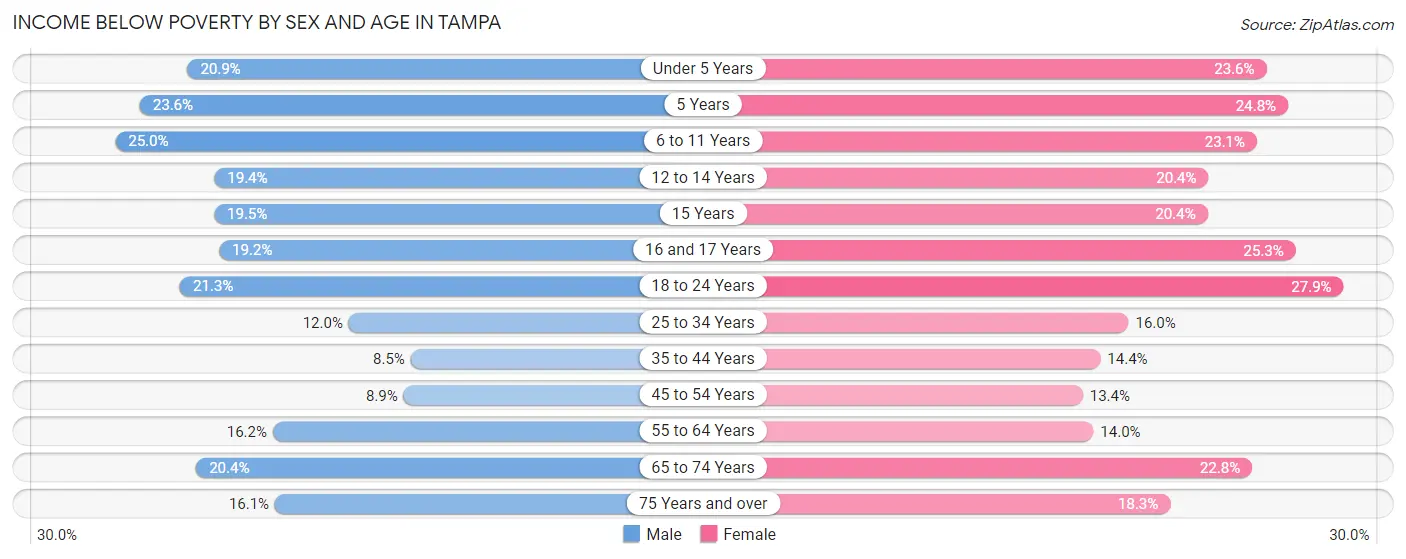
| Age Bracket | Male | Female |
| Under 5 Years | 2,316 (20.9%) | 2,724 (23.6%) |
| 5 Years | 428 (23.6%) | 568 (24.8%) |
| 6 to 11 Years | 3,566 (24.9%) | 2,901 (23.1%) |
| 12 to 14 Years | 1,363 (19.4%) | 1,210 (20.4%) |
| 15 Years | 424 (19.5%) | 513 (20.4%) |
| 16 and 17 Years | 855 (19.2%) | 967 (25.3%) |
| 18 to 24 Years | 3,381 (21.3%) | 4,386 (27.9%) |
| 25 to 34 Years | 4,064 (11.9%) | 5,269 (16.0%) |
| 35 to 44 Years | 2,265 (8.5%) | 3,863 (14.4%) |
| 45 to 54 Years | 2,233 (8.9%) | 3,173 (13.4%) |
| 55 to 64 Years | 3,712 (16.2%) | 2,979 (14.0%) |
| 65 to 74 Years | 2,743 (20.4%) | 3,458 (22.8%) |
| 75 Years and over | 1,401 (16.1%) | 2,211 (18.3%) |
| Total | 28,751 (15.3%) | 34,222 (18.4%) |
Income Above Poverty by Sex and Age in Tampa
According to the poverty statistics in Tampa, males aged 35 to 44 years and females aged 45 to 54 years are the age groups that are most secure financially, with 91.5% of males and 86.6% of females in these age groups living above the poverty line.
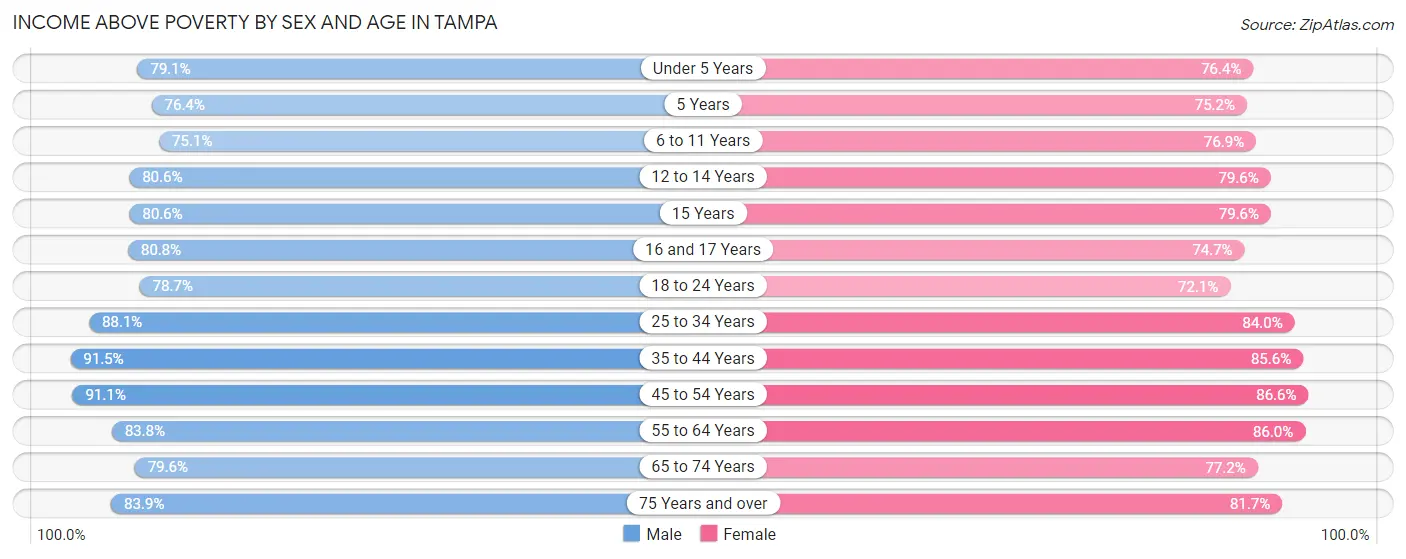
| Age Bracket | Male | Female |
| Under 5 Years | 8,752 (79.1%) | 8,797 (76.4%) |
| 5 Years | 1,387 (76.4%) | 1,719 (75.2%) |
| 6 to 11 Years | 10,725 (75.0%) | 9,652 (76.9%) |
| 12 to 14 Years | 5,653 (80.6%) | 4,718 (79.6%) |
| 15 Years | 1,756 (80.5%) | 2,007 (79.6%) |
| 16 and 17 Years | 3,605 (80.8%) | 2,860 (74.7%) |
| 18 to 24 Years | 12,463 (78.7%) | 11,317 (72.1%) |
| 25 to 34 Years | 29,938 (88.0%) | 27,731 (84.0%) |
| 35 to 44 Years | 24,391 (91.5%) | 22,963 (85.6%) |
| 45 to 54 Years | 22,849 (91.1%) | 20,466 (86.6%) |
| 55 to 64 Years | 19,232 (83.8%) | 18,288 (86.0%) |
| 65 to 74 Years | 10,676 (79.6%) | 11,681 (77.2%) |
| 75 Years and over | 7,324 (83.9%) | 9,885 (81.7%) |
| Total | 158,751 (84.7%) | 152,084 (81.6%) |
Income Below Poverty Among Married-Couple Families in Tampa
The poverty statistics for married-couple families in Tampa show that 5.8% or 3,235 of the total 55,479 families live below the poverty line. Families with 5 or more children have the highest poverty rate of 19.5%, comprising of 36 families. On the other hand, families with no children have the lowest poverty rate of 5.2%, which includes 1,646 families.
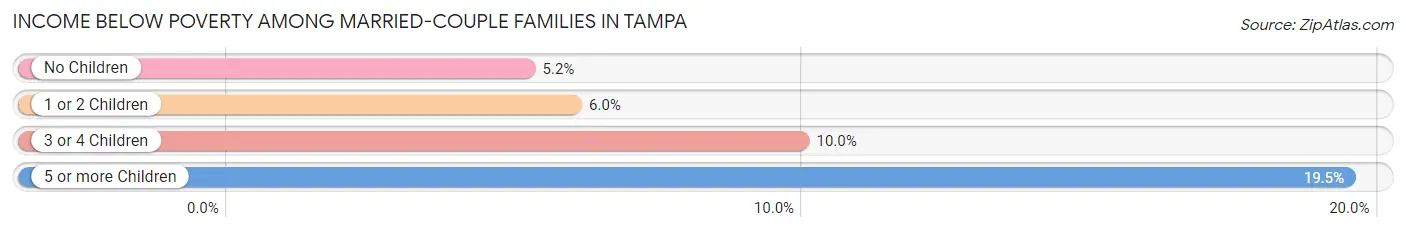
| Children | Above Poverty | Below Poverty |
| No Children | 30,154 (94.8%) | 1,646 (5.2%) |
| 1 or 2 Children | 18,620 (94.0%) | 1,186 (6.0%) |
| 3 or 4 Children | 3,321 (90.0%) | 367 (10.0%) |
| 5 or more Children | 149 (80.5%) | 36 (19.5%) |
| Total | 52,244 (94.2%) | 3,235 (5.8%) |
Income Below Poverty Among Single-Parent Households in Tampa
According to the poverty data in Tampa, 15.8% or 1,345 single-father households and 29.3% or 6,228 single-mother households are living below the poverty line. Among single-father households, those with 5 or more children have the highest poverty rate, with 12 households (100.0%) experiencing poverty. Likewise, among single-mother households, those with 5 or more children have the highest poverty rate, with 152 households (65.5%) falling below the poverty line.
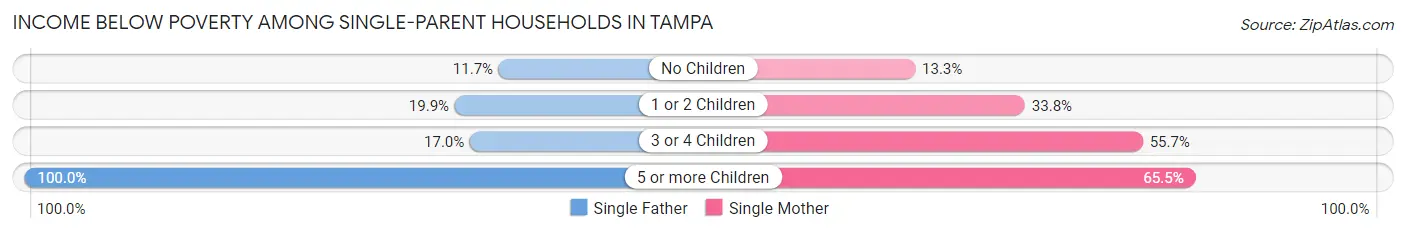
| Children | Single Father | Single Mother |
| No Children | 488 (11.7%) | 1,028 (13.3%) |
| 1 or 2 Children | 765 (19.9%) | 3,601 (33.8%) |
| 3 or 4 Children | 80 (17.0%) | 1,447 (55.7%) |
| 5 or more Children | 12 (100.0%) | 152 (65.5%) |
| Total | 1,345 (15.8%) | 6,228 (29.3%) |
Income Below Poverty Among Married-Couple vs Single-Parent Households in Tampa
The poverty data for Tampa shows that 3,235 of the married-couple family households (5.8%) and 7,573 of the single-parent households (25.5%) are living below the poverty level. Within the married-couple family households, those with 5 or more children have the highest poverty rate, with 36 households (19.5%) falling below the poverty line. Among the single-parent households, those with 5 or more children have the highest poverty rate, with 164 household (67.2%) living below poverty.
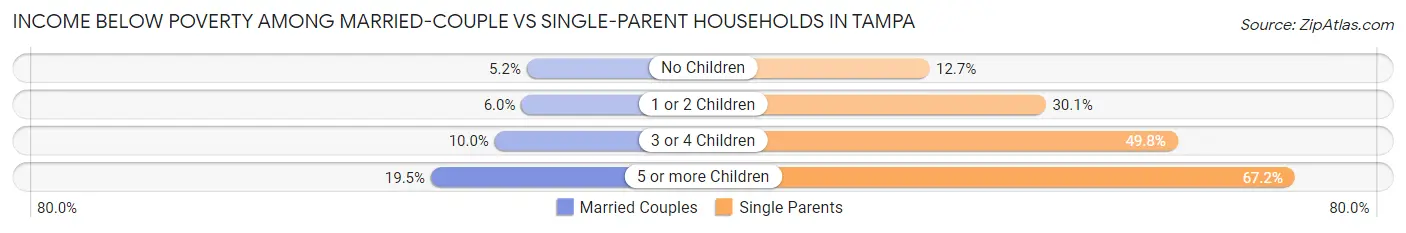
| Children | Married-Couple Families | Single-Parent Households |
| No Children | 1,646 (5.2%) | 1,516 (12.7%) |
| 1 or 2 Children | 1,186 (6.0%) | 4,366 (30.1%) |
| 3 or 4 Children | 367 (10.0%) | 1,527 (49.8%) |
| 5 or more Children | 36 (19.5%) | 164 (67.2%) |
| Total | 3,235 (5.8%) | 7,573 (25.5%) |
Race in Tampa
The most populous races in Tampa are White / Caucasian (213,542 | 54.9%), Hispanic or Latino (103,646 | 26.7%), and Black / African American (84,660 | 21.8%).
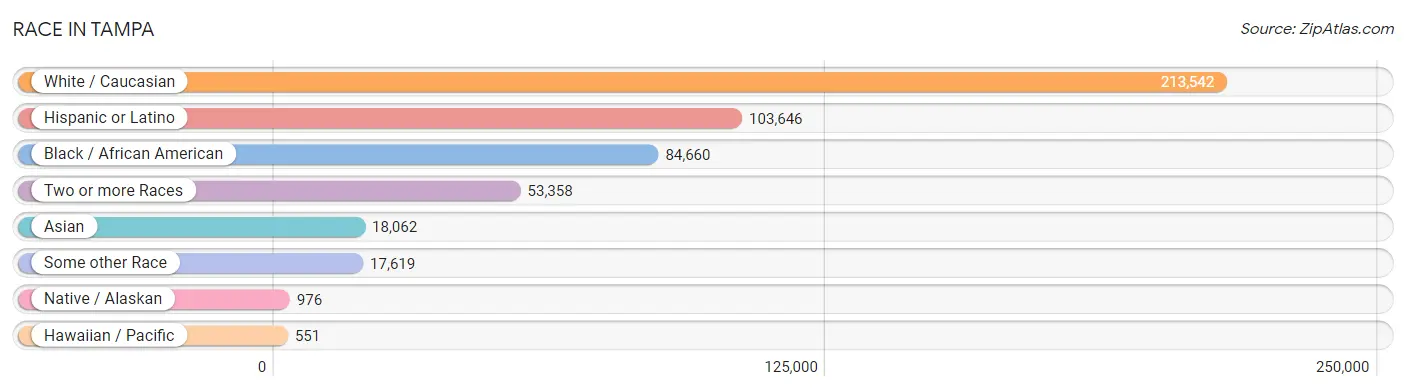
| Race | # Population | % Population |
| Asian | 18,062 | 4.6% |
| Black / African American | 84,660 | 21.8% |
| Hawaiian / Pacific | 551 | 0.1% |
| Hispanic or Latino | 103,646 | 26.7% |
| Native / Alaskan | 976 | 0.3% |
| White / Caucasian | 213,542 | 54.9% |
| Two or more Races | 53,358 | 13.7% |
| Some other Race | 17,619 | 4.5% |
| Total | 388,768 | 100.0% |
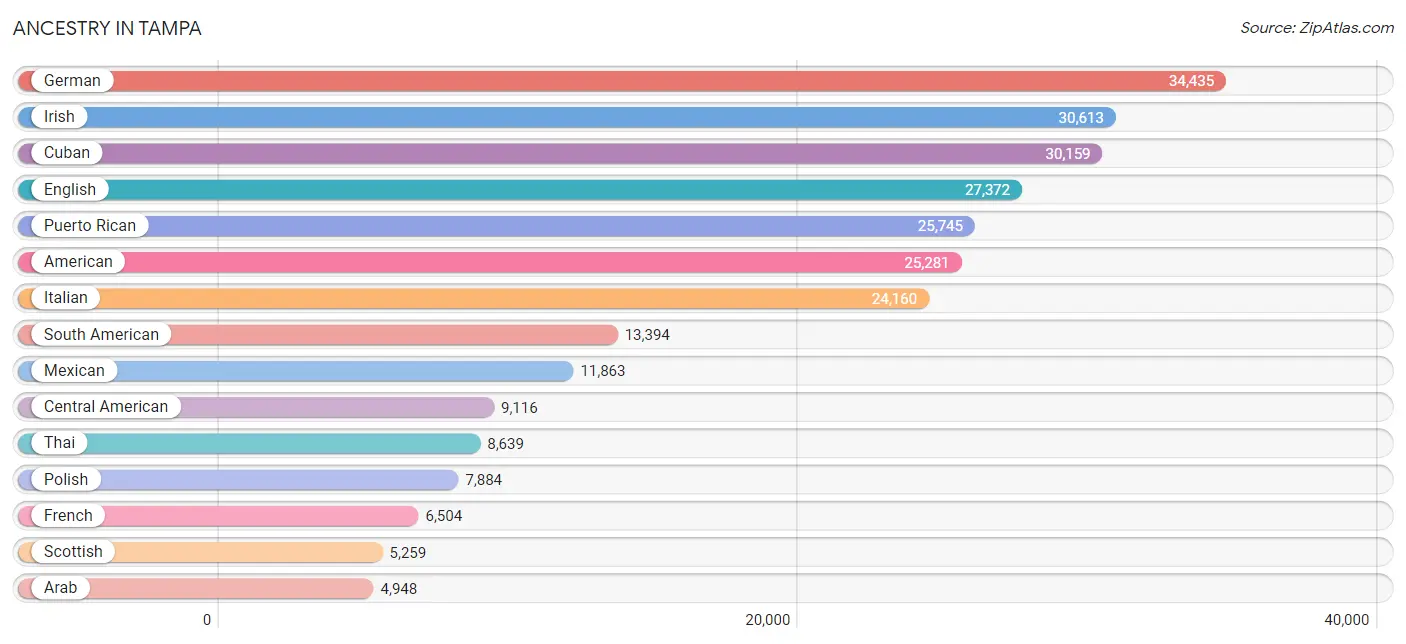
Ancestry in Tampa
The most populous ancestries reported in Tampa are German (34,435 | 8.9%), Irish (30,613 | 7.9%), Cuban (30,159 | 7.8%), English (27,372 | 7.0%), and Puerto Rican (25,745 | 6.6%), together accounting for 38.2% of all Tampa residents.
| Ancestry | # Population | % Population |
| Afghan | 73 | 0.0% |
| African | 2,240 | 0.6% |
| Albanian | 389 | 0.1% |
| American | 25,281 | 6.5% |
| Apache | 19 | 0.0% |
| Arab | 4,948 | 1.3% |
| Argentinean | 1,023 | 0.3% |
| Armenian | 206 | 0.1% |
| Assyrian / Chaldean / Syriac | 81 | 0.0% |
| Australian | 159 | 0.0% |
| Austrian | 688 | 0.2% |
| Bahamian | 675 | 0.2% |
| Bangladeshi | 22 | 0.0% |
| Barbadian | 2 | 0.0% |
| Basque | 55 | 0.0% |
| Belgian | 200 | 0.1% |
| Belizean | 48 | 0.0% |
| Bermudan | 9 | 0.0% |
| Bhutanese | 767 | 0.2% |
| Blackfeet | 115 | 0.0% |
| Bolivian | 366 | 0.1% |
| Brazilian | 892 | 0.2% |
| British | 2,756 | 0.7% |
| British West Indian | 838 | 0.2% |
| Bulgarian | 460 | 0.1% |
| Burmese | 1,389 | 0.4% |
| Cajun | 29 | 0.0% |
| Cambodian | 9 | 0.0% |
| Canadian | 847 | 0.2% |
| Cape Verdean | 7 | 0.0% |
| Carpatho Rusyn | 8 | 0.0% |
| Celtic | 43 | 0.0% |
| Central American | 9,116 | 2.3% |
| Central American Indian | 557 | 0.1% |
| Cherokee | 953 | 0.3% |
| Chickasaw | 7 | 0.0% |
| Chilean | 219 | 0.1% |
| Chippewa | 137 | 0.0% |
| Choctaw | 97 | 0.0% |
| Colombian | 4,767 | 1.2% |
| Costa Rican | 455 | 0.1% |
| Creek | 46 | 0.0% |
| Croatian | 372 | 0.1% |
| Cuban | 30,159 | 7.8% |
| Cypriot | 58 | 0.0% |
| Czech | 1,033 | 0.3% |
| Czechoslovakian | 64 | 0.0% |
| Danish | 566 | 0.2% |
| Delaware | 14 | 0.0% |
| Dominican | 4,891 | 1.3% |
| Dutch | 2,774 | 0.7% |
| Dutch West Indian | 38 | 0.0% |
| Eastern European | 1,023 | 0.3% |
| Ecuadorian | 1,473 | 0.4% |
| Egyptian | 647 | 0.2% |
| English | 27,372 | 7.0% |
| Estonian | 22 | 0.0% |
| Ethiopian | 320 | 0.1% |
| European | 4,777 | 1.2% |
| Fijian | 7 | 0.0% |
| Filipino | 143 | 0.0% |
| Finnish | 300 | 0.1% |
| French | 6,504 | 1.7% |
| French American Indian | 15 | 0.0% |
| French Canadian | 1,259 | 0.3% |
| German | 34,435 | 8.9% |
| German Russian | 32 | 0.0% |
| Ghanaian | 12 | 0.0% |
| Greek | 1,889 | 0.5% |
| Guamanian / Chamorro | 130 | 0.0% |
| Guatemalan | 1,642 | 0.4% |
| Guyanese | 256 | 0.1% |
| Haitian | 4,196 | 1.1% |
| Honduran | 3,570 | 0.9% |
| Hungarian | 1,362 | 0.4% |
| Icelander | 98 | 0.0% |
| Indian (Asian) | 3,405 | 0.9% |
| Indonesian | 51 | 0.0% |
| Iranian | 634 | 0.2% |
| Iraqi | 247 | 0.1% |
| Irish | 30,613 | 7.9% |
| Iroquois | 97 | 0.0% |
| Israeli | 362 | 0.1% |
| Italian | 24,160 | 6.2% |
| Jamaican | 3,850 | 1.0% |
| Japanese | 36 | 0.0% |
| Jordanian | 342 | 0.1% |
| Kenyan | 67 | 0.0% |
| Korean | 3,621 | 0.9% |
| Laotian | 38 | 0.0% |
| Latvian | 22 | 0.0% |
| Lebanese | 957 | 0.3% |
| Liberian | 18 | 0.0% |
| Lithuanian | 543 | 0.1% |
| Luxembourger | 37 | 0.0% |
| Macedonian | 80 | 0.0% |
| Malaysian | 95 | 0.0% |
| Maltese | 52 | 0.0% |
| Mexican | 11,863 | 3.0% |
| Mexican American Indian | 425 | 0.1% |
| Mongolian | 12 | 0.0% |
| Moroccan | 644 | 0.2% |
| Native Hawaiian | 385 | 0.1% |
| Navajo | 13 | 0.0% |
| New Zealander | 24 | 0.0% |
| Nicaraguan | 870 | 0.2% |
| Nigerian | 824 | 0.2% |
| Northern European | 377 | 0.1% |
| Norwegian | 2,058 | 0.5% |
| Pakistani | 854 | 0.2% |
| Palestinian | 474 | 0.1% |
| Panamanian | 979 | 0.3% |
| Pennsylvania German | 15 | 0.0% |
| Peruvian | 2,065 | 0.5% |
| Polish | 7,884 | 2.0% |
| Portuguese | 1,065 | 0.3% |
| Puerto Rican | 25,745 | 6.6% |
| Romanian | 499 | 0.1% |
| Russian | 2,735 | 0.7% |
| Salvadoran | 1,600 | 0.4% |
| Samoan | 214 | 0.1% |
| Scandinavian | 998 | 0.3% |
| Scotch-Irish | 2,173 | 0.6% |
| Scottish | 5,259 | 1.3% |
| Seminole | 17 | 0.0% |
| Senegalese | 30 | 0.0% |
| Serbian | 124 | 0.0% |
| Shoshone | 3 | 0.0% |
| Sierra Leonean | 80 | 0.0% |
| Sioux | 49 | 0.0% |
| Slavic | 185 | 0.1% |
| Slovak | 667 | 0.2% |
| Slovene | 265 | 0.1% |
| South African | 191 | 0.1% |
| South American | 13,394 | 3.5% |
| South American Indian | 216 | 0.1% |
| Spaniard | 3,126 | 0.8% |
| Spanish | 1,282 | 0.3% |
| Spanish American | 25 | 0.0% |
| Spanish American Indian | 53 | 0.0% |
| Sri Lankan | 1,954 | 0.5% |
| Subsaharan African | 3,982 | 1.0% |
| Swedish | 2,194 | 0.6% |
| Swiss | 503 | 0.1% |
| Syrian | 680 | 0.2% |
| Thai | 8,639 | 2.2% |
| Tongan | 21 | 0.0% |
| Trinidadian and Tobagonian | 908 | 0.2% |
| Tsimshian | 20 | 0.0% |
| Turkish | 422 | 0.1% |
| U.S. Virgin Islander | 302 | 0.1% |
| Ugandan | 97 | 0.0% |
| Ukrainian | 789 | 0.2% |
| Uruguayan | 187 | 0.1% |
| Venezuelan | 3,179 | 0.8% |
| Vietnamese | 27 | 0.0% |
| Welsh | 1,605 | 0.4% |
| West Indian | 669 | 0.2% |
| Yugoslavian | 308 | 0.1% |
| Zimbabwean | 12 | 0.0% | View All 160 Rows |
Immigrants in Tampa
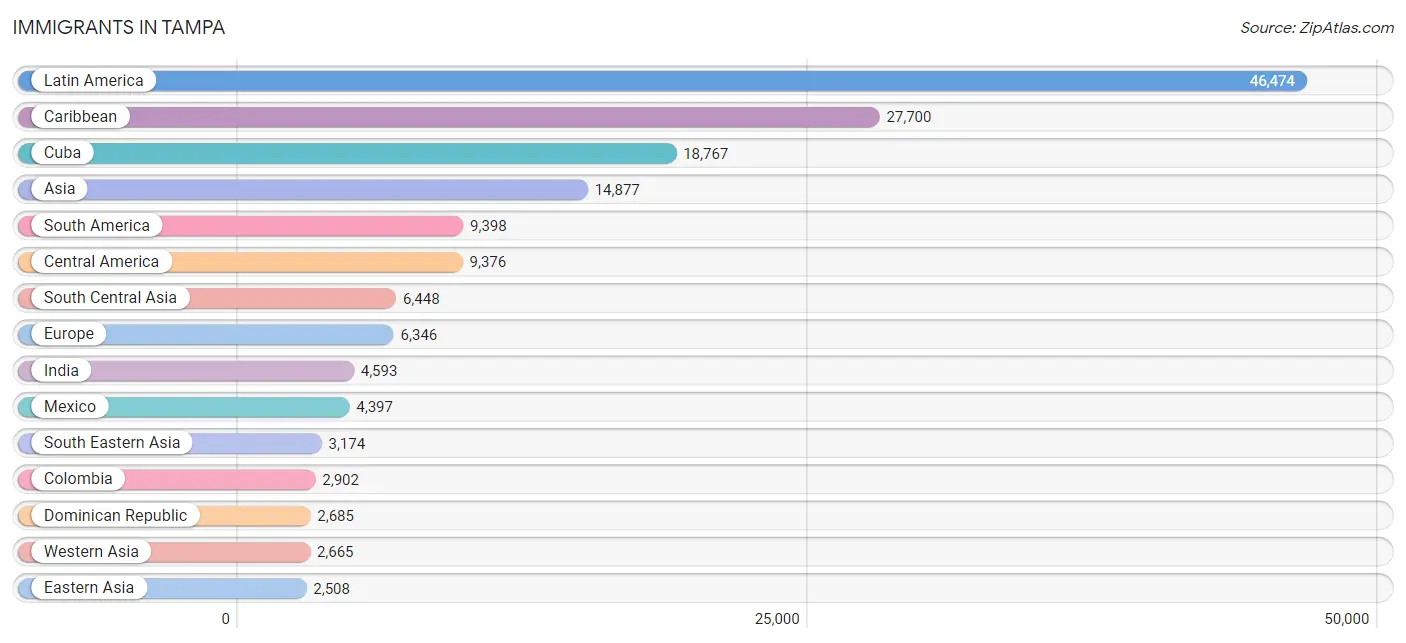
The most numerous immigrant groups reported in Tampa came from Latin America (46,474 | 11.9%), Caribbean (27,700 | 7.1%), Cuba (18,767 | 4.8%), Asia (14,877 | 3.8%), and South America (9,398 | 2.4%), together accounting for 30.2% of all Tampa residents.
| Immigration Origin | # Population | % Population |
| Afghanistan | 36 | 0.0% |
| Africa | 2,243 | 0.6% |
| Albania | 230 | 0.1% |
| Argentina | 734 | 0.2% |
| Armenia | 90 | 0.0% |
| Asia | 14,877 | 3.8% |
| Australia | 336 | 0.1% |
| Austria | 13 | 0.0% |
| Azores | 12 | 0.0% |
| Bahamas | 415 | 0.1% |
| Bangladesh | 283 | 0.1% |
| Barbados | 49 | 0.0% |
| Belarus | 32 | 0.0% |
| Belgium | 5 | 0.0% |
| Belize | 55 | 0.0% |
| Bolivia | 254 | 0.1% |
| Bosnia and Herzegovina | 180 | 0.1% |
| Brazil | 689 | 0.2% |
| Bulgaria | 288 | 0.1% |
| Cambodia | 27 | 0.0% |
| Cameroon | 15 | 0.0% |
| Canada | 1,130 | 0.3% |
| Caribbean | 27,700 | 7.1% |
| Central America | 9,376 | 2.4% |
| Chile | 192 | 0.1% |
| China | 1,852 | 0.5% |
| Colombia | 2,902 | 0.7% |
| Congo | 86 | 0.0% |
| Costa Rica | 234 | 0.1% |
| Croatia | 35 | 0.0% |
| Cuba | 18,767 | 4.8% |
| Czechoslovakia | 277 | 0.1% |
| Denmark | 41 | 0.0% |
| Dominica | 301 | 0.1% |
| Dominican Republic | 2,685 | 0.7% |
| Eastern Africa | 541 | 0.1% |
| Eastern Asia | 2,508 | 0.6% |
| Eastern Europe | 2,502 | 0.6% |
| Ecuador | 667 | 0.2% |
| Egypt | 312 | 0.1% |
| El Salvador | 866 | 0.2% |
| England | 593 | 0.2% |
| Eritrea | 22 | 0.0% |
| Ethiopia | 224 | 0.1% |
| Europe | 6,346 | 1.6% |
| Fiji | 5 | 0.0% |
| France | 381 | 0.1% |
| Germany | 501 | 0.1% |
| Ghana | 33 | 0.0% |
| Greece | 147 | 0.0% |
| Grenada | 66 | 0.0% |
| Guatemala | 578 | 0.2% |
| Guyana | 135 | 0.0% |
| Haiti | 2,038 | 0.5% |
| Honduras | 2,506 | 0.6% |
| Hong Kong | 100 | 0.0% |
| Hungary | 87 | 0.0% |
| India | 4,593 | 1.2% |
| Indonesia | 130 | 0.0% |
| Iran | 402 | 0.1% |
| Iraq | 277 | 0.1% |
| Ireland | 128 | 0.0% |
| Israel | 241 | 0.1% |
| Italy | 501 | 0.1% |
| Jamaica | 2,378 | 0.6% |
| Japan | 269 | 0.1% |
| Jordan | 336 | 0.1% |
| Kazakhstan | 62 | 0.0% |
| Kenya | 154 | 0.0% |
| Korea | 378 | 0.1% |
| Kuwait | 203 | 0.1% |
| Laos | 19 | 0.0% |
| Latin America | 46,474 | 11.9% |
| Latvia | 6 | 0.0% |
| Lebanon | 291 | 0.1% |
| Liberia | 31 | 0.0% |
| Malaysia | 183 | 0.1% |
| Mexico | 4,397 | 1.1% |
| Middle Africa | 101 | 0.0% |
| Moldova | 46 | 0.0% |
| Morocco | 470 | 0.1% |
| Nepal | 71 | 0.0% |
| Netherlands | 367 | 0.1% |
| Nicaragua | 447 | 0.1% |
| Nigeria | 373 | 0.1% |
| Northern Africa | 864 | 0.2% |
| Northern Europe | 1,691 | 0.4% |
| Norway | 28 | 0.0% |
| Oceania | 410 | 0.1% |
| Pakistan | 664 | 0.2% |
| Panama | 293 | 0.1% |
| Peru | 1,463 | 0.4% |
| Philippines | 1,081 | 0.3% |
| Poland | 127 | 0.0% |
| Portugal | 60 | 0.0% |
| Romania | 130 | 0.0% |
| Russia | 587 | 0.2% |
| Saudi Arabia | 178 | 0.1% |
| Scotland | 44 | 0.0% |
| Sierra Leone | 35 | 0.0% |
| Singapore | 12 | 0.0% |
| South Africa | 83 | 0.0% |
| South America | 9,398 | 2.4% |
| South Central Asia | 6,448 | 1.7% |
| South Eastern Asia | 3,174 | 0.8% |
| Southern Europe | 850 | 0.2% |
| Spain | 103 | 0.0% |
| Sri Lanka | 279 | 0.1% |
| St. Vincent and the Grenadines | 27 | 0.0% |
| Sweden | 67 | 0.0% |
| Syria | 603 | 0.2% |
| Taiwan | 114 | 0.0% |
| Thailand | 357 | 0.1% |
| Trinidad and Tobago | 765 | 0.2% |
| Turkey | 258 | 0.1% |
| Uganda | 58 | 0.0% |
| Ukraine | 268 | 0.1% |
| Uruguay | 66 | 0.0% |
| Uzbekistan | 8 | 0.0% |
| Venezuela | 2,271 | 0.6% |
| Vietnam | 1,331 | 0.3% |
| West Indies | 86 | 0.0% |
| Western Africa | 552 | 0.1% |
| Western Asia | 2,665 | 0.7% |
| Western Europe | 1,267 | 0.3% |
| Zimbabwe | 30 | 0.0% | View All 126 Rows |
Sex and Age in Tampa
Sex and Age in Tampa
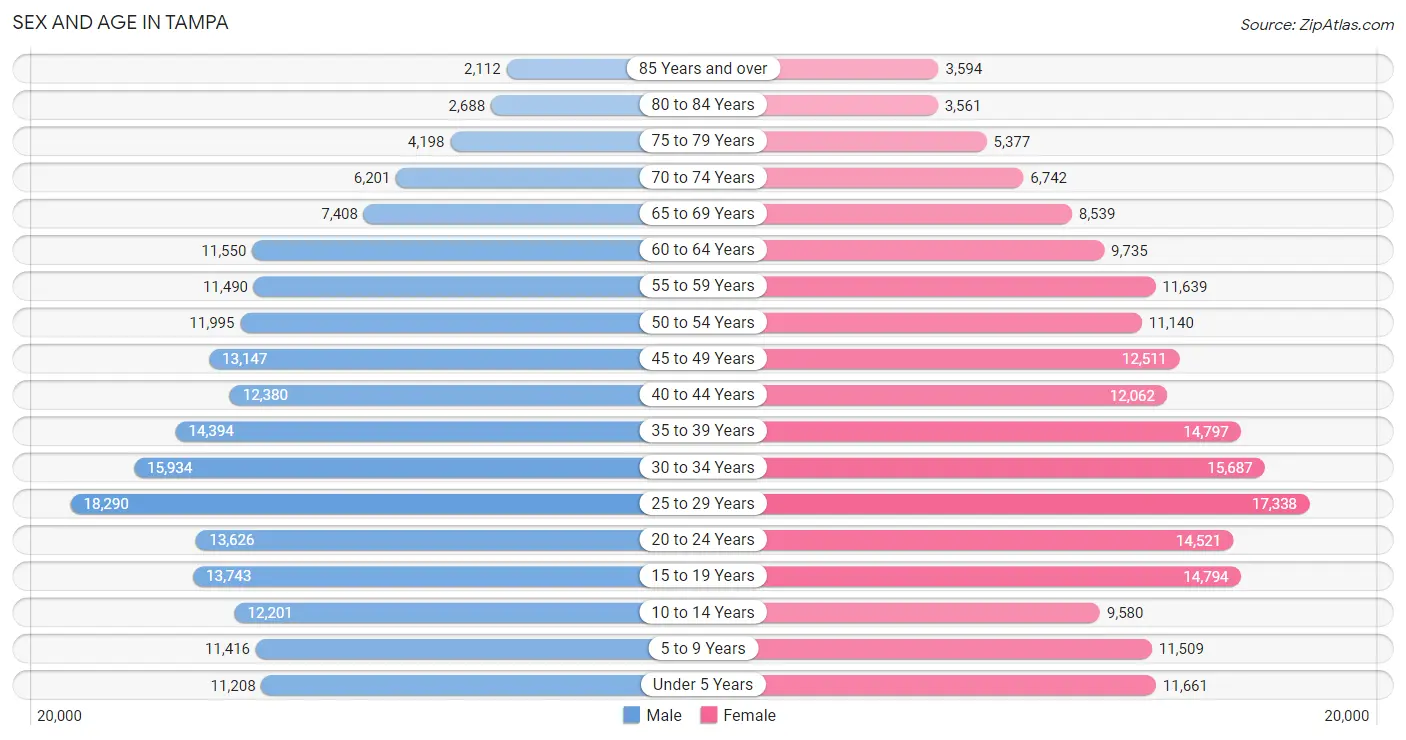
The most populous age groups in Tampa are 25 to 29 Years (18,290 | 9.4%) for men and 25 to 29 Years (17,338 | 8.9%) for women.
| Age Bracket | Male | Female |
| Under 5 Years | 11,208 (5.8%) | 11,661 (6.0%) |
| 5 to 9 Years | 11,416 (5.9%) | 11,509 (5.9%) |
| 10 to 14 Years | 12,201 (6.3%) | 9,580 (4.9%) |
| 15 to 19 Years | 13,743 (7.1%) | 14,794 (7.6%) |
| 20 to 24 Years | 13,626 (7.0%) | 14,521 (7.4%) |
| 25 to 29 Years | 18,290 (9.4%) | 17,338 (8.9%) |
| 30 to 34 Years | 15,934 (8.2%) | 15,687 (8.1%) |
| 35 to 39 Years | 14,394 (7.4%) | 14,797 (7.6%) |
| 40 to 44 Years | 12,380 (6.4%) | 12,062 (6.2%) |
| 45 to 49 Years | 13,147 (6.8%) | 12,511 (6.4%) |
| 50 to 54 Years | 11,995 (6.2%) | 11,140 (5.7%) |
| 55 to 59 Years | 11,490 (5.9%) | 11,639 (6.0%) |
| 60 to 64 Years | 11,550 (5.9%) | 9,735 (5.0%) |
| 65 to 69 Years | 7,408 (3.8%) | 8,539 (4.4%) |
| 70 to 74 Years | 6,201 (3.2%) | 6,742 (3.5%) |
| 75 to 79 Years | 4,198 (2.2%) | 5,377 (2.8%) |
| 80 to 84 Years | 2,688 (1.4%) | 3,561 (1.8%) |
| 85 Years and over | 2,112 (1.1%) | 3,594 (1.8%) |
| Total | 193,981 (100.0%) | 194,787 (100.0%) |
Families and Households in Tampa
Median Family Size in Tampa
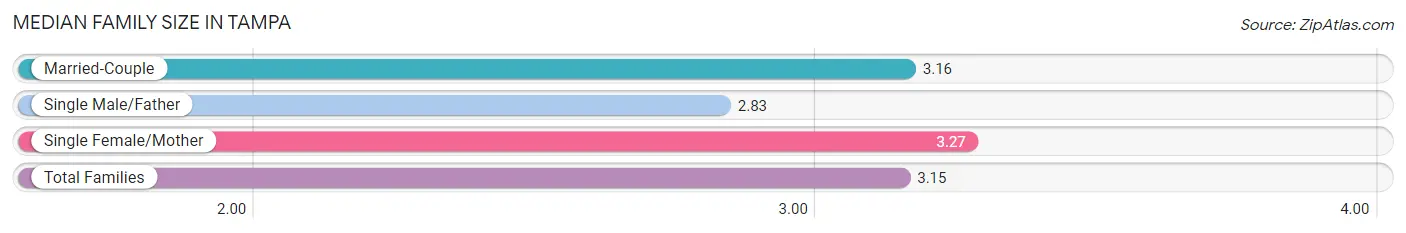
The median family size in Tampa is 3.15 persons per family, with single female/mother families (21,221 | 24.9%) accounting for the largest median family size of 3.27 persons per family. On the other hand, single male/father families (8,526 | 10.0%) represent the smallest median family size with 2.83 persons per family.
| Family Type | # Families | Family Size |
| Married-Couple | 55,479 (65.1%) | 3.16 |
| Single Male/Father | 8,526 (10.0%) | 2.83 |
| Single Female/Mother | 21,221 (24.9%) | 3.27 |
| Total Families | 85,226 (100.0%) | 3.15 |
Median Household Size in Tampa
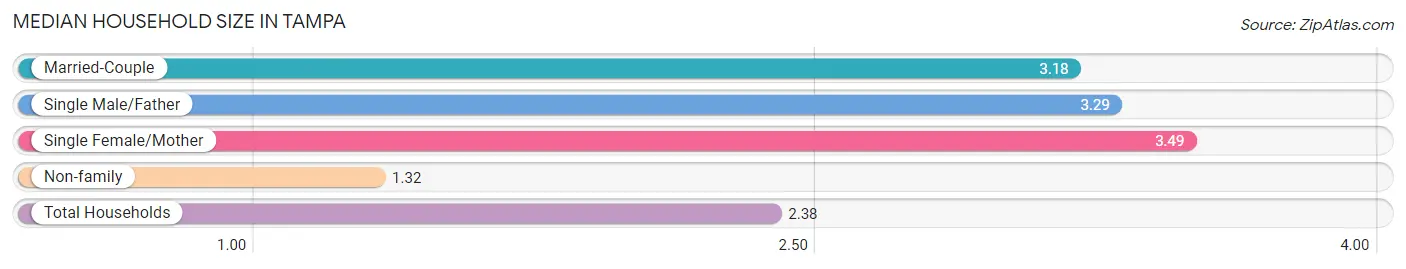
The median household size in Tampa is 2.38 persons per household, with single female/mother households (21,221 | 13.5%) accounting for the largest median household size of 3.49 persons per household. non-family households (71,840 | 45.7%) represent the smallest median household size with 1.32 persons per household.
| Household Type | # Households | Household Size |
| Married-Couple | 55,479 (35.3%) | 3.18 |
| Single Male/Father | 8,526 (5.4%) | 3.29 |
| Single Female/Mother | 21,221 (13.5%) | 3.49 |
| Non-family | 71,840 (45.7%) | 1.32 |
| Total Households | 157,066 (100.0%) | 2.38 |
Household Size by Marriage Status in Tampa
Out of a total of 157,066 households in Tampa, 85,226 (54.3%) are family households, while 71,840 (45.7%) are nonfamily households. The most numerous type of family households are 2-person households, comprising 35,959, and the most common type of nonfamily households are 1-person households, comprising 55,406.
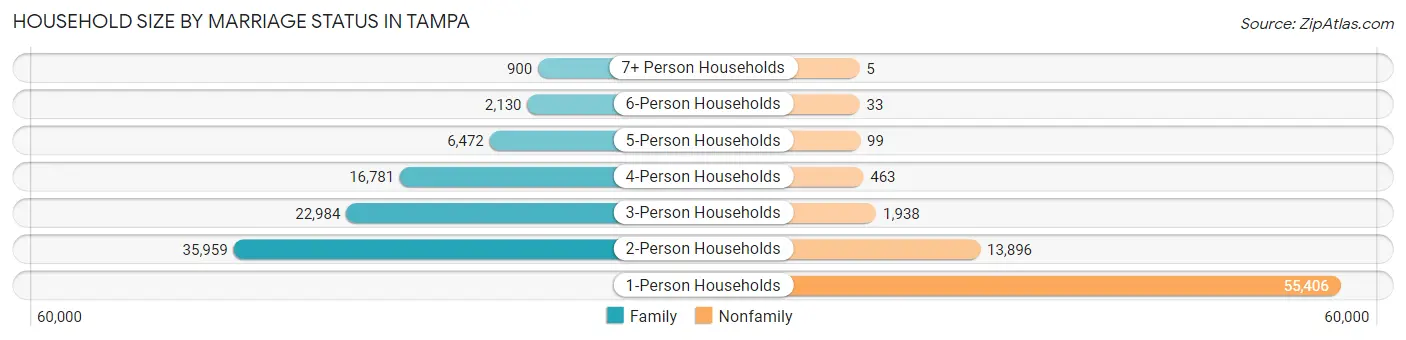
| Household Size | Family Households | Nonfamily Households |
| 1-Person Households | - | 55,406 (35.3%) |
| 2-Person Households | 35,959 (22.9%) | 13,896 (8.8%) |
| 3-Person Households | 22,984 (14.6%) | 1,938 (1.2%) |
| 4-Person Households | 16,781 (10.7%) | 463 (0.3%) |
| 5-Person Households | 6,472 (4.1%) | 99 (0.1%) |
| 6-Person Households | 2,130 (1.4%) | 33 (0.0%) |
| 7+ Person Households | 900 (0.6%) | 5 (0.0%) |
| Total | 85,226 (54.3%) | 71,840 (45.7%) |
Female Fertility in Tampa
Fertility by Age in Tampa
Average fertility rate in Tampa is 43.0 births per 1,000 women. Women in the age bracket of 20 to 34 years have the highest fertility rate with 63.0 births per 1,000 women. Women in the age bracket of 20 to 34 years acount for 67.2% of all women with births.
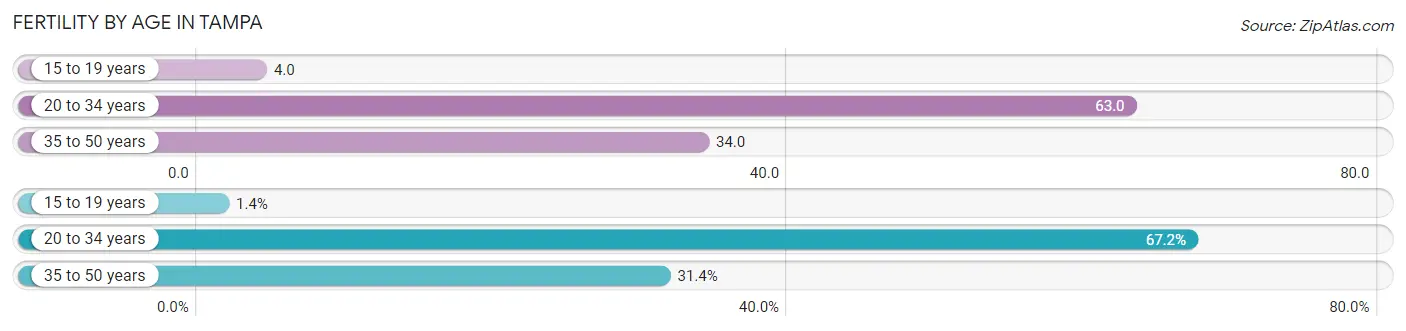
| Age Bracket | Women with Births | Births / 1,000 Women |
| 15 to 19 years | 64 (1.4%) | 4.0 |
| 20 to 34 years | 2,996 (67.2%) | 63.0 |
| 35 to 50 years | 1,400 (31.4%) | 34.0 |
| Total | 4,460 (100.0%) | 43.0 |
Fertility by Age by Marriage Status in Tampa
58.4% of women with births (4,460) in Tampa are married. The highest percentage of unmarried women with births falls into 15 to 19 years age bracket with 100.0% of them unmarried at the time of birth, while the lowest percentage of unmarried women with births belong to 35 to 50 years age bracket with 38.4% of them unmarried.
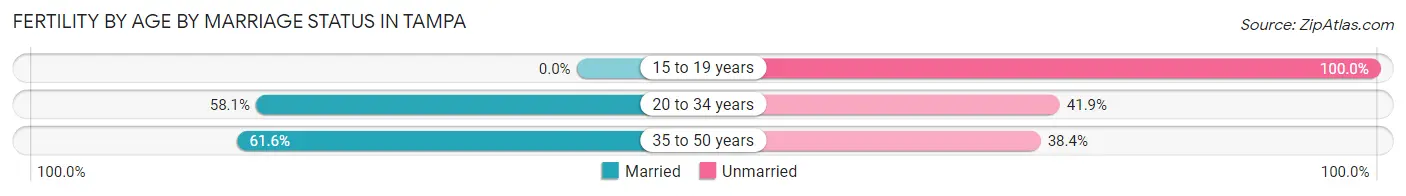
| Age Bracket | Married | Unmarried |
| 15 to 19 years | 0 (0.0%) | 64 (100.0%) |
| 20 to 34 years | 1,741 (58.1%) | 1,255 (41.9%) |
| 35 to 50 years | 862 (61.6%) | 538 (38.4%) |
| Total | 2,605 (58.4%) | 1,855 (41.6%) |
Fertility by Education in Tampa
Average fertility rate in Tampa is 43.0 births per 1,000 women. Women with the education attainment of high school diploma have the highest fertility rate of 51.0 births per 1,000 women, while women with the education attainment of bachelor's degree have the lowest fertility at 31.0 births per 1,000 women. Women with the education attainment of college or associate's degree represent 32.4% of all women with births.
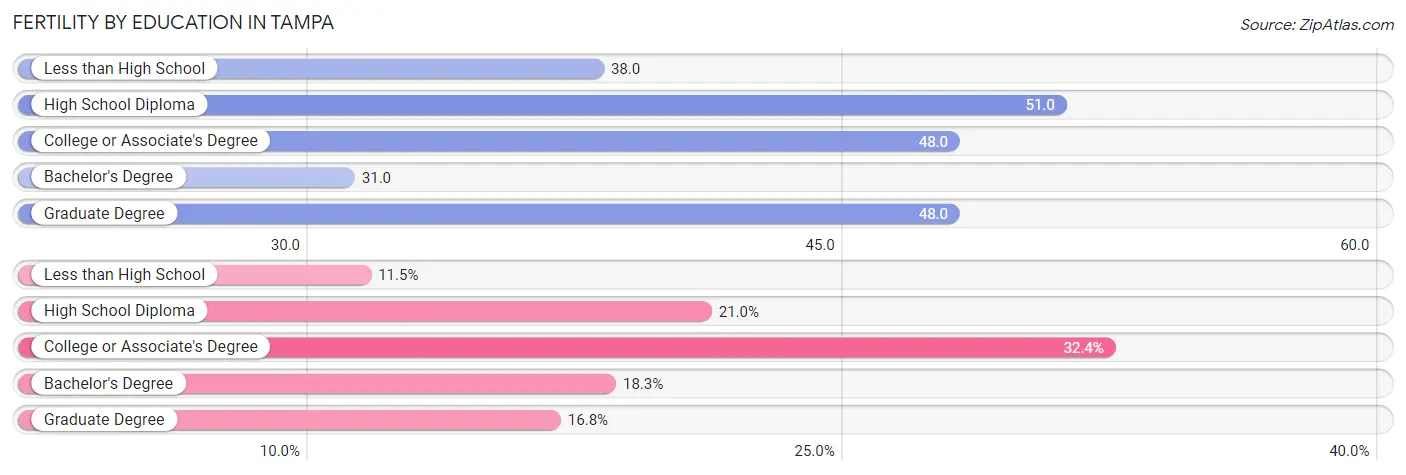
| Educational Attainment | Women with Births | Births / 1,000 Women |
| Less than High School | 511 (11.5%) | 38.0 |
| High School Diploma | 938 (21.0%) | 51.0 |
| College or Associate's Degree | 1,444 (32.4%) | 48.0 |
| Bachelor's Degree | 818 (18.3%) | 31.0 |
| Graduate Degree | 749 (16.8%) | 48.0 |
| Total | 4,460 (100.0%) | 43.0 |
Fertility by Education by Marriage Status in Tampa
41.6% of women with births in Tampa are unmarried. Women with the educational attainment of graduate degree are most likely to be married with 93.9% of them married at childbirth, while women with the educational attainment of high school diploma are least likely to be married with 66.6% of them unmarried at childbirth.
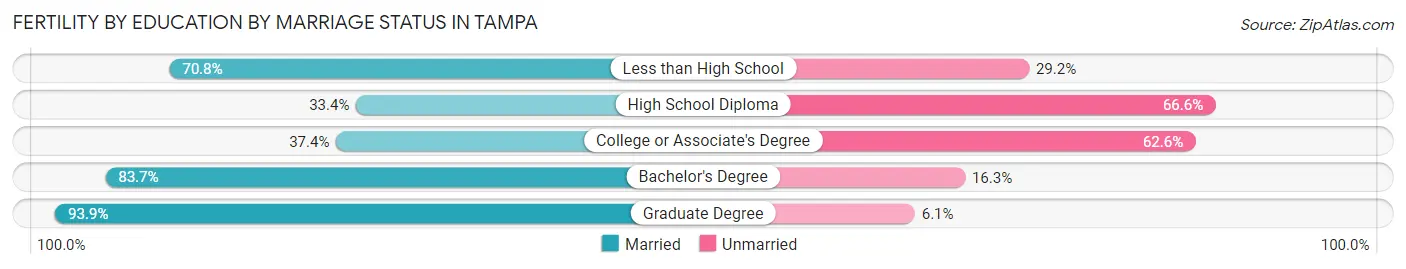
| Educational Attainment | Married | Unmarried |
| Less than High School | 362 (70.8%) | 149 (29.2%) |
| High School Diploma | 313 (33.4%) | 625 (66.6%) |
| College or Associate's Degree | 540 (37.4%) | 904 (62.6%) |
| Bachelor's Degree | 685 (83.7%) | 133 (16.3%) |
| Graduate Degree | 703 (93.9%) | 46 (6.1%) |
| Total | 2,605 (58.4%) | 1,855 (41.6%) |
Employment Characteristics in Tampa
Employment by Class of Employer in Tampa
Among the 194,577 employed individuals in Tampa, private company employees (134,442 | 69.1%), not-for-profit organizations (14,649 | 7.5%), and self-employed (incorporated) (11,443 | 5.9%) make up the most common classes of employment.
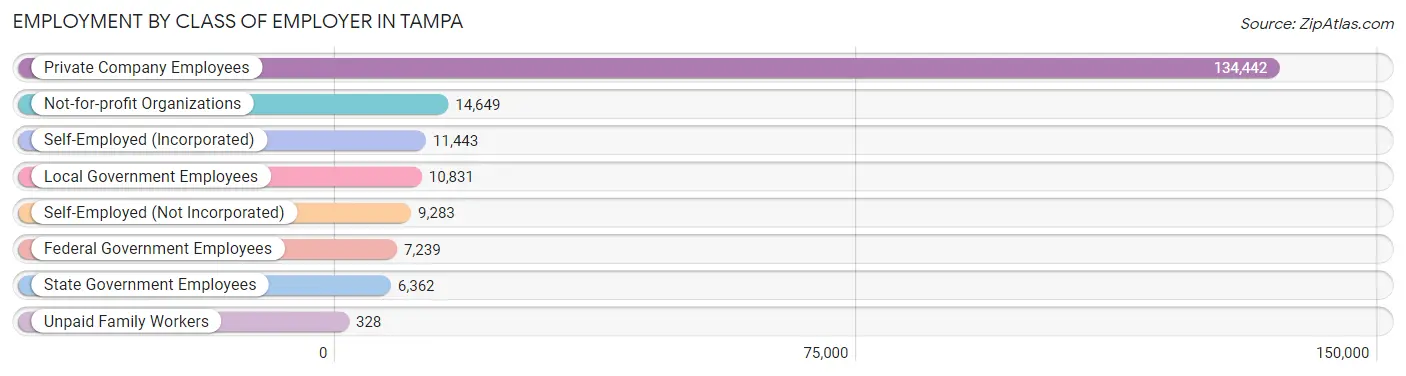
| Employer Class | # Employees | % Employees |
| Private Company Employees | 134,442 | 69.1% |
| Self-Employed (Incorporated) | 11,443 | 5.9% |
| Self-Employed (Not Incorporated) | 9,283 | 4.8% |
| Not-for-profit Organizations | 14,649 | 7.5% |
| Local Government Employees | 10,831 | 5.6% |
| State Government Employees | 6,362 | 3.3% |
| Federal Government Employees | 7,239 | 3.7% |
| Unpaid Family Workers | 328 | 0.2% |
| Total | 194,577 | 100.0% |
Employment Status by Age in Tampa
According to the labor force statistics for Tampa, out of the total population over 16 years of age (316,483), 66.0% or 208,879 individuals are in the labor force, with 5.2% or 10,862 of them unemployed. The age group with the highest labor force participation rate is 25 to 29 years, with 88.0% or 31,353 individuals in the labor force. Within the labor force, the 16 to 19 years age range has the highest percentage of unemployed individuals, with 15.5% or 1,075 of them being unemployed.
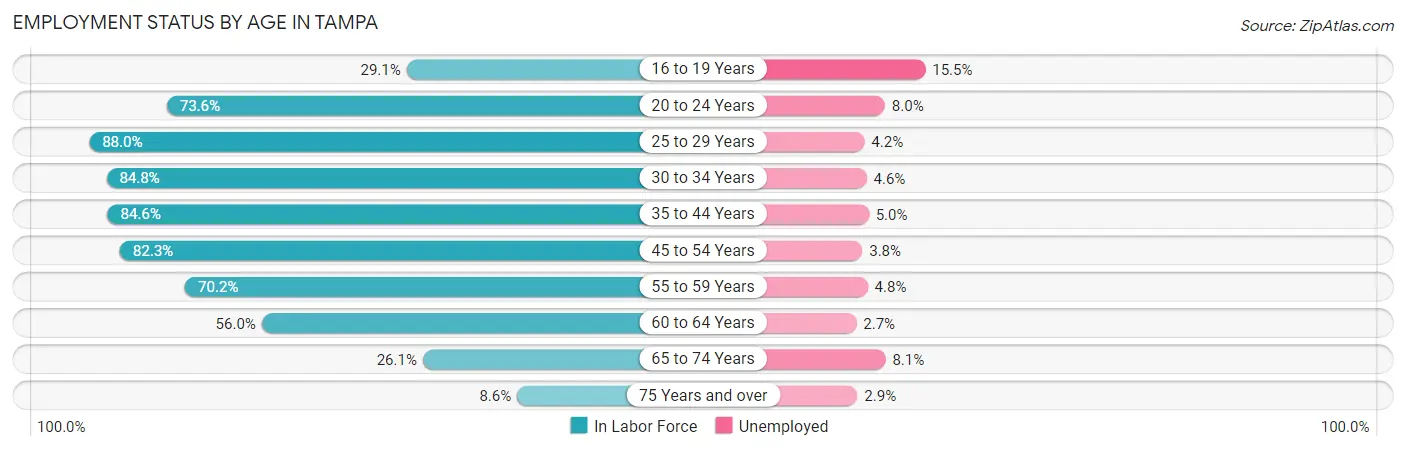
| Age Bracket | In Labor Force | Unemployed |
| 16 to 19 Years | 6,934 (29.1%) | 1,075 (15.5%) |
| 20 to 24 Years | 20,716 (73.6%) | 1,657 (8.0%) |
| 25 to 29 Years | 31,353 (88.0%) | 1,317 (4.2%) |
| 30 to 34 Years | 26,815 (84.8%) | 1,233 (4.6%) |
| 35 to 44 Years | 45,374 (84.6%) | 2,269 (5.0%) |
| 45 to 54 Years | 40,157 (82.3%) | 1,526 (3.8%) |
| 55 to 59 Years | 16,237 (70.2%) | 779 (4.8%) |
| 60 to 64 Years | 11,920 (56.0%) | 322 (2.7%) |
| 65 to 74 Years | 7,540 (26.1%) | 611 (8.1%) |
| 75 Years and over | 1,852 (8.6%) | 54 (2.9%) |
| Total | 208,879 (66.0%) | 10,862 (5.2%) |
Employment Status by Educational Attainment in Tampa
According to labor force statistics for Tampa, 80.3% of individuals (171,913) out of the total population between 25 and 64 years of age (214,089) are in the labor force, with 4.3% or 7,392 of them being unemployed. The group with the highest labor force participation rate are those with the educational attainment of bachelor's degree or higher, with 87.1% or 86,033 individuals in the labor force. Within the labor force, individuals with high school diploma education have the highest percentage of unemployment, with 7.3% or 2,531 of them being unemployed.
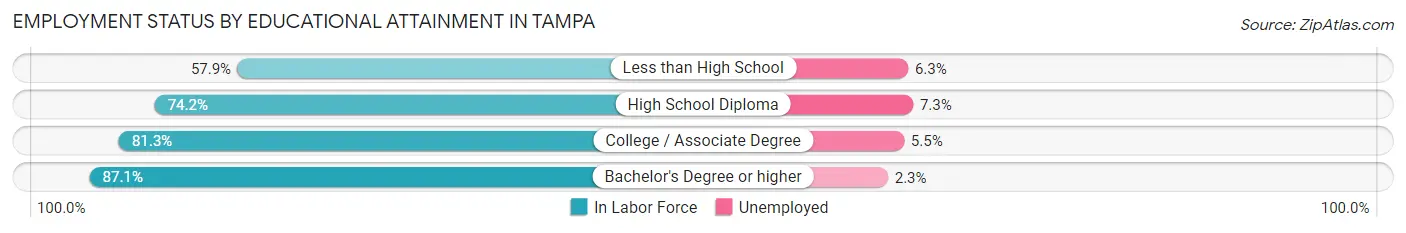
| Educational Attainment | In Labor Force | Unemployed |
| Less than High School | 11,359 (57.9%) | 1,236 (6.3%) |
| High School Diploma | 34,674 (74.2%) | 3,411 (7.3%) |
| College / Associate Degree | 39,808 (81.3%) | 2,693 (5.5%) |
| Bachelor's Degree or higher | 86,033 (87.1%) | 2,272 (2.3%) |
| Total | 171,913 (80.3%) | 9,206 (4.3%) |
Employment Occupations by Sex in Tampa
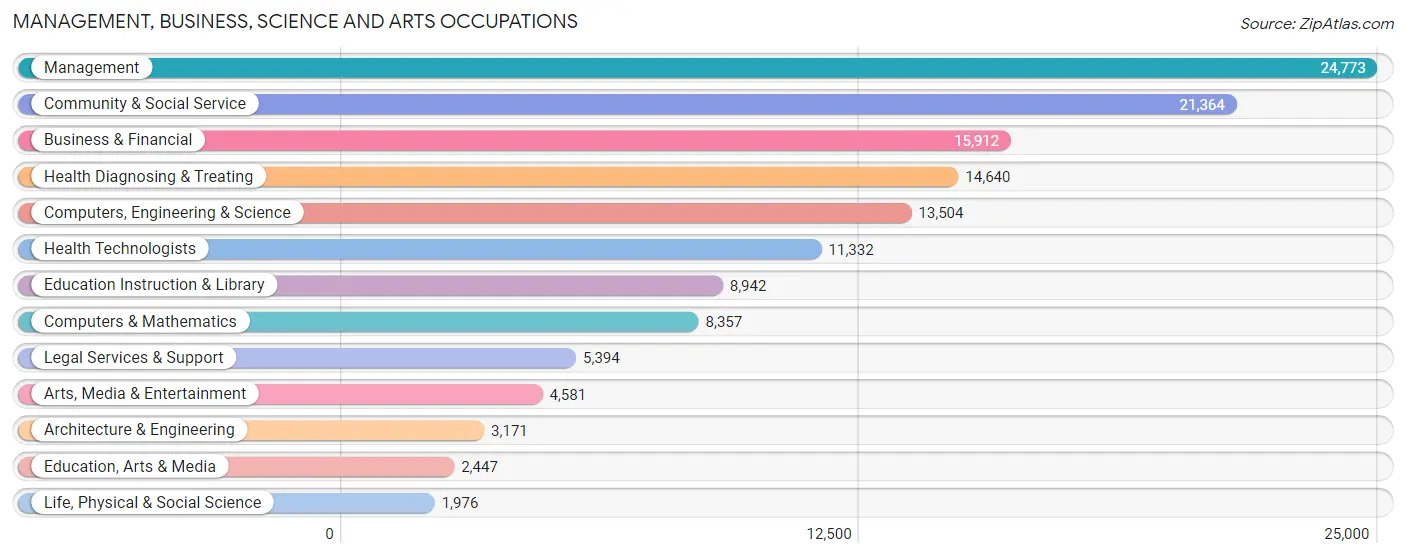
Management, Business, Science and Arts Occupations
The most common Management, Business, Science and Arts occupations in Tampa are Management (24,773 | 12.7%), Community & Social Service (21,364 | 10.9%), Business & Financial (15,912 | 8.1%), Health Diagnosing & Treating (14,640 | 7.5%), and Computers, Engineering & Science (13,504 | 6.9%).
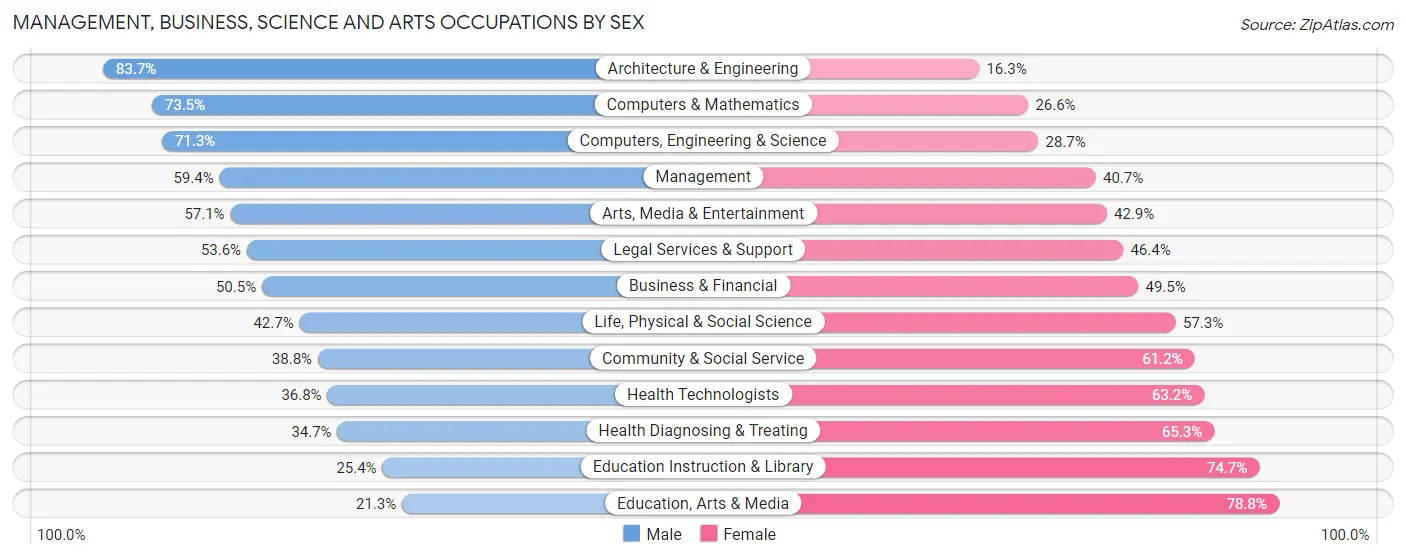
Management, Business, Science and Arts Occupations by Sex
Within the Management, Business, Science and Arts occupations in Tampa, the most male-oriented occupations are Architecture & Engineering (83.7%), Computers & Mathematics (73.5%), and Computers, Engineering & Science (71.3%), while the most female-oriented occupations are Education, Arts & Media (78.7%), Education Instruction & Library (74.7%), and Health Diagnosing & Treating (65.3%).
| Occupation | Male | Female |
| Management | 14,702 (59.4%) | 10,071 (40.6%) |
| Business & Financial | 8,033 (50.5%) | 7,879 (49.5%) |
| Computers, Engineering & Science | 9,634 (71.3%) | 3,870 (28.7%) |
| Computers & Mathematics | 6,138 (73.5%) | 2,219 (26.6%) |
| Architecture & Engineering | 2,653 (83.7%) | 518 (16.3%) |
| Life, Physical & Social Science | 843 (42.7%) | 1,133 (57.3%) |
| Community & Social Service | 8,293 (38.8%) | 13,071 (61.2%) |
| Education, Arts & Media | 520 (21.2%) | 1,927 (78.7%) |
| Legal Services & Support | 2,892 (53.6%) | 2,502 (46.4%) |
| Education Instruction & Library | 2,267 (25.4%) | 6,675 (74.7%) |
| Arts, Media & Entertainment | 2,614 (57.1%) | 1,967 (42.9%) |
| Health Diagnosing & Treating | 5,086 (34.7%) | 9,554 (65.3%) |
| Health Technologists | 4,173 (36.8%) | 7,159 (63.2%) |
| Total (Category) | 45,748 (50.7%) | 44,445 (49.3%) |
| Total (Overall) | 103,075 (52.7%) | 92,383 (47.3%) |
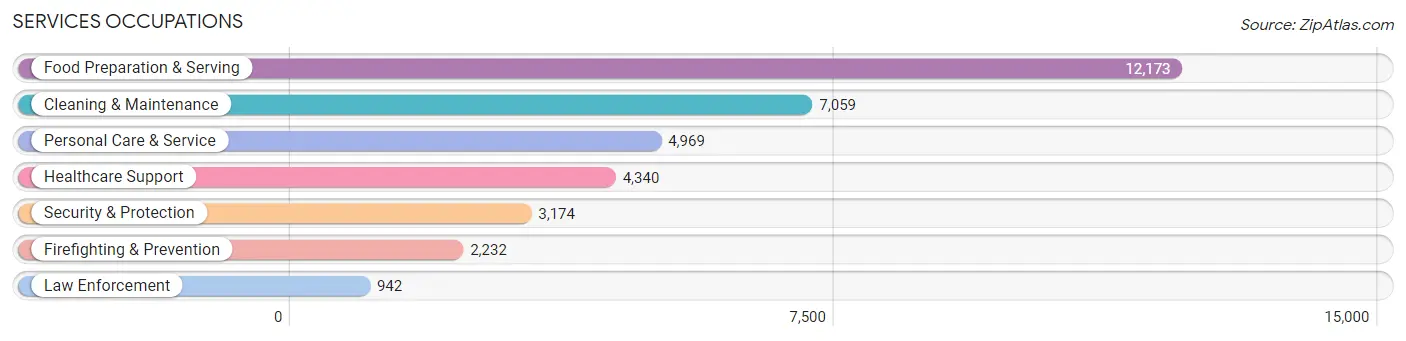
Services Occupations
The most common Services occupations in Tampa are Food Preparation & Serving (12,173 | 6.2%), Cleaning & Maintenance (7,059 | 3.6%), Personal Care & Service (4,969 | 2.5%), Healthcare Support (4,340 | 2.2%), and Security & Protection (3,174 | 1.6%).
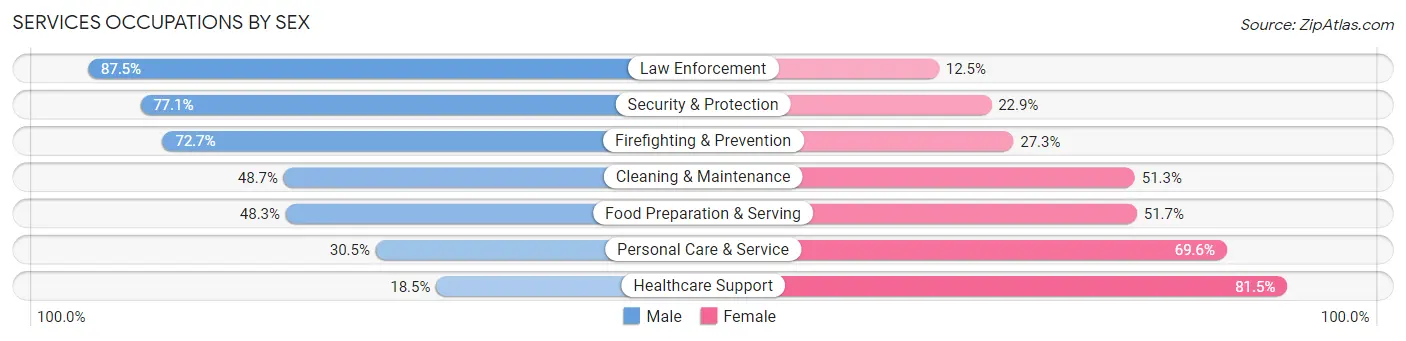
Services Occupations by Sex
Within the Services occupations in Tampa, the most male-oriented occupations are Law Enforcement (87.5%), Security & Protection (77.1%), and Firefighting & Prevention (72.7%), while the most female-oriented occupations are Healthcare Support (81.5%), Personal Care & Service (69.6%), and Food Preparation & Serving (51.7%).
| Occupation | Male | Female |
| Healthcare Support | 802 (18.5%) | 3,538 (81.5%) |
| Security & Protection | 2,447 (77.1%) | 727 (22.9%) |
| Firefighting & Prevention | 1,623 (72.7%) | 609 (27.3%) |
| Law Enforcement | 824 (87.5%) | 118 (12.5%) |
| Food Preparation & Serving | 5,876 (48.3%) | 6,297 (51.7%) |
| Cleaning & Maintenance | 3,435 (48.7%) | 3,624 (51.3%) |
| Personal Care & Service | 1,513 (30.4%) | 3,456 (69.6%) |
| Total (Category) | 14,073 (44.4%) | 17,642 (55.6%) |
| Total (Overall) | 103,075 (52.7%) | 92,383 (47.3%) |
Sales and Office Occupations
The most common Sales and Office occupations in Tampa are Office & Administration (21,350 | 10.9%), and Sales & Related (20,512 | 10.5%).

Sales and Office Occupations by Sex
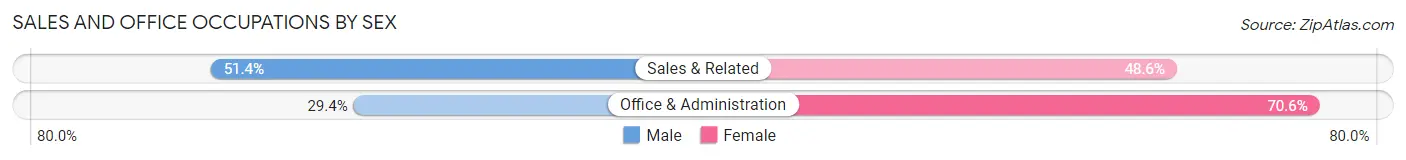
| Occupation | Male | Female |
| Sales & Related | 10,535 (51.4%) | 9,977 (48.6%) |
| Office & Administration | 6,276 (29.4%) | 15,074 (70.6%) |
| Total (Category) | 16,811 (40.2%) | 25,051 (59.8%) |
| Total (Overall) | 103,075 (52.7%) | 92,383 (47.3%) |
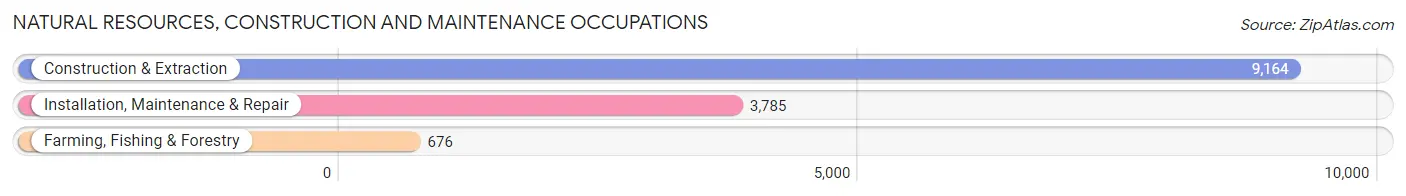
Natural Resources, Construction and Maintenance Occupations
The most common Natural Resources, Construction and Maintenance occupations in Tampa are Construction & Extraction (9,164 | 4.7%), Installation, Maintenance & Repair (3,785 | 1.9%), and Farming, Fishing & Forestry (676 | 0.4%).
Natural Resources, Construction and Maintenance Occupations by Sex
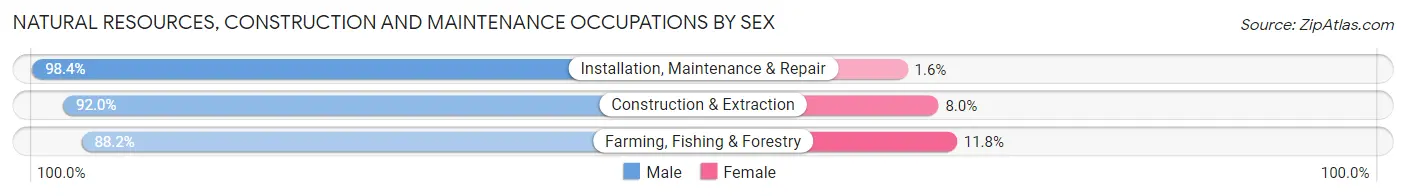
| Occupation | Male | Female |
| Farming, Fishing & Forestry | 596 (88.2%) | 80 (11.8%) |
| Construction & Extraction | 8,429 (92.0%) | 735 (8.0%) |
| Installation, Maintenance & Repair | 3,725 (98.4%) | 60 (1.6%) |
| Total (Category) | 12,750 (93.6%) | 875 (6.4%) |
| Total (Overall) | 103,075 (52.7%) | 92,383 (47.3%) |
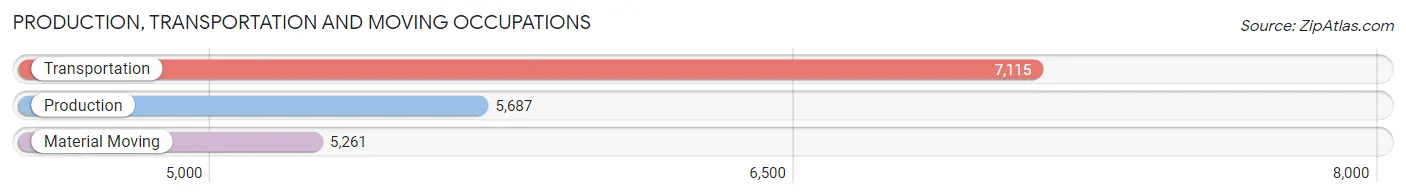
Production, Transportation and Moving Occupations
The most common Production, Transportation and Moving occupations in Tampa are Transportation (7,115 | 3.6%), Production (5,687 | 2.9%), and Material Moving (5,261 | 2.7%).
Production, Transportation and Moving Occupations by Sex
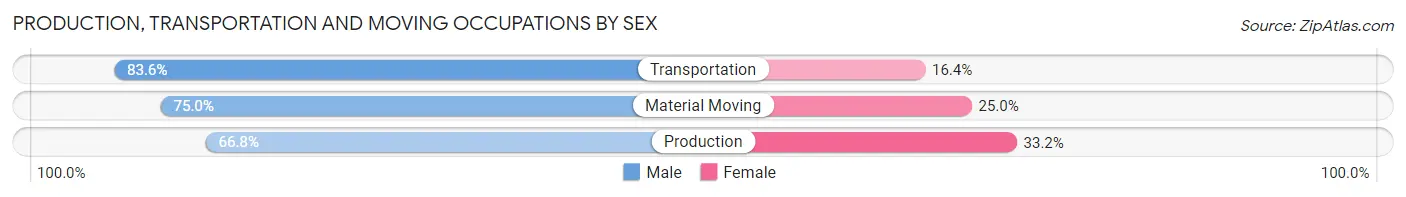
| Occupation | Male | Female |
| Production | 3,798 (66.8%) | 1,889 (33.2%) |
| Transportation | 5,947 (83.6%) | 1,168 (16.4%) |
| Material Moving | 3,948 (75.0%) | 1,313 (25.0%) |
| Total (Category) | 13,693 (75.8%) | 4,370 (24.2%) |
| Total (Overall) | 103,075 (52.7%) | 92,383 (47.3%) |
Employment Industries by Sex in Tampa
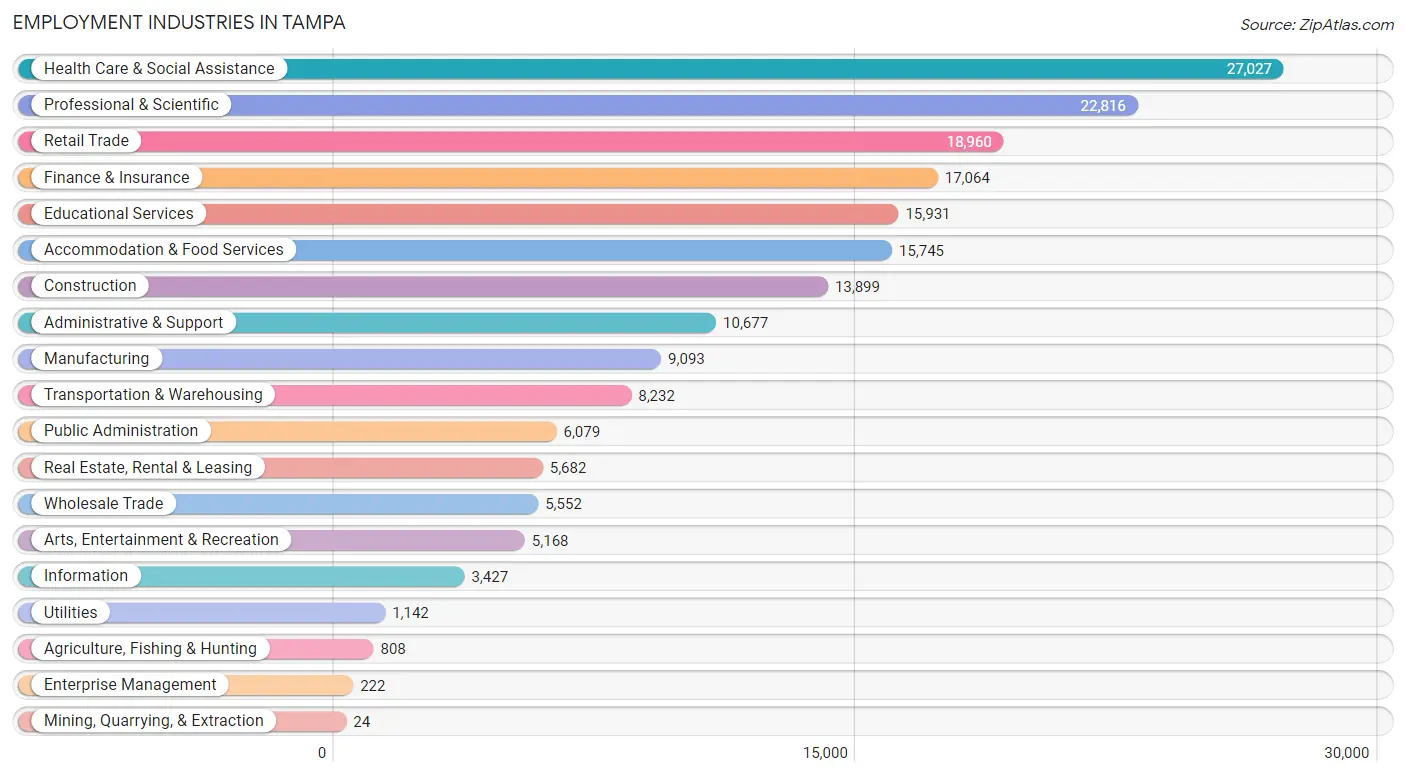
Employment Industries in Tampa
The major employment industries in Tampa include Health Care & Social Assistance (27,027 | 13.8%), Professional & Scientific (22,816 | 11.7%), Retail Trade (18,960 | 9.7%), Finance & Insurance (17,064 | 8.7%), and Educational Services (15,931 | 8.2%).
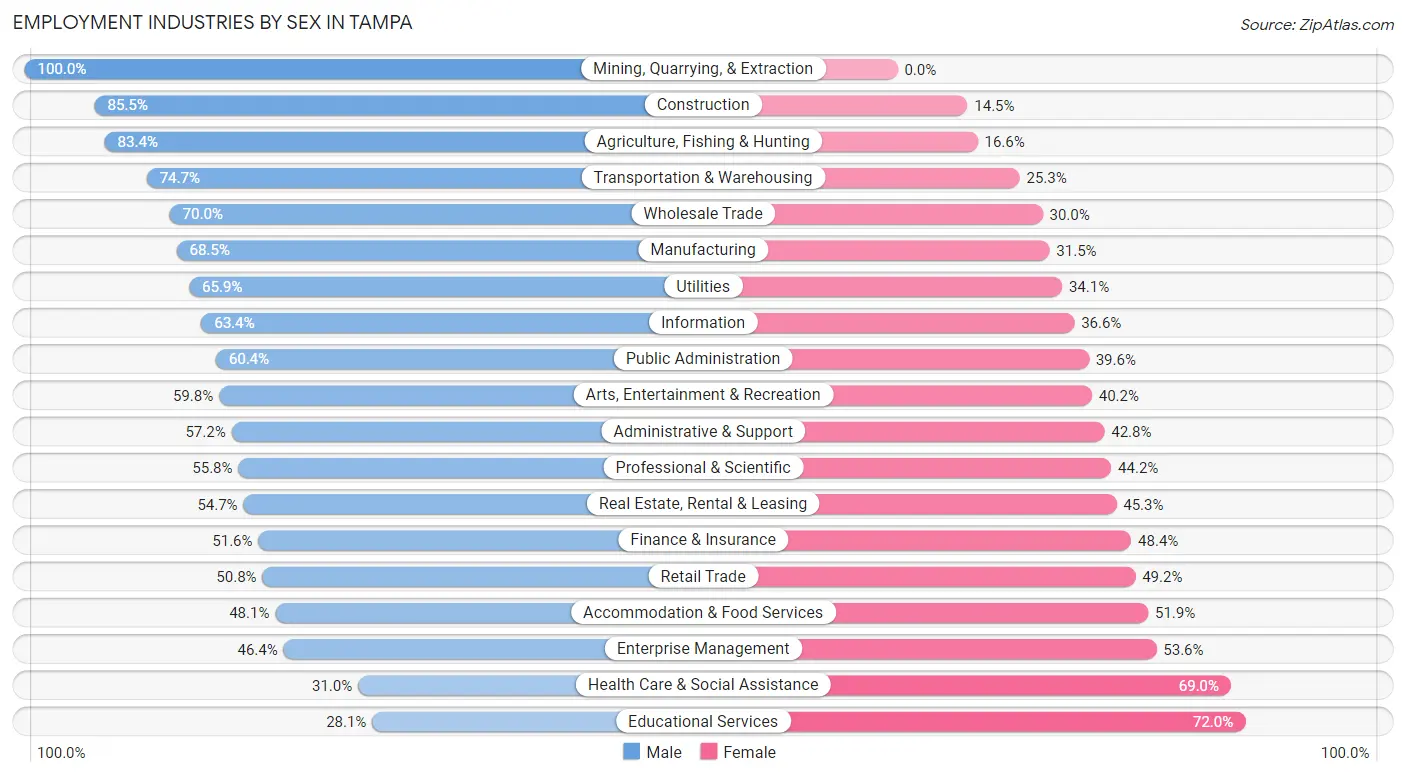
Employment Industries by Sex in Tampa
The Tampa industries that see more men than women are Mining, Quarrying, & Extraction (100.0%), Construction (85.5%), and Agriculture, Fishing & Hunting (83.4%), whereas the industries that tend to have a higher number of women are Educational Services (72.0%), Health Care & Social Assistance (69.0%), and Enterprise Management (53.6%).
| Industry | Male | Female |
| Agriculture, Fishing & Hunting | 674 (83.4%) | 134 (16.6%) |
| Mining, Quarrying, & Extraction | 24 (100.0%) | 0 (0.0%) |
| Construction | 11,886 (85.5%) | 2,013 (14.5%) |
| Manufacturing | 6,232 (68.5%) | 2,861 (31.5%) |
| Wholesale Trade | 3,885 (70.0%) | 1,667 (30.0%) |
| Retail Trade | 9,627 (50.8%) | 9,333 (49.2%) |
| Transportation & Warehousing | 6,151 (74.7%) | 2,081 (25.3%) |
| Utilities | 753 (65.9%) | 389 (34.1%) |
| Information | 2,173 (63.4%) | 1,254 (36.6%) |
| Finance & Insurance | 8,808 (51.6%) | 8,256 (48.4%) |
| Real Estate, Rental & Leasing | 3,108 (54.7%) | 2,574 (45.3%) |
| Professional & Scientific | 12,723 (55.8%) | 10,093 (44.2%) |
| Enterprise Management | 103 (46.4%) | 119 (53.6%) |
| Administrative & Support | 6,105 (57.2%) | 4,572 (42.8%) |
| Educational Services | 4,468 (28.1%) | 11,463 (72.0%) |
| Health Care & Social Assistance | 8,377 (31.0%) | 18,650 (69.0%) |
| Arts, Entertainment & Recreation | 3,089 (59.8%) | 2,079 (40.2%) |
| Accommodation & Food Services | 7,576 (48.1%) | 8,169 (51.9%) |
| Public Administration | 3,672 (60.4%) | 2,407 (39.6%) |
| Total | 103,075 (52.7%) | 92,383 (47.3%) |
Education in Tampa
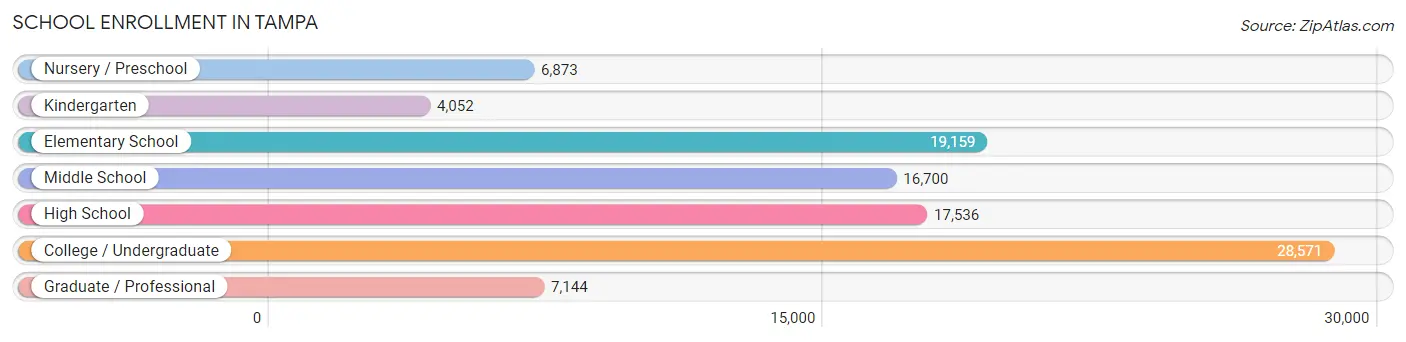
School Enrollment in Tampa
The most common levels of schooling among the 100,035 students in Tampa are college / undergraduate (28,571 | 28.6%), elementary school (19,159 | 19.2%), and high school (17,536 | 17.5%).
| School Level | # Students | % Students |
| Nursery / Preschool | 6,873 | 6.9% |
| Kindergarten | 4,052 | 4.1% |
| Elementary School | 19,159 | 19.2% |
| Middle School | 16,700 | 16.7% |
| High School | 17,536 | 17.5% |
| College / Undergraduate | 28,571 | 28.6% |
| Graduate / Professional | 7,144 | 7.1% |
| Total | 100,035 | 100.0% |
School Enrollment by Age by Funding Source in Tampa
Out of a total of 100,035 students who are enrolled in schools in Tampa, 25,009 (25.0%) attend a private institution, while the remaining 75,026 (75.0%) are enrolled in public schools. The age group of 3 to 4 year olds has the highest likelihood of being enrolled in private schools, with 3,028 (52.7% in the age bracket) enrolled. Conversely, the age group of 5 to 9 year old has the lowest likelihood of being enrolled in a private school, with 18,479 (84.6% in the age bracket) attending a public institution.
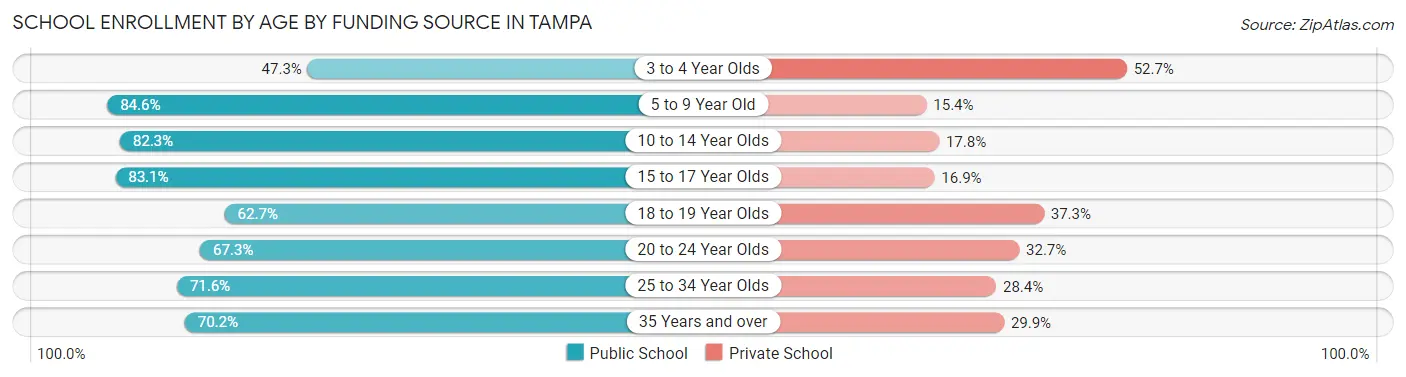
| Age Bracket | Public School | Private School |
| 3 to 4 Year Olds | 2,716 (47.3%) | 3,028 (52.7%) |
| 5 to 9 Year Old | 18,479 (84.6%) | 3,363 (15.4%) |
| 10 to 14 Year Olds | 17,478 (82.3%) | 3,773 (17.7%) |
| 15 to 17 Year Olds | 10,460 (83.1%) | 2,128 (16.9%) |
| 18 to 19 Year Olds | 8,294 (62.7%) | 4,927 (37.3%) |
| 20 to 24 Year Olds | 8,163 (67.3%) | 3,962 (32.7%) |
| 25 to 34 Year Olds | 5,516 (71.6%) | 2,186 (28.4%) |
| 35 Years and over | 3,902 (70.2%) | 1,660 (29.8%) |
| Total | 75,026 (75.0%) | 25,009 (25.0%) |
Educational Attainment by Field of Study in Tampa
Business (29,256 | 24.0%), science & technology (11,959 | 9.8%), social sciences (11,431 | 9.4%), education (9,615 | 7.9%), and engineering (8,359 | 6.9%) are the most common fields of study among 121,912 individuals in Tampa who have obtained a bachelor's degree or higher.
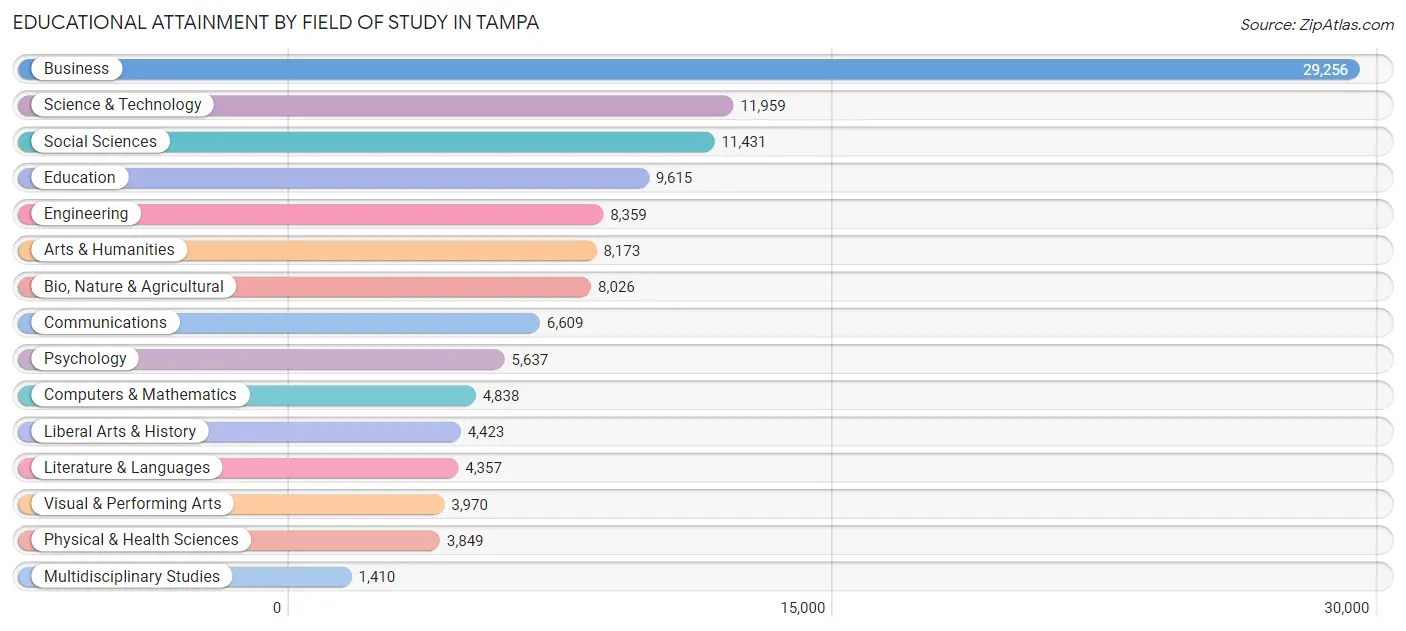
| Field of Study | # Graduates | % Graduates |
| Computers & Mathematics | 4,838 | 4.0% |
| Bio, Nature & Agricultural | 8,026 | 6.6% |
| Physical & Health Sciences | 3,849 | 3.2% |
| Psychology | 5,637 | 4.6% |
| Social Sciences | 11,431 | 9.4% |
| Engineering | 8,359 | 6.9% |
| Multidisciplinary Studies | 1,410 | 1.2% |
| Science & Technology | 11,959 | 9.8% |
| Business | 29,256 | 24.0% |
| Education | 9,615 | 7.9% |
| Literature & Languages | 4,357 | 3.6% |
| Liberal Arts & History | 4,423 | 3.6% |
| Visual & Performing Arts | 3,970 | 3.3% |
| Communications | 6,609 | 5.4% |
| Arts & Humanities | 8,173 | 6.7% |
| Total | 121,912 | 100.0% |
Transportation & Commute in Tampa
Vehicle Availability by Sex in Tampa
The most prevalent vehicle ownership categories in Tampa are males with 2 vehicles (47,882, accounting for 47.0%) and females with 2 vehicles (39,296, making up 54.0%).
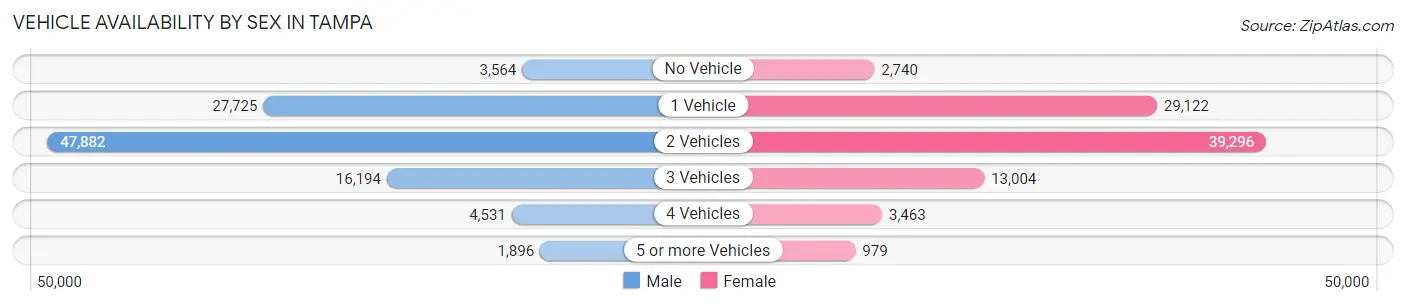
| Vehicles Available | Male | Female |
| No Vehicle | 3,564 (3.5%) | 2,740 (3.1%) |
| 1 Vehicle | 27,725 (27.2%) | 29,122 (32.9%) |
| 2 Vehicles | 47,882 (47.0%) | 39,296 (44.4%) |
| 3 Vehicles | 16,194 (15.9%) | 13,004 (14.7%) |
| 4 Vehicles | 4,531 (4.4%) | 3,463 (3.9%) |
| 5 or more Vehicles | 1,896 (1.9%) | 979 (1.1%) |
| Total | 101,792 (100.0%) | 88,604 (100.0%) |
Commute Time in Tampa
The most frequently occuring commute durations in Tampa are 15 to 19 minutes (28,067 commuters, 17.2%), 30 to 34 minutes (26,967 commuters, 16.5%), and 20 to 24 minutes (25,061 commuters, 15.3%).
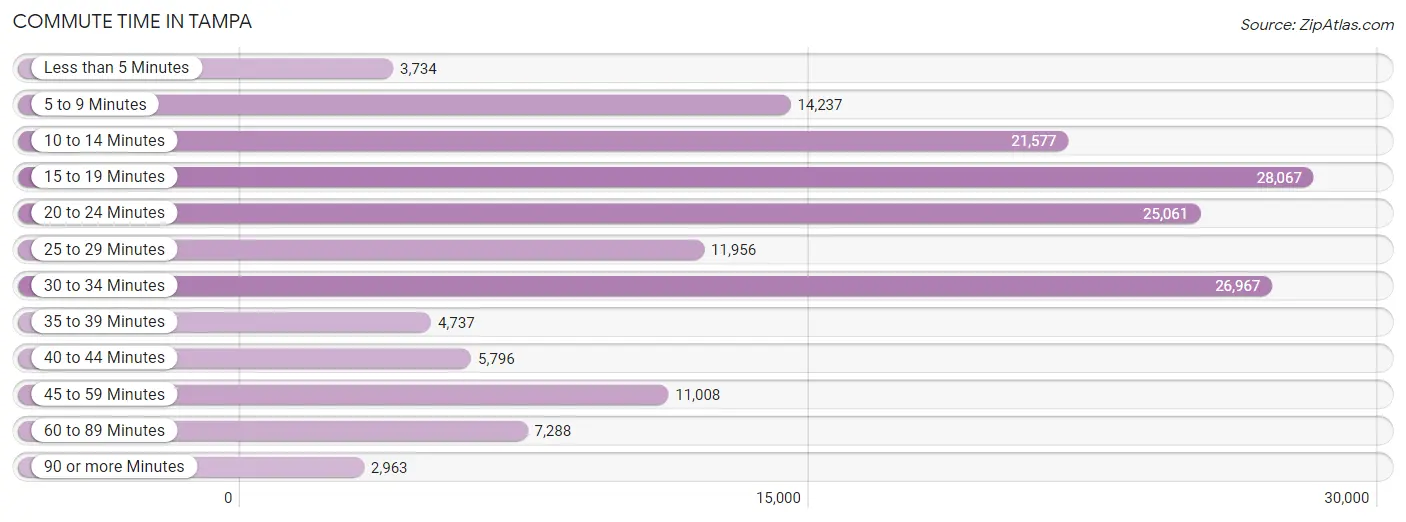
| Commute Time | # Commuters | % Commuters |
| Less than 5 Minutes | 3,734 | 2.3% |
| 5 to 9 Minutes | 14,237 | 8.7% |
| 10 to 14 Minutes | 21,577 | 13.2% |
| 15 to 19 Minutes | 28,067 | 17.2% |
| 20 to 24 Minutes | 25,061 | 15.3% |
| 25 to 29 Minutes | 11,956 | 7.3% |
| 30 to 34 Minutes | 26,967 | 16.5% |
| 35 to 39 Minutes | 4,737 | 2.9% |
| 40 to 44 Minutes | 5,796 | 3.5% |
| 45 to 59 Minutes | 11,008 | 6.7% |
| 60 to 89 Minutes | 7,288 | 4.5% |
| 90 or more Minutes | 2,963 | 1.8% |
Commute Time by Sex in Tampa
The most common commute times in Tampa are 30 to 34 minutes (15,911 commuters, 18.0%) for males and 15 to 19 minutes (12,765 commuters, 17.0%) for females.
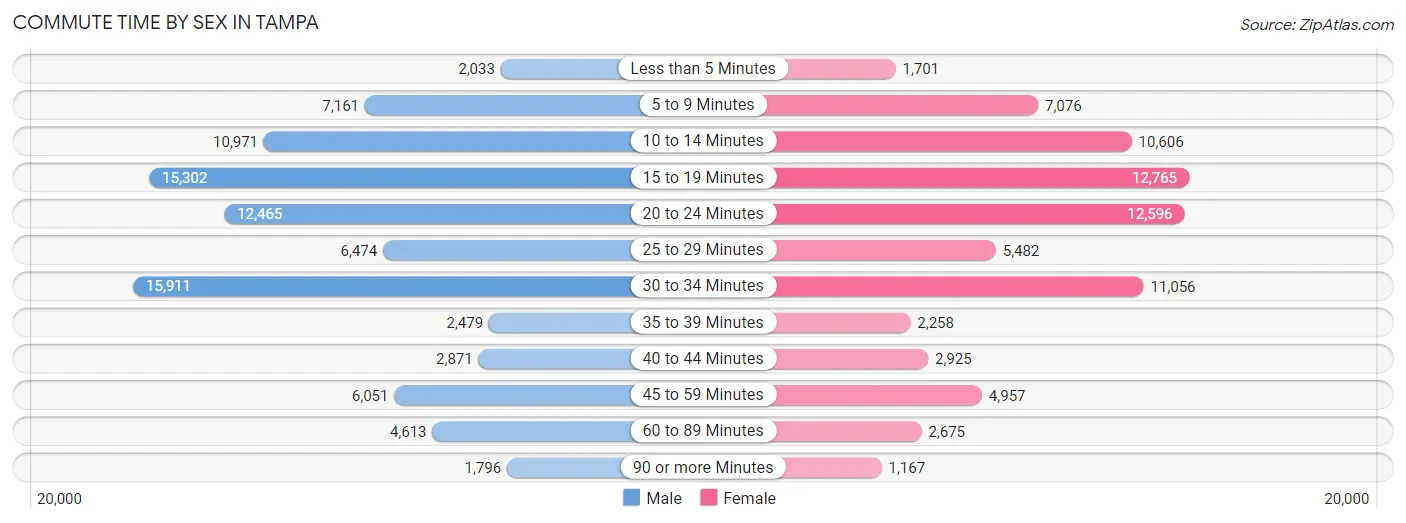
| Commute Time | Male | Female |
| Less than 5 Minutes | 2,033 (2.3%) | 1,701 (2.3%) |
| 5 to 9 Minutes | 7,161 (8.1%) | 7,076 (9.4%) |
| 10 to 14 Minutes | 10,971 (12.4%) | 10,606 (14.1%) |
| 15 to 19 Minutes | 15,302 (17.4%) | 12,765 (17.0%) |
| 20 to 24 Minutes | 12,465 (14.1%) | 12,596 (16.7%) |
| 25 to 29 Minutes | 6,474 (7.3%) | 5,482 (7.3%) |
| 30 to 34 Minutes | 15,911 (18.0%) | 11,056 (14.7%) |
| 35 to 39 Minutes | 2,479 (2.8%) | 2,258 (3.0%) |
| 40 to 44 Minutes | 2,871 (3.3%) | 2,925 (3.9%) |
| 45 to 59 Minutes | 6,051 (6.9%) | 4,957 (6.6%) |
| 60 to 89 Minutes | 4,613 (5.2%) | 2,675 (3.5%) |
| 90 or more Minutes | 1,796 (2.0%) | 1,167 (1.5%) |
Time of Departure to Work by Sex in Tampa
The most frequent times of departure to work in Tampa are 7:00 AM to 7:29 AM (13,391, 15.2%) for males and 8:00 AM to 8:29 AM (11,765, 15.6%) for females.
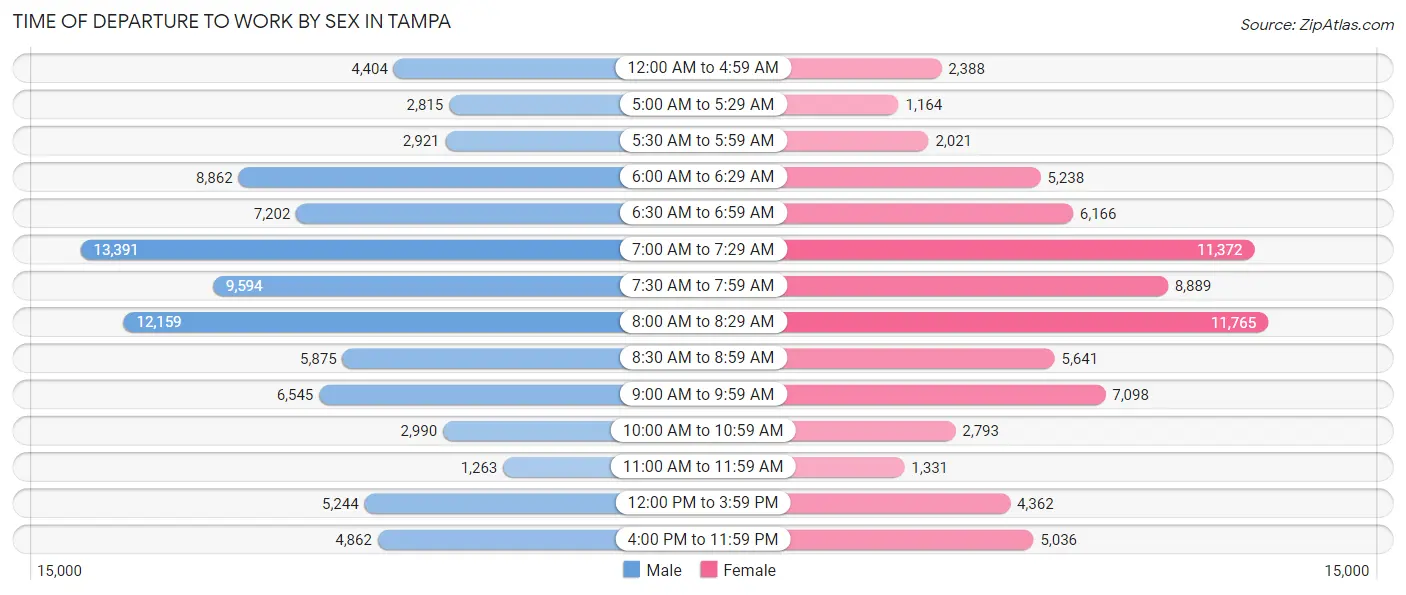
| Time of Departure | Male | Female |
| 12:00 AM to 4:59 AM | 4,404 (5.0%) | 2,388 (3.2%) |
| 5:00 AM to 5:29 AM | 2,815 (3.2%) | 1,164 (1.5%) |
| 5:30 AM to 5:59 AM | 2,921 (3.3%) | 2,021 (2.7%) |
| 6:00 AM to 6:29 AM | 8,862 (10.1%) | 5,238 (7.0%) |
| 6:30 AM to 6:59 AM | 7,202 (8.2%) | 6,166 (8.2%) |
| 7:00 AM to 7:29 AM | 13,391 (15.2%) | 11,372 (15.1%) |
| 7:30 AM to 7:59 AM | 9,594 (10.9%) | 8,889 (11.8%) |
| 8:00 AM to 8:29 AM | 12,159 (13.8%) | 11,765 (15.6%) |
| 8:30 AM to 8:59 AM | 5,875 (6.7%) | 5,641 (7.5%) |
| 9:00 AM to 9:59 AM | 6,545 (7.4%) | 7,098 (9.4%) |
| 10:00 AM to 10:59 AM | 2,990 (3.4%) | 2,793 (3.7%) |
| 11:00 AM to 11:59 AM | 1,263 (1.4%) | 1,331 (1.8%) |
| 12:00 PM to 3:59 PM | 5,244 (5.9%) | 4,362 (5.8%) |
| 4:00 PM to 11:59 PM | 4,862 (5.5%) | 5,036 (6.7%) |
| Total | 88,127 (100.0%) | 75,264 (100.0%) |
Housing Occupancy in Tampa
Occupancy by Ownership in Tampa
Of the total 157,066 dwellings in Tampa, owner-occupied units account for 79,321 (50.5%), while renter-occupied units make up 77,745 (49.5%).
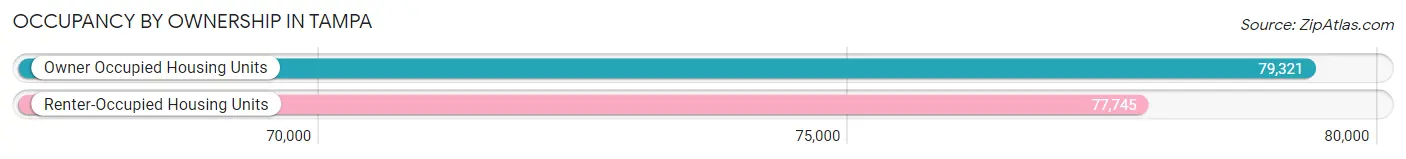
| Occupancy | # Housing Units | % Housing Units |
| Owner Occupied Housing Units | 79,321 | 50.5% |
| Renter-Occupied Housing Units | 77,745 | 49.5% |
| Total Occupied Housing Units | 157,066 | 100.0% |
Occupancy by Household Size in Tampa
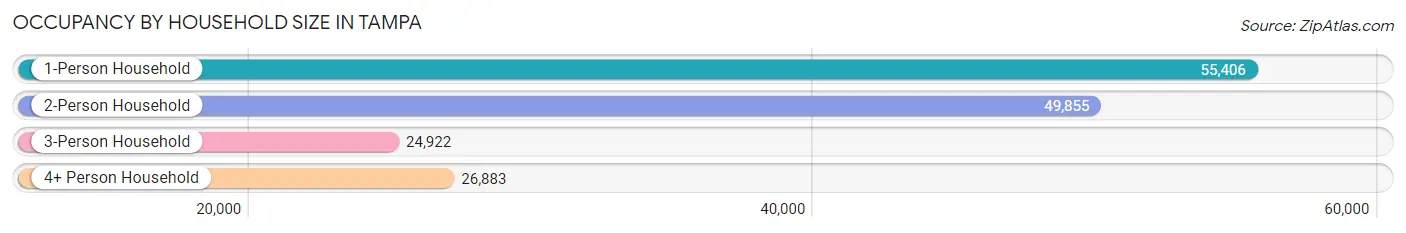
| Household Size | # Housing Units | % Housing Units |
| 1-Person Household | 55,406 | 35.3% |
| 2-Person Household | 49,855 | 31.7% |
| 3-Person Household | 24,922 | 15.9% |
| 4+ Person Household | 26,883 | 17.1% |
| Total Housing Units | 157,066 | 100.0% |
Occupancy by Ownership by Household Size in Tampa
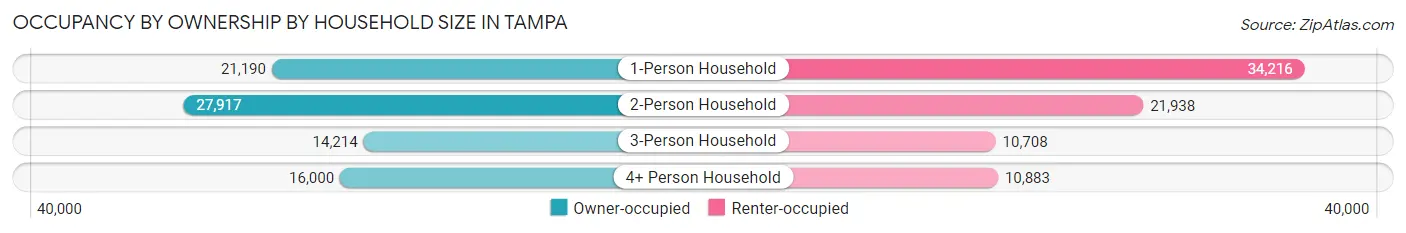
| Household Size | Owner-occupied | Renter-occupied |
| 1-Person Household | 21,190 (38.2%) | 34,216 (61.8%) |
| 2-Person Household | 27,917 (56.0%) | 21,938 (44.0%) |
| 3-Person Household | 14,214 (57.0%) | 10,708 (43.0%) |
| 4+ Person Household | 16,000 (59.5%) | 10,883 (40.5%) |
| Total Housing Units | 79,321 (50.5%) | 77,745 (49.5%) |
Occupancy by Educational Attainment in Tampa
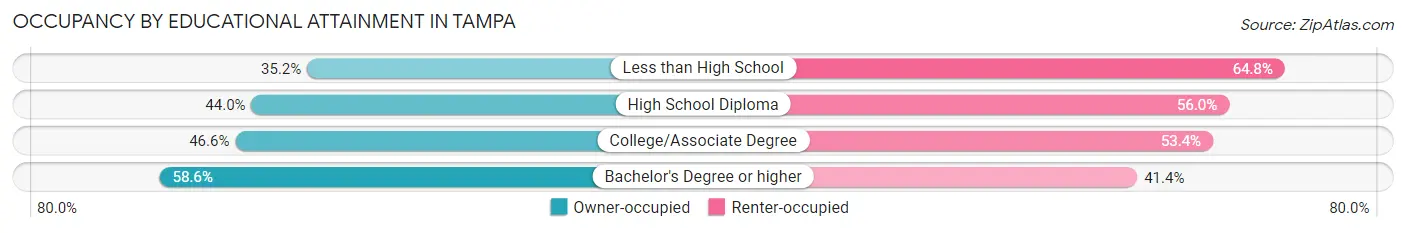
| Household Size | Owner-occupied | Renter-occupied |
| Less than High School | 4,947 (35.2%) | 9,110 (64.8%) |
| High School Diploma | 14,273 (44.0%) | 18,146 (56.0%) |
| College/Associate Degree | 18,223 (46.6%) | 20,892 (53.4%) |
| Bachelor's Degree or higher | 41,878 (58.6%) | 29,597 (41.4%) |
Occupancy by Age of Householder in Tampa
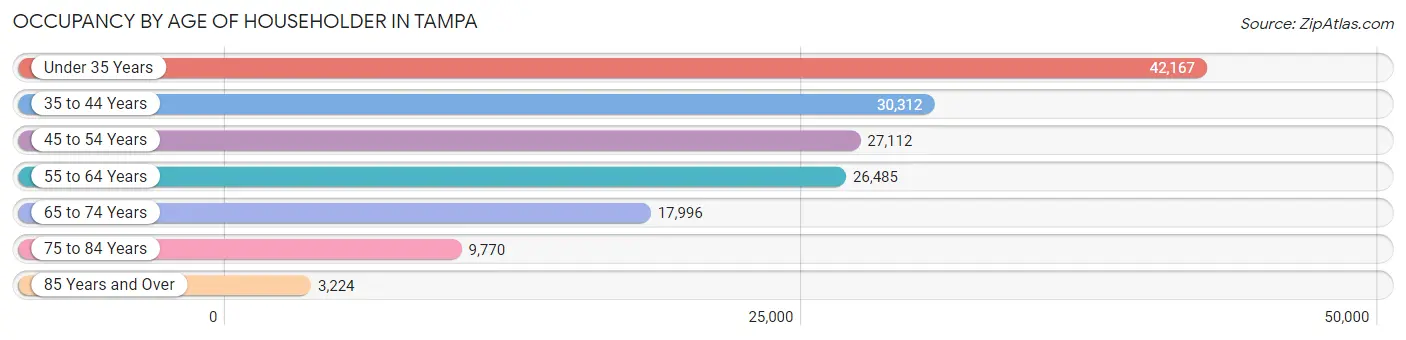
| Age Bracket | # Households | % Households |
| Under 35 Years | 42,167 | 26.9% |
| 35 to 44 Years | 30,312 | 19.3% |
| 45 to 54 Years | 27,112 | 17.3% |
| 55 to 64 Years | 26,485 | 16.9% |
| 65 to 74 Years | 17,996 | 11.5% |
| 75 to 84 Years | 9,770 | 6.2% |
| 85 Years and Over | 3,224 | 2.1% |
| Total | 157,066 | 100.0% |
Housing Finances in Tampa
Median Income by Occupancy in Tampa
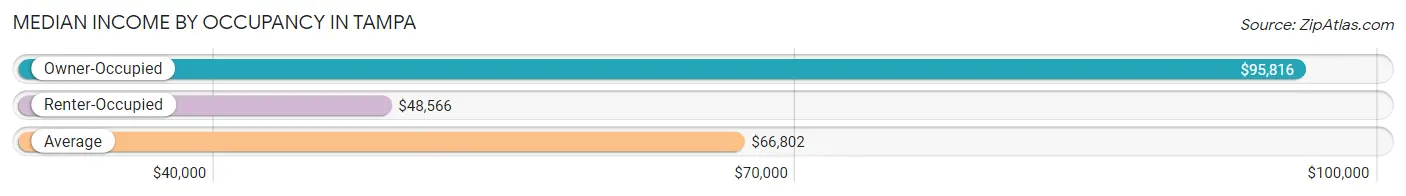
| Occupancy Type | # Households | Median Income |
| Owner-Occupied | 79,321 (50.5%) | $95,816 |
| Renter-Occupied | 77,745 (49.5%) | $48,566 |
| Average | 157,066 (100.0%) | $66,802 |
Occupancy by Householder Income Bracket in Tampa
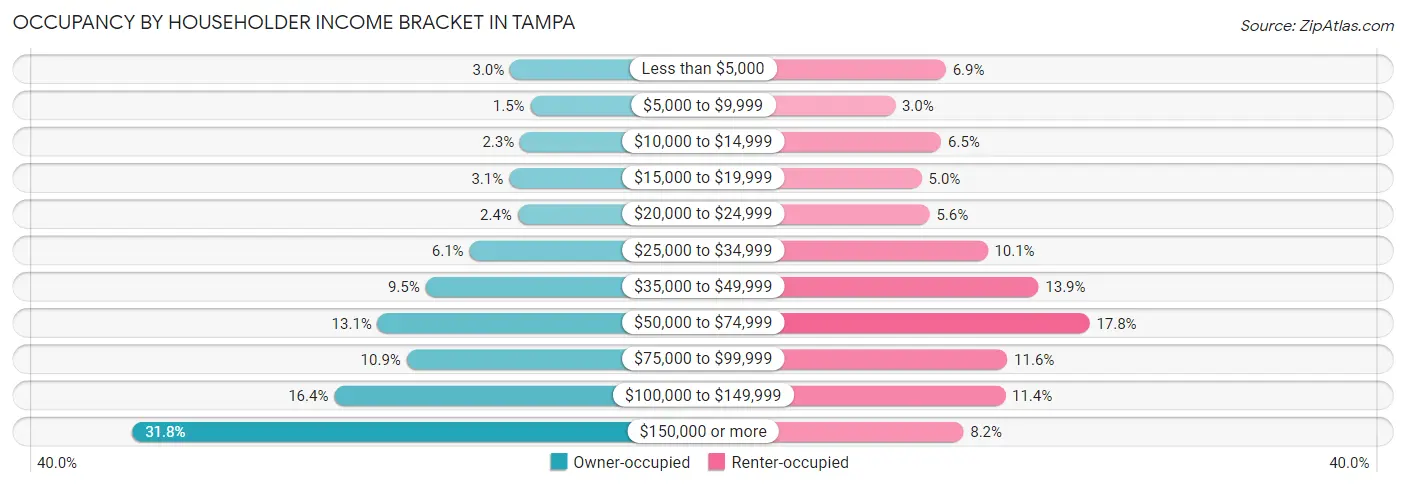
| Income Bracket | Owner-occupied | Renter-occupied |
| Less than $5,000 | 2,391 (3.0%) | 5,341 (6.9%) |
| $5,000 to $9,999 | 1,160 (1.5%) | 2,335 (3.0%) |
| $10,000 to $14,999 | 1,785 (2.2%) | 5,066 (6.5%) |
| $15,000 to $19,999 | 2,451 (3.1%) | 3,909 (5.0%) |
| $20,000 to $24,999 | 1,926 (2.4%) | 4,378 (5.6%) |
| $25,000 to $34,999 | 4,844 (6.1%) | 7,814 (10.1%) |
| $35,000 to $49,999 | 7,496 (9.5%) | 10,828 (13.9%) |
| $50,000 to $74,999 | 10,389 (13.1%) | 13,858 (17.8%) |
| $75,000 to $99,999 | 8,639 (10.9%) | 8,981 (11.6%) |
| $100,000 to $149,999 | 13,015 (16.4%) | 8,853 (11.4%) |
| $150,000 or more | 25,225 (31.8%) | 6,382 (8.2%) |
| Total | 79,321 (100.0%) | 77,745 (100.0%) |
Monthly Housing Cost Tiers in Tampa
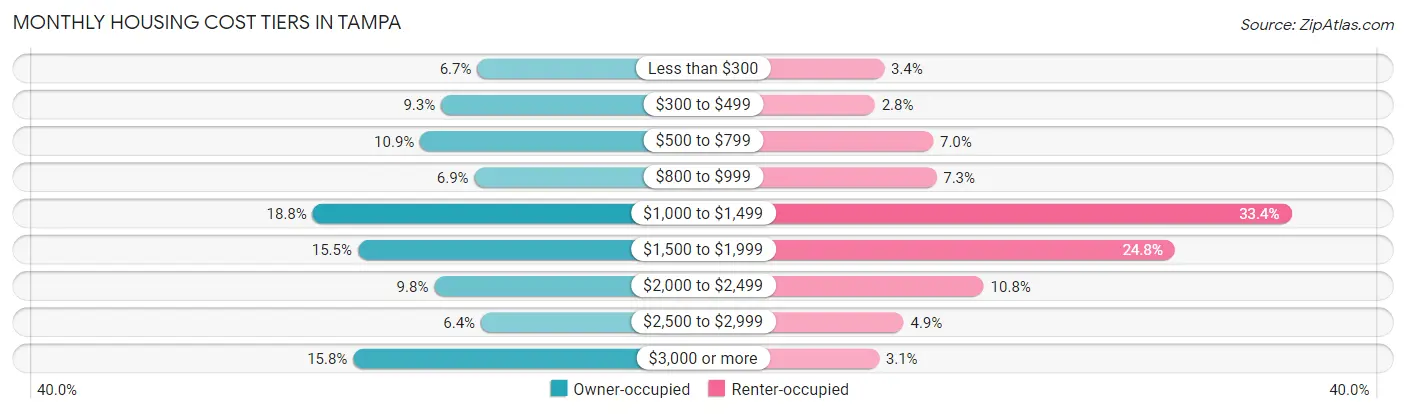
| Monthly Cost | Owner-occupied | Renter-occupied |
| Less than $300 | 5,286 (6.7%) | 2,665 (3.4%) |
| $300 to $499 | 7,399 (9.3%) | 2,138 (2.8%) |
| $500 to $799 | 8,624 (10.9%) | 5,474 (7.0%) |
| $800 to $999 | 5,448 (6.9%) | 5,656 (7.3%) |
| $1,000 to $1,499 | 14,905 (18.8%) | 25,985 (33.4%) |
| $1,500 to $1,999 | 12,262 (15.5%) | 19,309 (24.8%) |
| $2,000 to $2,499 | 7,794 (9.8%) | 8,375 (10.8%) |
| $2,500 to $2,999 | 5,068 (6.4%) | 3,787 (4.9%) |
| $3,000 or more | 12,535 (15.8%) | 2,373 (3.0%) |
| Total | 79,321 (100.0%) | 77,745 (100.0%) |
Physical Housing Characteristics in Tampa
Housing Structures in Tampa
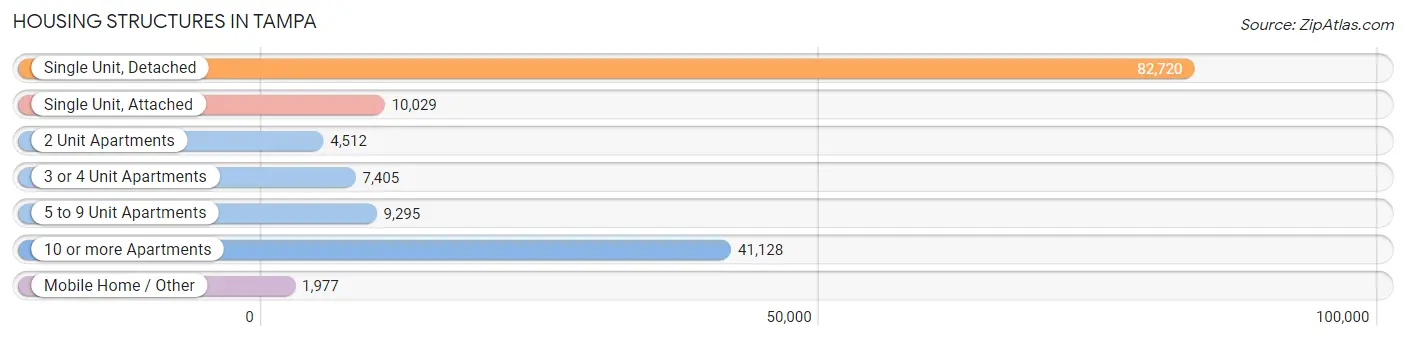
| Structure Type | # Housing Units | % Housing Units |
| Single Unit, Detached | 82,720 | 52.7% |
| Single Unit, Attached | 10,029 | 6.4% |
| 2 Unit Apartments | 4,512 | 2.9% |
| 3 or 4 Unit Apartments | 7,405 | 4.7% |
| 5 to 9 Unit Apartments | 9,295 | 5.9% |
| 10 or more Apartments | 41,128 | 26.2% |
| Mobile Home / Other | 1,977 | 1.3% |
| Total | 157,066 | 100.0% |
Housing Structures by Occupancy in Tampa
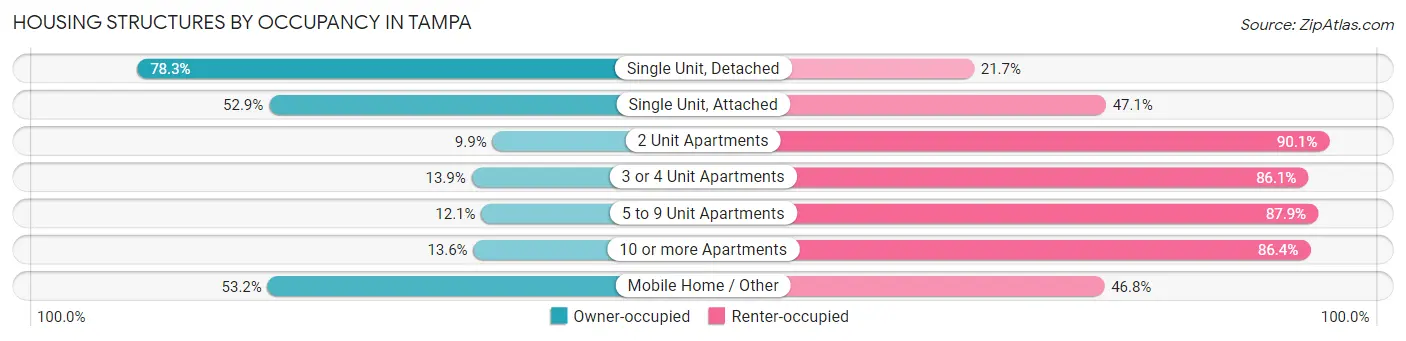
| Structure Type | Owner-occupied | Renter-occupied |
| Single Unit, Detached | 64,776 (78.3%) | 17,944 (21.7%) |
| Single Unit, Attached | 5,307 (52.9%) | 4,722 (47.1%) |
| 2 Unit Apartments | 447 (9.9%) | 4,065 (90.1%) |
| 3 or 4 Unit Apartments | 1,032 (13.9%) | 6,373 (86.1%) |
| 5 to 9 Unit Apartments | 1,121 (12.1%) | 8,174 (87.9%) |
| 10 or more Apartments | 5,586 (13.6%) | 35,542 (86.4%) |
| Mobile Home / Other | 1,052 (53.2%) | 925 (46.8%) |
| Total | 79,321 (50.5%) | 77,745 (49.5%) |
Housing Structures by Number of Rooms in Tampa
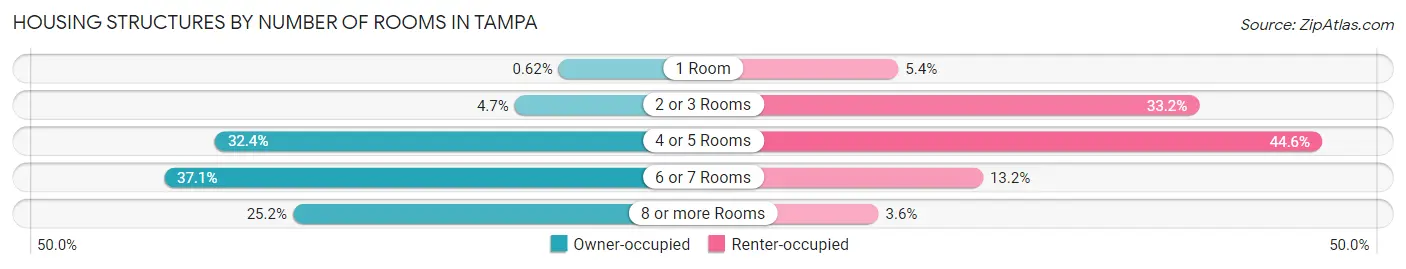
| Number of Rooms | Owner-occupied | Renter-occupied |
| 1 Room | 488 (0.6%) | 4,203 (5.4%) |
| 2 or 3 Rooms | 3,717 (4.7%) | 25,820 (33.2%) |
| 4 or 5 Rooms | 25,695 (32.4%) | 34,650 (44.6%) |
| 6 or 7 Rooms | 29,431 (37.1%) | 10,286 (13.2%) |
| 8 or more Rooms | 19,990 (25.2%) | 2,786 (3.6%) |
| Total | 79,321 (100.0%) | 77,745 (100.0%) |
Housing Structure by Heating Type in Tampa
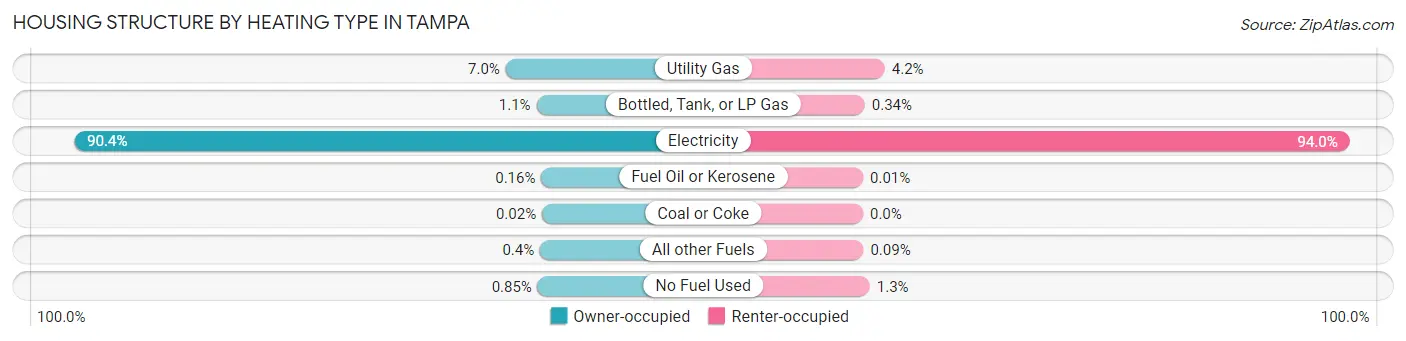
| Heating Type | Owner-occupied | Renter-occupied |
| Utility Gas | 5,583 (7.0%) | 3,275 (4.2%) |
| Bottled, Tank, or LP Gas | 868 (1.1%) | 268 (0.3%) |
| Electricity | 71,740 (90.4%) | 73,097 (94.0%) |
| Fuel Oil or Kerosene | 126 (0.2%) | 11 (0.0%) |
| Coal or Coke | 15 (0.0%) | 0 (0.0%) |
| All other Fuels | 316 (0.4%) | 73 (0.1%) |
| No Fuel Used | 673 (0.9%) | 1,021 (1.3%) |
| Total | 79,321 (100.0%) | 77,745 (100.0%) |
Household Vehicle Usage in Tampa
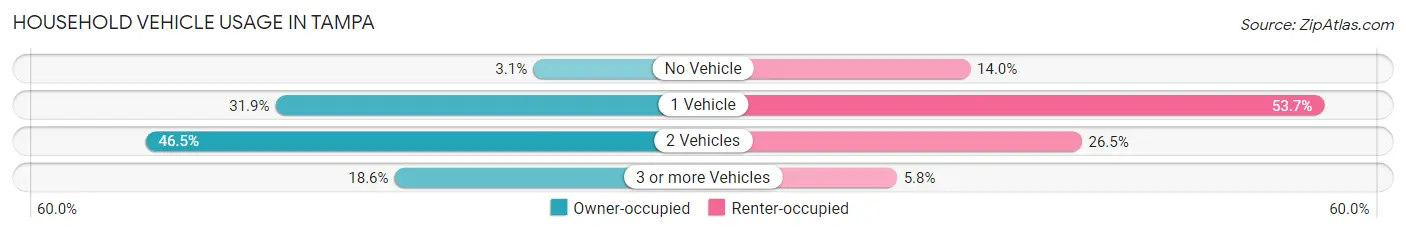
| Vehicles per Household | Owner-occupied | Renter-occupied |
| No Vehicle | 2,418 (3.0%) | 10,901 (14.0%) |
| 1 Vehicle | 25,317 (31.9%) | 41,722 (53.7%) |
| 2 Vehicles | 36,847 (46.5%) | 20,614 (26.5%) |
| 3 or more Vehicles | 14,739 (18.6%) | 4,508 (5.8%) |
| Total | 79,321 (100.0%) | 77,745 (100.0%) |
Real Estate & Mortgages in Tampa
Real Estate and Mortgage Overview in Tampa
| Characteristic | Without Mortgage | With Mortgage |
| Housing Units | 27,630 | 51,691 |
| Median Property Value | $286,600 | $355,900 |
| Median Household Income | $64,735 | $19,120 |
| Monthly Housing Costs | $553 | $11,722 |
| Real Estate Taxes | $1,746 | $1,169 |
Property Value by Mortgage Status in Tampa
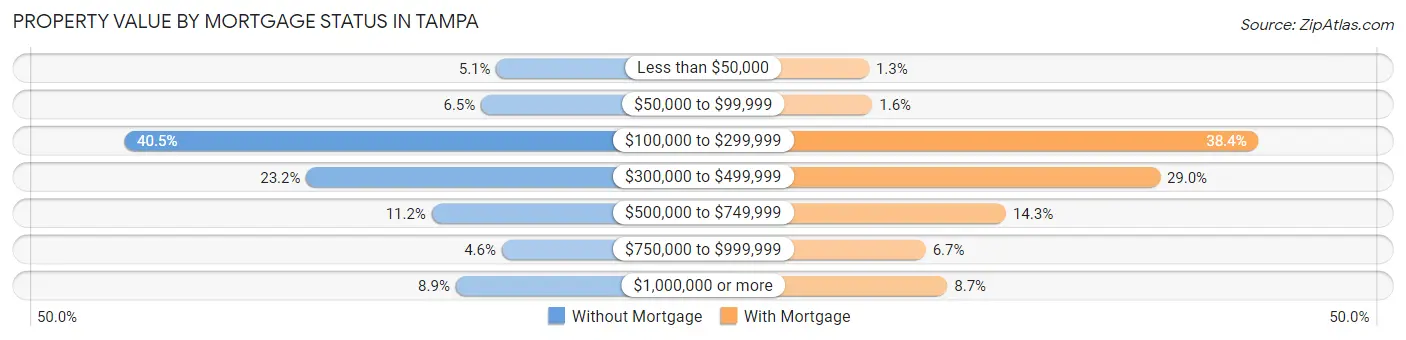
| Property Value | Without Mortgage | With Mortgage |
| Less than $50,000 | 1,401 (5.1%) | 664 (1.3%) |
| $50,000 to $99,999 | 1,801 (6.5%) | 826 (1.6%) |
| $100,000 to $299,999 | 11,196 (40.5%) | 19,839 (38.4%) |
| $300,000 to $499,999 | 6,403 (23.2%) | 14,986 (29.0%) |
| $500,000 to $749,999 | 3,102 (11.2%) | 7,405 (14.3%) |
| $750,000 to $999,999 | 1,256 (4.5%) | 3,452 (6.7%) |
| $1,000,000 or more | 2,471 (8.9%) | 4,519 (8.7%) |
| Total | 27,630 (100.0%) | 51,691 (100.0%) |
Household Income by Mortgage Status in Tampa
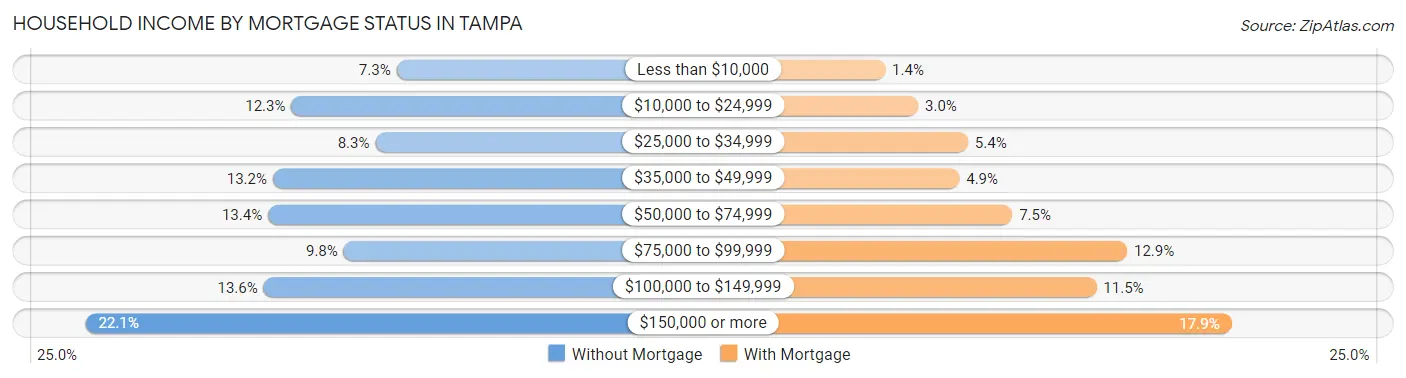
| Household Income | Without Mortgage | With Mortgage |
| Less than $10,000 | 2,013 (7.3%) | 731 (1.4%) |
| $10,000 to $24,999 | 3,398 (12.3%) | 1,538 (3.0%) |
| $25,000 to $34,999 | 2,292 (8.3%) | 2,764 (5.3%) |
| $35,000 to $49,999 | 3,642 (13.2%) | 2,552 (4.9%) |
| $50,000 to $74,999 | 3,705 (13.4%) | 3,854 (7.5%) |
| $75,000 to $99,999 | 2,711 (9.8%) | 6,684 (12.9%) |
| $100,000 to $149,999 | 3,764 (13.6%) | 5,928 (11.5%) |
| $150,000 or more | 6,105 (22.1%) | 9,251 (17.9%) |
| Total | 27,630 (100.0%) | 51,691 (100.0%) |
Property Value to Household Income Ratio in Tampa
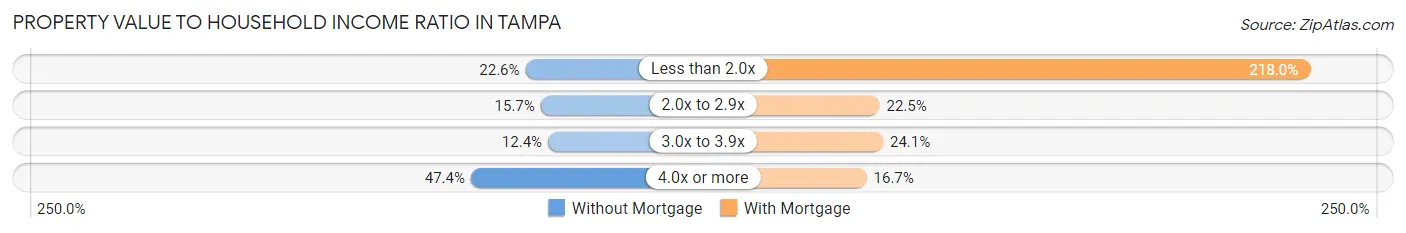
| Value-to-Income Ratio | Without Mortgage | With Mortgage |
| Less than 2.0x | 6,255 (22.6%) | 112,669 (218.0%) |
| 2.0x to 2.9x | 4,341 (15.7%) | 11,647 (22.5%) |
| 3.0x to 3.9x | 3,430 (12.4%) | 12,467 (24.1%) |
| 4.0x or more | 13,097 (47.4%) | 8,612 (16.7%) |
| Total | 27,630 (100.0%) | 51,691 (100.0%) |
Real Estate Taxes by Mortgage Status in Tampa
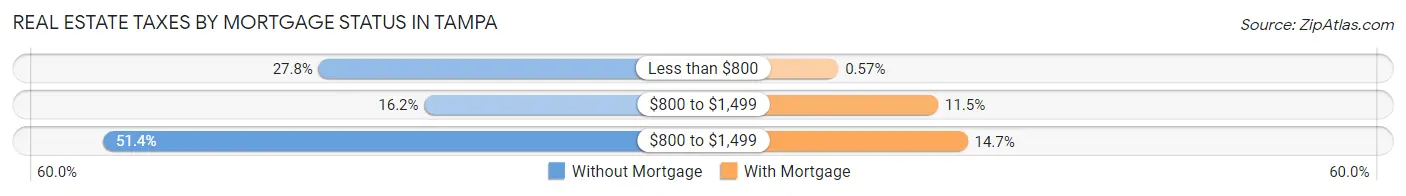
| Property Taxes | Without Mortgage | With Mortgage |
| Less than $800 | 7,672 (27.8%) | 297 (0.6%) |
| $800 to $1,499 | 4,474 (16.2%) | 5,948 (11.5%) |
| $800 to $1,499 | 14,198 (51.4%) | 7,617 (14.7%) |
| Total | 27,630 (100.0%) | 51,691 (100.0%) |
Health & Disability in Tampa
Health Insurance Coverage by Age in Tampa
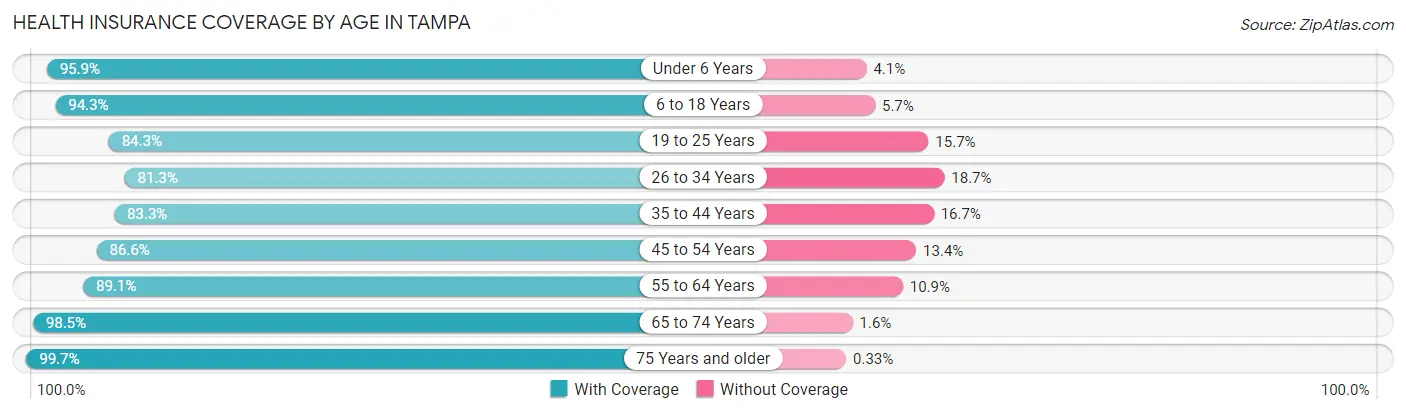
| Age Bracket | With Coverage | Without Coverage |
| Under 6 Years | 25,886 (95.9%) | 1,114 (4.1%) |
| 6 to 18 Years | 58,123 (94.3%) | 3,531 (5.7%) |
| 19 to 25 Years | 35,074 (84.3%) | 6,527 (15.7%) |
| 26 to 34 Years | 48,374 (81.3%) | 11,095 (18.7%) |
| 35 to 44 Years | 43,780 (83.3%) | 8,756 (16.7%) |
| 45 to 54 Years | 42,047 (86.6%) | 6,507 (13.4%) |
| 55 to 64 Years | 39,311 (89.1%) | 4,814 (10.9%) |
| 65 to 74 Years | 28,115 (98.5%) | 443 (1.5%) |
| 75 Years and older | 20,753 (99.7%) | 68 (0.3%) |
| Total | 341,463 (88.8%) | 42,855 (11.2%) |
Health Insurance Coverage by Citizenship Status in Tampa
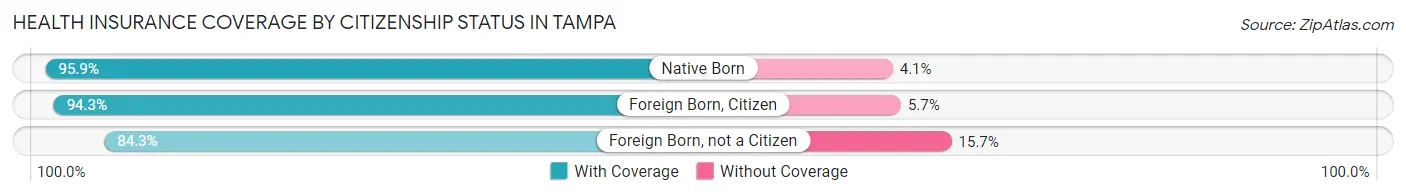
| Citizenship Status | With Coverage | Without Coverage |
| Native Born | 25,886 (95.9%) | 1,114 (4.1%) |
| Foreign Born, Citizen | 58,123 (94.3%) | 3,531 (5.7%) |
| Foreign Born, not a Citizen | 35,074 (84.3%) | 6,527 (15.7%) |
Health Insurance Coverage by Household Income in Tampa
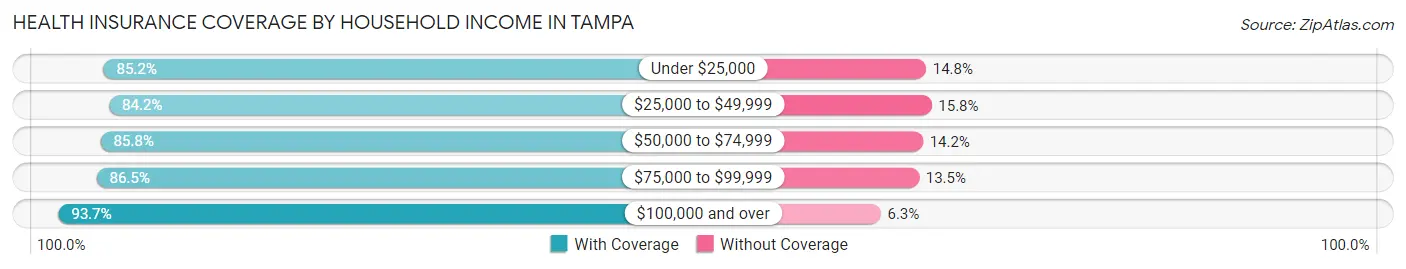
| Household Income | With Coverage | Without Coverage |
| Under $25,000 | 47,347 (85.2%) | 8,227 (14.8%) |
| $25,000 to $49,999 | 54,841 (84.2%) | 10,321 (15.8%) |
| $50,000 to $74,999 | 47,945 (85.8%) | 7,946 (14.2%) |
| $75,000 to $99,999 | 38,512 (86.5%) | 6,006 (13.5%) |
| $100,000 and over | 140,345 (93.7%) | 9,464 (6.3%) |
Public vs Private Health Insurance Coverage by Age in Tampa
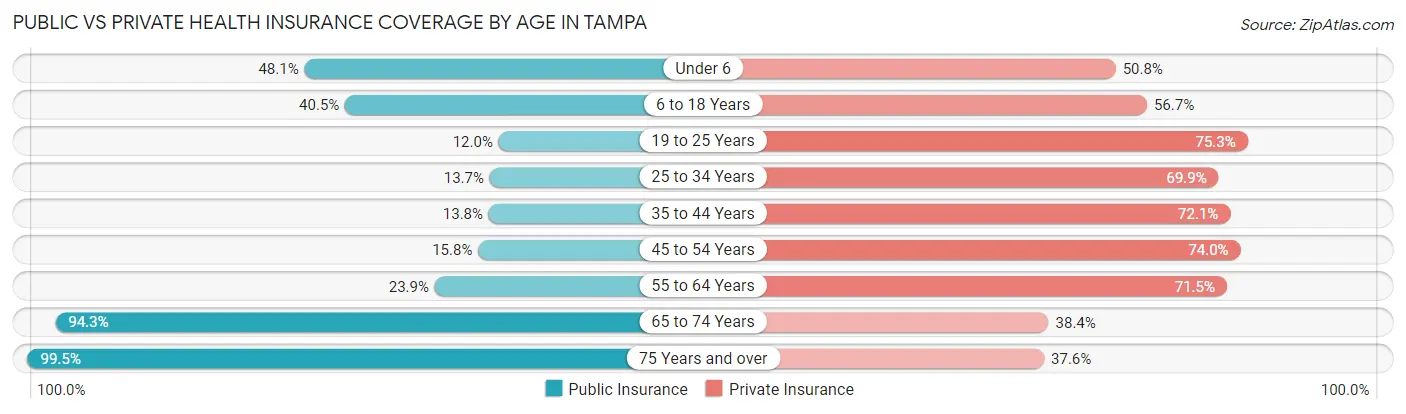
| Age Bracket | Public Insurance | Private Insurance |
| Under 6 | 12,974 (48.0%) | 13,727 (50.8%) |
| 6 to 18 Years | 24,968 (40.5%) | 34,929 (56.7%) |
| 19 to 25 Years | 4,987 (12.0%) | 31,330 (75.3%) |
| 25 to 34 Years | 8,125 (13.7%) | 41,581 (69.9%) |
| 35 to 44 Years | 7,264 (13.8%) | 37,870 (72.1%) |
| 45 to 54 Years | 7,672 (15.8%) | 35,923 (74.0%) |
| 55 to 64 Years | 10,529 (23.9%) | 31,533 (71.5%) |
| 65 to 74 Years | 26,931 (94.3%) | 10,964 (38.4%) |
| 75 Years and over | 20,706 (99.5%) | 7,819 (37.6%) |
| Total | 124,156 (32.3%) | 245,676 (63.9%) |
Disability Status by Sex by Age in Tampa
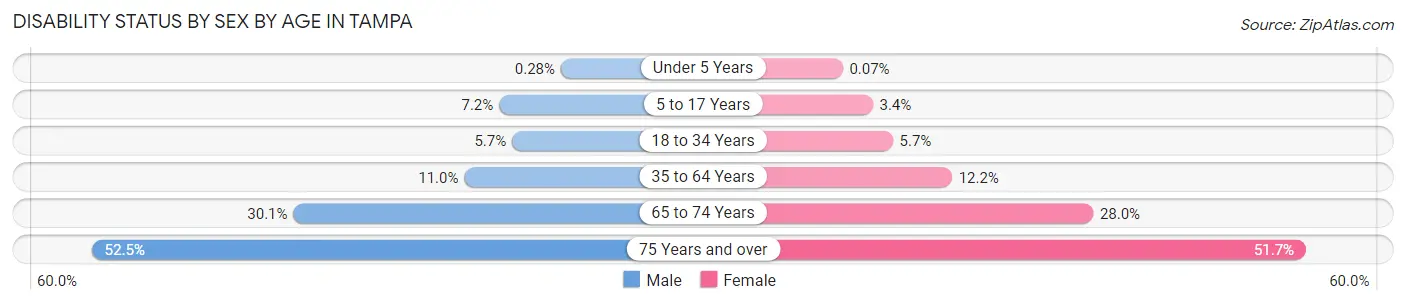
| Age Bracket | Male | Female |
| Under 5 Years | 31 (0.3%) | 8 (0.1%) |
| 5 to 17 Years | 2,175 (7.1%) | 939 (3.4%) |
| 18 to 34 Years | 3,039 (5.7%) | 3,156 (5.7%) |
| 35 to 64 Years | 8,147 (11.0%) | 8,740 (12.2%) |
| 65 to 74 Years | 4,035 (30.1%) | 4,234 (28.0%) |
| 75 Years and over | 4,583 (52.5%) | 6,252 (51.7%) |
Disability Class by Sex by Age in Tampa
Disability Class: Hearing Difficulty
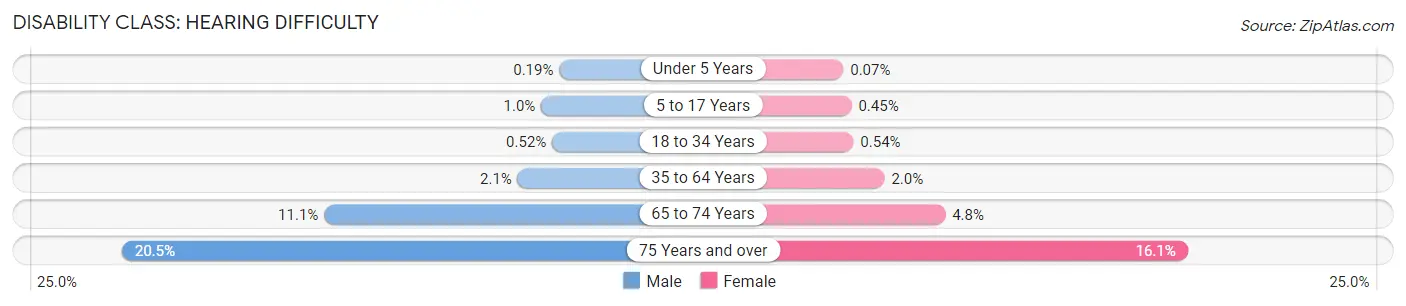
| Age Bracket | Male | Female |
| Under 5 Years | 21 (0.2%) | 8 (0.1%) |
| 5 to 17 Years | 312 (1.0%) | 125 (0.4%) |
| 18 to 34 Years | 276 (0.5%) | 302 (0.5%) |
| 35 to 64 Years | 1,567 (2.1%) | 1,412 (2.0%) |
| 65 to 74 Years | 1,490 (11.1%) | 727 (4.8%) |
| 75 Years and over | 1,788 (20.5%) | 1,942 (16.1%) |
Disability Class: Vision Difficulty
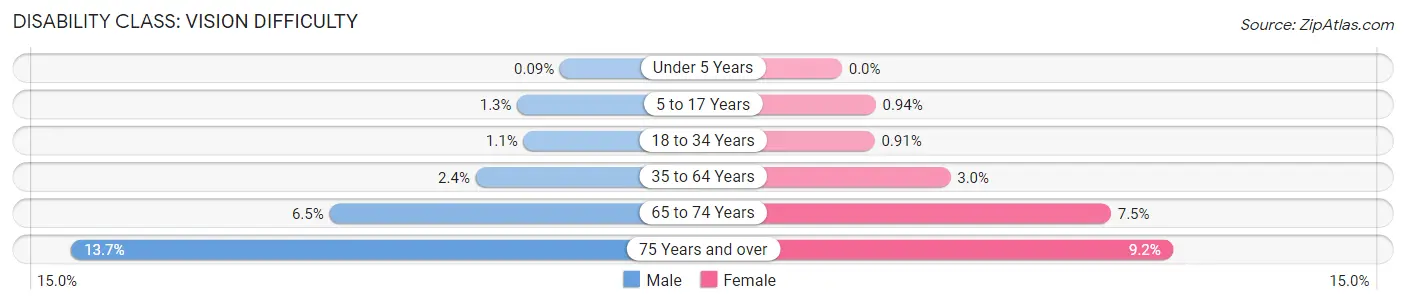
| Age Bracket | Male | Female |
| Under 5 Years | 10 (0.1%) | 0 (0.0%) |
| 5 to 17 Years | 390 (1.3%) | 257 (0.9%) |
| 18 to 34 Years | 590 (1.1%) | 505 (0.9%) |
| 35 to 64 Years | 1,799 (2.4%) | 2,156 (3.0%) |
| 65 to 74 Years | 874 (6.5%) | 1,134 (7.5%) |
| 75 Years and over | 1,195 (13.7%) | 1,114 (9.2%) |
Disability Class: Cognitive Difficulty
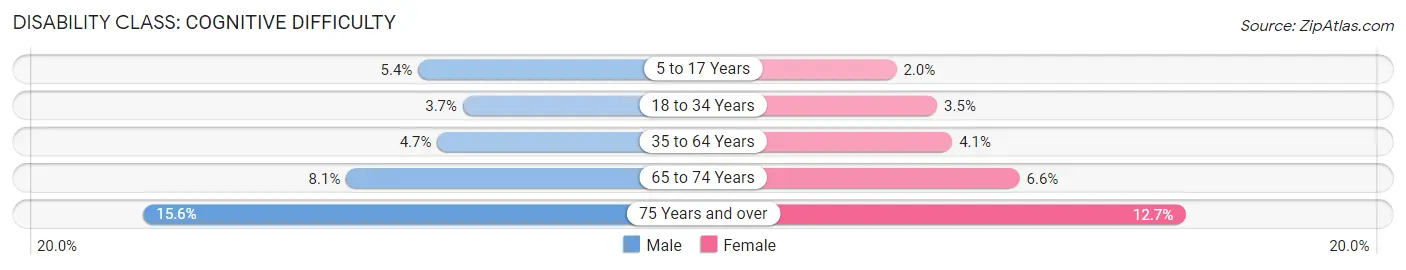
| Age Bracket | Male | Female |
| 5 to 17 Years | 1,640 (5.4%) | 559 (2.0%) |
| 18 to 34 Years | 1,986 (3.7%) | 1,972 (3.5%) |
| 35 to 64 Years | 3,452 (4.7%) | 2,930 (4.1%) |
| 65 to 74 Years | 1,081 (8.1%) | 999 (6.6%) |
| 75 Years and over | 1,360 (15.6%) | 1,541 (12.7%) |
Disability Class: Ambulatory Difficulty
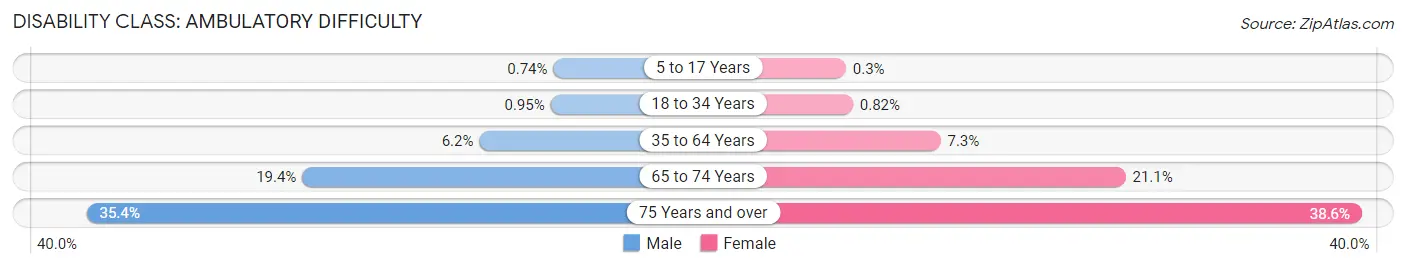
| Age Bracket | Male | Female |
| 5 to 17 Years | 224 (0.7%) | 83 (0.3%) |
| 18 to 34 Years | 506 (0.9%) | 456 (0.8%) |
| 35 to 64 Years | 4,604 (6.2%) | 5,234 (7.3%) |
| 65 to 74 Years | 2,602 (19.4%) | 3,190 (21.1%) |
| 75 Years and over | 3,089 (35.4%) | 4,670 (38.6%) |
Disability Class: Self-Care Difficulty
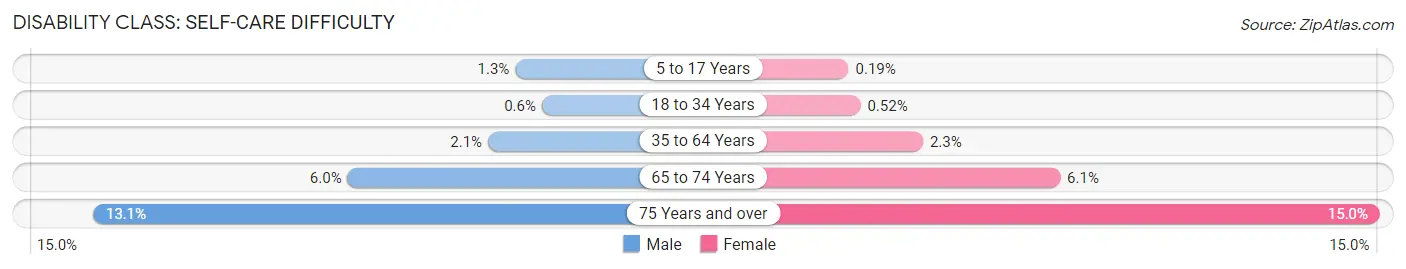
| Age Bracket | Male | Female |
| 5 to 17 Years | 407 (1.3%) | 52 (0.2%) |
| 18 to 34 Years | 320 (0.6%) | 287 (0.5%) |
| 35 to 64 Years | 1,550 (2.1%) | 1,616 (2.3%) |
| 65 to 74 Years | 807 (6.0%) | 921 (6.1%) |
| 75 Years and over | 1,143 (13.1%) | 1,812 (15.0%) |
Technology Access in Tampa
Computing Device Access in Tampa
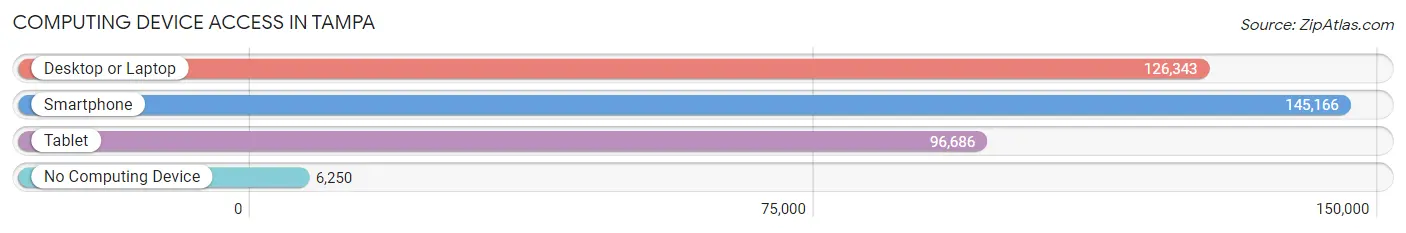
| Device Type | # Households | % Households |
| Desktop or Laptop | 126,343 | 80.4% |
| Smartphone | 145,166 | 92.4% |
| Tablet | 96,686 | 61.6% |
| No Computing Device | 6,250 | 4.0% |
| Total | 157,066 | 100.0% |
Internet Access in Tampa
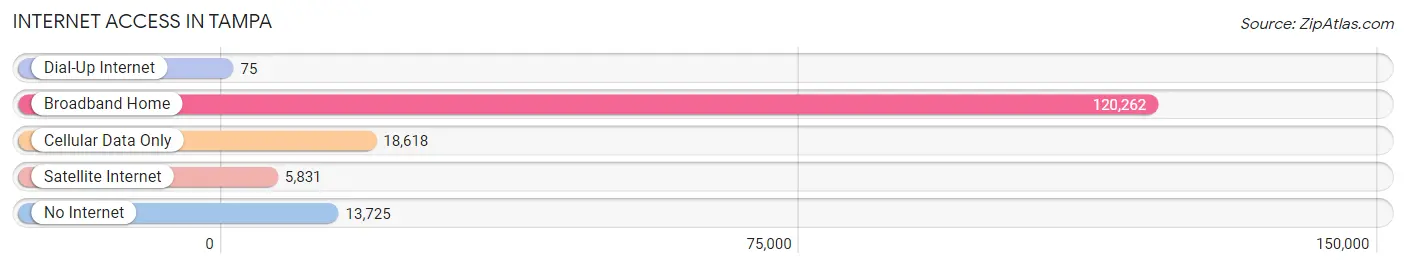
| Internet Type | # Households | % Households |
| Dial-Up Internet | 75 | 0.1% |
| Broadband Home | 120,262 | 76.6% |
| Cellular Data Only | 18,618 | 11.8% |
| Satellite Internet | 5,831 | 3.7% |
| No Internet | 13,725 | 8.7% |
| Total | 157,066 | 100.0% |
Tampa Summary
Tampa, Florida is a city located in Hillsborough County on the west coast of Florida. It is the third-largest city in the state and the largest city in the Tampa Bay Area. The city is situated on the Gulf of Mexico and is home to a diverse population of over 377,165 people.
History
Tampa was first settled by Native Americans in the late 1700s. The area was originally inhabited by the Tocobaga people, who were later displaced by the Seminole tribe. The first European settlers arrived in the area in the early 1800s, and the city was officially incorporated in 1855.
In the late 1800s, Tampa became a major port city, and the city’s economy was largely based on the cigar industry. The city was also a major hub for the phosphate industry, which was a major contributor to the city’s growth.
In the early 1900s, Tampa was a major tourist destination, and the city’s population grew rapidly. The city was also home to a large military presence, and the city’s economy was largely based on the military.
In the late 1900s, Tampa experienced a period of rapid growth and development. The city’s economy shifted from the military to tourism and technology, and the city’s population continued to grow.
Geography
Tampa is located on the west coast of Florida, on the Gulf of Mexico. The city is situated on the Hillsborough River, which flows into Tampa Bay. The city is bordered by the cities of St. Petersburg and Clearwater to the north, and Bradenton and Sarasota to the south.
The city has a humid subtropical climate, with hot, humid summers and mild winters. The average temperature in the summer is around 90°F, and the average temperature in the winter is around 70°F.
Economy
Tampa’s economy is largely based on tourism, technology, and the military. The city is home to several major corporations, including Raymond James Financial, TECO Energy, and Jabil Circuit.
The city is also home to several major universities, including the University of South Florida, the University of Tampa, and Hillsborough Community College.
The city’s port is one of the busiest in the United States, and the city is home to several major cruise lines. The city is also home to several major sports teams, including the Tampa Bay Buccaneers, the Tampa Bay Rays, and the Tampa Bay Lightning.
Demographics
As of the 2020 census, the population of Tampa was 377,165. The city is home to a diverse population, with a majority of the population being of Hispanic or Latino origin. The city is also home to a large African American population, as well as a significant population of Asian Americans.
The median household income in Tampa is $50,845, and the median home value is $219,400. The city has a poverty rate of 17.3%, and the unemployment rate is 4.2%.
Conclusion
Tampa, Florida is a vibrant city located on the west coast of Florida. The city has a rich history, and its economy is largely based on tourism, technology, and the military. The city is home to a diverse population, and it is a major port city. Tampa is a great place to live, work, and visit, and it is a great place to call home.
Common Questions
What is Per Capita Income in Tampa?
Per Capita income in Tampa is $45,586.
What is the Median Family Income in Tampa?
Median Family Income in Tampa is $84,185.
What is the Median Household income in Tampa?
Median Household Income in Tampa is $66,802.
What is Income or Wage Gap in Tampa?
Income or Wage Gap in Tampa is 25.1%.
Women in Tampa earn 74.9 cents for every dollar earned by a man.
What is Family Income Deficit in Tampa?
Family Income Deficit in Tampa is $12,091.
Families that are below poverty line in Tampa earn $12,091 less on average than the poverty threshold level.
What is Inequality or Gini Index in Tampa?
Inequality or Gini Index in Tampa is 0.54.
What is the Total Population of Tampa?
Total Population of Tampa is 388,768.
What is the Total Male Population of Tampa?
Total Male Population of Tampa is 193,981.
What is the Total Female Population of Tampa?
Total Female Population of Tampa is 194,787.
What is the Ratio of Males per 100 Females in Tampa?
There are 99.59 Males per 100 Females in Tampa.
What is the Ratio of Females per 100 Males in Tampa?
There are 100.42 Females per 100 Males in Tampa.
What is the Median Population Age in Tampa?
Median Population Age in Tampa is 35.5 Years.
What is the Average Family Size in Tampa
Average Family Size in Tampa is 3.1 People.
What is the Average Household Size in Tampa
Average Household Size in Tampa is 2.4 People.
How Large is the Labor Force in Tampa?
There are 208,879 People in the Labor Forcein in Tampa.
What is the Percentage of People in the Labor Force in Tampa?
66.0% of People are in the Labor Force in Tampa.
What is the Unemployment Rate in Tampa?
Unemployment Rate in Tampa is 5.2%.