Nashua, NH Map & Demographics
Nashua Map
Nashua Overview
$48,083
PER CAPITA INCOME
$109,271
AVG FAMILY INCOME
$88,766
AVG HOUSEHOLD INCOME
31.4%
WAGE / INCOME GAP [ % ]
68.6¢/ $1
WAGE / INCOME GAP [ $ ]
$11,377
FAMILY INCOME DEFICIT
0.43
INEQUALITY / GINI INDEX
90,943
TOTAL POPULATION
46,635
MALE POPULATION
44,308
FEMALE POPULATION
105.25
MALES / 100 FEMALES
95.01
FEMALES / 100 MALES
40.1
MEDIAN AGE
3.0
AVG FAMILY SIZE
2.4
AVG HOUSEHOLD SIZE
54,364
LABOR FORCE [ PEOPLE ]
71.7%
PERCENT IN LABOR FORCE
5.1%
UNEMPLOYMENT RATE
Nashua Area Codes
Income in Nashua
Income Overview in Nashua
Per Capita Income in Nashua is $48,083, while median incomes of families and households are $109,271 and $88,766 respectively.
| Characteristic | Number | Measure |
| Per Capita Income | 90,943 | $48,083 |
| Median Family Income | 22,240 | $109,271 |
| Mean Family Income | 22,240 | $134,167 |
| Median Household Income | 37,478 | $88,766 |
| Mean Household Income | 37,478 | $112,635 |
| Income Deficit | 22,240 | $11,377 |
| Wage / Income Gap (%) | 90,943 | 31.37% |
| Wage / Income Gap ($) | 90,943 | 68.63¢ per $1 |
| Gini / Inequality Index | 90,943 | 0.43 |
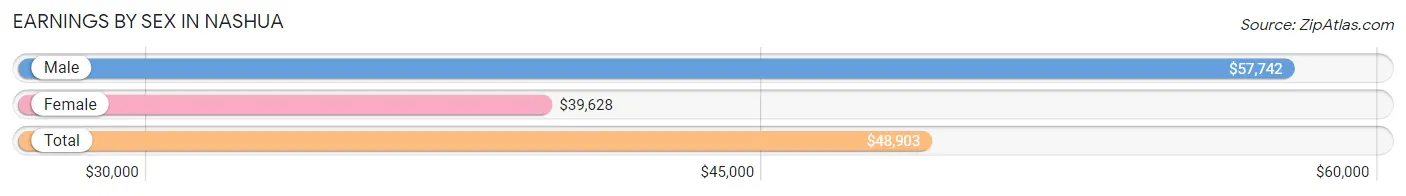
Earnings by Sex in Nashua
Average Earnings in Nashua are $48,903, $57,742 for men and $39,628 for women, a difference of 31.4%.
| Sex | Number | Average Earnings |
| Male | 30,559 (54.3%) | $57,742 |
| Female | 25,664 (45.7%) | $39,628 |
| Total | 56,223 (100.0%) | $48,903 |
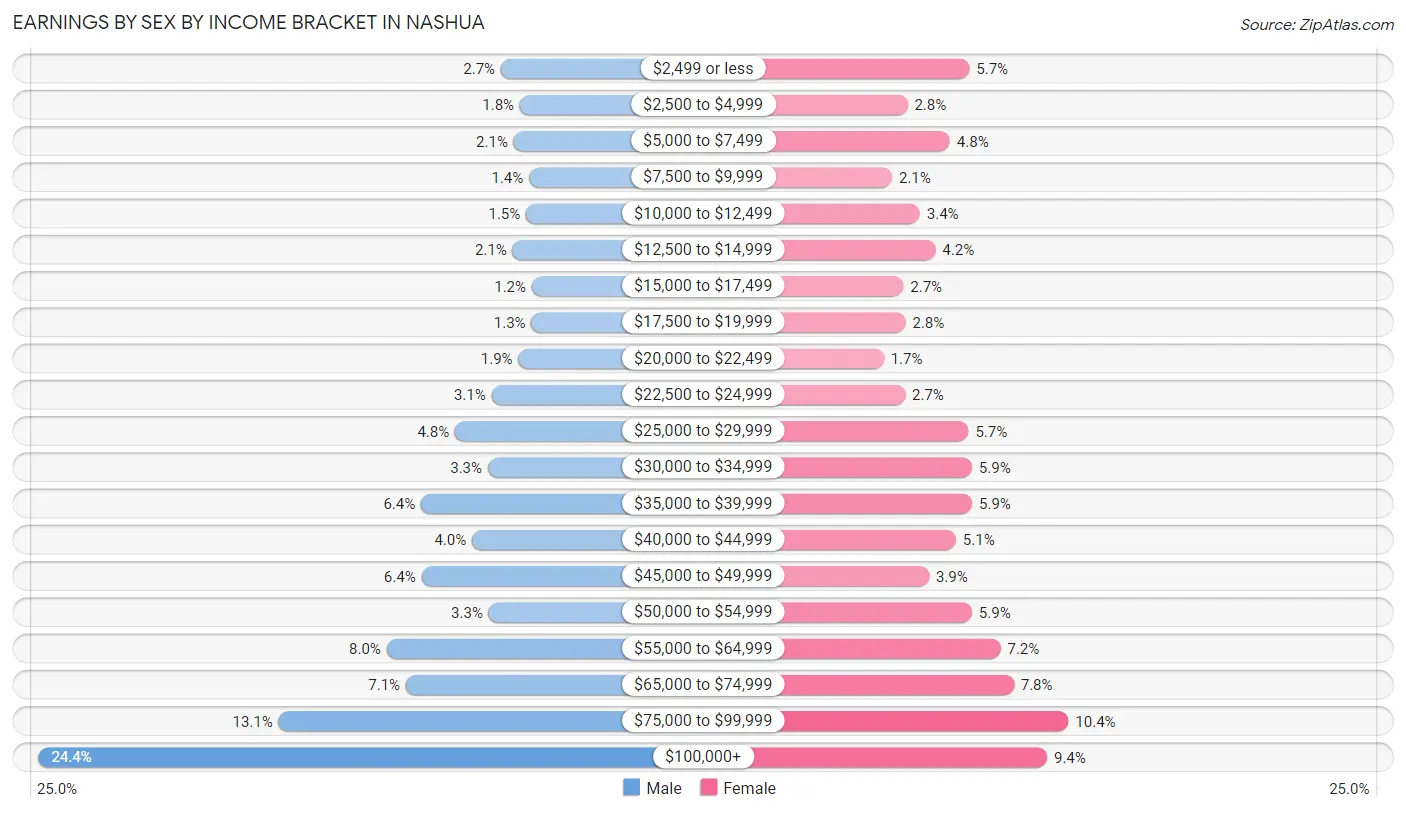
Earnings by Sex by Income Bracket in Nashua
The most common earnings brackets in Nashua are $100,000+ for men (7,440 | 24.3%) and $75,000 to $99,999 for women (2,663 | 10.4%).
| Income | Male | Female |
| $2,499 or less | 823 (2.7%) | 1,472 (5.7%) |
| $2,500 to $4,999 | 549 (1.8%) | 728 (2.8%) |
| $5,000 to $7,499 | 638 (2.1%) | 1,240 (4.8%) |
| $7,500 to $9,999 | 418 (1.4%) | 545 (2.1%) |
| $10,000 to $12,499 | 460 (1.5%) | 878 (3.4%) |
| $12,500 to $14,999 | 654 (2.1%) | 1,066 (4.2%) |
| $15,000 to $17,499 | 379 (1.2%) | 681 (2.6%) |
| $17,500 to $19,999 | 386 (1.3%) | 707 (2.8%) |
| $20,000 to $22,499 | 570 (1.9%) | 445 (1.7%) |
| $22,500 to $24,999 | 958 (3.1%) | 701 (2.7%) |
| $25,000 to $29,999 | 1,478 (4.8%) | 1,464 (5.7%) |
| $30,000 to $34,999 | 1,009 (3.3%) | 1,504 (5.9%) |
| $35,000 to $39,999 | 1,965 (6.4%) | 1,506 (5.9%) |
| $40,000 to $44,999 | 1,235 (4.0%) | 1,312 (5.1%) |
| $45,000 to $49,999 | 1,958 (6.4%) | 988 (3.8%) |
| $50,000 to $54,999 | 997 (3.3%) | 1,503 (5.9%) |
| $55,000 to $64,999 | 2,456 (8.0%) | 1,848 (7.2%) |
| $65,000 to $74,999 | 2,182 (7.1%) | 2,006 (7.8%) |
| $75,000 to $99,999 | 4,004 (13.1%) | 2,663 (10.4%) |
| $100,000+ | 7,440 (24.3%) | 2,407 (9.4%) |
| Total | 30,559 (100.0%) | 25,664 (100.0%) |
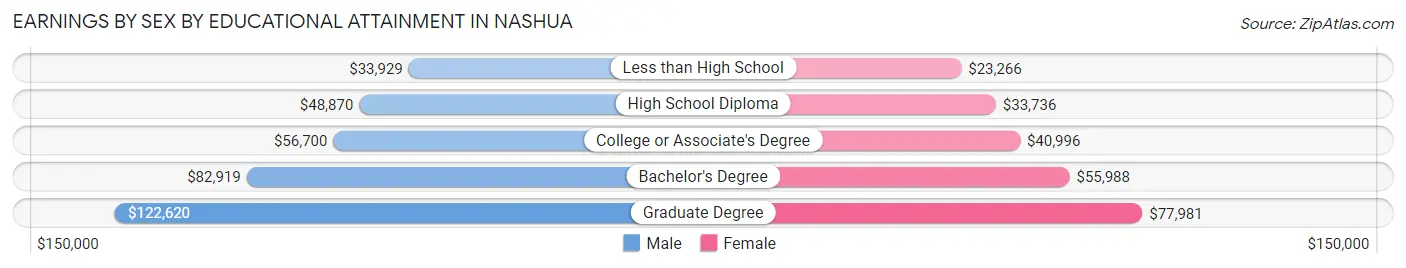
Earnings by Sex by Educational Attainment in Nashua
Average earnings in Nashua are $64,464 for men and $45,532 for women, a difference of 29.4%. Men with an educational attainment of graduate degree enjoy the highest average annual earnings of $122,620, while those with less than high school education earn the least with $33,929. Women with an educational attainment of graduate degree earn the most with the average annual earnings of $77,981, while those with less than high school education have the smallest earnings of $23,266.
| Educational Attainment | Male Income | Female Income |
| Less than High School | $33,929 | $23,266 |
| High School Diploma | $48,870 | $33,736 |
| College or Associate's Degree | $56,700 | $40,996 |
| Bachelor's Degree | $82,919 | $55,988 |
| Graduate Degree | $122,620 | $77,981 |
| Total | $64,464 | $45,532 |
Family Income in Nashua
Family Income Brackets in Nashua
According to the Nashua family income data, there are 5,026 families falling into the $100,000 to $149,999 income range, which is the most common income bracket and makes up 22.6% of all families. Conversely, the $10,000 to $14,999 income bracket is the least frequent group with only 245 families (1.1%) belonging to this category.
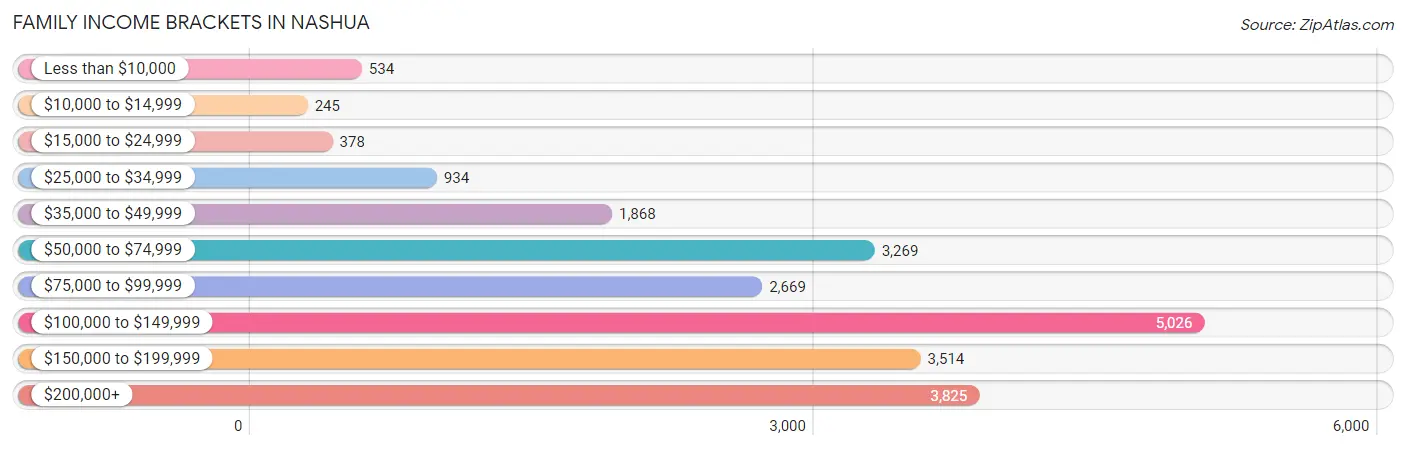
| Income Bracket | # Families | % Families |
| Less than $10,000 | 534 | 2.4% |
| $10,000 to $14,999 | 245 | 1.1% |
| $15,000 to $24,999 | 378 | 1.7% |
| $25,000 to $34,999 | 934 | 4.2% |
| $35,000 to $49,999 | 1,868 | 8.4% |
| $50,000 to $74,999 | 3,269 | 14.7% |
| $75,000 to $99,999 | 2,669 | 12.0% |
| $100,000 to $149,999 | 5,026 | 22.6% |
| $150,000 to $199,999 | 3,514 | 15.8% |
| $200,000+ | 3,825 | 17.2% |
Family Income by Famaliy Size in Nashua
7+ person families (260 | 1.2%) account for the highest median family income in Nashua with $231,699 per family, while 2-person families (11,045 | 49.7%) have the highest median income of $46,677 per family member.
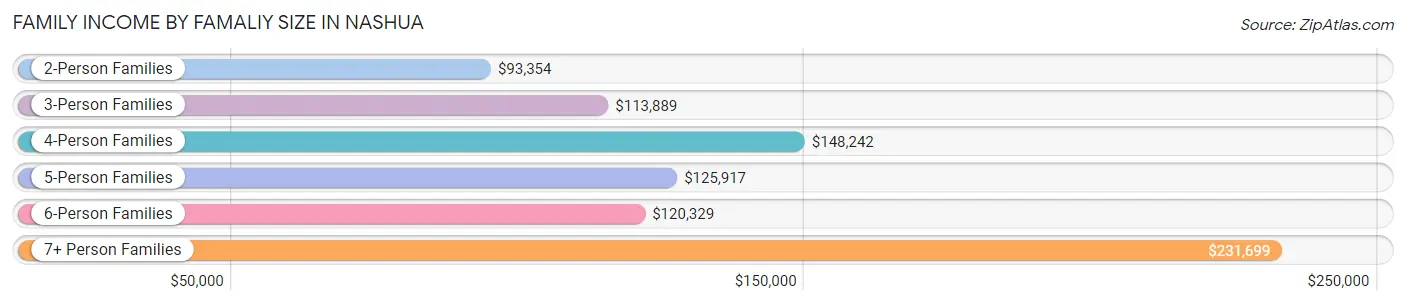
| Income Bracket | # Families | Median Income |
| 2-Person Families | 11,045 (49.7%) | $93,354 |
| 3-Person Families | 5,392 (24.2%) | $113,889 |
| 4-Person Families | 3,343 (15.0%) | $148,242 |
| 5-Person Families | 1,567 (7.0%) | $125,917 |
| 6-Person Families | 633 (2.9%) | $120,329 |
| 7+ Person Families | 260 (1.2%) | $231,699 |
| Total | 22,240 (100.0%) | $109,271 |
Family Income by Number of Earners in Nashua
The median family income in Nashua is $109,271, with families comprising 3+ earners (3,397) having the highest median family income of $168,677, while families with no earners (2,494) have the lowest median family income of $60,714, accounting for 15.3% and 11.2% of families, respectively.
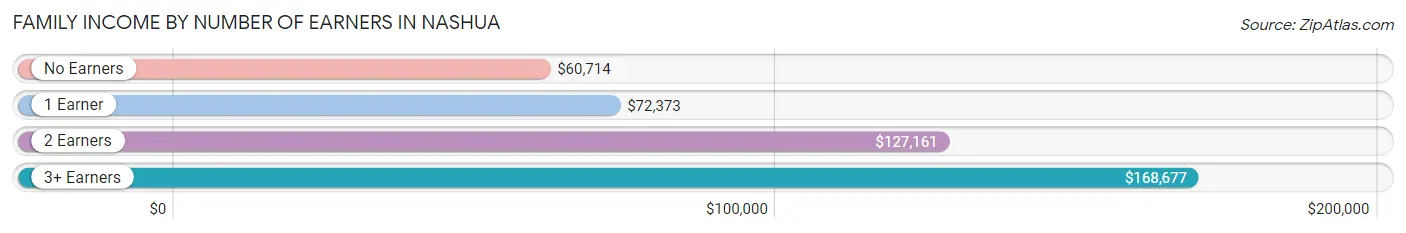
| Number of Earners | # Families | Median Income |
| No Earners | 2,494 (11.2%) | $60,714 |
| 1 Earner | 6,591 (29.6%) | $72,373 |
| 2 Earners | 9,758 (43.9%) | $127,161 |
| 3+ Earners | 3,397 (15.3%) | $168,677 |
| Total | 22,240 (100.0%) | $109,271 |
Household Income in Nashua
Household Income Brackets in Nashua
With 7,271 households falling in the category, the $100,000 to $149,999 income range is the most frequent in Nashua, accounting for 19.4% of all households. In contrast, only 1,012 households (2.7%) fall into the $10,000 to $14,999 income bracket, making it the least populous group.
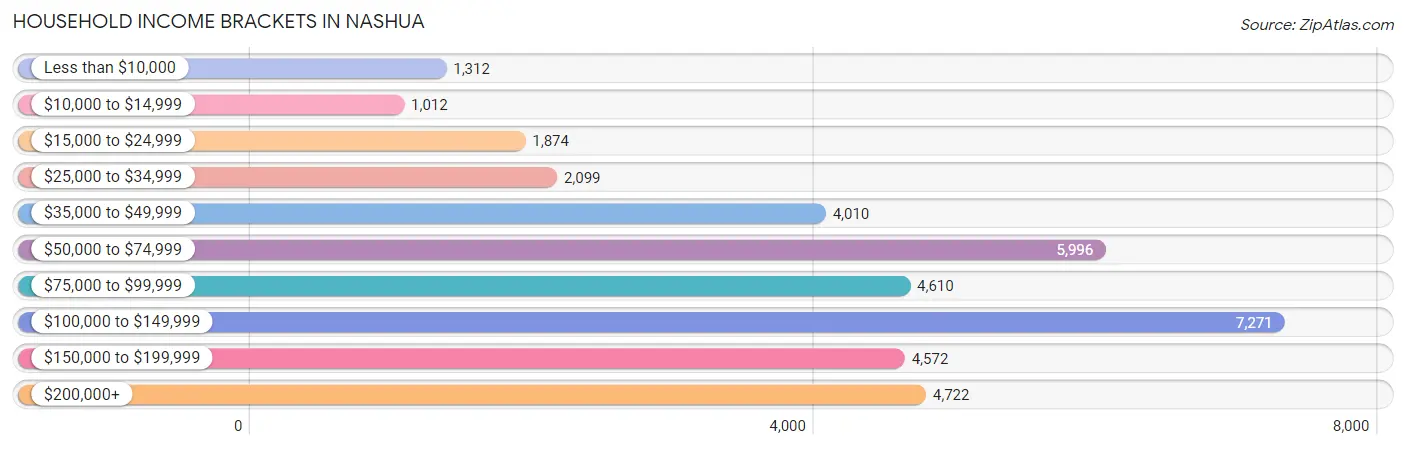
| Income Bracket | # Households | % Households |
| Less than $10,000 | 1,312 | 3.5% |
| $10,000 to $14,999 | 1,012 | 2.7% |
| $15,000 to $24,999 | 1,874 | 5.0% |
| $25,000 to $34,999 | 2,099 | 5.6% |
| $35,000 to $49,999 | 4,010 | 10.7% |
| $50,000 to $74,999 | 5,996 | 16.0% |
| $75,000 to $99,999 | 4,610 | 12.3% |
| $100,000 to $149,999 | 7,271 | 19.4% |
| $150,000 to $199,999 | 4,572 | 12.2% |
| $200,000+ | 4,722 | 12.6% |
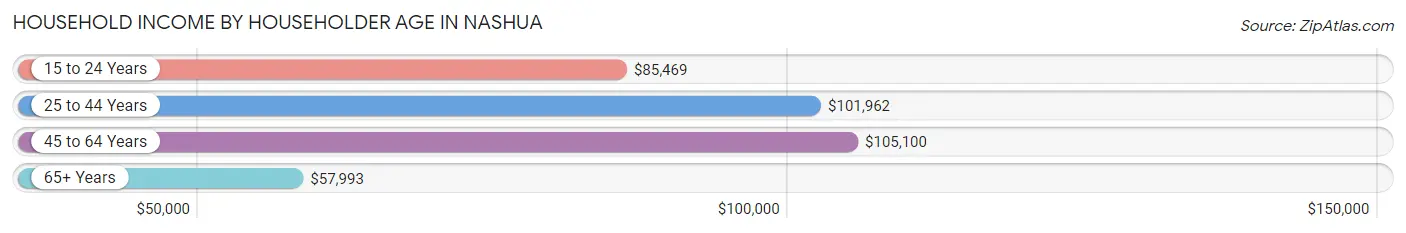
Household Income by Householder Age in Nashua
The median household income in Nashua is $88,766, with the highest median household income of $105,100 found in the 45 to 64 years age bracket for the primary householder. A total of 14,092 households (37.6%) fall into this category. Meanwhile, the 65+ years age bracket for the primary householder has the lowest median household income of $57,993, with 9,784 households (26.1%) in this group.
| Income Bracket | # Households | Median Income |
| 15 to 24 Years | 1,062 (2.8%) | $85,469 |
| 25 to 44 Years | 12,540 (33.5%) | $101,962 |
| 45 to 64 Years | 14,092 (37.6%) | $105,100 |
| 65+ Years | 9,784 (26.1%) | $57,993 |
| Total | 37,478 (100.0%) | $88,766 |
Poverty in Nashua
Income Below Poverty by Sex and Age in Nashua
With 7.1% poverty level for males and 8.2% for females among the residents of Nashua, 12 to 14 year old males and 75 year old and over females are the most vulnerable to poverty, with 254 males (19.8%) and 405 females (12.0%) in their respective age groups living below the poverty level.
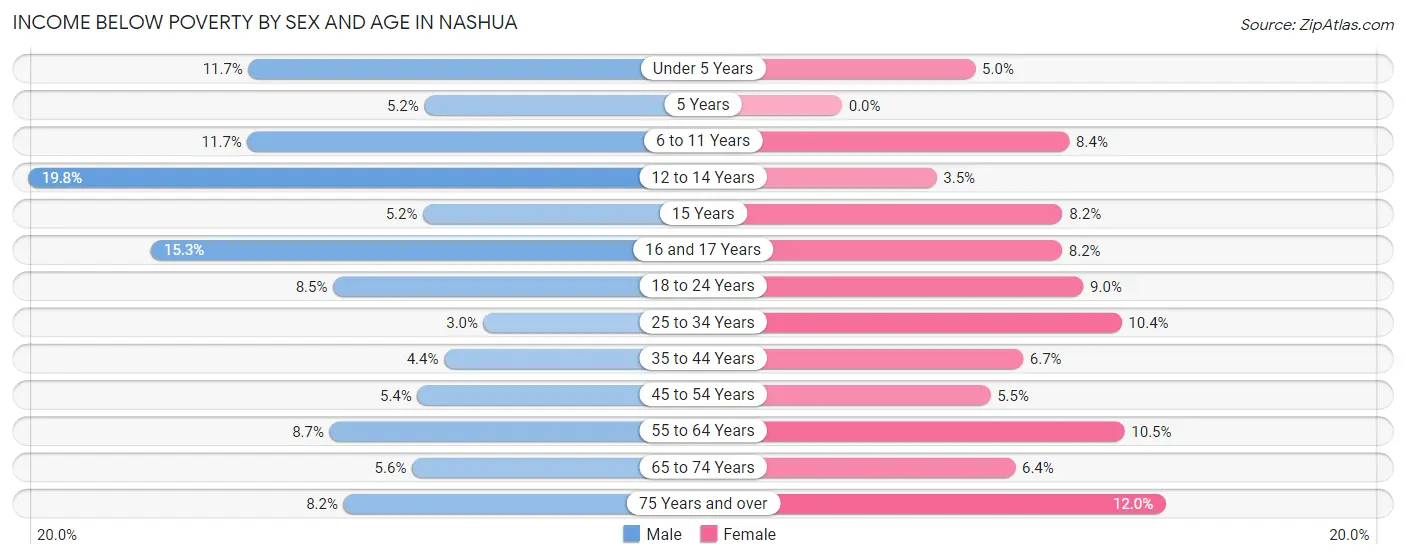
| Age Bracket | Male | Female |
| Under 5 Years | 318 (11.7%) | 117 (5.0%) |
| 5 Years | 22 (5.1%) | 0 (0.0%) |
| 6 to 11 Years | 324 (11.7%) | 216 (8.4%) |
| 12 to 14 Years | 254 (19.8%) | 50 (3.5%) |
| 15 Years | 21 (5.2%) | 37 (8.2%) |
| 16 and 17 Years | 167 (15.3%) | 71 (8.2%) |
| 18 to 24 Years | 324 (8.5%) | 277 (9.0%) |
| 25 to 34 Years | 248 (2.9%) | 727 (10.4%) |
| 35 to 44 Years | 275 (4.4%) | 332 (6.7%) |
| 45 to 54 Years | 344 (5.4%) | 303 (5.5%) |
| 55 to 64 Years | 542 (8.7%) | 713 (10.5%) |
| 65 to 74 Years | 232 (5.6%) | 305 (6.4%) |
| 75 Years and over | 185 (8.2%) | 405 (12.0%) |
| Total | 3,256 (7.1%) | 3,553 (8.2%) |
Income Above Poverty by Sex and Age in Nashua
According to the poverty statistics in Nashua, males aged 25 to 34 years and females aged 5 years are the age groups that are most secure financially, with 97.1% of males and 100.0% of females in these age groups living above the poverty line.
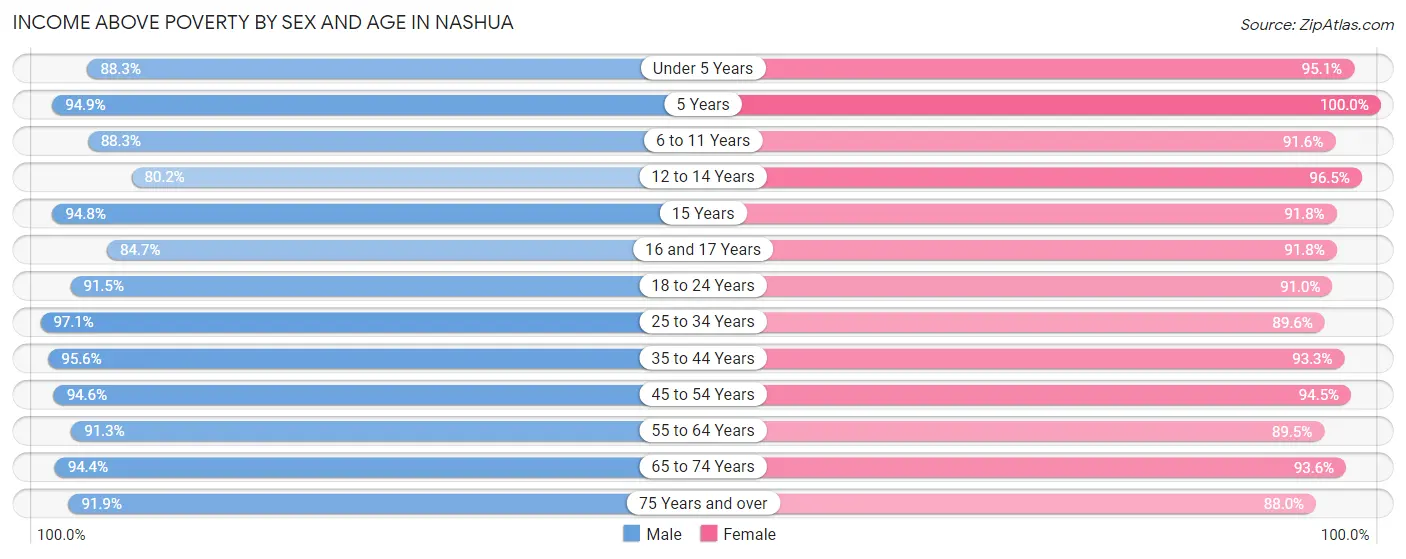
| Age Bracket | Male | Female |
| Under 5 Years | 2,405 (88.3%) | 2,246 (95.1%) |
| 5 Years | 405 (94.9%) | 453 (100.0%) |
| 6 to 11 Years | 2,440 (88.3%) | 2,344 (91.6%) |
| 12 to 14 Years | 1,026 (80.2%) | 1,374 (96.5%) |
| 15 Years | 383 (94.8%) | 415 (91.8%) |
| 16 and 17 Years | 924 (84.7%) | 798 (91.8%) |
| 18 to 24 Years | 3,471 (91.5%) | 2,814 (91.0%) |
| 25 to 34 Years | 8,157 (97.1%) | 6,275 (89.6%) |
| 35 to 44 Years | 5,944 (95.6%) | 4,609 (93.3%) |
| 45 to 54 Years | 6,013 (94.6%) | 5,197 (94.5%) |
| 55 to 64 Years | 5,709 (91.3%) | 6,087 (89.5%) |
| 65 to 74 Years | 3,902 (94.4%) | 4,442 (93.6%) |
| 75 Years and over | 2,086 (91.8%) | 2,971 (88.0%) |
| Total | 42,865 (92.9%) | 40,025 (91.8%) |
Income Below Poverty Among Married-Couple Families in Nashua
The poverty statistics for married-couple families in Nashua show that 2.3% or 381 of the total 16,333 families live below the poverty line. Families with 3 or 4 children have the highest poverty rate of 3.5%, comprising of 33 families. On the other hand, families with 5 or more children have the lowest poverty rate of 0.0%, which includes 0 families.
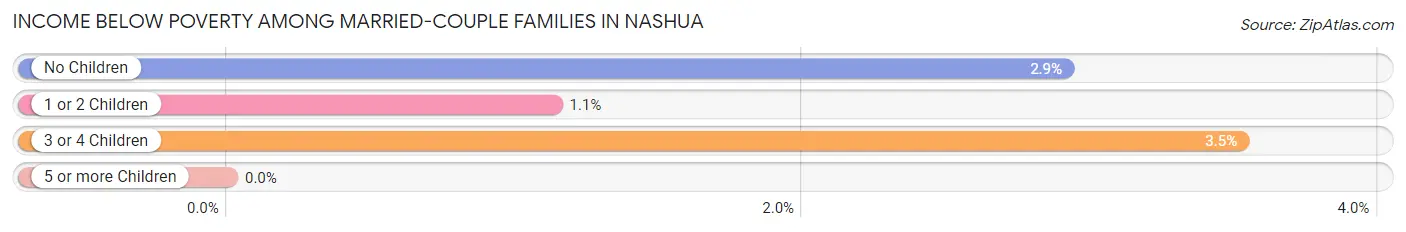
| Children | Above Poverty | Below Poverty |
| No Children | 9,497 (97.1%) | 285 (2.9%) |
| 1 or 2 Children | 5,503 (98.9%) | 63 (1.1%) |
| 3 or 4 Children | 905 (96.5%) | 33 (3.5%) |
| 5 or more Children | 47 (100.0%) | 0 (0.0%) |
| Total | 15,952 (97.7%) | 381 (2.3%) |
Income Below Poverty Among Single-Parent Households in Nashua
According to the poverty data in Nashua, 7.2% or 140 single-father households and 14.0% or 554 single-mother households are living below the poverty line. Among single-father households, those with 3 or 4 children have the highest poverty rate, with 13 households (56.5%) experiencing poverty. Likewise, among single-mother households, those with 3 or 4 children have the highest poverty rate, with 148 households (53.4%) falling below the poverty line.
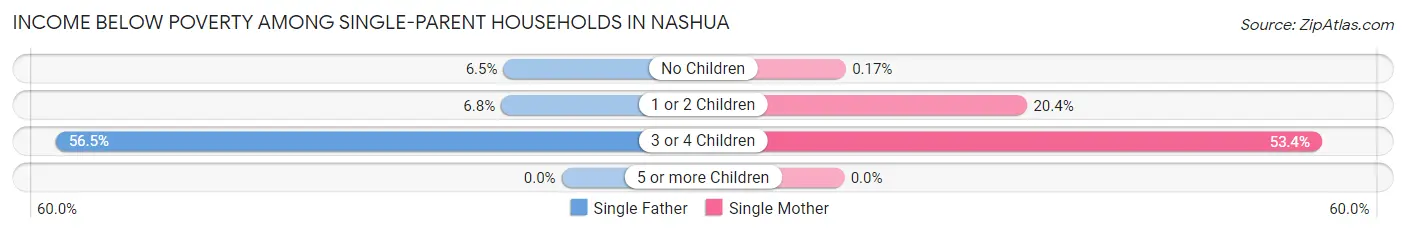
| Children | Single Father | Single Mother |
| No Children | 62 (6.5%) | 3 (0.2%) |
| 1 or 2 Children | 65 (6.8%) | 403 (20.4%) |
| 3 or 4 Children | 13 (56.5%) | 148 (53.4%) |
| 5 or more Children | 0 (0.0%) | 0 (0.0%) |
| Total | 140 (7.2%) | 554 (14.0%) |
Income Below Poverty Among Married-Couple vs Single-Parent Households in Nashua
The poverty data for Nashua shows that 381 of the married-couple family households (2.3%) and 694 of the single-parent households (11.7%) are living below the poverty level. Within the married-couple family households, those with 3 or 4 children have the highest poverty rate, with 33 households (3.5%) falling below the poverty line. Among the single-parent households, those with 3 or 4 children have the highest poverty rate, with 161 household (53.7%) living below poverty.
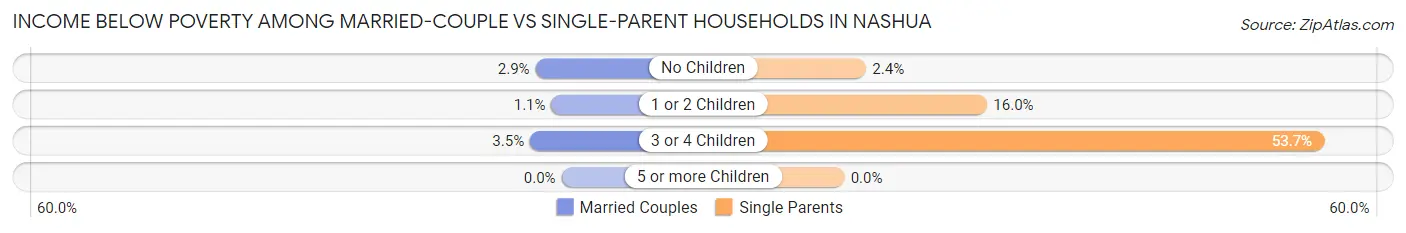
| Children | Married-Couple Families | Single-Parent Households |
| No Children | 285 (2.9%) | 65 (2.4%) |
| 1 or 2 Children | 63 (1.1%) | 468 (16.0%) |
| 3 or 4 Children | 33 (3.5%) | 161 (53.7%) |
| 5 or more Children | 0 (0.0%) | 0 (0.0%) |
| Total | 381 (2.3%) | 694 (11.7%) |
Race in Nashua
The most populous races in Nashua are White / Caucasian (70,763 | 77.8%), Hispanic or Latino (11,948 | 13.1%), and Two or more Races (8,153 | 9.0%).
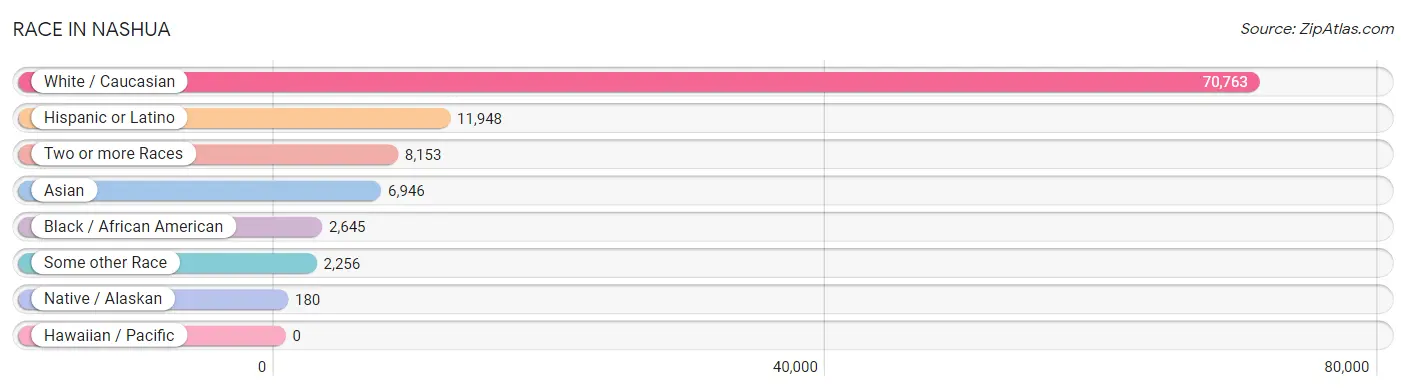
| Race | # Population | % Population |
| Asian | 6,946 | 7.6% |
| Black / African American | 2,645 | 2.9% |
| Hawaiian / Pacific | 0 | 0.0% |
| Hispanic or Latino | 11,948 | 13.1% |
| Native / Alaskan | 180 | 0.2% |
| White / Caucasian | 70,763 | 77.8% |
| Two or more Races | 8,153 | 9.0% |
| Some other Race | 2,256 | 2.5% |
| Total | 90,943 | 100.0% |
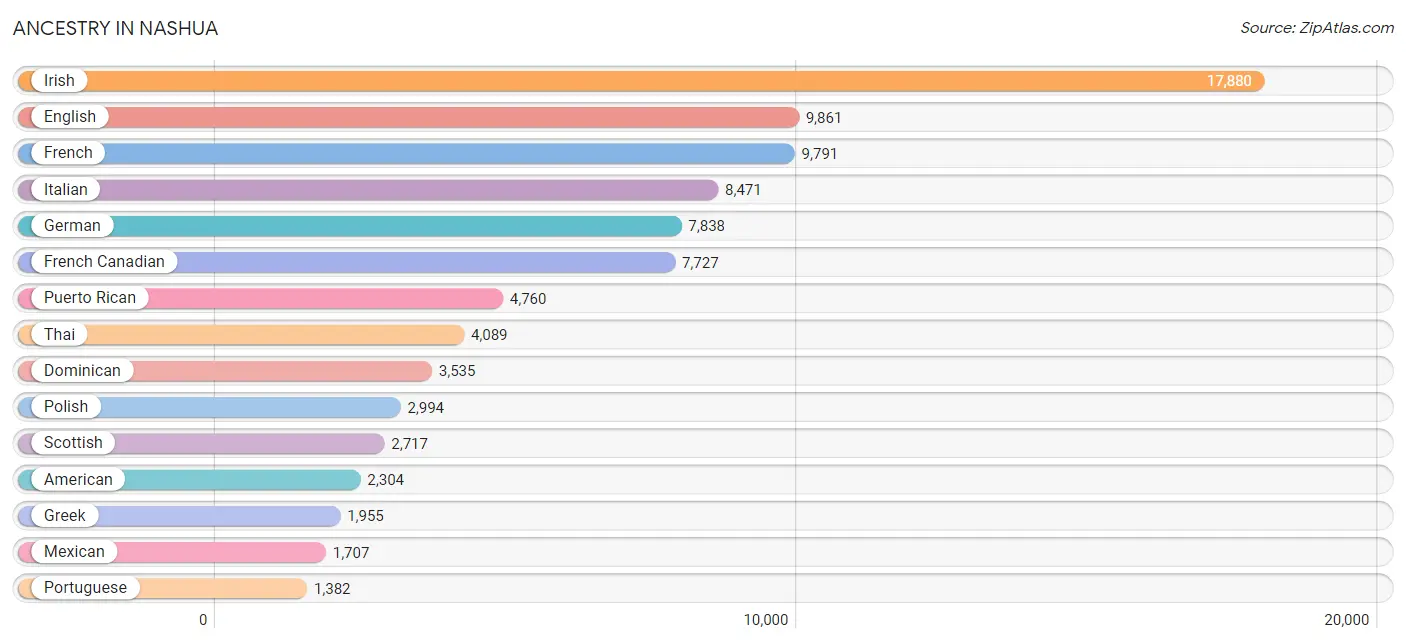
Ancestry in Nashua
The most populous ancestries reported in Nashua are Irish (17,880 | 19.7%), English (9,861 | 10.8%), French (9,791 | 10.8%), Italian (8,471 | 9.3%), and German (7,838 | 8.6%), together accounting for 59.2% of all Nashua residents.
| Ancestry | # Population | % Population |
| African | 122 | 0.1% |
| Albanian | 29 | 0.0% |
| American | 2,304 | 2.5% |
| Arab | 641 | 0.7% |
| Armenian | 251 | 0.3% |
| Austrian | 84 | 0.1% |
| Bahamian | 1 | 0.0% |
| Belgian | 75 | 0.1% |
| Bhutanese | 266 | 0.3% |
| Blackfeet | 97 | 0.1% |
| Brazilian | 843 | 0.9% |
| British | 206 | 0.2% |
| British West Indian | 16 | 0.0% |
| Bulgarian | 23 | 0.0% |
| Burmese | 236 | 0.3% |
| Cajun | 26 | 0.0% |
| Canadian | 676 | 0.7% |
| Cape Verdean | 160 | 0.2% |
| Celtic | 23 | 0.0% |
| Central American | 616 | 0.7% |
| Central American Indian | 99 | 0.1% |
| Cherokee | 46 | 0.1% |
| Chilean | 28 | 0.0% |
| Chippewa | 47 | 0.1% |
| Colombian | 547 | 0.6% |
| Costa Rican | 24 | 0.0% |
| Cuban | 282 | 0.3% |
| Czech | 229 | 0.3% |
| Czechoslovakian | 24 | 0.0% |
| Danish | 175 | 0.2% |
| Dominican | 3,535 | 3.9% |
| Dutch | 506 | 0.6% |
| Eastern European | 312 | 0.3% |
| Ecuadorian | 33 | 0.0% |
| Egyptian | 34 | 0.0% |
| English | 9,861 | 10.8% |
| Ethiopian | 165 | 0.2% |
| European | 1,048 | 1.1% |
| Filipino | 11 | 0.0% |
| Finnish | 303 | 0.3% |
| French | 9,791 | 10.8% |
| French Canadian | 7,727 | 8.5% |
| German | 7,838 | 8.6% |
| Ghanaian | 56 | 0.1% |
| Greek | 1,955 | 2.1% |
| Guatemalan | 128 | 0.1% |
| Haitian | 165 | 0.2% |
| Honduran | 371 | 0.4% |
| Hungarian | 398 | 0.4% |
| Icelander | 29 | 0.0% |
| Indian (Asian) | 1,254 | 1.4% |
| Indonesian | 324 | 0.4% |
| Iranian | 92 | 0.1% |
| Irish | 17,880 | 19.7% |
| Iroquois | 48 | 0.1% |
| Italian | 8,471 | 9.3% |
| Jamaican | 320 | 0.4% |
| Japanese | 251 | 0.3% |
| Jordanian | 25 | 0.0% |
| Kenyan | 371 | 0.4% |
| Korean | 497 | 0.5% |
| Laotian | 23 | 0.0% |
| Latvian | 93 | 0.1% |
| Lebanese | 140 | 0.2% |
| Liberian | 59 | 0.1% |
| Lithuanian | 704 | 0.8% |
| Malaysian | 49 | 0.1% |
| Mexican | 1,707 | 1.9% |
| Mexican American Indian | 22 | 0.0% |
| Mongolian | 16 | 0.0% |
| Moroccan | 291 | 0.3% |
| Navajo | 15 | 0.0% |
| Northern European | 222 | 0.2% |
| Norwegian | 499 | 0.5% |
| Pakistani | 53 | 0.1% |
| Palestinian | 49 | 0.1% |
| Pennsylvania German | 28 | 0.0% |
| Peruvian | 24 | 0.0% |
| Polish | 2,994 | 3.3% |
| Portuguese | 1,382 | 1.5% |
| Puerto Rican | 4,760 | 5.2% |
| Romanian | 126 | 0.1% |
| Russian | 536 | 0.6% |
| Salvadoran | 93 | 0.1% |
| Scandinavian | 93 | 0.1% |
| Scotch-Irish | 589 | 0.6% |
| Scottish | 2,717 | 3.0% |
| Seminole | 23 | 0.0% |
| Slavic | 34 | 0.0% |
| Slovak | 48 | 0.1% |
| Slovene | 21 | 0.0% |
| South American | 715 | 0.8% |
| South American Indian | 20 | 0.0% |
| Spaniard | 133 | 0.2% |
| Spanish | 137 | 0.2% |
| Sri Lankan | 672 | 0.7% |
| Subsaharan African | 1,094 | 1.2% |
| Swedish | 687 | 0.8% |
| Swiss | 98 | 0.1% |
| Syrian | 91 | 0.1% |
| Thai | 4,089 | 4.5% |
| Trinidadian and Tobagonian | 10 | 0.0% |
| Turkish | 54 | 0.1% |
| U.S. Virgin Islander | 9 | 0.0% |
| Ukrainian | 271 | 0.3% |
| Uruguayan | 25 | 0.0% |
| Venezuelan | 41 | 0.1% |
| Welsh | 426 | 0.5% |
| West Indian | 10 | 0.0% |
| Yugoslavian | 10 | 0.0% | View All 110 Rows |
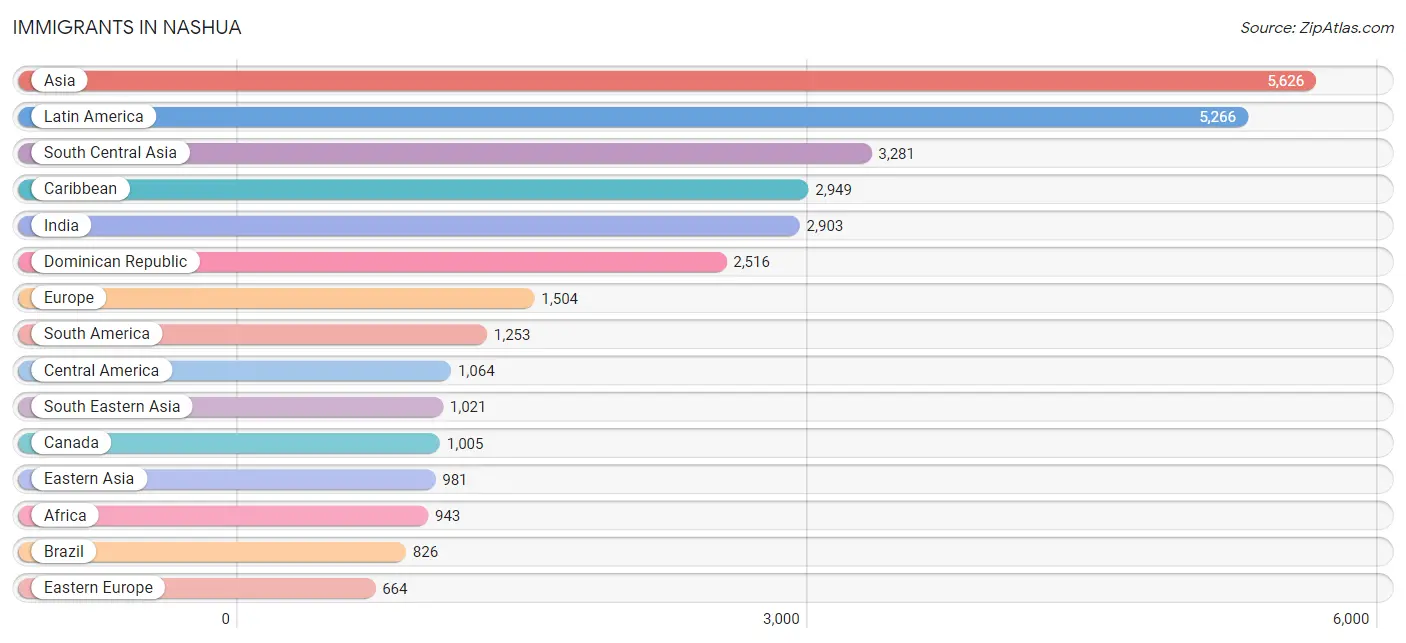
Immigrants in Nashua
The most numerous immigrant groups reported in Nashua came from Asia (5,626 | 6.2%), Latin America (5,266 | 5.8%), South Central Asia (3,281 | 3.6%), Caribbean (2,949 | 3.2%), and India (2,903 | 3.2%), together accounting for 22.0% of all Nashua residents.
| Immigration Origin | # Population | % Population |
| Africa | 943 | 1.0% |
| Albania | 15 | 0.0% |
| Asia | 5,626 | 6.2% |
| Australia | 8 | 0.0% |
| Austria | 21 | 0.0% |
| Azores | 51 | 0.1% |
| Bahamas | 1 | 0.0% |
| Brazil | 826 | 0.9% |
| Bulgaria | 15 | 0.0% |
| Cambodia | 53 | 0.1% |
| Canada | 1,005 | 1.1% |
| Caribbean | 2,949 | 3.2% |
| Central America | 1,064 | 1.2% |
| China | 627 | 0.7% |
| Colombia | 321 | 0.4% |
| Croatia | 10 | 0.0% |
| Cuba | 181 | 0.2% |
| Dominica | 45 | 0.1% |
| Dominican Republic | 2,516 | 2.8% |
| Eastern Africa | 419 | 0.5% |
| Eastern Asia | 981 | 1.1% |
| Eastern Europe | 664 | 0.7% |
| Ecuador | 24 | 0.0% |
| Egypt | 34 | 0.0% |
| El Salvador | 67 | 0.1% |
| England | 60 | 0.1% |
| Ethiopia | 117 | 0.1% |
| Europe | 1,504 | 1.7% |
| Germany | 350 | 0.4% |
| Ghana | 62 | 0.1% |
| Greece | 68 | 0.1% |
| Guatemala | 83 | 0.1% |
| Haiti | 66 | 0.1% |
| Honduras | 257 | 0.3% |
| Hong Kong | 22 | 0.0% |
| Hungary | 100 | 0.1% |
| India | 2,903 | 3.2% |
| Indonesia | 23 | 0.0% |
| Iran | 73 | 0.1% |
| Ireland | 30 | 0.0% |
| Israel | 32 | 0.0% |
| Jamaica | 130 | 0.1% |
| Japan | 64 | 0.1% |
| Jordan | 62 | 0.1% |
| Kazakhstan | 9 | 0.0% |
| Kenya | 192 | 0.2% |
| Korea | 290 | 0.3% |
| Laos | 20 | 0.0% |
| Latin America | 5,266 | 5.8% |
| Lebanon | 18 | 0.0% |
| Liberia | 29 | 0.0% |
| Malaysia | 125 | 0.1% |
| Mexico | 657 | 0.7% |
| Moldova | 14 | 0.0% |
| Morocco | 148 | 0.2% |
| Nepal | 263 | 0.3% |
| Netherlands | 12 | 0.0% |
| Northern Africa | 182 | 0.2% |
| Northern Europe | 249 | 0.3% |
| Norway | 14 | 0.0% |
| Oceania | 8 | 0.0% |
| Pakistan | 33 | 0.0% |
| Peru | 16 | 0.0% |
| Philippines | 188 | 0.2% |
| Poland | 51 | 0.1% |
| Portugal | 132 | 0.2% |
| Romania | 39 | 0.0% |
| Russia | 210 | 0.2% |
| Scotland | 34 | 0.0% |
| South Africa | 49 | 0.1% |
| South America | 1,253 | 1.4% |
| South Central Asia | 3,281 | 3.6% |
| South Eastern Asia | 1,021 | 1.1% |
| Southern Europe | 200 | 0.2% |
| Sweden | 15 | 0.0% |
| Switzerland | 8 | 0.0% |
| Syria | 181 | 0.2% |
| Taiwan | 47 | 0.1% |
| Thailand | 52 | 0.1% |
| Trinidad and Tobago | 10 | 0.0% |
| Turkey | 26 | 0.0% |
| Ukraine | 167 | 0.2% |
| Uruguay | 25 | 0.0% |
| Venezuela | 17 | 0.0% |
| Vietnam | 345 | 0.4% |
| Western Africa | 293 | 0.3% |
| Western Asia | 319 | 0.4% |
| Western Europe | 391 | 0.4% | View All 88 Rows |
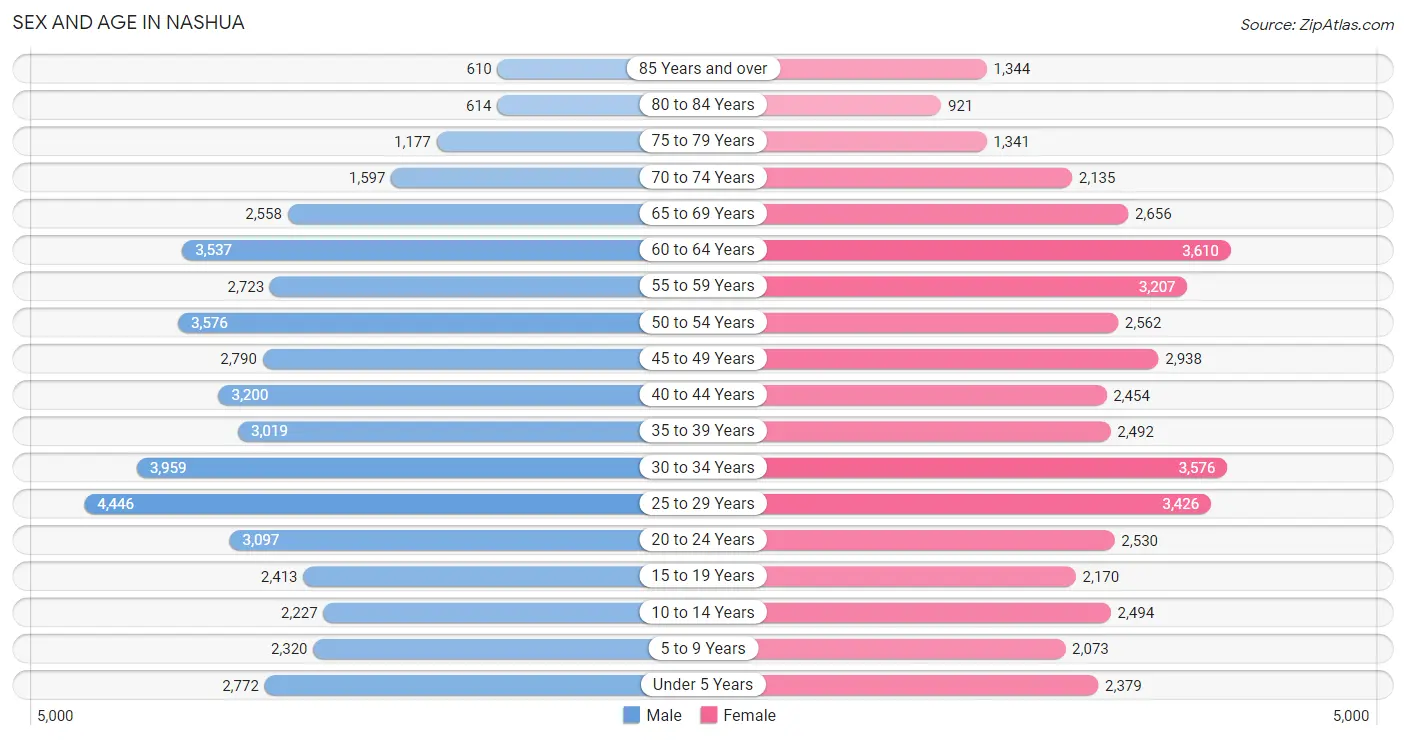
Sex and Age in Nashua
Sex and Age in Nashua
The most populous age groups in Nashua are 25 to 29 Years (4,446 | 9.5%) for men and 60 to 64 Years (3,610 | 8.2%) for women.
| Age Bracket | Male | Female |
| Under 5 Years | 2,772 (5.9%) | 2,379 (5.4%) |
| 5 to 9 Years | 2,320 (5.0%) | 2,073 (4.7%) |
| 10 to 14 Years | 2,227 (4.8%) | 2,494 (5.6%) |
| 15 to 19 Years | 2,413 (5.2%) | 2,170 (4.9%) |
| 20 to 24 Years | 3,097 (6.6%) | 2,530 (5.7%) |
| 25 to 29 Years | 4,446 (9.5%) | 3,426 (7.7%) |
| 30 to 34 Years | 3,959 (8.5%) | 3,576 (8.1%) |
| 35 to 39 Years | 3,019 (6.5%) | 2,492 (5.6%) |
| 40 to 44 Years | 3,200 (6.9%) | 2,454 (5.5%) |
| 45 to 49 Years | 2,790 (6.0%) | 2,938 (6.6%) |
| 50 to 54 Years | 3,576 (7.7%) | 2,562 (5.8%) |
| 55 to 59 Years | 2,723 (5.8%) | 3,207 (7.2%) |
| 60 to 64 Years | 3,537 (7.6%) | 3,610 (8.2%) |
| 65 to 69 Years | 2,558 (5.5%) | 2,656 (6.0%) |
| 70 to 74 Years | 1,597 (3.4%) | 2,135 (4.8%) |
| 75 to 79 Years | 1,177 (2.5%) | 1,341 (3.0%) |
| 80 to 84 Years | 614 (1.3%) | 921 (2.1%) |
| 85 Years and over | 610 (1.3%) | 1,344 (3.0%) |
| Total | 46,635 (100.0%) | 44,308 (100.0%) |
Families and Households in Nashua
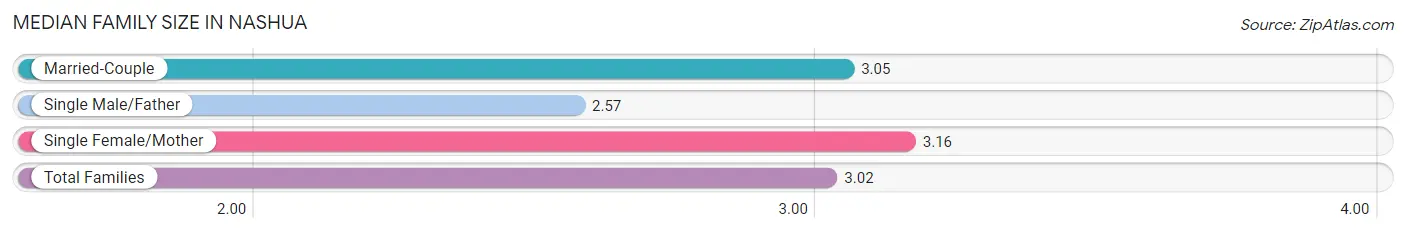
Median Family Size in Nashua
The median family size in Nashua is 3.02 persons per family, with single female/mother families (3,968 | 17.8%) accounting for the largest median family size of 3.16 persons per family. On the other hand, single male/father families (1,939 | 8.7%) represent the smallest median family size with 2.57 persons per family.
| Family Type | # Families | Family Size |
| Married-Couple | 16,333 (73.4%) | 3.05 |
| Single Male/Father | 1,939 (8.7%) | 2.57 |
| Single Female/Mother | 3,968 (17.8%) | 3.16 |
| Total Families | 22,240 (100.0%) | 3.02 |
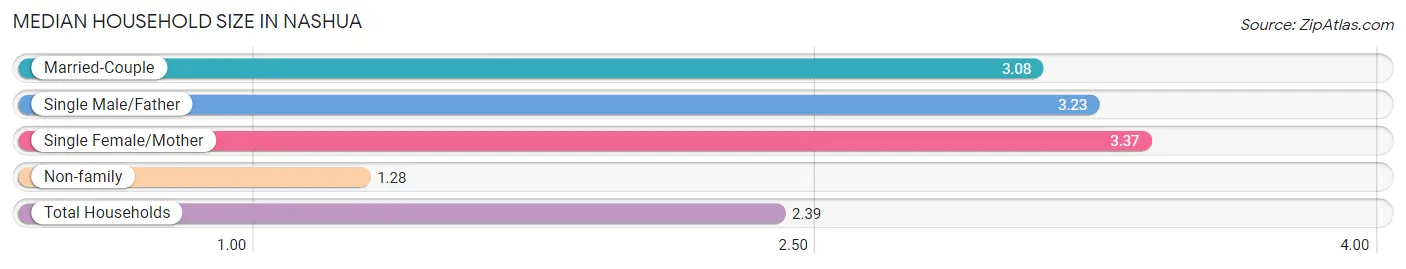
Median Household Size in Nashua
The median household size in Nashua is 2.39 persons per household, with single female/mother households (3,968 | 10.6%) accounting for the largest median household size of 3.37 persons per household. non-family households (15,238 | 40.7%) represent the smallest median household size with 1.28 persons per household.
| Household Type | # Households | Household Size |
| Married-Couple | 16,333 (43.6%) | 3.08 |
| Single Male/Father | 1,939 (5.2%) | 3.23 |
| Single Female/Mother | 3,968 (10.6%) | 3.37 |
| Non-family | 15,238 (40.7%) | 1.28 |
| Total Households | 37,478 (100.0%) | 2.39 |
Household Size by Marriage Status in Nashua
Out of a total of 37,478 households in Nashua, 22,240 (59.3%) are family households, while 15,238 (40.7%) are nonfamily households. The most numerous type of family households are 2-person households, comprising 10,073, and the most common type of nonfamily households are 1-person households, comprising 11,745.
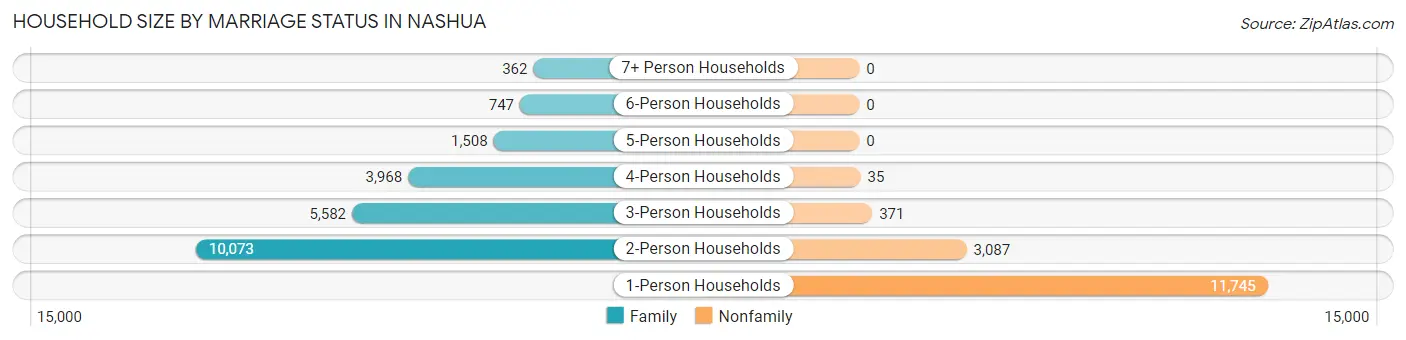
| Household Size | Family Households | Nonfamily Households |
| 1-Person Households | - | 11,745 (31.3%) |
| 2-Person Households | 10,073 (26.9%) | 3,087 (8.2%) |
| 3-Person Households | 5,582 (14.9%) | 371 (1.0%) |
| 4-Person Households | 3,968 (10.6%) | 35 (0.1%) |
| 5-Person Households | 1,508 (4.0%) | 0 (0.0%) |
| 6-Person Households | 747 (2.0%) | 0 (0.0%) |
| 7+ Person Households | 362 (1.0%) | 0 (0.0%) |
| Total | 22,240 (59.3%) | 15,238 (40.7%) |
Female Fertility in Nashua
Fertility by Age in Nashua
Average fertility rate in Nashua is 70.0 births per 1,000 women. Women in the age bracket of 20 to 34 years have the highest fertility rate with 115.0 births per 1,000 women. Women in the age bracket of 20 to 34 years acount for 77.6% of all women with births.
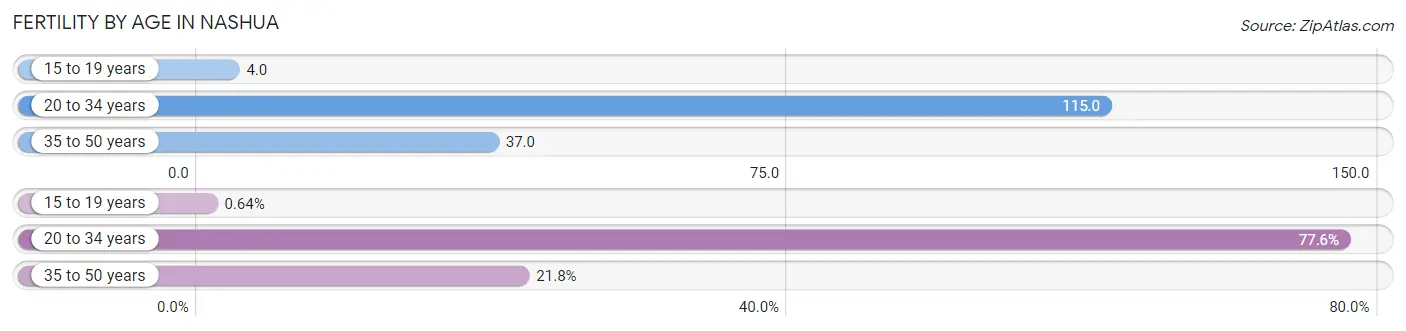
| Age Bracket | Women with Births | Births / 1,000 Women |
| 15 to 19 years | 9 (0.6%) | 4.0 |
| 20 to 34 years | 1,099 (77.6%) | 115.0 |
| 35 to 50 years | 309 (21.8%) | 37.0 |
| Total | 1,417 (100.0%) | 70.0 |
Fertility by Age by Marriage Status in Nashua
63.4% of women with births (1,417) in Nashua are married. The highest percentage of unmarried women with births falls into 15 to 19 years age bracket with 100.0% of them unmarried at the time of birth, while the lowest percentage of unmarried women with births belong to 20 to 34 years age bracket with 35.0% of them unmarried.
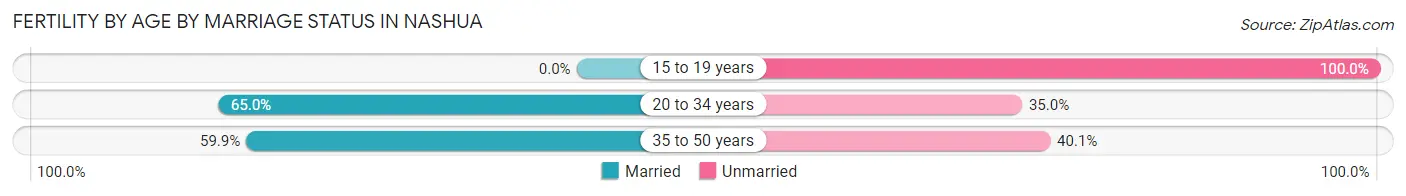
| Age Bracket | Married | Unmarried |
| 15 to 19 years | 0 (0.0%) | 9 (100.0%) |
| 20 to 34 years | 714 (65.0%) | 385 (35.0%) |
| 35 to 50 years | 185 (59.9%) | 124 (40.1%) |
| Total | 898 (63.4%) | 519 (36.6%) |
Fertility by Education in Nashua
Average fertility rate in Nashua is 70.0 births per 1,000 women. Women with the education attainment of high school diploma have the highest fertility rate of 101.0 births per 1,000 women, while women with the education attainment of college or associate's degree have the lowest fertility at 17.0 births per 1,000 women. Women with the education attainment of bachelor's degree represent 37.0% of all women with births.
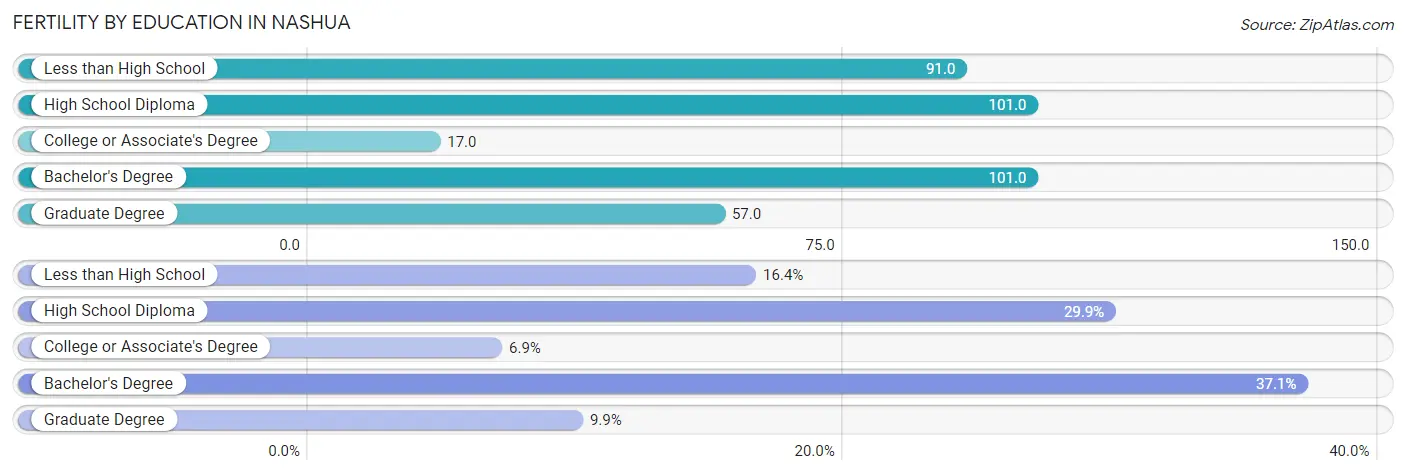
| Educational Attainment | Women with Births | Births / 1,000 Women |
| Less than High School | 232 (16.4%) | 91.0 |
| High School Diploma | 423 (29.8%) | 101.0 |
| College or Associate's Degree | 97 (6.9%) | 17.0 |
| Bachelor's Degree | 525 (37.0%) | 101.0 |
| Graduate Degree | 140 (9.9%) | 57.0 |
| Total | 1,417 (100.0%) | 70.0 |
Fertility by Education by Marriage Status in Nashua
36.6% of women with births in Nashua are unmarried. Women with the educational attainment of college or associate's degree are most likely to be married with 100.0% of them married at childbirth, while women with the educational attainment of less than high school are least likely to be married with 50.0% of them unmarried at childbirth.
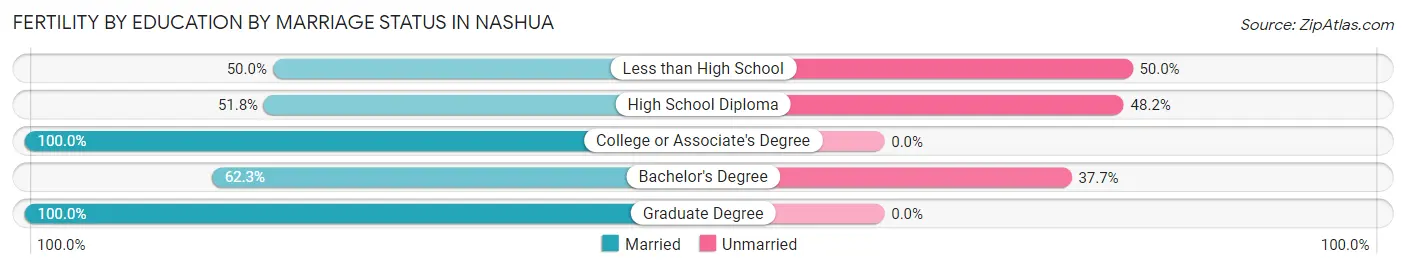
| Educational Attainment | Married | Unmarried |
| Less than High School | 116 (50.0%) | 116 (50.0%) |
| High School Diploma | 219 (51.8%) | 204 (48.2%) |
| College or Associate's Degree | 97 (100.0%) | 0 (0.0%) |
| Bachelor's Degree | 327 (62.3%) | 198 (37.7%) |
| Graduate Degree | 140 (100.0%) | 0 (0.0%) |
| Total | 898 (63.4%) | 519 (36.6%) |
Employment Characteristics in Nashua
Employment by Class of Employer in Nashua
Among the 50,337 employed individuals in Nashua, private company employees (37,352 | 74.2%), not-for-profit organizations (4,838 | 9.6%), and local government employees (2,698 | 5.4%) make up the most common classes of employment.
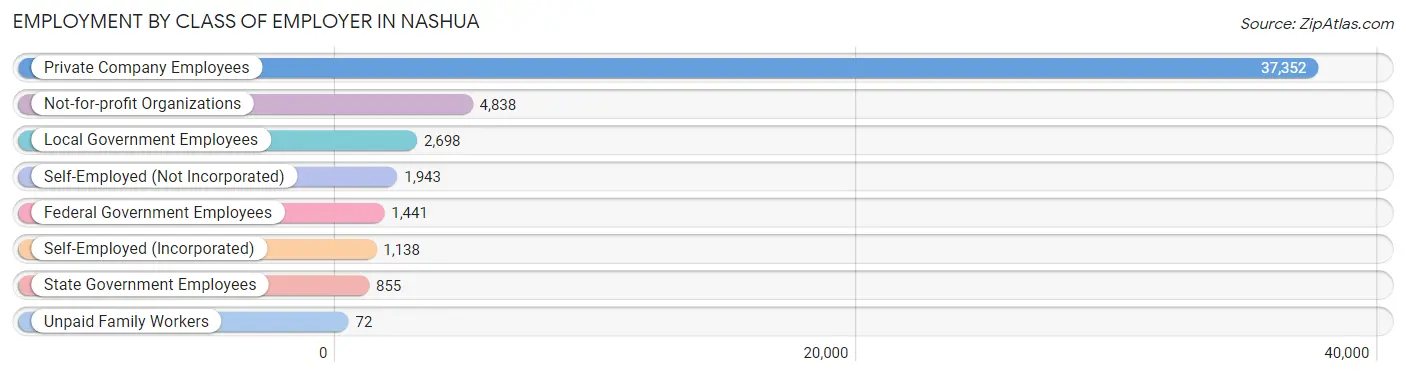
| Employer Class | # Employees | % Employees |
| Private Company Employees | 37,352 | 74.2% |
| Self-Employed (Incorporated) | 1,138 | 2.3% |
| Self-Employed (Not Incorporated) | 1,943 | 3.9% |
| Not-for-profit Organizations | 4,838 | 9.6% |
| Local Government Employees | 2,698 | 5.4% |
| State Government Employees | 855 | 1.7% |
| Federal Government Employees | 1,441 | 2.9% |
| Unpaid Family Workers | 72 | 0.1% |
| Total | 50,337 | 100.0% |
Employment Status by Age in Nashua
According to the labor force statistics for Nashua, out of the total population over 16 years of age (75,822), 71.7% or 54,364 individuals are in the labor force, with 5.1% or 2,773 of them unemployed. The age group with the highest labor force participation rate is 25 to 29 years, with 94.8% or 7,463 individuals in the labor force. Within the labor force, the 16 to 19 years age range has the highest percentage of unemployed individuals, with 11.3% or 231 of them being unemployed.
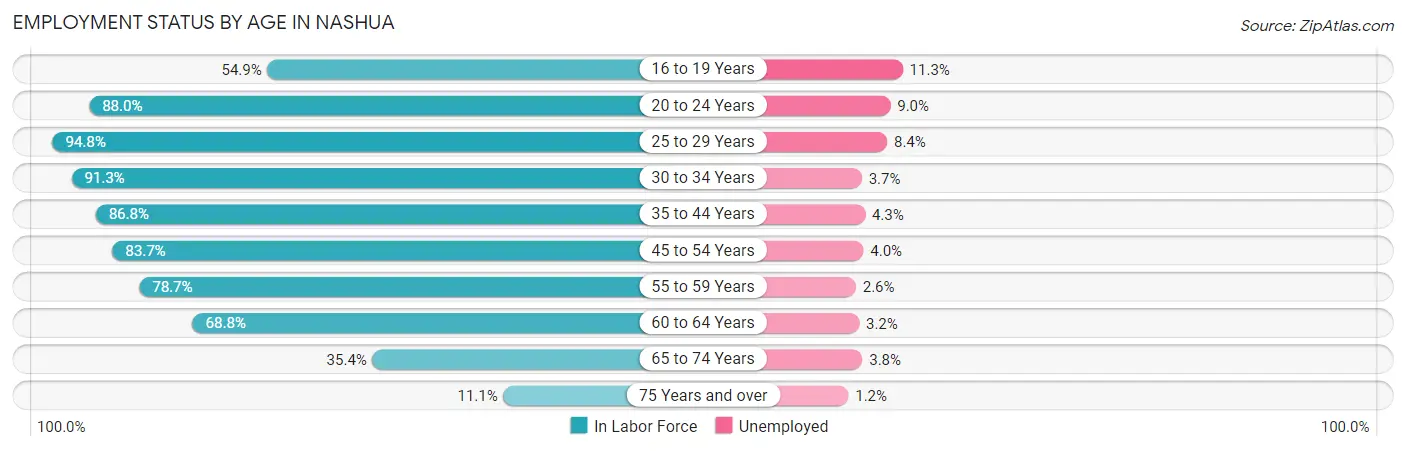
| Age Bracket | In Labor Force | Unemployed |
| 16 to 19 Years | 2,046 (54.9%) | 231 (11.3%) |
| 20 to 24 Years | 4,952 (88.0%) | 446 (9.0%) |
| 25 to 29 Years | 7,463 (94.8%) | 627 (8.4%) |
| 30 to 34 Years | 6,879 (91.3%) | 255 (3.7%) |
| 35 to 44 Years | 9,691 (86.8%) | 417 (4.3%) |
| 45 to 54 Years | 9,932 (83.7%) | 397 (4.0%) |
| 55 to 59 Years | 4,667 (78.7%) | 121 (2.6%) |
| 60 to 64 Years | 4,917 (68.8%) | 157 (3.2%) |
| 65 to 74 Years | 3,167 (35.4%) | 120 (3.8%) |
| 75 Years and over | 667 (11.1%) | 8 (1.2%) |
| Total | 54,364 (71.7%) | 2,773 (5.1%) |
Employment Status by Educational Attainment in Nashua
According to labor force statistics for Nashua, 84.5% of individuals (43,530) out of the total population between 25 and 64 years of age (51,515) are in the labor force, with 4.5% or 1,959 of them being unemployed. The group with the highest labor force participation rate are those with the educational attainment of bachelor's degree or higher, with 88.9% or 18,989 individuals in the labor force. Within the labor force, individuals with less than high school education have the highest percentage of unemployment, with 9.4% or 247 of them being unemployed.
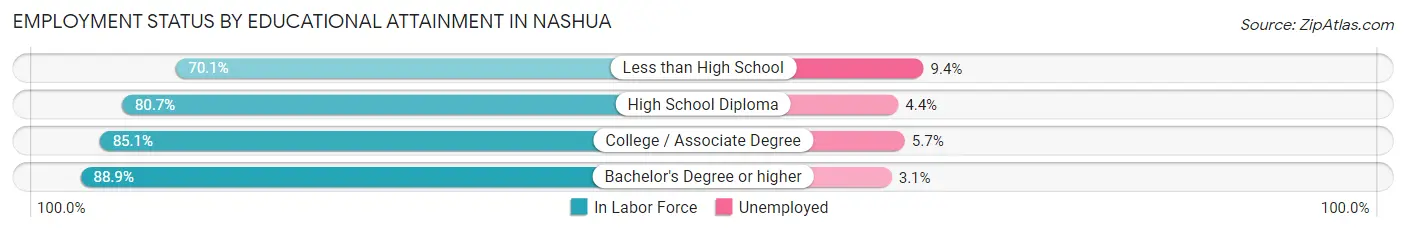
| Educational Attainment | In Labor Force | Unemployed |
| Less than High School | 2,630 (70.1%) | 353 (9.4%) |
| High School Diploma | 9,828 (80.7%) | 536 (4.4%) |
| College / Associate Degree | 12,105 (85.1%) | 811 (5.7%) |
| Bachelor's Degree or higher | 18,989 (88.9%) | 662 (3.1%) |
| Total | 43,530 (84.5%) | 2,318 (4.5%) |
Employment Occupations by Sex in Nashua
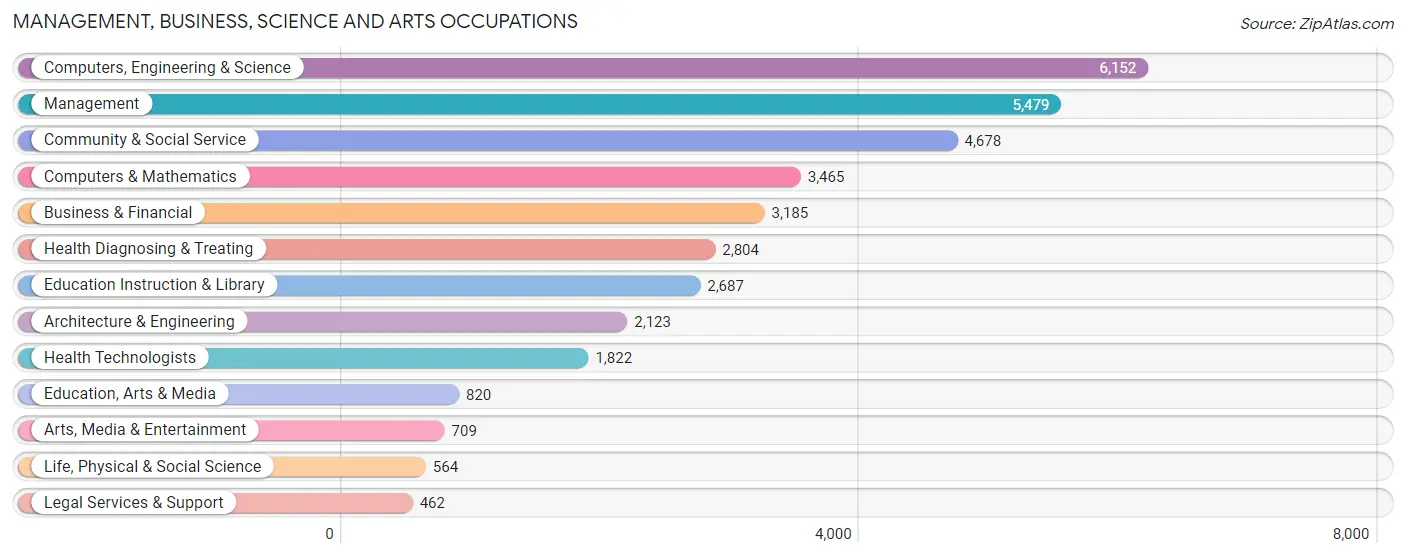
Management, Business, Science and Arts Occupations
The most common Management, Business, Science and Arts occupations in Nashua are Computers, Engineering & Science (6,152 | 11.9%), Management (5,479 | 10.6%), Community & Social Service (4,678 | 9.1%), Computers & Mathematics (3,465 | 6.7%), and Business & Financial (3,185 | 6.2%).
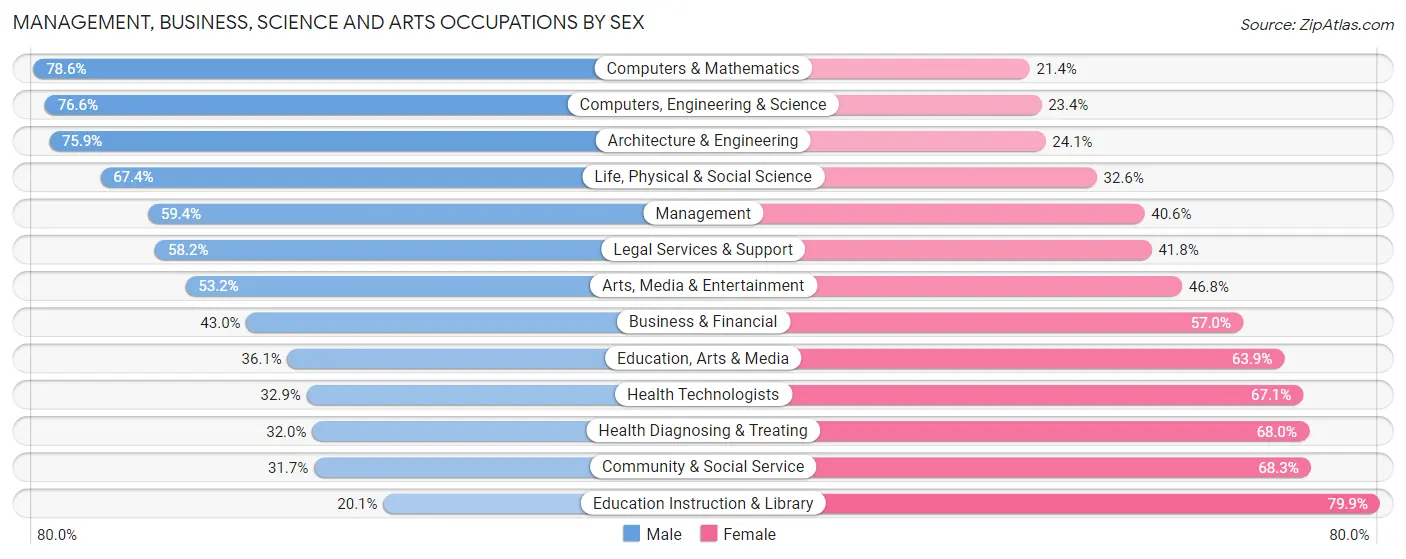
Management, Business, Science and Arts Occupations by Sex
Within the Management, Business, Science and Arts occupations in Nashua, the most male-oriented occupations are Computers & Mathematics (78.6%), Computers, Engineering & Science (76.6%), and Architecture & Engineering (75.9%), while the most female-oriented occupations are Education Instruction & Library (79.9%), Community & Social Service (68.3%), and Health Diagnosing & Treating (68.0%).
| Occupation | Male | Female |
| Management | 3,256 (59.4%) | 2,223 (40.6%) |
| Business & Financial | 1,369 (43.0%) | 1,816 (57.0%) |
| Computers, Engineering & Science | 4,714 (76.6%) | 1,438 (23.4%) |
| Computers & Mathematics | 2,722 (78.6%) | 743 (21.4%) |
| Architecture & Engineering | 1,612 (75.9%) | 511 (24.1%) |
| Life, Physical & Social Science | 380 (67.4%) | 184 (32.6%) |
| Community & Social Service | 1,483 (31.7%) | 3,195 (68.3%) |
| Education, Arts & Media | 296 (36.1%) | 524 (63.9%) |
| Legal Services & Support | 269 (58.2%) | 193 (41.8%) |
| Education Instruction & Library | 541 (20.1%) | 2,146 (79.9%) |
| Arts, Media & Entertainment | 377 (53.2%) | 332 (46.8%) |
| Health Diagnosing & Treating | 897 (32.0%) | 1,907 (68.0%) |
| Health Technologists | 600 (32.9%) | 1,222 (67.1%) |
| Total (Category) | 11,719 (52.6%) | 10,579 (47.4%) |
| Total (Overall) | 27,957 (54.3%) | 23,525 (45.7%) |
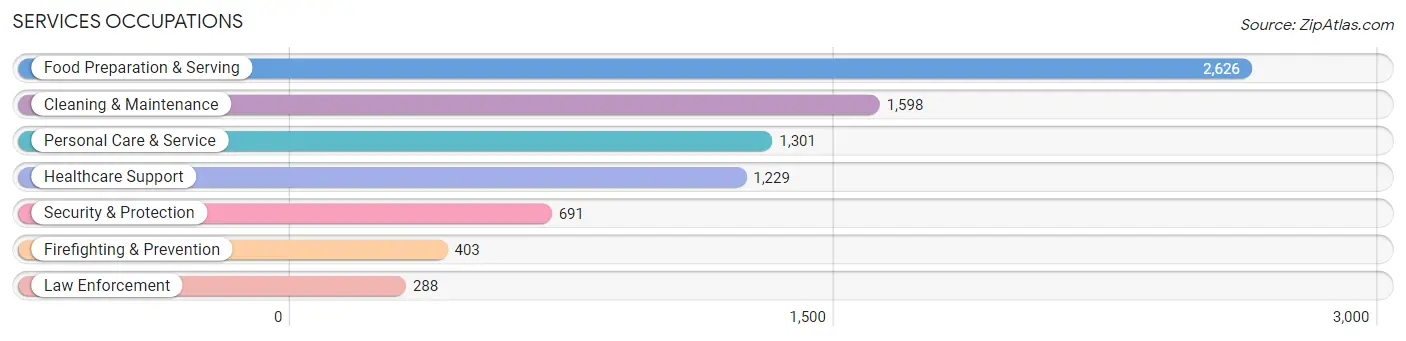
Services Occupations
The most common Services occupations in Nashua are Food Preparation & Serving (2,626 | 5.1%), Cleaning & Maintenance (1,598 | 3.1%), Personal Care & Service (1,301 | 2.5%), Healthcare Support (1,229 | 2.4%), and Security & Protection (691 | 1.3%).
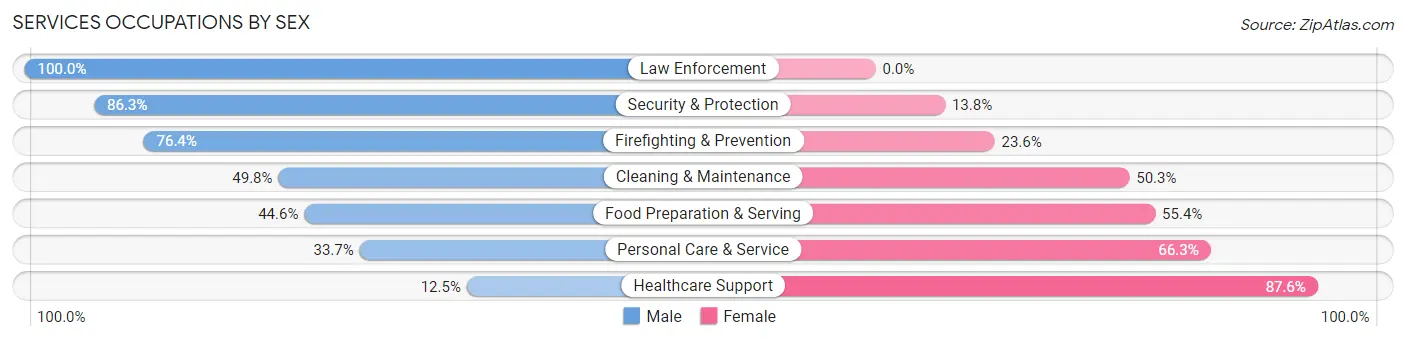
Services Occupations by Sex
Within the Services occupations in Nashua, the most male-oriented occupations are Law Enforcement (100.0%), Security & Protection (86.3%), and Firefighting & Prevention (76.4%), while the most female-oriented occupations are Healthcare Support (87.5%), Personal Care & Service (66.3%), and Food Preparation & Serving (55.4%).
| Occupation | Male | Female |
| Healthcare Support | 153 (12.4%) | 1,076 (87.5%) |
| Security & Protection | 596 (86.3%) | 95 (13.8%) |
| Firefighting & Prevention | 308 (76.4%) | 95 (23.6%) |
| Law Enforcement | 288 (100.0%) | 0 (0.0%) |
| Food Preparation & Serving | 1,172 (44.6%) | 1,454 (55.4%) |
| Cleaning & Maintenance | 795 (49.7%) | 803 (50.2%) |
| Personal Care & Service | 438 (33.7%) | 863 (66.3%) |
| Total (Category) | 3,154 (42.4%) | 4,291 (57.6%) |
| Total (Overall) | 27,957 (54.3%) | 23,525 (45.7%) |
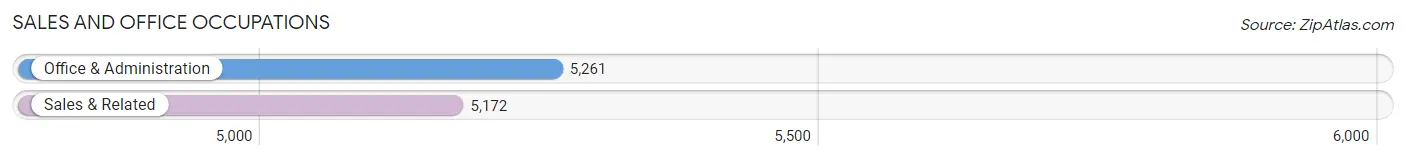
Sales and Office Occupations
The most common Sales and Office occupations in Nashua are Office & Administration (5,261 | 10.2%), and Sales & Related (5,172 | 10.1%).
Sales and Office Occupations by Sex
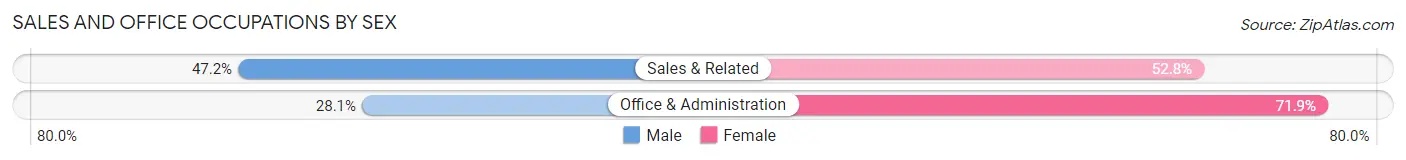
| Occupation | Male | Female |
| Sales & Related | 2,440 (47.2%) | 2,732 (52.8%) |
| Office & Administration | 1,479 (28.1%) | 3,782 (71.9%) |
| Total (Category) | 3,919 (37.6%) | 6,514 (62.4%) |
| Total (Overall) | 27,957 (54.3%) | 23,525 (45.7%) |
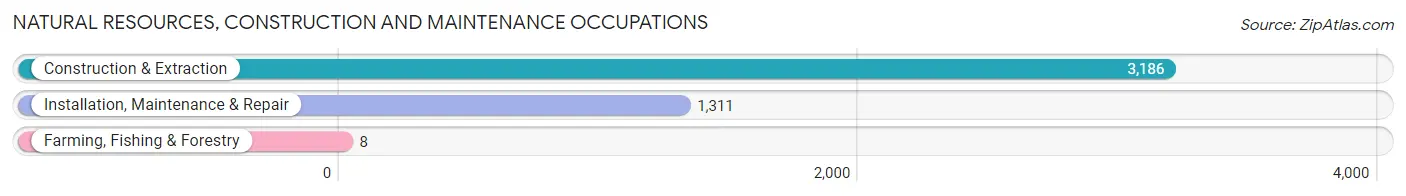
Natural Resources, Construction and Maintenance Occupations
The most common Natural Resources, Construction and Maintenance occupations in Nashua are Construction & Extraction (3,186 | 6.2%), Installation, Maintenance & Repair (1,311 | 2.5%), and Farming, Fishing & Forestry (8 | 0.0%).
Natural Resources, Construction and Maintenance Occupations by Sex
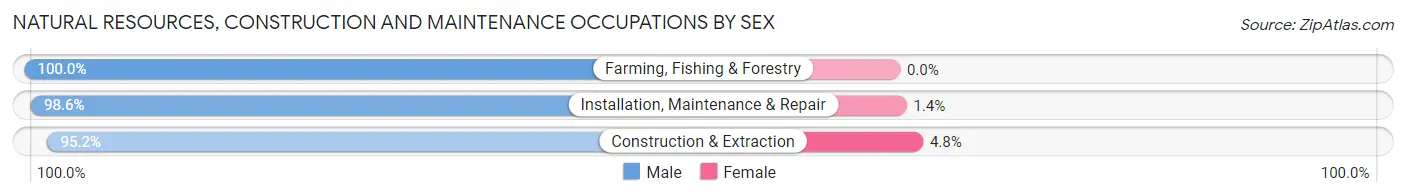
| Occupation | Male | Female |
| Farming, Fishing & Forestry | 8 (100.0%) | 0 (0.0%) |
| Construction & Extraction | 3,033 (95.2%) | 153 (4.8%) |
| Installation, Maintenance & Repair | 1,293 (98.6%) | 18 (1.4%) |
| Total (Category) | 4,334 (96.2%) | 171 (3.8%) |
| Total (Overall) | 27,957 (54.3%) | 23,525 (45.7%) |
Production, Transportation and Moving Occupations
The most common Production, Transportation and Moving occupations in Nashua are Production (3,510 | 6.8%), Transportation (1,753 | 3.4%), and Material Moving (1,538 | 3.0%).
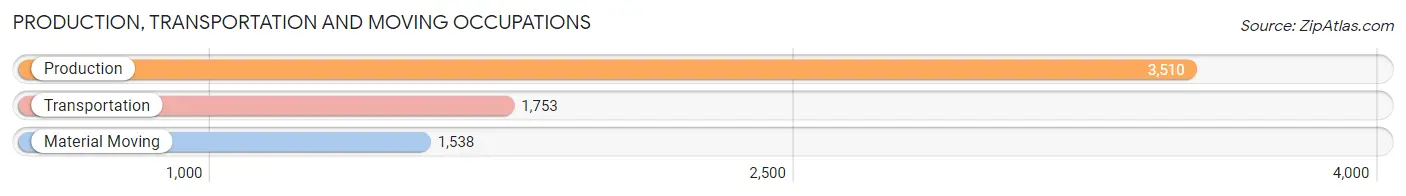
Production, Transportation and Moving Occupations by Sex
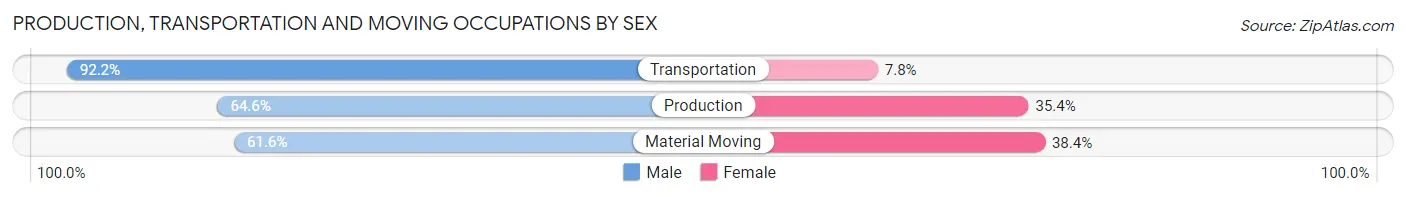
| Occupation | Male | Female |
| Production | 2,267 (64.6%) | 1,243 (35.4%) |
| Transportation | 1,617 (92.2%) | 136 (7.8%) |
| Material Moving | 947 (61.6%) | 591 (38.4%) |
| Total (Category) | 4,831 (71.0%) | 1,970 (29.0%) |
| Total (Overall) | 27,957 (54.3%) | 23,525 (45.7%) |
Employment Industries by Sex in Nashua
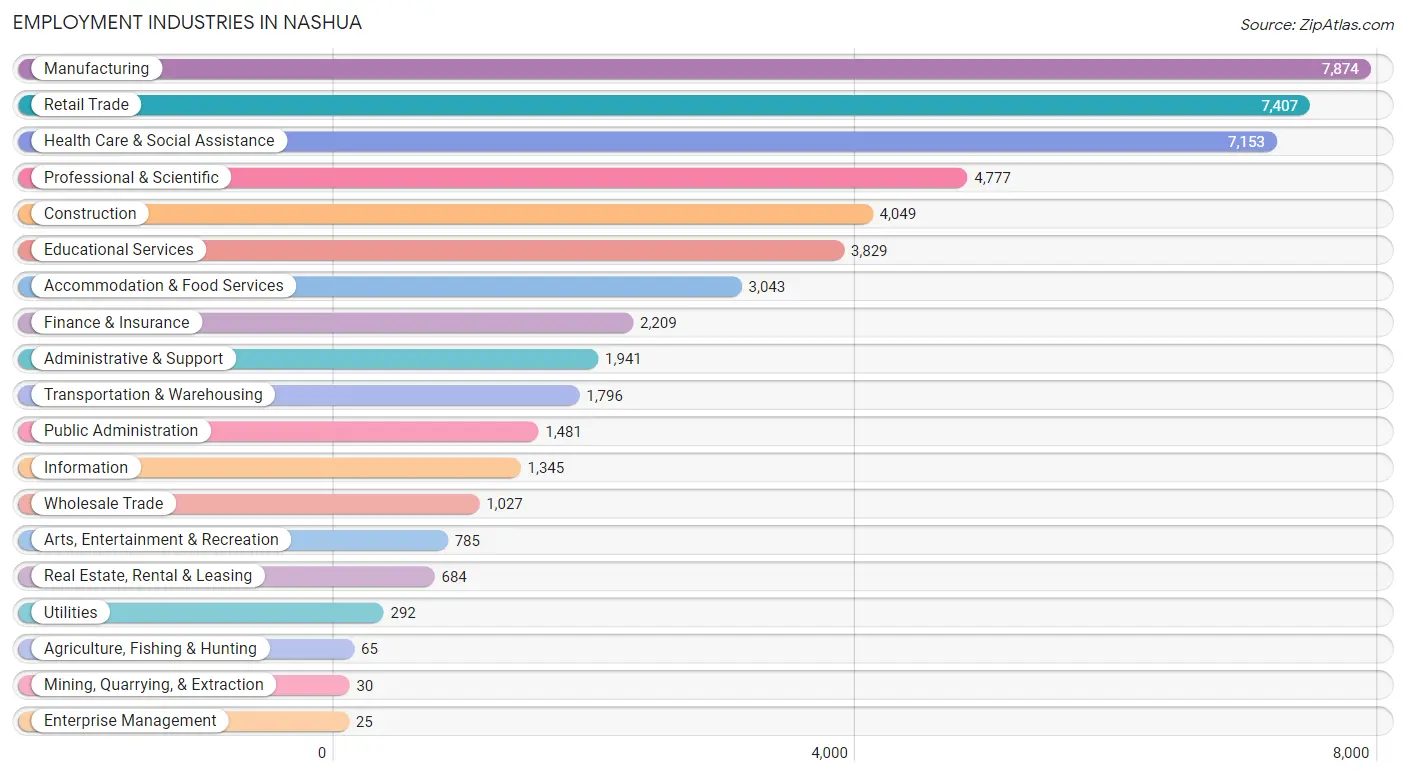
Employment Industries in Nashua
The major employment industries in Nashua include Manufacturing (7,874 | 15.3%), Retail Trade (7,407 | 14.4%), Health Care & Social Assistance (7,153 | 13.9%), Professional & Scientific (4,777 | 9.3%), and Construction (4,049 | 7.9%).
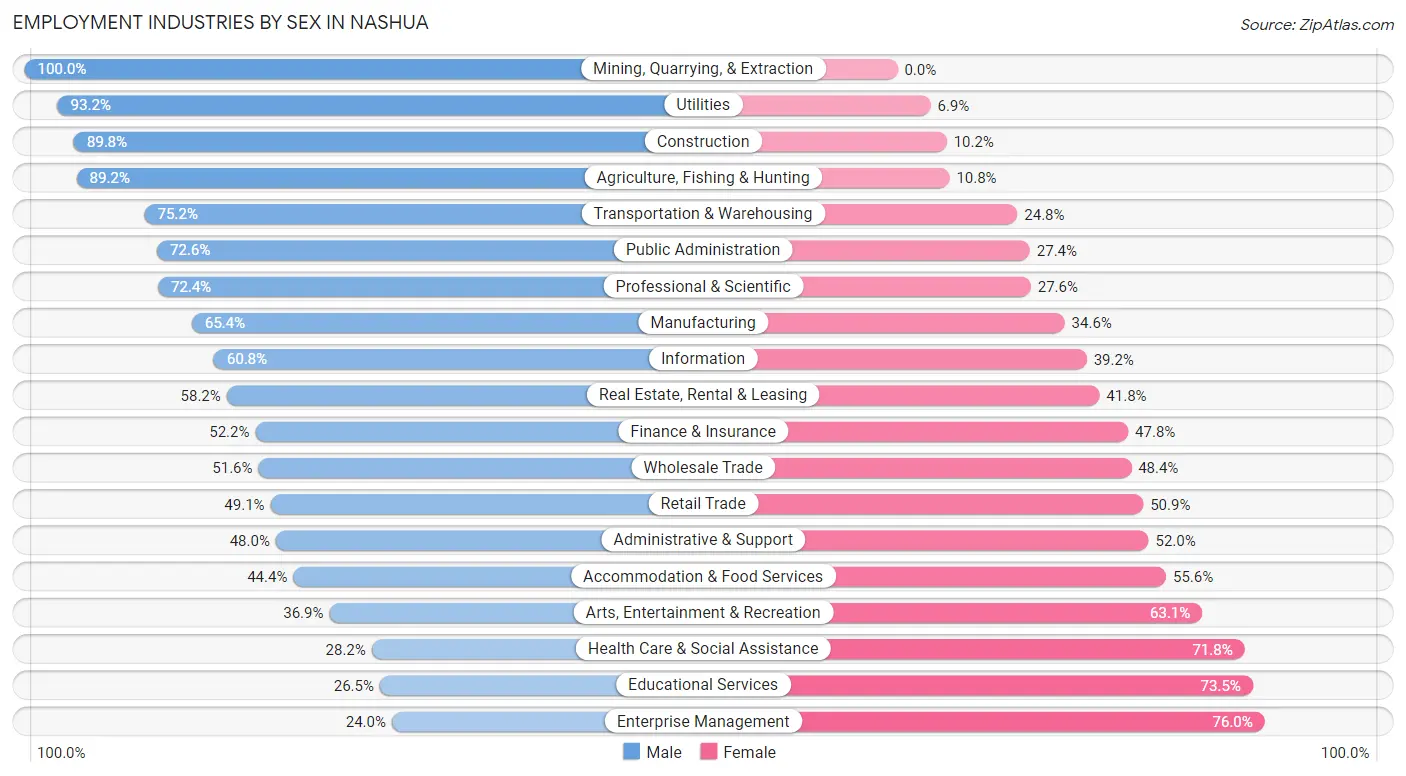
Employment Industries by Sex in Nashua
The Nashua industries that see more men than women are Mining, Quarrying, & Extraction (100.0%), Utilities (93.1%), and Construction (89.8%), whereas the industries that tend to have a higher number of women are Enterprise Management (76.0%), Educational Services (73.5%), and Health Care & Social Assistance (71.8%).
| Industry | Male | Female |
| Agriculture, Fishing & Hunting | 58 (89.2%) | 7 (10.8%) |
| Mining, Quarrying, & Extraction | 30 (100.0%) | 0 (0.0%) |
| Construction | 3,636 (89.8%) | 413 (10.2%) |
| Manufacturing | 5,149 (65.4%) | 2,725 (34.6%) |
| Wholesale Trade | 530 (51.6%) | 497 (48.4%) |
| Retail Trade | 3,638 (49.1%) | 3,769 (50.9%) |
| Transportation & Warehousing | 1,350 (75.2%) | 446 (24.8%) |
| Utilities | 272 (93.1%) | 20 (6.9%) |
| Information | 818 (60.8%) | 527 (39.2%) |
| Finance & Insurance | 1,154 (52.2%) | 1,055 (47.8%) |
| Real Estate, Rental & Leasing | 398 (58.2%) | 286 (41.8%) |
| Professional & Scientific | 3,458 (72.4%) | 1,319 (27.6%) |
| Enterprise Management | 6 (24.0%) | 19 (76.0%) |
| Administrative & Support | 932 (48.0%) | 1,009 (52.0%) |
| Educational Services | 1,014 (26.5%) | 2,815 (73.5%) |
| Health Care & Social Assistance | 2,015 (28.2%) | 5,138 (71.8%) |
| Arts, Entertainment & Recreation | 290 (36.9%) | 495 (63.1%) |
| Accommodation & Food Services | 1,351 (44.4%) | 1,692 (55.6%) |
| Public Administration | 1,075 (72.6%) | 406 (27.4%) |
| Total | 27,957 (54.3%) | 23,525 (45.7%) |
Education in Nashua
School Enrollment in Nashua
The most common levels of schooling among the 16,768 students in Nashua are high school (3,888 | 23.2%), middle school (3,415 | 20.4%), and elementary school (3,185 | 19.0%).
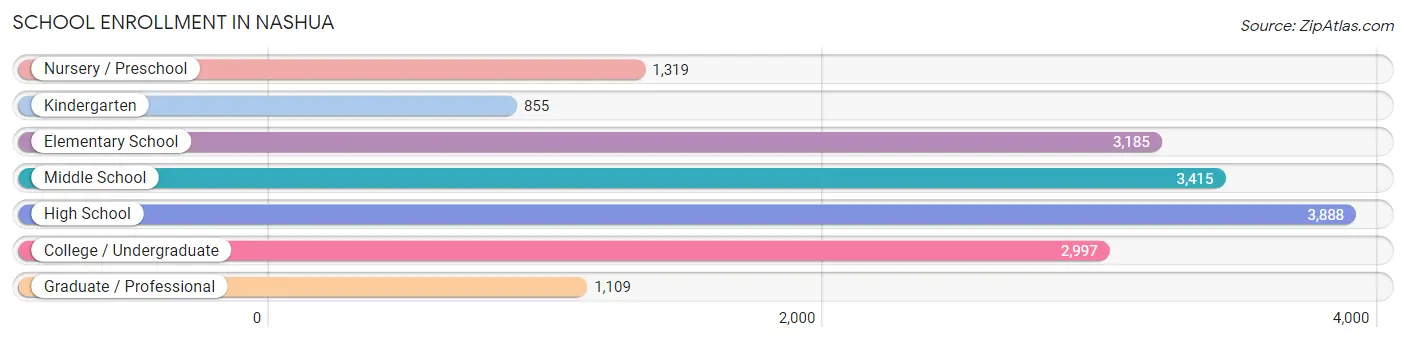
| School Level | # Students | % Students |
| Nursery / Preschool | 1,319 | 7.9% |
| Kindergarten | 855 | 5.1% |
| Elementary School | 3,185 | 19.0% |
| Middle School | 3,415 | 20.4% |
| High School | 3,888 | 23.2% |
| College / Undergraduate | 2,997 | 17.9% |
| Graduate / Professional | 1,109 | 6.6% |
| Total | 16,768 | 100.0% |
School Enrollment by Age by Funding Source in Nashua
Out of a total of 16,768 students who are enrolled in schools in Nashua, 3,672 (21.9%) attend a private institution, while the remaining 13,096 (78.1%) are enrolled in public schools. The age group of 35 years and over has the highest likelihood of being enrolled in private schools, with 376 (57.2% in the age bracket) enrolled. Conversely, the age group of 15 to 17 year olds has the lowest likelihood of being enrolled in a private school, with 2,631 (94.0% in the age bracket) attending a public institution.
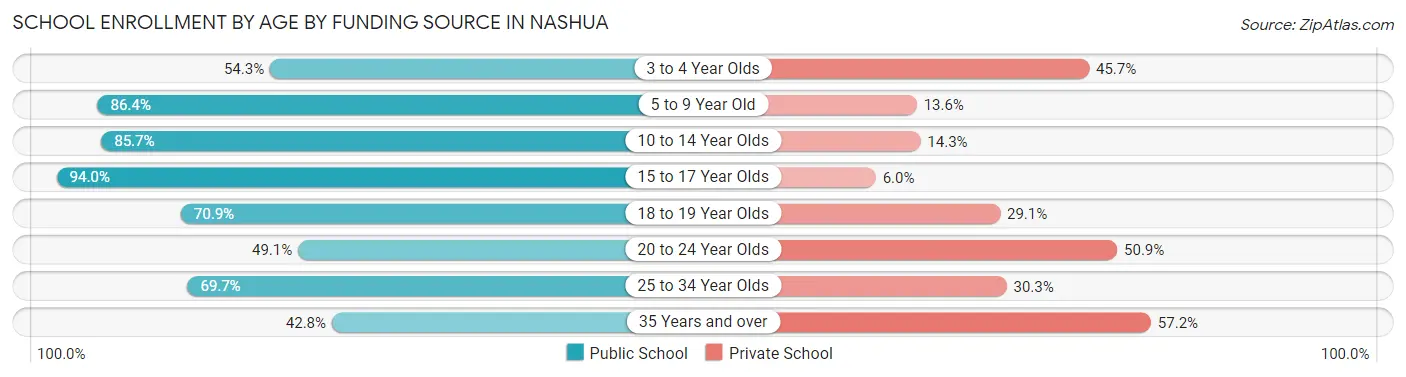
| Age Bracket | Public School | Private School |
| 3 to 4 Year Olds | 494 (54.3%) | 416 (45.7%) |
| 5 to 9 Year Old | 3,360 (86.4%) | 529 (13.6%) |
| 10 to 14 Year Olds | 3,886 (85.7%) | 648 (14.3%) |
| 15 to 17 Year Olds | 2,631 (94.0%) | 167 (6.0%) |
| 18 to 19 Year Olds | 791 (70.9%) | 325 (29.1%) |
| 20 to 24 Year Olds | 815 (49.1%) | 846 (50.9%) |
| 25 to 34 Year Olds | 838 (69.7%) | 365 (30.3%) |
| 35 Years and over | 281 (42.8%) | 376 (57.2%) |
| Total | 13,096 (78.1%) | 3,672 (21.9%) |
Educational Attainment by Field of Study in Nashua
Business (6,013 | 20.8%), engineering (3,910 | 13.5%), computers & mathematics (2,801 | 9.7%), education (2,316 | 8.0%), and science & technology (2,036 | 7.0%) are the most common fields of study among 28,939 individuals in Nashua who have obtained a bachelor's degree or higher.
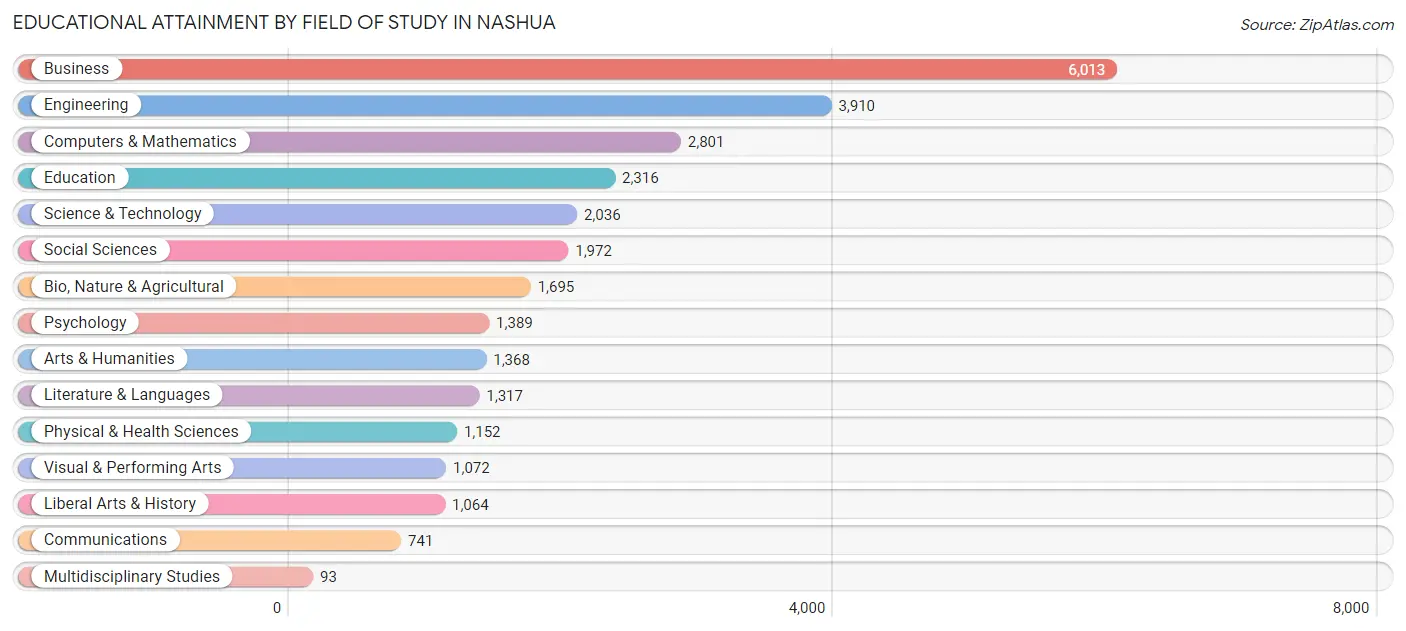
| Field of Study | # Graduates | % Graduates |
| Computers & Mathematics | 2,801 | 9.7% |
| Bio, Nature & Agricultural | 1,695 | 5.9% |
| Physical & Health Sciences | 1,152 | 4.0% |
| Psychology | 1,389 | 4.8% |
| Social Sciences | 1,972 | 6.8% |
| Engineering | 3,910 | 13.5% |
| Multidisciplinary Studies | 93 | 0.3% |
| Science & Technology | 2,036 | 7.0% |
| Business | 6,013 | 20.8% |
| Education | 2,316 | 8.0% |
| Literature & Languages | 1,317 | 4.5% |
| Liberal Arts & History | 1,064 | 3.7% |
| Visual & Performing Arts | 1,072 | 3.7% |
| Communications | 741 | 2.6% |
| Arts & Humanities | 1,368 | 4.7% |
| Total | 28,939 | 100.0% |
Transportation & Commute in Nashua
Vehicle Availability by Sex in Nashua
The most prevalent vehicle ownership categories in Nashua are males with 2 vehicles (12,509, accounting for 45.4%) and females with 2 vehicles (10,048, making up 55.8%).
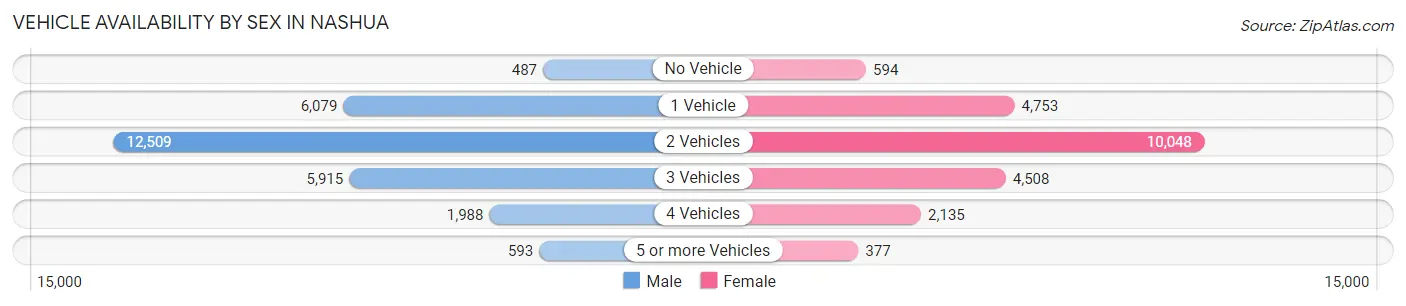
| Vehicles Available | Male | Female |
| No Vehicle | 487 (1.8%) | 594 (2.6%) |
| 1 Vehicle | 6,079 (22.1%) | 4,753 (21.2%) |
| 2 Vehicles | 12,509 (45.4%) | 10,048 (44.8%) |
| 3 Vehicles | 5,915 (21.4%) | 4,508 (20.1%) |
| 4 Vehicles | 1,988 (7.2%) | 2,135 (9.5%) |
| 5 or more Vehicles | 593 (2.1%) | 377 (1.7%) |
| Total | 27,571 (100.0%) | 22,415 (100.0%) |
Commute Time in Nashua
The most frequently occuring commute durations in Nashua are 10 to 14 minutes (8,687 commuters, 19.7%), 15 to 19 minutes (7,604 commuters, 17.2%), and 30 to 34 minutes (5,317 commuters, 12.0%).
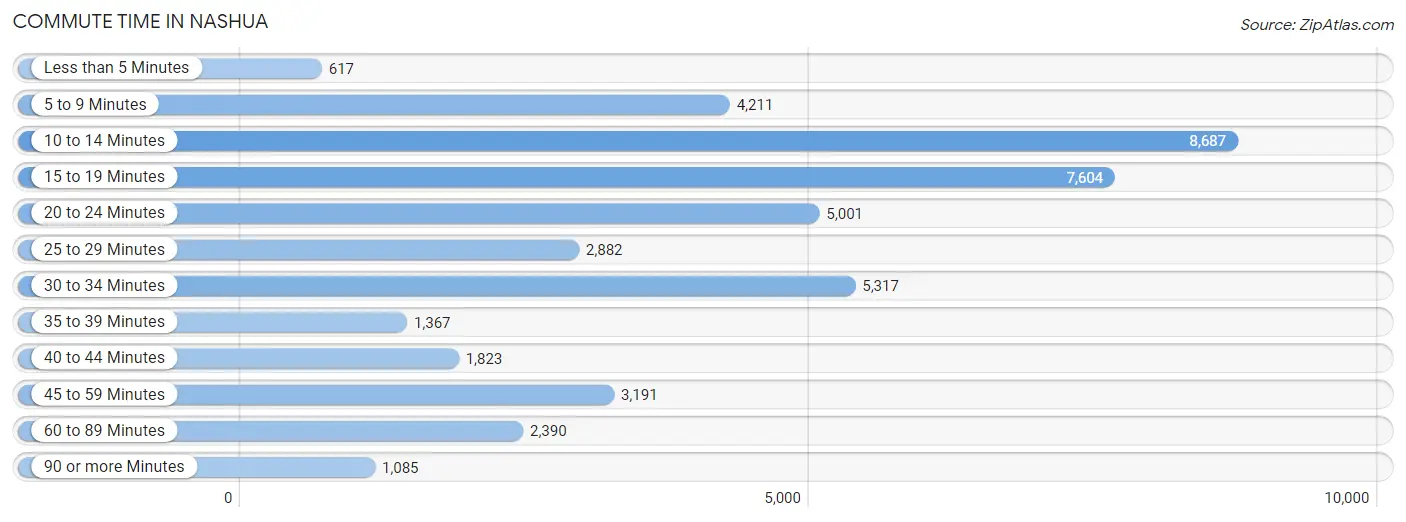
| Commute Time | # Commuters | % Commuters |
| Less than 5 Minutes | 617 | 1.4% |
| 5 to 9 Minutes | 4,211 | 9.5% |
| 10 to 14 Minutes | 8,687 | 19.7% |
| 15 to 19 Minutes | 7,604 | 17.2% |
| 20 to 24 Minutes | 5,001 | 11.3% |
| 25 to 29 Minutes | 2,882 | 6.5% |
| 30 to 34 Minutes | 5,317 | 12.0% |
| 35 to 39 Minutes | 1,367 | 3.1% |
| 40 to 44 Minutes | 1,823 | 4.1% |
| 45 to 59 Minutes | 3,191 | 7.2% |
| 60 to 89 Minutes | 2,390 | 5.4% |
| 90 or more Minutes | 1,085 | 2.5% |
Commute Time by Sex in Nashua
The most common commute times in Nashua are 10 to 14 minutes (4,096 commuters, 17.2%) for males and 10 to 14 minutes (4,591 commuters, 22.6%) for females.
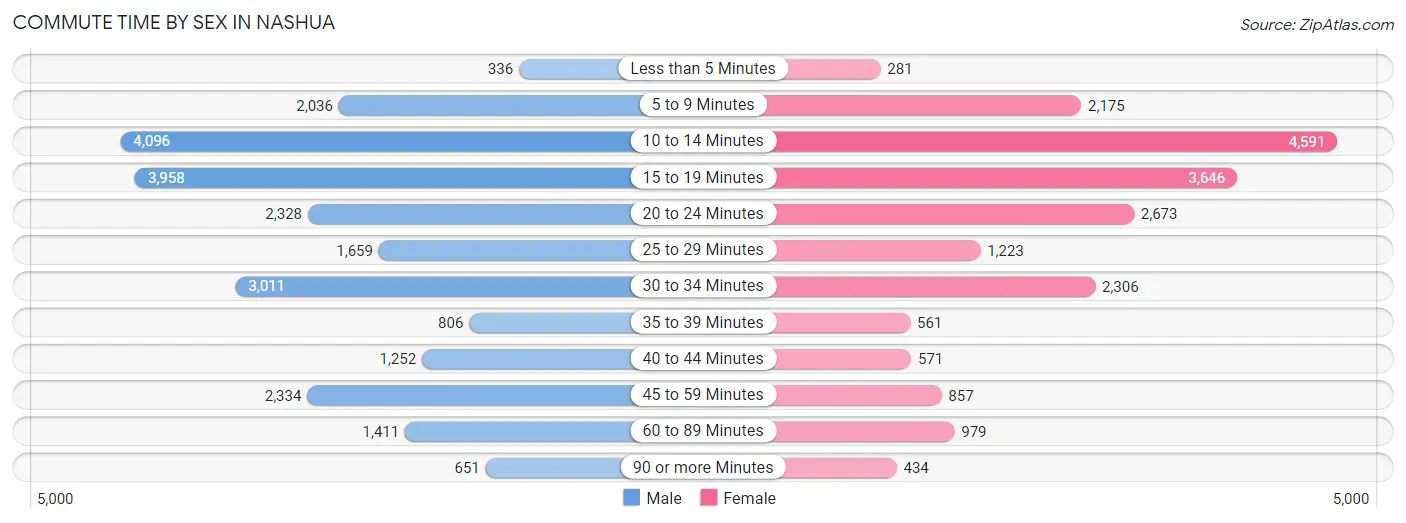
| Commute Time | Male | Female |
| Less than 5 Minutes | 336 (1.4%) | 281 (1.4%) |
| 5 to 9 Minutes | 2,036 (8.5%) | 2,175 (10.7%) |
| 10 to 14 Minutes | 4,096 (17.2%) | 4,591 (22.6%) |
| 15 to 19 Minutes | 3,958 (16.6%) | 3,646 (18.0%) |
| 20 to 24 Minutes | 2,328 (9.8%) | 2,673 (13.2%) |
| 25 to 29 Minutes | 1,659 (7.0%) | 1,223 (6.0%) |
| 30 to 34 Minutes | 3,011 (12.6%) | 2,306 (11.4%) |
| 35 to 39 Minutes | 806 (3.4%) | 561 (2.8%) |
| 40 to 44 Minutes | 1,252 (5.2%) | 571 (2.8%) |
| 45 to 59 Minutes | 2,334 (9.8%) | 857 (4.2%) |
| 60 to 89 Minutes | 1,411 (5.9%) | 979 (4.8%) |
| 90 or more Minutes | 651 (2.7%) | 434 (2.1%) |
Time of Departure to Work by Sex in Nashua
The most frequent times of departure to work in Nashua are 7:00 AM to 7:29 AM (2,909, 12.2%) for males and 7:00 AM to 7:29 AM (2,733, 13.5%) for females.
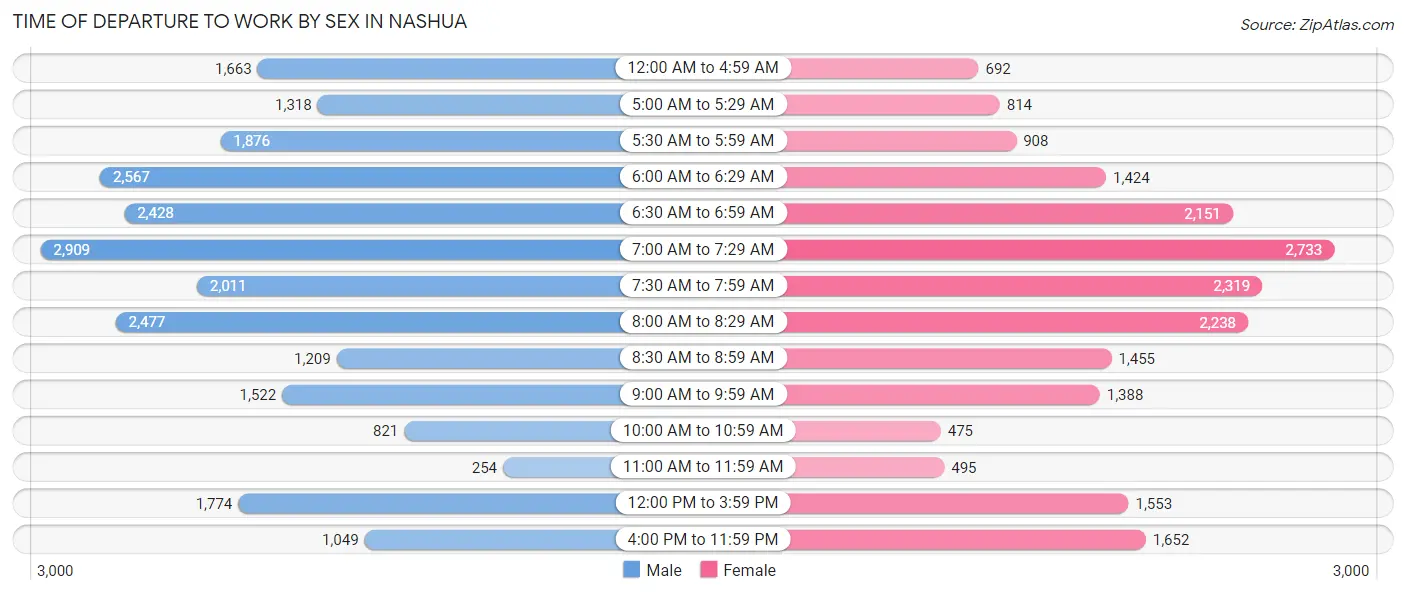
| Time of Departure | Male | Female |
| 12:00 AM to 4:59 AM | 1,663 (7.0%) | 692 (3.4%) |
| 5:00 AM to 5:29 AM | 1,318 (5.5%) | 814 (4.0%) |
| 5:30 AM to 5:59 AM | 1,876 (7.9%) | 908 (4.5%) |
| 6:00 AM to 6:29 AM | 2,567 (10.7%) | 1,424 (7.0%) |
| 6:30 AM to 6:59 AM | 2,428 (10.2%) | 2,151 (10.6%) |
| 7:00 AM to 7:29 AM | 2,909 (12.2%) | 2,733 (13.5%) |
| 7:30 AM to 7:59 AM | 2,011 (8.4%) | 2,319 (11.4%) |
| 8:00 AM to 8:29 AM | 2,477 (10.4%) | 2,238 (11.0%) |
| 8:30 AM to 8:59 AM | 1,209 (5.1%) | 1,455 (7.2%) |
| 9:00 AM to 9:59 AM | 1,522 (6.4%) | 1,388 (6.8%) |
| 10:00 AM to 10:59 AM | 821 (3.4%) | 475 (2.3%) |
| 11:00 AM to 11:59 AM | 254 (1.1%) | 495 (2.4%) |
| 12:00 PM to 3:59 PM | 1,774 (7.4%) | 1,553 (7.6%) |
| 4:00 PM to 11:59 PM | 1,049 (4.4%) | 1,652 (8.1%) |
| Total | 23,878 (100.0%) | 20,297 (100.0%) |
Housing Occupancy in Nashua
Occupancy by Ownership in Nashua
Of the total 37,478 dwellings in Nashua, owner-occupied units account for 20,817 (55.5%), while renter-occupied units make up 16,661 (44.5%).
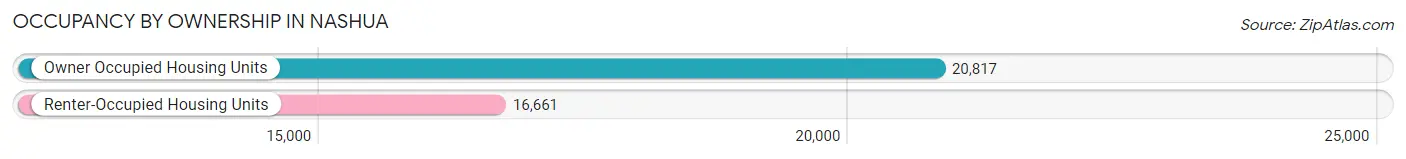
| Occupancy | # Housing Units | % Housing Units |
| Owner Occupied Housing Units | 20,817 | 55.5% |
| Renter-Occupied Housing Units | 16,661 | 44.5% |
| Total Occupied Housing Units | 37,478 | 100.0% |
Occupancy by Household Size in Nashua
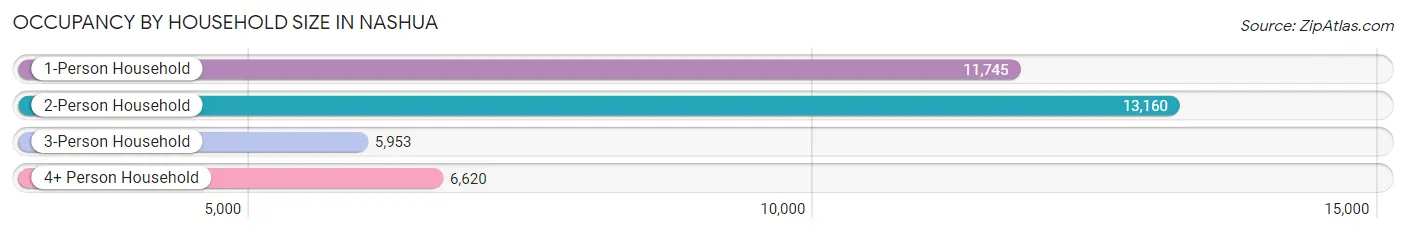
| Household Size | # Housing Units | % Housing Units |
| 1-Person Household | 11,745 | 31.3% |
| 2-Person Household | 13,160 | 35.1% |
| 3-Person Household | 5,953 | 15.9% |
| 4+ Person Household | 6,620 | 17.7% |
| Total Housing Units | 37,478 | 100.0% |
Occupancy by Ownership by Household Size in Nashua
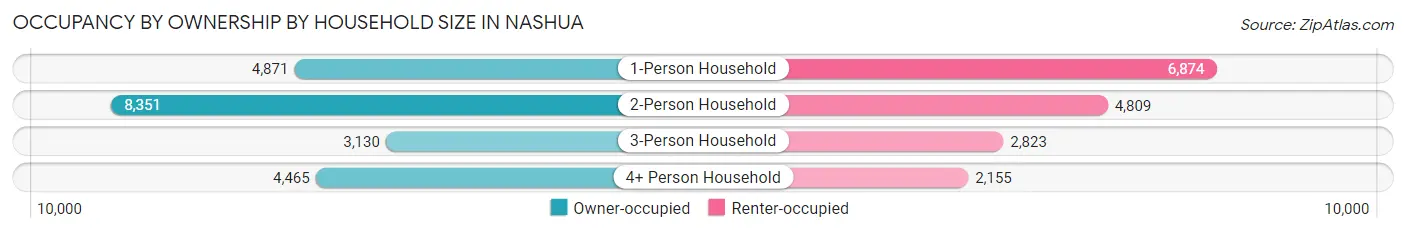
| Household Size | Owner-occupied | Renter-occupied |
| 1-Person Household | 4,871 (41.5%) | 6,874 (58.5%) |
| 2-Person Household | 8,351 (63.5%) | 4,809 (36.5%) |
| 3-Person Household | 3,130 (52.6%) | 2,823 (47.4%) |
| 4+ Person Household | 4,465 (67.4%) | 2,155 (32.6%) |
| Total Housing Units | 20,817 (55.5%) | 16,661 (44.5%) |
Occupancy by Educational Attainment in Nashua
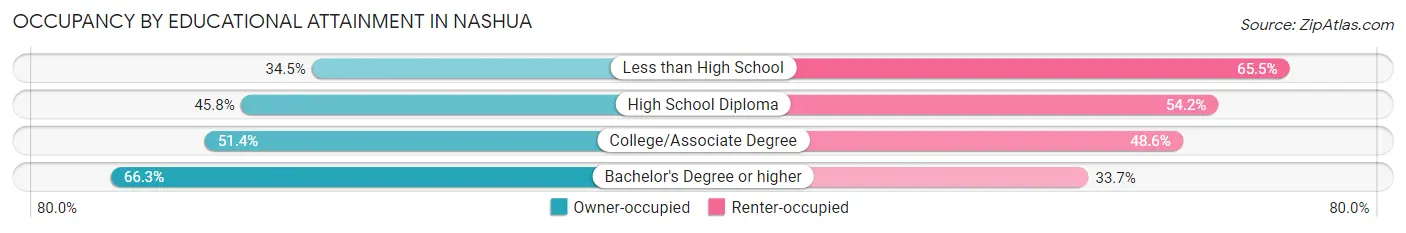
| Household Size | Owner-occupied | Renter-occupied |
| Less than High School | 791 (34.5%) | 1,503 (65.5%) |
| High School Diploma | 3,818 (45.8%) | 4,526 (54.2%) |
| College/Associate Degree | 5,477 (51.4%) | 5,179 (48.6%) |
| Bachelor's Degree or higher | 10,731 (66.3%) | 5,453 (33.7%) |
Occupancy by Age of Householder in Nashua
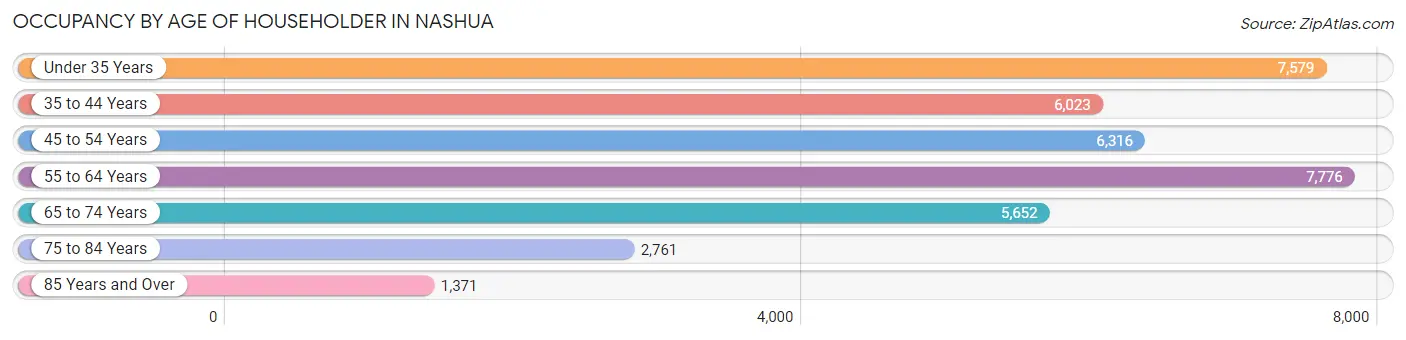
| Age Bracket | # Households | % Households |
| Under 35 Years | 7,579 | 20.2% |
| 35 to 44 Years | 6,023 | 16.1% |
| 45 to 54 Years | 6,316 | 16.9% |
| 55 to 64 Years | 7,776 | 20.7% |
| 65 to 74 Years | 5,652 | 15.1% |
| 75 to 84 Years | 2,761 | 7.4% |
| 85 Years and Over | 1,371 | 3.7% |
| Total | 37,478 | 100.0% |
Housing Finances in Nashua
Median Income by Occupancy in Nashua
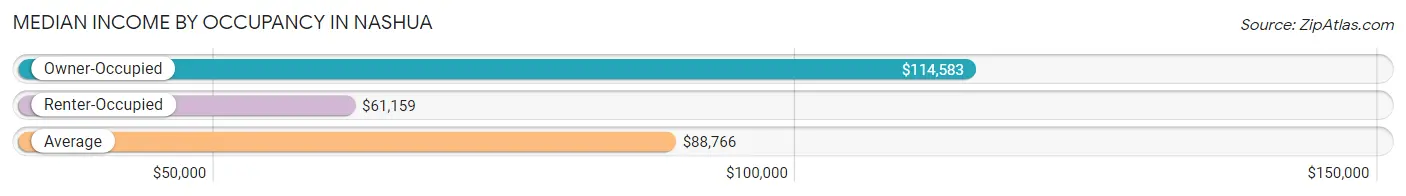
| Occupancy Type | # Households | Median Income |
| Owner-Occupied | 20,817 (55.5%) | $114,583 |
| Renter-Occupied | 16,661 (44.5%) | $61,159 |
| Average | 37,478 (100.0%) | $88,766 |
Occupancy by Householder Income Bracket in Nashua
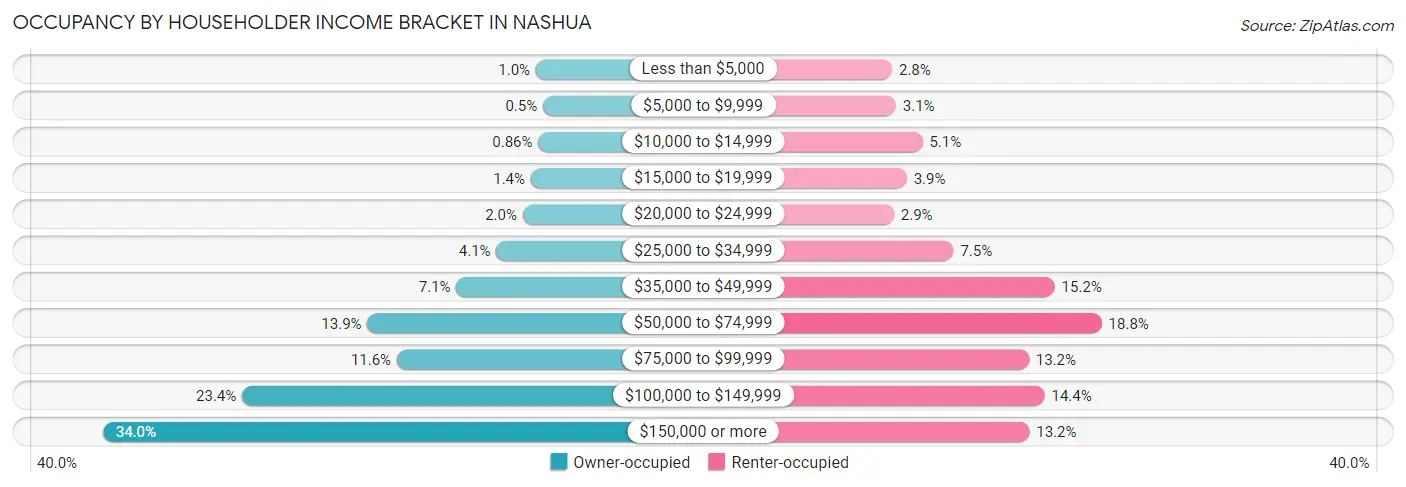
| Income Bracket | Owner-occupied | Renter-occupied |
| Less than $5,000 | 216 (1.0%) | 463 (2.8%) |
| $5,000 to $9,999 | 104 (0.5%) | 512 (3.1%) |
| $10,000 to $14,999 | 178 (0.9%) | 850 (5.1%) |
| $15,000 to $19,999 | 297 (1.4%) | 649 (3.9%) |
| $20,000 to $24,999 | 425 (2.0%) | 487 (2.9%) |
| $25,000 to $34,999 | 844 (4.1%) | 1,243 (7.5%) |
| $35,000 to $49,999 | 1,478 (7.1%) | 2,528 (15.2%) |
| $50,000 to $74,999 | 2,890 (13.9%) | 3,124 (18.8%) |
| $75,000 to $99,999 | 2,421 (11.6%) | 2,199 (13.2%) |
| $100,000 to $149,999 | 4,877 (23.4%) | 2,400 (14.4%) |
| $150,000 or more | 7,087 (34.0%) | 2,206 (13.2%) |
| Total | 20,817 (100.0%) | 16,661 (100.0%) |
Monthly Housing Cost Tiers in Nashua
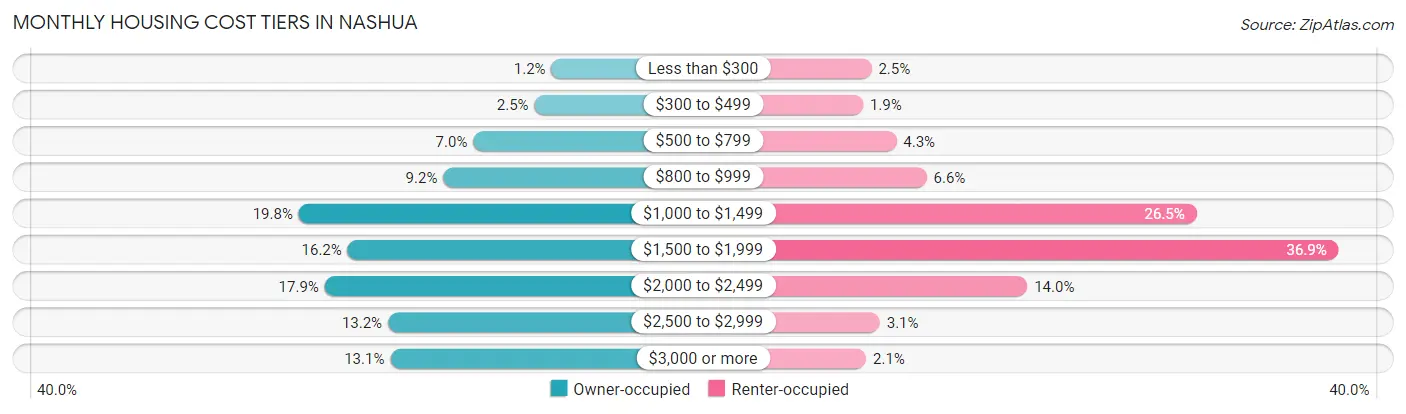
| Monthly Cost | Owner-occupied | Renter-occupied |
| Less than $300 | 249 (1.2%) | 418 (2.5%) |
| $300 to $499 | 509 (2.5%) | 314 (1.9%) |
| $500 to $799 | 1,449 (7.0%) | 723 (4.3%) |
| $800 to $999 | 1,909 (9.2%) | 1,095 (6.6%) |
| $1,000 to $1,499 | 4,123 (19.8%) | 4,407 (26.5%) |
| $1,500 to $1,999 | 3,375 (16.2%) | 6,149 (36.9%) |
| $2,000 to $2,499 | 3,727 (17.9%) | 2,330 (14.0%) |
| $2,500 to $2,999 | 2,756 (13.2%) | 520 (3.1%) |
| $3,000 or more | 2,720 (13.1%) | 351 (2.1%) |
| Total | 20,817 (100.0%) | 16,661 (100.0%) |
Physical Housing Characteristics in Nashua
Housing Structures in Nashua
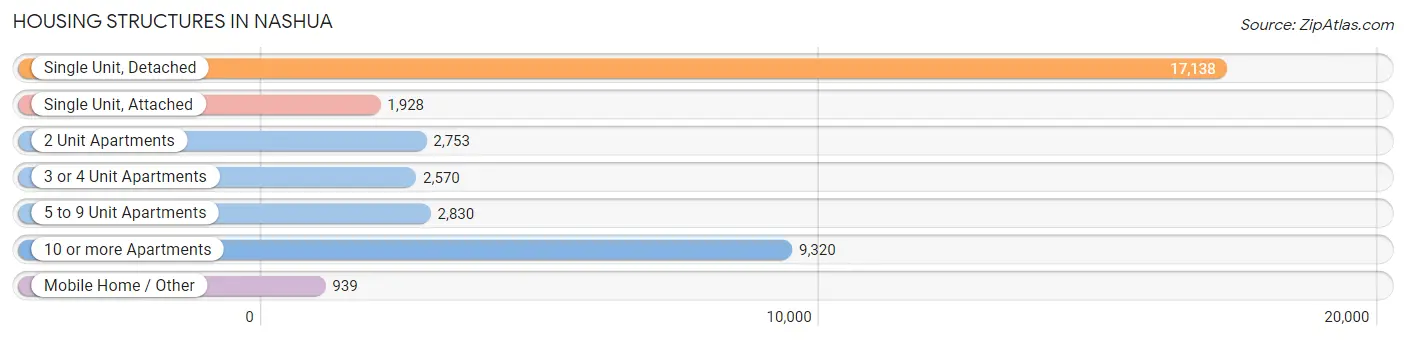
| Structure Type | # Housing Units | % Housing Units |
| Single Unit, Detached | 17,138 | 45.7% |
| Single Unit, Attached | 1,928 | 5.1% |
| 2 Unit Apartments | 2,753 | 7.3% |
| 3 or 4 Unit Apartments | 2,570 | 6.9% |
| 5 to 9 Unit Apartments | 2,830 | 7.5% |
| 10 or more Apartments | 9,320 | 24.9% |
| Mobile Home / Other | 939 | 2.5% |
| Total | 37,478 | 100.0% |
Housing Structures by Occupancy in Nashua
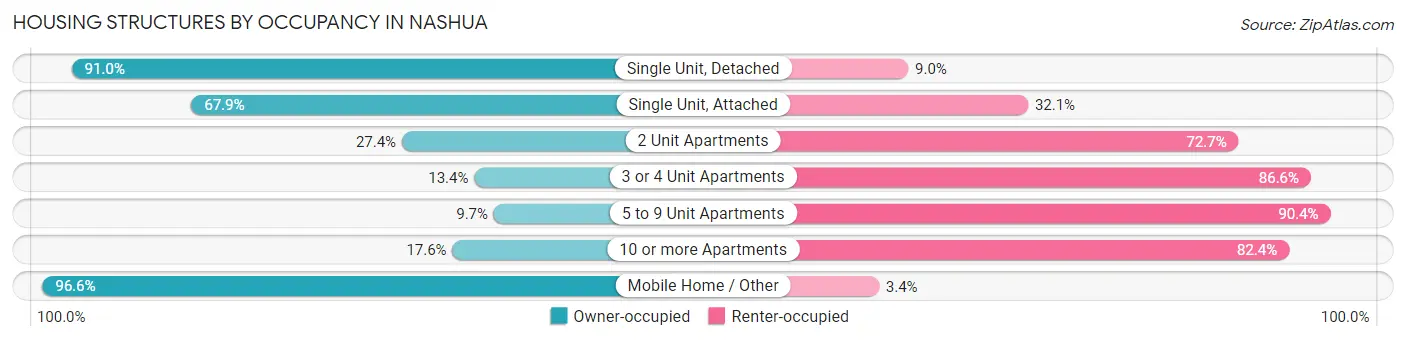
| Structure Type | Owner-occupied | Renter-occupied |
| Single Unit, Detached | 15,588 (91.0%) | 1,550 (9.0%) |
| Single Unit, Attached | 1,309 (67.9%) | 619 (32.1%) |
| 2 Unit Apartments | 753 (27.4%) | 2,000 (72.7%) |
| 3 or 4 Unit Apartments | 345 (13.4%) | 2,225 (86.6%) |
| 5 to 9 Unit Apartments | 273 (9.7%) | 2,557 (90.3%) |
| 10 or more Apartments | 1,642 (17.6%) | 7,678 (82.4%) |
| Mobile Home / Other | 907 (96.6%) | 32 (3.4%) |
| Total | 20,817 (55.5%) | 16,661 (44.5%) |
Housing Structures by Number of Rooms in Nashua
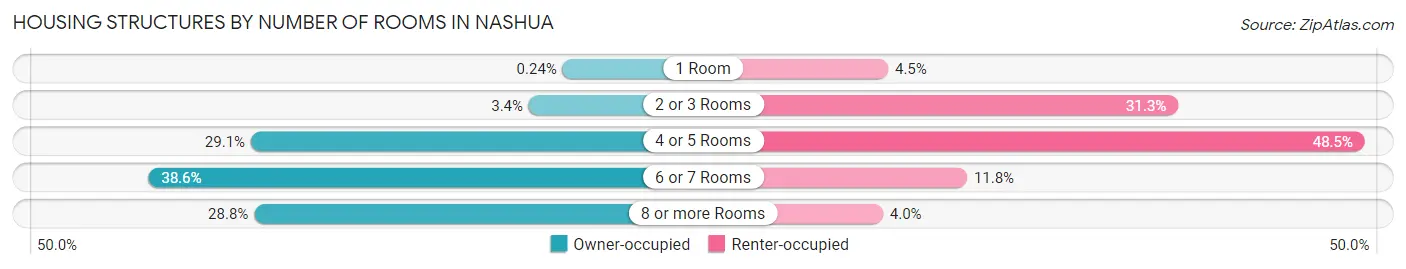
| Number of Rooms | Owner-occupied | Renter-occupied |
| 1 Room | 49 (0.2%) | 742 (4.4%) |
| 2 or 3 Rooms | 700 (3.4%) | 5,212 (31.3%) |
| 4 or 5 Rooms | 6,051 (29.1%) | 8,088 (48.5%) |
| 6 or 7 Rooms | 8,027 (38.6%) | 1,957 (11.7%) |
| 8 or more Rooms | 5,990 (28.8%) | 662 (4.0%) |
| Total | 20,817 (100.0%) | 16,661 (100.0%) |
Housing Structure by Heating Type in Nashua
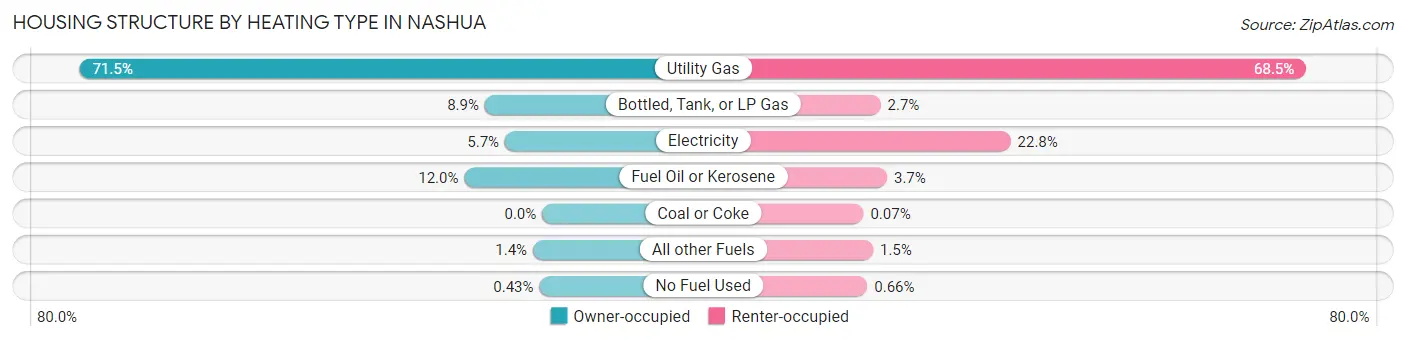
| Heating Type | Owner-occupied | Renter-occupied |
| Utility Gas | 14,887 (71.5%) | 11,411 (68.5%) |
| Bottled, Tank, or LP Gas | 1,845 (8.9%) | 454 (2.7%) |
| Electricity | 1,195 (5.7%) | 3,800 (22.8%) |
| Fuel Oil or Kerosene | 2,504 (12.0%) | 618 (3.7%) |
| Coal or Coke | 0 (0.0%) | 11 (0.1%) |
| All other Fuels | 296 (1.4%) | 257 (1.5%) |
| No Fuel Used | 90 (0.4%) | 110 (0.7%) |
| Total | 20,817 (100.0%) | 16,661 (100.0%) |
Household Vehicle Usage in Nashua
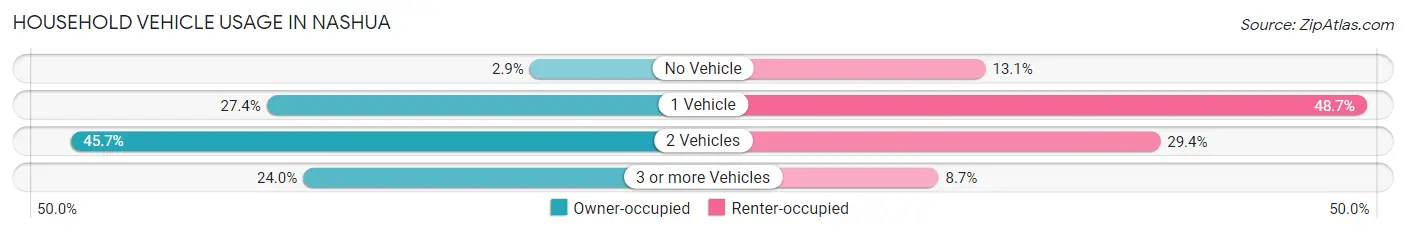
| Vehicles per Household | Owner-occupied | Renter-occupied |
| No Vehicle | 596 (2.9%) | 2,187 (13.1%) |
| 1 Vehicle | 5,705 (27.4%) | 8,112 (48.7%) |
| 2 Vehicles | 9,518 (45.7%) | 4,905 (29.4%) |
| 3 or more Vehicles | 4,998 (24.0%) | 1,457 (8.7%) |
| Total | 20,817 (100.0%) | 16,661 (100.0%) |
Real Estate & Mortgages in Nashua
Real Estate and Mortgage Overview in Nashua
| Characteristic | Without Mortgage | With Mortgage |
| Housing Units | 6,893 | 13,924 |
| Median Property Value | $319,600 | $355,700 |
| Median Household Income | $77,116 | $5,555 |
| Monthly Housing Costs | $976 | $2,720 |
| Real Estate Taxes | $6,095 | $83 |
Property Value by Mortgage Status in Nashua
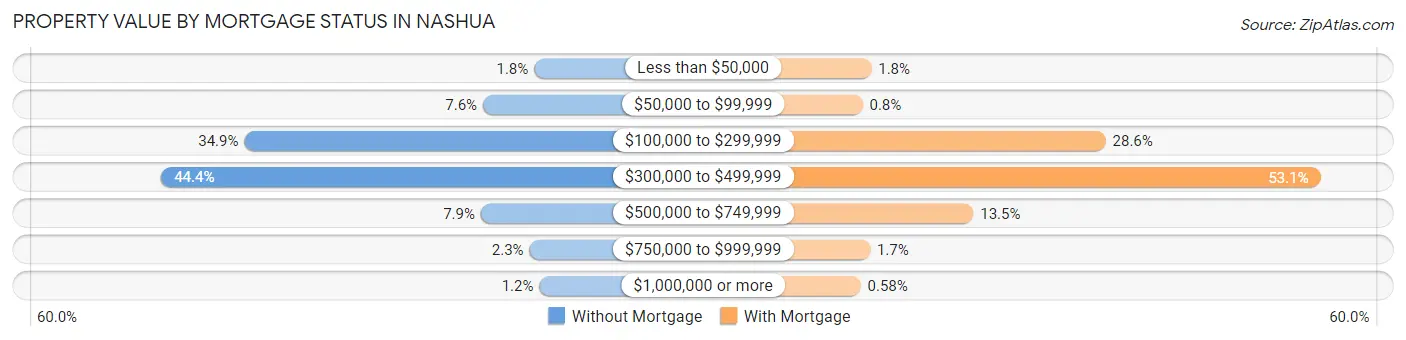
| Property Value | Without Mortgage | With Mortgage |
| Less than $50,000 | 122 (1.8%) | 251 (1.8%) |
| $50,000 to $99,999 | 525 (7.6%) | 111 (0.8%) |
| $100,000 to $299,999 | 2,405 (34.9%) | 3,979 (28.6%) |
| $300,000 to $499,999 | 3,059 (44.4%) | 7,398 (53.1%) |
| $500,000 to $749,999 | 542 (7.9%) | 1,874 (13.5%) |
| $750,000 to $999,999 | 159 (2.3%) | 230 (1.7%) |
| $1,000,000 or more | 81 (1.2%) | 81 (0.6%) |
| Total | 6,893 (100.0%) | 13,924 (100.0%) |
Household Income by Mortgage Status in Nashua
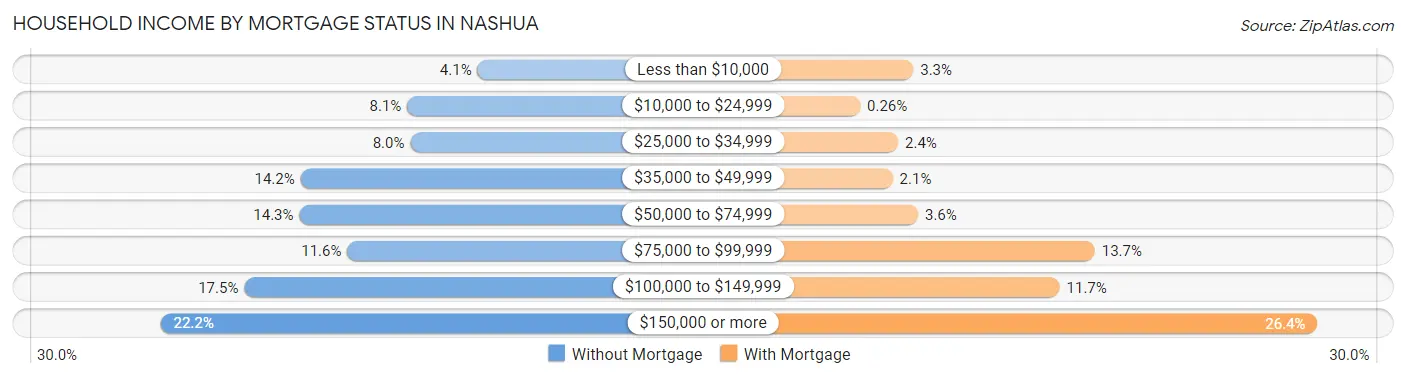
| Household Income | Without Mortgage | With Mortgage |
| Less than $10,000 | 284 (4.1%) | 459 (3.3%) |
| $10,000 to $24,999 | 561 (8.1%) | 36 (0.3%) |
| $25,000 to $34,999 | 549 (8.0%) | 339 (2.4%) |
| $35,000 to $49,999 | 981 (14.2%) | 295 (2.1%) |
| $50,000 to $74,999 | 986 (14.3%) | 497 (3.6%) |
| $75,000 to $99,999 | 797 (11.6%) | 1,904 (13.7%) |
| $100,000 to $149,999 | 1,203 (17.4%) | 1,624 (11.7%) |
| $150,000 or more | 1,532 (22.2%) | 3,674 (26.4%) |
| Total | 6,893 (100.0%) | 13,924 (100.0%) |
Property Value to Household Income Ratio in Nashua
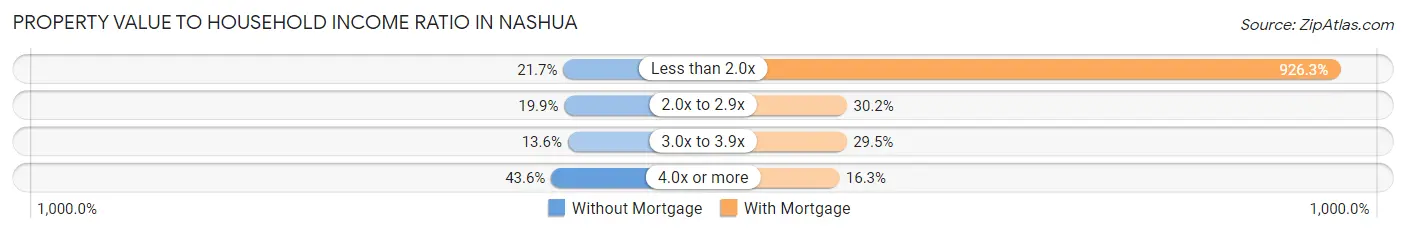
| Value-to-Income Ratio | Without Mortgage | With Mortgage |
| Less than 2.0x | 1,493 (21.7%) | 128,976 (926.3%) |
| 2.0x to 2.9x | 1,374 (19.9%) | 4,210 (30.2%) |
| 3.0x to 3.9x | 940 (13.6%) | 4,110 (29.5%) |
| 4.0x or more | 3,008 (43.6%) | 2,263 (16.3%) |
| Total | 6,893 (100.0%) | 13,924 (100.0%) |
Real Estate Taxes by Mortgage Status in Nashua
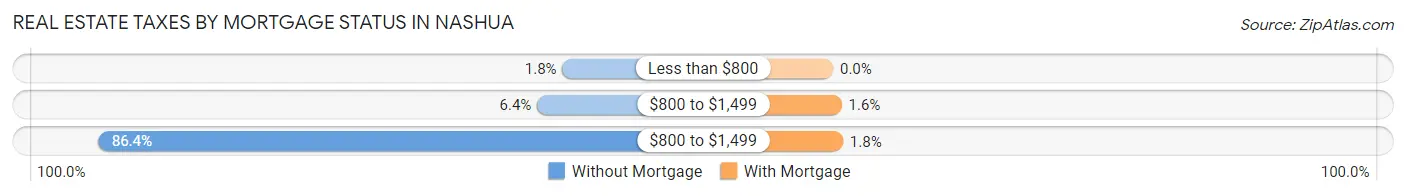
| Property Taxes | Without Mortgage | With Mortgage |
| Less than $800 | 122 (1.8%) | 0 (0.0%) |
| $800 to $1,499 | 440 (6.4%) | 217 (1.6%) |
| $800 to $1,499 | 5,958 (86.4%) | 250 (1.8%) |
| Total | 6,893 (100.0%) | 13,924 (100.0%) |
Health & Disability in Nashua
Health Insurance Coverage by Age in Nashua
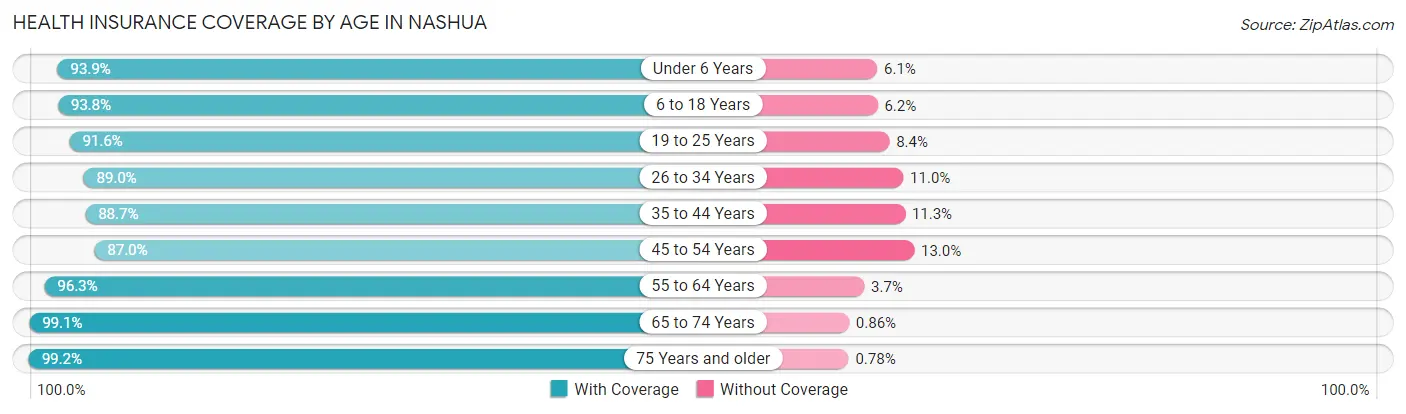
| Age Bracket | With Coverage | Without Coverage |
| Under 6 Years | 5,739 (93.9%) | 374 (6.1%) |
| 6 to 18 Years | 10,919 (93.8%) | 720 (6.2%) |
| 19 to 25 Years | 7,655 (91.6%) | 699 (8.4%) |
| 26 to 34 Years | 12,116 (89.0%) | 1,494 (11.0%) |
| 35 to 44 Years | 9,902 (88.7%) | 1,263 (11.3%) |
| 45 to 54 Years | 10,314 (87.0%) | 1,543 (13.0%) |
| 55 to 64 Years | 12,570 (96.3%) | 481 (3.7%) |
| 65 to 74 Years | 8,805 (99.1%) | 76 (0.9%) |
| 75 Years and older | 5,603 (99.2%) | 44 (0.8%) |
| Total | 83,623 (92.6%) | 6,694 (7.4%) |
Health Insurance Coverage by Citizenship Status in Nashua
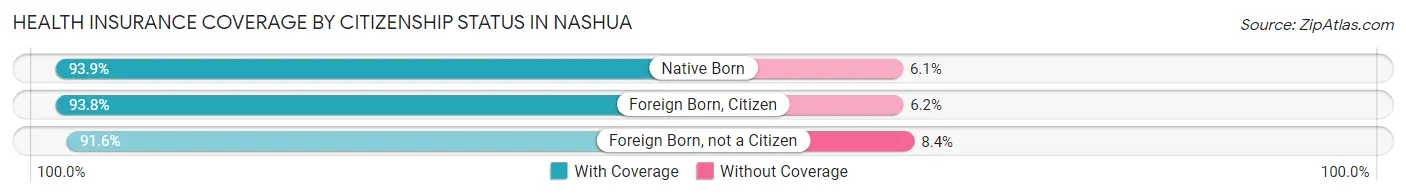
| Citizenship Status | With Coverage | Without Coverage |
| Native Born | 5,739 (93.9%) | 374 (6.1%) |
| Foreign Born, Citizen | 10,919 (93.8%) | 720 (6.2%) |
| Foreign Born, not a Citizen | 7,655 (91.6%) | 699 (8.4%) |
Health Insurance Coverage by Household Income in Nashua
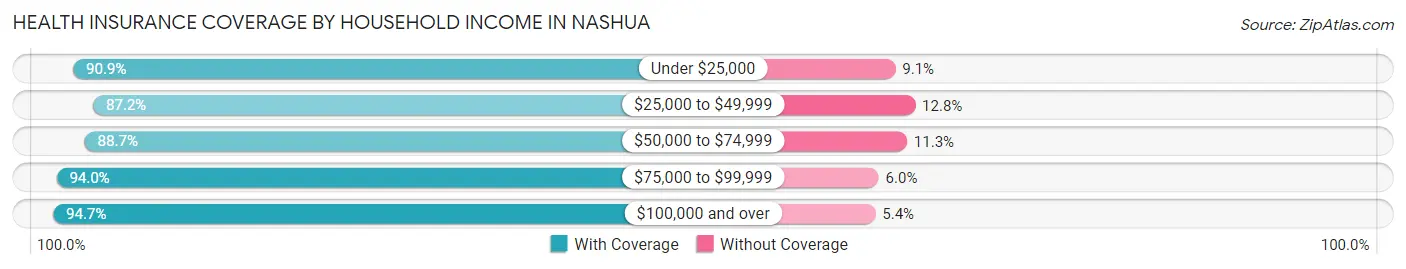
| Household Income | With Coverage | Without Coverage |
| Under $25,000 | 5,697 (90.9%) | 570 (9.1%) |
| $25,000 to $49,999 | 8,930 (87.2%) | 1,312 (12.8%) |
| $50,000 to $74,999 | 11,675 (88.7%) | 1,482 (11.3%) |
| $75,000 to $99,999 | 9,693 (94.0%) | 615 (6.0%) |
| $100,000 and over | 46,760 (94.7%) | 2,642 (5.3%) |
Public vs Private Health Insurance Coverage by Age in Nashua
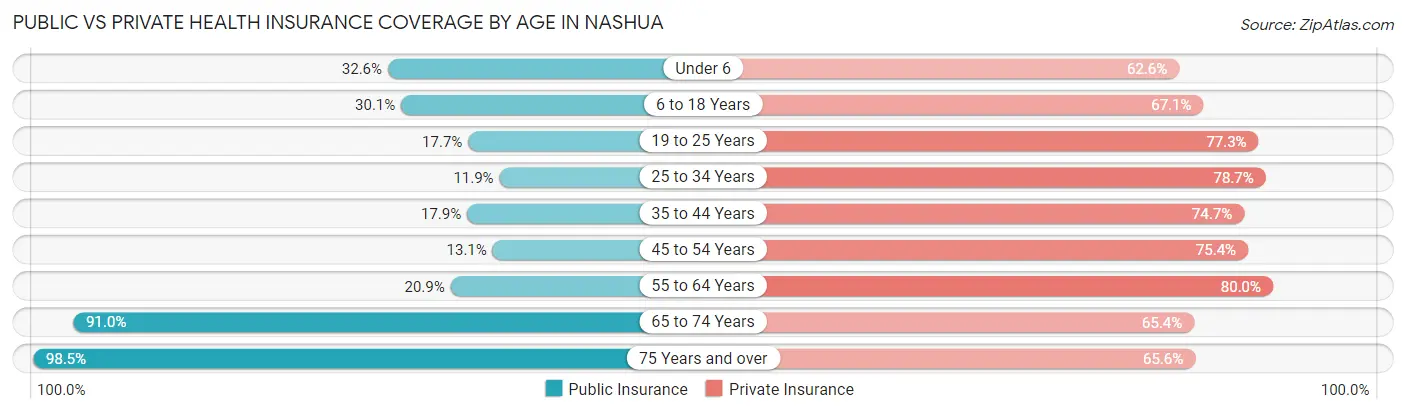
| Age Bracket | Public Insurance | Private Insurance |
| Under 6 | 1,991 (32.6%) | 3,826 (62.6%) |
| 6 to 18 Years | 3,505 (30.1%) | 7,811 (67.1%) |
| 19 to 25 Years | 1,476 (17.7%) | 6,460 (77.3%) |
| 25 to 34 Years | 1,614 (11.9%) | 10,705 (78.7%) |
| 35 to 44 Years | 1,996 (17.9%) | 8,338 (74.7%) |
| 45 to 54 Years | 1,557 (13.1%) | 8,938 (75.4%) |
| 55 to 64 Years | 2,733 (20.9%) | 10,442 (80.0%) |
| 65 to 74 Years | 8,083 (91.0%) | 5,807 (65.4%) |
| 75 Years and over | 5,560 (98.5%) | 3,703 (65.6%) |
| Total | 28,515 (31.6%) | 66,030 (73.1%) |
Disability Status by Sex by Age in Nashua
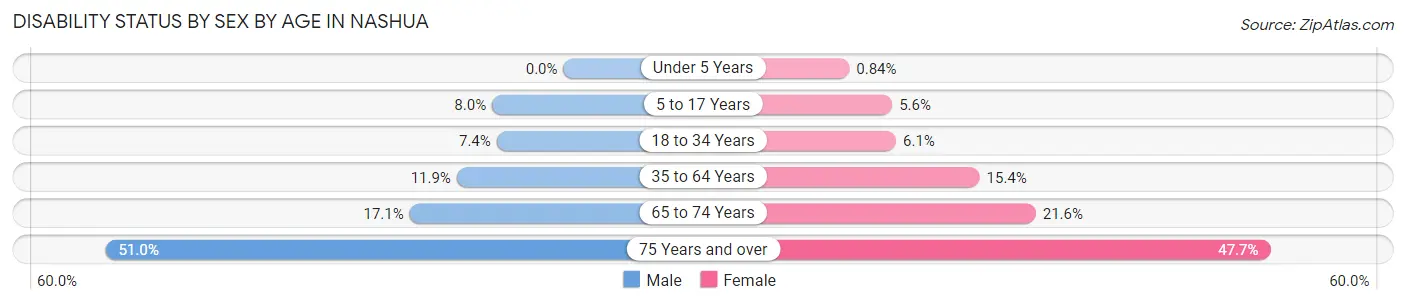
| Age Bracket | Male | Female |
| Under 5 Years | 0 (0.0%) | 20 (0.8%) |
| 5 to 17 Years | 480 (8.0%) | 331 (5.6%) |
| 18 to 34 Years | 912 (7.4%) | 628 (6.0%) |
| 35 to 64 Years | 2,236 (11.9%) | 2,648 (15.3%) |
| 65 to 74 Years | 708 (17.1%) | 1,026 (21.6%) |
| 75 Years and over | 1,158 (51.0%) | 1,611 (47.7%) |
Disability Class by Sex by Age in Nashua
Disability Class: Hearing Difficulty
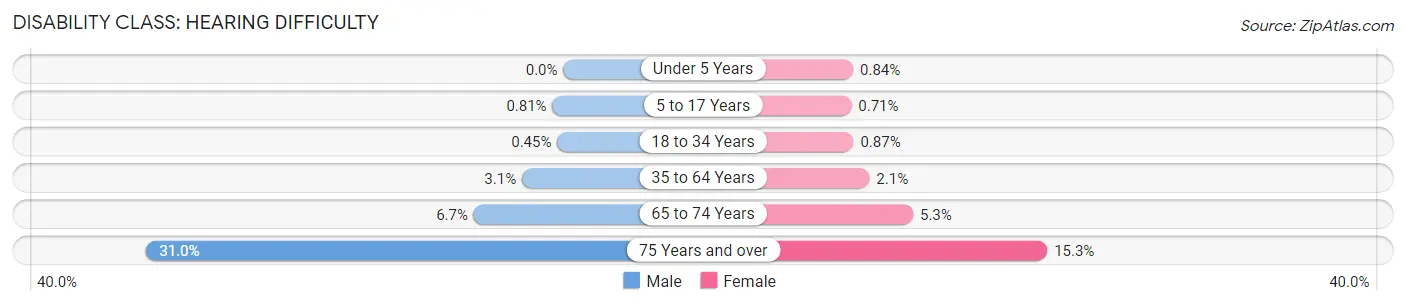
| Age Bracket | Male | Female |
| Under 5 Years | 0 (0.0%) | 20 (0.8%) |
| 5 to 17 Years | 49 (0.8%) | 42 (0.7%) |
| 18 to 34 Years | 55 (0.4%) | 90 (0.9%) |
| 35 to 64 Years | 578 (3.1%) | 354 (2.1%) |
| 65 to 74 Years | 275 (6.7%) | 251 (5.3%) |
| 75 Years and over | 703 (31.0%) | 515 (15.2%) |
Disability Class: Vision Difficulty
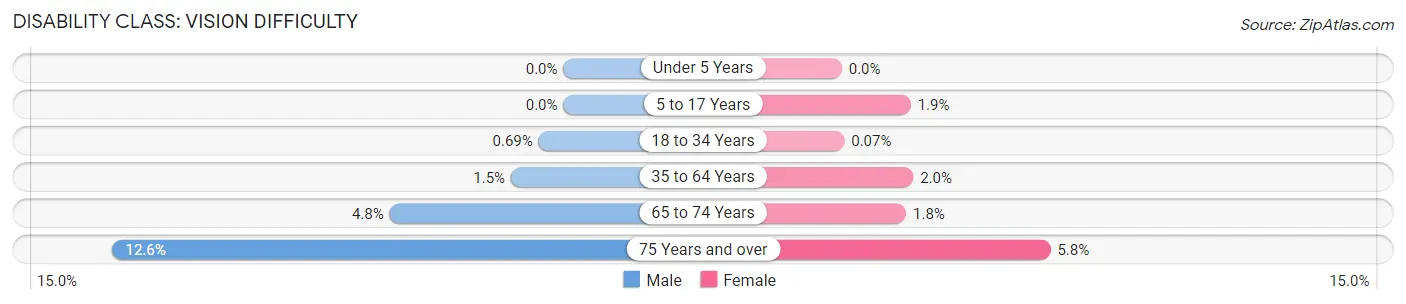
| Age Bracket | Male | Female |
| Under 5 Years | 0 (0.0%) | 0 (0.0%) |
| 5 to 17 Years | 0 (0.0%) | 113 (1.9%) |
| 18 to 34 Years | 85 (0.7%) | 7 (0.1%) |
| 35 to 64 Years | 274 (1.5%) | 343 (2.0%) |
| 65 to 74 Years | 200 (4.8%) | 85 (1.8%) |
| 75 Years and over | 285 (12.6%) | 196 (5.8%) |
Disability Class: Cognitive Difficulty
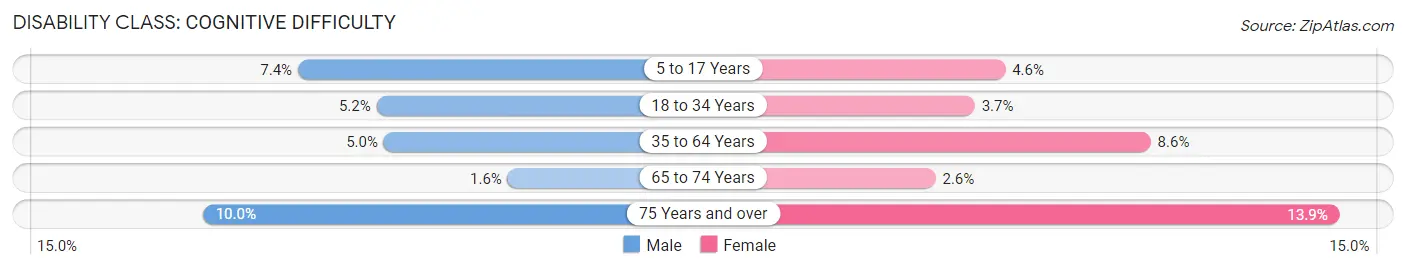
| Age Bracket | Male | Female |
| 5 to 17 Years | 446 (7.4%) | 268 (4.5%) |
| 18 to 34 Years | 638 (5.2%) | 384 (3.7%) |
| 35 to 64 Years | 941 (5.0%) | 1,483 (8.6%) |
| 65 to 74 Years | 64 (1.5%) | 124 (2.6%) |
| 75 Years and over | 228 (10.0%) | 468 (13.9%) |
Disability Class: Ambulatory Difficulty
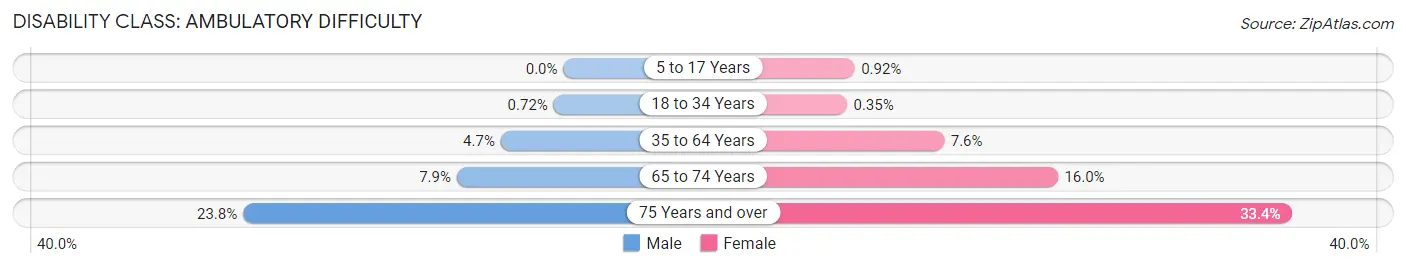
| Age Bracket | Male | Female |
| 5 to 17 Years | 0 (0.0%) | 54 (0.9%) |
| 18 to 34 Years | 88 (0.7%) | 36 (0.4%) |
| 35 to 64 Years | 875 (4.6%) | 1,306 (7.6%) |
| 65 to 74 Years | 327 (7.9%) | 760 (16.0%) |
| 75 Years and over | 540 (23.8%) | 1,129 (33.4%) |
Disability Class: Self-Care Difficulty
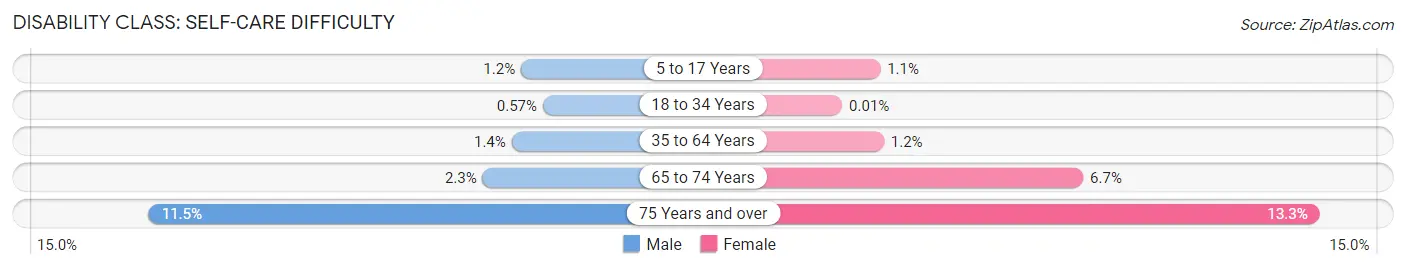
| Age Bracket | Male | Female |
| 5 to 17 Years | 71 (1.2%) | 63 (1.1%) |
| 18 to 34 Years | 70 (0.6%) | 1 (0.0%) |
| 35 to 64 Years | 271 (1.4%) | 202 (1.2%) |
| 65 to 74 Years | 93 (2.2%) | 319 (6.7%) |
| 75 Years and over | 262 (11.5%) | 449 (13.3%) |
Technology Access in Nashua
Computing Device Access in Nashua
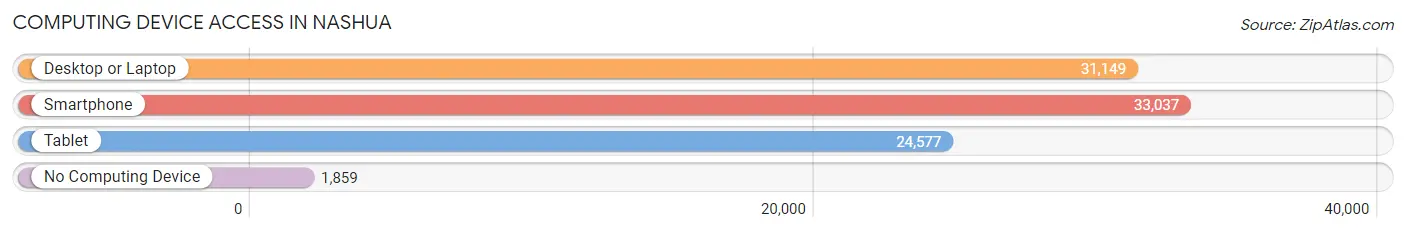
| Device Type | # Households | % Households |
| Desktop or Laptop | 31,149 | 83.1% |
| Smartphone | 33,037 | 88.1% |
| Tablet | 24,577 | 65.6% |
| No Computing Device | 1,859 | 5.0% |
| Total | 37,478 | 100.0% |
Internet Access in Nashua
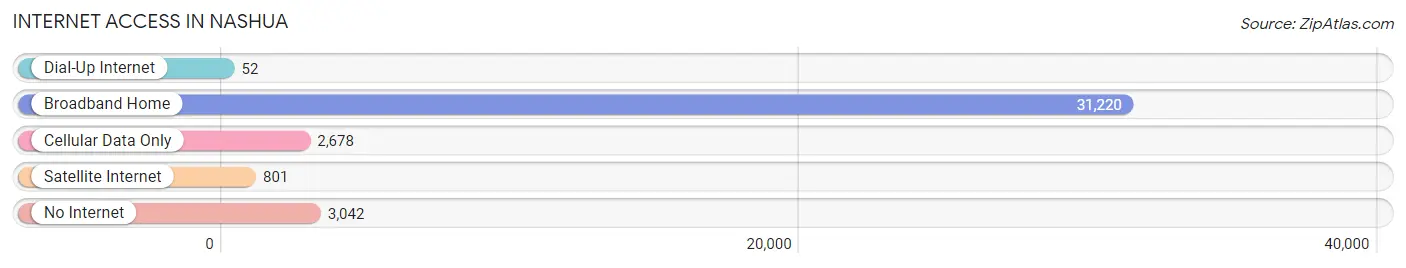
| Internet Type | # Households | % Households |
| Dial-Up Internet | 52 | 0.1% |
| Broadband Home | 31,220 | 83.3% |
| Cellular Data Only | 2,678 | 7.1% |
| Satellite Internet | 801 | 2.1% |
| No Internet | 3,042 | 8.1% |
| Total | 37,478 | 100.0% |
Nashua Summary
Nashua, New Hampshire is a city located in Hillsborough County in the southern part of the state. It is the second largest city in the state, with a population of 87,882 as of the 2010 census. The city is situated along the Merrimack River, which forms the border between New Hampshire and Massachusetts. Nashua is part of the Greater Boston metropolitan area, and is located approximately 40 miles northwest of Boston.
History
The area that is now Nashua was originally inhabited by the Pennacook Native American tribe. The first European settlers arrived in the area in 1656, and the town was officially incorporated in 1746. The town was named after the Nashaway tribe, which had inhabited the area prior to the arrival of the Europeans.
In the 19th century, Nashua became an important industrial center, with several mills and factories located along the Merrimack River. The city was also home to the first cotton mill in the United States, which was built in 1823. The city continued to grow and prosper throughout the 19th and 20th centuries, and today it is a major commercial and industrial center.
Geography
Nashua is located in southern New Hampshire, in Hillsborough County. The city is situated along the Merrimack River, which forms the border between New Hampshire and Massachusetts. The city covers an area of approximately 33.2 square miles, and has a population density of 2,637 people per square mile.
The city is located in the Merrimack Valley region of New Hampshire, and is part of the Greater Boston metropolitan area. The city is located approximately 40 miles northwest of Boston, and is easily accessible via Interstate 93 and Route 3.
Economy
Nashua is a major commercial and industrial center in New Hampshire. The city is home to several large companies, including BAE Systems, Fidelity Investments, and Hewlett Packard. The city is also home to several smaller businesses, including software companies, medical device manufacturers, and financial services firms.
The city is also home to several educational institutions, including Rivier University, Nashua Community College, and the University of New Hampshire at Manchester.
Demographics
As of the 2010 census, Nashua had a population of 87,882. The city has a population density of 2,637 people per square mile. The racial makeup of the city is 87.3% White, 4.2% African American, 0.3% Native American, 4.2% Asian, 0.1% Pacific Islander, and 3.9% from other races.
The median household income in Nashua is $63,945, and the median family income is $76,845. The city has a poverty rate of 8.7%. The largest employers in the city are BAE Systems, Fidelity Investments, and Hewlett Packard.
Nashua is a diverse and vibrant city, with a rich history and a strong economy. The city is home to several large companies, educational institutions, and cultural attractions. The city is also home to a diverse population, with a variety of racial and ethnic backgrounds. Nashua is an important part of the Greater Boston metropolitan area, and is an ideal place to live, work, and play.
Common Questions
What is Per Capita Income in Nashua?
Per Capita income in Nashua is $48,083.
What is the Median Family Income in Nashua?
Median Family Income in Nashua is $109,271.
What is the Median Household income in Nashua?
Median Household Income in Nashua is $88,766.
What is Income or Wage Gap in Nashua?
Income or Wage Gap in Nashua is 31.4%.
Women in Nashua earn 68.6 cents for every dollar earned by a man.
What is Family Income Deficit in Nashua?
Family Income Deficit in Nashua is $11,377.
Families that are below poverty line in Nashua earn $11,377 less on average than the poverty threshold level.
What is Inequality or Gini Index in Nashua?
Inequality or Gini Index in Nashua is 0.43.
What is the Total Population of Nashua?
Total Population of Nashua is 90,943.
What is the Total Male Population of Nashua?
Total Male Population of Nashua is 46,635.
What is the Total Female Population of Nashua?
Total Female Population of Nashua is 44,308.
What is the Ratio of Males per 100 Females in Nashua?
There are 105.25 Males per 100 Females in Nashua.
What is the Ratio of Females per 100 Males in Nashua?
There are 95.01 Females per 100 Males in Nashua.
What is the Median Population Age in Nashua?
Median Population Age in Nashua is 40.1 Years.
What is the Average Family Size in Nashua
Average Family Size in Nashua is 3.0 People.
What is the Average Household Size in Nashua
Average Household Size in Nashua is 2.4 People.
How Large is the Labor Force in Nashua?
There are 54,364 People in the Labor Forcein in Nashua.
What is the Percentage of People in the Labor Force in Nashua?
71.7% of People are in the Labor Force in Nashua.
What is the Unemployment Rate in Nashua?
Unemployment Rate in Nashua is 5.1%.