Colorado Springs, CO Map & Demographics
Colorado Springs Map
Colorado Springs Overview
$41,849
PER CAPITA INCOME
$95,492
AVG FAMILY INCOME
$79,026
AVG HOUSEHOLD INCOME
27.3%
WAGE / INCOME GAP [ % ]
72.7¢/ $1
WAGE / INCOME GAP [ $ ]
$11,904
FAMILY INCOME DEFICIT
0.44
INEQUALITY / GINI INDEX
479,612
TOTAL POPULATION
240,854
MALE POPULATION
238,758
FEMALE POPULATION
100.88
MALES / 100 FEMALES
99.13
FEMALES / 100 MALES
35.1
MEDIAN AGE
3.0
AVG FAMILY SIZE
2.4
AVG HOUSEHOLD SIZE
262,650
LABOR FORCE [ PEOPLE ]
68.3%
PERCENT IN LABOR FORCE
5.6%
UNEMPLOYMENT RATE
Colorado Springs Zip Codes
Colorado Springs Area Codes
Income in Colorado Springs
Income Overview in Colorado Springs
Per Capita Income in Colorado Springs is $41,849, while median incomes of families and households are $95,492 and $79,026 respectively.
| Characteristic | Number | Measure |
| Per Capita Income | 479,612 | $41,849 |
| Median Family Income | 121,711 | $95,492 |
| Mean Family Income | 121,711 | $119,234 |
| Median Household Income | 193,149 | $79,026 |
| Mean Household Income | 193,149 | $102,139 |
| Income Deficit | 121,711 | $11,904 |
| Wage / Income Gap (%) | 479,612 | 27.27% |
| Wage / Income Gap ($) | 479,612 | 72.73¢ per $1 |
| Gini / Inequality Index | 479,612 | 0.44 |
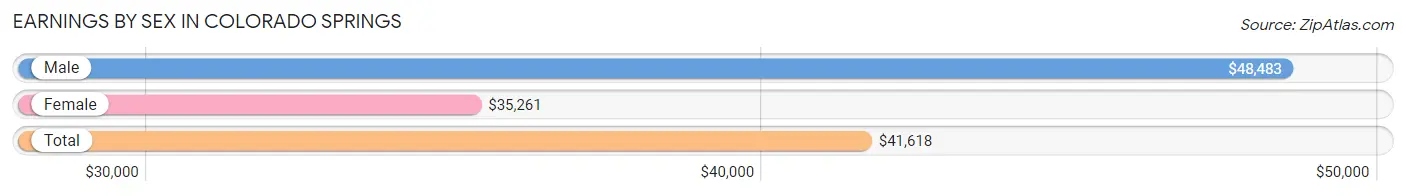
Earnings by Sex in Colorado Springs
Average Earnings in Colorado Springs are $41,618, $48,483 for men and $35,261 for women, a difference of 27.3%.
| Sex | Number | Average Earnings |
| Male | 148,414 (54.3%) | $48,483 |
| Female | 124,665 (45.7%) | $35,261 |
| Total | 273,079 (100.0%) | $41,618 |
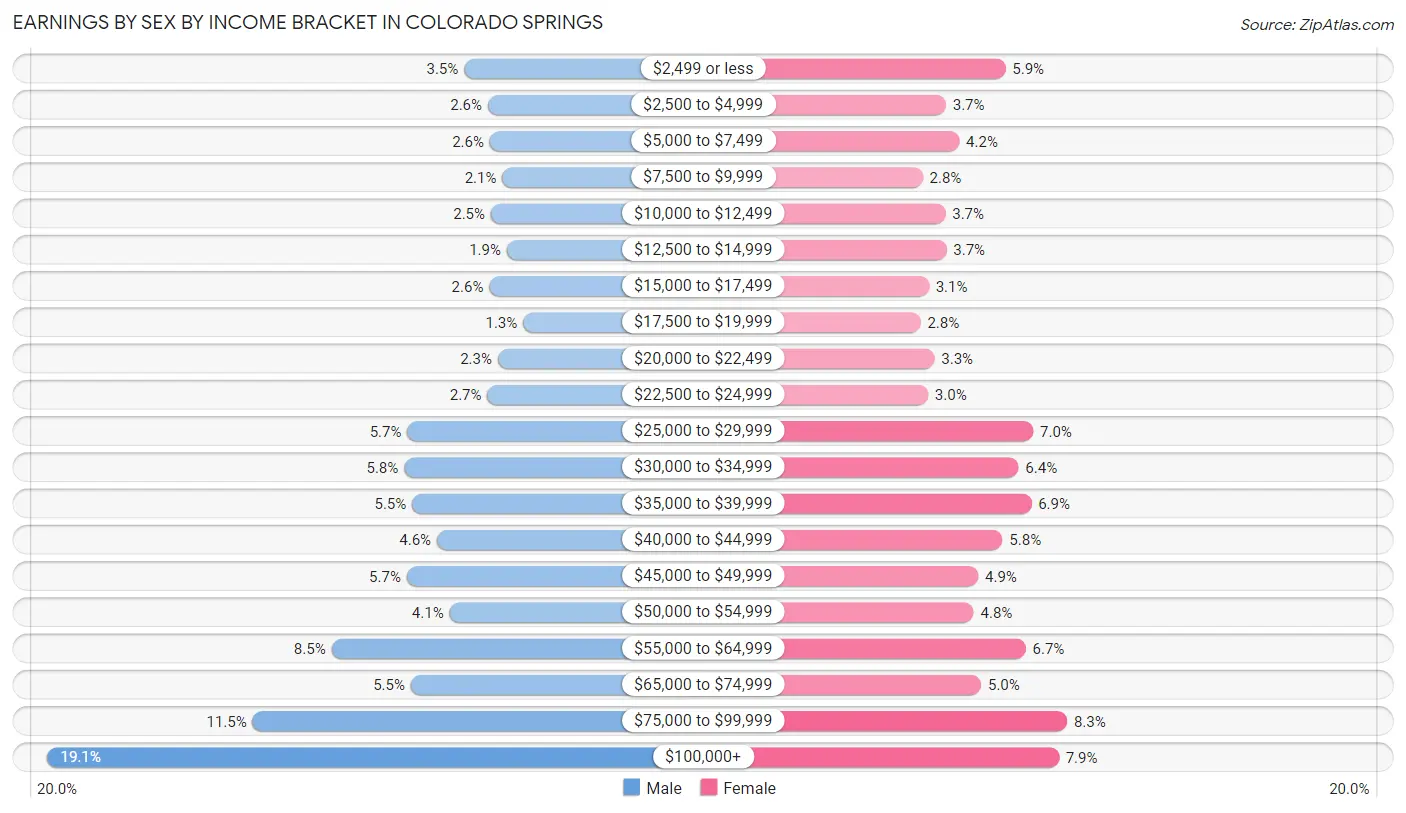
Earnings by Sex by Income Bracket in Colorado Springs
The most common earnings brackets in Colorado Springs are $100,000+ for men (28,409 | 19.1%) and $75,000 to $99,999 for women (10,288 | 8.3%).
| Income | Male | Female |
| $2,499 or less | 5,242 (3.5%) | 7,401 (5.9%) |
| $2,500 to $4,999 | 3,920 (2.6%) | 4,629 (3.7%) |
| $5,000 to $7,499 | 3,817 (2.6%) | 5,250 (4.2%) |
| $7,500 to $9,999 | 3,112 (2.1%) | 3,539 (2.8%) |
| $10,000 to $12,499 | 3,754 (2.5%) | 4,601 (3.7%) |
| $12,500 to $14,999 | 2,860 (1.9%) | 4,644 (3.7%) |
| $15,000 to $17,499 | 3,845 (2.6%) | 3,824 (3.1%) |
| $17,500 to $19,999 | 1,960 (1.3%) | 3,444 (2.8%) |
| $20,000 to $22,499 | 3,373 (2.3%) | 4,083 (3.3%) |
| $22,500 to $24,999 | 3,951 (2.7%) | 3,784 (3.0%) |
| $25,000 to $29,999 | 8,394 (5.7%) | 8,699 (7.0%) |
| $30,000 to $34,999 | 8,576 (5.8%) | 8,013 (6.4%) |
| $35,000 to $39,999 | 8,130 (5.5%) | 8,617 (6.9%) |
| $40,000 to $44,999 | 6,751 (4.5%) | 7,264 (5.8%) |
| $45,000 to $49,999 | 8,437 (5.7%) | 6,135 (4.9%) |
| $50,000 to $54,999 | 6,053 (4.1%) | 5,922 (4.8%) |
| $55,000 to $64,999 | 12,615 (8.5%) | 8,356 (6.7%) |
| $65,000 to $74,999 | 8,205 (5.5%) | 6,276 (5.0%) |
| $75,000 to $99,999 | 17,010 (11.5%) | 10,288 (8.3%) |
| $100,000+ | 28,409 (19.1%) | 9,896 (7.9%) |
| Total | 148,414 (100.0%) | 124,665 (100.0%) |
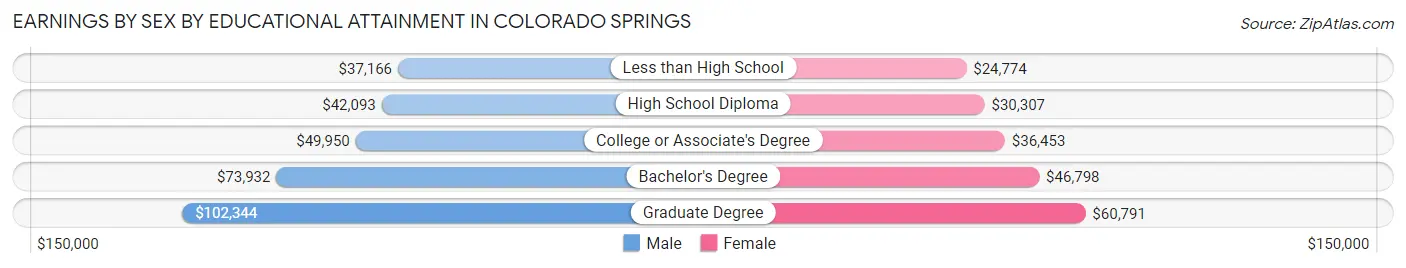
Earnings by Sex by Educational Attainment in Colorado Springs
Average earnings in Colorado Springs are $57,187 for men and $40,425 for women, a difference of 29.3%. Men with an educational attainment of graduate degree enjoy the highest average annual earnings of $102,344, while those with less than high school education earn the least with $37,166. Women with an educational attainment of graduate degree earn the most with the average annual earnings of $60,791, while those with less than high school education have the smallest earnings of $24,774.
| Educational Attainment | Male Income | Female Income |
| Less than High School | $37,166 | $24,774 |
| High School Diploma | $42,093 | $30,307 |
| College or Associate's Degree | $49,950 | $36,453 |
| Bachelor's Degree | $73,932 | $46,798 |
| Graduate Degree | $102,344 | $60,791 |
| Total | $57,187 | $40,425 |
Family Income in Colorado Springs
Family Income Brackets in Colorado Springs
According to the Colorado Springs family income data, there are 27,507 families falling into the $100,000 to $149,999 income range, which is the most common income bracket and makes up 22.6% of all families. Conversely, the $10,000 to $14,999 income bracket is the least frequent group with only 1,704 families (1.4%) belonging to this category.
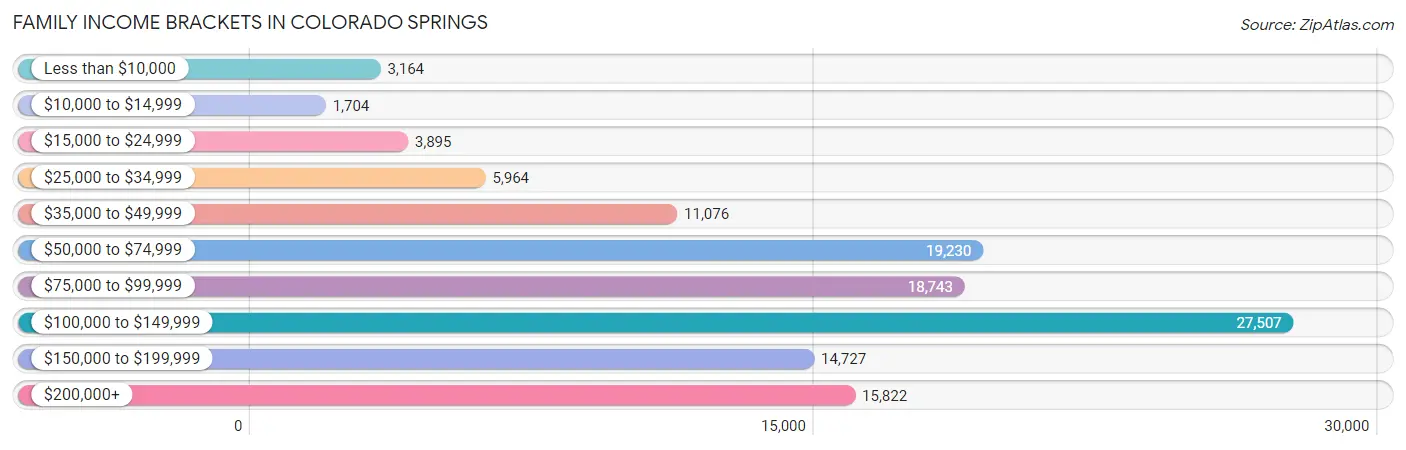
| Income Bracket | # Families | % Families |
| Less than $10,000 | 3,164 | 2.6% |
| $10,000 to $14,999 | 1,704 | 1.4% |
| $15,000 to $24,999 | 3,895 | 3.2% |
| $25,000 to $34,999 | 5,964 | 4.9% |
| $35,000 to $49,999 | 11,076 | 9.1% |
| $50,000 to $74,999 | 19,230 | 15.8% |
| $75,000 to $99,999 | 18,743 | 15.4% |
| $100,000 to $149,999 | 27,507 | 22.6% |
| $150,000 to $199,999 | 14,727 | 12.1% |
| $200,000+ | 15,822 | 13.0% |
Family Income by Famaliy Size in Colorado Springs
6-person families (3,344 | 2.8%) account for the highest median family income in Colorado Springs with $122,481 per family, while 2-person families (60,603 | 49.8%) have the highest median income of $43,960 per family member.
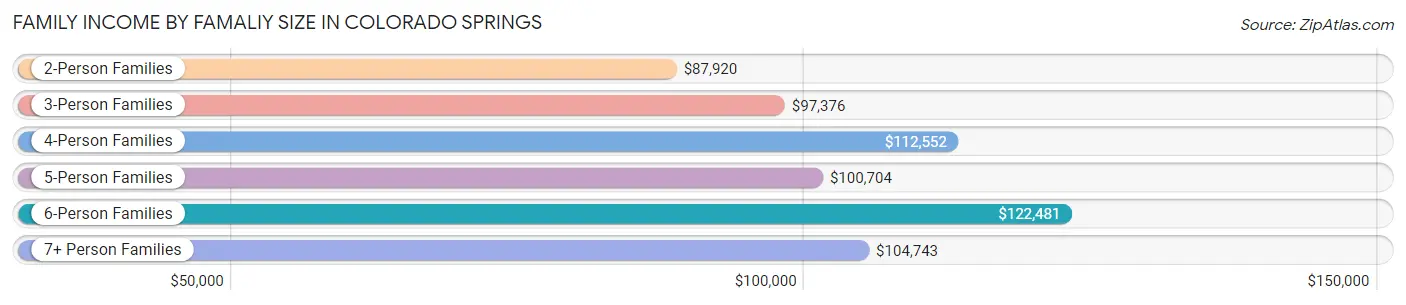
| Income Bracket | # Families | Median Income |
| 2-Person Families | 60,603 (49.8%) | $87,920 |
| 3-Person Families | 25,469 (20.9%) | $97,376 |
| 4-Person Families | 21,206 (17.4%) | $112,552 |
| 5-Person Families | 9,704 (8.0%) | $100,704 |
| 6-Person Families | 3,344 (2.8%) | $122,481 |
| 7+ Person Families | 1,385 (1.1%) | $104,743 |
| Total | 121,711 (100.0%) | $95,492 |
Family Income by Number of Earners in Colorado Springs
The median family income in Colorado Springs is $95,492, with families comprising 3+ earners (11,783) having the highest median family income of $136,357, while families with no earners (15,476) have the lowest median family income of $65,443, accounting for 9.7% and 12.7% of families, respectively.
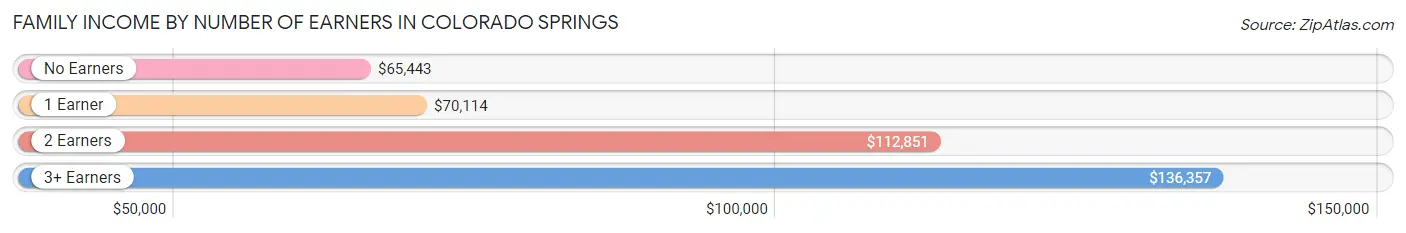
| Number of Earners | # Families | Median Income |
| No Earners | 15,476 (12.7%) | $65,443 |
| 1 Earner | 38,868 (31.9%) | $70,114 |
| 2 Earners | 55,584 (45.7%) | $112,851 |
| 3+ Earners | 11,783 (9.7%) | $136,357 |
| Total | 121,711 (100.0%) | $95,492 |
Household Income in Colorado Springs
Household Income Brackets in Colorado Springs
With 36,891 households falling in the category, the $100,000 to $149,999 income range is the most frequent in Colorado Springs, accounting for 19.1% of all households. In contrast, only 5,408 households (2.8%) fall into the $10,000 to $14,999 income bracket, making it the least populous group.
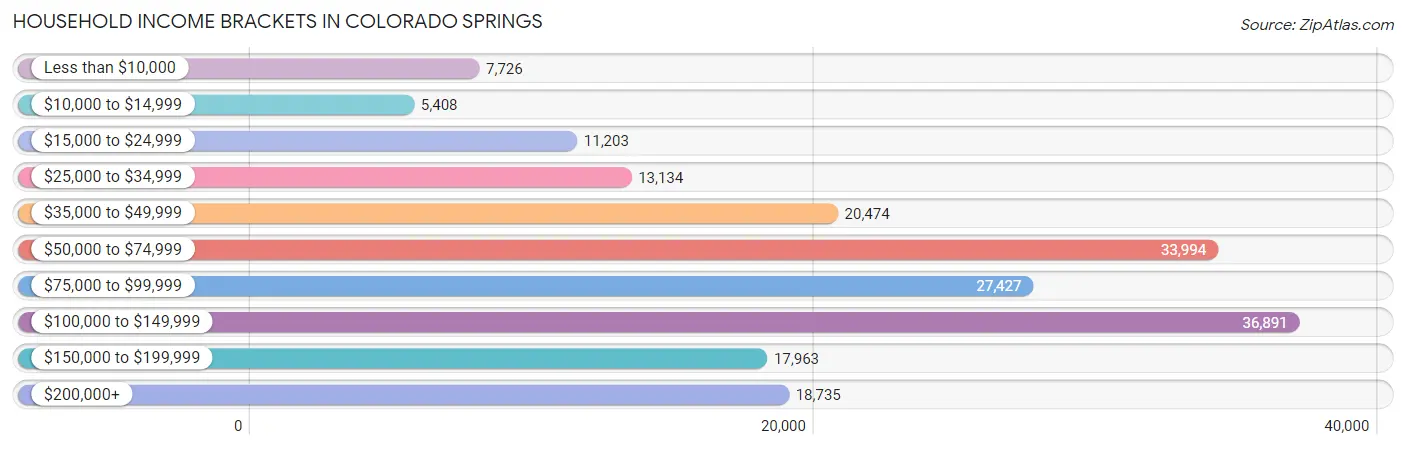
| Income Bracket | # Households | % Households |
| Less than $10,000 | 7,726 | 4.0% |
| $10,000 to $14,999 | 5,408 | 2.8% |
| $15,000 to $24,999 | 11,203 | 5.8% |
| $25,000 to $34,999 | 13,134 | 6.8% |
| $35,000 to $49,999 | 20,474 | 10.6% |
| $50,000 to $74,999 | 33,994 | 17.6% |
| $75,000 to $99,999 | 27,427 | 14.2% |
| $100,000 to $149,999 | 36,891 | 19.1% |
| $150,000 to $199,999 | 17,963 | 9.3% |
| $200,000+ | 18,735 | 9.7% |
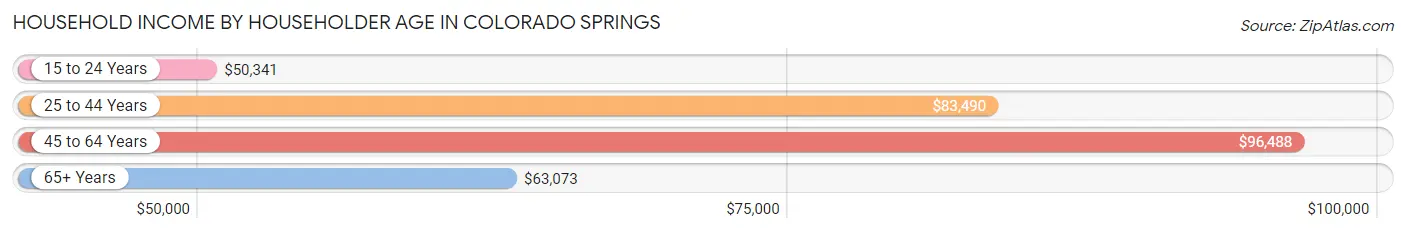
Household Income by Householder Age in Colorado Springs
The median household income in Colorado Springs is $79,026, with the highest median household income of $96,488 found in the 45 to 64 years age bracket for the primary householder. A total of 63,327 households (32.8%) fall into this category. Meanwhile, the 15 to 24 years age bracket for the primary householder has the lowest median household income of $50,341, with 12,353 households (6.4%) in this group.
| Income Bracket | # Households | Median Income |
| 15 to 24 Years | 12,353 (6.4%) | $50,341 |
| 25 to 44 Years | 74,439 (38.5%) | $83,490 |
| 45 to 64 Years | 63,327 (32.8%) | $96,488 |
| 65+ Years | 43,030 (22.3%) | $63,073 |
| Total | 193,149 (100.0%) | $79,026 |
Poverty in Colorado Springs
Income Below Poverty by Sex and Age in Colorado Springs
With 9.2% poverty level for males and 11.7% for females among the residents of Colorado Springs, 5 year old males and 18 to 24 year old females are the most vulnerable to poverty, with 412 males (15.4%) and 4,549 females (21.0%) in their respective age groups living below the poverty level.
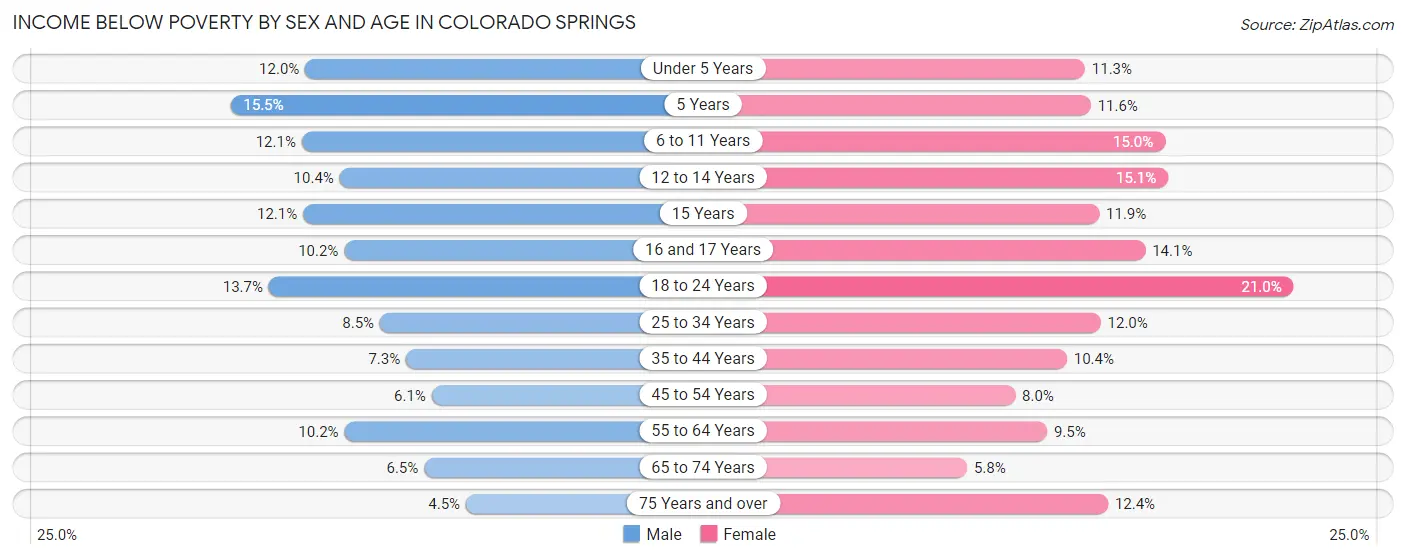
| Age Bracket | Male | Female |
| Under 5 Years | 1,680 (12.0%) | 1,605 (11.3%) |
| 5 Years | 412 (15.4%) | 309 (11.6%) |
| 6 to 11 Years | 2,327 (12.1%) | 2,568 (15.0%) |
| 12 to 14 Years | 904 (10.4%) | 1,305 (15.1%) |
| 15 Years | 350 (12.1%) | 417 (11.9%) |
| 16 and 17 Years | 585 (10.2%) | 717 (14.1%) |
| 18 to 24 Years | 3,411 (13.7%) | 4,549 (21.0%) |
| 25 to 34 Years | 3,684 (8.5%) | 4,643 (12.0%) |
| 35 to 44 Years | 2,362 (7.3%) | 3,202 (10.4%) |
| 45 to 54 Years | 1,678 (6.1%) | 2,173 (8.0%) |
| 55 to 64 Years | 2,626 (10.2%) | 2,631 (9.5%) |
| 65 to 74 Years | 1,180 (6.5%) | 1,274 (5.8%) |
| 75 Years and over | 498 (4.5%) | 1,929 (12.3%) |
| Total | 21,697 (9.2%) | 27,322 (11.7%) |
Income Above Poverty by Sex and Age in Colorado Springs
According to the poverty statistics in Colorado Springs, males aged 75 years and over and females aged 65 to 74 years are the age groups that are most secure financially, with 95.5% of males and 94.2% of females in these age groups living above the poverty line.
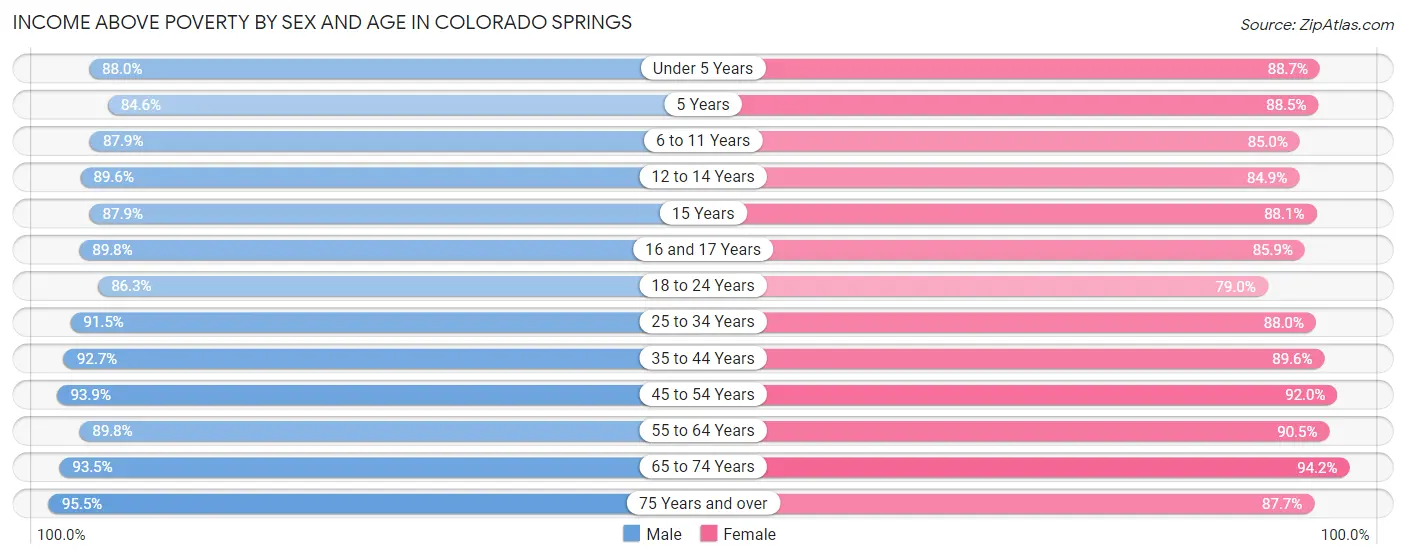
| Age Bracket | Male | Female |
| Under 5 Years | 12,344 (88.0%) | 12,630 (88.7%) |
| 5 Years | 2,255 (84.6%) | 2,367 (88.4%) |
| 6 to 11 Years | 16,834 (87.9%) | 14,548 (85.0%) |
| 12 to 14 Years | 7,804 (89.6%) | 7,317 (84.9%) |
| 15 Years | 2,548 (87.9%) | 3,076 (88.1%) |
| 16 and 17 Years | 5,169 (89.8%) | 4,375 (85.9%) |
| 18 to 24 Years | 21,546 (86.3%) | 17,154 (79.0%) |
| 25 to 34 Years | 39,596 (91.5%) | 34,028 (88.0%) |
| 35 to 44 Years | 30,008 (92.7%) | 27,475 (89.6%) |
| 45 to 54 Years | 25,765 (93.9%) | 24,850 (92.0%) |
| 55 to 64 Years | 23,218 (89.8%) | 24,999 (90.5%) |
| 65 to 74 Years | 17,095 (93.5%) | 20,649 (94.2%) |
| 75 Years and over | 10,522 (95.5%) | 13,686 (87.6%) |
| Total | 214,704 (90.8%) | 207,154 (88.3%) |
Income Below Poverty Among Married-Couple Families in Colorado Springs
The poverty statistics for married-couple families in Colorado Springs show that 3.1% or 2,827 of the total 91,989 families live below the poverty line. Families with 5 or more children have the highest poverty rate of 18.1%, comprising of 99 families. On the other hand, families with no children have the lowest poverty rate of 2.4%, which includes 1,292 families.
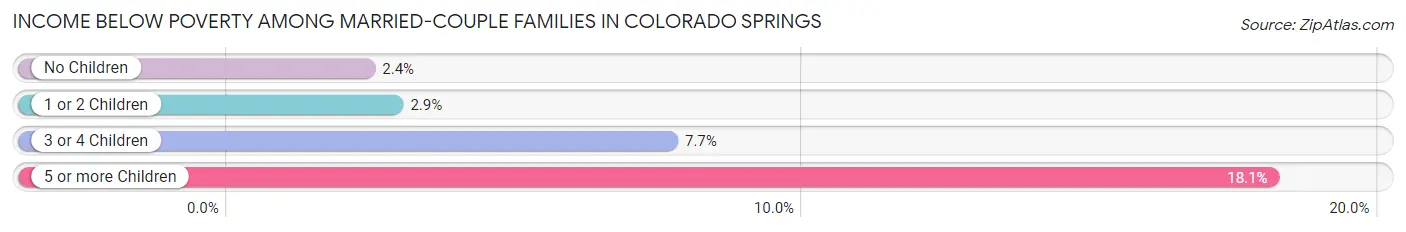
| Children | Above Poverty | Below Poverty |
| No Children | 52,679 (97.6%) | 1,292 (2.4%) |
| 1 or 2 Children | 29,144 (97.1%) | 864 (2.9%) |
| 3 or 4 Children | 6,892 (92.3%) | 572 (7.7%) |
| 5 or more Children | 447 (81.9%) | 99 (18.1%) |
| Total | 89,162 (96.9%) | 2,827 (3.1%) |
Income Below Poverty Among Single-Parent Households in Colorado Springs
According to the poverty data in Colorado Springs, 11.1% or 1,092 single-father households and 20.6% or 4,112 single-mother households are living below the poverty line. Among single-father households, those with 3 or 4 children have the highest poverty rate, with 256 households (32.5%) experiencing poverty. Likewise, among single-mother households, those with 5 or more children have the highest poverty rate, with 152 households (70.7%) falling below the poverty line.
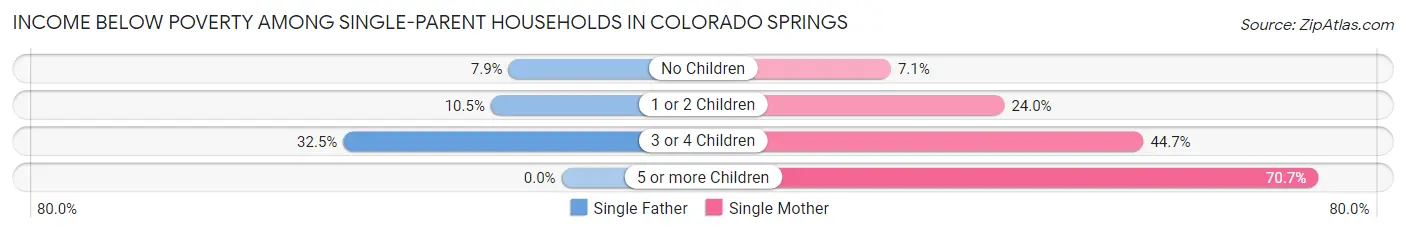
| Children | Single Father | Single Mother |
| No Children | 348 (7.9%) | 526 (7.0%) |
| 1 or 2 Children | 488 (10.5%) | 2,352 (24.0%) |
| 3 or 4 Children | 256 (32.5%) | 1,082 (44.7%) |
| 5 or more Children | 0 (0.0%) | 152 (70.7%) |
| Total | 1,092 (11.1%) | 4,112 (20.6%) |
Income Below Poverty Among Married-Couple vs Single-Parent Households in Colorado Springs
The poverty data for Colorado Springs shows that 2,827 of the married-couple family households (3.1%) and 5,204 of the single-parent households (17.5%) are living below the poverty level. Within the married-couple family households, those with 5 or more children have the highest poverty rate, with 99 households (18.1%) falling below the poverty line. Among the single-parent households, those with 5 or more children have the highest poverty rate, with 152 household (70.7%) living below poverty.
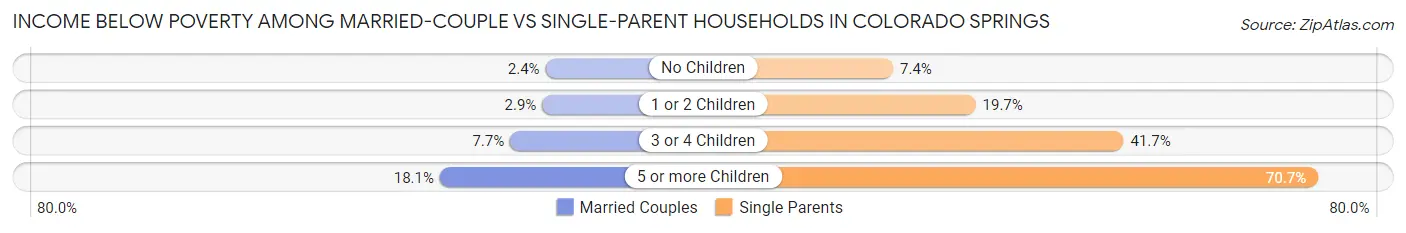
| Children | Married-Couple Families | Single-Parent Households |
| No Children | 1,292 (2.4%) | 874 (7.4%) |
| 1 or 2 Children | 864 (2.9%) | 2,840 (19.7%) |
| 3 or 4 Children | 572 (7.7%) | 1,338 (41.7%) |
| 5 or more Children | 99 (18.1%) | 152 (70.7%) |
| Total | 2,827 (3.1%) | 5,204 (17.5%) |
Race in Colorado Springs
The most populous races in Colorado Springs are White / Caucasian (351,990 | 73.4%), Hispanic or Latino (88,963 | 18.5%), and Two or more Races (55,048 | 11.5%).
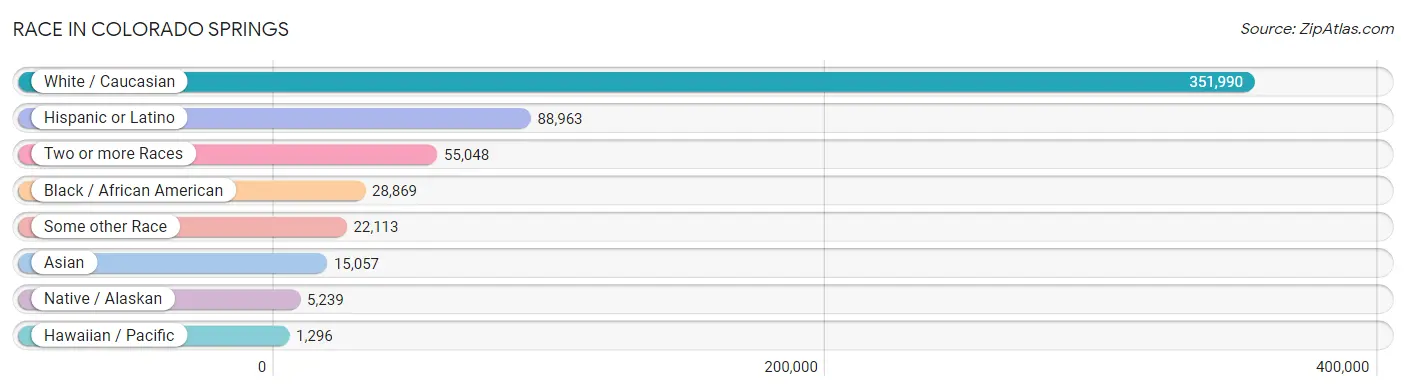
| Race | # Population | % Population |
| Asian | 15,057 | 3.1% |
| Black / African American | 28,869 | 6.0% |
| Hawaiian / Pacific | 1,296 | 0.3% |
| Hispanic or Latino | 88,963 | 18.5% |
| Native / Alaskan | 5,239 | 1.1% |
| White / Caucasian | 351,990 | 73.4% |
| Two or more Races | 55,048 | 11.5% |
| Some other Race | 22,113 | 4.6% |
| Total | 479,612 | 100.0% |
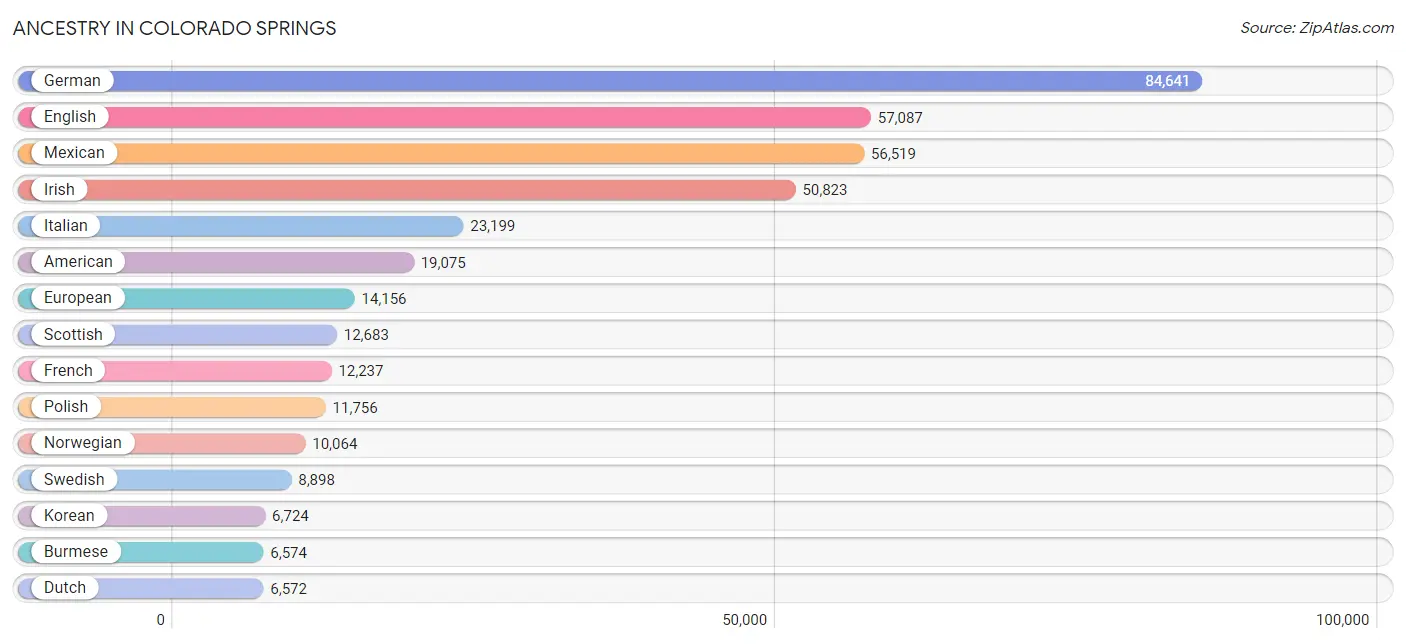
Ancestry in Colorado Springs
The most populous ancestries reported in Colorado Springs are German (84,641 | 17.6%), English (57,087 | 11.9%), Mexican (56,519 | 11.8%), Irish (50,823 | 10.6%), and Italian (23,199 | 4.8%), together accounting for 56.8% of all Colorado Springs residents.
| Ancestry | # Population | % Population |
| Afghan | 77 | 0.0% |
| African | 2,647 | 0.5% |
| Alaskan Athabascan | 60 | 0.0% |
| Albanian | 86 | 0.0% |
| Alsatian | 32 | 0.0% |
| American | 19,075 | 4.0% |
| Apache | 878 | 0.2% |
| Arab | 1,132 | 0.2% |
| Arapaho | 38 | 0.0% |
| Argentinean | 260 | 0.1% |
| Armenian | 229 | 0.1% |
| Assyrian / Chaldean / Syriac | 11 | 0.0% |
| Australian | 168 | 0.0% |
| Austrian | 1,177 | 0.3% |
| Bangladeshi | 19 | 0.0% |
| Barbadian | 80 | 0.0% |
| Basque | 290 | 0.1% |
| Belgian | 537 | 0.1% |
| Belizean | 216 | 0.1% |
| Bermudan | 20 | 0.0% |
| Bhutanese | 3,143 | 0.7% |
| Blackfeet | 270 | 0.1% |
| Bolivian | 62 | 0.0% |
| Brazilian | 451 | 0.1% |
| British | 3,236 | 0.7% |
| British West Indian | 30 | 0.0% |
| Bulgarian | 109 | 0.0% |
| Burmese | 6,574 | 1.4% |
| Cajun | 123 | 0.0% |
| Cambodian | 120 | 0.0% |
| Canadian | 851 | 0.2% |
| Cape Verdean | 50 | 0.0% |
| Carpatho Rusyn | 60 | 0.0% |
| Celtic | 223 | 0.1% |
| Central American | 4,525 | 0.9% |
| Central American Indian | 426 | 0.1% |
| Cherokee | 2,376 | 0.5% |
| Cheyenne | 41 | 0.0% |
| Chickasaw | 176 | 0.0% |
| Chilean | 283 | 0.1% |
| Chinese | 27 | 0.0% |
| Chippewa | 313 | 0.1% |
| Choctaw | 227 | 0.1% |
| Colombian | 959 | 0.2% |
| Comanche | 152 | 0.0% |
| Costa Rican | 145 | 0.0% |
| Cree | 75 | 0.0% |
| Creek | 21 | 0.0% |
| Croatian | 459 | 0.1% |
| Crow | 19 | 0.0% |
| Cuban | 1,291 | 0.3% |
| Czech | 2,573 | 0.5% |
| Czechoslovakian | 498 | 0.1% |
| Danish | 3,472 | 0.7% |
| Delaware | 14 | 0.0% |
| Dominican | 610 | 0.1% |
| Dutch | 6,572 | 1.4% |
| Eastern European | 1,120 | 0.2% |
| Ecuadorian | 284 | 0.1% |
| Egyptian | 109 | 0.0% |
| English | 57,087 | 11.9% |
| Estonian | 132 | 0.0% |
| Ethiopian | 267 | 0.1% |
| European | 14,156 | 2.9% |
| Filipino | 204 | 0.0% |
| Finnish | 780 | 0.2% |
| French | 12,237 | 2.5% |
| French American Indian | 6 | 0.0% |
| French Canadian | 2,382 | 0.5% |
| German | 84,641 | 17.6% |
| German Russian | 200 | 0.0% |
| Ghanaian | 73 | 0.0% |
| Greek | 1,177 | 0.3% |
| Guamanian / Chamorro | 1,016 | 0.2% |
| Guatemalan | 909 | 0.2% |
| Haitian | 381 | 0.1% |
| Honduran | 1,152 | 0.2% |
| Hopi | 22 | 0.0% |
| Hungarian | 2,231 | 0.5% |
| Icelander | 88 | 0.0% |
| Indian (Asian) | 4,095 | 0.9% |
| Indonesian | 153 | 0.0% |
| Inupiat | 40 | 0.0% |
| Iranian | 493 | 0.1% |
| Iraqi | 126 | 0.0% |
| Irish | 50,823 | 10.6% |
| Iroquois | 235 | 0.1% |
| Israeli | 159 | 0.0% |
| Italian | 23,199 | 4.8% |
| Jamaican | 881 | 0.2% |
| Japanese | 91 | 0.0% |
| Jordanian | 37 | 0.0% |
| Kenyan | 179 | 0.0% |
| Kiowa | 15 | 0.0% |
| Korean | 6,724 | 1.4% |
| Laotian | 189 | 0.0% |
| Latvian | 87 | 0.0% |
| Lebanese | 350 | 0.1% |
| Liberian | 30 | 0.0% |
| Lithuanian | 1,275 | 0.3% |
| Luxembourger | 208 | 0.0% |
| Macedonian | 48 | 0.0% |
| Malaysian | 158 | 0.0% |
| Maltese | 48 | 0.0% |
| Mexican | 56,519 | 11.8% |
| Mexican American Indian | 974 | 0.2% |
| Native Hawaiian | 1,602 | 0.3% |
| Navajo | 750 | 0.2% |
| New Zealander | 151 | 0.0% |
| Nicaraguan | 536 | 0.1% |
| Nigerian | 683 | 0.1% |
| Northern European | 1,328 | 0.3% |
| Norwegian | 10,064 | 2.1% |
| Okinawan | 19 | 0.0% |
| Osage | 14 | 0.0% |
| Pakistani | 746 | 0.2% |
| Palestinian | 48 | 0.0% |
| Panamanian | 689 | 0.1% |
| Paraguayan | 1 | 0.0% |
| Pennsylvania German | 77 | 0.0% |
| Peruvian | 693 | 0.1% |
| Pima | 12 | 0.0% |
| Polish | 11,756 | 2.5% |
| Portuguese | 1,017 | 0.2% |
| Potawatomi | 143 | 0.0% |
| Pueblo | 373 | 0.1% |
| Puerto Rican | 6,023 | 1.3% |
| Romanian | 423 | 0.1% |
| Russian | 3,282 | 0.7% |
| Salvadoran | 1,001 | 0.2% |
| Samoan | 452 | 0.1% |
| Scandinavian | 2,572 | 0.5% |
| Scotch-Irish | 5,908 | 1.2% |
| Scottish | 12,683 | 2.6% |
| Seminole | 23 | 0.0% |
| Serbian | 364 | 0.1% |
| Shoshone | 8 | 0.0% |
| Sioux | 485 | 0.1% |
| Slavic | 159 | 0.0% |
| Slovak | 779 | 0.2% |
| Slovene | 555 | 0.1% |
| Somali | 41 | 0.0% |
| South African | 122 | 0.0% |
| South American | 2,983 | 0.6% |
| South American Indian | 7 | 0.0% |
| Spaniard | 3,473 | 0.7% |
| Spanish | 6,244 | 1.3% |
| Spanish American | 802 | 0.2% |
| Spanish American Indian | 246 | 0.1% |
| Sri Lankan | 2,100 | 0.4% |
| Subsaharan African | 4,509 | 0.9% |
| Sudanese | 62 | 0.0% |
| Swedish | 8,898 | 1.9% |
| Swiss | 1,597 | 0.3% |
| Syrian | 32 | 0.0% |
| Thai | 2,589 | 0.5% |
| Tohono O'Odham | 17 | 0.0% |
| Trinidadian and Tobagonian | 59 | 0.0% |
| Tsimshian | 9 | 0.0% |
| Turkish | 110 | 0.0% |
| U.S. Virgin Islander | 25 | 0.0% |
| Ugandan | 7 | 0.0% |
| Ukrainian | 1,184 | 0.3% |
| Ute | 295 | 0.1% |
| Venezuelan | 441 | 0.1% |
| Vietnamese | 39 | 0.0% |
| Welsh | 3,877 | 0.8% |
| West Indian | 202 | 0.0% |
| Yaqui | 21 | 0.0% |
| Yugoslavian | 251 | 0.1% |
| Yup'ik | 41 | 0.0% | View All 171 Rows |
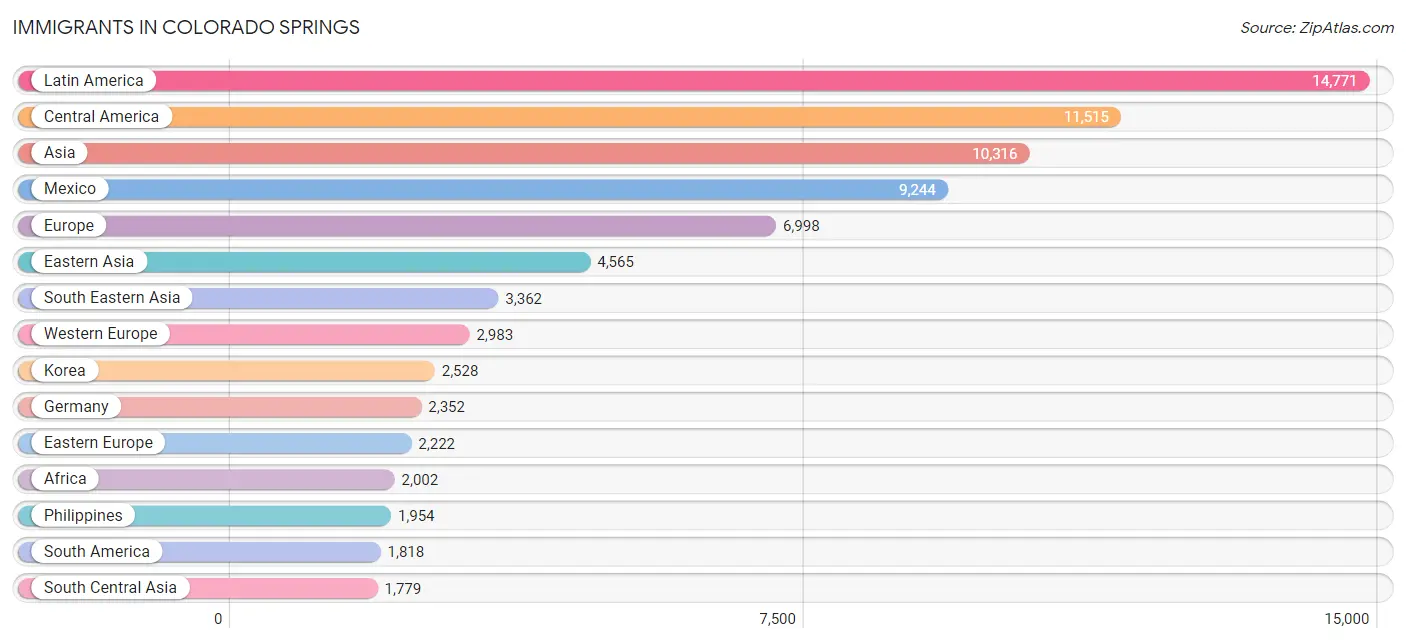
Immigrants in Colorado Springs
The most numerous immigrant groups reported in Colorado Springs came from Latin America (14,771 | 3.1%), Central America (11,515 | 2.4%), Asia (10,316 | 2.1%), Mexico (9,244 | 1.9%), and Europe (6,998 | 1.5%), together accounting for 11.0% of all Colorado Springs residents.
| Immigration Origin | # Population | % Population |
| Afghanistan | 58 | 0.0% |
| Africa | 2,002 | 0.4% |
| Argentina | 129 | 0.0% |
| Armenia | 27 | 0.0% |
| Asia | 10,316 | 2.1% |
| Australia | 221 | 0.1% |
| Austria | 89 | 0.0% |
| Bahamas | 70 | 0.0% |
| Bangladesh | 39 | 0.0% |
| Barbados | 19 | 0.0% |
| Belarus | 93 | 0.0% |
| Belgium | 9 | 0.0% |
| Belize | 52 | 0.0% |
| Bolivia | 62 | 0.0% |
| Bosnia and Herzegovina | 63 | 0.0% |
| Brazil | 517 | 0.1% |
| Bulgaria | 61 | 0.0% |
| Cambodia | 82 | 0.0% |
| Cameroon | 114 | 0.0% |
| Canada | 1,625 | 0.3% |
| Caribbean | 1,438 | 0.3% |
| Central America | 11,515 | 2.4% |
| Chile | 139 | 0.0% |
| China | 1,586 | 0.3% |
| Colombia | 414 | 0.1% |
| Costa Rica | 50 | 0.0% |
| Croatia | 111 | 0.0% |
| Cuba | 428 | 0.1% |
| Czechoslovakia | 186 | 0.0% |
| Denmark | 46 | 0.0% |
| Dominica | 10 | 0.0% |
| Dominican Republic | 195 | 0.0% |
| Eastern Africa | 1,145 | 0.2% |
| Eastern Asia | 4,565 | 0.9% |
| Eastern Europe | 2,222 | 0.5% |
| Ecuador | 201 | 0.0% |
| Egypt | 61 | 0.0% |
| El Salvador | 409 | 0.1% |
| England | 529 | 0.1% |
| Eritrea | 23 | 0.0% |
| Ethiopia | 306 | 0.1% |
| Europe | 6,998 | 1.5% |
| Fiji | 56 | 0.0% |
| France | 77 | 0.0% |
| Germany | 2,352 | 0.5% |
| Ghana | 47 | 0.0% |
| Guatemala | 635 | 0.1% |
| Guyana | 24 | 0.0% |
| Haiti | 155 | 0.0% |
| Honduras | 774 | 0.2% |
| Hong Kong | 39 | 0.0% |
| Hungary | 108 | 0.0% |
| India | 1,041 | 0.2% |
| Indonesia | 54 | 0.0% |
| Iran | 280 | 0.1% |
| Iraq | 156 | 0.0% |
| Ireland | 124 | 0.0% |
| Israel | 77 | 0.0% |
| Italy | 229 | 0.1% |
| Jamaica | 453 | 0.1% |
| Japan | 431 | 0.1% |
| Jordan | 30 | 0.0% |
| Kazakhstan | 25 | 0.0% |
| Kenya | 582 | 0.1% |
| Korea | 2,528 | 0.5% |
| Kuwait | 25 | 0.0% |
| Laos | 37 | 0.0% |
| Latin America | 14,771 | 3.1% |
| Lebanon | 19 | 0.0% |
| Liberia | 84 | 0.0% |
| Lithuania | 62 | 0.0% |
| Malaysia | 11 | 0.0% |
| Mexico | 9,244 | 1.9% |
| Middle Africa | 188 | 0.0% |
| Moldova | 42 | 0.0% |
| Morocco | 10 | 0.0% |
| Nepal | 131 | 0.0% |
| Netherlands | 154 | 0.0% |
| Nicaragua | 37 | 0.0% |
| Nigeria | 83 | 0.0% |
| North Macedonia | 26 | 0.0% |
| Northern Africa | 105 | 0.0% |
| Northern Europe | 1,390 | 0.3% |
| Norway | 32 | 0.0% |
| Oceania | 424 | 0.1% |
| Pakistan | 179 | 0.0% |
| Panama | 221 | 0.1% |
| Peru | 168 | 0.0% |
| Philippines | 1,954 | 0.4% |
| Poland | 317 | 0.1% |
| Romania | 87 | 0.0% |
| Russia | 522 | 0.1% |
| Scotland | 35 | 0.0% |
| Serbia | 9 | 0.0% |
| Singapore | 43 | 0.0% |
| Somalia | 37 | 0.0% |
| South Africa | 197 | 0.0% |
| South America | 1,818 | 0.4% |
| South Central Asia | 1,779 | 0.4% |
| South Eastern Asia | 3,362 | 0.7% |
| Southern Europe | 403 | 0.1% |
| Spain | 174 | 0.0% |
| St. Vincent and the Grenadines | 2 | 0.0% |
| Sudan | 23 | 0.0% |
| Sweden | 49 | 0.0% |
| Switzerland | 302 | 0.1% |
| Syria | 30 | 0.0% |
| Taiwan | 189 | 0.0% |
| Thailand | 197 | 0.0% |
| Trinidad and Tobago | 58 | 0.0% |
| Turkey | 194 | 0.0% |
| Uganda | 24 | 0.0% |
| Ukraine | 388 | 0.1% |
| Uzbekistan | 6 | 0.0% |
| Venezuela | 163 | 0.0% |
| Vietnam | 935 | 0.2% |
| West Indies | 31 | 0.0% |
| Western Africa | 296 | 0.1% |
| Western Asia | 610 | 0.1% |
| Western Europe | 2,983 | 0.6% |
| Zaire | 74 | 0.0% |
| Zimbabwe | 86 | 0.0% | View All 122 Rows |
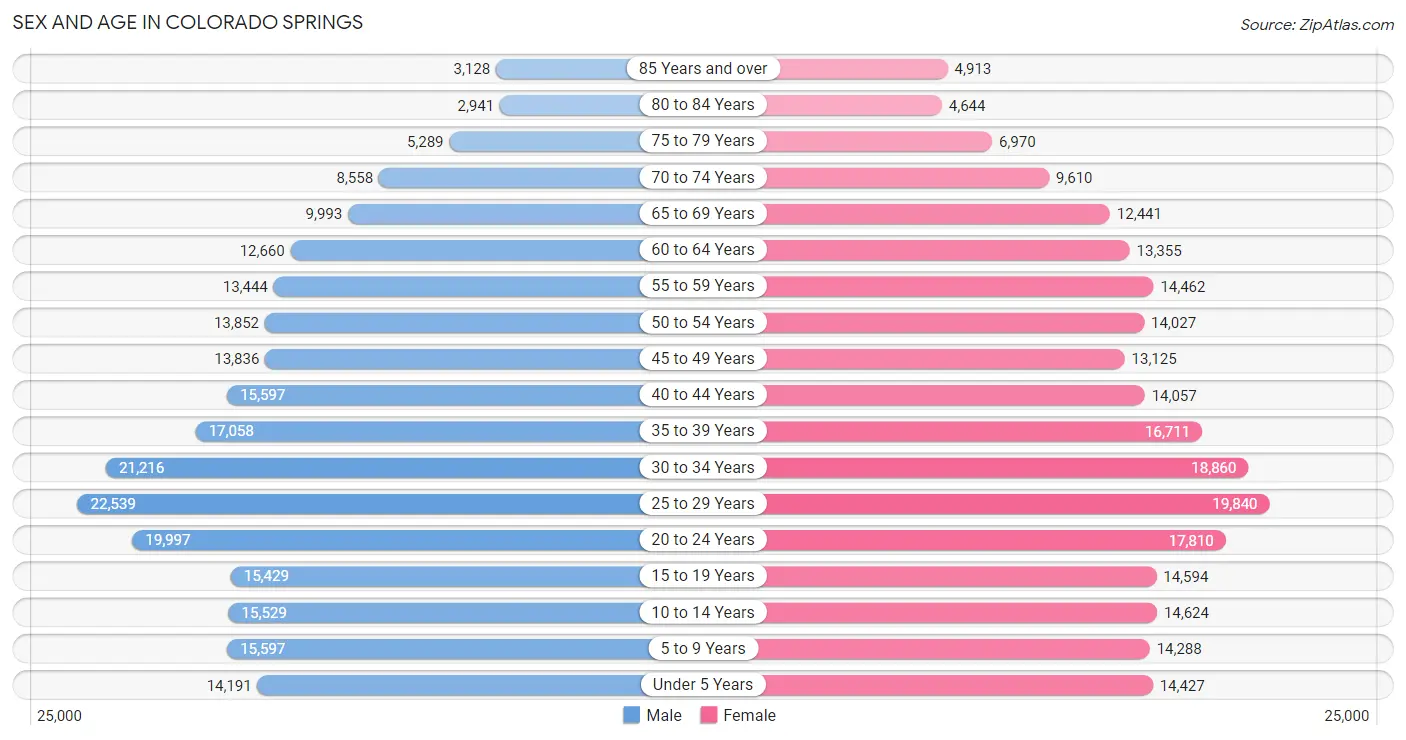
Sex and Age in Colorado Springs
Sex and Age in Colorado Springs
The most populous age groups in Colorado Springs are 25 to 29 Years (22,539 | 9.4%) for men and 25 to 29 Years (19,840 | 8.3%) for women.
| Age Bracket | Male | Female |
| Under 5 Years | 14,191 (5.9%) | 14,427 (6.0%) |
| 5 to 9 Years | 15,597 (6.5%) | 14,288 (6.0%) |
| 10 to 14 Years | 15,529 (6.5%) | 14,624 (6.1%) |
| 15 to 19 Years | 15,429 (6.4%) | 14,594 (6.1%) |
| 20 to 24 Years | 19,997 (8.3%) | 17,810 (7.5%) |
| 25 to 29 Years | 22,539 (9.4%) | 19,840 (8.3%) |
| 30 to 34 Years | 21,216 (8.8%) | 18,860 (7.9%) |
| 35 to 39 Years | 17,058 (7.1%) | 16,711 (7.0%) |
| 40 to 44 Years | 15,597 (6.5%) | 14,057 (5.9%) |
| 45 to 49 Years | 13,836 (5.7%) | 13,125 (5.5%) |
| 50 to 54 Years | 13,852 (5.8%) | 14,027 (5.9%) |
| 55 to 59 Years | 13,444 (5.6%) | 14,462 (6.1%) |
| 60 to 64 Years | 12,660 (5.3%) | 13,355 (5.6%) |
| 65 to 69 Years | 9,993 (4.2%) | 12,441 (5.2%) |
| 70 to 74 Years | 8,558 (3.5%) | 9,610 (4.0%) |
| 75 to 79 Years | 5,289 (2.2%) | 6,970 (2.9%) |
| 80 to 84 Years | 2,941 (1.2%) | 4,644 (1.9%) |
| 85 Years and over | 3,128 (1.3%) | 4,913 (2.1%) |
| Total | 240,854 (100.0%) | 238,758 (100.0%) |
Families and Households in Colorado Springs
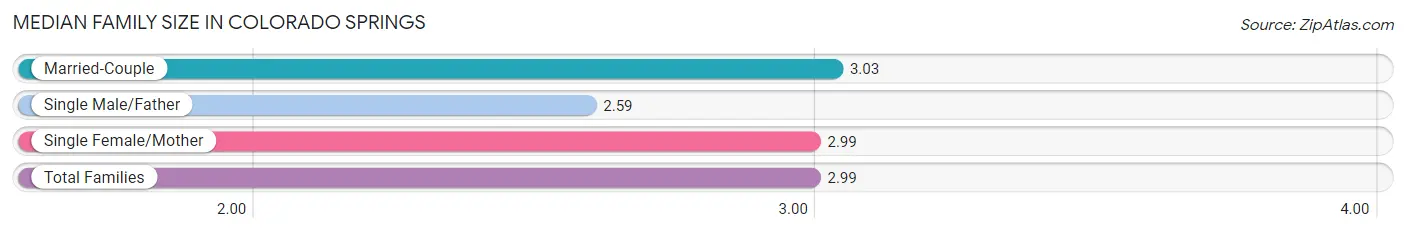
Median Family Size in Colorado Springs
The median family size in Colorado Springs is 2.99 persons per family, with married-couple families (91,989 | 75.6%) accounting for the largest median family size of 3.03 persons per family. On the other hand, single male/father families (9,813 | 8.1%) represent the smallest median family size with 2.59 persons per family.
| Family Type | # Families | Family Size |
| Married-Couple | 91,989 (75.6%) | 3.03 |
| Single Male/Father | 9,813 (8.1%) | 2.59 |
| Single Female/Mother | 19,909 (16.4%) | 2.99 |
| Total Families | 121,711 (100.0%) | 2.99 |
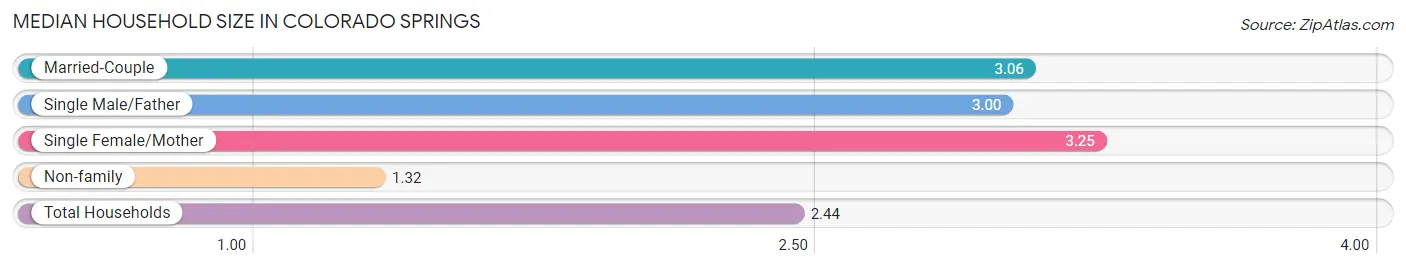
Median Household Size in Colorado Springs
The median household size in Colorado Springs is 2.44 persons per household, with single female/mother households (19,909 | 10.3%) accounting for the largest median household size of 3.25 persons per household. non-family households (71,438 | 37.0%) represent the smallest median household size with 1.32 persons per household.
| Household Type | # Households | Household Size |
| Married-Couple | 91,989 (47.6%) | 3.06 |
| Single Male/Father | 9,813 (5.1%) | 3.00 |
| Single Female/Mother | 19,909 (10.3%) | 3.25 |
| Non-family | 71,438 (37.0%) | 1.32 |
| Total Households | 193,149 (100.0%) | 2.44 |
Household Size by Marriage Status in Colorado Springs
Out of a total of 193,149 households in Colorado Springs, 121,711 (63.0%) are family households, while 71,438 (37.0%) are nonfamily households. The most numerous type of family households are 2-person households, comprising 56,021, and the most common type of nonfamily households are 1-person households, comprising 53,765.
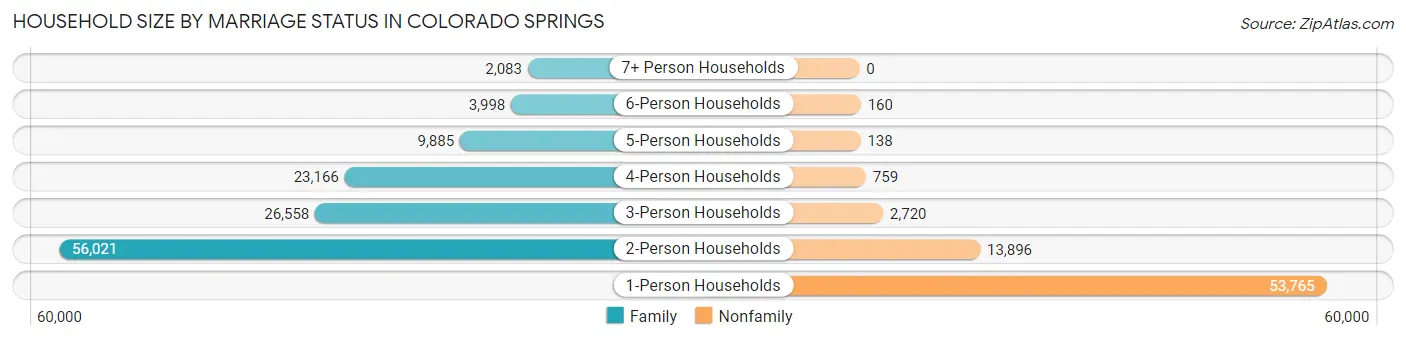
| Household Size | Family Households | Nonfamily Households |
| 1-Person Households | - | 53,765 (27.8%) |
| 2-Person Households | 56,021 (29.0%) | 13,896 (7.2%) |
| 3-Person Households | 26,558 (13.8%) | 2,720 (1.4%) |
| 4-Person Households | 23,166 (12.0%) | 759 (0.4%) |
| 5-Person Households | 9,885 (5.1%) | 138 (0.1%) |
| 6-Person Households | 3,998 (2.1%) | 160 (0.1%) |
| 7+ Person Households | 2,083 (1.1%) | 0 (0.0%) |
| Total | 121,711 (63.0%) | 71,438 (37.0%) |
Female Fertility in Colorado Springs
Fertility by Age in Colorado Springs
Average fertility rate in Colorado Springs is 50.0 births per 1,000 women. Women in the age bracket of 20 to 34 years have the highest fertility rate with 77.0 births per 1,000 women. Women in the age bracket of 20 to 34 years acount for 74.6% of all women with births.
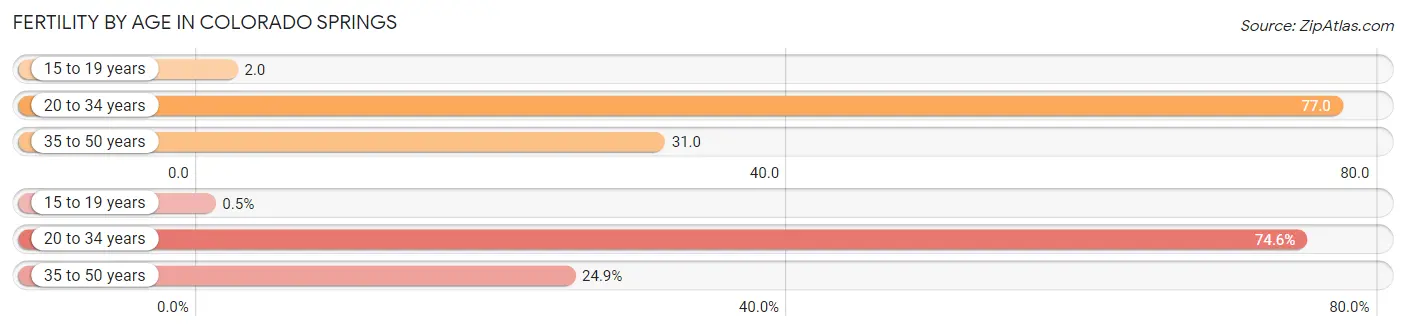
| Age Bracket | Women with Births | Births / 1,000 Women |
| 15 to 19 years | 29 (0.5%) | 2.0 |
| 20 to 34 years | 4,360 (74.6%) | 77.0 |
| 35 to 50 years | 1,456 (24.9%) | 31.0 |
| Total | 5,845 (100.0%) | 50.0 |
Fertility by Age by Marriage Status in Colorado Springs
74.6% of women with births (5,845) in Colorado Springs are married. The highest percentage of unmarried women with births falls into 15 to 19 years age bracket with 100.0% of them unmarried at the time of birth, while the lowest percentage of unmarried women with births belong to 35 to 50 years age bracket with 12.9% of them unmarried.
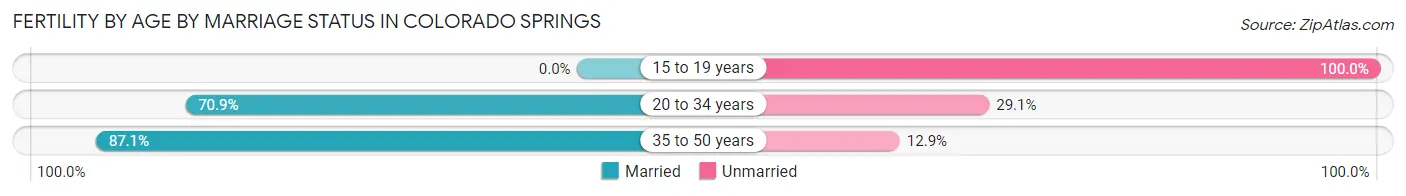
| Age Bracket | Married | Unmarried |
| 15 to 19 years | 0 (0.0%) | 29 (100.0%) |
| 20 to 34 years | 3,091 (70.9%) | 1,269 (29.1%) |
| 35 to 50 years | 1,268 (87.1%) | 188 (12.9%) |
| Total | 4,360 (74.6%) | 1,485 (25.4%) |
Fertility by Education in Colorado Springs
Average fertility rate in Colorado Springs is 50.0 births per 1,000 women. Women with the education attainment of graduate degree have the highest fertility rate of 79.0 births per 1,000 women, while women with the education attainment of less than high school have the lowest fertility at 15.0 births per 1,000 women. Women with the education attainment of college or associate's degree represent 39.4% of all women with births.
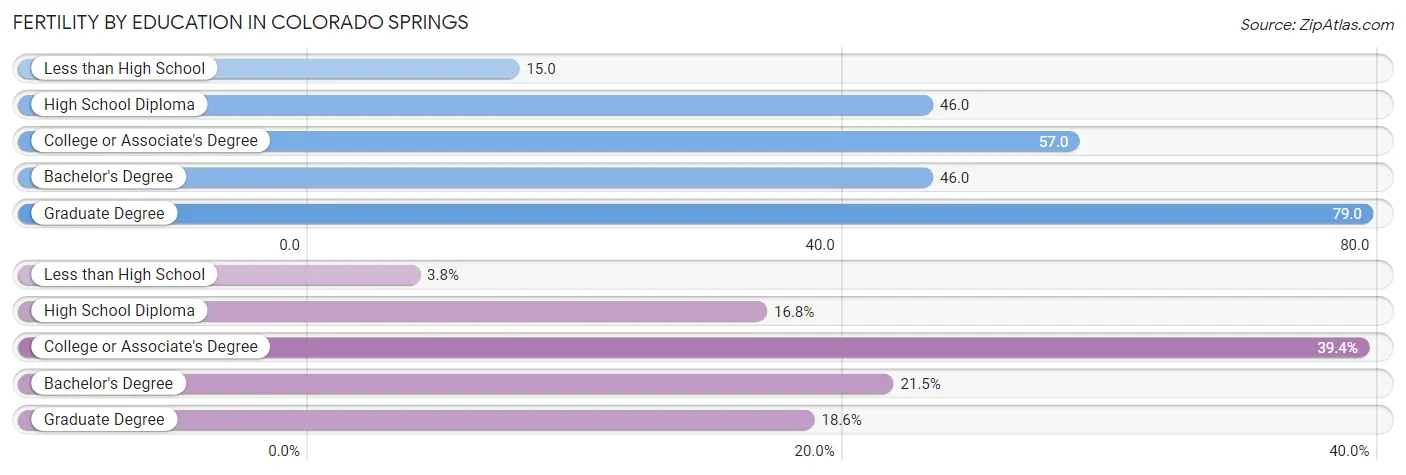
| Educational Attainment | Women with Births | Births / 1,000 Women |
| Less than High School | 221 (3.8%) | 15.0 |
| High School Diploma | 981 (16.8%) | 46.0 |
| College or Associate's Degree | 2,300 (39.4%) | 57.0 |
| Bachelor's Degree | 1,258 (21.5%) | 46.0 |
| Graduate Degree | 1,085 (18.6%) | 79.0 |
| Total | 5,845 (100.0%) | 50.0 |
Fertility by Education by Marriage Status in Colorado Springs
25.4% of women with births in Colorado Springs are unmarried. Women with the educational attainment of bachelor's degree are most likely to be married with 94.3% of them married at childbirth, while women with the educational attainment of less than high school are least likely to be married with 48.4% of them unmarried at childbirth.
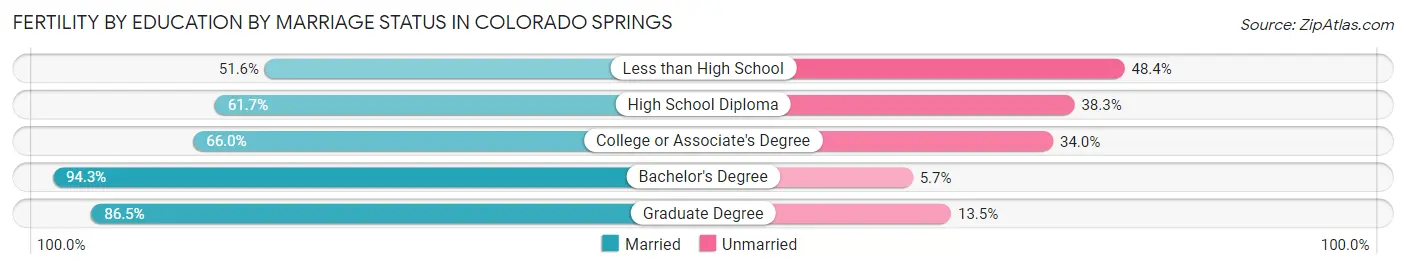
| Educational Attainment | Married | Unmarried |
| Less than High School | 114 (51.6%) | 107 (48.4%) |
| High School Diploma | 605 (61.7%) | 376 (38.3%) |
| College or Associate's Degree | 1,518 (66.0%) | 782 (34.0%) |
| Bachelor's Degree | 1,186 (94.3%) | 72 (5.7%) |
| Graduate Degree | 939 (86.5%) | 146 (13.5%) |
| Total | 4,360 (74.6%) | 1,485 (25.4%) |
Employment Characteristics in Colorado Springs
Employment by Class of Employer in Colorado Springs
Among the 244,226 employed individuals in Colorado Springs, private company employees (149,188 | 61.1%), not-for-profit organizations (24,427 | 10.0%), and federal government employees (23,718 | 9.7%) make up the most common classes of employment.
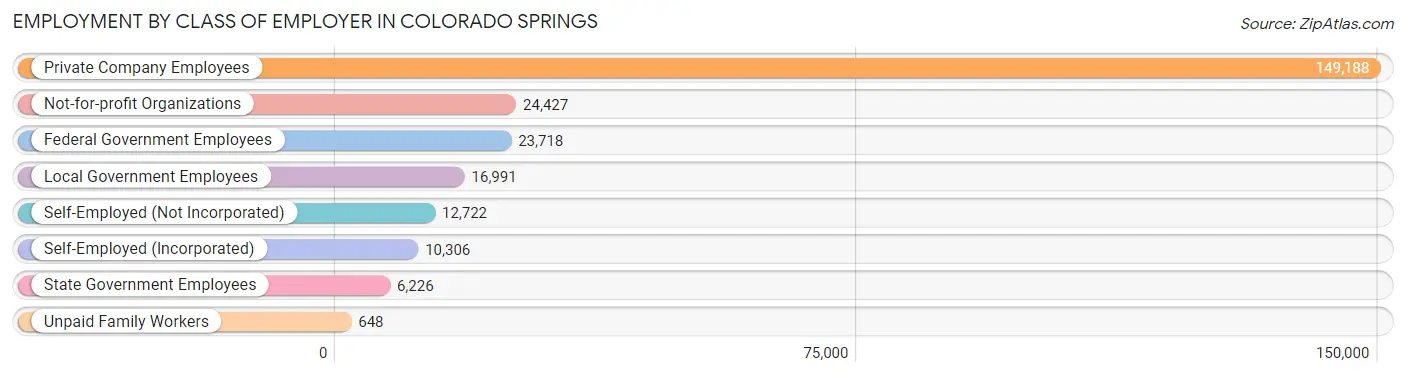
| Employer Class | # Employees | % Employees |
| Private Company Employees | 149,188 | 61.1% |
| Self-Employed (Incorporated) | 10,306 | 4.2% |
| Self-Employed (Not Incorporated) | 12,722 | 5.2% |
| Not-for-profit Organizations | 24,427 | 10.0% |
| Local Government Employees | 16,991 | 7.0% |
| State Government Employees | 6,226 | 2.5% |
| Federal Government Employees | 23,718 | 9.7% |
| Unpaid Family Workers | 648 | 0.3% |
| Total | 244,226 | 100.0% |
Employment Status by Age in Colorado Springs
According to the labor force statistics for Colorado Springs, out of the total population over 16 years of age (384,554), 68.3% or 262,650 individuals are in the labor force, with 5.6% or 14,708 of them unemployed. The age group with the highest labor force participation rate is 25 to 29 years, with 87.0% or 36,870 individuals in the labor force. Within the labor force, the 16 to 19 years age range has the highest percentage of unemployed individuals, with 16.1% or 1,810 of them being unemployed.

| Age Bracket | In Labor Force | Unemployed |
| 16 to 19 Years | 11,244 (47.6%) | 1,810 (16.1%) |
| 20 to 24 Years | 31,833 (84.2%) | 2,801 (8.8%) |
| 25 to 29 Years | 36,870 (87.0%) | 1,954 (5.3%) |
| 30 to 34 Years | 33,944 (84.7%) | 1,663 (4.9%) |
| 35 to 44 Years | 53,592 (84.5%) | 2,787 (5.2%) |
| 45 to 54 Years | 46,230 (84.3%) | 1,572 (3.4%) |
| 55 to 59 Years | 20,427 (73.2%) | 919 (4.5%) |
| 60 to 64 Years | 15,739 (60.5%) | 724 (4.6%) |
| 65 to 74 Years | 11,247 (27.7%) | 394 (3.5%) |
| 75 Years and over | 1,617 (5.8%) | 34 (2.1%) |
| Total | 262,650 (68.3%) | 14,708 (5.6%) |
Employment Status by Educational Attainment in Colorado Springs
According to labor force statistics for Colorado Springs, 81.2% of individuals (206,767) out of the total population between 25 and 64 years of age (254,639) are in the labor force, with 4.6% or 9,511 of them being unemployed. The group with the highest labor force participation rate are those with the educational attainment of bachelor's degree or higher, with 87.2% or 91,610 individuals in the labor force. Within the labor force, individuals with less than high school education have the highest percentage of unemployment, with 6.9% or 647 of them being unemployed.
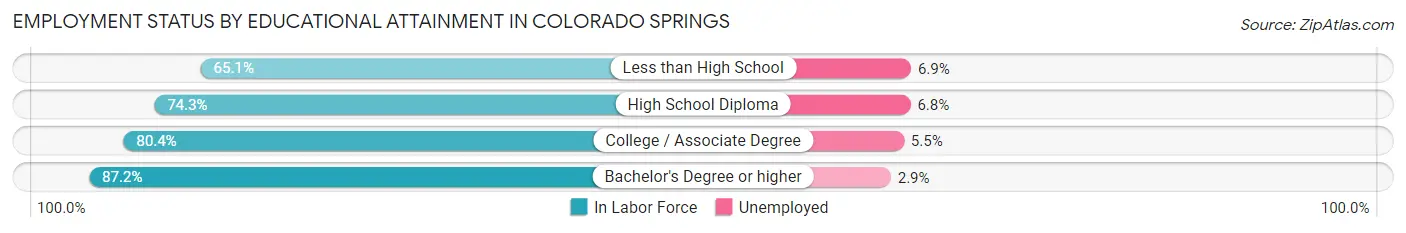
| Educational Attainment | In Labor Force | Unemployed |
| Less than High School | 9,376 (65.1%) | 994 (6.9%) |
| High School Diploma | 35,332 (74.3%) | 3,234 (6.8%) |
| College / Associate Degree | 70,451 (80.4%) | 4,819 (5.5%) |
| Bachelor's Degree or higher | 91,610 (87.2%) | 3,047 (2.9%) |
| Total | 206,767 (81.2%) | 11,713 (4.6%) |
Employment Occupations by Sex in Colorado Springs
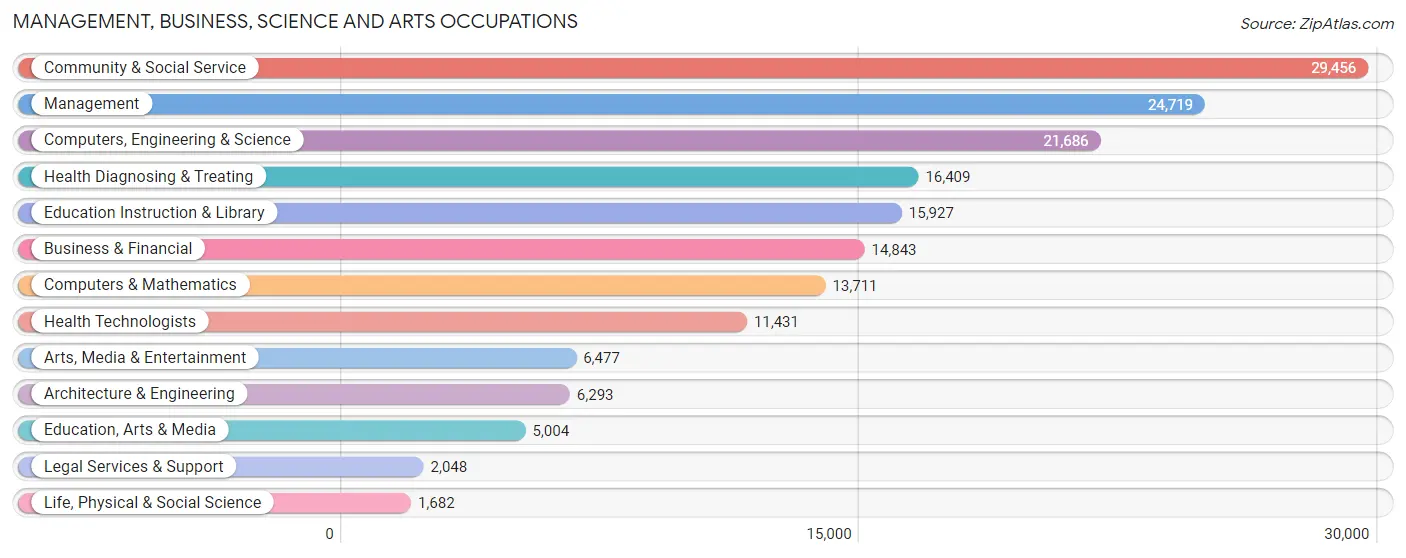
Management, Business, Science and Arts Occupations
The most common Management, Business, Science and Arts occupations in Colorado Springs are Community & Social Service (29,456 | 12.5%), Management (24,719 | 10.4%), Computers, Engineering & Science (21,686 | 9.2%), Health Diagnosing & Treating (16,409 | 6.9%), and Education Instruction & Library (15,927 | 6.7%).
Management, Business, Science and Arts Occupations by Sex
Within the Management, Business, Science and Arts occupations in Colorado Springs, the most male-oriented occupations are Architecture & Engineering (85.7%), Computers & Mathematics (81.1%), and Computers, Engineering & Science (80.3%), while the most female-oriented occupations are Health Technologists (70.1%), Health Diagnosing & Treating (68.8%), and Education Instruction & Library (68.8%).
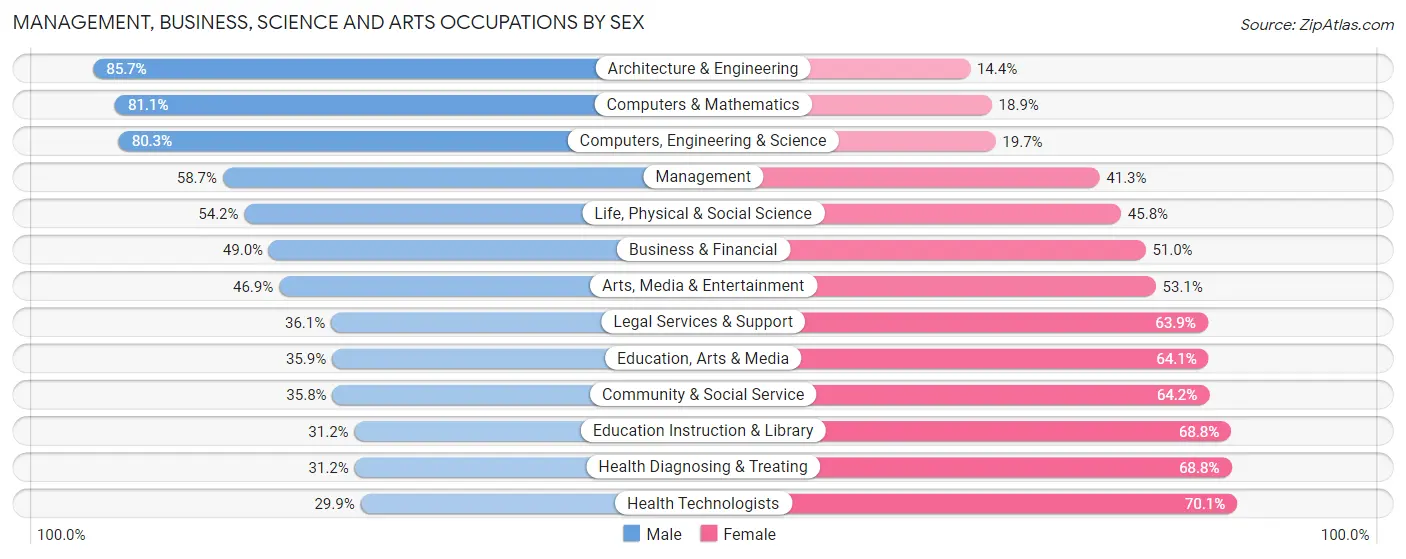
| Occupation | Male | Female |
| Management | 14,499 (58.7%) | 10,220 (41.3%) |
| Business & Financial | 7,279 (49.0%) | 7,564 (51.0%) |
| Computers, Engineering & Science | 17,423 (80.3%) | 4,263 (19.7%) |
| Computers & Mathematics | 11,122 (81.1%) | 2,589 (18.9%) |
| Architecture & Engineering | 5,390 (85.7%) | 903 (14.3%) |
| Life, Physical & Social Science | 911 (54.2%) | 771 (45.8%) |
| Community & Social Service | 10,542 (35.8%) | 18,914 (64.2%) |
| Education, Arts & Media | 1,795 (35.9%) | 3,209 (64.1%) |
| Legal Services & Support | 739 (36.1%) | 1,309 (63.9%) |
| Education Instruction & Library | 4,969 (31.2%) | 10,958 (68.8%) |
| Arts, Media & Entertainment | 3,039 (46.9%) | 3,438 (53.1%) |
| Health Diagnosing & Treating | 5,113 (31.2%) | 11,296 (68.8%) |
| Health Technologists | 3,421 (29.9%) | 8,010 (70.1%) |
| Total (Category) | 54,856 (51.2%) | 52,257 (48.8%) |
| Total (Overall) | 125,898 (53.2%) | 110,539 (46.8%) |
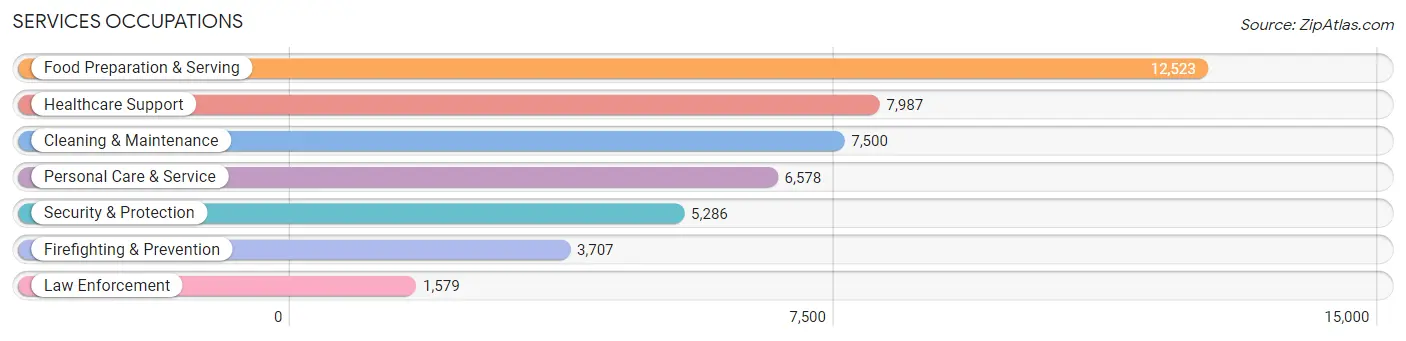
Services Occupations
The most common Services occupations in Colorado Springs are Food Preparation & Serving (12,523 | 5.3%), Healthcare Support (7,987 | 3.4%), Cleaning & Maintenance (7,500 | 3.2%), Personal Care & Service (6,578 | 2.8%), and Security & Protection (5,286 | 2.2%).
Services Occupations by Sex
Within the Services occupations in Colorado Springs, the most male-oriented occupations are Law Enforcement (82.5%), Security & Protection (78.2%), and Firefighting & Prevention (76.4%), while the most female-oriented occupations are Healthcare Support (79.6%), Personal Care & Service (77.6%), and Food Preparation & Serving (53.0%).
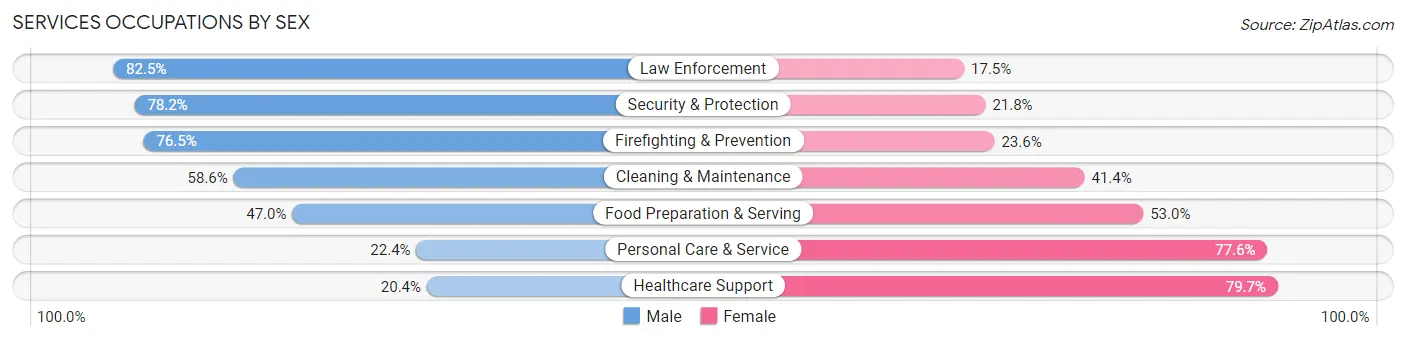
| Occupation | Male | Female |
| Healthcare Support | 1,625 (20.3%) | 6,362 (79.6%) |
| Security & Protection | 4,136 (78.2%) | 1,150 (21.8%) |
| Firefighting & Prevention | 2,834 (76.4%) | 873 (23.5%) |
| Law Enforcement | 1,302 (82.5%) | 277 (17.5%) |
| Food Preparation & Serving | 5,885 (47.0%) | 6,638 (53.0%) |
| Cleaning & Maintenance | 4,396 (58.6%) | 3,104 (41.4%) |
| Personal Care & Service | 1,474 (22.4%) | 5,104 (77.6%) |
| Total (Category) | 17,516 (43.9%) | 22,358 (56.1%) |
| Total (Overall) | 125,898 (53.2%) | 110,539 (46.8%) |
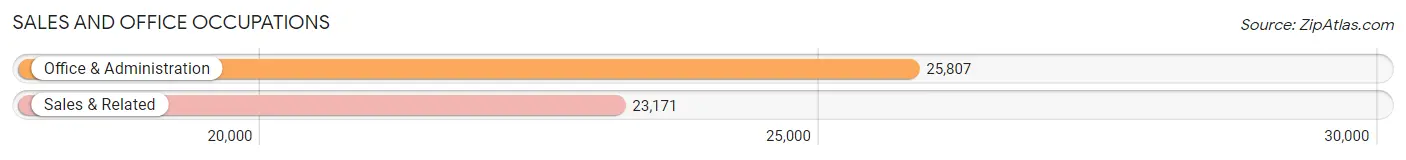
Sales and Office Occupations
The most common Sales and Office occupations in Colorado Springs are Office & Administration (25,807 | 10.9%), and Sales & Related (23,171 | 9.8%).
Sales and Office Occupations by Sex
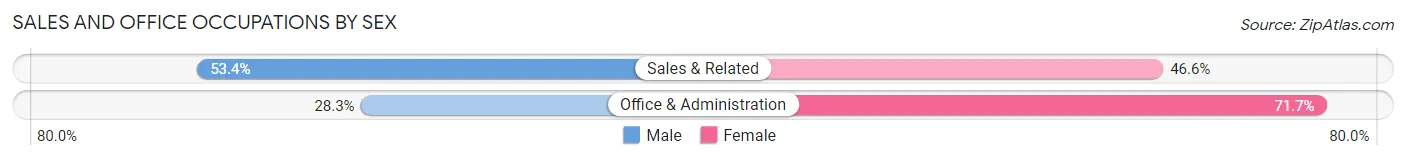
| Occupation | Male | Female |
| Sales & Related | 12,383 (53.4%) | 10,788 (46.6%) |
| Office & Administration | 7,310 (28.3%) | 18,497 (71.7%) |
| Total (Category) | 19,693 (40.2%) | 29,285 (59.8%) |
| Total (Overall) | 125,898 (53.2%) | 110,539 (46.8%) |
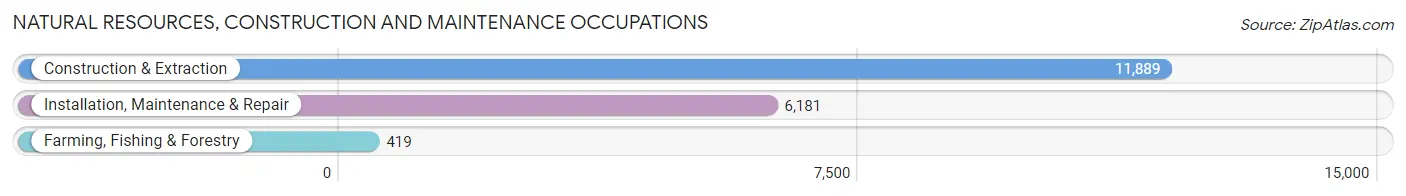
Natural Resources, Construction and Maintenance Occupations
The most common Natural Resources, Construction and Maintenance occupations in Colorado Springs are Construction & Extraction (11,889 | 5.0%), Installation, Maintenance & Repair (6,181 | 2.6%), and Farming, Fishing & Forestry (419 | 0.2%).
Natural Resources, Construction and Maintenance Occupations by Sex
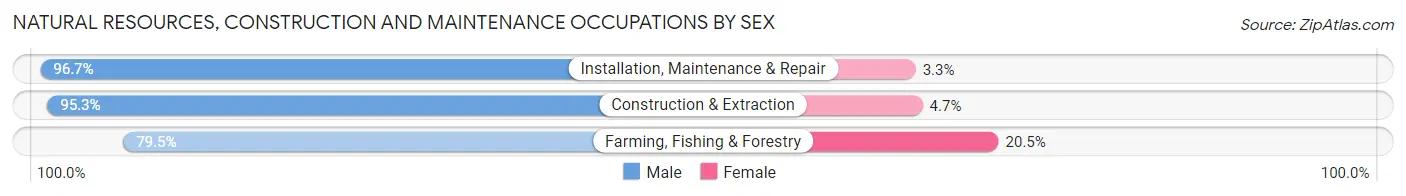
| Occupation | Male | Female |
| Farming, Fishing & Forestry | 333 (79.5%) | 86 (20.5%) |
| Construction & Extraction | 11,327 (95.3%) | 562 (4.7%) |
| Installation, Maintenance & Repair | 5,978 (96.7%) | 203 (3.3%) |
| Total (Category) | 17,638 (95.4%) | 851 (4.6%) |
| Total (Overall) | 125,898 (53.2%) | 110,539 (46.8%) |
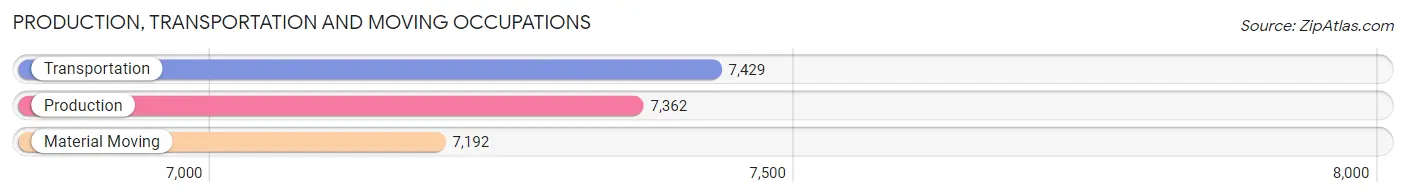
Production, Transportation and Moving Occupations
The most common Production, Transportation and Moving occupations in Colorado Springs are Transportation (7,429 | 3.1%), Production (7,362 | 3.1%), and Material Moving (7,192 | 3.0%).
Production, Transportation and Moving Occupations by Sex
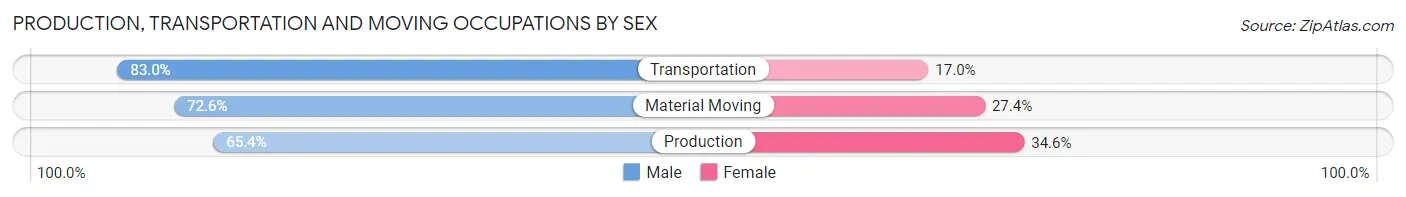
| Occupation | Male | Female |
| Production | 4,812 (65.4%) | 2,550 (34.6%) |
| Transportation | 6,163 (83.0%) | 1,266 (17.0%) |
| Material Moving | 5,220 (72.6%) | 1,972 (27.4%) |
| Total (Category) | 16,195 (73.7%) | 5,788 (26.3%) |
| Total (Overall) | 125,898 (53.2%) | 110,539 (46.8%) |
Employment Industries by Sex in Colorado Springs
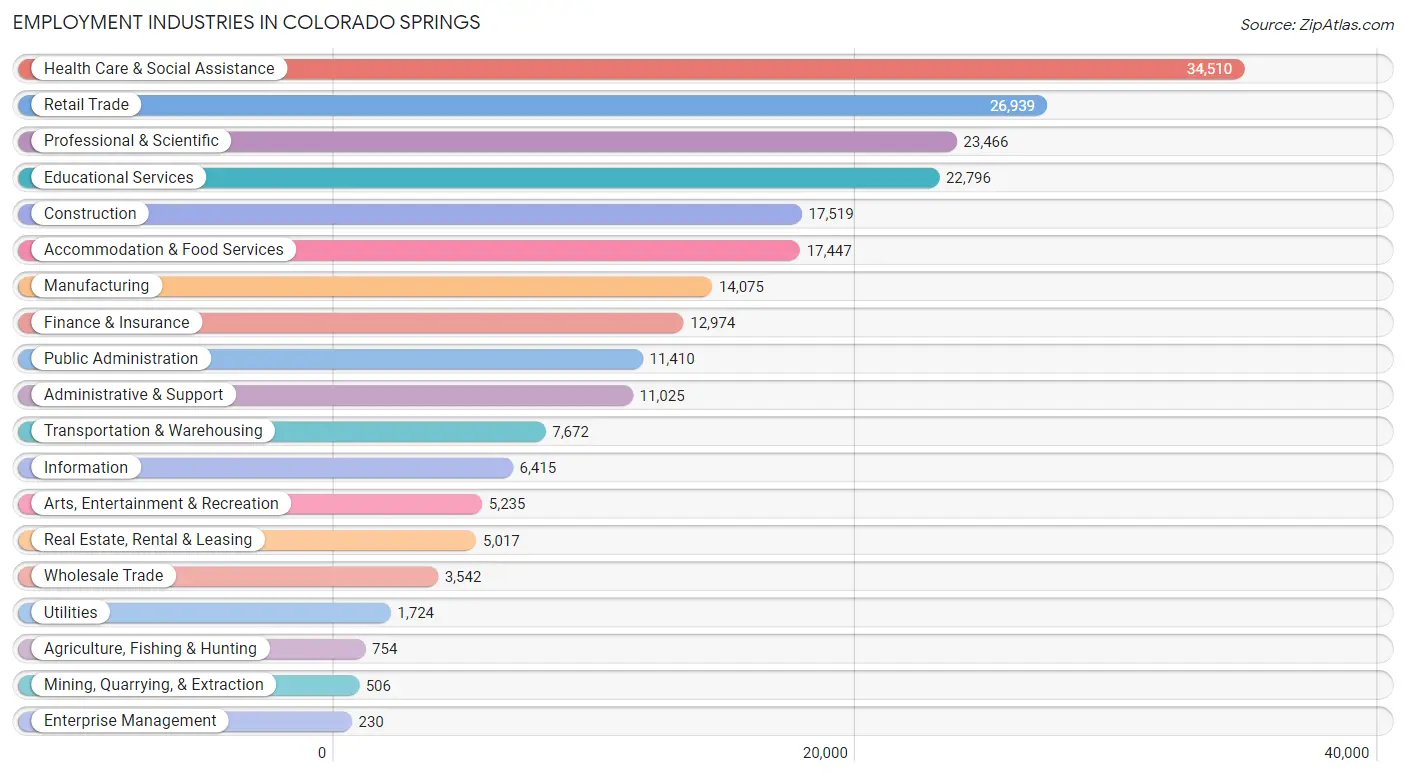
Employment Industries in Colorado Springs
The major employment industries in Colorado Springs include Health Care & Social Assistance (34,510 | 14.6%), Retail Trade (26,939 | 11.4%), Professional & Scientific (23,466 | 9.9%), Educational Services (22,796 | 9.6%), and Construction (17,519 | 7.4%).
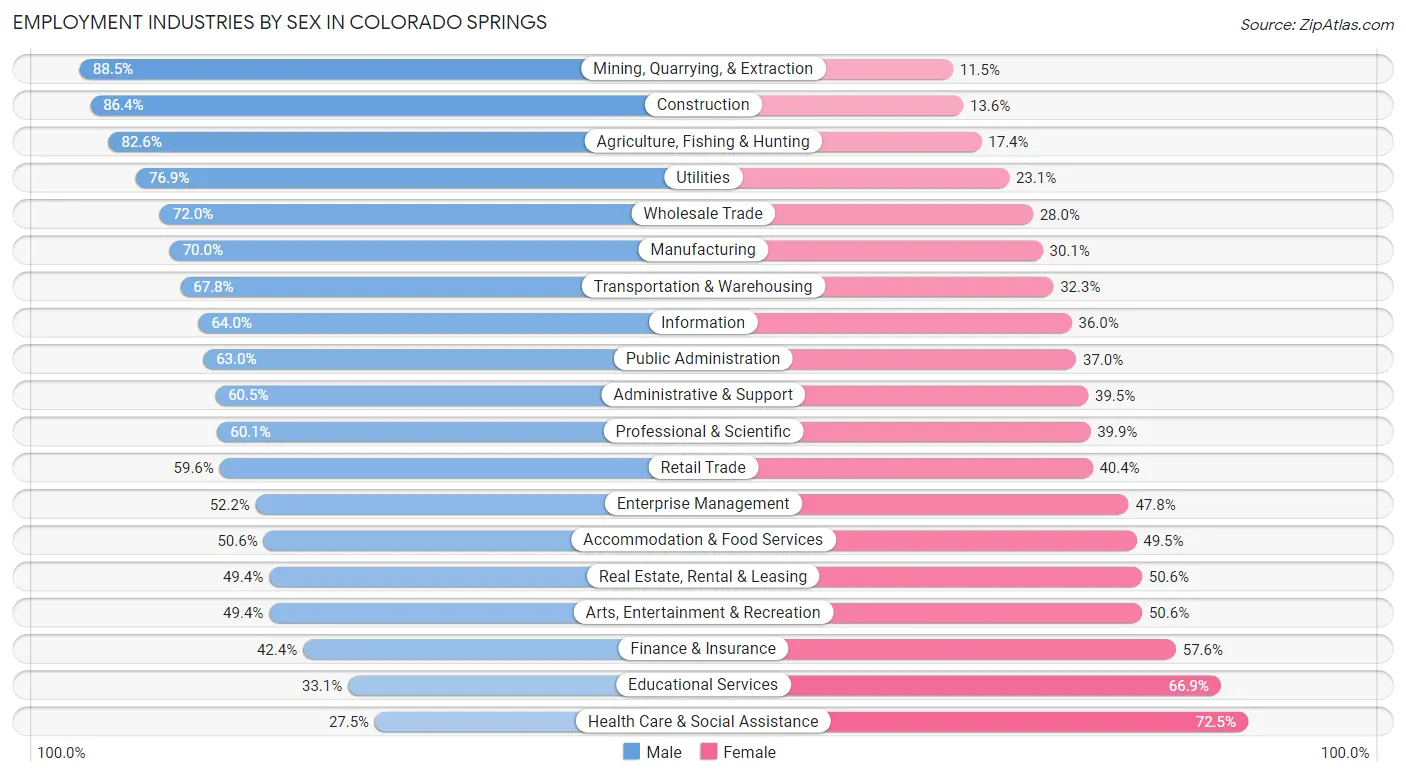
Employment Industries by Sex in Colorado Springs
The Colorado Springs industries that see more men than women are Mining, Quarrying, & Extraction (88.5%), Construction (86.4%), and Agriculture, Fishing & Hunting (82.6%), whereas the industries that tend to have a higher number of women are Health Care & Social Assistance (72.5%), Educational Services (66.9%), and Finance & Insurance (57.6%).
| Industry | Male | Female |
| Agriculture, Fishing & Hunting | 623 (82.6%) | 131 (17.4%) |
| Mining, Quarrying, & Extraction | 448 (88.5%) | 58 (11.5%) |
| Construction | 15,140 (86.4%) | 2,379 (13.6%) |
| Manufacturing | 9,845 (70.0%) | 4,230 (30.0%) |
| Wholesale Trade | 2,550 (72.0%) | 992 (28.0%) |
| Retail Trade | 16,064 (59.6%) | 10,875 (40.4%) |
| Transportation & Warehousing | 5,198 (67.7%) | 2,474 (32.3%) |
| Utilities | 1,326 (76.9%) | 398 (23.1%) |
| Information | 4,103 (64.0%) | 2,312 (36.0%) |
| Finance & Insurance | 5,499 (42.4%) | 7,475 (57.6%) |
| Real Estate, Rental & Leasing | 2,479 (49.4%) | 2,538 (50.6%) |
| Professional & Scientific | 14,102 (60.1%) | 9,364 (39.9%) |
| Enterprise Management | 120 (52.2%) | 110 (47.8%) |
| Administrative & Support | 6,674 (60.5%) | 4,351 (39.5%) |
| Educational Services | 7,537 (33.1%) | 15,259 (66.9%) |
| Health Care & Social Assistance | 9,485 (27.5%) | 25,025 (72.5%) |
| Arts, Entertainment & Recreation | 2,585 (49.4%) | 2,650 (50.6%) |
| Accommodation & Food Services | 8,819 (50.5%) | 8,628 (49.4%) |
| Public Administration | 7,191 (63.0%) | 4,219 (37.0%) |
| Total | 125,898 (53.2%) | 110,539 (46.8%) |
Education in Colorado Springs
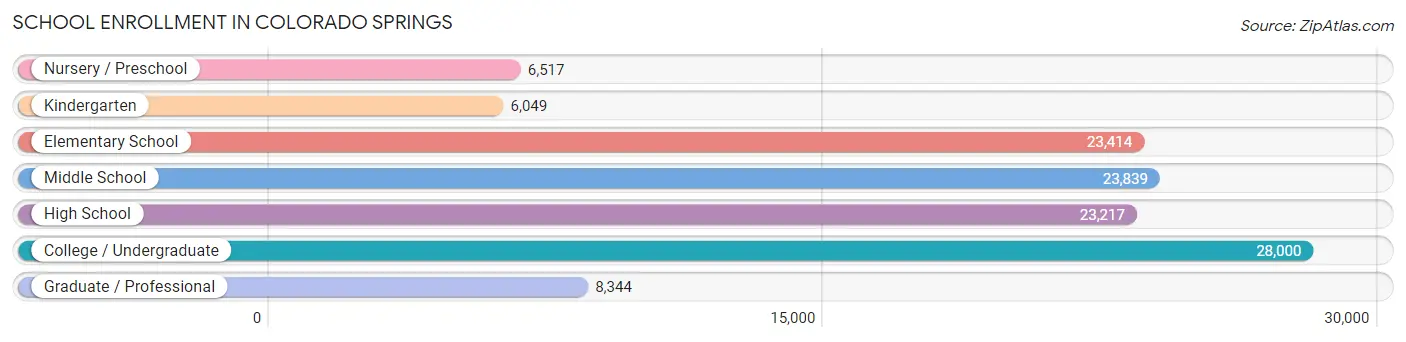
School Enrollment in Colorado Springs
The most common levels of schooling among the 119,380 students in Colorado Springs are college / undergraduate (28,000 | 23.4%), middle school (23,839 | 20.0%), and elementary school (23,414 | 19.6%).
| School Level | # Students | % Students |
| Nursery / Preschool | 6,517 | 5.5% |
| Kindergarten | 6,049 | 5.1% |
| Elementary School | 23,414 | 19.6% |
| Middle School | 23,839 | 20.0% |
| High School | 23,217 | 19.5% |
| College / Undergraduate | 28,000 | 23.4% |
| Graduate / Professional | 8,344 | 7.0% |
| Total | 119,380 | 100.0% |
School Enrollment by Age by Funding Source in Colorado Springs
Out of a total of 119,380 students who are enrolled in schools in Colorado Springs, 18,981 (15.9%) attend a private institution, while the remaining 100,399 (84.1%) are enrolled in public schools. The age group of 3 to 4 year olds has the highest likelihood of being enrolled in private schools, with 1,943 (37.6% in the age bracket) enrolled. Conversely, the age group of 15 to 17 year olds has the lowest likelihood of being enrolled in a private school, with 15,194 (90.7% in the age bracket) attending a public institution.
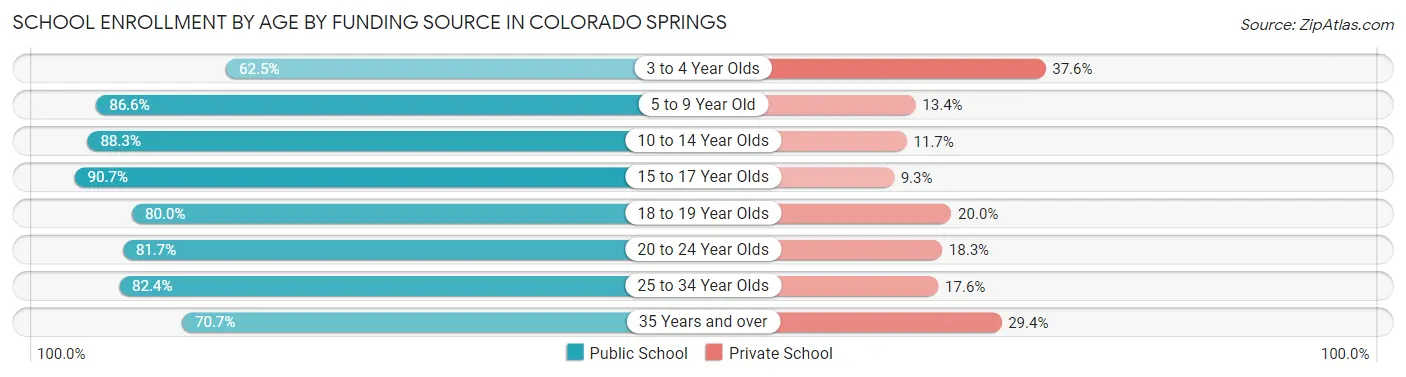
| Age Bracket | Public School | Private School |
| 3 to 4 Year Olds | 3,231 (62.5%) | 1,943 (37.6%) |
| 5 to 9 Year Old | 24,538 (86.6%) | 3,784 (13.4%) |
| 10 to 14 Year Olds | 25,967 (88.3%) | 3,447 (11.7%) |
| 15 to 17 Year Olds | 15,194 (90.7%) | 1,561 (9.3%) |
| 18 to 19 Year Olds | 6,950 (80.0%) | 1,740 (20.0%) |
| 20 to 24 Year Olds | 9,552 (81.7%) | 2,139 (18.3%) |
| 25 to 34 Year Olds | 8,906 (82.4%) | 1,902 (17.6%) |
| 35 Years and over | 6,024 (70.7%) | 2,502 (29.3%) |
| Total | 100,399 (84.1%) | 18,981 (15.9%) |
Educational Attainment by Field of Study in Colorado Springs
Business (25,428 | 17.5%), education (13,854 | 9.5%), science & technology (12,415 | 8.6%), social sciences (12,081 | 8.3%), and engineering (11,636 | 8.0%) are the most common fields of study among 145,236 individuals in Colorado Springs who have obtained a bachelor's degree or higher.
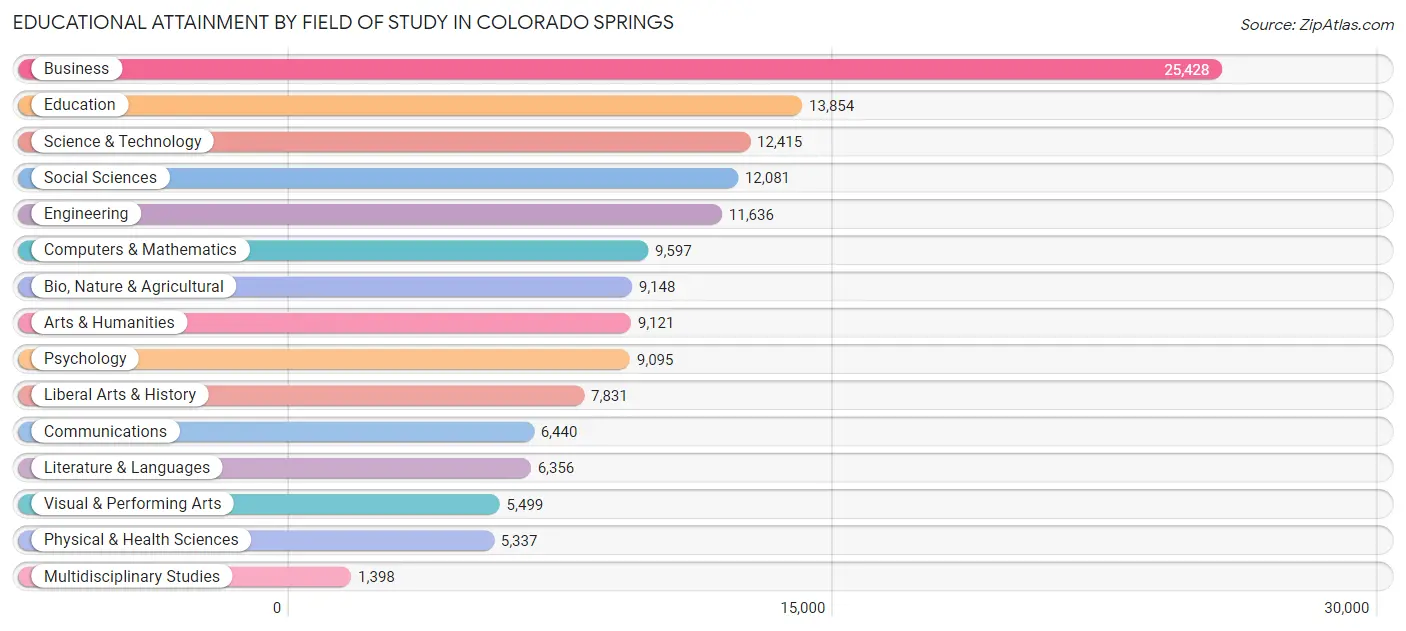
| Field of Study | # Graduates | % Graduates |
| Computers & Mathematics | 9,597 | 6.6% |
| Bio, Nature & Agricultural | 9,148 | 6.3% |
| Physical & Health Sciences | 5,337 | 3.7% |
| Psychology | 9,095 | 6.3% |
| Social Sciences | 12,081 | 8.3% |
| Engineering | 11,636 | 8.0% |
| Multidisciplinary Studies | 1,398 | 1.0% |
| Science & Technology | 12,415 | 8.6% |
| Business | 25,428 | 17.5% |
| Education | 13,854 | 9.5% |
| Literature & Languages | 6,356 | 4.4% |
| Liberal Arts & History | 7,831 | 5.4% |
| Visual & Performing Arts | 5,499 | 3.8% |
| Communications | 6,440 | 4.4% |
| Arts & Humanities | 9,121 | 6.3% |
| Total | 145,236 | 100.0% |
Transportation & Commute in Colorado Springs
Vehicle Availability by Sex in Colorado Springs
The most prevalent vehicle ownership categories in Colorado Springs are males with 2 vehicles (60,803, accounting for 45.6%) and females with 2 vehicles (46,566, making up 56.2%).
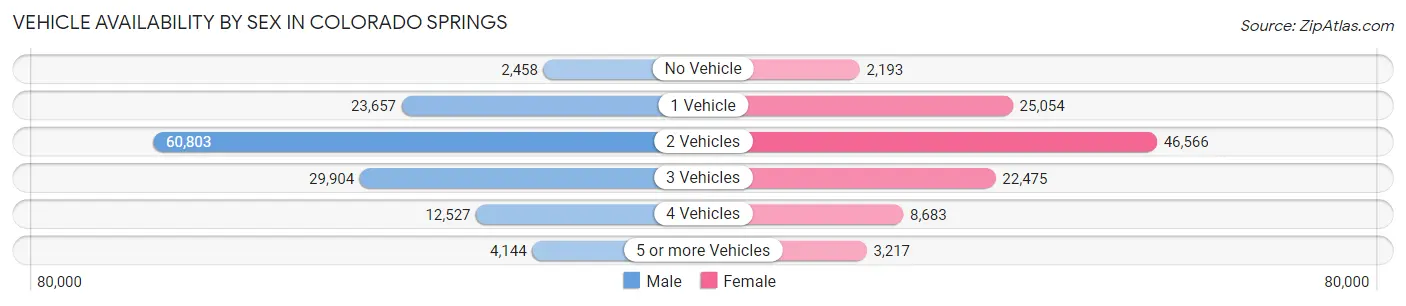
| Vehicles Available | Male | Female |
| No Vehicle | 2,458 (1.8%) | 2,193 (2.0%) |
| 1 Vehicle | 23,657 (17.7%) | 25,054 (23.2%) |
| 2 Vehicles | 60,803 (45.6%) | 46,566 (43.0%) |
| 3 Vehicles | 29,904 (22.4%) | 22,475 (20.8%) |
| 4 Vehicles | 12,527 (9.4%) | 8,683 (8.0%) |
| 5 or more Vehicles | 4,144 (3.1%) | 3,217 (3.0%) |
| Total | 133,493 (100.0%) | 108,188 (100.0%) |
Commute Time in Colorado Springs
The most frequently occuring commute durations in Colorado Springs are 15 to 19 minutes (44,981 commuters, 21.4%), 20 to 24 minutes (41,466 commuters, 19.7%), and 10 to 14 minutes (31,617 commuters, 15.0%).
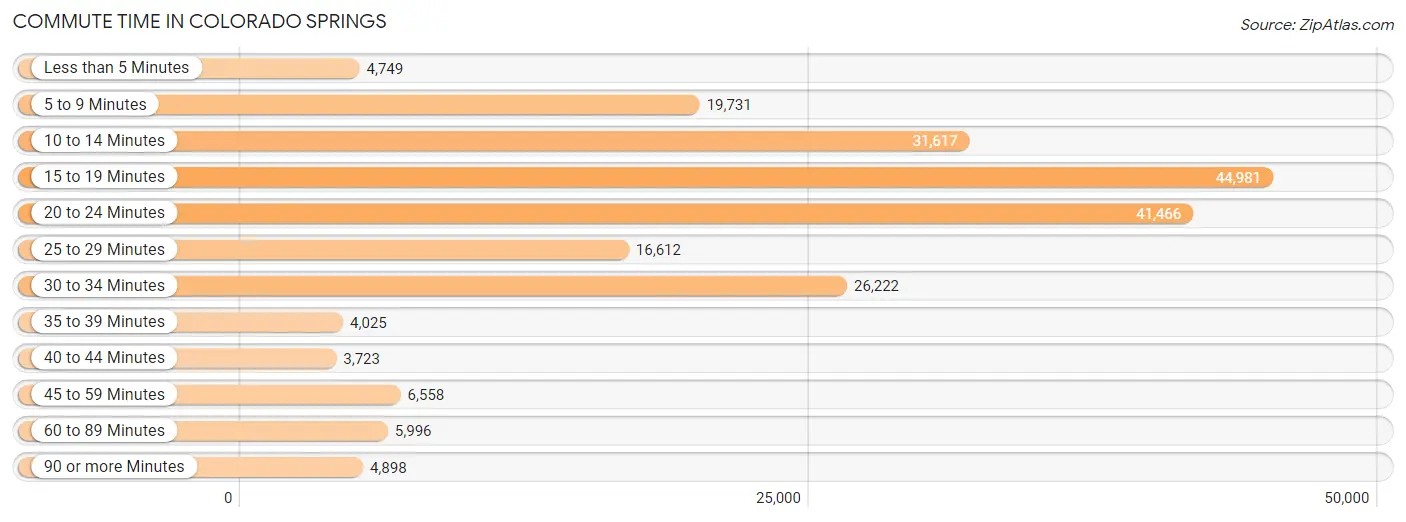
| Commute Time | # Commuters | % Commuters |
| Less than 5 Minutes | 4,749 | 2.3% |
| 5 to 9 Minutes | 19,731 | 9.4% |
| 10 to 14 Minutes | 31,617 | 15.0% |
| 15 to 19 Minutes | 44,981 | 21.4% |
| 20 to 24 Minutes | 41,466 | 19.7% |
| 25 to 29 Minutes | 16,612 | 7.9% |
| 30 to 34 Minutes | 26,222 | 12.4% |
| 35 to 39 Minutes | 4,025 | 1.9% |
| 40 to 44 Minutes | 3,723 | 1.8% |
| 45 to 59 Minutes | 6,558 | 3.1% |
| 60 to 89 Minutes | 5,996 | 2.9% |
| 90 or more Minutes | 4,898 | 2.3% |
Commute Time by Sex in Colorado Springs
The most common commute times in Colorado Springs are 15 to 19 minutes (24,695 commuters, 20.6%) for males and 15 to 19 minutes (20,286 commuters, 22.3%) for females.
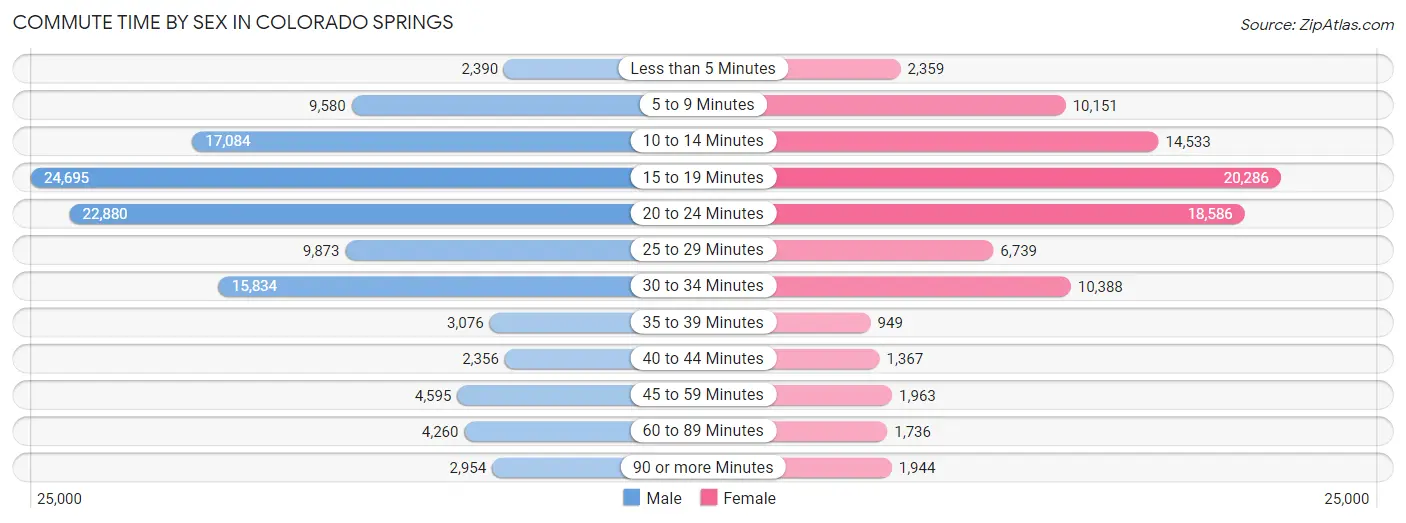
| Commute Time | Male | Female |
| Less than 5 Minutes | 2,390 (2.0%) | 2,359 (2.6%) |
| 5 to 9 Minutes | 9,580 (8.0%) | 10,151 (11.2%) |
| 10 to 14 Minutes | 17,084 (14.3%) | 14,533 (16.0%) |
| 15 to 19 Minutes | 24,695 (20.6%) | 20,286 (22.3%) |
| 20 to 24 Minutes | 22,880 (19.1%) | 18,586 (20.4%) |
| 25 to 29 Minutes | 9,873 (8.3%) | 6,739 (7.4%) |
| 30 to 34 Minutes | 15,834 (13.2%) | 10,388 (11.4%) |
| 35 to 39 Minutes | 3,076 (2.6%) | 949 (1.0%) |
| 40 to 44 Minutes | 2,356 (2.0%) | 1,367 (1.5%) |
| 45 to 59 Minutes | 4,595 (3.8%) | 1,963 (2.2%) |
| 60 to 89 Minutes | 4,260 (3.6%) | 1,736 (1.9%) |
| 90 or more Minutes | 2,954 (2.5%) | 1,944 (2.1%) |
Time of Departure to Work by Sex in Colorado Springs
The most frequent times of departure to work in Colorado Springs are 7:00 AM to 7:29 AM (18,054, 15.1%) for males and 7:00 AM to 7:29 AM (15,302, 16.8%) for females.
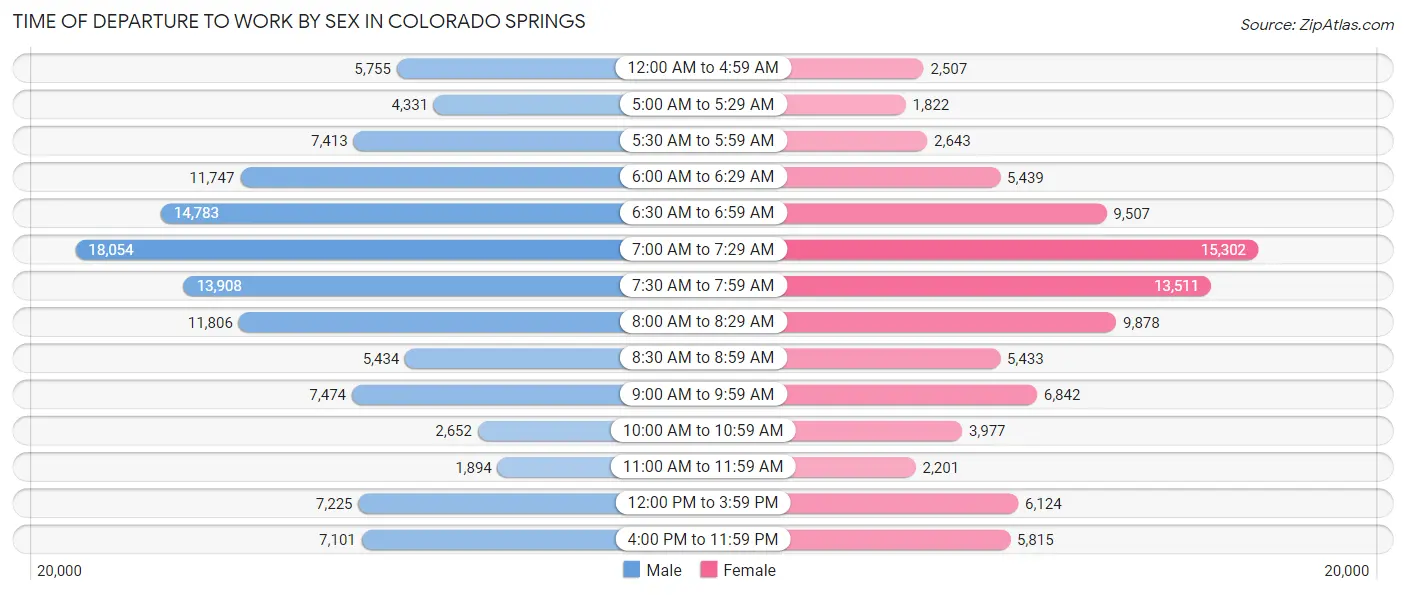
| Time of Departure | Male | Female |
| 12:00 AM to 4:59 AM | 5,755 (4.8%) | 2,507 (2.8%) |
| 5:00 AM to 5:29 AM | 4,331 (3.6%) | 1,822 (2.0%) |
| 5:30 AM to 5:59 AM | 7,413 (6.2%) | 2,643 (2.9%) |
| 6:00 AM to 6:29 AM | 11,747 (9.8%) | 5,439 (6.0%) |
| 6:30 AM to 6:59 AM | 14,783 (12.4%) | 9,507 (10.4%) |
| 7:00 AM to 7:29 AM | 18,054 (15.1%) | 15,302 (16.8%) |
| 7:30 AM to 7:59 AM | 13,908 (11.6%) | 13,511 (14.8%) |
| 8:00 AM to 8:29 AM | 11,806 (9.9%) | 9,878 (10.8%) |
| 8:30 AM to 8:59 AM | 5,434 (4.5%) | 5,433 (6.0%) |
| 9:00 AM to 9:59 AM | 7,474 (6.2%) | 6,842 (7.5%) |
| 10:00 AM to 10:59 AM | 2,652 (2.2%) | 3,977 (4.4%) |
| 11:00 AM to 11:59 AM | 1,894 (1.6%) | 2,201 (2.4%) |
| 12:00 PM to 3:59 PM | 7,225 (6.0%) | 6,124 (6.7%) |
| 4:00 PM to 11:59 PM | 7,101 (5.9%) | 5,815 (6.4%) |
| Total | 119,577 (100.0%) | 91,001 (100.0%) |
Housing Occupancy in Colorado Springs
Occupancy by Ownership in Colorado Springs
Of the total 193,149 dwellings in Colorado Springs, owner-occupied units account for 117,970 (61.1%), while renter-occupied units make up 75,179 (38.9%).
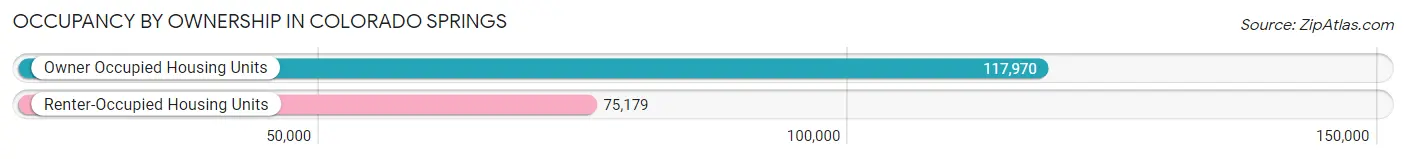
| Occupancy | # Housing Units | % Housing Units |
| Owner Occupied Housing Units | 117,970 | 61.1% |
| Renter-Occupied Housing Units | 75,179 | 38.9% |
| Total Occupied Housing Units | 193,149 | 100.0% |
Occupancy by Household Size in Colorado Springs
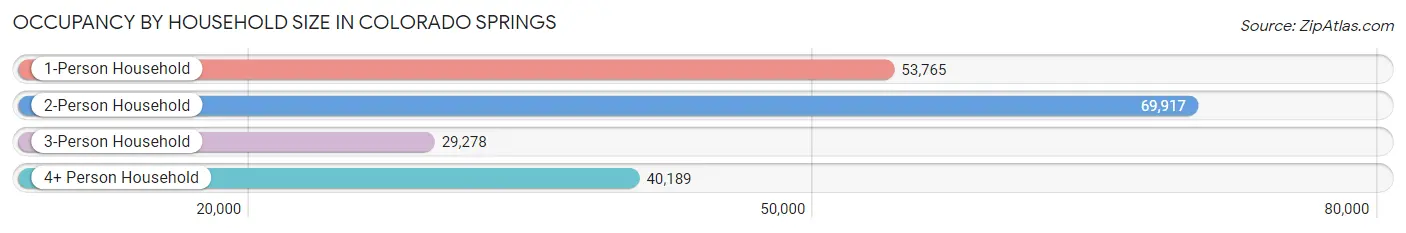
| Household Size | # Housing Units | % Housing Units |
| 1-Person Household | 53,765 | 27.8% |
| 2-Person Household | 69,917 | 36.2% |
| 3-Person Household | 29,278 | 15.2% |
| 4+ Person Household | 40,189 | 20.8% |
| Total Housing Units | 193,149 | 100.0% |
Occupancy by Ownership by Household Size in Colorado Springs
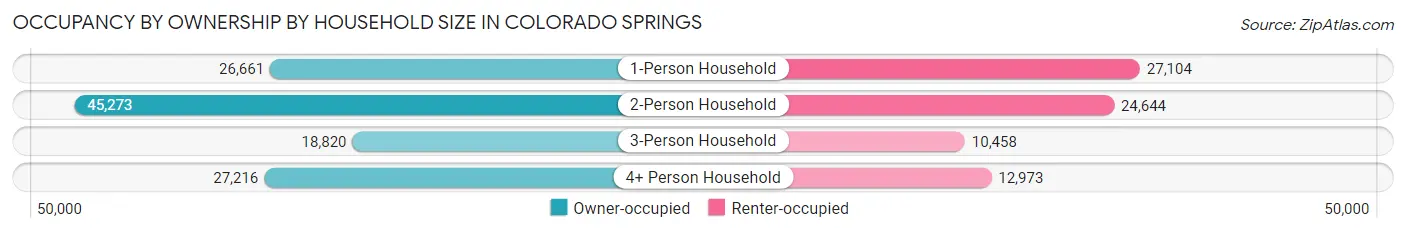
| Household Size | Owner-occupied | Renter-occupied |
| 1-Person Household | 26,661 (49.6%) | 27,104 (50.4%) |
| 2-Person Household | 45,273 (64.7%) | 24,644 (35.2%) |
| 3-Person Household | 18,820 (64.3%) | 10,458 (35.7%) |
| 4+ Person Household | 27,216 (67.7%) | 12,973 (32.3%) |
| Total Housing Units | 117,970 (61.1%) | 75,179 (38.9%) |
Occupancy by Educational Attainment in Colorado Springs
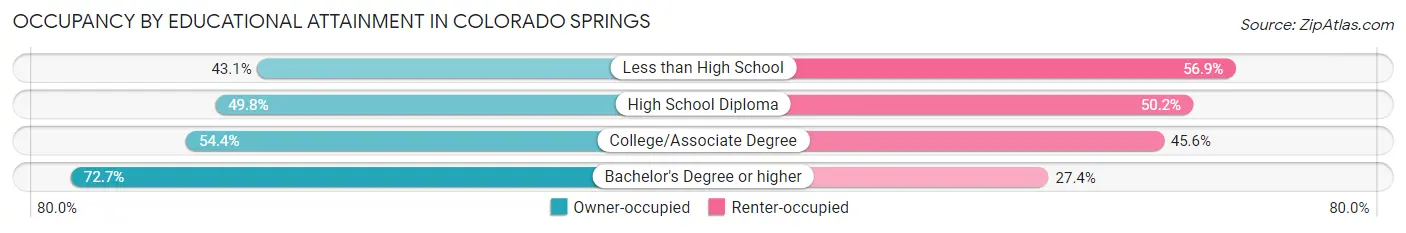
| Household Size | Owner-occupied | Renter-occupied |
| Less than High School | 3,376 (43.1%) | 4,464 (56.9%) |
| High School Diploma | 16,196 (49.8%) | 16,353 (50.2%) |
| College/Associate Degree | 37,454 (54.4%) | 31,418 (45.6%) |
| Bachelor's Degree or higher | 60,944 (72.7%) | 22,944 (27.4%) |
Occupancy by Age of Householder in Colorado Springs
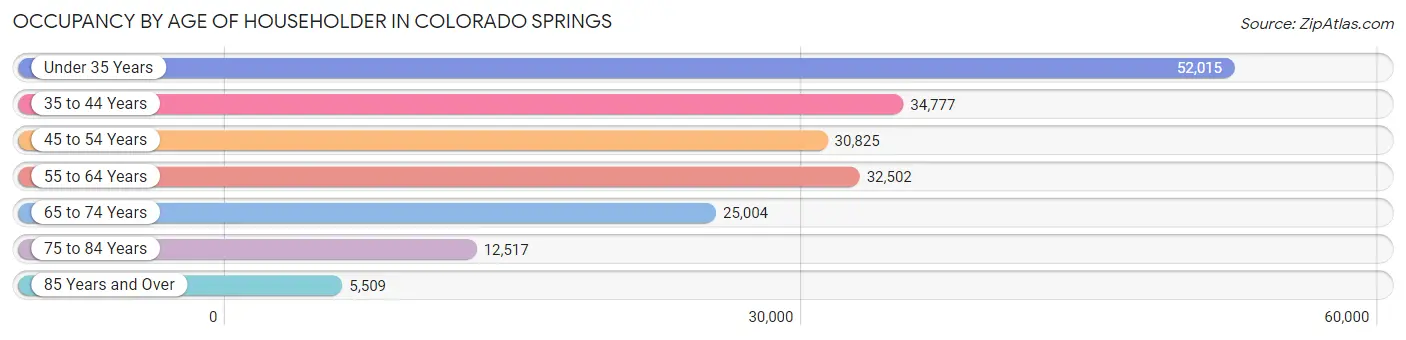
| Age Bracket | # Households | % Households |
| Under 35 Years | 52,015 | 26.9% |
| 35 to 44 Years | 34,777 | 18.0% |
| 45 to 54 Years | 30,825 | 16.0% |
| 55 to 64 Years | 32,502 | 16.8% |
| 65 to 74 Years | 25,004 | 13.0% |
| 75 to 84 Years | 12,517 | 6.5% |
| 85 Years and Over | 5,509 | 2.9% |
| Total | 193,149 | 100.0% |
Housing Finances in Colorado Springs
Median Income by Occupancy in Colorado Springs
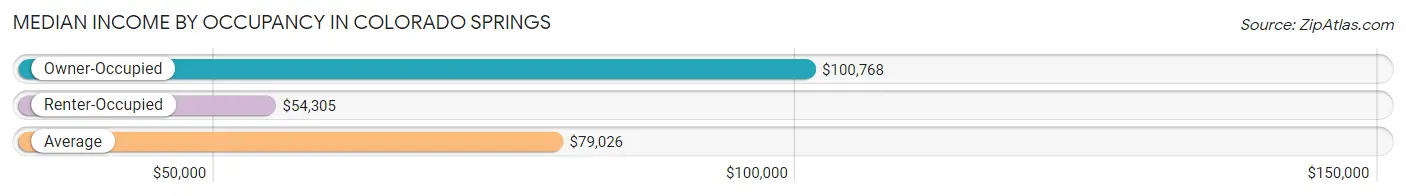
| Occupancy Type | # Households | Median Income |
| Owner-Occupied | 117,970 (61.1%) | $100,768 |
| Renter-Occupied | 75,179 (38.9%) | $54,305 |
| Average | 193,149 (100.0%) | $79,026 |
Occupancy by Householder Income Bracket in Colorado Springs
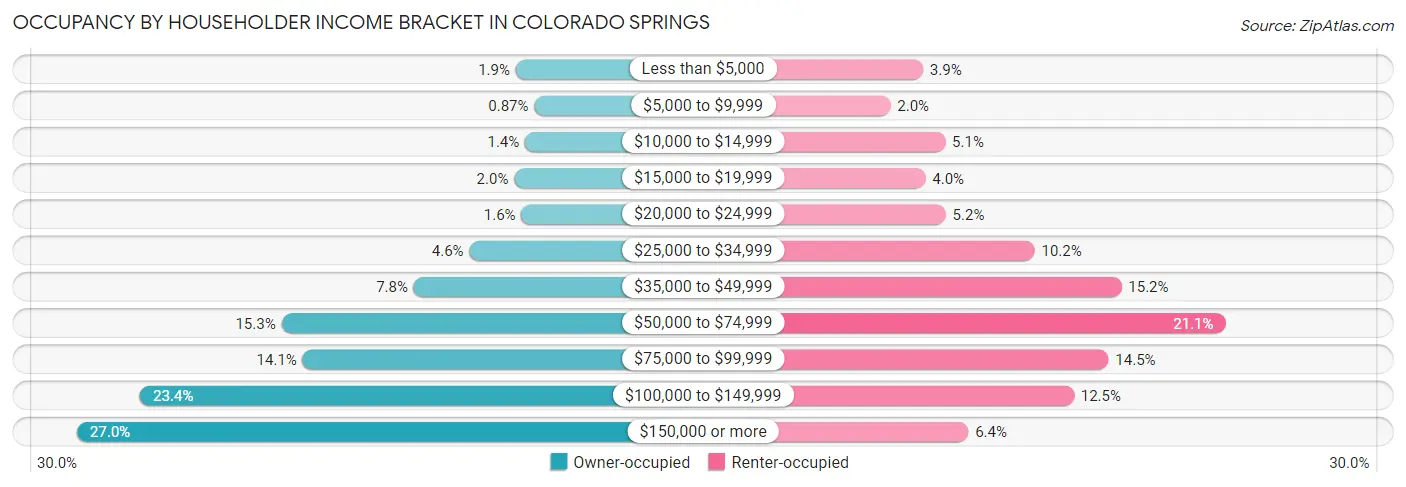
| Income Bracket | Owner-occupied | Renter-occupied |
| Less than $5,000 | 2,279 (1.9%) | 2,893 (3.8%) |
| $5,000 to $9,999 | 1,022 (0.9%) | 1,497 (2.0%) |
| $10,000 to $14,999 | 1,650 (1.4%) | 3,851 (5.1%) |
| $15,000 to $19,999 | 2,379 (2.0%) | 2,996 (4.0%) |
| $20,000 to $24,999 | 1,902 (1.6%) | 3,869 (5.1%) |
| $25,000 to $34,999 | 5,405 (4.6%) | 7,689 (10.2%) |
| $35,000 to $49,999 | 9,152 (7.8%) | 11,416 (15.2%) |
| $50,000 to $74,999 | 18,070 (15.3%) | 15,882 (21.1%) |
| $75,000 to $99,999 | 16,644 (14.1%) | 10,865 (14.4%) |
| $100,000 to $149,999 | 27,608 (23.4%) | 9,378 (12.5%) |
| $150,000 or more | 31,859 (27.0%) | 4,843 (6.4%) |
| Total | 117,970 (100.0%) | 75,179 (100.0%) |
Monthly Housing Cost Tiers in Colorado Springs
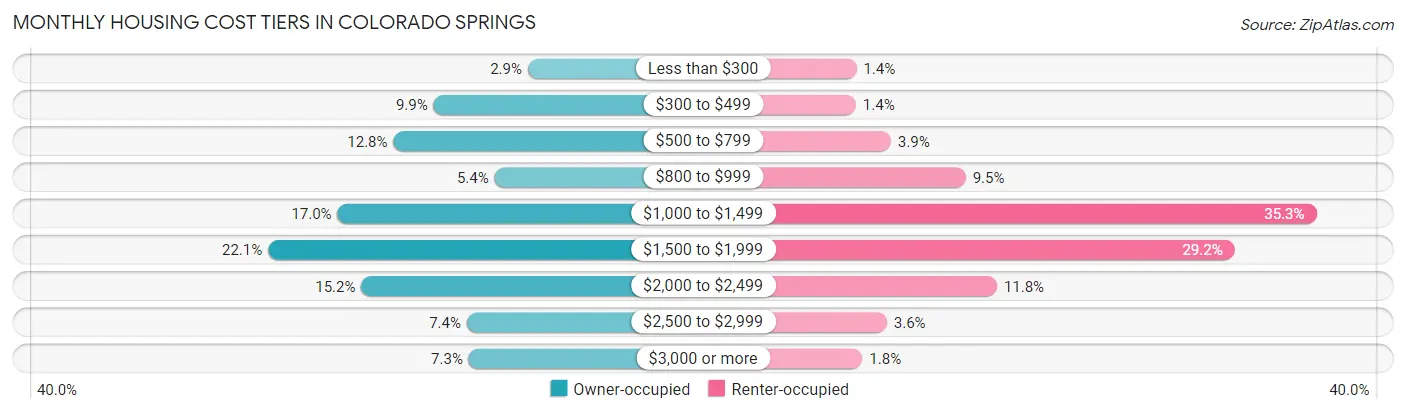
| Monthly Cost | Owner-occupied | Renter-occupied |
| Less than $300 | 3,464 (2.9%) | 1,050 (1.4%) |
| $300 to $499 | 11,657 (9.9%) | 1,022 (1.4%) |
| $500 to $799 | 15,143 (12.8%) | 2,961 (3.9%) |
| $800 to $999 | 6,362 (5.4%) | 7,104 (9.5%) |
| $1,000 to $1,499 | 20,004 (17.0%) | 26,513 (35.3%) |
| $1,500 to $1,999 | 26,039 (22.1%) | 21,980 (29.2%) |
| $2,000 to $2,499 | 17,935 (15.2%) | 8,832 (11.7%) |
| $2,500 to $2,999 | 8,765 (7.4%) | 2,733 (3.6%) |
| $3,000 or more | 8,601 (7.3%) | 1,382 (1.8%) |
| Total | 117,970 (100.0%) | 75,179 (100.0%) |
Physical Housing Characteristics in Colorado Springs
Housing Structures in Colorado Springs
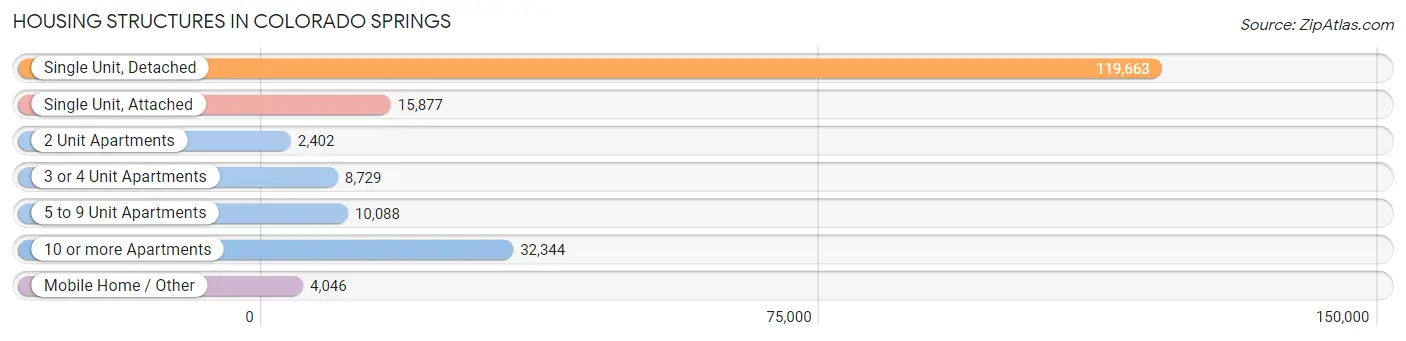
| Structure Type | # Housing Units | % Housing Units |
| Single Unit, Detached | 119,663 | 62.0% |
| Single Unit, Attached | 15,877 | 8.2% |
| 2 Unit Apartments | 2,402 | 1.2% |
| 3 or 4 Unit Apartments | 8,729 | 4.5% |
| 5 to 9 Unit Apartments | 10,088 | 5.2% |
| 10 or more Apartments | 32,344 | 16.8% |
| Mobile Home / Other | 4,046 | 2.1% |
| Total | 193,149 | 100.0% |
Housing Structures by Occupancy in Colorado Springs
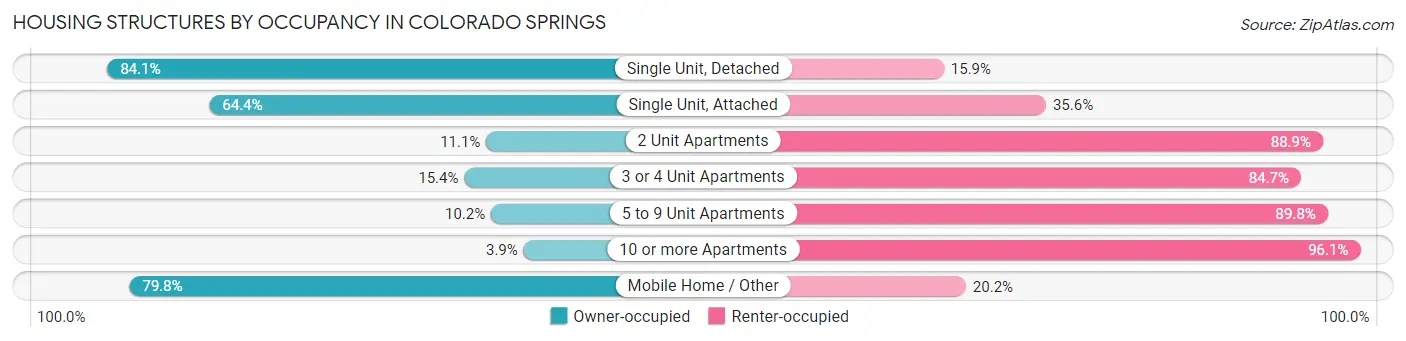
| Structure Type | Owner-occupied | Renter-occupied |
| Single Unit, Detached | 100,610 (84.1%) | 19,053 (15.9%) |
| Single Unit, Attached | 10,228 (64.4%) | 5,649 (35.6%) |
| 2 Unit Apartments | 267 (11.1%) | 2,135 (88.9%) |
| 3 or 4 Unit Apartments | 1,340 (15.3%) | 7,389 (84.7%) |
| 5 to 9 Unit Apartments | 1,028 (10.2%) | 9,060 (89.8%) |
| 10 or more Apartments | 1,267 (3.9%) | 31,077 (96.1%) |
| Mobile Home / Other | 3,230 (79.8%) | 816 (20.2%) |
| Total | 117,970 (61.1%) | 75,179 (38.9%) |
Housing Structures by Number of Rooms in Colorado Springs
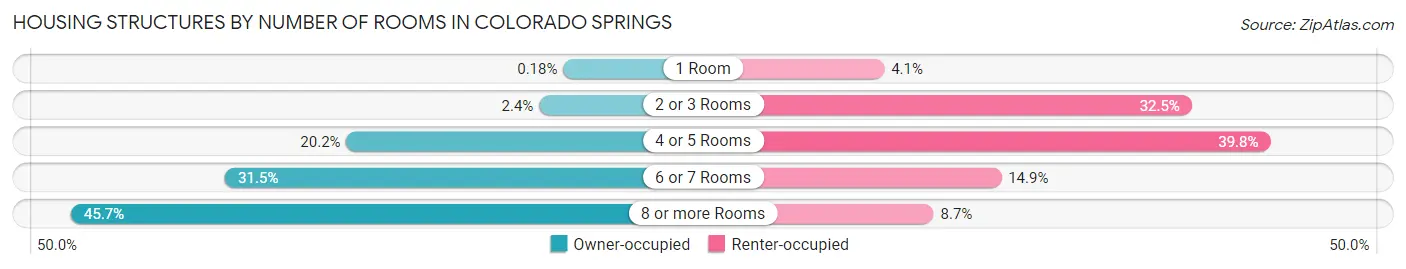
| Number of Rooms | Owner-occupied | Renter-occupied |
| 1 Room | 214 (0.2%) | 3,084 (4.1%) |
| 2 or 3 Rooms | 2,839 (2.4%) | 24,452 (32.5%) |
| 4 or 5 Rooms | 23,872 (20.2%) | 29,921 (39.8%) |
| 6 or 7 Rooms | 37,109 (31.5%) | 11,214 (14.9%) |
| 8 or more Rooms | 53,936 (45.7%) | 6,508 (8.7%) |
| Total | 117,970 (100.0%) | 75,179 (100.0%) |
Housing Structure by Heating Type in Colorado Springs
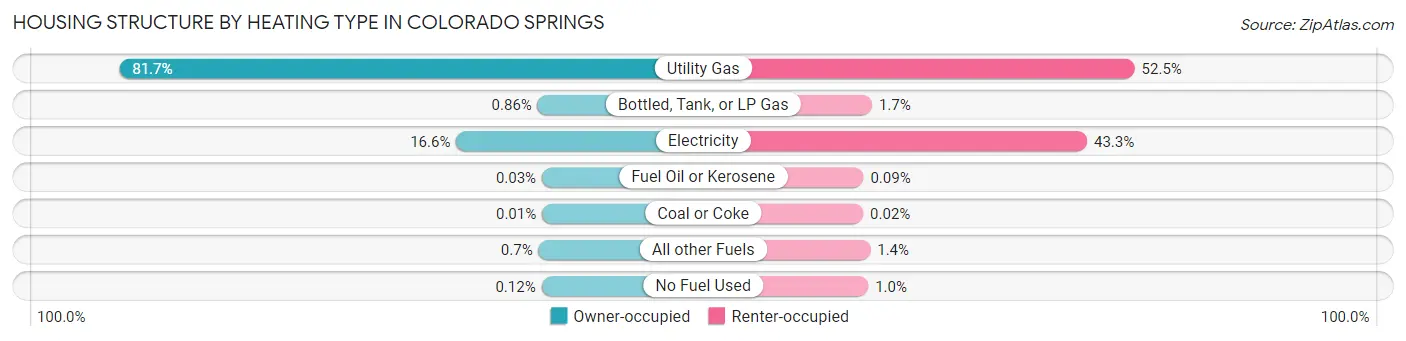
| Heating Type | Owner-occupied | Renter-occupied |
| Utility Gas | 96,381 (81.7%) | 39,453 (52.5%) |
| Bottled, Tank, or LP Gas | 1,014 (0.9%) | 1,299 (1.7%) |
| Electricity | 19,569 (16.6%) | 32,537 (43.3%) |
| Fuel Oil or Kerosene | 31 (0.0%) | 71 (0.1%) |
| Coal or Coke | 9 (0.0%) | 14 (0.0%) |
| All other Fuels | 820 (0.7%) | 1,055 (1.4%) |
| No Fuel Used | 146 (0.1%) | 750 (1.0%) |
| Total | 117,970 (100.0%) | 75,179 (100.0%) |
Household Vehicle Usage in Colorado Springs
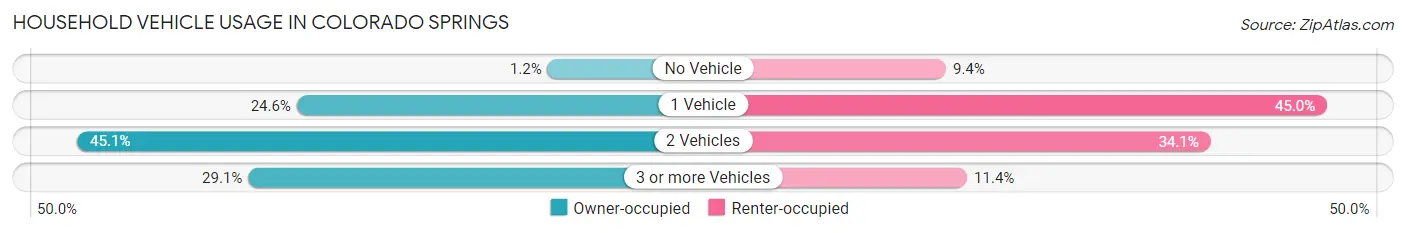
| Vehicles per Household | Owner-occupied | Renter-occupied |
| No Vehicle | 1,392 (1.2%) | 7,095 (9.4%) |
| 1 Vehicle | 29,020 (24.6%) | 33,837 (45.0%) |
| 2 Vehicles | 53,189 (45.1%) | 25,667 (34.1%) |
| 3 or more Vehicles | 34,369 (29.1%) | 8,580 (11.4%) |
| Total | 117,970 (100.0%) | 75,179 (100.0%) |
Real Estate & Mortgages in Colorado Springs
Real Estate and Mortgage Overview in Colorado Springs
| Characteristic | Without Mortgage | With Mortgage |
| Housing Units | 33,709 | 84,261 |
| Median Property Value | $372,700 | $386,200 |
| Median Household Income | $77,478 | $25,094 |
| Monthly Housing Costs | $537 | $8,517 |
| Real Estate Taxes | $1,419 | $1,490 |
Property Value by Mortgage Status in Colorado Springs
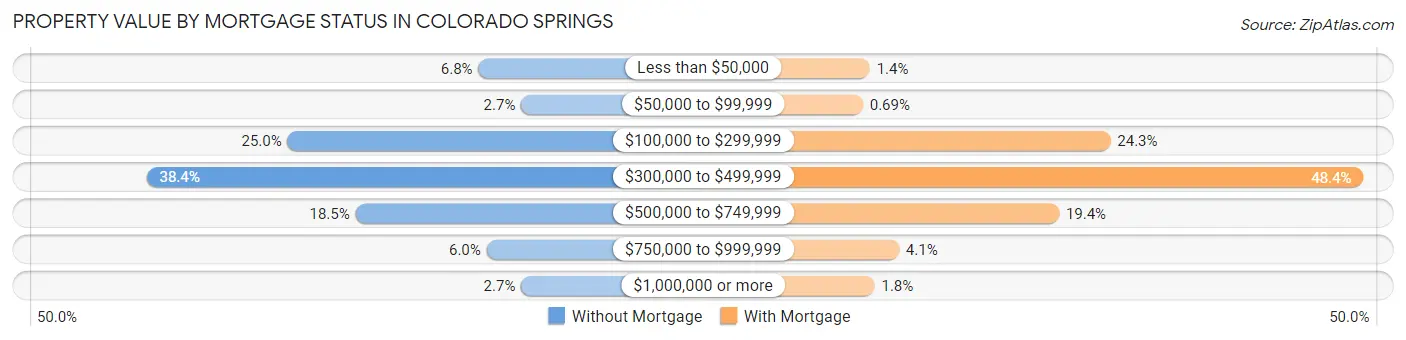
| Property Value | Without Mortgage | With Mortgage |
| Less than $50,000 | 2,284 (6.8%) | 1,139 (1.3%) |
| $50,000 to $99,999 | 910 (2.7%) | 585 (0.7%) |
| $100,000 to $299,999 | 8,414 (25.0%) | 20,453 (24.3%) |
| $300,000 to $499,999 | 12,937 (38.4%) | 40,754 (48.4%) |
| $500,000 to $749,999 | 6,229 (18.5%) | 16,325 (19.4%) |
| $750,000 to $999,999 | 2,024 (6.0%) | 3,481 (4.1%) |
| $1,000,000 or more | 911 (2.7%) | 1,524 (1.8%) |
| Total | 33,709 (100.0%) | 84,261 (100.0%) |
Household Income by Mortgage Status in Colorado Springs
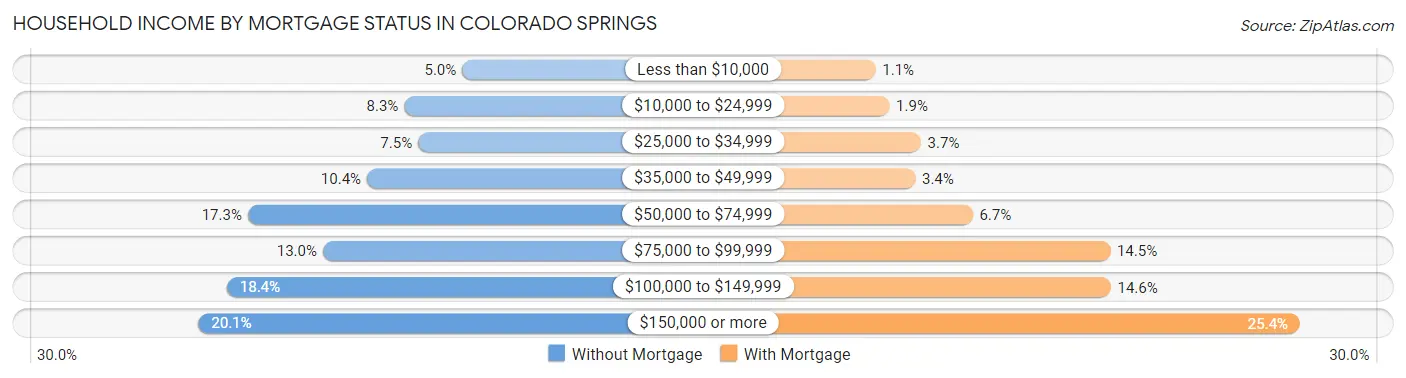
| Household Income | Without Mortgage | With Mortgage |
| Less than $10,000 | 1,685 (5.0%) | 949 (1.1%) |
| $10,000 to $24,999 | 2,800 (8.3%) | 1,616 (1.9%) |
| $25,000 to $34,999 | 2,536 (7.5%) | 3,131 (3.7%) |
| $35,000 to $49,999 | 3,520 (10.4%) | 2,869 (3.4%) |
| $50,000 to $74,999 | 5,816 (17.2%) | 5,632 (6.7%) |
| $75,000 to $99,999 | 4,370 (13.0%) | 12,254 (14.5%) |
| $100,000 to $149,999 | 6,217 (18.4%) | 12,274 (14.6%) |
| $150,000 or more | 6,765 (20.1%) | 21,391 (25.4%) |
| Total | 33,709 (100.0%) | 84,261 (100.0%) |
Property Value to Household Income Ratio in Colorado Springs
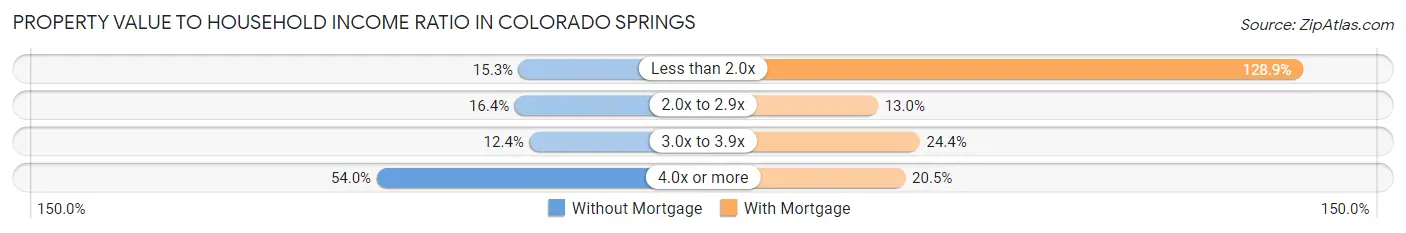
| Value-to-Income Ratio | Without Mortgage | With Mortgage |
| Less than 2.0x | 5,170 (15.3%) | 108,628 (128.9%) |
| 2.0x to 2.9x | 5,531 (16.4%) | 10,982 (13.0%) |
| 3.0x to 3.9x | 4,183 (12.4%) | 20,566 (24.4%) |
| 4.0x or more | 18,210 (54.0%) | 17,276 (20.5%) |
| Total | 33,709 (100.0%) | 84,261 (100.0%) |
Real Estate Taxes by Mortgage Status in Colorado Springs
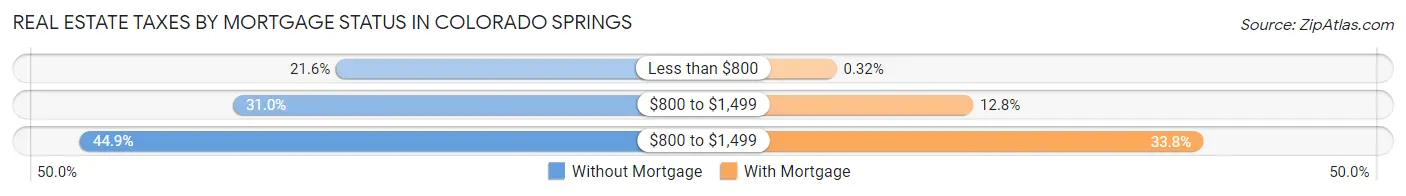
| Property Taxes | Without Mortgage | With Mortgage |
| Less than $800 | 7,263 (21.5%) | 269 (0.3%) |
| $800 to $1,499 | 10,440 (31.0%) | 10,775 (12.8%) |
| $800 to $1,499 | 15,144 (44.9%) | 28,460 (33.8%) |
| Total | 33,709 (100.0%) | 84,261 (100.0%) |
Health & Disability in Colorado Springs
Health Insurance Coverage by Age in Colorado Springs
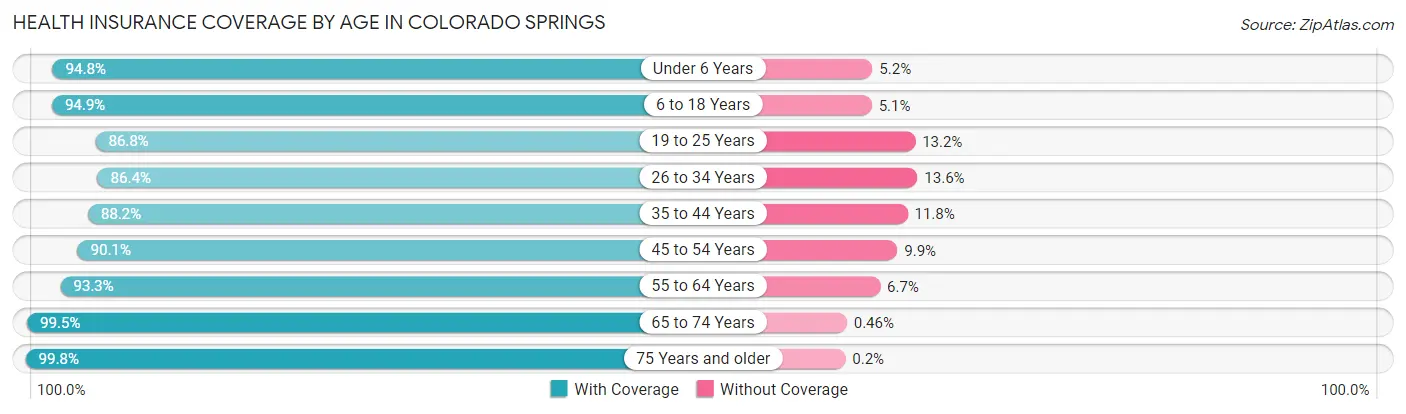
| Age Bracket | With Coverage | Without Coverage |
| Under 6 Years | 32,312 (94.8%) | 1,788 (5.2%) |
| 6 to 18 Years | 74,075 (94.9%) | 3,985 (5.1%) |
| 19 to 25 Years | 42,504 (86.8%) | 6,473 (13.2%) |
| 26 to 34 Years | 59,366 (86.4%) | 9,370 (13.6%) |
| 35 to 44 Years | 53,020 (88.2%) | 7,096 (11.8%) |
| 45 to 54 Years | 48,320 (90.1%) | 5,304 (9.9%) |
| 55 to 64 Years | 49,832 (93.3%) | 3,563 (6.7%) |
| 65 to 74 Years | 40,013 (99.5%) | 185 (0.5%) |
| 75 Years and older | 26,581 (99.8%) | 54 (0.2%) |
| Total | 426,023 (91.8%) | 37,818 (8.2%) |
Health Insurance Coverage by Citizenship Status in Colorado Springs
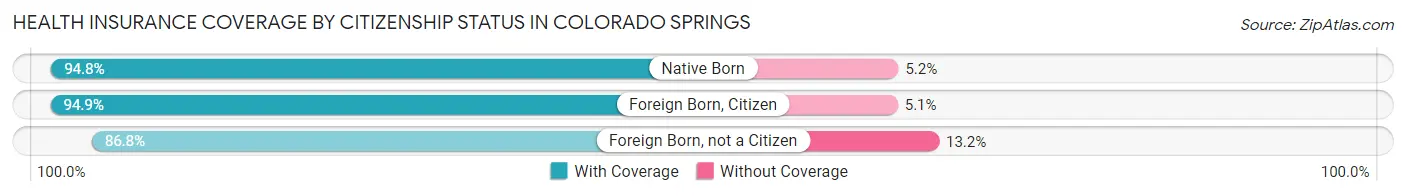
| Citizenship Status | With Coverage | Without Coverage |
| Native Born | 32,312 (94.8%) | 1,788 (5.2%) |
| Foreign Born, Citizen | 74,075 (94.9%) | 3,985 (5.1%) |
| Foreign Born, not a Citizen | 42,504 (86.8%) | 6,473 (13.2%) |
Health Insurance Coverage by Household Income in Colorado Springs
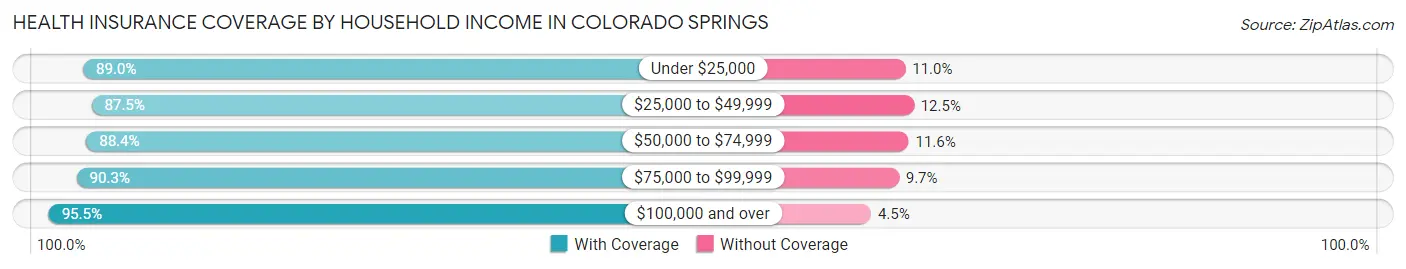
| Household Income | With Coverage | Without Coverage |
| Under $25,000 | 36,728 (89.0%) | 4,521 (11.0%) |
| $25,000 to $49,999 | 56,743 (87.5%) | 8,138 (12.5%) |
| $50,000 to $74,999 | 65,006 (88.4%) | 8,509 (11.6%) |
| $75,000 to $99,999 | 61,000 (90.3%) | 6,586 (9.7%) |
| $100,000 and over | 201,820 (95.5%) | 9,581 (4.5%) |
Public vs Private Health Insurance Coverage by Age in Colorado Springs
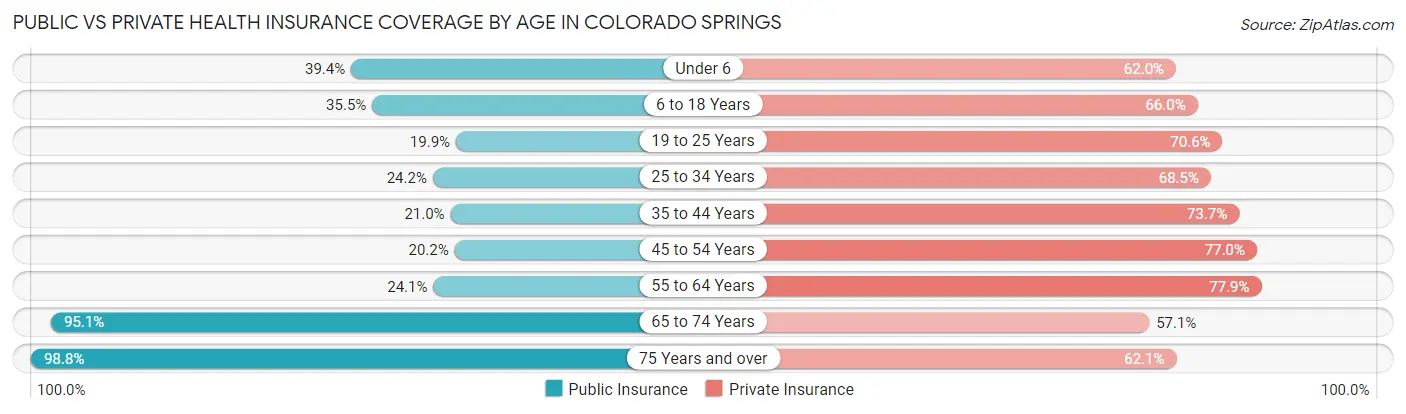
| Age Bracket | Public Insurance | Private Insurance |
| Under 6 | 13,439 (39.4%) | 21,145 (62.0%) |
| 6 to 18 Years | 27,705 (35.5%) | 51,539 (66.0%) |
| 19 to 25 Years | 9,766 (19.9%) | 34,595 (70.6%) |
| 25 to 34 Years | 16,662 (24.2%) | 47,069 (68.5%) |
| 35 to 44 Years | 12,603 (21.0%) | 44,317 (73.7%) |
| 45 to 54 Years | 10,827 (20.2%) | 41,310 (77.0%) |
| 55 to 64 Years | 12,891 (24.1%) | 41,577 (77.9%) |
| 65 to 74 Years | 38,228 (95.1%) | 22,936 (57.1%) |
| 75 Years and over | 26,319 (98.8%) | 16,539 (62.1%) |
| Total | 168,440 (36.3%) | 321,027 (69.2%) |
Disability Status by Sex by Age in Colorado Springs
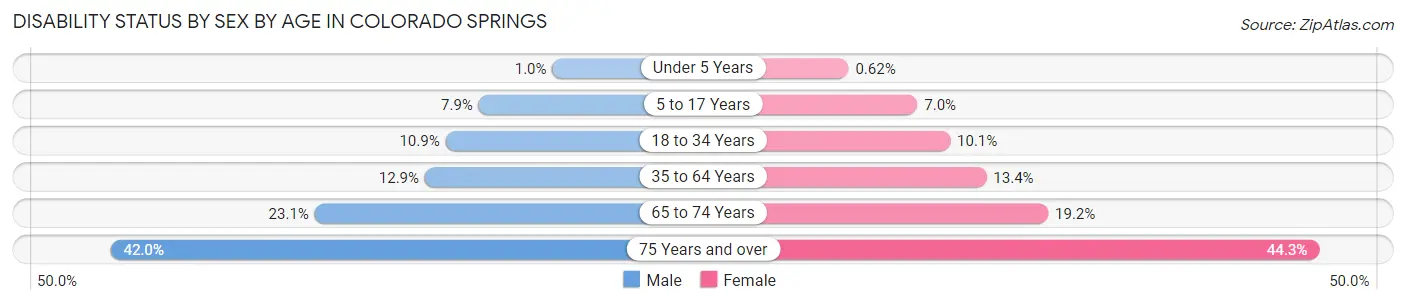
| Age Bracket | Male | Female |
| Under 5 Years | 145 (1.0%) | 90 (0.6%) |
| 5 to 17 Years | 3,126 (7.9%) | 2,629 (7.0%) |
| 18 to 34 Years | 6,851 (10.9%) | 6,163 (10.1%) |
| 35 to 64 Years | 10,578 (12.9%) | 11,377 (13.4%) |
| 65 to 74 Years | 4,218 (23.1%) | 4,199 (19.2%) |
| 75 Years and over | 4,631 (42.0%) | 6,917 (44.3%) |
Disability Class by Sex by Age in Colorado Springs
Disability Class: Hearing Difficulty
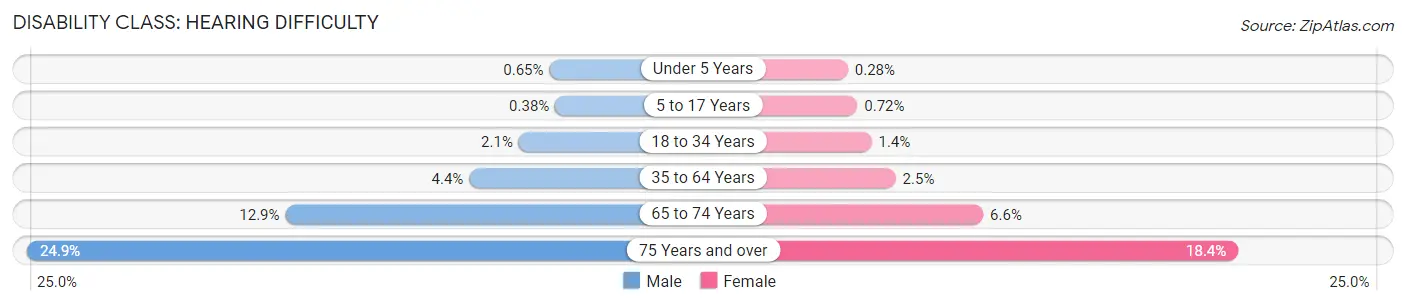
| Age Bracket | Male | Female |
| Under 5 Years | 92 (0.6%) | 40 (0.3%) |
| 5 to 17 Years | 151 (0.4%) | 271 (0.7%) |
| 18 to 34 Years | 1,295 (2.1%) | 844 (1.4%) |
| 35 to 64 Years | 3,596 (4.4%) | 2,122 (2.5%) |
| 65 to 74 Years | 2,358 (12.9%) | 1,438 (6.6%) |
| 75 Years and over | 2,743 (24.9%) | 2,872 (18.4%) |
Disability Class: Vision Difficulty
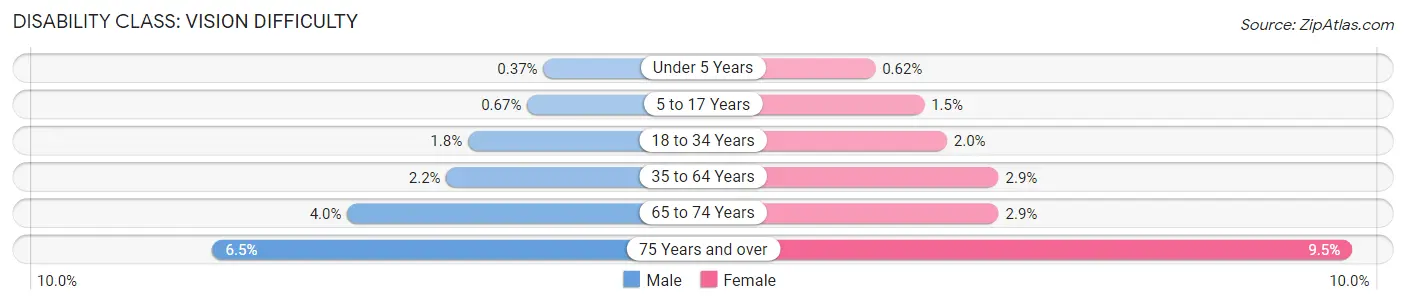
| Age Bracket | Male | Female |
| Under 5 Years | 53 (0.4%) | 90 (0.6%) |
| 5 to 17 Years | 265 (0.7%) | 575 (1.5%) |
| 18 to 34 Years | 1,111 (1.8%) | 1,196 (1.9%) |
| 35 to 64 Years | 1,786 (2.2%) | 2,468 (2.9%) |
| 65 to 74 Years | 733 (4.0%) | 639 (2.9%) |
| 75 Years and over | 717 (6.5%) | 1,478 (9.5%) |
Disability Class: Cognitive Difficulty
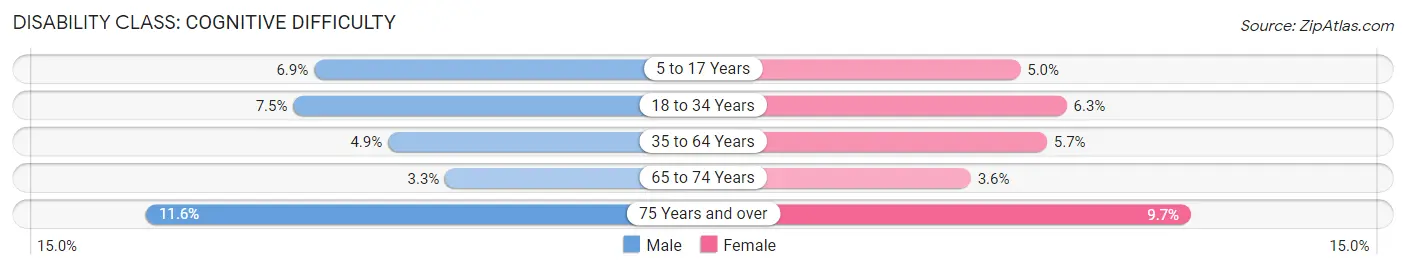
| Age Bracket | Male | Female |
| 5 to 17 Years | 2,758 (6.9%) | 1,862 (5.0%) |
| 18 to 34 Years | 4,711 (7.5%) | 3,840 (6.3%) |
| 35 to 64 Years | 4,022 (4.9%) | 4,839 (5.7%) |
| 65 to 74 Years | 601 (3.3%) | 787 (3.6%) |
| 75 Years and over | 1,281 (11.6%) | 1,517 (9.7%) |
Disability Class: Ambulatory Difficulty
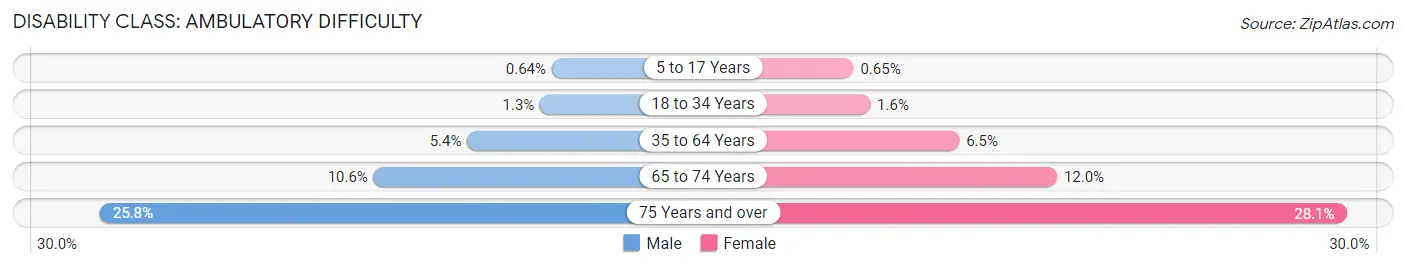
| Age Bracket | Male | Female |
| 5 to 17 Years | 253 (0.6%) | 242 (0.6%) |
| 18 to 34 Years | 808 (1.3%) | 971 (1.6%) |
| 35 to 64 Years | 4,402 (5.3%) | 5,544 (6.5%) |
| 65 to 74 Years | 1,929 (10.6%) | 2,626 (12.0%) |
| 75 Years and over | 2,844 (25.8%) | 4,387 (28.1%) |
Disability Class: Self-Care Difficulty
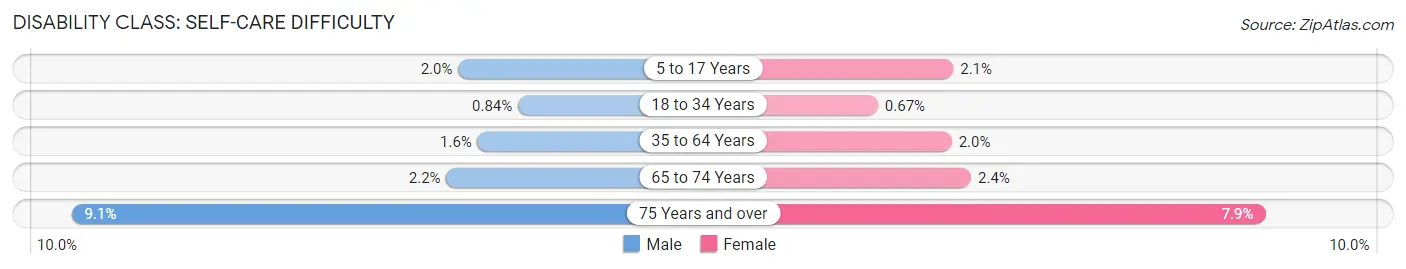
| Age Bracket | Male | Female |
| 5 to 17 Years | 775 (1.9%) | 778 (2.1%) |
| 18 to 34 Years | 528 (0.8%) | 413 (0.7%) |
| 35 to 64 Years | 1,311 (1.6%) | 1,730 (2.0%) |
| 65 to 74 Years | 397 (2.2%) | 527 (2.4%) |
| 75 Years and over | 1,006 (9.1%) | 1,228 (7.9%) |
Technology Access in Colorado Springs
Computing Device Access in Colorado Springs
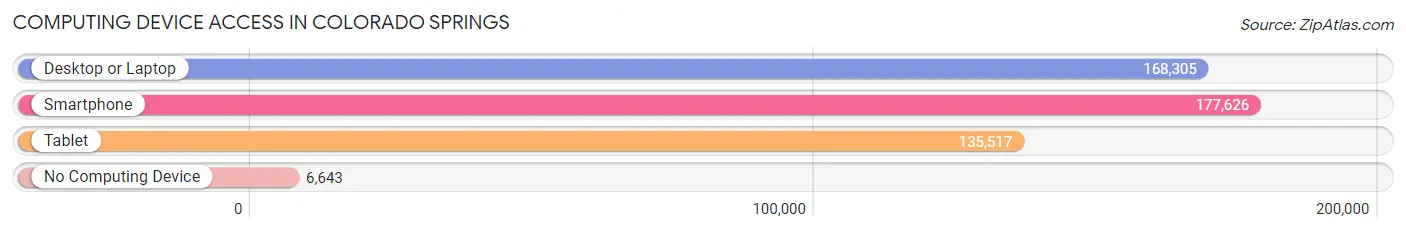
| Device Type | # Households | % Households |
| Desktop or Laptop | 168,305 | 87.1% |
| Smartphone | 177,626 | 92.0% |
| Tablet | 135,517 | 70.2% |
| No Computing Device | 6,643 | 3.4% |
| Total | 193,149 | 100.0% |
Internet Access in Colorado Springs
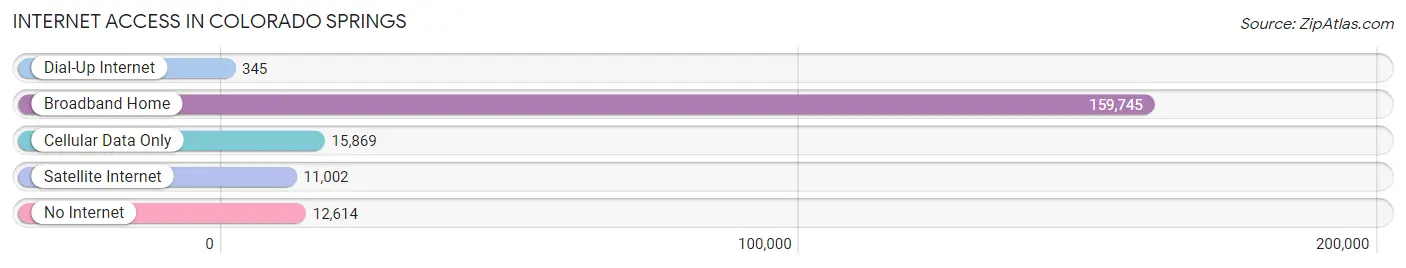
| Internet Type | # Households | % Households |
| Dial-Up Internet | 345 | 0.2% |
| Broadband Home | 159,745 | 82.7% |
| Cellular Data Only | 15,869 | 8.2% |
| Satellite Internet | 11,002 | 5.7% |
| No Internet | 12,614 | 6.5% |
| Total | 193,149 | 100.0% |
Colorado Springs Summary
Colorado Springs is a city located in the state of Colorado in the United States. It is the second most populous city in the state, with a population of 439,886 as of the 2019 census. Colorado Springs is situated at the base of the Rocky Mountains, and is known for its stunning views of the mountains and its many outdoor activities.
History
The area that is now Colorado Springs was first inhabited by the Ute people, who lived in the area for thousands of years before the arrival of European settlers. The first Europeans to settle in the area were the Spanish, who established a fort in the area in 1806. The fort was abandoned in 1820, and the area was later settled by American settlers in the mid-1800s.
The city of Colorado Springs was founded in 1871 by General William Jackson Palmer, a Civil War veteran and railroad magnate. He envisioned the city as a resort destination, and it quickly became a popular destination for tourists. The city was incorporated in 1872, and it quickly grew in size and population.
Geography
Colorado Springs is located in the eastern part of the state of Colorado, at the base of the Rocky Mountains. The city is situated at an elevation of 6,035 feet (1,839 m) above sea level, making it one of the highest cities in the United States. The city is surrounded by mountains, including Pikes Peak, which is the highest summit of the Rocky Mountains.
The city has a total area of 194.7 square miles (503.3 km2), of which 194.3 square miles (503.0 km2) is land and 0.4 square miles (1.3 km2) is water. The city is located in El Paso County, and is bordered by the cities of Manitou Springs, Fountain, and Monument.
Economy
Colorado Springs is a major economic center in the state of Colorado. The city is home to a number of major employers, including the United States Air Force Academy, the United States Olympic Committee, and the United States Space Command. The city is also home to a number of technology companies, including Hewlett Packard, Intel, and Lockheed Martin.
The city's economy is also supported by tourism, as it is a popular destination for outdoor activities such as hiking, biking, and skiing. The city is also home to a number of attractions, including the Garden of the Gods, the Cheyenne Mountain Zoo, and the United States Air Force Academy.
Demographics
As of the 2019 census, the population of Colorado Springs was 439,886. The city has a population density of 2,258 people per square mile (873/km2). The racial makeup of the city is 79.2% White, 8.3% African American, 4.2% Asian, 0.7% Native American, and 6.6% from other races.
The median household income in Colorado Springs is $60,945, and the median family income is $72,945. The city has a poverty rate of 11.3%, and the unemployment rate is 3.7%. The city has a large military presence, with over 20,000 active duty military personnel living in the city.
Conclusion
Colorado Springs is a vibrant city located in the state of Colorado. It is situated at the base of the Rocky Mountains, and is known for its stunning views of the mountains and its many outdoor activities. The city has a long and rich history, and is home to a number of major employers and attractions. The city has a population of 439,886, and has a diverse economy supported by tourism, technology, and the military. Colorado Springs is a great place to live, work, and play.
Common Questions
What is Per Capita Income in Colorado Springs?
Per Capita income in Colorado Springs is $41,849.
What is the Median Family Income in Colorado Springs?
Median Family Income in Colorado Springs is $95,492.
What is the Median Household income in Colorado Springs?
Median Household Income in Colorado Springs is $79,026.
What is Income or Wage Gap in Colorado Springs?
Income or Wage Gap in Colorado Springs is 27.3%.
Women in Colorado Springs earn 72.7 cents for every dollar earned by a man.
What is Family Income Deficit in Colorado Springs?
Family Income Deficit in Colorado Springs is $11,904.
Families that are below poverty line in Colorado Springs earn $11,904 less on average than the poverty threshold level.
What is Inequality or Gini Index in Colorado Springs?
Inequality or Gini Index in Colorado Springs is 0.44.
What is the Total Population of Colorado Springs?
Total Population of Colorado Springs is 479,612.
What is the Total Male Population of Colorado Springs?
Total Male Population of Colorado Springs is 240,854.
What is the Total Female Population of Colorado Springs?
Total Female Population of Colorado Springs is 238,758.
What is the Ratio of Males per 100 Females in Colorado Springs?
There are 100.88 Males per 100 Females in Colorado Springs.
What is the Ratio of Females per 100 Males in Colorado Springs?
There are 99.13 Females per 100 Males in Colorado Springs.
What is the Median Population Age in Colorado Springs?
Median Population Age in Colorado Springs is 35.1 Years.
What is the Average Family Size in Colorado Springs
Average Family Size in Colorado Springs is 3.0 People.
What is the Average Household Size in Colorado Springs
Average Household Size in Colorado Springs is 2.4 People.
How Large is the Labor Force in Colorado Springs?
There are 262,650 People in the Labor Forcein in Colorado Springs.
What is the Percentage of People in the Labor Force in Colorado Springs?
68.3% of People are in the Labor Force in Colorado Springs.
What is the Unemployment Rate in Colorado Springs?
Unemployment Rate in Colorado Springs is 5.6%.