Berwyn, IL Map & Demographics
Berwyn Map
Berwyn Overview
$31,736
PER CAPITA INCOME
$86,322
AVG FAMILY INCOME
$71,300
AVG HOUSEHOLD INCOME
16.0%
WAGE / INCOME GAP [ % ]
84.0¢/ $1
WAGE / INCOME GAP [ $ ]
$5,984
FAMILY INCOME DEFICIT
0.41
INEQUALITY / GINI INDEX
56,556
TOTAL POPULATION
28,971
MALE POPULATION
27,585
FEMALE POPULATION
105.02
MALES / 100 FEMALES
95.22
FEMALES / 100 MALES
36.3
MEDIAN AGE
3.5
AVG FAMILY SIZE
2.8
AVG HOUSEHOLD SIZE
30,316
LABOR FORCE [ PEOPLE ]
68.4%
PERCENT IN LABOR FORCE
5.0%
UNEMPLOYMENT RATE
Berwyn Zip Codes
Berwyn Area Codes
Income in Berwyn
Income Overview in Berwyn
Per Capita Income in Berwyn is $31,736, while median incomes of families and households are $86,322 and $71,300 respectively.
| Characteristic | Number | Measure |
| Per Capita Income | 56,556 | $31,736 |
| Median Family Income | 13,426 | $86,322 |
| Mean Family Income | 13,426 | $100,422 |
| Median Household Income | 19,904 | $71,300 |
| Mean Household Income | 19,904 | $88,515 |
| Income Deficit | 13,426 | $5,984 |
| Wage / Income Gap (%) | 56,556 | 16.03% |
| Wage / Income Gap ($) | 56,556 | 83.97¢ per $1 |
| Gini / Inequality Index | 56,556 | 0.41 |
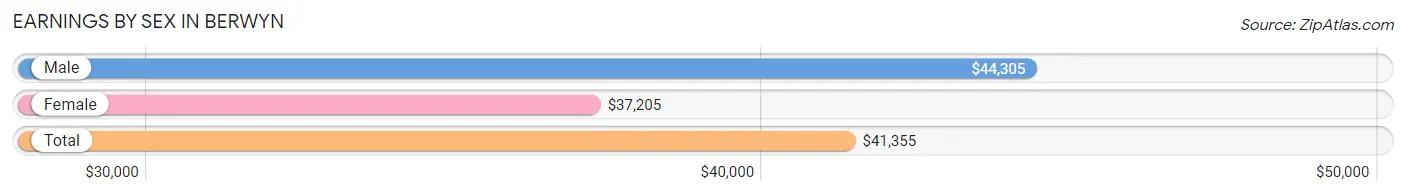
Earnings by Sex in Berwyn
Average Earnings in Berwyn are $41,355, $44,305 for men and $37,205 for women, a difference of 16.0%.
| Sex | Number | Average Earnings |
| Male | 16,625 (54.6%) | $44,305 |
| Female | 13,796 (45.4%) | $37,205 |
| Total | 30,421 (100.0%) | $41,355 |
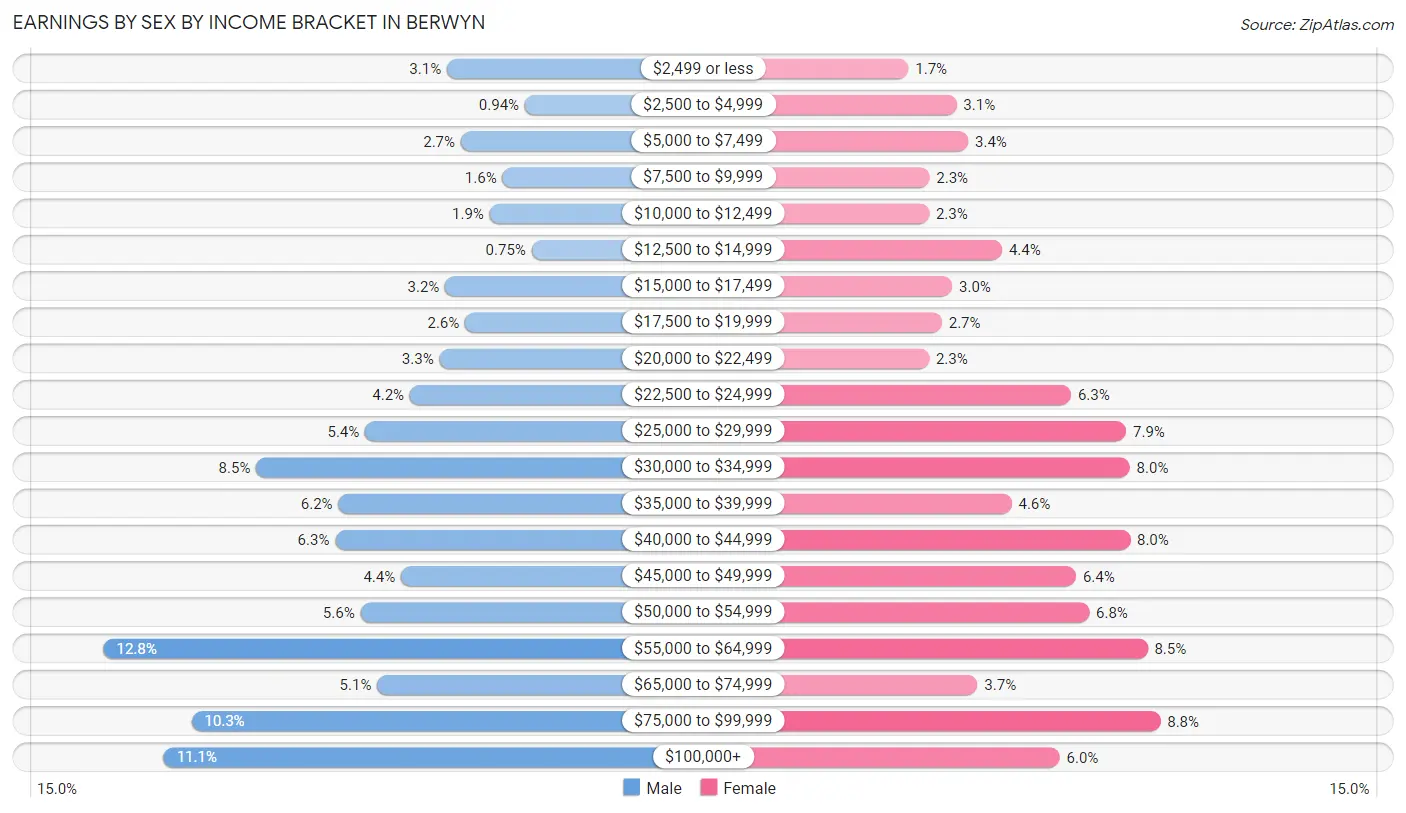
Earnings by Sex by Income Bracket in Berwyn
The most common earnings brackets in Berwyn are $55,000 to $64,999 for men (2,125 | 12.8%) and $75,000 to $99,999 for women (1,216 | 8.8%).
| Income | Male | Female |
| $2,499 or less | 521 (3.1%) | 238 (1.7%) |
| $2,500 to $4,999 | 156 (0.9%) | 425 (3.1%) |
| $5,000 to $7,499 | 456 (2.7%) | 470 (3.4%) |
| $7,500 to $9,999 | 261 (1.6%) | 320 (2.3%) |
| $10,000 to $12,499 | 321 (1.9%) | 319 (2.3%) |
| $12,500 to $14,999 | 125 (0.7%) | 601 (4.4%) |
| $15,000 to $17,499 | 528 (3.2%) | 408 (3.0%) |
| $17,500 to $19,999 | 436 (2.6%) | 369 (2.7%) |
| $20,000 to $22,499 | 556 (3.3%) | 318 (2.3%) |
| $22,500 to $24,999 | 693 (4.2%) | 869 (6.3%) |
| $25,000 to $29,999 | 902 (5.4%) | 1,083 (7.9%) |
| $30,000 to $34,999 | 1,412 (8.5%) | 1,097 (8.0%) |
| $35,000 to $39,999 | 1,028 (6.2%) | 639 (4.6%) |
| $40,000 to $44,999 | 1,042 (6.3%) | 1,098 (8.0%) |
| $45,000 to $49,999 | 735 (4.4%) | 889 (6.4%) |
| $50,000 to $54,999 | 924 (5.6%) | 939 (6.8%) |
| $55,000 to $64,999 | 2,125 (12.8%) | 1,166 (8.5%) |
| $65,000 to $74,999 | 846 (5.1%) | 507 (3.7%) |
| $75,000 to $99,999 | 1,714 (10.3%) | 1,216 (8.8%) |
| $100,000+ | 1,844 (11.1%) | 825 (6.0%) |
| Total | 16,625 (100.0%) | 13,796 (100.0%) |
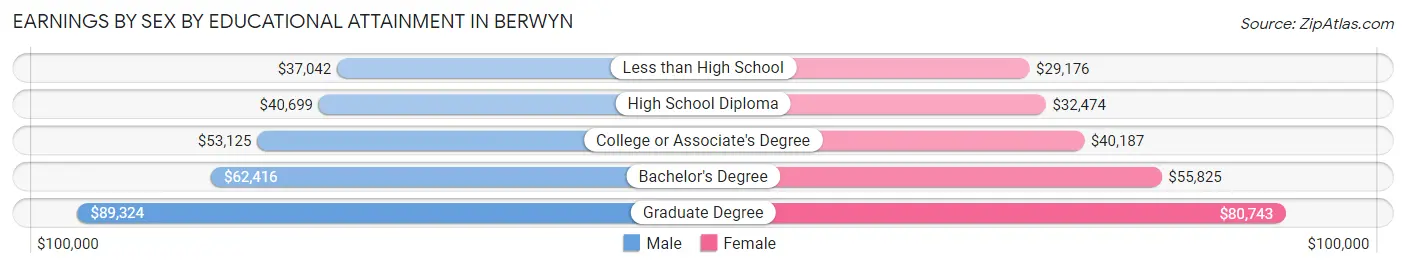
Earnings by Sex by Educational Attainment in Berwyn
Average earnings in Berwyn are $50,572 for men and $41,869 for women, a difference of 17.2%. Men with an educational attainment of graduate degree enjoy the highest average annual earnings of $89,324, while those with less than high school education earn the least with $37,042. Women with an educational attainment of graduate degree earn the most with the average annual earnings of $80,743, while those with less than high school education have the smallest earnings of $29,176.
| Educational Attainment | Male Income | Female Income |
| Less than High School | $37,042 | $29,176 |
| High School Diploma | $40,699 | $32,474 |
| College or Associate's Degree | $53,125 | $40,187 |
| Bachelor's Degree | $62,416 | $55,825 |
| Graduate Degree | $89,324 | $80,743 |
| Total | $50,572 | $41,869 |
Family Income in Berwyn
Family Income Brackets in Berwyn
According to the Berwyn family income data, there are 2,860 families falling into the $100,000 to $149,999 income range, which is the most common income bracket and makes up 21.3% of all families. Conversely, the $10,000 to $14,999 income bracket is the least frequent group with only 54 families (0.4%) belonging to this category.
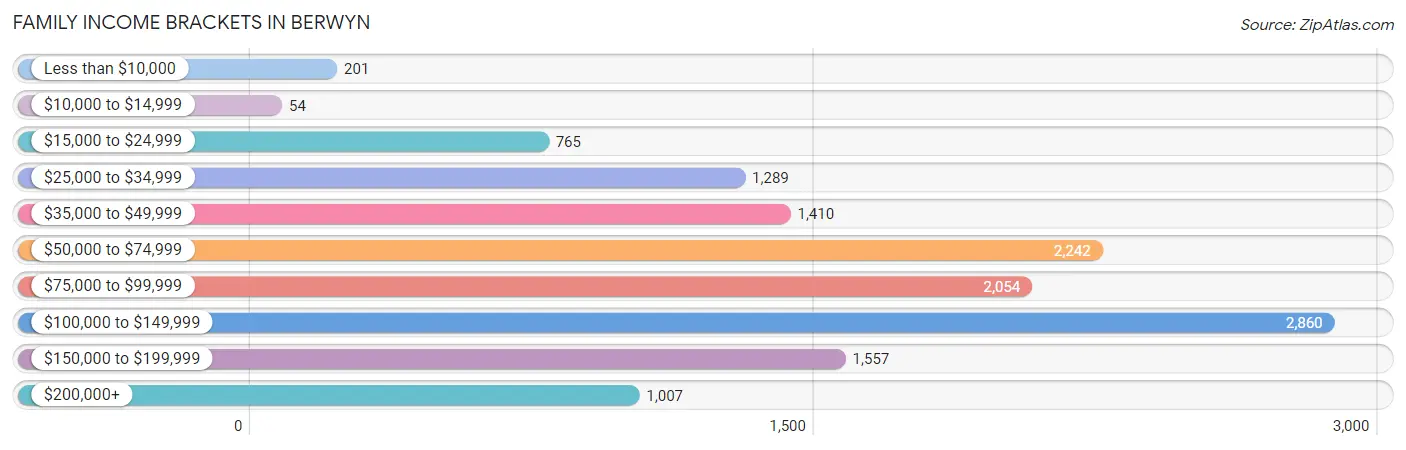
| Income Bracket | # Families | % Families |
| Less than $10,000 | 201 | 1.5% |
| $10,000 to $14,999 | 54 | 0.4% |
| $15,000 to $24,999 | 765 | 5.7% |
| $25,000 to $34,999 | 1,289 | 9.6% |
| $35,000 to $49,999 | 1,410 | 10.5% |
| $50,000 to $74,999 | 2,242 | 16.7% |
| $75,000 to $99,999 | 2,054 | 15.3% |
| $100,000 to $149,999 | 2,860 | 21.3% |
| $150,000 to $199,999 | 1,557 | 11.6% |
| $200,000+ | 1,007 | 7.5% |
Family Income by Famaliy Size in Berwyn
7+ person families (484 | 3.6%) account for the highest median family income in Berwyn with $120,857 per family, while 2-person families (4,887 | 36.4%) have the highest median income of $38,442 per family member.
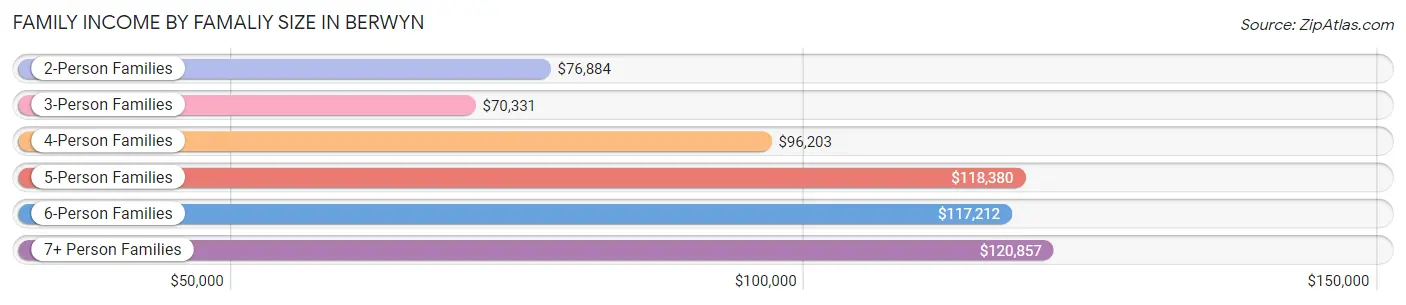
| Income Bracket | # Families | Median Income |
| 2-Person Families | 4,887 (36.4%) | $76,884 |
| 3-Person Families | 3,571 (26.6%) | $70,331 |
| 4-Person Families | 2,480 (18.5%) | $96,203 |
| 5-Person Families | 1,491 (11.1%) | $118,380 |
| 6-Person Families | 513 (3.8%) | $117,212 |
| 7+ Person Families | 484 (3.6%) | $120,857 |
| Total | 13,426 (100.0%) | $86,322 |
Family Income by Number of Earners in Berwyn
The median family income in Berwyn is $86,322, with families comprising 3+ earners (2,601) having the highest median family income of $135,457, while families with no earners (1,193) have the lowest median family income of $35,328, accounting for 19.4% and 8.9% of families, respectively.
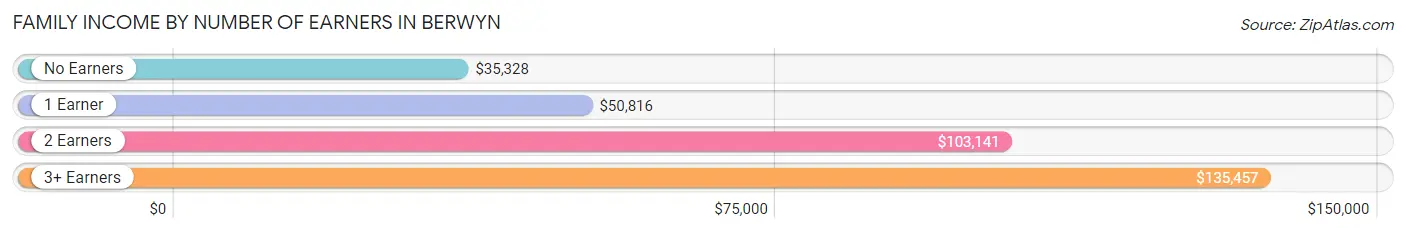
| Number of Earners | # Families | Median Income |
| No Earners | 1,193 (8.9%) | $35,328 |
| 1 Earner | 4,658 (34.7%) | $50,816 |
| 2 Earners | 4,974 (37.0%) | $103,141 |
| 3+ Earners | 2,601 (19.4%) | $135,457 |
| Total | 13,426 (100.0%) | $86,322 |
Household Income in Berwyn
Household Income Brackets in Berwyn
With 3,662 households falling in the category, the $100,000 to $149,999 income range is the most frequent in Berwyn, accounting for 18.4% of all households. In contrast, only 418 households (2.1%) fall into the $10,000 to $14,999 income bracket, making it the least populous group.
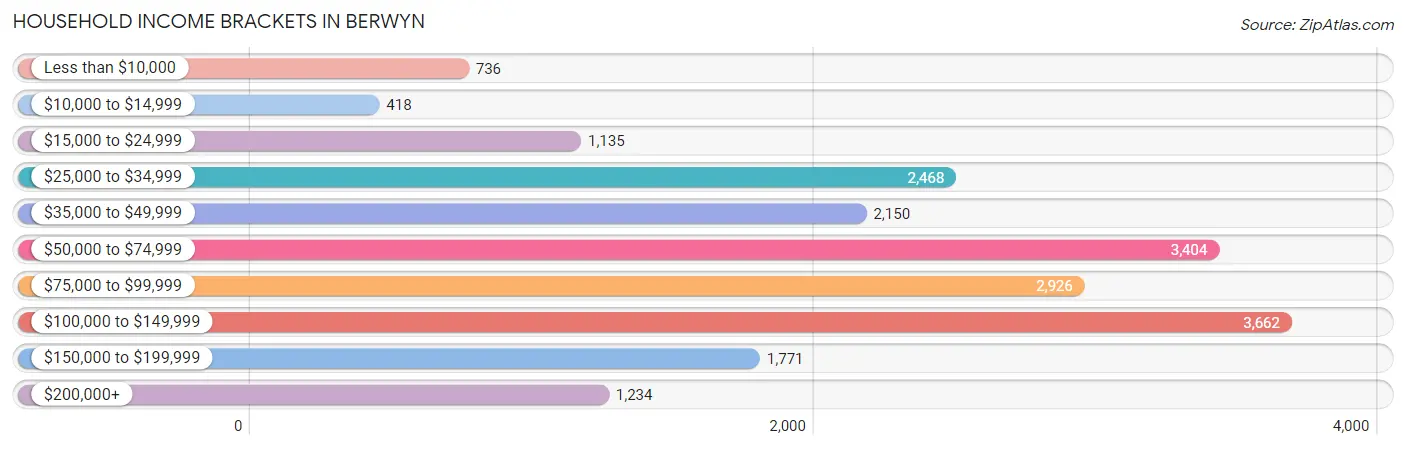
| Income Bracket | # Households | % Households |
| Less than $10,000 | 736 | 3.7% |
| $10,000 to $14,999 | 418 | 2.1% |
| $15,000 to $24,999 | 1,135 | 5.7% |
| $25,000 to $34,999 | 2,468 | 12.4% |
| $35,000 to $49,999 | 2,150 | 10.8% |
| $50,000 to $74,999 | 3,404 | 17.1% |
| $75,000 to $99,999 | 2,926 | 14.7% |
| $100,000 to $149,999 | 3,662 | 18.4% |
| $150,000 to $199,999 | 1,771 | 8.9% |
| $200,000+ | 1,234 | 6.2% |
Household Income by Householder Age in Berwyn
The median household income in Berwyn is $71,300, with the highest median household income of $88,441 found in the 45 to 64 years age bracket for the primary householder. A total of 7,373 households (37.0%) fall into this category. Meanwhile, the 15 to 24 years age bracket for the primary householder has the lowest median household income of $46,806, with 569 households (2.9%) in this group.
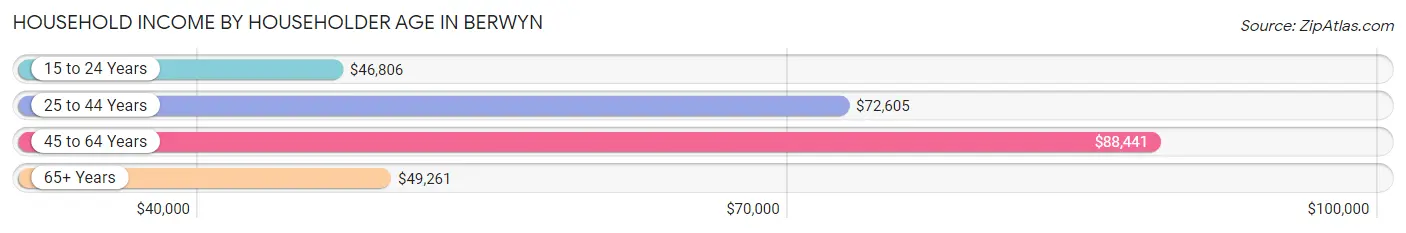
| Income Bracket | # Households | Median Income |
| 15 to 24 Years | 569 (2.9%) | $46,806 |
| 25 to 44 Years | 7,529 (37.8%) | $72,605 |
| 45 to 64 Years | 7,373 (37.0%) | $88,441 |
| 65+ Years | 4,433 (22.3%) | $49,261 |
| Total | 19,904 (100.0%) | $71,300 |
Poverty in Berwyn
Income Below Poverty by Sex and Age in Berwyn
With 9.5% poverty level for males and 12.6% for females among the residents of Berwyn, 6 to 11 year old males and under 5 year old females are the most vulnerable to poverty, with 453 males (17.1%) and 485 females (26.3%) in their respective age groups living below the poverty level.
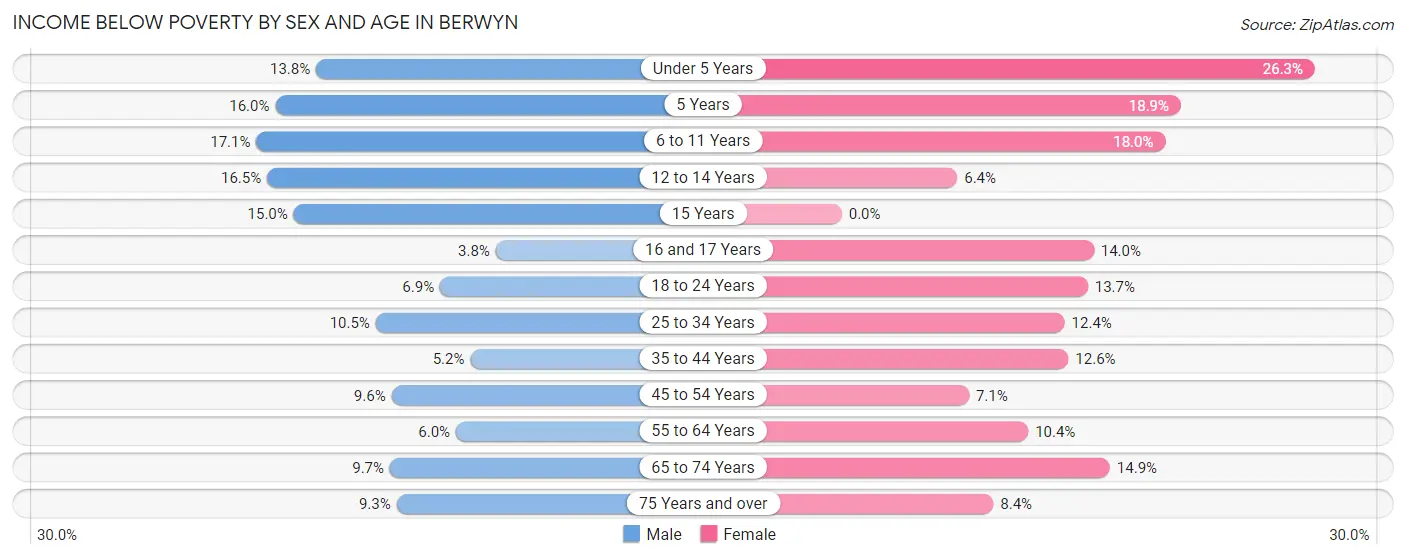
| Age Bracket | Male | Female |
| Under 5 Years | 204 (13.8%) | 485 (26.3%) |
| 5 Years | 34 (16.0%) | 47 (18.9%) |
| 6 to 11 Years | 453 (17.1%) | 351 (18.0%) |
| 12 to 14 Years | 257 (16.5%) | 75 (6.4%) |
| 15 Years | 64 (15.0%) | 0 (0.0%) |
| 16 and 17 Years | 40 (3.8%) | 110 (14.0%) |
| 18 to 24 Years | 197 (6.9%) | 319 (13.7%) |
| 25 to 34 Years | 408 (10.4%) | 466 (12.4%) |
| 35 to 44 Years | 243 (5.2%) | 539 (12.6%) |
| 45 to 54 Years | 324 (9.6%) | 244 (7.1%) |
| 55 to 64 Years | 206 (6.0%) | 334 (10.4%) |
| 65 to 74 Years | 202 (9.7%) | 349 (14.9%) |
| 75 Years and over | 102 (9.3%) | 133 (8.4%) |
| Total | 2,734 (9.5%) | 3,452 (12.6%) |
Income Above Poverty by Sex and Age in Berwyn
According to the poverty statistics in Berwyn, males aged 16 and 17 years and females aged 15 years are the age groups that are most secure financially, with 96.2% of males and 100.0% of females in these age groups living above the poverty line.
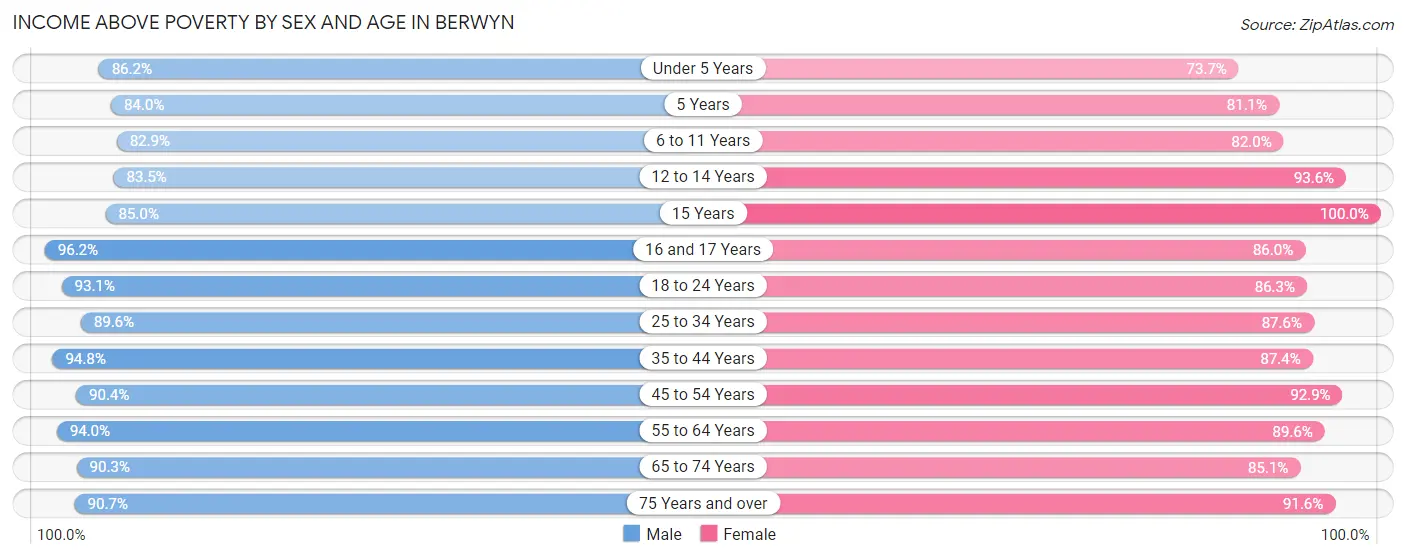
| Age Bracket | Male | Female |
| Under 5 Years | 1,278 (86.2%) | 1,356 (73.7%) |
| 5 Years | 178 (84.0%) | 202 (81.1%) |
| 6 to 11 Years | 2,196 (82.9%) | 1,598 (82.0%) |
| 12 to 14 Years | 1,301 (83.5%) | 1,092 (93.6%) |
| 15 Years | 362 (85.0%) | 452 (100.0%) |
| 16 and 17 Years | 1,021 (96.2%) | 674 (86.0%) |
| 18 to 24 Years | 2,670 (93.1%) | 2,010 (86.3%) |
| 25 to 34 Years | 3,497 (89.5%) | 3,290 (87.6%) |
| 35 to 44 Years | 4,448 (94.8%) | 3,732 (87.4%) |
| 45 to 54 Years | 3,062 (90.4%) | 3,204 (92.9%) |
| 55 to 64 Years | 3,239 (94.0%) | 2,885 (89.6%) |
| 65 to 74 Years | 1,890 (90.3%) | 1,989 (85.1%) |
| 75 Years and over | 996 (90.7%) | 1,443 (91.6%) |
| Total | 26,138 (90.5%) | 23,927 (87.4%) |
Income Below Poverty Among Married-Couple Families in Berwyn
The poverty statistics for married-couple families in Berwyn show that 5.6% or 478 of the total 8,545 families live below the poverty line. Families with 3 or 4 children have the highest poverty rate of 10.8%, comprising of 75 families. On the other hand, families with 5 or more children have the lowest poverty rate of 0.0%, which includes 0 families.
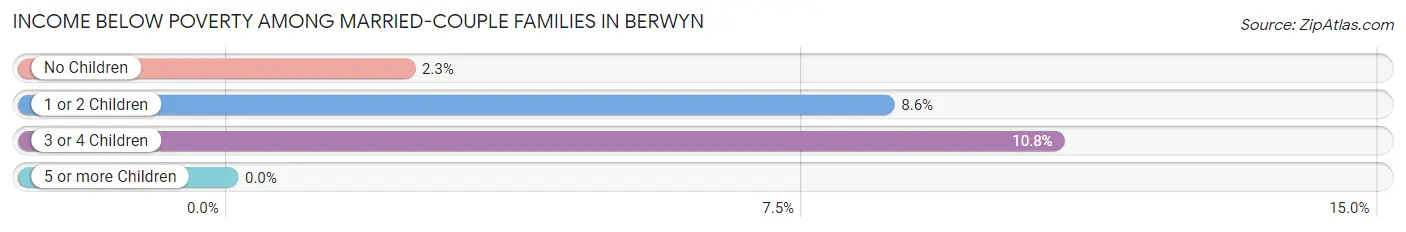
| Children | Above Poverty | Below Poverty |
| No Children | 4,025 (97.7%) | 95 (2.3%) |
| 1 or 2 Children | 3,286 (91.4%) | 308 (8.6%) |
| 3 or 4 Children | 620 (89.2%) | 75 (10.8%) |
| 5 or more Children | 136 (100.0%) | 0 (0.0%) |
| Total | 8,067 (94.4%) | 478 (5.6%) |
Income Below Poverty Among Single-Parent Households in Berwyn
According to the poverty data in Berwyn, 11.9% or 185 single-father households and 13.8% or 458 single-mother households are living below the poverty line. Among single-father households, those with 3 or 4 children have the highest poverty rate, with 55 households (40.4%) experiencing poverty. Likewise, among single-mother households, those with 3 or 4 children have the highest poverty rate, with 37 households (20.9%) falling below the poverty line.
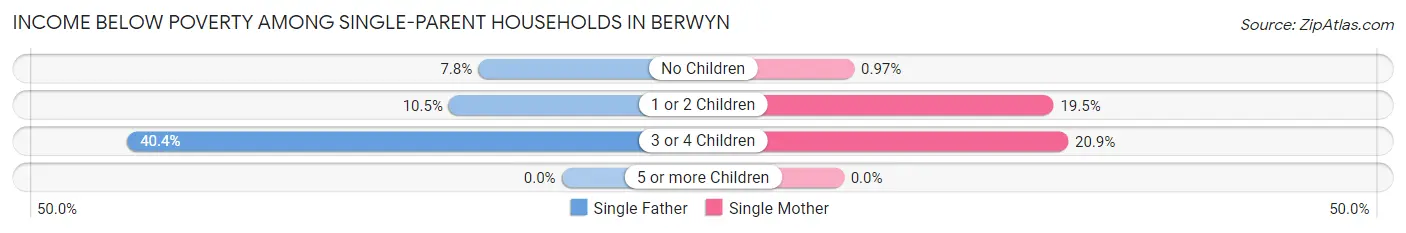
| Children | Single Father | Single Mother |
| No Children | 55 (7.8%) | 10 (1.0%) |
| 1 or 2 Children | 75 (10.5%) | 411 (19.5%) |
| 3 or 4 Children | 55 (40.4%) | 37 (20.9%) |
| 5 or more Children | 0 (0.0%) | 0 (0.0%) |
| Total | 185 (11.9%) | 458 (13.8%) |
Income Below Poverty Among Married-Couple vs Single-Parent Households in Berwyn
The poverty data for Berwyn shows that 478 of the married-couple family households (5.6%) and 643 of the single-parent households (13.2%) are living below the poverty level. Within the married-couple family households, those with 3 or 4 children have the highest poverty rate, with 75 households (10.8%) falling below the poverty line. Among the single-parent households, those with 3 or 4 children have the highest poverty rate, with 92 household (29.4%) living below poverty.
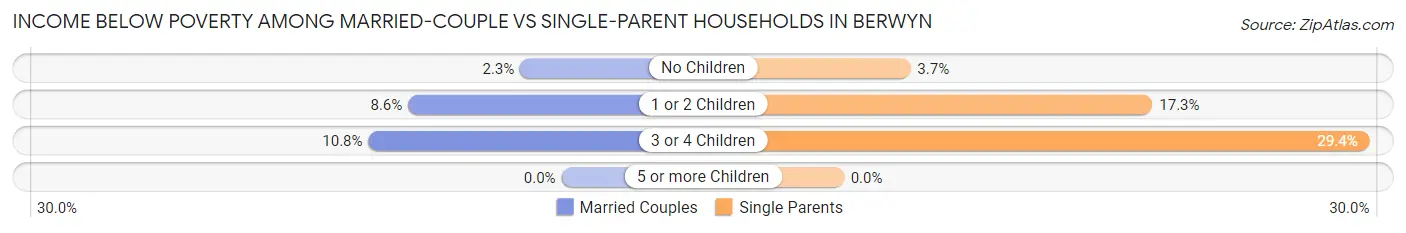
| Children | Married-Couple Families | Single-Parent Households |
| No Children | 95 (2.3%) | 65 (3.7%) |
| 1 or 2 Children | 308 (8.6%) | 486 (17.2%) |
| 3 or 4 Children | 75 (10.8%) | 92 (29.4%) |
| 5 or more Children | 0 (0.0%) | 0 (0.0%) |
| Total | 478 (5.6%) | 643 (13.2%) |
Race in Berwyn
The most populous races in Berwyn are Hispanic or Latino (34,510 | 61.0%), White / Caucasian (20,930 | 37.0%), and Some other Race (20,181 | 35.7%).
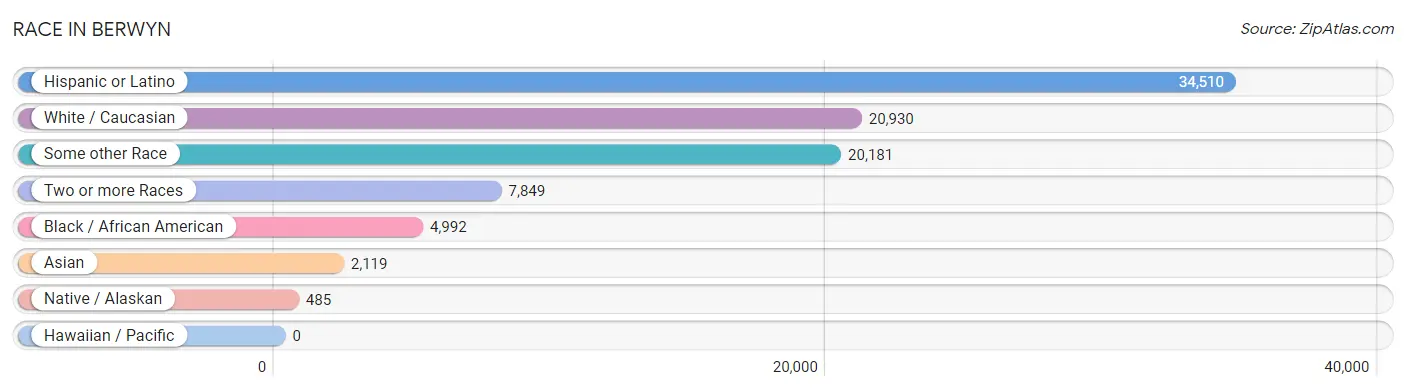
| Race | # Population | % Population |
| Asian | 2,119 | 3.7% |
| Black / African American | 4,992 | 8.8% |
| Hawaiian / Pacific | 0 | 0.0% |
| Hispanic or Latino | 34,510 | 61.0% |
| Native / Alaskan | 485 | 0.9% |
| White / Caucasian | 20,930 | 37.0% |
| Two or more Races | 7,849 | 13.9% |
| Some other Race | 20,181 | 35.7% |
| Total | 56,556 | 100.0% |
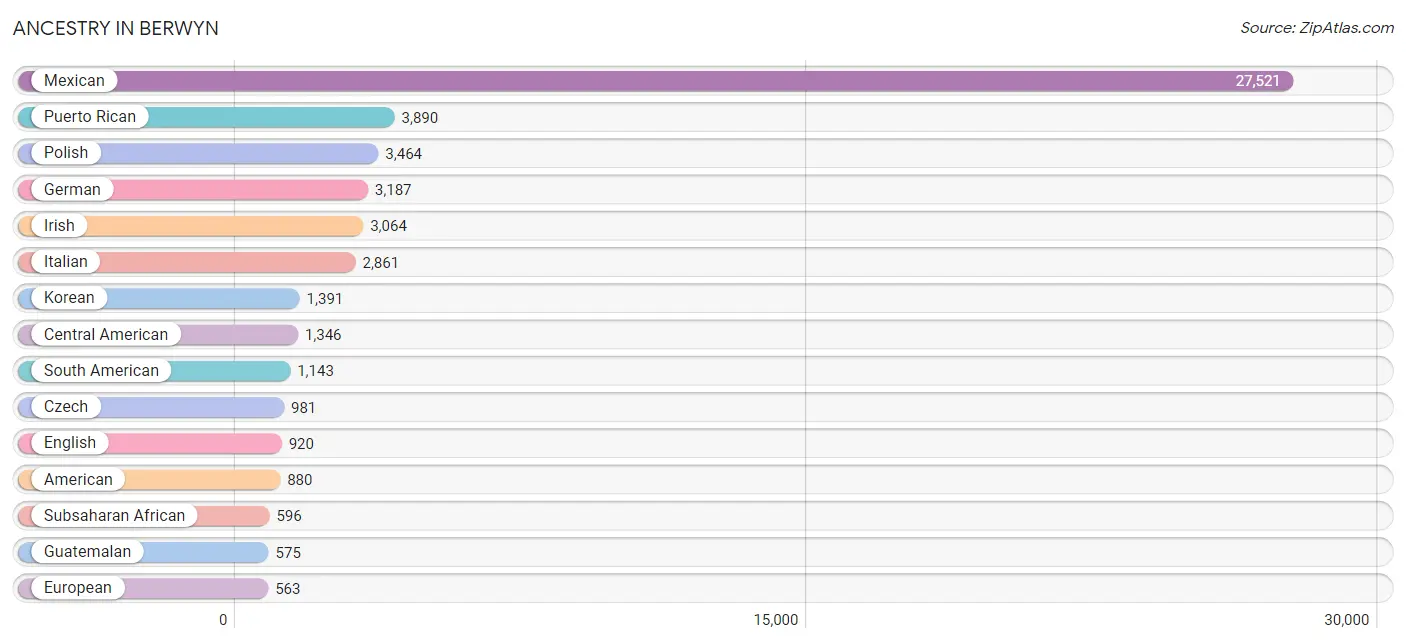
Ancestry in Berwyn
The most populous ancestries reported in Berwyn are Mexican (27,521 | 48.7%), Puerto Rican (3,890 | 6.9%), Polish (3,464 | 6.1%), German (3,187 | 5.6%), and Irish (3,064 | 5.4%), together accounting for 72.7% of all Berwyn residents.
| Ancestry | # Population | % Population |
| African | 85 | 0.2% |
| American | 880 | 1.6% |
| Arab | 125 | 0.2% |
| Argentinean | 1 | 0.0% |
| Armenian | 11 | 0.0% |
| Austrian | 130 | 0.2% |
| Bahamian | 10 | 0.0% |
| Belgian | 66 | 0.1% |
| Bhutanese | 101 | 0.2% |
| Blackfeet | 22 | 0.0% |
| Bolivian | 148 | 0.3% |
| Brazilian | 39 | 0.1% |
| British | 41 | 0.1% |
| British West Indian | 9 | 0.0% |
| Burmese | 85 | 0.2% |
| Cajun | 8 | 0.0% |
| Central American | 1,346 | 2.4% |
| Central American Indian | 107 | 0.2% |
| Chilean | 26 | 0.1% |
| Chippewa | 12 | 0.0% |
| Colombian | 306 | 0.5% |
| Croatian | 76 | 0.1% |
| Cuban | 168 | 0.3% |
| Czech | 981 | 1.7% |
| Czechoslovakian | 216 | 0.4% |
| Danish | 21 | 0.0% |
| Dominican | 133 | 0.2% |
| Dutch | 181 | 0.3% |
| Eastern European | 129 | 0.2% |
| Ecuadorian | 337 | 0.6% |
| English | 920 | 1.6% |
| European | 563 | 1.0% |
| Finnish | 34 | 0.1% |
| French | 372 | 0.7% |
| French Canadian | 30 | 0.1% |
| German | 3,187 | 5.6% |
| Ghanaian | 13 | 0.0% |
| Greek | 329 | 0.6% |
| Guatemalan | 575 | 1.0% |
| Haitian | 10 | 0.0% |
| Honduran | 182 | 0.3% |
| Hungarian | 75 | 0.1% |
| Indian (Asian) | 217 | 0.4% |
| Irish | 3,064 | 5.4% |
| Italian | 2,861 | 5.1% |
| Korean | 1,391 | 2.5% |
| Laotian | 8 | 0.0% |
| Latvian | 9 | 0.0% |
| Lebanese | 18 | 0.0% |
| Lithuanian | 520 | 0.9% |
| Luxembourger | 18 | 0.0% |
| Macedonian | 120 | 0.2% |
| Mexican | 27,521 | 48.7% |
| Mexican American Indian | 440 | 0.8% |
| Moroccan | 10 | 0.0% |
| Nicaraguan | 442 | 0.8% |
| Nigerian | 43 | 0.1% |
| Northern European | 43 | 0.1% |
| Norwegian | 386 | 0.7% |
| Pakistani | 35 | 0.1% |
| Palestinian | 49 | 0.1% |
| Panamanian | 77 | 0.1% |
| Peruvian | 239 | 0.4% |
| Polish | 3,464 | 6.1% |
| Portuguese | 7 | 0.0% |
| Puerto Rican | 3,890 | 6.9% |
| Romanian | 278 | 0.5% |
| Russian | 241 | 0.4% |
| Salvadoran | 70 | 0.1% |
| Scandinavian | 115 | 0.2% |
| Scotch-Irish | 167 | 0.3% |
| Scottish | 170 | 0.3% |
| Senegalese | 413 | 0.7% |
| Slavic | 12 | 0.0% |
| Slovak | 28 | 0.1% |
| Slovene | 33 | 0.1% |
| South American | 1,143 | 2.0% |
| Spaniard | 43 | 0.1% |
| Spanish | 157 | 0.3% |
| Sri Lankan | 182 | 0.3% |
| Subsaharan African | 596 | 1.1% |
| Swedish | 449 | 0.8% |
| Swiss | 10 | 0.0% |
| Thai | 65 | 0.1% |
| Ugandan | 1 | 0.0% |
| Ukrainian | 127 | 0.2% |
| Uruguayan | 69 | 0.1% |
| Venezuelan | 17 | 0.0% |
| Welsh | 10 | 0.0% |
| West Indian | 64 | 0.1% | View All 90 Rows |
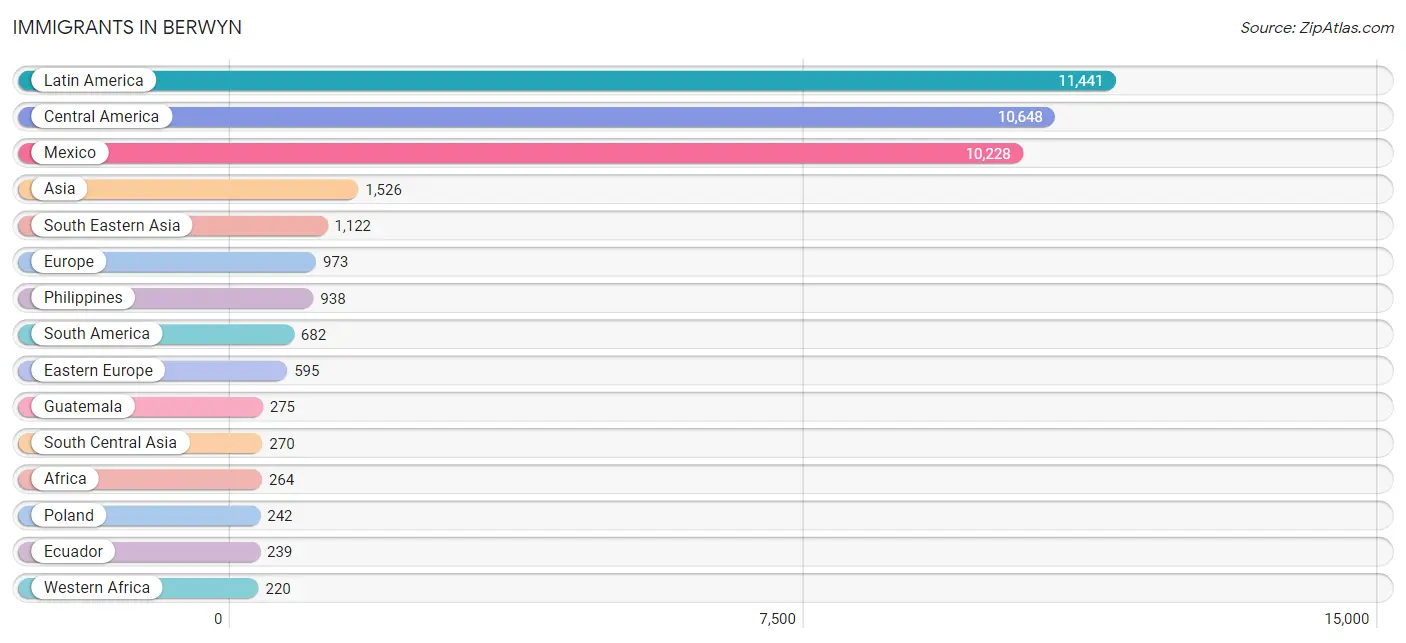
Immigrants in Berwyn
The most numerous immigrant groups reported in Berwyn came from Latin America (11,441 | 20.2%), Central America (10,648 | 18.8%), Mexico (10,228 | 18.1%), Asia (1,526 | 2.7%), and South Eastern Asia (1,122 | 2.0%), together accounting for 61.8% of all Berwyn residents.
| Immigration Origin | # Population | % Population |
| Africa | 264 | 0.5% |
| Asia | 1,526 | 2.7% |
| Australia | 1 | 0.0% |
| Bahamas | 10 | 0.0% |
| Bolivia | 95 | 0.2% |
| Bosnia and Herzegovina | 24 | 0.0% |
| Brazil | 7 | 0.0% |
| Cameroon | 22 | 0.0% |
| Canada | 11 | 0.0% |
| Caribbean | 111 | 0.2% |
| Central America | 10,648 | 18.8% |
| Chile | 10 | 0.0% |
| China | 66 | 0.1% |
| Colombia | 167 | 0.3% |
| Croatia | 44 | 0.1% |
| Cuba | 38 | 0.1% |
| Dominican Republic | 63 | 0.1% |
| Eastern Africa | 1 | 0.0% |
| Eastern Asia | 116 | 0.2% |
| Eastern Europe | 595 | 1.1% |
| Ecuador | 239 | 0.4% |
| England | 32 | 0.1% |
| Europe | 973 | 1.7% |
| France | 10 | 0.0% |
| Germany | 84 | 0.2% |
| Greece | 36 | 0.1% |
| Guatemala | 275 | 0.5% |
| Honduras | 68 | 0.1% |
| India | 73 | 0.1% |
| Indonesia | 8 | 0.0% |
| Italy | 138 | 0.2% |
| Jordan | 18 | 0.0% |
| Korea | 50 | 0.1% |
| Latin America | 11,441 | 20.2% |
| Latvia | 9 | 0.0% |
| Mexico | 10,228 | 18.1% |
| Middle Africa | 22 | 0.0% |
| Morocco | 21 | 0.0% |
| Nigeria | 22 | 0.0% |
| North Macedonia | 78 | 0.1% |
| Northern Africa | 21 | 0.0% |
| Northern Europe | 51 | 0.1% |
| Oceania | 1 | 0.0% |
| Pakistan | 187 | 0.3% |
| Panama | 77 | 0.1% |
| Peru | 71 | 0.1% |
| Philippines | 938 | 1.7% |
| Poland | 242 | 0.4% |
| Romania | 114 | 0.2% |
| Senegal | 179 | 0.3% |
| South America | 682 | 1.2% |
| South Central Asia | 270 | 0.5% |
| South Eastern Asia | 1,122 | 2.0% |
| Southern Europe | 205 | 0.4% |
| Spain | 31 | 0.1% |
| Sri Lanka | 10 | 0.0% |
| Thailand | 35 | 0.1% |
| Uganda | 1 | 0.0% |
| Ukraine | 75 | 0.1% |
| Uruguay | 69 | 0.1% |
| Venezuela | 24 | 0.0% |
| Vietnam | 141 | 0.3% |
| Western Africa | 220 | 0.4% |
| Western Asia | 18 | 0.0% |
| Western Europe | 94 | 0.2% | View All 65 Rows |
Sex and Age in Berwyn
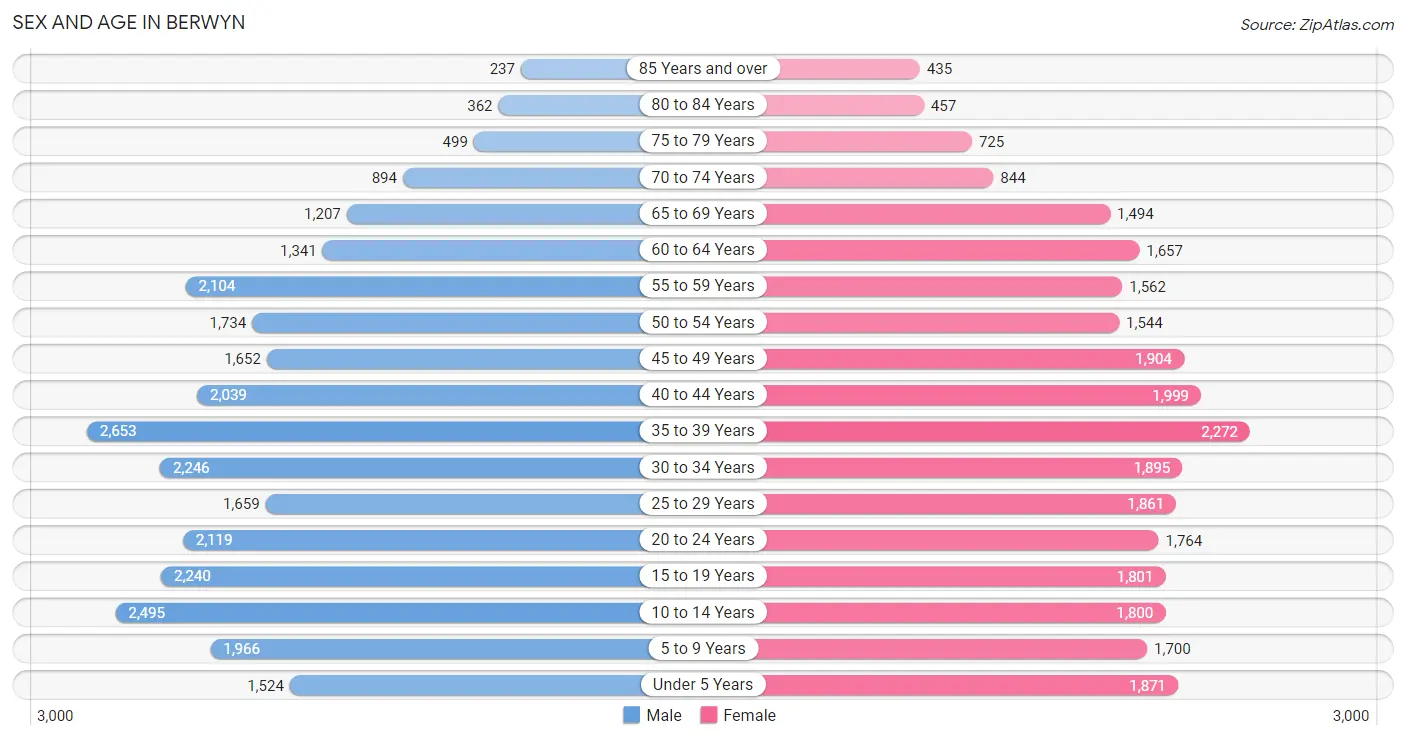
Sex and Age in Berwyn
The most populous age groups in Berwyn are 35 to 39 Years (2,653 | 9.2%) for men and 35 to 39 Years (2,272 | 8.2%) for women.
| Age Bracket | Male | Female |
| Under 5 Years | 1,524 (5.3%) | 1,871 (6.8%) |
| 5 to 9 Years | 1,966 (6.8%) | 1,700 (6.2%) |
| 10 to 14 Years | 2,495 (8.6%) | 1,800 (6.5%) |
| 15 to 19 Years | 2,240 (7.7%) | 1,801 (6.5%) |
| 20 to 24 Years | 2,119 (7.3%) | 1,764 (6.4%) |
| 25 to 29 Years | 1,659 (5.7%) | 1,861 (6.8%) |
| 30 to 34 Years | 2,246 (7.7%) | 1,895 (6.9%) |
| 35 to 39 Years | 2,653 (9.2%) | 2,272 (8.2%) |
| 40 to 44 Years | 2,039 (7.0%) | 1,999 (7.2%) |
| 45 to 49 Years | 1,652 (5.7%) | 1,904 (6.9%) |
| 50 to 54 Years | 1,734 (6.0%) | 1,544 (5.6%) |
| 55 to 59 Years | 2,104 (7.3%) | 1,562 (5.7%) |
| 60 to 64 Years | 1,341 (4.6%) | 1,657 (6.0%) |
| 65 to 69 Years | 1,207 (4.2%) | 1,494 (5.4%) |
| 70 to 74 Years | 894 (3.1%) | 844 (3.1%) |
| 75 to 79 Years | 499 (1.7%) | 725 (2.6%) |
| 80 to 84 Years | 362 (1.3%) | 457 (1.7%) |
| 85 Years and over | 237 (0.8%) | 435 (1.6%) |
| Total | 28,971 (100.0%) | 27,585 (100.0%) |
Families and Households in Berwyn
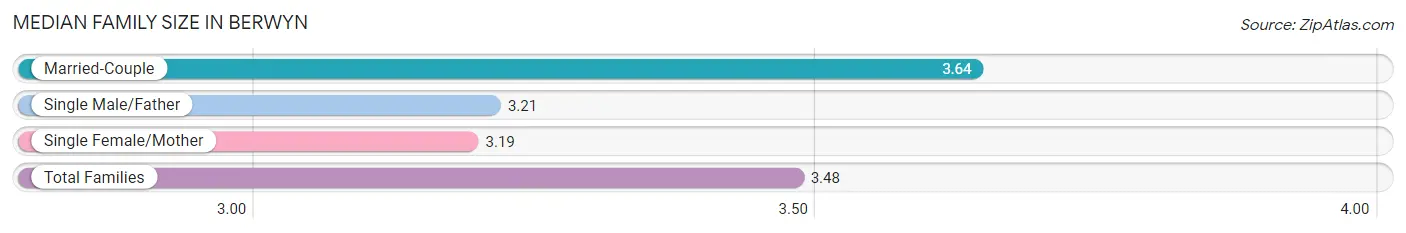
Median Family Size in Berwyn
The median family size in Berwyn is 3.48 persons per family, with married-couple families (8,545 | 63.6%) accounting for the largest median family size of 3.64 persons per family. On the other hand, single female/mother families (3,323 | 24.7%) represent the smallest median family size with 3.19 persons per family.
| Family Type | # Families | Family Size |
| Married-Couple | 8,545 (63.6%) | 3.64 |
| Single Male/Father | 1,558 (11.6%) | 3.21 |
| Single Female/Mother | 3,323 (24.7%) | 3.19 |
| Total Families | 13,426 (100.0%) | 3.48 |
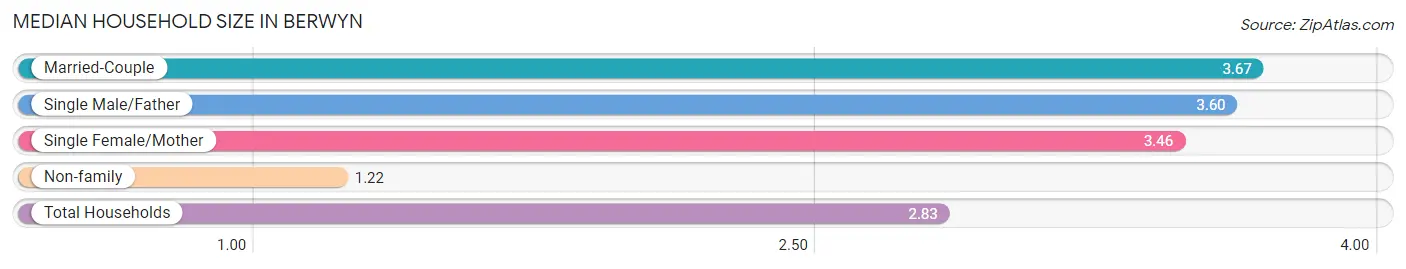
Median Household Size in Berwyn
The median household size in Berwyn is 2.83 persons per household, with married-couple households (8,545 | 42.9%) accounting for the largest median household size of 3.67 persons per household. non-family households (6,478 | 32.6%) represent the smallest median household size with 1.22 persons per household.
| Household Type | # Households | Household Size |
| Married-Couple | 8,545 (42.9%) | 3.67 |
| Single Male/Father | 1,558 (7.8%) | 3.60 |
| Single Female/Mother | 3,323 (16.7%) | 3.46 |
| Non-family | 6,478 (32.6%) | 1.22 |
| Total Households | 19,904 (100.0%) | 2.83 |
Household Size by Marriage Status in Berwyn
Out of a total of 19,904 households in Berwyn, 13,426 (67.4%) are family households, while 6,478 (32.6%) are nonfamily households. The most numerous type of family households are 2-person households, comprising 4,357, and the most common type of nonfamily households are 1-person households, comprising 5,427.
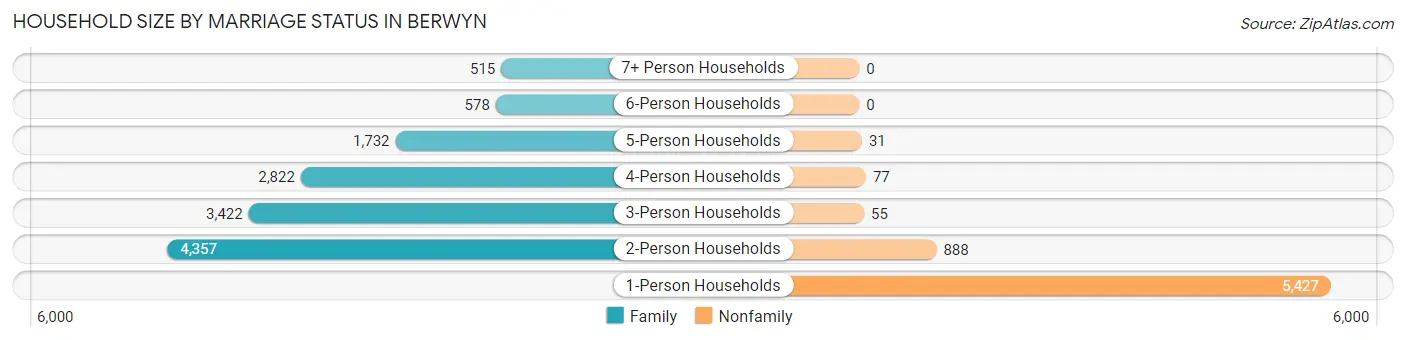
| Household Size | Family Households | Nonfamily Households |
| 1-Person Households | - | 5,427 (27.3%) |
| 2-Person Households | 4,357 (21.9%) | 888 (4.5%) |
| 3-Person Households | 3,422 (17.2%) | 55 (0.3%) |
| 4-Person Households | 2,822 (14.2%) | 77 (0.4%) |
| 5-Person Households | 1,732 (8.7%) | 31 (0.2%) |
| 6-Person Households | 578 (2.9%) | 0 (0.0%) |
| 7+ Person Households | 515 (2.6%) | 0 (0.0%) |
| Total | 13,426 (67.4%) | 6,478 (32.6%) |
Female Fertility in Berwyn
Fertility by Age in Berwyn
Average fertility rate in Berwyn is 41.0 births per 1,000 women. Women in the age bracket of 20 to 34 years have the highest fertility rate with 70.0 births per 1,000 women. Women in the age bracket of 20 to 34 years acount for 68.7% of all women with births.
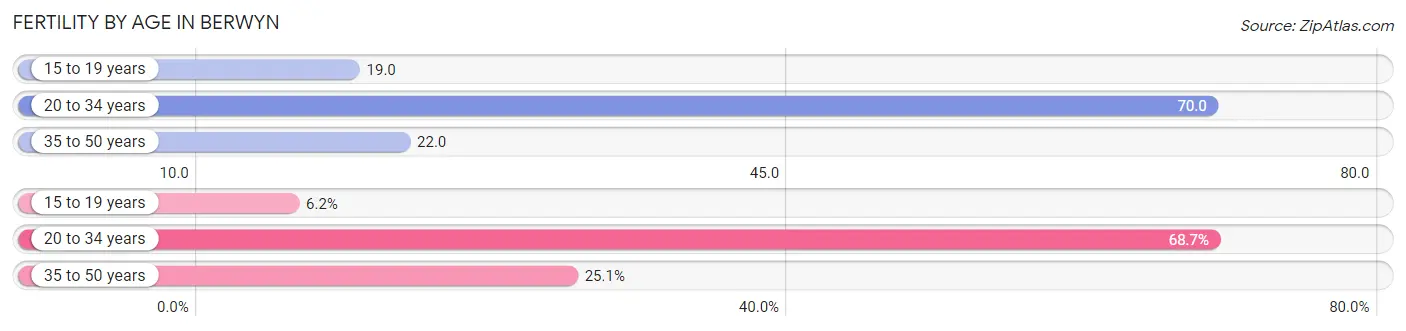
| Age Bracket | Women with Births | Births / 1,000 Women |
| 15 to 19 years | 35 (6.2%) | 19.0 |
| 20 to 34 years | 389 (68.7%) | 70.0 |
| 35 to 50 years | 142 (25.1%) | 22.0 |
| Total | 566 (100.0%) | 41.0 |
Fertility by Age by Marriage Status in Berwyn
47.3% of women with births (566) in Berwyn are married. The highest percentage of unmarried women with births falls into 15 to 19 years age bracket with 100.0% of them unmarried at the time of birth, while the lowest percentage of unmarried women with births belong to 20 to 34 years age bracket with 48.1% of them unmarried.
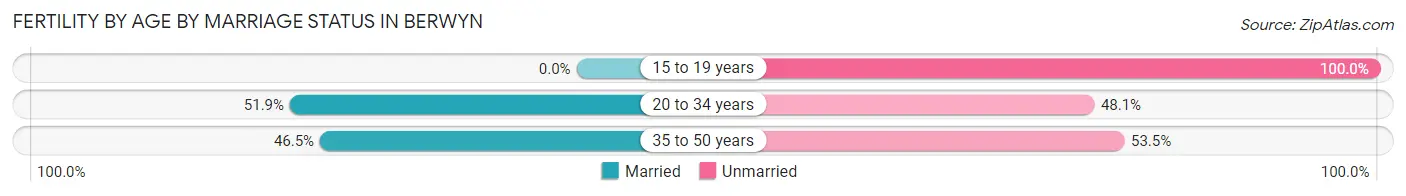
| Age Bracket | Married | Unmarried |
| 15 to 19 years | 0 (0.0%) | 35 (100.0%) |
| 20 to 34 years | 202 (51.9%) | 187 (48.1%) |
| 35 to 50 years | 66 (46.5%) | 76 (53.5%) |
| Total | 268 (47.3%) | 298 (52.6%) |
Fertility by Education in Berwyn
Average fertility rate in Berwyn is 41.0 births per 1,000 women. Women with the education attainment of college or associate's degree have the highest fertility rate of 74.0 births per 1,000 women, while women with the education attainment of high school diploma have the lowest fertility at 11.0 births per 1,000 women. Women with the education attainment of college or associate's degree represent 57.2% of all women with births.
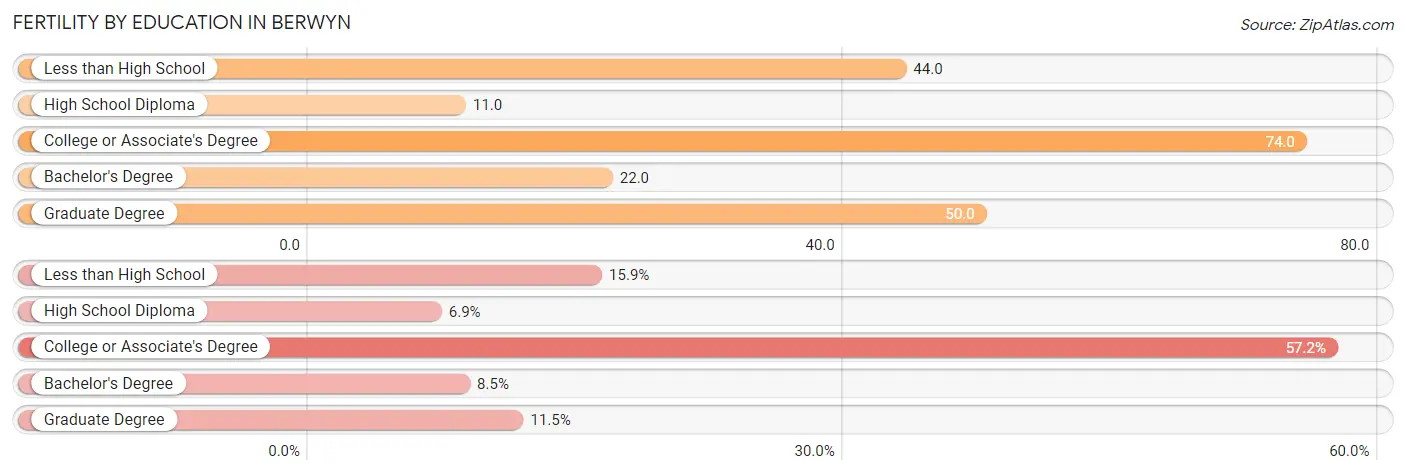
| Educational Attainment | Women with Births | Births / 1,000 Women |
| Less than High School | 90 (15.9%) | 44.0 |
| High School Diploma | 39 (6.9%) | 11.0 |
| College or Associate's Degree | 324 (57.2%) | 74.0 |
| Bachelor's Degree | 48 (8.5%) | 22.0 |
| Graduate Degree | 65 (11.5%) | 50.0 |
| Total | 566 (100.0%) | 41.0 |
Fertility by Education by Marriage Status in Berwyn
52.6% of women with births in Berwyn are unmarried. Women with the educational attainment of graduate degree are most likely to be married with 100.0% of them married at childbirth, while women with the educational attainment of college or associate's degree are least likely to be married with 70.1% of them unmarried at childbirth.
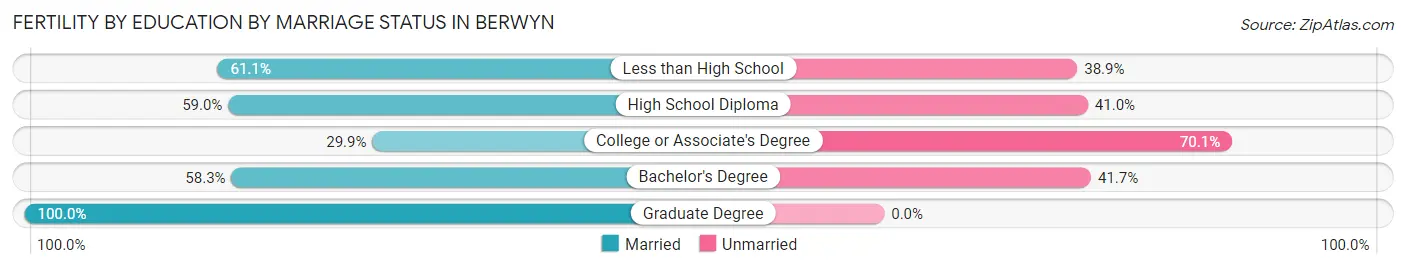
| Educational Attainment | Married | Unmarried |
| Less than High School | 55 (61.1%) | 35 (38.9%) |
| High School Diploma | 23 (59.0%) | 16 (41.0%) |
| College or Associate's Degree | 97 (29.9%) | 227 (70.1%) |
| Bachelor's Degree | 28 (58.3%) | 20 (41.7%) |
| Graduate Degree | 65 (100.0%) | 0 (0.0%) |
| Total | 268 (47.3%) | 298 (52.6%) |
Employment Characteristics in Berwyn
Employment by Class of Employer in Berwyn
Among the 28,465 employed individuals in Berwyn, private company employees (20,472 | 71.9%), not-for-profit organizations (2,496 | 8.8%), and self-employed (not incorporated) (1,669 | 5.9%) make up the most common classes of employment.
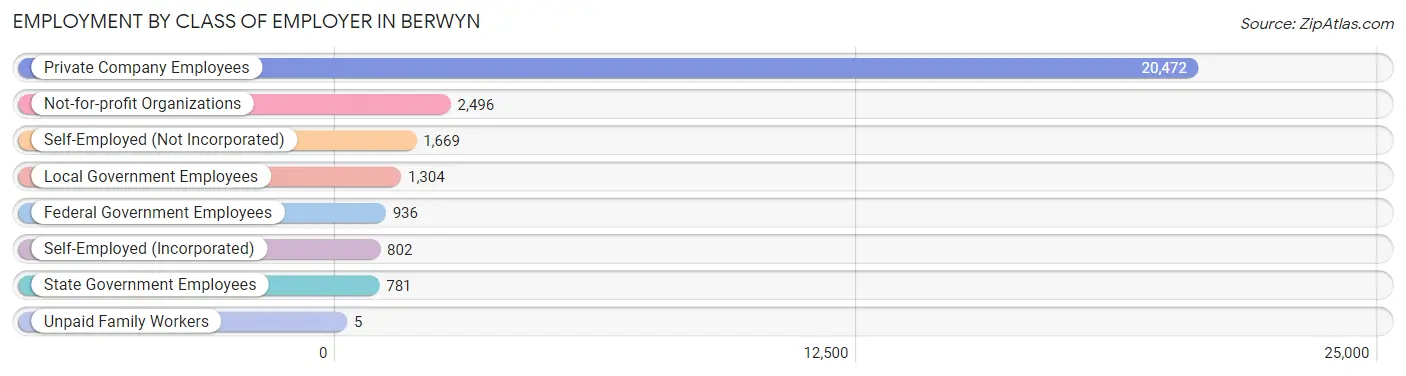
| Employer Class | # Employees | % Employees |
| Private Company Employees | 20,472 | 71.9% |
| Self-Employed (Incorporated) | 802 | 2.8% |
| Self-Employed (Not Incorporated) | 1,669 | 5.9% |
| Not-for-profit Organizations | 2,496 | 8.8% |
| Local Government Employees | 1,304 | 4.6% |
| State Government Employees | 781 | 2.7% |
| Federal Government Employees | 936 | 3.3% |
| Unpaid Family Workers | 5 | 0.0% |
| Total | 28,465 | 100.0% |
Employment Status by Age in Berwyn
According to the labor force statistics for Berwyn, out of the total population over 16 years of age (44,322), 68.4% or 30,316 individuals are in the labor force, with 5.0% or 1,516 of them unemployed. The age group with the highest labor force participation rate is 35 to 44 years, with 91.5% or 8,201 individuals in the labor force. Within the labor force, the 55 to 59 years age range has the highest percentage of unemployed individuals, with 15.5% or 433 of them being unemployed.
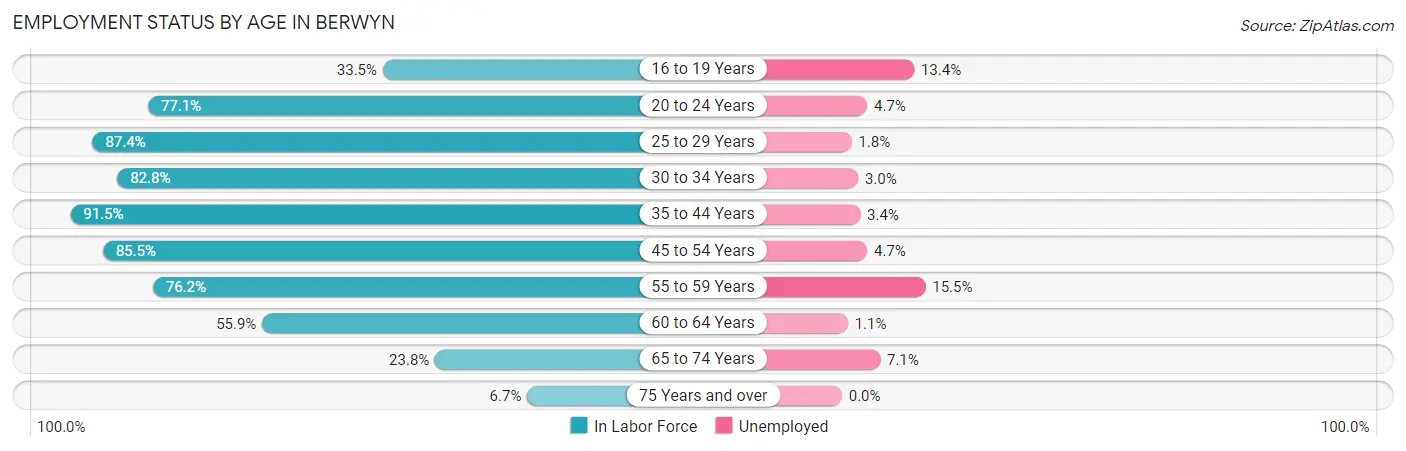
| Age Bracket | In Labor Force | Unemployed |
| 16 to 19 Years | 1,060 (33.5%) | 142 (13.4%) |
| 20 to 24 Years | 2,994 (77.1%) | 141 (4.7%) |
| 25 to 29 Years | 3,076 (87.4%) | 55 (1.8%) |
| 30 to 34 Years | 3,429 (82.8%) | 103 (3.0%) |
| 35 to 44 Years | 8,201 (91.5%) | 279 (3.4%) |
| 45 to 54 Years | 5,843 (85.5%) | 275 (4.7%) |
| 55 to 59 Years | 2,793 (76.2%) | 433 (15.5%) |
| 60 to 64 Years | 1,676 (55.9%) | 18 (1.1%) |
| 65 to 74 Years | 1,056 (23.8%) | 75 (7.1%) |
| 75 Years and over | 182 (6.7%) | 0 (0.0%) |
| Total | 30,316 (68.4%) | 1,516 (5.0%) |
Employment Status by Educational Attainment in Berwyn
According to labor force statistics for Berwyn, 83.0% of individuals (25,001) out of the total population between 25 and 64 years of age (30,122) are in the labor force, with 4.7% or 1,175 of them being unemployed. The group with the highest labor force participation rate are those with the educational attainment of bachelor's degree or higher, with 92.2% or 7,469 individuals in the labor force. Within the labor force, individuals with high school diploma education have the highest percentage of unemployment, with 6.4% or 469 of them being unemployed.
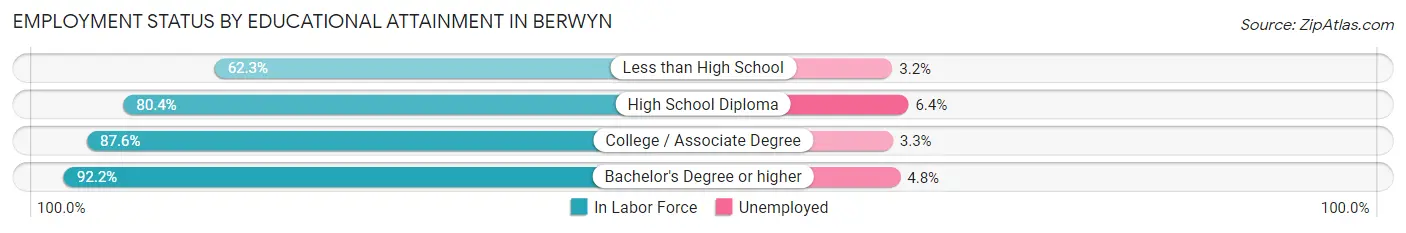
| Educational Attainment | In Labor Force | Unemployed |
| Less than High School | 2,683 (62.3%) | 138 (3.2%) |
| High School Diploma | 7,334 (80.4%) | 584 (6.4%) |
| College / Associate Degree | 7,527 (87.6%) | 284 (3.3%) |
| Bachelor's Degree or higher | 7,469 (92.2%) | 389 (4.8%) |
| Total | 25,001 (83.0%) | 1,416 (4.7%) |
Employment Occupations by Sex in Berwyn
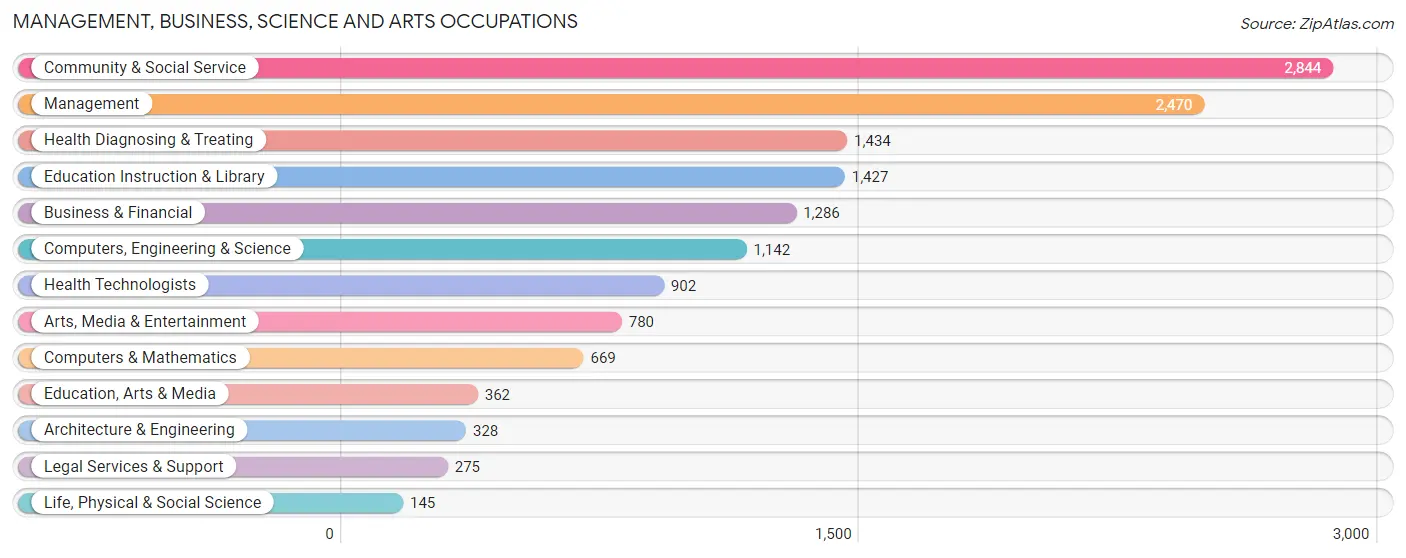
Management, Business, Science and Arts Occupations
The most common Management, Business, Science and Arts occupations in Berwyn are Community & Social Service (2,844 | 9.9%), Management (2,470 | 8.6%), Health Diagnosing & Treating (1,434 | 5.0%), Education Instruction & Library (1,427 | 5.0%), and Business & Financial (1,286 | 4.5%).
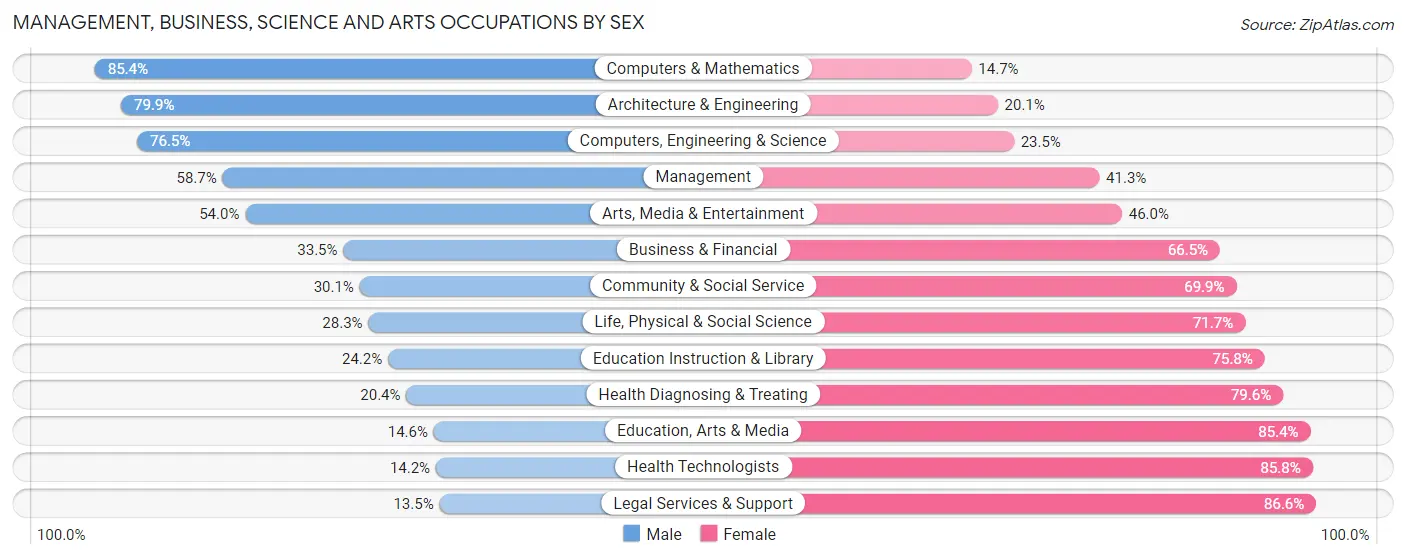
Management, Business, Science and Arts Occupations by Sex
Within the Management, Business, Science and Arts occupations in Berwyn, the most male-oriented occupations are Computers & Mathematics (85.4%), Architecture & Engineering (79.9%), and Computers, Engineering & Science (76.5%), while the most female-oriented occupations are Legal Services & Support (86.6%), Health Technologists (85.8%), and Education, Arts & Media (85.4%).
| Occupation | Male | Female |
| Management | 1,450 (58.7%) | 1,020 (41.3%) |
| Business & Financial | 431 (33.5%) | 855 (66.5%) |
| Computers, Engineering & Science | 874 (76.5%) | 268 (23.5%) |
| Computers & Mathematics | 571 (85.4%) | 98 (14.6%) |
| Architecture & Engineering | 262 (79.9%) | 66 (20.1%) |
| Life, Physical & Social Science | 41 (28.3%) | 104 (71.7%) |
| Community & Social Service | 856 (30.1%) | 1,988 (69.9%) |
| Education, Arts & Media | 53 (14.6%) | 309 (85.4%) |
| Legal Services & Support | 37 (13.5%) | 238 (86.6%) |
| Education Instruction & Library | 345 (24.2%) | 1,082 (75.8%) |
| Arts, Media & Entertainment | 421 (54.0%) | 359 (46.0%) |
| Health Diagnosing & Treating | 292 (20.4%) | 1,142 (79.6%) |
| Health Technologists | 128 (14.2%) | 774 (85.8%) |
| Total (Category) | 3,903 (42.5%) | 5,273 (57.5%) |
| Total (Overall) | 15,759 (54.8%) | 12,992 (45.2%) |
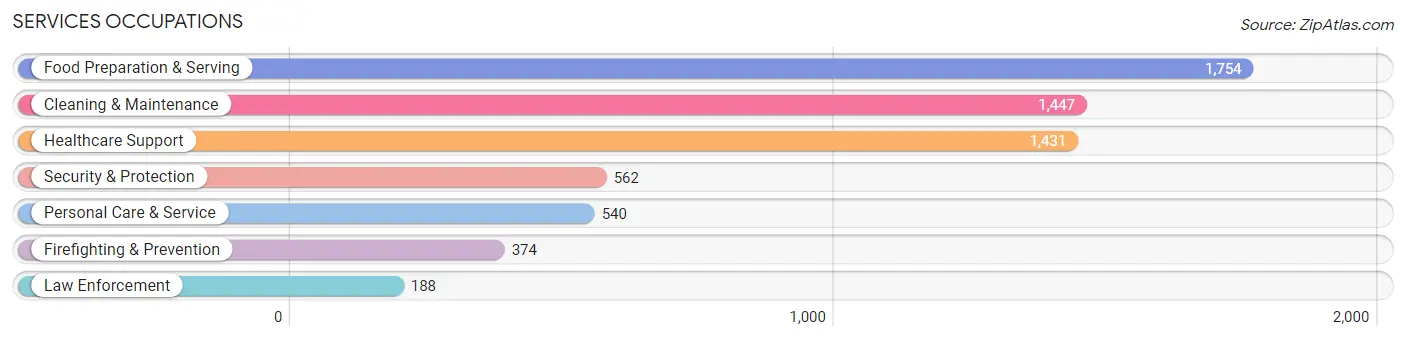
Services Occupations
The most common Services occupations in Berwyn are Food Preparation & Serving (1,754 | 6.1%), Cleaning & Maintenance (1,447 | 5.0%), Healthcare Support (1,431 | 5.0%), Security & Protection (562 | 1.9%), and Personal Care & Service (540 | 1.9%).
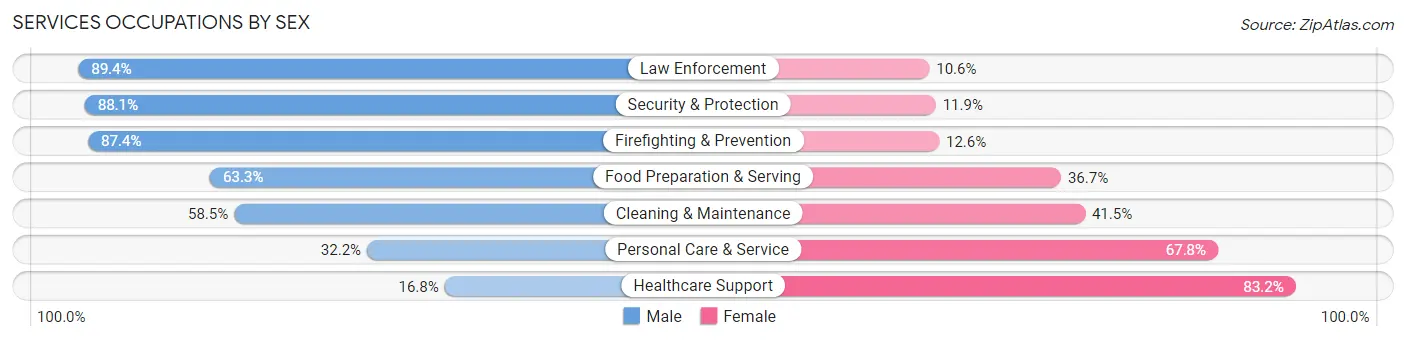
Services Occupations by Sex
Within the Services occupations in Berwyn, the most male-oriented occupations are Law Enforcement (89.4%), Security & Protection (88.1%), and Firefighting & Prevention (87.4%), while the most female-oriented occupations are Healthcare Support (83.2%), Personal Care & Service (67.8%), and Cleaning & Maintenance (41.5%).
| Occupation | Male | Female |
| Healthcare Support | 241 (16.8%) | 1,190 (83.2%) |
| Security & Protection | 495 (88.1%) | 67 (11.9%) |
| Firefighting & Prevention | 327 (87.4%) | 47 (12.6%) |
| Law Enforcement | 168 (89.4%) | 20 (10.6%) |
| Food Preparation & Serving | 1,110 (63.3%) | 644 (36.7%) |
| Cleaning & Maintenance | 847 (58.5%) | 600 (41.5%) |
| Personal Care & Service | 174 (32.2%) | 366 (67.8%) |
| Total (Category) | 2,867 (50.0%) | 2,867 (50.0%) |
| Total (Overall) | 15,759 (54.8%) | 12,992 (45.2%) |
Sales and Office Occupations
The most common Sales and Office occupations in Berwyn are Office & Administration (3,982 | 13.9%), and Sales & Related (2,351 | 8.2%).

Sales and Office Occupations by Sex

| Occupation | Male | Female |
| Sales & Related | 1,234 (52.5%) | 1,117 (47.5%) |
| Office & Administration | 1,372 (34.5%) | 2,610 (65.5%) |
| Total (Category) | 2,606 (41.1%) | 3,727 (58.9%) |
| Total (Overall) | 15,759 (54.8%) | 12,992 (45.2%) |
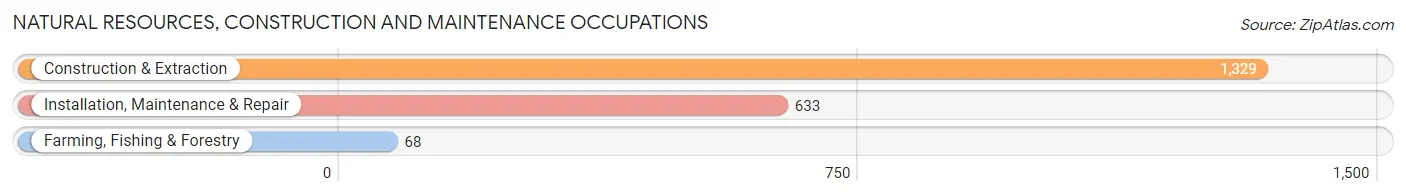
Natural Resources, Construction and Maintenance Occupations
The most common Natural Resources, Construction and Maintenance occupations in Berwyn are Construction & Extraction (1,329 | 4.6%), Installation, Maintenance & Repair (633 | 2.2%), and Farming, Fishing & Forestry (68 | 0.2%).
Natural Resources, Construction and Maintenance Occupations by Sex
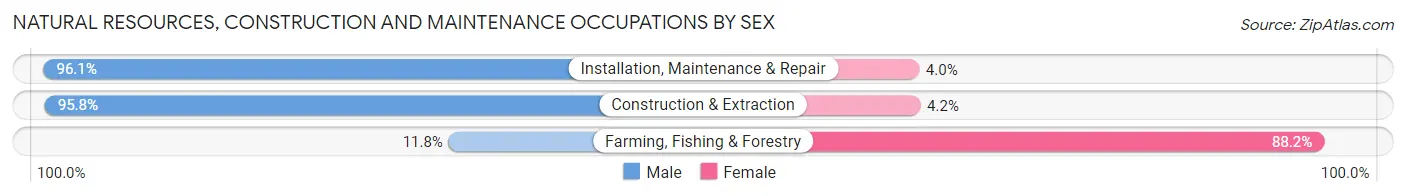
| Occupation | Male | Female |
| Farming, Fishing & Forestry | 8 (11.8%) | 60 (88.2%) |
| Construction & Extraction | 1,273 (95.8%) | 56 (4.2%) |
| Installation, Maintenance & Repair | 608 (96.1%) | 25 (4.0%) |
| Total (Category) | 1,889 (93.0%) | 141 (7.0%) |
| Total (Overall) | 15,759 (54.8%) | 12,992 (45.2%) |
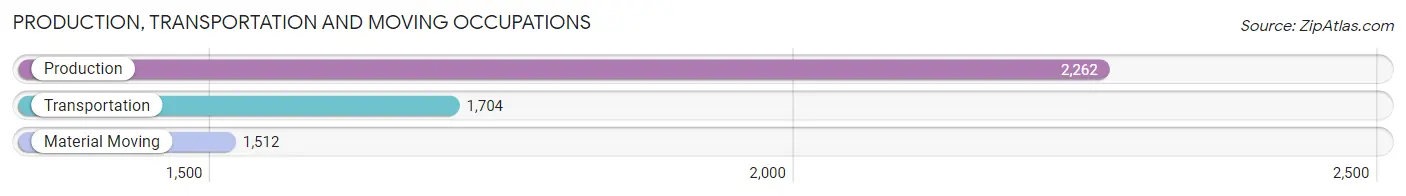
Production, Transportation and Moving Occupations
The most common Production, Transportation and Moving occupations in Berwyn are Production (2,262 | 7.9%), Transportation (1,704 | 5.9%), and Material Moving (1,512 | 5.3%).
Production, Transportation and Moving Occupations by Sex
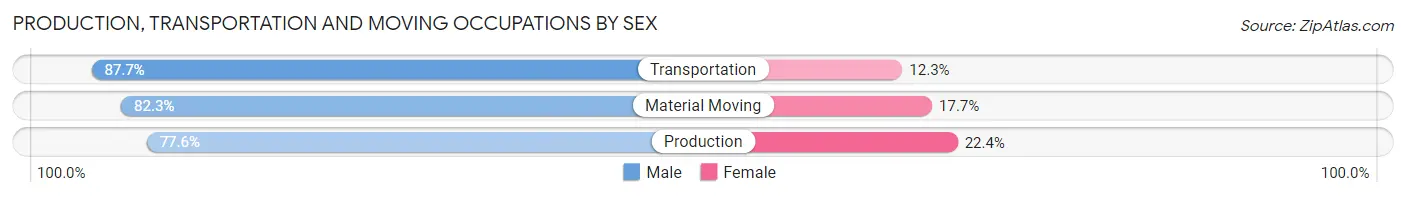
| Occupation | Male | Female |
| Production | 1,755 (77.6%) | 507 (22.4%) |
| Transportation | 1,495 (87.7%) | 209 (12.3%) |
| Material Moving | 1,244 (82.3%) | 268 (17.7%) |
| Total (Category) | 4,494 (82.0%) | 984 (18.0%) |
| Total (Overall) | 15,759 (54.8%) | 12,992 (45.2%) |
Employment Industries by Sex in Berwyn
Employment Industries in Berwyn
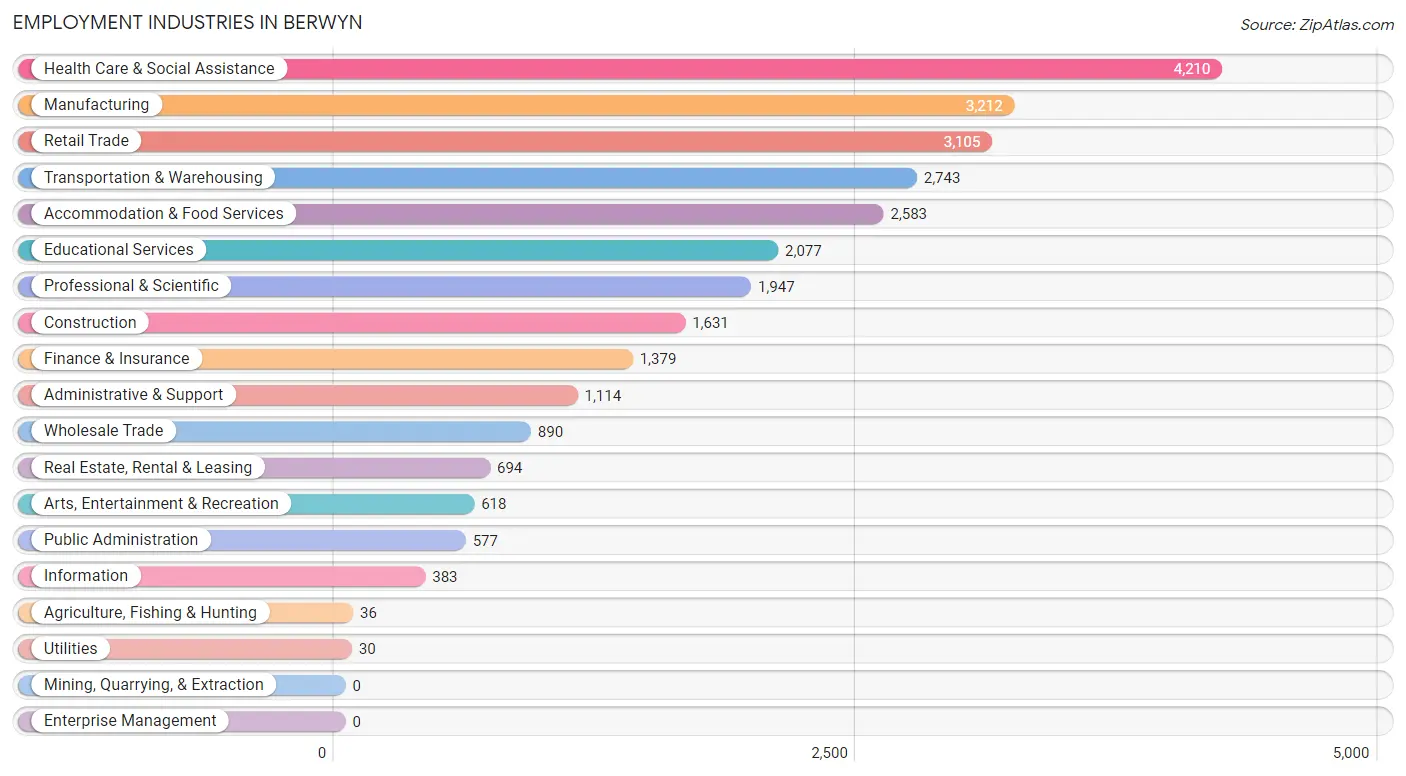
The major employment industries in Berwyn include Health Care & Social Assistance (4,210 | 14.6%), Manufacturing (3,212 | 11.2%), Retail Trade (3,105 | 10.8%), Transportation & Warehousing (2,743 | 9.5%), and Accommodation & Food Services (2,583 | 9.0%).
Employment Industries by Sex in Berwyn
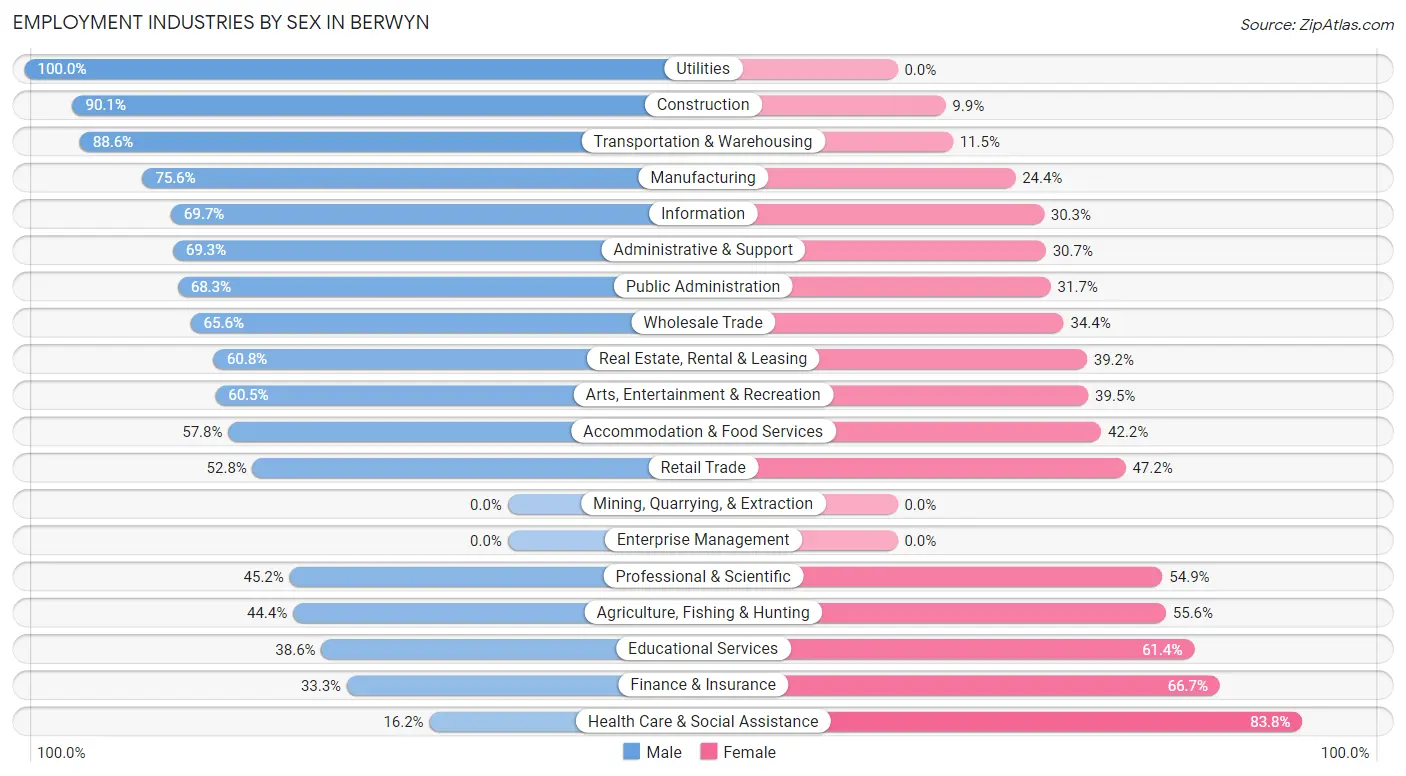
The Berwyn industries that see more men than women are Utilities (100.0%), Construction (90.1%), and Transportation & Warehousing (88.5%), whereas the industries that tend to have a higher number of women are Health Care & Social Assistance (83.8%), Finance & Insurance (66.7%), and Educational Services (61.4%).
| Industry | Male | Female |
| Agriculture, Fishing & Hunting | 16 (44.4%) | 20 (55.6%) |
| Mining, Quarrying, & Extraction | 0 (0.0%) | 0 (0.0%) |
| Construction | 1,469 (90.1%) | 162 (9.9%) |
| Manufacturing | 2,429 (75.6%) | 783 (24.4%) |
| Wholesale Trade | 584 (65.6%) | 306 (34.4%) |
| Retail Trade | 1,639 (52.8%) | 1,466 (47.2%) |
| Transportation & Warehousing | 2,429 (88.5%) | 314 (11.5%) |
| Utilities | 30 (100.0%) | 0 (0.0%) |
| Information | 267 (69.7%) | 116 (30.3%) |
| Finance & Insurance | 459 (33.3%) | 920 (66.7%) |
| Real Estate, Rental & Leasing | 422 (60.8%) | 272 (39.2%) |
| Professional & Scientific | 879 (45.2%) | 1,068 (54.8%) |
| Enterprise Management | 0 (0.0%) | 0 (0.0%) |
| Administrative & Support | 772 (69.3%) | 342 (30.7%) |
| Educational Services | 801 (38.6%) | 1,276 (61.4%) |
| Health Care & Social Assistance | 682 (16.2%) | 3,528 (83.8%) |
| Arts, Entertainment & Recreation | 374 (60.5%) | 244 (39.5%) |
| Accommodation & Food Services | 1,494 (57.8%) | 1,089 (42.2%) |
| Public Administration | 394 (68.3%) | 183 (31.7%) |
| Total | 15,759 (54.8%) | 12,992 (45.2%) |
Education in Berwyn
School Enrollment in Berwyn
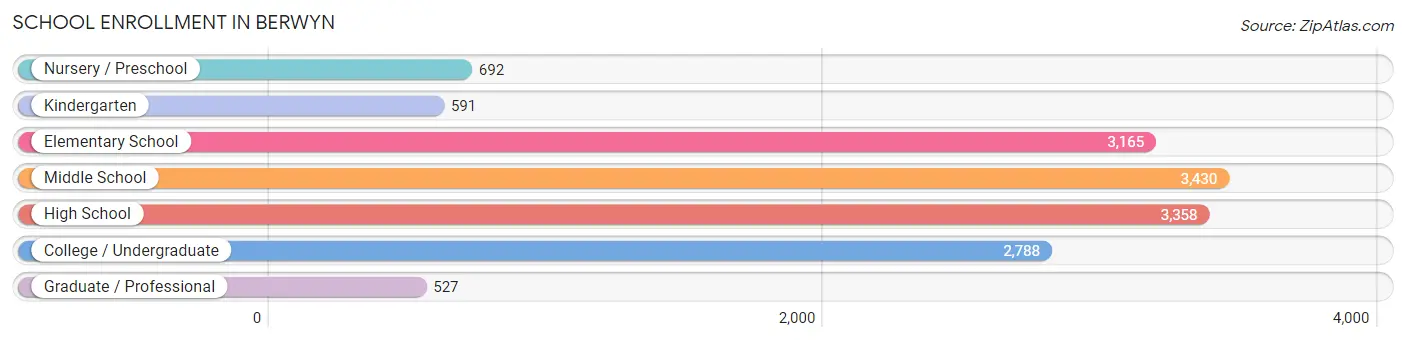
The most common levels of schooling among the 14,551 students in Berwyn are middle school (3,430 | 23.6%), high school (3,358 | 23.1%), and elementary school (3,165 | 21.7%).
| School Level | # Students | % Students |
| Nursery / Preschool | 692 | 4.8% |
| Kindergarten | 591 | 4.1% |
| Elementary School | 3,165 | 21.7% |
| Middle School | 3,430 | 23.6% |
| High School | 3,358 | 23.1% |
| College / Undergraduate | 2,788 | 19.2% |
| Graduate / Professional | 527 | 3.6% |
| Total | 14,551 | 100.0% |
School Enrollment by Age by Funding Source in Berwyn
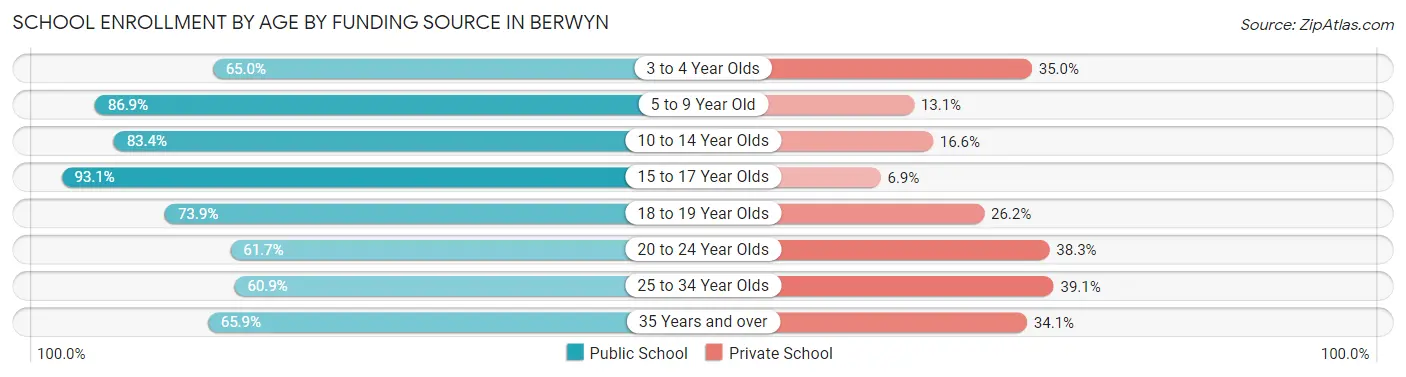
Out of a total of 14,551 students who are enrolled in schools in Berwyn, 2,823 (19.4%) attend a private institution, while the remaining 11,728 (80.6%) are enrolled in public schools. The age group of 25 to 34 year olds has the highest likelihood of being enrolled in private schools, with 249 (39.1% in the age bracket) enrolled. Conversely, the age group of 15 to 17 year olds has the lowest likelihood of being enrolled in a private school, with 2,441 (93.1% in the age bracket) attending a public institution.
| Age Bracket | Public School | Private School |
| 3 to 4 Year Olds | 445 (65.0%) | 240 (35.0%) |
| 5 to 9 Year Old | 2,982 (86.9%) | 449 (13.1%) |
| 10 to 14 Year Olds | 3,481 (83.4%) | 693 (16.6%) |
| 15 to 17 Year Olds | 2,441 (93.1%) | 180 (6.9%) |
| 18 to 19 Year Olds | 658 (73.9%) | 233 (26.2%) |
| 20 to 24 Year Olds | 916 (61.7%) | 569 (38.3%) |
| 25 to 34 Year Olds | 388 (60.9%) | 249 (39.1%) |
| 35 Years and over | 413 (65.9%) | 214 (34.1%) |
| Total | 11,728 (80.6%) | 2,823 (19.4%) |
Educational Attainment by Field of Study in Berwyn
Business (1,589 | 16.2%), science & technology (1,224 | 12.5%), arts & humanities (918 | 9.4%), education (819 | 8.4%), and social sciences (796 | 8.1%) are the most common fields of study among 9,787 individuals in Berwyn who have obtained a bachelor's degree or higher.
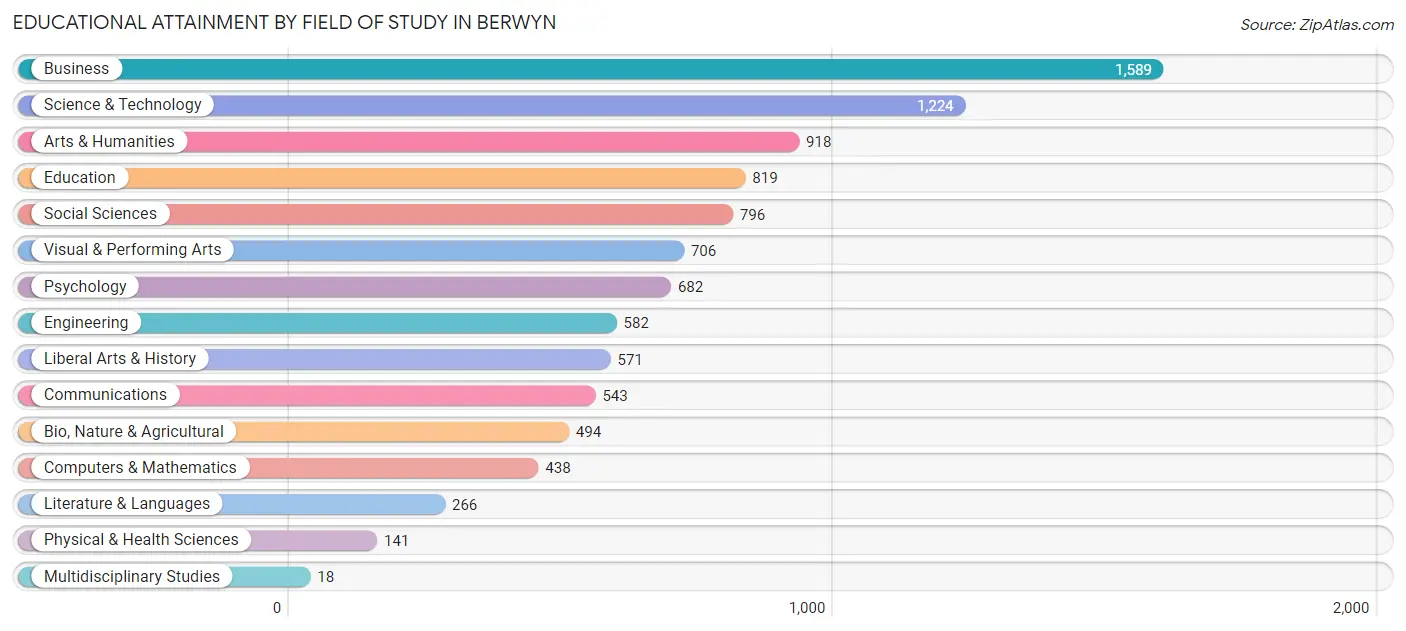
| Field of Study | # Graduates | % Graduates |
| Computers & Mathematics | 438 | 4.5% |
| Bio, Nature & Agricultural | 494 | 5.1% |
| Physical & Health Sciences | 141 | 1.4% |
| Psychology | 682 | 7.0% |
| Social Sciences | 796 | 8.1% |
| Engineering | 582 | 5.9% |
| Multidisciplinary Studies | 18 | 0.2% |
| Science & Technology | 1,224 | 12.5% |
| Business | 1,589 | 16.2% |
| Education | 819 | 8.4% |
| Literature & Languages | 266 | 2.7% |
| Liberal Arts & History | 571 | 5.8% |
| Visual & Performing Arts | 706 | 7.2% |
| Communications | 543 | 5.6% |
| Arts & Humanities | 918 | 9.4% |
| Total | 9,787 | 100.0% |
Transportation & Commute in Berwyn
Vehicle Availability by Sex in Berwyn
The most prevalent vehicle ownership categories in Berwyn are males with 2 vehicles (6,019, accounting for 38.6%) and females with 2 vehicles (5,185, making up 46.9%).
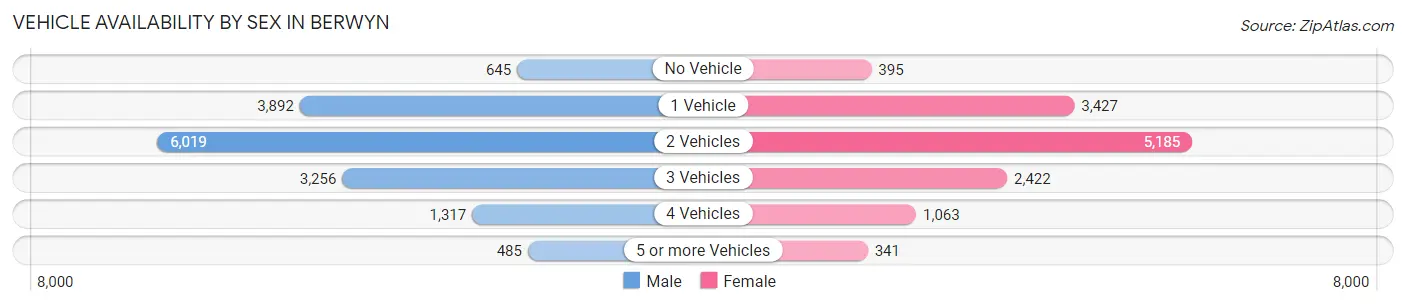
| Vehicles Available | Male | Female |
| No Vehicle | 645 (4.1%) | 395 (3.1%) |
| 1 Vehicle | 3,892 (24.9%) | 3,427 (26.7%) |
| 2 Vehicles | 6,019 (38.6%) | 5,185 (40.4%) |
| 3 Vehicles | 3,256 (20.8%) | 2,422 (18.9%) |
| 4 Vehicles | 1,317 (8.4%) | 1,063 (8.3%) |
| 5 or more Vehicles | 485 (3.1%) | 341 (2.7%) |
| Total | 15,614 (100.0%) | 12,833 (100.0%) |
Commute Time in Berwyn
The most frequently occuring commute durations in Berwyn are 30 to 34 minutes (4,960 commuters, 18.9%), 45 to 59 minutes (3,316 commuters, 12.6%), and 10 to 14 minutes (3,228 commuters, 12.3%).
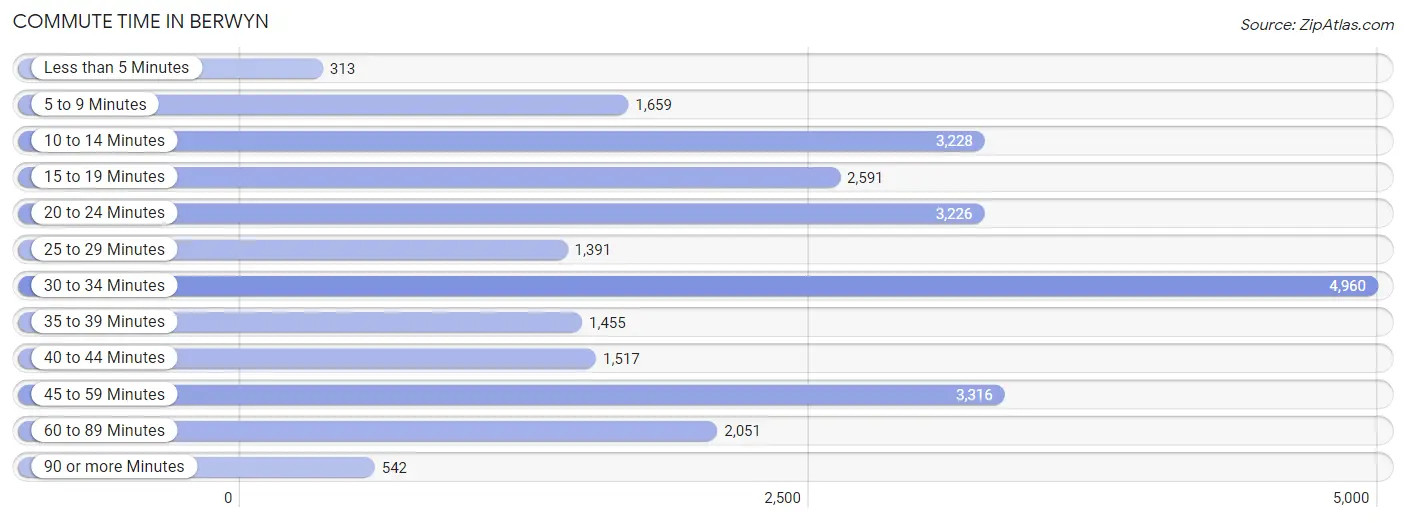
| Commute Time | # Commuters | % Commuters |
| Less than 5 Minutes | 313 | 1.2% |
| 5 to 9 Minutes | 1,659 | 6.3% |
| 10 to 14 Minutes | 3,228 | 12.3% |
| 15 to 19 Minutes | 2,591 | 9.9% |
| 20 to 24 Minutes | 3,226 | 12.3% |
| 25 to 29 Minutes | 1,391 | 5.3% |
| 30 to 34 Minutes | 4,960 | 18.9% |
| 35 to 39 Minutes | 1,455 | 5.5% |
| 40 to 44 Minutes | 1,517 | 5.8% |
| 45 to 59 Minutes | 3,316 | 12.6% |
| 60 to 89 Minutes | 2,051 | 7.8% |
| 90 or more Minutes | 542 | 2.1% |
Commute Time by Sex in Berwyn
The most common commute times in Berwyn are 30 to 34 minutes (3,307 commuters, 22.6%) for males and 30 to 34 minutes (1,653 commuters, 14.3%) for females.
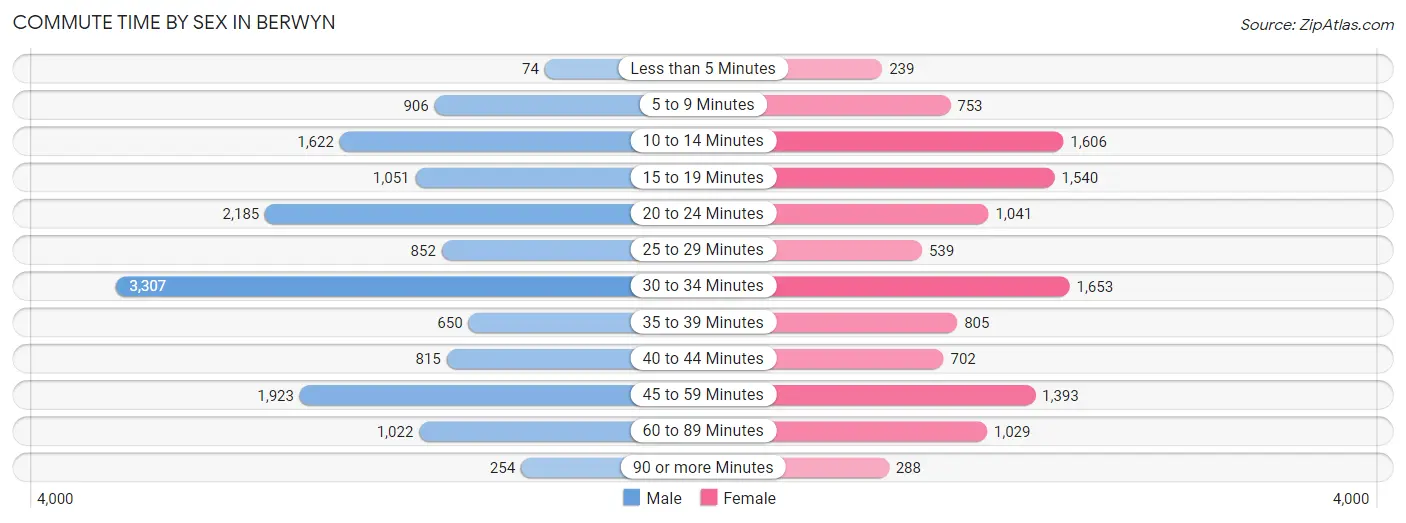
| Commute Time | Male | Female |
| Less than 5 Minutes | 74 (0.5%) | 239 (2.1%) |
| 5 to 9 Minutes | 906 (6.2%) | 753 (6.5%) |
| 10 to 14 Minutes | 1,622 (11.1%) | 1,606 (13.9%) |
| 15 to 19 Minutes | 1,051 (7.2%) | 1,540 (13.3%) |
| 20 to 24 Minutes | 2,185 (14.9%) | 1,041 (9.0%) |
| 25 to 29 Minutes | 852 (5.8%) | 539 (4.6%) |
| 30 to 34 Minutes | 3,307 (22.6%) | 1,653 (14.3%) |
| 35 to 39 Minutes | 650 (4.4%) | 805 (7.0%) |
| 40 to 44 Minutes | 815 (5.6%) | 702 (6.1%) |
| 45 to 59 Minutes | 1,923 (13.1%) | 1,393 (12.0%) |
| 60 to 89 Minutes | 1,022 (7.0%) | 1,029 (8.9%) |
| 90 or more Minutes | 254 (1.7%) | 288 (2.5%) |
Time of Departure to Work by Sex in Berwyn
The most frequent times of departure to work in Berwyn are 7:00 AM to 7:29 AM (2,637, 18.0%) for males and 7:00 AM to 7:29 AM (1,914, 16.5%) for females.
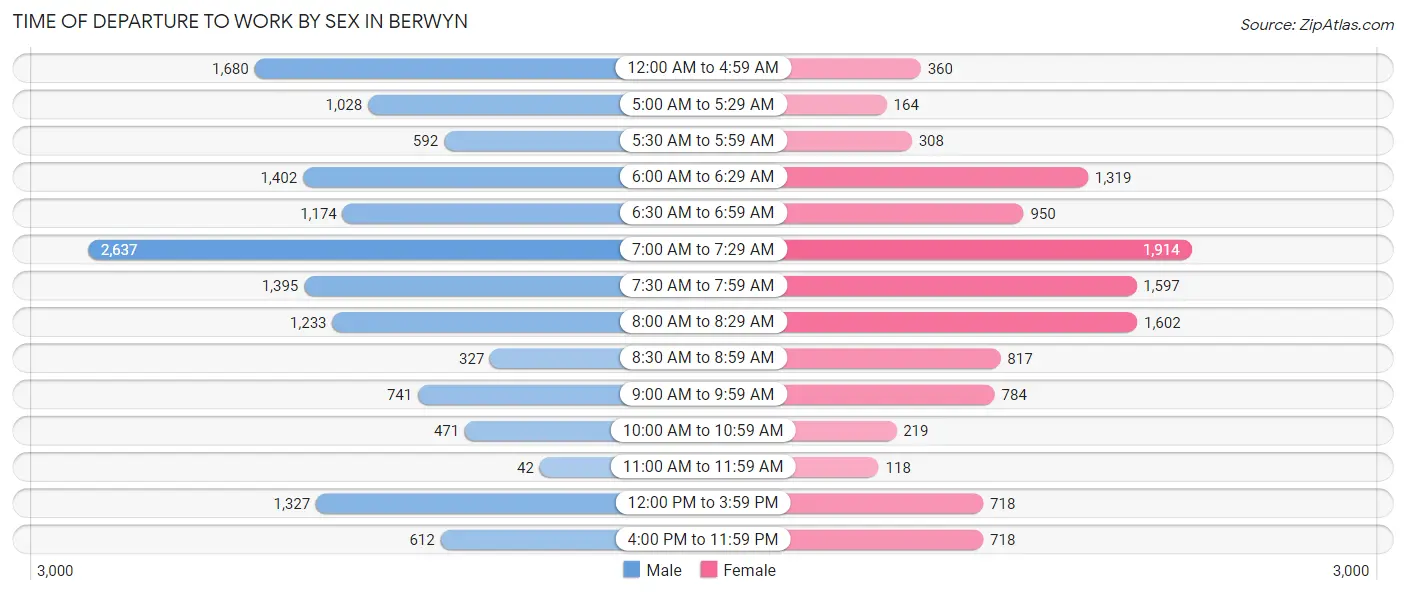
| Time of Departure | Male | Female |
| 12:00 AM to 4:59 AM | 1,680 (11.5%) | 360 (3.1%) |
| 5:00 AM to 5:29 AM | 1,028 (7.0%) | 164 (1.4%) |
| 5:30 AM to 5:59 AM | 592 (4.0%) | 308 (2.7%) |
| 6:00 AM to 6:29 AM | 1,402 (9.6%) | 1,319 (11.4%) |
| 6:30 AM to 6:59 AM | 1,174 (8.0%) | 950 (8.2%) |
| 7:00 AM to 7:29 AM | 2,637 (18.0%) | 1,914 (16.5%) |
| 7:30 AM to 7:59 AM | 1,395 (9.5%) | 1,597 (13.8%) |
| 8:00 AM to 8:29 AM | 1,233 (8.4%) | 1,602 (13.8%) |
| 8:30 AM to 8:59 AM | 327 (2.2%) | 817 (7.0%) |
| 9:00 AM to 9:59 AM | 741 (5.1%) | 784 (6.8%) |
| 10:00 AM to 10:59 AM | 471 (3.2%) | 219 (1.9%) |
| 11:00 AM to 11:59 AM | 42 (0.3%) | 118 (1.0%) |
| 12:00 PM to 3:59 PM | 1,327 (9.0%) | 718 (6.2%) |
| 4:00 PM to 11:59 PM | 612 (4.2%) | 718 (6.2%) |
| Total | 14,661 (100.0%) | 11,588 (100.0%) |
Housing Occupancy in Berwyn
Occupancy by Ownership in Berwyn
Of the total 19,904 dwellings in Berwyn, owner-occupied units account for 12,031 (60.5%), while renter-occupied units make up 7,873 (39.6%).
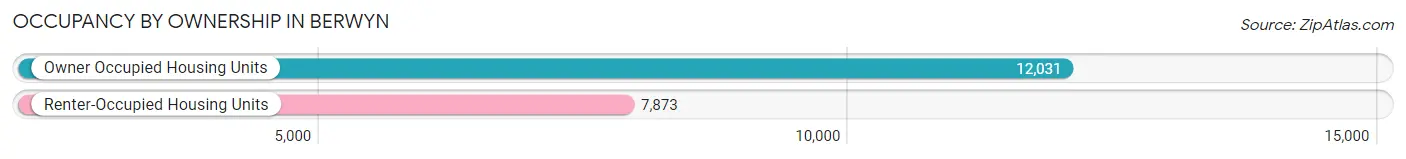
| Occupancy | # Housing Units | % Housing Units |
| Owner Occupied Housing Units | 12,031 | 60.5% |
| Renter-Occupied Housing Units | 7,873 | 39.6% |
| Total Occupied Housing Units | 19,904 | 100.0% |
Occupancy by Household Size in Berwyn
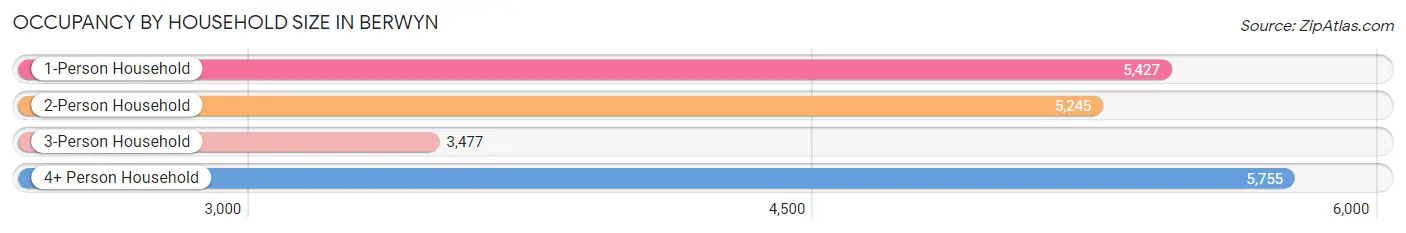
| Household Size | # Housing Units | % Housing Units |
| 1-Person Household | 5,427 | 27.3% |
| 2-Person Household | 5,245 | 26.4% |
| 3-Person Household | 3,477 | 17.5% |
| 4+ Person Household | 5,755 | 28.9% |
| Total Housing Units | 19,904 | 100.0% |
Occupancy by Ownership by Household Size in Berwyn
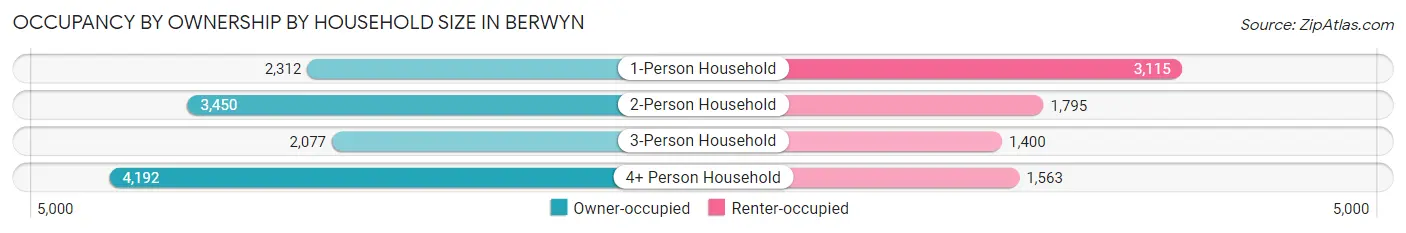
| Household Size | Owner-occupied | Renter-occupied |
| 1-Person Household | 2,312 (42.6%) | 3,115 (57.4%) |
| 2-Person Household | 3,450 (65.8%) | 1,795 (34.2%) |
| 3-Person Household | 2,077 (59.7%) | 1,400 (40.3%) |
| 4+ Person Household | 4,192 (72.8%) | 1,563 (27.2%) |
| Total Housing Units | 12,031 (60.5%) | 7,873 (39.6%) |
Occupancy by Educational Attainment in Berwyn
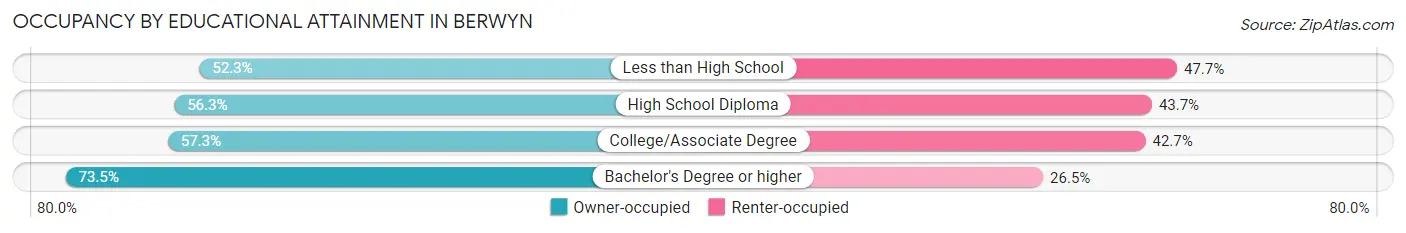
| Household Size | Owner-occupied | Renter-occupied |
| Less than High School | 1,331 (52.3%) | 1,215 (47.7%) |
| High School Diploma | 3,270 (56.3%) | 2,542 (43.7%) |
| College/Associate Degree | 3,731 (57.3%) | 2,783 (42.7%) |
| Bachelor's Degree or higher | 3,699 (73.5%) | 1,333 (26.5%) |
Occupancy by Age of Householder in Berwyn
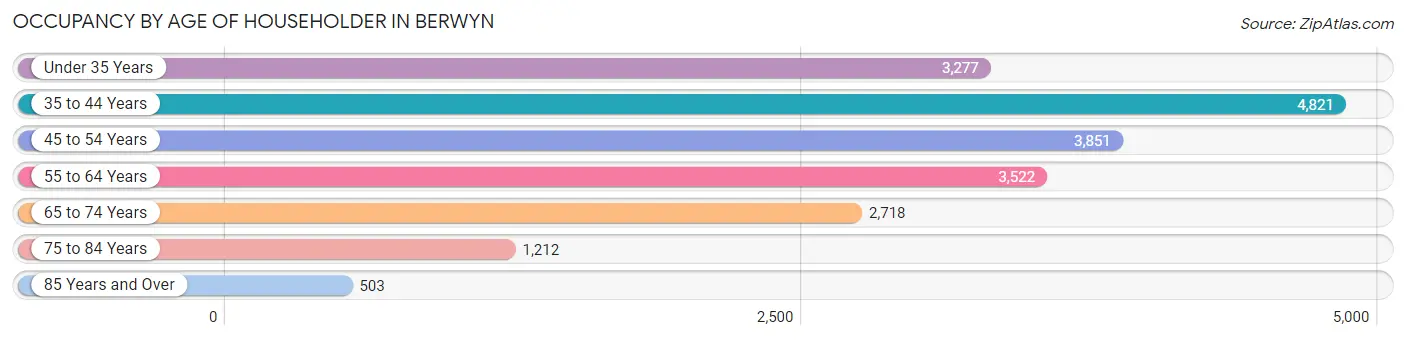
| Age Bracket | # Households | % Households |
| Under 35 Years | 3,277 | 16.5% |
| 35 to 44 Years | 4,821 | 24.2% |
| 45 to 54 Years | 3,851 | 19.4% |
| 55 to 64 Years | 3,522 | 17.7% |
| 65 to 74 Years | 2,718 | 13.7% |
| 75 to 84 Years | 1,212 | 6.1% |
| 85 Years and Over | 503 | 2.5% |
| Total | 19,904 | 100.0% |
Housing Finances in Berwyn
Median Income by Occupancy in Berwyn
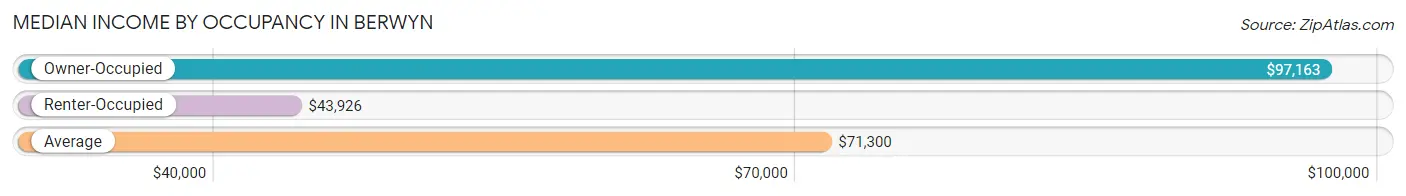
| Occupancy Type | # Households | Median Income |
| Owner-Occupied | 12,031 (60.5%) | $97,163 |
| Renter-Occupied | 7,873 (39.6%) | $43,926 |
| Average | 19,904 (100.0%) | $71,300 |
Occupancy by Householder Income Bracket in Berwyn
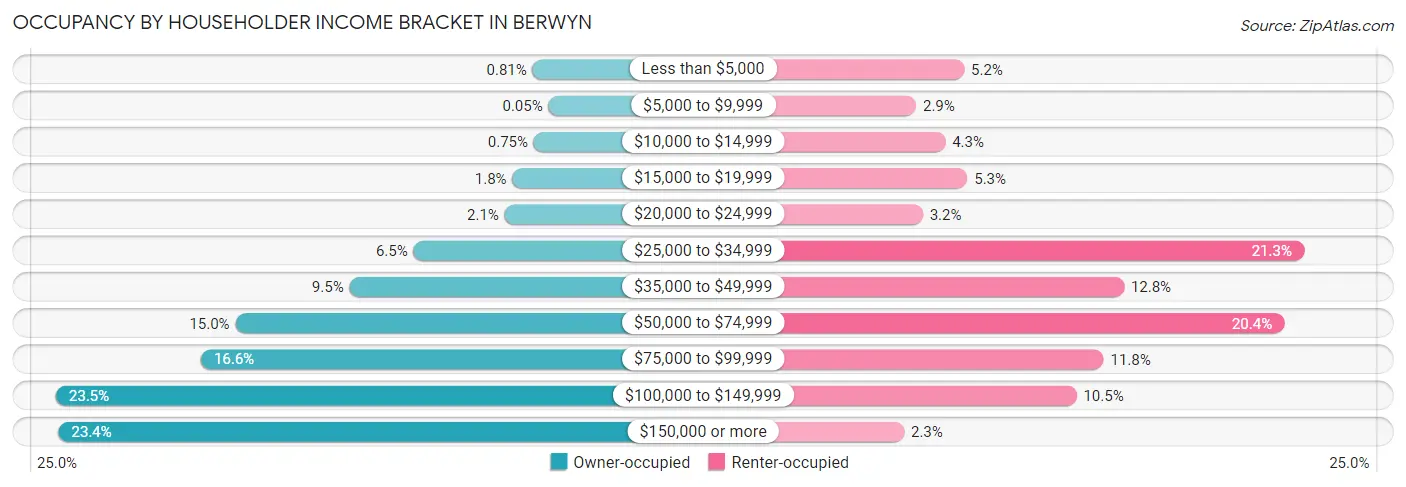
| Income Bracket | Owner-occupied | Renter-occupied |
| Less than $5,000 | 97 (0.8%) | 407 (5.2%) |
| $5,000 to $9,999 | 6 (0.1%) | 227 (2.9%) |
| $10,000 to $14,999 | 90 (0.7%) | 336 (4.3%) |
| $15,000 to $19,999 | 213 (1.8%) | 419 (5.3%) |
| $20,000 to $24,999 | 258 (2.1%) | 252 (3.2%) |
| $25,000 to $34,999 | 780 (6.5%) | 1,680 (21.3%) |
| $35,000 to $49,999 | 1,147 (9.5%) | 1,006 (12.8%) |
| $50,000 to $74,999 | 1,800 (15.0%) | 1,606 (20.4%) |
| $75,000 to $99,999 | 1,997 (16.6%) | 930 (11.8%) |
| $100,000 to $149,999 | 2,829 (23.5%) | 828 (10.5%) |
| $150,000 or more | 2,814 (23.4%) | 182 (2.3%) |
| Total | 12,031 (100.0%) | 7,873 (100.0%) |
Monthly Housing Cost Tiers in Berwyn
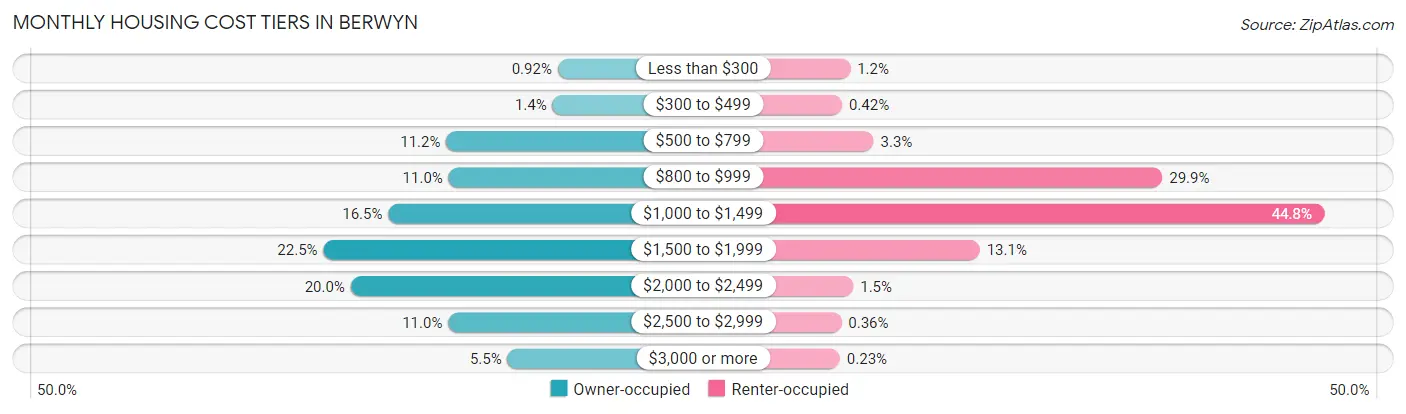
| Monthly Cost | Owner-occupied | Renter-occupied |
| Less than $300 | 111 (0.9%) | 93 (1.2%) |
| $300 to $499 | 168 (1.4%) | 33 (0.4%) |
| $500 to $799 | 1,345 (11.2%) | 262 (3.3%) |
| $800 to $999 | 1,319 (11.0%) | 2,355 (29.9%) |
| $1,000 to $1,499 | 1,987 (16.5%) | 3,525 (44.8%) |
| $1,500 to $1,999 | 2,706 (22.5%) | 1,031 (13.1%) |
| $2,000 to $2,499 | 2,404 (20.0%) | 115 (1.5%) |
| $2,500 to $2,999 | 1,324 (11.0%) | 28 (0.4%) |
| $3,000 or more | 667 (5.5%) | 18 (0.2%) |
| Total | 12,031 (100.0%) | 7,873 (100.0%) |
Physical Housing Characteristics in Berwyn
Housing Structures in Berwyn
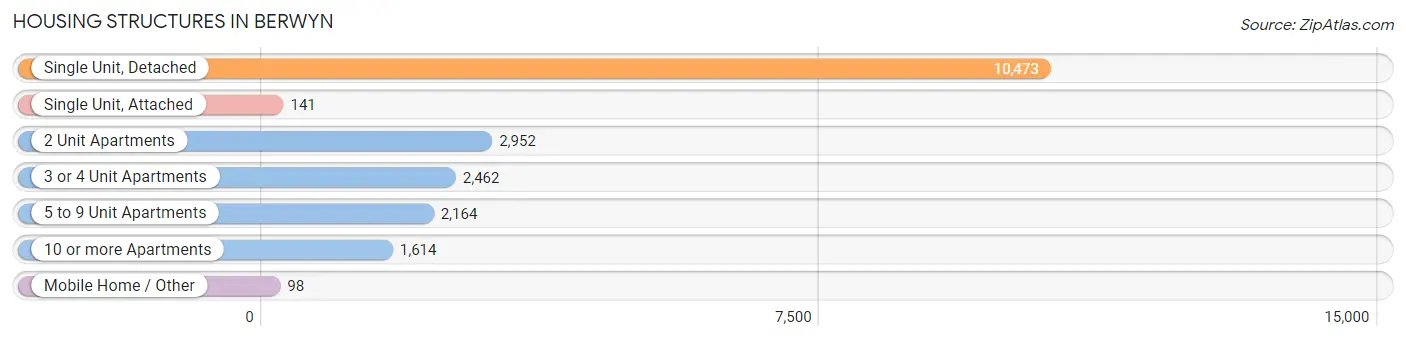
| Structure Type | # Housing Units | % Housing Units |
| Single Unit, Detached | 10,473 | 52.6% |
| Single Unit, Attached | 141 | 0.7% |
| 2 Unit Apartments | 2,952 | 14.8% |
| 3 or 4 Unit Apartments | 2,462 | 12.4% |
| 5 to 9 Unit Apartments | 2,164 | 10.9% |
| 10 or more Apartments | 1,614 | 8.1% |
| Mobile Home / Other | 98 | 0.5% |
| Total | 19,904 | 100.0% |
Housing Structures by Occupancy in Berwyn
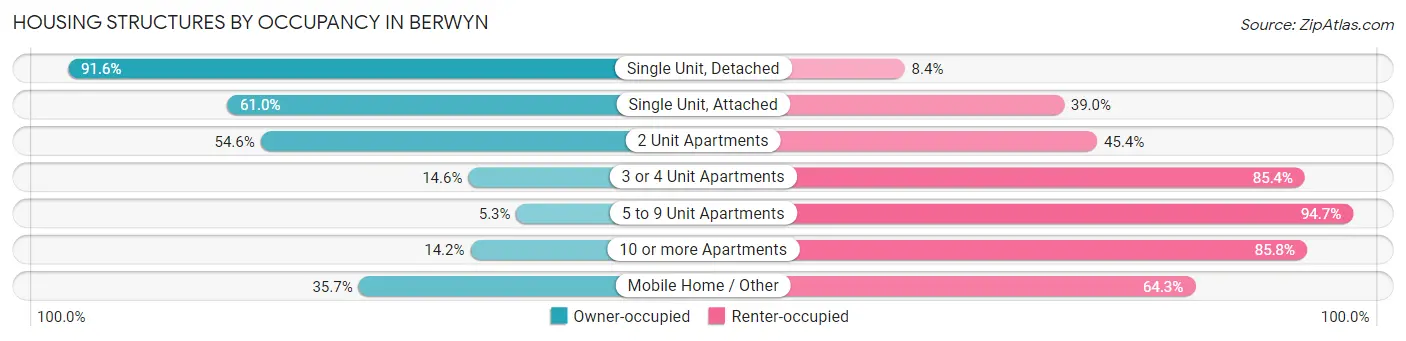
| Structure Type | Owner-occupied | Renter-occupied |
| Single Unit, Detached | 9,596 (91.6%) | 877 (8.4%) |
| Single Unit, Attached | 86 (61.0%) | 55 (39.0%) |
| 2 Unit Apartments | 1,611 (54.6%) | 1,341 (45.4%) |
| 3 or 4 Unit Apartments | 359 (14.6%) | 2,103 (85.4%) |
| 5 to 9 Unit Apartments | 115 (5.3%) | 2,049 (94.7%) |
| 10 or more Apartments | 229 (14.2%) | 1,385 (85.8%) |
| Mobile Home / Other | 35 (35.7%) | 63 (64.3%) |
| Total | 12,031 (60.5%) | 7,873 (39.6%) |
Housing Structures by Number of Rooms in Berwyn
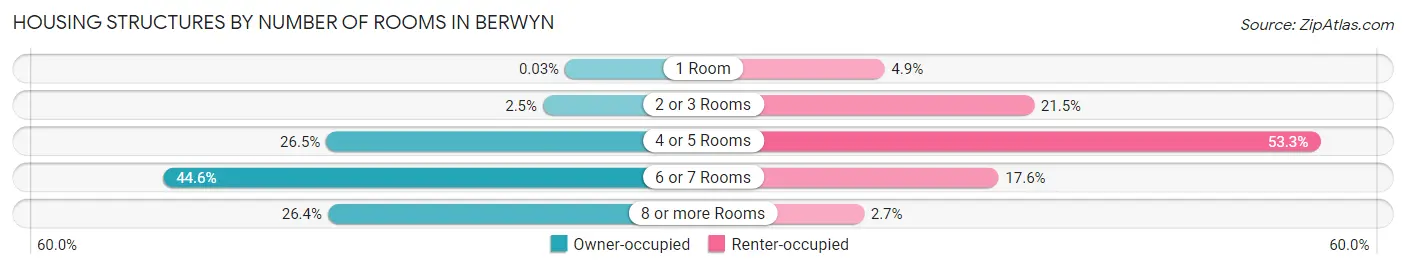
| Number of Rooms | Owner-occupied | Renter-occupied |
| 1 Room | 4 (0.0%) | 389 (4.9%) |
| 2 or 3 Rooms | 298 (2.5%) | 1,695 (21.5%) |
| 4 or 5 Rooms | 3,192 (26.5%) | 4,195 (53.3%) |
| 6 or 7 Rooms | 5,367 (44.6%) | 1,385 (17.6%) |
| 8 or more Rooms | 3,170 (26.4%) | 209 (2.6%) |
| Total | 12,031 (100.0%) | 7,873 (100.0%) |
Housing Structure by Heating Type in Berwyn
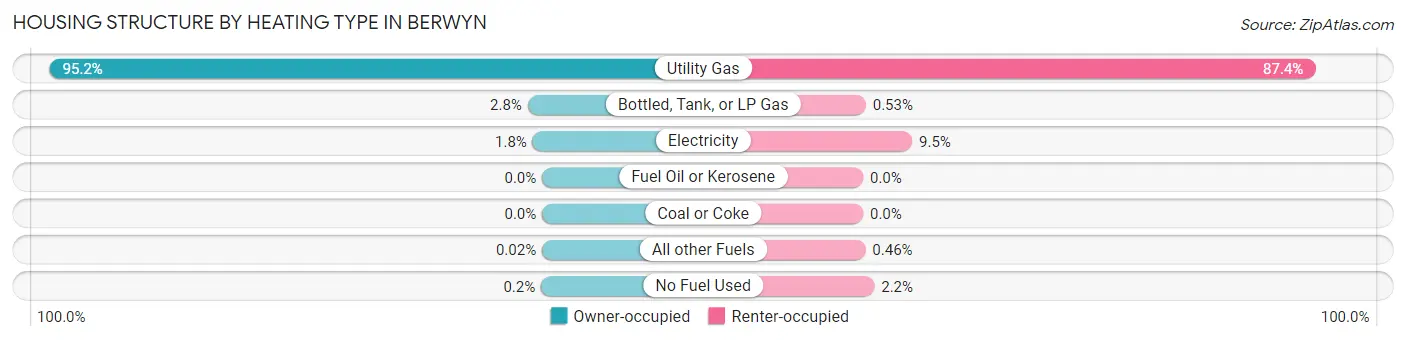
| Heating Type | Owner-occupied | Renter-occupied |
| Utility Gas | 11,452 (95.2%) | 6,878 (87.4%) |
| Bottled, Tank, or LP Gas | 334 (2.8%) | 42 (0.5%) |
| Electricity | 219 (1.8%) | 746 (9.5%) |
| Fuel Oil or Kerosene | 0 (0.0%) | 0 (0.0%) |
| Coal or Coke | 0 (0.0%) | 0 (0.0%) |
| All other Fuels | 2 (0.0%) | 36 (0.5%) |
| No Fuel Used | 24 (0.2%) | 171 (2.2%) |
| Total | 12,031 (100.0%) | 7,873 (100.0%) |
Household Vehicle Usage in Berwyn
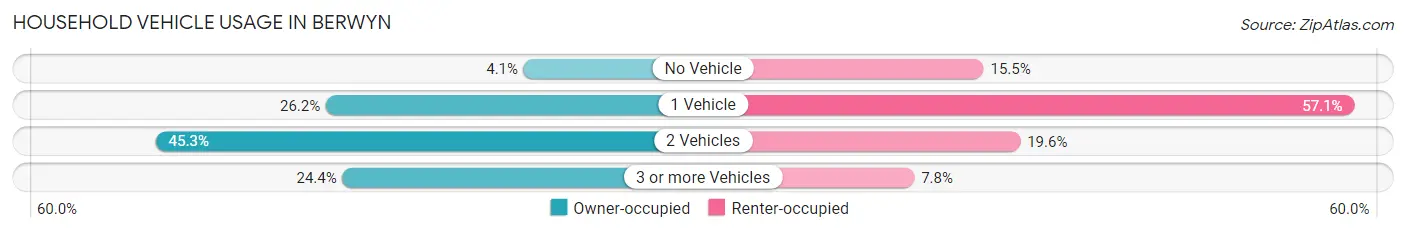
| Vehicles per Household | Owner-occupied | Renter-occupied |
| No Vehicle | 490 (4.1%) | 1,223 (15.5%) |
| 1 Vehicle | 3,156 (26.2%) | 4,493 (57.1%) |
| 2 Vehicles | 5,452 (45.3%) | 1,546 (19.6%) |
| 3 or more Vehicles | 2,933 (24.4%) | 611 (7.8%) |
| Total | 12,031 (100.0%) | 7,873 (100.0%) |
Real Estate & Mortgages in Berwyn
Real Estate and Mortgage Overview in Berwyn
| Characteristic | Without Mortgage | With Mortgage |
| Housing Units | 3,995 | 8,036 |
| Median Property Value | $262,300 | $278,400 |
| Median Household Income | $72,679 | $2,132 |
| Monthly Housing Costs | $856 | $629 |
| Real Estate Taxes | $5,809 | $41 |
Property Value by Mortgage Status in Berwyn
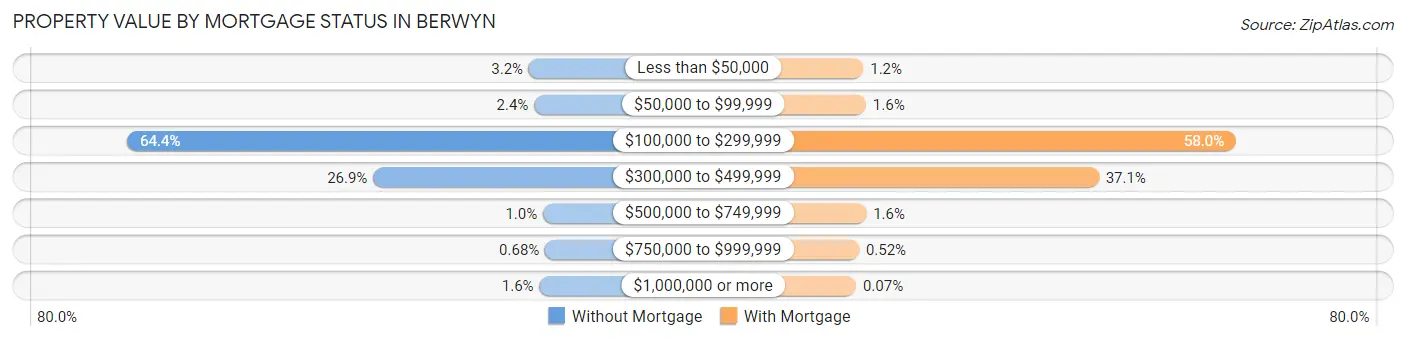
| Property Value | Without Mortgage | With Mortgage |
| Less than $50,000 | 126 (3.2%) | 95 (1.2%) |
| $50,000 to $99,999 | 94 (2.4%) | 127 (1.6%) |
| $100,000 to $299,999 | 2,572 (64.4%) | 4,659 (58.0%) |
| $300,000 to $499,999 | 1,074 (26.9%) | 2,977 (37.0%) |
| $500,000 to $749,999 | 40 (1.0%) | 130 (1.6%) |
| $750,000 to $999,999 | 27 (0.7%) | 42 (0.5%) |
| $1,000,000 or more | 62 (1.5%) | 6 (0.1%) |
| Total | 3,995 (100.0%) | 8,036 (100.0%) |
Household Income by Mortgage Status in Berwyn
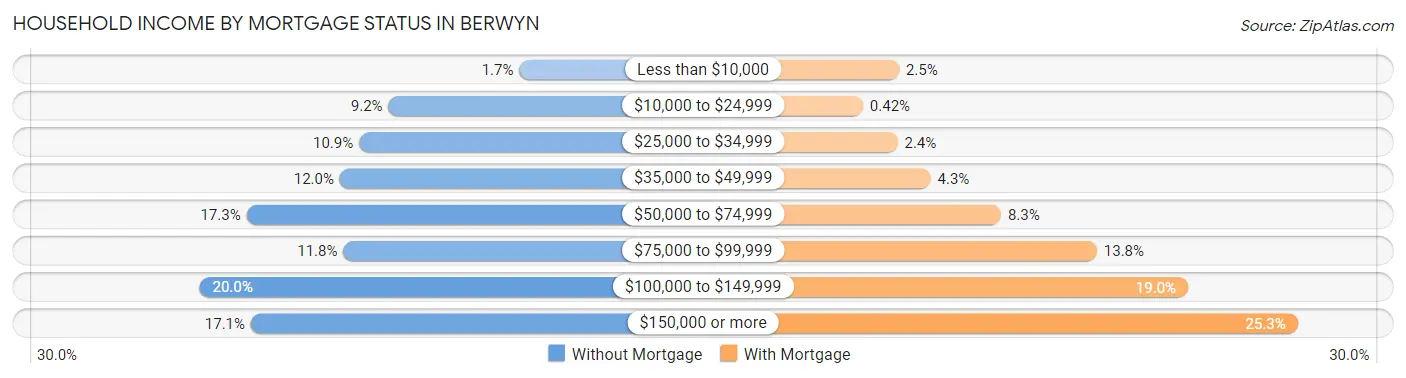
| Household Income | Without Mortgage | With Mortgage |
| Less than $10,000 | 69 (1.7%) | 199 (2.5%) |
| $10,000 to $24,999 | 368 (9.2%) | 34 (0.4%) |
| $25,000 to $34,999 | 435 (10.9%) | 193 (2.4%) |
| $35,000 to $49,999 | 479 (12.0%) | 345 (4.3%) |
| $50,000 to $74,999 | 692 (17.3%) | 668 (8.3%) |
| $75,000 to $99,999 | 471 (11.8%) | 1,108 (13.8%) |
| $100,000 to $149,999 | 799 (20.0%) | 1,526 (19.0%) |
| $150,000 or more | 682 (17.1%) | 2,030 (25.3%) |
| Total | 3,995 (100.0%) | 8,036 (100.0%) |
Property Value to Household Income Ratio in Berwyn
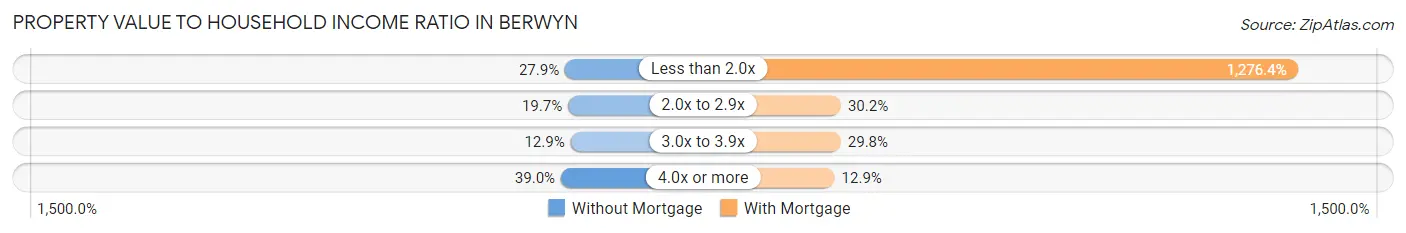
| Value-to-Income Ratio | Without Mortgage | With Mortgage |
| Less than 2.0x | 1,116 (27.9%) | 102,572 (1,276.4%) |
| 2.0x to 2.9x | 787 (19.7%) | 2,427 (30.2%) |
| 3.0x to 3.9x | 517 (12.9%) | 2,393 (29.8%) |
| 4.0x or more | 1,557 (39.0%) | 1,036 (12.9%) |
| Total | 3,995 (100.0%) | 8,036 (100.0%) |
Real Estate Taxes by Mortgage Status in Berwyn

| Property Taxes | Without Mortgage | With Mortgage |
| Less than $800 | 65 (1.6%) | 0 (0.0%) |
| $800 to $1,499 | 72 (1.8%) | 76 (0.9%) |
| $800 to $1,499 | 3,792 (94.9%) | 62 (0.8%) |
| Total | 3,995 (100.0%) | 8,036 (100.0%) |
Health & Disability in Berwyn
Health Insurance Coverage by Age in Berwyn
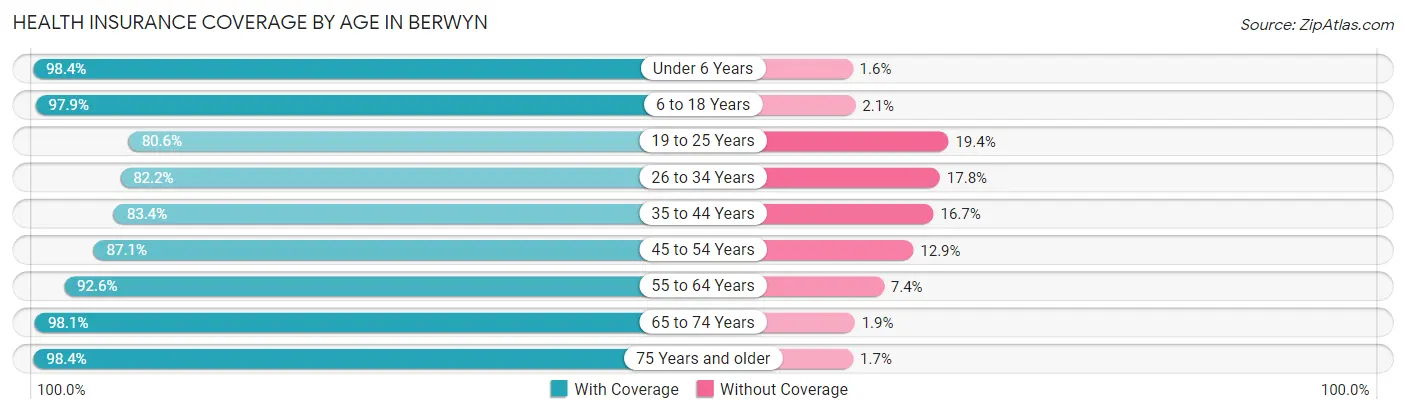
| Age Bracket | With Coverage | Without Coverage |
| Under 6 Years | 3,796 (98.4%) | 60 (1.6%) |
| 6 to 18 Years | 10,561 (97.9%) | 222 (2.1%) |
| 19 to 25 Years | 4,146 (80.6%) | 1,000 (19.4%) |
| 26 to 34 Years | 5,848 (82.2%) | 1,269 (17.8%) |
| 35 to 44 Years | 7,470 (83.4%) | 1,492 (16.7%) |
| 45 to 54 Years | 5,954 (87.1%) | 880 (12.9%) |
| 55 to 64 Years | 6,172 (92.6%) | 492 (7.4%) |
| 65 to 74 Years | 4,344 (98.1%) | 86 (1.9%) |
| 75 Years and older | 2,630 (98.4%) | 44 (1.7%) |
| Total | 50,921 (90.2%) | 5,545 (9.8%) |
Health Insurance Coverage by Citizenship Status in Berwyn
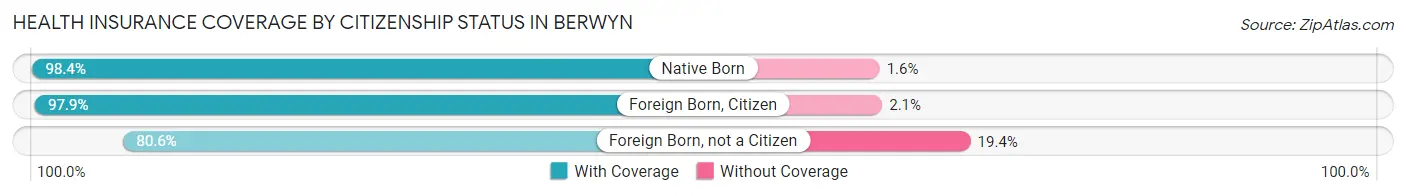
| Citizenship Status | With Coverage | Without Coverage |
| Native Born | 3,796 (98.4%) | 60 (1.6%) |
| Foreign Born, Citizen | 10,561 (97.9%) | 222 (2.1%) |
| Foreign Born, not a Citizen | 4,146 (80.6%) | 1,000 (19.4%) |
Health Insurance Coverage by Household Income in Berwyn
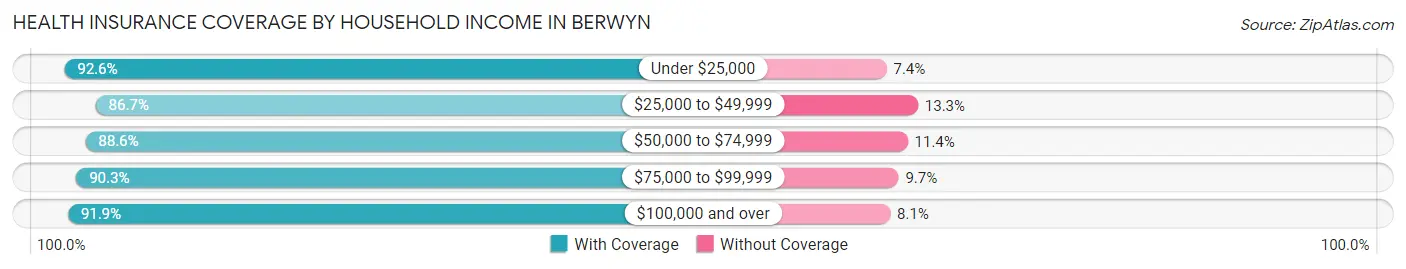
| Household Income | With Coverage | Without Coverage |
| Under $25,000 | 3,668 (92.6%) | 295 (7.4%) |
| $25,000 to $49,999 | 9,549 (86.7%) | 1,466 (13.3%) |
| $50,000 to $74,999 | 7,634 (88.6%) | 981 (11.4%) |
| $75,000 to $99,999 | 8,038 (90.3%) | 861 (9.7%) |
| $100,000 and over | 21,912 (91.9%) | 1,933 (8.1%) |
Public vs Private Health Insurance Coverage by Age in Berwyn
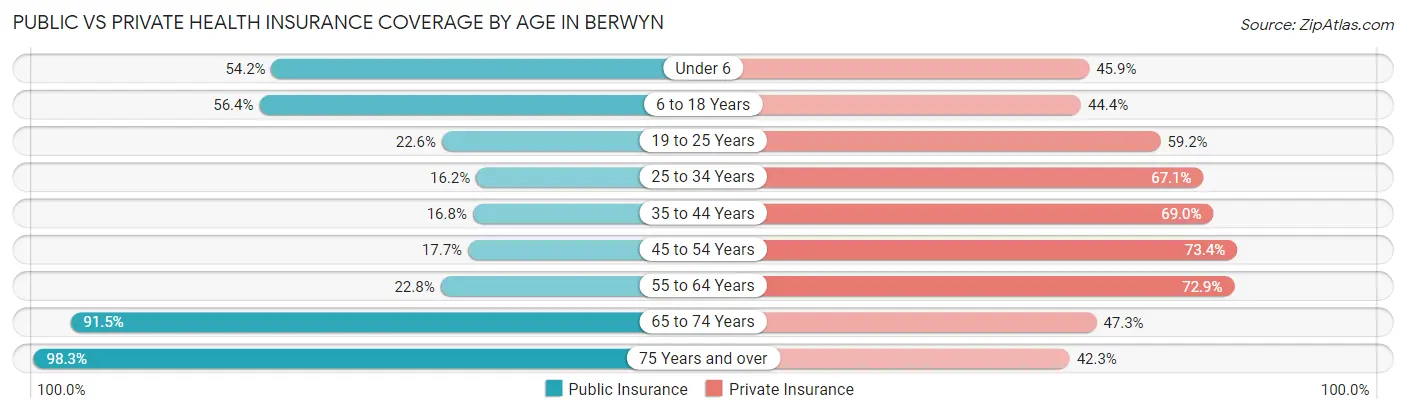
| Age Bracket | Public Insurance | Private Insurance |
| Under 6 | 2,089 (54.2%) | 1,771 (45.9%) |
| 6 to 18 Years | 6,086 (56.4%) | 4,789 (44.4%) |
| 19 to 25 Years | 1,161 (22.6%) | 3,044 (59.2%) |
| 25 to 34 Years | 1,153 (16.2%) | 4,775 (67.1%) |
| 35 to 44 Years | 1,507 (16.8%) | 6,179 (69.0%) |
| 45 to 54 Years | 1,211 (17.7%) | 5,015 (73.4%) |
| 55 to 64 Years | 1,520 (22.8%) | 4,855 (72.9%) |
| 65 to 74 Years | 4,053 (91.5%) | 2,094 (47.3%) |
| 75 Years and over | 2,629 (98.3%) | 1,131 (42.3%) |
| Total | 21,409 (37.9%) | 33,653 (59.6%) |
Disability Status by Sex by Age in Berwyn
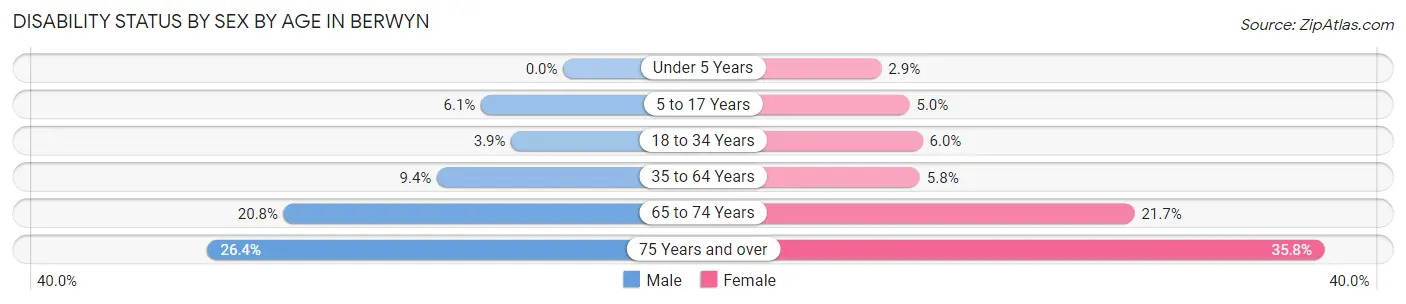
| Age Bracket | Male | Female |
| Under 5 Years | 0 (0.0%) | 55 (2.9%) |
| 5 to 17 Years | 363 (6.1%) | 238 (5.0%) |
| 18 to 34 Years | 260 (3.9%) | 365 (6.0%) |
| 35 to 64 Years | 1,080 (9.4%) | 634 (5.8%) |
| 65 to 74 Years | 434 (20.7%) | 508 (21.7%) |
| 75 Years and over | 290 (26.4%) | 564 (35.8%) |
Disability Class by Sex by Age in Berwyn
Disability Class: Hearing Difficulty
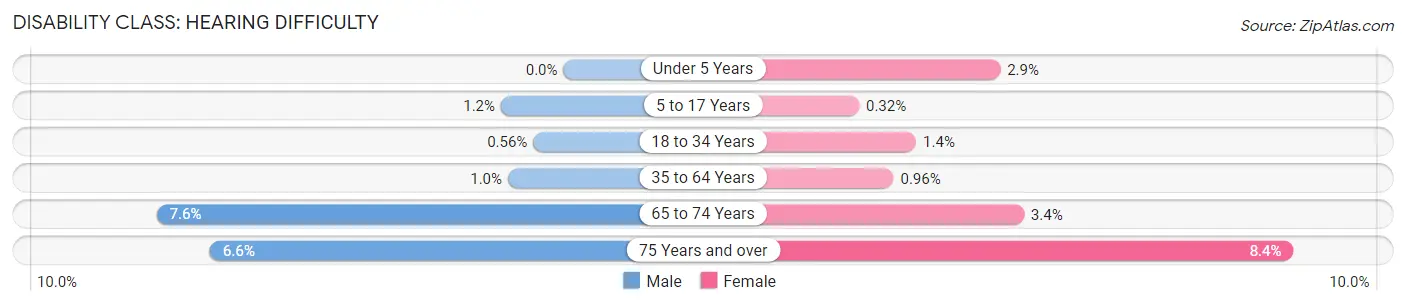
| Age Bracket | Male | Female |
| Under 5 Years | 0 (0.0%) | 55 (2.9%) |
| 5 to 17 Years | 69 (1.2%) | 15 (0.3%) |
| 18 to 34 Years | 38 (0.6%) | 84 (1.4%) |
| 35 to 64 Years | 119 (1.0%) | 105 (1.0%) |
| 65 to 74 Years | 158 (7.5%) | 79 (3.4%) |
| 75 Years and over | 72 (6.6%) | 132 (8.4%) |
Disability Class: Vision Difficulty
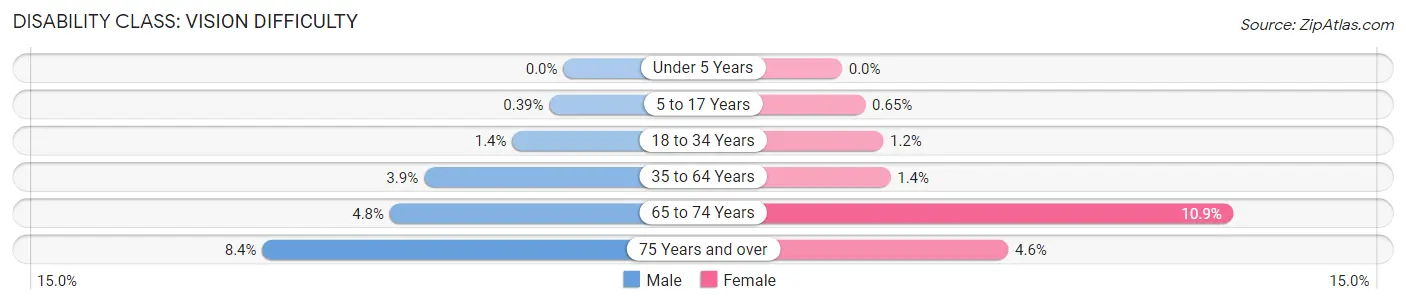
| Age Bracket | Male | Female |
| Under 5 Years | 0 (0.0%) | 0 (0.0%) |
| 5 to 17 Years | 23 (0.4%) | 31 (0.6%) |
| 18 to 34 Years | 96 (1.4%) | 70 (1.1%) |
| 35 to 64 Years | 447 (3.9%) | 148 (1.3%) |
| 65 to 74 Years | 101 (4.8%) | 255 (10.9%) |
| 75 Years and over | 92 (8.4%) | 73 (4.6%) |
Disability Class: Cognitive Difficulty
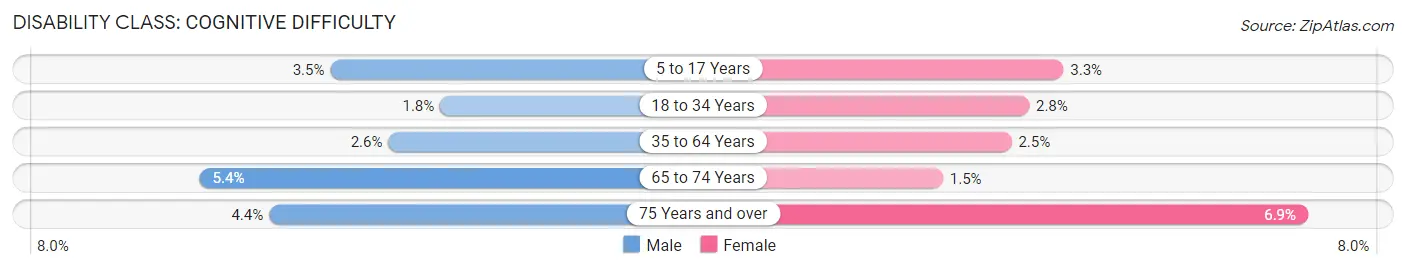
| Age Bracket | Male | Female |
| 5 to 17 Years | 206 (3.5%) | 156 (3.3%) |
| 18 to 34 Years | 123 (1.8%) | 169 (2.8%) |
| 35 to 64 Years | 300 (2.6%) | 276 (2.5%) |
| 65 to 74 Years | 113 (5.4%) | 35 (1.5%) |
| 75 Years and over | 48 (4.4%) | 109 (6.9%) |
Disability Class: Ambulatory Difficulty
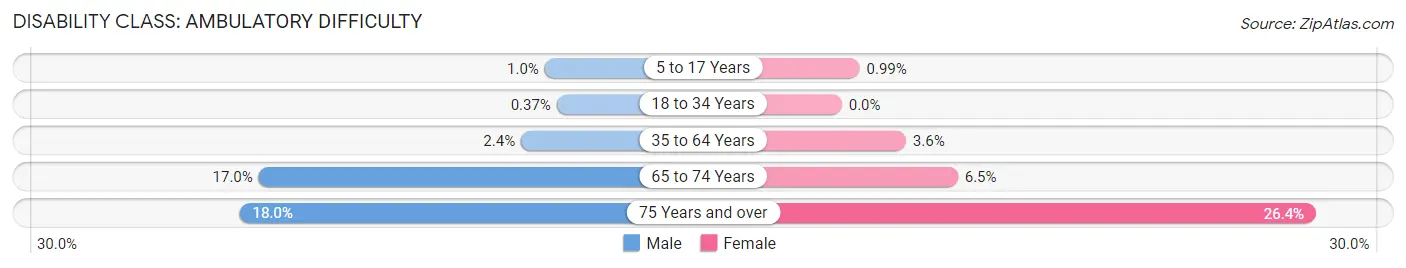
| Age Bracket | Male | Female |
| 5 to 17 Years | 62 (1.0%) | 47 (1.0%) |
| 18 to 34 Years | 25 (0.4%) | 0 (0.0%) |
| 35 to 64 Years | 272 (2.4%) | 390 (3.6%) |
| 65 to 74 Years | 355 (17.0%) | 151 (6.5%) |
| 75 Years and over | 198 (18.0%) | 416 (26.4%) |
Disability Class: Self-Care Difficulty
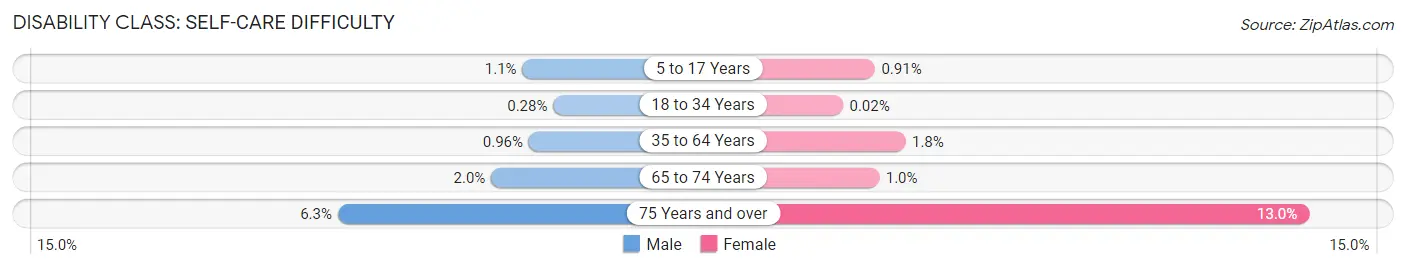
| Age Bracket | Male | Female |
| 5 to 17 Years | 68 (1.1%) | 43 (0.9%) |
| 18 to 34 Years | 19 (0.3%) | 1 (0.0%) |
| 35 to 64 Years | 111 (1.0%) | 193 (1.8%) |
| 65 to 74 Years | 42 (2.0%) | 24 (1.0%) |
| 75 Years and over | 69 (6.3%) | 205 (13.0%) |
Technology Access in Berwyn
Computing Device Access in Berwyn
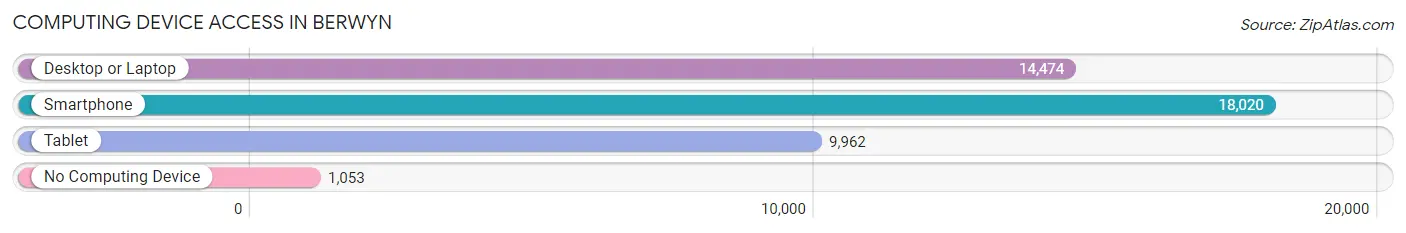
| Device Type | # Households | % Households |
| Desktop or Laptop | 14,474 | 72.7% |
| Smartphone | 18,020 | 90.5% |
| Tablet | 9,962 | 50.0% |
| No Computing Device | 1,053 | 5.3% |
| Total | 19,904 | 100.0% |
Internet Access in Berwyn
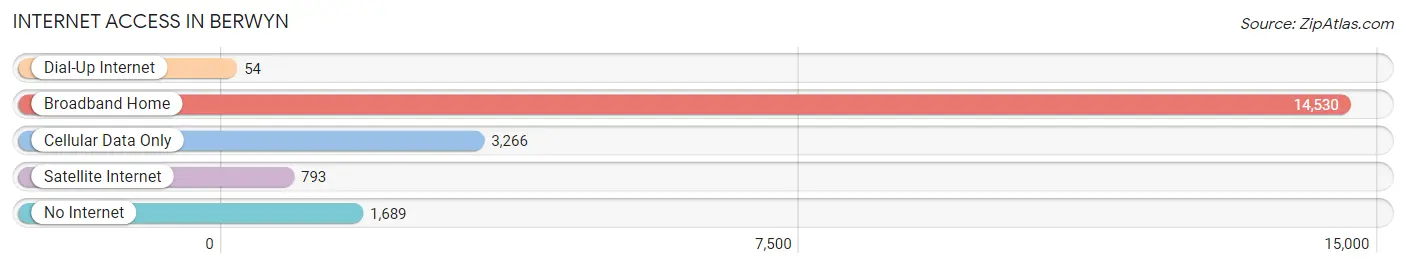
| Internet Type | # Households | % Households |
| Dial-Up Internet | 54 | 0.3% |
| Broadband Home | 14,530 | 73.0% |
| Cellular Data Only | 3,266 | 16.4% |
| Satellite Internet | 793 | 4.0% |
| No Internet | 1,689 | 8.5% |
| Total | 19,904 | 100.0% |
Berwyn Summary
Berwyn, Illinois is a city located in Cook County, Illinois, United States. It is a suburb of Chicago, located approximately 14 miles west of the city. As of the 2010 census, the population of Berwyn was 56,657.
History
Berwyn was first settled in the late 19th century by German and Irish immigrants. The area was originally known as LaVergne, but was renamed Berwyn in 1908 after a small town in Wales. The city was officially incorporated in 1914.
Berwyn was a major industrial center in the early 20th century, with many factories and businesses located in the city. The city was also home to a large number of immigrants, including Italians, Poles, and Czechs.
In the 1950s, the city began to experience a decline in its industrial base, and many of the factories and businesses closed. This led to a period of economic decline and population loss.
In the late 1970s, the city began to experience a resurgence, as new businesses and industries moved into the city. This led to a period of economic growth and population growth.
Geography
Berwyn is located in northeastern Illinois, approximately 14 miles west of Chicago. The city is situated on the Des Plaines River, and is bordered by Cicero to the north, Oak Park to the east, Riverside to the south, and Stickney to the west.
The city has a total area of 5.2 square miles, of which 5.1 square miles is land and 0.1 square miles is water.
Economy
Berwyn’s economy is largely based on manufacturing and retail. The city is home to a number of factories and businesses, including the Berwyn Manufacturing Company, the Berwyn Tool Company, and the Berwyn Paper Company.
The city is also home to a number of retail stores, including the Berwyn Mall, the Berwyn Shopping Center, and the Berwyn Plaza.
Demographics
As of the 2010 census, the population of Berwyn was 56,657. The racial makeup of the city was 68.2% White, 17.2% African American, 0.3% Native American, 4.2% Asian, 0.1% Pacific Islander, 6.3% from other races, and 3.7% from two or more races. Hispanic or Latino of any race were 22.2% of the population.
The median income for a household in the city was $45,945, and the median income for a family was $54,945. The per capita income for the city was $22,945. About 11.2% of families and 14.2% of the population were below the poverty line, including 19.2% of those under age 18 and 8.2% of those age 65 or over.
Common Questions
What is Per Capita Income in Berwyn?
Per Capita income in Berwyn is $31,736.
What is the Median Family Income in Berwyn?
Median Family Income in Berwyn is $86,322.
What is the Median Household income in Berwyn?
Median Household Income in Berwyn is $71,300.
What is Income or Wage Gap in Berwyn?
Income or Wage Gap in Berwyn is 16.0%.
Women in Berwyn earn 84.0 cents for every dollar earned by a man.
What is Family Income Deficit in Berwyn?
Family Income Deficit in Berwyn is $5,984.
Families that are below poverty line in Berwyn earn $5,984 less on average than the poverty threshold level.
What is Inequality or Gini Index in Berwyn?
Inequality or Gini Index in Berwyn is 0.41.
What is the Total Population of Berwyn?
Total Population of Berwyn is 56,556.
What is the Total Male Population of Berwyn?
Total Male Population of Berwyn is 28,971.
What is the Total Female Population of Berwyn?
Total Female Population of Berwyn is 27,585.
What is the Ratio of Males per 100 Females in Berwyn?
There are 105.02 Males per 100 Females in Berwyn.
What is the Ratio of Females per 100 Males in Berwyn?
There are 95.22 Females per 100 Males in Berwyn.
What is the Median Population Age in Berwyn?
Median Population Age in Berwyn is 36.3 Years.
What is the Average Family Size in Berwyn
Average Family Size in Berwyn is 3.5 People.
What is the Average Household Size in Berwyn
Average Household Size in Berwyn is 2.8 People.
How Large is the Labor Force in Berwyn?
There are 30,316 People in the Labor Forcein in Berwyn.
What is the Percentage of People in the Labor Force in Berwyn?
68.4% of People are in the Labor Force in Berwyn.
What is the Unemployment Rate in Berwyn?
Unemployment Rate in Berwyn is 5.0%.