Scottsdale, AZ Map & Demographics
Scottsdale Map
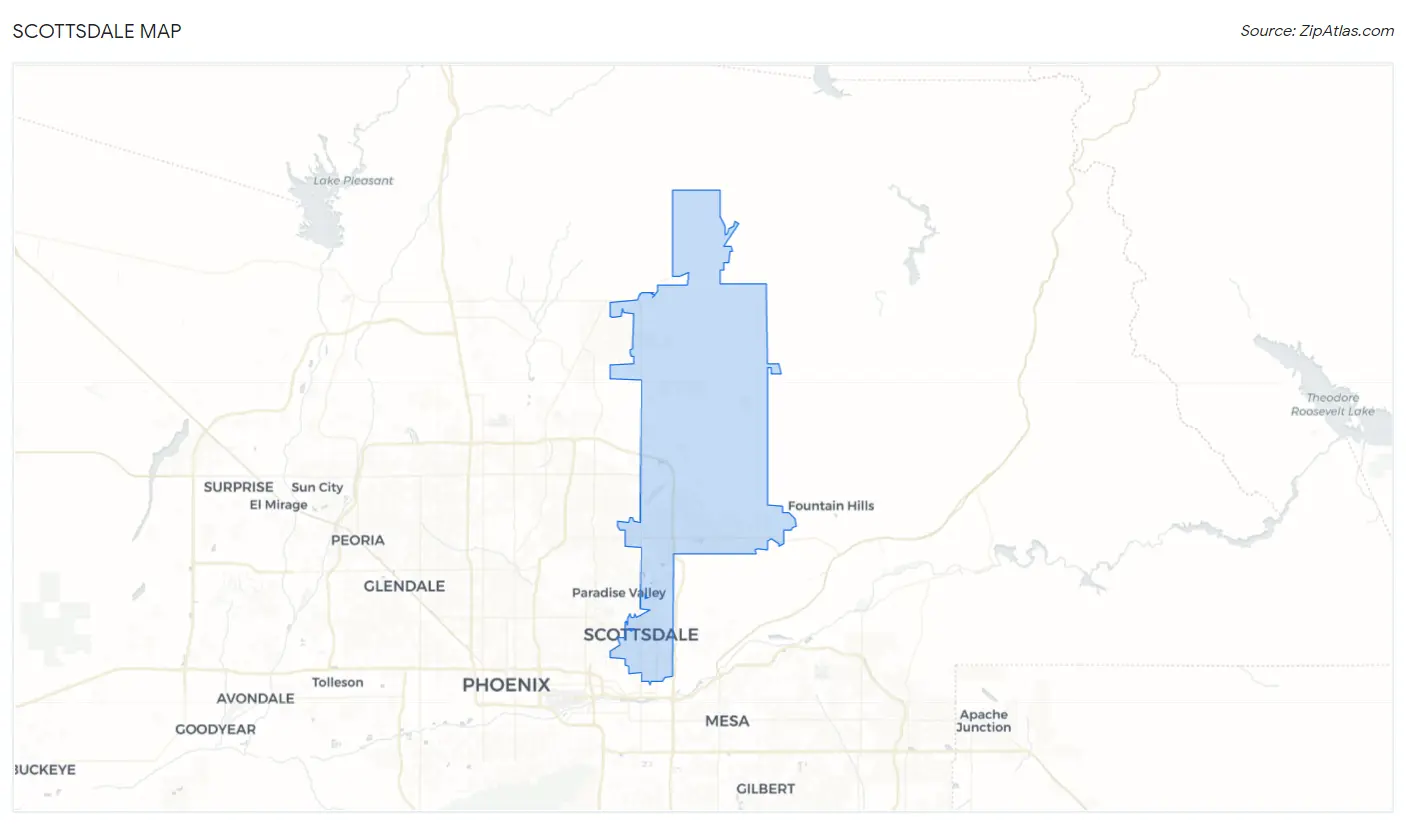
Scottsdale Overview
$77,594
PER CAPITA INCOME
$140,883
AVG FAMILY INCOME
$104,197
AVG HOUSEHOLD INCOME
30.7%
WAGE / INCOME GAP [ % ]
69.3¢/ $1
WAGE / INCOME GAP [ $ ]
$13,410
FAMILY INCOME DEFICIT
0.51
INEQUALITY / GINI INDEX
240,537
TOTAL POPULATION
117,177
MALE POPULATION
123,360
FEMALE POPULATION
94.99
MALES / 100 FEMALES
105.28
FEMALES / 100 MALES
48.4
MEDIAN AGE
2.7
AVG FAMILY SIZE
2.1
AVG HOUSEHOLD SIZE
131,529
LABOR FORCE [ PEOPLE ]
62.4%
PERCENT IN LABOR FORCE
3.5%
UNEMPLOYMENT RATE
Income in Scottsdale
Income Overview in Scottsdale
Per Capita Income in Scottsdale is $77,594, while median incomes of families and households are $140,883 and $104,197 respectively.
| Characteristic | Number | Measure |
| Per Capita Income | 240,537 | $77,594 |
| Median Family Income | 63,045 | $140,883 |
| Mean Family Income | 63,045 | $203,879 |
| Median Household Income | 115,826 | $104,197 |
| Mean Household Income | 115,826 | $159,871 |
| Income Deficit | 63,045 | $13,410 |
| Wage / Income Gap (%) | 240,537 | 30.74% |
| Wage / Income Gap ($) | 240,537 | 69.26¢ per $1 |
| Gini / Inequality Index | 240,537 | 0.51 |
Earnings by Sex in Scottsdale
Average Earnings in Scottsdale are $62,805, $77,840 for men and $53,915 for women, a difference of 30.7%.
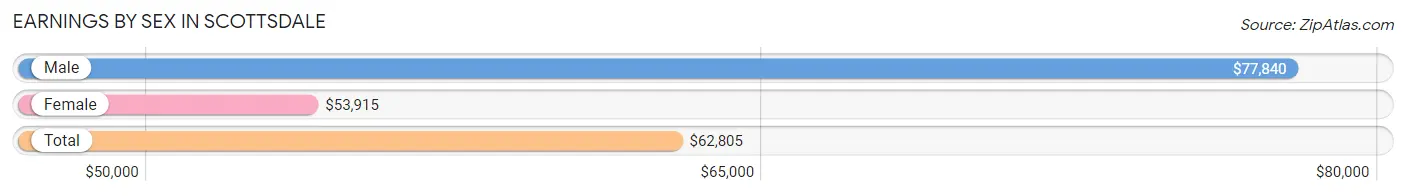
| Sex | Number | Average Earnings |
| Male | 72,843 (53.3%) | $77,840 |
| Female | 63,816 (46.7%) | $53,915 |
| Total | 136,659 (100.0%) | $62,805 |
Earnings by Sex by Income Bracket in Scottsdale
The most common earnings brackets in Scottsdale are $100,000+ for men (28,880 | 39.7%) and $100,000+ for women (13,152 | 20.6%).
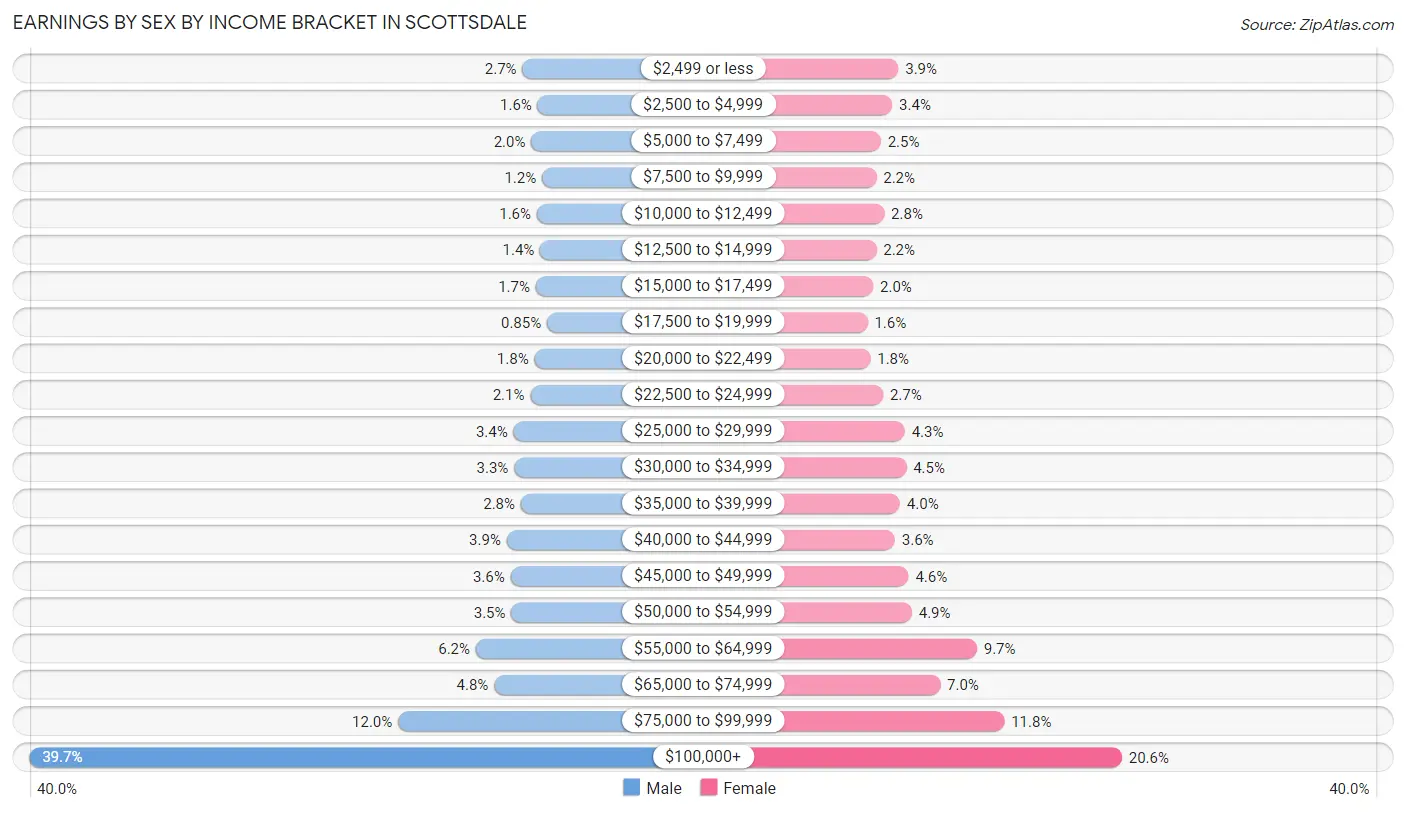
| Income | Male | Female |
| $2,499 or less | 1,962 (2.7%) | 2,462 (3.9%) |
| $2,500 to $4,999 | 1,128 (1.5%) | 2,167 (3.4%) |
| $5,000 to $7,499 | 1,478 (2.0%) | 1,621 (2.5%) |
| $7,500 to $9,999 | 890 (1.2%) | 1,411 (2.2%) |
| $10,000 to $12,499 | 1,175 (1.6%) | 1,787 (2.8%) |
| $12,500 to $14,999 | 989 (1.4%) | 1,411 (2.2%) |
| $15,000 to $17,499 | 1,228 (1.7%) | 1,254 (2.0%) |
| $17,500 to $19,999 | 618 (0.9%) | 990 (1.5%) |
| $20,000 to $22,499 | 1,307 (1.8%) | 1,120 (1.8%) |
| $22,500 to $24,999 | 1,530 (2.1%) | 1,727 (2.7%) |
| $25,000 to $29,999 | 2,449 (3.4%) | 2,769 (4.3%) |
| $30,000 to $34,999 | 2,412 (3.3%) | 2,839 (4.4%) |
| $35,000 to $39,999 | 2,044 (2.8%) | 2,537 (4.0%) |
| $40,000 to $44,999 | 2,822 (3.9%) | 2,300 (3.6%) |
| $45,000 to $49,999 | 2,607 (3.6%) | 2,949 (4.6%) |
| $50,000 to $54,999 | 2,565 (3.5%) | 3,108 (4.9%) |
| $55,000 to $64,999 | 4,502 (6.2%) | 6,216 (9.7%) |
| $65,000 to $74,999 | 3,505 (4.8%) | 4,463 (7.0%) |
| $75,000 to $99,999 | 8,752 (12.0%) | 7,533 (11.8%) |
| $100,000+ | 28,880 (39.7%) | 13,152 (20.6%) |
| Total | 72,843 (100.0%) | 63,816 (100.0%) |
Earnings by Sex by Educational Attainment in Scottsdale
Average earnings in Scottsdale are $86,606 for men and $58,424 for women, a difference of 32.5%. Men with an educational attainment of graduate degree enjoy the highest average annual earnings of $129,302, while those with less than high school education earn the least with $30,601. Women with an educational attainment of graduate degree earn the most with the average annual earnings of $81,556, while those with less than high school education have the smallest earnings of $28,979.
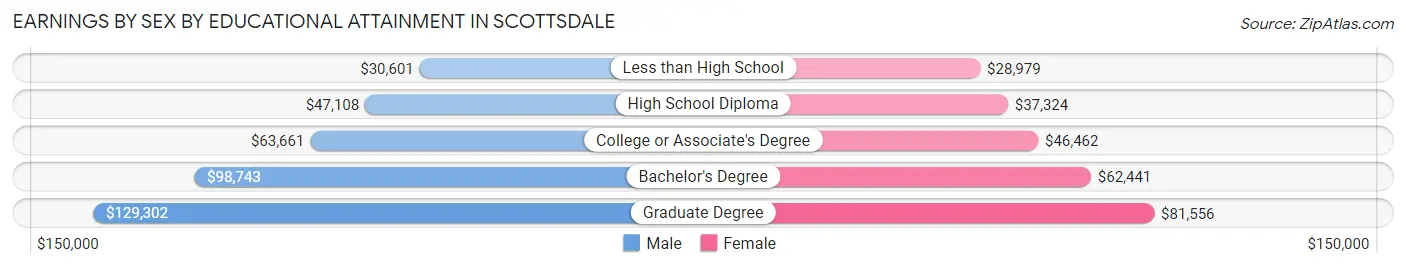
| Educational Attainment | Male Income | Female Income |
| Less than High School | $30,601 | $28,979 |
| High School Diploma | $47,108 | $37,324 |
| College or Associate's Degree | $63,661 | $46,462 |
| Bachelor's Degree | $98,743 | $62,441 |
| Graduate Degree | $129,302 | $81,556 |
| Total | $86,606 | $58,424 |
Family Income in Scottsdale
Family Income Brackets in Scottsdale
According to the Scottsdale family income data, there are 21,057 families falling into the $200,000+ income range, which is the most common income bracket and makes up 33.4% of all families. Conversely, the $10,000 to $14,999 income bracket is the least frequent group with only 441 families (0.7%) belonging to this category.
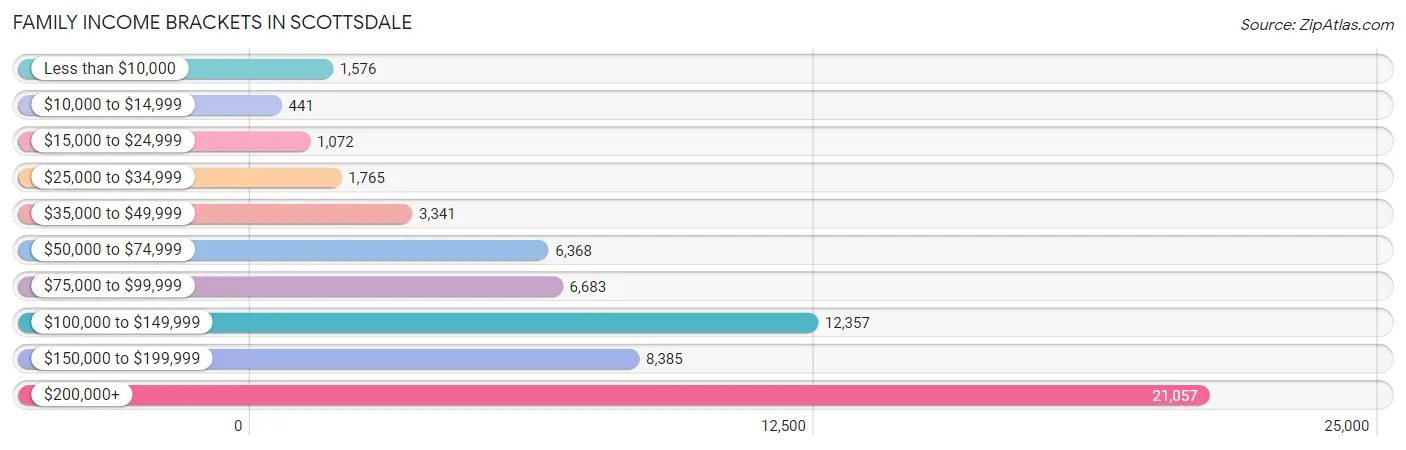
| Income Bracket | # Families | % Families |
| Less than $10,000 | 1,576 | 2.5% |
| $10,000 to $14,999 | 441 | 0.7% |
| $15,000 to $24,999 | 1,072 | 1.7% |
| $25,000 to $34,999 | 1,765 | 2.8% |
| $35,000 to $49,999 | 3,341 | 5.3% |
| $50,000 to $74,999 | 6,368 | 10.1% |
| $75,000 to $99,999 | 6,683 | 10.6% |
| $100,000 to $149,999 | 12,357 | 19.6% |
| $150,000 to $199,999 | 8,385 | 13.3% |
| $200,000+ | 21,057 | 33.4% |
Family Income by Famaliy Size in Scottsdale
4-person families (9,047 | 14.3%) account for the highest median family income in Scottsdale with $198,516 per family, while 2-person families (39,962 | 63.4%) have the highest median income of $63,382 per family member.
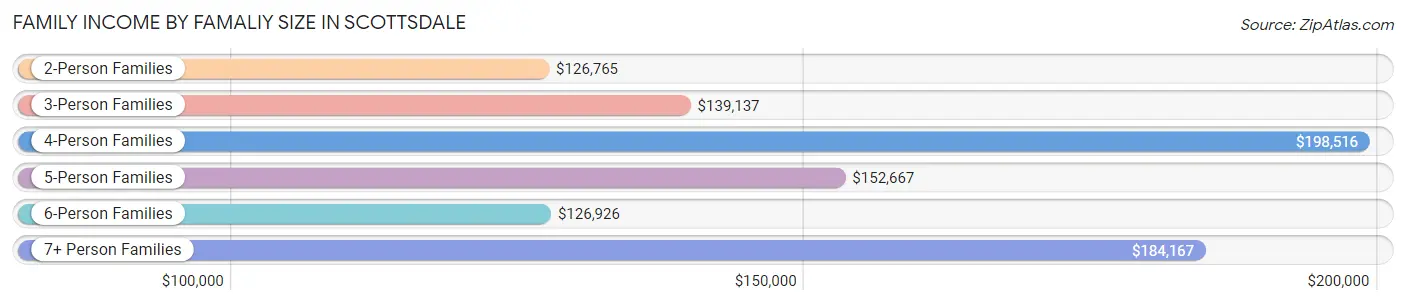
| Income Bracket | # Families | Median Income |
| 2-Person Families | 39,962 (63.4%) | $126,765 |
| 3-Person Families | 10,306 (16.4%) | $139,137 |
| 4-Person Families | 9,047 (14.3%) | $198,516 |
| 5-Person Families | 2,670 (4.2%) | $152,667 |
| 6-Person Families | 714 (1.1%) | $126,926 |
| 7+ Person Families | 346 (0.5%) | $184,167 |
| Total | 63,045 (100.0%) | $140,883 |
Family Income by Number of Earners in Scottsdale
The median family income in Scottsdale is $140,883, with families comprising 3+ earners (4,490) having the highest median family income of $195,515, while families with no earners (14,085) have the lowest median family income of $88,298, accounting for 7.1% and 22.3% of families, respectively.
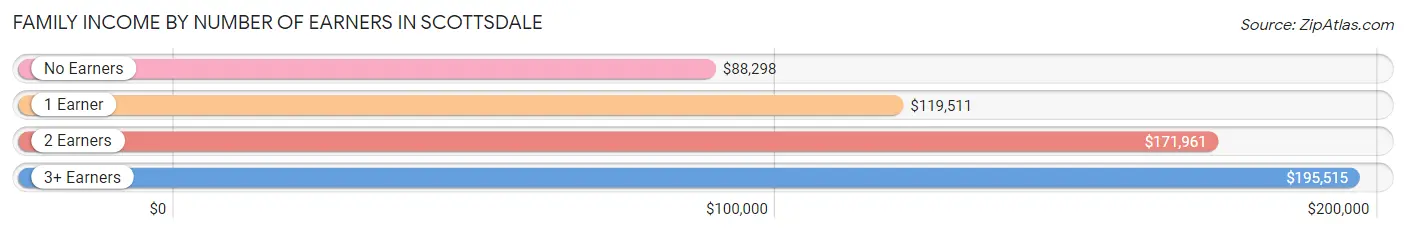
| Number of Earners | # Families | Median Income |
| No Earners | 14,085 (22.3%) | $88,298 |
| 1 Earner | 19,786 (31.4%) | $119,511 |
| 2 Earners | 24,684 (39.2%) | $171,961 |
| 3+ Earners | 4,490 (7.1%) | $195,515 |
| Total | 63,045 (100.0%) | $140,883 |
Household Income in Scottsdale
Household Income Brackets in Scottsdale
With 26,987 households falling in the category, the $200,000+ income range is the most frequent in Scottsdale, accounting for 23.3% of all households. In contrast, only 2,085 households (1.8%) fall into the $10,000 to $14,999 income bracket, making it the least populous group.
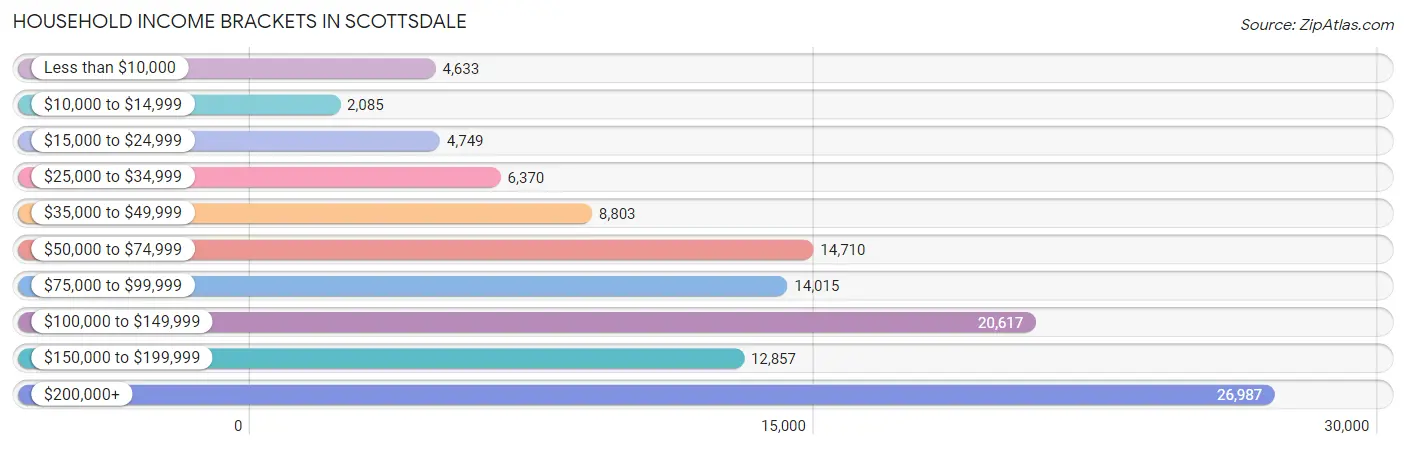
| Income Bracket | # Households | % Households |
| Less than $10,000 | 4,633 | 4.0% |
| $10,000 to $14,999 | 2,085 | 1.8% |
| $15,000 to $24,999 | 4,749 | 4.1% |
| $25,000 to $34,999 | 6,370 | 5.5% |
| $35,000 to $49,999 | 8,803 | 7.6% |
| $50,000 to $74,999 | 14,710 | 12.7% |
| $75,000 to $99,999 | 14,015 | 12.1% |
| $100,000 to $149,999 | 20,617 | 17.8% |
| $150,000 to $199,999 | 12,857 | 11.1% |
| $200,000+ | 26,987 | 23.3% |
Household Income by Householder Age in Scottsdale
The median household income in Scottsdale is $104,197, with the highest median household income of $134,015 found in the 45 to 64 years age bracket for the primary householder. A total of 41,250 households (35.6%) fall into this category. Meanwhile, the 15 to 24 years age bracket for the primary householder has the lowest median household income of $66,110, with 4,371 households (3.8%) in this group.
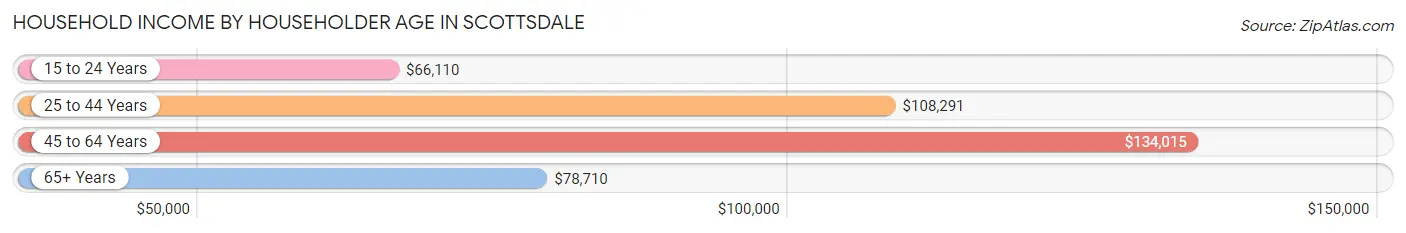
| Income Bracket | # Households | Median Income |
| 15 to 24 Years | 4,371 (3.8%) | $66,110 |
| 25 to 44 Years | 32,440 (28.0%) | $108,291 |
| 45 to 64 Years | 41,250 (35.6%) | $134,015 |
| 65+ Years | 37,765 (32.6%) | $78,710 |
| Total | 115,826 (100.0%) | $104,197 |
Poverty in Scottsdale
Income Below Poverty by Sex and Age in Scottsdale
With 5.8% poverty level for males and 7.7% for females among the residents of Scottsdale, 18 to 24 year old males and 18 to 24 year old females are the most vulnerable to poverty, with 1,018 males (12.4%) and 1,146 females (13.2%) in their respective age groups living below the poverty level.
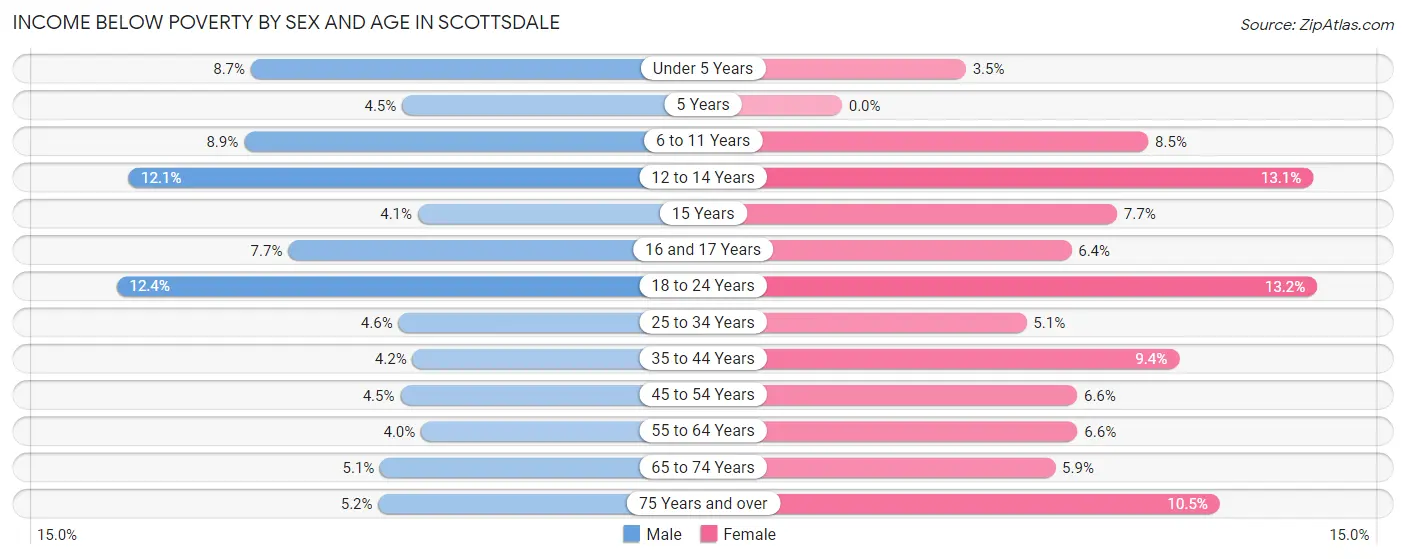
| Age Bracket | Male | Female |
| Under 5 Years | 360 (8.7%) | 133 (3.5%) |
| 5 Years | 34 (4.5%) | 0 (0.0%) |
| 6 to 11 Years | 506 (8.9%) | 432 (8.5%) |
| 12 to 14 Years | 407 (12.1%) | 465 (13.1%) |
| 15 Years | 62 (4.1%) | 79 (7.7%) |
| 16 and 17 Years | 196 (7.7%) | 130 (6.4%) |
| 18 to 24 Years | 1,018 (12.4%) | 1,146 (13.2%) |
| 25 to 34 Years | 784 (4.6%) | 805 (5.1%) |
| 35 to 44 Years | 542 (4.2%) | 1,259 (9.4%) |
| 45 to 54 Years | 709 (4.5%) | 1,086 (6.6%) |
| 55 to 64 Years | 714 (4.0%) | 1,265 (6.6%) |
| 65 to 74 Years | 745 (5.1%) | 969 (5.9%) |
| 75 Years and over | 622 (5.1%) | 1,714 (10.5%) |
| Total | 6,699 (5.8%) | 9,483 (7.7%) |
Income Above Poverty by Sex and Age in Scottsdale
According to the poverty statistics in Scottsdale, males aged 55 to 64 years and females aged 5 years are the age groups that are most secure financially, with 96.0% of males and 100.0% of females in these age groups living above the poverty line.
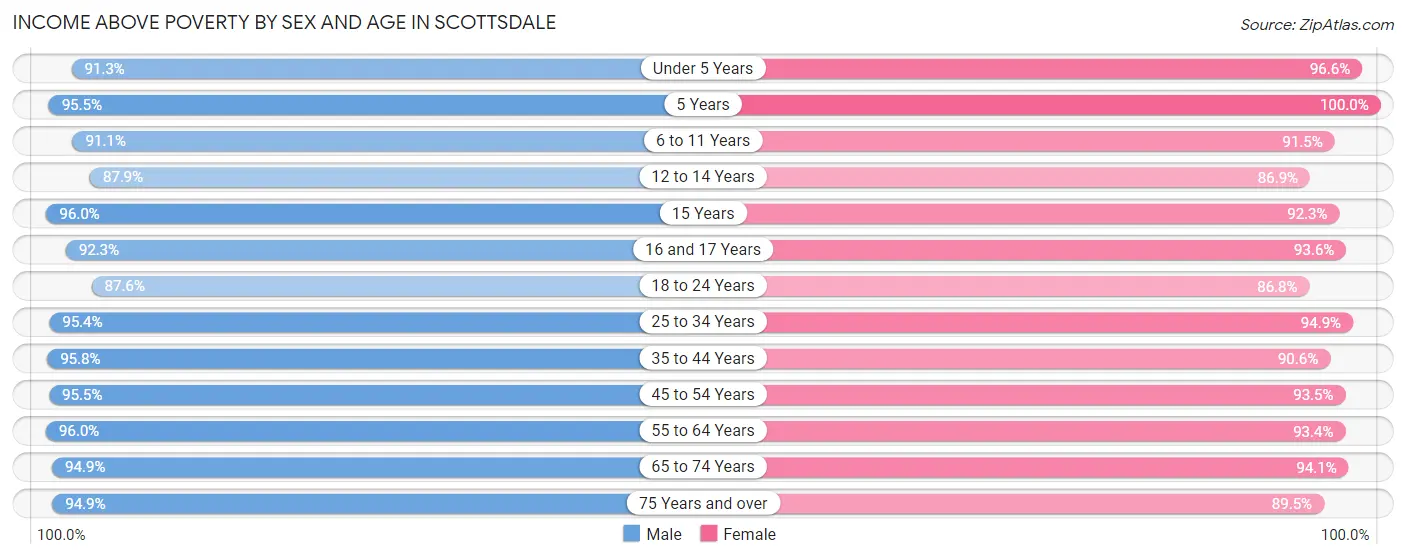
| Age Bracket | Male | Female |
| Under 5 Years | 3,779 (91.3%) | 3,722 (96.6%) |
| 5 Years | 723 (95.5%) | 632 (100.0%) |
| 6 to 11 Years | 5,188 (91.1%) | 4,635 (91.5%) |
| 12 to 14 Years | 2,952 (87.9%) | 3,080 (86.9%) |
| 15 Years | 1,470 (96.0%) | 952 (92.3%) |
| 16 and 17 Years | 2,363 (92.3%) | 1,903 (93.6%) |
| 18 to 24 Years | 7,165 (87.6%) | 7,518 (86.8%) |
| 25 to 34 Years | 16,282 (95.4%) | 14,852 (94.9%) |
| 35 to 44 Years | 12,359 (95.8%) | 12,156 (90.6%) |
| 45 to 54 Years | 14,901 (95.5%) | 15,494 (93.4%) |
| 55 to 64 Years | 17,339 (96.0%) | 18,016 (93.4%) |
| 65 to 74 Years | 13,876 (94.9%) | 15,333 (94.1%) |
| 75 Years and over | 11,459 (94.9%) | 14,582 (89.5%) |
| Total | 109,856 (94.3%) | 112,875 (92.2%) |
Income Below Poverty Among Married-Couple Families in Scottsdale
The poverty statistics for married-couple families in Scottsdale show that 2.6% or 1,337 of the total 51,746 families live below the poverty line. Families with 3 or 4 children have the highest poverty rate of 4.8%, comprising of 87 families. On the other hand, families with 5 or more children have the lowest poverty rate of 0.0%, which includes 0 families.
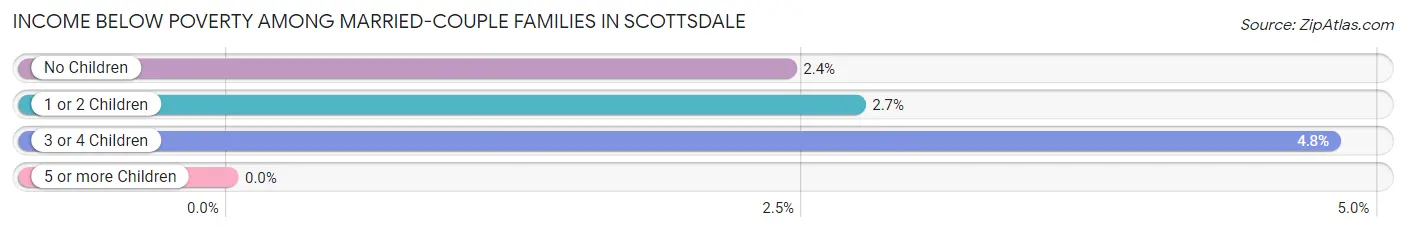
| Children | Above Poverty | Below Poverty |
| No Children | 36,348 (97.6%) | 906 (2.4%) |
| 1 or 2 Children | 12,234 (97.3%) | 344 (2.7%) |
| 3 or 4 Children | 1,727 (95.2%) | 87 (4.8%) |
| 5 or more Children | 100 (100.0%) | 0 (0.0%) |
| Total | 50,409 (97.4%) | 1,337 (2.6%) |
Income Below Poverty Among Single-Parent Households in Scottsdale
According to the poverty data in Scottsdale, 4.9% or 147 single-father households and 14.2% or 1,180 single-mother households are living below the poverty line. Among single-father households, those with 1 or 2 children have the highest poverty rate, with 109 households (8.5%) experiencing poverty. Likewise, among single-mother households, those with 3 or 4 children have the highest poverty rate, with 323 households (55.4%) falling below the poverty line.
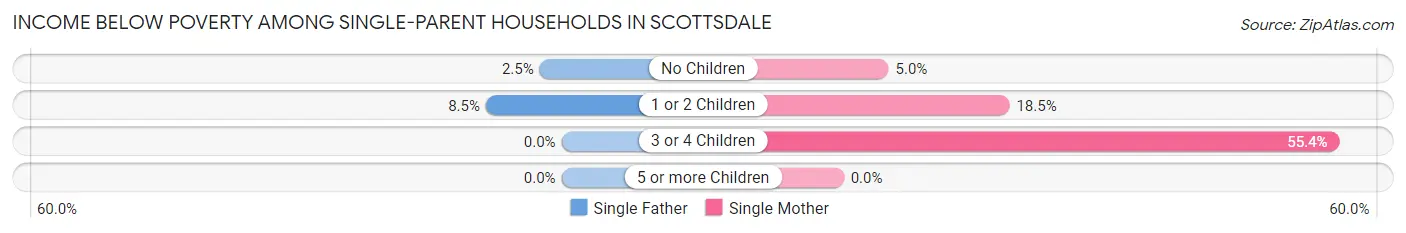
| Children | Single Father | Single Mother |
| No Children | 38 (2.5%) | 212 (5.0%) |
| 1 or 2 Children | 109 (8.5%) | 645 (18.5%) |
| 3 or 4 Children | 0 (0.0%) | 323 (55.4%) |
| 5 or more Children | 0 (0.0%) | 0 (0.0%) |
| Total | 147 (4.9%) | 1,180 (14.2%) |
Income Below Poverty Among Married-Couple vs Single-Parent Households in Scottsdale
The poverty data for Scottsdale shows that 1,337 of the married-couple family households (2.6%) and 1,327 of the single-parent households (11.7%) are living below the poverty level. Within the married-couple family households, those with 3 or 4 children have the highest poverty rate, with 87 households (4.8%) falling below the poverty line. Among the single-parent households, those with 3 or 4 children have the highest poverty rate, with 323 household (45.9%) living below poverty.
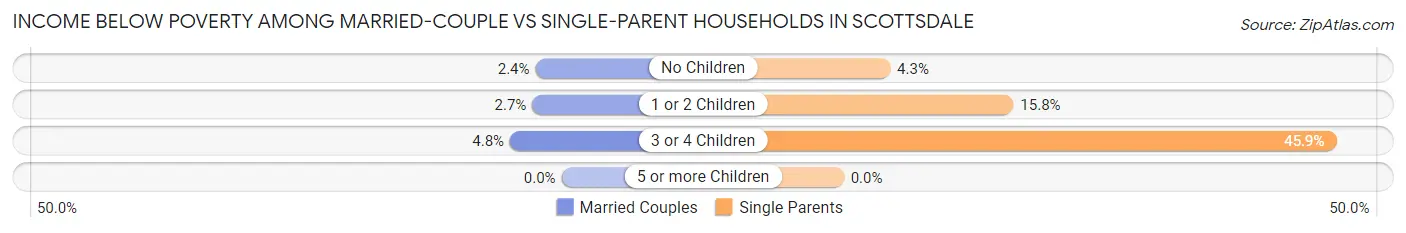
| Children | Married-Couple Families | Single-Parent Households |
| No Children | 906 (2.4%) | 250 (4.3%) |
| 1 or 2 Children | 344 (2.7%) | 754 (15.8%) |
| 3 or 4 Children | 87 (4.8%) | 323 (45.9%) |
| 5 or more Children | 0 (0.0%) | 0 (0.0%) |
| Total | 1,337 (2.6%) | 1,327 (11.7%) |
Race in Scottsdale
The most populous races in Scottsdale are White / Caucasian (199,701 | 83.0%), Hispanic or Latino (25,081 | 10.4%), and Two or more Races (16,460 | 6.8%).
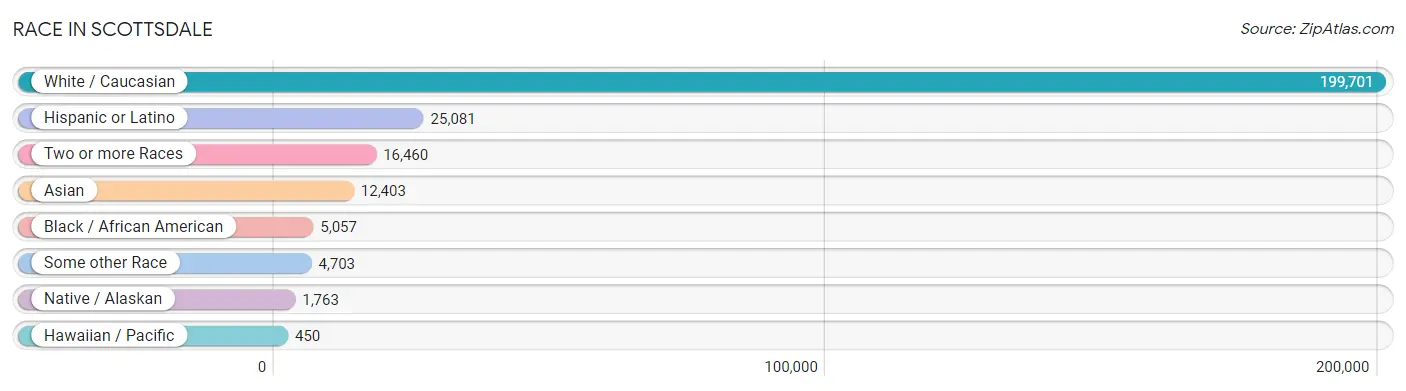
| Race | # Population | % Population |
| Asian | 12,403 | 5.2% |
| Black / African American | 5,057 | 2.1% |
| Hawaiian / Pacific | 450 | 0.2% |
| Hispanic or Latino | 25,081 | 10.4% |
| Native / Alaskan | 1,763 | 0.7% |
| White / Caucasian | 199,701 | 83.0% |
| Two or more Races | 16,460 | 6.8% |
| Some other Race | 4,703 | 2.0% |
| Total | 240,537 | 100.0% |
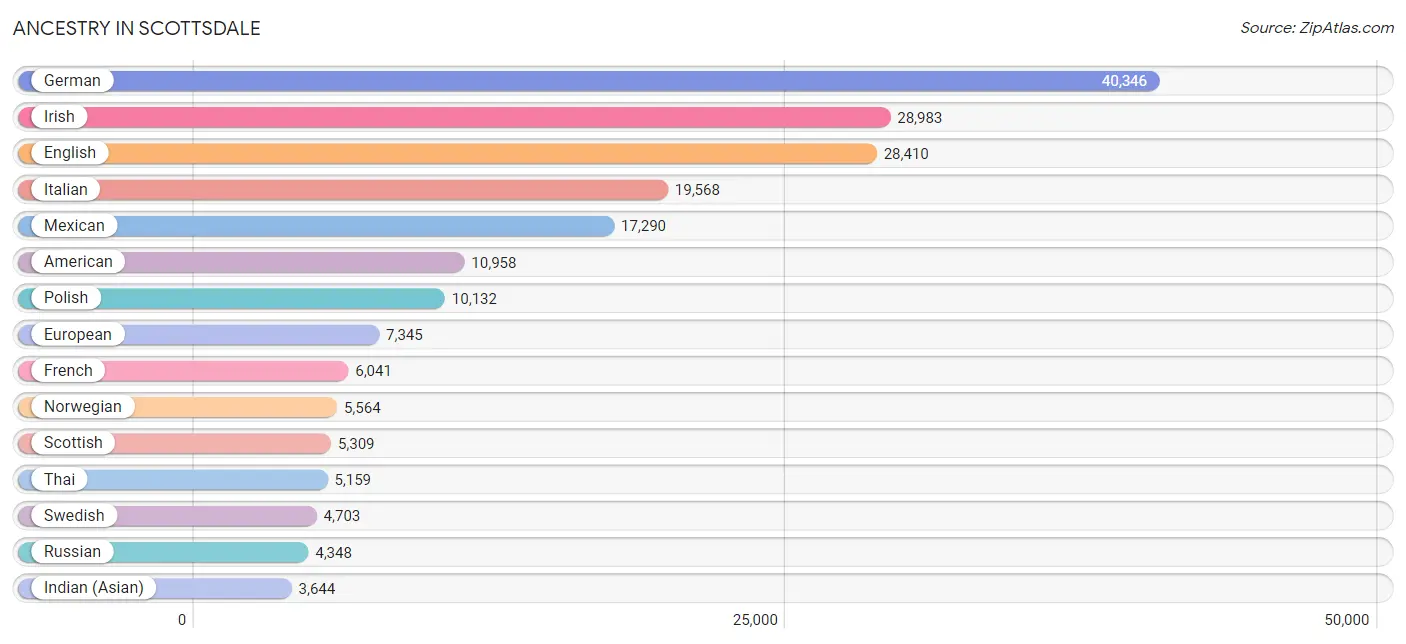
Ancestry in Scottsdale
The most populous ancestries reported in Scottsdale are German (40,346 | 16.8%), Irish (28,983 | 12.0%), English (28,410 | 11.8%), Italian (19,568 | 8.1%), and Mexican (17,290 | 7.2%), together accounting for 56.0% of all Scottsdale residents.
| Ancestry | # Population | % Population |
| Afghan | 51 | 0.0% |
| African | 682 | 0.3% |
| Albanian | 320 | 0.1% |
| American | 10,958 | 4.6% |
| Apache | 279 | 0.1% |
| Arab | 2,288 | 0.9% |
| Argentinean | 473 | 0.2% |
| Armenian | 545 | 0.2% |
| Assyrian / Chaldean / Syriac | 216 | 0.1% |
| Australian | 249 | 0.1% |
| Austrian | 1,019 | 0.4% |
| Barbadian | 14 | 0.0% |
| Basque | 69 | 0.0% |
| Belgian | 353 | 0.2% |
| Bhutanese | 1,044 | 0.4% |
| Blackfeet | 95 | 0.0% |
| Bolivian | 37 | 0.0% |
| Brazilian | 198 | 0.1% |
| British | 2,339 | 1.0% |
| Bulgarian | 248 | 0.1% |
| Burmese | 1,894 | 0.8% |
| Cajun | 16 | 0.0% |
| Canadian | 1,030 | 0.4% |
| Celtic | 69 | 0.0% |
| Central American | 1,274 | 0.5% |
| Central American Indian | 129 | 0.1% |
| Cherokee | 424 | 0.2% |
| Chilean | 215 | 0.1% |
| Chippewa | 1 | 0.0% |
| Choctaw | 270 | 0.1% |
| Colombian | 418 | 0.2% |
| Costa Rican | 198 | 0.1% |
| Cree | 11 | 0.0% |
| Creek | 43 | 0.0% |
| Croatian | 772 | 0.3% |
| Crow | 1 | 0.0% |
| Cuban | 280 | 0.1% |
| Cypriot | 54 | 0.0% |
| Czech | 1,927 | 0.8% |
| Czechoslovakian | 552 | 0.2% |
| Danish | 1,542 | 0.6% |
| Dominican | 219 | 0.1% |
| Dutch | 3,523 | 1.5% |
| Eastern European | 1,764 | 0.7% |
| Ecuadorian | 174 | 0.1% |
| Egyptian | 89 | 0.0% |
| English | 28,410 | 11.8% |
| Estonian | 89 | 0.0% |
| Ethiopian | 513 | 0.2% |
| European | 7,345 | 3.0% |
| Filipino | 142 | 0.1% |
| Finnish | 488 | 0.2% |
| French | 6,041 | 2.5% |
| French American Indian | 4 | 0.0% |
| French Canadian | 1,415 | 0.6% |
| German | 40,346 | 16.8% |
| Greek | 2,283 | 0.9% |
| Guamanian / Chamorro | 178 | 0.1% |
| Guatemalan | 175 | 0.1% |
| Haitian | 83 | 0.0% |
| Honduran | 64 | 0.0% |
| Hopi | 59 | 0.0% |
| Hungarian | 1,608 | 0.7% |
| Icelander | 44 | 0.0% |
| Indian (Asian) | 3,644 | 1.5% |
| Indonesian | 11 | 0.0% |
| Inupiat | 10 | 0.0% |
| Iranian | 1,646 | 0.7% |
| Iraqi | 93 | 0.0% |
| Irish | 28,983 | 12.0% |
| Iroquois | 6 | 0.0% |
| Israeli | 205 | 0.1% |
| Italian | 19,568 | 8.1% |
| Jamaican | 152 | 0.1% |
| Japanese | 72 | 0.0% |
| Jordanian | 149 | 0.1% |
| Kenyan | 65 | 0.0% |
| Korean | 1,883 | 0.8% |
| Laotian | 104 | 0.0% |
| Latvian | 112 | 0.1% |
| Lebanese | 915 | 0.4% |
| Liberian | 57 | 0.0% |
| Lithuanian | 947 | 0.4% |
| Luxembourger | 133 | 0.1% |
| Macedonian | 123 | 0.1% |
| Malaysian | 202 | 0.1% |
| Maltese | 19 | 0.0% |
| Mexican | 17,290 | 7.2% |
| Mexican American Indian | 209 | 0.1% |
| Mongolian | 70 | 0.0% |
| Moroccan | 41 | 0.0% |
| Native Hawaiian | 451 | 0.2% |
| Navajo | 580 | 0.2% |
| New Zealander | 14 | 0.0% |
| Nicaraguan | 226 | 0.1% |
| Nigerian | 115 | 0.1% |
| Northern European | 924 | 0.4% |
| Norwegian | 5,564 | 2.3% |
| Paiute | 11 | 0.0% |
| Pakistani | 669 | 0.3% |
| Palestinian | 358 | 0.2% |
| Panamanian | 96 | 0.0% |
| Paraguayan | 74 | 0.0% |
| Pennsylvania German | 31 | 0.0% |
| Peruvian | 444 | 0.2% |
| Pima | 175 | 0.1% |
| Polish | 10,132 | 4.2% |
| Portuguese | 1,089 | 0.4% |
| Pueblo | 21 | 0.0% |
| Puerto Rican | 1,439 | 0.6% |
| Romanian | 657 | 0.3% |
| Russian | 4,348 | 1.8% |
| Salvadoran | 515 | 0.2% |
| Samoan | 40 | 0.0% |
| Scandinavian | 1,263 | 0.5% |
| Scotch-Irish | 2,057 | 0.9% |
| Scottish | 5,309 | 2.2% |
| Seminole | 39 | 0.0% |
| Serbian | 470 | 0.2% |
| Shoshone | 3 | 0.0% |
| Sioux | 14 | 0.0% |
| Slavic | 83 | 0.0% |
| Slovak | 855 | 0.4% |
| Slovene | 183 | 0.1% |
| South African | 164 | 0.1% |
| South American | 1,895 | 0.8% |
| South American Indian | 30 | 0.0% |
| Soviet Union | 18 | 0.0% |
| Spaniard | 964 | 0.4% |
| Spanish | 1,278 | 0.5% |
| Spanish American | 11 | 0.0% |
| Sri Lankan | 798 | 0.3% |
| Subsaharan African | 1,646 | 0.7% |
| Swedish | 4,703 | 2.0% |
| Swiss | 744 | 0.3% |
| Syrian | 368 | 0.2% |
| Thai | 5,159 | 2.1% |
| Tlingit-Haida | 35 | 0.0% |
| Tohono O'Odham | 14 | 0.0% |
| Trinidadian and Tobagonian | 60 | 0.0% |
| Turkish | 127 | 0.1% |
| Ugandan | 5 | 0.0% |
| Ukrainian | 1,151 | 0.5% |
| Uruguayan | 29 | 0.0% |
| Ute | 8 | 0.0% |
| Venezuelan | 31 | 0.0% |
| Vietnamese | 102 | 0.0% |
| Welsh | 1,542 | 0.6% |
| West Indian | 50 | 0.0% |
| Yaqui | 112 | 0.1% |
| Yugoslavian | 235 | 0.1% |
| Yuman | 13 | 0.0% | View All 152 Rows |
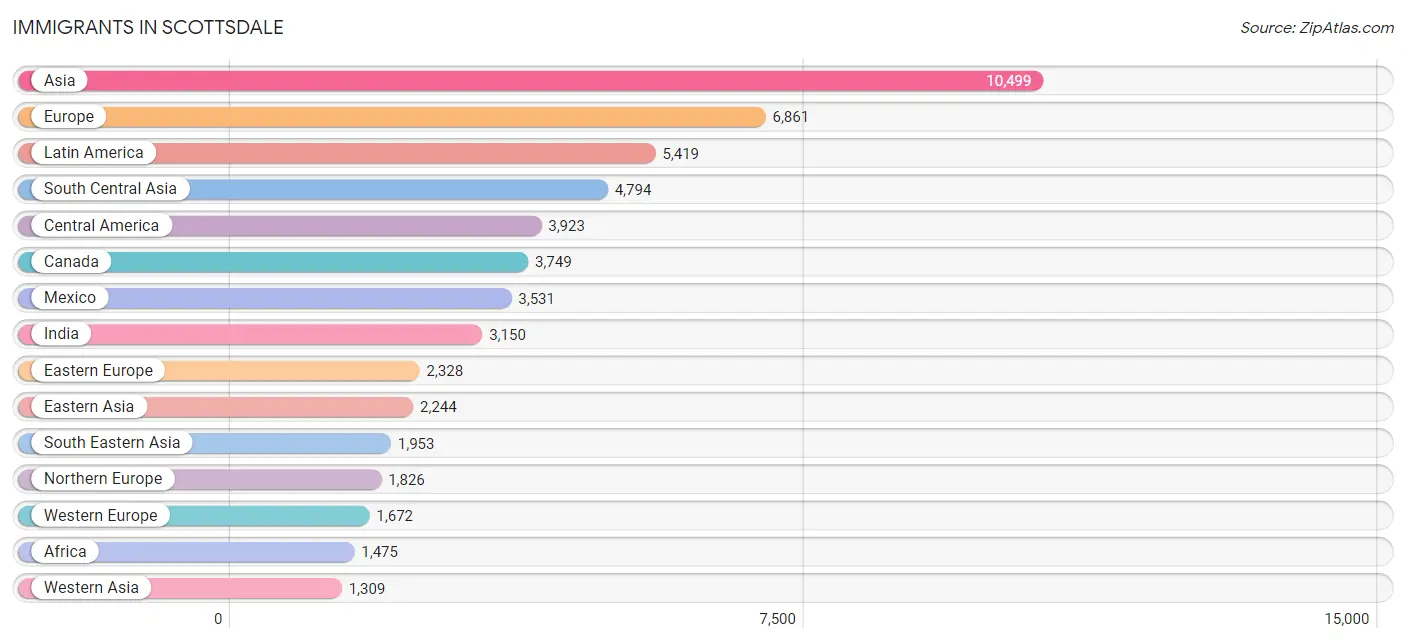
Immigrants in Scottsdale
The most numerous immigrant groups reported in Scottsdale came from Asia (10,499 | 4.4%), Europe (6,861 | 2.9%), Latin America (5,419 | 2.2%), South Central Asia (4,794 | 2.0%), and Central America (3,923 | 1.6%), together accounting for 13.1% of all Scottsdale residents.
| Immigration Origin | # Population | % Population |
| Afghanistan | 51 | 0.0% |
| Africa | 1,475 | 0.6% |
| Albania | 147 | 0.1% |
| Argentina | 59 | 0.0% |
| Armenia | 14 | 0.0% |
| Asia | 10,499 | 4.4% |
| Australia | 190 | 0.1% |
| Austria | 158 | 0.1% |
| Bangladesh | 67 | 0.0% |
| Belarus | 41 | 0.0% |
| Belgium | 64 | 0.0% |
| Bosnia and Herzegovina | 42 | 0.0% |
| Brazil | 204 | 0.1% |
| Bulgaria | 163 | 0.1% |
| Cambodia | 54 | 0.0% |
| Cameroon | 26 | 0.0% |
| Canada | 3,749 | 1.6% |
| Caribbean | 378 | 0.2% |
| Central America | 3,923 | 1.6% |
| Chile | 120 | 0.1% |
| China | 1,148 | 0.5% |
| Colombia | 380 | 0.2% |
| Costa Rica | 40 | 0.0% |
| Croatia | 204 | 0.1% |
| Cuba | 134 | 0.1% |
| Czechoslovakia | 93 | 0.0% |
| Denmark | 14 | 0.0% |
| Dominican Republic | 52 | 0.0% |
| Eastern Africa | 782 | 0.3% |
| Eastern Asia | 2,244 | 0.9% |
| Eastern Europe | 2,328 | 1.0% |
| Ecuador | 195 | 0.1% |
| Egypt | 59 | 0.0% |
| El Salvador | 186 | 0.1% |
| England | 741 | 0.3% |
| Ethiopia | 497 | 0.2% |
| Europe | 6,861 | 2.9% |
| Fiji | 33 | 0.0% |
| France | 262 | 0.1% |
| Germany | 900 | 0.4% |
| Ghana | 1 | 0.0% |
| Greece | 170 | 0.1% |
| Guatemala | 49 | 0.0% |
| Haiti | 63 | 0.0% |
| Hong Kong | 290 | 0.1% |
| Hungary | 125 | 0.1% |
| India | 3,150 | 1.3% |
| Indonesia | 88 | 0.0% |
| Iran | 1,202 | 0.5% |
| Iraq | 258 | 0.1% |
| Ireland | 138 | 0.1% |
| Israel | 476 | 0.2% |
| Italy | 449 | 0.2% |
| Jamaica | 81 | 0.0% |
| Japan | 275 | 0.1% |
| Jordan | 50 | 0.0% |
| Kazakhstan | 60 | 0.0% |
| Kenya | 119 | 0.1% |
| Korea | 821 | 0.3% |
| Kuwait | 46 | 0.0% |
| Laos | 76 | 0.0% |
| Latin America | 5,419 | 2.2% |
| Latvia | 54 | 0.0% |
| Lebanon | 89 | 0.0% |
| Liberia | 18 | 0.0% |
| Lithuania | 26 | 0.0% |
| Malaysia | 81 | 0.0% |
| Mexico | 3,531 | 1.5% |
| Middle Africa | 26 | 0.0% |
| Morocco | 74 | 0.0% |
| Netherlands | 215 | 0.1% |
| Nicaragua | 117 | 0.1% |
| Northern Africa | 218 | 0.1% |
| Northern Europe | 1,826 | 0.8% |
| Norway | 70 | 0.0% |
| Oceania | 381 | 0.2% |
| Pakistan | 221 | 0.1% |
| Peru | 116 | 0.1% |
| Philippines | 774 | 0.3% |
| Poland | 226 | 0.1% |
| Portugal | 32 | 0.0% |
| Romania | 341 | 0.1% |
| Russia | 514 | 0.2% |
| Saudi Arabia | 65 | 0.0% |
| Scotland | 104 | 0.0% |
| Senegal | 4 | 0.0% |
| Serbia | 154 | 0.1% |
| South Africa | 425 | 0.2% |
| South America | 1,118 | 0.5% |
| South Central Asia | 4,794 | 2.0% |
| South Eastern Asia | 1,953 | 0.8% |
| Southern Europe | 1,035 | 0.4% |
| Spain | 365 | 0.2% |
| Sudan | 25 | 0.0% |
| Sweden | 115 | 0.1% |
| Switzerland | 73 | 0.0% |
| Syria | 185 | 0.1% |
| Taiwan | 222 | 0.1% |
| Thailand | 336 | 0.1% |
| Trinidad and Tobago | 48 | 0.0% |
| Turkey | 50 | 0.0% |
| Uganda | 4 | 0.0% |
| Ukraine | 124 | 0.1% |
| Uruguay | 14 | 0.0% |
| Uzbekistan | 10 | 0.0% |
| Venezuela | 30 | 0.0% |
| Vietnam | 496 | 0.2% |
| Western Africa | 23 | 0.0% |
| Western Asia | 1,309 | 0.5% |
| Western Europe | 1,672 | 0.7% |
| Zimbabwe | 17 | 0.0% | View All 111 Rows |
Sex and Age in Scottsdale
Sex and Age in Scottsdale
The most populous age groups in Scottsdale are 60 to 64 Years (9,572 | 8.2%) for men and 60 to 64 Years (10,147 | 8.2%) for women.
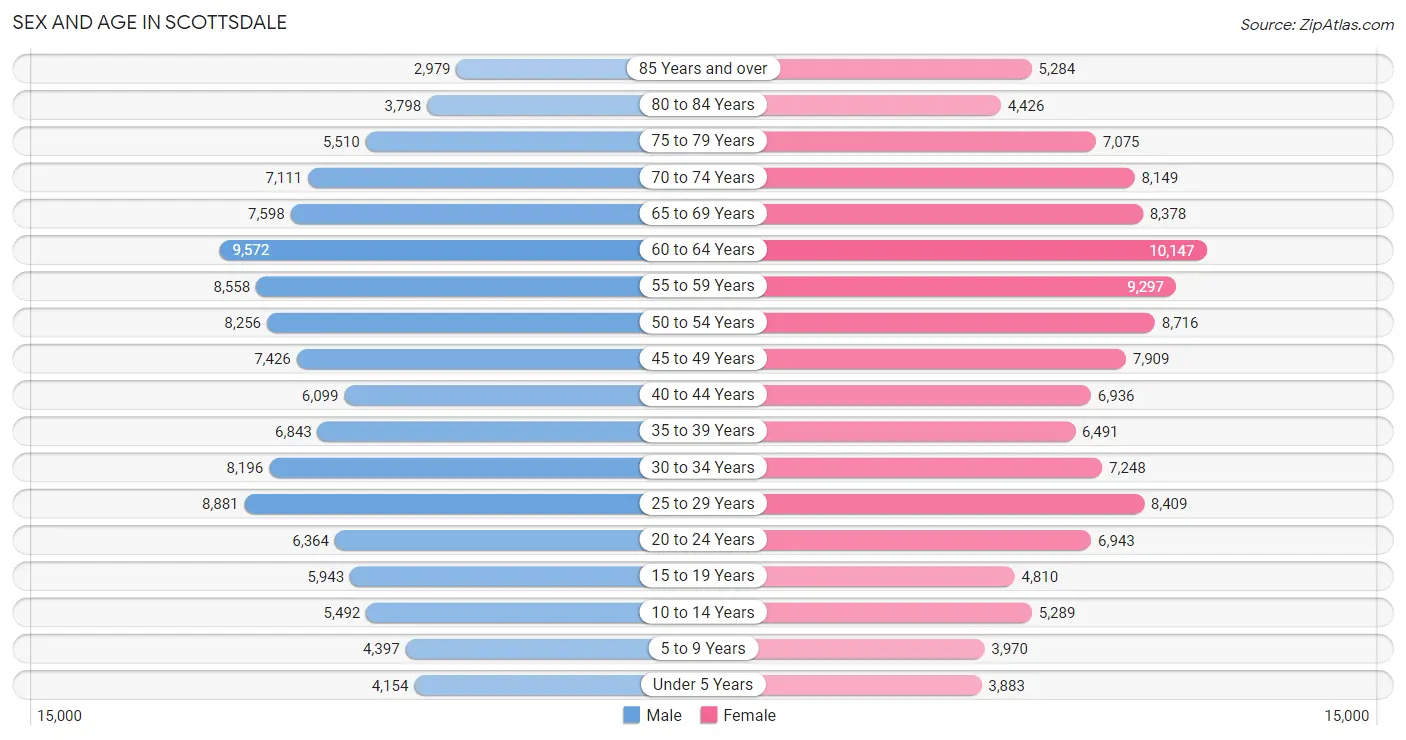
| Age Bracket | Male | Female |
| Under 5 Years | 4,154 (3.5%) | 3,883 (3.2%) |
| 5 to 9 Years | 4,397 (3.7%) | 3,970 (3.2%) |
| 10 to 14 Years | 5,492 (4.7%) | 5,289 (4.3%) |
| 15 to 19 Years | 5,943 (5.1%) | 4,810 (3.9%) |
| 20 to 24 Years | 6,364 (5.4%) | 6,943 (5.6%) |
| 25 to 29 Years | 8,881 (7.6%) | 8,409 (6.8%) |
| 30 to 34 Years | 8,196 (7.0%) | 7,248 (5.9%) |
| 35 to 39 Years | 6,843 (5.8%) | 6,491 (5.3%) |
| 40 to 44 Years | 6,099 (5.2%) | 6,936 (5.6%) |
| 45 to 49 Years | 7,426 (6.3%) | 7,909 (6.4%) |
| 50 to 54 Years | 8,256 (7.0%) | 8,716 (7.1%) |
| 55 to 59 Years | 8,558 (7.3%) | 9,297 (7.5%) |
| 60 to 64 Years | 9,572 (8.2%) | 10,147 (8.2%) |
| 65 to 69 Years | 7,598 (6.5%) | 8,378 (6.8%) |
| 70 to 74 Years | 7,111 (6.1%) | 8,149 (6.6%) |
| 75 to 79 Years | 5,510 (4.7%) | 7,075 (5.7%) |
| 80 to 84 Years | 3,798 (3.2%) | 4,426 (3.6%) |
| 85 Years and over | 2,979 (2.5%) | 5,284 (4.3%) |
| Total | 117,177 (100.0%) | 123,360 (100.0%) |
Families and Households in Scottsdale
Median Family Size in Scottsdale
The median family size in Scottsdale is 2.67 persons per family, with married-couple families (51,746 | 82.1%) accounting for the largest median family size of 2.69 persons per family. On the other hand, single male/father families (3,006 | 4.8%) represent the smallest median family size with 2.56 persons per family.
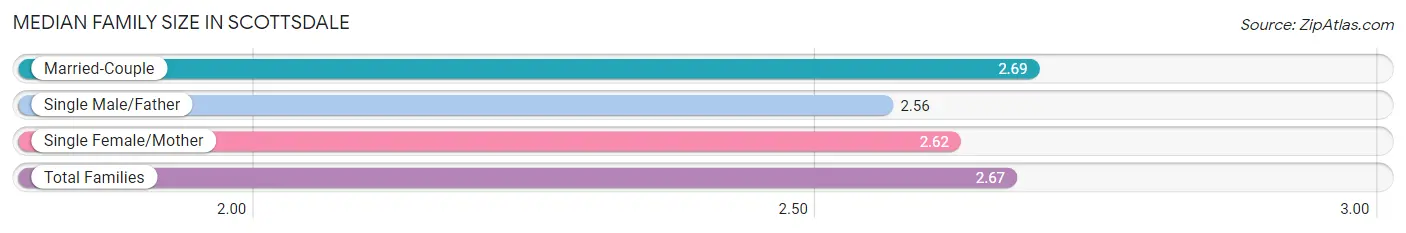
| Family Type | # Families | Family Size |
| Married-Couple | 51,746 (82.1%) | 2.69 |
| Single Male/Father | 3,006 (4.8%) | 2.56 |
| Single Female/Mother | 8,293 (13.2%) | 2.62 |
| Total Families | 63,045 (100.0%) | 2.67 |
Median Household Size in Scottsdale
The median household size in Scottsdale is 2.06 persons per household, with single male/father households (3,006 | 2.6%) accounting for the largest median household size of 2.84 persons per household. non-family households (52,781 | 45.6%) represent the smallest median household size with 1.27 persons per household.
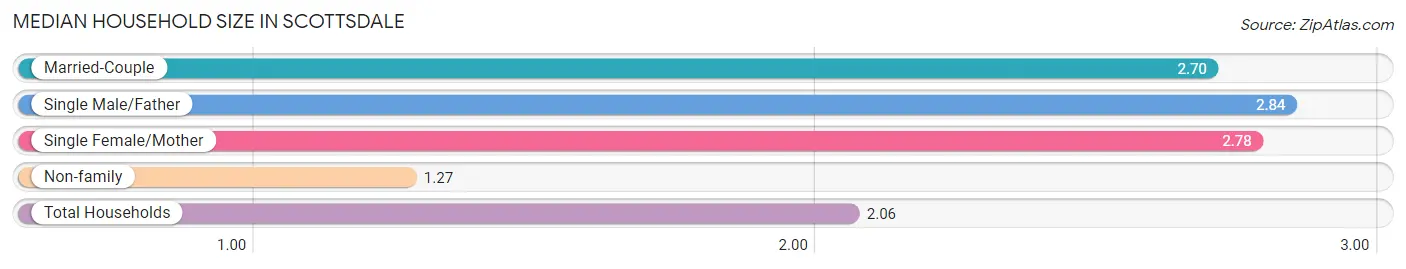
| Household Type | # Households | Household Size |
| Married-Couple | 51,746 (44.7%) | 2.70 |
| Single Male/Father | 3,006 (2.6%) | 2.84 |
| Single Female/Mother | 8,293 (7.2%) | 2.78 |
| Non-family | 52,781 (45.6%) | 1.27 |
| Total Households | 115,826 (100.0%) | 2.06 |
Household Size by Marriage Status in Scottsdale
Out of a total of 115,826 households in Scottsdale, 63,045 (54.4%) are family households, while 52,781 (45.6%) are nonfamily households. The most numerous type of family households are 2-person households, comprising 38,612, and the most common type of nonfamily households are 1-person households, comprising 41,288.
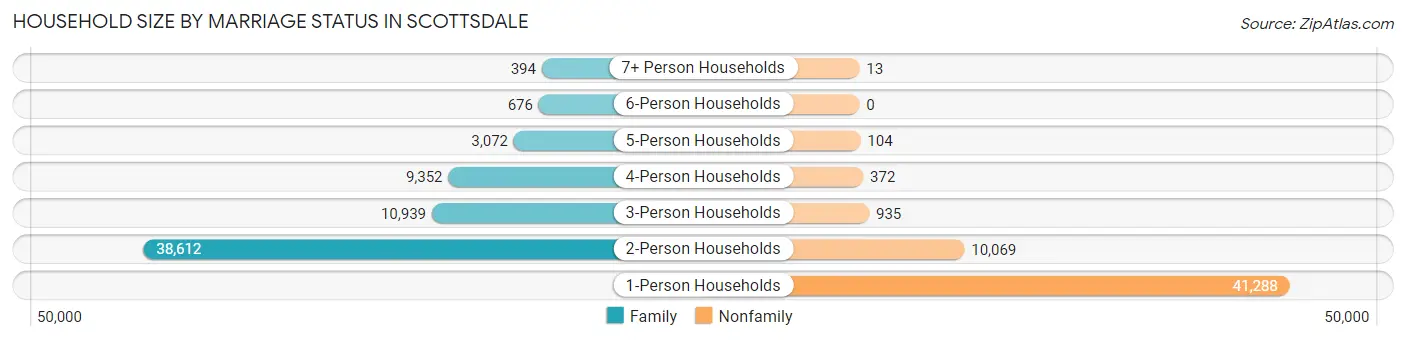
| Household Size | Family Households | Nonfamily Households |
| 1-Person Households | - | 41,288 (35.6%) |
| 2-Person Households | 38,612 (33.3%) | 10,069 (8.7%) |
| 3-Person Households | 10,939 (9.4%) | 935 (0.8%) |
| 4-Person Households | 9,352 (8.1%) | 372 (0.3%) |
| 5-Person Households | 3,072 (2.6%) | 104 (0.1%) |
| 6-Person Households | 676 (0.6%) | 0 (0.0%) |
| 7+ Person Households | 394 (0.3%) | 13 (0.0%) |
| Total | 63,045 (54.4%) | 52,781 (45.6%) |
Female Fertility in Scottsdale
Fertility by Age in Scottsdale
Average fertility rate in Scottsdale is 42.0 births per 1,000 women. Women in the age bracket of 35 to 50 years have the highest fertility rate with 45.0 births per 1,000 women. Women in the age bracket of 35 to 50 years acount for 49.2% of all women with births.
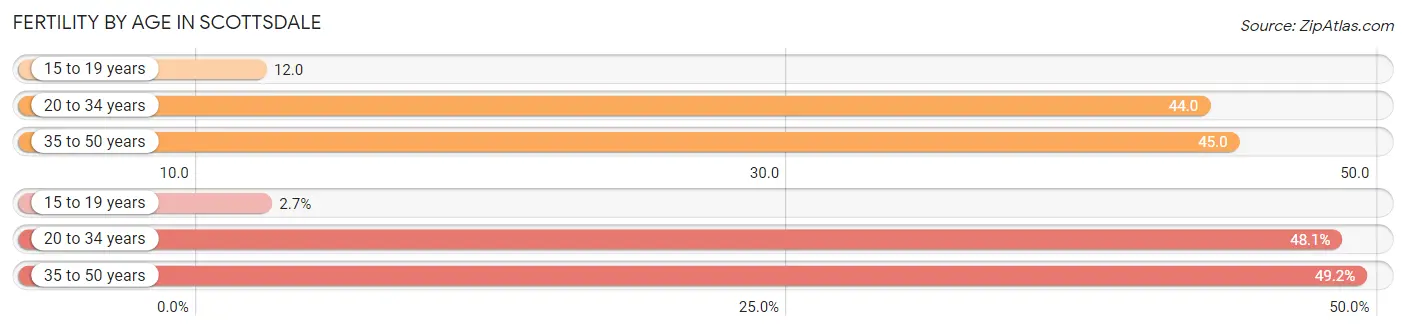
| Age Bracket | Women with Births | Births / 1,000 Women |
| 15 to 19 years | 57 (2.7%) | 12.0 |
| 20 to 34 years | 1,005 (48.1%) | 44.0 |
| 35 to 50 years | 1,027 (49.2%) | 45.0 |
| Total | 2,089 (100.0%) | 42.0 |
Fertility by Age by Marriage Status in Scottsdale
65.8% of women with births (2,089) in Scottsdale are married. The highest percentage of unmarried women with births falls into 15 to 19 years age bracket with 100.0% of them unmarried at the time of birth, while the lowest percentage of unmarried women with births belong to 35 to 50 years age bracket with 30.4% of them unmarried.
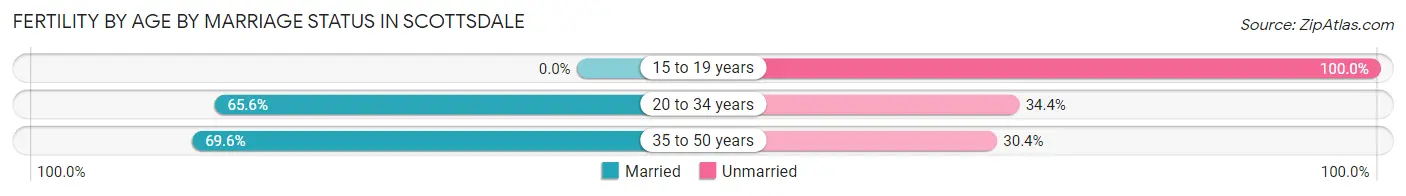
| Age Bracket | Married | Unmarried |
| 15 to 19 years | 0 (0.0%) | 57 (100.0%) |
| 20 to 34 years | 659 (65.6%) | 346 (34.4%) |
| 35 to 50 years | 715 (69.6%) | 312 (30.4%) |
| Total | 1,375 (65.8%) | 714 (34.2%) |
Fertility by Education in Scottsdale
Average fertility rate in Scottsdale is 42.0 births per 1,000 women. Women with the education attainment of graduate degree have the highest fertility rate of 69.0 births per 1,000 women, while women with the education attainment of less than high school have the lowest fertility at 20.0 births per 1,000 women. Women with the education attainment of bachelor's degree represent 33.5% of all women with births.
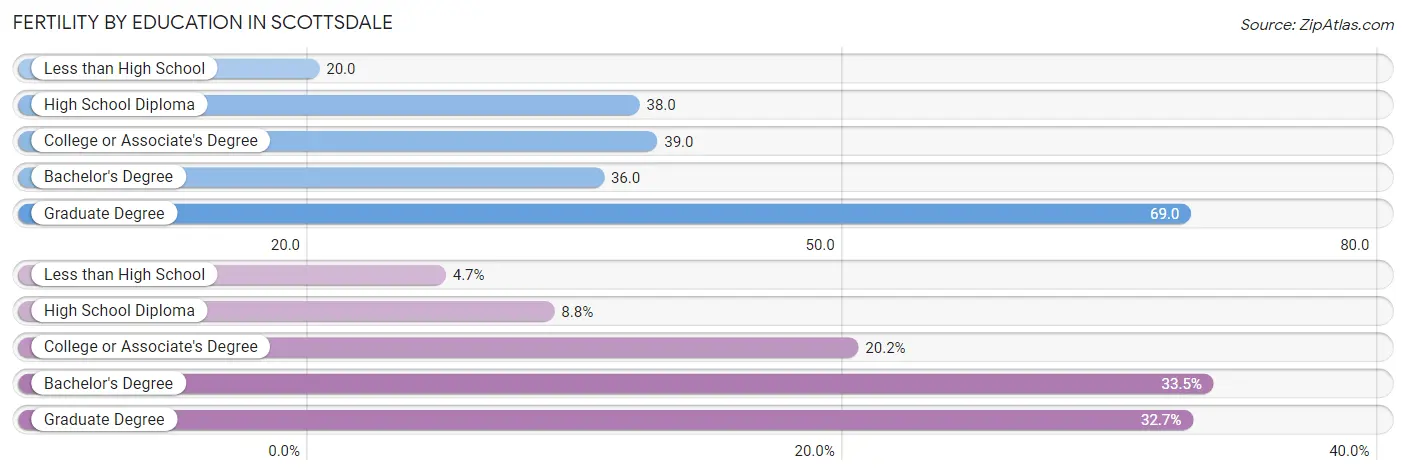
| Educational Attainment | Women with Births | Births / 1,000 Women |
| Less than High School | 99 (4.7%) | 20.0 |
| High School Diploma | 184 (8.8%) | 38.0 |
| College or Associate's Degree | 422 (20.2%) | 39.0 |
| Bachelor's Degree | 700 (33.5%) | 36.0 |
| Graduate Degree | 684 (32.7%) | 69.0 |
| Total | 2,089 (100.0%) | 42.0 |
Fertility by Education by Marriage Status in Scottsdale
34.2% of women with births in Scottsdale are unmarried. Women with the educational attainment of graduate degree are most likely to be married with 98.8% of them married at childbirth, while women with the educational attainment of college or associate's degree are least likely to be married with 86.0% of them unmarried at childbirth.
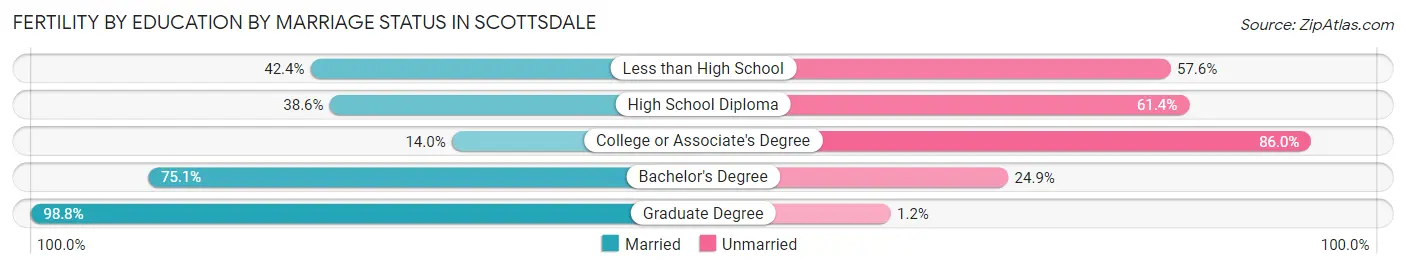
| Educational Attainment | Married | Unmarried |
| Less than High School | 42 (42.4%) | 57 (57.6%) |
| High School Diploma | 71 (38.6%) | 113 (61.4%) |
| College or Associate's Degree | 59 (14.0%) | 363 (86.0%) |
| Bachelor's Degree | 526 (75.1%) | 174 (24.9%) |
| Graduate Degree | 676 (98.8%) | 8 (1.2%) |
| Total | 1,375 (65.8%) | 714 (34.2%) |
Employment Characteristics in Scottsdale
Employment by Class of Employer in Scottsdale
Among the 124,887 employed individuals in Scottsdale, private company employees (85,553 | 68.5%), self-employed (incorporated) (12,410 | 9.9%), and not-for-profit organizations (8,653 | 6.9%) make up the most common classes of employment.
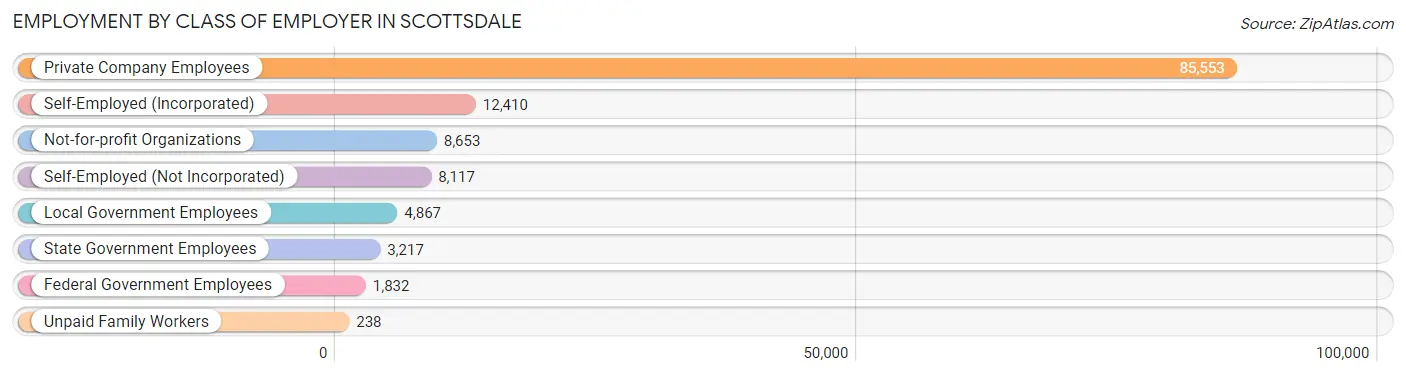
| Employer Class | # Employees | % Employees |
| Private Company Employees | 85,553 | 68.5% |
| Self-Employed (Incorporated) | 12,410 | 9.9% |
| Self-Employed (Not Incorporated) | 8,117 | 6.5% |
| Not-for-profit Organizations | 8,653 | 6.9% |
| Local Government Employees | 4,867 | 3.9% |
| State Government Employees | 3,217 | 2.6% |
| Federal Government Employees | 1,832 | 1.5% |
| Unpaid Family Workers | 238 | 0.2% |
| Total | 124,887 | 100.0% |
Employment Status by Age in Scottsdale
According to the labor force statistics for Scottsdale, out of the total population over 16 years of age (210,783), 62.4% or 131,529 individuals are in the labor force, with 3.5% or 4,604 of them unemployed. The age group with the highest labor force participation rate is 25 to 29 years, with 93.1% or 16,097 individuals in the labor force. Within the labor force, the 16 to 19 years age range has the highest percentage of unemployed individuals, with 9.3% or 285 of them being unemployed.
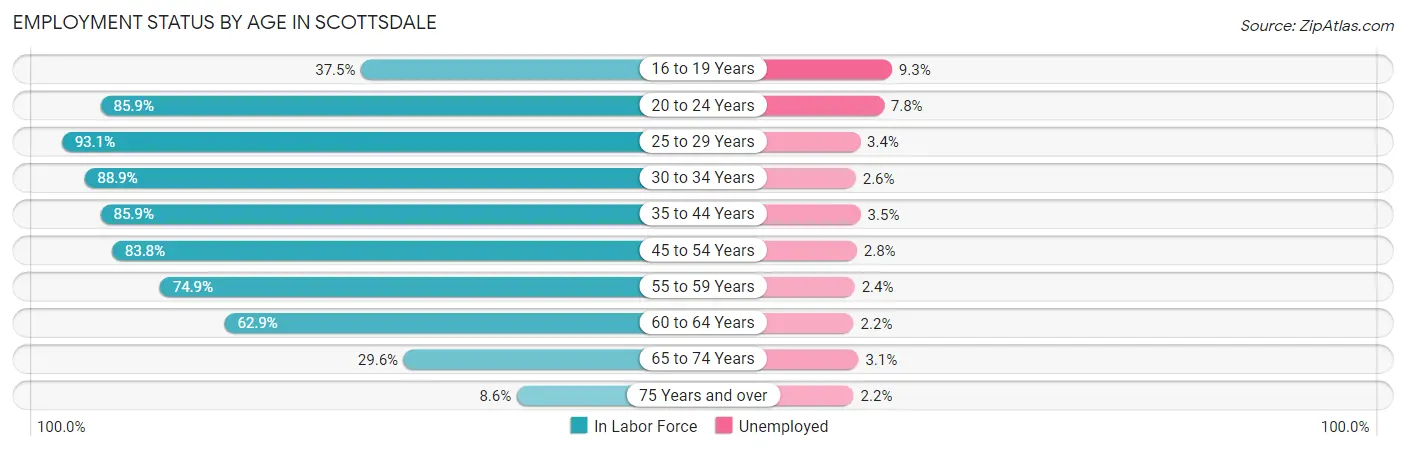
| Age Bracket | In Labor Force | Unemployed |
| 16 to 19 Years | 3,069 (37.5%) | 285 (9.3%) |
| 20 to 24 Years | 11,431 (85.9%) | 892 (7.8%) |
| 25 to 29 Years | 16,097 (93.1%) | 547 (3.4%) |
| 30 to 34 Years | 13,730 (88.9%) | 357 (2.6%) |
| 35 to 44 Years | 22,651 (85.9%) | 793 (3.5%) |
| 45 to 54 Years | 27,073 (83.8%) | 758 (2.8%) |
| 55 to 59 Years | 13,373 (74.9%) | 321 (2.4%) |
| 60 to 64 Years | 12,403 (62.9%) | 273 (2.2%) |
| 65 to 74 Years | 9,246 (29.6%) | 287 (3.1%) |
| 75 Years and over | 2,500 (8.6%) | 55 (2.2%) |
| Total | 131,529 (62.4%) | 4,604 (3.5%) |
Employment Status by Educational Attainment in Scottsdale
According to labor force statistics for Scottsdale, 81.7% of individuals (105,380) out of the total population between 25 and 64 years of age (128,984) are in the labor force, with 2.9% or 3,056 of them being unemployed. The group with the highest labor force participation rate are those with the educational attainment of bachelor's degree or higher, with 84.7% or 69,994 individuals in the labor force. Within the labor force, individuals with high school diploma education have the highest percentage of unemployment, with 5.2% or 475 of them being unemployed.
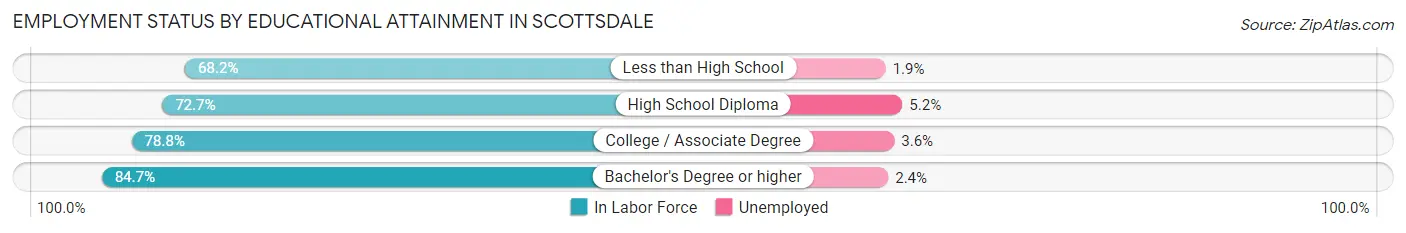
| Educational Attainment | In Labor Force | Unemployed |
| Less than High School | 2,485 (68.2%) | 69 (1.9%) |
| High School Diploma | 9,134 (72.7%) | 653 (5.2%) |
| College / Associate Degree | 23,749 (78.8%) | 1,085 (3.6%) |
| Bachelor's Degree or higher | 69,994 (84.7%) | 1,983 (2.4%) |
| Total | 105,380 (81.7%) | 3,741 (2.9%) |
Employment Occupations by Sex in Scottsdale
Management, Business, Science and Arts Occupations
The most common Management, Business, Science and Arts occupations in Scottsdale are Management (24,101 | 19.0%), Community & Social Service (14,190 | 11.2%), Business & Financial (13,874 | 10.9%), Computers, Engineering & Science (11,202 | 8.8%), and Health Diagnosing & Treating (9,962 | 7.9%).
Management, Business, Science and Arts Occupations by Sex
Within the Management, Business, Science and Arts occupations in Scottsdale, the most male-oriented occupations are Architecture & Engineering (88.2%), Computers, Engineering & Science (73.0%), and Computers & Mathematics (70.2%), while the most female-oriented occupations are Health Diagnosing & Treating (69.8%), Health Technologists (68.8%), and Education, Arts & Media (68.1%).
| Occupation | Male | Female |
| Management | 14,800 (61.4%) | 9,301 (38.6%) |
| Business & Financial | 6,977 (50.3%) | 6,897 (49.7%) |
| Computers, Engineering & Science | 8,176 (73.0%) | 3,026 (27.0%) |
| Computers & Mathematics | 5,214 (70.2%) | 2,212 (29.8%) |
| Architecture & Engineering | 2,437 (88.2%) | 326 (11.8%) |
| Life, Physical & Social Science | 525 (51.8%) | 488 (48.2%) |
| Community & Social Service | 5,894 (41.5%) | 8,296 (58.5%) |
| Education, Arts & Media | 508 (31.9%) | 1,085 (68.1%) |
| Legal Services & Support | 1,427 (54.6%) | 1,186 (45.4%) |
| Education Instruction & Library | 2,232 (34.2%) | 4,287 (65.8%) |
| Arts, Media & Entertainment | 1,727 (49.8%) | 1,738 (50.2%) |
| Health Diagnosing & Treating | 3,005 (30.2%) | 6,957 (69.8%) |
| Health Technologists | 2,659 (31.2%) | 5,861 (68.8%) |
| Total (Category) | 38,852 (53.0%) | 34,477 (47.0%) |
| Total (Overall) | 67,091 (52.8%) | 59,866 (47.1%) |
Services Occupations
The most common Services occupations in Scottsdale are Food Preparation & Serving (5,529 | 4.4%), Personal Care & Service (2,954 | 2.3%), Cleaning & Maintenance (1,878 | 1.5%), Healthcare Support (1,604 | 1.3%), and Security & Protection (1,111 | 0.9%).
Services Occupations by Sex
Within the Services occupations in Scottsdale, the most male-oriented occupations are Law Enforcement (86.3%), Security & Protection (79.1%), and Firefighting & Prevention (76.6%), while the most female-oriented occupations are Personal Care & Service (74.0%), Healthcare Support (66.8%), and Food Preparation & Serving (53.2%).
| Occupation | Male | Female |
| Healthcare Support | 533 (33.2%) | 1,071 (66.8%) |
| Security & Protection | 879 (79.1%) | 232 (20.9%) |
| Firefighting & Prevention | 628 (76.6%) | 192 (23.4%) |
| Law Enforcement | 251 (86.3%) | 40 (13.8%) |
| Food Preparation & Serving | 2,589 (46.8%) | 2,940 (53.2%) |
| Cleaning & Maintenance | 1,414 (75.3%) | 464 (24.7%) |
| Personal Care & Service | 769 (26.0%) | 2,185 (74.0%) |
| Total (Category) | 6,184 (47.3%) | 6,892 (52.7%) |
| Total (Overall) | 67,091 (52.8%) | 59,866 (47.1%) |
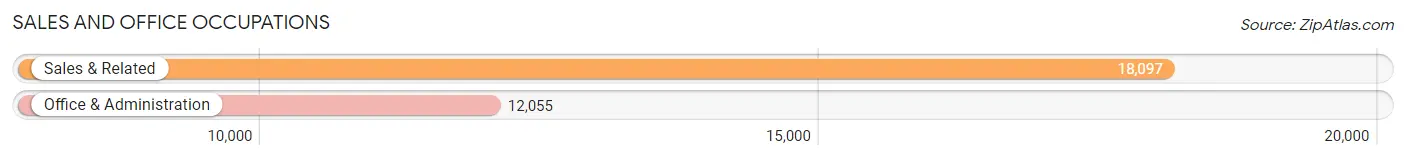
Sales and Office Occupations
The most common Sales and Office occupations in Scottsdale are Sales & Related (18,097 | 14.2%), and Office & Administration (12,055 | 9.5%).
Sales and Office Occupations by Sex
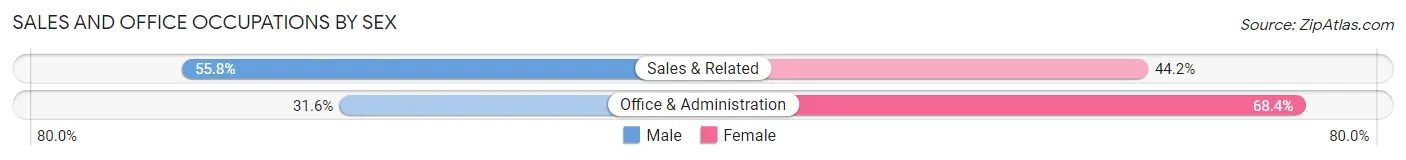
| Occupation | Male | Female |
| Sales & Related | 10,094 (55.8%) | 8,003 (44.2%) |
| Office & Administration | 3,810 (31.6%) | 8,245 (68.4%) |
| Total (Category) | 13,904 (46.1%) | 16,248 (53.9%) |
| Total (Overall) | 67,091 (52.8%) | 59,866 (47.1%) |
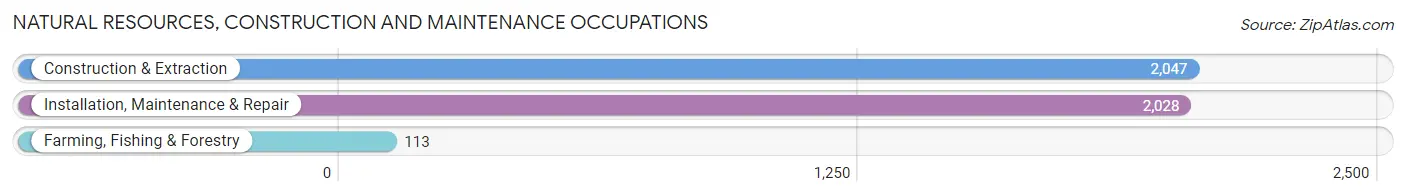
Natural Resources, Construction and Maintenance Occupations
The most common Natural Resources, Construction and Maintenance occupations in Scottsdale are Construction & Extraction (2,047 | 1.6%), Installation, Maintenance & Repair (2,028 | 1.6%), and Farming, Fishing & Forestry (113 | 0.1%).
Natural Resources, Construction and Maintenance Occupations by Sex
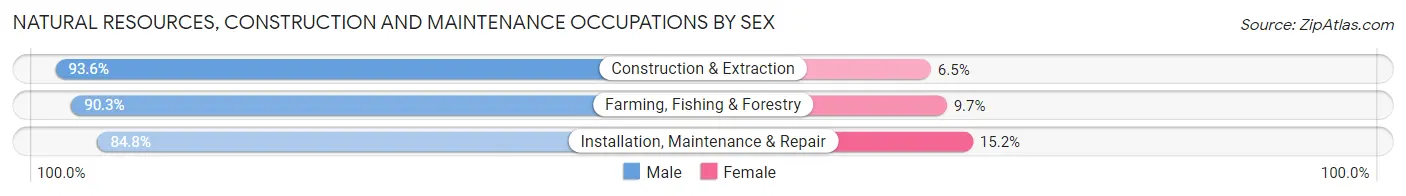
| Occupation | Male | Female |
| Farming, Fishing & Forestry | 102 (90.3%) | 11 (9.7%) |
| Construction & Extraction | 1,915 (93.5%) | 132 (6.5%) |
| Installation, Maintenance & Repair | 1,720 (84.8%) | 308 (15.2%) |
| Total (Category) | 3,737 (89.2%) | 451 (10.8%) |
| Total (Overall) | 67,091 (52.8%) | 59,866 (47.1%) |
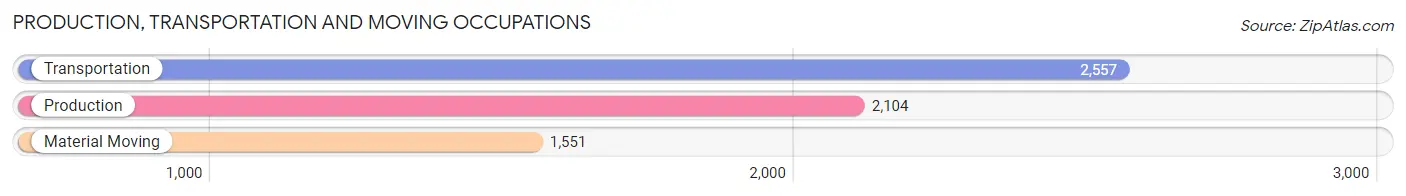
Production, Transportation and Moving Occupations
The most common Production, Transportation and Moving occupations in Scottsdale are Transportation (2,557 | 2.0%), Production (2,104 | 1.7%), and Material Moving (1,551 | 1.2%).
Production, Transportation and Moving Occupations by Sex
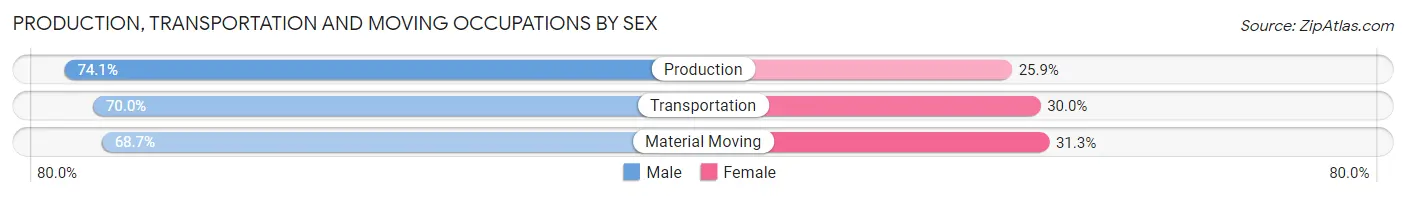
| Occupation | Male | Female |
| Production | 1,560 (74.1%) | 544 (25.9%) |
| Transportation | 1,789 (70.0%) | 768 (30.0%) |
| Material Moving | 1,065 (68.7%) | 486 (31.3%) |
| Total (Category) | 4,414 (71.1%) | 1,798 (28.9%) |
| Total (Overall) | 67,091 (52.8%) | 59,866 (47.1%) |
Employment Industries by Sex in Scottsdale
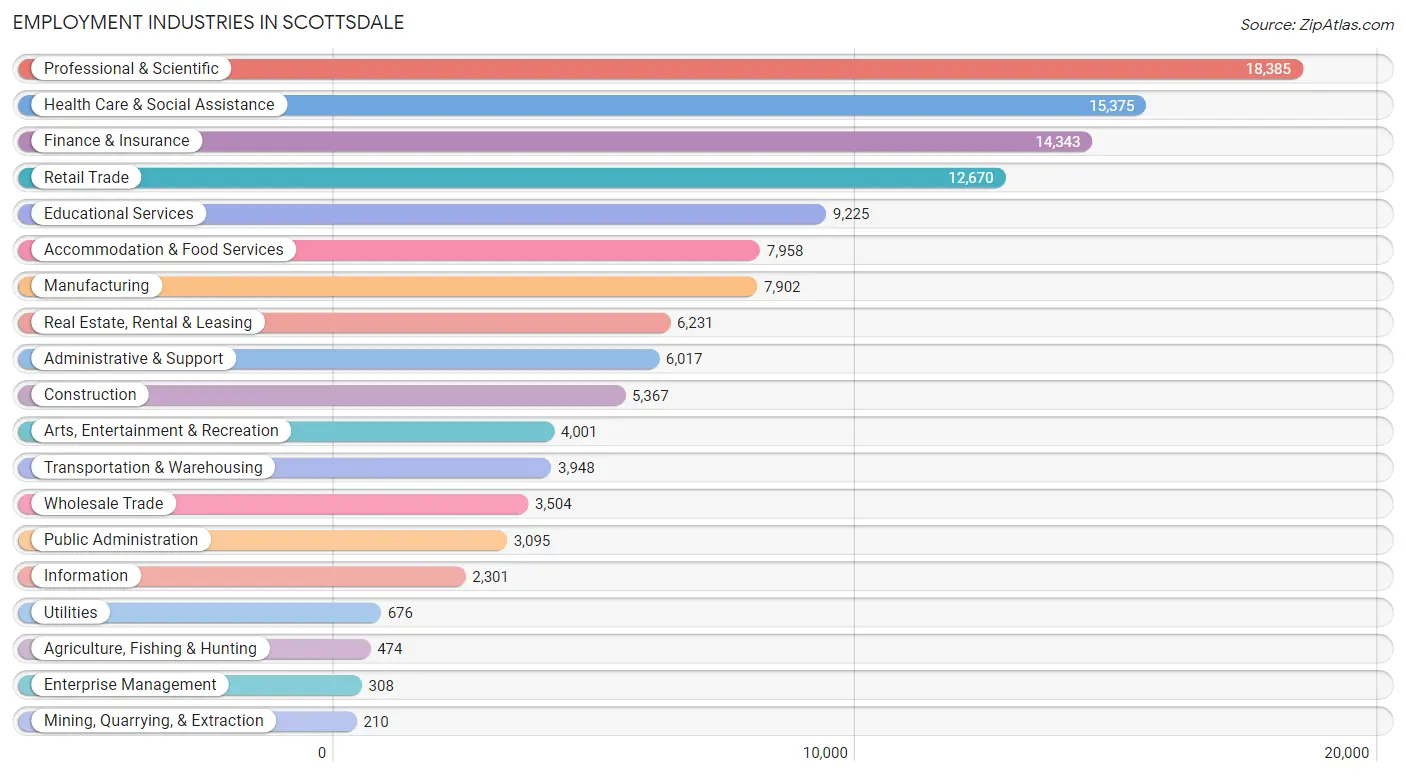
Employment Industries in Scottsdale
The major employment industries in Scottsdale include Professional & Scientific (18,385 | 14.5%), Health Care & Social Assistance (15,375 | 12.1%), Finance & Insurance (14,343 | 11.3%), Retail Trade (12,670 | 10.0%), and Educational Services (9,225 | 7.3%).
Employment Industries by Sex in Scottsdale
The Scottsdale industries that see more men than women are Mining, Quarrying, & Extraction (100.0%), Construction (82.4%), and Utilities (80.6%), whereas the industries that tend to have a higher number of women are Health Care & Social Assistance (70.3%), Educational Services (67.2%), and Accommodation & Food Services (54.3%).
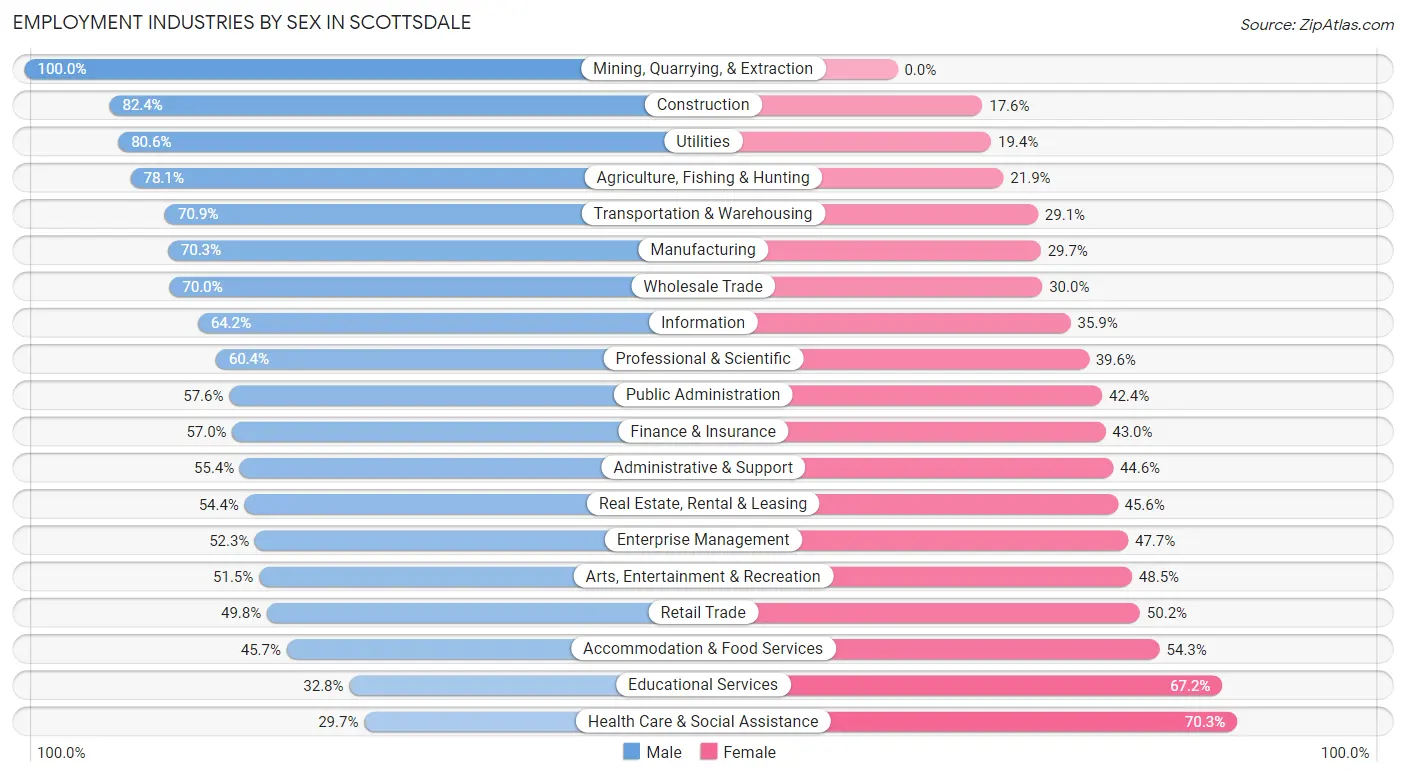
| Industry | Male | Female |
| Agriculture, Fishing & Hunting | 370 (78.1%) | 104 (21.9%) |
| Mining, Quarrying, & Extraction | 210 (100.0%) | 0 (0.0%) |
| Construction | 4,424 (82.4%) | 943 (17.6%) |
| Manufacturing | 5,558 (70.3%) | 2,344 (29.7%) |
| Wholesale Trade | 2,454 (70.0%) | 1,050 (30.0%) |
| Retail Trade | 6,311 (49.8%) | 6,359 (50.2%) |
| Transportation & Warehousing | 2,800 (70.9%) | 1,148 (29.1%) |
| Utilities | 545 (80.6%) | 131 (19.4%) |
| Information | 1,476 (64.1%) | 825 (35.8%) |
| Finance & Insurance | 8,172 (57.0%) | 6,171 (43.0%) |
| Real Estate, Rental & Leasing | 3,392 (54.4%) | 2,839 (45.6%) |
| Professional & Scientific | 11,107 (60.4%) | 7,278 (39.6%) |
| Enterprise Management | 161 (52.3%) | 147 (47.7%) |
| Administrative & Support | 3,333 (55.4%) | 2,684 (44.6%) |
| Educational Services | 3,024 (32.8%) | 6,201 (67.2%) |
| Health Care & Social Assistance | 4,566 (29.7%) | 10,809 (70.3%) |
| Arts, Entertainment & Recreation | 2,059 (51.5%) | 1,942 (48.5%) |
| Accommodation & Food Services | 3,639 (45.7%) | 4,319 (54.3%) |
| Public Administration | 1,784 (57.6%) | 1,311 (42.4%) |
| Total | 67,091 (52.8%) | 59,866 (47.1%) |
Education in Scottsdale
School Enrollment in Scottsdale
The most common levels of schooling among the 40,149 students in Scottsdale are high school (9,354 | 23.3%), middle school (8,471 | 21.1%), and college / undergraduate (7,930 | 19.8%).
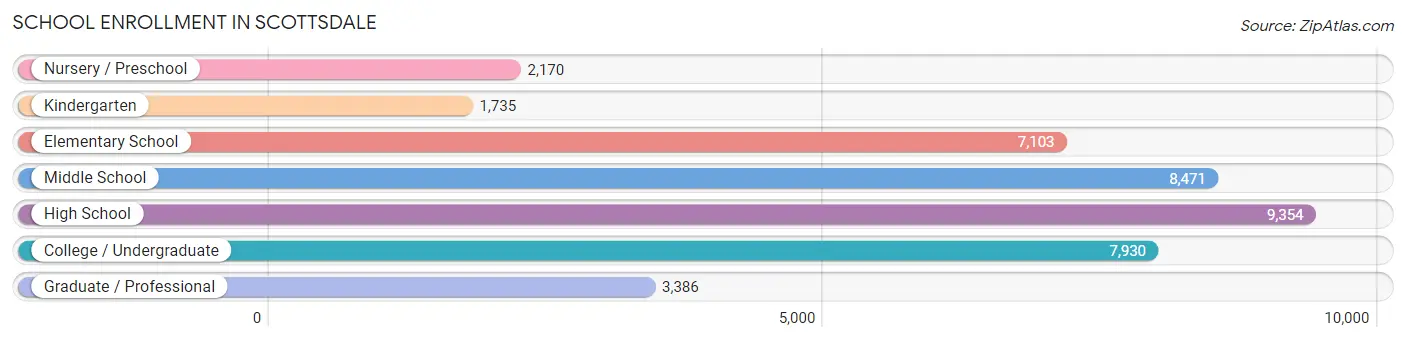
| School Level | # Students | % Students |
| Nursery / Preschool | 2,170 | 5.4% |
| Kindergarten | 1,735 | 4.3% |
| Elementary School | 7,103 | 17.7% |
| Middle School | 8,471 | 21.1% |
| High School | 9,354 | 23.3% |
| College / Undergraduate | 7,930 | 19.8% |
| Graduate / Professional | 3,386 | 8.4% |
| Total | 40,149 | 100.0% |
School Enrollment by Age by Funding Source in Scottsdale
Out of a total of 40,149 students who are enrolled in schools in Scottsdale, 7,909 (19.7%) attend a private institution, while the remaining 32,240 (80.3%) are enrolled in public schools. The age group of 3 to 4 year olds has the highest likelihood of being enrolled in private schools, with 981 (56.2% in the age bracket) enrolled. Conversely, the age group of 10 to 14 year olds has the lowest likelihood of being enrolled in a private school, with 9,116 (85.9% in the age bracket) attending a public institution.
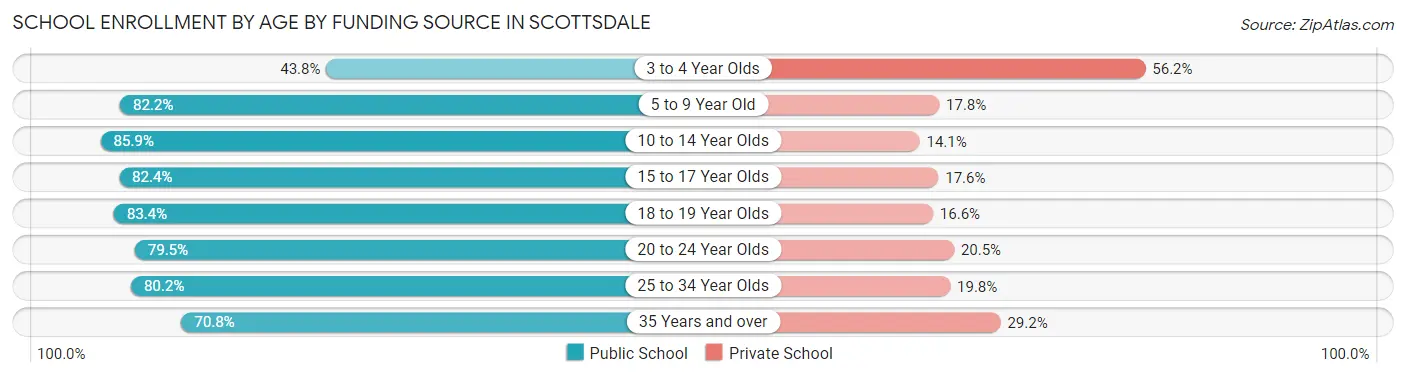
| Age Bracket | Public School | Private School |
| 3 to 4 Year Olds | 765 (43.8%) | 981 (56.2%) |
| 5 to 9 Year Old | 6,644 (82.2%) | 1,437 (17.8%) |
| 10 to 14 Year Olds | 9,116 (85.9%) | 1,501 (14.1%) |
| 15 to 17 Year Olds | 5,712 (82.4%) | 1,222 (17.6%) |
| 18 to 19 Year Olds | 2,232 (83.4%) | 445 (16.6%) |
| 20 to 24 Year Olds | 3,620 (79.5%) | 936 (20.5%) |
| 25 to 34 Year Olds | 2,099 (80.2%) | 519 (19.8%) |
| 35 Years and over | 2,067 (70.8%) | 853 (29.2%) |
| Total | 32,240 (80.3%) | 7,909 (19.7%) |
Educational Attainment by Field of Study in Scottsdale
Business (32,509 | 26.0%), education (11,194 | 9.0%), social sciences (10,708 | 8.6%), science & technology (10,647 | 8.5%), and engineering (9,391 | 7.5%) are the most common fields of study among 124,833 individuals in Scottsdale who have obtained a bachelor's degree or higher.
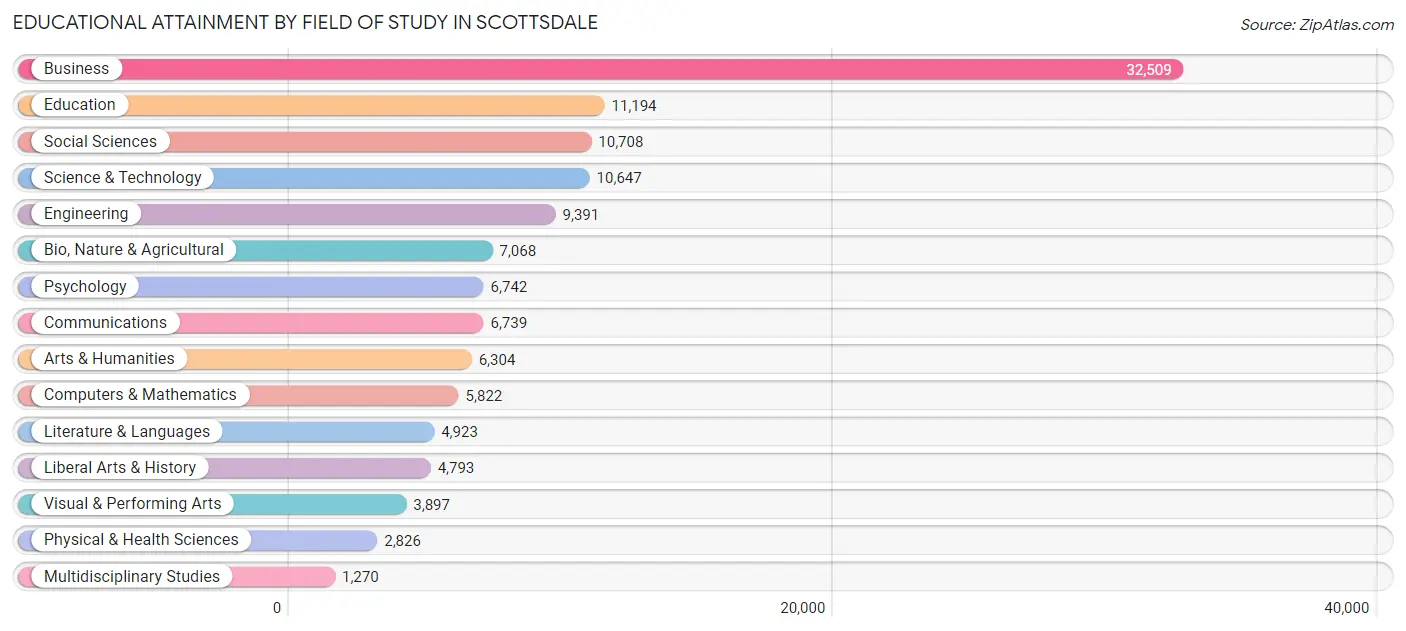
| Field of Study | # Graduates | % Graduates |
| Computers & Mathematics | 5,822 | 4.7% |
| Bio, Nature & Agricultural | 7,068 | 5.7% |
| Physical & Health Sciences | 2,826 | 2.3% |
| Psychology | 6,742 | 5.4% |
| Social Sciences | 10,708 | 8.6% |
| Engineering | 9,391 | 7.5% |
| Multidisciplinary Studies | 1,270 | 1.0% |
| Science & Technology | 10,647 | 8.5% |
| Business | 32,509 | 26.0% |
| Education | 11,194 | 9.0% |
| Literature & Languages | 4,923 | 3.9% |
| Liberal Arts & History | 4,793 | 3.8% |
| Visual & Performing Arts | 3,897 | 3.1% |
| Communications | 6,739 | 5.4% |
| Arts & Humanities | 6,304 | 5.1% |
| Total | 124,833 | 100.0% |
Transportation & Commute in Scottsdale
Vehicle Availability by Sex in Scottsdale
The most prevalent vehicle ownership categories in Scottsdale are males with 2 vehicles (31,942, accounting for 48.2%) and females with 2 vehicles (25,823, making up 54.6%).
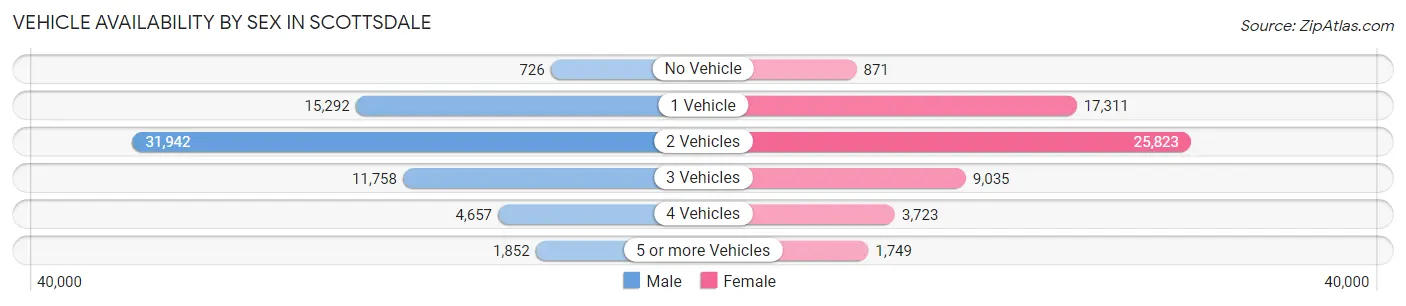
| Vehicles Available | Male | Female |
| No Vehicle | 726 (1.1%) | 871 (1.5%) |
| 1 Vehicle | 15,292 (23.1%) | 17,311 (29.6%) |
| 2 Vehicles | 31,942 (48.2%) | 25,823 (44.1%) |
| 3 Vehicles | 11,758 (17.7%) | 9,035 (15.4%) |
| 4 Vehicles | 4,657 (7.0%) | 3,723 (6.4%) |
| 5 or more Vehicles | 1,852 (2.8%) | 1,749 (3.0%) |
| Total | 66,227 (100.0%) | 58,512 (100.0%) |
Commute Time in Scottsdale
The most frequently occuring commute durations in Scottsdale are 20 to 24 minutes (16,717 commuters, 18.2%), 15 to 19 minutes (15,548 commuters, 17.0%), and 10 to 14 minutes (14,034 commuters, 15.3%).
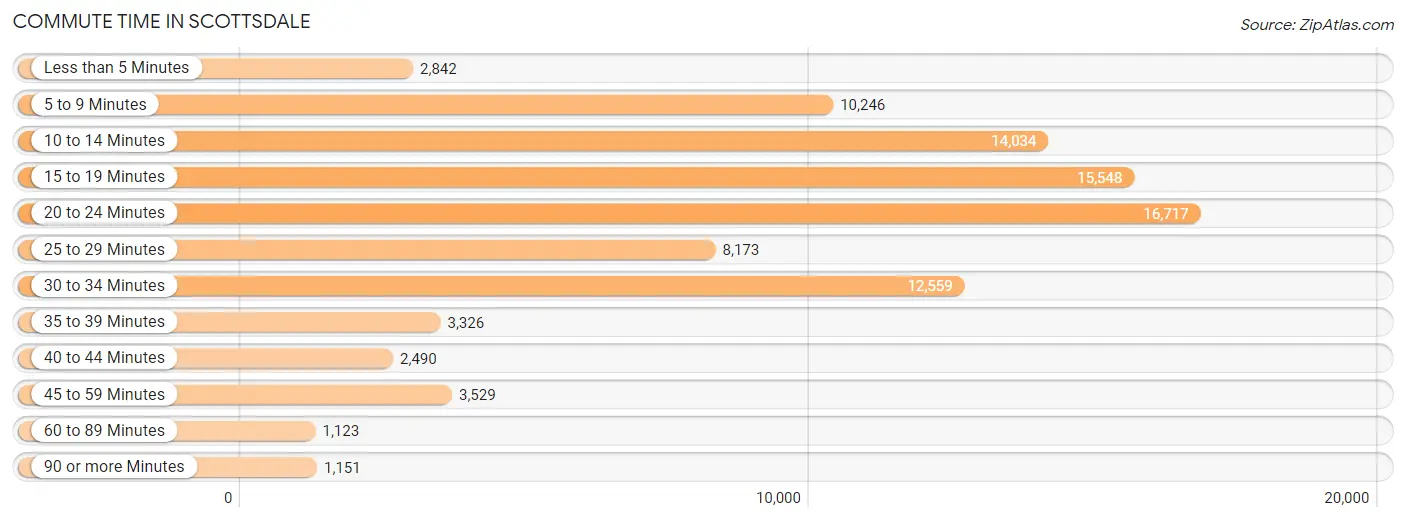
| Commute Time | # Commuters | % Commuters |
| Less than 5 Minutes | 2,842 | 3.1% |
| 5 to 9 Minutes | 10,246 | 11.2% |
| 10 to 14 Minutes | 14,034 | 15.3% |
| 15 to 19 Minutes | 15,548 | 17.0% |
| 20 to 24 Minutes | 16,717 | 18.2% |
| 25 to 29 Minutes | 8,173 | 8.9% |
| 30 to 34 Minutes | 12,559 | 13.7% |
| 35 to 39 Minutes | 3,326 | 3.6% |
| 40 to 44 Minutes | 2,490 | 2.7% |
| 45 to 59 Minutes | 3,529 | 3.8% |
| 60 to 89 Minutes | 1,123 | 1.2% |
| 90 or more Minutes | 1,151 | 1.3% |
Commute Time by Sex in Scottsdale
The most common commute times in Scottsdale are 20 to 24 minutes (9,039 commuters, 18.6%) for males and 20 to 24 minutes (7,678 commuters, 17.8%) for females.
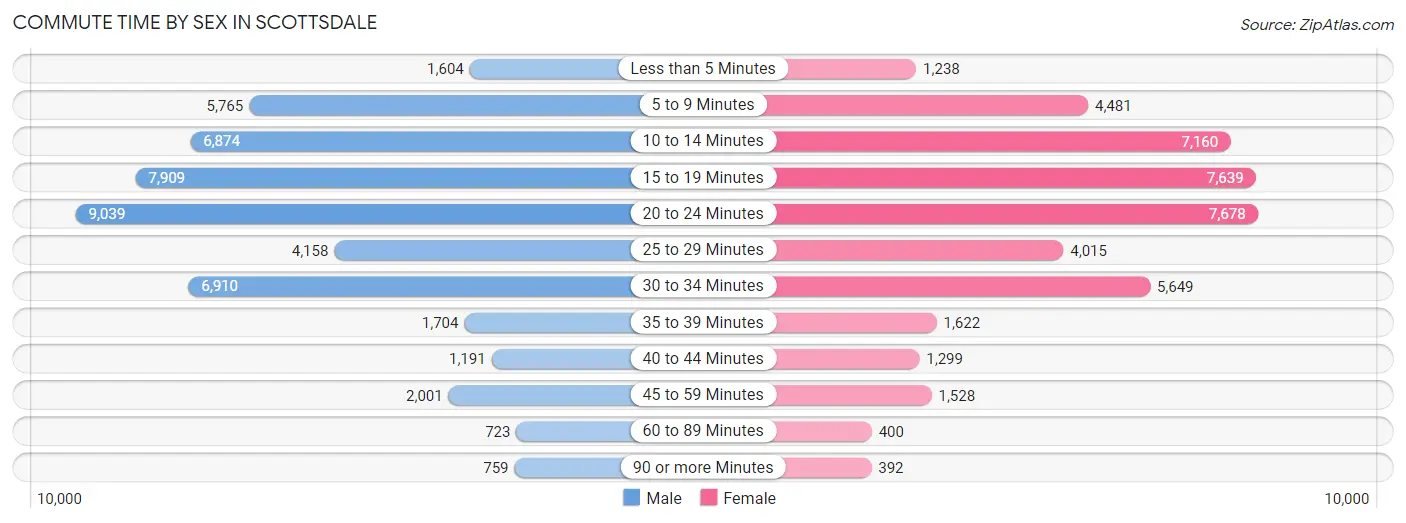
| Commute Time | Male | Female |
| Less than 5 Minutes | 1,604 (3.3%) | 1,238 (2.9%) |
| 5 to 9 Minutes | 5,765 (11.8%) | 4,481 (10.4%) |
| 10 to 14 Minutes | 6,874 (14.1%) | 7,160 (16.6%) |
| 15 to 19 Minutes | 7,909 (16.3%) | 7,639 (17.7%) |
| 20 to 24 Minutes | 9,039 (18.6%) | 7,678 (17.8%) |
| 25 to 29 Minutes | 4,158 (8.6%) | 4,015 (9.3%) |
| 30 to 34 Minutes | 6,910 (14.2%) | 5,649 (13.1%) |
| 35 to 39 Minutes | 1,704 (3.5%) | 1,622 (3.8%) |
| 40 to 44 Minutes | 1,191 (2.5%) | 1,299 (3.0%) |
| 45 to 59 Minutes | 2,001 (4.1%) | 1,528 (3.5%) |
| 60 to 89 Minutes | 723 (1.5%) | 400 (0.9%) |
| 90 or more Minutes | 759 (1.6%) | 392 (0.9%) |
Time of Departure to Work by Sex in Scottsdale
The most frequent times of departure to work in Scottsdale are 7:30 AM to 7:59 AM (7,394, 15.2%) for males and 8:00 AM to 8:29 AM (6,431, 14.9%) for females.
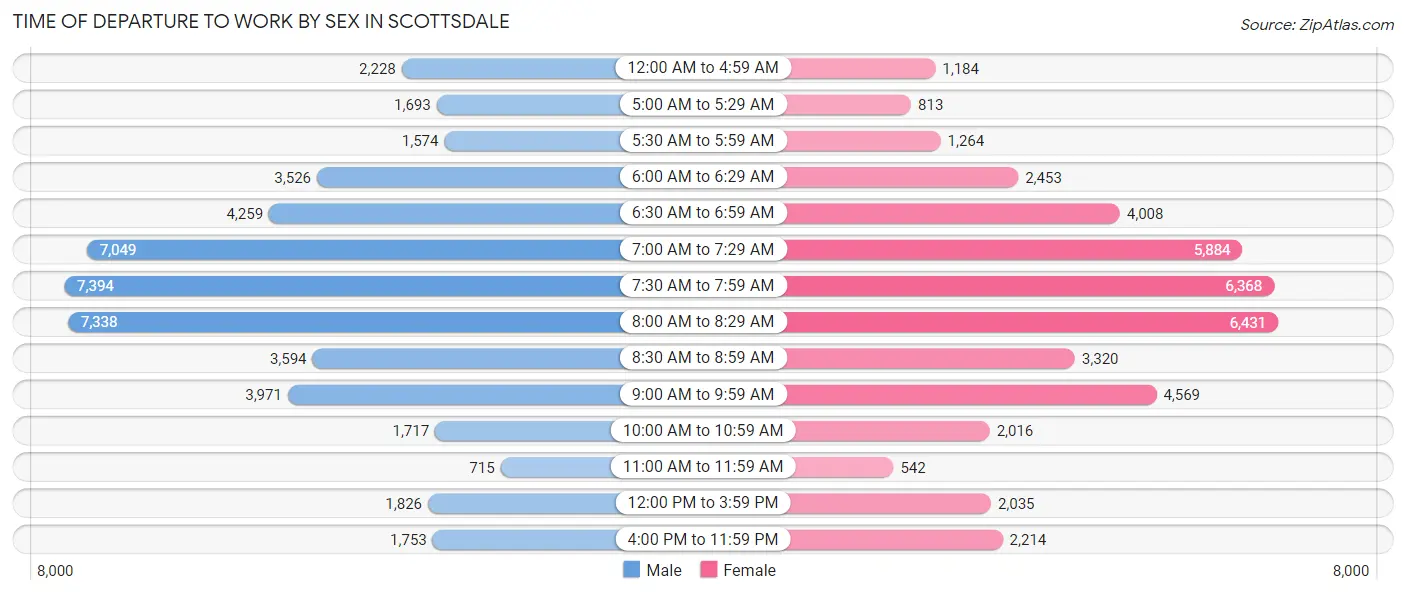
| Time of Departure | Male | Female |
| 12:00 AM to 4:59 AM | 2,228 (4.6%) | 1,184 (2.8%) |
| 5:00 AM to 5:29 AM | 1,693 (3.5%) | 813 (1.9%) |
| 5:30 AM to 5:59 AM | 1,574 (3.2%) | 1,264 (2.9%) |
| 6:00 AM to 6:29 AM | 3,526 (7.2%) | 2,453 (5.7%) |
| 6:30 AM to 6:59 AM | 4,259 (8.8%) | 4,008 (9.3%) |
| 7:00 AM to 7:29 AM | 7,049 (14.5%) | 5,884 (13.7%) |
| 7:30 AM to 7:59 AM | 7,394 (15.2%) | 6,368 (14.8%) |
| 8:00 AM to 8:29 AM | 7,338 (15.1%) | 6,431 (14.9%) |
| 8:30 AM to 8:59 AM | 3,594 (7.4%) | 3,320 (7.7%) |
| 9:00 AM to 9:59 AM | 3,971 (8.2%) | 4,569 (10.6%) |
| 10:00 AM to 10:59 AM | 1,717 (3.5%) | 2,016 (4.7%) |
| 11:00 AM to 11:59 AM | 715 (1.5%) | 542 (1.3%) |
| 12:00 PM to 3:59 PM | 1,826 (3.7%) | 2,035 (4.7%) |
| 4:00 PM to 11:59 PM | 1,753 (3.6%) | 2,214 (5.1%) |
| Total | 48,637 (100.0%) | 43,101 (100.0%) |
Housing Occupancy in Scottsdale
Occupancy by Ownership in Scottsdale
Of the total 115,826 dwellings in Scottsdale, owner-occupied units account for 77,574 (67.0%), while renter-occupied units make up 38,252 (33.0%).
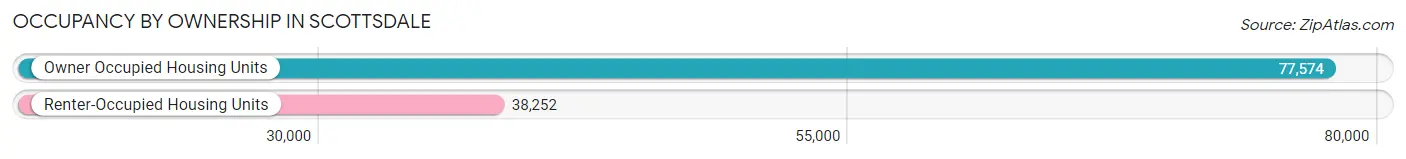
| Occupancy | # Housing Units | % Housing Units |
| Owner Occupied Housing Units | 77,574 | 67.0% |
| Renter-Occupied Housing Units | 38,252 | 33.0% |
| Total Occupied Housing Units | 115,826 | 100.0% |
Occupancy by Household Size in Scottsdale
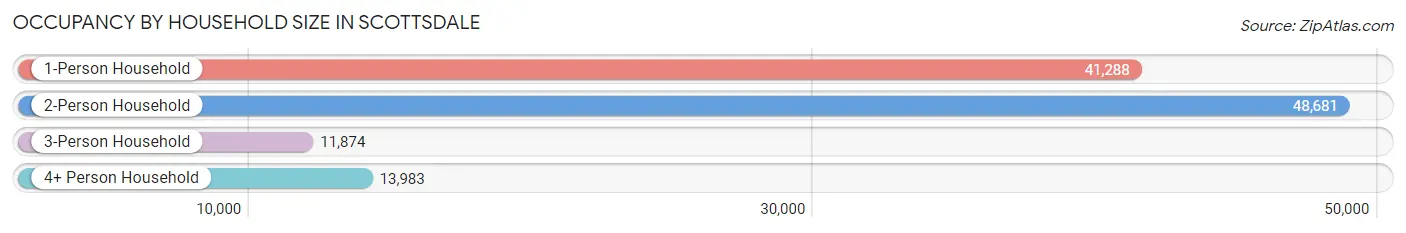
| Household Size | # Housing Units | % Housing Units |
| 1-Person Household | 41,288 | 35.6% |
| 2-Person Household | 48,681 | 42.0% |
| 3-Person Household | 11,874 | 10.2% |
| 4+ Person Household | 13,983 | 12.1% |
| Total Housing Units | 115,826 | 100.0% |
Occupancy by Ownership by Household Size in Scottsdale
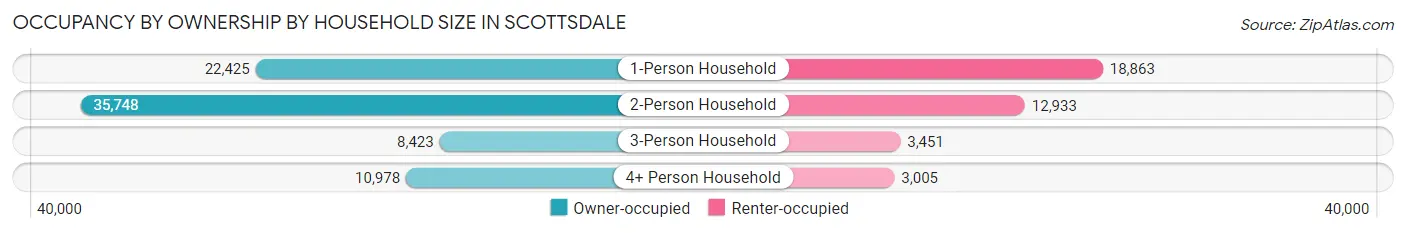
| Household Size | Owner-occupied | Renter-occupied |
| 1-Person Household | 22,425 (54.3%) | 18,863 (45.7%) |
| 2-Person Household | 35,748 (73.4%) | 12,933 (26.6%) |
| 3-Person Household | 8,423 (70.9%) | 3,451 (29.1%) |
| 4+ Person Household | 10,978 (78.5%) | 3,005 (21.5%) |
| Total Housing Units | 77,574 (67.0%) | 38,252 (33.0%) |
Occupancy by Educational Attainment in Scottsdale
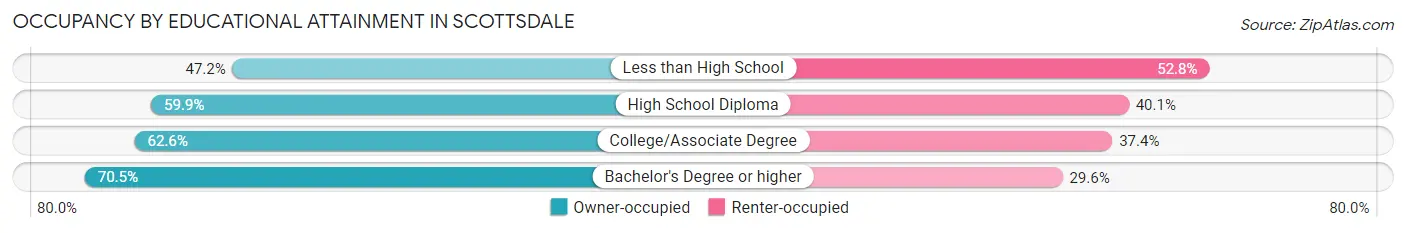
| Household Size | Owner-occupied | Renter-occupied |
| Less than High School | 1,224 (47.2%) | 1,371 (52.8%) |
| High School Diploma | 6,162 (59.9%) | 4,118 (40.1%) |
| College/Associate Degree | 18,601 (62.6%) | 11,130 (37.4%) |
| Bachelor's Degree or higher | 51,587 (70.5%) | 21,633 (29.5%) |
Occupancy by Age of Householder in Scottsdale
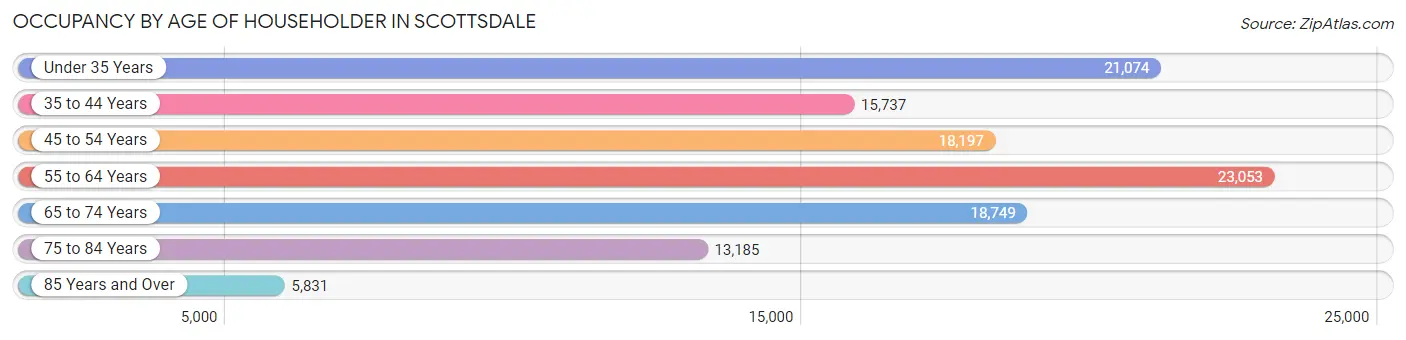
| Age Bracket | # Households | % Households |
| Under 35 Years | 21,074 | 18.2% |
| 35 to 44 Years | 15,737 | 13.6% |
| 45 to 54 Years | 18,197 | 15.7% |
| 55 to 64 Years | 23,053 | 19.9% |
| 65 to 74 Years | 18,749 | 16.2% |
| 75 to 84 Years | 13,185 | 11.4% |
| 85 Years and Over | 5,831 | 5.0% |
| Total | 115,826 | 100.0% |
Housing Finances in Scottsdale
Median Income by Occupancy in Scottsdale
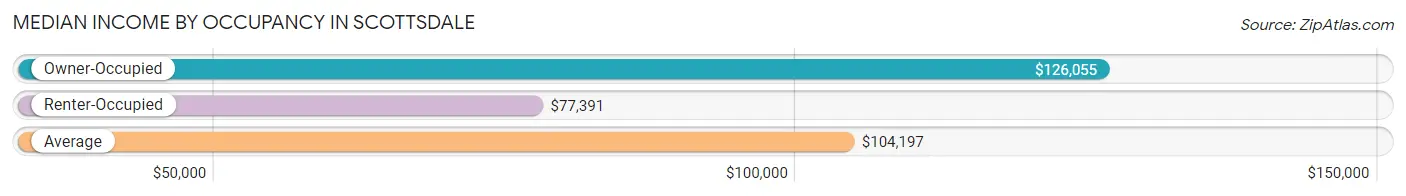
| Occupancy Type | # Households | Median Income |
| Owner-Occupied | 77,574 (67.0%) | $126,055 |
| Renter-Occupied | 38,252 (33.0%) | $77,391 |
| Average | 115,826 (100.0%) | $104,197 |
Occupancy by Householder Income Bracket in Scottsdale
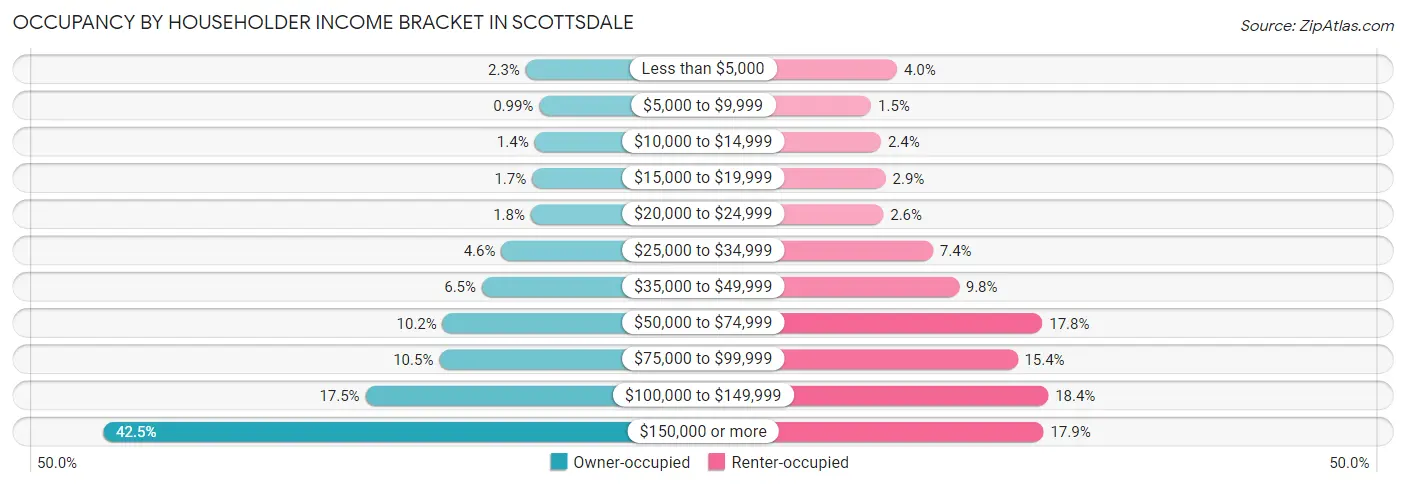
| Income Bracket | Owner-occupied | Renter-occupied |
| Less than $5,000 | 1,768 (2.3%) | 1,512 (4.0%) |
| $5,000 to $9,999 | 769 (1.0%) | 566 (1.5%) |
| $10,000 to $14,999 | 1,119 (1.4%) | 924 (2.4%) |
| $15,000 to $19,999 | 1,296 (1.7%) | 1,095 (2.9%) |
| $20,000 to $24,999 | 1,389 (1.8%) | 1,011 (2.6%) |
| $25,000 to $34,999 | 3,567 (4.6%) | 2,814 (7.4%) |
| $35,000 to $49,999 | 5,007 (6.5%) | 3,762 (9.8%) |
| $50,000 to $74,999 | 7,907 (10.2%) | 6,804 (17.8%) |
| $75,000 to $99,999 | 8,151 (10.5%) | 5,897 (15.4%) |
| $100,000 to $149,999 | 13,605 (17.5%) | 7,021 (18.3%) |
| $150,000 or more | 32,996 (42.5%) | 6,846 (17.9%) |
| Total | 77,574 (100.0%) | 38,252 (100.0%) |
Monthly Housing Cost Tiers in Scottsdale
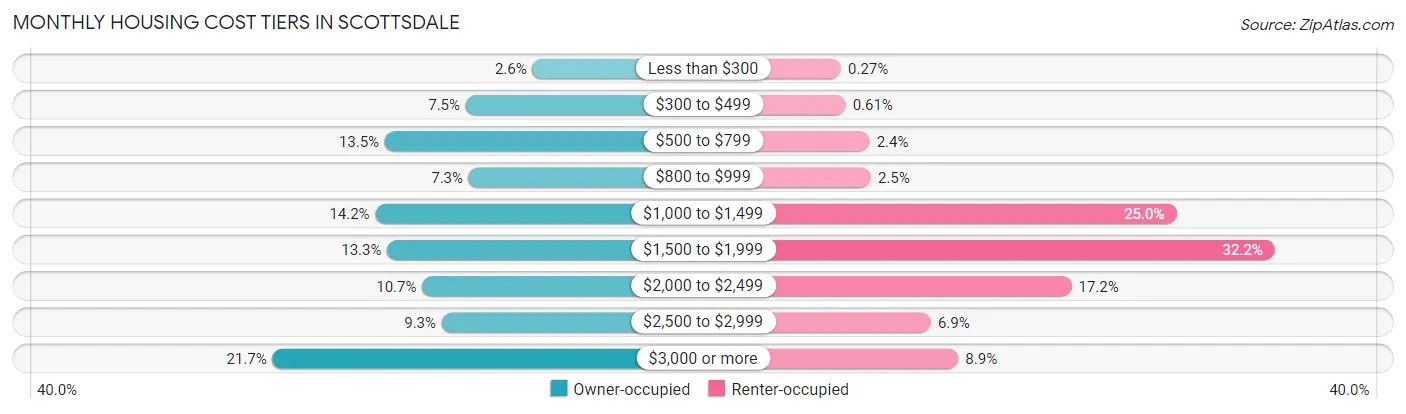
| Monthly Cost | Owner-occupied | Renter-occupied |
| Less than $300 | 2,006 (2.6%) | 102 (0.3%) |
| $300 to $499 | 5,815 (7.5%) | 233 (0.6%) |
| $500 to $799 | 10,445 (13.5%) | 911 (2.4%) |
| $800 to $999 | 5,647 (7.3%) | 945 (2.5%) |
| $1,000 to $1,499 | 10,986 (14.2%) | 9,543 (24.9%) |
| $1,500 to $1,999 | 10,312 (13.3%) | 12,316 (32.2%) |
| $2,000 to $2,499 | 8,306 (10.7%) | 6,594 (17.2%) |
| $2,500 to $2,999 | 7,189 (9.3%) | 2,635 (6.9%) |
| $3,000 or more | 16,868 (21.7%) | 3,410 (8.9%) |
| Total | 77,574 (100.0%) | 38,252 (100.0%) |
Physical Housing Characteristics in Scottsdale
Housing Structures in Scottsdale
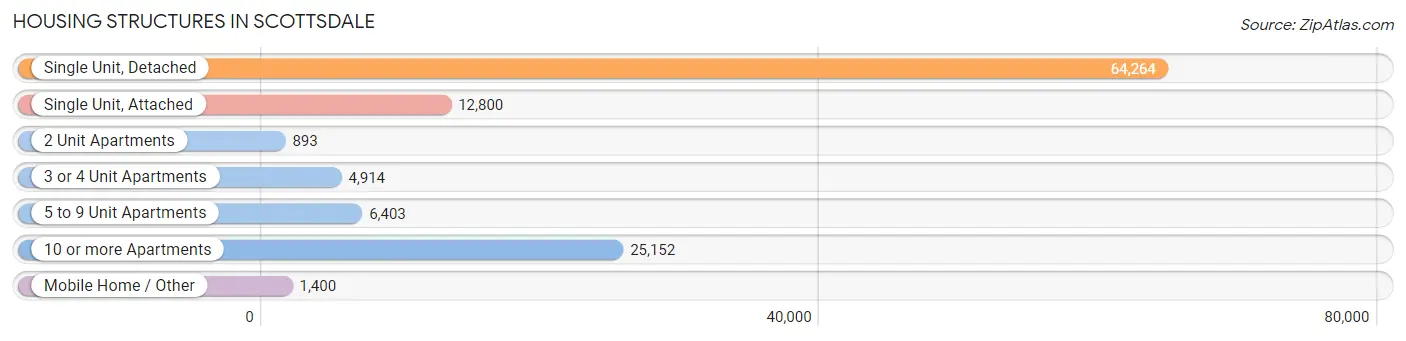
| Structure Type | # Housing Units | % Housing Units |
| Single Unit, Detached | 64,264 | 55.5% |
| Single Unit, Attached | 12,800 | 11.1% |
| 2 Unit Apartments | 893 | 0.8% |
| 3 or 4 Unit Apartments | 4,914 | 4.2% |
| 5 to 9 Unit Apartments | 6,403 | 5.5% |
| 10 or more Apartments | 25,152 | 21.7% |
| Mobile Home / Other | 1,400 | 1.2% |
| Total | 115,826 | 100.0% |
Housing Structures by Occupancy in Scottsdale
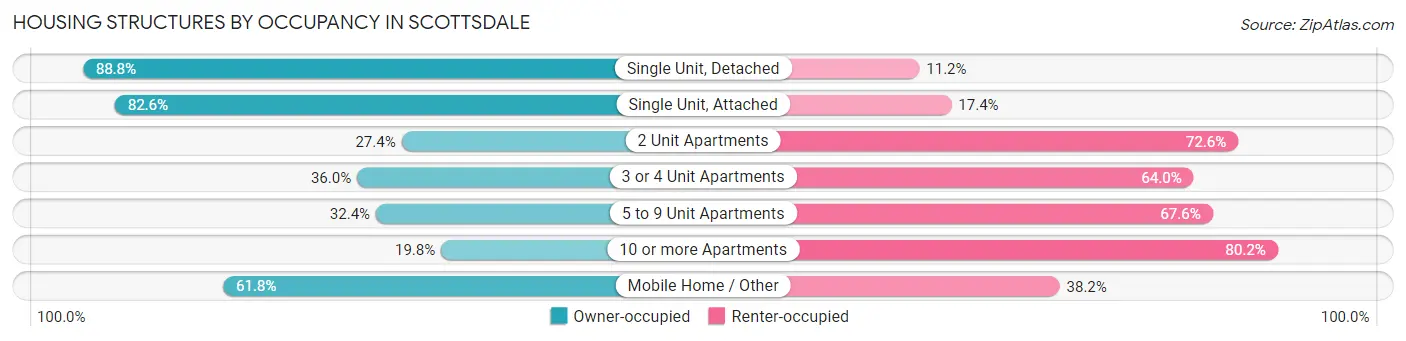
| Structure Type | Owner-occupied | Renter-occupied |
| Single Unit, Detached | 57,062 (88.8%) | 7,202 (11.2%) |
| Single Unit, Attached | 10,577 (82.6%) | 2,223 (17.4%) |
| 2 Unit Apartments | 245 (27.4%) | 648 (72.6%) |
| 3 or 4 Unit Apartments | 1,769 (36.0%) | 3,145 (64.0%) |
| 5 to 9 Unit Apartments | 2,072 (32.4%) | 4,331 (67.6%) |
| 10 or more Apartments | 4,984 (19.8%) | 20,168 (80.2%) |
| Mobile Home / Other | 865 (61.8%) | 535 (38.2%) |
| Total | 77,574 (67.0%) | 38,252 (33.0%) |
Housing Structures by Number of Rooms in Scottsdale
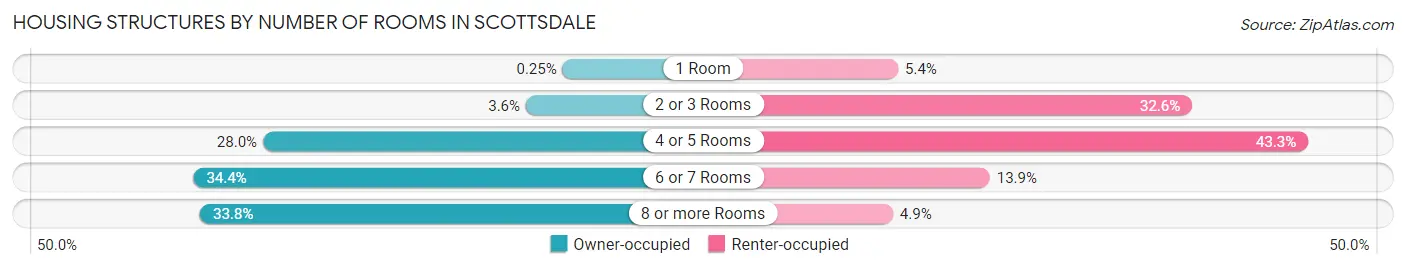
| Number of Rooms | Owner-occupied | Renter-occupied |
| 1 Room | 195 (0.3%) | 2,059 (5.4%) |
| 2 or 3 Rooms | 2,824 (3.6%) | 12,456 (32.6%) |
| 4 or 5 Rooms | 21,690 (28.0%) | 16,561 (43.3%) |
| 6 or 7 Rooms | 26,668 (34.4%) | 5,302 (13.9%) |
| 8 or more Rooms | 26,197 (33.8%) | 1,874 (4.9%) |
| Total | 77,574 (100.0%) | 38,252 (100.0%) |
Housing Structure by Heating Type in Scottsdale
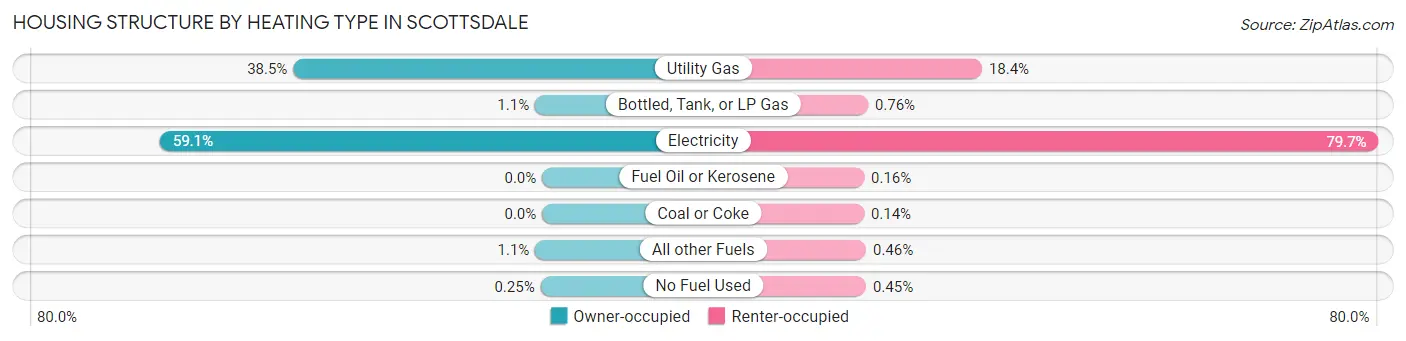
| Heating Type | Owner-occupied | Renter-occupied |
| Utility Gas | 29,852 (38.5%) | 7,029 (18.4%) |
| Bottled, Tank, or LP Gas | 850 (1.1%) | 289 (0.8%) |
| Electricity | 45,847 (59.1%) | 30,474 (79.7%) |
| Fuel Oil or Kerosene | 0 (0.0%) | 60 (0.2%) |
| Coal or Coke | 0 (0.0%) | 53 (0.1%) |
| All other Fuels | 829 (1.1%) | 176 (0.5%) |
| No Fuel Used | 196 (0.3%) | 171 (0.4%) |
| Total | 77,574 (100.0%) | 38,252 (100.0%) |
Household Vehicle Usage in Scottsdale
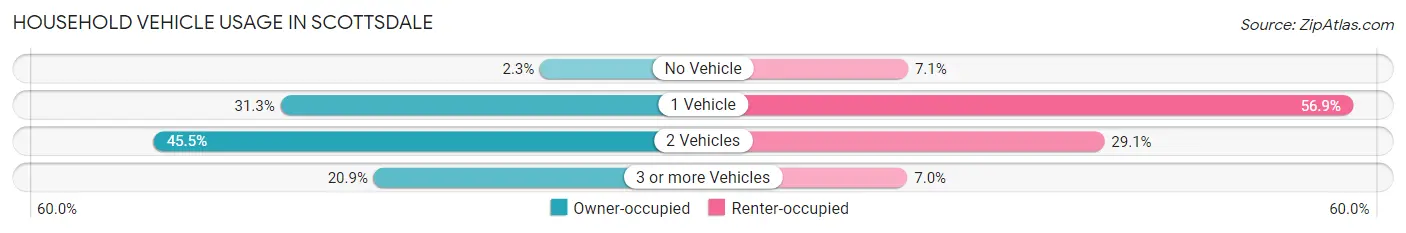
| Vehicles per Household | Owner-occupied | Renter-occupied |
| No Vehicle | 1,748 (2.2%) | 2,702 (7.1%) |
| 1 Vehicle | 24,303 (31.3%) | 21,756 (56.9%) |
| 2 Vehicles | 35,320 (45.5%) | 11,119 (29.1%) |
| 3 or more Vehicles | 16,203 (20.9%) | 2,675 (7.0%) |
| Total | 77,574 (100.0%) | 38,252 (100.0%) |
Real Estate & Mortgages in Scottsdale
Real Estate and Mortgage Overview in Scottsdale
| Characteristic | Without Mortgage | With Mortgage |
| Housing Units | 29,139 | 48,435 |
| Median Property Value | $634,800 | $660,700 |
| Median Household Income | $96,884 | $23,684 |
| Monthly Housing Costs | $707 | $16,488 |
| Real Estate Taxes | $2,988 | $676 |
Property Value by Mortgage Status in Scottsdale
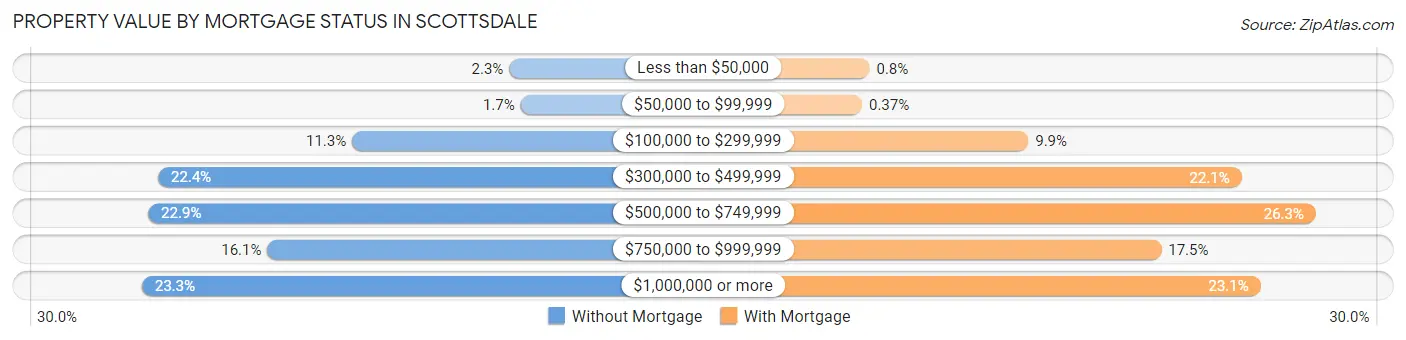
| Property Value | Without Mortgage | With Mortgage |
| Less than $50,000 | 672 (2.3%) | 387 (0.8%) |
| $50,000 to $99,999 | 484 (1.7%) | 179 (0.4%) |
| $100,000 to $299,999 | 3,289 (11.3%) | 4,781 (9.9%) |
| $300,000 to $499,999 | 6,521 (22.4%) | 10,684 (22.1%) |
| $500,000 to $749,999 | 6,685 (22.9%) | 12,736 (26.3%) |
| $750,000 to $999,999 | 4,700 (16.1%) | 8,460 (17.5%) |
| $1,000,000 or more | 6,788 (23.3%) | 11,208 (23.1%) |
| Total | 29,139 (100.0%) | 48,435 (100.0%) |
Household Income by Mortgage Status in Scottsdale
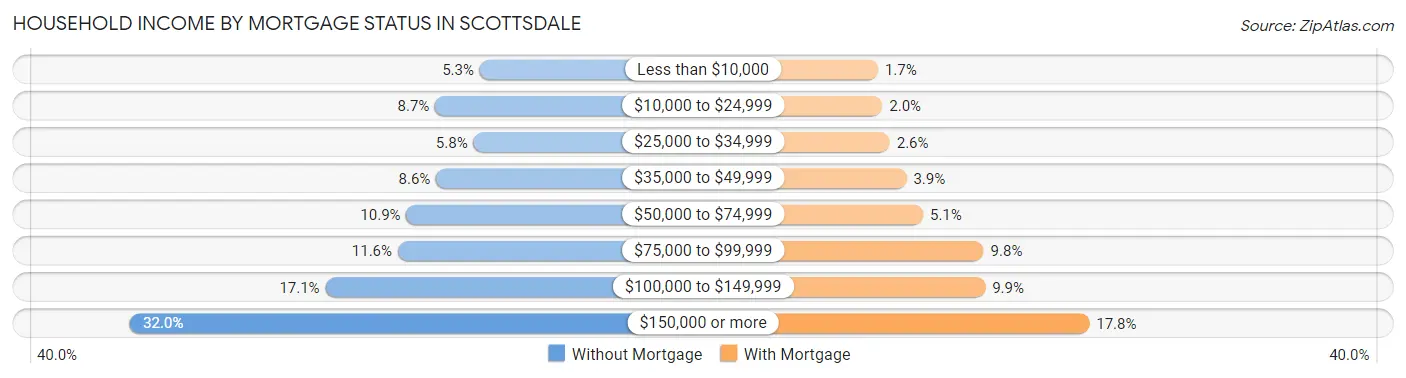
| Household Income | Without Mortgage | With Mortgage |
| Less than $10,000 | 1,551 (5.3%) | 830 (1.7%) |
| $10,000 to $24,999 | 2,542 (8.7%) | 986 (2.0%) |
| $25,000 to $34,999 | 1,690 (5.8%) | 1,262 (2.6%) |
| $35,000 to $49,999 | 2,519 (8.6%) | 1,877 (3.9%) |
| $50,000 to $74,999 | 3,180 (10.9%) | 2,488 (5.1%) |
| $75,000 to $99,999 | 3,368 (11.6%) | 4,727 (9.8%) |
| $100,000 to $149,999 | 4,977 (17.1%) | 4,783 (9.9%) |
| $150,000 or more | 9,312 (32.0%) | 8,628 (17.8%) |
| Total | 29,139 (100.0%) | 48,435 (100.0%) |
Property Value to Household Income Ratio in Scottsdale
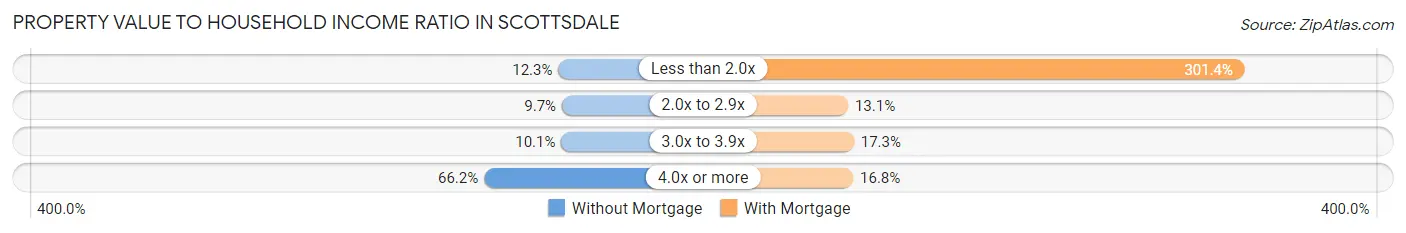
| Value-to-Income Ratio | Without Mortgage | With Mortgage |
| Less than 2.0x | 3,587 (12.3%) | 145,986 (301.4%) |
| 2.0x to 2.9x | 2,814 (9.7%) | 6,357 (13.1%) |
| 3.0x to 3.9x | 2,939 (10.1%) | 8,393 (17.3%) |
| 4.0x or more | 19,299 (66.2%) | 8,153 (16.8%) |
| Total | 29,139 (100.0%) | 48,435 (100.0%) |
Real Estate Taxes by Mortgage Status in Scottsdale
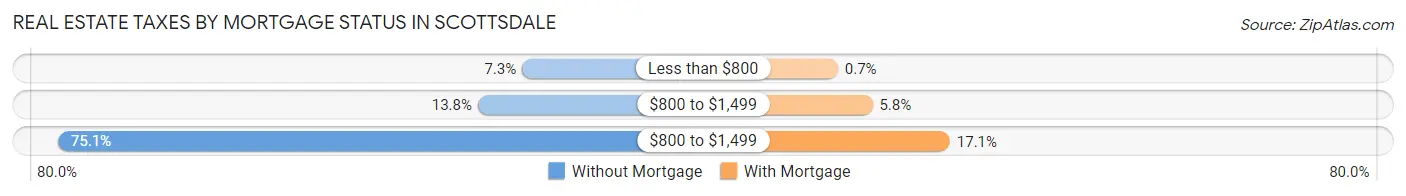
| Property Taxes | Without Mortgage | With Mortgage |
| Less than $800 | 2,131 (7.3%) | 338 (0.7%) |
| $800 to $1,499 | 4,014 (13.8%) | 2,789 (5.8%) |
| $800 to $1,499 | 21,893 (75.1%) | 8,269 (17.1%) |
| Total | 29,139 (100.0%) | 48,435 (100.0%) |
Health & Disability in Scottsdale
Health Insurance Coverage by Age in Scottsdale
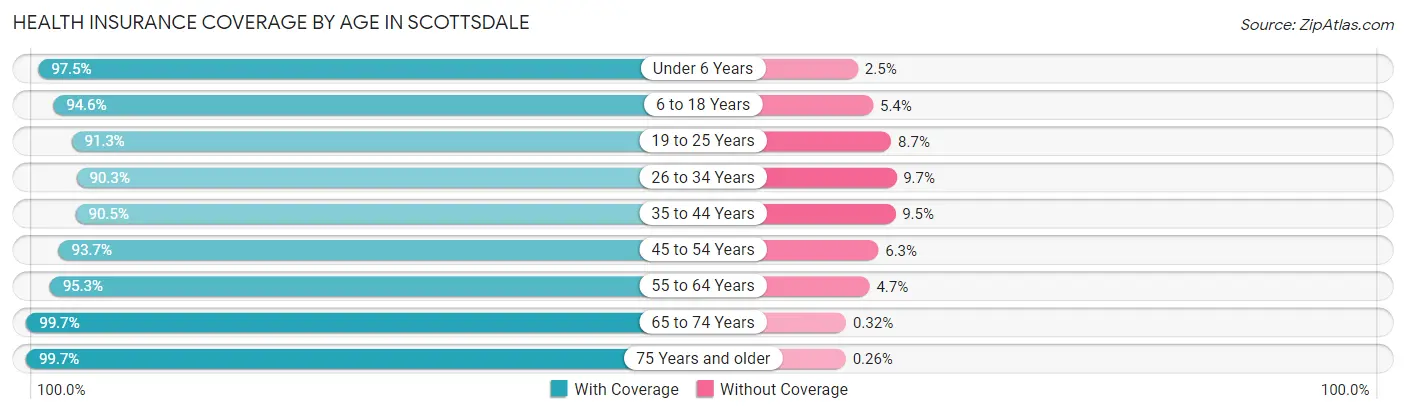
| Age Bracket | With Coverage | Without Coverage |
| Under 6 Years | 9,187 (97.5%) | 239 (2.5%) |
| 6 to 18 Years | 25,178 (94.6%) | 1,427 (5.4%) |
| 19 to 25 Years | 17,313 (91.3%) | 1,659 (8.7%) |
| 26 to 34 Years | 26,064 (90.3%) | 2,794 (9.7%) |
| 35 to 44 Years | 23,817 (90.5%) | 2,499 (9.5%) |
| 45 to 54 Years | 30,141 (93.7%) | 2,040 (6.3%) |
| 55 to 64 Years | 35,589 (95.3%) | 1,751 (4.7%) |
| 65 to 74 Years | 30,824 (99.7%) | 99 (0.3%) |
| 75 Years and older | 28,304 (99.7%) | 73 (0.3%) |
| Total | 226,417 (94.7%) | 12,581 (5.3%) |
Health Insurance Coverage by Citizenship Status in Scottsdale
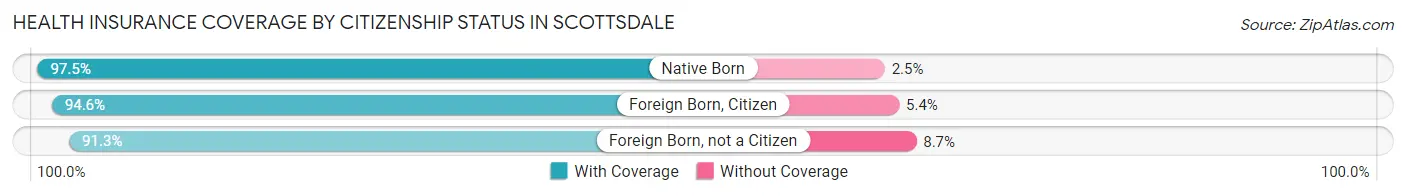
| Citizenship Status | With Coverage | Without Coverage |
| Native Born | 9,187 (97.5%) | 239 (2.5%) |
| Foreign Born, Citizen | 25,178 (94.6%) | 1,427 (5.4%) |
| Foreign Born, not a Citizen | 17,313 (91.3%) | 1,659 (8.7%) |
Health Insurance Coverage by Household Income in Scottsdale
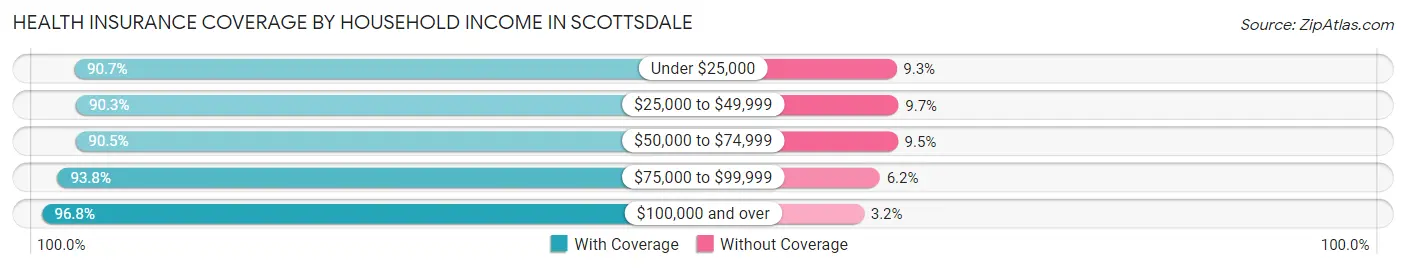
| Household Income | With Coverage | Without Coverage |
| Under $25,000 | 14,688 (90.7%) | 1,502 (9.3%) |
| $25,000 to $49,999 | 21,283 (90.3%) | 2,277 (9.7%) |
| $50,000 to $74,999 | 23,140 (90.5%) | 2,436 (9.5%) |
| $75,000 to $99,999 | 25,305 (93.8%) | 1,664 (6.2%) |
| $100,000 and over | 141,212 (96.8%) | 4,644 (3.2%) |
Public vs Private Health Insurance Coverage by Age in Scottsdale
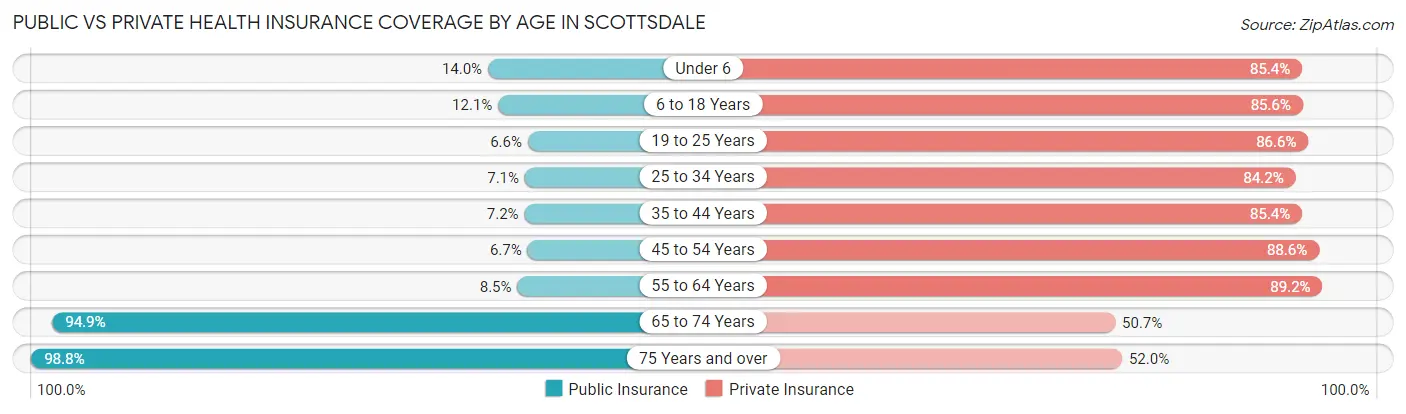
| Age Bracket | Public Insurance | Private Insurance |
| Under 6 | 1,320 (14.0%) | 8,052 (85.4%) |
| 6 to 18 Years | 3,218 (12.1%) | 22,760 (85.6%) |
| 19 to 25 Years | 1,252 (6.6%) | 16,425 (86.6%) |
| 25 to 34 Years | 2,060 (7.1%) | 24,301 (84.2%) |
| 35 to 44 Years | 1,900 (7.2%) | 22,481 (85.4%) |
| 45 to 54 Years | 2,139 (6.7%) | 28,502 (88.6%) |
| 55 to 64 Years | 3,189 (8.5%) | 33,307 (89.2%) |
| 65 to 74 Years | 29,331 (94.9%) | 15,686 (50.7%) |
| 75 Years and over | 28,025 (98.8%) | 14,760 (52.0%) |
| Total | 72,434 (30.3%) | 186,274 (77.9%) |
Disability Status by Sex by Age in Scottsdale
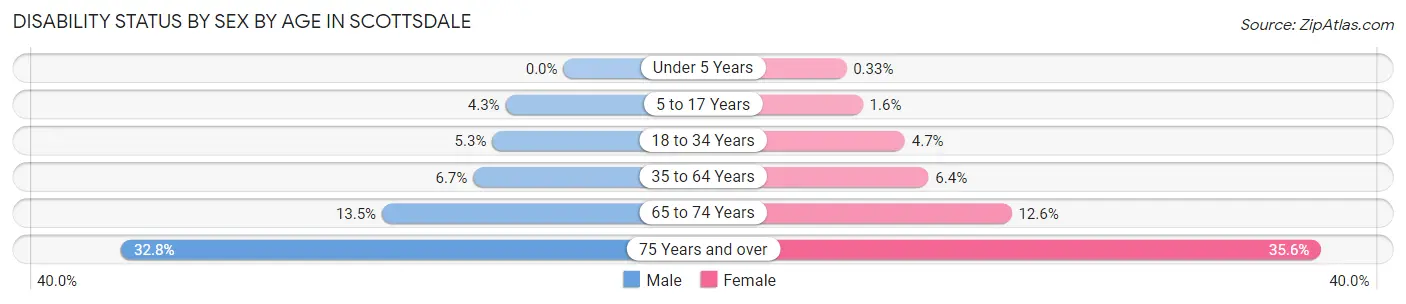
| Age Bracket | Male | Female |
| Under 5 Years | 0 (0.0%) | 13 (0.3%) |
| 5 to 17 Years | 601 (4.3%) | 191 (1.5%) |
| 18 to 34 Years | 1,332 (5.3%) | 1,137 (4.7%) |
| 35 to 64 Years | 3,120 (6.7%) | 3,170 (6.4%) |
| 65 to 74 Years | 1,970 (13.5%) | 2,054 (12.6%) |
| 75 Years and over | 3,966 (32.8%) | 5,799 (35.6%) |
Disability Class by Sex by Age in Scottsdale
Disability Class: Hearing Difficulty
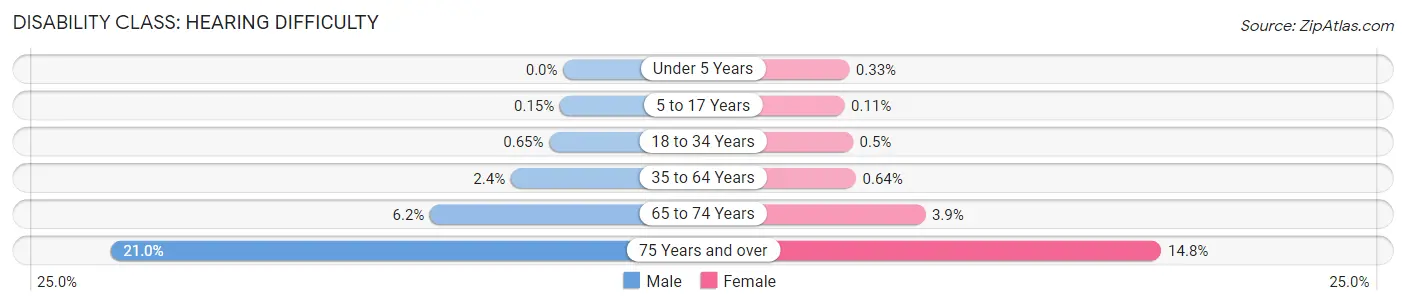
| Age Bracket | Male | Female |
| Under 5 Years | 0 (0.0%) | 13 (0.3%) |
| 5 to 17 Years | 21 (0.2%) | 14 (0.1%) |
| 18 to 34 Years | 165 (0.6%) | 121 (0.5%) |
| 35 to 64 Years | 1,131 (2.4%) | 314 (0.6%) |
| 65 to 74 Years | 904 (6.2%) | 629 (3.9%) |
| 75 Years and over | 2,539 (21.0%) | 2,415 (14.8%) |
Disability Class: Vision Difficulty
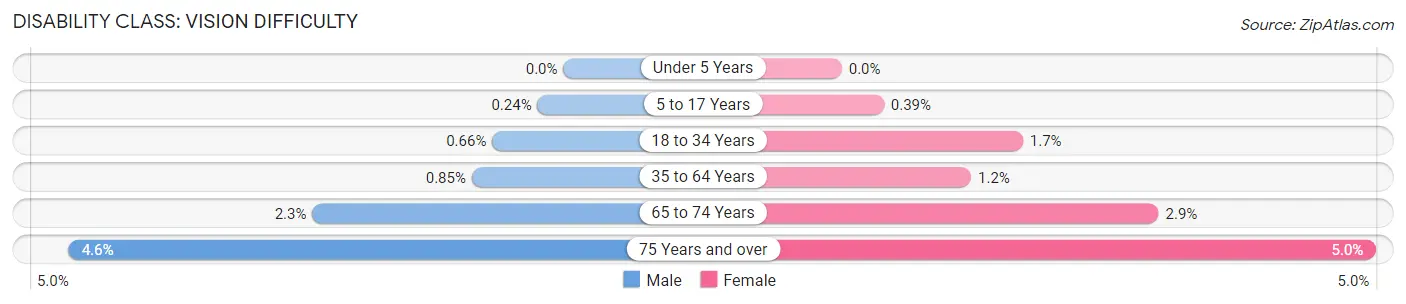
| Age Bracket | Male | Female |
| Under 5 Years | 0 (0.0%) | 0 (0.0%) |
| 5 to 17 Years | 33 (0.2%) | 48 (0.4%) |
| 18 to 34 Years | 166 (0.7%) | 409 (1.7%) |
| 35 to 64 Years | 397 (0.9%) | 589 (1.2%) |
| 65 to 74 Years | 340 (2.3%) | 479 (2.9%) |
| 75 Years and over | 554 (4.6%) | 806 (5.0%) |
Disability Class: Cognitive Difficulty
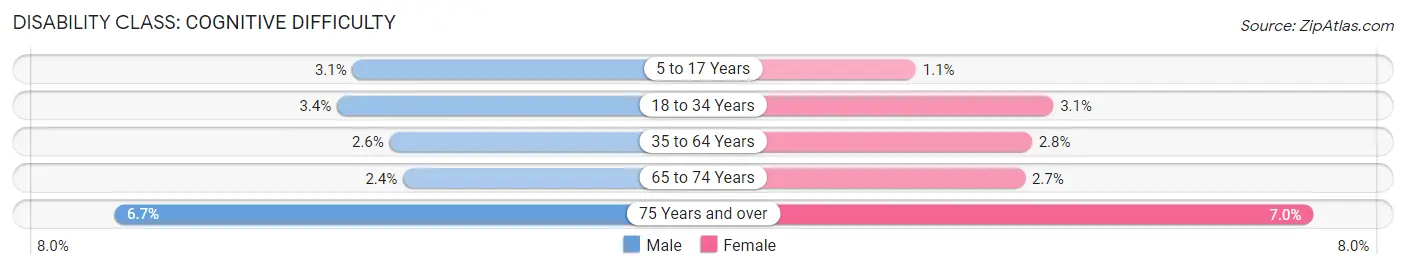
| Age Bracket | Male | Female |
| 5 to 17 Years | 437 (3.1%) | 135 (1.1%) |
| 18 to 34 Years | 848 (3.4%) | 762 (3.1%) |
| 35 to 64 Years | 1,199 (2.6%) | 1,389 (2.8%) |
| 65 to 74 Years | 348 (2.4%) | 444 (2.7%) |
| 75 Years and over | 806 (6.7%) | 1,141 (7.0%) |
Disability Class: Ambulatory Difficulty
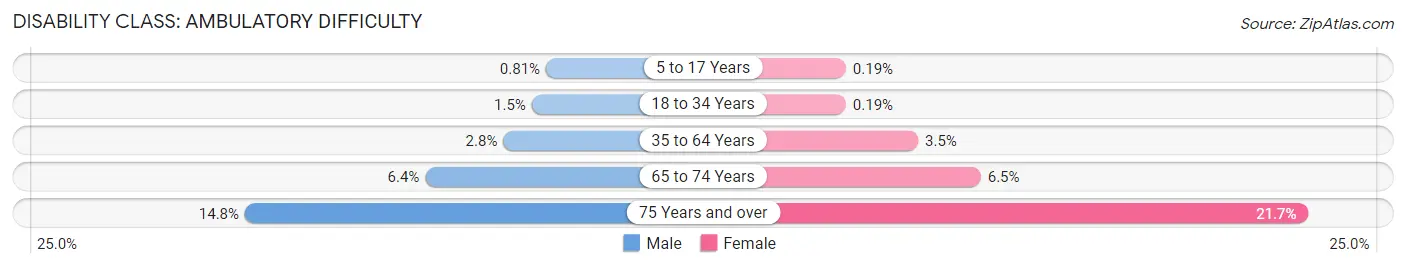
| Age Bracket | Male | Female |
| 5 to 17 Years | 113 (0.8%) | 24 (0.2%) |
| 18 to 34 Years | 370 (1.5%) | 46 (0.2%) |
| 35 to 64 Years | 1,301 (2.8%) | 1,742 (3.5%) |
| 65 to 74 Years | 937 (6.4%) | 1,052 (6.5%) |
| 75 Years and over | 1,786 (14.8%) | 3,528 (21.6%) |
Disability Class: Self-Care Difficulty
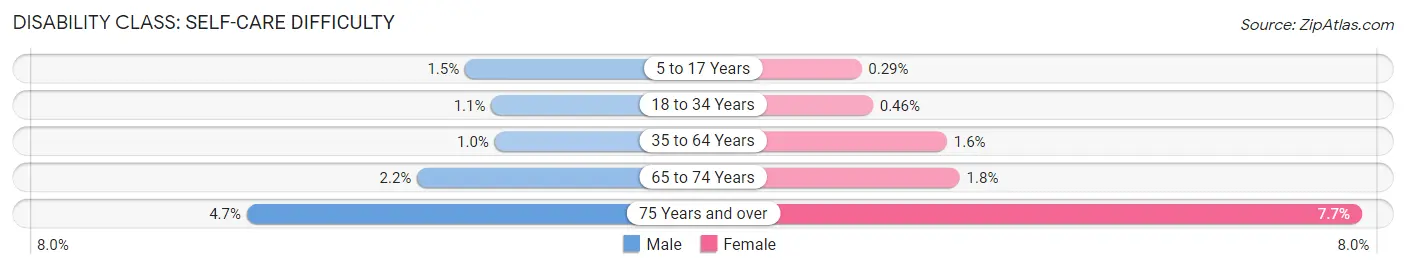
| Age Bracket | Male | Female |
| 5 to 17 Years | 204 (1.5%) | 36 (0.3%) |
| 18 to 34 Years | 269 (1.1%) | 112 (0.5%) |
| 35 to 64 Years | 473 (1.0%) | 771 (1.6%) |
| 65 to 74 Years | 318 (2.2%) | 286 (1.8%) |
| 75 Years and over | 568 (4.7%) | 1,258 (7.7%) |
Technology Access in Scottsdale
Computing Device Access in Scottsdale
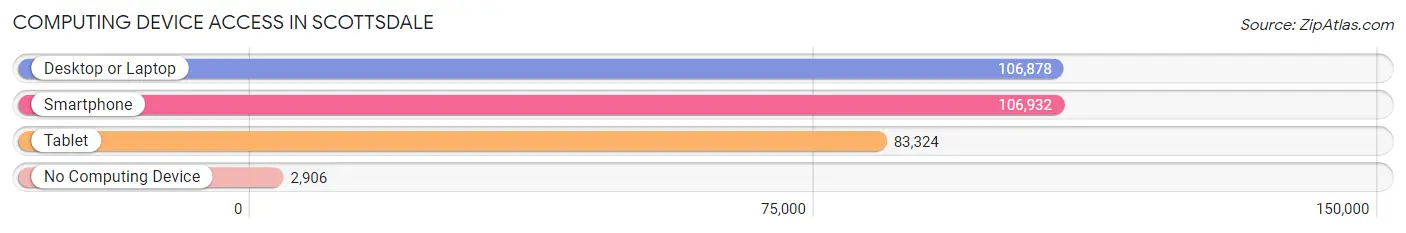
| Device Type | # Households | % Households |
| Desktop or Laptop | 106,878 | 92.3% |
| Smartphone | 106,932 | 92.3% |
| Tablet | 83,324 | 71.9% |
| No Computing Device | 2,906 | 2.5% |
| Total | 115,826 | 100.0% |
Internet Access in Scottsdale
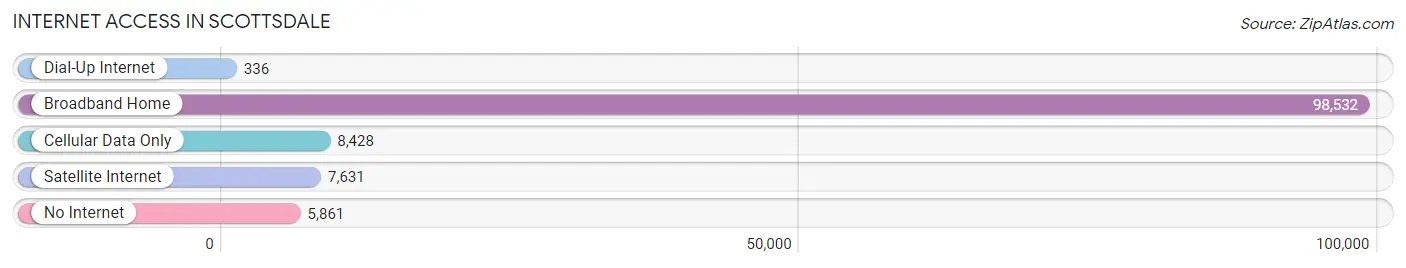
| Internet Type | # Households | % Households |
| Dial-Up Internet | 336 | 0.3% |
| Broadband Home | 98,532 | 85.1% |
| Cellular Data Only | 8,428 | 7.3% |
| Satellite Internet | 7,631 | 6.6% |
| No Internet | 5,861 | 5.1% |
| Total | 115,826 | 100.0% |
Scottsdale Summary
Scottsdale, Arizona is a city located in the eastern part of Maricopa County, Arizona. It is part of the Greater Phoenix metropolitan area and is the sixth-largest city in the state. Scottsdale is known for its upscale shopping, dining, and entertainment, as well as its vibrant nightlife. The city is also home to a number of golf courses, resorts, and spas.
Geography
Scottsdale is located in the Sonoran Desert, which is characterized by hot, dry summers and mild winters. The city is bordered by the McDowell Mountains to the east, the Verde River to the north, and the Salt River to the south. The city covers an area of 184.2 square miles, with an elevation of 1,085 feet above sea level.
Economy
Scottsdale is a major economic center in the Phoenix metropolitan area. The city is home to a number of corporate headquarters, including GoDaddy, Discount Tire, and Insight Enterprises. The city is also home to a number of technology companies, such as Infusionsoft and WebPT. Tourism is also a major industry in Scottsdale, with the city attracting over 8 million visitors each year.
Demographics
As of the 2020 census, Scottsdale had a population of 255,310. The city has a median age of 42.7 years, with a gender ratio of 49.7% male and 50.3% female. The racial makeup of the city is 79.2% White, 4.3% Black or African American, 3.2% Asian, 0.3% Native American, and 0.1% Pacific Islander. The city also has a large Hispanic or Latino population, making up 16.2% of the population.
History
Scottsdale was founded in 1888 by U.S. Army Chaplain Winfield Scott. The city was originally a small farming community, but it quickly grew into a popular tourist destination due to its proximity to the nearby Grand Canyon. In the 1950s, the city began to experience a population boom, as people moved to the area for its warm climate and low cost of living. In the 1960s, the city began to develop its reputation as a shopping and entertainment destination, with the opening of the Scottsdale Fashion Square mall in 1961. The city has continued to grow and develop over the years, and today it is a major economic and cultural center in the Phoenix metropolitan area.
Common Questions
What is Per Capita Income in Scottsdale?
Per Capita income in Scottsdale is $77,594.
What is the Median Family Income in Scottsdale?
Median Family Income in Scottsdale is $140,883.
What is the Median Household income in Scottsdale?
Median Household Income in Scottsdale is $104,197.
What is Income or Wage Gap in Scottsdale?
Income or Wage Gap in Scottsdale is 30.7%.
Women in Scottsdale earn 69.3 cents for every dollar earned by a man.
What is Family Income Deficit in Scottsdale?
Family Income Deficit in Scottsdale is $13,410.
Families that are below poverty line in Scottsdale earn $13,410 less on average than the poverty threshold level.
What is Inequality or Gini Index in Scottsdale?
Inequality or Gini Index in Scottsdale is 0.51.
What is the Total Population of Scottsdale?
Total Population of Scottsdale is 240,537.
What is the Total Male Population of Scottsdale?
Total Male Population of Scottsdale is 117,177.
What is the Total Female Population of Scottsdale?
Total Female Population of Scottsdale is 123,360.
What is the Ratio of Males per 100 Females in Scottsdale?
There are 94.99 Males per 100 Females in Scottsdale.
What is the Ratio of Females per 100 Males in Scottsdale?
There are 105.28 Females per 100 Males in Scottsdale.
What is the Median Population Age in Scottsdale?
Median Population Age in Scottsdale is 48.4 Years.
What is the Average Family Size in Scottsdale
Average Family Size in Scottsdale is 2.7 People.
What is the Average Household Size in Scottsdale
Average Household Size in Scottsdale is 2.1 People.
How Large is the Labor Force in Scottsdale?
There are 131,529 People in the Labor Forcein in Scottsdale.
What is the Percentage of People in the Labor Force in Scottsdale?
62.4% of People are in the Labor Force in Scottsdale.
What is the Unemployment Rate in Scottsdale?
Unemployment Rate in Scottsdale is 3.5%.