New Lenox, IL Map & Demographics
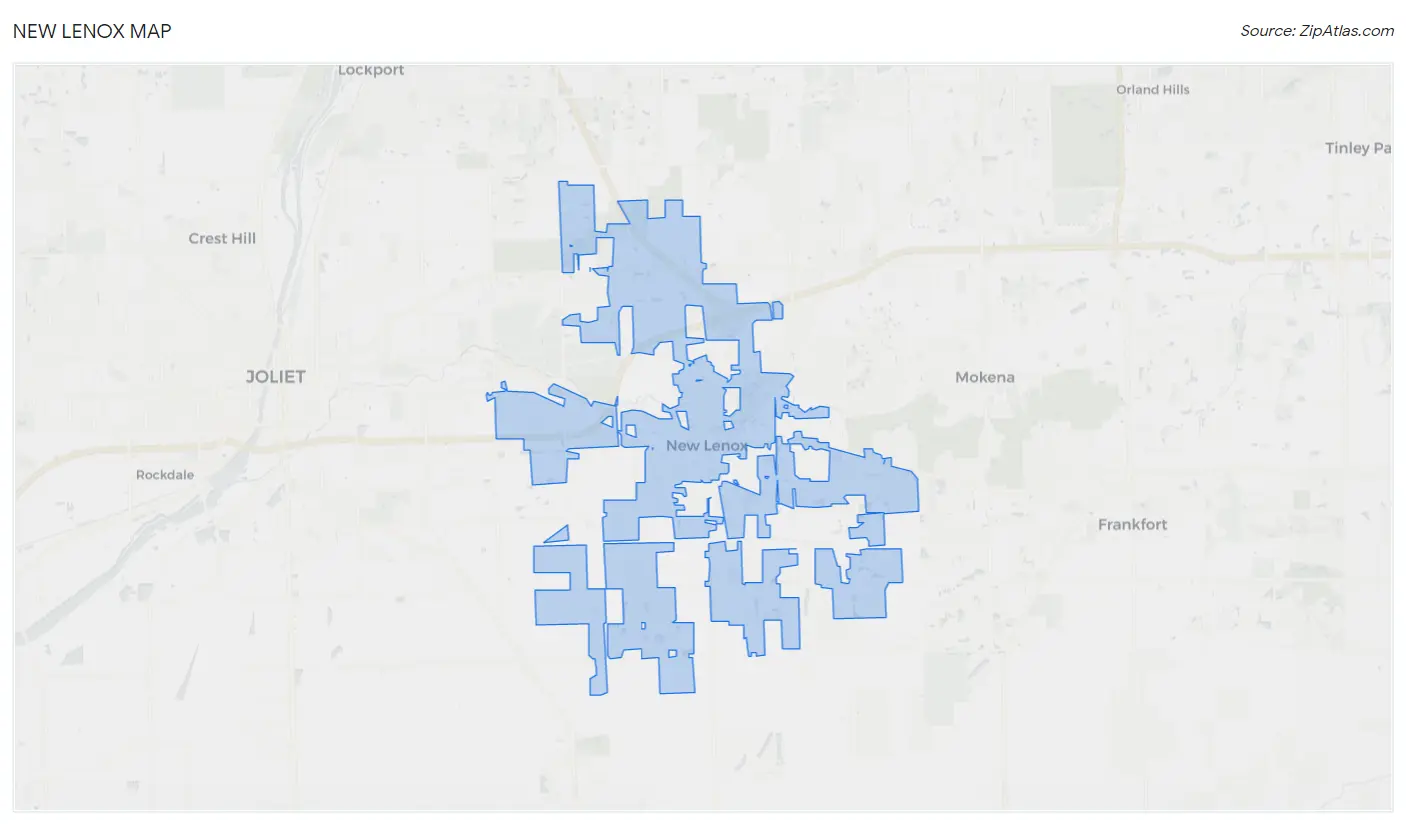
New Lenox Map
New Lenox Overview
$47,780
PER CAPITA INCOME
$144,297
AVG FAMILY INCOME
$129,797
AVG HOUSEHOLD INCOME
43.3%
WAGE / INCOME GAP [ % ]
56.7¢/ $1
WAGE / INCOME GAP [ $ ]
$9,749
FAMILY INCOME DEFICIT
0.32
INEQUALITY / GINI INDEX
27,242
TOTAL POPULATION
14,079
MALE POPULATION
13,163
FEMALE POPULATION
106.96
MALES / 100 FEMALES
93.49
FEMALES / 100 MALES
37.0
MEDIAN AGE
3.4
AVG FAMILY SIZE
3.0
AVG HOUSEHOLD SIZE
14,788
LABOR FORCE [ PEOPLE ]
72.9%
PERCENT IN LABOR FORCE
2.8%
UNEMPLOYMENT RATE
New Lenox Zip Codes
Income in New Lenox
Income Overview in New Lenox
Per Capita Income in New Lenox is $47,780, while median incomes of families and households are $144,297 and $129,797 respectively.
| Characteristic | Number | Measure |
| Per Capita Income | 27,242 | $47,780 |
| Median Family Income | 7,454 | $144,297 |
| Mean Family Income | 7,454 | $154,024 |
| Median Household Income | 9,006 | $129,797 |
| Mean Household Income | 9,006 | $141,857 |
| Income Deficit | 7,454 | $9,749 |
| Wage / Income Gap (%) | 27,242 | 43.34% |
| Wage / Income Gap ($) | 27,242 | 56.66¢ per $1 |
| Gini / Inequality Index | 27,242 | 0.32 |
Earnings by Sex in New Lenox
Average Earnings in New Lenox are $63,040, $85,000 for men and $48,159 for women, a difference of 43.3%.
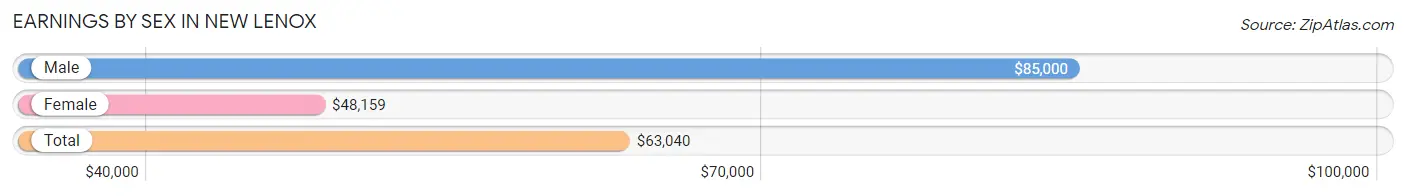
| Sex | Number | Average Earnings |
| Male | 8,206 (54.0%) | $85,000 |
| Female | 6,977 (46.0%) | $48,159 |
| Total | 15,183 (100.0%) | $63,040 |
Earnings by Sex by Income Bracket in New Lenox
The most common earnings brackets in New Lenox are $100,000+ for men (3,181 | 38.8%) and $75,000 to $99,999 for women (977 | 14.0%).
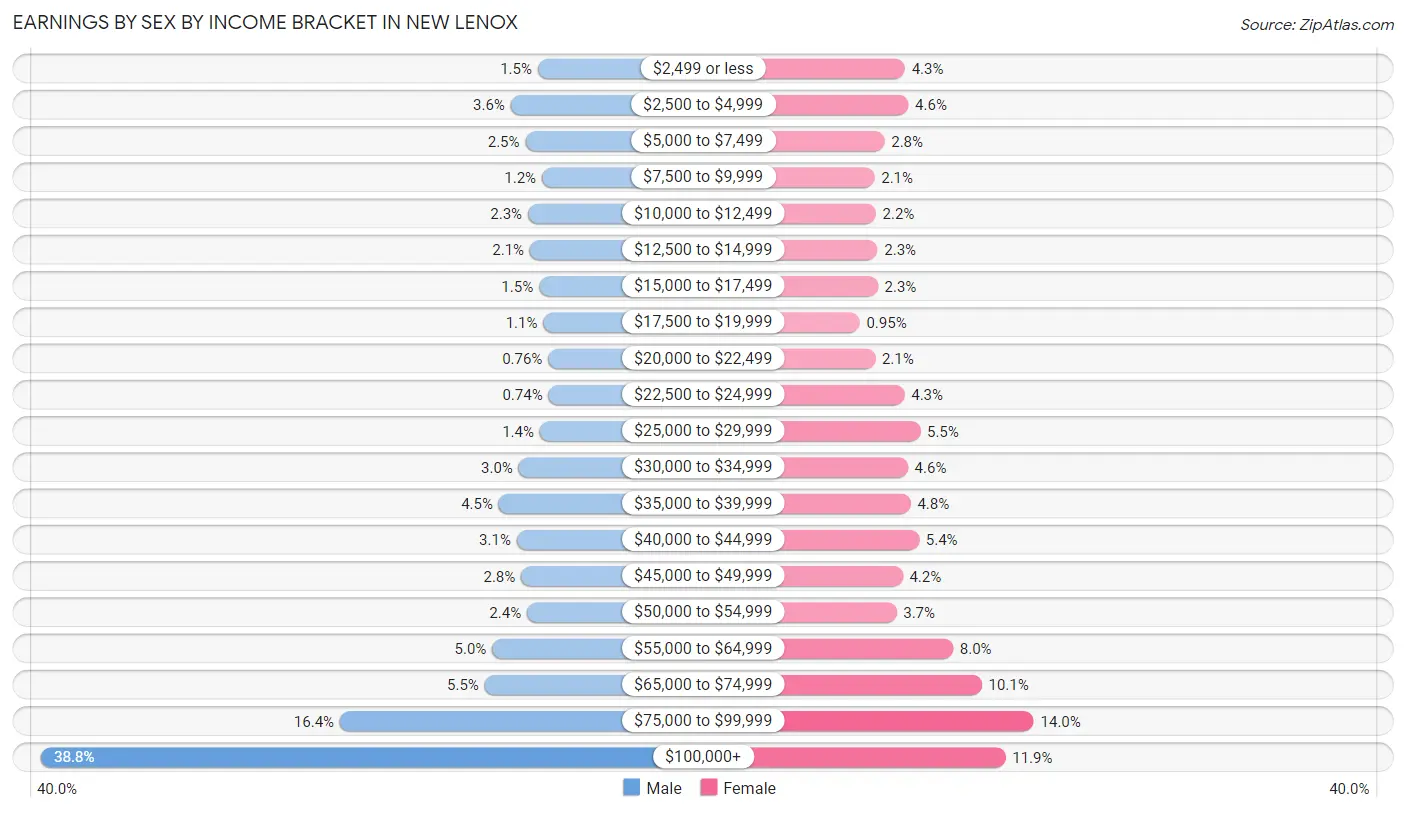
| Income | Male | Female |
| $2,499 or less | 126 (1.5%) | 303 (4.3%) |
| $2,500 to $4,999 | 293 (3.6%) | 321 (4.6%) |
| $5,000 to $7,499 | 203 (2.5%) | 196 (2.8%) |
| $7,500 to $9,999 | 101 (1.2%) | 144 (2.1%) |
| $10,000 to $12,499 | 187 (2.3%) | 151 (2.2%) |
| $12,500 to $14,999 | 175 (2.1%) | 160 (2.3%) |
| $15,000 to $17,499 | 119 (1.5%) | 161 (2.3%) |
| $17,500 to $19,999 | 93 (1.1%) | 66 (0.9%) |
| $20,000 to $22,499 | 62 (0.8%) | 147 (2.1%) |
| $22,500 to $24,999 | 61 (0.7%) | 301 (4.3%) |
| $25,000 to $29,999 | 114 (1.4%) | 383 (5.5%) |
| $30,000 to $34,999 | 244 (3.0%) | 318 (4.6%) |
| $35,000 to $39,999 | 366 (4.5%) | 333 (4.8%) |
| $40,000 to $44,999 | 256 (3.1%) | 377 (5.4%) |
| $45,000 to $49,999 | 229 (2.8%) | 291 (4.2%) |
| $50,000 to $54,999 | 193 (2.4%) | 259 (3.7%) |
| $55,000 to $64,999 | 407 (5.0%) | 555 (8.0%) |
| $65,000 to $74,999 | 453 (5.5%) | 705 (10.1%) |
| $75,000 to $99,999 | 1,343 (16.4%) | 977 (14.0%) |
| $100,000+ | 3,181 (38.8%) | 829 (11.9%) |
| Total | 8,206 (100.0%) | 6,977 (100.0%) |
Earnings by Sex by Educational Attainment in New Lenox
Average earnings in New Lenox are $93,823 for men and $53,907 for women, a difference of 42.5%. Men with an educational attainment of graduate degree enjoy the highest average annual earnings of $112,083, while those with high school diploma education earn the least with $71,648. Women with an educational attainment of graduate degree earn the most with the average annual earnings of $83,443, while those with high school diploma education have the smallest earnings of $38,082.
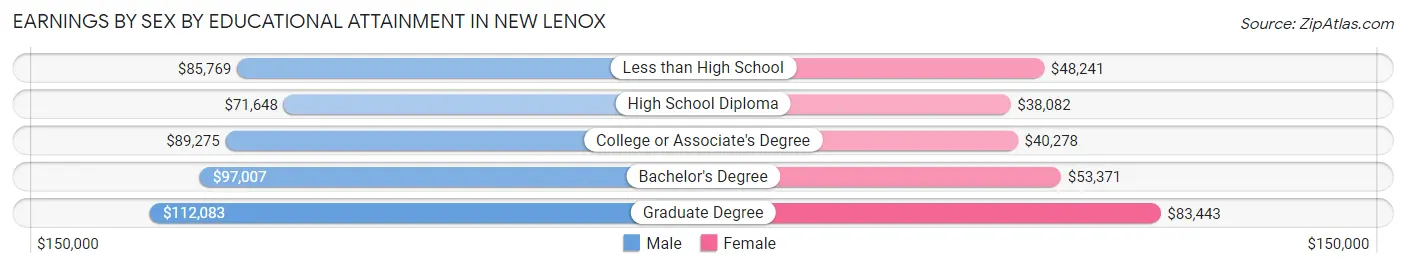
| Educational Attainment | Male Income | Female Income |
| Less than High School | $85,769 | $48,241 |
| High School Diploma | $71,648 | $38,082 |
| College or Associate's Degree | $89,275 | $40,278 |
| Bachelor's Degree | $97,007 | $53,371 |
| Graduate Degree | $112,083 | $83,443 |
| Total | $93,823 | $53,907 |
Family Income in New Lenox
Family Income Brackets in New Lenox
According to the New Lenox family income data, there are 2,087 families falling into the $100,000 to $149,999 income range, which is the most common income bracket and makes up 28.0% of all families. Conversely, the $10,000 to $14,999 income bracket is the least frequent group with only 52 families (0.7%) belonging to this category.
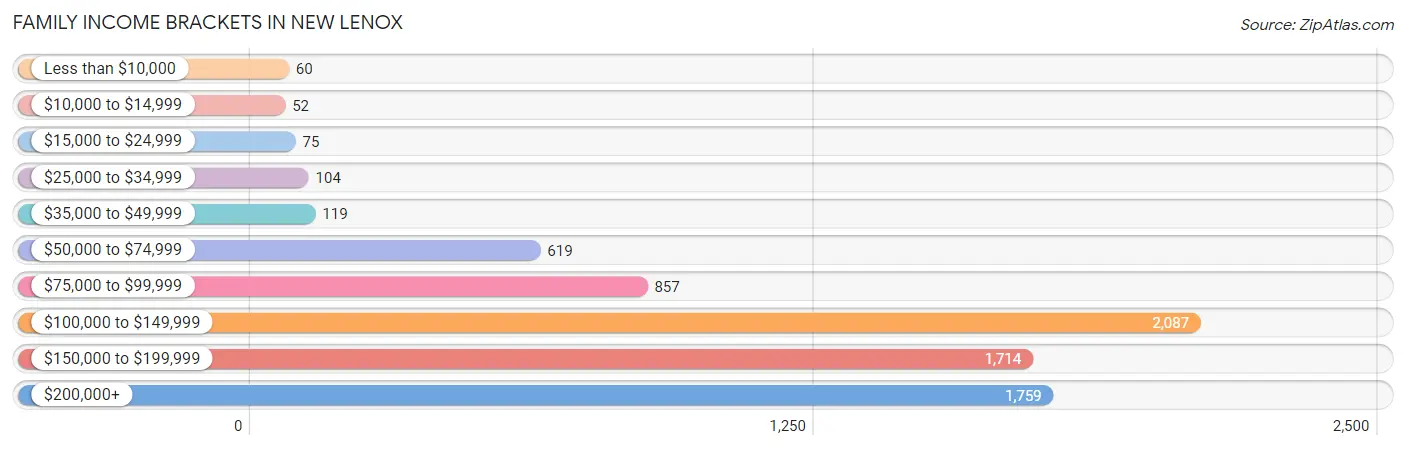
| Income Bracket | # Families | % Families |
| Less than $10,000 | 60 | 0.8% |
| $10,000 to $14,999 | 52 | 0.7% |
| $15,000 to $24,999 | 75 | 1.0% |
| $25,000 to $34,999 | 104 | 1.4% |
| $35,000 to $49,999 | 119 | 1.6% |
| $50,000 to $74,999 | 619 | 8.3% |
| $75,000 to $99,999 | 857 | 11.5% |
| $100,000 to $149,999 | 2,087 | 28.0% |
| $150,000 to $199,999 | 1,714 | 23.0% |
| $200,000+ | 1,759 | 23.6% |
Family Income by Famaliy Size in New Lenox
4-person families (1,790 | 24.0%) account for the highest median family income in New Lenox with $169,844 per family, while 2-person families (2,852 | 38.3%) have the highest median income of $54,892 per family member.
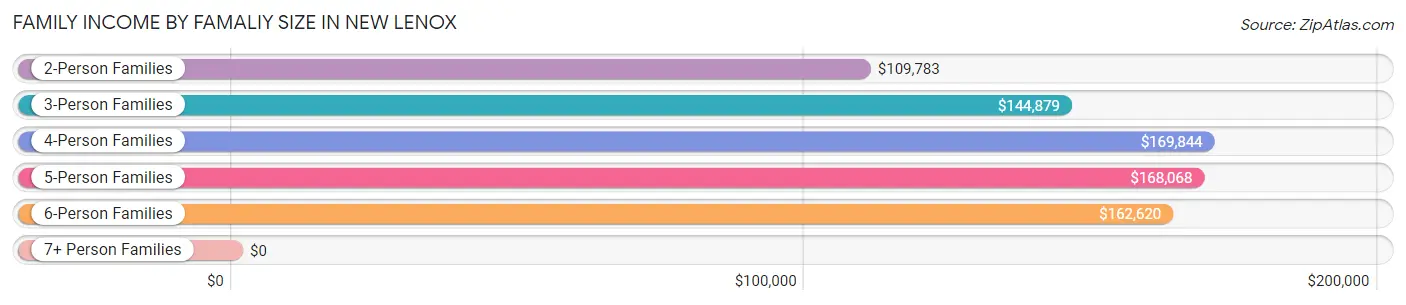
| Income Bracket | # Families | Median Income |
| 2-Person Families | 2,852 (38.3%) | $109,783 |
| 3-Person Families | 1,491 (20.0%) | $144,879 |
| 4-Person Families | 1,790 (24.0%) | $169,844 |
| 5-Person Families | 902 (12.1%) | $168,068 |
| 6-Person Families | 360 (4.8%) | $162,620 |
| 7+ Person Families | 59 (0.8%) | $0 |
| Total | 7,454 (100.0%) | $144,297 |
Family Income by Number of Earners in New Lenox
The median family income in New Lenox is $144,297, with families comprising 3+ earners (1,220) having the highest median family income of $178,750, while families with no earners (837) have the lowest median family income of $76,644, accounting for 16.4% and 11.2% of families, respectively.
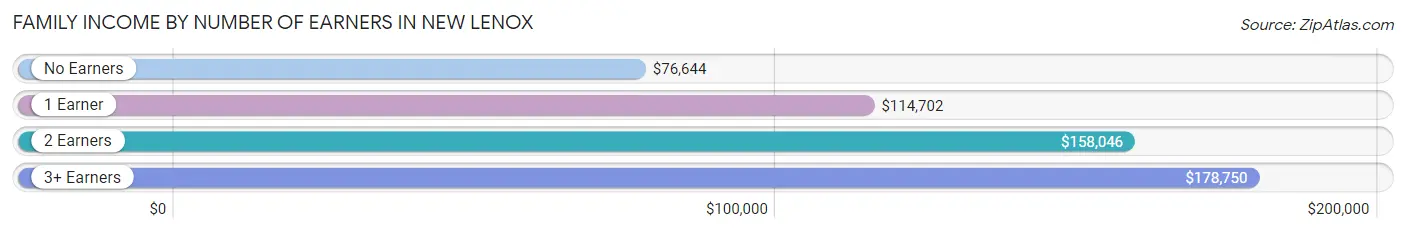
| Number of Earners | # Families | Median Income |
| No Earners | 837 (11.2%) | $76,644 |
| 1 Earner | 1,589 (21.3%) | $114,702 |
| 2 Earners | 3,808 (51.1%) | $158,046 |
| 3+ Earners | 1,220 (16.4%) | $178,750 |
| Total | 7,454 (100.0%) | $144,297 |
Household Income in New Lenox
Household Income Brackets in New Lenox
With 2,306 households falling in the category, the $100,000 to $149,999 income range is the most frequent in New Lenox, accounting for 25.6% of all households. In contrast, only 36 households (0.4%) fall into the $10,000 to $14,999 income bracket, making it the least populous group.
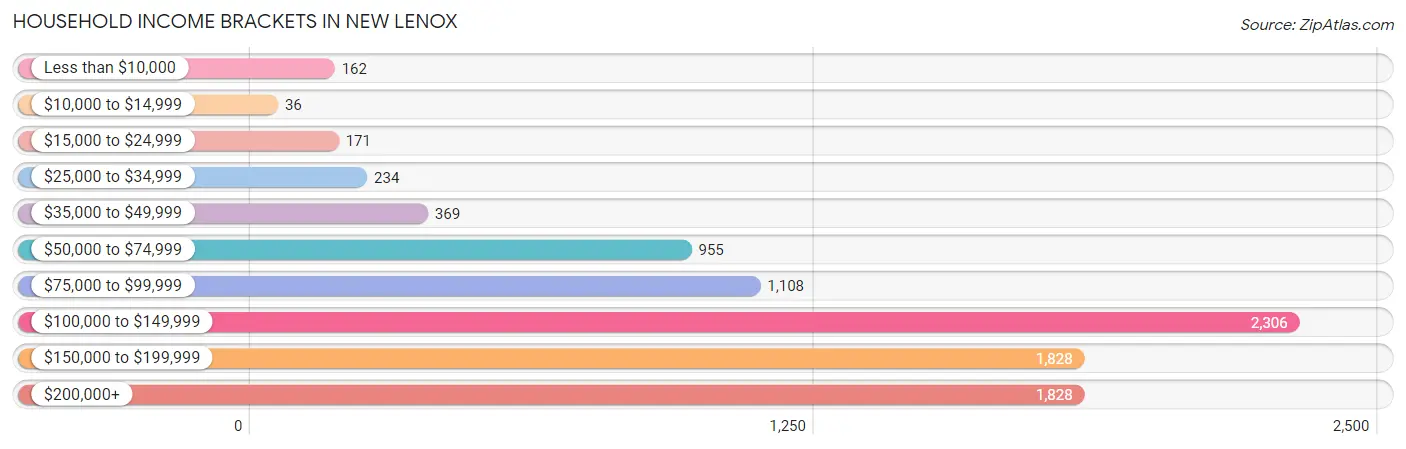
| Income Bracket | # Households | % Households |
| Less than $10,000 | 162 | 1.8% |
| $10,000 to $14,999 | 36 | 0.4% |
| $15,000 to $24,999 | 171 | 1.9% |
| $25,000 to $34,999 | 234 | 2.6% |
| $35,000 to $49,999 | 369 | 4.1% |
| $50,000 to $74,999 | 955 | 10.6% |
| $75,000 to $99,999 | 1,108 | 12.3% |
| $100,000 to $149,999 | 2,306 | 25.6% |
| $150,000 to $199,999 | 1,828 | 20.3% |
| $200,000+ | 1,828 | 20.3% |
Household Income by Householder Age in New Lenox
The median household income in New Lenox is $129,797, with the highest median household income of $148,093 found in the 45 to 64 years age bracket for the primary householder. A total of 3,729 households (41.4%) fall into this category. Meanwhile, the 65+ years age bracket for the primary householder has the lowest median household income of $77,418, with 1,751 households (19.4%) in this group.
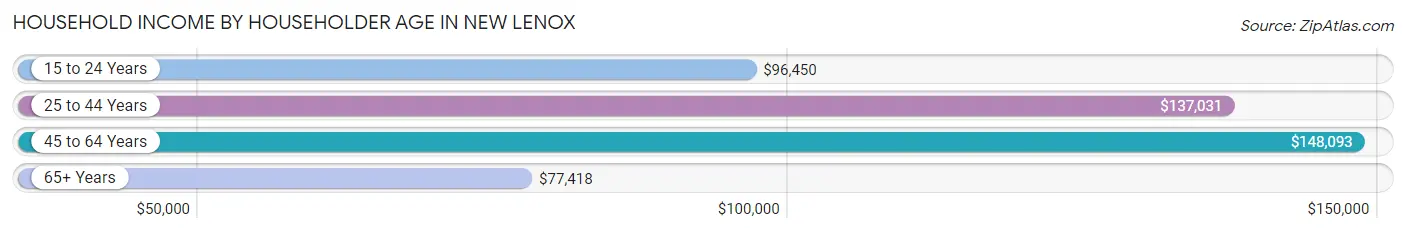
| Income Bracket | # Households | Median Income |
| 15 to 24 Years | 69 (0.8%) | $96,450 |
| 25 to 44 Years | 3,457 (38.4%) | $137,031 |
| 45 to 64 Years | 3,729 (41.4%) | $148,093 |
| 65+ Years | 1,751 (19.4%) | $77,418 |
| Total | 9,006 (100.0%) | $129,797 |
Poverty in New Lenox
Income Below Poverty by Sex and Age in New Lenox
With 1.9% poverty level for males and 2.2% for females among the residents of New Lenox, 6 to 11 year old males and 75 year old and over females are the most vulnerable to poverty, with 69 males (5.4%) and 39 females (5.4%) in their respective age groups living below the poverty level.
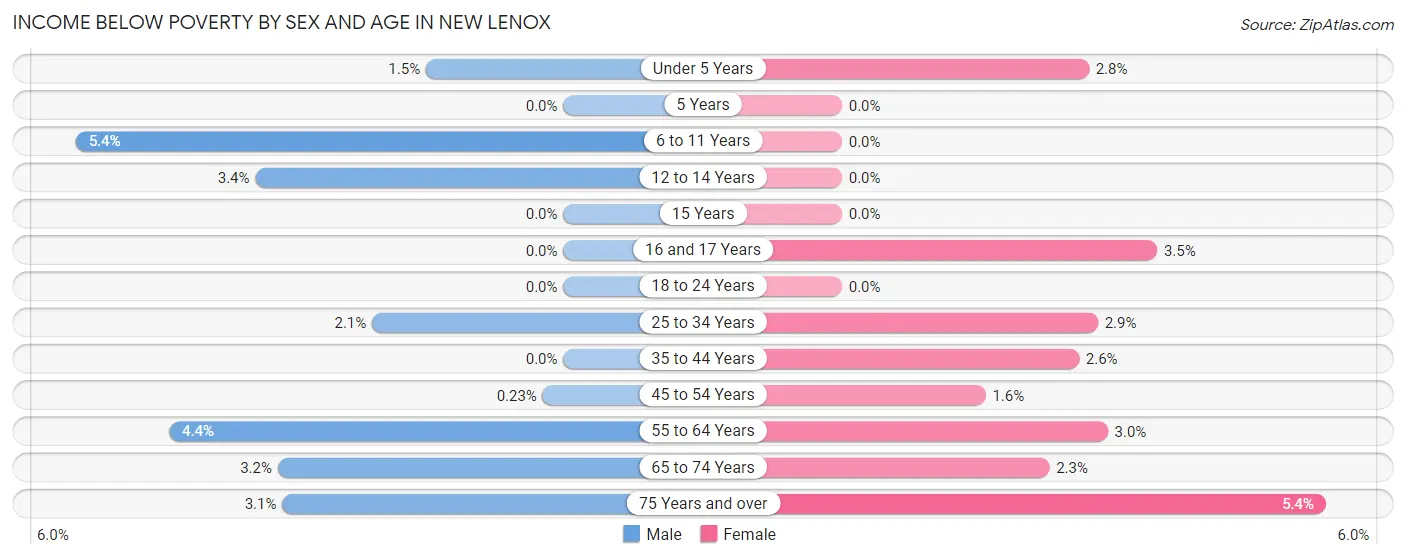
| Age Bracket | Male | Female |
| Under 5 Years | 20 (1.5%) | 29 (2.8%) |
| 5 Years | 0 (0.0%) | 0 (0.0%) |
| 6 to 11 Years | 69 (5.4%) | 0 (0.0%) |
| 12 to 14 Years | 25 (3.4%) | 0 (0.0%) |
| 15 Years | 0 (0.0%) | 0 (0.0%) |
| 16 and 17 Years | 0 (0.0%) | 17 (3.5%) |
| 18 to 24 Years | 0 (0.0%) | 0 (0.0%) |
| 25 to 34 Years | 25 (2.1%) | 42 (2.9%) |
| 35 to 44 Years | 0 (0.0%) | 58 (2.6%) |
| 45 to 54 Years | 4 (0.2%) | 25 (1.6%) |
| 55 to 64 Years | 80 (4.4%) | 52 (3.0%) |
| 65 to 74 Years | 30 (3.2%) | 22 (2.3%) |
| 75 Years and over | 14 (3.1%) | 39 (5.4%) |
| Total | 267 (1.9%) | 284 (2.2%) |
Income Above Poverty by Sex and Age in New Lenox
According to the poverty statistics in New Lenox, males aged 5 years and females aged 5 years are the age groups that are most secure financially, with 100.0% of males and 100.0% of females in these age groups living above the poverty line.
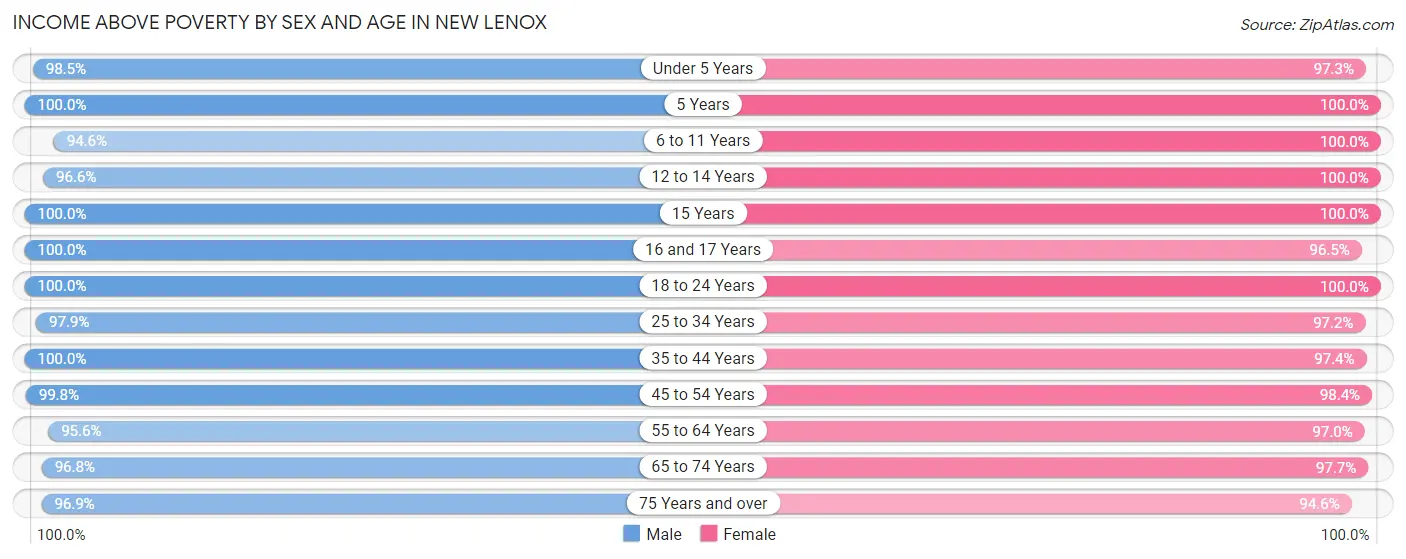
| Age Bracket | Male | Female |
| Under 5 Years | 1,289 (98.5%) | 1,027 (97.3%) |
| 5 Years | 307 (100.0%) | 111 (100.0%) |
| 6 to 11 Years | 1,202 (94.6%) | 971 (100.0%) |
| 12 to 14 Years | 704 (96.6%) | 726 (100.0%) |
| 15 Years | 253 (100.0%) | 221 (100.0%) |
| 16 and 17 Years | 305 (100.0%) | 468 (96.5%) |
| 18 to 24 Years | 1,221 (100.0%) | 873 (100.0%) |
| 25 to 34 Years | 1,149 (97.9%) | 1,433 (97.2%) |
| 35 to 44 Years | 2,521 (100.0%) | 2,140 (97.4%) |
| 45 to 54 Years | 1,733 (99.8%) | 1,536 (98.4%) |
| 55 to 64 Years | 1,743 (95.6%) | 1,707 (97.0%) |
| 65 to 74 Years | 913 (96.8%) | 929 (97.7%) |
| 75 Years and over | 433 (96.9%) | 684 (94.6%) |
| Total | 13,773 (98.1%) | 12,826 (97.8%) |
Income Below Poverty Among Married-Couple Families in New Lenox
The poverty statistics for married-couple families in New Lenox show that 1.0% or 66 of the total 6,587 families live below the poverty line. Families with no children have the highest poverty rate of 1.5%, comprising of 48 families. On the other hand, families with 3 or 4 children have the lowest poverty rate of 0.0%, which includes 0 families.
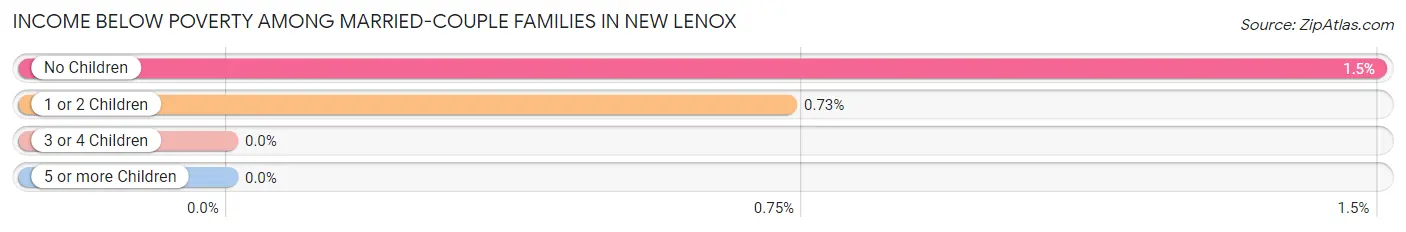
| Children | Above Poverty | Below Poverty |
| No Children | 3,154 (98.5%) | 48 (1.5%) |
| 1 or 2 Children | 2,449 (99.3%) | 18 (0.7%) |
| 3 or 4 Children | 892 (100.0%) | 0 (0.0%) |
| 5 or more Children | 26 (100.0%) | 0 (0.0%) |
| Total | 6,521 (99.0%) | 66 (1.0%) |
Income Below Poverty Among Single-Parent Households in New Lenox
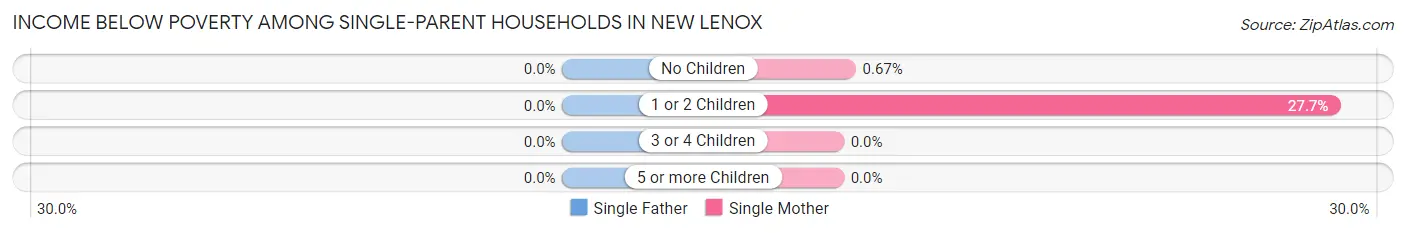
| Children | Single Father | Single Mother |
| No Children | 0 (0.0%) | 2 (0.7%) |
| 1 or 2 Children | 0 (0.0%) | 86 (27.7%) |
| 3 or 4 Children | 0 (0.0%) | 0 (0.0%) |
| 5 or more Children | 0 (0.0%) | 0 (0.0%) |
| Total | 0 (0.0%) | 88 (14.3%) |
Income Below Poverty Among Married-Couple vs Single-Parent Households in New Lenox
The poverty data for New Lenox shows that 66 of the married-couple family households (1.0%) and 88 of the single-parent households (10.2%) are living below the poverty level. Within the married-couple family households, those with no children have the highest poverty rate, with 48 households (1.5%) falling below the poverty line. Among the single-parent households, those with 1 or 2 children have the highest poverty rate, with 86 household (18.8%) living below poverty.
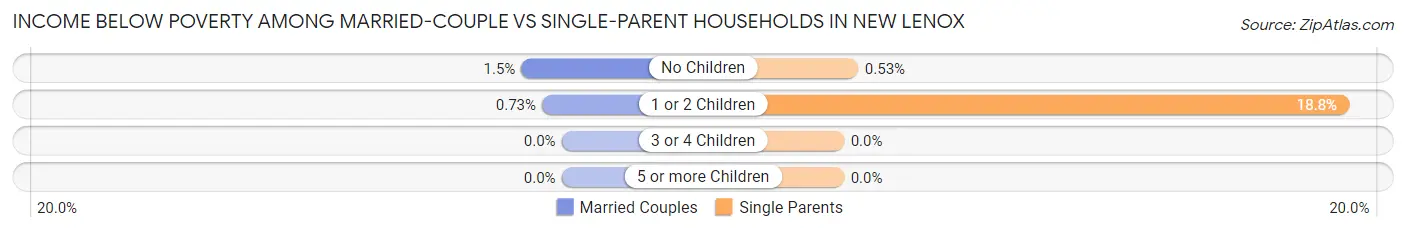
| Children | Married-Couple Families | Single-Parent Households |
| No Children | 48 (1.5%) | 2 (0.5%) |
| 1 or 2 Children | 18 (0.7%) | 86 (18.8%) |
| 3 or 4 Children | 0 (0.0%) | 0 (0.0%) |
| 5 or more Children | 0 (0.0%) | 0 (0.0%) |
| Total | 66 (1.0%) | 88 (10.2%) |
Race in New Lenox
The most populous races in New Lenox are White / Caucasian (25,111 | 92.2%), Hispanic or Latino (1,374 | 5.0%), and Two or more Races (1,343 | 4.9%).
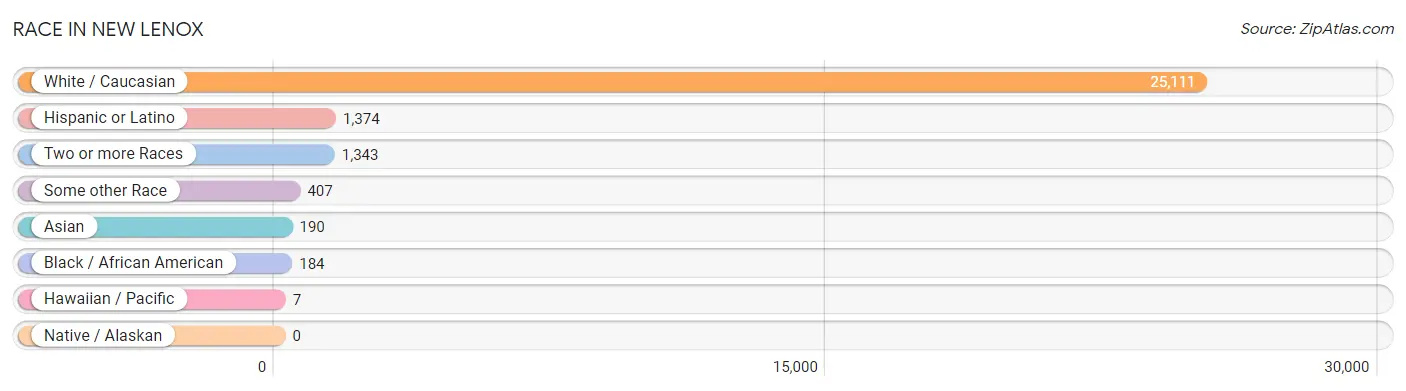
| Race | # Population | % Population |
| Asian | 190 | 0.7% |
| Black / African American | 184 | 0.7% |
| Hawaiian / Pacific | 7 | 0.0% |
| Hispanic or Latino | 1,374 | 5.0% |
| Native / Alaskan | 0 | 0.0% |
| White / Caucasian | 25,111 | 92.2% |
| Two or more Races | 1,343 | 4.9% |
| Some other Race | 407 | 1.5% |
| Total | 27,242 | 100.0% |
Ancestry in New Lenox
The most populous ancestries reported in New Lenox are German (7,777 | 28.5%), Irish (6,625 | 24.3%), Polish (5,241 | 19.2%), Italian (3,862 | 14.2%), and English (2,208 | 8.1%), together accounting for 94.4% of all New Lenox residents.
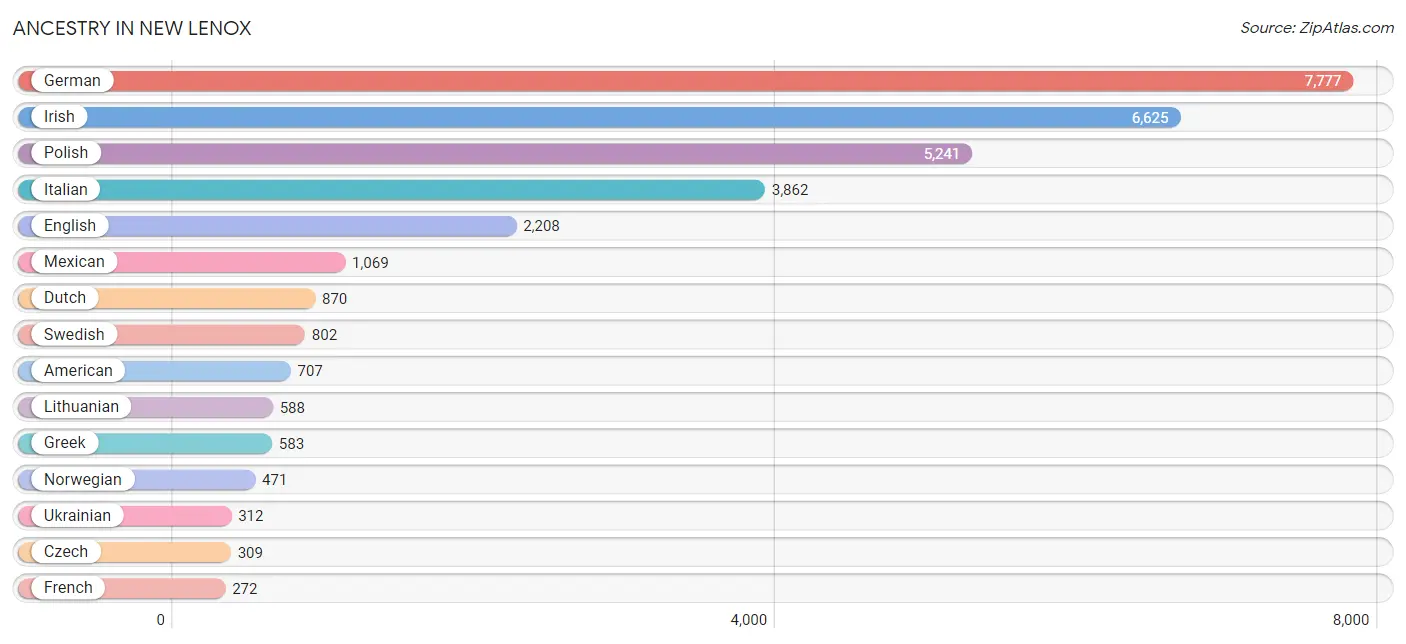
| Ancestry | # Population | % Population |
| African | 16 | 0.1% |
| American | 707 | 2.6% |
| Arab | 48 | 0.2% |
| Armenian | 9 | 0.0% |
| Austrian | 81 | 0.3% |
| Belgian | 60 | 0.2% |
| Bhutanese | 52 | 0.2% |
| British | 113 | 0.4% |
| Burmese | 23 | 0.1% |
| Central American | 69 | 0.3% |
| Cherokee | 5 | 0.0% |
| Choctaw | 3 | 0.0% |
| Colombian | 38 | 0.1% |
| Comanche | 2 | 0.0% |
| Croatian | 260 | 0.9% |
| Czech | 309 | 1.1% |
| Czechoslovakian | 45 | 0.2% |
| Danish | 91 | 0.3% |
| Dutch | 870 | 3.2% |
| English | 2,208 | 8.1% |
| European | 146 | 0.5% |
| Finnish | 40 | 0.2% |
| French | 272 | 1.0% |
| French Canadian | 72 | 0.3% |
| German | 7,777 | 28.5% |
| Greek | 583 | 2.1% |
| Guatemalan | 69 | 0.3% |
| Hungarian | 134 | 0.5% |
| Indian (Asian) | 28 | 0.1% |
| Irish | 6,625 | 24.3% |
| Italian | 3,862 | 14.2% |
| Jordanian | 48 | 0.2% |
| Korean | 78 | 0.3% |
| Latvian | 12 | 0.0% |
| Lithuanian | 588 | 2.2% |
| Lumbee | 21 | 0.1% |
| Maltese | 10 | 0.0% |
| Mexican | 1,069 | 3.9% |
| Native Hawaiian | 7 | 0.0% |
| Nigerian | 76 | 0.3% |
| Norwegian | 471 | 1.7% |
| Pakistani | 70 | 0.3% |
| Peruvian | 31 | 0.1% |
| Polish | 5,241 | 19.2% |
| Portuguese | 5 | 0.0% |
| Puerto Rican | 96 | 0.4% |
| Romanian | 7 | 0.0% |
| Russian | 93 | 0.3% |
| Scandinavian | 91 | 0.3% |
| Scotch-Irish | 117 | 0.4% |
| Scottish | 250 | 0.9% |
| Serbian | 38 | 0.1% |
| Slovak | 178 | 0.6% |
| Slovene | 227 | 0.8% |
| South American | 69 | 0.3% |
| Spanish | 36 | 0.1% |
| Sri Lankan | 25 | 0.1% |
| Subsaharan African | 85 | 0.3% |
| Swedish | 802 | 2.9% |
| Swiss | 72 | 0.3% |
| Thai | 42 | 0.2% |
| Ukrainian | 312 | 1.1% |
| Welsh | 75 | 0.3% | View All 63 Rows |
Immigrants in New Lenox
The most numerous immigrant groups reported in New Lenox came from Europe (254 | 0.9%), Latin America (195 | 0.7%), Eastern Europe (187 | 0.7%), Poland (179 | 0.7%), and Asia (168 | 0.6%), together accounting for 3.6% of all New Lenox residents.
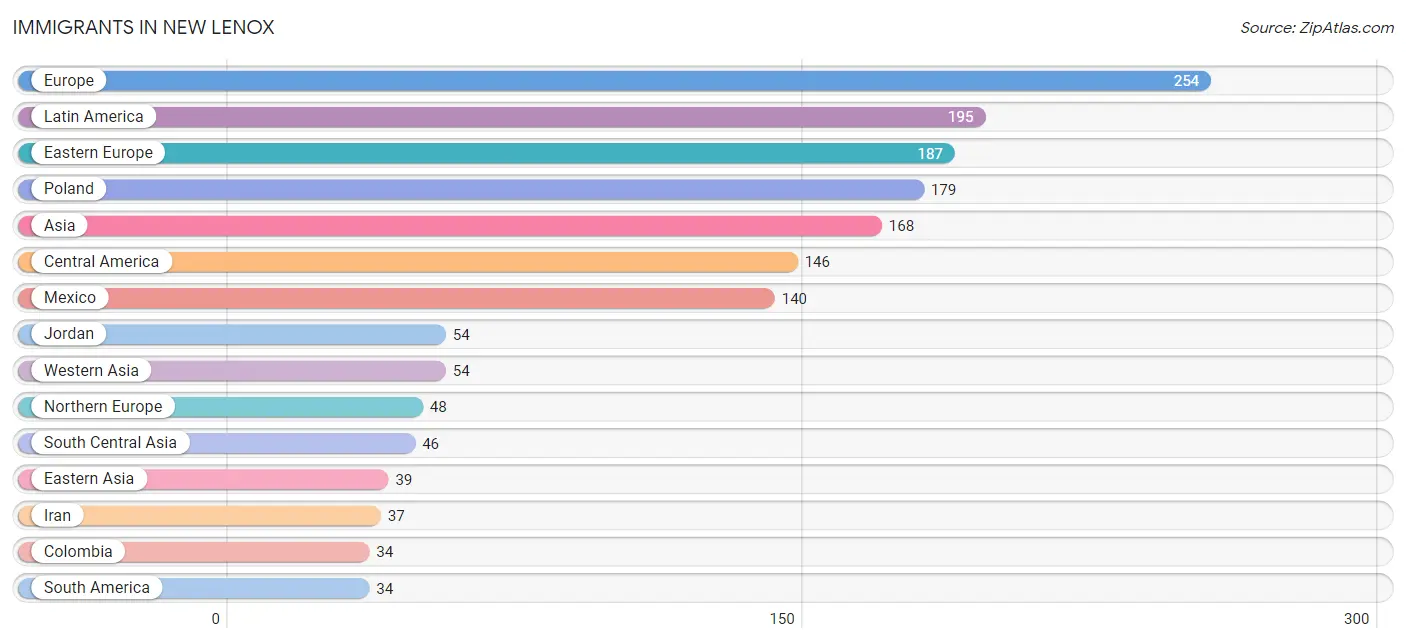
| Immigration Origin | # Population | % Population |
| Africa | 31 | 0.1% |
| Asia | 168 | 0.6% |
| Caribbean | 15 | 0.1% |
| Central America | 146 | 0.5% |
| China | 9 | 0.0% |
| Colombia | 34 | 0.1% |
| Eastern Asia | 39 | 0.1% |
| Eastern Europe | 187 | 0.7% |
| England | 7 | 0.0% |
| Europe | 254 | 0.9% |
| Greece | 7 | 0.0% |
| Guatemala | 6 | 0.0% |
| Iran | 37 | 0.1% |
| Ireland | 6 | 0.0% |
| Italy | 12 | 0.0% |
| Japan | 7 | 0.0% |
| Jordan | 54 | 0.2% |
| Korea | 23 | 0.1% |
| Latin America | 195 | 0.7% |
| Lithuania | 8 | 0.0% |
| Mexico | 140 | 0.5% |
| Nigeria | 31 | 0.1% |
| Northern Europe | 48 | 0.2% |
| Pakistan | 9 | 0.0% |
| Philippines | 14 | 0.1% |
| Poland | 179 | 0.7% |
| Scotland | 9 | 0.0% |
| South America | 34 | 0.1% |
| South Central Asia | 46 | 0.2% |
| South Eastern Asia | 29 | 0.1% |
| Southern Europe | 19 | 0.1% |
| Thailand | 9 | 0.0% |
| Trinidad and Tobago | 15 | 0.1% |
| Vietnam | 6 | 0.0% |
| Western Africa | 31 | 0.1% |
| Western Asia | 54 | 0.2% | View All 36 Rows |
Sex and Age in New Lenox
Sex and Age in New Lenox
The most populous age groups in New Lenox are 5 to 9 Years (1,329 | 9.4%) for men and 10 to 14 Years (1,179 | 9.0%) for women.
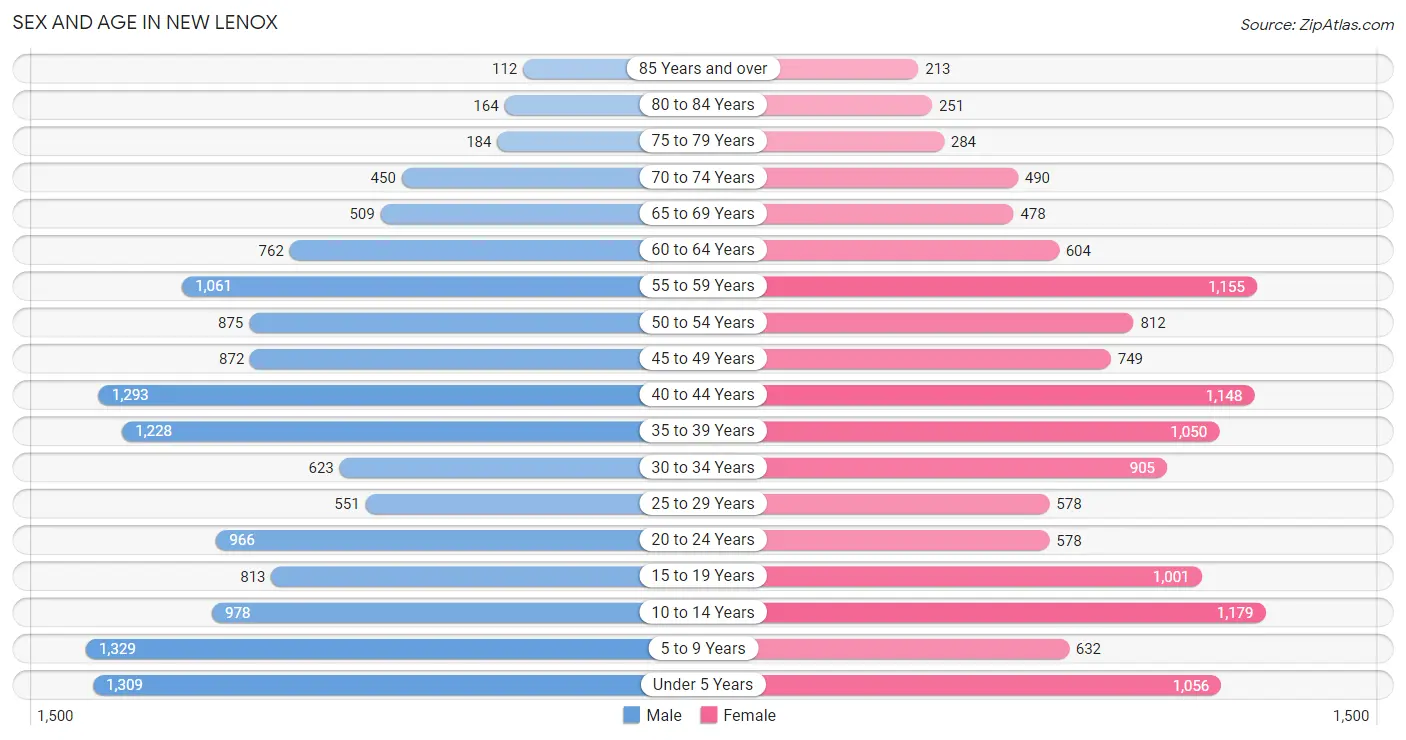
| Age Bracket | Male | Female |
| Under 5 Years | 1,309 (9.3%) | 1,056 (8.0%) |
| 5 to 9 Years | 1,329 (9.4%) | 632 (4.8%) |
| 10 to 14 Years | 978 (7.0%) | 1,179 (9.0%) |
| 15 to 19 Years | 813 (5.8%) | 1,001 (7.6%) |
| 20 to 24 Years | 966 (6.9%) | 578 (4.4%) |
| 25 to 29 Years | 551 (3.9%) | 578 (4.4%) |
| 30 to 34 Years | 623 (4.4%) | 905 (6.9%) |
| 35 to 39 Years | 1,228 (8.7%) | 1,050 (8.0%) |
| 40 to 44 Years | 1,293 (9.2%) | 1,148 (8.7%) |
| 45 to 49 Years | 872 (6.2%) | 749 (5.7%) |
| 50 to 54 Years | 875 (6.2%) | 812 (6.2%) |
| 55 to 59 Years | 1,061 (7.5%) | 1,155 (8.8%) |
| 60 to 64 Years | 762 (5.4%) | 604 (4.6%) |
| 65 to 69 Years | 509 (3.6%) | 478 (3.6%) |
| 70 to 74 Years | 450 (3.2%) | 490 (3.7%) |
| 75 to 79 Years | 184 (1.3%) | 284 (2.2%) |
| 80 to 84 Years | 164 (1.2%) | 251 (1.9%) |
| 85 Years and over | 112 (0.8%) | 213 (1.6%) |
| Total | 14,079 (100.0%) | 13,163 (100.0%) |
Families and Households in New Lenox
Median Family Size in New Lenox
The median family size in New Lenox is 3.38 persons per family, with married-couple families (6,587 | 88.4%) accounting for the largest median family size of 3.46 persons per family. On the other hand, single female/mother families (617 | 8.3%) represent the smallest median family size with 2.72 persons per family.
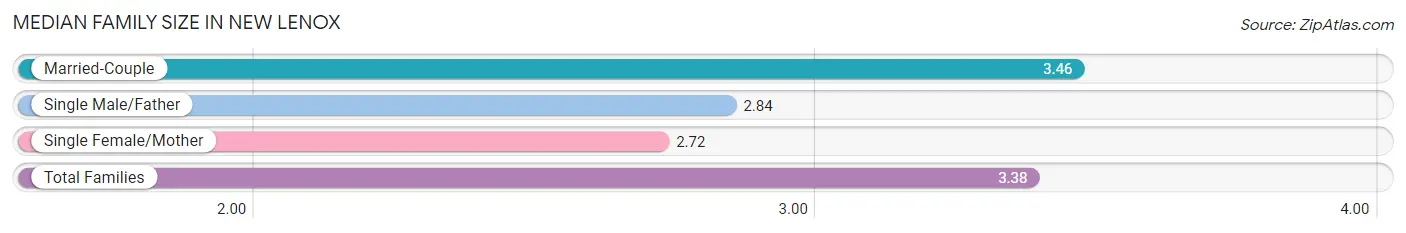
| Family Type | # Families | Family Size |
| Married-Couple | 6,587 (88.4%) | 3.46 |
| Single Male/Father | 250 (3.4%) | 2.84 |
| Single Female/Mother | 617 (8.3%) | 2.72 |
| Total Families | 7,454 (100.0%) | 3.38 |
Median Household Size in New Lenox
The median household size in New Lenox is 3.01 persons per household, with married-couple households (6,587 | 73.1%) accounting for the largest median household size of 3.46 persons per household. non-family households (1,552 | 17.2%) represent the smallest median household size with 1.19 persons per household.
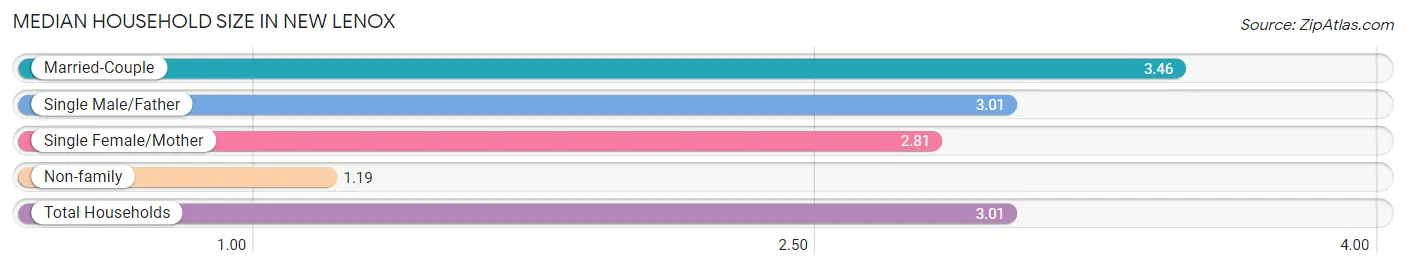
| Household Type | # Households | Household Size |
| Married-Couple | 6,587 (73.1%) | 3.46 |
| Single Male/Father | 250 (2.8%) | 3.01 |
| Single Female/Mother | 617 (6.9%) | 2.81 |
| Non-family | 1,552 (17.2%) | 1.19 |
| Total Households | 9,006 (100.0%) | 3.01 |
Household Size by Marriage Status in New Lenox
Out of a total of 9,006 households in New Lenox, 7,454 (82.8%) are family households, while 1,552 (17.2%) are nonfamily households. The most numerous type of family households are 2-person households, comprising 2,820, and the most common type of nonfamily households are 1-person households, comprising 1,295.
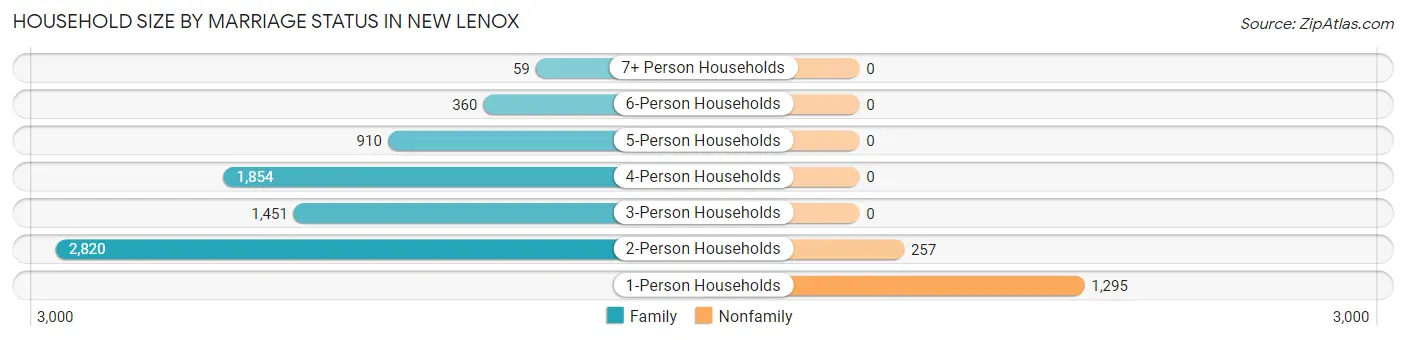
| Household Size | Family Households | Nonfamily Households |
| 1-Person Households | - | 1,295 (14.4%) |
| 2-Person Households | 2,820 (31.3%) | 257 (2.9%) |
| 3-Person Households | 1,451 (16.1%) | 0 (0.0%) |
| 4-Person Households | 1,854 (20.6%) | 0 (0.0%) |
| 5-Person Households | 910 (10.1%) | 0 (0.0%) |
| 6-Person Households | 360 (4.0%) | 0 (0.0%) |
| 7+ Person Households | 59 (0.7%) | 0 (0.0%) |
| Total | 7,454 (82.8%) | 1,552 (17.2%) |
Female Fertility in New Lenox
Fertility by Age in New Lenox
Average fertility rate in New Lenox is 77.0 births per 1,000 women. Women in the age bracket of 20 to 34 years have the highest fertility rate with 152.0 births per 1,000 women. Women in the age bracket of 20 to 34 years acount for 65.3% of all women with births.
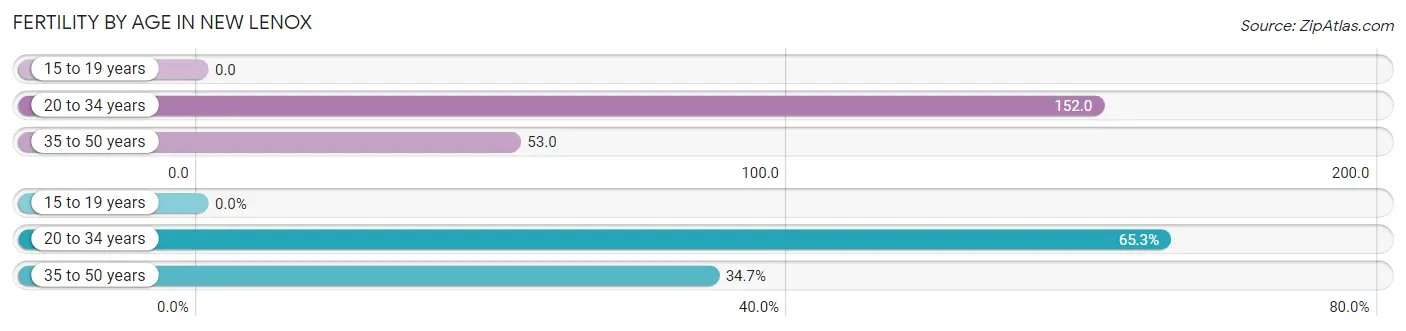
| Age Bracket | Women with Births | Births / 1,000 Women |
| 15 to 19 years | 0 (0.0%) | 0.0 |
| 20 to 34 years | 313 (65.3%) | 152.0 |
| 35 to 50 years | 166 (34.7%) | 53.0 |
| Total | 479 (100.0%) | 77.0 |
Fertility by Age by Marriage Status in New Lenox
93.7% of women with births (479) in New Lenox are married. The highest percentage of unmarried women with births falls into 20 to 34 years age bracket with 9.6% of them unmarried at the time of birth, while the lowest percentage of unmarried women with births belong to 35 to 50 years age bracket with 0.0% of them unmarried.
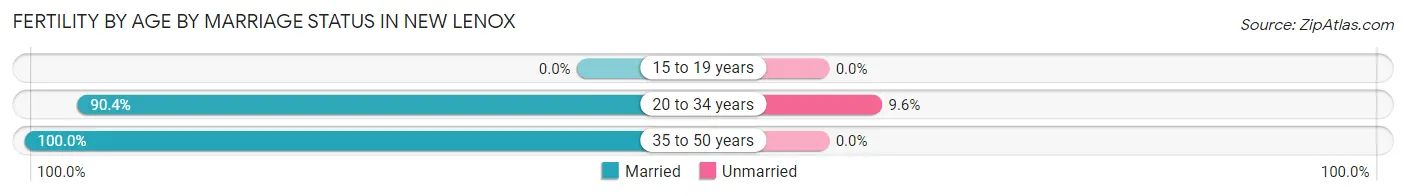
| Age Bracket | Married | Unmarried |
| 15 to 19 years | 0 (0.0%) | 0 (0.0%) |
| 20 to 34 years | 283 (90.4%) | 30 (9.6%) |
| 35 to 50 years | 166 (100.0%) | 0 (0.0%) |
| Total | 449 (93.7%) | 30 (6.3%) |
Fertility by Education in New Lenox
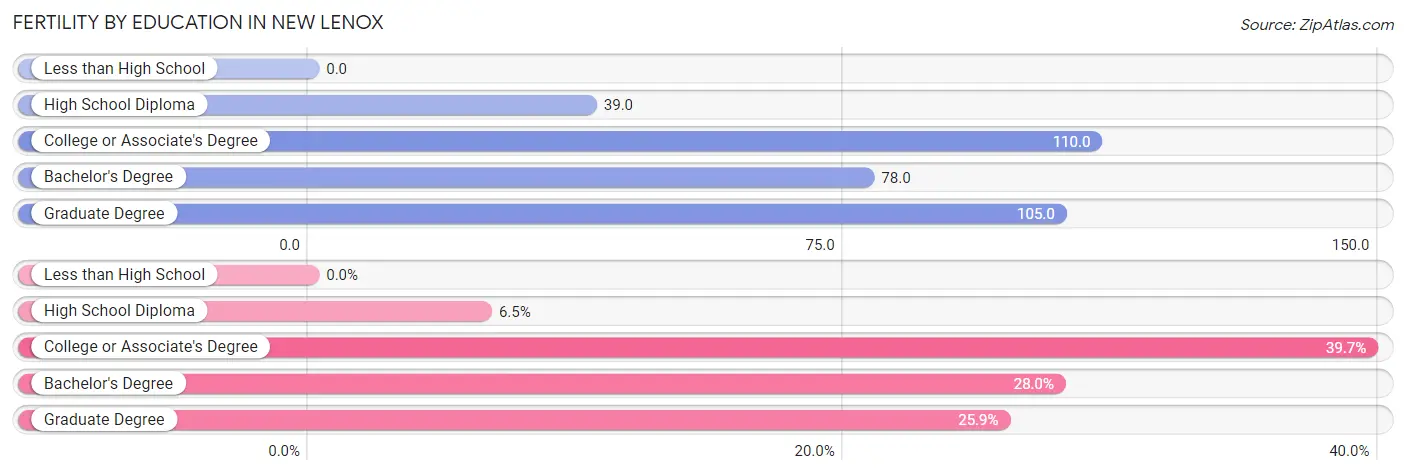
| Educational Attainment | Women with Births | Births / 1,000 Women |
| Less than High School | 0 (0.0%) | 0.0 |
| High School Diploma | 31 (6.5%) | 39.0 |
| College or Associate's Degree | 190 (39.7%) | 110.0 |
| Bachelor's Degree | 134 (28.0%) | 78.0 |
| Graduate Degree | 124 (25.9%) | 105.0 |
| Total | 479 (100.0%) | 77.0 |
Fertility by Education by Marriage Status in New Lenox
6.3% of women with births in New Lenox are unmarried. Women with the educational attainment of high school diploma are most likely to be married with 100.0% of them married at childbirth, while women with the educational attainment of bachelor's degree are least likely to be married with 22.4% of them unmarried at childbirth.

| Educational Attainment | Married | Unmarried |
| Less than High School | 0 (0.0%) | 0 (0.0%) |
| High School Diploma | 31 (100.0%) | 0 (0.0%) |
| College or Associate's Degree | 190 (100.0%) | 0 (0.0%) |
| Bachelor's Degree | 104 (77.6%) | 30 (22.4%) |
| Graduate Degree | 124 (100.0%) | 0 (0.0%) |
| Total | 449 (93.7%) | 30 (6.3%) |
Employment Characteristics in New Lenox
Employment by Class of Employer in New Lenox
Among the 14,143 employed individuals in New Lenox, private company employees (9,302 | 65.8%), local government employees (1,883 | 13.3%), and not-for-profit organizations (1,194 | 8.4%) make up the most common classes of employment.
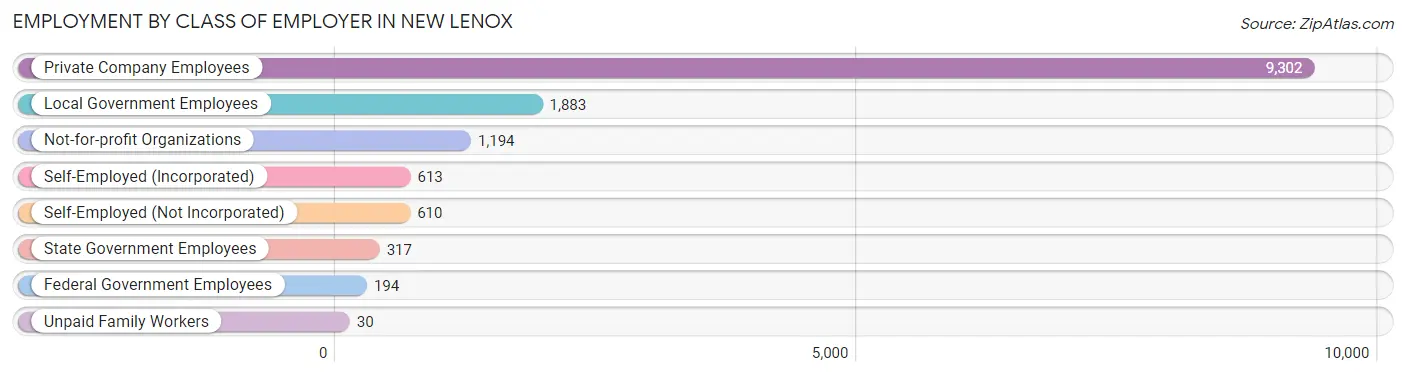
| Employer Class | # Employees | % Employees |
| Private Company Employees | 9,302 | 65.8% |
| Self-Employed (Incorporated) | 613 | 4.3% |
| Self-Employed (Not Incorporated) | 610 | 4.3% |
| Not-for-profit Organizations | 1,194 | 8.4% |
| Local Government Employees | 1,883 | 13.3% |
| State Government Employees | 317 | 2.2% |
| Federal Government Employees | 194 | 1.4% |
| Unpaid Family Workers | 30 | 0.2% |
| Total | 14,143 | 100.0% |
Employment Status by Age in New Lenox
According to the labor force statistics for New Lenox, out of the total population over 16 years of age (20,285), 72.9% or 14,788 individuals are in the labor force, with 2.8% or 414 of them unemployed. The age group with the highest labor force participation rate is 25 to 29 years, with 92.4% or 1,043 individuals in the labor force. Within the labor force, the 20 to 24 years age range has the highest percentage of unemployed individuals, with 9.0% or 115 of them being unemployed.
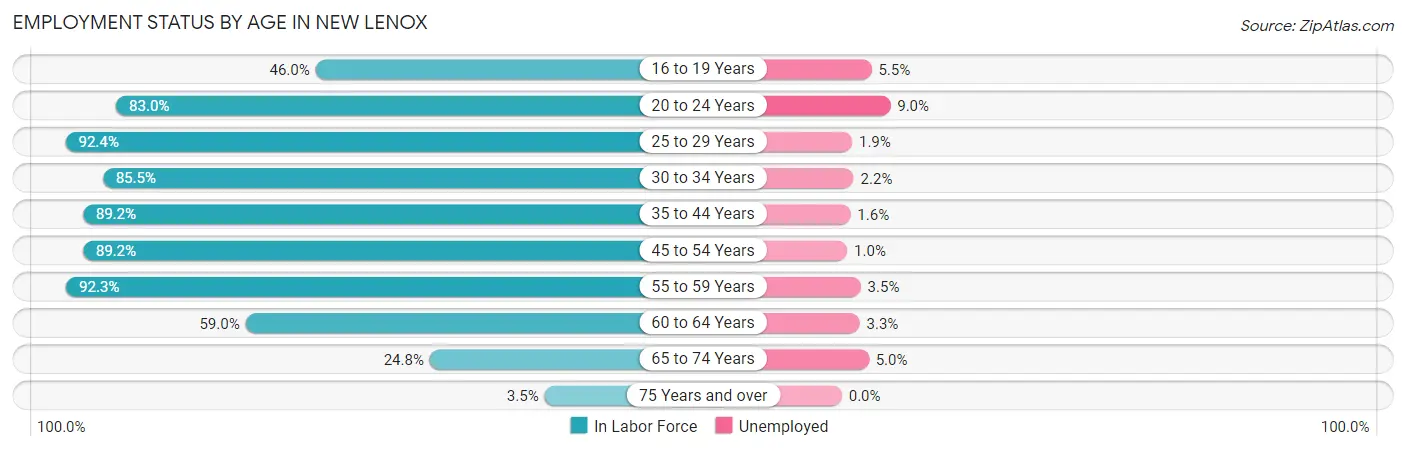
| Age Bracket | In Labor Force | Unemployed |
| 16 to 19 Years | 616 (46.0%) | 34 (5.5%) |
| 20 to 24 Years | 1,282 (83.0%) | 115 (9.0%) |
| 25 to 29 Years | 1,043 (92.4%) | 20 (1.9%) |
| 30 to 34 Years | 1,306 (85.5%) | 29 (2.2%) |
| 35 to 44 Years | 4,209 (89.2%) | 67 (1.6%) |
| 45 to 54 Years | 2,951 (89.2%) | 30 (1.0%) |
| 55 to 59 Years | 2,045 (92.3%) | 72 (3.5%) |
| 60 to 64 Years | 806 (59.0%) | 27 (3.3%) |
| 65 to 74 Years | 478 (24.8%) | 24 (5.0%) |
| 75 Years and over | 42 (3.5%) | 0 (0.0%) |
| Total | 14,788 (72.9%) | 414 (2.8%) |
Employment Status by Educational Attainment in New Lenox
According to labor force statistics for New Lenox, 86.6% of individuals (12,354) out of the total population between 25 and 64 years of age (14,266) are in the labor force, with 2.0% or 247 of them being unemployed. The group with the highest labor force participation rate are those with the educational attainment of bachelor's degree or higher, with 92.0% or 6,421 individuals in the labor force. Within the labor force, individuals with less than high school education have the highest percentage of unemployment, with 6.5% or 8 of them being unemployed.
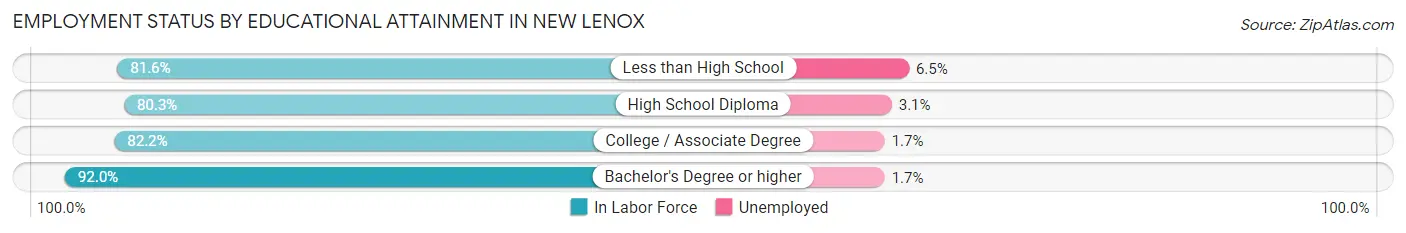
| Educational Attainment | In Labor Force | Unemployed |
| Less than High School | 124 (81.6%) | 10 (6.5%) |
| High School Diploma | 2,109 (80.3%) | 81 (3.1%) |
| College / Associate Degree | 3,706 (82.2%) | 77 (1.7%) |
| Bachelor's Degree or higher | 6,421 (92.0%) | 119 (1.7%) |
| Total | 12,354 (86.6%) | 285 (2.0%) |
Employment Occupations by Sex in New Lenox
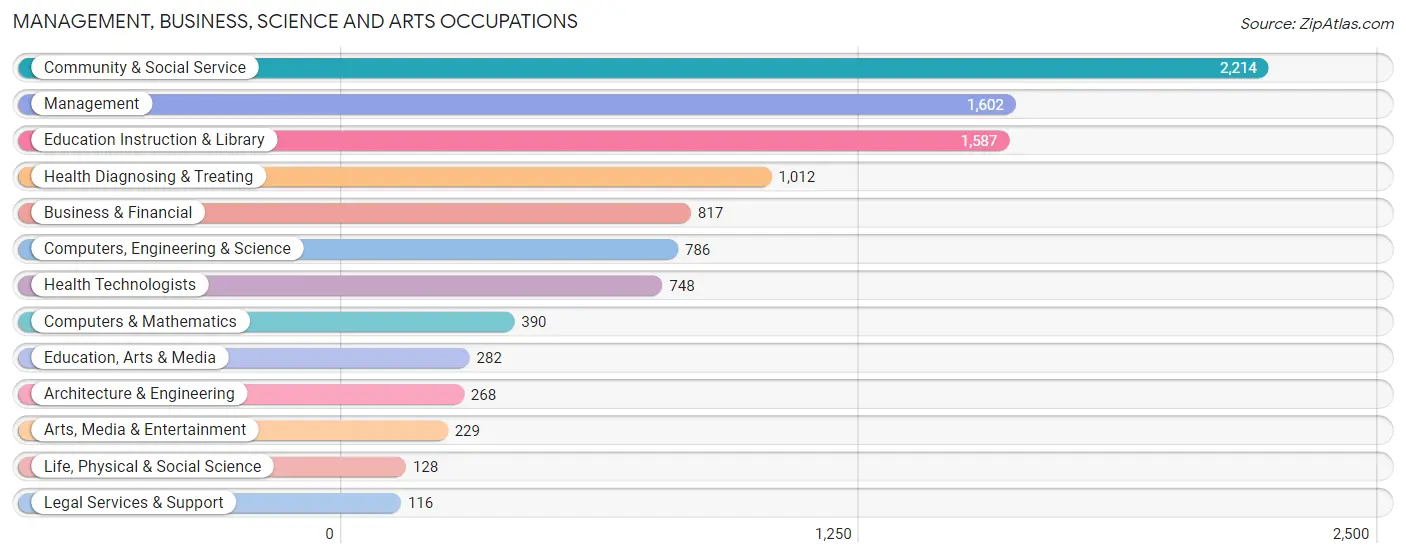
Management, Business, Science and Arts Occupations
The most common Management, Business, Science and Arts occupations in New Lenox are Community & Social Service (2,214 | 15.4%), Management (1,602 | 11.2%), Education Instruction & Library (1,587 | 11.1%), Health Diagnosing & Treating (1,012 | 7.0%), and Business & Financial (817 | 5.7%).
Management, Business, Science and Arts Occupations by Sex
Within the Management, Business, Science and Arts occupations in New Lenox, the most male-oriented occupations are Architecture & Engineering (91.4%), Computers & Mathematics (83.9%), and Computers, Engineering & Science (82.3%), while the most female-oriented occupations are Education, Arts & Media (81.6%), Health Technologists (78.6%), and Legal Services & Support (74.1%).
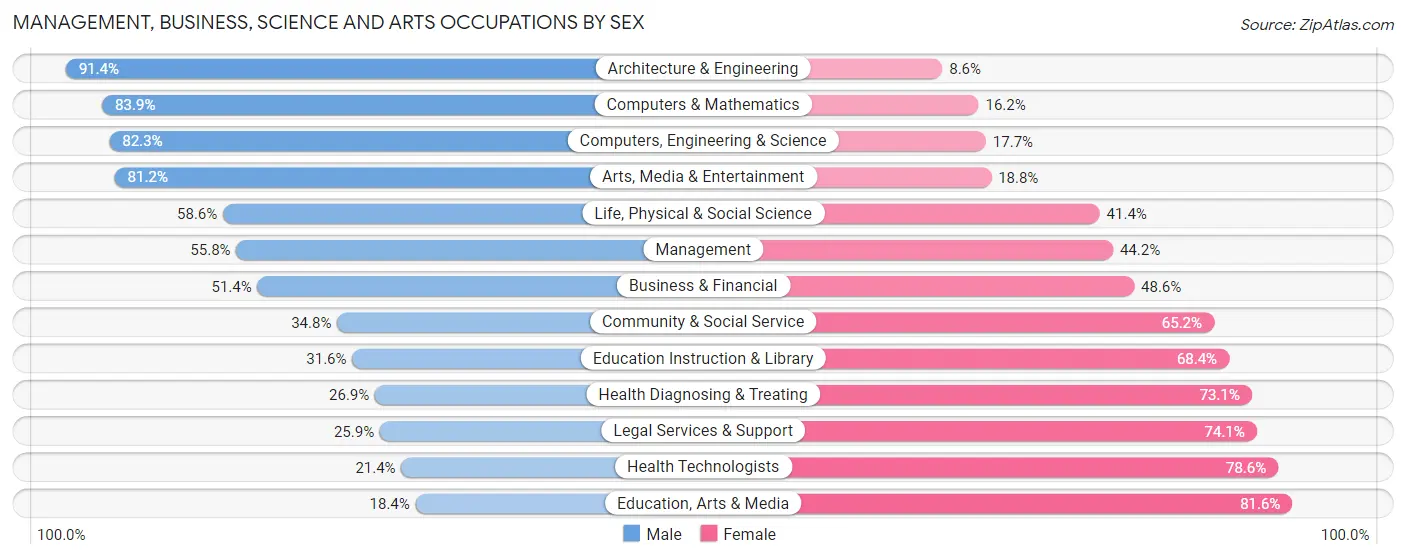
| Occupation | Male | Female |
| Management | 894 (55.8%) | 708 (44.2%) |
| Business & Financial | 420 (51.4%) | 397 (48.6%) |
| Computers, Engineering & Science | 647 (82.3%) | 139 (17.7%) |
| Computers & Mathematics | 327 (83.9%) | 63 (16.2%) |
| Architecture & Engineering | 245 (91.4%) | 23 (8.6%) |
| Life, Physical & Social Science | 75 (58.6%) | 53 (41.4%) |
| Community & Social Service | 770 (34.8%) | 1,444 (65.2%) |
| Education, Arts & Media | 52 (18.4%) | 230 (81.6%) |
| Legal Services & Support | 30 (25.9%) | 86 (74.1%) |
| Education Instruction & Library | 502 (31.6%) | 1,085 (68.4%) |
| Arts, Media & Entertainment | 186 (81.2%) | 43 (18.8%) |
| Health Diagnosing & Treating | 272 (26.9%) | 740 (73.1%) |
| Health Technologists | 160 (21.4%) | 588 (78.6%) |
| Total (Category) | 3,003 (46.7%) | 3,428 (53.3%) |
| Total (Overall) | 7,745 (53.9%) | 6,614 (46.1%) |
Services Occupations
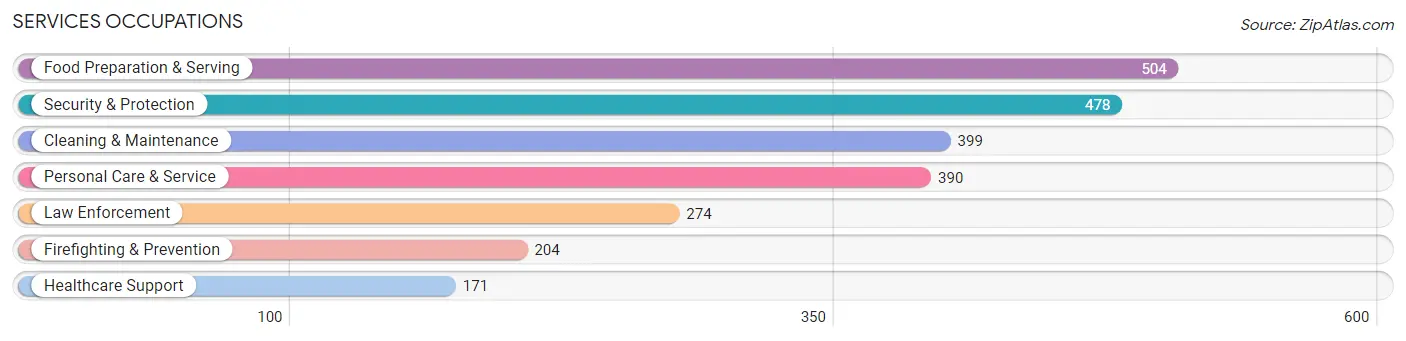
The most common Services occupations in New Lenox are Food Preparation & Serving (504 | 3.5%), Security & Protection (478 | 3.3%), Cleaning & Maintenance (399 | 2.8%), Personal Care & Service (390 | 2.7%), and Law Enforcement (274 | 1.9%).
Services Occupations by Sex
Within the Services occupations in New Lenox, the most male-oriented occupations are Cleaning & Maintenance (94.2%), Law Enforcement (82.1%), and Security & Protection (81.2%), while the most female-oriented occupations are Food Preparation & Serving (81.4%), Personal Care & Service (81.0%), and Healthcare Support (65.5%).
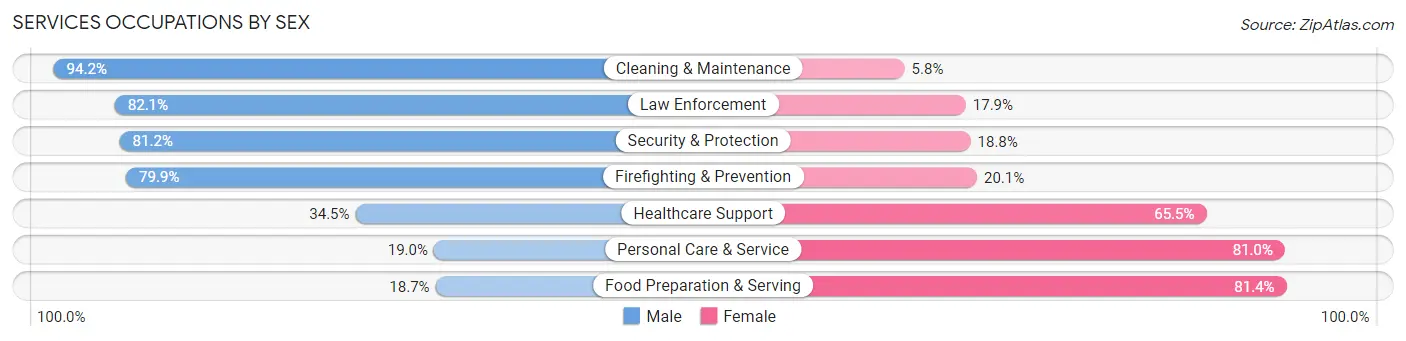
| Occupation | Male | Female |
| Healthcare Support | 59 (34.5%) | 112 (65.5%) |
| Security & Protection | 388 (81.2%) | 90 (18.8%) |
| Firefighting & Prevention | 163 (79.9%) | 41 (20.1%) |
| Law Enforcement | 225 (82.1%) | 49 (17.9%) |
| Food Preparation & Serving | 94 (18.6%) | 410 (81.4%) |
| Cleaning & Maintenance | 376 (94.2%) | 23 (5.8%) |
| Personal Care & Service | 74 (19.0%) | 316 (81.0%) |
| Total (Category) | 991 (51.0%) | 951 (49.0%) |
| Total (Overall) | 7,745 (53.9%) | 6,614 (46.1%) |
Sales and Office Occupations
The most common Sales and Office occupations in New Lenox are Sales & Related (1,617 | 11.3%), and Office & Administration (1,603 | 11.2%).

Sales and Office Occupations by Sex
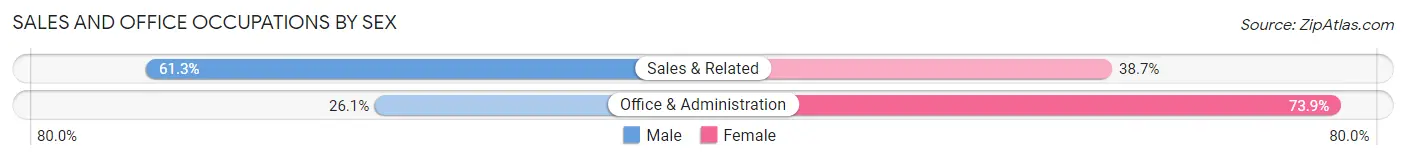
| Occupation | Male | Female |
| Sales & Related | 991 (61.3%) | 626 (38.7%) |
| Office & Administration | 418 (26.1%) | 1,185 (73.9%) |
| Total (Category) | 1,409 (43.8%) | 1,811 (56.2%) |
| Total (Overall) | 7,745 (53.9%) | 6,614 (46.1%) |
Natural Resources, Construction and Maintenance Occupations
The most common Natural Resources, Construction and Maintenance occupations in New Lenox are Construction & Extraction (914 | 6.4%), Installation, Maintenance & Repair (461 | 3.2%), and Farming, Fishing & Forestry (64 | 0.4%).
Natural Resources, Construction and Maintenance Occupations by Sex
| Occupation | Male | Female |
| Farming, Fishing & Forestry | 0 (0.0%) | 64 (100.0%) |
| Construction & Extraction | 904 (98.9%) | 10 (1.1%) |
| Installation, Maintenance & Repair | 420 (91.1%) | 41 (8.9%) |
| Total (Category) | 1,324 (92.0%) | 115 (8.0%) |
| Total (Overall) | 7,745 (53.9%) | 6,614 (46.1%) |
Production, Transportation and Moving Occupations
The most common Production, Transportation and Moving occupations in New Lenox are Material Moving (578 | 4.0%), Production (397 | 2.8%), and Transportation (352 | 2.5%).
Production, Transportation and Moving Occupations by Sex
| Occupation | Male | Female |
| Production | 326 (82.1%) | 71 (17.9%) |
| Transportation | 311 (88.3%) | 41 (11.7%) |
| Material Moving | 381 (65.9%) | 197 (34.1%) |
| Total (Category) | 1,018 (76.7%) | 309 (23.3%) |
| Total (Overall) | 7,745 (53.9%) | 6,614 (46.1%) |
Employment Industries by Sex in New Lenox
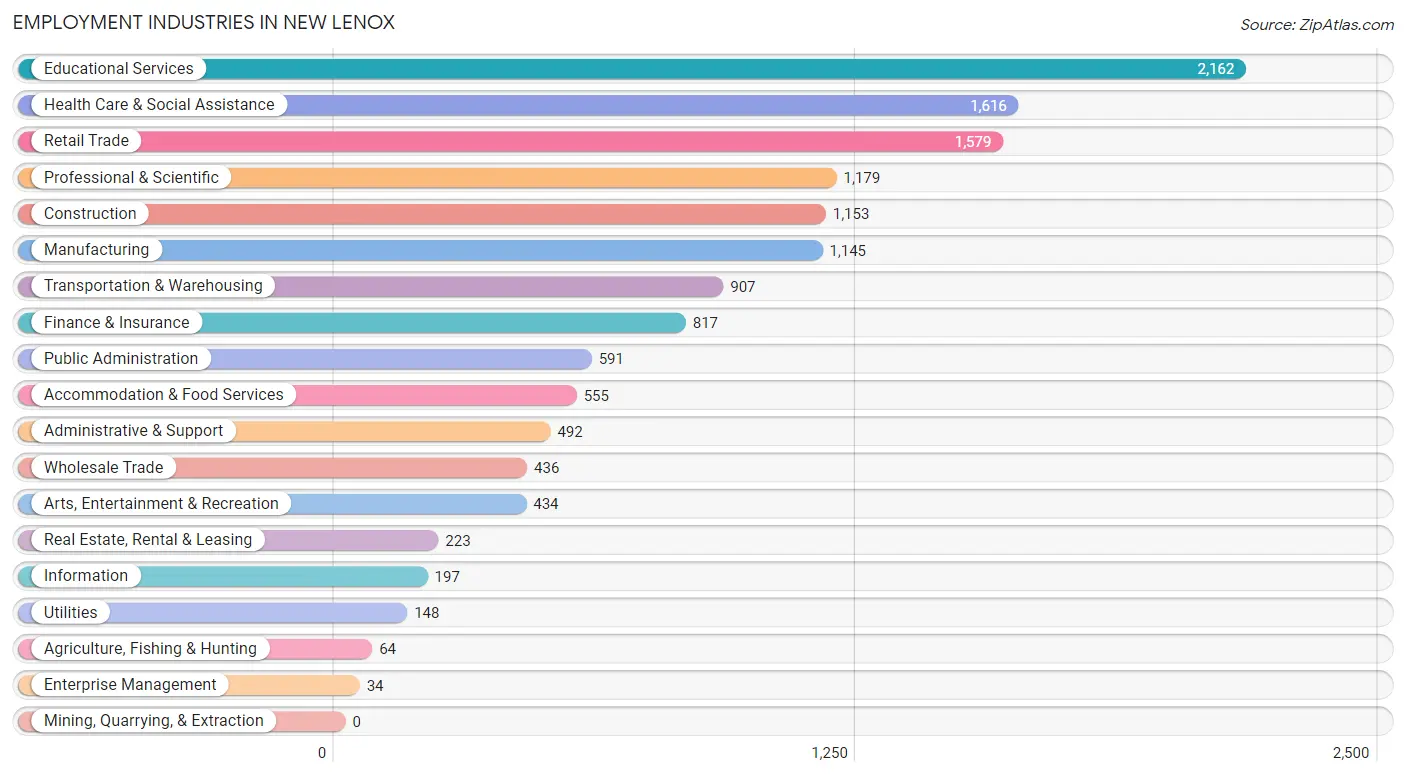
Employment Industries in New Lenox
The major employment industries in New Lenox include Educational Services (2,162 | 15.1%), Health Care & Social Assistance (1,616 | 11.3%), Retail Trade (1,579 | 11.0%), Professional & Scientific (1,179 | 8.2%), and Construction (1,153 | 8.0%).
Employment Industries by Sex in New Lenox
The New Lenox industries that see more men than women are Utilities (89.9%), Construction (89.2%), and Manufacturing (80.6%), whereas the industries that tend to have a higher number of women are Agriculture, Fishing & Hunting (100.0%), Health Care & Social Assistance (78.2%), and Accommodation & Food Services (71.5%).
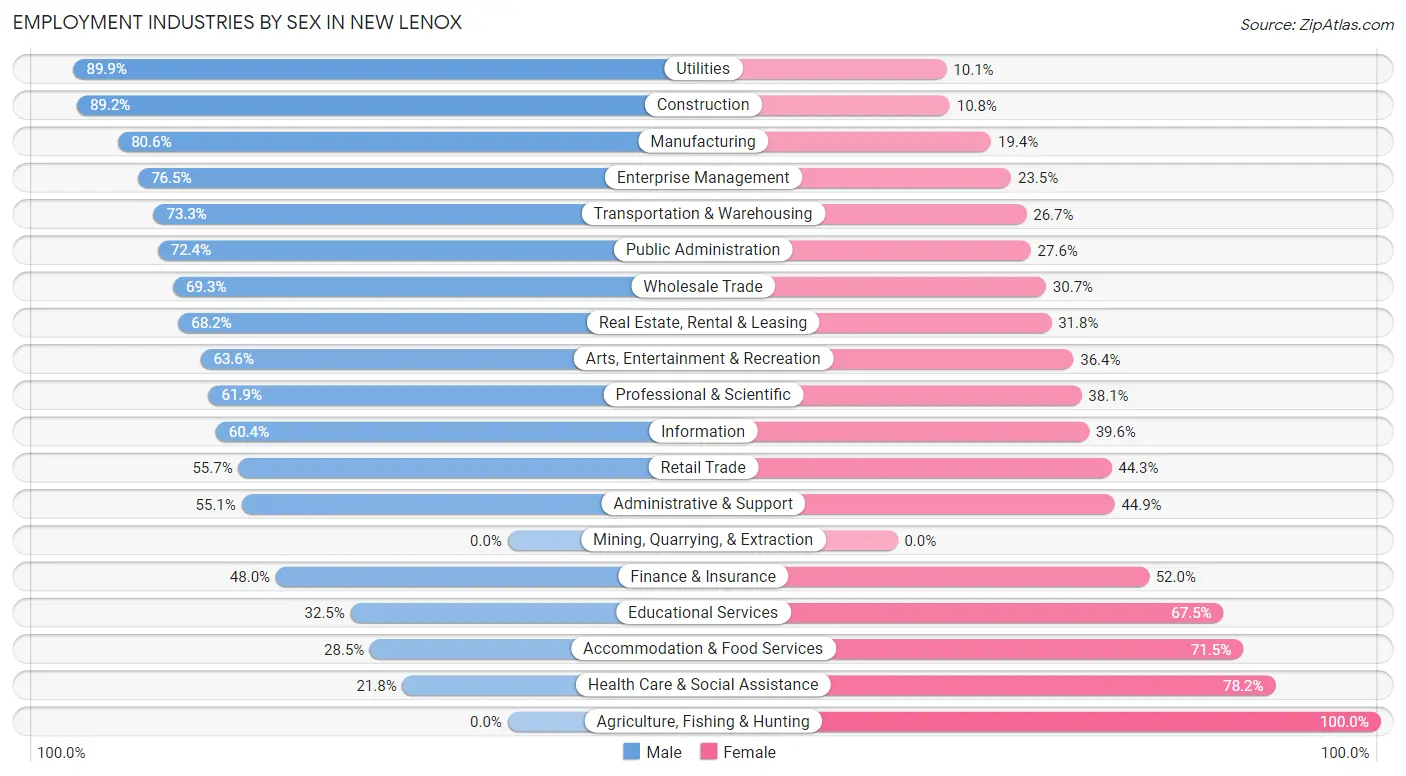
| Industry | Male | Female |
| Agriculture, Fishing & Hunting | 0 (0.0%) | 64 (100.0%) |
| Mining, Quarrying, & Extraction | 0 (0.0%) | 0 (0.0%) |
| Construction | 1,028 (89.2%) | 125 (10.8%) |
| Manufacturing | 923 (80.6%) | 222 (19.4%) |
| Wholesale Trade | 302 (69.3%) | 134 (30.7%) |
| Retail Trade | 880 (55.7%) | 699 (44.3%) |
| Transportation & Warehousing | 665 (73.3%) | 242 (26.7%) |
| Utilities | 133 (89.9%) | 15 (10.1%) |
| Information | 119 (60.4%) | 78 (39.6%) |
| Finance & Insurance | 392 (48.0%) | 425 (52.0%) |
| Real Estate, Rental & Leasing | 152 (68.2%) | 71 (31.8%) |
| Professional & Scientific | 730 (61.9%) | 449 (38.1%) |
| Enterprise Management | 26 (76.5%) | 8 (23.5%) |
| Administrative & Support | 271 (55.1%) | 221 (44.9%) |
| Educational Services | 703 (32.5%) | 1,459 (67.5%) |
| Health Care & Social Assistance | 352 (21.8%) | 1,264 (78.2%) |
| Arts, Entertainment & Recreation | 276 (63.6%) | 158 (36.4%) |
| Accommodation & Food Services | 158 (28.5%) | 397 (71.5%) |
| Public Administration | 428 (72.4%) | 163 (27.6%) |
| Total | 7,745 (53.9%) | 6,614 (46.1%) |
Education in New Lenox
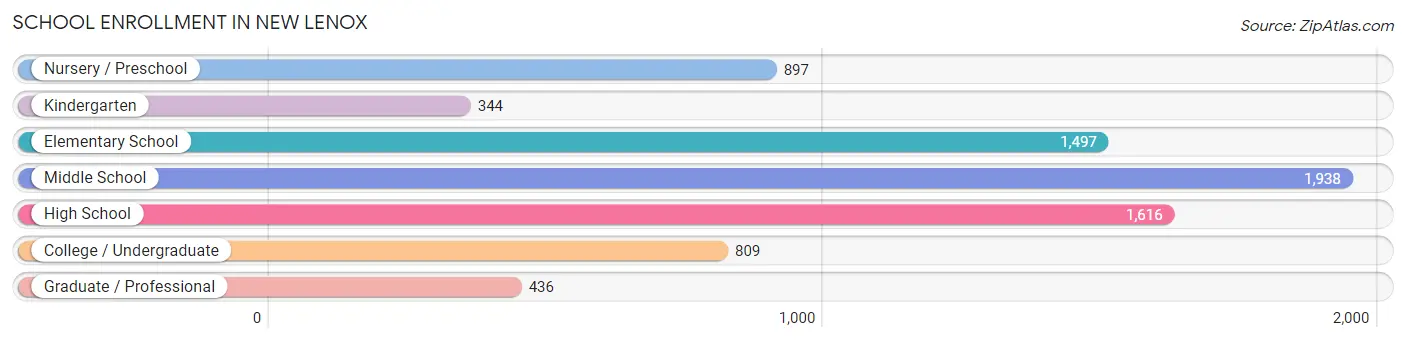
School Enrollment in New Lenox
The most common levels of schooling among the 7,537 students in New Lenox are middle school (1,938 | 25.7%), high school (1,616 | 21.4%), and elementary school (1,497 | 19.9%).
| School Level | # Students | % Students |
| Nursery / Preschool | 897 | 11.9% |
| Kindergarten | 344 | 4.6% |
| Elementary School | 1,497 | 19.9% |
| Middle School | 1,938 | 25.7% |
| High School | 1,616 | 21.4% |
| College / Undergraduate | 809 | 10.7% |
| Graduate / Professional | 436 | 5.8% |
| Total | 7,537 | 100.0% |
School Enrollment by Age by Funding Source in New Lenox
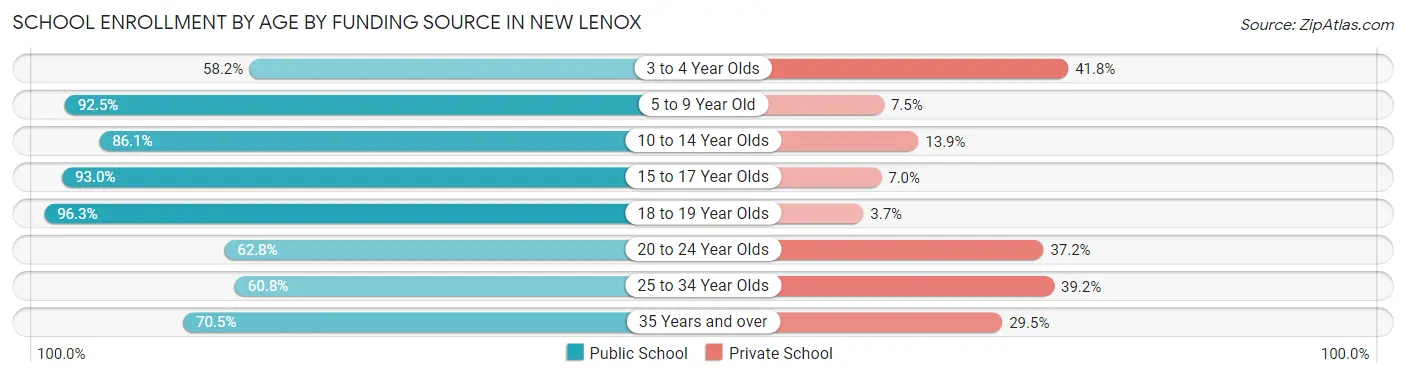
Out of a total of 7,537 students who are enrolled in schools in New Lenox, 1,259 (16.7%) attend a private institution, while the remaining 6,278 (83.3%) are enrolled in public schools. The age group of 3 to 4 year olds has the highest likelihood of being enrolled in private schools, with 340 (41.8% in the age bracket) enrolled. Conversely, the age group of 18 to 19 year olds has the lowest likelihood of being enrolled in a private school, with 474 (96.3% in the age bracket) attending a public institution.
| Age Bracket | Public School | Private School |
| 3 to 4 Year Olds | 473 (58.2%) | 340 (41.8%) |
| 5 to 9 Year Old | 1,699 (92.5%) | 138 (7.5%) |
| 10 to 14 Year Olds | 1,838 (86.1%) | 297 (13.9%) |
| 15 to 17 Year Olds | 1,076 (93.0%) | 81 (7.0%) |
| 18 to 19 Year Olds | 474 (96.3%) | 18 (3.7%) |
| 20 to 24 Year Olds | 356 (62.8%) | 211 (37.2%) |
| 25 to 34 Year Olds | 118 (60.8%) | 76 (39.2%) |
| 35 Years and over | 241 (70.5%) | 101 (29.5%) |
| Total | 6,278 (83.3%) | 1,259 (16.7%) |
Educational Attainment by Field of Study in New Lenox
Business (2,093 | 25.4%), education (1,576 | 19.1%), science & technology (1,098 | 13.3%), arts & humanities (668 | 8.1%), and engineering (430 | 5.2%) are the most common fields of study among 8,232 individuals in New Lenox who have obtained a bachelor's degree or higher.
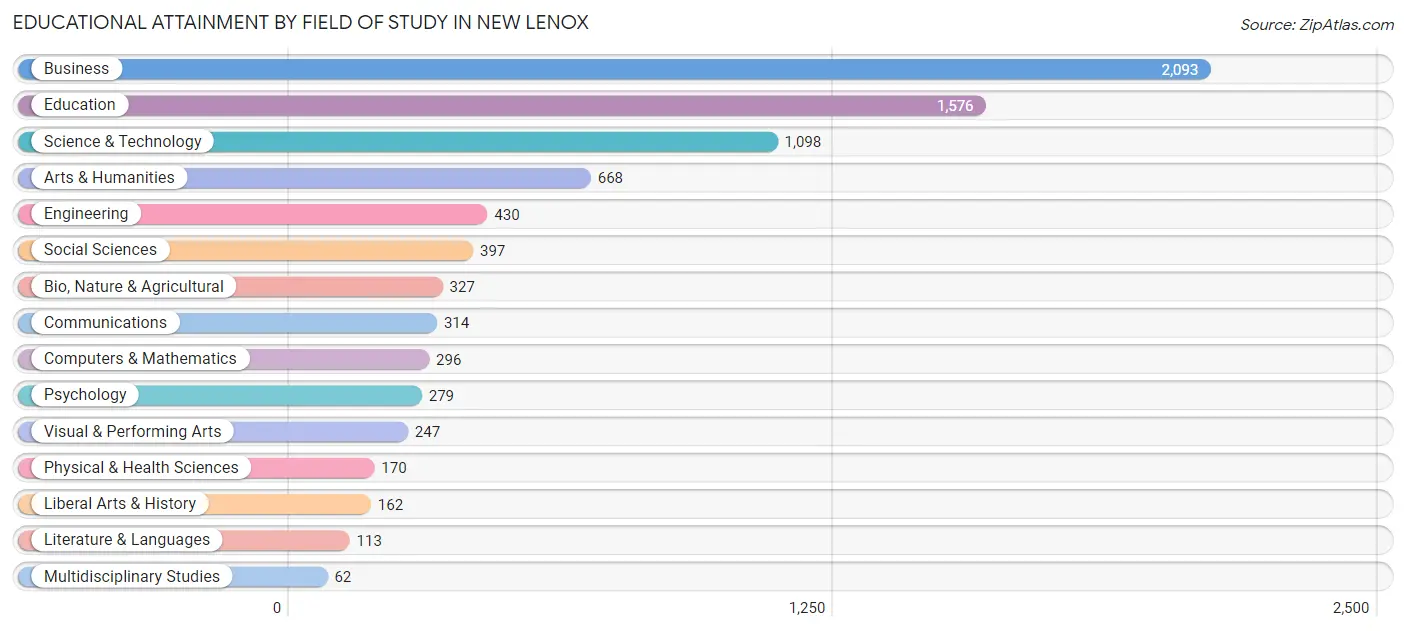
| Field of Study | # Graduates | % Graduates |
| Computers & Mathematics | 296 | 3.6% |
| Bio, Nature & Agricultural | 327 | 4.0% |
| Physical & Health Sciences | 170 | 2.1% |
| Psychology | 279 | 3.4% |
| Social Sciences | 397 | 4.8% |
| Engineering | 430 | 5.2% |
| Multidisciplinary Studies | 62 | 0.7% |
| Science & Technology | 1,098 | 13.3% |
| Business | 2,093 | 25.4% |
| Education | 1,576 | 19.1% |
| Literature & Languages | 113 | 1.4% |
| Liberal Arts & History | 162 | 2.0% |
| Visual & Performing Arts | 247 | 3.0% |
| Communications | 314 | 3.8% |
| Arts & Humanities | 668 | 8.1% |
| Total | 8,232 | 100.0% |
Transportation & Commute in New Lenox
Vehicle Availability by Sex in New Lenox
The most prevalent vehicle ownership categories in New Lenox are males with 2 vehicles (3,651, accounting for 47.8%) and females with 2 vehicles (3,049, making up 56.2%).
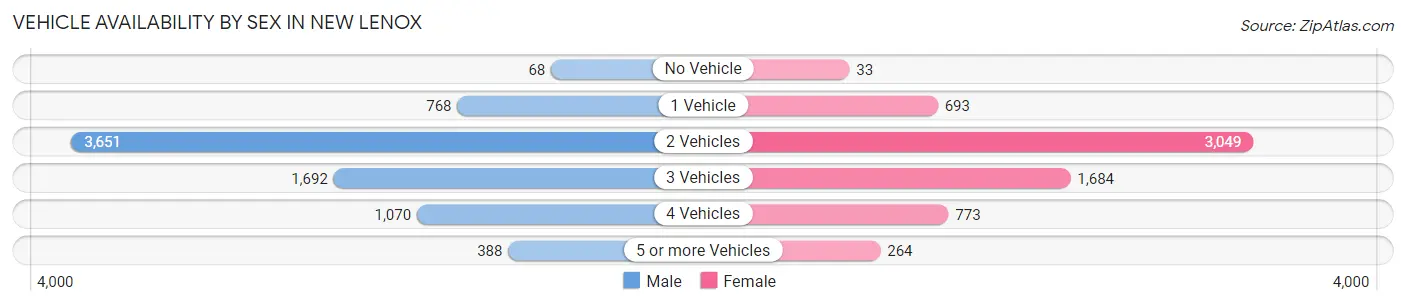
| Vehicles Available | Male | Female |
| No Vehicle | 68 (0.9%) | 33 (0.5%) |
| 1 Vehicle | 768 (10.1%) | 693 (10.7%) |
| 2 Vehicles | 3,651 (47.8%) | 3,049 (46.9%) |
| 3 Vehicles | 1,692 (22.2%) | 1,684 (25.9%) |
| 4 Vehicles | 1,070 (14.0%) | 773 (11.9%) |
| 5 or more Vehicles | 388 (5.1%) | 264 (4.1%) |
| Total | 7,637 (100.0%) | 6,496 (100.0%) |
Commute Time in New Lenox
The most frequently occuring commute durations in New Lenox are 45 to 59 minutes (1,803 commuters, 14.5%), 10 to 14 minutes (1,581 commuters, 12.8%), and 30 to 34 minutes (1,577 commuters, 12.7%).
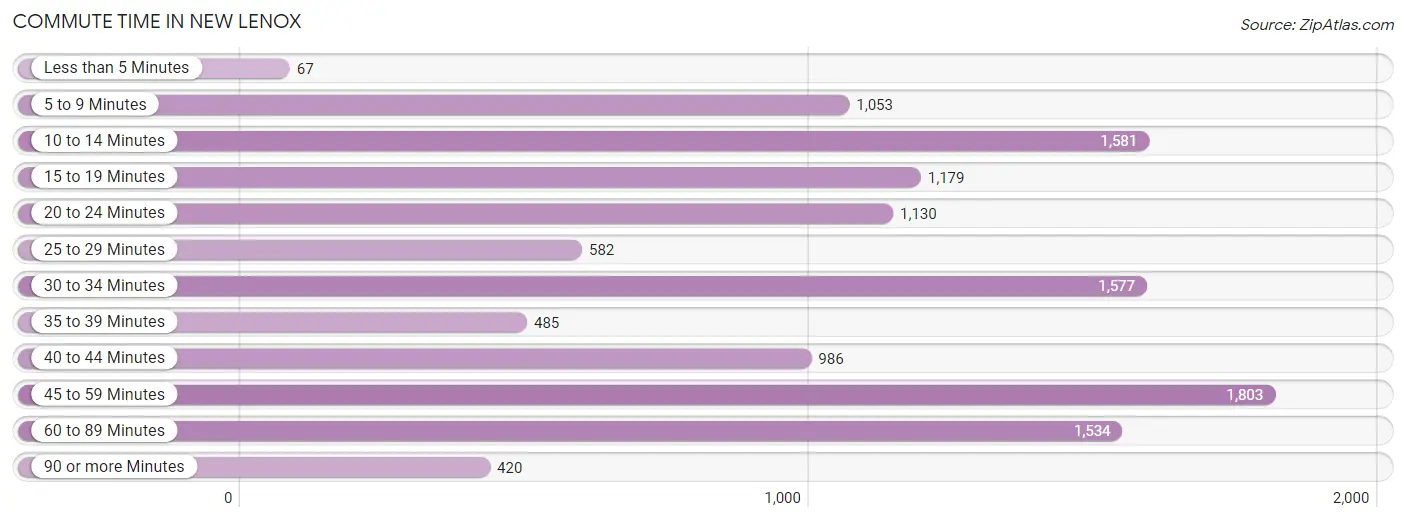
| Commute Time | # Commuters | % Commuters |
| Less than 5 Minutes | 67 | 0.5% |
| 5 to 9 Minutes | 1,053 | 8.5% |
| 10 to 14 Minutes | 1,581 | 12.8% |
| 15 to 19 Minutes | 1,179 | 9.5% |
| 20 to 24 Minutes | 1,130 | 9.1% |
| 25 to 29 Minutes | 582 | 4.7% |
| 30 to 34 Minutes | 1,577 | 12.7% |
| 35 to 39 Minutes | 485 | 3.9% |
| 40 to 44 Minutes | 986 | 8.0% |
| 45 to 59 Minutes | 1,803 | 14.5% |
| 60 to 89 Minutes | 1,534 | 12.4% |
| 90 or more Minutes | 420 | 3.4% |
Commute Time by Sex in New Lenox
The most common commute times in New Lenox are 60 to 89 minutes (1,179 commuters, 17.2%) for males and 10 to 14 minutes (914 commuters, 16.6%) for females.
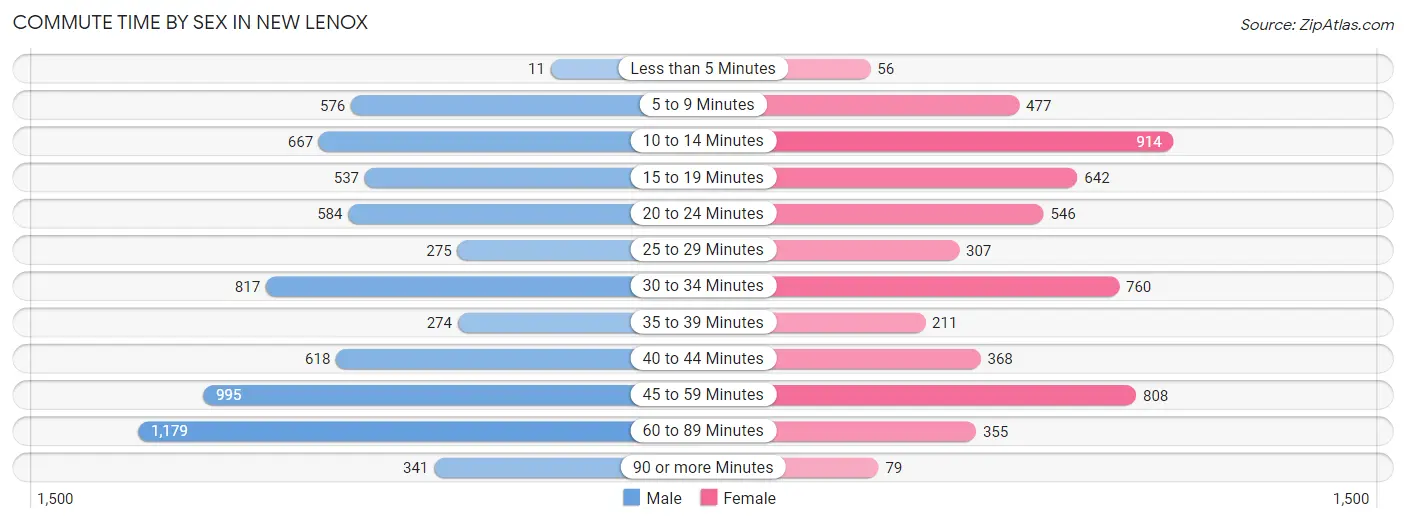
| Commute Time | Male | Female |
| Less than 5 Minutes | 11 (0.2%) | 56 (1.0%) |
| 5 to 9 Minutes | 576 (8.4%) | 477 (8.6%) |
| 10 to 14 Minutes | 667 (9.7%) | 914 (16.6%) |
| 15 to 19 Minutes | 537 (7.8%) | 642 (11.6%) |
| 20 to 24 Minutes | 584 (8.5%) | 546 (9.9%) |
| 25 to 29 Minutes | 275 (4.0%) | 307 (5.6%) |
| 30 to 34 Minutes | 817 (11.9%) | 760 (13.8%) |
| 35 to 39 Minutes | 274 (4.0%) | 211 (3.8%) |
| 40 to 44 Minutes | 618 (9.0%) | 368 (6.7%) |
| 45 to 59 Minutes | 995 (14.5%) | 808 (14.6%) |
| 60 to 89 Minutes | 1,179 (17.2%) | 355 (6.4%) |
| 90 or more Minutes | 341 (5.0%) | 79 (1.4%) |
Time of Departure to Work by Sex in New Lenox
The most frequent times of departure to work in New Lenox are 5:30 AM to 5:59 AM (990, 14.4%) for males and 7:00 AM to 7:29 AM (1,010, 18.3%) for females.
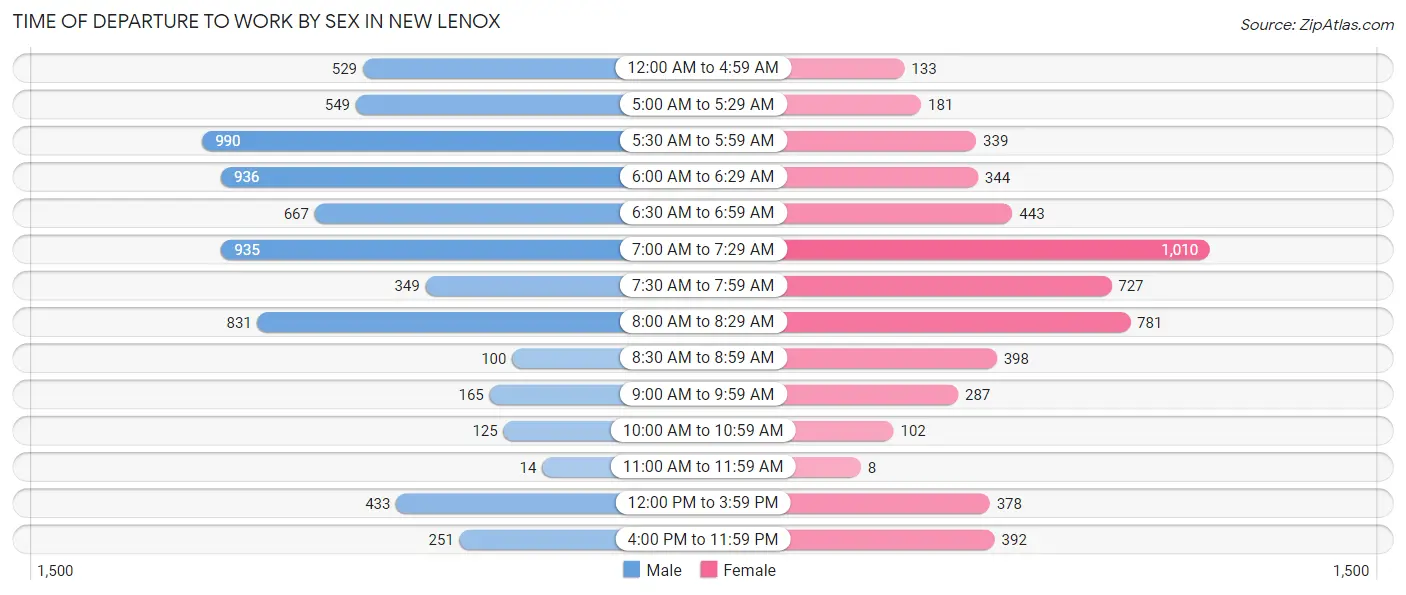
| Time of Departure | Male | Female |
| 12:00 AM to 4:59 AM | 529 (7.7%) | 133 (2.4%) |
| 5:00 AM to 5:29 AM | 549 (8.0%) | 181 (3.3%) |
| 5:30 AM to 5:59 AM | 990 (14.4%) | 339 (6.1%) |
| 6:00 AM to 6:29 AM | 936 (13.6%) | 344 (6.2%) |
| 6:30 AM to 6:59 AM | 667 (9.7%) | 443 (8.0%) |
| 7:00 AM to 7:29 AM | 935 (13.6%) | 1,010 (18.3%) |
| 7:30 AM to 7:59 AM | 349 (5.1%) | 727 (13.2%) |
| 8:00 AM to 8:29 AM | 831 (12.1%) | 781 (14.1%) |
| 8:30 AM to 8:59 AM | 100 (1.5%) | 398 (7.2%) |
| 9:00 AM to 9:59 AM | 165 (2.4%) | 287 (5.2%) |
| 10:00 AM to 10:59 AM | 125 (1.8%) | 102 (1.8%) |
| 11:00 AM to 11:59 AM | 14 (0.2%) | 8 (0.1%) |
| 12:00 PM to 3:59 PM | 433 (6.3%) | 378 (6.8%) |
| 4:00 PM to 11:59 PM | 251 (3.6%) | 392 (7.1%) |
| Total | 6,874 (100.0%) | 5,523 (100.0%) |
Housing Occupancy in New Lenox
Occupancy by Ownership in New Lenox
Of the total 9,006 dwellings in New Lenox, owner-occupied units account for 8,198 (91.0%), while renter-occupied units make up 808 (9.0%).
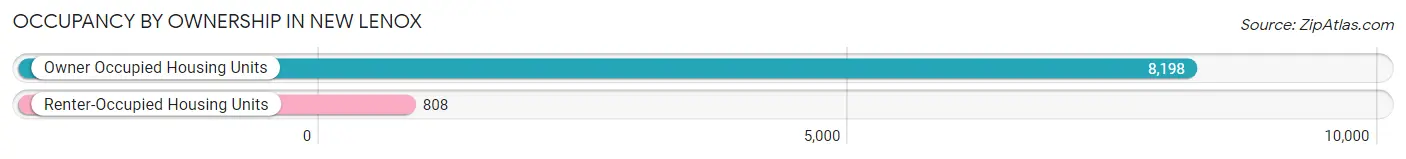
| Occupancy | # Housing Units | % Housing Units |
| Owner Occupied Housing Units | 8,198 | 91.0% |
| Renter-Occupied Housing Units | 808 | 9.0% |
| Total Occupied Housing Units | 9,006 | 100.0% |
Occupancy by Household Size in New Lenox
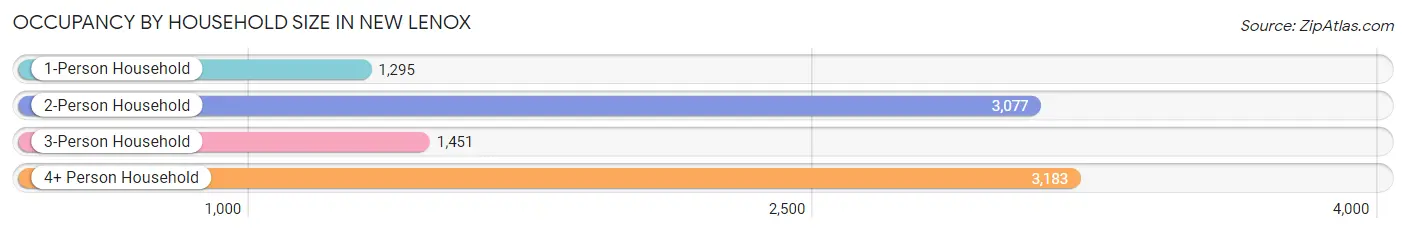
| Household Size | # Housing Units | % Housing Units |
| 1-Person Household | 1,295 | 14.4% |
| 2-Person Household | 3,077 | 34.2% |
| 3-Person Household | 1,451 | 16.1% |
| 4+ Person Household | 3,183 | 35.3% |
| Total Housing Units | 9,006 | 100.0% |
Occupancy by Ownership by Household Size in New Lenox
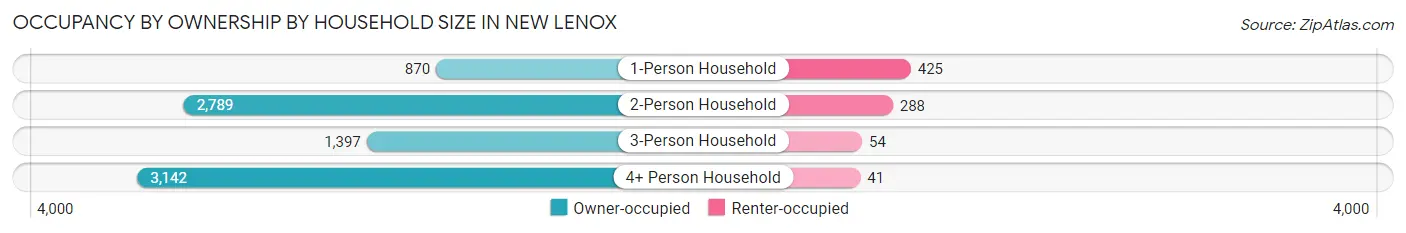
| Household Size | Owner-occupied | Renter-occupied |
| 1-Person Household | 870 (67.2%) | 425 (32.8%) |
| 2-Person Household | 2,789 (90.6%) | 288 (9.4%) |
| 3-Person Household | 1,397 (96.3%) | 54 (3.7%) |
| 4+ Person Household | 3,142 (98.7%) | 41 (1.3%) |
| Total Housing Units | 8,198 (91.0%) | 808 (9.0%) |
Occupancy by Educational Attainment in New Lenox
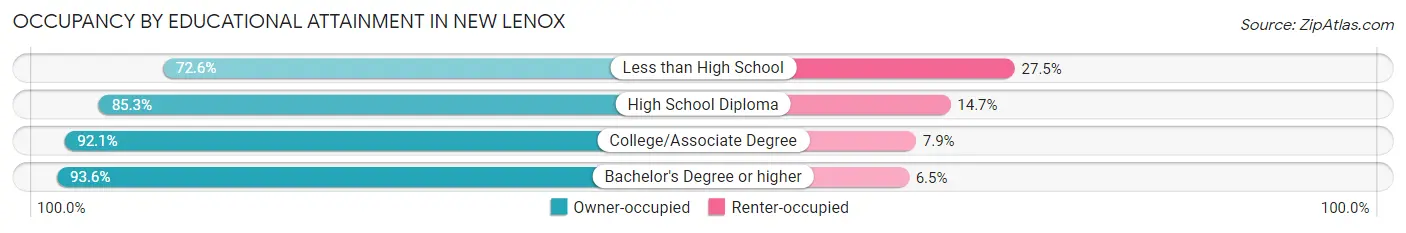
| Household Size | Owner-occupied | Renter-occupied |
| Less than High School | 111 (72.6%) | 42 (27.5%) |
| High School Diploma | 1,623 (85.3%) | 280 (14.7%) |
| College/Associate Degree | 2,460 (92.1%) | 210 (7.9%) |
| Bachelor's Degree or higher | 4,004 (93.5%) | 276 (6.5%) |
Occupancy by Age of Householder in New Lenox
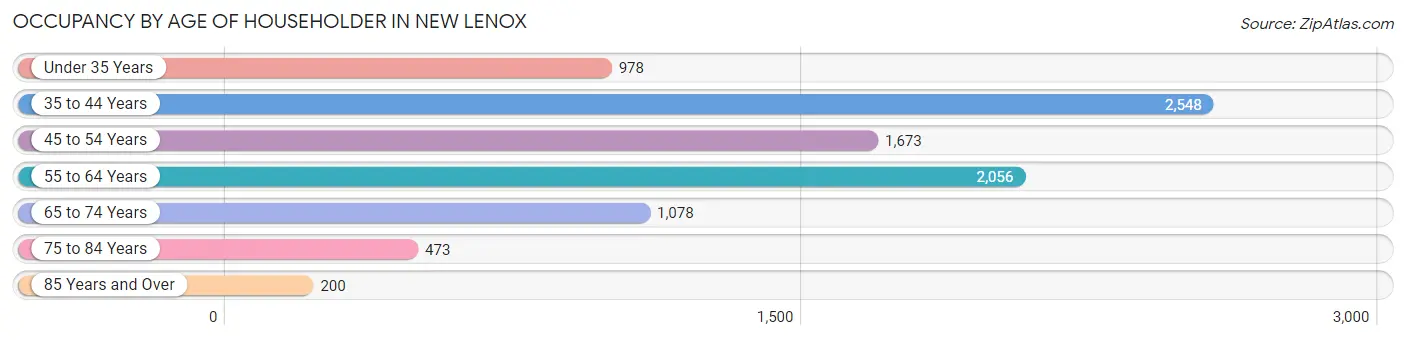
| Age Bracket | # Households | % Households |
| Under 35 Years | 978 | 10.9% |
| 35 to 44 Years | 2,548 | 28.3% |
| 45 to 54 Years | 1,673 | 18.6% |
| 55 to 64 Years | 2,056 | 22.8% |
| 65 to 74 Years | 1,078 | 12.0% |
| 75 to 84 Years | 473 | 5.2% |
| 85 Years and Over | 200 | 2.2% |
| Total | 9,006 | 100.0% |
Housing Finances in New Lenox
Median Income by Occupancy in New Lenox
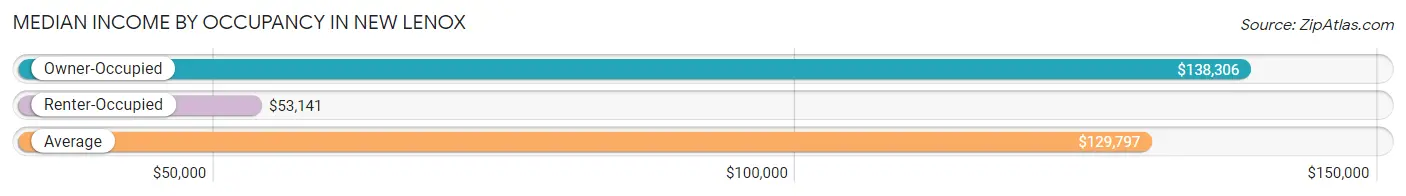
| Occupancy Type | # Households | Median Income |
| Owner-Occupied | 8,198 (91.0%) | $138,306 |
| Renter-Occupied | 808 (9.0%) | $53,141 |
| Average | 9,006 (100.0%) | $129,797 |
Occupancy by Householder Income Bracket in New Lenox
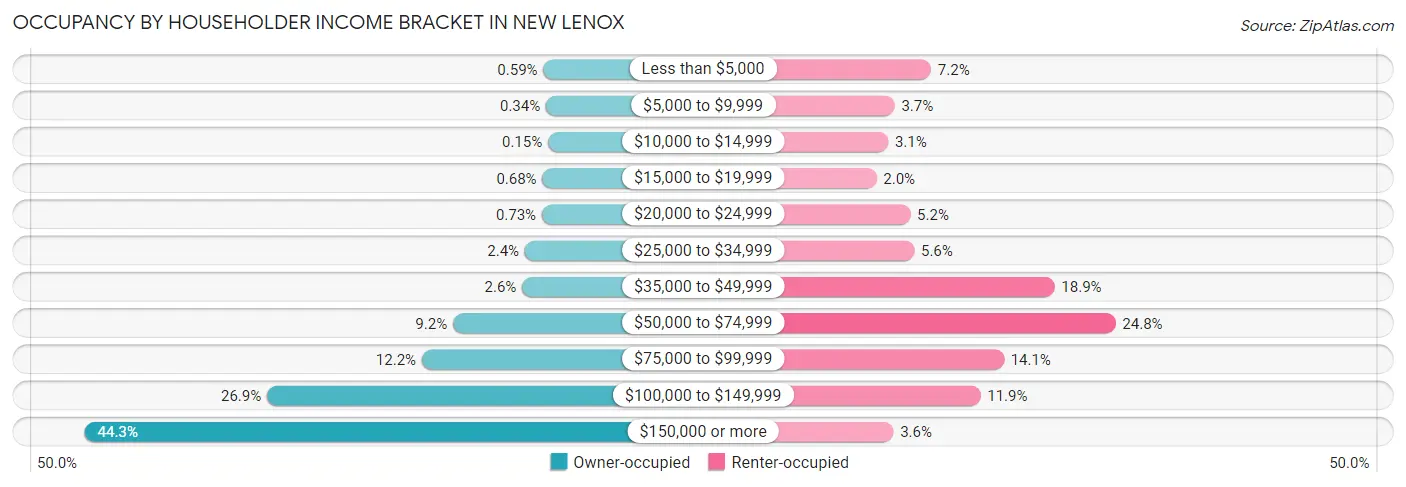
| Income Bracket | Owner-occupied | Renter-occupied |
| Less than $5,000 | 48 (0.6%) | 58 (7.2%) |
| $5,000 to $9,999 | 28 (0.3%) | 30 (3.7%) |
| $10,000 to $14,999 | 12 (0.2%) | 25 (3.1%) |
| $15,000 to $19,999 | 56 (0.7%) | 16 (2.0%) |
| $20,000 to $24,999 | 60 (0.7%) | 42 (5.2%) |
| $25,000 to $34,999 | 193 (2.4%) | 45 (5.6%) |
| $35,000 to $49,999 | 214 (2.6%) | 153 (18.9%) |
| $50,000 to $74,999 | 754 (9.2%) | 200 (24.7%) |
| $75,000 to $99,999 | 997 (12.2%) | 114 (14.1%) |
| $100,000 to $149,999 | 2,206 (26.9%) | 96 (11.9%) |
| $150,000 or more | 3,630 (44.3%) | 29 (3.6%) |
| Total | 8,198 (100.0%) | 808 (100.0%) |
Monthly Housing Cost Tiers in New Lenox
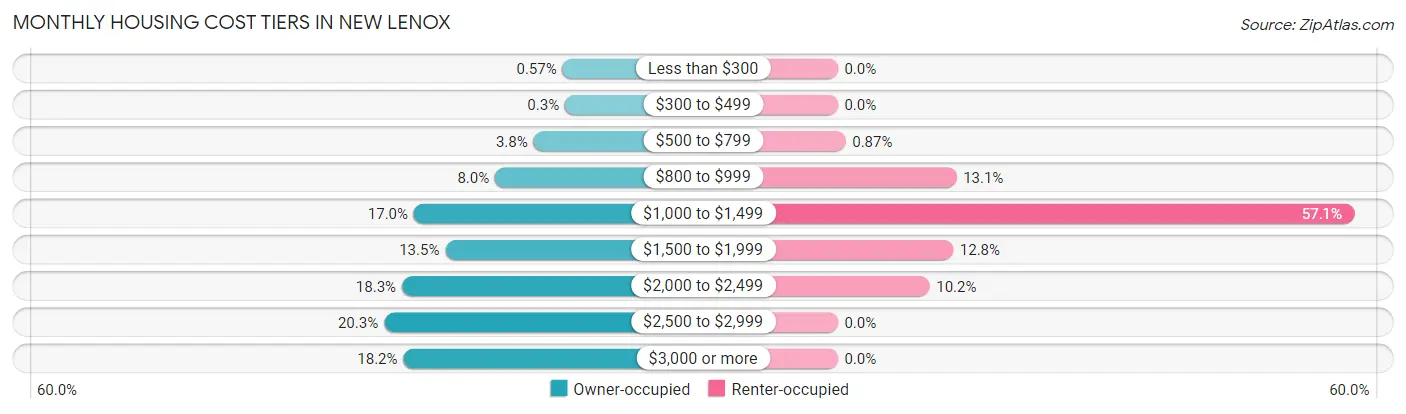
| Monthly Cost | Owner-occupied | Renter-occupied |
| Less than $300 | 47 (0.6%) | 0 (0.0%) |
| $300 to $499 | 25 (0.3%) | 0 (0.0%) |
| $500 to $799 | 310 (3.8%) | 7 (0.9%) |
| $800 to $999 | 658 (8.0%) | 106 (13.1%) |
| $1,000 to $1,499 | 1,394 (17.0%) | 461 (57.1%) |
| $1,500 to $1,999 | 1,109 (13.5%) | 103 (12.8%) |
| $2,000 to $2,499 | 1,502 (18.3%) | 82 (10.2%) |
| $2,500 to $2,999 | 1,664 (20.3%) | 0 (0.0%) |
| $3,000 or more | 1,489 (18.2%) | 0 (0.0%) |
| Total | 8,198 (100.0%) | 808 (100.0%) |
Physical Housing Characteristics in New Lenox
Housing Structures in New Lenox
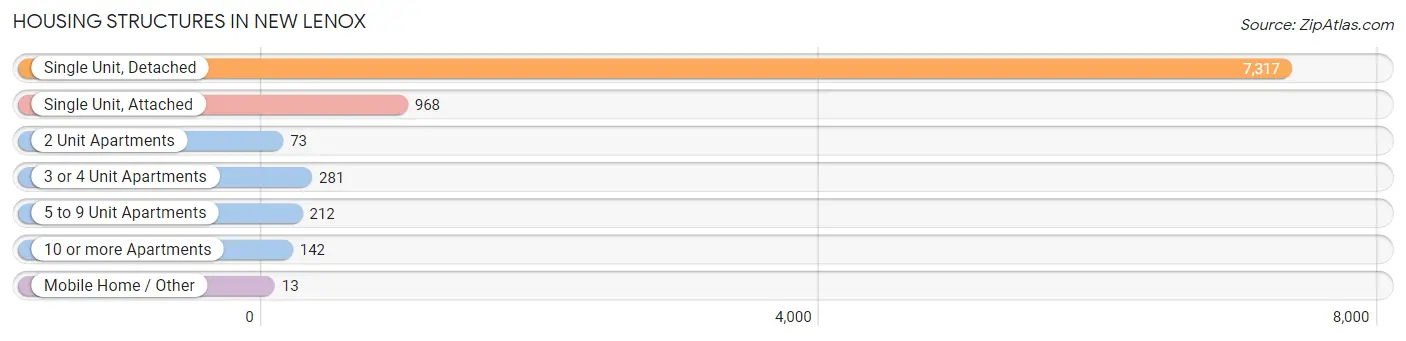
| Structure Type | # Housing Units | % Housing Units |
| Single Unit, Detached | 7,317 | 81.2% |
| Single Unit, Attached | 968 | 10.7% |
| 2 Unit Apartments | 73 | 0.8% |
| 3 or 4 Unit Apartments | 281 | 3.1% |
| 5 to 9 Unit Apartments | 212 | 2.4% |
| 10 or more Apartments | 142 | 1.6% |
| Mobile Home / Other | 13 | 0.1% |
| Total | 9,006 | 100.0% |
Housing Structures by Occupancy in New Lenox
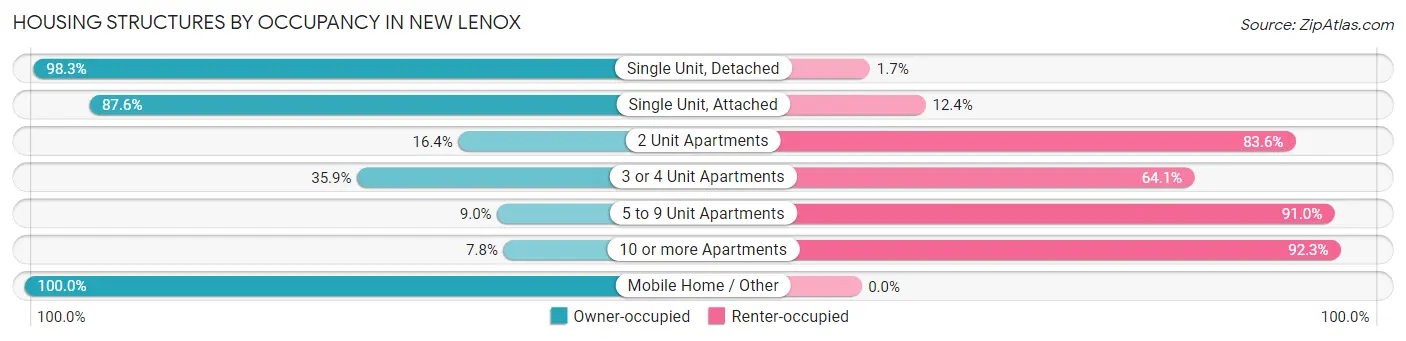
| Structure Type | Owner-occupied | Renter-occupied |
| Single Unit, Detached | 7,194 (98.3%) | 123 (1.7%) |
| Single Unit, Attached | 848 (87.6%) | 120 (12.4%) |
| 2 Unit Apartments | 12 (16.4%) | 61 (83.6%) |
| 3 or 4 Unit Apartments | 101 (35.9%) | 180 (64.1%) |
| 5 to 9 Unit Apartments | 19 (9.0%) | 193 (91.0%) |
| 10 or more Apartments | 11 (7.7%) | 131 (92.2%) |
| Mobile Home / Other | 13 (100.0%) | 0 (0.0%) |
| Total | 8,198 (91.0%) | 808 (9.0%) |
Housing Structures by Number of Rooms in New Lenox
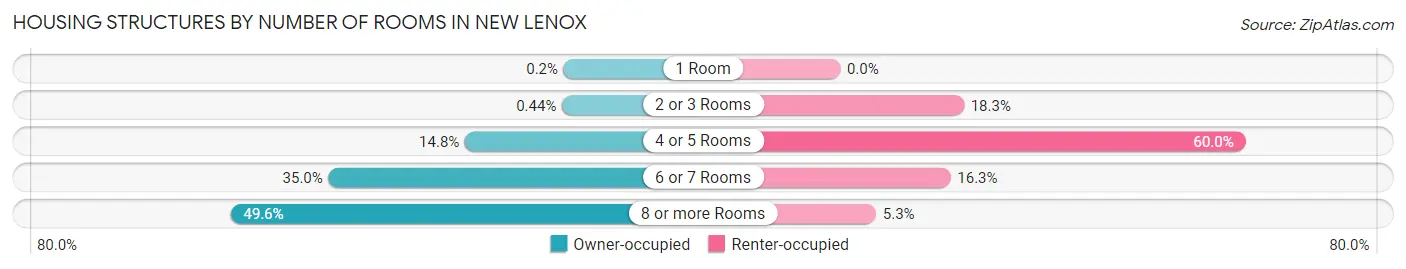
| Number of Rooms | Owner-occupied | Renter-occupied |
| 1 Room | 16 (0.2%) | 0 (0.0%) |
| 2 or 3 Rooms | 36 (0.4%) | 148 (18.3%) |
| 4 or 5 Rooms | 1,214 (14.8%) | 485 (60.0%) |
| 6 or 7 Rooms | 2,870 (35.0%) | 132 (16.3%) |
| 8 or more Rooms | 4,062 (49.5%) | 43 (5.3%) |
| Total | 8,198 (100.0%) | 808 (100.0%) |
Housing Structure by Heating Type in New Lenox
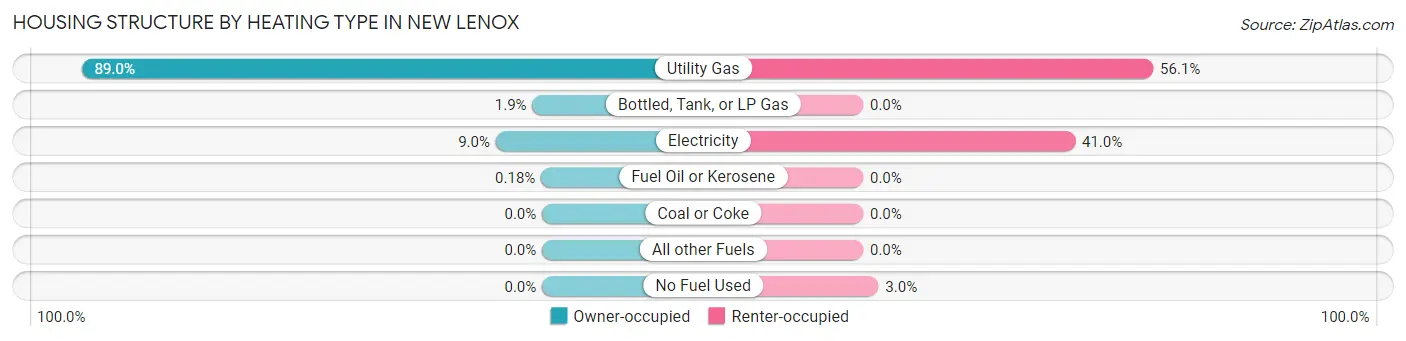
| Heating Type | Owner-occupied | Renter-occupied |
| Utility Gas | 7,296 (89.0%) | 453 (56.1%) |
| Bottled, Tank, or LP Gas | 153 (1.9%) | 0 (0.0%) |
| Electricity | 734 (8.9%) | 331 (41.0%) |
| Fuel Oil or Kerosene | 15 (0.2%) | 0 (0.0%) |
| Coal or Coke | 0 (0.0%) | 0 (0.0%) |
| All other Fuels | 0 (0.0%) | 0 (0.0%) |
| No Fuel Used | 0 (0.0%) | 24 (3.0%) |
| Total | 8,198 (100.0%) | 808 (100.0%) |
Household Vehicle Usage in New Lenox
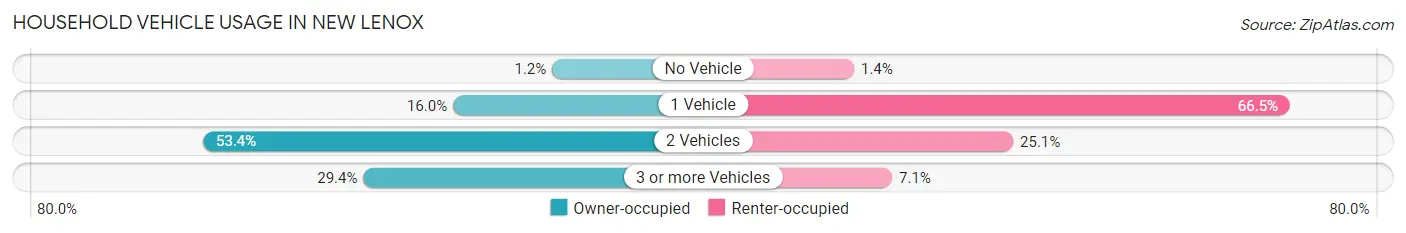
| Vehicles per Household | Owner-occupied | Renter-occupied |
| No Vehicle | 99 (1.2%) | 11 (1.4%) |
| 1 Vehicle | 1,313 (16.0%) | 537 (66.5%) |
| 2 Vehicles | 4,375 (53.4%) | 203 (25.1%) |
| 3 or more Vehicles | 2,411 (29.4%) | 57 (7.0%) |
| Total | 8,198 (100.0%) | 808 (100.0%) |
Real Estate & Mortgages in New Lenox
Real Estate and Mortgage Overview in New Lenox
| Characteristic | Without Mortgage | With Mortgage |
| Housing Units | 2,146 | 6,052 |
| Median Property Value | $333,200 | $365,700 |
| Median Household Income | $114,750 | $2,961 |
| Monthly Housing Costs | $1,040 | $1,471 |
| Real Estate Taxes | $7,665 | $45 |
Property Value by Mortgage Status in New Lenox
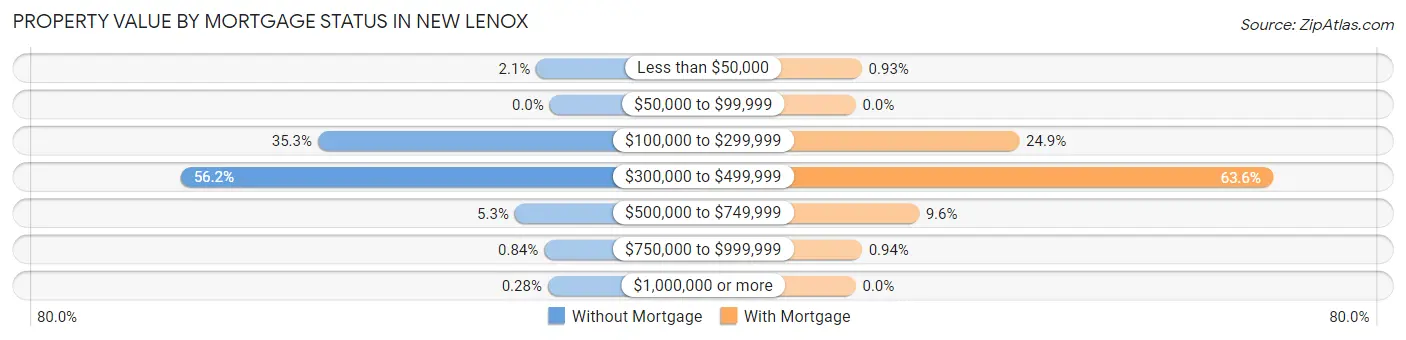
| Property Value | Without Mortgage | With Mortgage |
| Less than $50,000 | 44 (2.1%) | 56 (0.9%) |
| $50,000 to $99,999 | 0 (0.0%) | 0 (0.0%) |
| $100,000 to $299,999 | 758 (35.3%) | 1,508 (24.9%) |
| $300,000 to $499,999 | 1,206 (56.2%) | 3,848 (63.6%) |
| $500,000 to $749,999 | 114 (5.3%) | 583 (9.6%) |
| $750,000 to $999,999 | 18 (0.8%) | 57 (0.9%) |
| $1,000,000 or more | 6 (0.3%) | 0 (0.0%) |
| Total | 2,146 (100.0%) | 6,052 (100.0%) |
Household Income by Mortgage Status in New Lenox
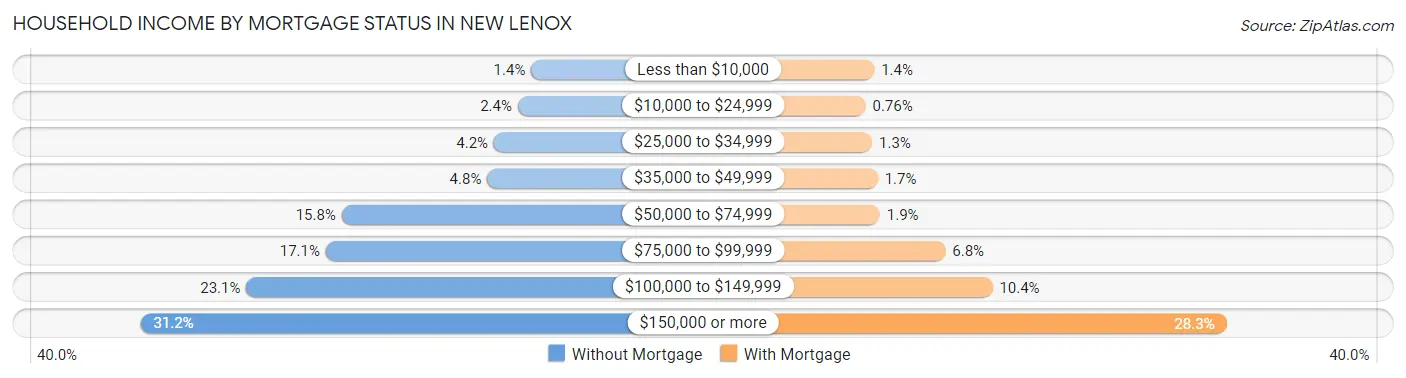
| Household Income | Without Mortgage | With Mortgage |
| Less than $10,000 | 30 (1.4%) | 86 (1.4%) |
| $10,000 to $24,999 | 52 (2.4%) | 46 (0.8%) |
| $25,000 to $34,999 | 91 (4.2%) | 76 (1.3%) |
| $35,000 to $49,999 | 102 (4.8%) | 102 (1.7%) |
| $50,000 to $74,999 | 340 (15.8%) | 112 (1.8%) |
| $75,000 to $99,999 | 366 (17.1%) | 414 (6.8%) |
| $100,000 to $149,999 | 496 (23.1%) | 631 (10.4%) |
| $150,000 or more | 669 (31.2%) | 1,710 (28.3%) |
| Total | 2,146 (100.0%) | 6,052 (100.0%) |
Property Value to Household Income Ratio in New Lenox
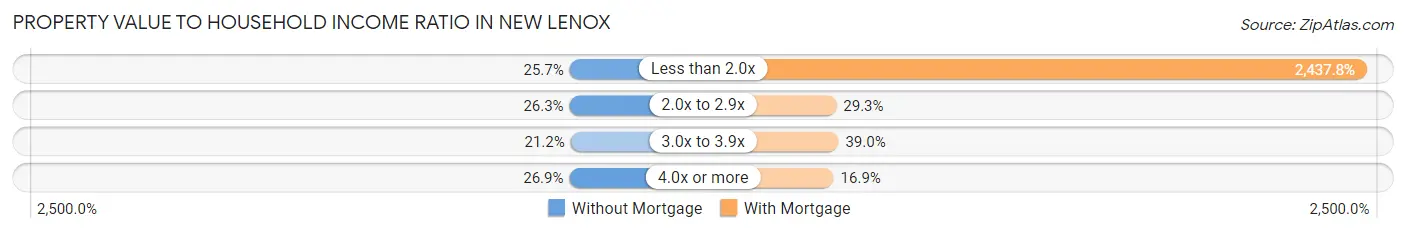
| Value-to-Income Ratio | Without Mortgage | With Mortgage |
| Less than 2.0x | 551 (25.7%) | 147,538 (2,437.8%) |
| 2.0x to 2.9x | 564 (26.3%) | 1,773 (29.3%) |
| 3.0x to 3.9x | 454 (21.2%) | 2,358 (39.0%) |
| 4.0x or more | 577 (26.9%) | 1,021 (16.9%) |
| Total | 2,146 (100.0%) | 6,052 (100.0%) |
Real Estate Taxes by Mortgage Status in New Lenox
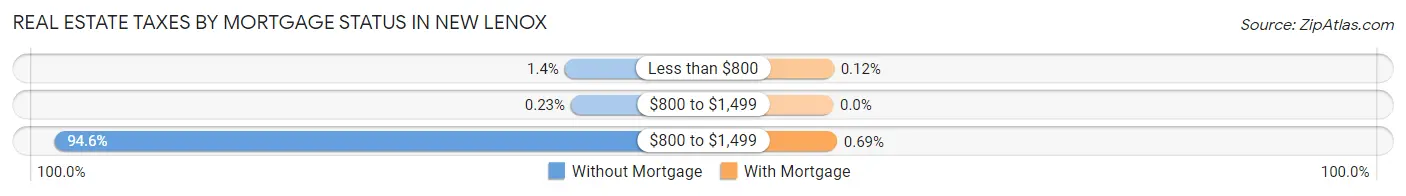
| Property Taxes | Without Mortgage | With Mortgage |
| Less than $800 | 29 (1.3%) | 7 (0.1%) |
| $800 to $1,499 | 5 (0.2%) | 0 (0.0%) |
| $800 to $1,499 | 2,030 (94.6%) | 42 (0.7%) |
| Total | 2,146 (100.0%) | 6,052 (100.0%) |
Health & Disability in New Lenox
Health Insurance Coverage by Age in New Lenox
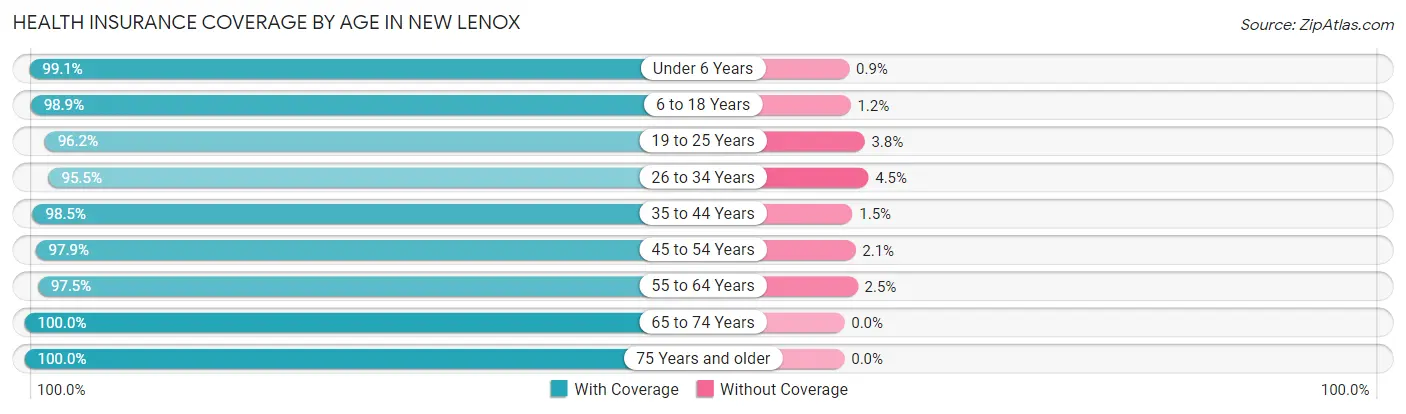
| Age Bracket | With Coverage | Without Coverage |
| Under 6 Years | 2,758 (99.1%) | 25 (0.9%) |
| 6 to 18 Years | 5,239 (98.9%) | 61 (1.1%) |
| 19 to 25 Years | 1,892 (96.2%) | 74 (3.8%) |
| 26 to 34 Years | 2,332 (95.5%) | 109 (4.5%) |
| 35 to 44 Years | 4,648 (98.5%) | 71 (1.5%) |
| 45 to 54 Years | 3,230 (97.9%) | 68 (2.1%) |
| 55 to 64 Years | 3,493 (97.5%) | 89 (2.5%) |
| 65 to 74 Years | 1,894 (100.0%) | 0 (0.0%) |
| 75 Years and older | 1,170 (100.0%) | 0 (0.0%) |
| Total | 26,656 (98.2%) | 497 (1.8%) |
Health Insurance Coverage by Citizenship Status in New Lenox
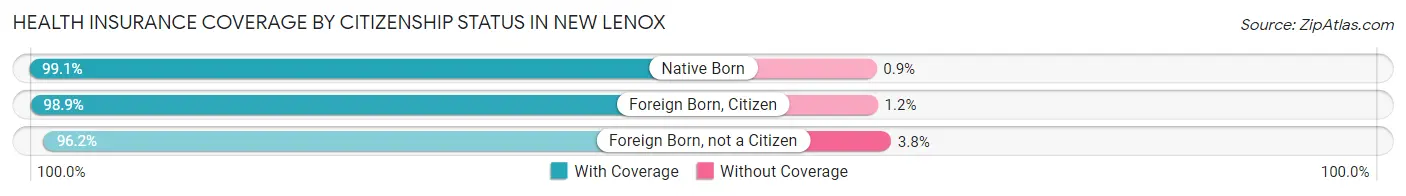
| Citizenship Status | With Coverage | Without Coverage |
| Native Born | 2,758 (99.1%) | 25 (0.9%) |
| Foreign Born, Citizen | 5,239 (98.9%) | 61 (1.1%) |
| Foreign Born, not a Citizen | 1,892 (96.2%) | 74 (3.8%) |
Health Insurance Coverage by Household Income in New Lenox
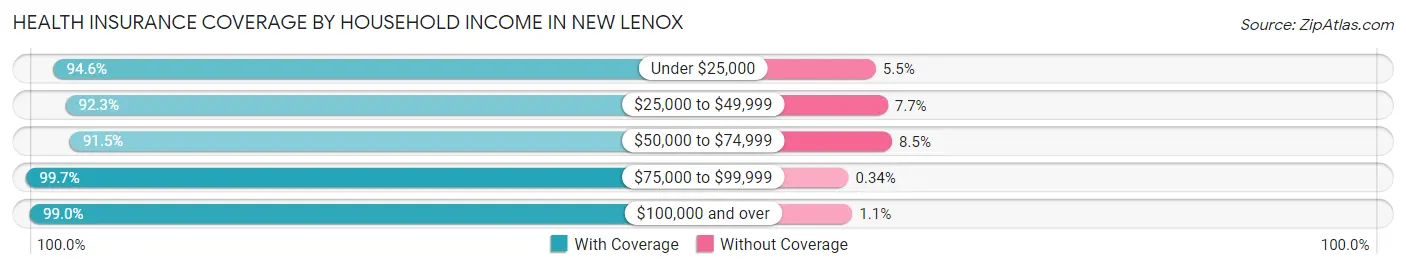
| Household Income | With Coverage | Without Coverage |
| Under $25,000 | 590 (94.6%) | 34 (5.4%) |
| $25,000 to $49,999 | 888 (92.3%) | 74 (7.7%) |
| $50,000 to $74,999 | 1,743 (91.5%) | 162 (8.5%) |
| $75,000 to $99,999 | 2,926 (99.7%) | 10 (0.3%) |
| $100,000 and over | 20,488 (99.0%) | 217 (1.1%) |
Public vs Private Health Insurance Coverage by Age in New Lenox
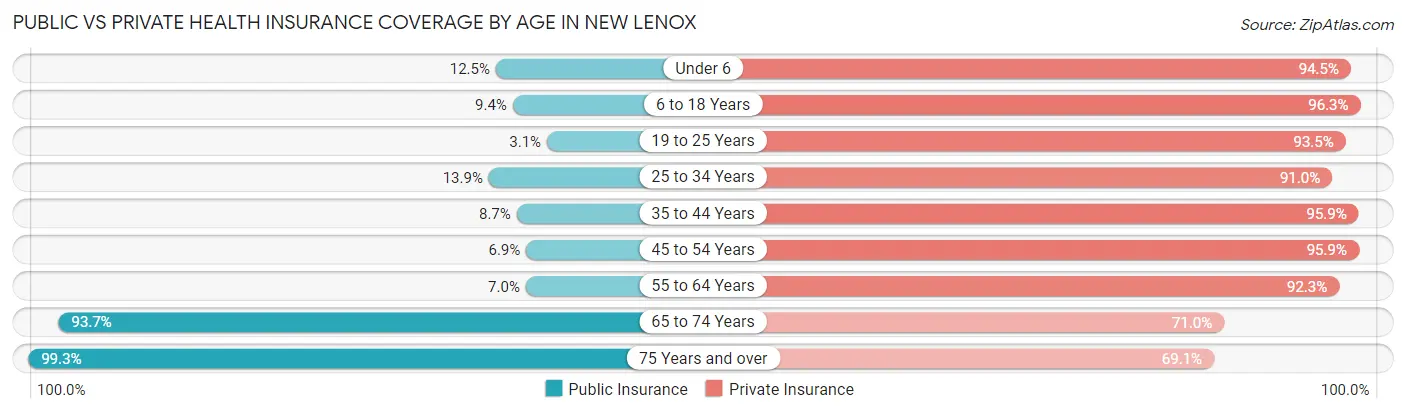
| Age Bracket | Public Insurance | Private Insurance |
| Under 6 | 349 (12.5%) | 2,629 (94.5%) |
| 6 to 18 Years | 498 (9.4%) | 5,101 (96.3%) |
| 19 to 25 Years | 60 (3.0%) | 1,838 (93.5%) |
| 25 to 34 Years | 338 (13.9%) | 2,221 (91.0%) |
| 35 to 44 Years | 409 (8.7%) | 4,526 (95.9%) |
| 45 to 54 Years | 228 (6.9%) | 3,164 (95.9%) |
| 55 to 64 Years | 250 (7.0%) | 3,306 (92.3%) |
| 65 to 74 Years | 1,775 (93.7%) | 1,344 (71.0%) |
| 75 Years and over | 1,162 (99.3%) | 808 (69.1%) |
| Total | 5,069 (18.7%) | 24,937 (91.8%) |
Disability Status by Sex by Age in New Lenox
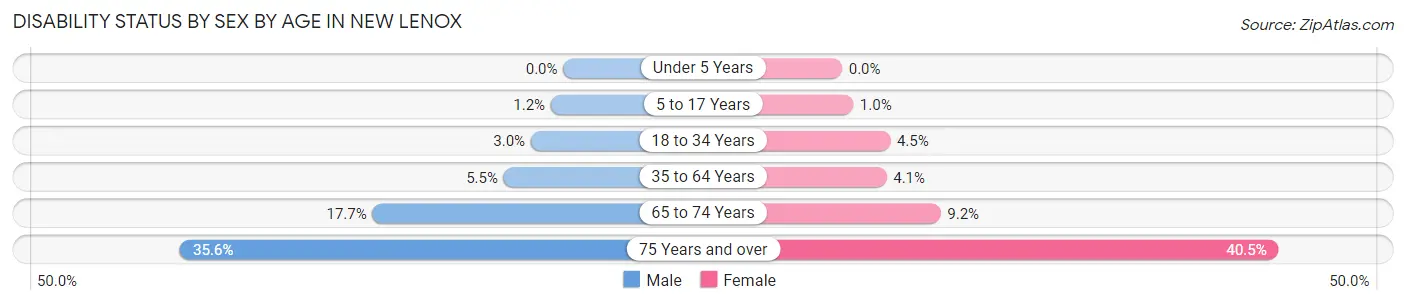
| Age Bracket | Male | Female |
| Under 5 Years | 0 (0.0%) | 0 (0.0%) |
| 5 to 17 Years | 33 (1.1%) | 26 (1.0%) |
| 18 to 34 Years | 72 (3.0%) | 105 (4.5%) |
| 35 to 64 Years | 336 (5.5%) | 228 (4.1%) |
| 65 to 74 Years | 167 (17.7%) | 87 (9.1%) |
| 75 Years and over | 159 (35.6%) | 293 (40.5%) |
Disability Class by Sex by Age in New Lenox
Disability Class: Hearing Difficulty
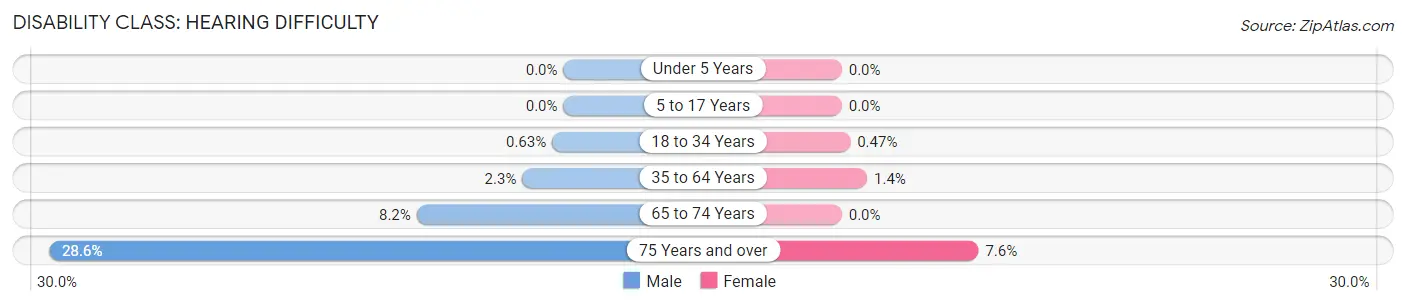
| Age Bracket | Male | Female |
| Under 5 Years | 0 (0.0%) | 0 (0.0%) |
| 5 to 17 Years | 0 (0.0%) | 0 (0.0%) |
| 18 to 34 Years | 15 (0.6%) | 11 (0.5%) |
| 35 to 64 Years | 139 (2.3%) | 78 (1.4%) |
| 65 to 74 Years | 77 (8.2%) | 0 (0.0%) |
| 75 Years and over | 128 (28.6%) | 55 (7.6%) |
Disability Class: Vision Difficulty
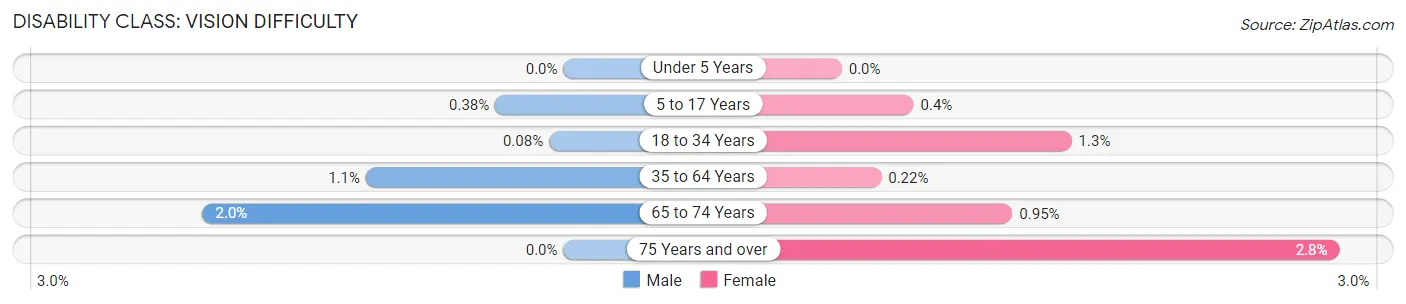
| Age Bracket | Male | Female |
| Under 5 Years | 0 (0.0%) | 0 (0.0%) |
| 5 to 17 Years | 11 (0.4%) | 10 (0.4%) |
| 18 to 34 Years | 2 (0.1%) | 30 (1.3%) |
| 35 to 64 Years | 67 (1.1%) | 12 (0.2%) |
| 65 to 74 Years | 19 (2.0%) | 9 (0.9%) |
| 75 Years and over | 0 (0.0%) | 20 (2.8%) |
Disability Class: Cognitive Difficulty
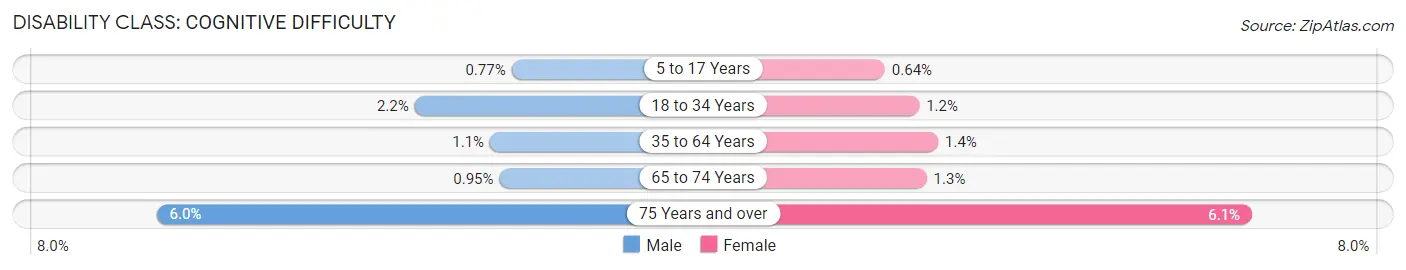
| Age Bracket | Male | Female |
| 5 to 17 Years | 22 (0.8%) | 16 (0.6%) |
| 18 to 34 Years | 53 (2.2%) | 27 (1.1%) |
| 35 to 64 Years | 66 (1.1%) | 79 (1.4%) |
| 65 to 74 Years | 9 (0.9%) | 12 (1.3%) |
| 75 Years and over | 27 (6.0%) | 44 (6.1%) |
Disability Class: Ambulatory Difficulty
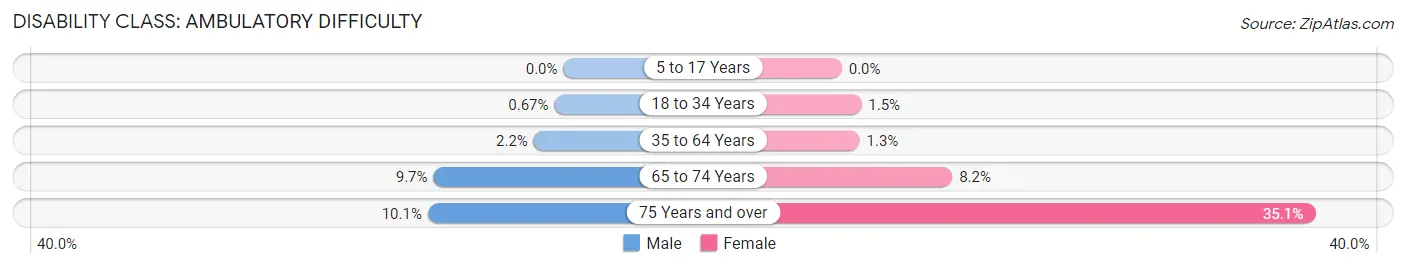
| Age Bracket | Male | Female |
| 5 to 17 Years | 0 (0.0%) | 0 (0.0%) |
| 18 to 34 Years | 16 (0.7%) | 34 (1.5%) |
| 35 to 64 Years | 134 (2.2%) | 73 (1.3%) |
| 65 to 74 Years | 91 (9.7%) | 78 (8.2%) |
| 75 Years and over | 45 (10.1%) | 254 (35.1%) |
Disability Class: Self-Care Difficulty
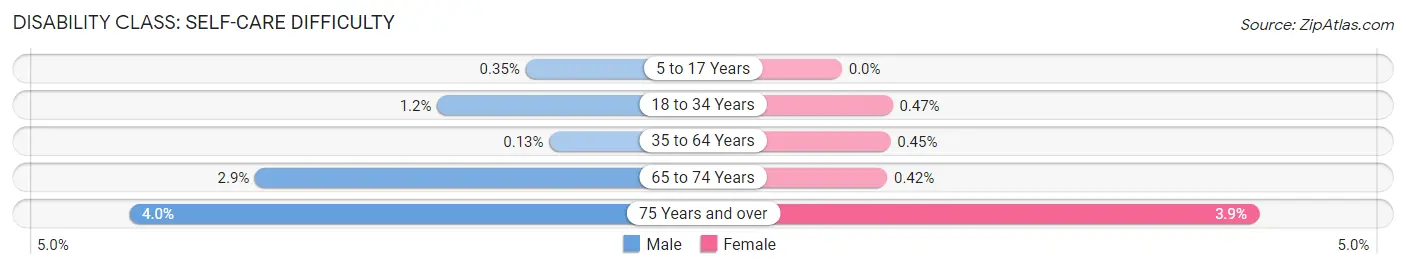
| Age Bracket | Male | Female |
| 5 to 17 Years | 10 (0.4%) | 0 (0.0%) |
| 18 to 34 Years | 28 (1.2%) | 11 (0.5%) |
| 35 to 64 Years | 8 (0.1%) | 25 (0.4%) |
| 65 to 74 Years | 27 (2.9%) | 4 (0.4%) |
| 75 Years and over | 18 (4.0%) | 28 (3.9%) |
Technology Access in New Lenox
Computing Device Access in New Lenox
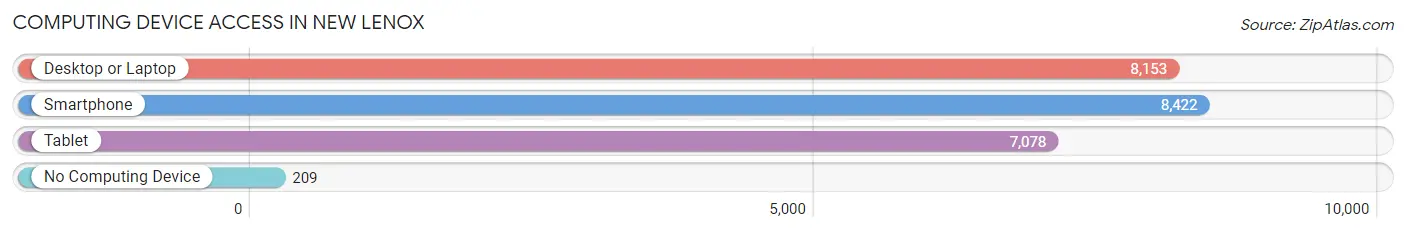
| Device Type | # Households | % Households |
| Desktop or Laptop | 8,153 | 90.5% |
| Smartphone | 8,422 | 93.5% |
| Tablet | 7,078 | 78.6% |
| No Computing Device | 209 | 2.3% |
| Total | 9,006 | 100.0% |
Internet Access in New Lenox
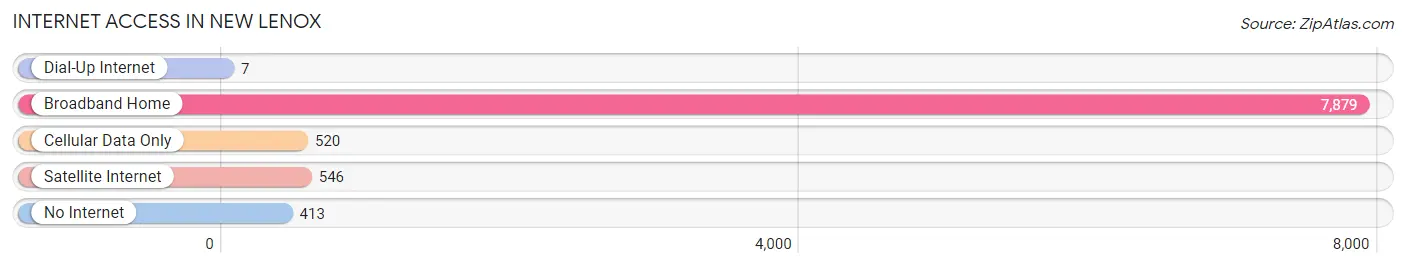
| Internet Type | # Households | % Households |
| Dial-Up Internet | 7 | 0.1% |
| Broadband Home | 7,879 | 87.5% |
| Cellular Data Only | 520 | 5.8% |
| Satellite Internet | 546 | 6.1% |
| No Internet | 413 | 4.6% |
| Total | 9,006 | 100.0% |
New Lenox Summary
Lenox, Illinois is a village located in Will County, Illinois, United States. The village is located approximately 40 miles southwest of Chicago and is part of the Chicago metropolitan area. As of the 2010 census, the village had a population of 24,394.
History
The area that is now Lenox was first settled in the 1830s by German immigrants. The village was originally known as Varna, but was renamed New Lenox in 1836. The name was chosen to honor the original Lenox, Massachusetts, which was the hometown of many of the settlers.
The village was officially incorporated in 1853. In the late 19th century, the village was a major center for the production of bricks. The brickyards were located along the Des Plaines River and provided employment for many of the village's residents.
Geography
Lenox is located in northeastern Will County at 41°31'25" North, 87°59'45" West (41.523750, -87.995890). It is bordered to the north by the village of Frankfort, to the east by the village of Mokena, to the south by the village of Manhattan, and to the west by the village of Joliet.
The village is located in the Des Plaines River Valley, with the Des Plaines River forming the western boundary of the village. The village is located approximately 40 miles southwest of downtown Chicago.
Economy
The economy of Lenox is largely based on manufacturing and retail. The village is home to several large manufacturing companies, including Caterpillar, Inc., which has a large manufacturing facility in the village. Other major employers in the village include the University of St. Francis, Silver Cross Hospital, and the Will County government.
The village is also home to several retail establishments, including the New Lenox Commons shopping center, which features a variety of stores and restaurants.
Demographics
As of the 2010 census, there were 24,394 people, 8,845 households, and 6,717 families residing in the village. The population density was 1,845.3 people per square mile (711.7/km2). There were 9,093 housing units at an average density of 690.3 per square mile (266.3/km2). The racial makeup of the village was 87.2% White, 4.2% African American, 0.3% Native American, 3.7% Asian, 2.7% from other races, and 1.9% from two or more races. Hispanic or Latino of any race were 8.7% of the population.
There were 8,845 households, out of which 39.2% had children under the age of 18 living with them, 61.2% were married couples living together, 9.7% had a female householder with no husband present, and 25.2% were non-families. 20.7% of all households were made up of individuals, and 6.2% had someone living alone who was 65 years of age or older. The average household size was 2.75 and the average family size was 3.21.
In the village, the population was spread out, with 28.7% under the age of 18, 7.7% from 18 to 24, 32.2% from 25 to 44, 22.2% from 45 to 64, and 9.2% who were 65 years of age or older. The median age was 34 years. For every 100 females, there were 95.3 males. For every 100 females age 18 and over, there were 91.7 males.
The median income for a household in the village was $76,845, and the median income for a family was $86,945. Males had a median income of $60,945 versus $41,945 for females. The per capita income for the village was $30,945. About 2.7% of families and 3.7% of the population were below the poverty line, including 4.2% of those under age 18 and 4.2% of those age 65 or over.
Common Questions
What is Per Capita Income in New Lenox?
Per Capita income in New Lenox is $47,780.
What is the Median Family Income in New Lenox?
Median Family Income in New Lenox is $144,297.
What is the Median Household income in New Lenox?
Median Household Income in New Lenox is $129,797.
What is Income or Wage Gap in New Lenox?
Income or Wage Gap in New Lenox is 43.3%.
Women in New Lenox earn 56.7 cents for every dollar earned by a man.
What is Family Income Deficit in New Lenox?
Family Income Deficit in New Lenox is $9,749.
Families that are below poverty line in New Lenox earn $9,749 less on average than the poverty threshold level.
What is Inequality or Gini Index in New Lenox?
Inequality or Gini Index in New Lenox is 0.32.
What is the Total Population of New Lenox?
Total Population of New Lenox is 27,242.
What is the Total Male Population of New Lenox?
Total Male Population of New Lenox is 14,079.
What is the Total Female Population of New Lenox?
Total Female Population of New Lenox is 13,163.
What is the Ratio of Males per 100 Females in New Lenox?
There are 106.96 Males per 100 Females in New Lenox.
What is the Ratio of Females per 100 Males in New Lenox?
There are 93.49 Females per 100 Males in New Lenox.
What is the Median Population Age in New Lenox?
Median Population Age in New Lenox is 37.0 Years.
What is the Average Family Size in New Lenox
Average Family Size in New Lenox is 3.4 People.
What is the Average Household Size in New Lenox
Average Household Size in New Lenox is 3.0 People.
How Large is the Labor Force in New Lenox?
There are 14,788 People in the Labor Forcein in New Lenox.
What is the Percentage of People in the Labor Force in New Lenox?
72.9% of People are in the Labor Force in New Lenox.
What is the Unemployment Rate in New Lenox?
Unemployment Rate in New Lenox is 2.8%.