Chino, CA Map & Demographics
Chino Map
Chino Overview
$34,162
PER CAPITA INCOME
$106,544
AVG FAMILY INCOME
$99,385
AVG HOUSEHOLD INCOME
30.3%
WAGE / INCOME GAP [ % ]
69.7¢/ $1
WAGE / INCOME GAP [ $ ]
$11,139
FAMILY INCOME DEFICIT
0.39
INEQUALITY / GINI INDEX
91,008
TOTAL POPULATION
46,346
MALE POPULATION
44,662
FEMALE POPULATION
103.77
MALES / 100 FEMALES
96.37
FEMALES / 100 MALES
36.9
MEDIAN AGE
3.6
AVG FAMILY SIZE
3.3
AVG HOUSEHOLD SIZE
45,406
LABOR FORCE [ PEOPLE ]
62.9%
PERCENT IN LABOR FORCE
5.5%
UNEMPLOYMENT RATE
Chino Area Codes
Income in Chino
Income Overview in Chino
Per Capita Income in Chino is $34,162, while median incomes of families and households are $106,544 and $99,385 respectively.
| Characteristic | Number | Measure |
| Per Capita Income | 91,008 | $34,162 |
| Median Family Income | 21,156 | $106,544 |
| Mean Family Income | 21,156 | $121,420 |
| Median Household Income | 26,391 | $99,385 |
| Mean Household Income | 26,391 | $114,401 |
| Income Deficit | 21,156 | $11,139 |
| Wage / Income Gap (%) | 91,008 | 30.27% |
| Wage / Income Gap ($) | 91,008 | 69.73¢ per $1 |
| Gini / Inequality Index | 91,008 | 0.39 |
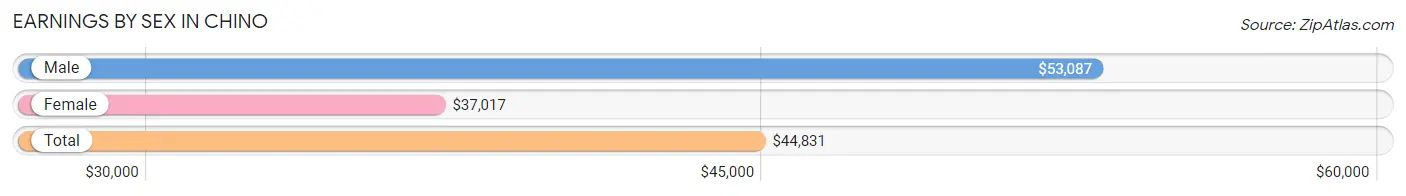
Earnings by Sex in Chino
Average Earnings in Chino are $44,831, $53,087 for men and $37,017 for women, a difference of 30.3%.
| Sex | Number | Average Earnings |
| Male | 24,632 (53.1%) | $53,087 |
| Female | 21,785 (46.9%) | $37,017 |
| Total | 46,417 (100.0%) | $44,831 |
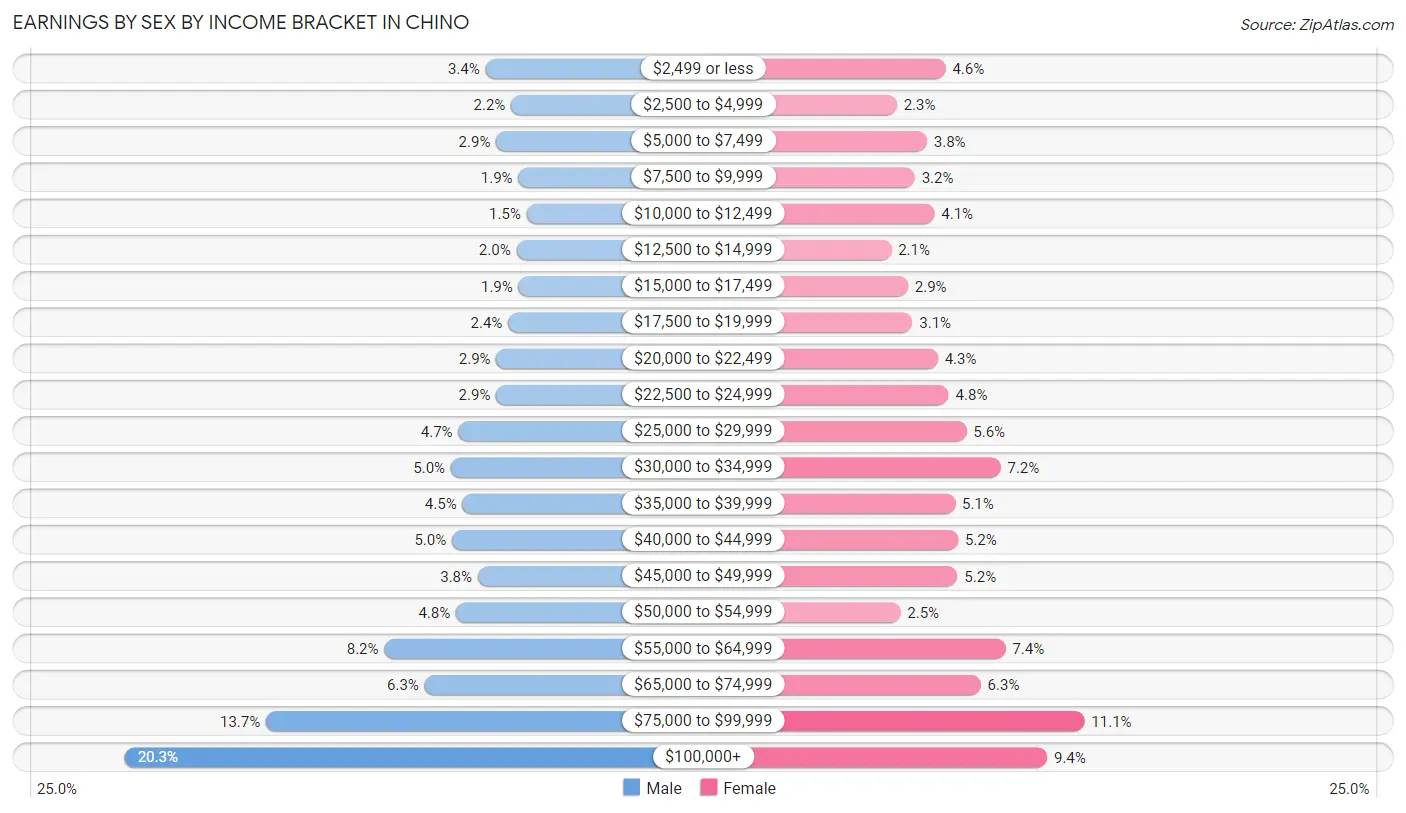
Earnings by Sex by Income Bracket in Chino
The most common earnings brackets in Chino are $100,000+ for men (5,002 | 20.3%) and $75,000 to $99,999 for women (2,424 | 11.1%).
| Income | Male | Female |
| $2,499 or less | 839 (3.4%) | 1,006 (4.6%) |
| $2,500 to $4,999 | 545 (2.2%) | 510 (2.3%) |
| $5,000 to $7,499 | 717 (2.9%) | 816 (3.7%) |
| $7,500 to $9,999 | 460 (1.9%) | 692 (3.2%) |
| $10,000 to $12,499 | 365 (1.5%) | 894 (4.1%) |
| $12,500 to $14,999 | 484 (2.0%) | 453 (2.1%) |
| $15,000 to $17,499 | 457 (1.9%) | 623 (2.9%) |
| $17,500 to $19,999 | 580 (2.4%) | 668 (3.1%) |
| $20,000 to $22,499 | 715 (2.9%) | 929 (4.3%) |
| $22,500 to $24,999 | 718 (2.9%) | 1,040 (4.8%) |
| $25,000 to $29,999 | 1,152 (4.7%) | 1,219 (5.6%) |
| $30,000 to $34,999 | 1,238 (5.0%) | 1,568 (7.2%) |
| $35,000 to $39,999 | 1,105 (4.5%) | 1,105 (5.1%) |
| $40,000 to $44,999 | 1,226 (5.0%) | 1,135 (5.2%) |
| $45,000 to $49,999 | 929 (3.8%) | 1,129 (5.2%) |
| $50,000 to $54,999 | 1,180 (4.8%) | 546 (2.5%) |
| $55,000 to $64,999 | 2,007 (8.2%) | 1,618 (7.4%) |
| $65,000 to $74,999 | 1,541 (6.3%) | 1,366 (6.3%) |
| $75,000 to $99,999 | 3,372 (13.7%) | 2,424 (11.1%) |
| $100,000+ | 5,002 (20.3%) | 2,044 (9.4%) |
| Total | 24,632 (100.0%) | 21,785 (100.0%) |
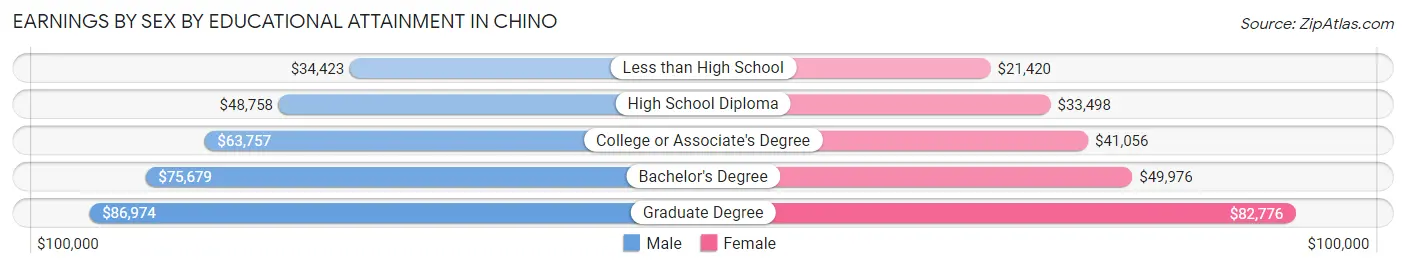
Earnings by Sex by Educational Attainment in Chino
Average earnings in Chino are $59,099 for men and $41,617 for women, a difference of 29.6%. Men with an educational attainment of graduate degree enjoy the highest average annual earnings of $86,974, while those with less than high school education earn the least with $34,423. Women with an educational attainment of graduate degree earn the most with the average annual earnings of $82,776, while those with less than high school education have the smallest earnings of $21,420.
| Educational Attainment | Male Income | Female Income |
| Less than High School | $34,423 | $21,420 |
| High School Diploma | $48,758 | $33,498 |
| College or Associate's Degree | $63,757 | $41,056 |
| Bachelor's Degree | $75,679 | $49,976 |
| Graduate Degree | $86,974 | $82,776 |
| Total | $59,099 | $41,617 |
Family Income in Chino
Family Income Brackets in Chino
According to the Chino family income data, there are 5,162 families falling into the $100,000 to $149,999 income range, which is the most common income bracket and makes up 24.4% of all families. Conversely, the $10,000 to $14,999 income bracket is the least frequent group with only 212 families (1.0%) belonging to this category.
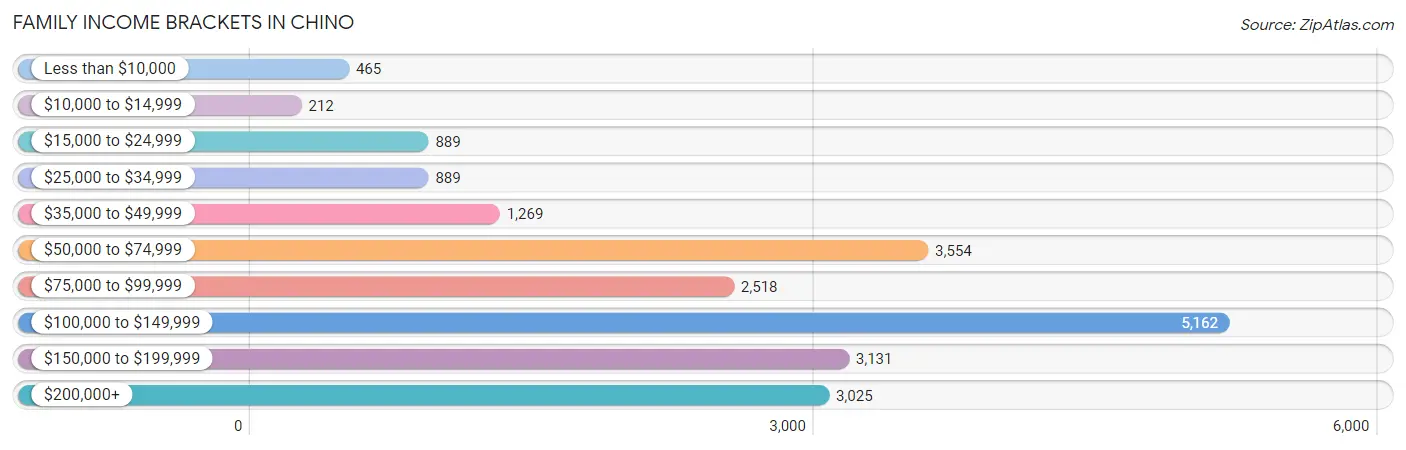
| Income Bracket | # Families | % Families |
| Less than $10,000 | 465 | 2.2% |
| $10,000 to $14,999 | 212 | 1.0% |
| $15,000 to $24,999 | 889 | 4.2% |
| $25,000 to $34,999 | 889 | 4.2% |
| $35,000 to $49,999 | 1,269 | 6.0% |
| $50,000 to $74,999 | 3,554 | 16.8% |
| $75,000 to $99,999 | 2,518 | 11.9% |
| $100,000 to $149,999 | 5,162 | 24.4% |
| $150,000 to $199,999 | 3,131 | 14.8% |
| $200,000+ | 3,025 | 14.3% |
Family Income by Famaliy Size in Chino
7+ person families (624 | 2.9%) account for the highest median family income in Chino with $117,857 per family, while 3-person families (5,699 | 26.9%) have the highest median income of $39,113 per family member.
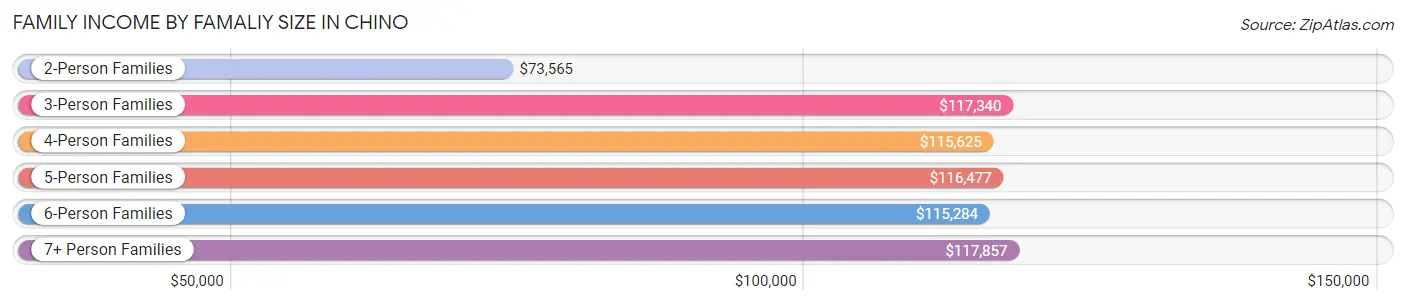
| Income Bracket | # Families | Median Income |
| 2-Person Families | 6,684 (31.6%) | $73,565 |
| 3-Person Families | 5,699 (26.9%) | $117,340 |
| 4-Person Families | 4,447 (21.0%) | $115,625 |
| 5-Person Families | 2,488 (11.8%) | $116,477 |
| 6-Person Families | 1,214 (5.7%) | $115,284 |
| 7+ Person Families | 624 (2.9%) | $117,857 |
| Total | 21,156 (100.0%) | $106,544 |
Family Income by Number of Earners in Chino
The median family income in Chino is $106,544, with families comprising 3+ earners (4,352) having the highest median family income of $155,800, while families with no earners (1,785) have the lowest median family income of $35,411, accounting for 20.6% and 8.4% of families, respectively.
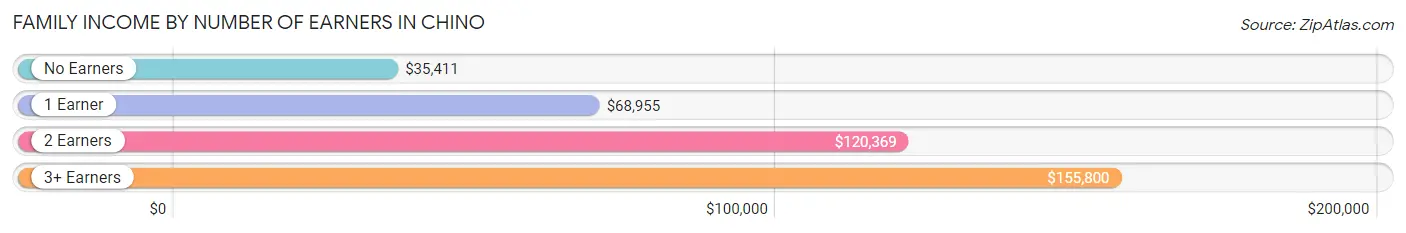
| Number of Earners | # Families | Median Income |
| No Earners | 1,785 (8.4%) | $35,411 |
| 1 Earner | 6,459 (30.5%) | $68,955 |
| 2 Earners | 8,560 (40.5%) | $120,369 |
| 3+ Earners | 4,352 (20.6%) | $155,800 |
| Total | 21,156 (100.0%) | $106,544 |
Household Income in Chino
Household Income Brackets in Chino
With 5,806 households falling in the category, the $100,000 to $149,999 income range is the most frequent in Chino, accounting for 22.0% of all households. In contrast, only 369 households (1.4%) fall into the $10,000 to $14,999 income bracket, making it the least populous group.
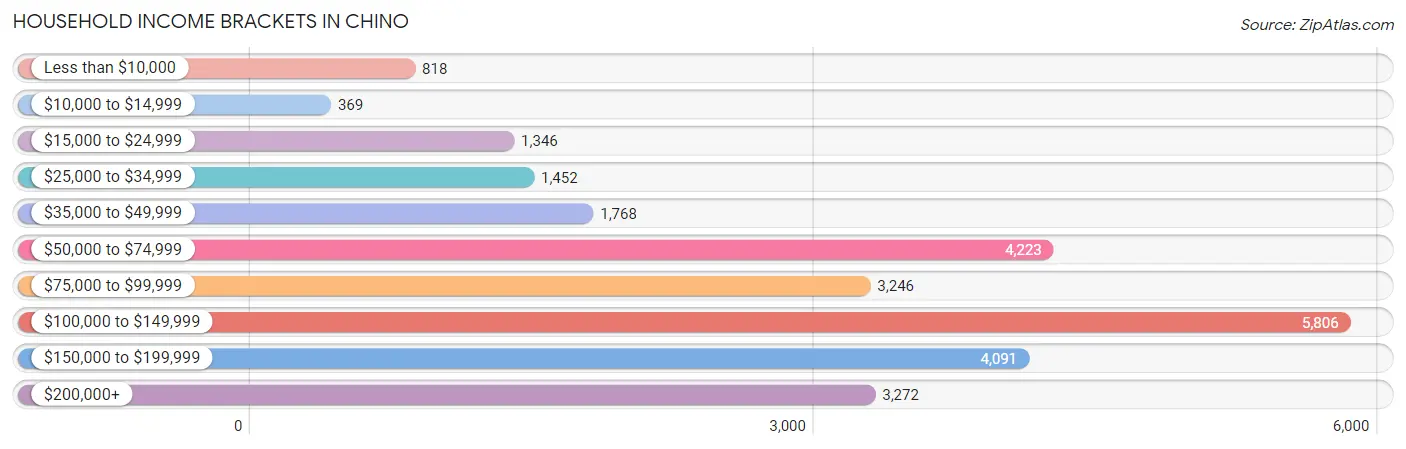
| Income Bracket | # Households | % Households |
| Less than $10,000 | 818 | 3.1% |
| $10,000 to $14,999 | 369 | 1.4% |
| $15,000 to $24,999 | 1,346 | 5.1% |
| $25,000 to $34,999 | 1,452 | 5.5% |
| $35,000 to $49,999 | 1,768 | 6.7% |
| $50,000 to $74,999 | 4,223 | 16.0% |
| $75,000 to $99,999 | 3,246 | 12.3% |
| $100,000 to $149,999 | 5,806 | 22.0% |
| $150,000 to $199,999 | 4,091 | 15.5% |
| $200,000+ | 3,272 | 12.4% |
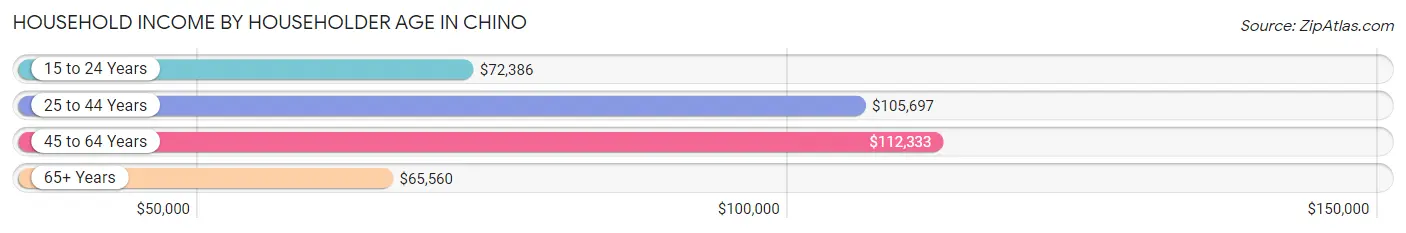
Household Income by Householder Age in Chino
The median household income in Chino is $99,385, with the highest median household income of $112,333 found in the 45 to 64 years age bracket for the primary householder. A total of 11,164 households (42.3%) fall into this category. Meanwhile, the 65+ years age bracket for the primary householder has the lowest median household income of $65,560, with 5,219 households (19.8%) in this group.
| Income Bracket | # Households | Median Income |
| 15 to 24 Years | 241 (0.9%) | $72,386 |
| 25 to 44 Years | 9,767 (37.0%) | $105,697 |
| 45 to 64 Years | 11,164 (42.3%) | $112,333 |
| 65+ Years | 5,219 (19.8%) | $65,560 |
| Total | 26,391 (100.0%) | $99,385 |
Poverty in Chino
Income Below Poverty by Sex and Age in Chino
With 7.8% poverty level for males and 8.7% for females among the residents of Chino, 5 year old males and 18 to 24 year old females are the most vulnerable to poverty, with 65 males (17.3%) and 554 females (16.4%) in their respective age groups living below the poverty level.
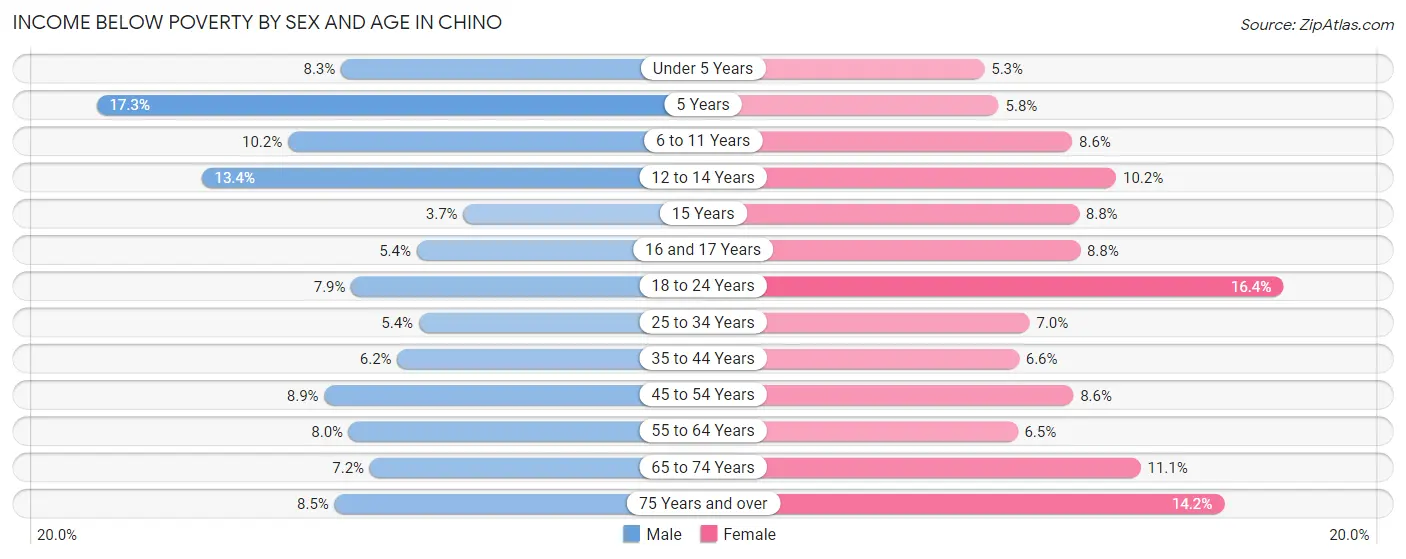
| Age Bracket | Male | Female |
| Under 5 Years | 275 (8.3%) | 132 (5.3%) |
| 5 Years | 65 (17.3%) | 21 (5.8%) |
| 6 to 11 Years | 333 (10.2%) | 360 (8.6%) |
| 12 to 14 Years | 274 (13.4%) | 146 (10.2%) |
| 15 Years | 28 (3.7%) | 41 (8.8%) |
| 16 and 17 Years | 59 (5.4%) | 104 (8.8%) |
| 18 to 24 Years | 281 (7.9%) | 554 (16.4%) |
| 25 to 34 Years | 335 (5.4%) | 470 (7.0%) |
| 35 to 44 Years | 409 (6.2%) | 431 (6.6%) |
| 45 to 54 Years | 483 (8.9%) | 503 (8.6%) |
| 55 to 64 Years | 417 (8.0%) | 340 (6.5%) |
| 65 to 74 Years | 231 (7.2%) | 404 (11.1%) |
| 75 Years and over | 140 (8.5%) | 285 (14.2%) |
| Total | 3,330 (7.8%) | 3,791 (8.7%) |
Income Above Poverty by Sex and Age in Chino
According to the poverty statistics in Chino, males aged 15 years and females aged under 5 years are the age groups that are most secure financially, with 96.3% of males and 94.7% of females in these age groups living above the poverty line.
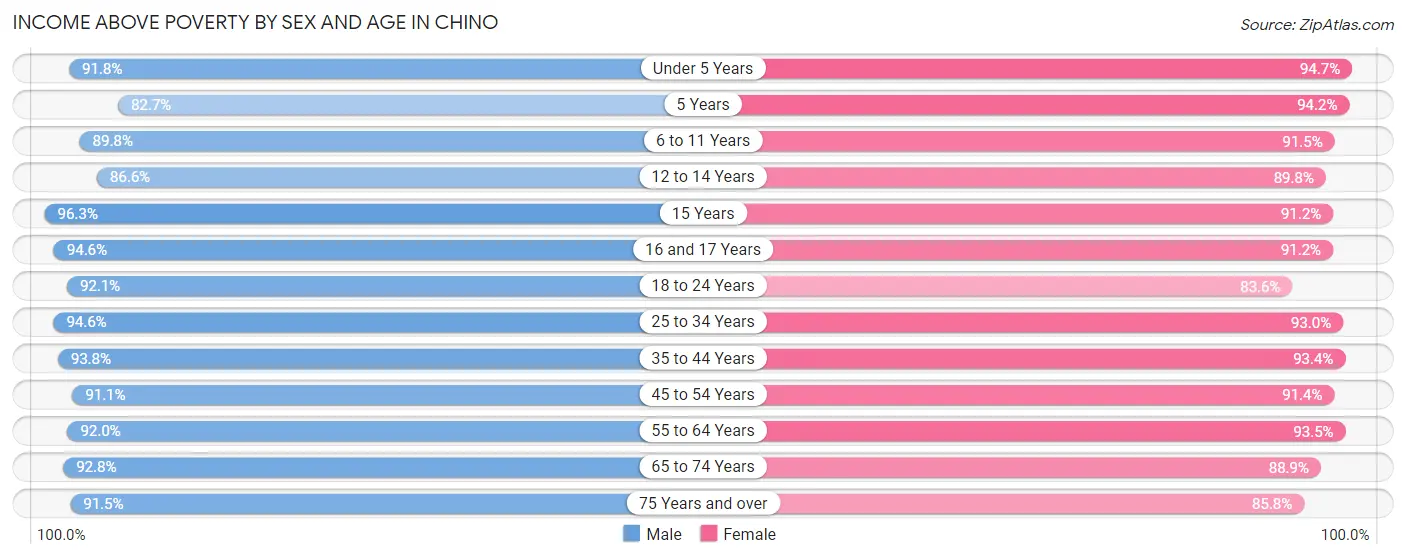
| Age Bracket | Male | Female |
| Under 5 Years | 3,060 (91.7%) | 2,365 (94.7%) |
| 5 Years | 310 (82.7%) | 340 (94.2%) |
| 6 to 11 Years | 2,924 (89.8%) | 3,851 (91.4%) |
| 12 to 14 Years | 1,766 (86.6%) | 1,288 (89.8%) |
| 15 Years | 727 (96.3%) | 425 (91.2%) |
| 16 and 17 Years | 1,026 (94.6%) | 1,073 (91.2%) |
| 18 to 24 Years | 3,290 (92.1%) | 2,829 (83.6%) |
| 25 to 34 Years | 5,913 (94.6%) | 6,276 (93.0%) |
| 35 to 44 Years | 6,233 (93.8%) | 6,126 (93.4%) |
| 45 to 54 Years | 4,962 (91.1%) | 5,351 (91.4%) |
| 55 to 64 Years | 4,819 (92.0%) | 4,876 (93.5%) |
| 65 to 74 Years | 2,986 (92.8%) | 3,239 (88.9%) |
| 75 Years and over | 1,509 (91.5%) | 1,724 (85.8%) |
| Total | 39,525 (92.2%) | 39,763 (91.3%) |
Income Below Poverty Among Married-Couple Families in Chino
The poverty statistics for married-couple families in Chino show that 5.2% or 827 of the total 15,759 families live below the poverty line. Families with 5 or more children have the highest poverty rate of 25.0%, comprising of 4 families. On the other hand, families with no children have the lowest poverty rate of 5.0%, which includes 403 families.
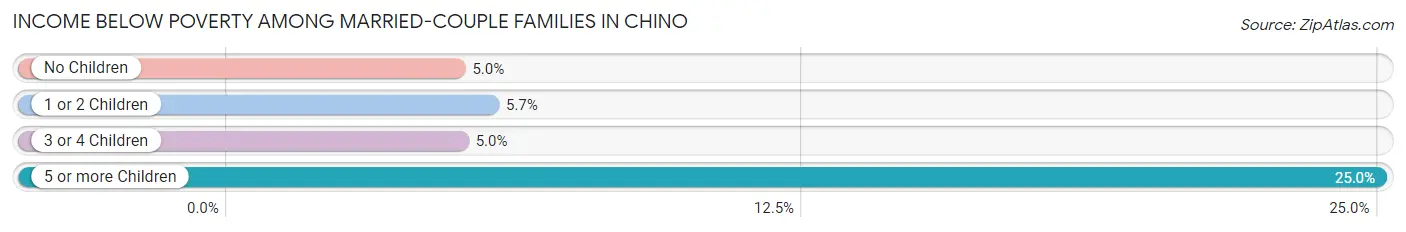
| Children | Above Poverty | Below Poverty |
| No Children | 7,739 (95.1%) | 403 (5.0%) |
| 1 or 2 Children | 5,517 (94.3%) | 332 (5.7%) |
| 3 or 4 Children | 1,664 (95.0%) | 88 (5.0%) |
| 5 or more Children | 12 (75.0%) | 4 (25.0%) |
| Total | 14,932 (94.8%) | 827 (5.2%) |
Income Below Poverty Among Single-Parent Households in Chino
According to the poverty data in Chino, 4.6% or 87 single-father households and 14.2% or 498 single-mother households are living below the poverty line. Among single-father households, those with no children have the highest poverty rate, with 78 households (9.0%) experiencing poverty. Likewise, among single-mother households, those with 3 or 4 children have the highest poverty rate, with 118 households (39.1%) falling below the poverty line.
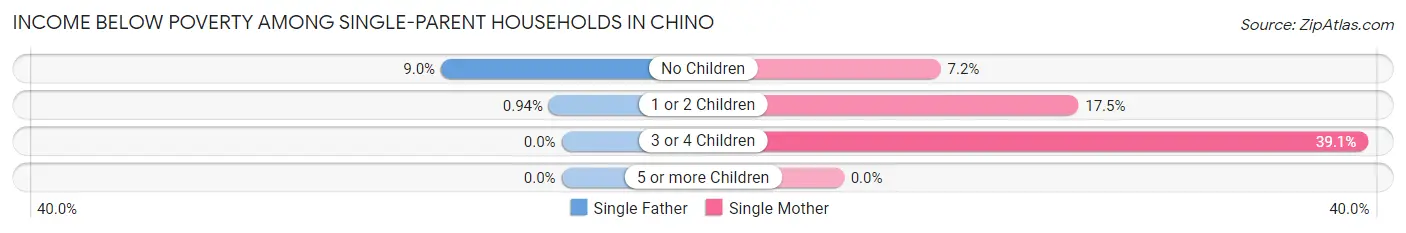
| Children | Single Father | Single Mother |
| No Children | 78 (9.0%) | 126 (7.2%) |
| 1 or 2 Children | 9 (0.9%) | 254 (17.5%) |
| 3 or 4 Children | 0 (0.0%) | 118 (39.1%) |
| 5 or more Children | 0 (0.0%) | 0 (0.0%) |
| Total | 87 (4.6%) | 498 (14.2%) |
Income Below Poverty Among Married-Couple vs Single-Parent Households in Chino
The poverty data for Chino shows that 827 of the married-couple family households (5.2%) and 585 of the single-parent households (10.8%) are living below the poverty level. Within the married-couple family households, those with 5 or more children have the highest poverty rate, with 4 households (25.0%) falling below the poverty line. Among the single-parent households, those with 3 or 4 children have the highest poverty rate, with 118 household (33.3%) living below poverty.
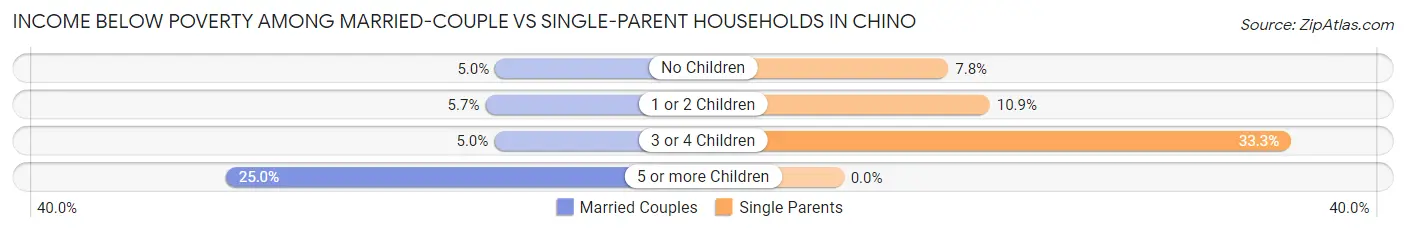
| Children | Married-Couple Families | Single-Parent Households |
| No Children | 403 (5.0%) | 204 (7.8%) |
| 1 or 2 Children | 332 (5.7%) | 263 (10.9%) |
| 3 or 4 Children | 88 (5.0%) | 118 (33.3%) |
| 5 or more Children | 4 (25.0%) | 0 (0.0%) |
| Total | 827 (5.2%) | 585 (10.8%) |
Race in Chino
The most populous races in Chino are Hispanic or Latino (49,126 | 54.0%), White / Caucasian (33,716 | 37.0%), and Some other Race (17,718 | 19.5%).
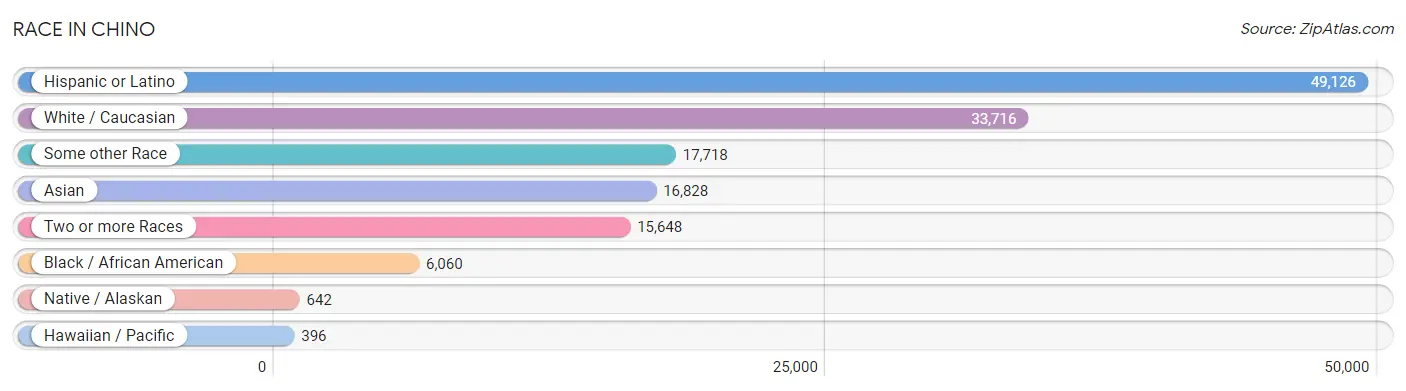
| Race | # Population | % Population |
| Asian | 16,828 | 18.5% |
| Black / African American | 6,060 | 6.7% |
| Hawaiian / Pacific | 396 | 0.4% |
| Hispanic or Latino | 49,126 | 54.0% |
| Native / Alaskan | 642 | 0.7% |
| White / Caucasian | 33,716 | 37.0% |
| Two or more Races | 15,648 | 17.2% |
| Some other Race | 17,718 | 19.5% |
| Total | 91,008 | 100.0% |
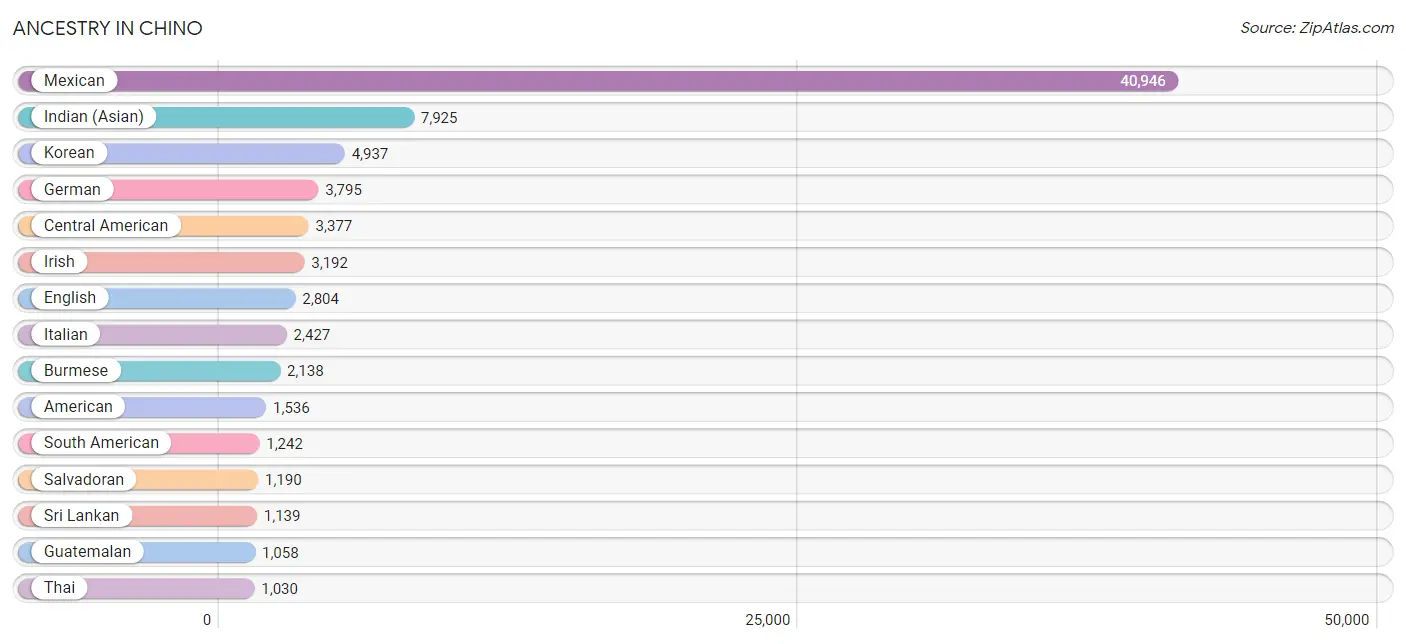
Ancestry in Chino
The most populous ancestries reported in Chino are Mexican (40,946 | 45.0%), Indian (Asian) (7,925 | 8.7%), Korean (4,937 | 5.4%), German (3,795 | 4.2%), and Central American (3,377 | 3.7%), together accounting for 67.0% of all Chino residents.
| Ancestry | # Population | % Population |
| African | 275 | 0.3% |
| American | 1,536 | 1.7% |
| Apache | 147 | 0.2% |
| Arab | 515 | 0.6% |
| Argentinean | 510 | 0.6% |
| Armenian | 49 | 0.1% |
| Australian | 4 | 0.0% |
| Austrian | 24 | 0.0% |
| Basque | 73 | 0.1% |
| Bhutanese | 835 | 0.9% |
| Blackfeet | 41 | 0.1% |
| Bolivian | 53 | 0.1% |
| British | 114 | 0.1% |
| Bulgarian | 9 | 0.0% |
| Burmese | 2,138 | 2.4% |
| Cajun | 29 | 0.0% |
| Canadian | 126 | 0.1% |
| Central American | 3,377 | 3.7% |
| Central American Indian | 259 | 0.3% |
| Cherokee | 257 | 0.3% |
| Chickasaw | 17 | 0.0% |
| Chilean | 40 | 0.0% |
| Chippewa | 37 | 0.0% |
| Choctaw | 71 | 0.1% |
| Colombian | 248 | 0.3% |
| Comanche | 9 | 0.0% |
| Costa Rican | 50 | 0.1% |
| Creek | 28 | 0.0% |
| Croatian | 201 | 0.2% |
| Cuban | 595 | 0.6% |
| Czech | 62 | 0.1% |
| Czechoslovakian | 31 | 0.0% |
| Danish | 184 | 0.2% |
| Dutch | 796 | 0.9% |
| Eastern European | 93 | 0.1% |
| Ecuadorian | 116 | 0.1% |
| Egyptian | 96 | 0.1% |
| English | 2,804 | 3.1% |
| Ethiopian | 40 | 0.0% |
| European | 960 | 1.1% |
| Fijian | 2 | 0.0% |
| Filipino | 563 | 0.6% |
| Finnish | 112 | 0.1% |
| French | 915 | 1.0% |
| French Canadian | 120 | 0.1% |
| German | 3,795 | 4.2% |
| German Russian | 8 | 0.0% |
| Ghanaian | 7 | 0.0% |
| Greek | 191 | 0.2% |
| Guamanian / Chamorro | 12 | 0.0% |
| Guatemalan | 1,058 | 1.2% |
| Guyanese | 23 | 0.0% |
| Honduran | 44 | 0.1% |
| Hopi | 23 | 0.0% |
| Hungarian | 113 | 0.1% |
| Indian (Asian) | 7,925 | 8.7% |
| Indonesian | 66 | 0.1% |
| Iranian | 65 | 0.1% |
| Irish | 3,192 | 3.5% |
| Israeli | 11 | 0.0% |
| Italian | 2,427 | 2.7% |
| Jamaican | 60 | 0.1% |
| Japanese | 235 | 0.3% |
| Korean | 4,937 | 5.4% |
| Laotian | 615 | 0.7% |
| Lebanese | 89 | 0.1% |
| Malaysian | 81 | 0.1% |
| Mexican | 40,946 | 45.0% |
| Mexican American Indian | 571 | 0.6% |
| Moroccan | 11 | 0.0% |
| Native Hawaiian | 50 | 0.1% |
| Navajo | 18 | 0.0% |
| Nicaraguan | 986 | 1.1% |
| Nigerian | 220 | 0.2% |
| Northern European | 29 | 0.0% |
| Norwegian | 184 | 0.2% |
| Pakistani | 260 | 0.3% |
| Palestinian | 51 | 0.1% |
| Panamanian | 17 | 0.0% |
| Pennsylvania German | 14 | 0.0% |
| Peruvian | 234 | 0.3% |
| Polish | 466 | 0.5% |
| Portuguese | 563 | 0.6% |
| Pueblo | 32 | 0.0% |
| Puerto Rican | 929 | 1.0% |
| Romanian | 89 | 0.1% |
| Russian | 199 | 0.2% |
| Salvadoran | 1,190 | 1.3% |
| Samoan | 318 | 0.4% |
| Scandinavian | 169 | 0.2% |
| Scotch-Irish | 189 | 0.2% |
| Scottish | 436 | 0.5% |
| Seminole | 2 | 0.0% |
| Serbian | 7 | 0.0% |
| Sierra Leonean | 27 | 0.0% |
| Sioux | 95 | 0.1% |
| Slovak | 37 | 0.0% |
| Slovene | 12 | 0.0% |
| South American | 1,242 | 1.4% |
| Spaniard | 635 | 0.7% |
| Spanish | 267 | 0.3% |
| Sri Lankan | 1,139 | 1.3% |
| Subsaharan African | 578 | 0.6% |
| Swedish | 561 | 0.6% |
| Swiss | 41 | 0.1% |
| Syrian | 223 | 0.3% |
| Thai | 1,030 | 1.1% |
| Tongan | 20 | 0.0% |
| Trinidadian and Tobagonian | 49 | 0.1% |
| Ukrainian | 12 | 0.0% |
| Uruguayan | 29 | 0.0% |
| Venezuelan | 12 | 0.0% |
| Vietnamese | 44 | 0.1% |
| Welsh | 232 | 0.3% |
| West Indian | 1 | 0.0% |
| Yaqui | 103 | 0.1% |
| Yugoslavian | 23 | 0.0% |
| Yuman | 6 | 0.0% | View All 118 Rows |
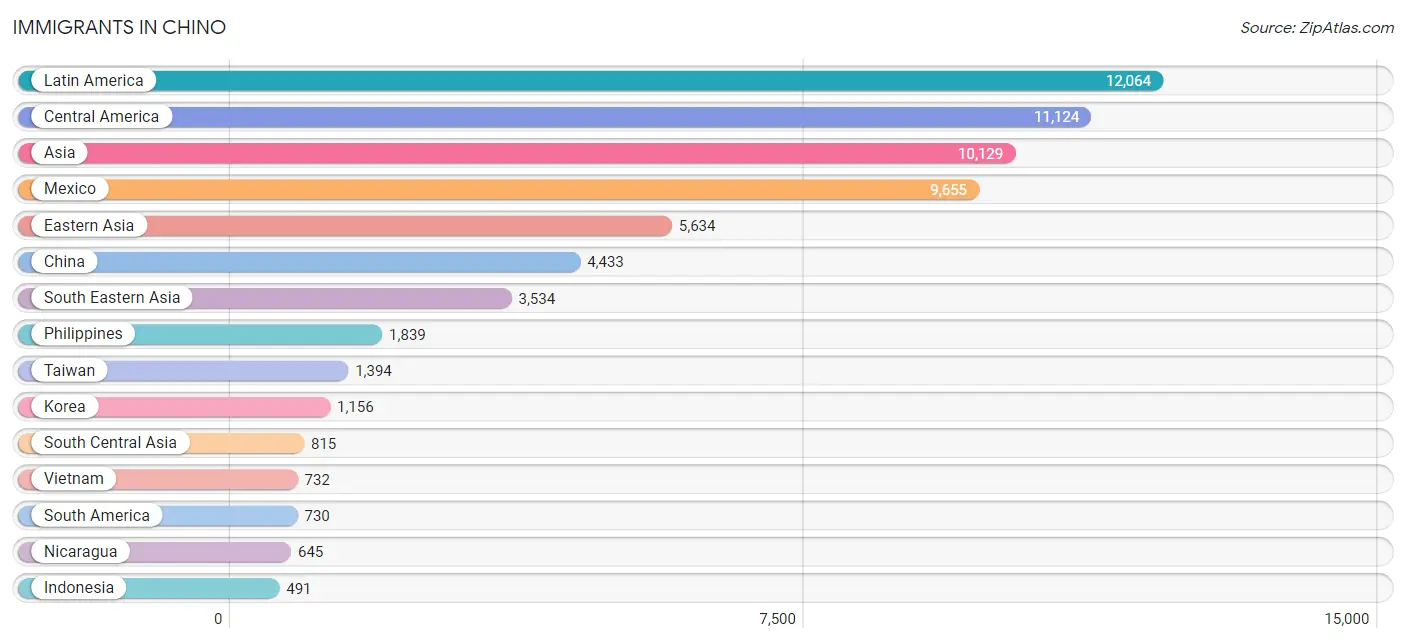
Immigrants in Chino
The most numerous immigrant groups reported in Chino came from Latin America (12,064 | 13.3%), Central America (11,124 | 12.2%), Asia (10,129 | 11.1%), Mexico (9,655 | 10.6%), and Eastern Asia (5,634 | 6.2%), together accounting for 53.4% of all Chino residents.
| Immigration Origin | # Population | % Population |
| Africa | 183 | 0.2% |
| Argentina | 218 | 0.2% |
| Asia | 10,129 | 11.1% |
| Austria | 4 | 0.0% |
| Azores | 48 | 0.1% |
| Bolivia | 38 | 0.0% |
| Brazil | 13 | 0.0% |
| Bulgaria | 10 | 0.0% |
| Cambodia | 87 | 0.1% |
| Canada | 108 | 0.1% |
| Caribbean | 210 | 0.2% |
| Central America | 11,124 | 12.2% |
| China | 4,433 | 4.9% |
| Colombia | 142 | 0.2% |
| Cuba | 192 | 0.2% |
| Eastern Africa | 82 | 0.1% |
| Eastern Asia | 5,634 | 6.2% |
| Eastern Europe | 174 | 0.2% |
| Ecuador | 60 | 0.1% |
| Egypt | 19 | 0.0% |
| El Salvador | 468 | 0.5% |
| England | 10 | 0.0% |
| Ethiopia | 40 | 0.0% |
| Europe | 450 | 0.5% |
| Fiji | 78 | 0.1% |
| France | 16 | 0.0% |
| Germany | 8 | 0.0% |
| Ghana | 24 | 0.0% |
| Guatemala | 346 | 0.4% |
| Honduras | 10 | 0.0% |
| Hong Kong | 406 | 0.4% |
| Hungary | 2 | 0.0% |
| India | 442 | 0.5% |
| Indonesia | 491 | 0.5% |
| Iran | 64 | 0.1% |
| Israel | 16 | 0.0% |
| Italy | 21 | 0.0% |
| Japan | 45 | 0.1% |
| Jordan | 8 | 0.0% |
| Kenya | 28 | 0.0% |
| Korea | 1,156 | 1.3% |
| Kuwait | 13 | 0.0% |
| Laos | 30 | 0.0% |
| Latin America | 12,064 | 13.3% |
| Lebanon | 78 | 0.1% |
| Malaysia | 202 | 0.2% |
| Mexico | 9,655 | 10.6% |
| Middle Africa | 9 | 0.0% |
| Netherlands | 26 | 0.0% |
| Nicaragua | 645 | 0.7% |
| Nigeria | 37 | 0.0% |
| Northern Africa | 19 | 0.0% |
| Northern Europe | 24 | 0.0% |
| Oceania | 215 | 0.2% |
| Pakistan | 261 | 0.3% |
| Peru | 249 | 0.3% |
| Philippines | 1,839 | 2.0% |
| Portugal | 166 | 0.2% |
| Romania | 162 | 0.2% |
| Saudi Arabia | 21 | 0.0% |
| Sierra Leone | 12 | 0.0% |
| Singapore | 44 | 0.1% |
| Somalia | 4 | 0.0% |
| South America | 730 | 0.8% |
| South Central Asia | 815 | 0.9% |
| South Eastern Asia | 3,534 | 3.9% |
| Southern Europe | 198 | 0.2% |
| Spain | 11 | 0.0% |
| Sri Lanka | 48 | 0.1% |
| Syria | 10 | 0.0% |
| Taiwan | 1,394 | 1.5% |
| Thailand | 60 | 0.1% |
| Trinidad and Tobago | 18 | 0.0% |
| Venezuela | 10 | 0.0% |
| Vietnam | 732 | 0.8% |
| Western Africa | 73 | 0.1% |
| Western Asia | 146 | 0.2% |
| Western Europe | 54 | 0.1% | View All 78 Rows |
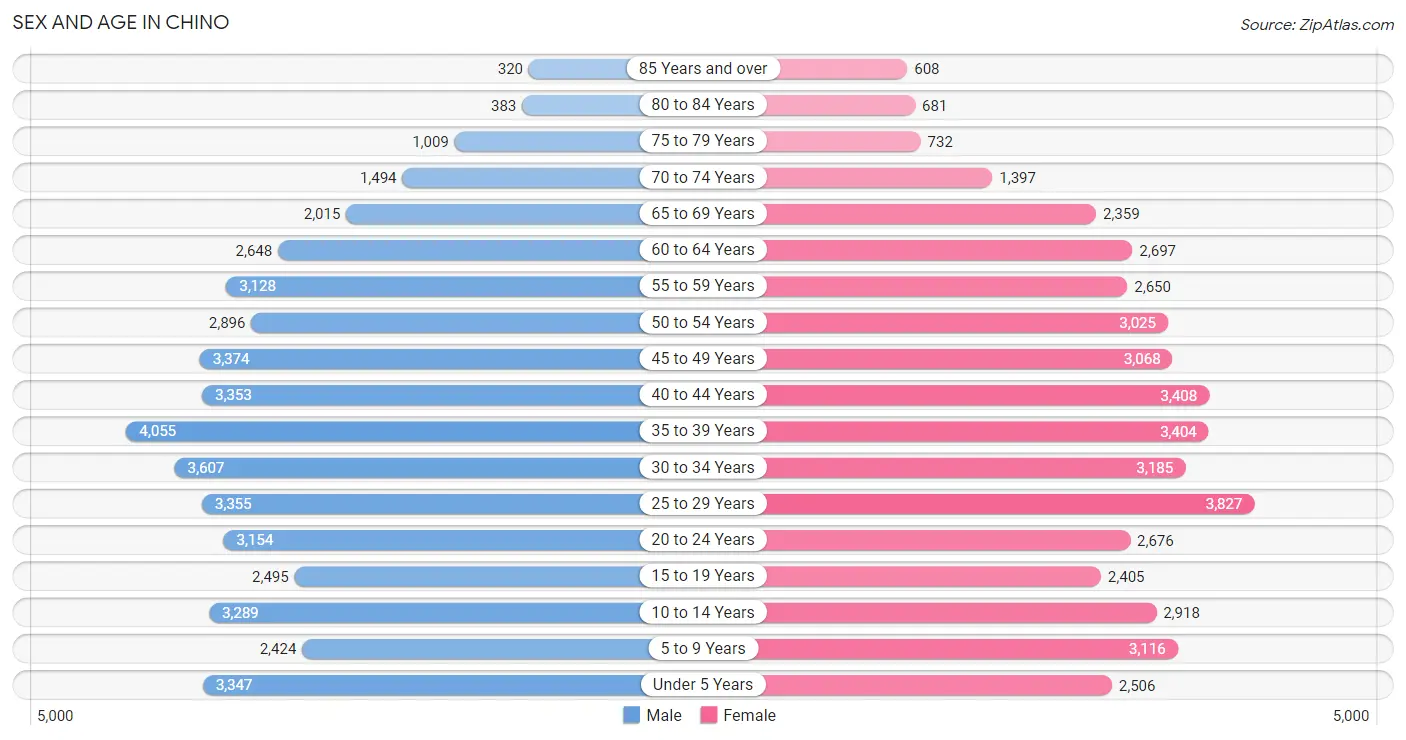
Sex and Age in Chino
Sex and Age in Chino
The most populous age groups in Chino are 35 to 39 Years (4,055 | 8.7%) for men and 25 to 29 Years (3,827 | 8.6%) for women.
| Age Bracket | Male | Female |
| Under 5 Years | 3,347 (7.2%) | 2,506 (5.6%) |
| 5 to 9 Years | 2,424 (5.2%) | 3,116 (7.0%) |
| 10 to 14 Years | 3,289 (7.1%) | 2,918 (6.5%) |
| 15 to 19 Years | 2,495 (5.4%) | 2,405 (5.4%) |
| 20 to 24 Years | 3,154 (6.8%) | 2,676 (6.0%) |
| 25 to 29 Years | 3,355 (7.2%) | 3,827 (8.6%) |
| 30 to 34 Years | 3,607 (7.8%) | 3,185 (7.1%) |
| 35 to 39 Years | 4,055 (8.7%) | 3,404 (7.6%) |
| 40 to 44 Years | 3,353 (7.2%) | 3,408 (7.6%) |
| 45 to 49 Years | 3,374 (7.3%) | 3,068 (6.9%) |
| 50 to 54 Years | 2,896 (6.2%) | 3,025 (6.8%) |
| 55 to 59 Years | 3,128 (6.8%) | 2,650 (5.9%) |
| 60 to 64 Years | 2,648 (5.7%) | 2,697 (6.0%) |
| 65 to 69 Years | 2,015 (4.3%) | 2,359 (5.3%) |
| 70 to 74 Years | 1,494 (3.2%) | 1,397 (3.1%) |
| 75 to 79 Years | 1,009 (2.2%) | 732 (1.6%) |
| 80 to 84 Years | 383 (0.8%) | 681 (1.5%) |
| 85 Years and over | 320 (0.7%) | 608 (1.4%) |
| Total | 46,346 (100.0%) | 44,662 (100.0%) |
Families and Households in Chino
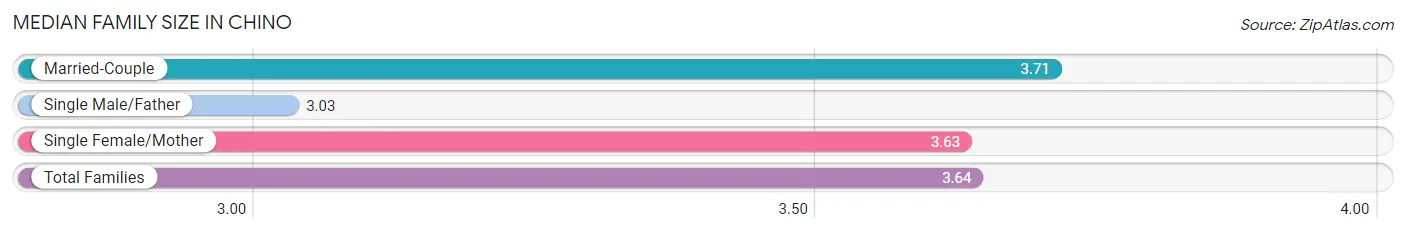
Median Family Size in Chino
The median family size in Chino is 3.64 persons per family, with married-couple families (15,759 | 74.5%) accounting for the largest median family size of 3.71 persons per family. On the other hand, single male/father families (1,883 | 8.9%) represent the smallest median family size with 3.03 persons per family.
| Family Type | # Families | Family Size |
| Married-Couple | 15,759 (74.5%) | 3.71 |
| Single Male/Father | 1,883 (8.9%) | 3.03 |
| Single Female/Mother | 3,514 (16.6%) | 3.63 |
| Total Families | 21,156 (100.0%) | 3.64 |
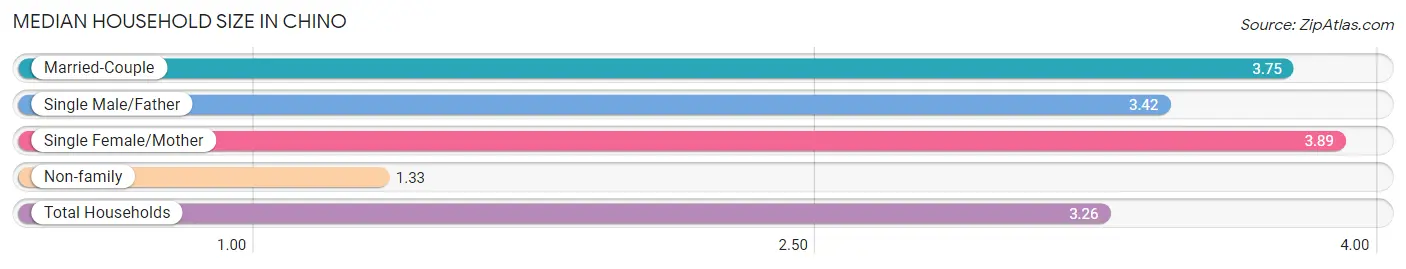
Median Household Size in Chino
The median household size in Chino is 3.26 persons per household, with single female/mother households (3,514 | 13.3%) accounting for the largest median household size of 3.89 persons per household. non-family households (5,235 | 19.8%) represent the smallest median household size with 1.33 persons per household.
| Household Type | # Households | Household Size |
| Married-Couple | 15,759 (59.7%) | 3.75 |
| Single Male/Father | 1,883 (7.1%) | 3.42 |
| Single Female/Mother | 3,514 (13.3%) | 3.89 |
| Non-family | 5,235 (19.8%) | 1.33 |
| Total Households | 26,391 (100.0%) | 3.26 |
Household Size by Marriage Status in Chino
Out of a total of 26,391 households in Chino, 21,156 (80.2%) are family households, while 5,235 (19.8%) are nonfamily households. The most numerous type of family households are 2-person households, comprising 5,956, and the most common type of nonfamily households are 1-person households, comprising 3,853.
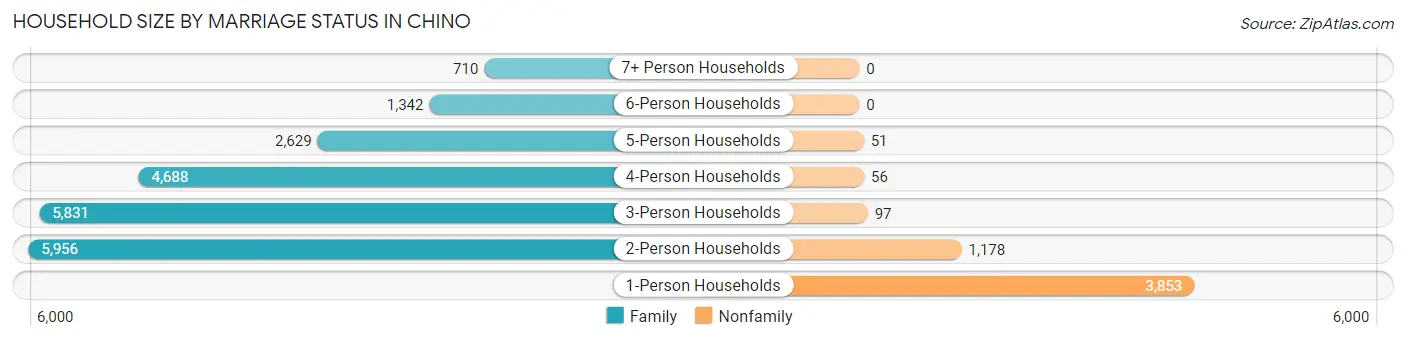
| Household Size | Family Households | Nonfamily Households |
| 1-Person Households | - | 3,853 (14.6%) |
| 2-Person Households | 5,956 (22.6%) | 1,178 (4.5%) |
| 3-Person Households | 5,831 (22.1%) | 97 (0.4%) |
| 4-Person Households | 4,688 (17.8%) | 56 (0.2%) |
| 5-Person Households | 2,629 (10.0%) | 51 (0.2%) |
| 6-Person Households | 1,342 (5.1%) | 0 (0.0%) |
| 7+ Person Households | 710 (2.7%) | 0 (0.0%) |
| Total | 21,156 (80.2%) | 5,235 (19.8%) |
Female Fertility in Chino
Fertility by Age in Chino
Average fertility rate in Chino is 56.0 births per 1,000 women. Women in the age bracket of 20 to 34 years have the highest fertility rate with 88.0 births per 1,000 women. Women in the age bracket of 20 to 34 years acount for 67.7% of all women with births.
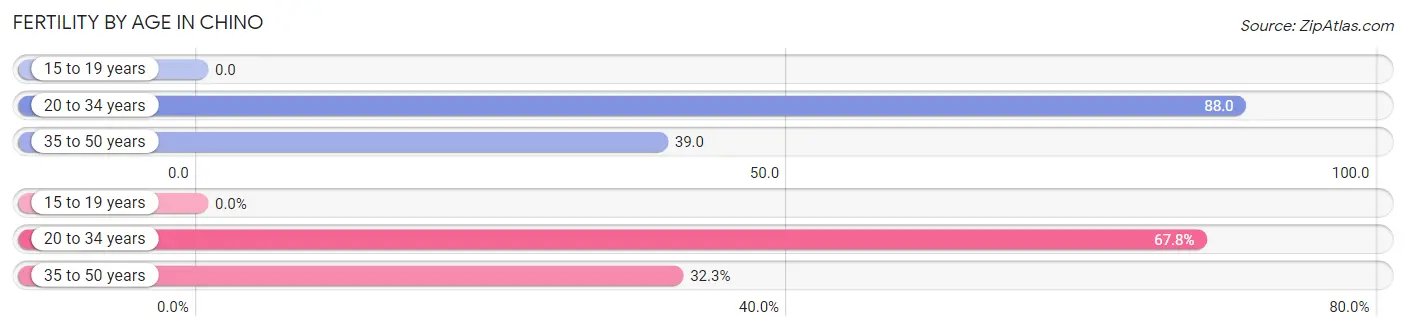
| Age Bracket | Women with Births | Births / 1,000 Women |
| 15 to 19 years | 0 (0.0%) | 0.0 |
| 20 to 34 years | 857 (67.7%) | 88.0 |
| 35 to 50 years | 408 (32.3%) | 39.0 |
| Total | 1,265 (100.0%) | 56.0 |
Fertility by Age by Marriage Status in Chino
68.0% of women with births (1,265) in Chino are married. The highest percentage of unmarried women with births falls into 20 to 34 years age bracket with 33.4% of them unmarried at the time of birth, while the lowest percentage of unmarried women with births belong to 35 to 50 years age bracket with 29.2% of them unmarried.
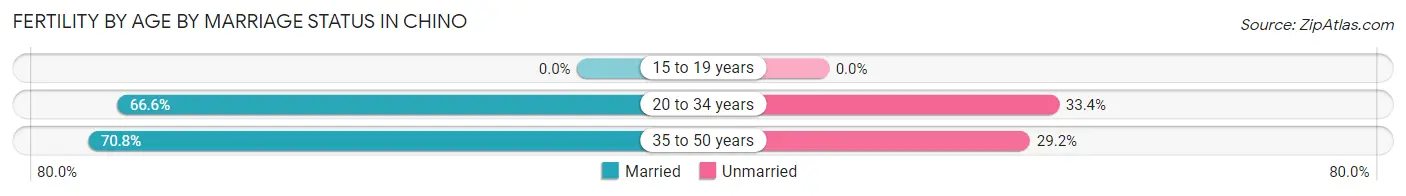
| Age Bracket | Married | Unmarried |
| 15 to 19 years | 0 (0.0%) | 0 (0.0%) |
| 20 to 34 years | 571 (66.6%) | 286 (33.4%) |
| 35 to 50 years | 289 (70.8%) | 119 (29.2%) |
| Total | 860 (68.0%) | 405 (32.0%) |
Fertility by Education in Chino
Average fertility rate in Chino is 56.0 births per 1,000 women. Women with the education attainment of bachelor's degree have the highest fertility rate of 78.0 births per 1,000 women, while women with the education attainment of less than high school have the lowest fertility at 20.0 births per 1,000 women. Women with the education attainment of college or associate's degree represent 29.6% of all women with births.
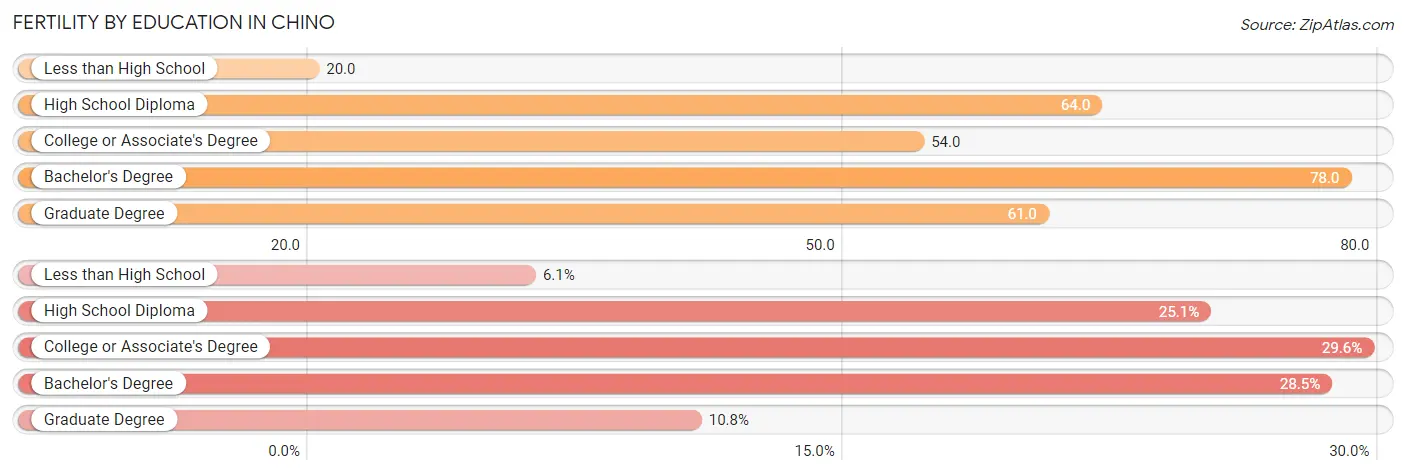
| Educational Attainment | Women with Births | Births / 1,000 Women |
| Less than High School | 77 (6.1%) | 20.0 |
| High School Diploma | 317 (25.1%) | 64.0 |
| College or Associate's Degree | 375 (29.6%) | 54.0 |
| Bachelor's Degree | 360 (28.5%) | 78.0 |
| Graduate Degree | 136 (10.7%) | 61.0 |
| Total | 1,265 (100.0%) | 56.0 |
Fertility by Education by Marriage Status in Chino
32.0% of women with births in Chino are unmarried. Women with the educational attainment of graduate degree are most likely to be married with 100.0% of them married at childbirth, while women with the educational attainment of less than high school are least likely to be married with 59.7% of them unmarried at childbirth.
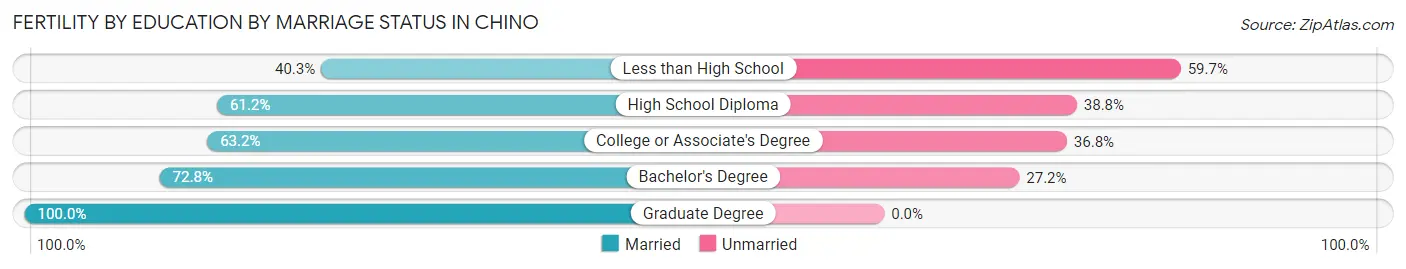
| Educational Attainment | Married | Unmarried |
| Less than High School | 31 (40.3%) | 46 (59.7%) |
| High School Diploma | 194 (61.2%) | 123 (38.8%) |
| College or Associate's Degree | 237 (63.2%) | 138 (36.8%) |
| Bachelor's Degree | 262 (72.8%) | 98 (27.2%) |
| Graduate Degree | 136 (100.0%) | 0 (0.0%) |
| Total | 860 (68.0%) | 405 (32.0%) |
Employment Characteristics in Chino
Employment by Class of Employer in Chino
Among the 41,586 employed individuals in Chino, private company employees (28,582 | 68.7%), local government employees (4,559 | 11.0%), and not-for-profit organizations (2,279 | 5.5%) make up the most common classes of employment.
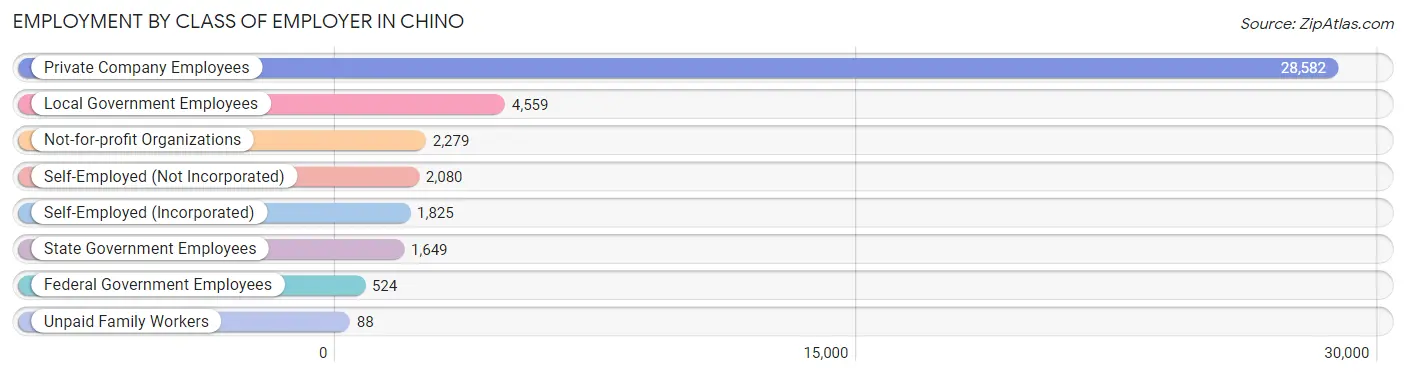
| Employer Class | # Employees | % Employees |
| Private Company Employees | 28,582 | 68.7% |
| Self-Employed (Incorporated) | 1,825 | 4.4% |
| Self-Employed (Not Incorporated) | 2,080 | 5.0% |
| Not-for-profit Organizations | 2,279 | 5.5% |
| Local Government Employees | 4,559 | 11.0% |
| State Government Employees | 1,649 | 4.0% |
| Federal Government Employees | 524 | 1.3% |
| Unpaid Family Workers | 88 | 0.2% |
| Total | 41,586 | 100.0% |
Employment Status by Age in Chino
According to the labor force statistics for Chino, out of the total population over 16 years of age (72,187), 62.9% or 45,406 individuals are in the labor force, with 5.5% or 2,497 of them unemployed. The age group with the highest labor force participation rate is 25 to 29 years, with 79.7% or 5,724 individuals in the labor force. Within the labor force, the 20 to 24 years age range has the highest percentage of unemployed individuals, with 12.2% or 501 of them being unemployed.
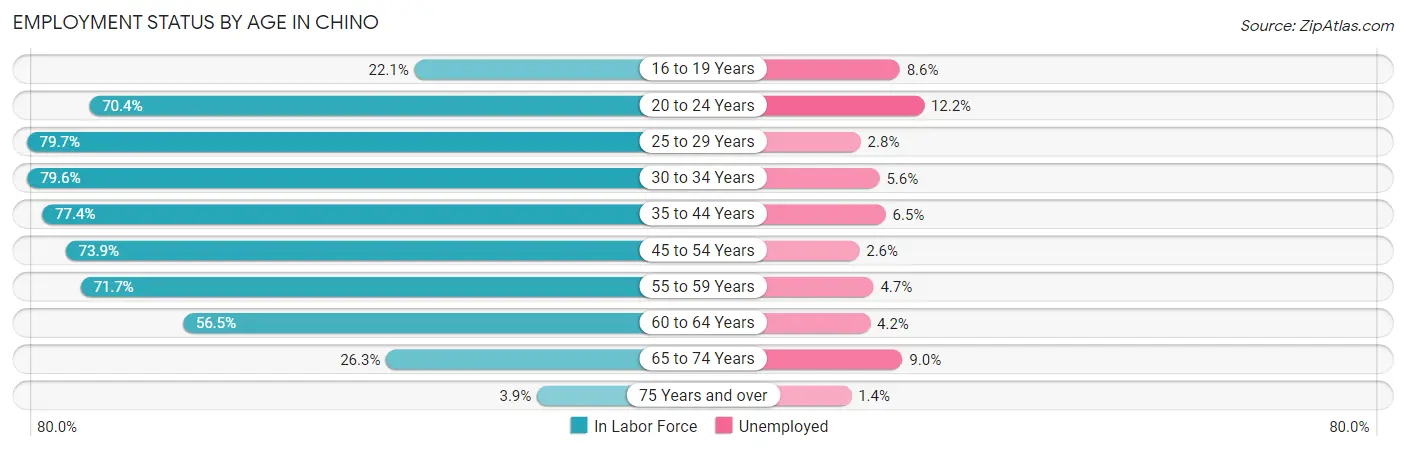
| Age Bracket | In Labor Force | Unemployed |
| 16 to 19 Years | 813 (22.1%) | 70 (8.6%) |
| 20 to 24 Years | 4,104 (70.4%) | 501 (12.2%) |
| 25 to 29 Years | 5,724 (79.7%) | 160 (2.8%) |
| 30 to 34 Years | 5,406 (79.6%) | 303 (5.6%) |
| 35 to 44 Years | 11,006 (77.4%) | 715 (6.5%) |
| 45 to 54 Years | 9,136 (73.9%) | 238 (2.6%) |
| 55 to 59 Years | 4,143 (71.7%) | 195 (4.7%) |
| 60 to 64 Years | 3,020 (56.5%) | 127 (4.2%) |
| 65 to 74 Years | 1,911 (26.3%) | 172 (9.0%) |
| 75 Years and over | 146 (3.9%) | 2 (1.4%) |
| Total | 45,406 (62.9%) | 2,497 (5.5%) |
Employment Status by Educational Attainment in Chino
According to labor force statistics for Chino, 74.4% of individuals (38,450) out of the total population between 25 and 64 years of age (51,680) are in the labor force, with 4.5% or 1,730 of them being unemployed. The group with the highest labor force participation rate are those with the educational attainment of bachelor's degree or higher, with 83.0% or 12,858 individuals in the labor force. Within the labor force, individuals with high school diploma education have the highest percentage of unemployment, with 5.4% or 443 of them being unemployed.
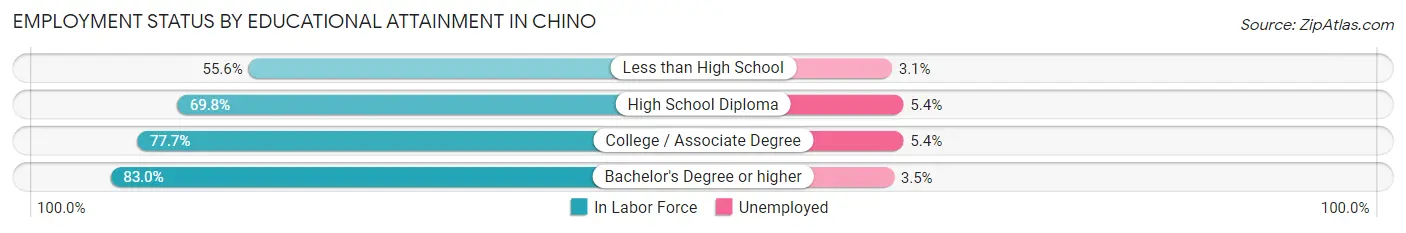
| Educational Attainment | In Labor Force | Unemployed |
| Less than High School | 4,030 (55.6%) | 225 (3.1%) |
| High School Diploma | 8,205 (69.8%) | 635 (5.4%) |
| College / Associate Degree | 13,353 (77.7%) | 928 (5.4%) |
| Bachelor's Degree or higher | 12,858 (83.0%) | 542 (3.5%) |
| Total | 38,450 (74.4%) | 2,326 (4.5%) |
Employment Occupations by Sex in Chino
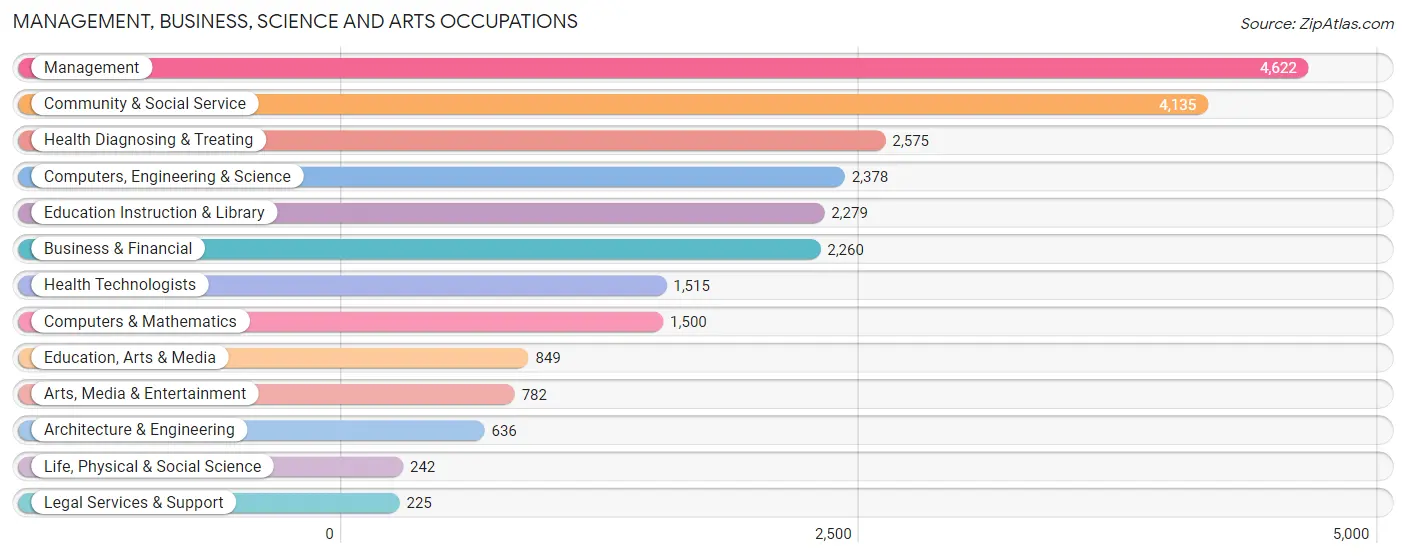
Management, Business, Science and Arts Occupations
The most common Management, Business, Science and Arts occupations in Chino are Management (4,622 | 10.8%), Community & Social Service (4,135 | 9.6%), Health Diagnosing & Treating (2,575 | 6.0%), Computers, Engineering & Science (2,378 | 5.5%), and Education Instruction & Library (2,279 | 5.3%).
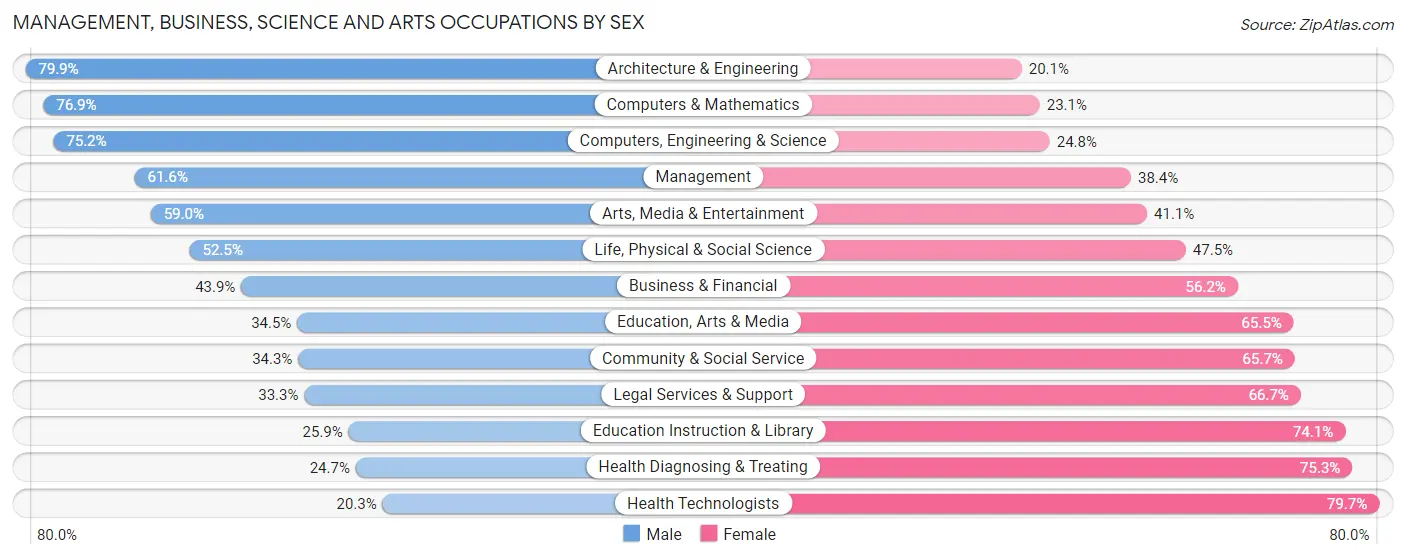
Management, Business, Science and Arts Occupations by Sex
Within the Management, Business, Science and Arts occupations in Chino, the most male-oriented occupations are Architecture & Engineering (79.9%), Computers & Mathematics (76.9%), and Computers, Engineering & Science (75.2%), while the most female-oriented occupations are Health Technologists (79.7%), Health Diagnosing & Treating (75.3%), and Education Instruction & Library (74.1%).
| Occupation | Male | Female |
| Management | 2,849 (61.6%) | 1,773 (38.4%) |
| Business & Financial | 991 (43.9%) | 1,269 (56.1%) |
| Computers, Engineering & Science | 1,788 (75.2%) | 590 (24.8%) |
| Computers & Mathematics | 1,153 (76.9%) | 347 (23.1%) |
| Architecture & Engineering | 508 (79.9%) | 128 (20.1%) |
| Life, Physical & Social Science | 127 (52.5%) | 115 (47.5%) |
| Community & Social Service | 1,420 (34.3%) | 2,715 (65.7%) |
| Education, Arts & Media | 293 (34.5%) | 556 (65.5%) |
| Legal Services & Support | 75 (33.3%) | 150 (66.7%) |
| Education Instruction & Library | 591 (25.9%) | 1,688 (74.1%) |
| Arts, Media & Entertainment | 461 (59.0%) | 321 (41.0%) |
| Health Diagnosing & Treating | 637 (24.7%) | 1,938 (75.3%) |
| Health Technologists | 307 (20.3%) | 1,208 (79.7%) |
| Total (Category) | 7,685 (48.1%) | 8,285 (51.9%) |
| Total (Overall) | 22,830 (53.2%) | 20,094 (46.8%) |
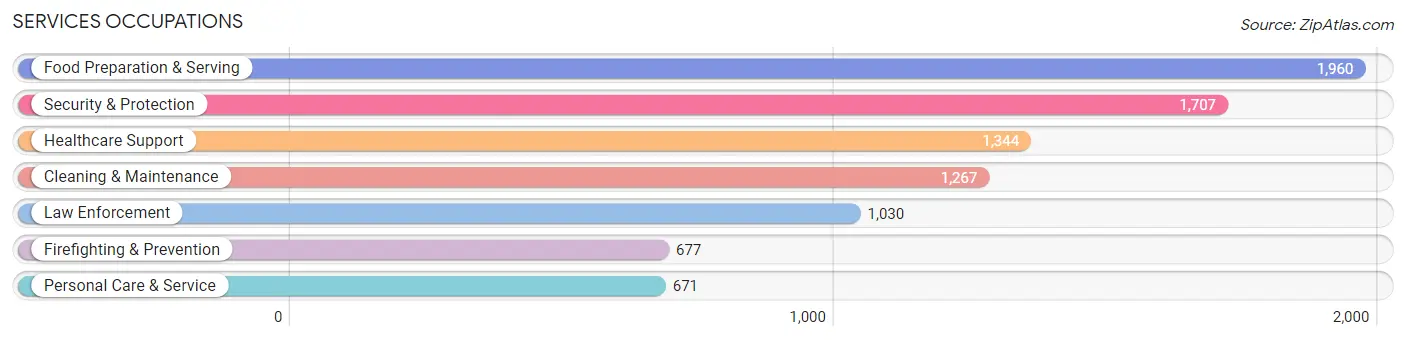
Services Occupations
The most common Services occupations in Chino are Food Preparation & Serving (1,960 | 4.6%), Security & Protection (1,707 | 4.0%), Healthcare Support (1,344 | 3.1%), Cleaning & Maintenance (1,267 | 2.9%), and Law Enforcement (1,030 | 2.4%).
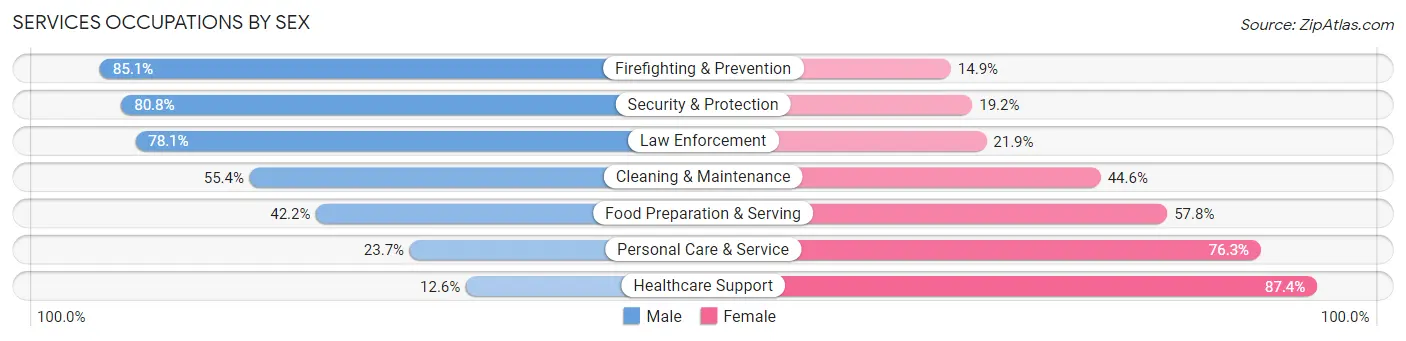
Services Occupations by Sex
Within the Services occupations in Chino, the most male-oriented occupations are Firefighting & Prevention (85.1%), Security & Protection (80.8%), and Law Enforcement (78.1%), while the most female-oriented occupations are Healthcare Support (87.4%), Personal Care & Service (76.3%), and Food Preparation & Serving (57.8%).
| Occupation | Male | Female |
| Healthcare Support | 169 (12.6%) | 1,175 (87.4%) |
| Security & Protection | 1,380 (80.8%) | 327 (19.2%) |
| Firefighting & Prevention | 576 (85.1%) | 101 (14.9%) |
| Law Enforcement | 804 (78.1%) | 226 (21.9%) |
| Food Preparation & Serving | 828 (42.2%) | 1,132 (57.8%) |
| Cleaning & Maintenance | 702 (55.4%) | 565 (44.6%) |
| Personal Care & Service | 159 (23.7%) | 512 (76.3%) |
| Total (Category) | 3,238 (46.6%) | 3,711 (53.4%) |
| Total (Overall) | 22,830 (53.2%) | 20,094 (46.8%) |
Sales and Office Occupations
The most common Sales and Office occupations in Chino are Office & Administration (5,622 | 13.1%), and Sales & Related (4,617 | 10.8%).

Sales and Office Occupations by Sex
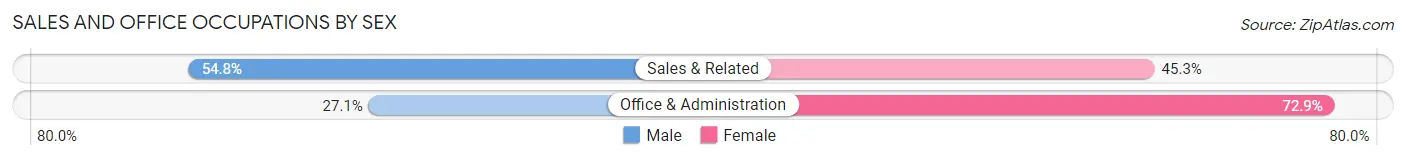
| Occupation | Male | Female |
| Sales & Related | 2,528 (54.7%) | 2,089 (45.3%) |
| Office & Administration | 1,522 (27.1%) | 4,100 (72.9%) |
| Total (Category) | 4,050 (39.6%) | 6,189 (60.5%) |
| Total (Overall) | 22,830 (53.2%) | 20,094 (46.8%) |
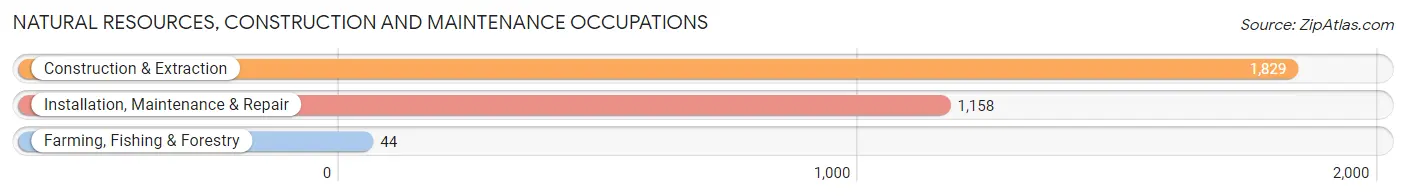
Natural Resources, Construction and Maintenance Occupations
The most common Natural Resources, Construction and Maintenance occupations in Chino are Construction & Extraction (1,829 | 4.3%), Installation, Maintenance & Repair (1,158 | 2.7%), and Farming, Fishing & Forestry (44 | 0.1%).
Natural Resources, Construction and Maintenance Occupations by Sex
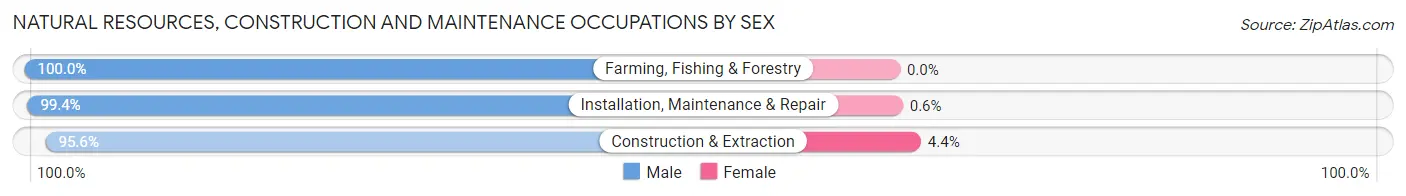
| Occupation | Male | Female |
| Farming, Fishing & Forestry | 44 (100.0%) | 0 (0.0%) |
| Construction & Extraction | 1,749 (95.6%) | 80 (4.4%) |
| Installation, Maintenance & Repair | 1,151 (99.4%) | 7 (0.6%) |
| Total (Category) | 2,944 (97.1%) | 87 (2.9%) |
| Total (Overall) | 22,830 (53.2%) | 20,094 (46.8%) |
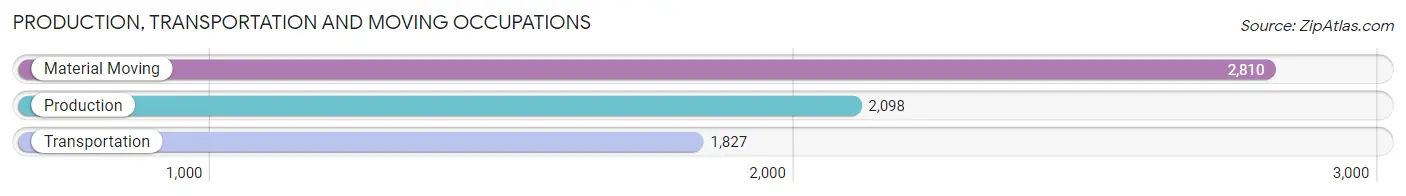
Production, Transportation and Moving Occupations
The most common Production, Transportation and Moving occupations in Chino are Material Moving (2,810 | 6.6%), Production (2,098 | 4.9%), and Transportation (1,827 | 4.3%).
Production, Transportation and Moving Occupations by Sex
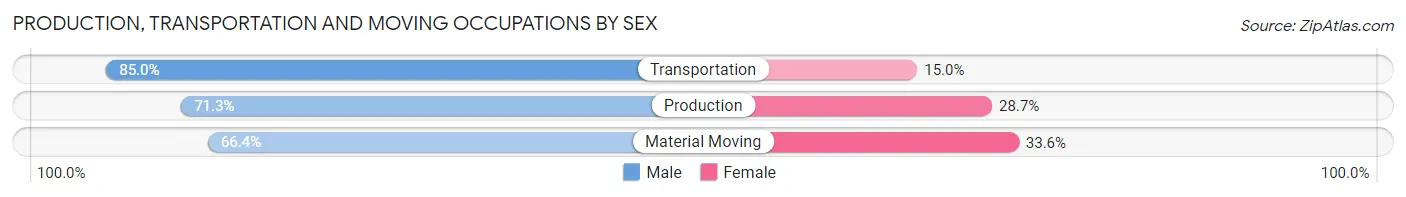
| Occupation | Male | Female |
| Production | 1,495 (71.3%) | 603 (28.7%) |
| Transportation | 1,553 (85.0%) | 274 (15.0%) |
| Material Moving | 1,865 (66.4%) | 945 (33.6%) |
| Total (Category) | 4,913 (73.0%) | 1,822 (27.1%) |
| Total (Overall) | 22,830 (53.2%) | 20,094 (46.8%) |
Employment Industries by Sex in Chino
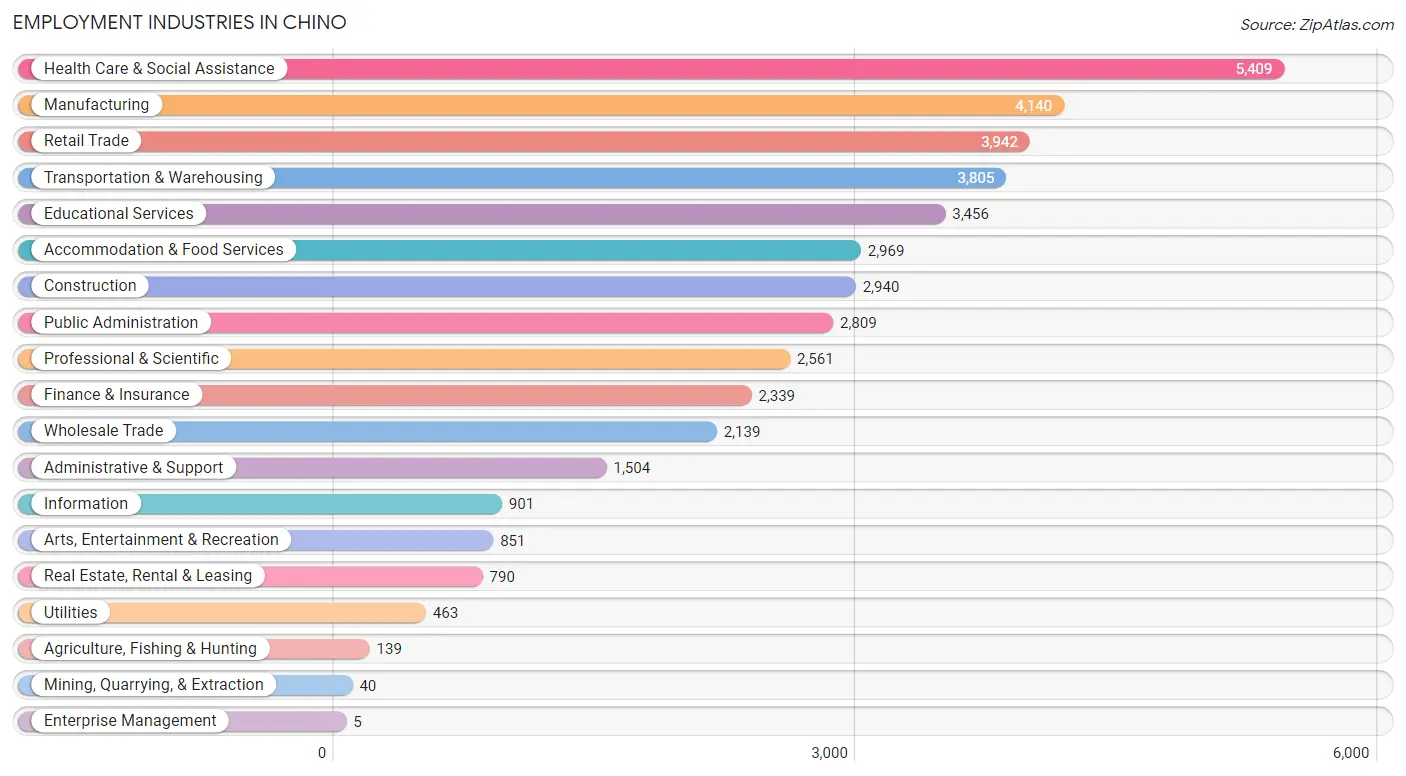
Employment Industries in Chino
The major employment industries in Chino include Health Care & Social Assistance (5,409 | 12.6%), Manufacturing (4,140 | 9.6%), Retail Trade (3,942 | 9.2%), Transportation & Warehousing (3,805 | 8.9%), and Educational Services (3,456 | 8.1%).
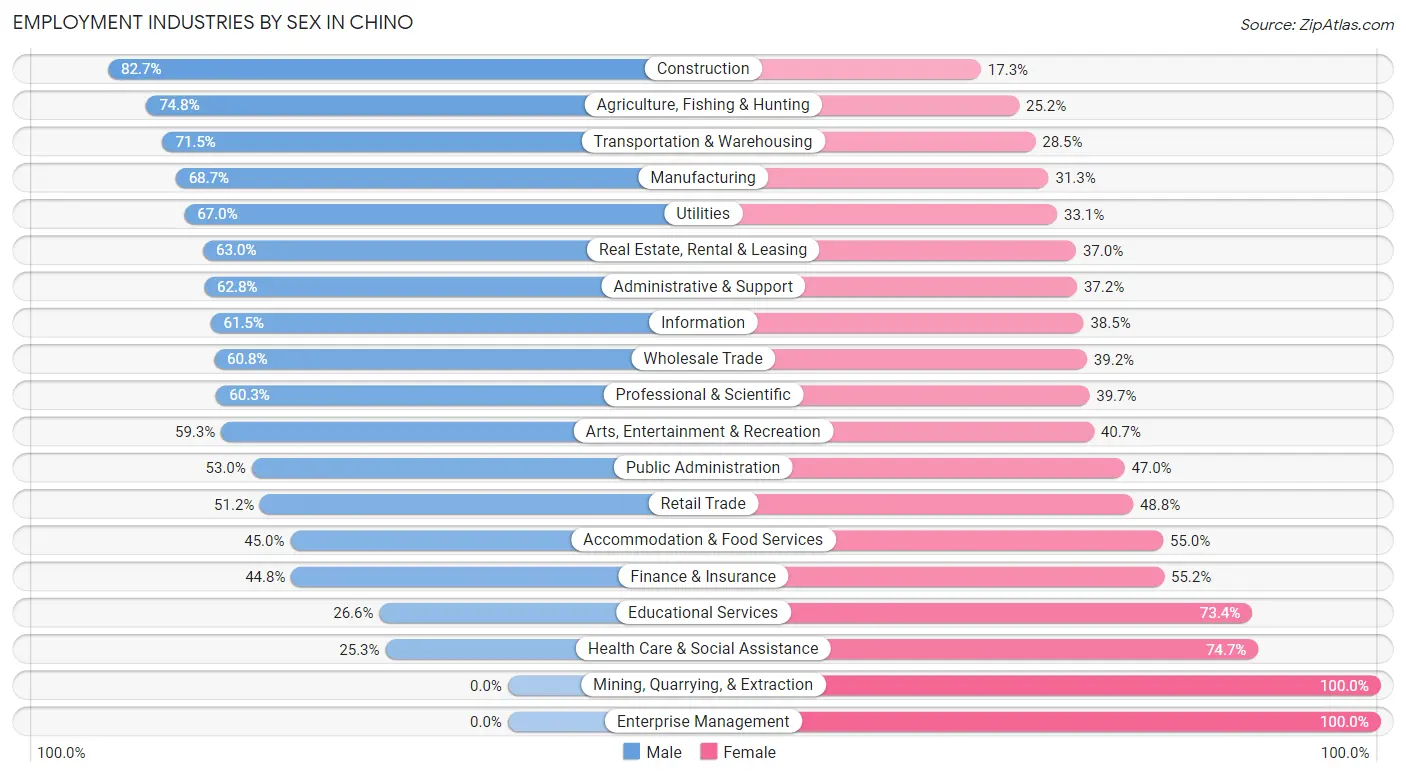
Employment Industries by Sex in Chino
The Chino industries that see more men than women are Construction (82.7%), Agriculture, Fishing & Hunting (74.8%), and Transportation & Warehousing (71.5%), whereas the industries that tend to have a higher number of women are Mining, Quarrying, & Extraction (100.0%), Enterprise Management (100.0%), and Health Care & Social Assistance (74.7%).
| Industry | Male | Female |
| Agriculture, Fishing & Hunting | 104 (74.8%) | 35 (25.2%) |
| Mining, Quarrying, & Extraction | 0 (0.0%) | 40 (100.0%) |
| Construction | 2,432 (82.7%) | 508 (17.3%) |
| Manufacturing | 2,845 (68.7%) | 1,295 (31.3%) |
| Wholesale Trade | 1,300 (60.8%) | 839 (39.2%) |
| Retail Trade | 2,020 (51.2%) | 1,922 (48.8%) |
| Transportation & Warehousing | 2,719 (71.5%) | 1,086 (28.5%) |
| Utilities | 310 (66.9%) | 153 (33.1%) |
| Information | 554 (61.5%) | 347 (38.5%) |
| Finance & Insurance | 1,048 (44.8%) | 1,291 (55.2%) |
| Real Estate, Rental & Leasing | 498 (63.0%) | 292 (37.0%) |
| Professional & Scientific | 1,544 (60.3%) | 1,017 (39.7%) |
| Enterprise Management | 0 (0.0%) | 5 (100.0%) |
| Administrative & Support | 945 (62.8%) | 559 (37.2%) |
| Educational Services | 919 (26.6%) | 2,537 (73.4%) |
| Health Care & Social Assistance | 1,370 (25.3%) | 4,039 (74.7%) |
| Arts, Entertainment & Recreation | 505 (59.3%) | 346 (40.7%) |
| Accommodation & Food Services | 1,336 (45.0%) | 1,633 (55.0%) |
| Public Administration | 1,489 (53.0%) | 1,320 (47.0%) |
| Total | 22,830 (53.2%) | 20,094 (46.8%) |
Education in Chino
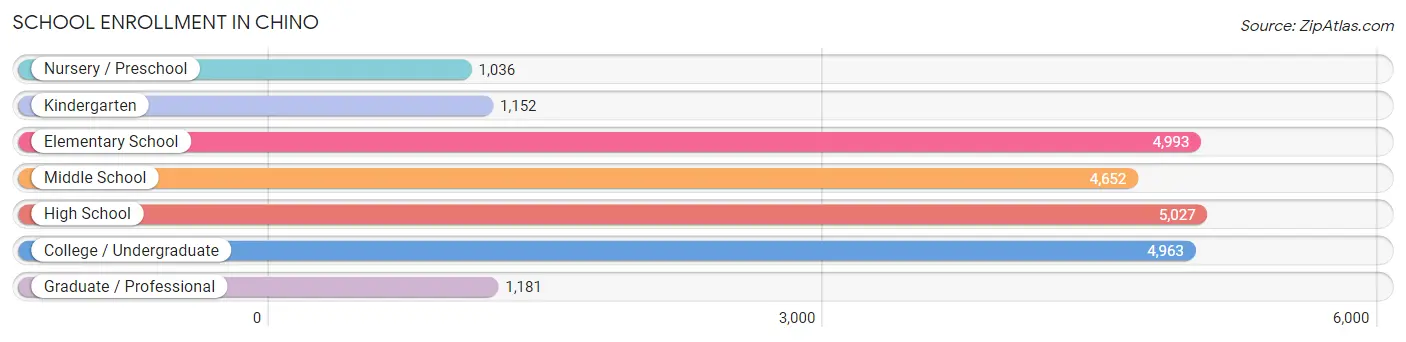
School Enrollment in Chino
The most common levels of schooling among the 23,004 students in Chino are high school (5,027 | 21.8%), elementary school (4,993 | 21.7%), and college / undergraduate (4,963 | 21.6%).
| School Level | # Students | % Students |
| Nursery / Preschool | 1,036 | 4.5% |
| Kindergarten | 1,152 | 5.0% |
| Elementary School | 4,993 | 21.7% |
| Middle School | 4,652 | 20.2% |
| High School | 5,027 | 21.8% |
| College / Undergraduate | 4,963 | 21.6% |
| Graduate / Professional | 1,181 | 5.1% |
| Total | 23,004 | 100.0% |
School Enrollment by Age by Funding Source in Chino
Out of a total of 23,004 students who are enrolled in schools in Chino, 2,968 (12.9%) attend a private institution, while the remaining 20,036 (87.1%) are enrolled in public schools. The age group of 3 to 4 year olds has the highest likelihood of being enrolled in private schools, with 384 (37.2% in the age bracket) enrolled. Conversely, the age group of 10 to 14 year olds has the lowest likelihood of being enrolled in a private school, with 5,621 (91.7% in the age bracket) attending a public institution.
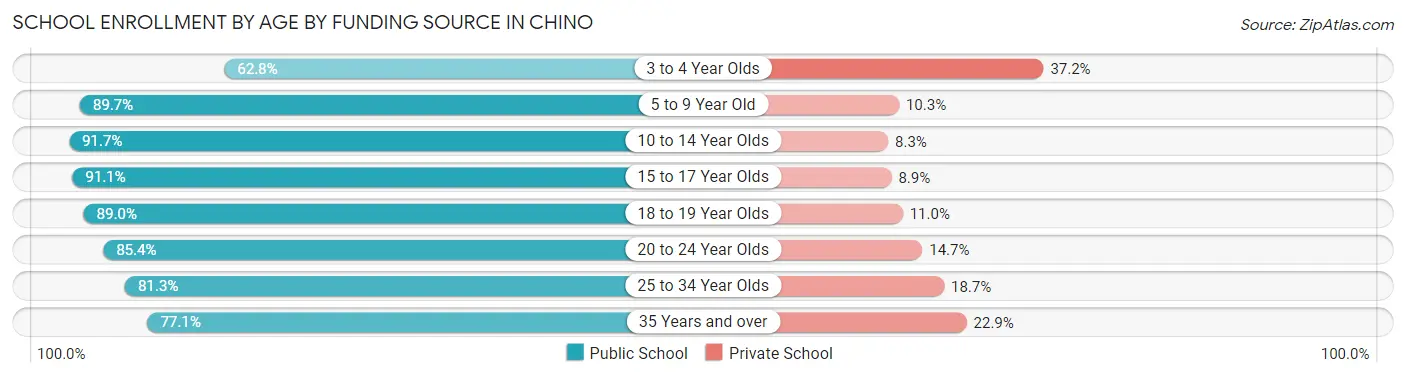
| Age Bracket | Public School | Private School |
| 3 to 4 Year Olds | 648 (62.8%) | 384 (37.2%) |
| 5 to 9 Year Old | 4,888 (89.7%) | 561 (10.3%) |
| 10 to 14 Year Olds | 5,621 (91.7%) | 507 (8.3%) |
| 15 to 17 Year Olds | 3,121 (91.1%) | 305 (8.9%) |
| 18 to 19 Year Olds | 833 (89.0%) | 103 (11.0%) |
| 20 to 24 Year Olds | 1,963 (85.4%) | 337 (14.6%) |
| 25 to 34 Year Olds | 1,622 (81.3%) | 373 (18.7%) |
| 35 Years and over | 1,340 (77.1%) | 398 (22.9%) |
| Total | 20,036 (87.1%) | 2,968 (12.9%) |
Educational Attainment by Field of Study in Chino
Business (4,392 | 23.9%), science & technology (1,917 | 10.4%), engineering (1,557 | 8.5%), arts & humanities (1,443 | 7.9%), and social sciences (1,379 | 7.5%) are the most common fields of study among 18,376 individuals in Chino who have obtained a bachelor's degree or higher.
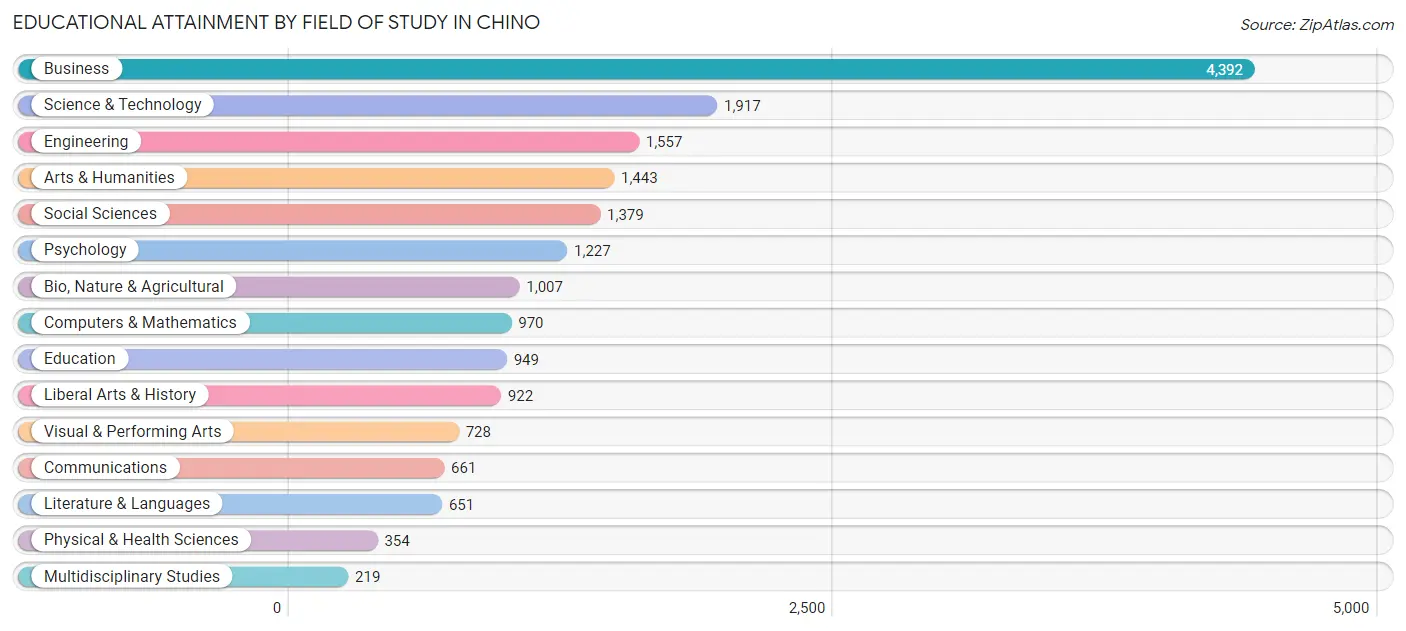
| Field of Study | # Graduates | % Graduates |
| Computers & Mathematics | 970 | 5.3% |
| Bio, Nature & Agricultural | 1,007 | 5.5% |
| Physical & Health Sciences | 354 | 1.9% |
| Psychology | 1,227 | 6.7% |
| Social Sciences | 1,379 | 7.5% |
| Engineering | 1,557 | 8.5% |
| Multidisciplinary Studies | 219 | 1.2% |
| Science & Technology | 1,917 | 10.4% |
| Business | 4,392 | 23.9% |
| Education | 949 | 5.2% |
| Literature & Languages | 651 | 3.5% |
| Liberal Arts & History | 922 | 5.0% |
| Visual & Performing Arts | 728 | 4.0% |
| Communications | 661 | 3.6% |
| Arts & Humanities | 1,443 | 7.9% |
| Total | 18,376 | 100.0% |
Transportation & Commute in Chino
Vehicle Availability by Sex in Chino
The most prevalent vehicle ownership categories in Chino are males with 2 vehicles (8,052, accounting for 35.9%) and females with 2 vehicles (6,064, making up 42.1%).
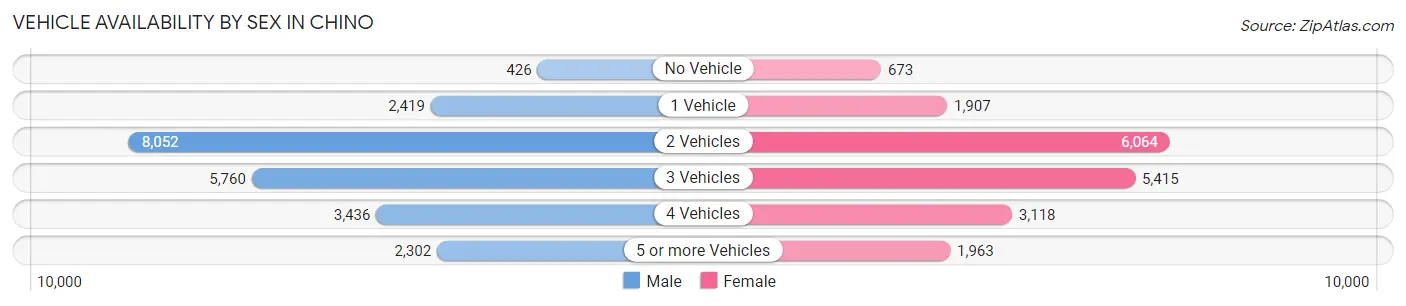
| Vehicles Available | Male | Female |
| No Vehicle | 426 (1.9%) | 673 (3.5%) |
| 1 Vehicle | 2,419 (10.8%) | 1,907 (10.0%) |
| 2 Vehicles | 8,052 (35.9%) | 6,064 (31.7%) |
| 3 Vehicles | 5,760 (25.7%) | 5,415 (28.3%) |
| 4 Vehicles | 3,436 (15.3%) | 3,118 (16.3%) |
| 5 or more Vehicles | 2,302 (10.3%) | 1,963 (10.3%) |
| Total | 22,395 (100.0%) | 19,140 (100.0%) |
Commute Time in Chino
The most frequently occuring commute durations in Chino are 30 to 34 minutes (5,101 commuters, 14.1%), 20 to 24 minutes (4,628 commuters, 12.8%), and 60 to 89 minutes (4,372 commuters, 12.1%).
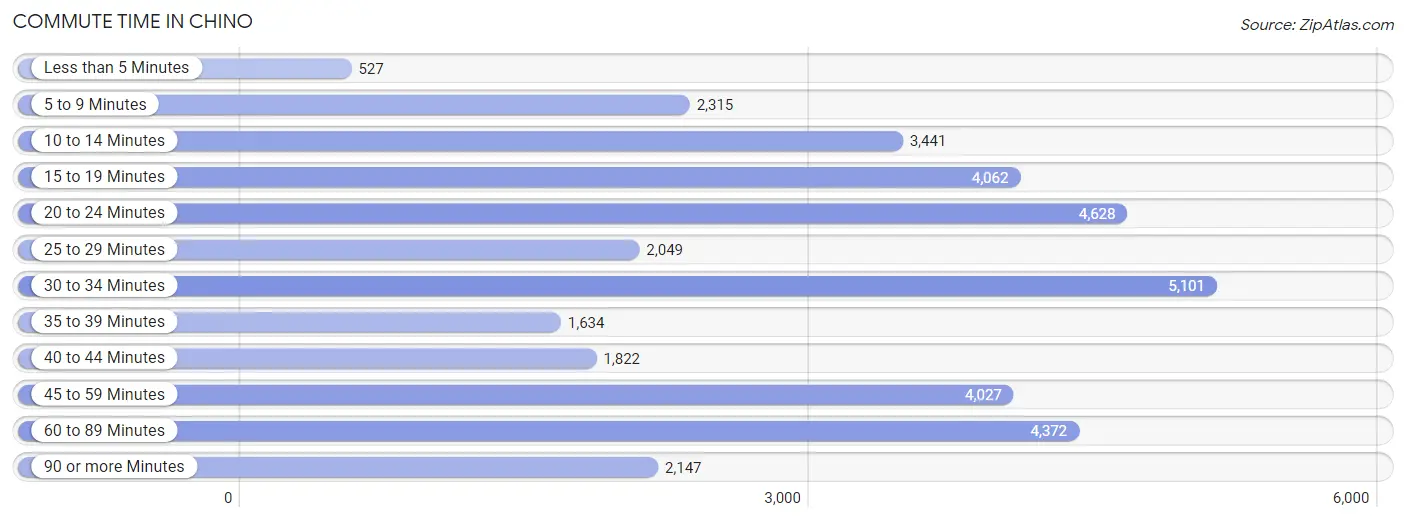
| Commute Time | # Commuters | % Commuters |
| Less than 5 Minutes | 527 | 1.5% |
| 5 to 9 Minutes | 2,315 | 6.4% |
| 10 to 14 Minutes | 3,441 | 9.5% |
| 15 to 19 Minutes | 4,062 | 11.2% |
| 20 to 24 Minutes | 4,628 | 12.8% |
| 25 to 29 Minutes | 2,049 | 5.7% |
| 30 to 34 Minutes | 5,101 | 14.1% |
| 35 to 39 Minutes | 1,634 | 4.5% |
| 40 to 44 Minutes | 1,822 | 5.0% |
| 45 to 59 Minutes | 4,027 | 11.2% |
| 60 to 89 Minutes | 4,372 | 12.1% |
| 90 or more Minutes | 2,147 | 5.9% |
Commute Time by Sex in Chino
The most common commute times in Chino are 20 to 24 minutes (2,700 commuters, 13.4%) for males and 30 to 34 minutes (2,542 commuters, 15.9%) for females.
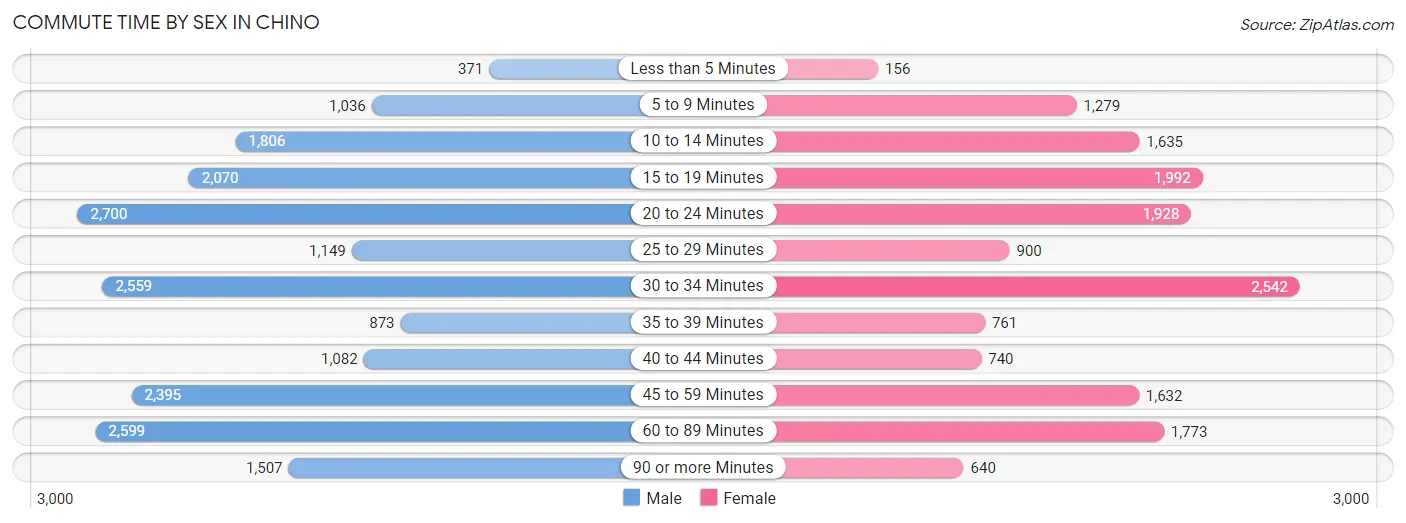
| Commute Time | Male | Female |
| Less than 5 Minutes | 371 (1.8%) | 156 (1.0%) |
| 5 to 9 Minutes | 1,036 (5.1%) | 1,279 (8.0%) |
| 10 to 14 Minutes | 1,806 (9.0%) | 1,635 (10.2%) |
| 15 to 19 Minutes | 2,070 (10.3%) | 1,992 (12.5%) |
| 20 to 24 Minutes | 2,700 (13.4%) | 1,928 (12.1%) |
| 25 to 29 Minutes | 1,149 (5.7%) | 900 (5.6%) |
| 30 to 34 Minutes | 2,559 (12.7%) | 2,542 (15.9%) |
| 35 to 39 Minutes | 873 (4.3%) | 761 (4.8%) |
| 40 to 44 Minutes | 1,082 (5.4%) | 740 (4.6%) |
| 45 to 59 Minutes | 2,395 (11.9%) | 1,632 (10.2%) |
| 60 to 89 Minutes | 2,599 (12.9%) | 1,773 (11.1%) |
| 90 or more Minutes | 1,507 (7.5%) | 640 (4.0%) |
Time of Departure to Work by Sex in Chino
The most frequent times of departure to work in Chino are 6:00 AM to 6:29 AM (2,556, 12.7%) for males and 7:00 AM to 7:29 AM (2,401, 15.0%) for females.
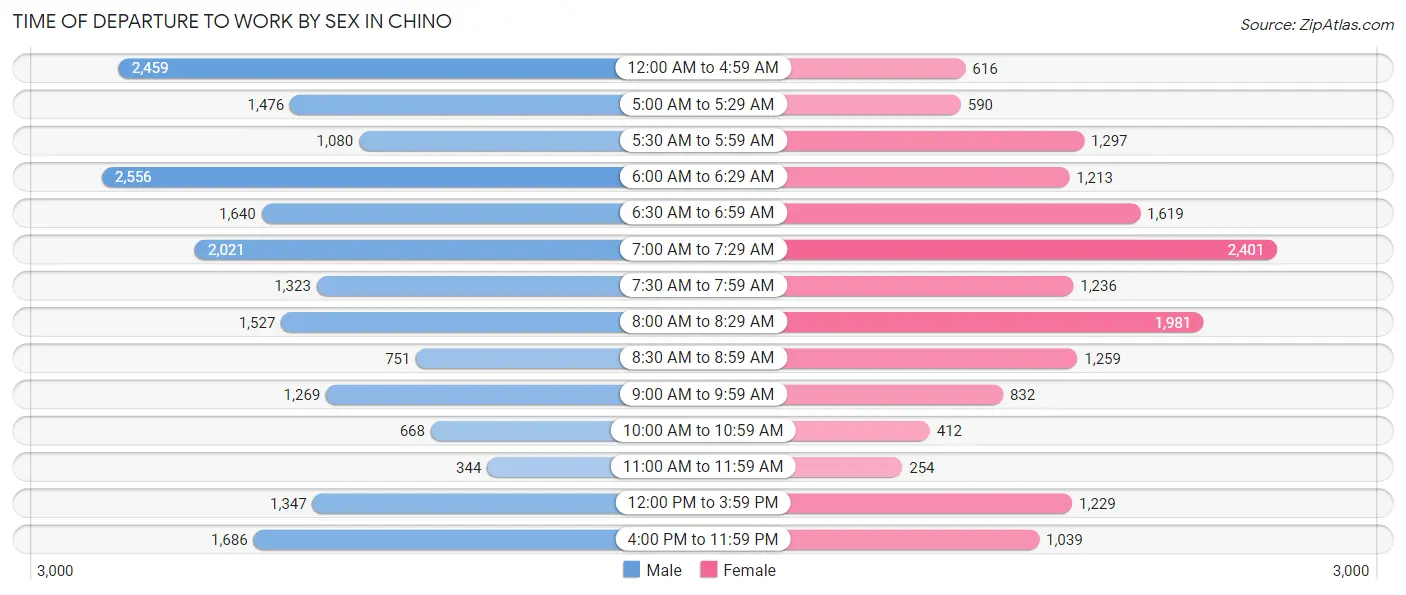
| Time of Departure | Male | Female |
| 12:00 AM to 4:59 AM | 2,459 (12.2%) | 616 (3.9%) |
| 5:00 AM to 5:29 AM | 1,476 (7.3%) | 590 (3.7%) |
| 5:30 AM to 5:59 AM | 1,080 (5.4%) | 1,297 (8.1%) |
| 6:00 AM to 6:29 AM | 2,556 (12.7%) | 1,213 (7.6%) |
| 6:30 AM to 6:59 AM | 1,640 (8.1%) | 1,619 (10.1%) |
| 7:00 AM to 7:29 AM | 2,021 (10.0%) | 2,401 (15.0%) |
| 7:30 AM to 7:59 AM | 1,323 (6.6%) | 1,236 (7.7%) |
| 8:00 AM to 8:29 AM | 1,527 (7.6%) | 1,981 (12.4%) |
| 8:30 AM to 8:59 AM | 751 (3.7%) | 1,259 (7.9%) |
| 9:00 AM to 9:59 AM | 1,269 (6.3%) | 832 (5.2%) |
| 10:00 AM to 10:59 AM | 668 (3.3%) | 412 (2.6%) |
| 11:00 AM to 11:59 AM | 344 (1.7%) | 254 (1.6%) |
| 12:00 PM to 3:59 PM | 1,347 (6.7%) | 1,229 (7.7%) |
| 4:00 PM to 11:59 PM | 1,686 (8.4%) | 1,039 (6.5%) |
| Total | 20,147 (100.0%) | 15,978 (100.0%) |
Housing Occupancy in Chino
Occupancy by Ownership in Chino
Of the total 26,391 dwellings in Chino, owner-occupied units account for 16,819 (63.7%), while renter-occupied units make up 9,572 (36.3%).
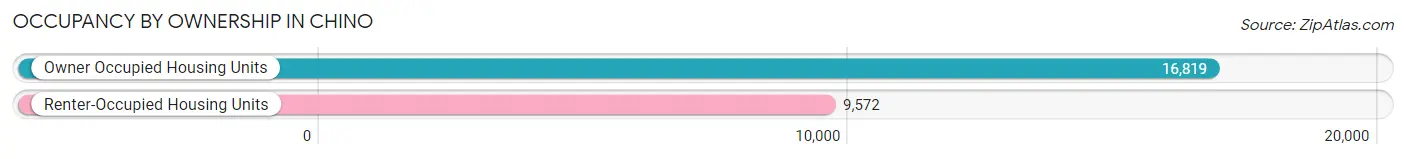
| Occupancy | # Housing Units | % Housing Units |
| Owner Occupied Housing Units | 16,819 | 63.7% |
| Renter-Occupied Housing Units | 9,572 | 36.3% |
| Total Occupied Housing Units | 26,391 | 100.0% |
Occupancy by Household Size in Chino
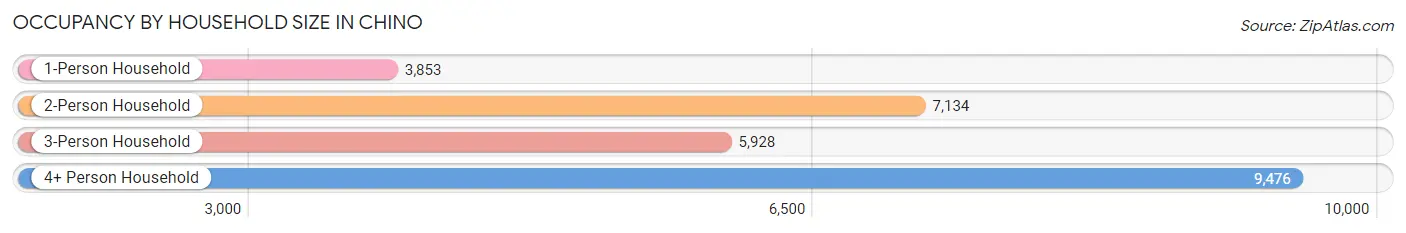
| Household Size | # Housing Units | % Housing Units |
| 1-Person Household | 3,853 | 14.6% |
| 2-Person Household | 7,134 | 27.0% |
| 3-Person Household | 5,928 | 22.5% |
| 4+ Person Household | 9,476 | 35.9% |
| Total Housing Units | 26,391 | 100.0% |
Occupancy by Ownership by Household Size in Chino
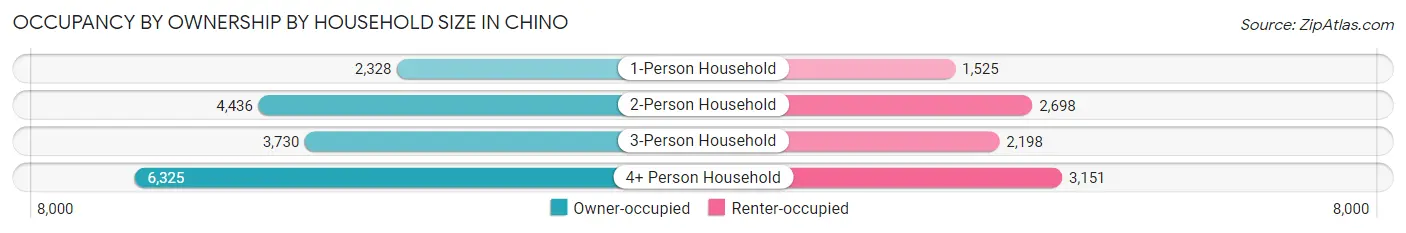
| Household Size | Owner-occupied | Renter-occupied |
| 1-Person Household | 2,328 (60.4%) | 1,525 (39.6%) |
| 2-Person Household | 4,436 (62.2%) | 2,698 (37.8%) |
| 3-Person Household | 3,730 (62.9%) | 2,198 (37.1%) |
| 4+ Person Household | 6,325 (66.7%) | 3,151 (33.3%) |
| Total Housing Units | 16,819 (63.7%) | 9,572 (36.3%) |
Occupancy by Educational Attainment in Chino
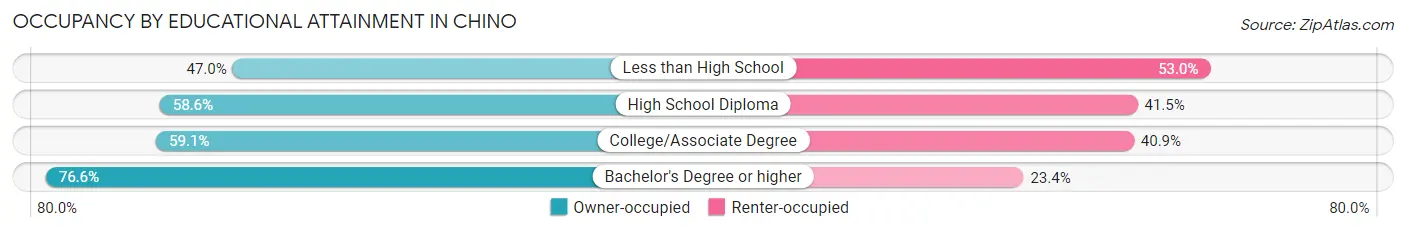
| Household Size | Owner-occupied | Renter-occupied |
| Less than High School | 1,331 (47.0%) | 1,500 (53.0%) |
| High School Diploma | 2,908 (58.6%) | 2,059 (41.4%) |
| College/Associate Degree | 5,637 (59.1%) | 3,896 (40.9%) |
| Bachelor's Degree or higher | 6,943 (76.6%) | 2,117 (23.4%) |
Occupancy by Age of Householder in Chino
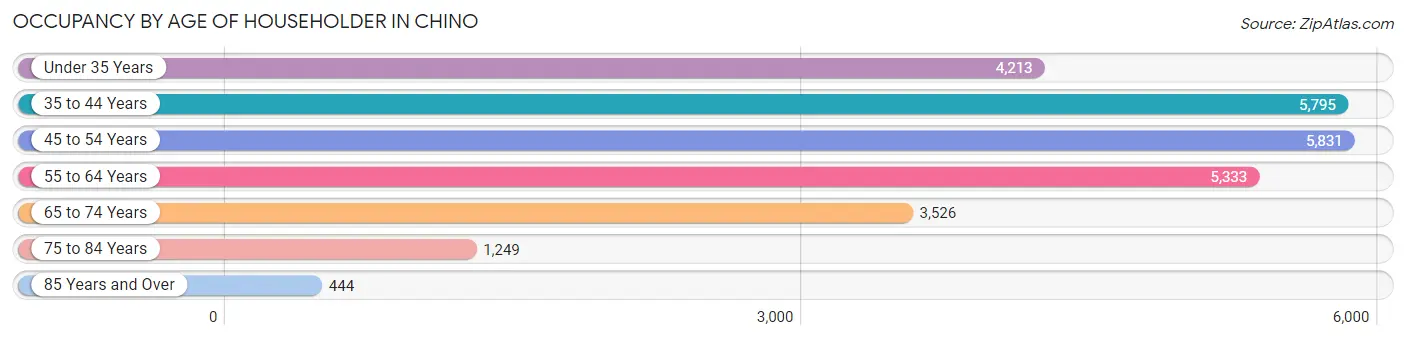
| Age Bracket | # Households | % Households |
| Under 35 Years | 4,213 | 16.0% |
| 35 to 44 Years | 5,795 | 22.0% |
| 45 to 54 Years | 5,831 | 22.1% |
| 55 to 64 Years | 5,333 | 20.2% |
| 65 to 74 Years | 3,526 | 13.4% |
| 75 to 84 Years | 1,249 | 4.7% |
| 85 Years and Over | 444 | 1.7% |
| Total | 26,391 | 100.0% |
Housing Finances in Chino
Median Income by Occupancy in Chino
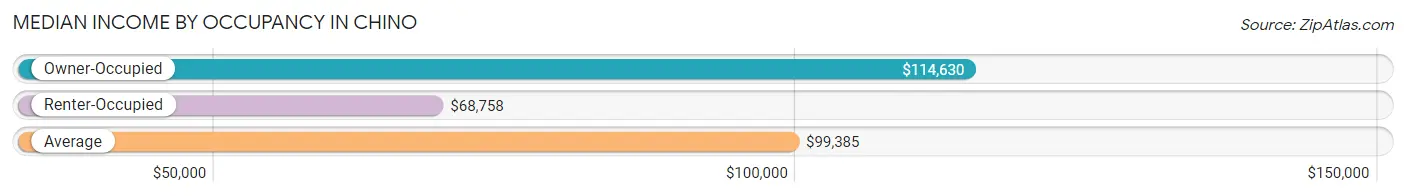
| Occupancy Type | # Households | Median Income |
| Owner-Occupied | 16,819 (63.7%) | $114,630 |
| Renter-Occupied | 9,572 (36.3%) | $68,758 |
| Average | 26,391 (100.0%) | $99,385 |
Occupancy by Householder Income Bracket in Chino
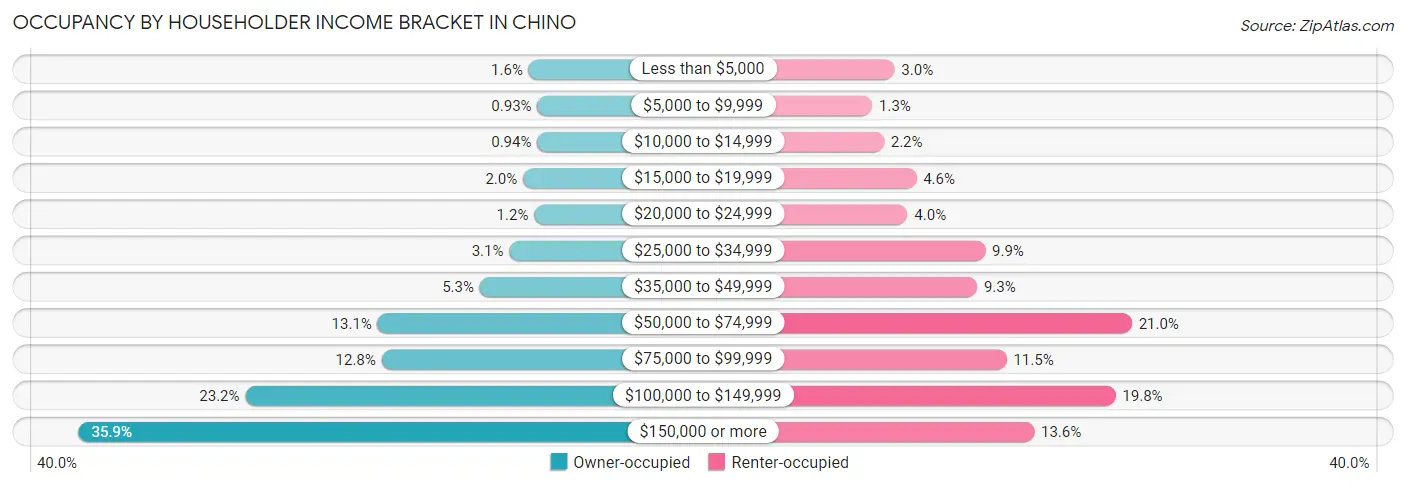
| Income Bracket | Owner-occupied | Renter-occupied |
| Less than $5,000 | 268 (1.6%) | 283 (3.0%) |
| $5,000 to $9,999 | 157 (0.9%) | 121 (1.3%) |
| $10,000 to $14,999 | 158 (0.9%) | 206 (2.1%) |
| $15,000 to $19,999 | 339 (2.0%) | 442 (4.6%) |
| $20,000 to $24,999 | 196 (1.2%) | 378 (4.0%) |
| $25,000 to $34,999 | 516 (3.1%) | 945 (9.9%) |
| $35,000 to $49,999 | 894 (5.3%) | 885 (9.2%) |
| $50,000 to $74,999 | 2,204 (13.1%) | 2,014 (21.0%) |
| $75,000 to $99,999 | 2,152 (12.8%) | 1,101 (11.5%) |
| $100,000 to $149,999 | 3,898 (23.2%) | 1,895 (19.8%) |
| $150,000 or more | 6,037 (35.9%) | 1,302 (13.6%) |
| Total | 16,819 (100.0%) | 9,572 (100.0%) |
Monthly Housing Cost Tiers in Chino
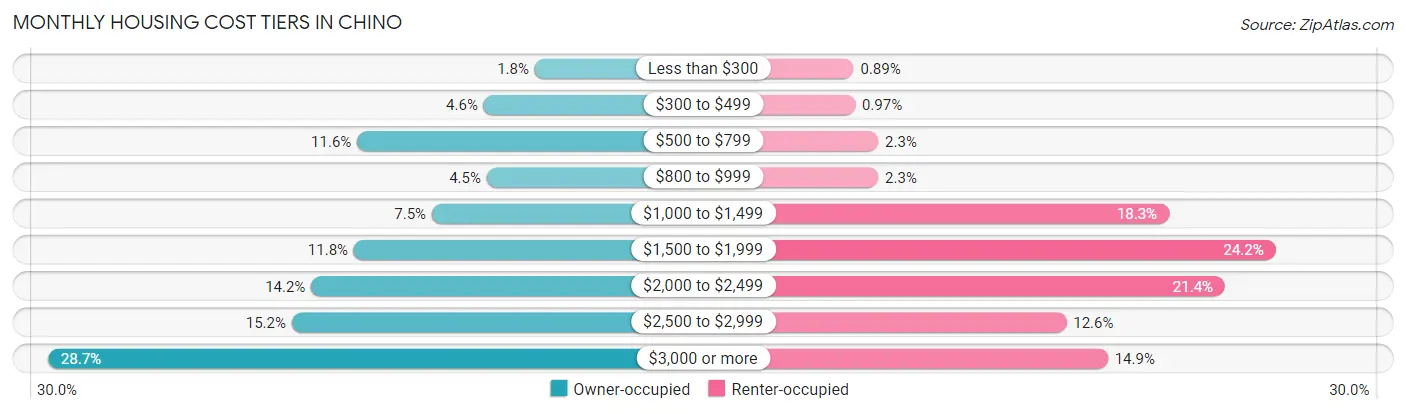
| Monthly Cost | Owner-occupied | Renter-occupied |
| Less than $300 | 306 (1.8%) | 85 (0.9%) |
| $300 to $499 | 781 (4.6%) | 93 (1.0%) |
| $500 to $799 | 1,956 (11.6%) | 215 (2.2%) |
| $800 to $999 | 751 (4.5%) | 215 (2.2%) |
| $1,000 to $1,499 | 1,262 (7.5%) | 1,753 (18.3%) |
| $1,500 to $1,999 | 1,987 (11.8%) | 2,316 (24.2%) |
| $2,000 to $2,499 | 2,383 (14.2%) | 2,048 (21.4%) |
| $2,500 to $2,999 | 2,564 (15.2%) | 1,210 (12.6%) |
| $3,000 or more | 4,829 (28.7%) | 1,429 (14.9%) |
| Total | 16,819 (100.0%) | 9,572 (100.0%) |
Physical Housing Characteristics in Chino
Housing Structures in Chino
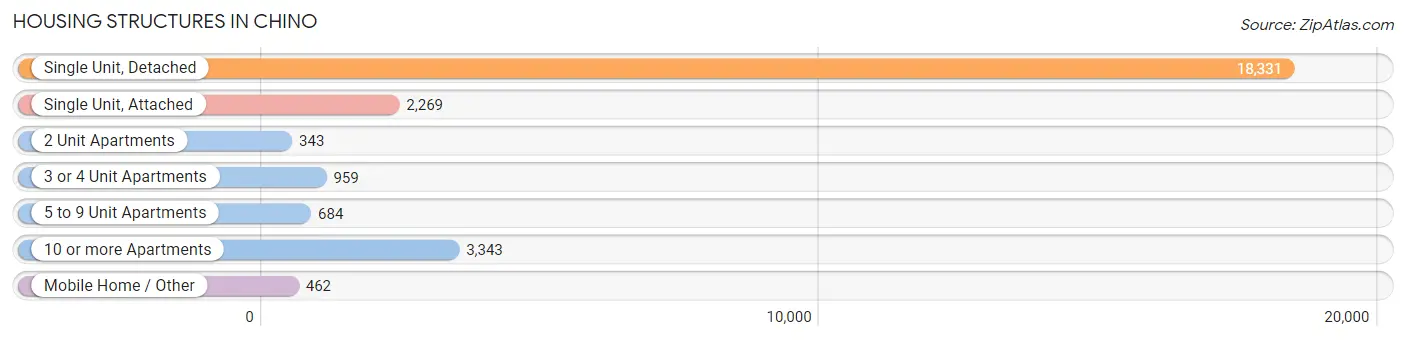
| Structure Type | # Housing Units | % Housing Units |
| Single Unit, Detached | 18,331 | 69.5% |
| Single Unit, Attached | 2,269 | 8.6% |
| 2 Unit Apartments | 343 | 1.3% |
| 3 or 4 Unit Apartments | 959 | 3.6% |
| 5 to 9 Unit Apartments | 684 | 2.6% |
| 10 or more Apartments | 3,343 | 12.7% |
| Mobile Home / Other | 462 | 1.8% |
| Total | 26,391 | 100.0% |
Housing Structures by Occupancy in Chino
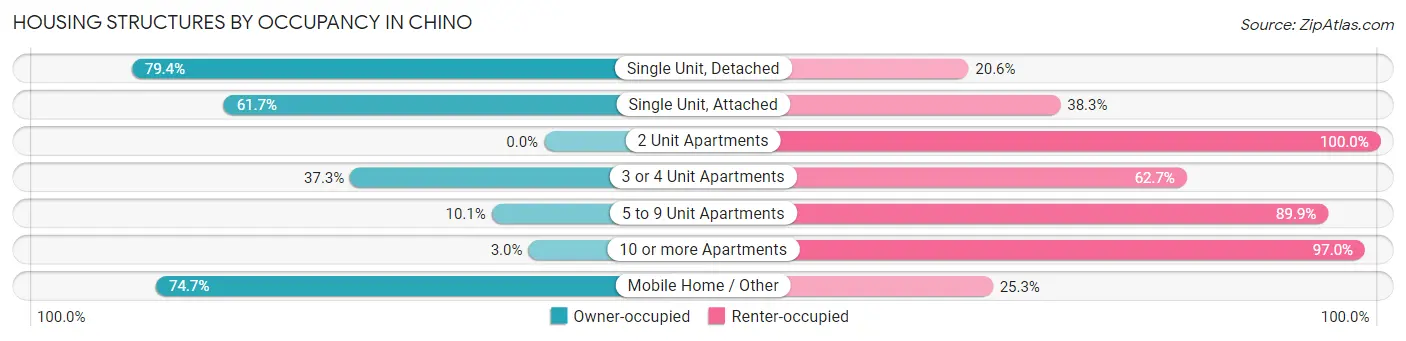
| Structure Type | Owner-occupied | Renter-occupied |
| Single Unit, Detached | 14,547 (79.4%) | 3,784 (20.6%) |
| Single Unit, Attached | 1,399 (61.7%) | 870 (38.3%) |
| 2 Unit Apartments | 0 (0.0%) | 343 (100.0%) |
| 3 or 4 Unit Apartments | 358 (37.3%) | 601 (62.7%) |
| 5 to 9 Unit Apartments | 69 (10.1%) | 615 (89.9%) |
| 10 or more Apartments | 101 (3.0%) | 3,242 (97.0%) |
| Mobile Home / Other | 345 (74.7%) | 117 (25.3%) |
| Total | 16,819 (63.7%) | 9,572 (36.3%) |
Housing Structures by Number of Rooms in Chino
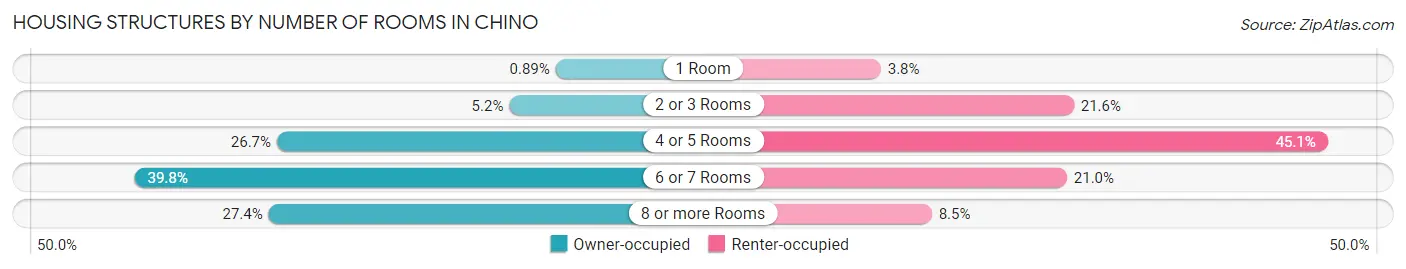
| Number of Rooms | Owner-occupied | Renter-occupied |
| 1 Room | 149 (0.9%) | 362 (3.8%) |
| 2 or 3 Rooms | 871 (5.2%) | 2,070 (21.6%) |
| 4 or 5 Rooms | 4,485 (26.7%) | 4,318 (45.1%) |
| 6 or 7 Rooms | 6,699 (39.8%) | 2,009 (21.0%) |
| 8 or more Rooms | 4,615 (27.4%) | 813 (8.5%) |
| Total | 16,819 (100.0%) | 9,572 (100.0%) |
Housing Structure by Heating Type in Chino
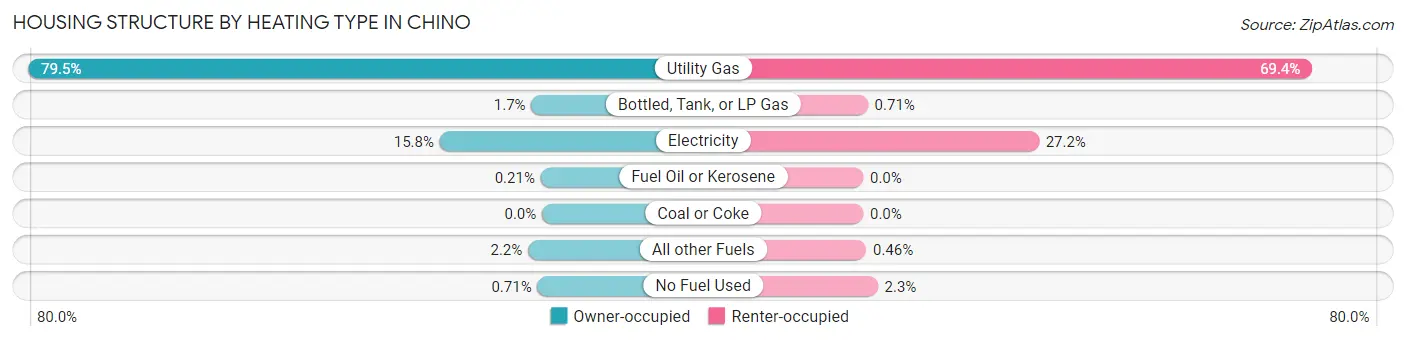
| Heating Type | Owner-occupied | Renter-occupied |
| Utility Gas | 13,364 (79.5%) | 6,646 (69.4%) |
| Bottled, Tank, or LP Gas | 278 (1.7%) | 68 (0.7%) |
| Electricity | 2,660 (15.8%) | 2,599 (27.2%) |
| Fuel Oil or Kerosene | 35 (0.2%) | 0 (0.0%) |
| Coal or Coke | 0 (0.0%) | 0 (0.0%) |
| All other Fuels | 363 (2.2%) | 44 (0.5%) |
| No Fuel Used | 119 (0.7%) | 215 (2.2%) |
| Total | 16,819 (100.0%) | 9,572 (100.0%) |
Household Vehicle Usage in Chino
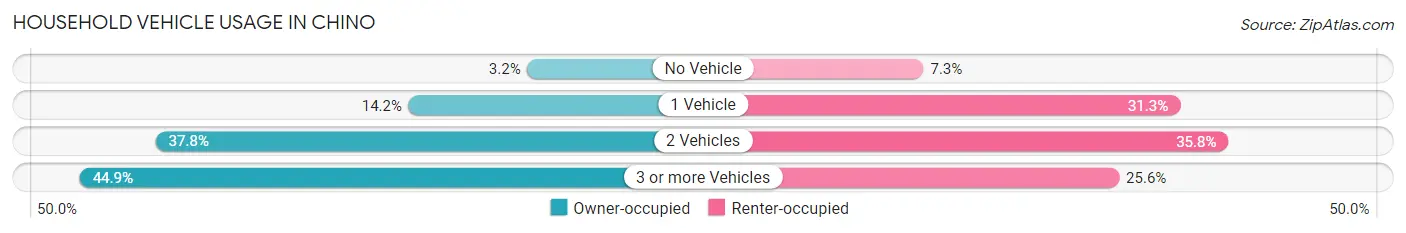
| Vehicles per Household | Owner-occupied | Renter-occupied |
| No Vehicle | 530 (3.2%) | 703 (7.3%) |
| 1 Vehicle | 2,393 (14.2%) | 2,994 (31.3%) |
| 2 Vehicles | 6,352 (37.8%) | 3,425 (35.8%) |
| 3 or more Vehicles | 7,544 (44.9%) | 2,450 (25.6%) |
| Total | 16,819 (100.0%) | 9,572 (100.0%) |
Real Estate & Mortgages in Chino
Real Estate and Mortgage Overview in Chino
| Characteristic | Without Mortgage | With Mortgage |
| Housing Units | 4,356 | 12,463 |
| Median Property Value | $555,900 | $611,100 |
| Median Household Income | $77,382 | $5,023 |
| Monthly Housing Costs | $673 | $4,829 |
| Real Estate Taxes | $3,261 | $274 |
Property Value by Mortgage Status in Chino
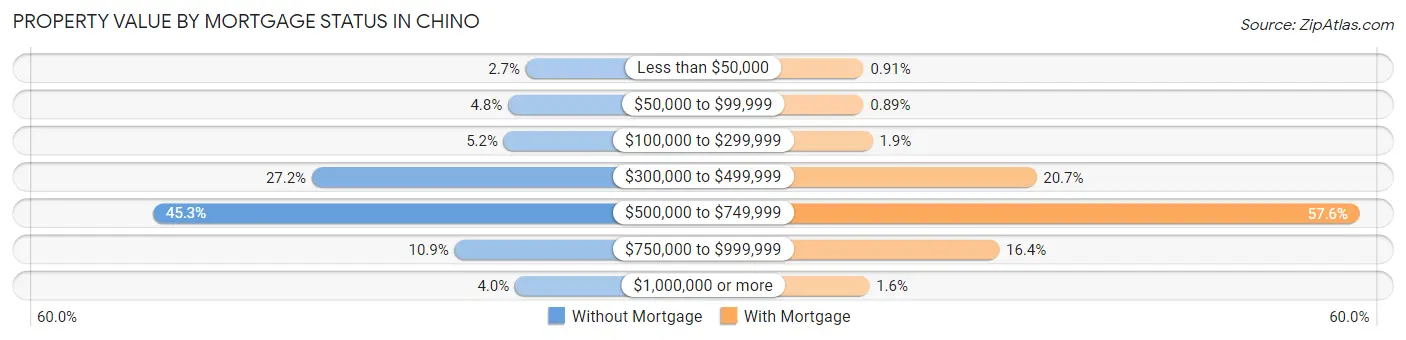
| Property Value | Without Mortgage | With Mortgage |
| Less than $50,000 | 118 (2.7%) | 113 (0.9%) |
| $50,000 to $99,999 | 207 (4.8%) | 111 (0.9%) |
| $100,000 to $299,999 | 228 (5.2%) | 241 (1.9%) |
| $300,000 to $499,999 | 1,183 (27.2%) | 2,575 (20.7%) |
| $500,000 to $749,999 | 1,975 (45.3%) | 7,183 (57.6%) |
| $750,000 to $999,999 | 473 (10.9%) | 2,045 (16.4%) |
| $1,000,000 or more | 172 (4.0%) | 195 (1.6%) |
| Total | 4,356 (100.0%) | 12,463 (100.0%) |
Household Income by Mortgage Status in Chino
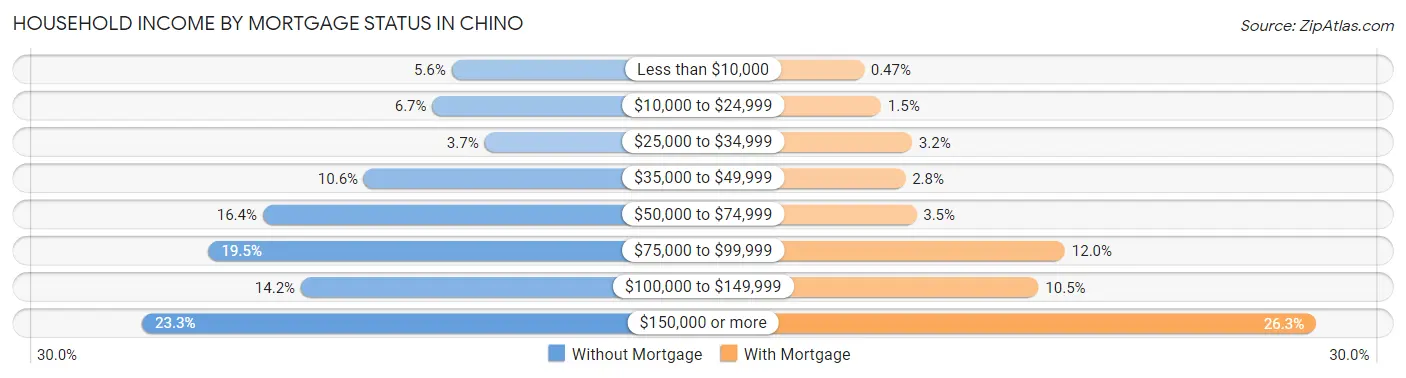
| Household Income | Without Mortgage | With Mortgage |
| Less than $10,000 | 244 (5.6%) | 58 (0.5%) |
| $10,000 to $24,999 | 292 (6.7%) | 181 (1.5%) |
| $25,000 to $34,999 | 162 (3.7%) | 401 (3.2%) |
| $35,000 to $49,999 | 462 (10.6%) | 354 (2.8%) |
| $50,000 to $74,999 | 714 (16.4%) | 432 (3.5%) |
| $75,000 to $99,999 | 849 (19.5%) | 1,490 (12.0%) |
| $100,000 to $149,999 | 619 (14.2%) | 1,303 (10.4%) |
| $150,000 or more | 1,014 (23.3%) | 3,279 (26.3%) |
| Total | 4,356 (100.0%) | 12,463 (100.0%) |
Property Value to Household Income Ratio in Chino
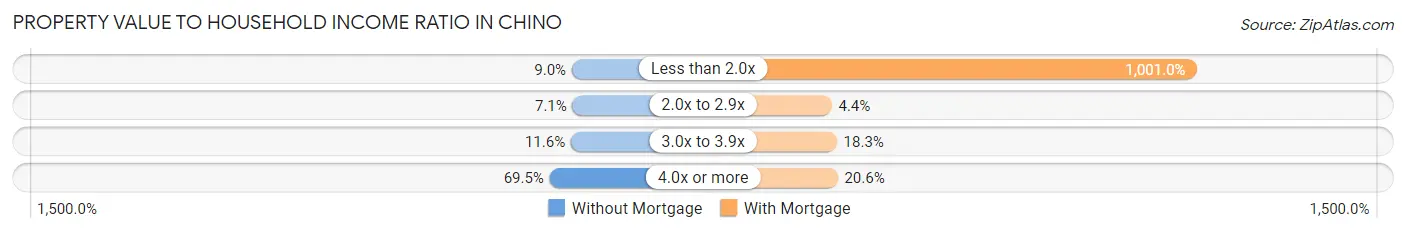
| Value-to-Income Ratio | Without Mortgage | With Mortgage |
| Less than 2.0x | 394 (9.0%) | 124,753 (1,001.0%) |
| 2.0x to 2.9x | 309 (7.1%) | 553 (4.4%) |
| 3.0x to 3.9x | 504 (11.6%) | 2,283 (18.3%) |
| 4.0x or more | 3,028 (69.5%) | 2,567 (20.6%) |
| Total | 4,356 (100.0%) | 12,463 (100.0%) |
Real Estate Taxes by Mortgage Status in Chino
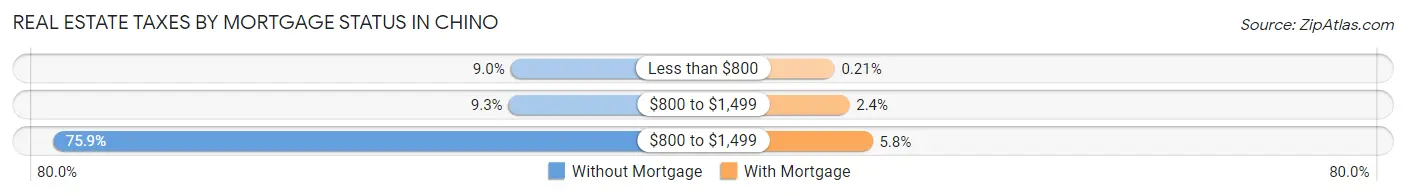
| Property Taxes | Without Mortgage | With Mortgage |
| Less than $800 | 392 (9.0%) | 26 (0.2%) |
| $800 to $1,499 | 405 (9.3%) | 295 (2.4%) |
| $800 to $1,499 | 3,305 (75.9%) | 718 (5.8%) |
| Total | 4,356 (100.0%) | 12,463 (100.0%) |
Health & Disability in Chino
Health Insurance Coverage by Age in Chino
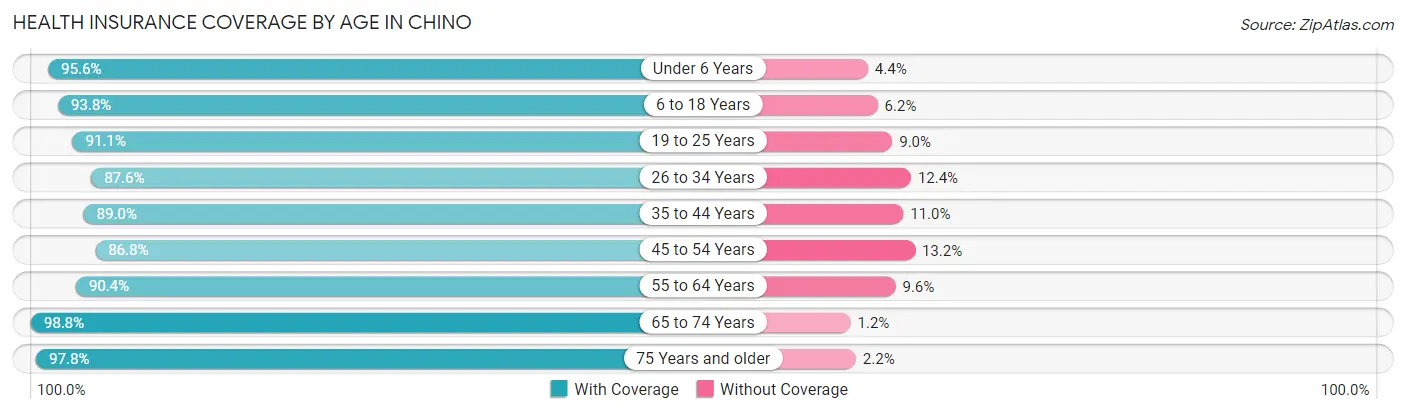
| Age Bracket | With Coverage | Without Coverage |
| Under 6 Years | 6,330 (95.6%) | 291 (4.4%) |
| 6 to 18 Years | 14,253 (93.8%) | 946 (6.2%) |
| 19 to 25 Years | 6,725 (91.0%) | 661 (8.9%) |
| 26 to 34 Years | 10,341 (87.6%) | 1,468 (12.4%) |
| 35 to 44 Years | 11,746 (89.0%) | 1,453 (11.0%) |
| 45 to 54 Years | 9,810 (86.8%) | 1,489 (13.2%) |
| 55 to 64 Years | 9,453 (90.4%) | 999 (9.6%) |
| 65 to 74 Years | 6,779 (98.8%) | 81 (1.2%) |
| 75 Years and older | 3,579 (97.8%) | 79 (2.2%) |
| Total | 79,016 (91.4%) | 7,467 (8.6%) |
Health Insurance Coverage by Citizenship Status in Chino

| Citizenship Status | With Coverage | Without Coverage |
| Native Born | 6,330 (95.6%) | 291 (4.4%) |
| Foreign Born, Citizen | 14,253 (93.8%) | 946 (6.2%) |
| Foreign Born, not a Citizen | 6,725 (91.0%) | 661 (8.9%) |
Health Insurance Coverage by Household Income in Chino
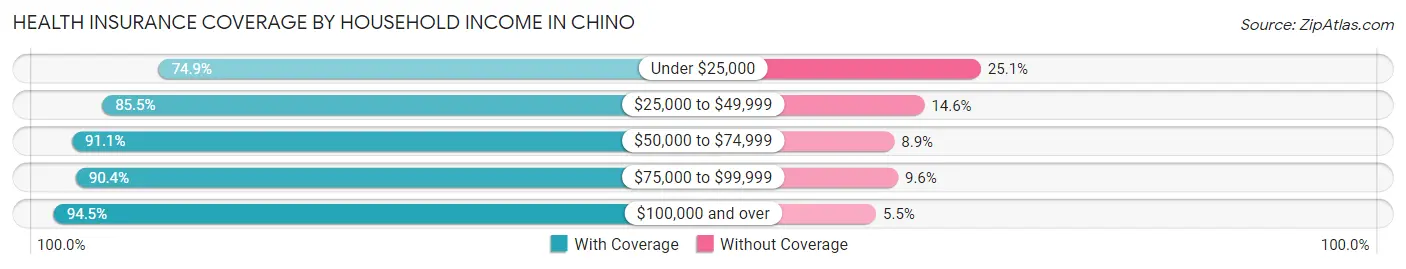
| Household Income | With Coverage | Without Coverage |
| Under $25,000 | 4,368 (74.9%) | 1,466 (25.1%) |
| $25,000 to $49,999 | 6,546 (85.5%) | 1,115 (14.5%) |
| $50,000 to $74,999 | 11,487 (91.1%) | 1,124 (8.9%) |
| $75,000 to $99,999 | 10,039 (90.4%) | 1,066 (9.6%) |
| $100,000 and over | 46,229 (94.5%) | 2,687 (5.5%) |
Public vs Private Health Insurance Coverage by Age in Chino
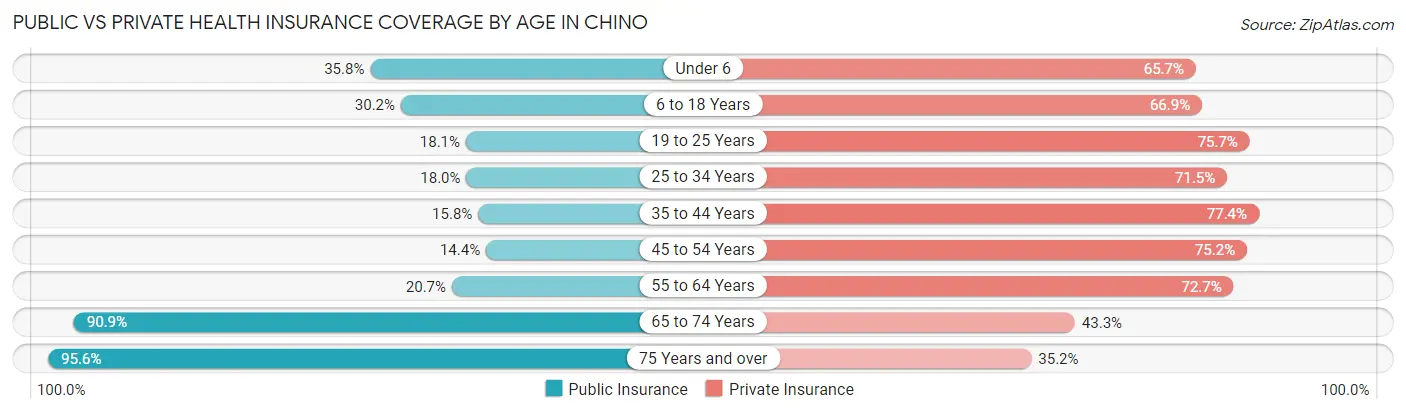
| Age Bracket | Public Insurance | Private Insurance |
| Under 6 | 2,373 (35.8%) | 4,350 (65.7%) |
| 6 to 18 Years | 4,584 (30.2%) | 10,160 (66.8%) |
| 19 to 25 Years | 1,337 (18.1%) | 5,592 (75.7%) |
| 25 to 34 Years | 2,126 (18.0%) | 8,445 (71.5%) |
| 35 to 44 Years | 2,087 (15.8%) | 10,218 (77.4%) |
| 45 to 54 Years | 1,622 (14.4%) | 8,497 (75.2%) |
| 55 to 64 Years | 2,163 (20.7%) | 7,600 (72.7%) |
| 65 to 74 Years | 6,233 (90.9%) | 2,968 (43.3%) |
| 75 Years and over | 3,498 (95.6%) | 1,287 (35.2%) |
| Total | 26,023 (30.1%) | 59,117 (68.4%) |
Disability Status by Sex by Age in Chino
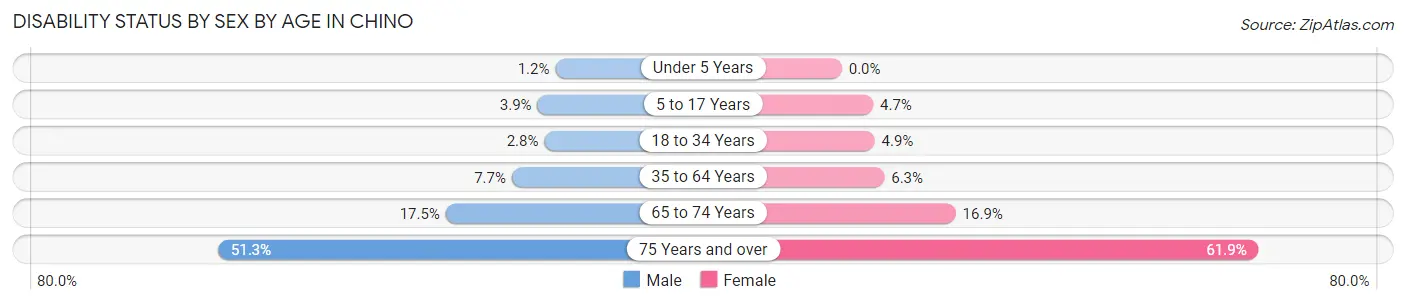
| Age Bracket | Male | Female |
| Under 5 Years | 40 (1.2%) | 0 (0.0%) |
| 5 to 17 Years | 291 (3.8%) | 357 (4.6%) |
| 18 to 34 Years | 278 (2.8%) | 493 (4.9%) |
| 35 to 64 Years | 1,325 (7.6%) | 1,112 (6.3%) |
| 65 to 74 Years | 562 (17.5%) | 616 (16.9%) |
| 75 Years and over | 846 (51.3%) | 1,243 (61.9%) |
Disability Class by Sex by Age in Chino
Disability Class: Hearing Difficulty
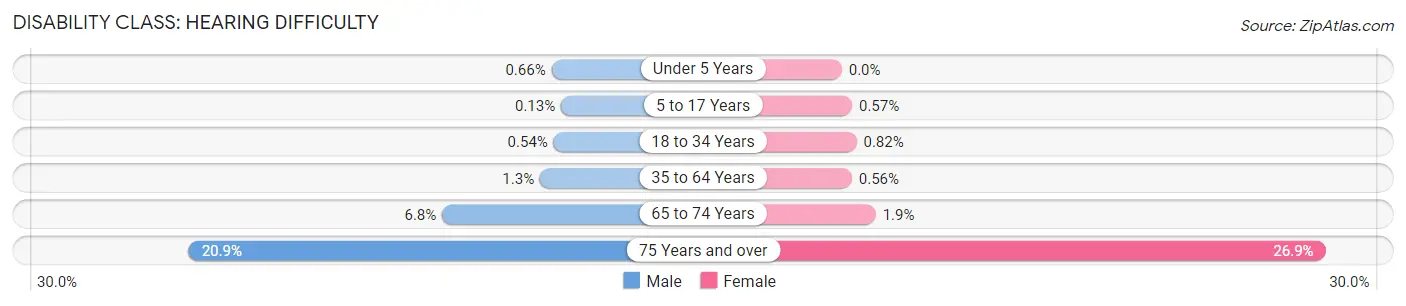
| Age Bracket | Male | Female |
| Under 5 Years | 22 (0.7%) | 0 (0.0%) |
| 5 to 17 Years | 10 (0.1%) | 44 (0.6%) |
| 18 to 34 Years | 53 (0.5%) | 83 (0.8%) |
| 35 to 64 Years | 225 (1.3%) | 98 (0.6%) |
| 65 to 74 Years | 217 (6.8%) | 69 (1.9%) |
| 75 Years and over | 344 (20.9%) | 541 (26.9%) |
Disability Class: Vision Difficulty
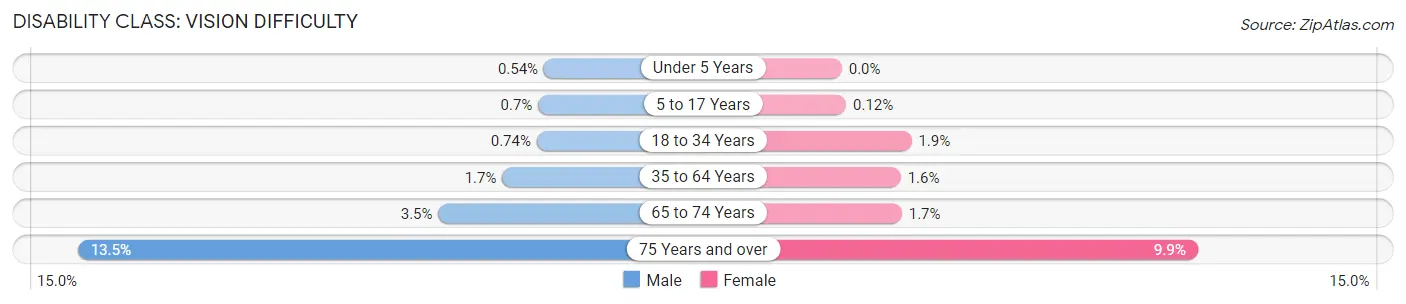
| Age Bracket | Male | Female |
| Under 5 Years | 18 (0.5%) | 0 (0.0%) |
| 5 to 17 Years | 53 (0.7%) | 9 (0.1%) |
| 18 to 34 Years | 73 (0.7%) | 196 (1.9%) |
| 35 to 64 Years | 295 (1.7%) | 289 (1.6%) |
| 65 to 74 Years | 112 (3.5%) | 61 (1.7%) |
| 75 Years and over | 223 (13.5%) | 199 (9.9%) |
Disability Class: Cognitive Difficulty
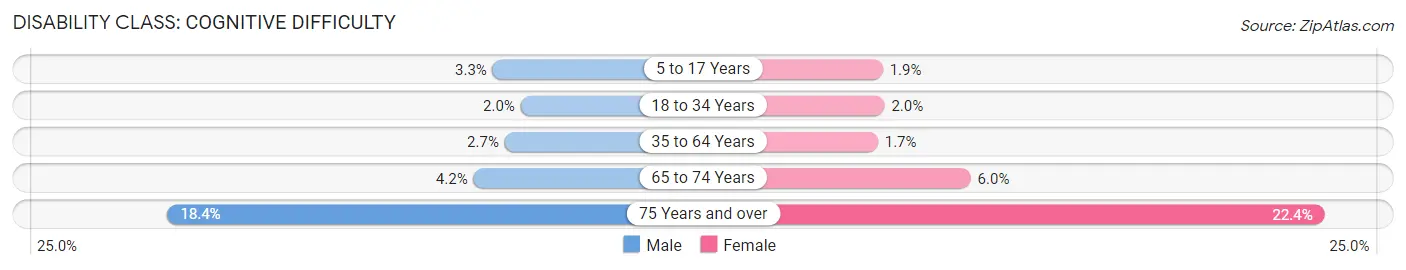
| Age Bracket | Male | Female |
| 5 to 17 Years | 248 (3.3%) | 146 (1.9%) |
| 18 to 34 Years | 194 (2.0%) | 200 (2.0%) |
| 35 to 64 Years | 472 (2.7%) | 294 (1.7%) |
| 65 to 74 Years | 134 (4.2%) | 218 (6.0%) |
| 75 Years and over | 303 (18.4%) | 450 (22.4%) |
Disability Class: Ambulatory Difficulty
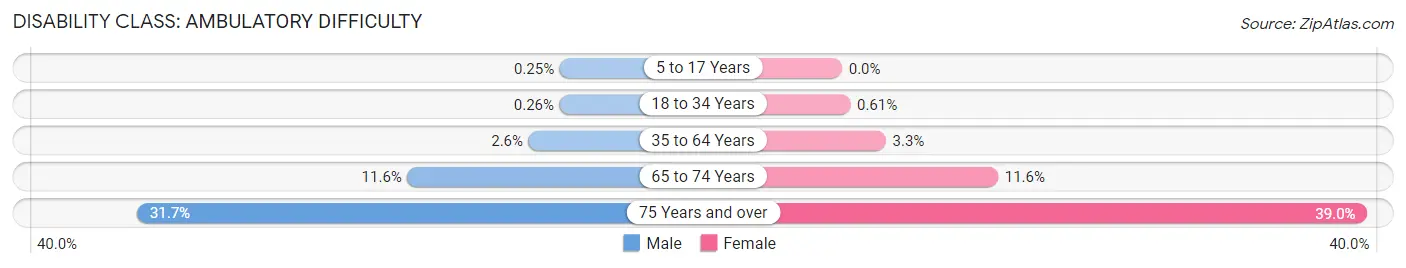
| Age Bracket | Male | Female |
| 5 to 17 Years | 19 (0.3%) | 0 (0.0%) |
| 18 to 34 Years | 26 (0.3%) | 62 (0.6%) |
| 35 to 64 Years | 444 (2.6%) | 572 (3.3%) |
| 65 to 74 Years | 372 (11.6%) | 422 (11.6%) |
| 75 Years and over | 522 (31.7%) | 784 (39.0%) |
Disability Class: Self-Care Difficulty
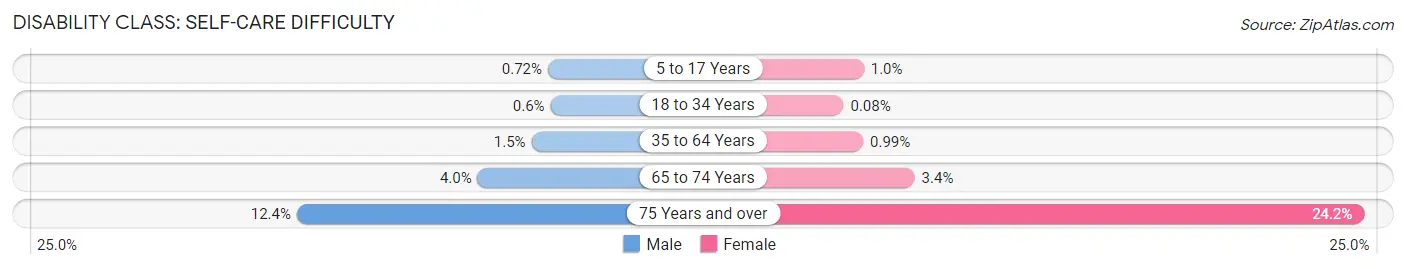
| Age Bracket | Male | Female |
| 5 to 17 Years | 54 (0.7%) | 78 (1.0%) |
| 18 to 34 Years | 59 (0.6%) | 8 (0.1%) |
| 35 to 64 Years | 257 (1.5%) | 175 (1.0%) |
| 65 to 74 Years | 128 (4.0%) | 123 (3.4%) |
| 75 Years and over | 204 (12.4%) | 487 (24.2%) |
Technology Access in Chino
Computing Device Access in Chino
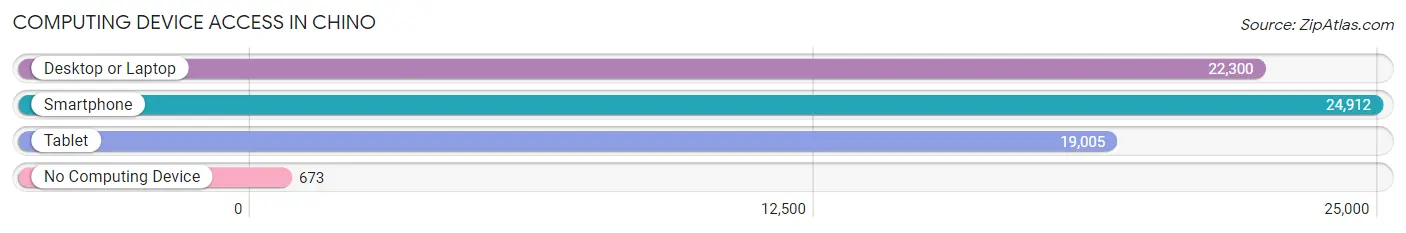
| Device Type | # Households | % Households |
| Desktop or Laptop | 22,300 | 84.5% |
| Smartphone | 24,912 | 94.4% |
| Tablet | 19,005 | 72.0% |
| No Computing Device | 673 | 2.5% |
| Total | 26,391 | 100.0% |
Internet Access in Chino
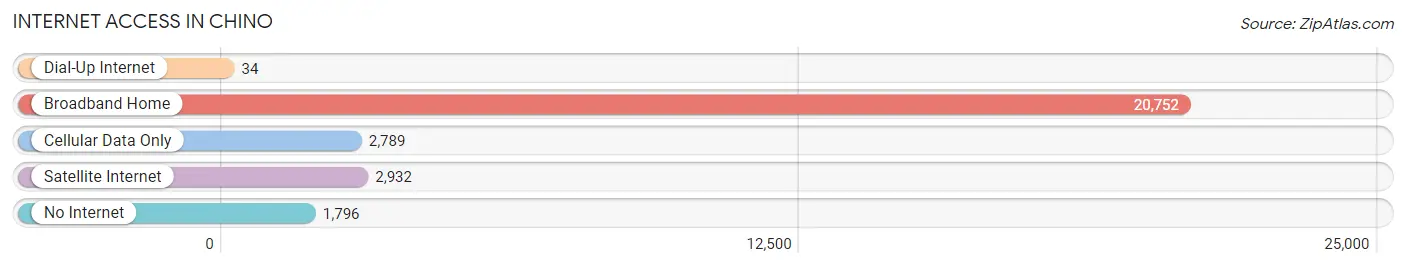
| Internet Type | # Households | % Households |
| Dial-Up Internet | 34 | 0.1% |
| Broadband Home | 20,752 | 78.6% |
| Cellular Data Only | 2,789 | 10.6% |
| Satellite Internet | 2,932 | 11.1% |
| No Internet | 1,796 | 6.8% |
| Total | 26,391 | 100.0% |
Chino Summary
Chino, California is a city located in San Bernardino County, California, United States. The city is located in the western part of the county, about 30 miles east of downtown Los Angeles. As of the 2010 census, the population of Chino was 77,983, making it the second-largest city in San Bernardino County.
Geography
Chino is located in the western part of San Bernardino County, about 30 miles east of downtown Los Angeles. The city is bordered by the cities of Chino Hills to the west, Ontario to the north, and Montclair to the east. The city is located in the Chino Valley, which is part of the Inland Empire region of Southern California. The city is situated at an elevation of 830 feet above sea level.
The city covers an area of approximately 24.5 square miles, of which 24.3 square miles is land and 0.2 square miles is water. The city is located in the Chino Valley, which is part of the Inland Empire region of Southern California. The city is situated at an elevation of 830 feet above sea level.
Climate
Chino has a Mediterranean climate, with hot, dry summers and mild, wet winters. The average annual temperature is 68°F, with an average high of 86°F in July and an average low of 50°F in January. The average annual precipitation is 13.5 inches, with an average of 2.5 inches in July and an average of 0.5 inches in January.
Demographics
As of the 2010 census, the population of Chino was 77,983, making it the second-largest city in San Bernardino County. The racial makeup of the city was 57.2% White, 4.2% African American, 1.2% Native American, 8.2% Asian, 0.3% Pacific Islander, 25.2% from other races, and 3.7% from two or more races. Hispanic or Latino of any race were 51.2% of the population.
The median household income in Chino was $60,945 in 2018, and the median family income was $68,945. The per capita income in Chino was $25,945 in 2018.
Economy
Chino is home to several major employers, including Chino Valley Medical Center, Chino Valley Unified School District, and Chino Valley Fire District. The city is also home to several industrial and manufacturing companies, including Chino Valley Industries, Chino Valley Foods, and Chino Valley Plastics.
The city is served by the Chino Valley Unified School District, which operates several elementary, middle, and high schools. The city is also home to several higher education institutions, including Chaffey College, California State Polytechnic University, Pomona, and the University of La Verne.
History
Chino was founded in 1887 by two brothers, John and George Chaffey. The brothers purchased the land from the Mexican government and established a large ranch, which they named the Chino Ranch. The ranch was used for cattle and sheep grazing, and the brothers also planted vineyards and orchards.
In the early 1900s, the Chino Ranch was subdivided and sold to settlers, and the city of Chino was officially incorporated in 1910. The city grew rapidly in the early 20th century, and by the 1950s, it had become a major agricultural center.
Today, Chino is a thriving city with a diverse economy and a vibrant cultural scene. The city is home to several parks and recreational facilities, as well as a variety of shopping and dining options. The city is also home to several higher education institutions, making it an attractive destination for students and professionals alike.
Common Questions
What is Per Capita Income in Chino?
Per Capita income in Chino is $34,162.
What is the Median Family Income in Chino?
Median Family Income in Chino is $106,544.
What is the Median Household income in Chino?
Median Household Income in Chino is $99,385.
What is Income or Wage Gap in Chino?
Income or Wage Gap in Chino is 30.3%.
Women in Chino earn 69.7 cents for every dollar earned by a man.
What is Family Income Deficit in Chino?
Family Income Deficit in Chino is $11,139.
Families that are below poverty line in Chino earn $11,139 less on average than the poverty threshold level.
What is Inequality or Gini Index in Chino?
Inequality or Gini Index in Chino is 0.39.
What is the Total Population of Chino?
Total Population of Chino is 91,008.
What is the Total Male Population of Chino?
Total Male Population of Chino is 46,346.
What is the Total Female Population of Chino?
Total Female Population of Chino is 44,662.
What is the Ratio of Males per 100 Females in Chino?
There are 103.77 Males per 100 Females in Chino.
What is the Ratio of Females per 100 Males in Chino?
There are 96.37 Females per 100 Males in Chino.
What is the Median Population Age in Chino?
Median Population Age in Chino is 36.9 Years.
What is the Average Family Size in Chino
Average Family Size in Chino is 3.6 People.
What is the Average Household Size in Chino
Average Household Size in Chino is 3.3 People.
How Large is the Labor Force in Chino?
There are 45,406 People in the Labor Forcein in Chino.
What is the Percentage of People in the Labor Force in Chino?
62.9% of People are in the Labor Force in Chino.
What is the Unemployment Rate in Chino?
Unemployment Rate in Chino is 5.5%.