Anaheim, CA Map & Demographics
Anaheim Map
Anaheim Overview
$35,331
PER CAPITA INCOME
$95,320
AVG FAMILY INCOME
$88,538
AVG HOUSEHOLD INCOME
23.7%
WAGE / INCOME GAP [ % ]
76.3¢/ $1
WAGE / INCOME GAP [ $ ]
$11,416
FAMILY INCOME DEFICIT
0.44
INEQUALITY / GINI INDEX
347,111
TOTAL POPULATION
169,425
MALE POPULATION
177,686
FEMALE POPULATION
95.35
MALES / 100 FEMALES
104.88
FEMALES / 100 MALES
35.4
MEDIAN AGE
3.8
AVG FAMILY SIZE
3.3
AVG HOUSEHOLD SIZE
186,932
LABOR FORCE [ PEOPLE ]
67.4%
PERCENT IN LABOR FORCE
5.4%
UNEMPLOYMENT RATE
Income in Anaheim
Income Overview in Anaheim
Per Capita Income in Anaheim is $35,331, while median incomes of families and households are $95,320 and $88,538 respectively.
| Characteristic | Number | Measure |
| Per Capita Income | 347,111 | $35,331 |
| Median Family Income | 75,883 | $95,320 |
| Mean Family Income | 75,883 | $120,150 |
| Median Household Income | 104,671 | $88,538 |
| Mean Household Income | 104,671 | $112,640 |
| Income Deficit | 75,883 | $11,416 |
| Wage / Income Gap (%) | 347,111 | 23.71% |
| Wage / Income Gap ($) | 347,111 | 76.29¢ per $1 |
| Gini / Inequality Index | 347,111 | 0.44 |
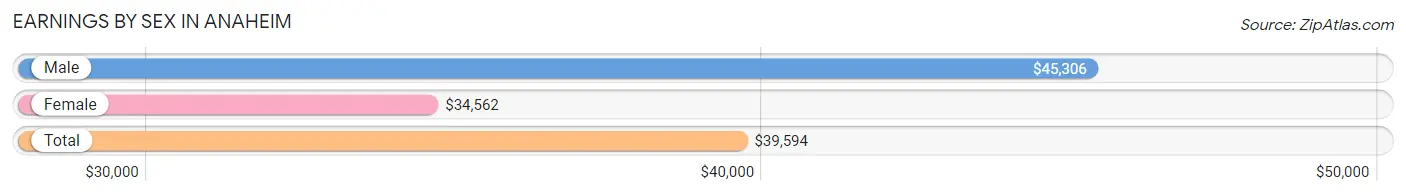
Earnings by Sex in Anaheim
Average Earnings in Anaheim are $39,594, $45,306 for men and $34,562 for women, a difference of 23.7%.
| Sex | Number | Average Earnings |
| Male | 100,877 (53.4%) | $45,306 |
| Female | 88,013 (46.6%) | $34,562 |
| Total | 188,890 (100.0%) | $39,594 |
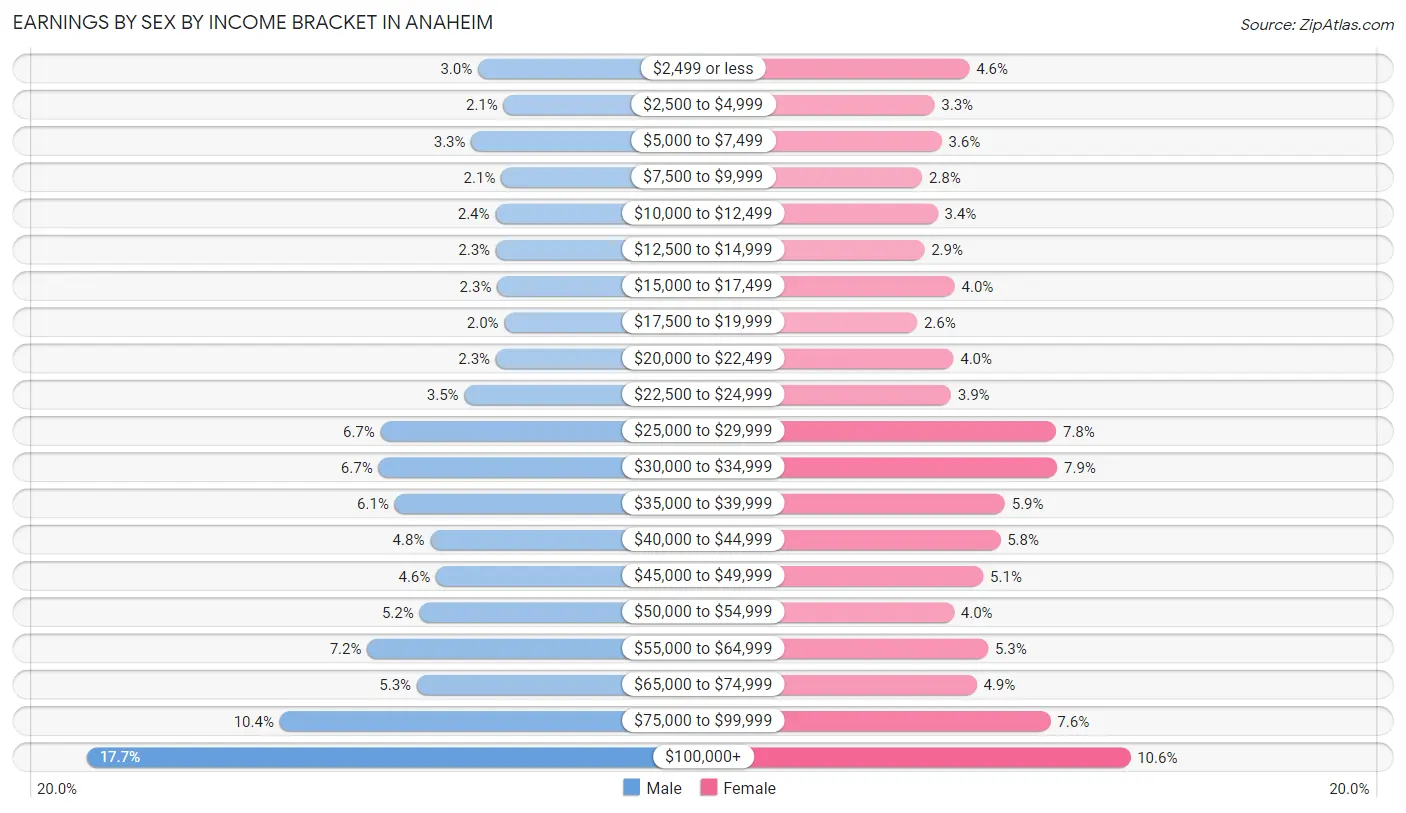
Earnings by Sex by Income Bracket in Anaheim
The most common earnings brackets in Anaheim are $100,000+ for men (17,829 | 17.7%) and $100,000+ for women (9,347 | 10.6%).
| Income | Male | Female |
| $2,499 or less | 3,034 (3.0%) | 4,040 (4.6%) |
| $2,500 to $4,999 | 2,064 (2.1%) | 2,891 (3.3%) |
| $5,000 to $7,499 | 3,291 (3.3%) | 3,122 (3.5%) |
| $7,500 to $9,999 | 2,154 (2.1%) | 2,481 (2.8%) |
| $10,000 to $12,499 | 2,378 (2.4%) | 2,991 (3.4%) |
| $12,500 to $14,999 | 2,361 (2.3%) | 2,556 (2.9%) |
| $15,000 to $17,499 | 2,310 (2.3%) | 3,554 (4.0%) |
| $17,500 to $19,999 | 2,038 (2.0%) | 2,313 (2.6%) |
| $20,000 to $22,499 | 2,363 (2.3%) | 3,511 (4.0%) |
| $22,500 to $24,999 | 3,547 (3.5%) | 3,435 (3.9%) |
| $25,000 to $29,999 | 6,714 (6.7%) | 6,902 (7.8%) |
| $30,000 to $34,999 | 6,799 (6.7%) | 6,932 (7.9%) |
| $35,000 to $39,999 | 6,186 (6.1%) | 5,207 (5.9%) |
| $40,000 to $44,999 | 4,847 (4.8%) | 5,058 (5.8%) |
| $45,000 to $49,999 | 4,617 (4.6%) | 4,499 (5.1%) |
| $50,000 to $54,999 | 5,245 (5.2%) | 3,529 (4.0%) |
| $55,000 to $64,999 | 7,225 (7.2%) | 4,653 (5.3%) |
| $65,000 to $74,999 | 5,347 (5.3%) | 4,277 (4.9%) |
| $75,000 to $99,999 | 10,528 (10.4%) | 6,715 (7.6%) |
| $100,000+ | 17,829 (17.7%) | 9,347 (10.6%) |
| Total | 100,877 (100.0%) | 88,013 (100.0%) |
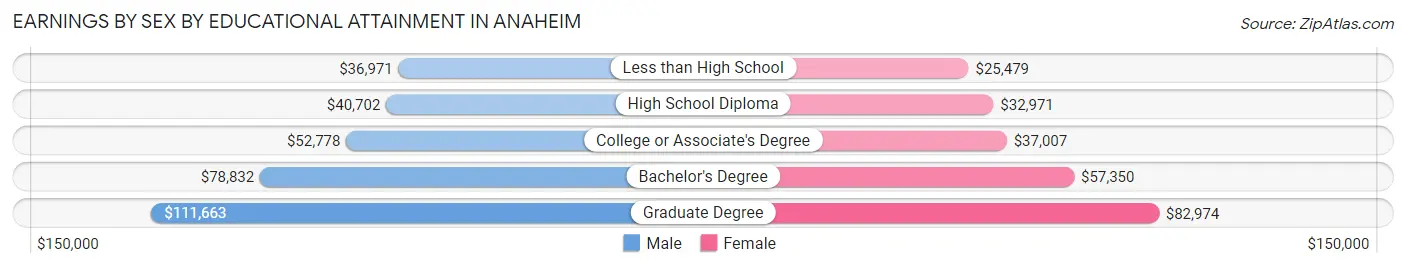
Earnings by Sex by Educational Attainment in Anaheim
Average earnings in Anaheim are $51,256 for men and $39,516 for women, a difference of 22.9%. Men with an educational attainment of graduate degree enjoy the highest average annual earnings of $111,663, while those with less than high school education earn the least with $36,971. Women with an educational attainment of graduate degree earn the most with the average annual earnings of $82,974, while those with less than high school education have the smallest earnings of $25,479.
| Educational Attainment | Male Income | Female Income |
| Less than High School | $36,971 | $25,479 |
| High School Diploma | $40,702 | $32,971 |
| College or Associate's Degree | $52,778 | $37,007 |
| Bachelor's Degree | $78,832 | $57,350 |
| Graduate Degree | $111,663 | $82,974 |
| Total | $51,256 | $39,516 |
Family Income in Anaheim
Family Income Brackets in Anaheim
According to the Anaheim family income data, there are 15,556 families falling into the $100,000 to $149,999 income range, which is the most common income bracket and makes up 20.5% of all families. Conversely, the $10,000 to $14,999 income bracket is the least frequent group with only 1,442 families (1.9%) belonging to this category.
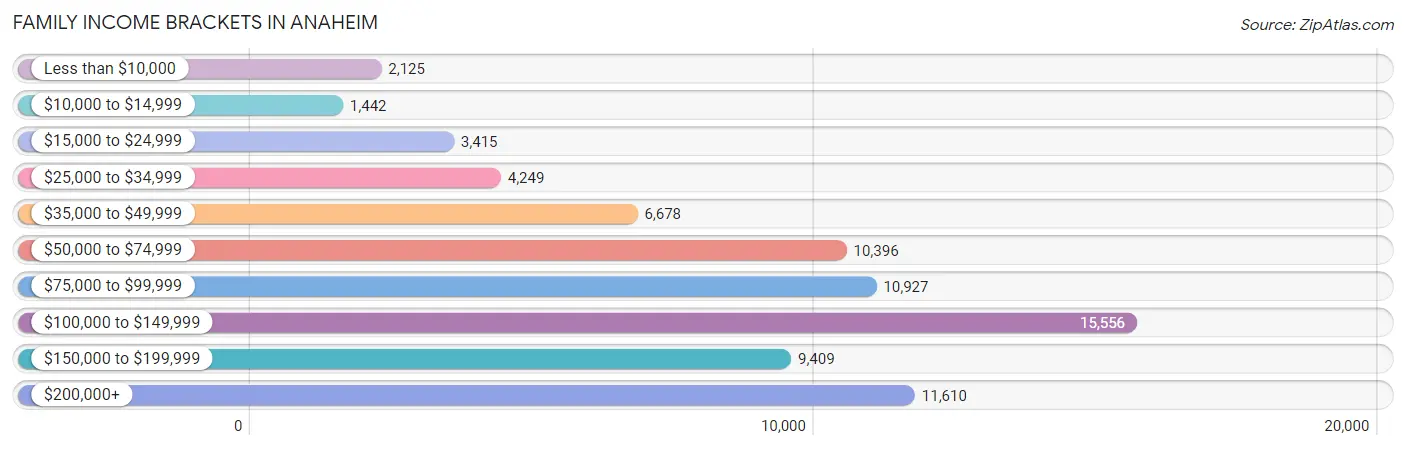
| Income Bracket | # Families | % Families |
| Less than $10,000 | 2,125 | 2.8% |
| $10,000 to $14,999 | 1,442 | 1.9% |
| $15,000 to $24,999 | 3,415 | 4.5% |
| $25,000 to $34,999 | 4,249 | 5.6% |
| $35,000 to $49,999 | 6,678 | 8.8% |
| $50,000 to $74,999 | 10,396 | 13.7% |
| $75,000 to $99,999 | 10,927 | 14.4% |
| $100,000 to $149,999 | 15,556 | 20.5% |
| $150,000 to $199,999 | 9,409 | 12.4% |
| $200,000+ | 11,610 | 15.3% |
Family Income by Famaliy Size in Anaheim
7+ person families (3,703 | 4.9%) account for the highest median family income in Anaheim with $141,567 per family, while 2-person families (23,793 | 31.4%) have the highest median income of $40,039 per family member.
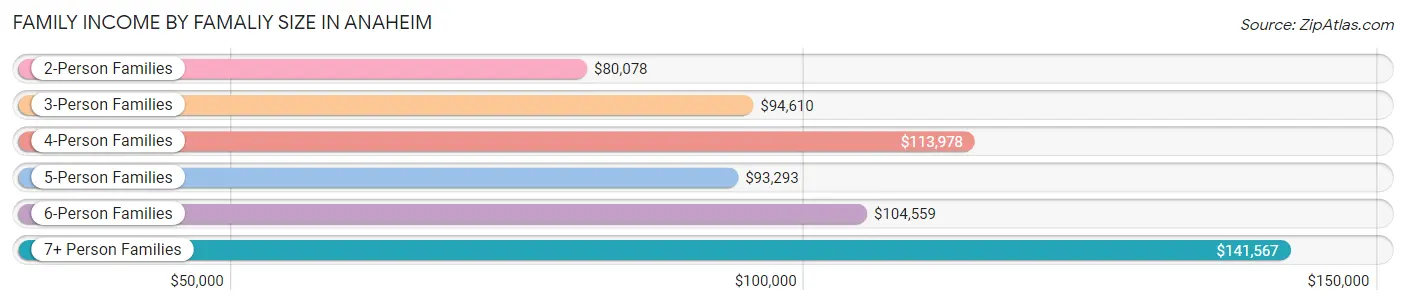
| Income Bracket | # Families | Median Income |
| 2-Person Families | 23,793 (31.4%) | $80,078 |
| 3-Person Families | 17,289 (22.8%) | $94,610 |
| 4-Person Families | 16,233 (21.4%) | $113,978 |
| 5-Person Families | 9,991 (13.2%) | $93,293 |
| 6-Person Families | 4,874 (6.4%) | $104,559 |
| 7+ Person Families | 3,703 (4.9%) | $141,567 |
| Total | 75,883 (100.0%) | $95,320 |
Family Income by Number of Earners in Anaheim
The median family income in Anaheim is $95,320, with families comprising 3+ earners (17,585) having the highest median family income of $141,708, while families with no earners (6,454) have the lowest median family income of $35,493, accounting for 23.2% and 8.5% of families, respectively.
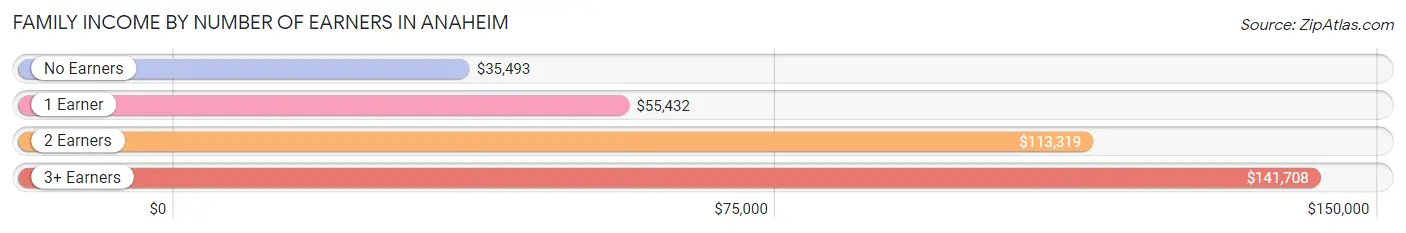
| Number of Earners | # Families | Median Income |
| No Earners | 6,454 (8.5%) | $35,493 |
| 1 Earner | 21,329 (28.1%) | $55,432 |
| 2 Earners | 30,515 (40.2%) | $113,319 |
| 3+ Earners | 17,585 (23.2%) | $141,708 |
| Total | 75,883 (100.0%) | $95,320 |
Household Income in Anaheim
Household Income Brackets in Anaheim
With 20,306 households falling in the category, the $100,000 to $149,999 income range is the most frequent in Anaheim, accounting for 19.4% of all households. In contrast, only 3,454 households (3.3%) fall into the $10,000 to $14,999 income bracket, making it the least populous group.
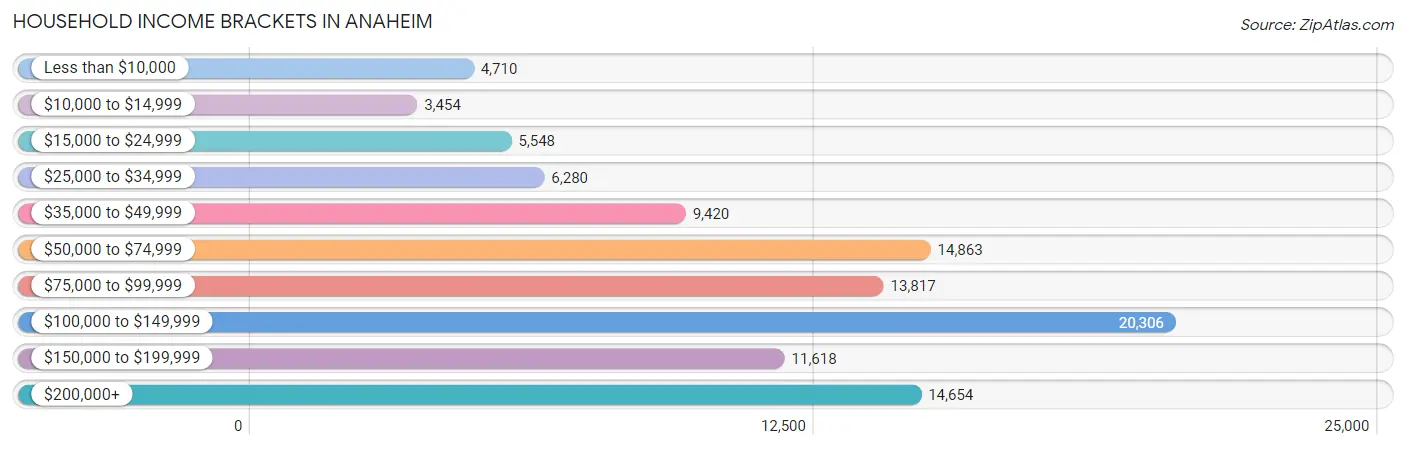
| Income Bracket | # Households | % Households |
| Less than $10,000 | 4,710 | 4.5% |
| $10,000 to $14,999 | 3,454 | 3.3% |
| $15,000 to $24,999 | 5,548 | 5.3% |
| $25,000 to $34,999 | 6,280 | 6.0% |
| $35,000 to $49,999 | 9,420 | 9.0% |
| $50,000 to $74,999 | 14,863 | 14.2% |
| $75,000 to $99,999 | 13,817 | 13.2% |
| $100,000 to $149,999 | 20,306 | 19.4% |
| $150,000 to $199,999 | 11,618 | 11.1% |
| $200,000+ | 14,654 | 14.0% |
Household Income by Householder Age in Anaheim
The median household income in Anaheim is $88,538, with the highest median household income of $102,438 found in the 45 to 64 years age bracket for the primary householder. A total of 42,088 households (40.2%) fall into this category. Meanwhile, the 65+ years age bracket for the primary householder has the lowest median household income of $58,654, with 21,609 households (20.6%) in this group.
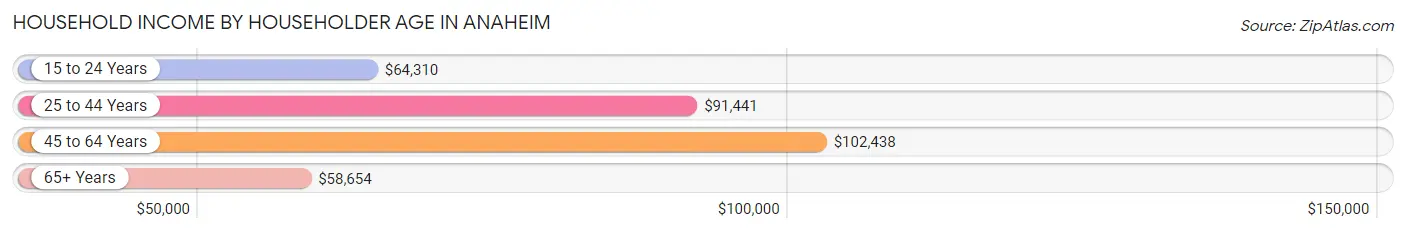
| Income Bracket | # Households | Median Income |
| 15 to 24 Years | 3,296 (3.2%) | $64,310 |
| 25 to 44 Years | 37,678 (36.0%) | $91,441 |
| 45 to 64 Years | 42,088 (40.2%) | $102,438 |
| 65+ Years | 21,609 (20.6%) | $58,654 |
| Total | 104,671 (100.0%) | $88,538 |
Poverty in Anaheim
Income Below Poverty by Sex and Age in Anaheim
With 11.2% poverty level for males and 14.0% for females among the residents of Anaheim, 5 year old males and 15 year old females are the most vulnerable to poverty, with 546 males (23.4%) and 651 females (23.4%) in their respective age groups living below the poverty level.
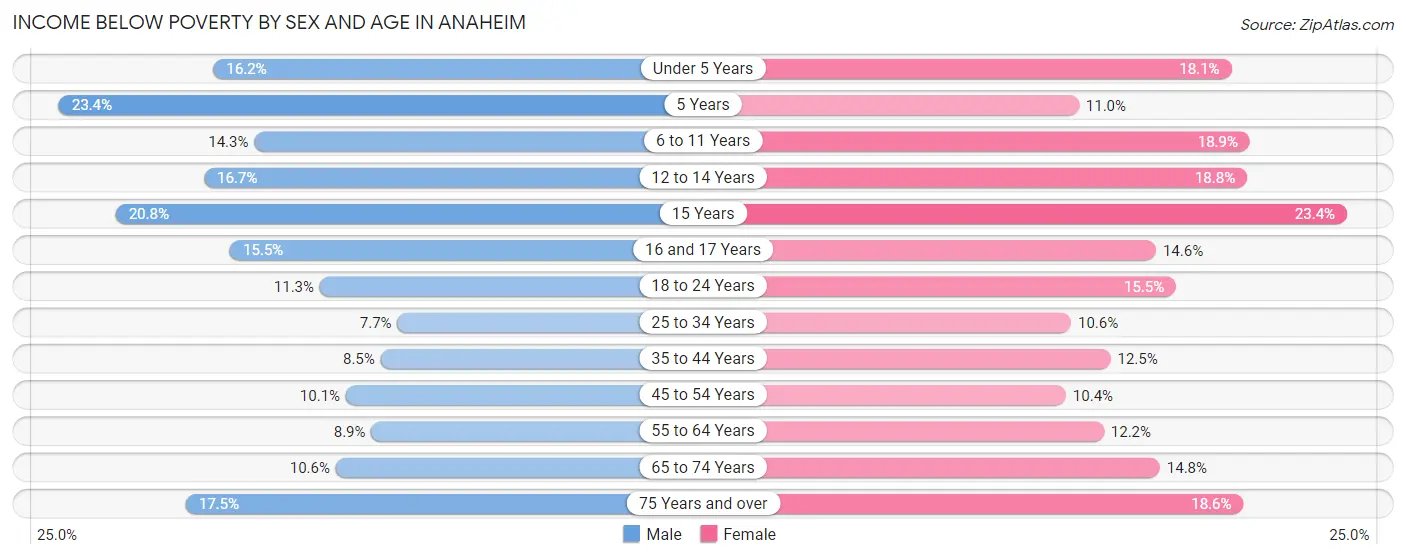
| Age Bracket | Male | Female |
| Under 5 Years | 1,740 (16.2%) | 1,815 (18.1%) |
| 5 Years | 546 (23.4%) | 212 (11.0%) |
| 6 to 11 Years | 1,825 (14.3%) | 2,323 (18.9%) |
| 12 to 14 Years | 1,121 (16.7%) | 1,337 (18.8%) |
| 15 Years | 369 (20.8%) | 651 (23.4%) |
| 16 and 17 Years | 807 (15.5%) | 652 (14.6%) |
| 18 to 24 Years | 1,891 (11.3%) | 2,859 (15.5%) |
| 25 to 34 Years | 2,155 (7.7%) | 2,952 (10.6%) |
| 35 to 44 Years | 2,001 (8.5%) | 2,837 (12.5%) |
| 45 to 54 Years | 2,260 (10.1%) | 2,399 (10.4%) |
| 55 to 64 Years | 1,759 (8.9%) | 2,583 (12.2%) |
| 65 to 74 Years | 1,163 (10.6%) | 1,956 (14.8%) |
| 75 Years and over | 1,182 (17.5%) | 1,916 (18.6%) |
| Total | 18,819 (11.2%) | 24,492 (14.0%) |
Income Above Poverty by Sex and Age in Anaheim
According to the poverty statistics in Anaheim, males aged 25 to 34 years and females aged 45 to 54 years are the age groups that are most secure financially, with 92.3% of males and 89.6% of females in these age groups living above the poverty line.
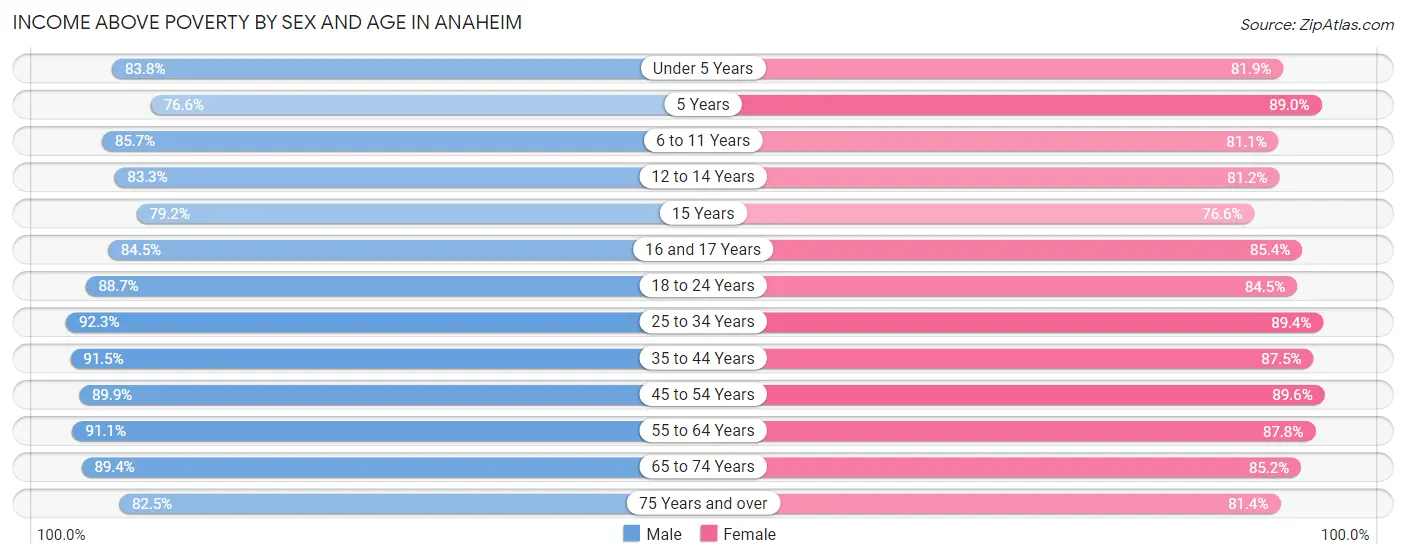
| Age Bracket | Male | Female |
| Under 5 Years | 8,973 (83.8%) | 8,223 (81.9%) |
| 5 Years | 1,786 (76.6%) | 1,716 (89.0%) |
| 6 to 11 Years | 10,902 (85.7%) | 9,950 (81.1%) |
| 12 to 14 Years | 5,604 (83.3%) | 5,773 (81.2%) |
| 15 Years | 1,408 (79.2%) | 2,126 (76.6%) |
| 16 and 17 Years | 4,411 (84.5%) | 3,821 (85.4%) |
| 18 to 24 Years | 14,844 (88.7%) | 15,570 (84.5%) |
| 25 to 34 Years | 25,845 (92.3%) | 24,797 (89.4%) |
| 35 to 44 Years | 21,603 (91.5%) | 19,912 (87.5%) |
| 45 to 54 Years | 20,136 (89.9%) | 20,666 (89.6%) |
| 55 to 64 Years | 17,988 (91.1%) | 18,662 (87.8%) |
| 65 to 74 Years | 9,851 (89.4%) | 11,293 (85.2%) |
| 75 Years and over | 5,564 (82.5%) | 8,367 (81.4%) |
| Total | 148,915 (88.8%) | 150,876 (86.0%) |
Income Below Poverty Among Married-Couple Families in Anaheim
The poverty statistics for married-couple families in Anaheim show that 6.1% or 3,163 of the total 51,871 families live below the poverty line. Families with 5 or more children have the highest poverty rate of 31.5%, comprising of 168 families. On the other hand, families with no children have the lowest poverty rate of 4.1%, which includes 1,064 families.
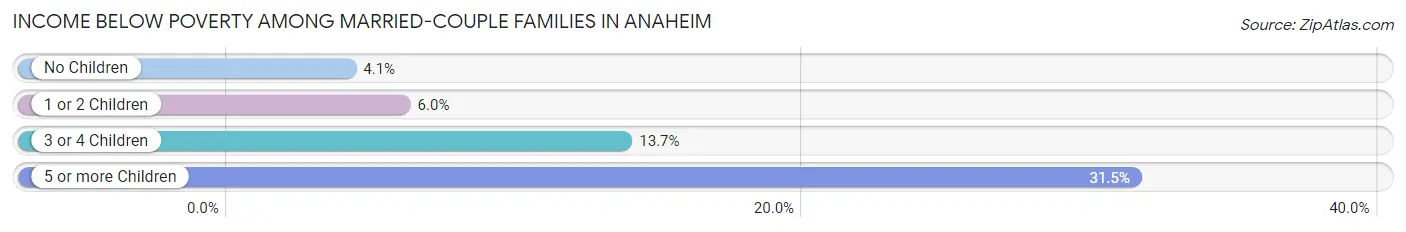
| Children | Above Poverty | Below Poverty |
| No Children | 24,777 (95.9%) | 1,064 (4.1%) |
| 1 or 2 Children | 19,110 (94.0%) | 1,222 (6.0%) |
| 3 or 4 Children | 4,455 (86.3%) | 709 (13.7%) |
| 5 or more Children | 366 (68.5%) | 168 (31.5%) |
| Total | 48,708 (93.9%) | 3,163 (6.1%) |
Income Below Poverty Among Single-Parent Households in Anaheim
According to the poverty data in Anaheim, 11.6% or 922 single-father households and 18.8% or 3,025 single-mother households are living below the poverty line. Among single-father households, those with 3 or 4 children have the highest poverty rate, with 320 households (36.9%) experiencing poverty. Likewise, among single-mother households, those with 5 or more children have the highest poverty rate, with 151 households (81.2%) falling below the poverty line.
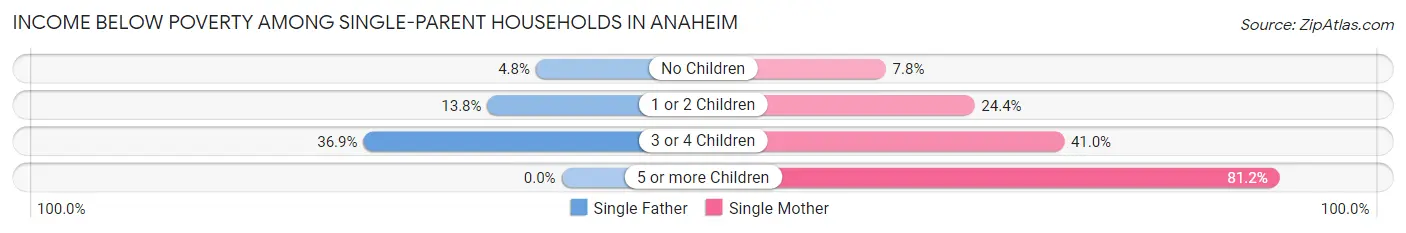
| Children | Single Father | Single Mother |
| No Children | 195 (4.8%) | 587 (7.8%) |
| 1 or 2 Children | 407 (13.8%) | 1,695 (24.3%) |
| 3 or 4 Children | 320 (36.9%) | 592 (41.0%) |
| 5 or more Children | 0 (0.0%) | 151 (81.2%) |
| Total | 922 (11.6%) | 3,025 (18.8%) |
Income Below Poverty Among Married-Couple vs Single-Parent Households in Anaheim
The poverty data for Anaheim shows that 3,163 of the married-couple family households (6.1%) and 3,947 of the single-parent households (16.4%) are living below the poverty level. Within the married-couple family households, those with 5 or more children have the highest poverty rate, with 168 households (31.5%) falling below the poverty line. Among the single-parent households, those with 5 or more children have the highest poverty rate, with 151 household (73.7%) living below poverty.
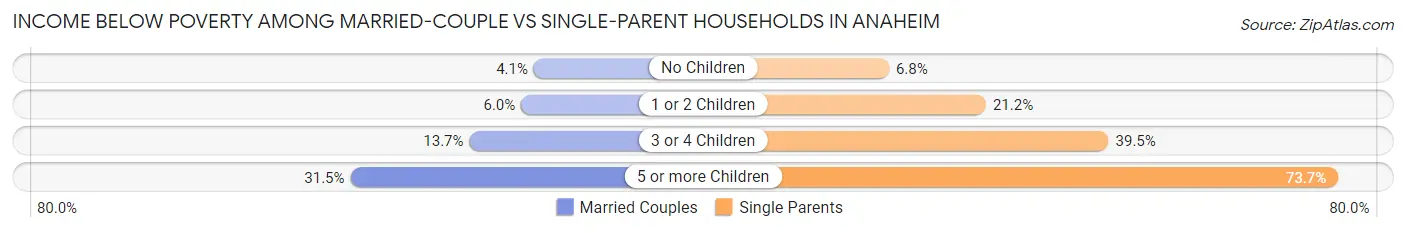
| Children | Married-Couple Families | Single-Parent Households |
| No Children | 1,064 (4.1%) | 782 (6.8%) |
| 1 or 2 Children | 1,222 (6.0%) | 2,102 (21.2%) |
| 3 or 4 Children | 709 (13.7%) | 912 (39.5%) |
| 5 or more Children | 168 (31.5%) | 151 (73.7%) |
| Total | 3,163 (6.1%) | 3,947 (16.4%) |
Race in Anaheim
The most populous races in Anaheim are Hispanic or Latino (185,162 | 53.3%), White / Caucasian (167,094 | 48.1%), and Asian (61,068 | 17.6%).
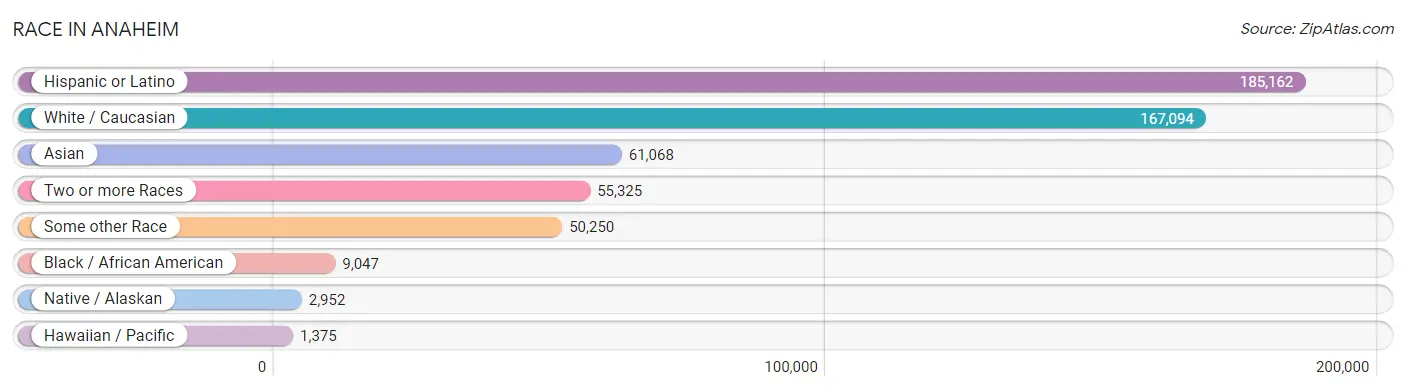
| Race | # Population | % Population |
| Asian | 61,068 | 17.6% |
| Black / African American | 9,047 | 2.6% |
| Hawaiian / Pacific | 1,375 | 0.4% |
| Hispanic or Latino | 185,162 | 53.3% |
| Native / Alaskan | 2,952 | 0.9% |
| White / Caucasian | 167,094 | 48.1% |
| Two or more Races | 55,325 | 15.9% |
| Some other Race | 50,250 | 14.5% |
| Total | 347,111 | 100.0% |
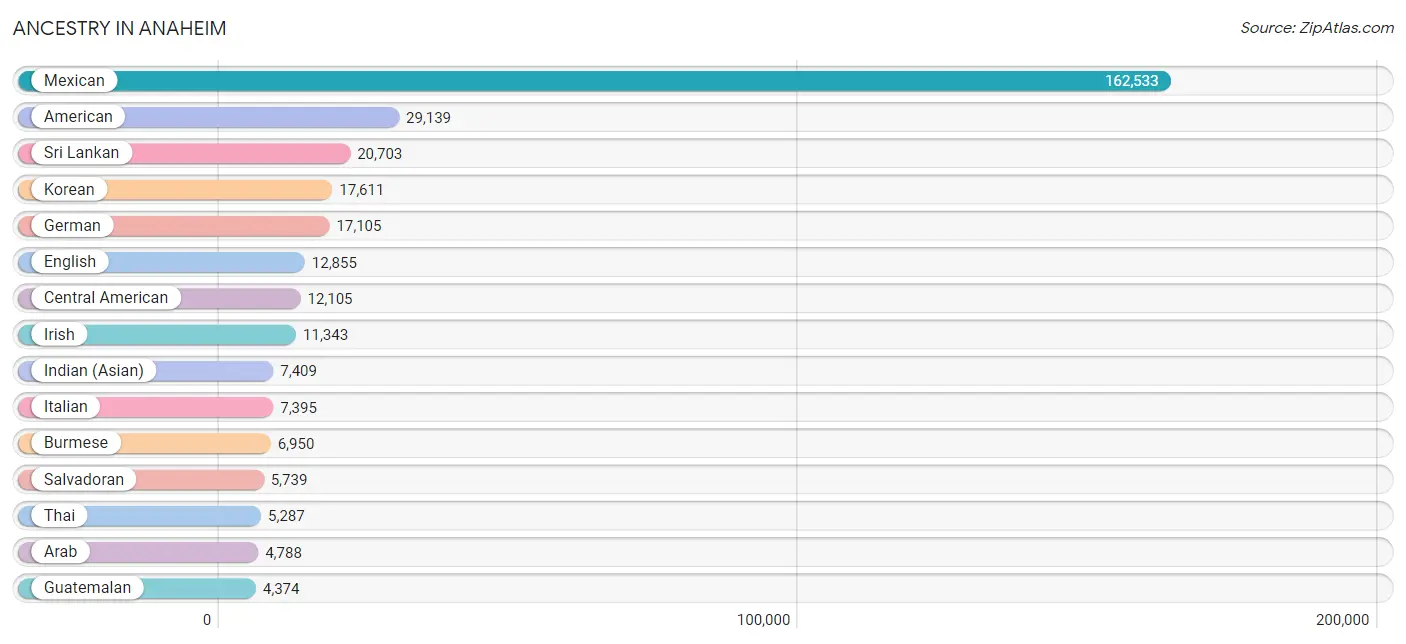
Ancestry in Anaheim
The most populous ancestries reported in Anaheim are Mexican (162,533 | 46.8%), American (29,139 | 8.4%), Sri Lankan (20,703 | 6.0%), Korean (17,611 | 5.1%), and German (17,105 | 4.9%), together accounting for 71.2% of all Anaheim residents.
| Ancestry | # Population | % Population |
| Afghan | 602 | 0.2% |
| African | 1,096 | 0.3% |
| Albanian | 60 | 0.0% |
| Aleut | 54 | 0.0% |
| American | 29,139 | 8.4% |
| Apache | 167 | 0.1% |
| Arab | 4,788 | 1.4% |
| Argentinean | 378 | 0.1% |
| Armenian | 587 | 0.2% |
| Assyrian / Chaldean / Syriac | 104 | 0.0% |
| Australian | 29 | 0.0% |
| Austrian | 232 | 0.1% |
| Bangladeshi | 31 | 0.0% |
| Barbadian | 15 | 0.0% |
| Basque | 25 | 0.0% |
| Belgian | 28 | 0.0% |
| Belizean | 1 | 0.0% |
| Bhutanese | 3,314 | 0.9% |
| Blackfeet | 65 | 0.0% |
| Bolivian | 205 | 0.1% |
| Brazilian | 123 | 0.0% |
| British | 945 | 0.3% |
| British West Indian | 14 | 0.0% |
| Bulgarian | 4 | 0.0% |
| Burmese | 6,950 | 2.0% |
| Canadian | 242 | 0.1% |
| Carpatho Rusyn | 7 | 0.0% |
| Celtic | 23 | 0.0% |
| Central American | 12,105 | 3.5% |
| Central American Indian | 1,155 | 0.3% |
| Cherokee | 375 | 0.1% |
| Chickasaw | 43 | 0.0% |
| Chilean | 133 | 0.0% |
| Chippewa | 15 | 0.0% |
| Choctaw | 157 | 0.1% |
| Colombian | 1,161 | 0.3% |
| Costa Rican | 491 | 0.1% |
| Creek | 42 | 0.0% |
| Croatian | 294 | 0.1% |
| Cuban | 813 | 0.2% |
| Czech | 387 | 0.1% |
| Czechoslovakian | 73 | 0.0% |
| Danish | 463 | 0.1% |
| Delaware | 18 | 0.0% |
| Dominican | 104 | 0.0% |
| Dutch | 1,552 | 0.4% |
| Eastern European | 214 | 0.1% |
| Ecuadorian | 298 | 0.1% |
| Egyptian | 1,364 | 0.4% |
| English | 12,855 | 3.7% |
| Ethiopian | 330 | 0.1% |
| European | 2,237 | 0.6% |
| Filipino | 703 | 0.2% |
| Finnish | 121 | 0.0% |
| French | 2,176 | 0.6% |
| French Canadian | 345 | 0.1% |
| German | 17,105 | 4.9% |
| Ghanaian | 64 | 0.0% |
| Greek | 731 | 0.2% |
| Guamanian / Chamorro | 129 | 0.0% |
| Guatemalan | 4,374 | 1.3% |
| Guyanese | 101 | 0.0% |
| Honduran | 760 | 0.2% |
| Hungarian | 461 | 0.1% |
| Indian (Asian) | 7,409 | 2.1% |
| Indonesian | 112 | 0.0% |
| Iranian | 2,113 | 0.6% |
| Iraqi | 101 | 0.0% |
| Irish | 11,343 | 3.3% |
| Iroquois | 20 | 0.0% |
| Israeli | 143 | 0.0% |
| Italian | 7,395 | 2.1% |
| Jamaican | 96 | 0.0% |
| Japanese | 1,288 | 0.4% |
| Jordanian | 807 | 0.2% |
| Kenyan | 285 | 0.1% |
| Korean | 17,611 | 5.1% |
| Laotian | 603 | 0.2% |
| Latvian | 55 | 0.0% |
| Lebanese | 819 | 0.2% |
| Lithuanian | 164 | 0.1% |
| Malaysian | 1,041 | 0.3% |
| Maltese | 18 | 0.0% |
| Mexican | 162,533 | 46.8% |
| Mexican American Indian | 1,682 | 0.5% |
| Mongolian | 28 | 0.0% |
| Moroccan | 6 | 0.0% |
| Native Hawaiian | 423 | 0.1% |
| Navajo | 149 | 0.0% |
| New Zealander | 6 | 0.0% |
| Nicaraguan | 299 | 0.1% |
| Nigerian | 372 | 0.1% |
| Northern European | 101 | 0.0% |
| Norwegian | 1,713 | 0.5% |
| Okinawan | 3 | 0.0% |
| Osage | 108 | 0.0% |
| Pakistani | 556 | 0.2% |
| Palestinian | 498 | 0.1% |
| Panamanian | 260 | 0.1% |
| Pennsylvania German | 13 | 0.0% |
| Peruvian | 1,023 | 0.3% |
| Pima | 90 | 0.0% |
| Polish | 2,375 | 0.7% |
| Portuguese | 778 | 0.2% |
| Potawatomi | 104 | 0.0% |
| Pueblo | 47 | 0.0% |
| Puerto Rican | 1,607 | 0.5% |
| Romanian | 872 | 0.3% |
| Russian | 700 | 0.2% |
| Salvadoran | 5,739 | 1.7% |
| Samoan | 876 | 0.3% |
| Scandinavian | 402 | 0.1% |
| Scotch-Irish | 601 | 0.2% |
| Scottish | 1,680 | 0.5% |
| Serbian | 66 | 0.0% |
| Shoshone | 6 | 0.0% |
| Sioux | 115 | 0.0% |
| Slavic | 14 | 0.0% |
| Slovak | 97 | 0.0% |
| Slovene | 86 | 0.0% |
| Somali | 62 | 0.0% |
| South African | 28 | 0.0% |
| South American | 3,520 | 1.0% |
| South American Indian | 22 | 0.0% |
| Spaniard | 1,073 | 0.3% |
| Spanish | 1,301 | 0.4% |
| Spanish American | 11 | 0.0% |
| Spanish American Indian | 31 | 0.0% |
| Sri Lankan | 20,703 | 6.0% |
| Subsaharan African | 2,291 | 0.7% |
| Swedish | 1,878 | 0.5% |
| Swiss | 243 | 0.1% |
| Syrian | 403 | 0.1% |
| Thai | 5,287 | 1.5% |
| Tohono O'Odham | 52 | 0.0% |
| Tongan | 74 | 0.0% |
| Trinidadian and Tobagonian | 46 | 0.0% |
| Turkish | 70 | 0.0% |
| Ukrainian | 417 | 0.1% |
| Uruguayan | 129 | 0.0% |
| Ute | 11 | 0.0% |
| Venezuelan | 193 | 0.1% |
| Vietnamese | 848 | 0.2% |
| Welsh | 768 | 0.2% |
| Yakama | 56 | 0.0% |
| Yaqui | 28 | 0.0% |
| Yugoslavian | 209 | 0.1% | View All 147 Rows |
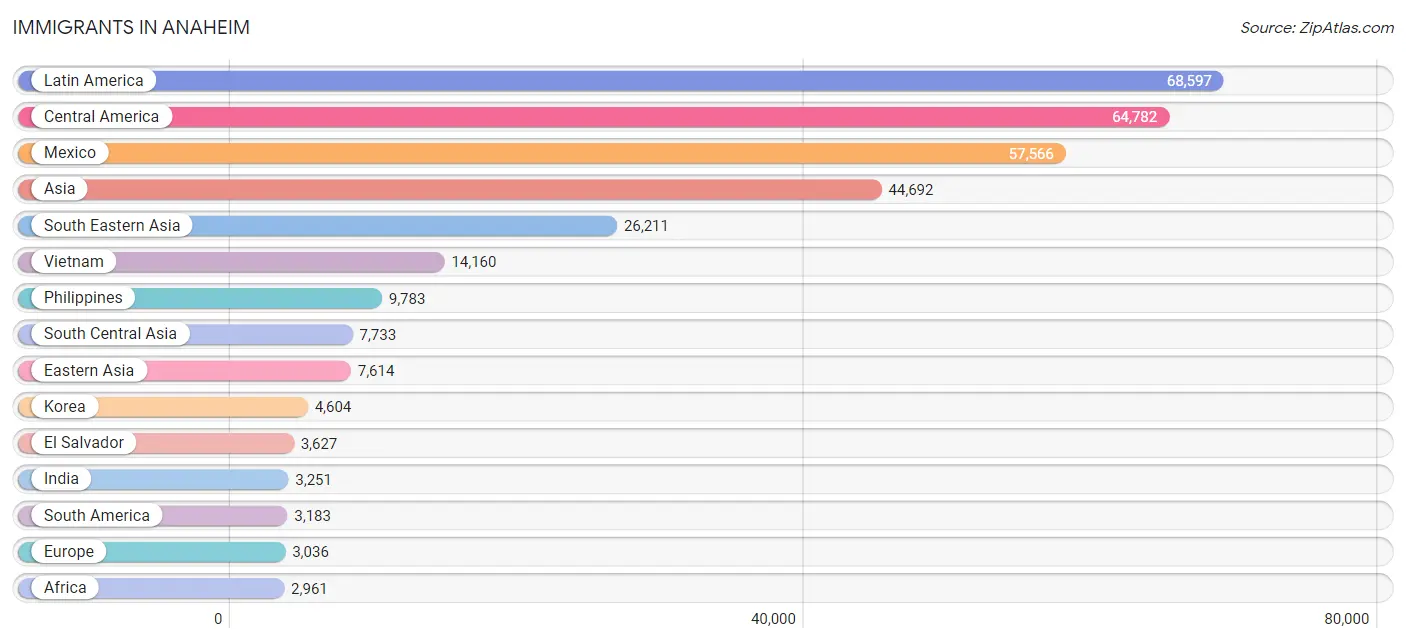
Immigrants in Anaheim
The most numerous immigrant groups reported in Anaheim came from Latin America (68,597 | 19.8%), Central America (64,782 | 18.7%), Mexico (57,566 | 16.6%), Asia (44,692 | 12.9%), and South Eastern Asia (26,211 | 7.5%), together accounting for 75.4% of all Anaheim residents.
| Immigration Origin | # Population | % Population |
| Afghanistan | 555 | 0.2% |
| Africa | 2,961 | 0.9% |
| Albania | 27 | 0.0% |
| Argentina | 315 | 0.1% |
| Armenia | 137 | 0.0% |
| Asia | 44,692 | 12.9% |
| Australia | 17 | 0.0% |
| Austria | 28 | 0.0% |
| Bangladesh | 514 | 0.2% |
| Belarus | 12 | 0.0% |
| Belgium | 7 | 0.0% |
| Belize | 11 | 0.0% |
| Bolivia | 175 | 0.1% |
| Bosnia and Herzegovina | 22 | 0.0% |
| Brazil | 384 | 0.1% |
| Bulgaria | 4 | 0.0% |
| Cambodia | 623 | 0.2% |
| Canada | 554 | 0.2% |
| Caribbean | 632 | 0.2% |
| Central America | 64,782 | 18.7% |
| Chile | 258 | 0.1% |
| China | 2,496 | 0.7% |
| Colombia | 728 | 0.2% |
| Costa Rica | 171 | 0.1% |
| Croatia | 28 | 0.0% |
| Cuba | 303 | 0.1% |
| Dominican Republic | 17 | 0.0% |
| Eastern Africa | 1,236 | 0.4% |
| Eastern Asia | 7,614 | 2.2% |
| Eastern Europe | 1,381 | 0.4% |
| Ecuador | 233 | 0.1% |
| Egypt | 1,220 | 0.4% |
| El Salvador | 3,627 | 1.0% |
| England | 287 | 0.1% |
| Eritrea | 110 | 0.0% |
| Ethiopia | 338 | 0.1% |
| Europe | 3,036 | 0.9% |
| Fiji | 131 | 0.0% |
| France | 106 | 0.0% |
| Germany | 389 | 0.1% |
| Ghana | 45 | 0.0% |
| Greece | 194 | 0.1% |
| Guatemala | 2,823 | 0.8% |
| Guyana | 76 | 0.0% |
| Honduras | 315 | 0.1% |
| Hong Kong | 271 | 0.1% |
| Hungary | 21 | 0.0% |
| India | 3,251 | 0.9% |
| Indonesia | 470 | 0.1% |
| Iran | 1,806 | 0.5% |
| Iraq | 275 | 0.1% |
| Ireland | 54 | 0.0% |
| Israel | 255 | 0.1% |
| Italy | 100 | 0.0% |
| Jamaica | 16 | 0.0% |
| Japan | 514 | 0.2% |
| Jordan | 910 | 0.3% |
| Kenya | 705 | 0.2% |
| Korea | 4,604 | 1.3% |
| Kuwait | 57 | 0.0% |
| Laos | 630 | 0.2% |
| Latin America | 68,597 | 19.8% |
| Lebanon | 458 | 0.1% |
| Malaysia | 81 | 0.0% |
| Mexico | 57,566 | 16.6% |
| Nepal | 864 | 0.3% |
| Netherlands | 34 | 0.0% |
| Nicaragua | 175 | 0.1% |
| Nigeria | 198 | 0.1% |
| Northern Africa | 1,338 | 0.4% |
| Northern Europe | 639 | 0.2% |
| Norway | 25 | 0.0% |
| Oceania | 366 | 0.1% |
| Pakistan | 659 | 0.2% |
| Panama | 67 | 0.0% |
| Peru | 727 | 0.2% |
| Philippines | 9,783 | 2.8% |
| Poland | 257 | 0.1% |
| Portugal | 58 | 0.0% |
| Romania | 819 | 0.2% |
| Russia | 85 | 0.0% |
| Saudi Arabia | 259 | 0.1% |
| Scotland | 42 | 0.0% |
| Serbia | 15 | 0.0% |
| Sierra Leone | 14 | 0.0% |
| Singapore | 49 | 0.0% |
| Somalia | 26 | 0.0% |
| South Africa | 122 | 0.0% |
| South America | 3,183 | 0.9% |
| South Central Asia | 7,733 | 2.2% |
| South Eastern Asia | 26,211 | 7.5% |
| Southern Europe | 381 | 0.1% |
| Spain | 14 | 0.0% |
| Sri Lanka | 66 | 0.0% |
| Sudan | 4 | 0.0% |
| Sweden | 51 | 0.0% |
| Switzerland | 71 | 0.0% |
| Syria | 484 | 0.1% |
| Taiwan | 998 | 0.3% |
| Thailand | 296 | 0.1% |
| Trinidad and Tobago | 59 | 0.0% |
| Turkey | 70 | 0.0% |
| Ukraine | 58 | 0.0% |
| Uruguay | 75 | 0.0% |
| Venezuela | 169 | 0.1% |
| Vietnam | 14,160 | 4.1% |
| West Indies | 26 | 0.0% |
| Western Africa | 257 | 0.1% |
| Western Asia | 2,918 | 0.8% |
| Western Europe | 635 | 0.2% | View All 110 Rows |
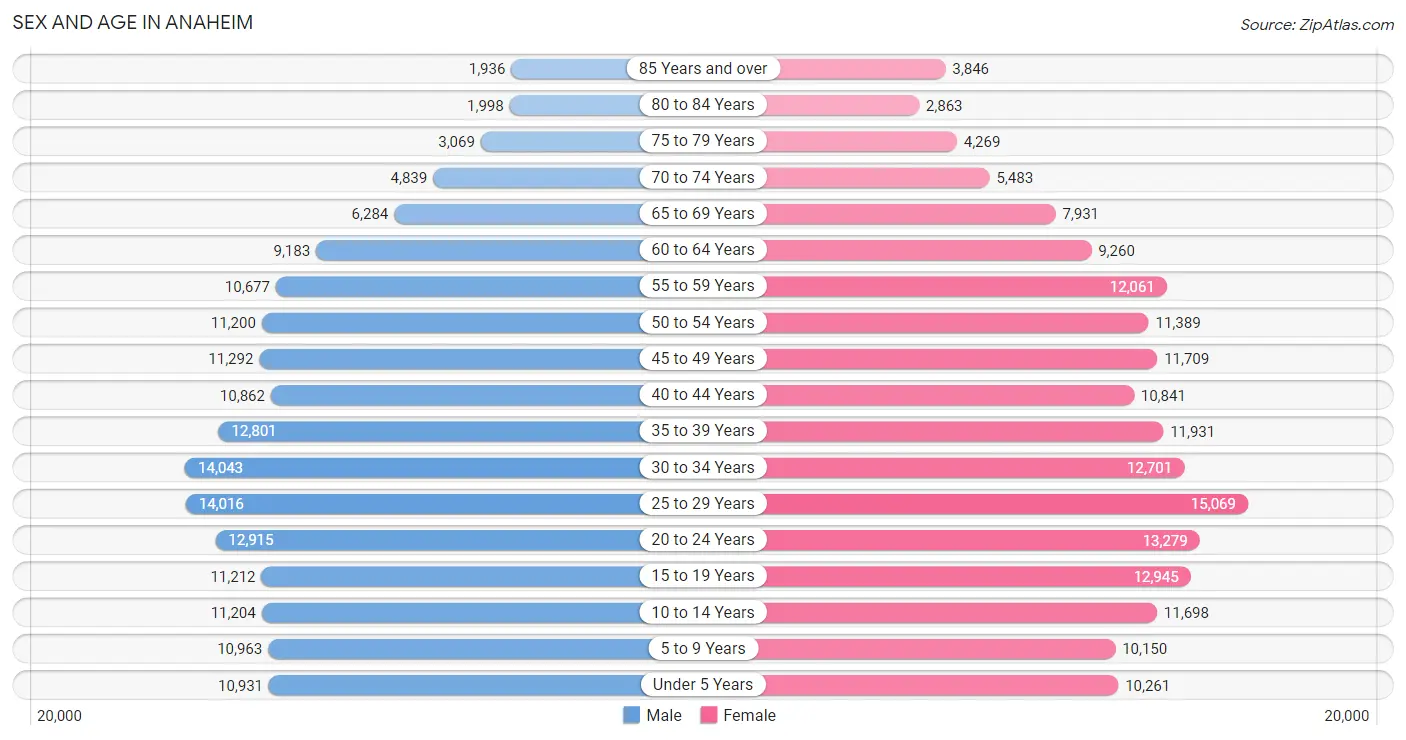
Sex and Age in Anaheim
Sex and Age in Anaheim
The most populous age groups in Anaheim are 30 to 34 Years (14,043 | 8.3%) for men and 25 to 29 Years (15,069 | 8.5%) for women.
| Age Bracket | Male | Female |
| Under 5 Years | 10,931 (6.5%) | 10,261 (5.8%) |
| 5 to 9 Years | 10,963 (6.5%) | 10,150 (5.7%) |
| 10 to 14 Years | 11,204 (6.6%) | 11,698 (6.6%) |
| 15 to 19 Years | 11,212 (6.6%) | 12,945 (7.3%) |
| 20 to 24 Years | 12,915 (7.6%) | 13,279 (7.5%) |
| 25 to 29 Years | 14,016 (8.3%) | 15,069 (8.5%) |
| 30 to 34 Years | 14,043 (8.3%) | 12,701 (7.1%) |
| 35 to 39 Years | 12,801 (7.6%) | 11,931 (6.7%) |
| 40 to 44 Years | 10,862 (6.4%) | 10,841 (6.1%) |
| 45 to 49 Years | 11,292 (6.7%) | 11,709 (6.6%) |
| 50 to 54 Years | 11,200 (6.6%) | 11,389 (6.4%) |
| 55 to 59 Years | 10,677 (6.3%) | 12,061 (6.8%) |
| 60 to 64 Years | 9,183 (5.4%) | 9,260 (5.2%) |
| 65 to 69 Years | 6,284 (3.7%) | 7,931 (4.5%) |
| 70 to 74 Years | 4,839 (2.9%) | 5,483 (3.1%) |
| 75 to 79 Years | 3,069 (1.8%) | 4,269 (2.4%) |
| 80 to 84 Years | 1,998 (1.2%) | 2,863 (1.6%) |
| 85 Years and over | 1,936 (1.1%) | 3,846 (2.2%) |
| Total | 169,425 (100.0%) | 177,686 (100.0%) |
Families and Households in Anaheim
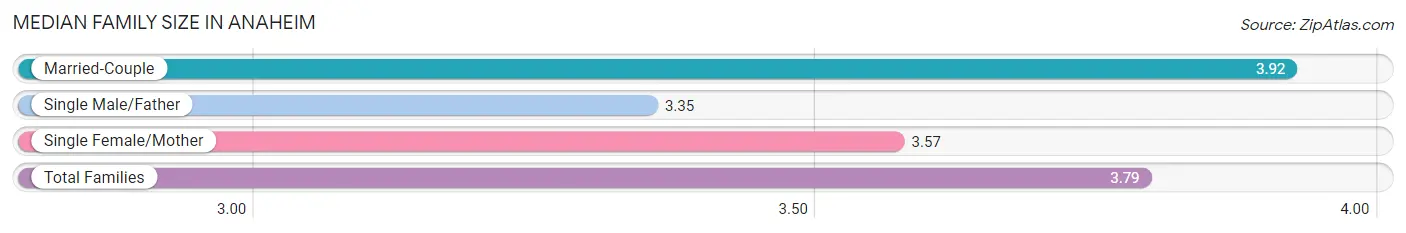
Median Family Size in Anaheim
The median family size in Anaheim is 3.79 persons per family, with married-couple families (51,871 | 68.4%) accounting for the largest median family size of 3.92 persons per family. On the other hand, single male/father families (7,918 | 10.4%) represent the smallest median family size with 3.35 persons per family.
| Family Type | # Families | Family Size |
| Married-Couple | 51,871 (68.4%) | 3.92 |
| Single Male/Father | 7,918 (10.4%) | 3.35 |
| Single Female/Mother | 16,094 (21.2%) | 3.57 |
| Total Families | 75,883 (100.0%) | 3.79 |
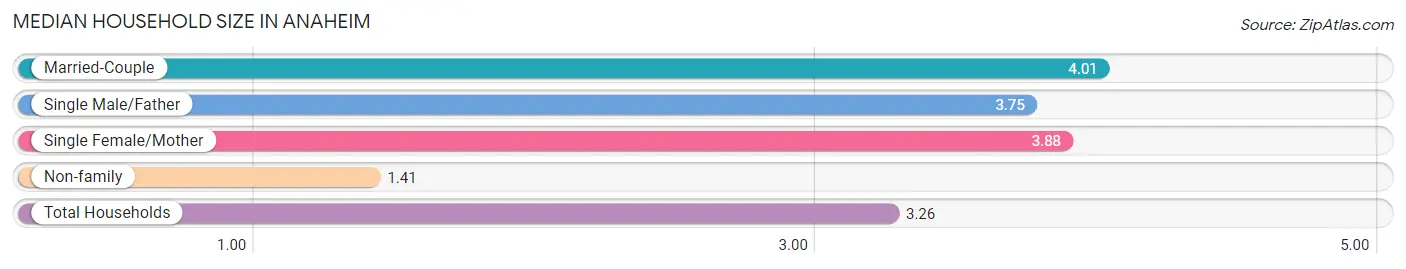
Median Household Size in Anaheim
The median household size in Anaheim is 3.26 persons per household, with married-couple households (51,871 | 49.6%) accounting for the largest median household size of 4.01 persons per household. non-family households (28,788 | 27.5%) represent the smallest median household size with 1.41 persons per household.
| Household Type | # Households | Household Size |
| Married-Couple | 51,871 (49.6%) | 4.01 |
| Single Male/Father | 7,918 (7.6%) | 3.75 |
| Single Female/Mother | 16,094 (15.4%) | 3.88 |
| Non-family | 28,788 (27.5%) | 1.41 |
| Total Households | 104,671 (100.0%) | 3.26 |
Household Size by Marriage Status in Anaheim
Out of a total of 104,671 households in Anaheim, 75,883 (72.5%) are family households, while 28,788 (27.5%) are nonfamily households. The most numerous type of family households are 2-person households, comprising 20,630, and the most common type of nonfamily households are 1-person households, comprising 21,056.
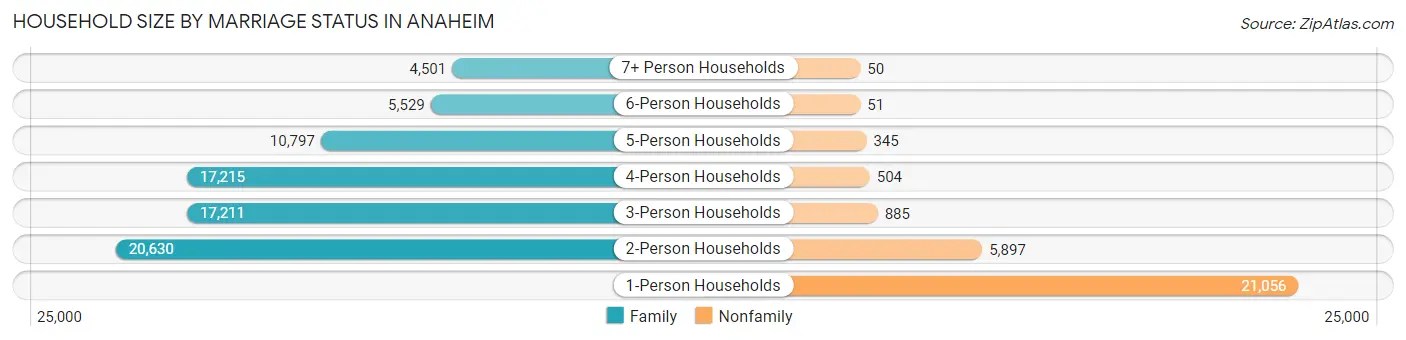
| Household Size | Family Households | Nonfamily Households |
| 1-Person Households | - | 21,056 (20.1%) |
| 2-Person Households | 20,630 (19.7%) | 5,897 (5.6%) |
| 3-Person Households | 17,211 (16.4%) | 885 (0.9%) |
| 4-Person Households | 17,215 (16.5%) | 504 (0.5%) |
| 5-Person Households | 10,797 (10.3%) | 345 (0.3%) |
| 6-Person Households | 5,529 (5.3%) | 51 (0.1%) |
| 7+ Person Households | 4,501 (4.3%) | 50 (0.1%) |
| Total | 75,883 (72.5%) | 28,788 (27.5%) |
Female Fertility in Anaheim
Fertility by Age in Anaheim
Average fertility rate in Anaheim is 46.0 births per 1,000 women. Women in the age bracket of 20 to 34 years have the highest fertility rate with 67.0 births per 1,000 women. Women in the age bracket of 20 to 34 years acount for 65.0% of all women with births.
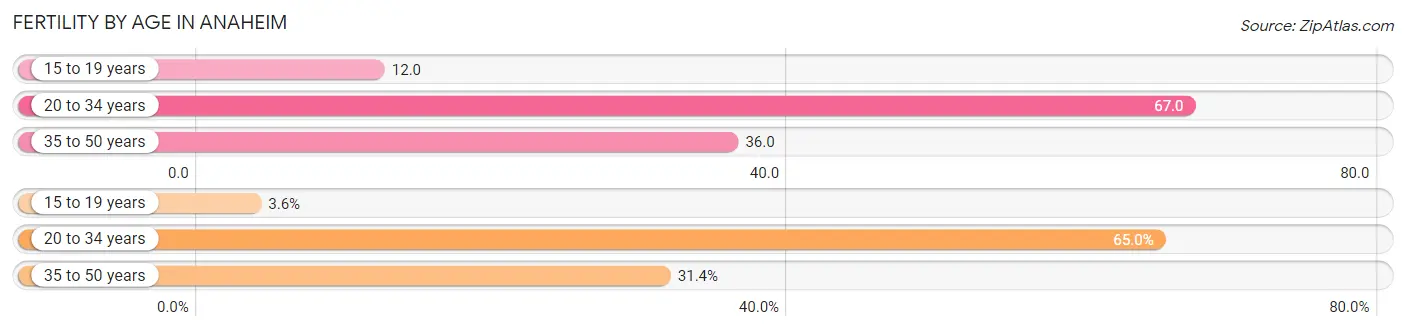
| Age Bracket | Women with Births | Births / 1,000 Women |
| 15 to 19 years | 152 (3.6%) | 12.0 |
| 20 to 34 years | 2,731 (65.0%) | 67.0 |
| 35 to 50 years | 1,320 (31.4%) | 36.0 |
| Total | 4,203 (100.0%) | 46.0 |
Fertility by Age by Marriage Status in Anaheim
71.9% of women with births (4,203) in Anaheim are married. The highest percentage of unmarried women with births falls into 15 to 19 years age bracket with 100.0% of them unmarried at the time of birth, while the lowest percentage of unmarried women with births belong to 20 to 34 years age bracket with 23.5% of them unmarried.
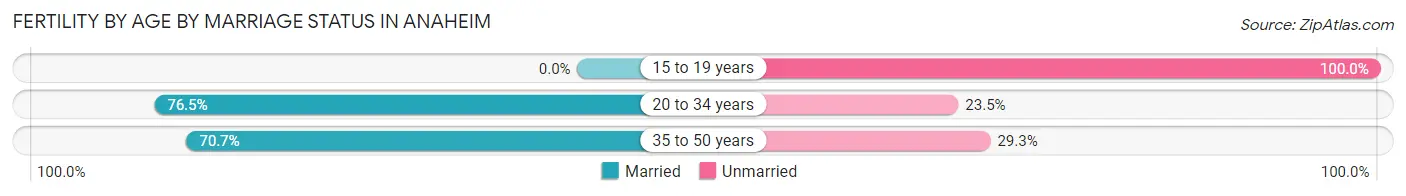
| Age Bracket | Married | Unmarried |
| 15 to 19 years | 0 (0.0%) | 152 (100.0%) |
| 20 to 34 years | 2,089 (76.5%) | 642 (23.5%) |
| 35 to 50 years | 933 (70.7%) | 387 (29.3%) |
| Total | 3,022 (71.9%) | 1,181 (28.1%) |
Fertility by Education in Anaheim
Average fertility rate in Anaheim is 46.0 births per 1,000 women. Women with the education attainment of graduate degree have the highest fertility rate of 81.0 births per 1,000 women, while women with the education attainment of less than high school have the lowest fertility at 18.0 births per 1,000 women. Women with the education attainment of college or associate's degree represent 36.2% of all women with births.
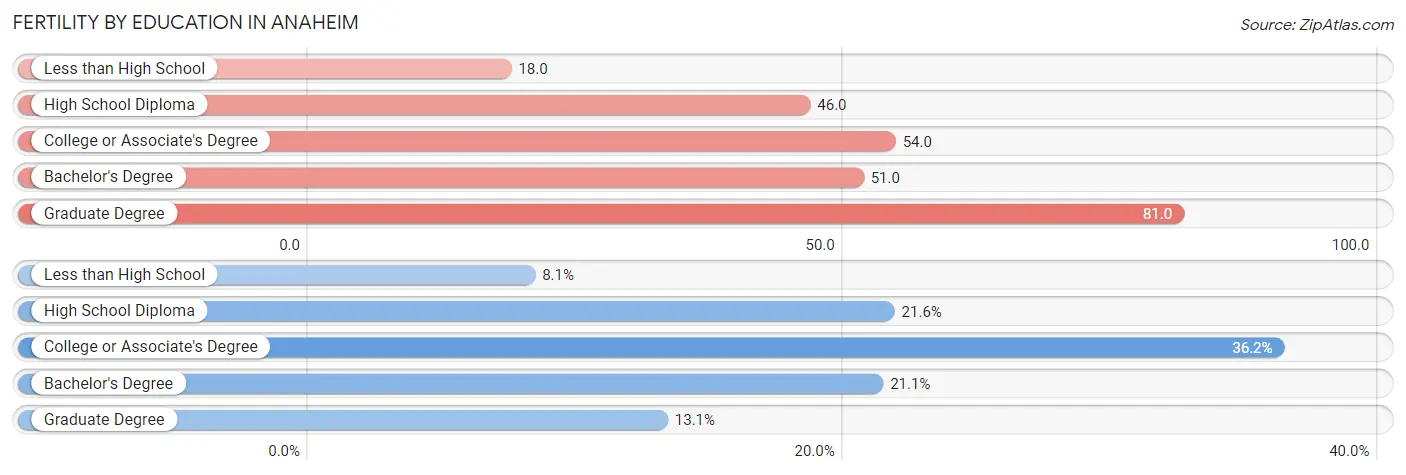
| Educational Attainment | Women with Births | Births / 1,000 Women |
| Less than High School | 340 (8.1%) | 18.0 |
| High School Diploma | 906 (21.6%) | 46.0 |
| College or Associate's Degree | 1,520 (36.2%) | 54.0 |
| Bachelor's Degree | 888 (21.1%) | 51.0 |
| Graduate Degree | 549 (13.1%) | 81.0 |
| Total | 4,203 (100.0%) | 46.0 |
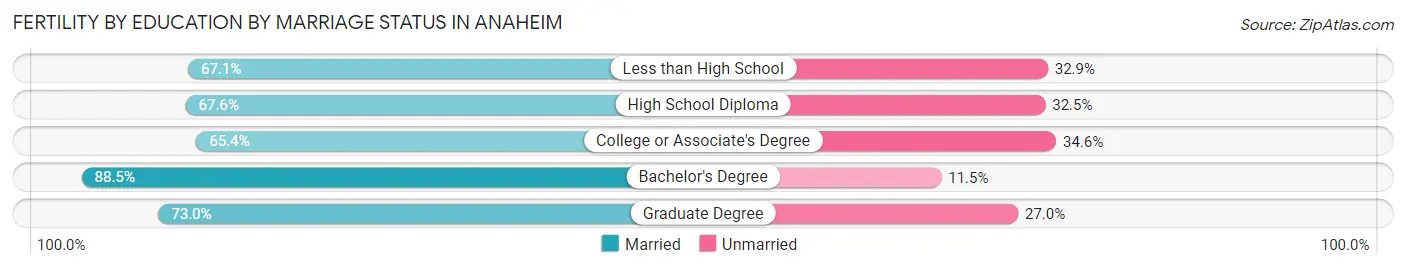
Fertility by Education by Marriage Status in Anaheim
28.1% of women with births in Anaheim are unmarried. Women with the educational attainment of bachelor's degree are most likely to be married with 88.5% of them married at childbirth, while women with the educational attainment of college or associate's degree are least likely to be married with 34.6% of them unmarried at childbirth.
| Educational Attainment | Married | Unmarried |
| Less than High School | 228 (67.1%) | 112 (32.9%) |
| High School Diploma | 612 (67.5%) | 294 (32.5%) |
| College or Associate's Degree | 994 (65.4%) | 526 (34.6%) |
| Bachelor's Degree | 786 (88.5%) | 102 (11.5%) |
| Graduate Degree | 401 (73.0%) | 148 (27.0%) |
| Total | 3,022 (71.9%) | 1,181 (28.1%) |
Employment Characteristics in Anaheim
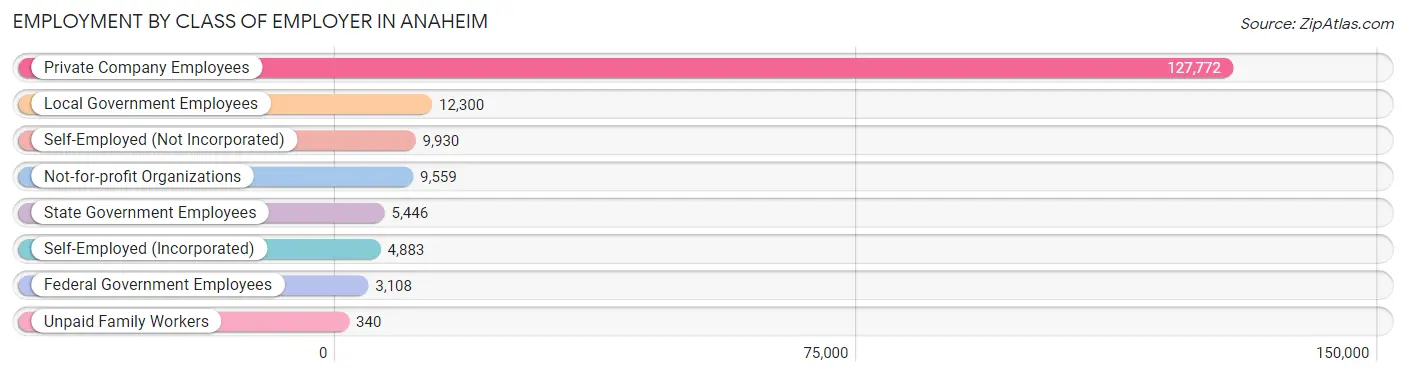
Employment by Class of Employer in Anaheim
Among the 173,338 employed individuals in Anaheim, private company employees (127,772 | 73.7%), local government employees (12,300 | 7.1%), and self-employed (not incorporated) (9,930 | 5.7%) make up the most common classes of employment.
| Employer Class | # Employees | % Employees |
| Private Company Employees | 127,772 | 73.7% |
| Self-Employed (Incorporated) | 4,883 | 2.8% |
| Self-Employed (Not Incorporated) | 9,930 | 5.7% |
| Not-for-profit Organizations | 9,559 | 5.5% |
| Local Government Employees | 12,300 | 7.1% |
| State Government Employees | 5,446 | 3.1% |
| Federal Government Employees | 3,108 | 1.8% |
| Unpaid Family Workers | 340 | 0.2% |
| Total | 173,338 | 100.0% |
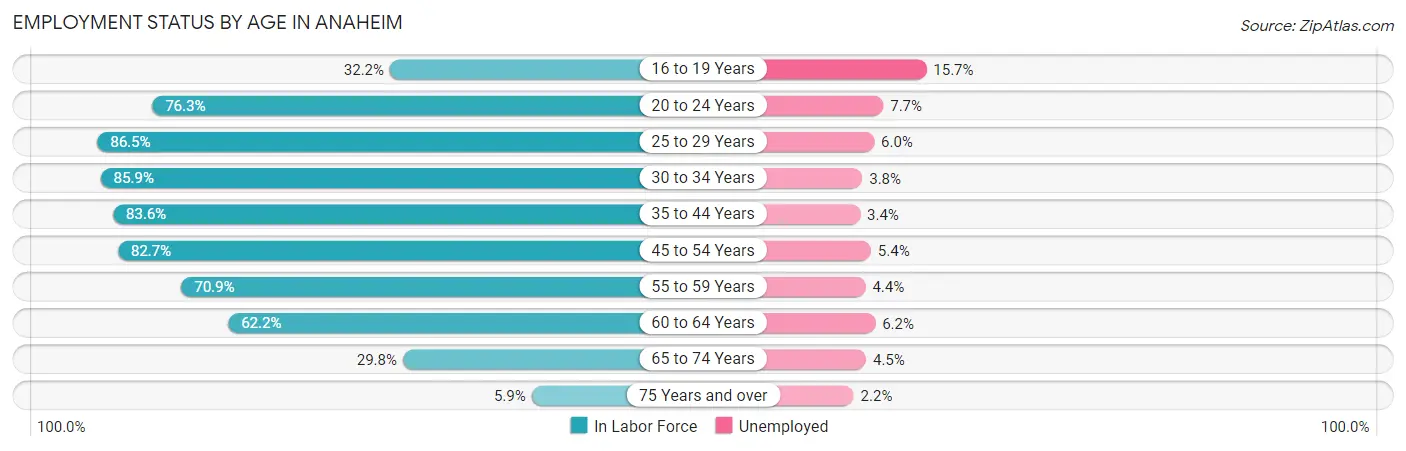
Employment Status by Age in Anaheim
According to the labor force statistics for Anaheim, out of the total population over 16 years of age (277,347), 67.4% or 186,932 individuals are in the labor force, with 5.4% or 10,094 of them unemployed. The age group with the highest labor force participation rate is 25 to 29 years, with 86.5% or 25,159 individuals in the labor force. Within the labor force, the 16 to 19 years age range has the highest percentage of unemployed individuals, with 15.7% or 991 of them being unemployed.
| Age Bracket | In Labor Force | Unemployed |
| 16 to 19 Years | 6,311 (32.2%) | 991 (15.7%) |
| 20 to 24 Years | 19,986 (76.3%) | 1,539 (7.7%) |
| 25 to 29 Years | 25,159 (86.5%) | 1,510 (6.0%) |
| 30 to 34 Years | 22,973 (85.9%) | 873 (3.8%) |
| 35 to 44 Years | 38,820 (83.6%) | 1,320 (3.4%) |
| 45 to 54 Years | 37,703 (82.7%) | 2,036 (5.4%) |
| 55 to 59 Years | 16,121 (70.9%) | 709 (4.4%) |
| 60 to 64 Years | 11,472 (62.2%) | 711 (6.2%) |
| 65 to 74 Years | 7,312 (29.8%) | 329 (4.5%) |
| 75 Years and over | 1,061 (5.9%) | 23 (2.2%) |
| Total | 186,932 (67.4%) | 10,094 (5.4%) |
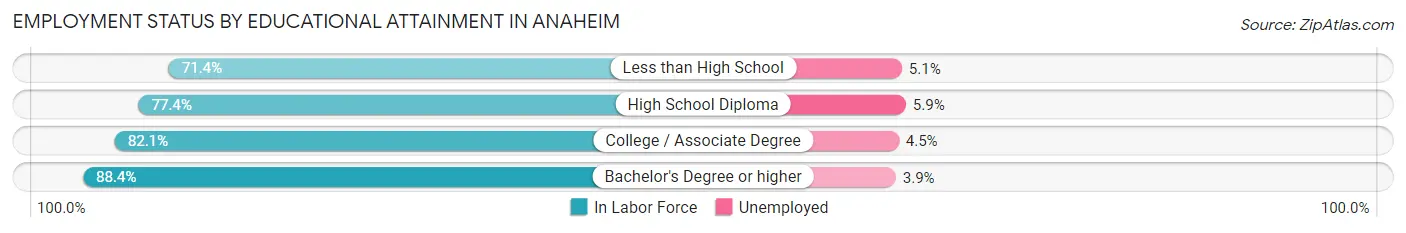
Employment Status by Educational Attainment in Anaheim
According to labor force statistics for Anaheim, 80.6% of individuals (152,362) out of the total population between 25 and 64 years of age (189,035) are in the labor force, with 4.7% or 7,161 of them being unemployed. The group with the highest labor force participation rate are those with the educational attainment of bachelor's degree or higher, with 88.4% or 48,126 individuals in the labor force. Within the labor force, individuals with high school diploma education have the highest percentage of unemployment, with 5.9% or 1,908 of them being unemployed.
| Educational Attainment | In Labor Force | Unemployed |
| Less than High School | 29,406 (71.4%) | 2,100 (5.1%) |
| High School Diploma | 32,346 (77.4%) | 2,466 (5.9%) |
| College / Associate Degree | 42,378 (82.1%) | 2,323 (4.5%) |
| Bachelor's Degree or higher | 48,126 (88.4%) | 2,123 (3.9%) |
| Total | 152,362 (80.6%) | 8,885 (4.7%) |
Employment Occupations by Sex in Anaheim
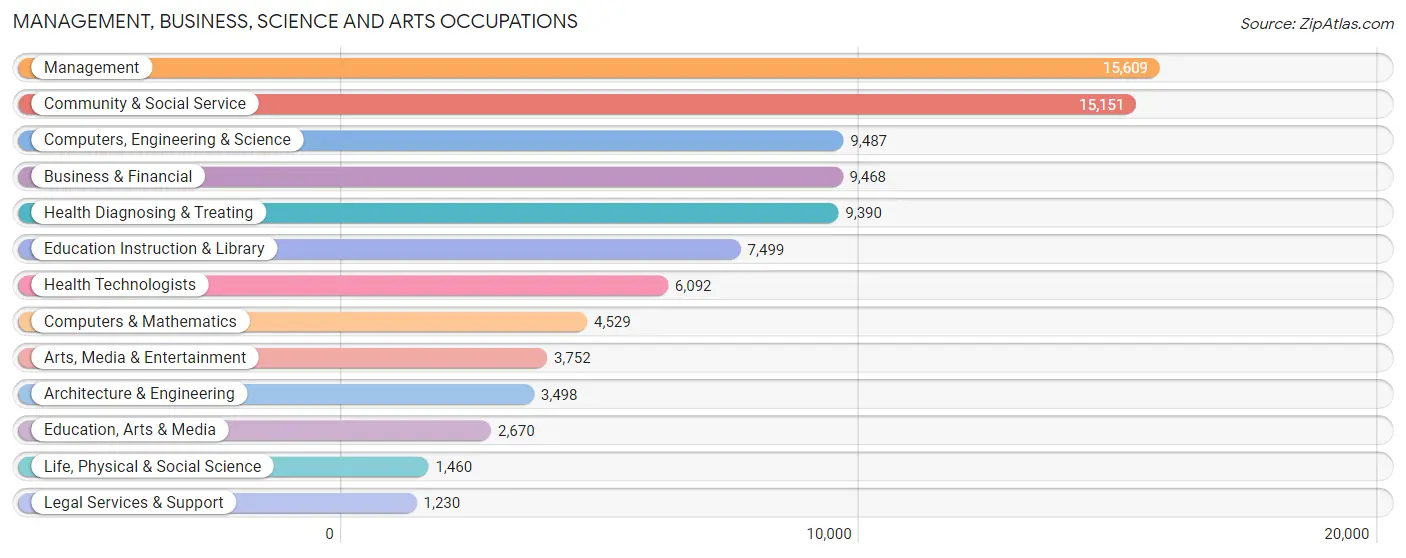
Management, Business, Science and Arts Occupations
The most common Management, Business, Science and Arts occupations in Anaheim are Management (15,609 | 8.8%), Community & Social Service (15,151 | 8.6%), Computers, Engineering & Science (9,487 | 5.4%), Business & Financial (9,468 | 5.4%), and Health Diagnosing & Treating (9,390 | 5.3%).
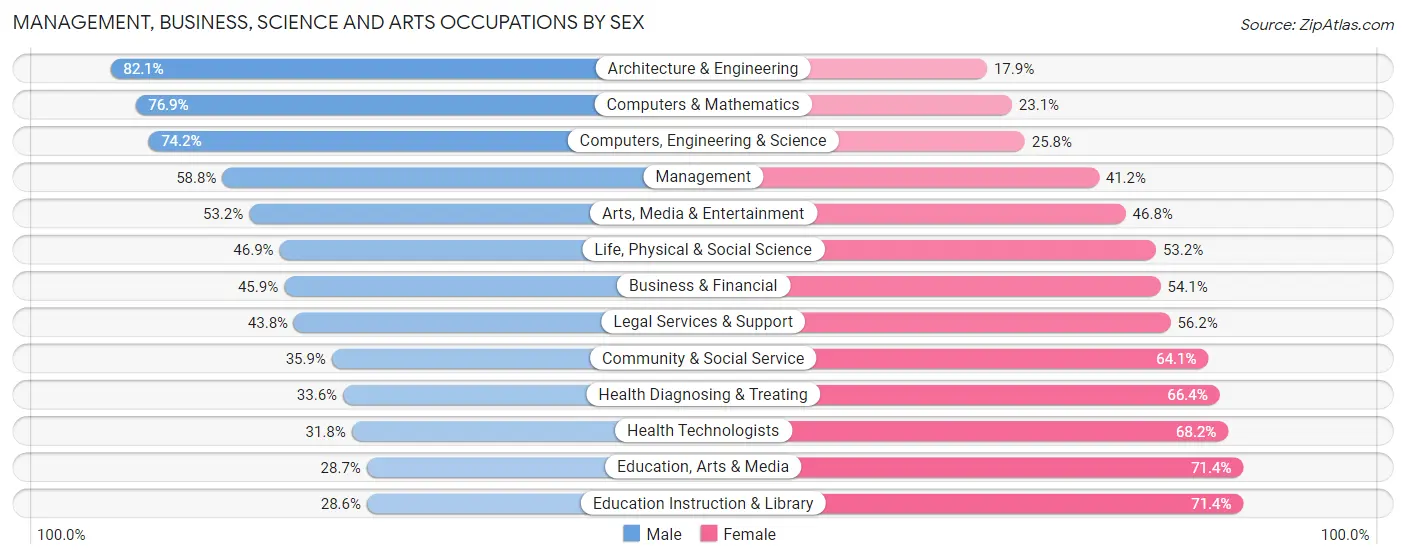
Management, Business, Science and Arts Occupations by Sex
Within the Management, Business, Science and Arts occupations in Anaheim, the most male-oriented occupations are Architecture & Engineering (82.1%), Computers & Mathematics (76.9%), and Computers, Engineering & Science (74.2%), while the most female-oriented occupations are Education Instruction & Library (71.4%), Education, Arts & Media (71.4%), and Health Technologists (68.2%).
| Occupation | Male | Female |
| Management | 9,174 (58.8%) | 6,435 (41.2%) |
| Business & Financial | 4,345 (45.9%) | 5,123 (54.1%) |
| Computers, Engineering & Science | 7,039 (74.2%) | 2,448 (25.8%) |
| Computers & Mathematics | 3,483 (76.9%) | 1,046 (23.1%) |
| Architecture & Engineering | 2,872 (82.1%) | 626 (17.9%) |
| Life, Physical & Social Science | 684 (46.9%) | 776 (53.1%) |
| Community & Social Service | 5,445 (35.9%) | 9,706 (64.1%) |
| Education, Arts & Media | 765 (28.6%) | 1,905 (71.4%) |
| Legal Services & Support | 539 (43.8%) | 691 (56.2%) |
| Education Instruction & Library | 2,146 (28.6%) | 5,353 (71.4%) |
| Arts, Media & Entertainment | 1,995 (53.2%) | 1,757 (46.8%) |
| Health Diagnosing & Treating | 3,155 (33.6%) | 6,235 (66.4%) |
| Health Technologists | 1,937 (31.8%) | 4,155 (68.2%) |
| Total (Category) | 29,158 (49.3%) | 29,947 (50.7%) |
| Total (Overall) | 94,688 (53.6%) | 82,028 (46.4%) |
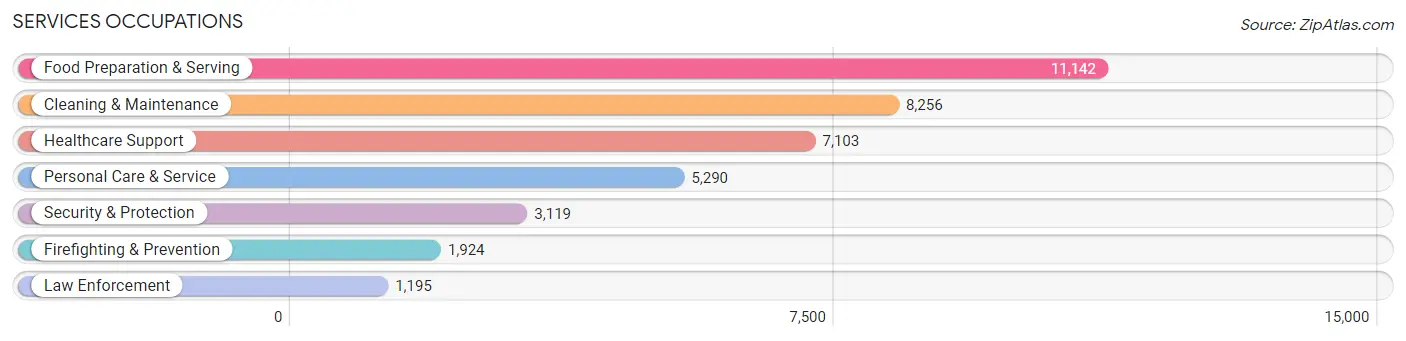
Services Occupations
The most common Services occupations in Anaheim are Food Preparation & Serving (11,142 | 6.3%), Cleaning & Maintenance (8,256 | 4.7%), Healthcare Support (7,103 | 4.0%), Personal Care & Service (5,290 | 3.0%), and Security & Protection (3,119 | 1.8%).
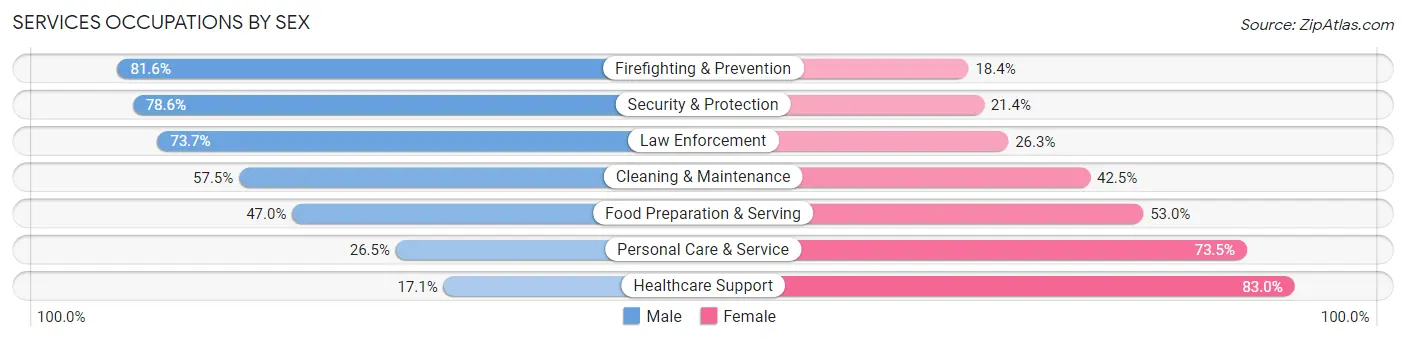
Services Occupations by Sex
Within the Services occupations in Anaheim, the most male-oriented occupations are Firefighting & Prevention (81.6%), Security & Protection (78.6%), and Law Enforcement (73.7%), while the most female-oriented occupations are Healthcare Support (83.0%), Personal Care & Service (73.5%), and Food Preparation & Serving (53.0%).
| Occupation | Male | Female |
| Healthcare Support | 1,211 (17.1%) | 5,892 (83.0%) |
| Security & Protection | 2,451 (78.6%) | 668 (21.4%) |
| Firefighting & Prevention | 1,570 (81.6%) | 354 (18.4%) |
| Law Enforcement | 881 (73.7%) | 314 (26.3%) |
| Food Preparation & Serving | 5,237 (47.0%) | 5,905 (53.0%) |
| Cleaning & Maintenance | 4,749 (57.5%) | 3,507 (42.5%) |
| Personal Care & Service | 1,402 (26.5%) | 3,888 (73.5%) |
| Total (Category) | 15,050 (43.1%) | 19,860 (56.9%) |
| Total (Overall) | 94,688 (53.6%) | 82,028 (46.4%) |
Sales and Office Occupations
The most common Sales and Office occupations in Anaheim are Office & Administration (21,923 | 12.4%), and Sales & Related (18,669 | 10.6%).

Sales and Office Occupations by Sex
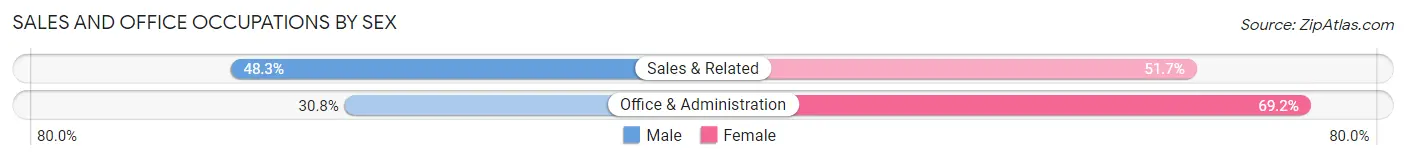
| Occupation | Male | Female |
| Sales & Related | 9,019 (48.3%) | 9,650 (51.7%) |
| Office & Administration | 6,745 (30.8%) | 15,178 (69.2%) |
| Total (Category) | 15,764 (38.8%) | 24,828 (61.2%) |
| Total (Overall) | 94,688 (53.6%) | 82,028 (46.4%) |
Natural Resources, Construction and Maintenance Occupations
The most common Natural Resources, Construction and Maintenance occupations in Anaheim are Construction & Extraction (10,199 | 5.8%), Installation, Maintenance & Repair (4,301 | 2.4%), and Farming, Fishing & Forestry (978 | 0.5%).

Natural Resources, Construction and Maintenance Occupations by Sex
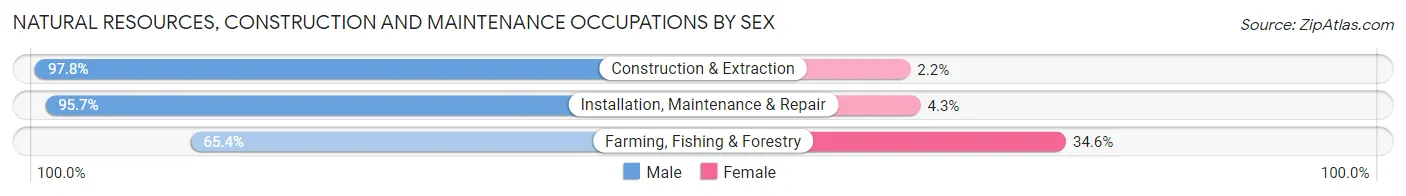
| Occupation | Male | Female |
| Farming, Fishing & Forestry | 640 (65.4%) | 338 (34.6%) |
| Construction & Extraction | 9,977 (97.8%) | 222 (2.2%) |
| Installation, Maintenance & Repair | 4,116 (95.7%) | 185 (4.3%) |
| Total (Category) | 14,733 (95.2%) | 745 (4.8%) |
| Total (Overall) | 94,688 (53.6%) | 82,028 (46.4%) |
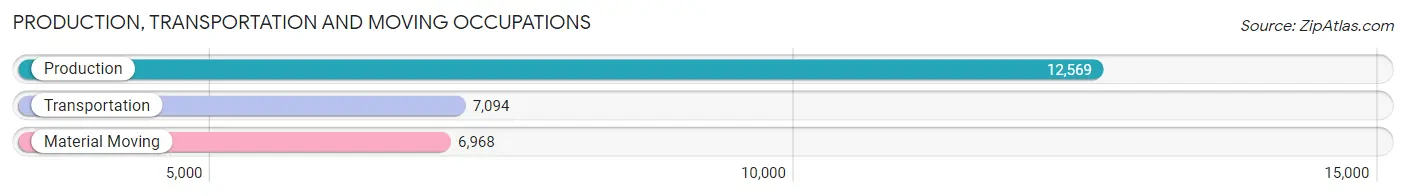
Production, Transportation and Moving Occupations
The most common Production, Transportation and Moving occupations in Anaheim are Production (12,569 | 7.1%), Transportation (7,094 | 4.0%), and Material Moving (6,968 | 3.9%).
Production, Transportation and Moving Occupations by Sex
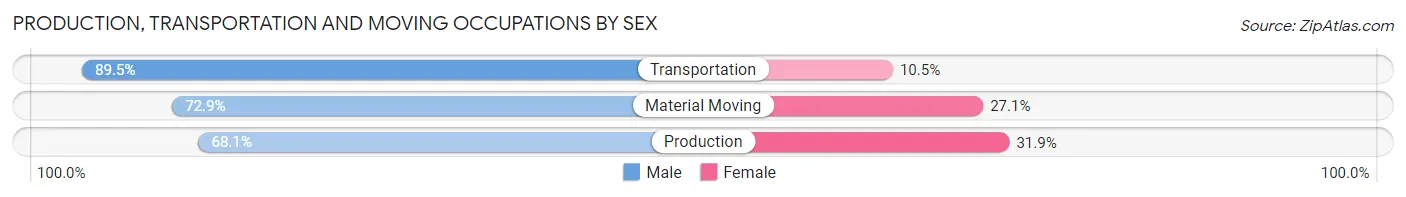
| Occupation | Male | Female |
| Production | 8,557 (68.1%) | 4,012 (31.9%) |
| Transportation | 6,346 (89.5%) | 748 (10.5%) |
| Material Moving | 5,080 (72.9%) | 1,888 (27.1%) |
| Total (Category) | 19,983 (75.0%) | 6,648 (25.0%) |
| Total (Overall) | 94,688 (53.6%) | 82,028 (46.4%) |
Employment Industries by Sex in Anaheim
Employment Industries in Anaheim
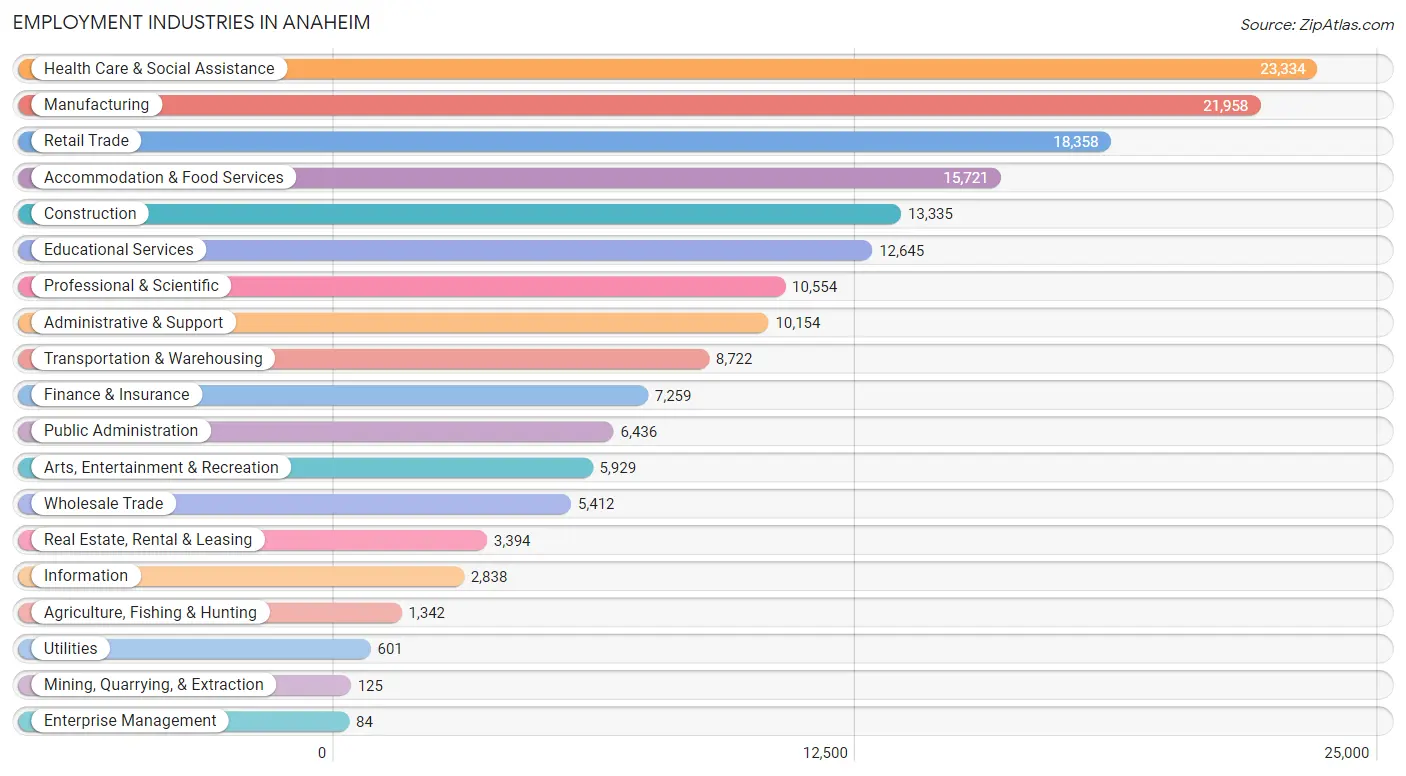
The major employment industries in Anaheim include Health Care & Social Assistance (23,334 | 13.2%), Manufacturing (21,958 | 12.4%), Retail Trade (18,358 | 10.4%), Accommodation & Food Services (15,721 | 8.9%), and Construction (13,335 | 7.5%).
Employment Industries by Sex in Anaheim
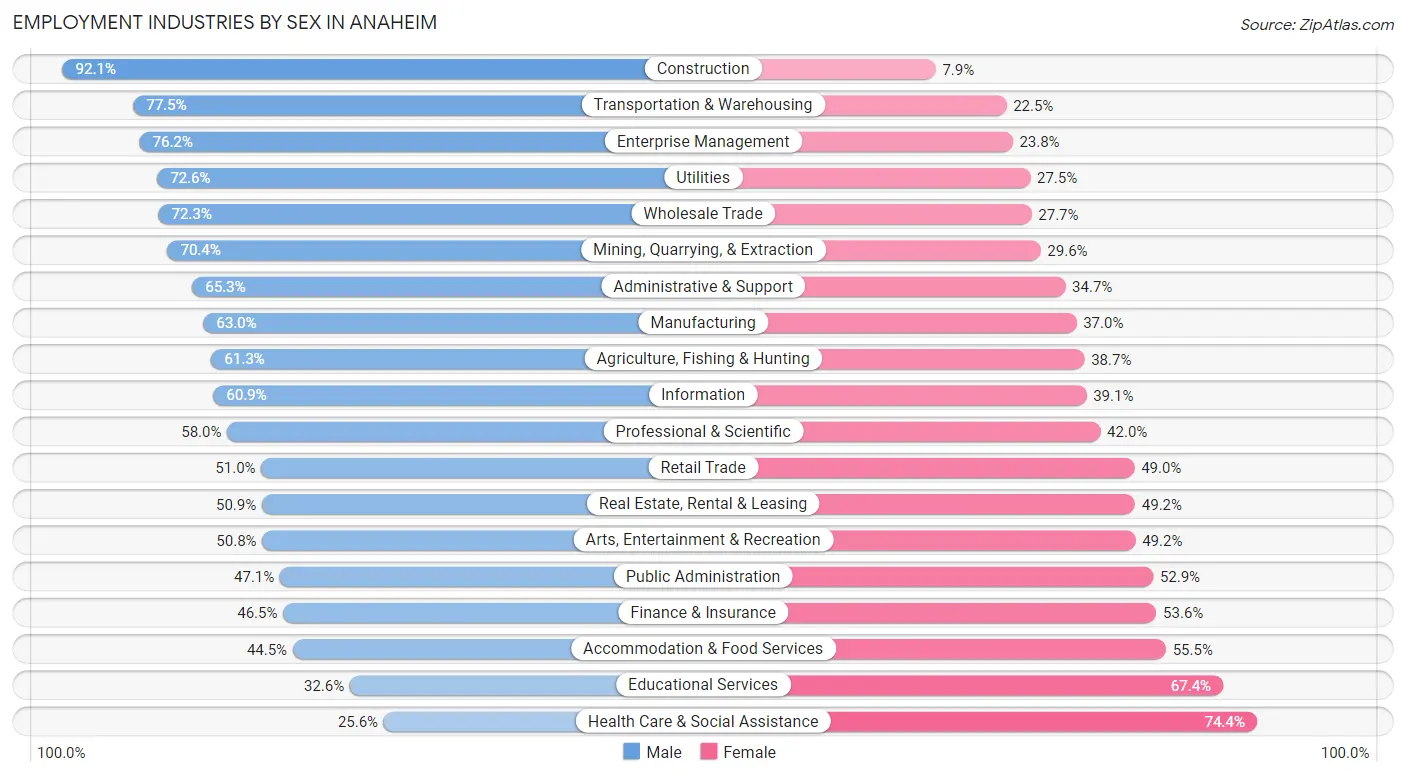
The Anaheim industries that see more men than women are Construction (92.1%), Transportation & Warehousing (77.5%), and Enterprise Management (76.2%), whereas the industries that tend to have a higher number of women are Health Care & Social Assistance (74.4%), Educational Services (67.4%), and Accommodation & Food Services (55.5%).
| Industry | Male | Female |
| Agriculture, Fishing & Hunting | 823 (61.3%) | 519 (38.7%) |
| Mining, Quarrying, & Extraction | 88 (70.4%) | 37 (29.6%) |
| Construction | 12,284 (92.1%) | 1,051 (7.9%) |
| Manufacturing | 13,831 (63.0%) | 8,127 (37.0%) |
| Wholesale Trade | 3,912 (72.3%) | 1,500 (27.7%) |
| Retail Trade | 9,361 (51.0%) | 8,997 (49.0%) |
| Transportation & Warehousing | 6,759 (77.5%) | 1,963 (22.5%) |
| Utilities | 436 (72.6%) | 165 (27.5%) |
| Information | 1,729 (60.9%) | 1,109 (39.1%) |
| Finance & Insurance | 3,372 (46.5%) | 3,887 (53.5%) |
| Real Estate, Rental & Leasing | 1,726 (50.8%) | 1,668 (49.1%) |
| Professional & Scientific | 6,126 (58.0%) | 4,428 (42.0%) |
| Enterprise Management | 64 (76.2%) | 20 (23.8%) |
| Administrative & Support | 6,629 (65.3%) | 3,525 (34.7%) |
| Educational Services | 4,127 (32.6%) | 8,518 (67.4%) |
| Health Care & Social Assistance | 5,979 (25.6%) | 17,355 (74.4%) |
| Arts, Entertainment & Recreation | 3,011 (50.8%) | 2,918 (49.2%) |
| Accommodation & Food Services | 6,990 (44.5%) | 8,731 (55.5%) |
| Public Administration | 3,032 (47.1%) | 3,404 (52.9%) |
| Total | 94,688 (53.6%) | 82,028 (46.4%) |
Education in Anaheim
School Enrollment in Anaheim
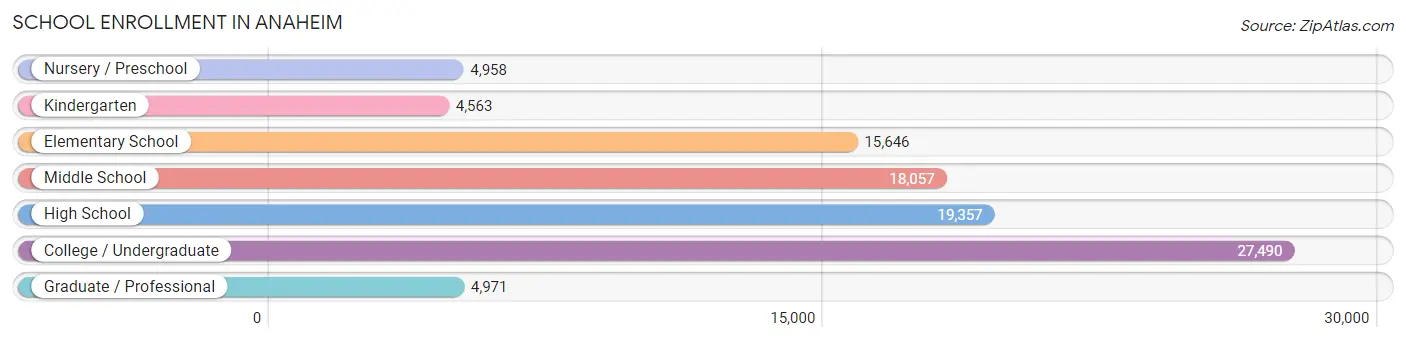
The most common levels of schooling among the 95,042 students in Anaheim are college / undergraduate (27,490 | 28.9%), high school (19,357 | 20.4%), and middle school (18,057 | 19.0%).
| School Level | # Students | % Students |
| Nursery / Preschool | 4,958 | 5.2% |
| Kindergarten | 4,563 | 4.8% |
| Elementary School | 15,646 | 16.5% |
| Middle School | 18,057 | 19.0% |
| High School | 19,357 | 20.4% |
| College / Undergraduate | 27,490 | 28.9% |
| Graduate / Professional | 4,971 | 5.2% |
| Total | 95,042 | 100.0% |
School Enrollment by Age by Funding Source in Anaheim
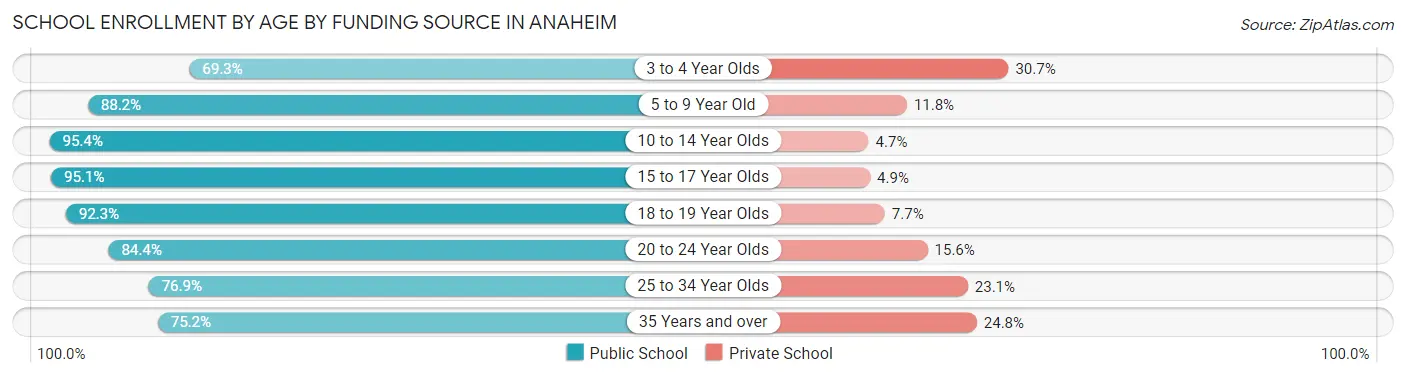
Out of a total of 95,042 students who are enrolled in schools in Anaheim, 11,405 (12.0%) attend a private institution, while the remaining 83,637 (88.0%) are enrolled in public schools. The age group of 3 to 4 year olds has the highest likelihood of being enrolled in private schools, with 1,222 (30.7% in the age bracket) enrolled. Conversely, the age group of 10 to 14 year olds has the lowest likelihood of being enrolled in a private school, with 21,328 (95.4% in the age bracket) attending a public institution.
| Age Bracket | Public School | Private School |
| 3 to 4 Year Olds | 2,758 (69.3%) | 1,222 (30.7%) |
| 5 to 9 Year Old | 17,482 (88.2%) | 2,336 (11.8%) |
| 10 to 14 Year Olds | 21,328 (95.4%) | 1,040 (4.6%) |
| 15 to 17 Year Olds | 12,977 (95.1%) | 673 (4.9%) |
| 18 to 19 Year Olds | 7,083 (92.3%) | 589 (7.7%) |
| 20 to 24 Year Olds | 10,837 (84.4%) | 2,008 (15.6%) |
| 25 to 34 Year Olds | 6,731 (76.9%) | 2,025 (23.1%) |
| 35 Years and over | 4,476 (75.2%) | 1,477 (24.8%) |
| Total | 83,637 (88.0%) | 11,405 (12.0%) |
Educational Attainment by Field of Study in Anaheim
Business (14,847 | 21.8%), science & technology (6,960 | 10.2%), engineering (6,347 | 9.3%), social sciences (5,460 | 8.0%), and arts & humanities (5,113 | 7.5%) are the most common fields of study among 68,221 individuals in Anaheim who have obtained a bachelor's degree or higher.
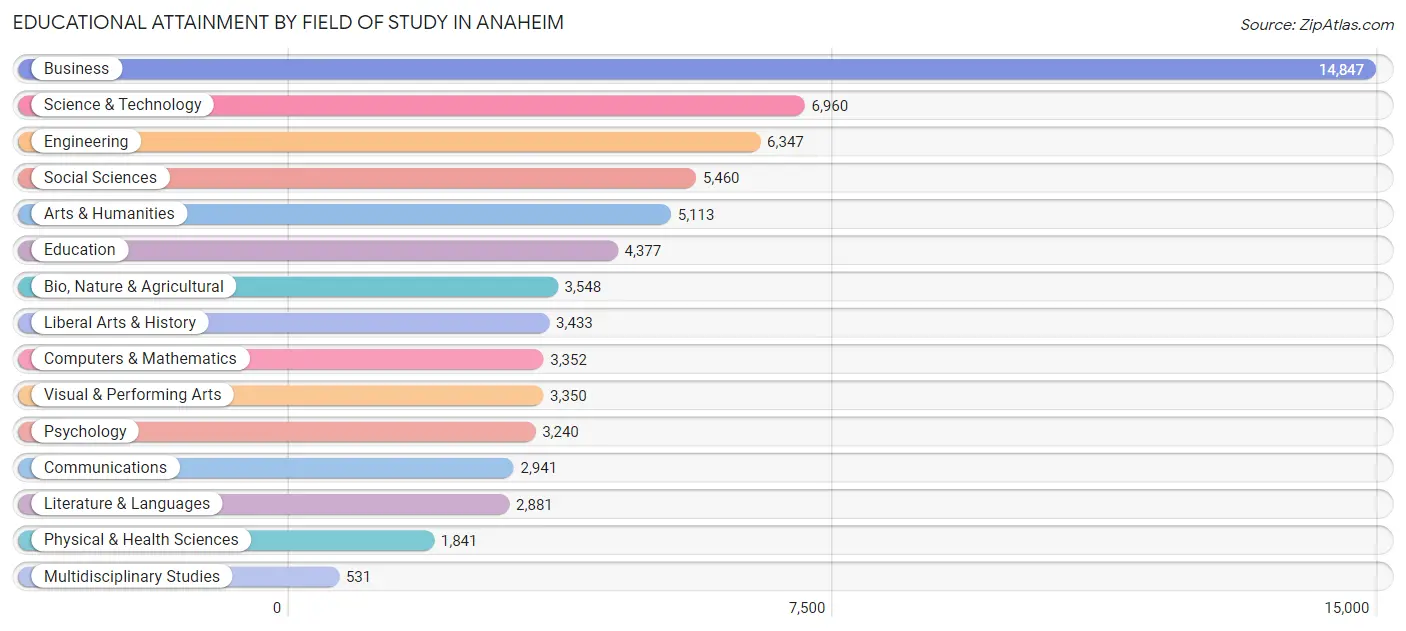
| Field of Study | # Graduates | % Graduates |
| Computers & Mathematics | 3,352 | 4.9% |
| Bio, Nature & Agricultural | 3,548 | 5.2% |
| Physical & Health Sciences | 1,841 | 2.7% |
| Psychology | 3,240 | 4.8% |
| Social Sciences | 5,460 | 8.0% |
| Engineering | 6,347 | 9.3% |
| Multidisciplinary Studies | 531 | 0.8% |
| Science & Technology | 6,960 | 10.2% |
| Business | 14,847 | 21.8% |
| Education | 4,377 | 6.4% |
| Literature & Languages | 2,881 | 4.2% |
| Liberal Arts & History | 3,433 | 5.0% |
| Visual & Performing Arts | 3,350 | 4.9% |
| Communications | 2,941 | 4.3% |
| Arts & Humanities | 5,113 | 7.5% |
| Total | 68,221 | 100.0% |
Transportation & Commute in Anaheim
Vehicle Availability by Sex in Anaheim
The most prevalent vehicle ownership categories in Anaheim are males with 2 vehicles (33,400, accounting for 36.1%) and females with 2 vehicles (29,375, making up 41.8%).
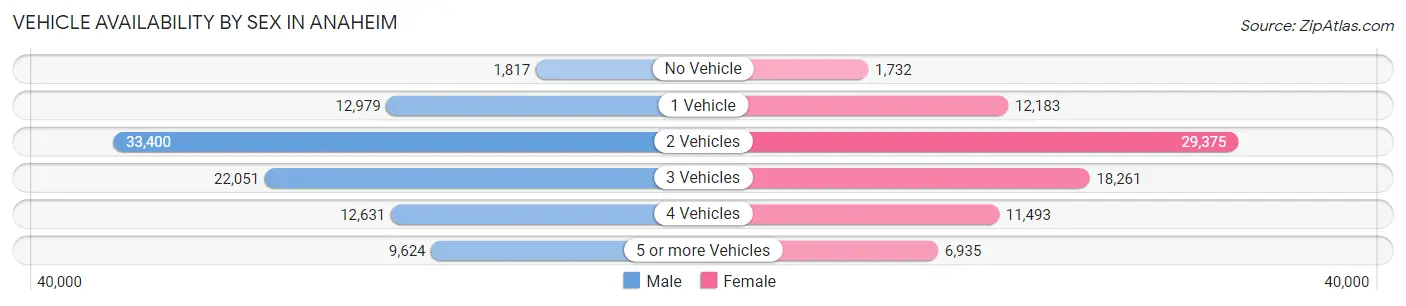
| Vehicles Available | Male | Female |
| No Vehicle | 1,817 (2.0%) | 1,732 (2.2%) |
| 1 Vehicle | 12,979 (14.0%) | 12,183 (15.2%) |
| 2 Vehicles | 33,400 (36.1%) | 29,375 (36.7%) |
| 3 Vehicles | 22,051 (23.8%) | 18,261 (22.8%) |
| 4 Vehicles | 12,631 (13.7%) | 11,493 (14.4%) |
| 5 or more Vehicles | 9,624 (10.4%) | 6,935 (8.7%) |
| Total | 92,502 (100.0%) | 79,979 (100.0%) |
Commute Time in Anaheim
The most frequently occuring commute durations in Anaheim are 30 to 34 minutes (28,997 commuters, 18.1%), 20 to 24 minutes (23,764 commuters, 14.9%), and 15 to 19 minutes (23,285 commuters, 14.6%).
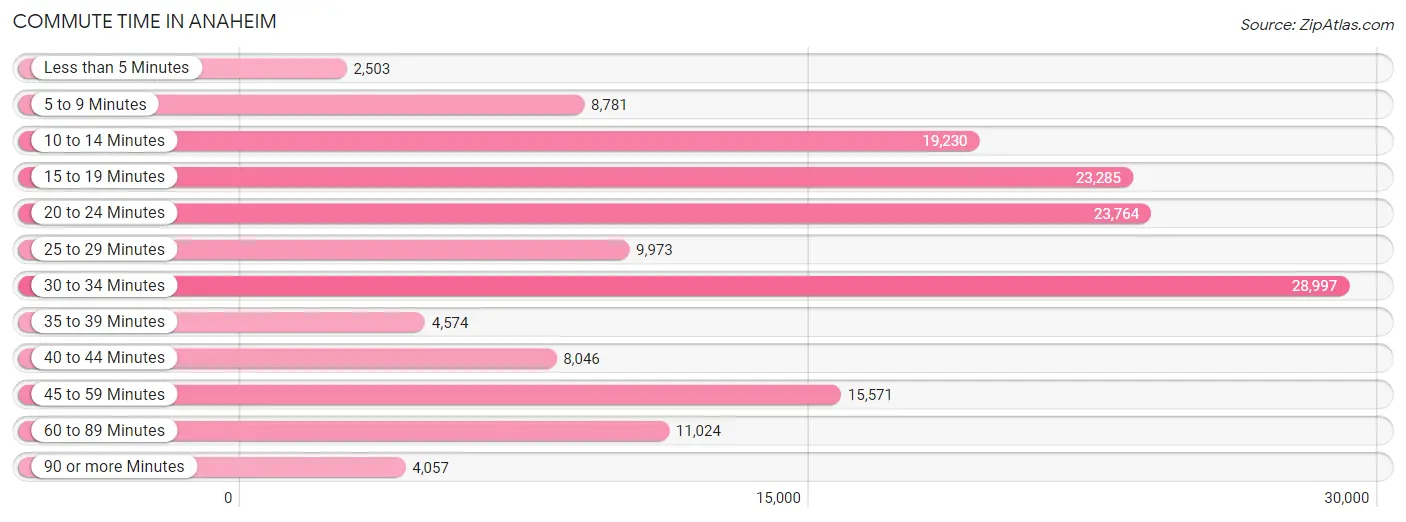
| Commute Time | # Commuters | % Commuters |
| Less than 5 Minutes | 2,503 | 1.6% |
| 5 to 9 Minutes | 8,781 | 5.5% |
| 10 to 14 Minutes | 19,230 | 12.0% |
| 15 to 19 Minutes | 23,285 | 14.6% |
| 20 to 24 Minutes | 23,764 | 14.9% |
| 25 to 29 Minutes | 9,973 | 6.2% |
| 30 to 34 Minutes | 28,997 | 18.1% |
| 35 to 39 Minutes | 4,574 | 2.9% |
| 40 to 44 Minutes | 8,046 | 5.0% |
| 45 to 59 Minutes | 15,571 | 9.7% |
| 60 to 89 Minutes | 11,024 | 6.9% |
| 90 or more Minutes | 4,057 | 2.5% |
Commute Time by Sex in Anaheim
The most common commute times in Anaheim are 30 to 34 minutes (16,073 commuters, 18.5%) for males and 30 to 34 minutes (12,924 commuters, 17.7%) for females.
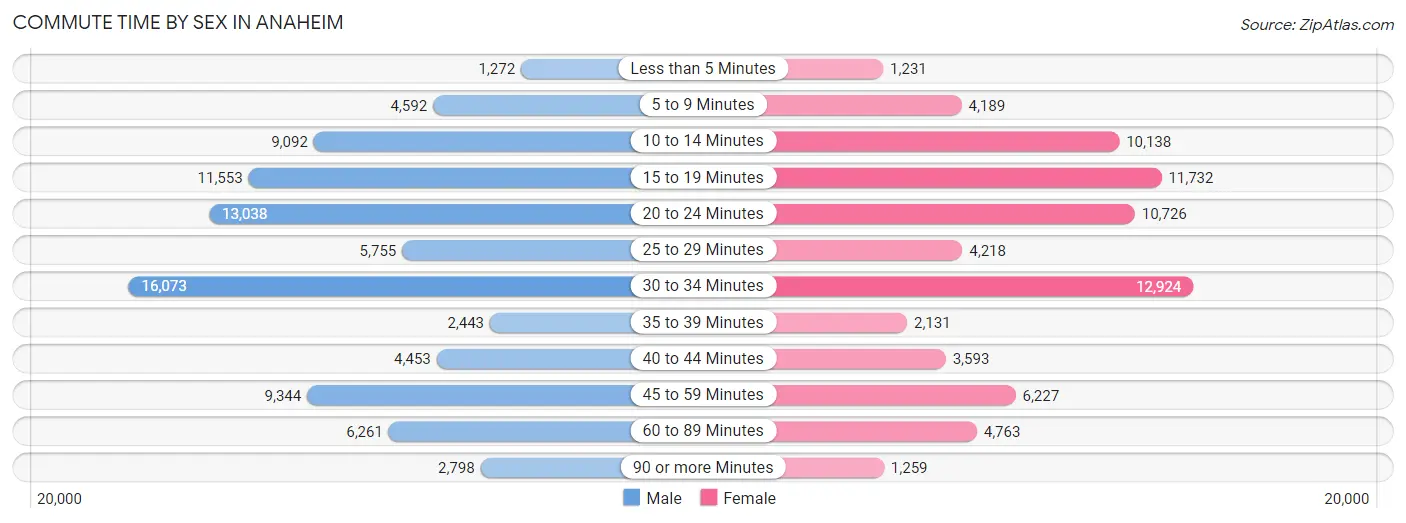
| Commute Time | Male | Female |
| Less than 5 Minutes | 1,272 (1.5%) | 1,231 (1.7%) |
| 5 to 9 Minutes | 4,592 (5.3%) | 4,189 (5.7%) |
| 10 to 14 Minutes | 9,092 (10.5%) | 10,138 (13.9%) |
| 15 to 19 Minutes | 11,553 (13.3%) | 11,732 (16.0%) |
| 20 to 24 Minutes | 13,038 (15.0%) | 10,726 (14.7%) |
| 25 to 29 Minutes | 5,755 (6.6%) | 4,218 (5.8%) |
| 30 to 34 Minutes | 16,073 (18.5%) | 12,924 (17.7%) |
| 35 to 39 Minutes | 2,443 (2.8%) | 2,131 (2.9%) |
| 40 to 44 Minutes | 4,453 (5.1%) | 3,593 (4.9%) |
| 45 to 59 Minutes | 9,344 (10.8%) | 6,227 (8.5%) |
| 60 to 89 Minutes | 6,261 (7.2%) | 4,763 (6.5%) |
| 90 or more Minutes | 2,798 (3.2%) | 1,259 (1.7%) |
Time of Departure to Work by Sex in Anaheim
The most frequent times of departure to work in Anaheim are 7:00 AM to 7:29 AM (11,250, 13.0%) for males and 7:00 AM to 7:29 AM (12,057, 16.5%) for females.
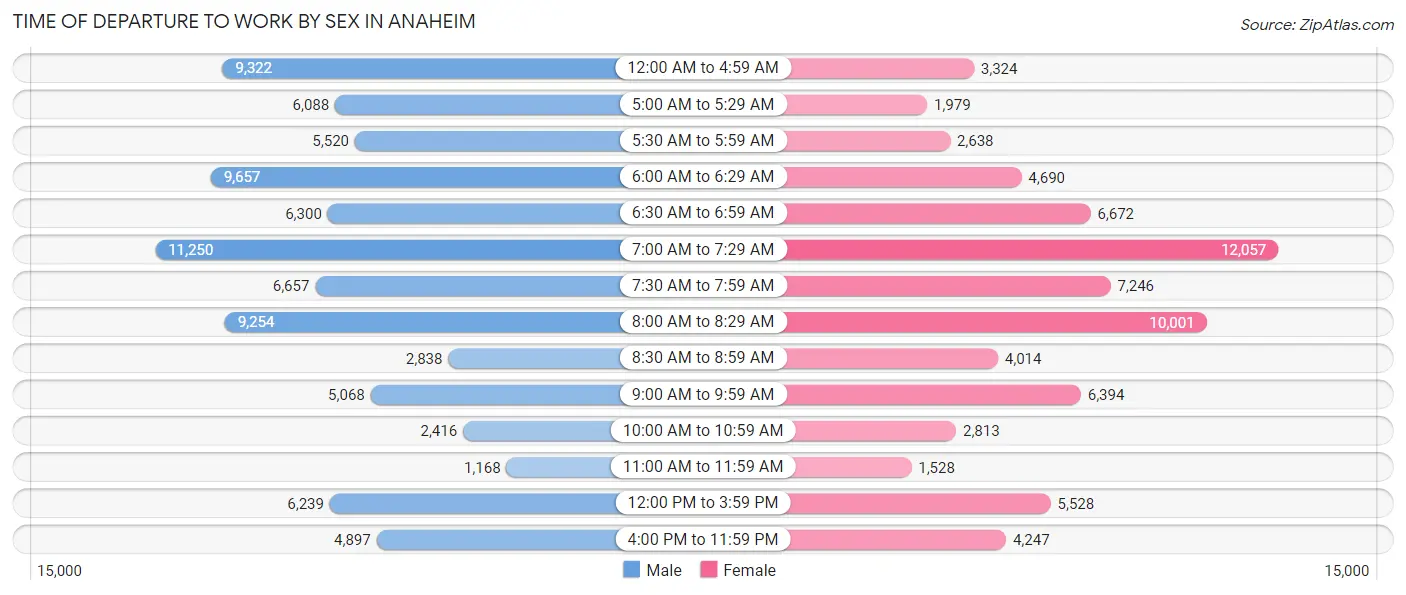
| Time of Departure | Male | Female |
| 12:00 AM to 4:59 AM | 9,322 (10.8%) | 3,324 (4.5%) |
| 5:00 AM to 5:29 AM | 6,088 (7.0%) | 1,979 (2.7%) |
| 5:30 AM to 5:59 AM | 5,520 (6.4%) | 2,638 (3.6%) |
| 6:00 AM to 6:29 AM | 9,657 (11.1%) | 4,690 (6.4%) |
| 6:30 AM to 6:59 AM | 6,300 (7.3%) | 6,672 (9.1%) |
| 7:00 AM to 7:29 AM | 11,250 (13.0%) | 12,057 (16.5%) |
| 7:30 AM to 7:59 AM | 6,657 (7.7%) | 7,246 (9.9%) |
| 8:00 AM to 8:29 AM | 9,254 (10.7%) | 10,001 (13.7%) |
| 8:30 AM to 8:59 AM | 2,838 (3.3%) | 4,014 (5.5%) |
| 9:00 AM to 9:59 AM | 5,068 (5.9%) | 6,394 (8.7%) |
| 10:00 AM to 10:59 AM | 2,416 (2.8%) | 2,813 (3.8%) |
| 11:00 AM to 11:59 AM | 1,168 (1.3%) | 1,528 (2.1%) |
| 12:00 PM to 3:59 PM | 6,239 (7.2%) | 5,528 (7.6%) |
| 4:00 PM to 11:59 PM | 4,897 (5.7%) | 4,247 (5.8%) |
| Total | 86,674 (100.0%) | 73,131 (100.0%) |
Housing Occupancy in Anaheim
Occupancy by Ownership in Anaheim
Of the total 104,671 dwellings in Anaheim, owner-occupied units account for 48,806 (46.6%), while renter-occupied units make up 55,865 (53.4%).
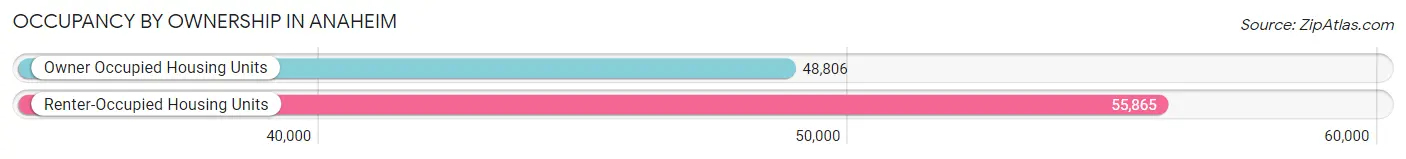
| Occupancy | # Housing Units | % Housing Units |
| Owner Occupied Housing Units | 48,806 | 46.6% |
| Renter-Occupied Housing Units | 55,865 | 53.4% |
| Total Occupied Housing Units | 104,671 | 100.0% |
Occupancy by Household Size in Anaheim
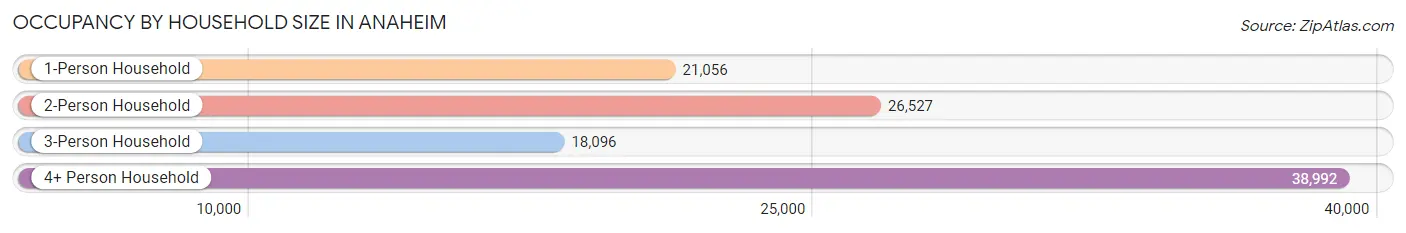
| Household Size | # Housing Units | % Housing Units |
| 1-Person Household | 21,056 | 20.1% |
| 2-Person Household | 26,527 | 25.3% |
| 3-Person Household | 18,096 | 17.3% |
| 4+ Person Household | 38,992 | 37.2% |
| Total Housing Units | 104,671 | 100.0% |
Occupancy by Ownership by Household Size in Anaheim
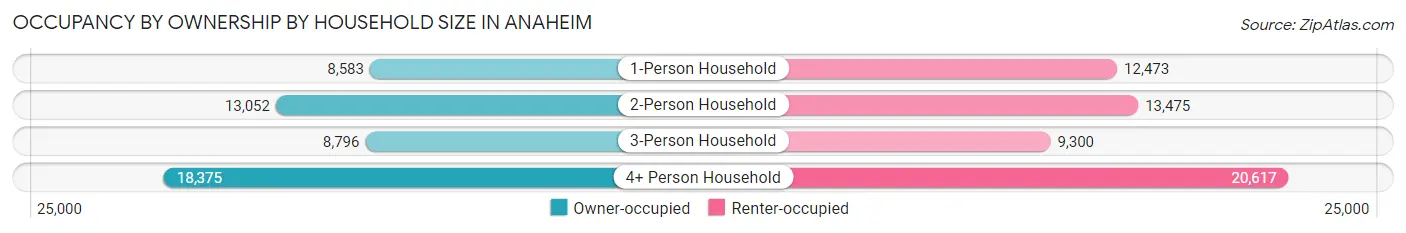
| Household Size | Owner-occupied | Renter-occupied |
| 1-Person Household | 8,583 (40.8%) | 12,473 (59.2%) |
| 2-Person Household | 13,052 (49.2%) | 13,475 (50.8%) |
| 3-Person Household | 8,796 (48.6%) | 9,300 (51.4%) |
| 4+ Person Household | 18,375 (47.1%) | 20,617 (52.9%) |
| Total Housing Units | 48,806 (46.6%) | 55,865 (53.4%) |
Occupancy by Educational Attainment in Anaheim
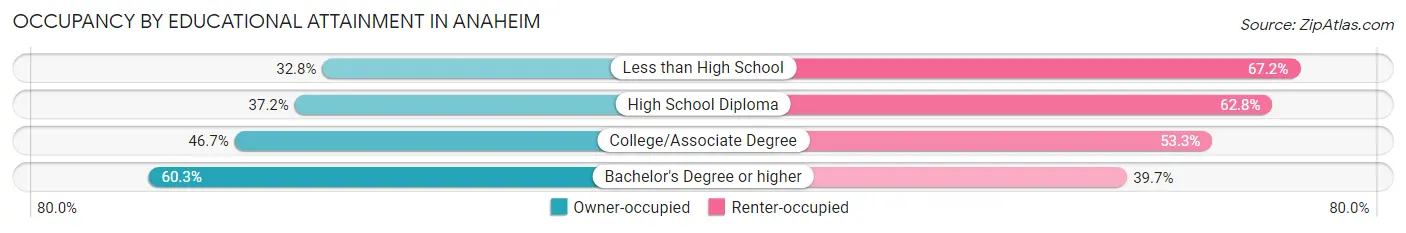
| Household Size | Owner-occupied | Renter-occupied |
| Less than High School | 6,390 (32.8%) | 13,102 (67.2%) |
| High School Diploma | 7,464 (37.2%) | 12,617 (62.8%) |
| College/Associate Degree | 14,840 (46.7%) | 16,928 (53.3%) |
| Bachelor's Degree or higher | 20,112 (60.3%) | 13,218 (39.7%) |
Occupancy by Age of Householder in Anaheim
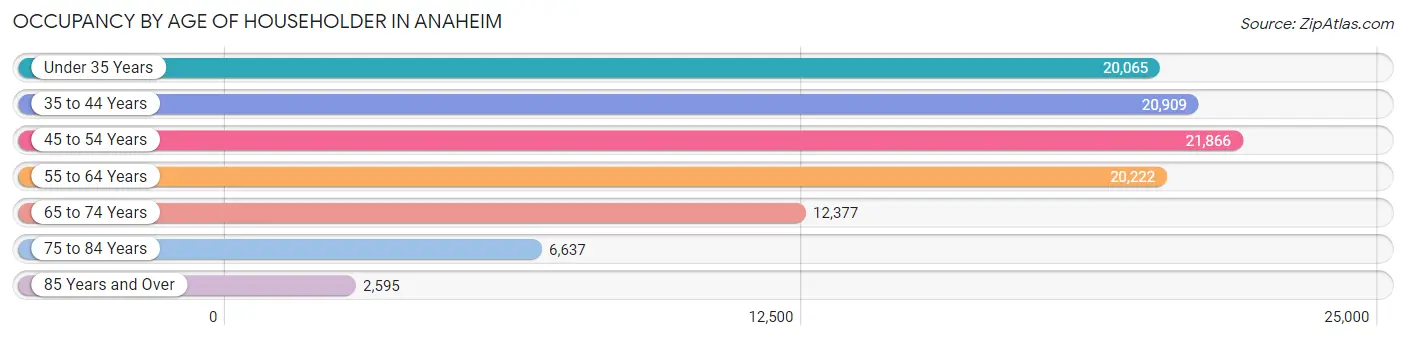
| Age Bracket | # Households | % Households |
| Under 35 Years | 20,065 | 19.2% |
| 35 to 44 Years | 20,909 | 20.0% |
| 45 to 54 Years | 21,866 | 20.9% |
| 55 to 64 Years | 20,222 | 19.3% |
| 65 to 74 Years | 12,377 | 11.8% |
| 75 to 84 Years | 6,637 | 6.3% |
| 85 Years and Over | 2,595 | 2.5% |
| Total | 104,671 | 100.0% |
Housing Finances in Anaheim
Median Income by Occupancy in Anaheim
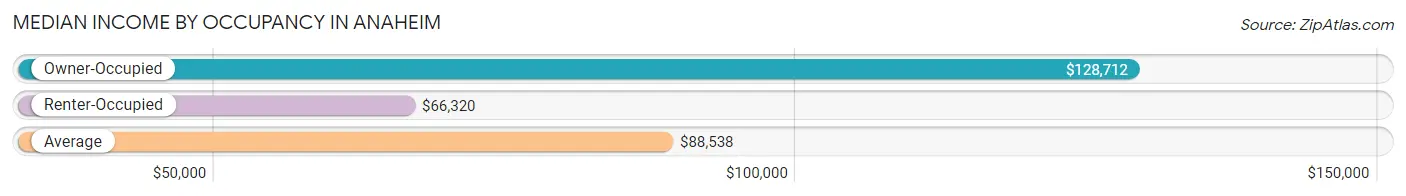
| Occupancy Type | # Households | Median Income |
| Owner-Occupied | 48,806 (46.6%) | $128,712 |
| Renter-Occupied | 55,865 (53.4%) | $66,320 |
| Average | 104,671 (100.0%) | $88,538 |
Occupancy by Householder Income Bracket in Anaheim
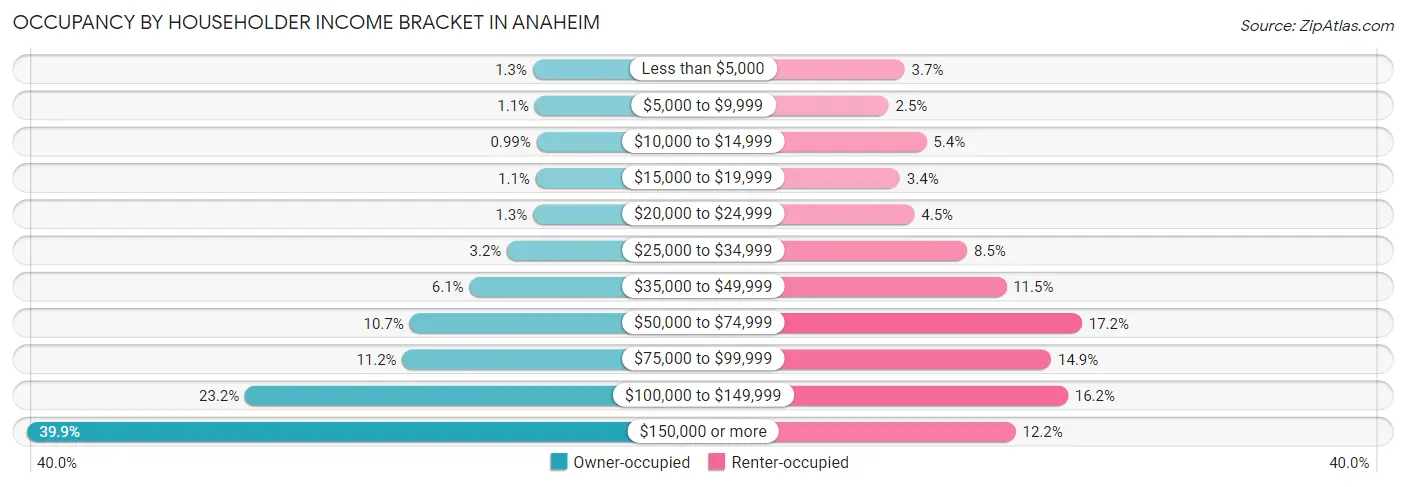
| Income Bracket | Owner-occupied | Renter-occupied |
| Less than $5,000 | 627 (1.3%) | 2,091 (3.7%) |
| $5,000 to $9,999 | 547 (1.1%) | 1,410 (2.5%) |
| $10,000 to $14,999 | 484 (1.0%) | 3,015 (5.4%) |
| $15,000 to $19,999 | 516 (1.1%) | 1,890 (3.4%) |
| $20,000 to $24,999 | 617 (1.3%) | 2,505 (4.5%) |
| $25,000 to $34,999 | 1,577 (3.2%) | 4,746 (8.5%) |
| $35,000 to $49,999 | 2,981 (6.1%) | 6,413 (11.5%) |
| $50,000 to $74,999 | 5,210 (10.7%) | 9,632 (17.2%) |
| $75,000 to $99,999 | 5,473 (11.2%) | 8,322 (14.9%) |
| $100,000 to $149,999 | 11,324 (23.2%) | 9,031 (16.2%) |
| $150,000 or more | 19,450 (39.9%) | 6,810 (12.2%) |
| Total | 48,806 (100.0%) | 55,865 (100.0%) |
Monthly Housing Cost Tiers in Anaheim
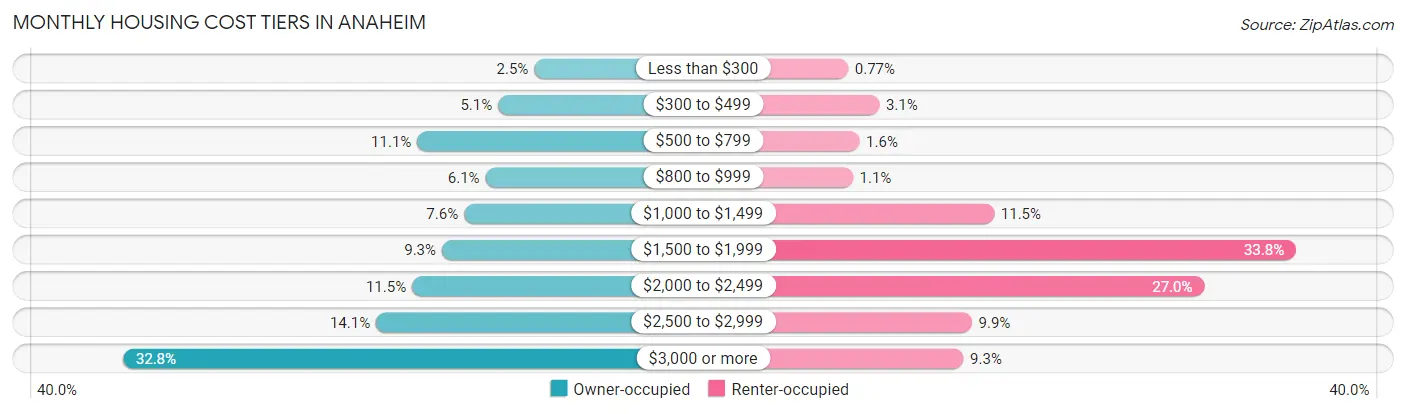
| Monthly Cost | Owner-occupied | Renter-occupied |
| Less than $300 | 1,205 (2.5%) | 429 (0.8%) |
| $300 to $499 | 2,503 (5.1%) | 1,709 (3.1%) |
| $500 to $799 | 5,414 (11.1%) | 892 (1.6%) |
| $800 to $999 | 2,956 (6.1%) | 624 (1.1%) |
| $1,000 to $1,499 | 3,729 (7.6%) | 6,436 (11.5%) |
| $1,500 to $1,999 | 4,523 (9.3%) | 18,866 (33.8%) |
| $2,000 to $2,499 | 5,596 (11.5%) | 15,097 (27.0%) |
| $2,500 to $2,999 | 6,889 (14.1%) | 5,518 (9.9%) |
| $3,000 or more | 15,991 (32.8%) | 5,172 (9.3%) |
| Total | 48,806 (100.0%) | 55,865 (100.0%) |
Physical Housing Characteristics in Anaheim
Housing Structures in Anaheim
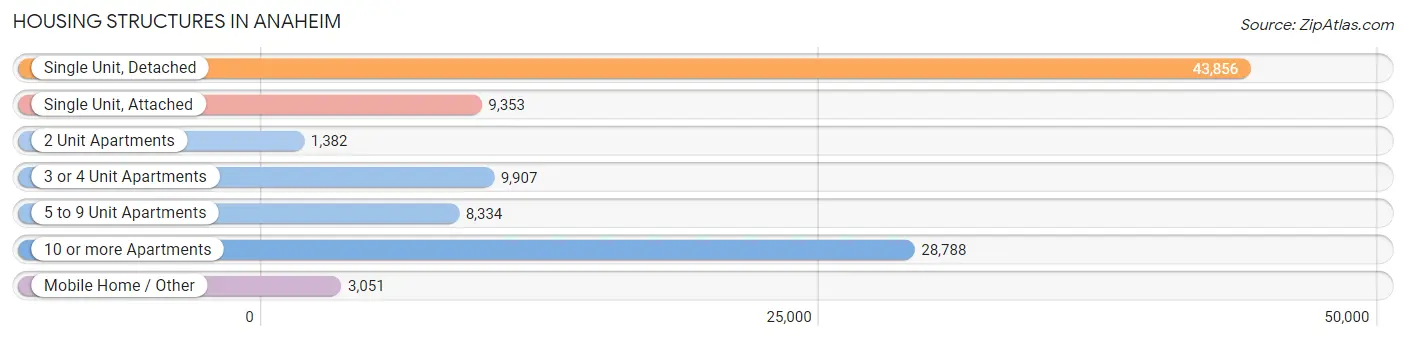
| Structure Type | # Housing Units | % Housing Units |
| Single Unit, Detached | 43,856 | 41.9% |
| Single Unit, Attached | 9,353 | 8.9% |
| 2 Unit Apartments | 1,382 | 1.3% |
| 3 or 4 Unit Apartments | 9,907 | 9.5% |
| 5 to 9 Unit Apartments | 8,334 | 8.0% |
| 10 or more Apartments | 28,788 | 27.5% |
| Mobile Home / Other | 3,051 | 2.9% |
| Total | 104,671 | 100.0% |
Housing Structures by Occupancy in Anaheim
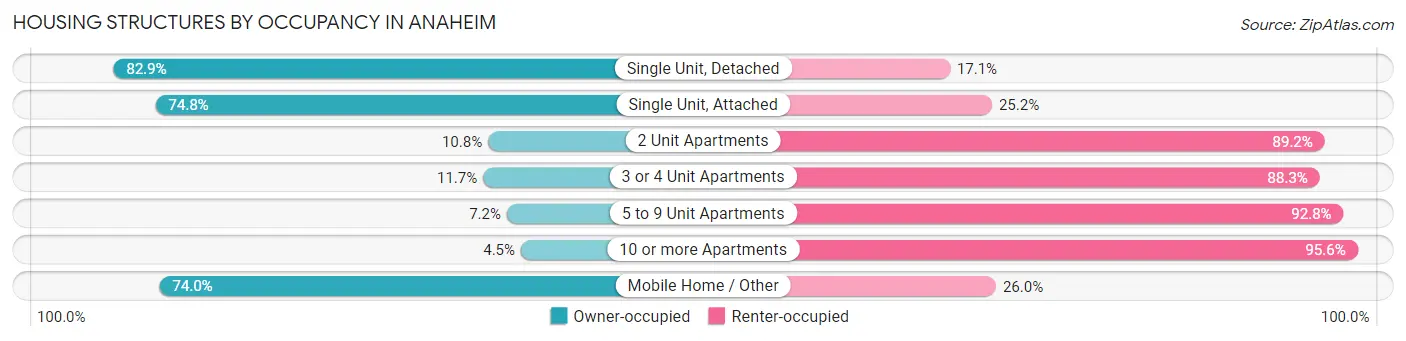
| Structure Type | Owner-occupied | Renter-occupied |
| Single Unit, Detached | 36,362 (82.9%) | 7,494 (17.1%) |
| Single Unit, Attached | 6,997 (74.8%) | 2,356 (25.2%) |
| 2 Unit Apartments | 149 (10.8%) | 1,233 (89.2%) |
| 3 or 4 Unit Apartments | 1,162 (11.7%) | 8,745 (88.3%) |
| 5 to 9 Unit Apartments | 597 (7.2%) | 7,737 (92.8%) |
| 10 or more Apartments | 1,280 (4.4%) | 27,508 (95.6%) |
| Mobile Home / Other | 2,259 (74.0%) | 792 (26.0%) |
| Total | 48,806 (46.6%) | 55,865 (53.4%) |
Housing Structures by Number of Rooms in Anaheim
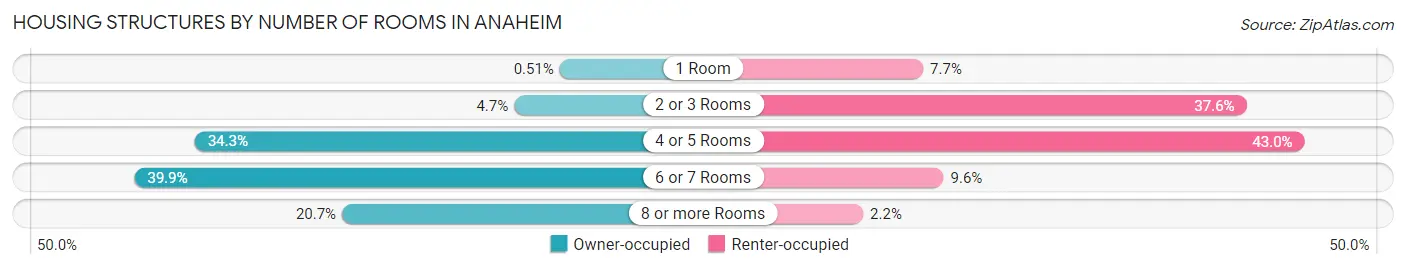
| Number of Rooms | Owner-occupied | Renter-occupied |
| 1 Room | 247 (0.5%) | 4,304 (7.7%) |
| 2 or 3 Rooms | 2,307 (4.7%) | 21,002 (37.6%) |
| 4 or 5 Rooms | 16,722 (34.3%) | 23,998 (43.0%) |
| 6 or 7 Rooms | 19,450 (39.9%) | 5,359 (9.6%) |
| 8 or more Rooms | 10,080 (20.6%) | 1,202 (2.1%) |
| Total | 48,806 (100.0%) | 55,865 (100.0%) |
Housing Structure by Heating Type in Anaheim
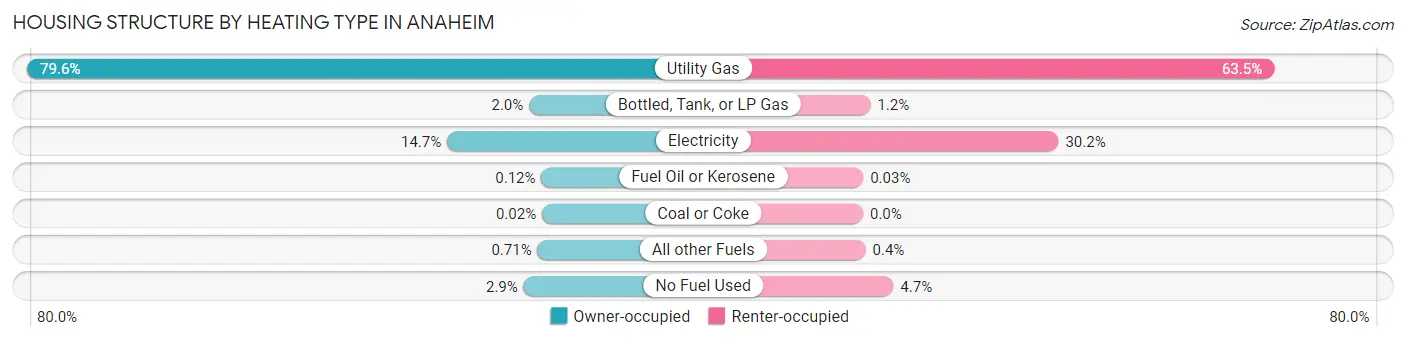
| Heating Type | Owner-occupied | Renter-occupied |
| Utility Gas | 38,849 (79.6%) | 35,485 (63.5%) |
| Bottled, Tank, or LP Gas | 980 (2.0%) | 642 (1.1%) |
| Electricity | 7,168 (14.7%) | 16,878 (30.2%) |
| Fuel Oil or Kerosene | 59 (0.1%) | 19 (0.0%) |
| Coal or Coke | 8 (0.0%) | 0 (0.0%) |
| All other Fuels | 346 (0.7%) | 223 (0.4%) |
| No Fuel Used | 1,396 (2.9%) | 2,618 (4.7%) |
| Total | 48,806 (100.0%) | 55,865 (100.0%) |
Household Vehicle Usage in Anaheim
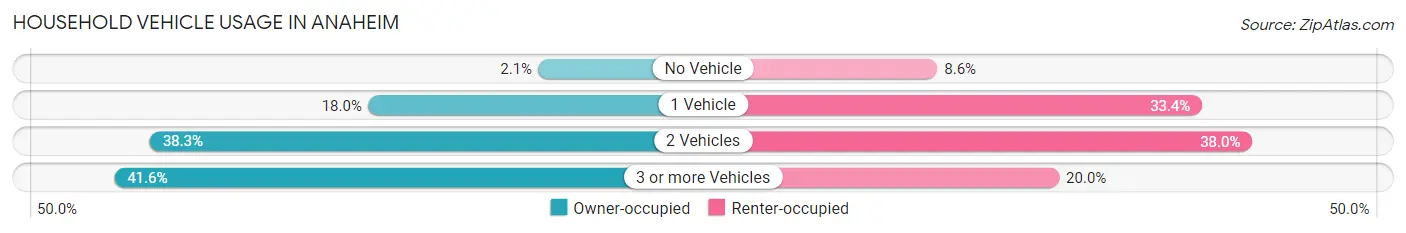
| Vehicles per Household | Owner-occupied | Renter-occupied |
| No Vehicle | 1,016 (2.1%) | 4,823 (8.6%) |
| 1 Vehicle | 8,769 (18.0%) | 18,632 (33.4%) |
| 2 Vehicles | 18,701 (38.3%) | 21,238 (38.0%) |
| 3 or more Vehicles | 20,320 (41.6%) | 11,172 (20.0%) |
| Total | 48,806 (100.0%) | 55,865 (100.0%) |
Real Estate & Mortgages in Anaheim
Real Estate and Mortgage Overview in Anaheim
| Characteristic | Without Mortgage | With Mortgage |
| Housing Units | 14,250 | 34,556 |
| Median Property Value | $664,900 | $735,600 |
| Median Household Income | $94,503 | $15,600 |
| Monthly Housing Costs | $714 | $15,878 |
| Real Estate Taxes | $3,499 | $442 |
Property Value by Mortgage Status in Anaheim
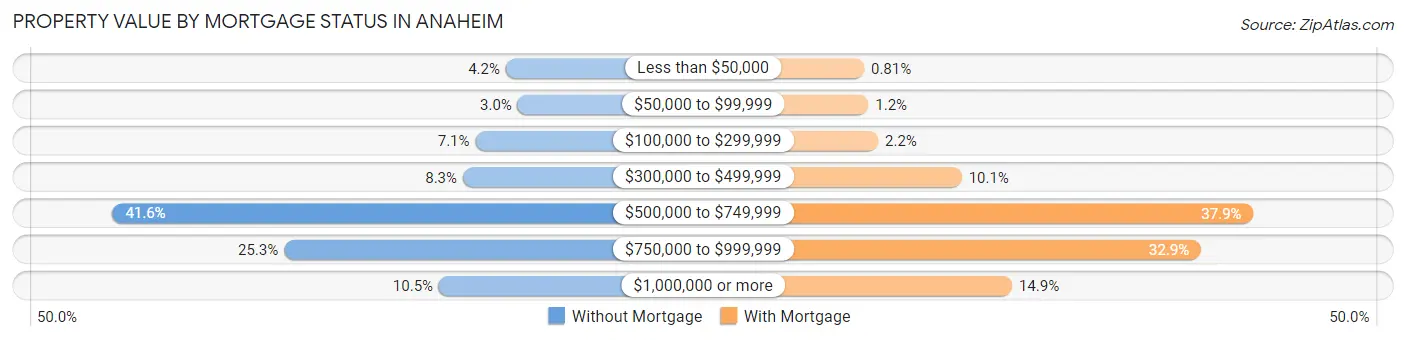
| Property Value | Without Mortgage | With Mortgage |
| Less than $50,000 | 594 (4.2%) | 279 (0.8%) |
| $50,000 to $99,999 | 433 (3.0%) | 422 (1.2%) |
| $100,000 to $299,999 | 1,008 (7.1%) | 744 (2.1%) |
| $300,000 to $499,999 | 1,177 (8.3%) | 3,495 (10.1%) |
| $500,000 to $749,999 | 5,932 (41.6%) | 13,092 (37.9%) |
| $750,000 to $999,999 | 3,604 (25.3%) | 11,374 (32.9%) |
| $1,000,000 or more | 1,502 (10.5%) | 5,150 (14.9%) |
| Total | 14,250 (100.0%) | 34,556 (100.0%) |
Household Income by Mortgage Status in Anaheim
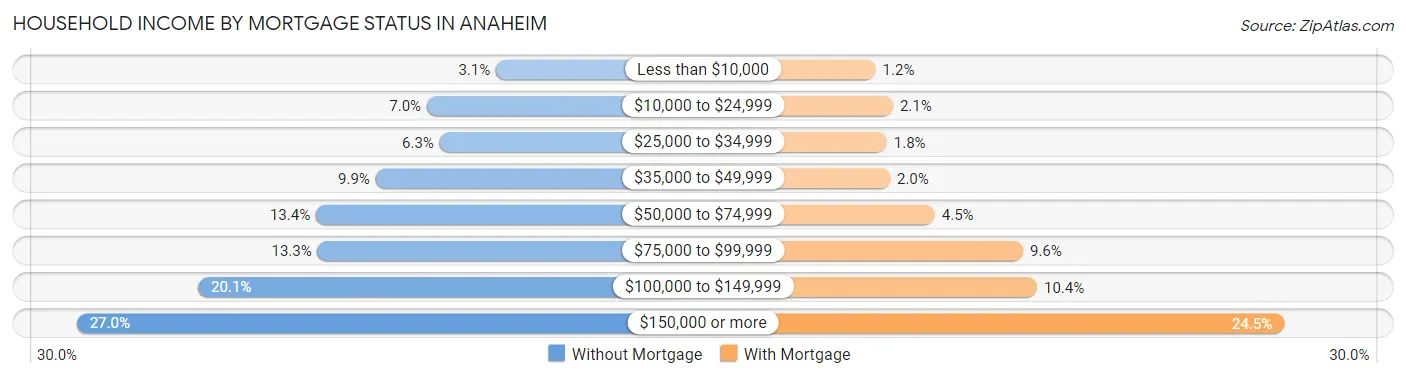
| Household Income | Without Mortgage | With Mortgage |
| Less than $10,000 | 436 (3.1%) | 399 (1.1%) |
| $10,000 to $24,999 | 999 (7.0%) | 738 (2.1%) |
| $25,000 to $34,999 | 895 (6.3%) | 618 (1.8%) |
| $35,000 to $49,999 | 1,416 (9.9%) | 682 (2.0%) |
| $50,000 to $74,999 | 1,903 (13.4%) | 1,565 (4.5%) |
| $75,000 to $99,999 | 1,890 (13.3%) | 3,307 (9.6%) |
| $100,000 to $149,999 | 2,861 (20.1%) | 3,583 (10.4%) |
| $150,000 or more | 3,850 (27.0%) | 8,463 (24.5%) |
| Total | 14,250 (100.0%) | 34,556 (100.0%) |
Property Value to Household Income Ratio in Anaheim
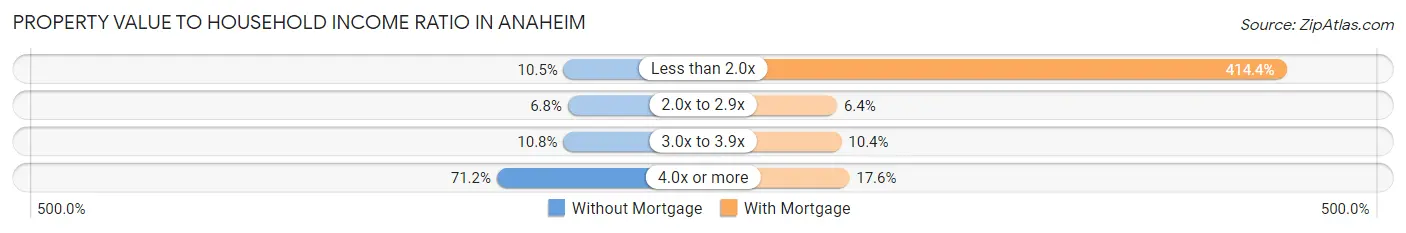
| Value-to-Income Ratio | Without Mortgage | With Mortgage |
| Less than 2.0x | 1,498 (10.5%) | 143,197 (414.4%) |
| 2.0x to 2.9x | 962 (6.8%) | 2,201 (6.4%) |
| 3.0x to 3.9x | 1,533 (10.8%) | 3,599 (10.4%) |
| 4.0x or more | 10,150 (71.2%) | 6,079 (17.6%) |
| Total | 14,250 (100.0%) | 34,556 (100.0%) |
Real Estate Taxes by Mortgage Status in Anaheim
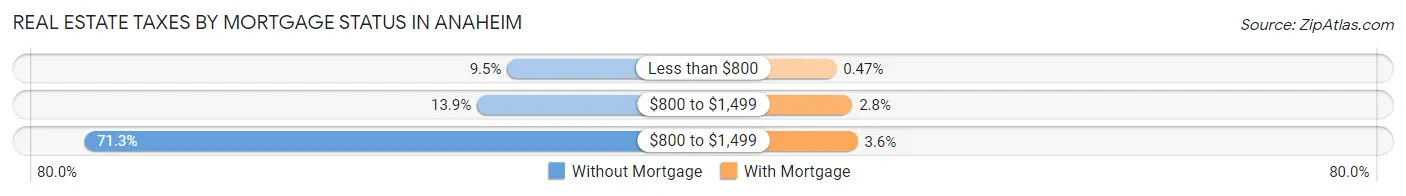
| Property Taxes | Without Mortgage | With Mortgage |
| Less than $800 | 1,349 (9.5%) | 162 (0.5%) |
| $800 to $1,499 | 1,980 (13.9%) | 968 (2.8%) |
| $800 to $1,499 | 10,160 (71.3%) | 1,236 (3.6%) |
| Total | 14,250 (100.0%) | 34,556 (100.0%) |
Health & Disability in Anaheim
Health Insurance Coverage by Age in Anaheim
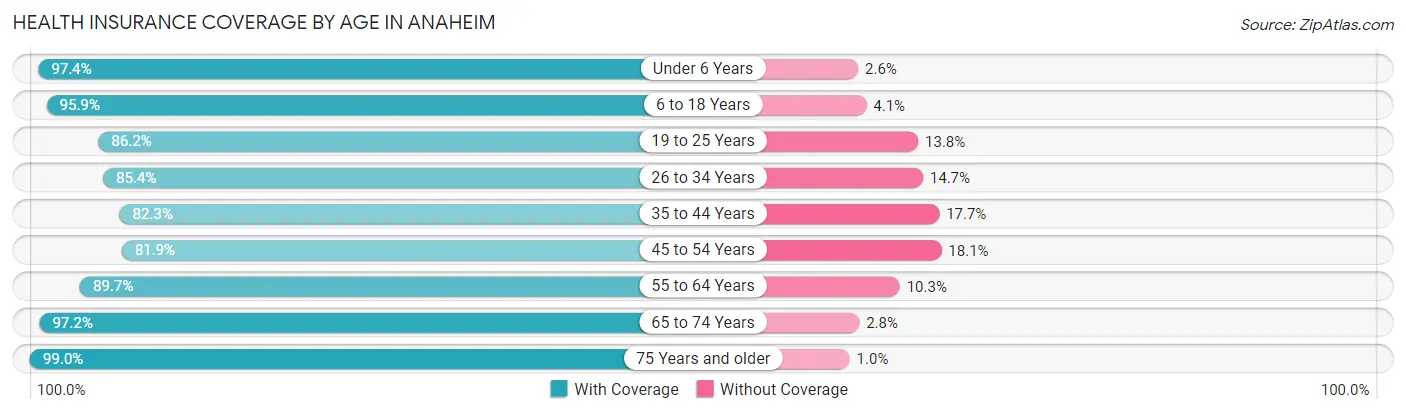
| Age Bracket | With Coverage | Without Coverage |
| Under 6 Years | 24,976 (97.4%) | 659 (2.6%) |
| 6 to 18 Years | 56,484 (95.9%) | 2,423 (4.1%) |
| 19 to 25 Years | 32,072 (86.2%) | 5,120 (13.8%) |
| 26 to 34 Years | 42,156 (85.4%) | 7,237 (14.6%) |
| 35 to 44 Years | 38,151 (82.3%) | 8,204 (17.7%) |
| 45 to 54 Years | 37,220 (81.9%) | 8,231 (18.1%) |
| 55 to 64 Years | 36,752 (89.7%) | 4,240 (10.3%) |
| 65 to 74 Years | 23,589 (97.2%) | 674 (2.8%) |
| 75 Years and older | 16,858 (99.0%) | 171 (1.0%) |
| Total | 308,258 (89.3%) | 36,959 (10.7%) |
Health Insurance Coverage by Citizenship Status in Anaheim
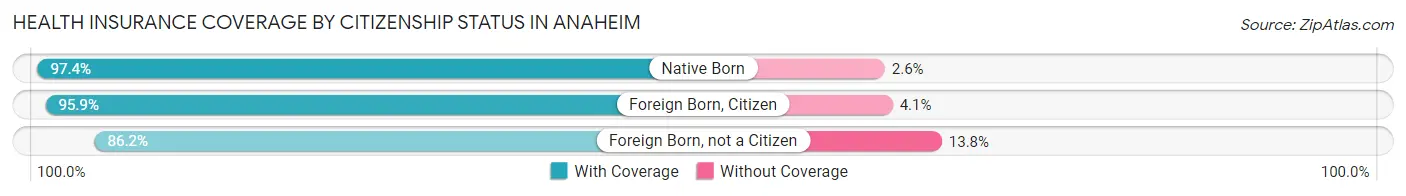
| Citizenship Status | With Coverage | Without Coverage |
| Native Born | 24,976 (97.4%) | 659 (2.6%) |
| Foreign Born, Citizen | 56,484 (95.9%) | 2,423 (4.1%) |
| Foreign Born, not a Citizen | 32,072 (86.2%) | 5,120 (13.8%) |
Health Insurance Coverage by Household Income in Anaheim
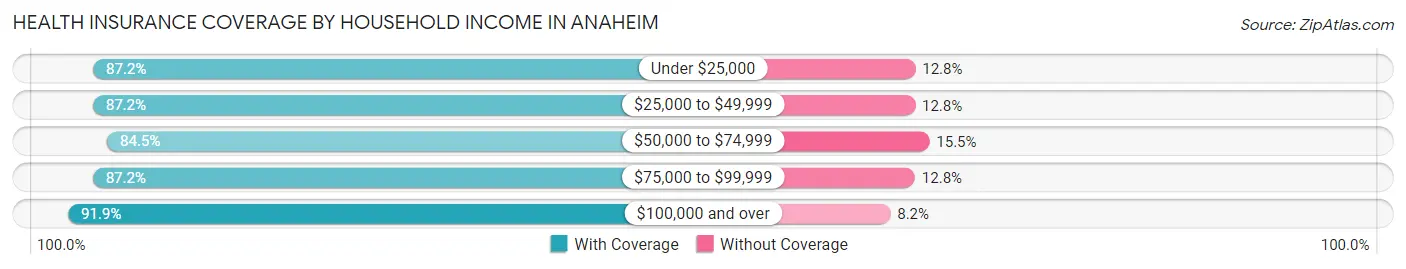
| Household Income | With Coverage | Without Coverage |
| Under $25,000 | 24,688 (87.2%) | 3,633 (12.8%) |
| $25,000 to $49,999 | 38,117 (87.2%) | 5,586 (12.8%) |
| $50,000 to $74,999 | 39,105 (84.5%) | 7,157 (15.5%) |
| $75,000 to $99,999 | 40,430 (87.2%) | 5,915 (12.8%) |
| $100,000 and over | 161,812 (91.8%) | 14,360 (8.2%) |
Public vs Private Health Insurance Coverage by Age in Anaheim
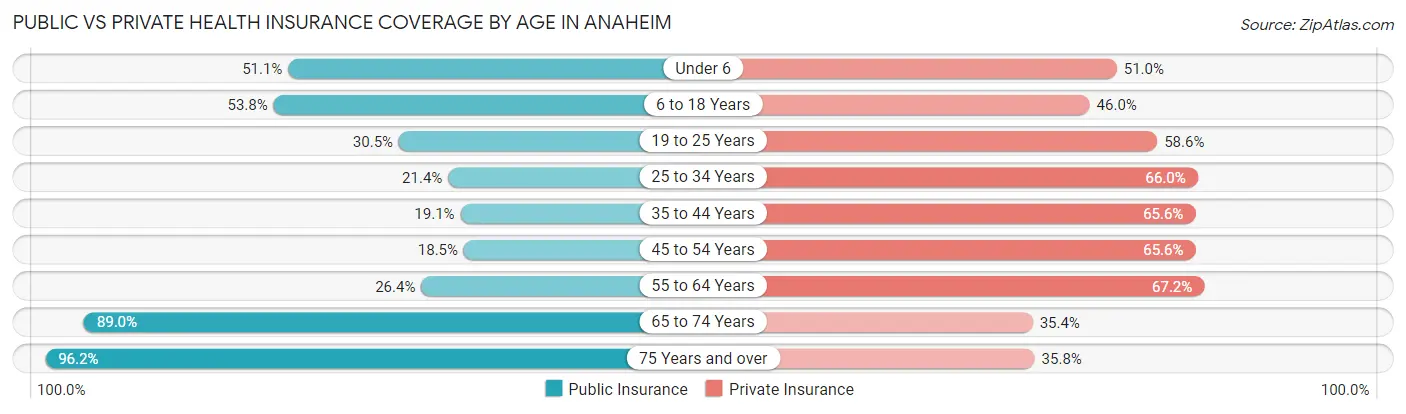
| Age Bracket | Public Insurance | Private Insurance |
| Under 6 | 13,093 (51.1%) | 13,085 (51.0%) |
| 6 to 18 Years | 31,686 (53.8%) | 27,106 (46.0%) |
| 19 to 25 Years | 11,350 (30.5%) | 21,775 (58.6%) |
| 25 to 34 Years | 10,561 (21.4%) | 32,621 (66.0%) |
| 35 to 44 Years | 8,859 (19.1%) | 30,403 (65.6%) |
| 45 to 54 Years | 8,394 (18.5%) | 29,818 (65.6%) |
| 55 to 64 Years | 10,815 (26.4%) | 27,563 (67.2%) |
| 65 to 74 Years | 21,592 (89.0%) | 8,596 (35.4%) |
| 75 Years and over | 16,377 (96.2%) | 6,096 (35.8%) |
| Total | 132,727 (38.5%) | 197,063 (57.1%) |
Disability Status by Sex by Age in Anaheim
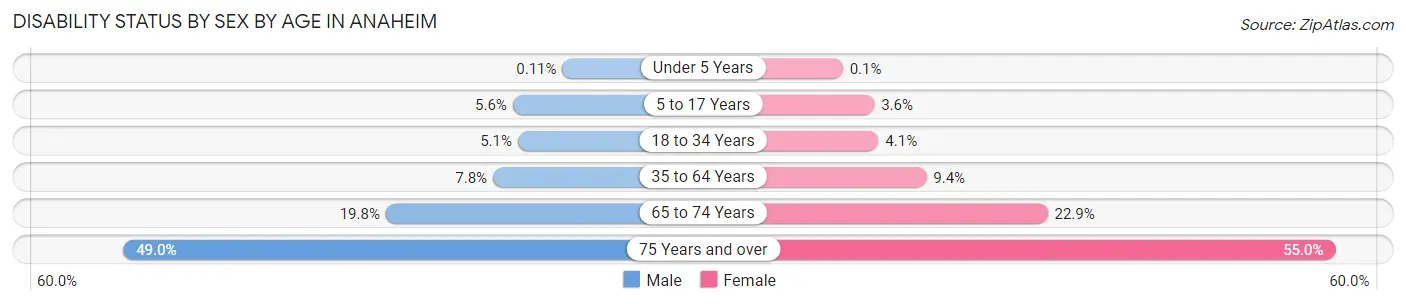
| Age Bracket | Male | Female |
| Under 5 Years | 12 (0.1%) | 10 (0.1%) |
| 5 to 17 Years | 1,644 (5.6%) | 1,051 (3.6%) |
| 18 to 34 Years | 2,283 (5.1%) | 1,904 (4.1%) |
| 35 to 64 Years | 5,151 (7.8%) | 6,318 (9.4%) |
| 65 to 74 Years | 2,179 (19.8%) | 3,036 (22.9%) |
| 75 Years and over | 3,306 (49.0%) | 5,651 (54.9%) |
Disability Class by Sex by Age in Anaheim
Disability Class: Hearing Difficulty
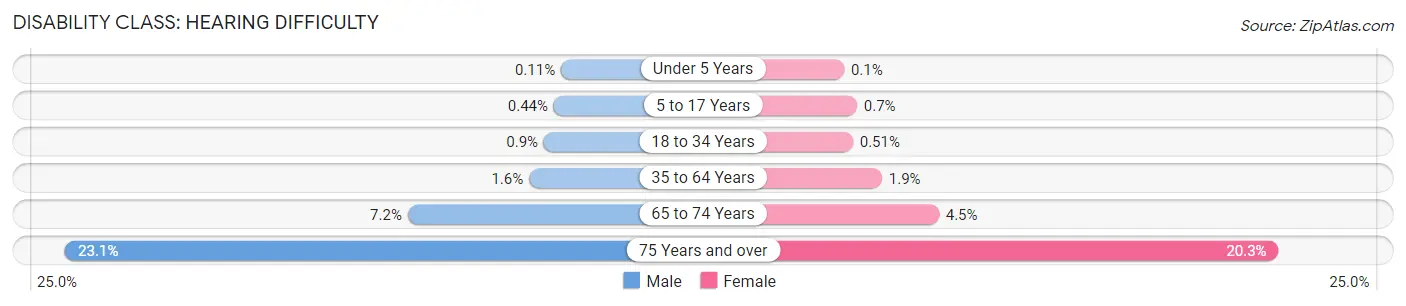
| Age Bracket | Male | Female |
| Under 5 Years | 12 (0.1%) | 10 (0.1%) |
| 5 to 17 Years | 128 (0.4%) | 204 (0.7%) |
| 18 to 34 Years | 403 (0.9%) | 240 (0.5%) |
| 35 to 64 Years | 1,043 (1.6%) | 1,245 (1.9%) |
| 65 to 74 Years | 795 (7.2%) | 596 (4.5%) |
| 75 Years and over | 1,560 (23.1%) | 2,083 (20.3%) |
Disability Class: Vision Difficulty
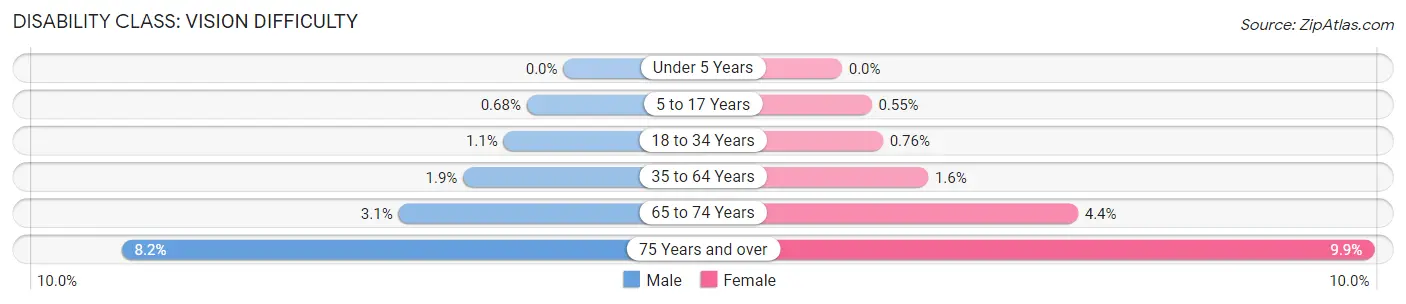
| Age Bracket | Male | Female |
| Under 5 Years | 0 (0.0%) | 0 (0.0%) |
| 5 to 17 Years | 198 (0.7%) | 160 (0.5%) |
| 18 to 34 Years | 501 (1.1%) | 353 (0.8%) |
| 35 to 64 Years | 1,224 (1.9%) | 1,072 (1.6%) |
| 65 to 74 Years | 337 (3.1%) | 580 (4.4%) |
| 75 Years and over | 553 (8.2%) | 1,016 (9.9%) |
Disability Class: Cognitive Difficulty
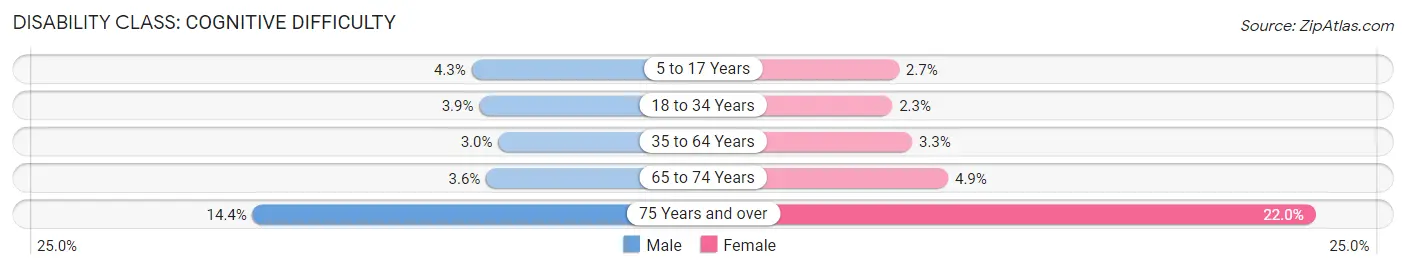
| Age Bracket | Male | Female |
| 5 to 17 Years | 1,243 (4.3%) | 773 (2.6%) |
| 18 to 34 Years | 1,757 (3.9%) | 1,090 (2.3%) |
| 35 to 64 Years | 1,986 (3.0%) | 2,187 (3.3%) |
| 65 to 74 Years | 394 (3.6%) | 653 (4.9%) |
| 75 Years and over | 973 (14.4%) | 2,260 (22.0%) |
Disability Class: Ambulatory Difficulty
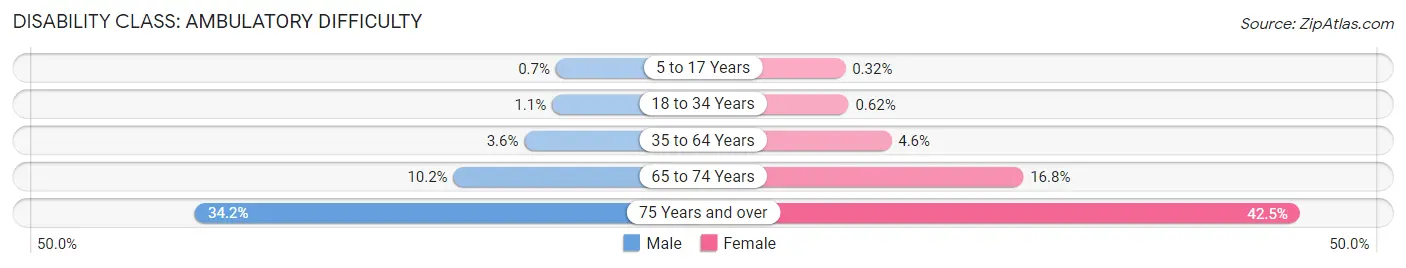
| Age Bracket | Male | Female |
| 5 to 17 Years | 205 (0.7%) | 94 (0.3%) |
| 18 to 34 Years | 474 (1.1%) | 290 (0.6%) |
| 35 to 64 Years | 2,378 (3.6%) | 3,077 (4.6%) |
| 65 to 74 Years | 1,123 (10.2%) | 2,231 (16.8%) |
| 75 Years and over | 2,306 (34.2%) | 4,369 (42.5%) |
Disability Class: Self-Care Difficulty
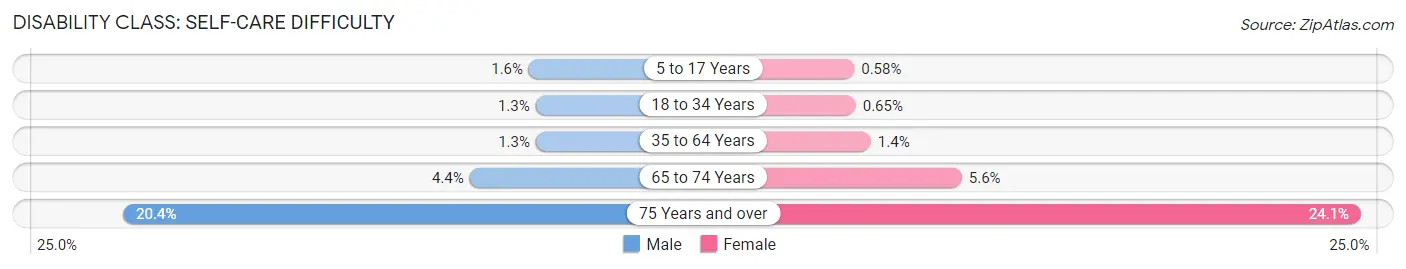
| Age Bracket | Male | Female |
| 5 to 17 Years | 468 (1.6%) | 170 (0.6%) |
| 18 to 34 Years | 579 (1.3%) | 302 (0.6%) |
| 35 to 64 Years | 841 (1.3%) | 907 (1.3%) |
| 65 to 74 Years | 479 (4.3%) | 738 (5.6%) |
| 75 Years and over | 1,378 (20.4%) | 2,477 (24.1%) |
Technology Access in Anaheim
Computing Device Access in Anaheim
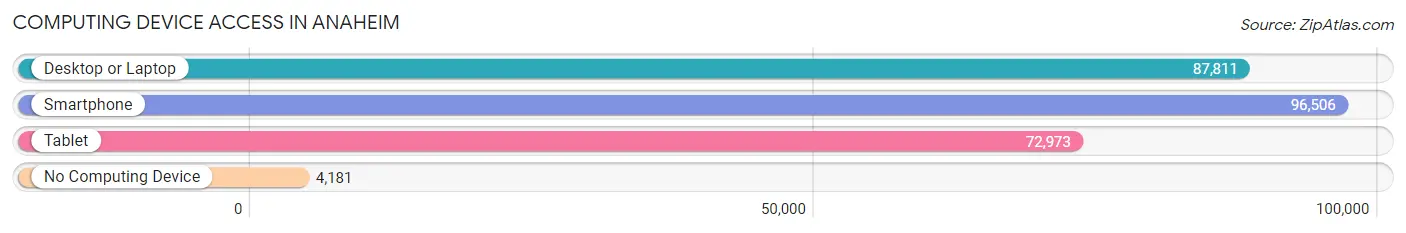
| Device Type | # Households | % Households |
| Desktop or Laptop | 87,811 | 83.9% |
| Smartphone | 96,506 | 92.2% |
| Tablet | 72,973 | 69.7% |
| No Computing Device | 4,181 | 4.0% |
| Total | 104,671 | 100.0% |
Internet Access in Anaheim
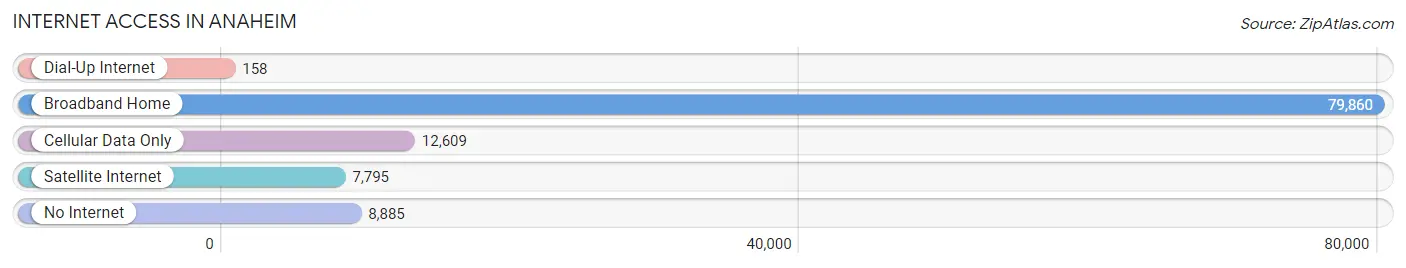
| Internet Type | # Households | % Households |
| Dial-Up Internet | 158 | 0.2% |
| Broadband Home | 79,860 | 76.3% |
| Cellular Data Only | 12,609 | 12.0% |
| Satellite Internet | 7,795 | 7.4% |
| No Internet | 8,885 | 8.5% |
| Total | 104,671 | 100.0% |
Anaheim Summary
Anaheim, California is a city located in Orange County, California, United States. It is the tenth most populous city in the state of California and the most populous city in Orange County. Anaheim is known for its theme parks, sports teams, and convention center. The city is home to the Anaheim Ducks of the National Hockey League, the Los Angeles Angels of Major League Baseball, and the Anaheim Convention Center.
History
Anaheim was founded in 1857 by fifty German families who were looking for a place to settle in the area. The city was originally named "Annaheim" after the German word for "home". The name was later changed to Anaheim in 1876. The city was incorporated in 1870 and was the second city to be incorporated in Orange County.
In the early 1900s, Anaheim was a major agricultural center, producing citrus fruits, grapes, and walnuts. The city was also home to a large number of dairies. In the 1950s, Anaheim began to experience a population boom due to the construction of Disneyland. The city's population grew from 11,000 in 1950 to over 200,000 in 1960.
Geography
Anaheim is located in the northern part of Orange County, California. It is bordered by the cities of Fullerton, Buena Park, and Garden Grove. The city covers an area of 50.5 square miles and has a population of over 350,000. The city is located in the Santa Ana River Valley and is surrounded by hills and mountains.
The climate in Anaheim is Mediterranean, with hot, dry summers and mild, wet winters. The average temperature in the summer is around 80°F and in the winter it is around 60°F.
Economy
Anaheim is a major tourist destination due to its proximity to Disneyland and other attractions. The city is also home to a number of corporate headquarters, including the headquarters of the Anaheim Ducks, the Los Angeles Angels, and the Anaheim Convention Center.
The city's economy is also driven by its manufacturing sector, which includes electronics, aerospace, and automotive parts. The city is also home to a number of technology companies, including Hewlett-Packard, Broadcom, and Western Digital.
Demographics
As of the 2010 census, the population of Anaheim was 336,265. The racial makeup of the city was 57.2% White, 3.3% African American, 0.7% Native American, 25.2% Asian, 0.3% Pacific Islander, 8.7% from other races, and 4.1% from two or more races. Hispanic or Latino of any race were 25.2% of the population.
The median household income in Anaheim was $60,845 in 2018. The median age of the city's population was 35.7 years. The city's population is also highly educated, with over 40% of the population having a bachelor's degree or higher.
Anaheim is a diverse city with a variety of cultures and backgrounds. The city is home to a large number of immigrants from Mexico, Vietnam, and other countries. The city is also home to a large number of religious institutions, including churches, mosques, and temples.
Common Questions
What is Per Capita Income in Anaheim?
Per Capita income in Anaheim is $35,331.
What is the Median Family Income in Anaheim?
Median Family Income in Anaheim is $95,320.
What is the Median Household income in Anaheim?
Median Household Income in Anaheim is $88,538.
What is Income or Wage Gap in Anaheim?
Income or Wage Gap in Anaheim is 23.7%.
Women in Anaheim earn 76.3 cents for every dollar earned by a man.
What is Family Income Deficit in Anaheim?
Family Income Deficit in Anaheim is $11,416.
Families that are below poverty line in Anaheim earn $11,416 less on average than the poverty threshold level.
What is Inequality or Gini Index in Anaheim?
Inequality or Gini Index in Anaheim is 0.44.
What is the Total Population of Anaheim?
Total Population of Anaheim is 347,111.
What is the Total Male Population of Anaheim?
Total Male Population of Anaheim is 169,425.
What is the Total Female Population of Anaheim?
Total Female Population of Anaheim is 177,686.
What is the Ratio of Males per 100 Females in Anaheim?
There are 95.35 Males per 100 Females in Anaheim.
What is the Ratio of Females per 100 Males in Anaheim?
There are 104.88 Females per 100 Males in Anaheim.
What is the Median Population Age in Anaheim?
Median Population Age in Anaheim is 35.4 Years.
What is the Average Family Size in Anaheim
Average Family Size in Anaheim is 3.8 People.
What is the Average Household Size in Anaheim
Average Household Size in Anaheim is 3.3 People.
How Large is the Labor Force in Anaheim?
There are 186,932 People in the Labor Forcein in Anaheim.
What is the Percentage of People in the Labor Force in Anaheim?
67.4% of People are in the Labor Force in Anaheim.
What is the Unemployment Rate in Anaheim?
Unemployment Rate in Anaheim is 5.4%.