College Station, TX Map & Demographics
College Station Map
College Station Overview
$31,381
PER CAPITA INCOME
$93,505
AVG FAMILY INCOME
$52,397
AVG HOUSEHOLD INCOME
25.8%
WAGE / INCOME GAP [ % ]
74.2¢/ $1
WAGE / INCOME GAP [ $ ]
$12,294
FAMILY INCOME DEFICIT
0.54
INEQUALITY / GINI INDEX
120,451
TOTAL POPULATION
61,867
MALE POPULATION
58,584
FEMALE POPULATION
105.60
MALES / 100 FEMALES
94.69
FEMALES / 100 MALES
22.9
MEDIAN AGE
3.0
AVG FAMILY SIZE
2.4
AVG HOUSEHOLD SIZE
63,369
LABOR FORCE [ PEOPLE ]
61.6%
PERCENT IN LABOR FORCE
4.7%
UNEMPLOYMENT RATE
College Station Area Codes
Income in College Station
Income Overview in College Station
Per Capita Income in College Station is $31,381, while median incomes of families and households are $93,505 and $52,397 respectively.
| Characteristic | Number | Measure |
| Per Capita Income | 120,451 | $31,381 |
| Median Family Income | 20,912 | $93,505 |
| Mean Family Income | 20,912 | $121,032 |
| Median Household Income | 44,029 | $52,397 |
| Mean Household Income | 44,029 | $82,614 |
| Income Deficit | 20,912 | $12,294 |
| Wage / Income Gap (%) | 120,451 | 25.83% |
| Wage / Income Gap ($) | 120,451 | 74.17¢ per $1 |
| Gini / Inequality Index | 120,451 | 0.54 |
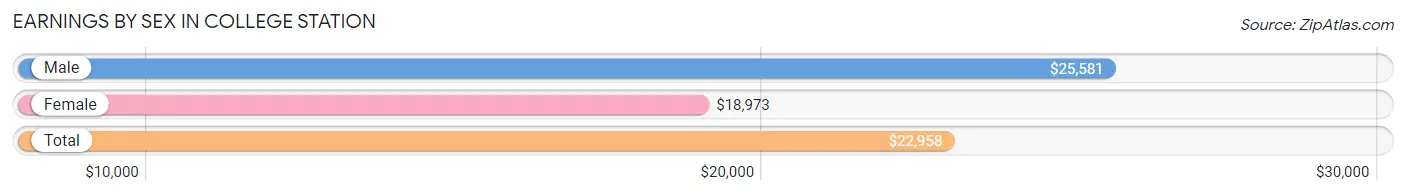
Earnings by Sex in College Station
Average Earnings in College Station are $22,958, $25,581 for men and $18,973 for women, a difference of 25.8%.
| Sex | Number | Average Earnings |
| Male | 41,121 (54.4%) | $25,581 |
| Female | 34,438 (45.6%) | $18,973 |
| Total | 75,559 (100.0%) | $22,958 |
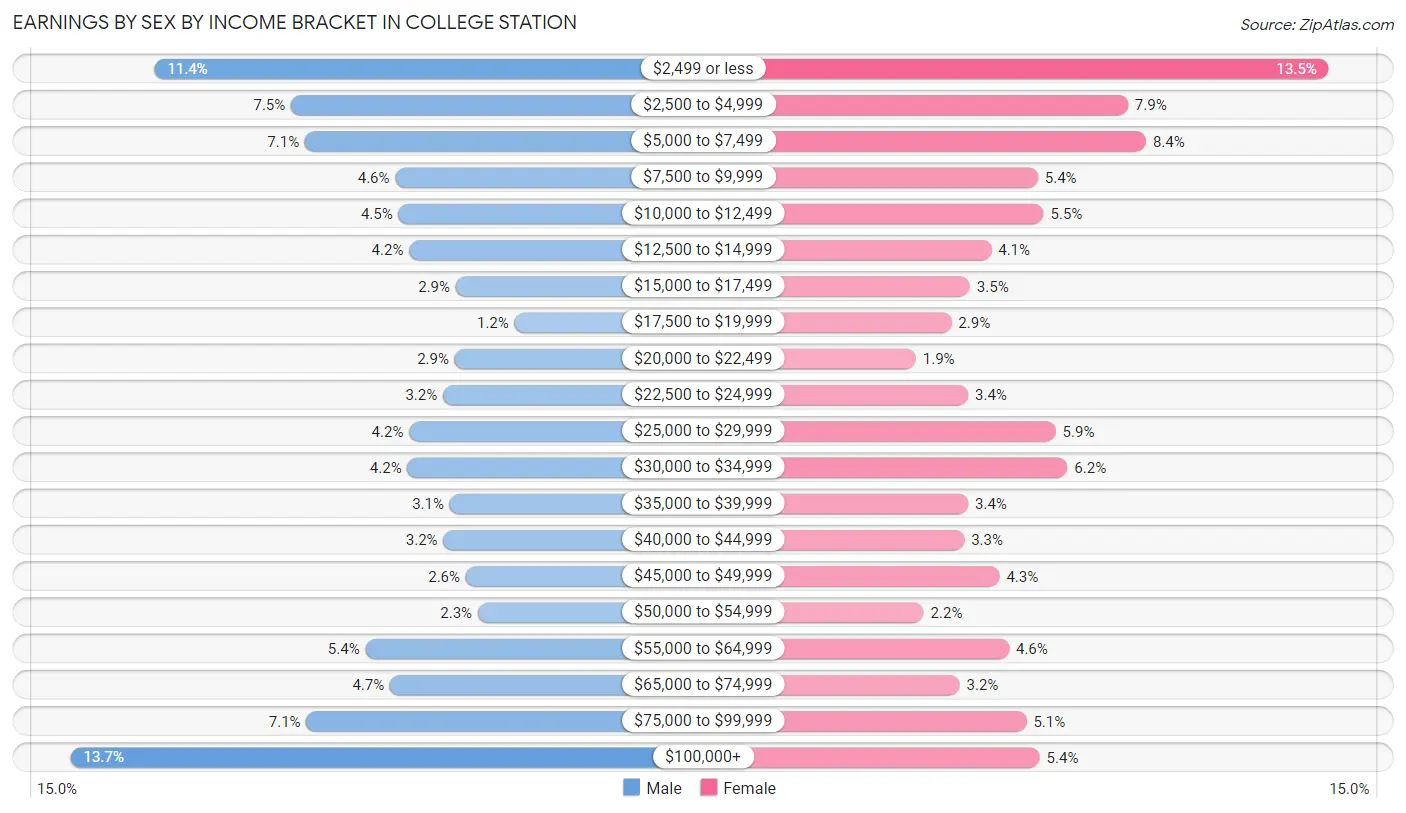
Earnings by Sex by Income Bracket in College Station
The most common earnings brackets in College Station are $100,000+ for men (5,637 | 13.7%) and $2,499 or less for women (4,664 | 13.5%).
| Income | Male | Female |
| $2,499 or less | 4,666 (11.4%) | 4,664 (13.5%) |
| $2,500 to $4,999 | 3,087 (7.5%) | 2,720 (7.9%) |
| $5,000 to $7,499 | 2,926 (7.1%) | 2,896 (8.4%) |
| $7,500 to $9,999 | 1,882 (4.6%) | 1,850 (5.4%) |
| $10,000 to $12,499 | 1,846 (4.5%) | 1,905 (5.5%) |
| $12,500 to $14,999 | 1,722 (4.2%) | 1,397 (4.1%) |
| $15,000 to $17,499 | 1,183 (2.9%) | 1,190 (3.5%) |
| $17,500 to $19,999 | 507 (1.2%) | 1,013 (2.9%) |
| $20,000 to $22,499 | 1,197 (2.9%) | 669 (1.9%) |
| $22,500 to $24,999 | 1,332 (3.2%) | 1,175 (3.4%) |
| $25,000 to $29,999 | 1,722 (4.2%) | 2,020 (5.9%) |
| $30,000 to $34,999 | 1,744 (4.2%) | 2,136 (6.2%) |
| $35,000 to $39,999 | 1,256 (3.0%) | 1,174 (3.4%) |
| $40,000 to $44,999 | 1,329 (3.2%) | 1,136 (3.3%) |
| $45,000 to $49,999 | 1,069 (2.6%) | 1,479 (4.3%) |
| $50,000 to $54,999 | 931 (2.3%) | 744 (2.2%) |
| $55,000 to $64,999 | 2,230 (5.4%) | 1,571 (4.6%) |
| $65,000 to $74,999 | 1,944 (4.7%) | 1,091 (3.2%) |
| $75,000 to $99,999 | 2,911 (7.1%) | 1,740 (5.1%) |
| $100,000+ | 5,637 (13.7%) | 1,868 (5.4%) |
| Total | 41,121 (100.0%) | 34,438 (100.0%) |
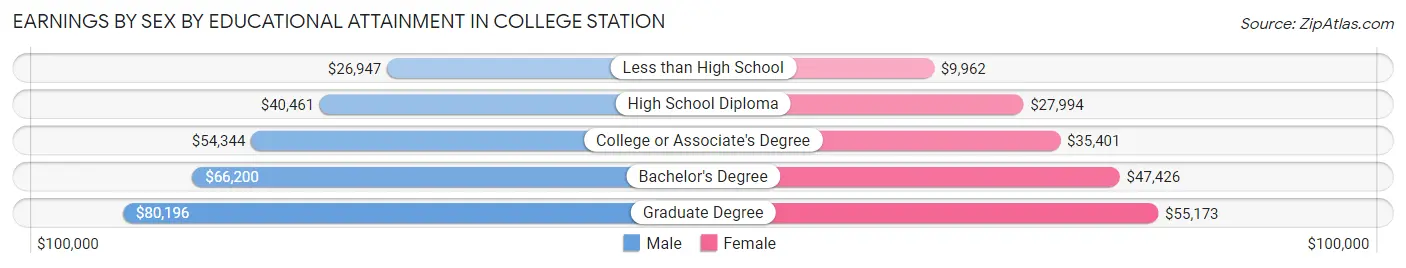
Earnings by Sex by Educational Attainment in College Station
Average earnings in College Station are $62,243 for men and $39,957 for women, a difference of 35.8%. Men with an educational attainment of graduate degree enjoy the highest average annual earnings of $80,196, while those with less than high school education earn the least with $26,947. Women with an educational attainment of graduate degree earn the most with the average annual earnings of $55,173, while those with less than high school education have the smallest earnings of $9,962.
| Educational Attainment | Male Income | Female Income |
| Less than High School | $26,947 | $9,962 |
| High School Diploma | $40,461 | $27,994 |
| College or Associate's Degree | $54,344 | $35,401 |
| Bachelor's Degree | $66,200 | $47,426 |
| Graduate Degree | $80,196 | $55,173 |
| Total | $62,243 | $39,957 |
Family Income in College Station
Family Income Brackets in College Station
According to the College Station family income data, there are 4,036 families falling into the $100,000 to $149,999 income range, which is the most common income bracket and makes up 19.3% of all families. Conversely, the $10,000 to $14,999 income bracket is the least frequent group with only 523 families (2.5%) belonging to this category.
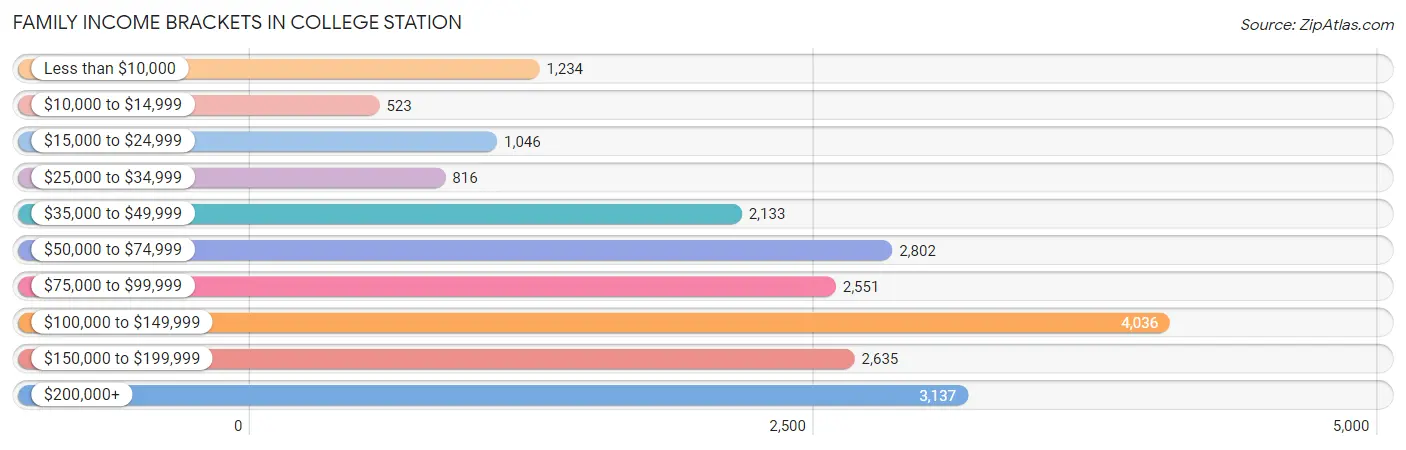
| Income Bracket | # Families | % Families |
| Less than $10,000 | 1,234 | 5.9% |
| $10,000 to $14,999 | 523 | 2.5% |
| $15,000 to $24,999 | 1,046 | 5.0% |
| $25,000 to $34,999 | 816 | 3.9% |
| $35,000 to $49,999 | 2,133 | 10.2% |
| $50,000 to $74,999 | 2,802 | 13.4% |
| $75,000 to $99,999 | 2,551 | 12.2% |
| $100,000 to $149,999 | 4,036 | 19.3% |
| $150,000 to $199,999 | 2,635 | 12.6% |
| $200,000+ | 3,137 | 15.0% |
Family Income by Famaliy Size in College Station
6-person families (959 | 4.6%) account for the highest median family income in College Station with $145,836 per family, while 2-person families (9,729 | 46.5%) have the highest median income of $38,128 per family member.
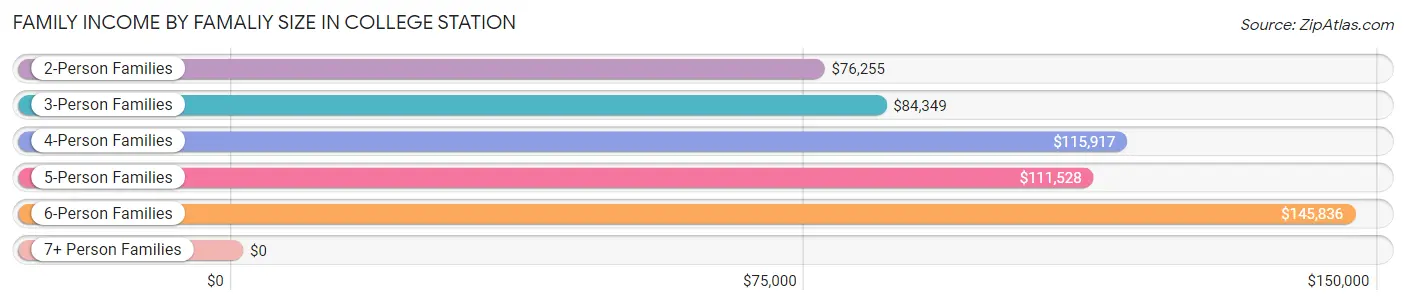
| Income Bracket | # Families | Median Income |
| 2-Person Families | 9,729 (46.5%) | $76,255 |
| 3-Person Families | 4,596 (22.0%) | $84,349 |
| 4-Person Families | 4,154 (19.9%) | $115,917 |
| 5-Person Families | 1,287 (6.1%) | $111,528 |
| 6-Person Families | 959 (4.6%) | $145,836 |
| 7+ Person Families | 187 (0.9%) | $0 |
| Total | 20,912 (100.0%) | $93,505 |
Family Income by Number of Earners in College Station
The median family income in College Station is $93,505, with families comprising 3+ earners (1,561) having the highest median family income of $142,699, while families with no earners (2,025) have the lowest median family income of $57,585, accounting for 7.5% and 9.7% of families, respectively.
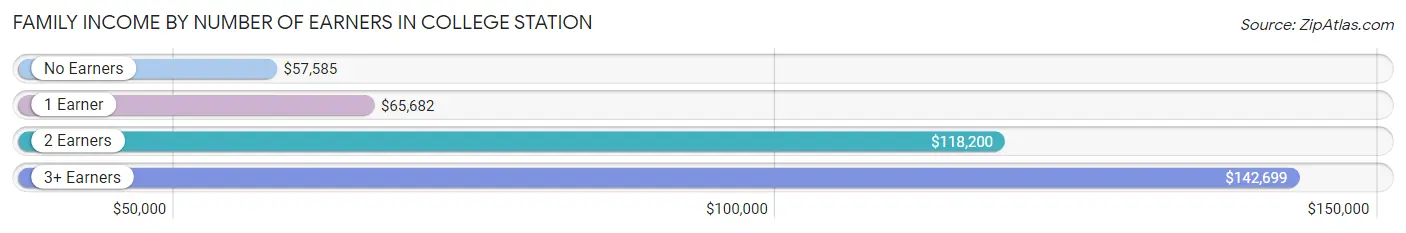
| Number of Earners | # Families | Median Income |
| No Earners | 2,025 (9.7%) | $57,585 |
| 1 Earner | 7,316 (35.0%) | $65,682 |
| 2 Earners | 10,010 (47.9%) | $118,200 |
| 3+ Earners | 1,561 (7.5%) | $142,699 |
| Total | 20,912 (100.0%) | $93,505 |
Household Income in College Station
Household Income Brackets in College Station
With 6,296 households falling in the category, the $50,000 to $74,999 income range is the most frequent in College Station, accounting for 14.3% of all households. In contrast, only 2,554 households (5.8%) fall into the $10,000 to $14,999 income bracket, making it the least populous group.
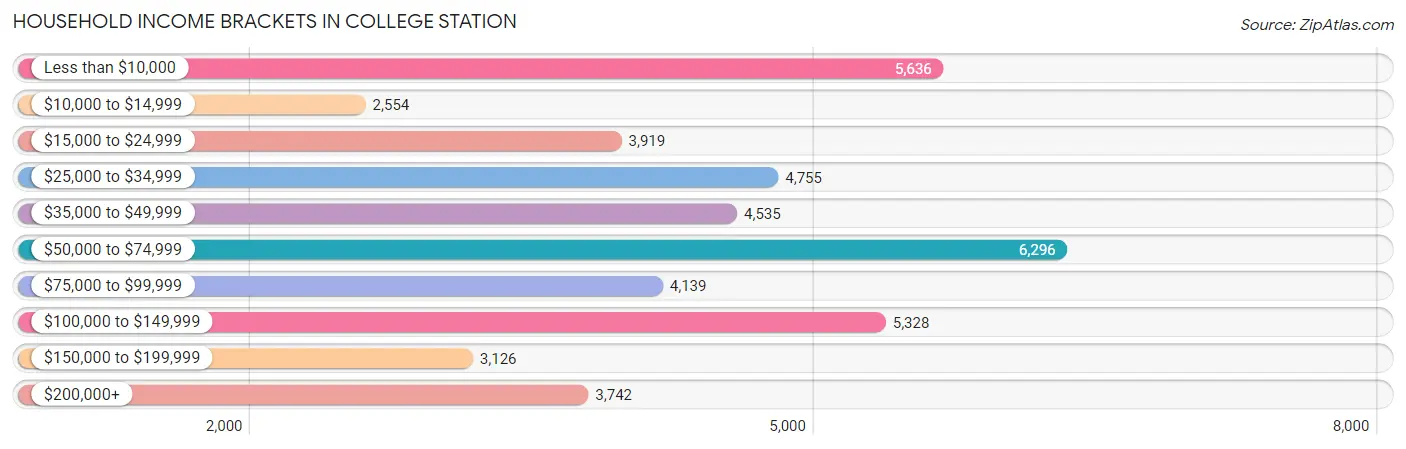
| Income Bracket | # Households | % Households |
| Less than $10,000 | 5,636 | 12.8% |
| $10,000 to $14,999 | 2,554 | 5.8% |
| $15,000 to $24,999 | 3,919 | 8.9% |
| $25,000 to $34,999 | 4,755 | 10.8% |
| $35,000 to $49,999 | 4,535 | 10.3% |
| $50,000 to $74,999 | 6,296 | 14.3% |
| $75,000 to $99,999 | 4,139 | 9.4% |
| $100,000 to $149,999 | 5,328 | 12.1% |
| $150,000 to $199,999 | 3,126 | 7.1% |
| $200,000+ | 3,742 | 8.5% |
Household Income by Householder Age in College Station
The median household income in College Station is $52,397, with the highest median household income of $100,592 found in the 45 to 64 years age bracket for the primary householder. A total of 9,251 households (21.0%) fall into this category. Meanwhile, the 15 to 24 years age bracket for the primary householder has the lowest median household income of $21,686, with 14,225 households (32.3%) in this group.
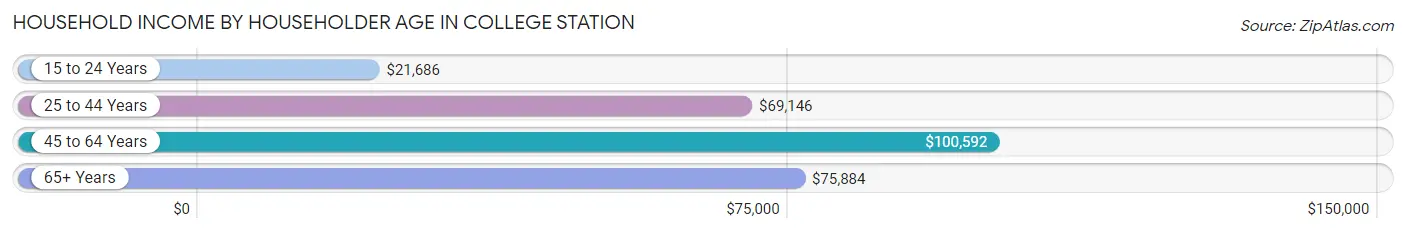
| Income Bracket | # Households | Median Income |
| 15 to 24 Years | 14,225 (32.3%) | $21,686 |
| 25 to 44 Years | 15,781 (35.8%) | $69,146 |
| 45 to 64 Years | 9,251 (21.0%) | $100,592 |
| 65+ Years | 4,772 (10.8%) | $75,884 |
| Total | 44,029 (100.0%) | $52,397 |
Poverty in College Station
Income Below Poverty by Sex and Age in College Station
With 28.4% poverty level for males and 28.5% for females among the residents of College Station, 18 to 24 year old males and 18 to 24 year old females are the most vulnerable to poverty, with 12,019 males (62.0%) and 10,890 females (64.7%) in their respective age groups living below the poverty level.
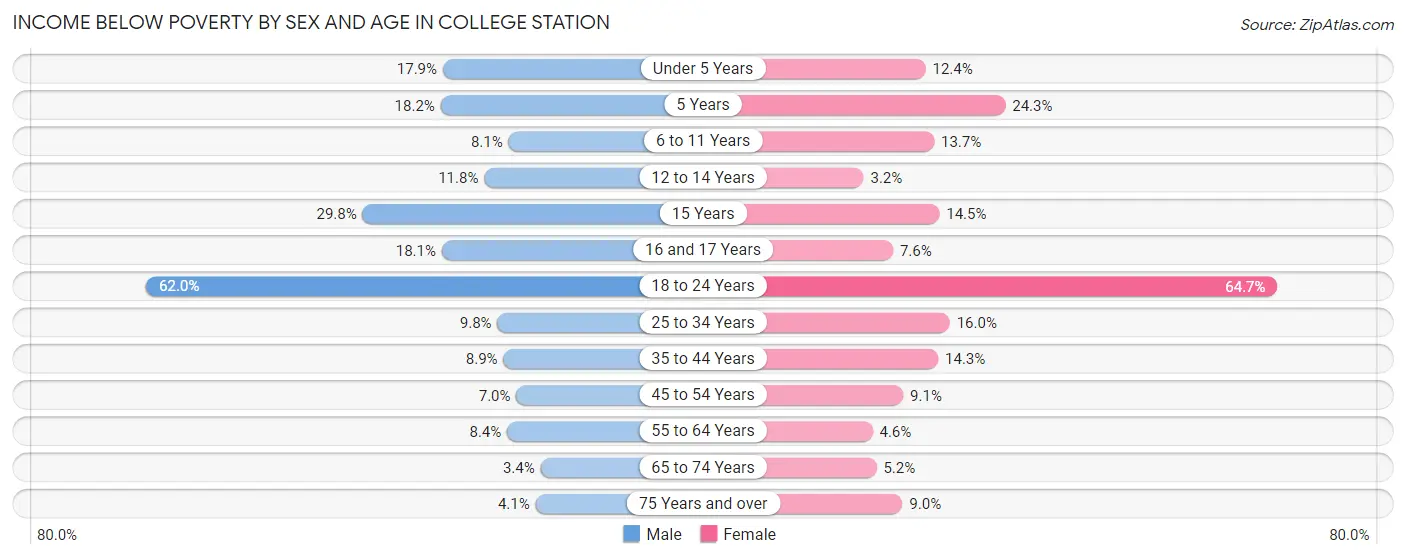
| Age Bracket | Male | Female |
| Under 5 Years | 472 (17.9%) | 348 (12.4%) |
| 5 Years | 141 (18.2%) | 134 (24.3%) |
| 6 to 11 Years | 265 (8.1%) | 404 (13.7%) |
| 12 to 14 Years | 172 (11.7%) | 55 (3.2%) |
| 15 Years | 178 (29.8%) | 96 (14.5%) |
| 16 and 17 Years | 209 (18.0%) | 79 (7.6%) |
| 18 to 24 Years | 12,019 (62.0%) | 10,890 (64.7%) |
| 25 to 34 Years | 782 (9.8%) | 1,235 (16.0%) |
| 35 to 44 Years | 555 (8.9%) | 824 (14.3%) |
| 45 to 54 Years | 269 (7.0%) | 385 (9.1%) |
| 55 to 64 Years | 295 (8.4%) | 166 (4.6%) |
| 65 to 74 Years | 77 (3.4%) | 140 (5.1%) |
| 75 Years and over | 55 (4.1%) | 154 (9.0%) |
| Total | 15,489 (28.4%) | 14,910 (28.5%) |
Income Above Poverty by Sex and Age in College Station
According to the poverty statistics in College Station, males aged 65 to 74 years and females aged 12 to 14 years are the age groups that are most secure financially, with 96.6% of males and 96.8% of females in these age groups living above the poverty line.
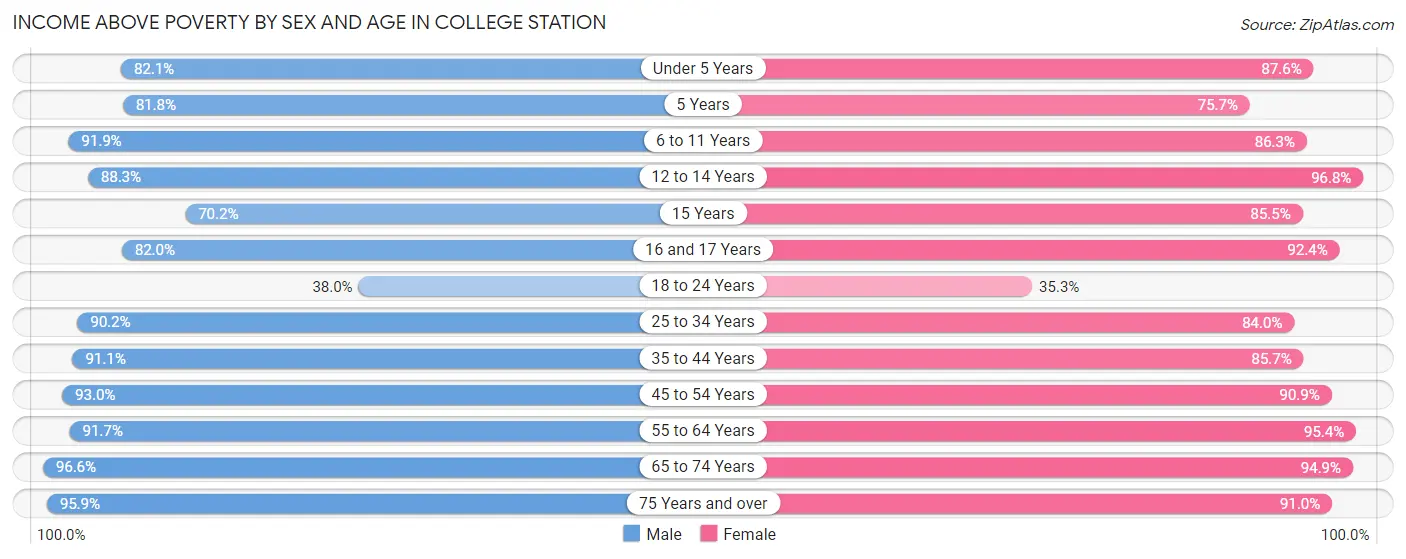
| Age Bracket | Male | Female |
| Under 5 Years | 2,167 (82.1%) | 2,449 (87.6%) |
| 5 Years | 633 (81.8%) | 418 (75.7%) |
| 6 to 11 Years | 2,989 (91.9%) | 2,544 (86.3%) |
| 12 to 14 Years | 1,292 (88.2%) | 1,650 (96.8%) |
| 15 Years | 419 (70.2%) | 567 (85.5%) |
| 16 and 17 Years | 949 (82.0%) | 960 (92.4%) |
| 18 to 24 Years | 7,375 (38.0%) | 5,949 (35.3%) |
| 25 to 34 Years | 7,209 (90.2%) | 6,469 (84.0%) |
| 35 to 44 Years | 5,681 (91.1%) | 4,939 (85.7%) |
| 45 to 54 Years | 3,585 (93.0%) | 3,839 (90.9%) |
| 55 to 64 Years | 3,237 (91.6%) | 3,475 (95.4%) |
| 65 to 74 Years | 2,197 (96.6%) | 2,577 (94.9%) |
| 75 Years and over | 1,278 (95.9%) | 1,558 (91.0%) |
| Total | 39,011 (71.6%) | 37,394 (71.5%) |
Income Below Poverty Among Married-Couple Families in College Station
The poverty statistics for married-couple families in College Station show that 3.9% or 584 of the total 15,068 families live below the poverty line. Families with 5 or more children have the highest poverty rate of 27.6%, comprising of 24 families. On the other hand, families with no children have the lowest poverty rate of 2.6%, which includes 192 families.
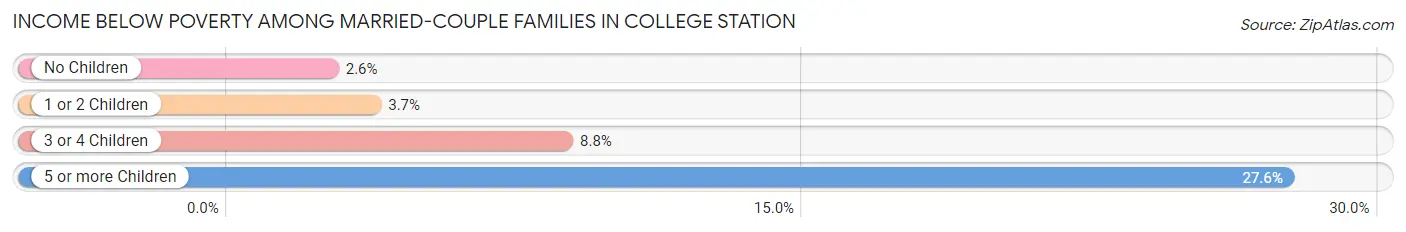
| Children | Above Poverty | Below Poverty |
| No Children | 7,103 (97.4%) | 192 (2.6%) |
| 1 or 2 Children | 5,847 (96.3%) | 227 (3.7%) |
| 3 or 4 Children | 1,471 (91.2%) | 141 (8.7%) |
| 5 or more Children | 63 (72.4%) | 24 (27.6%) |
| Total | 14,484 (96.1%) | 584 (3.9%) |
Income Below Poverty Among Single-Parent Households in College Station
According to the poverty data in College Station, 31.2% or 556 single-father households and 31.6% or 1,284 single-mother households are living below the poverty line. Among single-father households, those with no children have the highest poverty rate, with 541 households (44.3%) experiencing poverty. Likewise, among single-mother households, those with 5 or more children have the highest poverty rate, with 26 households (100.0%) falling below the poverty line.
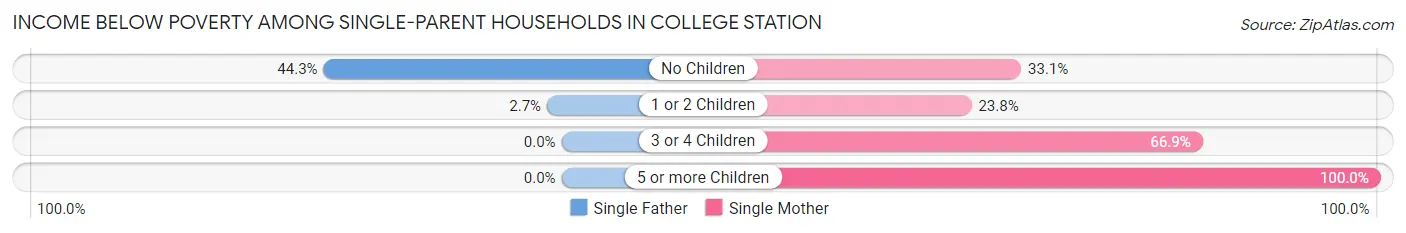
| Children | Single Father | Single Mother |
| No Children | 541 (44.3%) | 516 (33.1%) |
| 1 or 2 Children | 15 (2.7%) | 504 (23.8%) |
| 3 or 4 Children | 0 (0.0%) | 238 (66.8%) |
| 5 or more Children | 0 (0.0%) | 26 (100.0%) |
| Total | 556 (31.2%) | 1,284 (31.6%) |
Income Below Poverty Among Married-Couple vs Single-Parent Households in College Station
The poverty data for College Station shows that 584 of the married-couple family households (3.9%) and 1,840 of the single-parent households (31.5%) are living below the poverty level. Within the married-couple family households, those with 5 or more children have the highest poverty rate, with 24 households (27.6%) falling below the poverty line. Among the single-parent households, those with 5 or more children have the highest poverty rate, with 26 household (100.0%) living below poverty.
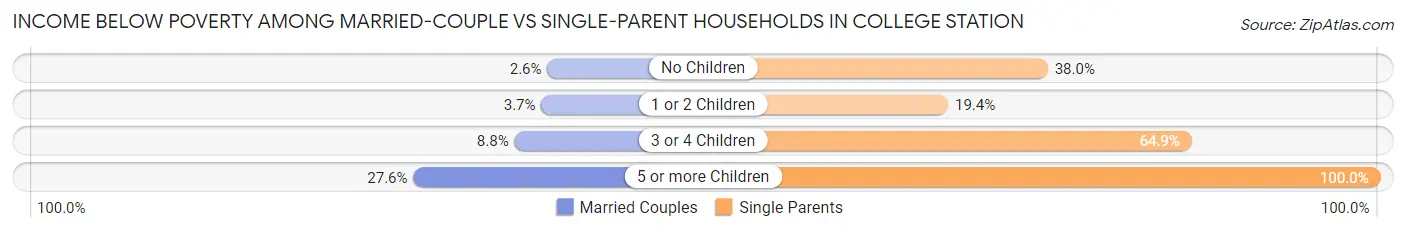
| Children | Married-Couple Families | Single-Parent Households |
| No Children | 192 (2.6%) | 1,057 (38.0%) |
| 1 or 2 Children | 227 (3.7%) | 519 (19.4%) |
| 3 or 4 Children | 141 (8.7%) | 238 (64.8%) |
| 5 or more Children | 24 (27.6%) | 26 (100.0%) |
| Total | 584 (3.9%) | 1,840 (31.5%) |
Race in College Station
The most populous races in College Station are White / Caucasian (84,215 | 69.9%), Hispanic or Latino (21,519 | 17.9%), and Asian (11,955 | 9.9%).
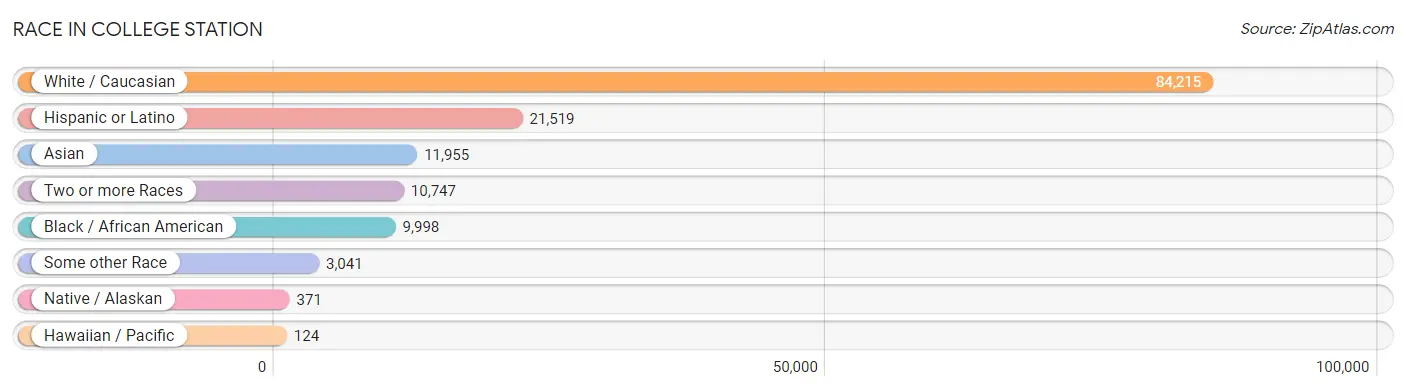
| Race | # Population | % Population |
| Asian | 11,955 | 9.9% |
| Black / African American | 9,998 | 8.3% |
| Hawaiian / Pacific | 124 | 0.1% |
| Hispanic or Latino | 21,519 | 17.9% |
| Native / Alaskan | 371 | 0.3% |
| White / Caucasian | 84,215 | 69.9% |
| Two or more Races | 10,747 | 8.9% |
| Some other Race | 3,041 | 2.5% |
| Total | 120,451 | 100.0% |
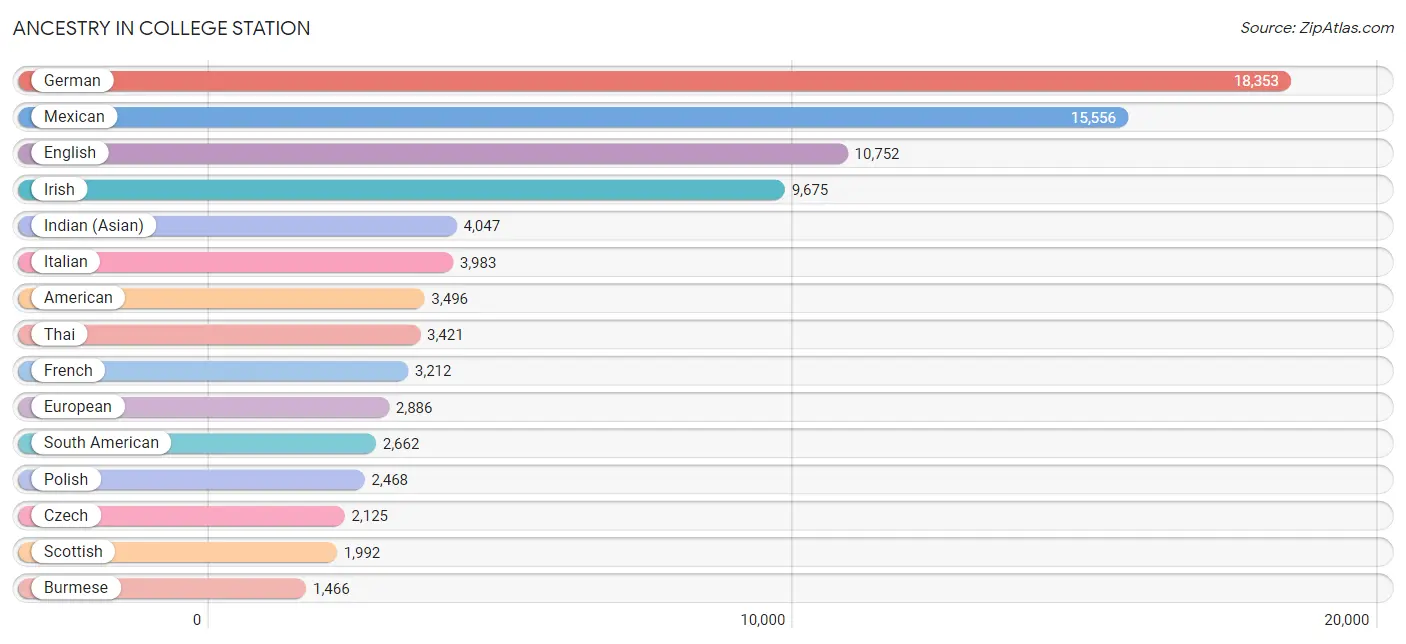
Ancestry in College Station
The most populous ancestries reported in College Station are German (18,353 | 15.2%), Mexican (15,556 | 12.9%), English (10,752 | 8.9%), Irish (9,675 | 8.0%), and Indian (Asian) (4,047 | 3.4%), together accounting for 48.5% of all College Station residents.
| Ancestry | # Population | % Population |
| Afghan | 161 | 0.1% |
| African | 636 | 0.5% |
| Alaska Native | 57 | 0.1% |
| Albanian | 11 | 0.0% |
| American | 3,496 | 2.9% |
| Apache | 54 | 0.0% |
| Arab | 1,179 | 1.0% |
| Argentinean | 61 | 0.1% |
| Armenian | 16 | 0.0% |
| Assyrian / Chaldean / Syriac | 5 | 0.0% |
| Australian | 34 | 0.0% |
| Austrian | 94 | 0.1% |
| Bahamian | 27 | 0.0% |
| Bangladeshi | 10 | 0.0% |
| Basque | 39 | 0.0% |
| Belgian | 123 | 0.1% |
| Belizean | 7 | 0.0% |
| Bhutanese | 424 | 0.4% |
| Blackfeet | 76 | 0.1% |
| Bolivian | 654 | 0.5% |
| Brazilian | 151 | 0.1% |
| British | 984 | 0.8% |
| Bulgarian | 10 | 0.0% |
| Burmese | 1,466 | 1.2% |
| Cajun | 60 | 0.1% |
| Canadian | 221 | 0.2% |
| Central American | 820 | 0.7% |
| Central American Indian | 10 | 0.0% |
| Cherokee | 242 | 0.2% |
| Chickasaw | 66 | 0.1% |
| Chilean | 25 | 0.0% |
| Chinese | 14 | 0.0% |
| Choctaw | 113 | 0.1% |
| Colombian | 702 | 0.6% |
| Costa Rican | 143 | 0.1% |
| Creek | 64 | 0.1% |
| Croatian | 85 | 0.1% |
| Crow | 15 | 0.0% |
| Cuban | 394 | 0.3% |
| Czech | 2,125 | 1.8% |
| Czechoslovakian | 212 | 0.2% |
| Danish | 282 | 0.2% |
| Dominican | 105 | 0.1% |
| Dutch | 820 | 0.7% |
| Dutch West Indian | 34 | 0.0% |
| Eastern European | 209 | 0.2% |
| Ecuadorian | 51 | 0.0% |
| Egyptian | 142 | 0.1% |
| English | 10,752 | 8.9% |
| Ethiopian | 19 | 0.0% |
| European | 2,886 | 2.4% |
| Filipino | 430 | 0.4% |
| Finnish | 57 | 0.1% |
| French | 3,212 | 2.7% |
| French Canadian | 436 | 0.4% |
| German | 18,353 | 15.2% |
| German Russian | 58 | 0.1% |
| Ghanaian | 33 | 0.0% |
| Greek | 265 | 0.2% |
| Guamanian / Chamorro | 144 | 0.1% |
| Guatemalan | 386 | 0.3% |
| Guyanese | 10 | 0.0% |
| Haitian | 59 | 0.1% |
| Hmong | 18 | 0.0% |
| Honduran | 81 | 0.1% |
| Hungarian | 134 | 0.1% |
| Icelander | 43 | 0.0% |
| Indian (Asian) | 4,047 | 3.4% |
| Indonesian | 103 | 0.1% |
| Iranian | 399 | 0.3% |
| Iraqi | 10 | 0.0% |
| Irish | 9,675 | 8.0% |
| Israeli | 53 | 0.0% |
| Italian | 3,983 | 3.3% |
| Jamaican | 24 | 0.0% |
| Japanese | 36 | 0.0% |
| Jordanian | 47 | 0.0% |
| Kenyan | 44 | 0.0% |
| Korean | 871 | 0.7% |
| Laotian | 317 | 0.3% |
| Latvian | 37 | 0.0% |
| Lebanese | 260 | 0.2% |
| Lithuanian | 55 | 0.1% |
| Malaysian | 17 | 0.0% |
| Mexican | 15,556 | 12.9% |
| Mexican American Indian | 125 | 0.1% |
| Mongolian | 110 | 0.1% |
| Native Hawaiian | 11 | 0.0% |
| Navajo | 16 | 0.0% |
| New Zealander | 3 | 0.0% |
| Nicaraguan | 34 | 0.0% |
| Nigerian | 217 | 0.2% |
| Northern European | 83 | 0.1% |
| Norwegian | 1,045 | 0.9% |
| Okinawan | 1 | 0.0% |
| Pakistani | 15 | 0.0% |
| Palestinian | 155 | 0.1% |
| Panamanian | 38 | 0.0% |
| Pennsylvania German | 39 | 0.0% |
| Peruvian | 183 | 0.2% |
| Polish | 2,468 | 2.1% |
| Portuguese | 230 | 0.2% |
| Pueblo | 37 | 0.0% |
| Puerto Rican | 619 | 0.5% |
| Puget Sound Salish | 4 | 0.0% |
| Romanian | 62 | 0.1% |
| Russian | 568 | 0.5% |
| Salvadoran | 138 | 0.1% |
| Samoan | 42 | 0.0% |
| Scandinavian | 394 | 0.3% |
| Scotch-Irish | 947 | 0.8% |
| Scottish | 1,992 | 1.7% |
| Seminole | 40 | 0.0% |
| Serbian | 41 | 0.0% |
| Sioux | 26 | 0.0% |
| Slavic | 16 | 0.0% |
| Slovene | 84 | 0.1% |
| Somali | 35 | 0.0% |
| South American | 2,662 | 2.2% |
| South American Indian | 22 | 0.0% |
| Spaniard | 354 | 0.3% |
| Spanish | 562 | 0.5% |
| Sri Lankan | 877 | 0.7% |
| Subsaharan African | 997 | 0.8% |
| Swedish | 1,193 | 1.0% |
| Swiss | 36 | 0.0% |
| Syrian | 54 | 0.0% |
| Thai | 3,421 | 2.8% |
| Turkish | 313 | 0.3% |
| Ukrainian | 141 | 0.1% |
| Uruguayan | 279 | 0.2% |
| Venezuelan | 707 | 0.6% |
| Vietnamese | 545 | 0.4% |
| Welsh | 473 | 0.4% |
| West Indian | 22 | 0.0% |
| Yugoslavian | 31 | 0.0% | View All 136 Rows |
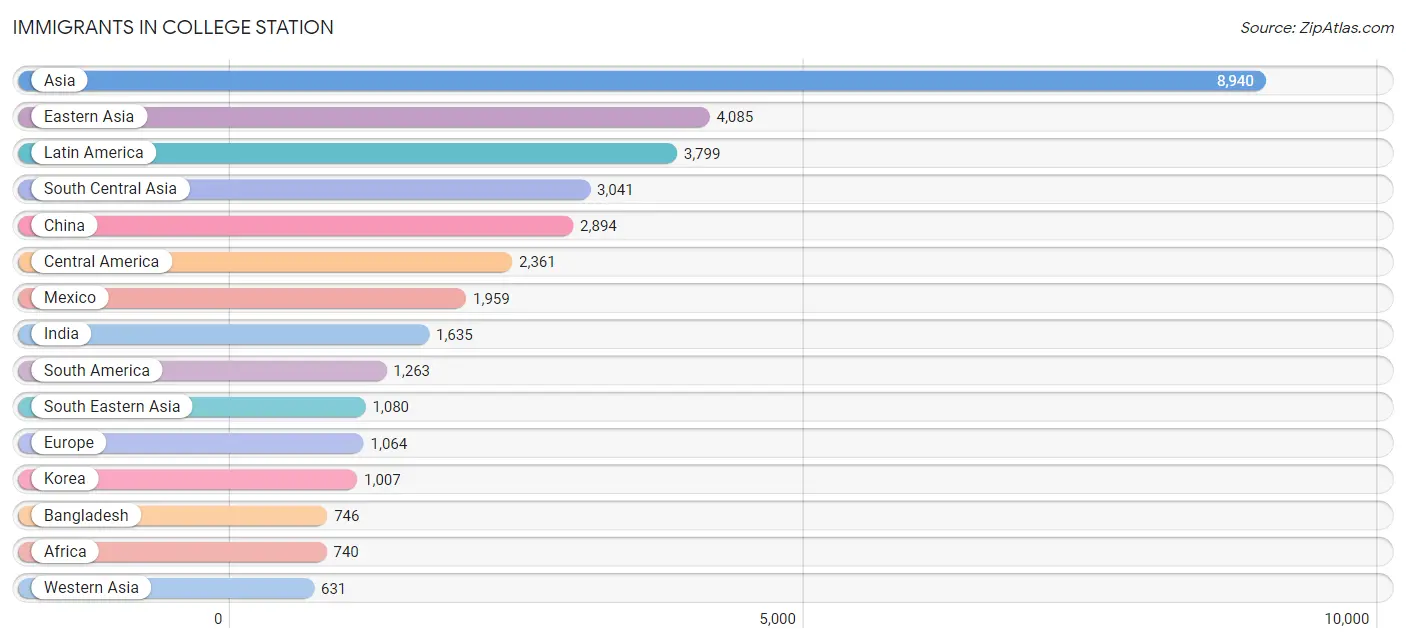
Immigrants in College Station
The most numerous immigrant groups reported in College Station came from Asia (8,940 | 7.4%), Eastern Asia (4,085 | 3.4%), Latin America (3,799 | 3.2%), South Central Asia (3,041 | 2.5%), and China (2,894 | 2.4%), together accounting for 18.9% of all College Station residents.
| Immigration Origin | # Population | % Population |
| Afghanistan | 79 | 0.1% |
| Africa | 740 | 0.6% |
| Argentina | 50 | 0.0% |
| Asia | 8,940 | 7.4% |
| Australia | 16 | 0.0% |
| Bangladesh | 746 | 0.6% |
| Bolivia | 7 | 0.0% |
| Brazil | 114 | 0.1% |
| Cameroon | 42 | 0.0% |
| Canada | 148 | 0.1% |
| Caribbean | 175 | 0.2% |
| Central America | 2,361 | 2.0% |
| China | 2,894 | 2.4% |
| Colombia | 342 | 0.3% |
| Congo | 40 | 0.0% |
| Costa Rica | 13 | 0.0% |
| Croatia | 23 | 0.0% |
| Cuba | 36 | 0.0% |
| Czechoslovakia | 24 | 0.0% |
| Eastern Africa | 80 | 0.1% |
| Eastern Asia | 4,085 | 3.4% |
| Eastern Europe | 387 | 0.3% |
| Egypt | 142 | 0.1% |
| El Salvador | 26 | 0.0% |
| England | 117 | 0.1% |
| Europe | 1,064 | 0.9% |
| France | 187 | 0.2% |
| Germany | 165 | 0.1% |
| Ghana | 56 | 0.1% |
| Greece | 53 | 0.0% |
| Guatemala | 323 | 0.3% |
| Guyana | 70 | 0.1% |
| Haiti | 69 | 0.1% |
| Honduras | 17 | 0.0% |
| Hong Kong | 48 | 0.0% |
| India | 1,635 | 1.4% |
| Indonesia | 299 | 0.3% |
| Iran | 204 | 0.2% |
| Iraq | 115 | 0.1% |
| Israel | 51 | 0.0% |
| Italy | 8 | 0.0% |
| Jamaica | 20 | 0.0% |
| Japan | 184 | 0.2% |
| Jordan | 68 | 0.1% |
| Kenya | 44 | 0.0% |
| Korea | 1,007 | 0.8% |
| Laos | 9 | 0.0% |
| Latin America | 3,799 | 3.2% |
| Lebanon | 36 | 0.0% |
| Malaysia | 77 | 0.1% |
| Mexico | 1,959 | 1.6% |
| Middle Africa | 82 | 0.1% |
| Morocco | 45 | 0.0% |
| Nepal | 125 | 0.1% |
| Netherlands | 15 | 0.0% |
| Nigeria | 218 | 0.2% |
| Northern Africa | 253 | 0.2% |
| Northern Europe | 237 | 0.2% |
| Norway | 17 | 0.0% |
| Oceania | 16 | 0.0% |
| Pakistan | 219 | 0.2% |
| Panama | 23 | 0.0% |
| Peru | 21 | 0.0% |
| Philippines | 193 | 0.2% |
| Poland | 64 | 0.1% |
| Romania | 63 | 0.1% |
| Russia | 164 | 0.1% |
| Saudi Arabia | 77 | 0.1% |
| Scotland | 46 | 0.0% |
| Singapore | 20 | 0.0% |
| Somalia | 16 | 0.0% |
| South Africa | 51 | 0.0% |
| South America | 1,263 | 1.1% |
| South Central Asia | 3,041 | 2.5% |
| South Eastern Asia | 1,080 | 0.9% |
| Southern Europe | 73 | 0.1% |
| Spain | 12 | 0.0% |
| Sri Lanka | 33 | 0.0% |
| Taiwan | 456 | 0.4% |
| Thailand | 19 | 0.0% |
| Turkey | 219 | 0.2% |
| Ukraine | 49 | 0.0% |
| Uruguay | 58 | 0.1% |
| Venezuela | 601 | 0.5% |
| Vietnam | 360 | 0.3% |
| Western Africa | 274 | 0.2% |
| Western Asia | 631 | 0.5% |
| Western Europe | 367 | 0.3% |
| Zimbabwe | 13 | 0.0% | View All 89 Rows |
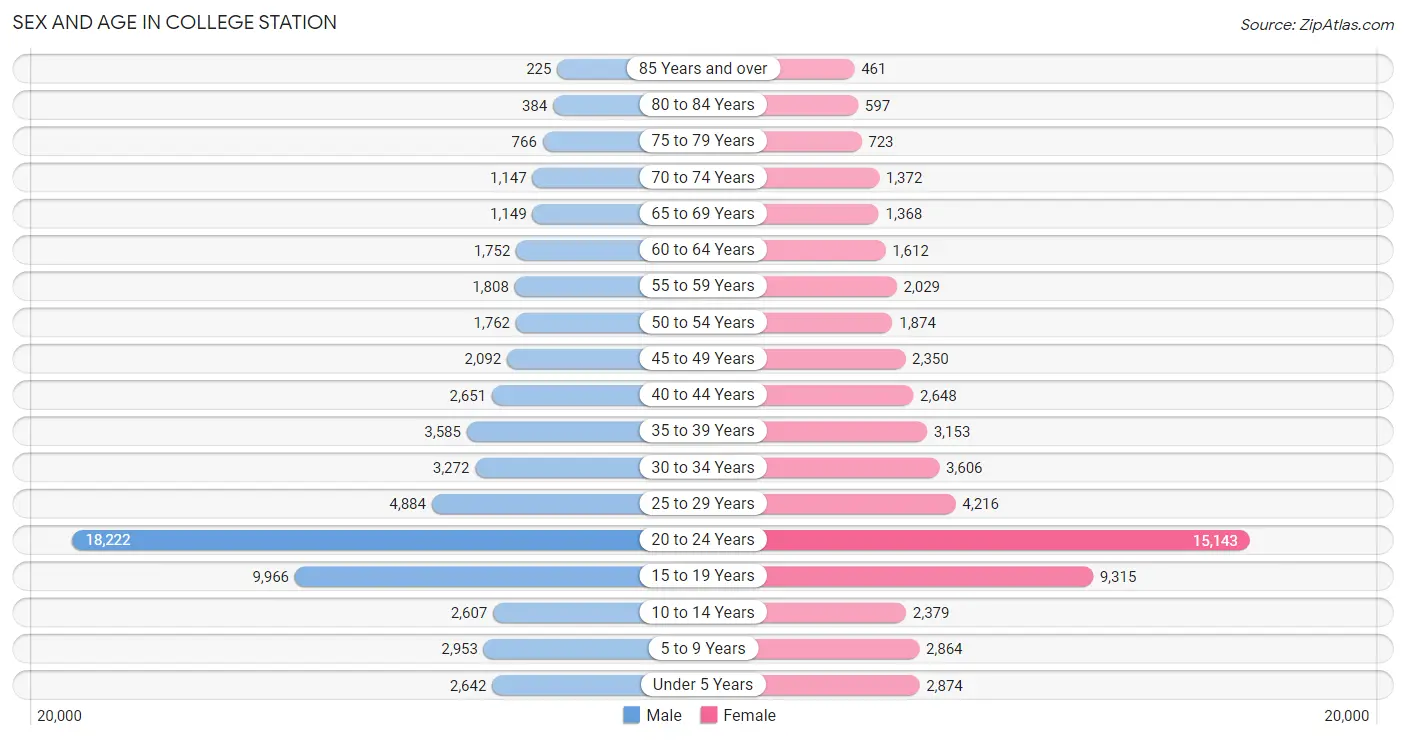
Sex and Age in College Station
Sex and Age in College Station
The most populous age groups in College Station are 20 to 24 Years (18,222 | 29.4%) for men and 20 to 24 Years (15,143 | 25.9%) for women.
| Age Bracket | Male | Female |
| Under 5 Years | 2,642 (4.3%) | 2,874 (4.9%) |
| 5 to 9 Years | 2,953 (4.8%) | 2,864 (4.9%) |
| 10 to 14 Years | 2,607 (4.2%) | 2,379 (4.1%) |
| 15 to 19 Years | 9,966 (16.1%) | 9,315 (15.9%) |
| 20 to 24 Years | 18,222 (29.4%) | 15,143 (25.9%) |
| 25 to 29 Years | 4,884 (7.9%) | 4,216 (7.2%) |
| 30 to 34 Years | 3,272 (5.3%) | 3,606 (6.2%) |
| 35 to 39 Years | 3,585 (5.8%) | 3,153 (5.4%) |
| 40 to 44 Years | 2,651 (4.3%) | 2,648 (4.5%) |
| 45 to 49 Years | 2,092 (3.4%) | 2,350 (4.0%) |
| 50 to 54 Years | 1,762 (2.9%) | 1,874 (3.2%) |
| 55 to 59 Years | 1,808 (2.9%) | 2,029 (3.5%) |
| 60 to 64 Years | 1,752 (2.8%) | 1,612 (2.8%) |
| 65 to 69 Years | 1,149 (1.9%) | 1,368 (2.3%) |
| 70 to 74 Years | 1,147 (1.8%) | 1,372 (2.3%) |
| 75 to 79 Years | 766 (1.2%) | 723 (1.2%) |
| 80 to 84 Years | 384 (0.6%) | 597 (1.0%) |
| 85 Years and over | 225 (0.4%) | 461 (0.8%) |
| Total | 61,867 (100.0%) | 58,584 (100.0%) |
Families and Households in College Station
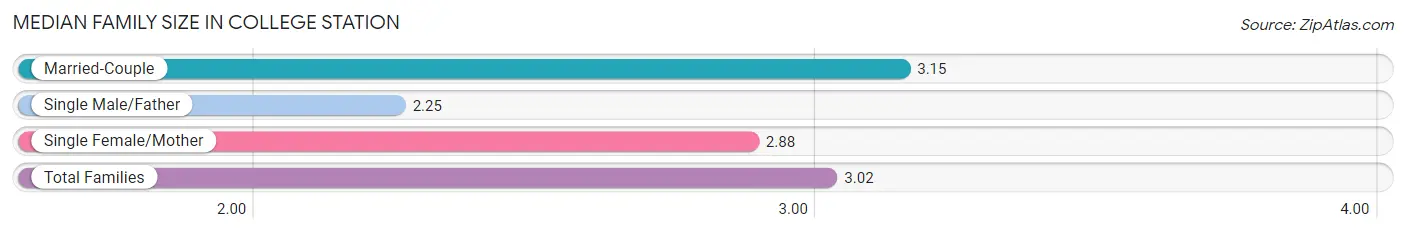
Median Family Size in College Station
The median family size in College Station is 3.02 persons per family, with married-couple families (15,068 | 72.1%) accounting for the largest median family size of 3.15 persons per family. On the other hand, single male/father families (1,784 | 8.5%) represent the smallest median family size with 2.25 persons per family.
| Family Type | # Families | Family Size |
| Married-Couple | 15,068 (72.1%) | 3.15 |
| Single Male/Father | 1,784 (8.5%) | 2.25 |
| Single Female/Mother | 4,060 (19.4%) | 2.88 |
| Total Families | 20,912 (100.0%) | 3.02 |
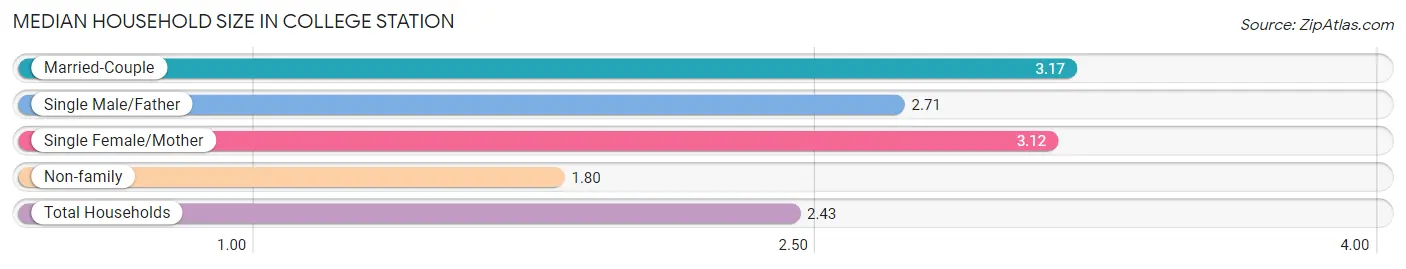
Median Household Size in College Station
The median household size in College Station is 2.43 persons per household, with married-couple households (15,068 | 34.2%) accounting for the largest median household size of 3.17 persons per household. non-family households (23,117 | 52.5%) represent the smallest median household size with 1.80 persons per household.
| Household Type | # Households | Household Size |
| Married-Couple | 15,068 (34.2%) | 3.17 |
| Single Male/Father | 1,784 (4.1%) | 2.71 |
| Single Female/Mother | 4,060 (9.2%) | 3.12 |
| Non-family | 23,117 (52.5%) | 1.80 |
| Total Households | 44,029 (100.0%) | 2.43 |
Household Size by Marriage Status in College Station
Out of a total of 44,029 households in College Station, 20,912 (47.5%) are family households, while 23,117 (52.5%) are nonfamily households. The most numerous type of family households are 2-person households, comprising 8,794, and the most common type of nonfamily households are 1-person households, comprising 13,830.
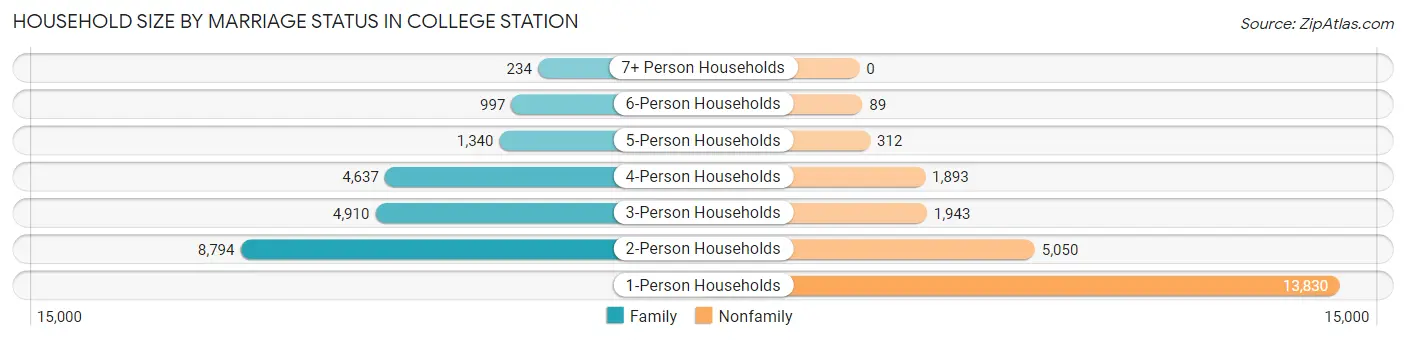
| Household Size | Family Households | Nonfamily Households |
| 1-Person Households | - | 13,830 (31.4%) |
| 2-Person Households | 8,794 (20.0%) | 5,050 (11.5%) |
| 3-Person Households | 4,910 (11.2%) | 1,943 (4.4%) |
| 4-Person Households | 4,637 (10.5%) | 1,893 (4.3%) |
| 5-Person Households | 1,340 (3.0%) | 312 (0.7%) |
| 6-Person Households | 997 (2.3%) | 89 (0.2%) |
| 7+ Person Households | 234 (0.5%) | 0 (0.0%) |
| Total | 20,912 (47.5%) | 23,117 (52.5%) |
Female Fertility in College Station
Fertility by Age in College Station
Average fertility rate in College Station is 30.0 births per 1,000 women. Women in the age bracket of 20 to 34 years have the highest fertility rate with 42.0 births per 1,000 women. Women in the age bracket of 20 to 34 years acount for 80.2% of all women with births.
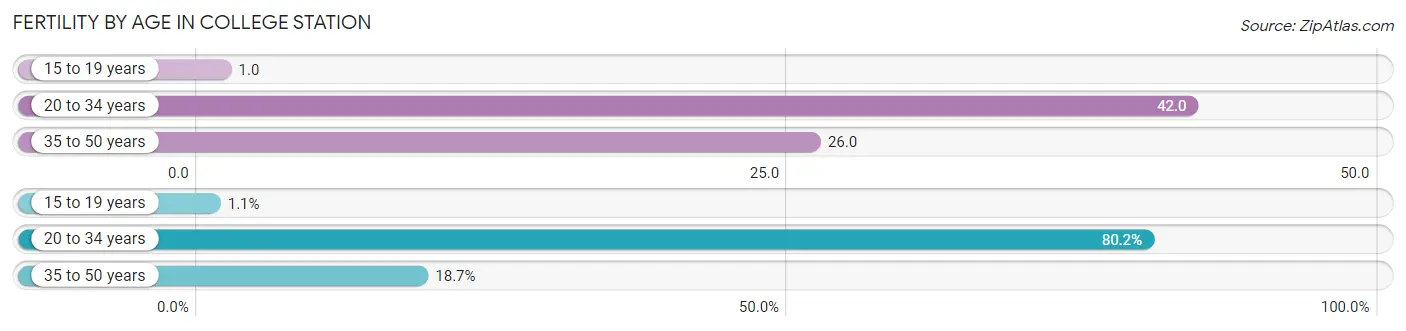
| Age Bracket | Women with Births | Births / 1,000 Women |
| 15 to 19 years | 13 (1.1%) | 1.0 |
| 20 to 34 years | 970 (80.2%) | 42.0 |
| 35 to 50 years | 226 (18.7%) | 26.0 |
| Total | 1,209 (100.0%) | 30.0 |
Fertility by Age by Marriage Status in College Station
49.5% of women with births (1,209) in College Station are married. The highest percentage of unmarried women with births falls into 15 to 19 years age bracket with 100.0% of them unmarried at the time of birth, while the lowest percentage of unmarried women with births belong to 35 to 50 years age bracket with 14.2% of them unmarried.
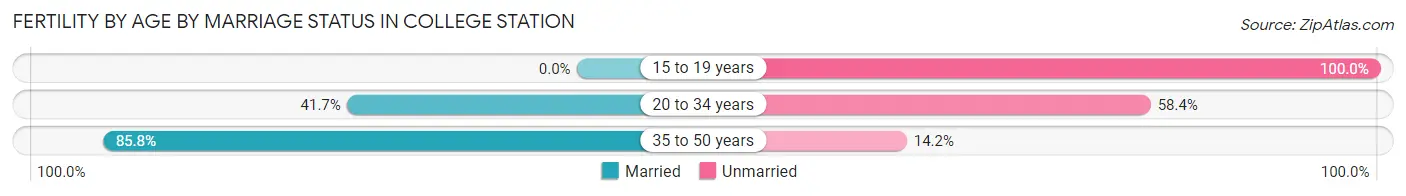
| Age Bracket | Married | Unmarried |
| 15 to 19 years | 0 (0.0%) | 13 (100.0%) |
| 20 to 34 years | 404 (41.6%) | 566 (58.4%) |
| 35 to 50 years | 194 (85.8%) | 32 (14.2%) |
| Total | 598 (49.5%) | 611 (50.5%) |
Fertility by Education in College Station
Average fertility rate in College Station is 30.0 births per 1,000 women. Women with the education attainment of less than high school have the highest fertility rate of 85.0 births per 1,000 women, while women with the education attainment of college or associate's degree have the lowest fertility at 15.0 births per 1,000 women. Women with the education attainment of college or associate's degree represent 23.6% of all women with births.
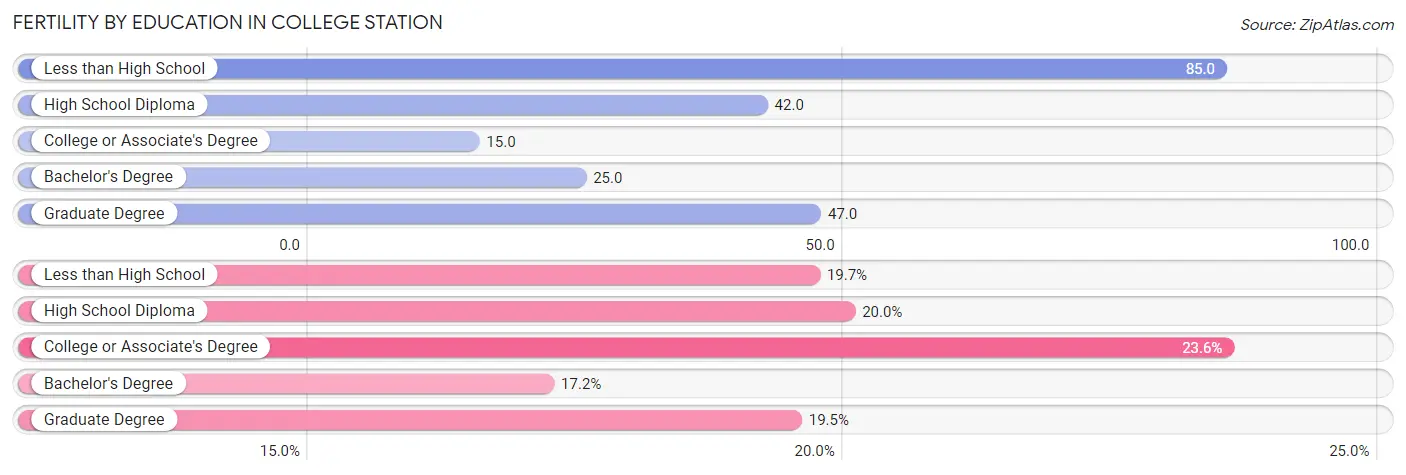
| Educational Attainment | Women with Births | Births / 1,000 Women |
| Less than High School | 238 (19.7%) | 85.0 |
| High School Diploma | 242 (20.0%) | 42.0 |
| College or Associate's Degree | 285 (23.6%) | 15.0 |
| Bachelor's Degree | 208 (17.2%) | 25.0 |
| Graduate Degree | 236 (19.5%) | 47.0 |
| Total | 1,209 (100.0%) | 30.0 |
Fertility by Education by Marriage Status in College Station
50.5% of women with births in College Station are unmarried. Women with the educational attainment of bachelor's degree are most likely to be married with 100.0% of them married at childbirth, while women with the educational attainment of less than high school are least likely to be married with 100.0% of them unmarried at childbirth.
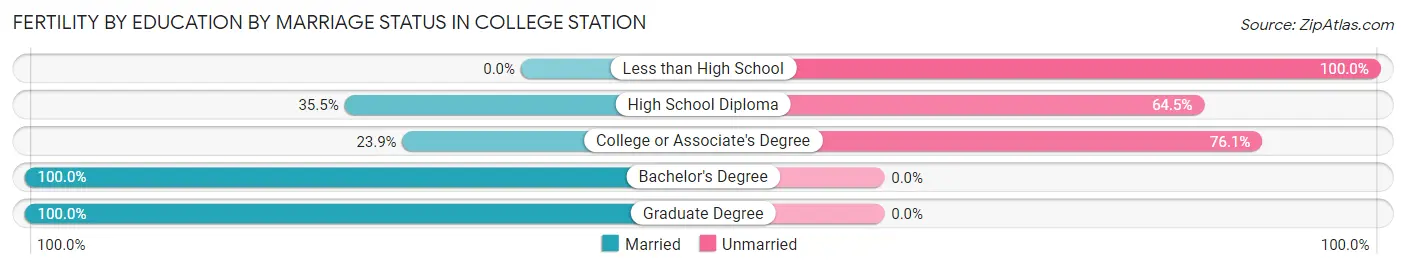
| Educational Attainment | Married | Unmarried |
| Less than High School | 0 (0.0%) | 238 (100.0%) |
| High School Diploma | 86 (35.5%) | 156 (64.5%) |
| College or Associate's Degree | 68 (23.9%) | 217 (76.1%) |
| Bachelor's Degree | 208 (100.0%) | 0 (0.0%) |
| Graduate Degree | 236 (100.0%) | 0 (0.0%) |
| Total | 598 (49.5%) | 611 (50.5%) |
Employment Characteristics in College Station
Employment by Class of Employer in College Station
Among the 59,399 employed individuals in College Station, private company employees (34,134 | 57.5%), state government employees (12,468 | 21.0%), and not-for-profit organizations (4,148 | 7.0%) make up the most common classes of employment.
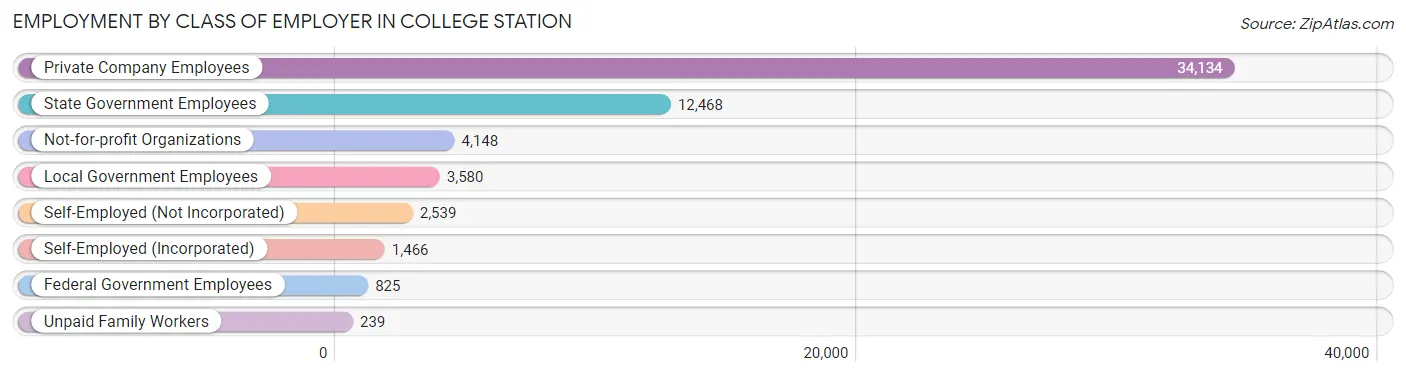
| Employer Class | # Employees | % Employees |
| Private Company Employees | 34,134 | 57.5% |
| Self-Employed (Incorporated) | 1,466 | 2.5% |
| Self-Employed (Not Incorporated) | 2,539 | 4.3% |
| Not-for-profit Organizations | 4,148 | 7.0% |
| Local Government Employees | 3,580 | 6.0% |
| State Government Employees | 12,468 | 21.0% |
| Federal Government Employees | 825 | 1.4% |
| Unpaid Family Workers | 239 | 0.4% |
| Total | 59,399 | 100.0% |
Employment Status by Age in College Station
According to the labor force statistics for College Station, out of the total population over 16 years of age (102,872), 61.6% or 63,369 individuals are in the labor force, with 4.7% or 2,978 of them unemployed. The age group with the highest labor force participation rate is 30 to 34 years, with 88.8% or 6,108 individuals in the labor force. Within the labor force, the 16 to 19 years age range has the highest percentage of unemployed individuals, with 17.3% or 998 of them being unemployed.
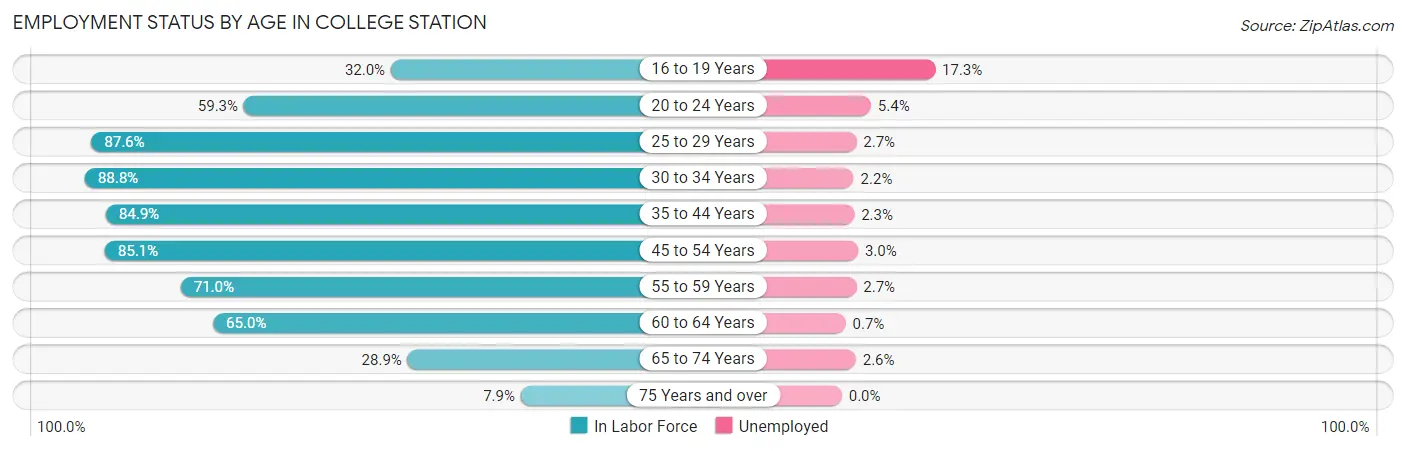
| Age Bracket | In Labor Force | Unemployed |
| 16 to 19 Years | 5,767 (32.0%) | 998 (17.3%) |
| 20 to 24 Years | 19,785 (59.3%) | 1,068 (5.4%) |
| 25 to 29 Years | 7,972 (87.6%) | 215 (2.7%) |
| 30 to 34 Years | 6,108 (88.8%) | 134 (2.2%) |
| 35 to 44 Years | 10,219 (84.9%) | 235 (2.3%) |
| 45 to 54 Years | 6,874 (85.1%) | 206 (3.0%) |
| 55 to 59 Years | 2,724 (71.0%) | 74 (2.7%) |
| 60 to 64 Years | 2,187 (65.0%) | 15 (0.7%) |
| 65 to 74 Years | 1,455 (28.9%) | 38 (2.6%) |
| 75 Years and over | 249 (7.9%) | 0 (0.0%) |
| Total | 63,369 (61.6%) | 2,978 (4.7%) |
Employment Status by Educational Attainment in College Station
According to labor force statistics for College Station, 83.4% of individuals (36,107) out of the total population between 25 and 64 years of age (43,294) are in the labor force, with 2.4% or 867 of them being unemployed. The group with the highest labor force participation rate are those with the educational attainment of bachelor's degree or higher, with 87.8% or 22,714 individuals in the labor force. Within the labor force, individuals with less than high school education have the highest percentage of unemployment, with 7.6% or 115 of them being unemployed.
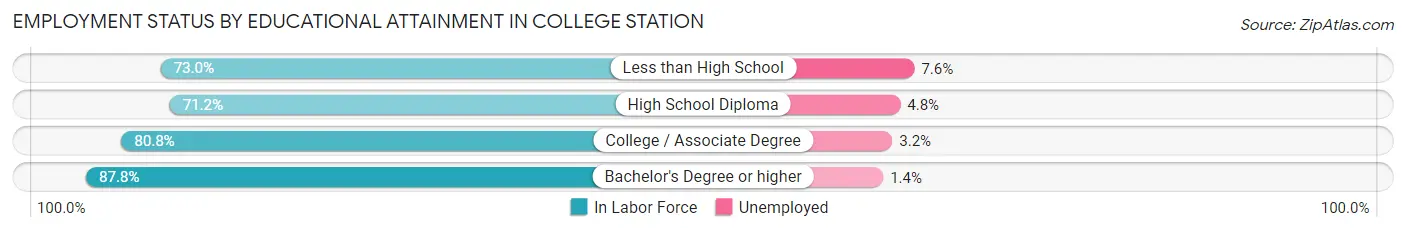
| Educational Attainment | In Labor Force | Unemployed |
| Less than High School | 1,513 (73.0%) | 157 (7.6%) |
| High School Diploma | 4,085 (71.2%) | 275 (4.8%) |
| College / Associate Degree | 7,768 (80.8%) | 308 (3.2%) |
| Bachelor's Degree or higher | 22,714 (87.8%) | 362 (1.4%) |
| Total | 36,107 (83.4%) | 1,039 (2.4%) |
Employment Occupations by Sex in College Station
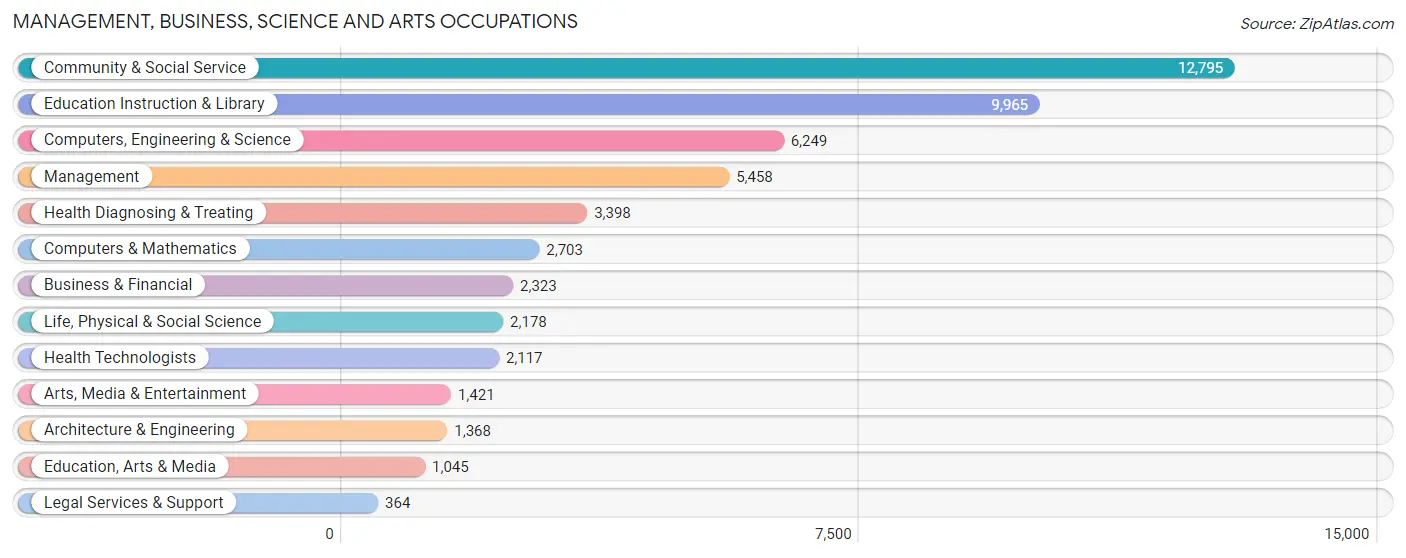
Management, Business, Science and Arts Occupations
The most common Management, Business, Science and Arts occupations in College Station are Community & Social Service (12,795 | 21.2%), Education Instruction & Library (9,965 | 16.6%), Computers, Engineering & Science (6,249 | 10.4%), Management (5,458 | 9.1%), and Health Diagnosing & Treating (3,398 | 5.6%).
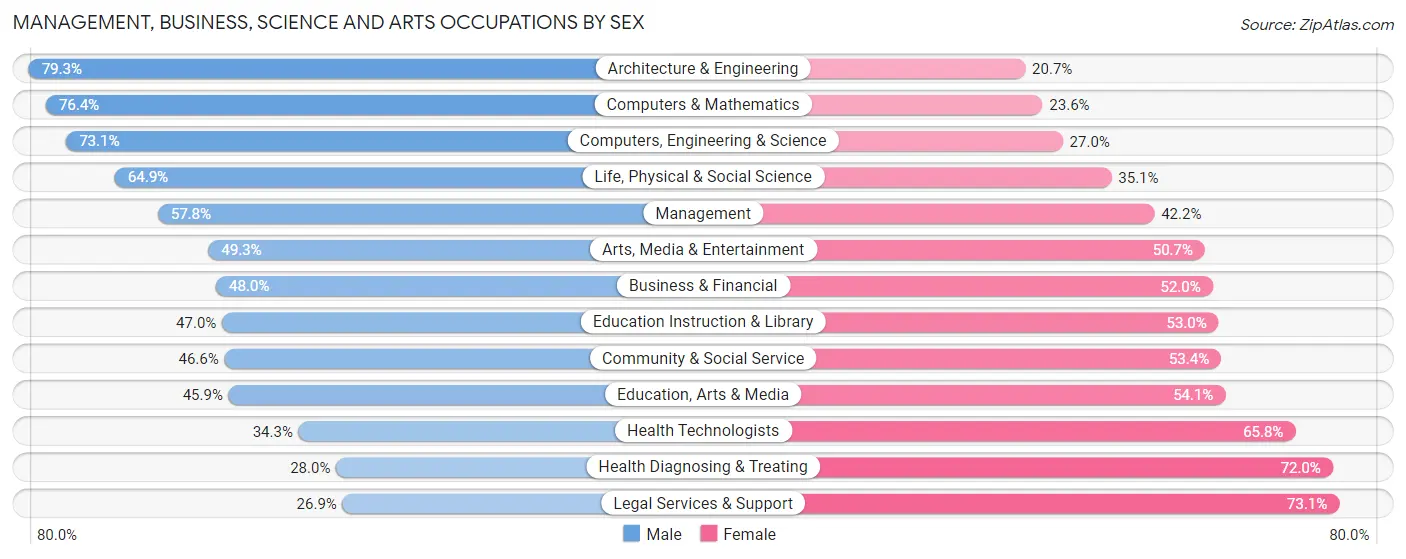
Management, Business, Science and Arts Occupations by Sex
Within the Management, Business, Science and Arts occupations in College Station, the most male-oriented occupations are Architecture & Engineering (79.3%), Computers & Mathematics (76.4%), and Computers, Engineering & Science (73.1%), while the most female-oriented occupations are Legal Services & Support (73.1%), Health Diagnosing & Treating (72.0%), and Health Technologists (65.7%).
| Occupation | Male | Female |
| Management | 3,153 (57.8%) | 2,305 (42.2%) |
| Business & Financial | 1,116 (48.0%) | 1,207 (52.0%) |
| Computers, Engineering & Science | 4,565 (73.1%) | 1,684 (27.0%) |
| Computers & Mathematics | 2,066 (76.4%) | 637 (23.6%) |
| Architecture & Engineering | 1,085 (79.3%) | 283 (20.7%) |
| Life, Physical & Social Science | 1,414 (64.9%) | 764 (35.1%) |
| Community & Social Service | 5,966 (46.6%) | 6,829 (53.4%) |
| Education, Arts & Media | 480 (45.9%) | 565 (54.1%) |
| Legal Services & Support | 98 (26.9%) | 266 (73.1%) |
| Education Instruction & Library | 4,687 (47.0%) | 5,278 (53.0%) |
| Arts, Media & Entertainment | 701 (49.3%) | 720 (50.7%) |
| Health Diagnosing & Treating | 951 (28.0%) | 2,447 (72.0%) |
| Health Technologists | 725 (34.3%) | 1,392 (65.7%) |
| Total (Category) | 15,751 (52.1%) | 14,472 (47.9%) |
| Total (Overall) | 31,933 (53.0%) | 28,281 (47.0%) |
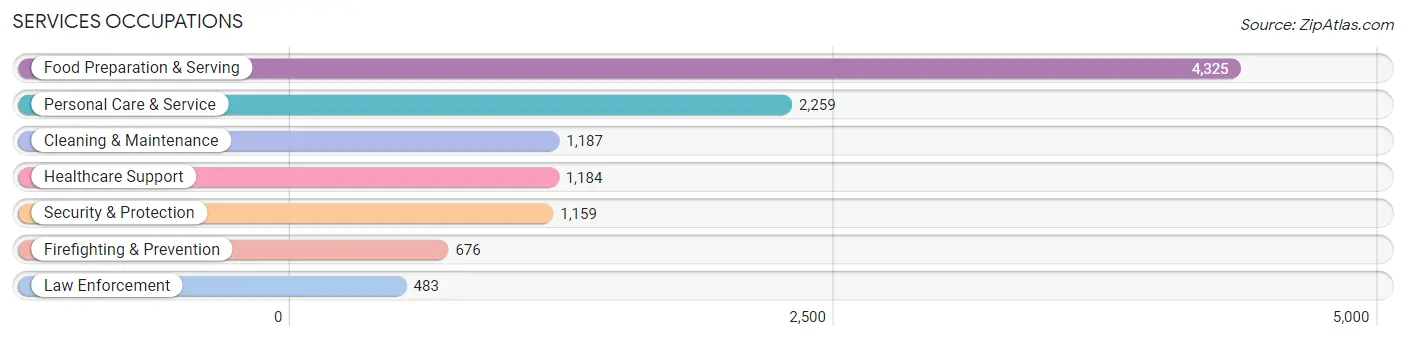
Services Occupations
The most common Services occupations in College Station are Food Preparation & Serving (4,325 | 7.2%), Personal Care & Service (2,259 | 3.7%), Cleaning & Maintenance (1,187 | 2.0%), Healthcare Support (1,184 | 2.0%), and Security & Protection (1,159 | 1.9%).
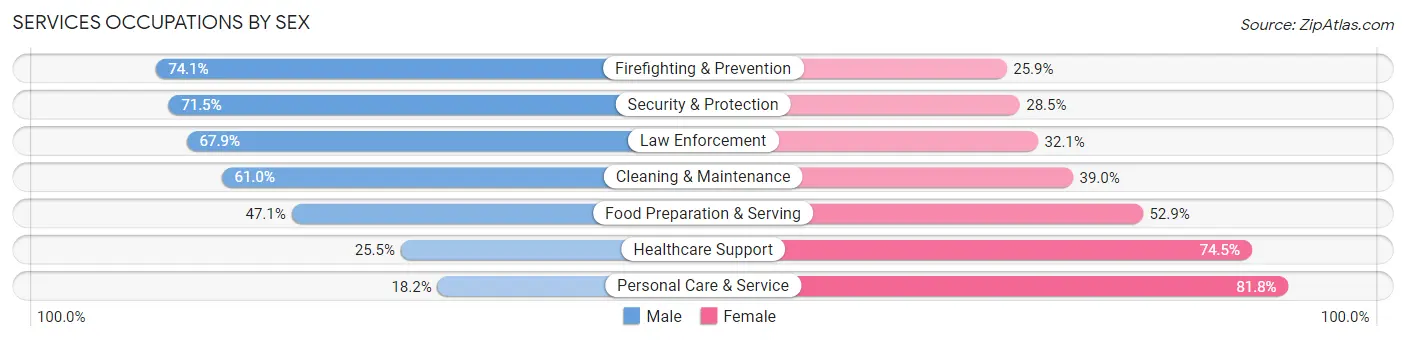
Services Occupations by Sex
Within the Services occupations in College Station, the most male-oriented occupations are Firefighting & Prevention (74.1%), Security & Protection (71.5%), and Law Enforcement (67.9%), while the most female-oriented occupations are Personal Care & Service (81.8%), Healthcare Support (74.5%), and Food Preparation & Serving (52.9%).
| Occupation | Male | Female |
| Healthcare Support | 302 (25.5%) | 882 (74.5%) |
| Security & Protection | 829 (71.5%) | 330 (28.5%) |
| Firefighting & Prevention | 501 (74.1%) | 175 (25.9%) |
| Law Enforcement | 328 (67.9%) | 155 (32.1%) |
| Food Preparation & Serving | 2,039 (47.1%) | 2,286 (52.9%) |
| Cleaning & Maintenance | 724 (61.0%) | 463 (39.0%) |
| Personal Care & Service | 412 (18.2%) | 1,847 (81.8%) |
| Total (Category) | 4,306 (42.6%) | 5,808 (57.4%) |
| Total (Overall) | 31,933 (53.0%) | 28,281 (47.0%) |
Sales and Office Occupations
The most common Sales and Office occupations in College Station are Sales & Related (6,383 | 10.6%), and Office & Administration (6,334 | 10.5%).

Sales and Office Occupations by Sex
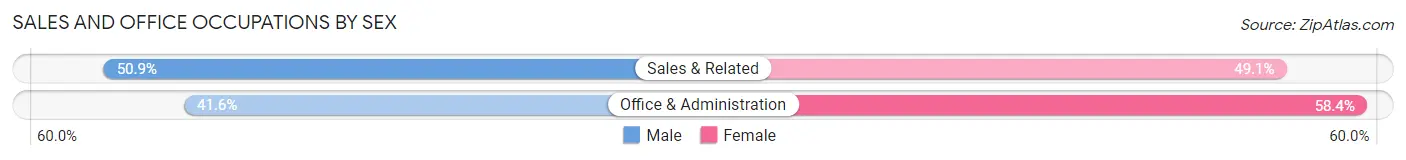
| Occupation | Male | Female |
| Sales & Related | 3,247 (50.9%) | 3,136 (49.1%) |
| Office & Administration | 2,635 (41.6%) | 3,699 (58.4%) |
| Total (Category) | 5,882 (46.3%) | 6,835 (53.7%) |
| Total (Overall) | 31,933 (53.0%) | 28,281 (47.0%) |
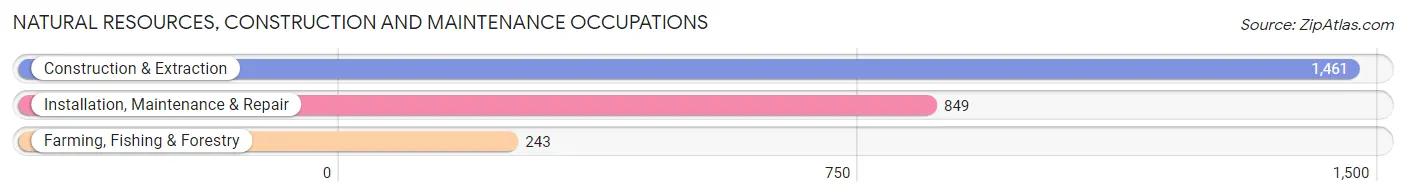
Natural Resources, Construction and Maintenance Occupations
The most common Natural Resources, Construction and Maintenance occupations in College Station are Construction & Extraction (1,461 | 2.4%), Installation, Maintenance & Repair (849 | 1.4%), and Farming, Fishing & Forestry (243 | 0.4%).
Natural Resources, Construction and Maintenance Occupations by Sex
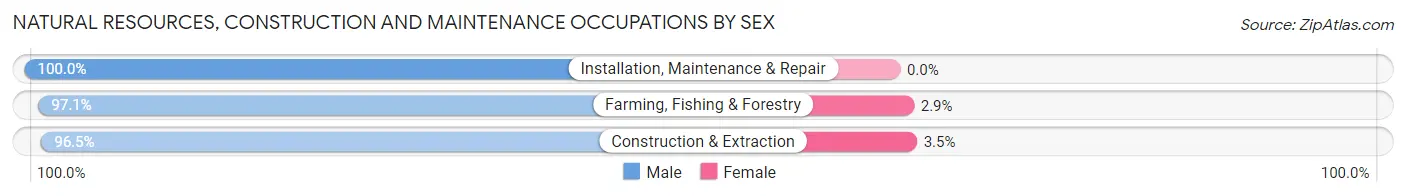
| Occupation | Male | Female |
| Farming, Fishing & Forestry | 236 (97.1%) | 7 (2.9%) |
| Construction & Extraction | 1,410 (96.5%) | 51 (3.5%) |
| Installation, Maintenance & Repair | 849 (100.0%) | 0 (0.0%) |
| Total (Category) | 2,495 (97.7%) | 58 (2.3%) |
| Total (Overall) | 31,933 (53.0%) | 28,281 (47.0%) |
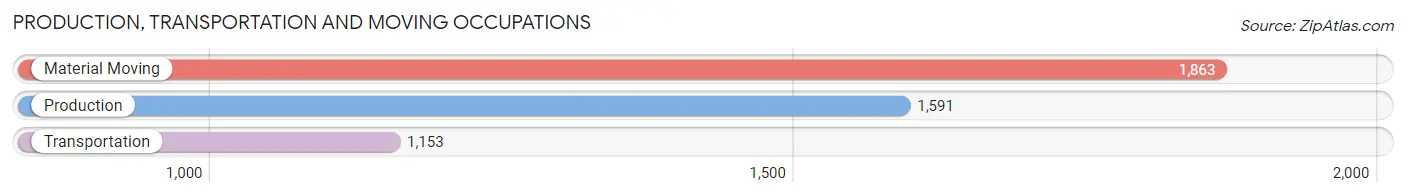
Production, Transportation and Moving Occupations
The most common Production, Transportation and Moving occupations in College Station are Material Moving (1,863 | 3.1%), Production (1,591 | 2.6%), and Transportation (1,153 | 1.9%).
Production, Transportation and Moving Occupations by Sex
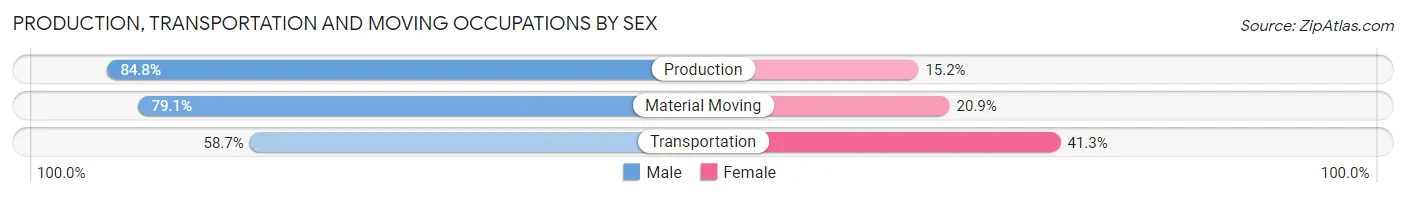
| Occupation | Male | Female |
| Production | 1,349 (84.8%) | 242 (15.2%) |
| Transportation | 677 (58.7%) | 476 (41.3%) |
| Material Moving | 1,473 (79.1%) | 390 (20.9%) |
| Total (Category) | 3,499 (75.9%) | 1,108 (24.0%) |
| Total (Overall) | 31,933 (53.0%) | 28,281 (47.0%) |
Employment Industries by Sex in College Station
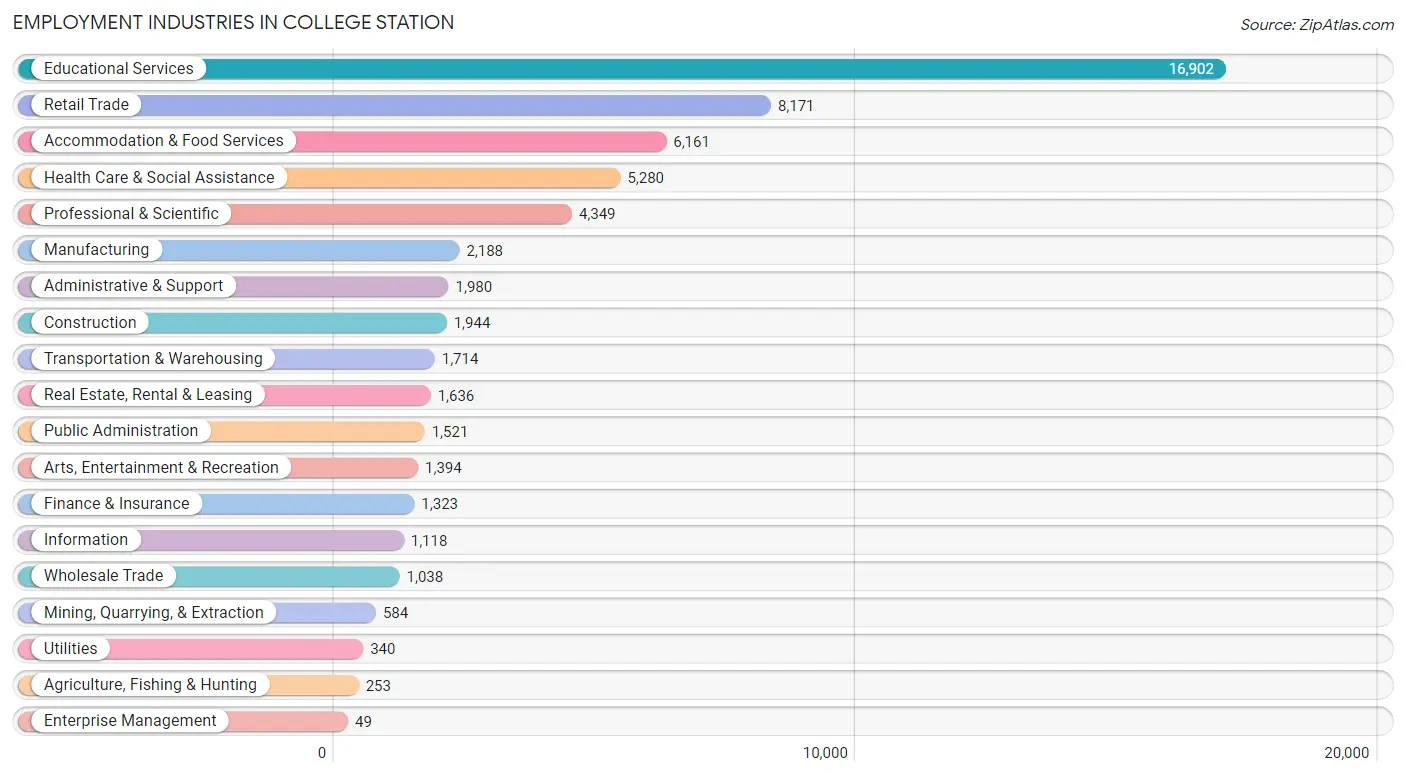
Employment Industries in College Station
The major employment industries in College Station include Educational Services (16,902 | 28.1%), Retail Trade (8,171 | 13.6%), Accommodation & Food Services (6,161 | 10.2%), Health Care & Social Assistance (5,280 | 8.8%), and Professional & Scientific (4,349 | 7.2%).
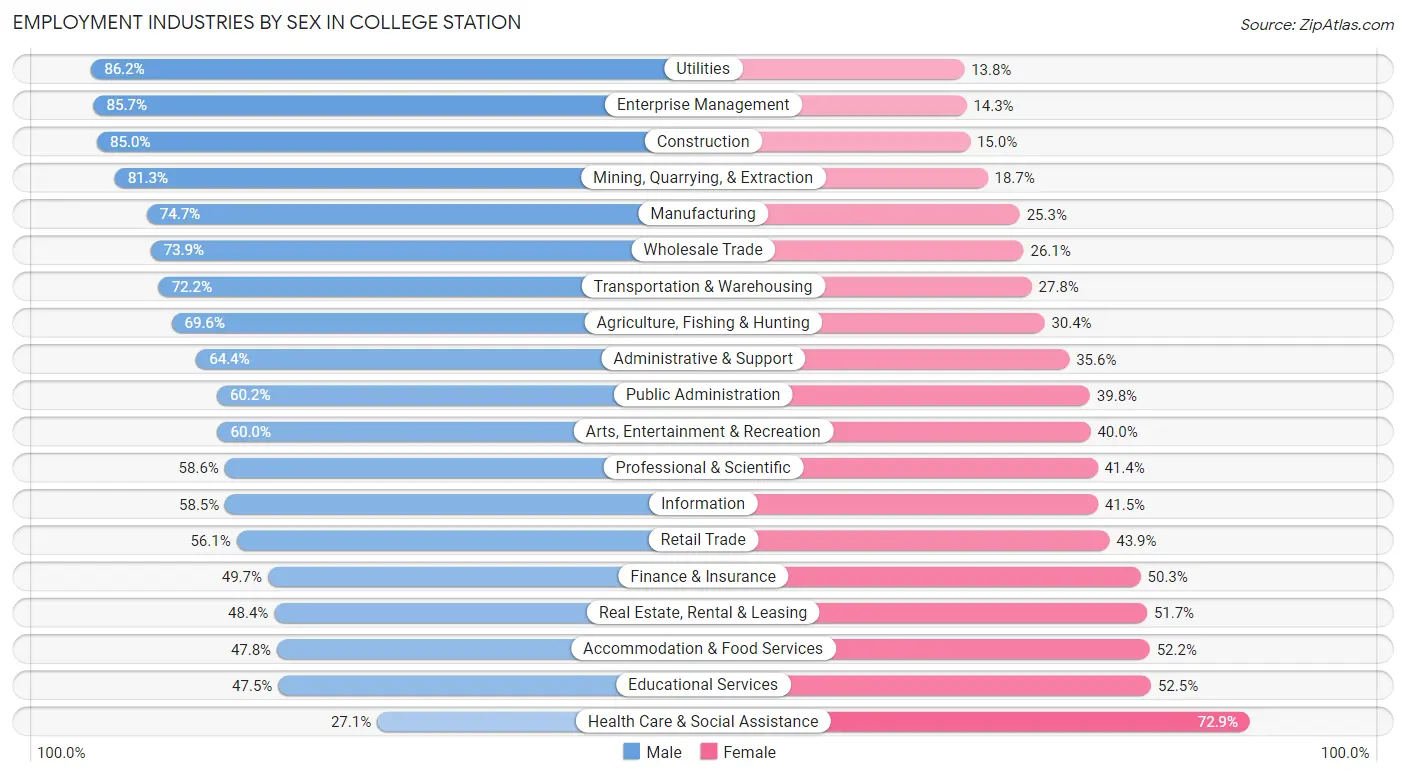
Employment Industries by Sex in College Station
The College Station industries that see more men than women are Utilities (86.2%), Enterprise Management (85.7%), and Construction (85.0%), whereas the industries that tend to have a higher number of women are Health Care & Social Assistance (72.9%), Educational Services (52.5%), and Accommodation & Food Services (52.2%).
| Industry | Male | Female |
| Agriculture, Fishing & Hunting | 176 (69.6%) | 77 (30.4%) |
| Mining, Quarrying, & Extraction | 475 (81.3%) | 109 (18.7%) |
| Construction | 1,652 (85.0%) | 292 (15.0%) |
| Manufacturing | 1,634 (74.7%) | 554 (25.3%) |
| Wholesale Trade | 767 (73.9%) | 271 (26.1%) |
| Retail Trade | 4,587 (56.1%) | 3,584 (43.9%) |
| Transportation & Warehousing | 1,238 (72.2%) | 476 (27.8%) |
| Utilities | 293 (86.2%) | 47 (13.8%) |
| Information | 654 (58.5%) | 464 (41.5%) |
| Finance & Insurance | 657 (49.7%) | 666 (50.3%) |
| Real Estate, Rental & Leasing | 791 (48.3%) | 845 (51.6%) |
| Professional & Scientific | 2,548 (58.6%) | 1,801 (41.4%) |
| Enterprise Management | 42 (85.7%) | 7 (14.3%) |
| Administrative & Support | 1,276 (64.4%) | 704 (35.6%) |
| Educational Services | 8,032 (47.5%) | 8,870 (52.5%) |
| Health Care & Social Assistance | 1,429 (27.1%) | 3,851 (72.9%) |
| Arts, Entertainment & Recreation | 837 (60.0%) | 557 (40.0%) |
| Accommodation & Food Services | 2,943 (47.8%) | 3,218 (52.2%) |
| Public Administration | 915 (60.2%) | 606 (39.8%) |
| Total | 31,933 (53.0%) | 28,281 (47.0%) |
Education in College Station
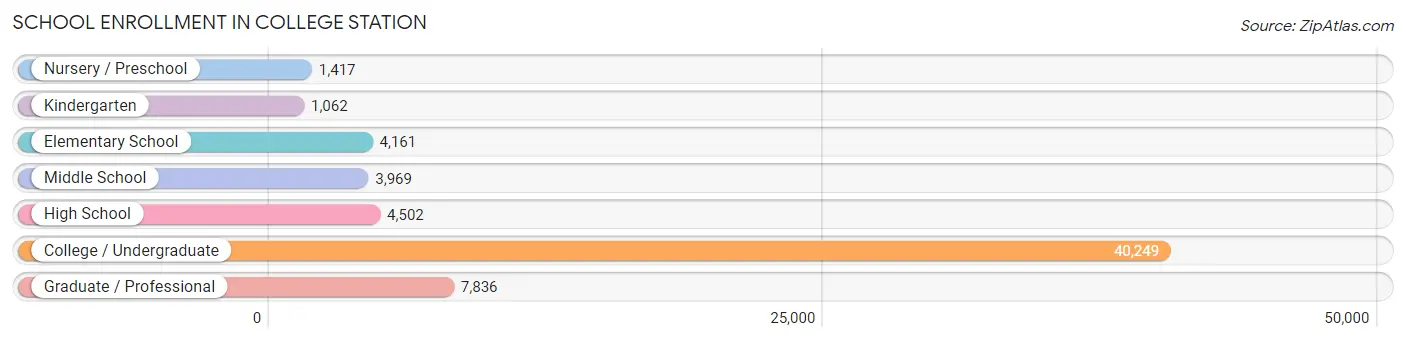
School Enrollment in College Station
The most common levels of schooling among the 63,196 students in College Station are college / undergraduate (40,249 | 63.7%), graduate / professional (7,836 | 12.4%), and high school (4,502 | 7.1%).
| School Level | # Students | % Students |
| Nursery / Preschool | 1,417 | 2.2% |
| Kindergarten | 1,062 | 1.7% |
| Elementary School | 4,161 | 6.6% |
| Middle School | 3,969 | 6.3% |
| High School | 4,502 | 7.1% |
| College / Undergraduate | 40,249 | 63.7% |
| Graduate / Professional | 7,836 | 12.4% |
| Total | 63,196 | 100.0% |
School Enrollment by Age by Funding Source in College Station
Out of a total of 63,196 students who are enrolled in schools in College Station, 3,792 (6.0%) attend a private institution, while the remaining 59,404 (94.0%) are enrolled in public schools. The age group of 3 to 4 year olds has the highest likelihood of being enrolled in private schools, with 481 (51.3% in the age bracket) enrolled. Conversely, the age group of 20 to 24 year olds has the lowest likelihood of being enrolled in a private school, with 26,256 (97.3% in the age bracket) attending a public institution.
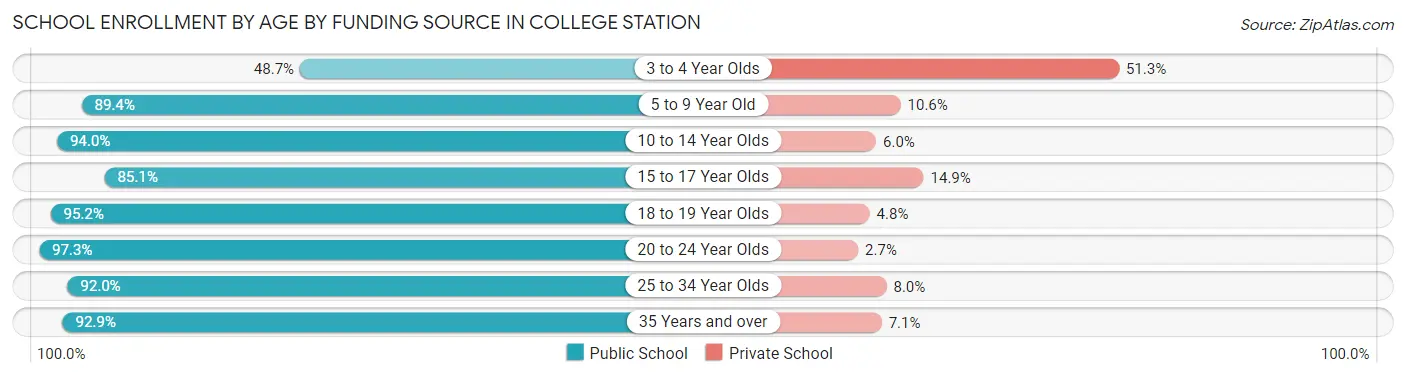
| Age Bracket | Public School | Private School |
| 3 to 4 Year Olds | 457 (48.7%) | 481 (51.3%) |
| 5 to 9 Year Old | 4,650 (89.4%) | 552 (10.6%) |
| 10 to 14 Year Olds | 4,574 (94.0%) | 294 (6.0%) |
| 15 to 17 Year Olds | 2,914 (85.1%) | 510 (14.9%) |
| 18 to 19 Year Olds | 14,362 (95.2%) | 731 (4.8%) |
| 20 to 24 Year Olds | 26,256 (97.3%) | 729 (2.7%) |
| 25 to 34 Year Olds | 4,566 (92.0%) | 396 (8.0%) |
| 35 Years and over | 1,602 (92.9%) | 122 (7.1%) |
| Total | 59,404 (94.0%) | 3,792 (6.0%) |
Educational Attainment by Field of Study in College Station
Business (4,405 | 13.7%), engineering (4,239 | 13.2%), bio, nature & agricultural (4,036 | 12.5%), science & technology (2,673 | 8.3%), and social sciences (2,337 | 7.2%) are the most common fields of study among 32,242 individuals in College Station who have obtained a bachelor's degree or higher.
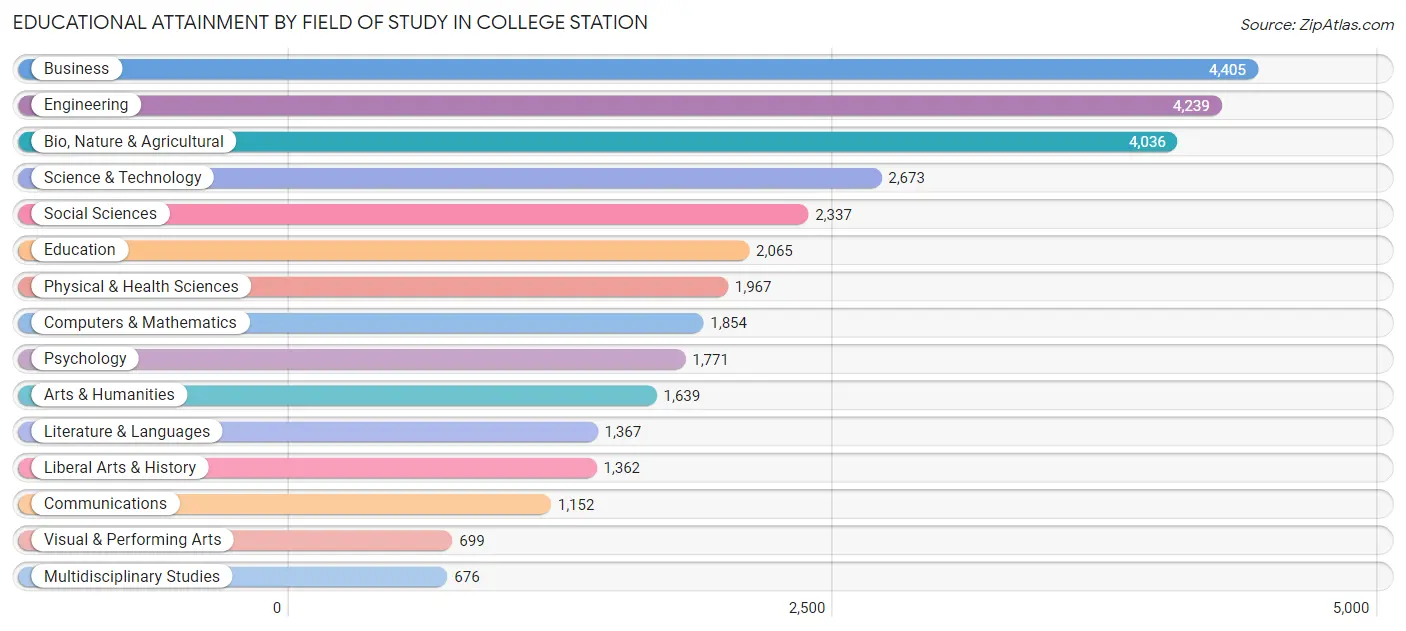
| Field of Study | # Graduates | % Graduates |
| Computers & Mathematics | 1,854 | 5.8% |
| Bio, Nature & Agricultural | 4,036 | 12.5% |
| Physical & Health Sciences | 1,967 | 6.1% |
| Psychology | 1,771 | 5.5% |
| Social Sciences | 2,337 | 7.2% |
| Engineering | 4,239 | 13.2% |
| Multidisciplinary Studies | 676 | 2.1% |
| Science & Technology | 2,673 | 8.3% |
| Business | 4,405 | 13.7% |
| Education | 2,065 | 6.4% |
| Literature & Languages | 1,367 | 4.2% |
| Liberal Arts & History | 1,362 | 4.2% |
| Visual & Performing Arts | 699 | 2.2% |
| Communications | 1,152 | 3.6% |
| Arts & Humanities | 1,639 | 5.1% |
| Total | 32,242 | 100.0% |
Transportation & Commute in College Station
Vehicle Availability by Sex in College Station
The most prevalent vehicle ownership categories in College Station are males with 2 vehicles (13,189, accounting for 44.0%) and females with 2 vehicles (10,544, making up 50.2%).
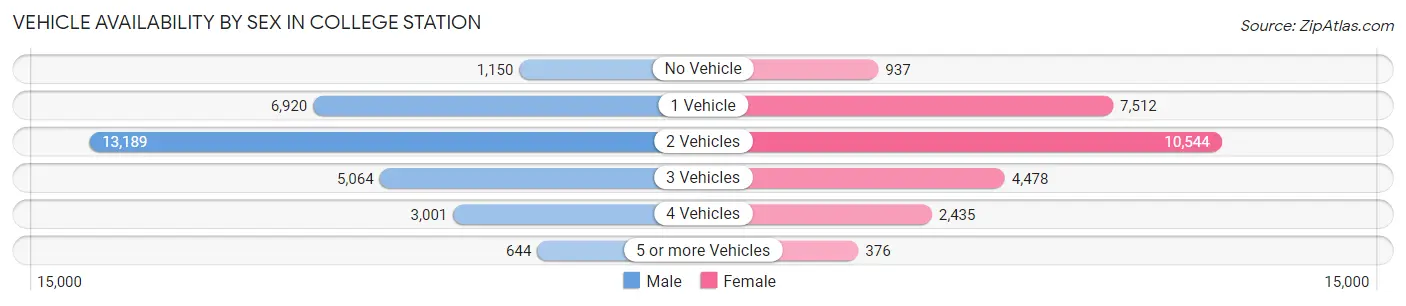
| Vehicles Available | Male | Female |
| No Vehicle | 1,150 (3.8%) | 937 (3.6%) |
| 1 Vehicle | 6,920 (23.1%) | 7,512 (28.6%) |
| 2 Vehicles | 13,189 (44.0%) | 10,544 (40.1%) |
| 3 Vehicles | 5,064 (16.9%) | 4,478 (17.0%) |
| 4 Vehicles | 3,001 (10.0%) | 2,435 (9.3%) |
| 5 or more Vehicles | 644 (2.1%) | 376 (1.4%) |
| Total | 29,968 (100.0%) | 26,282 (100.0%) |
Commute Time in College Station
The most frequently occuring commute durations in College Station are 15 to 19 minutes (15,854 commuters, 30.1%), 10 to 14 minutes (13,758 commuters, 26.1%), and 5 to 9 minutes (7,686 commuters, 14.6%).
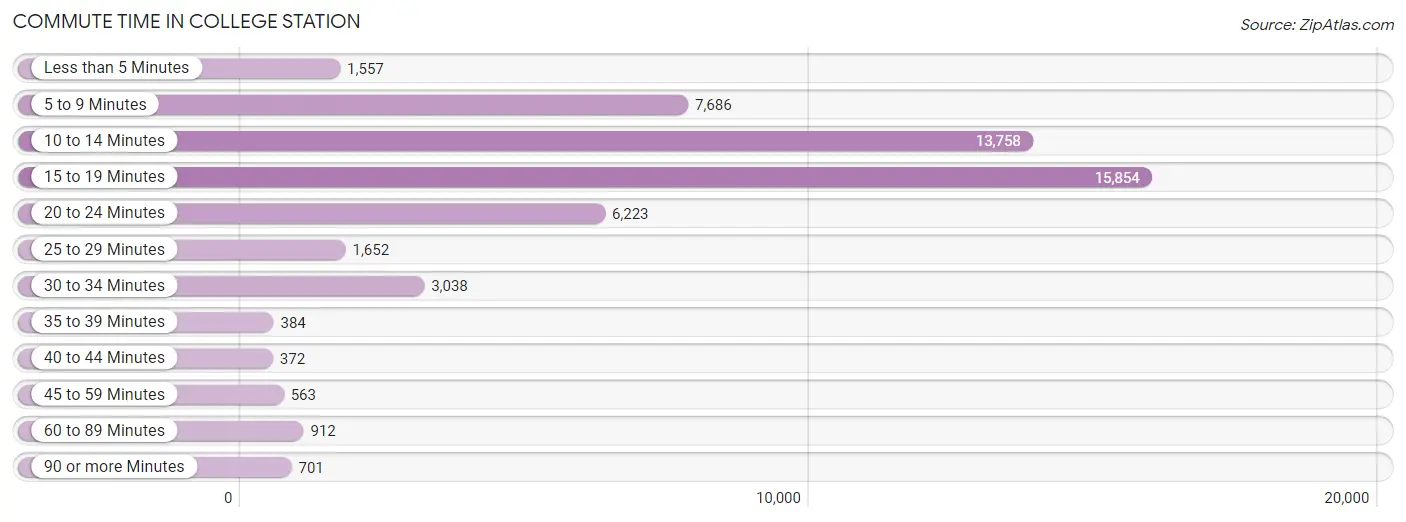
| Commute Time | # Commuters | % Commuters |
| Less than 5 Minutes | 1,557 | 2.9% |
| 5 to 9 Minutes | 7,686 | 14.6% |
| 10 to 14 Minutes | 13,758 | 26.1% |
| 15 to 19 Minutes | 15,854 | 30.1% |
| 20 to 24 Minutes | 6,223 | 11.8% |
| 25 to 29 Minutes | 1,652 | 3.1% |
| 30 to 34 Minutes | 3,038 | 5.8% |
| 35 to 39 Minutes | 384 | 0.7% |
| 40 to 44 Minutes | 372 | 0.7% |
| 45 to 59 Minutes | 563 | 1.1% |
| 60 to 89 Minutes | 912 | 1.7% |
| 90 or more Minutes | 701 | 1.3% |
Commute Time by Sex in College Station
The most common commute times in College Station are 15 to 19 minutes (8,817 commuters, 31.7%) for males and 15 to 19 minutes (7,037 commuters, 28.3%) for females.
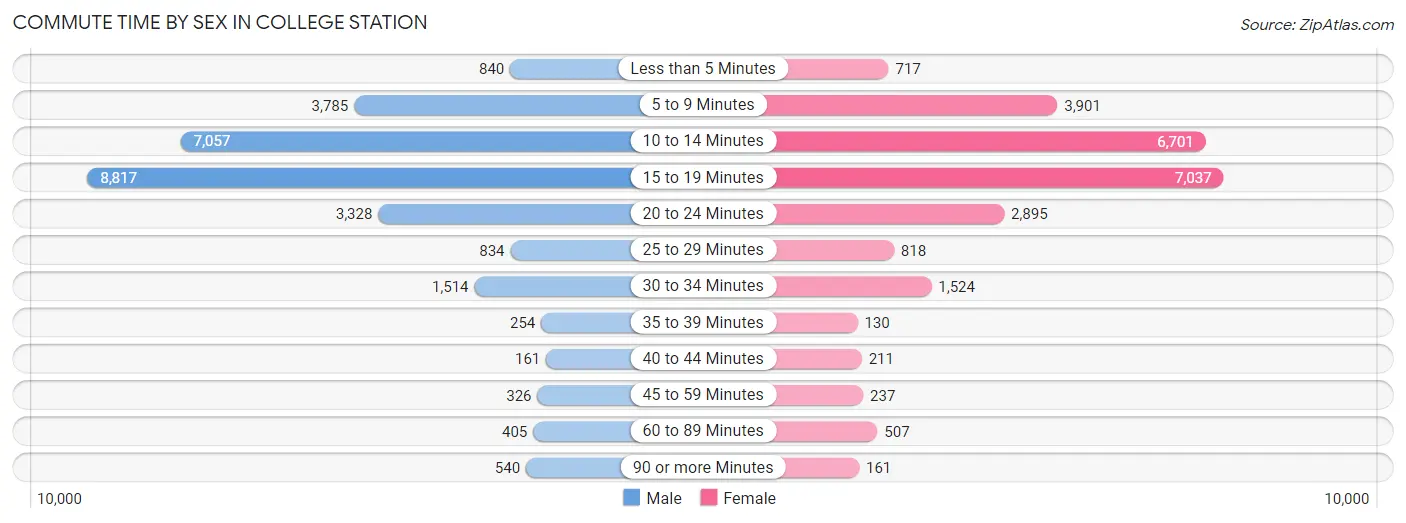
| Commute Time | Male | Female |
| Less than 5 Minutes | 840 (3.0%) | 717 (2.9%) |
| 5 to 9 Minutes | 3,785 (13.6%) | 3,901 (15.7%) |
| 10 to 14 Minutes | 7,057 (25.3%) | 6,701 (27.0%) |
| 15 to 19 Minutes | 8,817 (31.7%) | 7,037 (28.3%) |
| 20 to 24 Minutes | 3,328 (11.9%) | 2,895 (11.7%) |
| 25 to 29 Minutes | 834 (3.0%) | 818 (3.3%) |
| 30 to 34 Minutes | 1,514 (5.4%) | 1,524 (6.1%) |
| 35 to 39 Minutes | 254 (0.9%) | 130 (0.5%) |
| 40 to 44 Minutes | 161 (0.6%) | 211 (0.9%) |
| 45 to 59 Minutes | 326 (1.2%) | 237 (0.9%) |
| 60 to 89 Minutes | 405 (1.5%) | 507 (2.0%) |
| 90 or more Minutes | 540 (1.9%) | 161 (0.6%) |
Time of Departure to Work by Sex in College Station
The most frequent times of departure to work in College Station are 7:30 AM to 7:59 AM (5,466, 19.6%) for males and 7:30 AM to 7:59 AM (5,522, 22.2%) for females.
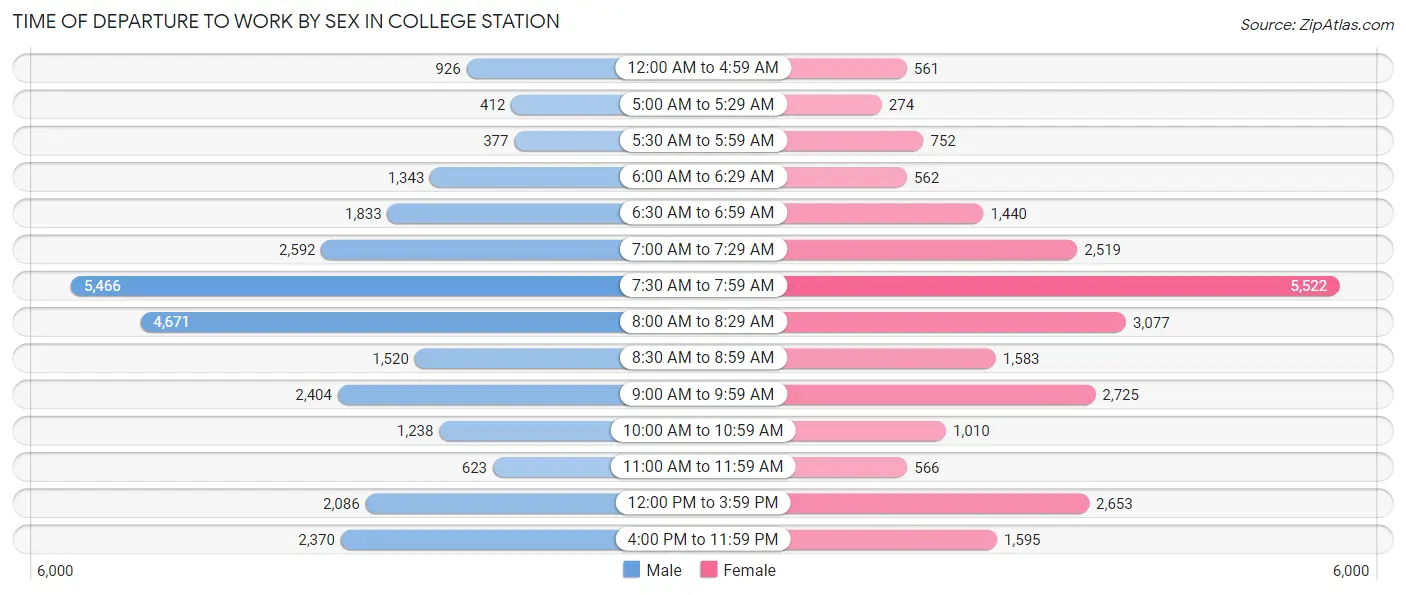
| Time of Departure | Male | Female |
| 12:00 AM to 4:59 AM | 926 (3.3%) | 561 (2.3%) |
| 5:00 AM to 5:29 AM | 412 (1.5%) | 274 (1.1%) |
| 5:30 AM to 5:59 AM | 377 (1.3%) | 752 (3.0%) |
| 6:00 AM to 6:29 AM | 1,343 (4.8%) | 562 (2.3%) |
| 6:30 AM to 6:59 AM | 1,833 (6.6%) | 1,440 (5.8%) |
| 7:00 AM to 7:29 AM | 2,592 (9.3%) | 2,519 (10.1%) |
| 7:30 AM to 7:59 AM | 5,466 (19.6%) | 5,522 (22.2%) |
| 8:00 AM to 8:29 AM | 4,671 (16.8%) | 3,077 (12.4%) |
| 8:30 AM to 8:59 AM | 1,520 (5.5%) | 1,583 (6.4%) |
| 9:00 AM to 9:59 AM | 2,404 (8.6%) | 2,725 (11.0%) |
| 10:00 AM to 10:59 AM | 1,238 (4.4%) | 1,010 (4.1%) |
| 11:00 AM to 11:59 AM | 623 (2.2%) | 566 (2.3%) |
| 12:00 PM to 3:59 PM | 2,086 (7.5%) | 2,653 (10.7%) |
| 4:00 PM to 11:59 PM | 2,370 (8.5%) | 1,595 (6.4%) |
| Total | 27,861 (100.0%) | 24,839 (100.0%) |
Housing Occupancy in College Station
Occupancy by Ownership in College Station
Of the total 44,029 dwellings in College Station, owner-occupied units account for 15,968 (36.3%), while renter-occupied units make up 28,061 (63.7%).
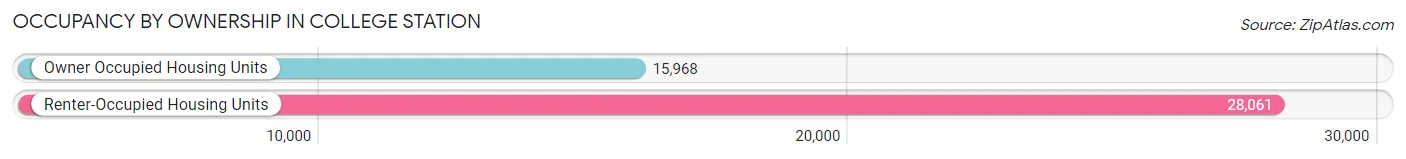
| Occupancy | # Housing Units | % Housing Units |
| Owner Occupied Housing Units | 15,968 | 36.3% |
| Renter-Occupied Housing Units | 28,061 | 63.7% |
| Total Occupied Housing Units | 44,029 | 100.0% |
Occupancy by Household Size in College Station
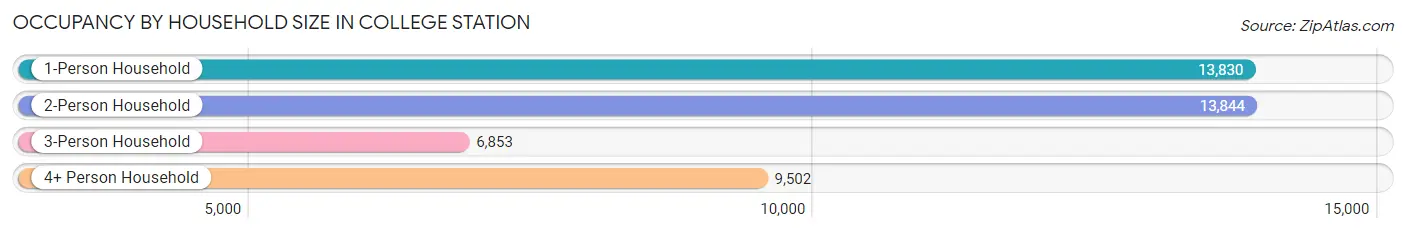
| Household Size | # Housing Units | % Housing Units |
| 1-Person Household | 13,830 | 31.4% |
| 2-Person Household | 13,844 | 31.4% |
| 3-Person Household | 6,853 | 15.6% |
| 4+ Person Household | 9,502 | 21.6% |
| Total Housing Units | 44,029 | 100.0% |
Occupancy by Ownership by Household Size in College Station
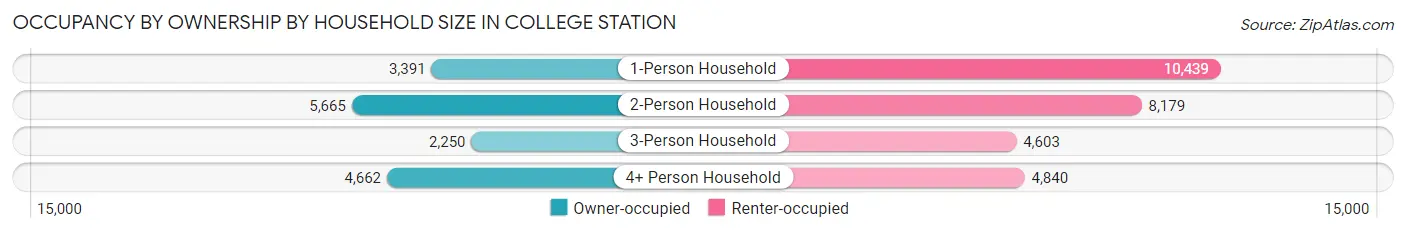
| Household Size | Owner-occupied | Renter-occupied |
| 1-Person Household | 3,391 (24.5%) | 10,439 (75.5%) |
| 2-Person Household | 5,665 (40.9%) | 8,179 (59.1%) |
| 3-Person Household | 2,250 (32.8%) | 4,603 (67.2%) |
| 4+ Person Household | 4,662 (49.1%) | 4,840 (50.9%) |
| Total Housing Units | 15,968 (36.3%) | 28,061 (63.7%) |
Occupancy by Educational Attainment in College Station
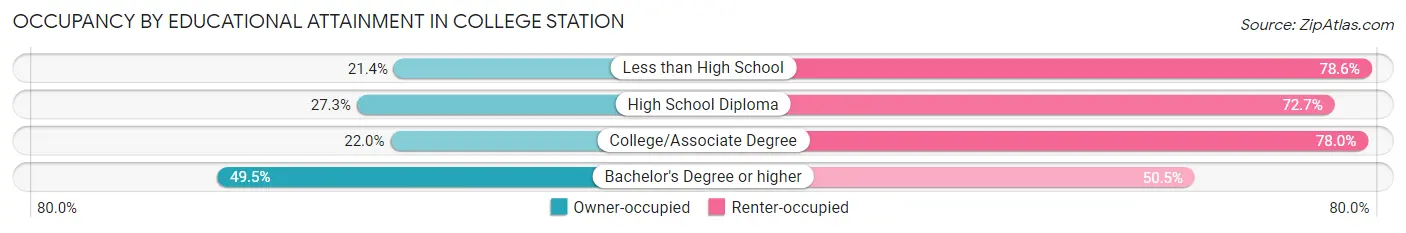
| Household Size | Owner-occupied | Renter-occupied |
| Less than High School | 324 (21.4%) | 1,188 (78.6%) |
| High School Diploma | 1,526 (27.3%) | 4,061 (72.7%) |
| College/Associate Degree | 3,323 (22.0%) | 11,781 (78.0%) |
| Bachelor's Degree or higher | 10,795 (49.5%) | 11,031 (50.5%) |
Occupancy by Age of Householder in College Station
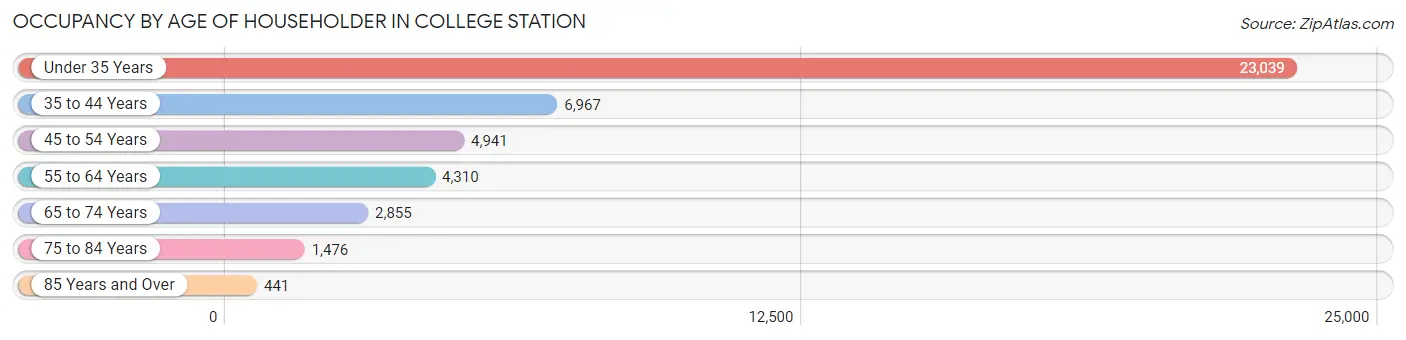
| Age Bracket | # Households | % Households |
| Under 35 Years | 23,039 | 52.3% |
| 35 to 44 Years | 6,967 | 15.8% |
| 45 to 54 Years | 4,941 | 11.2% |
| 55 to 64 Years | 4,310 | 9.8% |
| 65 to 74 Years | 2,855 | 6.5% |
| 75 to 84 Years | 1,476 | 3.4% |
| 85 Years and Over | 441 | 1.0% |
| Total | 44,029 | 100.0% |
Housing Finances in College Station
Median Income by Occupancy in College Station
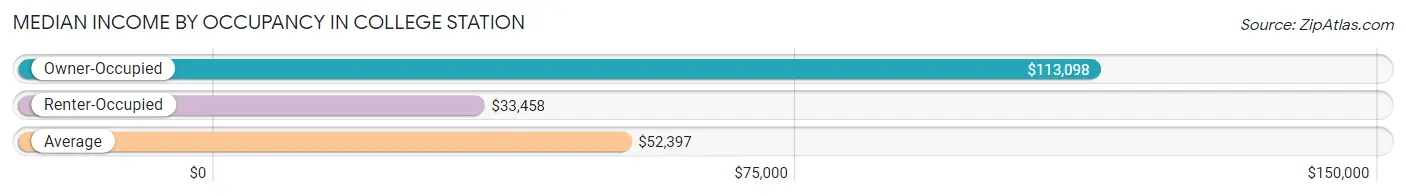
| Occupancy Type | # Households | Median Income |
| Owner-Occupied | 15,968 (36.3%) | $113,098 |
| Renter-Occupied | 28,061 (63.7%) | $33,458 |
| Average | 44,029 (100.0%) | $52,397 |
Occupancy by Householder Income Bracket in College Station
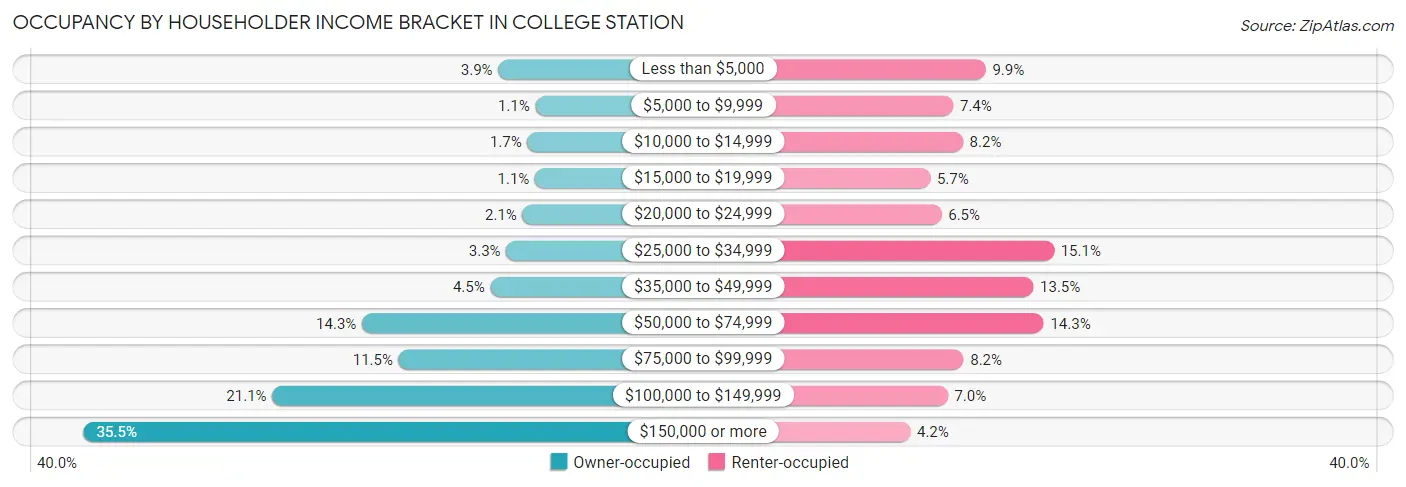
| Income Bracket | Owner-occupied | Renter-occupied |
| Less than $5,000 | 622 (3.9%) | 2,777 (9.9%) |
| $5,000 to $9,999 | 171 (1.1%) | 2,086 (7.4%) |
| $10,000 to $14,999 | 269 (1.7%) | 2,290 (8.2%) |
| $15,000 to $19,999 | 176 (1.1%) | 1,591 (5.7%) |
| $20,000 to $24,999 | 327 (2.1%) | 1,831 (6.5%) |
| $25,000 to $34,999 | 525 (3.3%) | 4,238 (15.1%) |
| $35,000 to $49,999 | 719 (4.5%) | 3,798 (13.5%) |
| $50,000 to $74,999 | 2,281 (14.3%) | 4,017 (14.3%) |
| $75,000 to $99,999 | 1,835 (11.5%) | 2,305 (8.2%) |
| $100,000 to $149,999 | 3,372 (21.1%) | 1,963 (7.0%) |
| $150,000 or more | 5,671 (35.5%) | 1,165 (4.2%) |
| Total | 15,968 (100.0%) | 28,061 (100.0%) |
Monthly Housing Cost Tiers in College Station
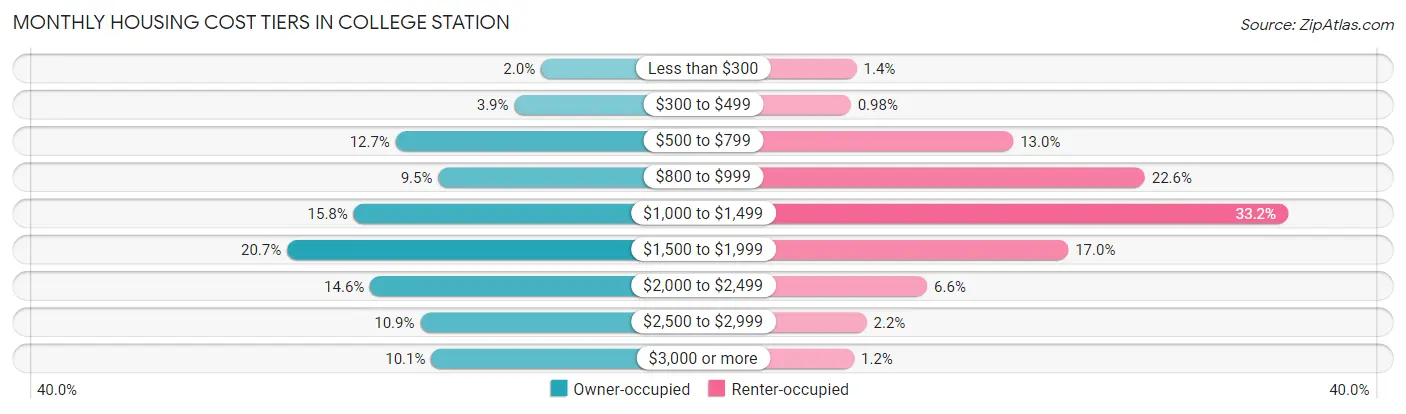
| Monthly Cost | Owner-occupied | Renter-occupied |
| Less than $300 | 315 (2.0%) | 395 (1.4%) |
| $300 to $499 | 628 (3.9%) | 276 (1.0%) |
| $500 to $799 | 2,023 (12.7%) | 3,634 (13.0%) |
| $800 to $999 | 1,522 (9.5%) | 6,354 (22.6%) |
| $1,000 to $1,499 | 2,518 (15.8%) | 9,308 (33.2%) |
| $1,500 to $1,999 | 3,300 (20.7%) | 4,769 (17.0%) |
| $2,000 to $2,499 | 2,324 (14.5%) | 1,854 (6.6%) |
| $2,500 to $2,999 | 1,734 (10.9%) | 603 (2.1%) |
| $3,000 or more | 1,604 (10.1%) | 346 (1.2%) |
| Total | 15,968 (100.0%) | 28,061 (100.0%) |
Physical Housing Characteristics in College Station
Housing Structures in College Station
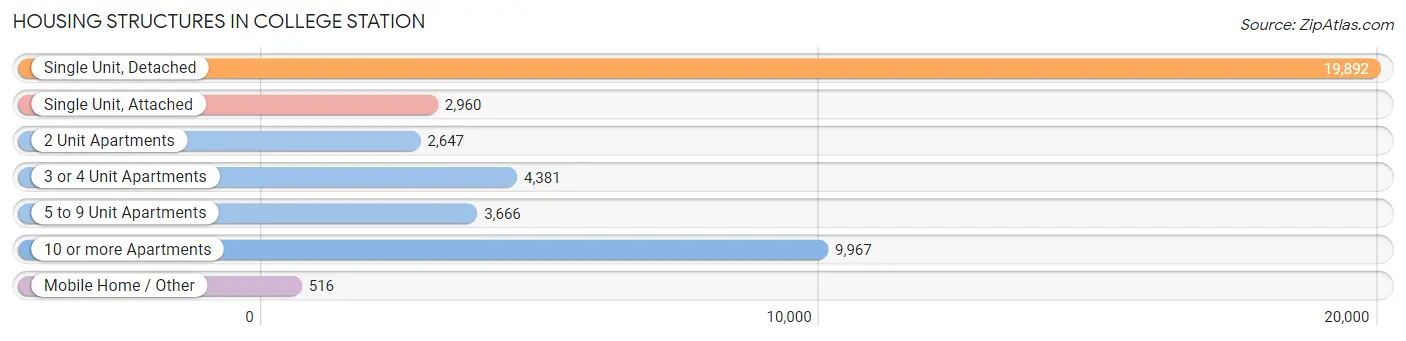
| Structure Type | # Housing Units | % Housing Units |
| Single Unit, Detached | 19,892 | 45.2% |
| Single Unit, Attached | 2,960 | 6.7% |
| 2 Unit Apartments | 2,647 | 6.0% |
| 3 or 4 Unit Apartments | 4,381 | 10.0% |
| 5 to 9 Unit Apartments | 3,666 | 8.3% |
| 10 or more Apartments | 9,967 | 22.6% |
| Mobile Home / Other | 516 | 1.2% |
| Total | 44,029 | 100.0% |
Housing Structures by Occupancy in College Station
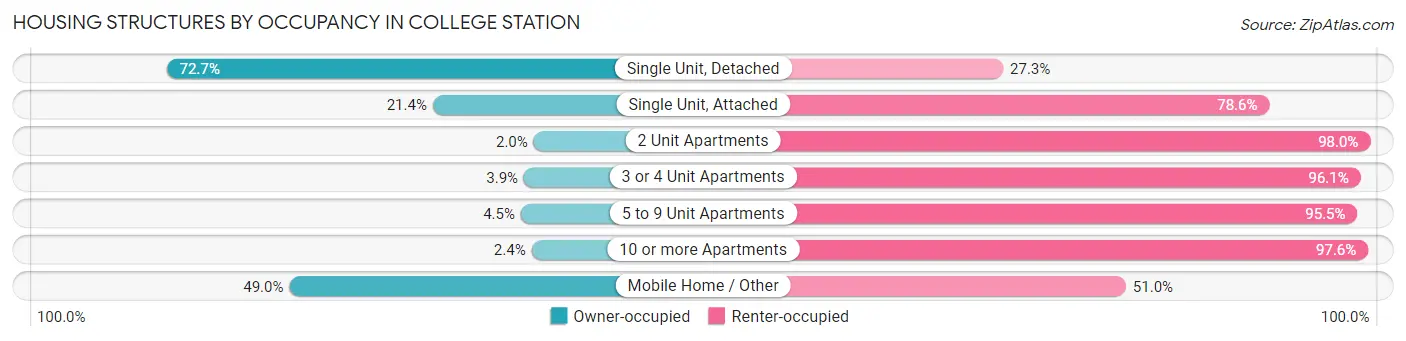
| Structure Type | Owner-occupied | Renter-occupied |
| Single Unit, Detached | 14,456 (72.7%) | 5,436 (27.3%) |
| Single Unit, Attached | 634 (21.4%) | 2,326 (78.6%) |
| 2 Unit Apartments | 53 (2.0%) | 2,594 (98.0%) |
| 3 or 4 Unit Apartments | 169 (3.9%) | 4,212 (96.1%) |
| 5 to 9 Unit Apartments | 164 (4.5%) | 3,502 (95.5%) |
| 10 or more Apartments | 239 (2.4%) | 9,728 (97.6%) |
| Mobile Home / Other | 253 (49.0%) | 263 (51.0%) |
| Total | 15,968 (36.3%) | 28,061 (63.7%) |
Housing Structures by Number of Rooms in College Station
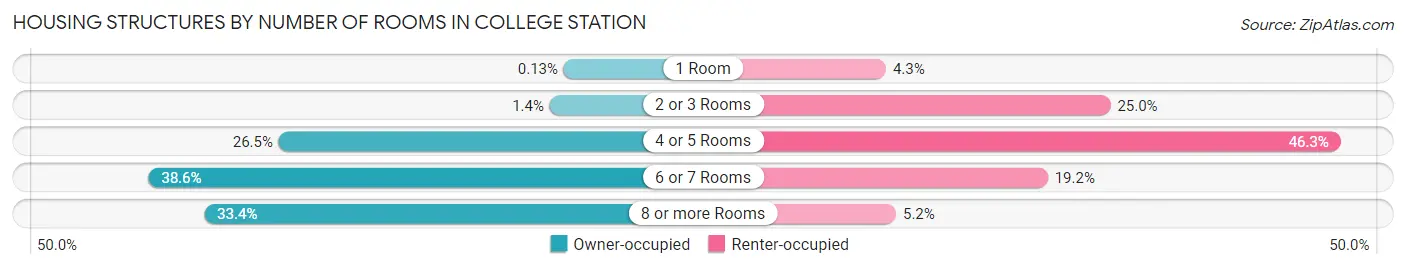
| Number of Rooms | Owner-occupied | Renter-occupied |
| 1 Room | 21 (0.1%) | 1,195 (4.3%) |
| 2 or 3 Rooms | 229 (1.4%) | 7,021 (25.0%) |
| 4 or 5 Rooms | 4,230 (26.5%) | 12,994 (46.3%) |
| 6 or 7 Rooms | 6,157 (38.6%) | 5,394 (19.2%) |
| 8 or more Rooms | 5,331 (33.4%) | 1,457 (5.2%) |
| Total | 15,968 (100.0%) | 28,061 (100.0%) |
Housing Structure by Heating Type in College Station
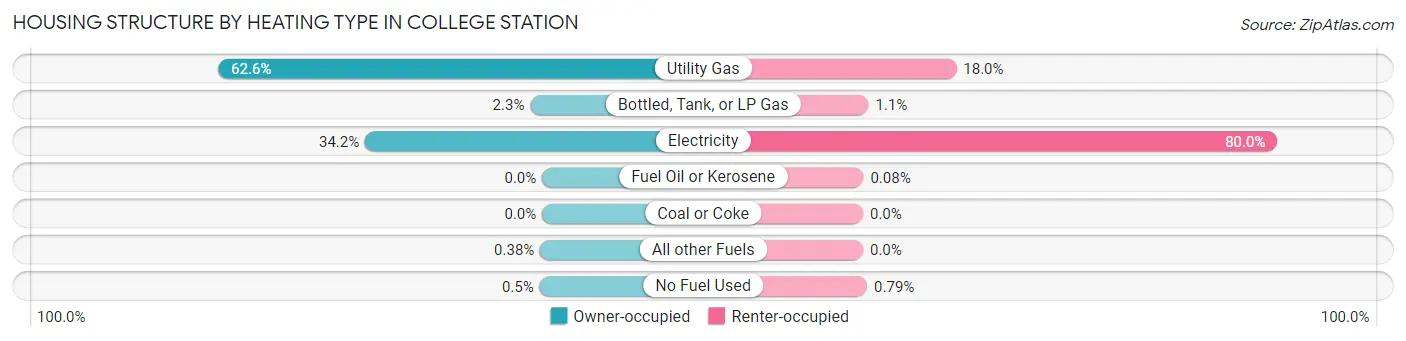
| Heating Type | Owner-occupied | Renter-occupied |
| Utility Gas | 9,997 (62.6%) | 5,059 (18.0%) |
| Bottled, Tank, or LP Gas | 366 (2.3%) | 301 (1.1%) |
| Electricity | 5,465 (34.2%) | 22,457 (80.0%) |
| Fuel Oil or Kerosene | 0 (0.0%) | 23 (0.1%) |
| Coal or Coke | 0 (0.0%) | 0 (0.0%) |
| All other Fuels | 60 (0.4%) | 0 (0.0%) |
| No Fuel Used | 80 (0.5%) | 221 (0.8%) |
| Total | 15,968 (100.0%) | 28,061 (100.0%) |
Household Vehicle Usage in College Station
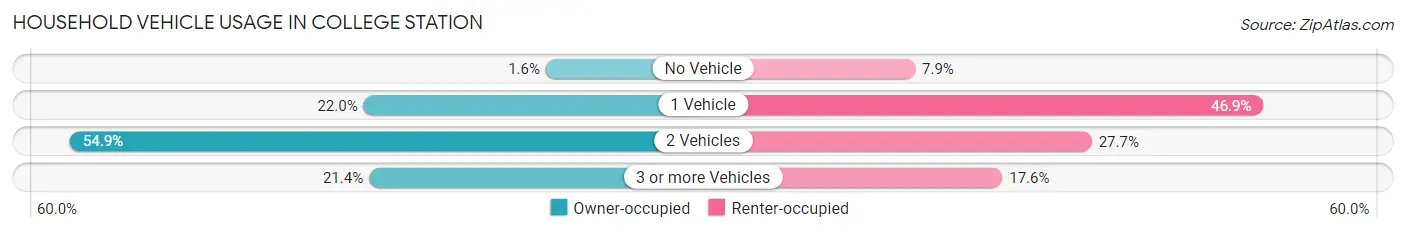
| Vehicles per Household | Owner-occupied | Renter-occupied |
| No Vehicle | 258 (1.6%) | 2,205 (7.9%) |
| 1 Vehicle | 3,520 (22.0%) | 13,150 (46.9%) |
| 2 Vehicles | 8,770 (54.9%) | 7,758 (27.7%) |
| 3 or more Vehicles | 3,420 (21.4%) | 4,948 (17.6%) |
| Total | 15,968 (100.0%) | 28,061 (100.0%) |
Real Estate & Mortgages in College Station
Real Estate and Mortgage Overview in College Station
| Characteristic | Without Mortgage | With Mortgage |
| Housing Units | 6,209 | 9,759 |
| Median Property Value | $292,500 | $315,200 |
| Median Household Income | $87,386 | $3,868 |
| Monthly Housing Costs | $839 | $1,553 |
| Real Estate Taxes | $4,949 | $117 |
Property Value by Mortgage Status in College Station
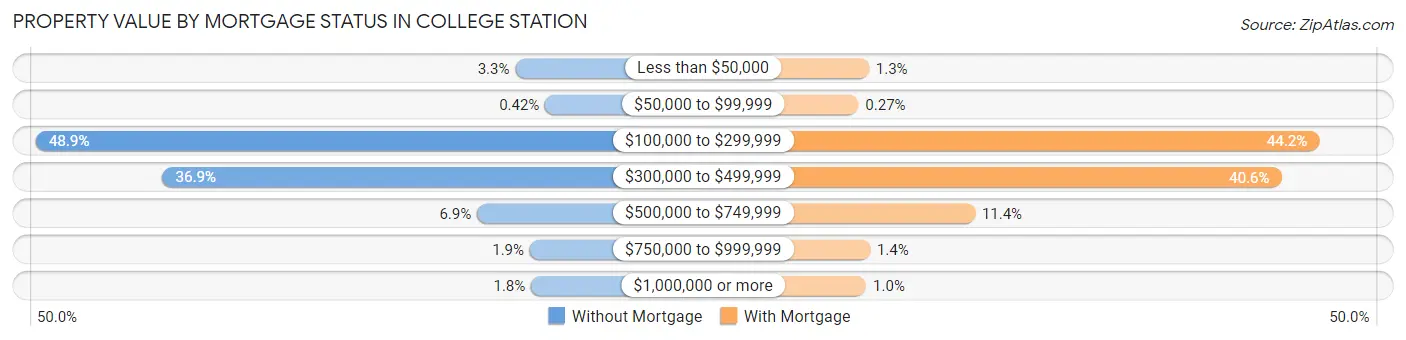
| Property Value | Without Mortgage | With Mortgage |
| Less than $50,000 | 203 (3.3%) | 124 (1.3%) |
| $50,000 to $99,999 | 26 (0.4%) | 26 (0.3%) |
| $100,000 to $299,999 | 3,037 (48.9%) | 4,309 (44.2%) |
| $300,000 to $499,999 | 2,288 (36.8%) | 3,957 (40.6%) |
| $500,000 to $749,999 | 429 (6.9%) | 1,110 (11.4%) |
| $750,000 to $999,999 | 117 (1.9%) | 134 (1.4%) |
| $1,000,000 or more | 109 (1.8%) | 99 (1.0%) |
| Total | 6,209 (100.0%) | 9,759 (100.0%) |
Household Income by Mortgage Status in College Station
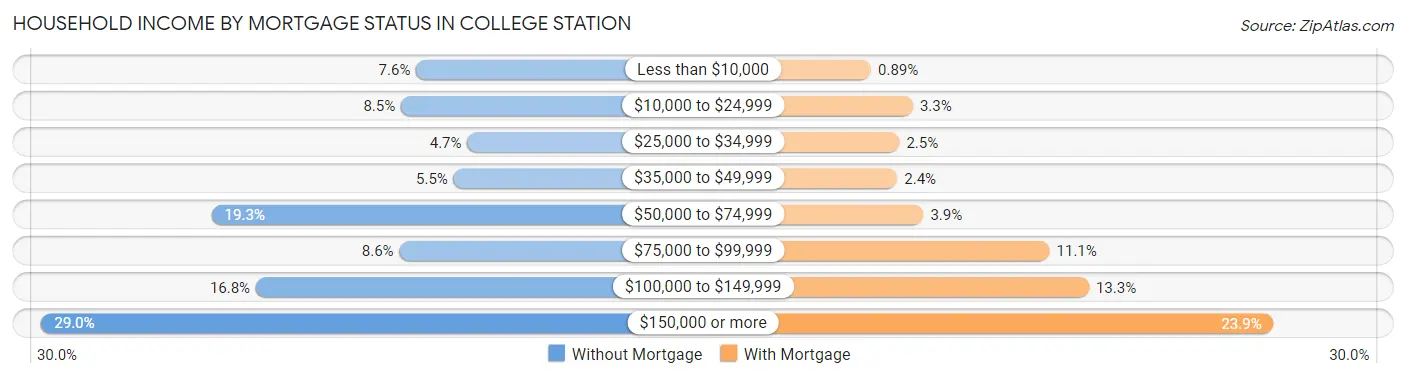
| Household Income | Without Mortgage | With Mortgage |
| Less than $10,000 | 473 (7.6%) | 87 (0.9%) |
| $10,000 to $24,999 | 527 (8.5%) | 320 (3.3%) |
| $25,000 to $34,999 | 292 (4.7%) | 245 (2.5%) |
| $35,000 to $49,999 | 340 (5.5%) | 233 (2.4%) |
| $50,000 to $74,999 | 1,199 (19.3%) | 379 (3.9%) |
| $75,000 to $99,999 | 533 (8.6%) | 1,082 (11.1%) |
| $100,000 to $149,999 | 1,042 (16.8%) | 1,302 (13.3%) |
| $150,000 or more | 1,803 (29.0%) | 2,330 (23.9%) |
| Total | 6,209 (100.0%) | 9,759 (100.0%) |
Property Value to Household Income Ratio in College Station
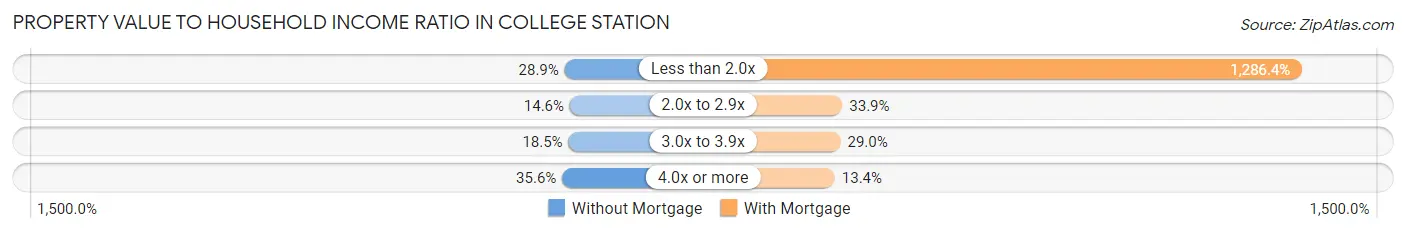
| Value-to-Income Ratio | Without Mortgage | With Mortgage |
| Less than 2.0x | 1,793 (28.9%) | 125,544 (1,286.4%) |
| 2.0x to 2.9x | 904 (14.6%) | 3,305 (33.9%) |
| 3.0x to 3.9x | 1,147 (18.5%) | 2,829 (29.0%) |
| 4.0x or more | 2,207 (35.5%) | 1,311 (13.4%) |
| Total | 6,209 (100.0%) | 9,759 (100.0%) |
Real Estate Taxes by Mortgage Status in College Station
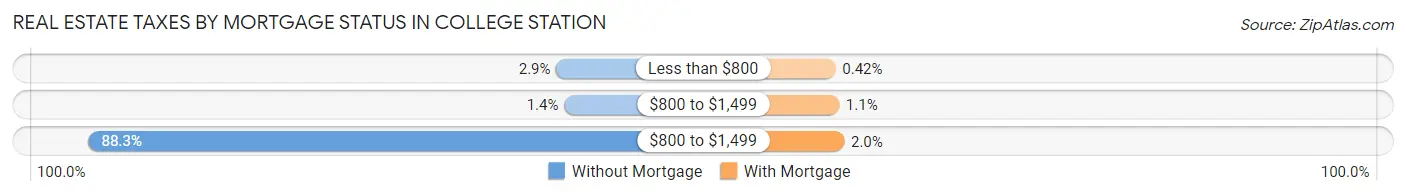
| Property Taxes | Without Mortgage | With Mortgage |
| Less than $800 | 178 (2.9%) | 41 (0.4%) |
| $800 to $1,499 | 89 (1.4%) | 104 (1.1%) |
| $800 to $1,499 | 5,484 (88.3%) | 196 (2.0%) |
| Total | 6,209 (100.0%) | 9,759 (100.0%) |
Health & Disability in College Station
Health Insurance Coverage by Age in College Station
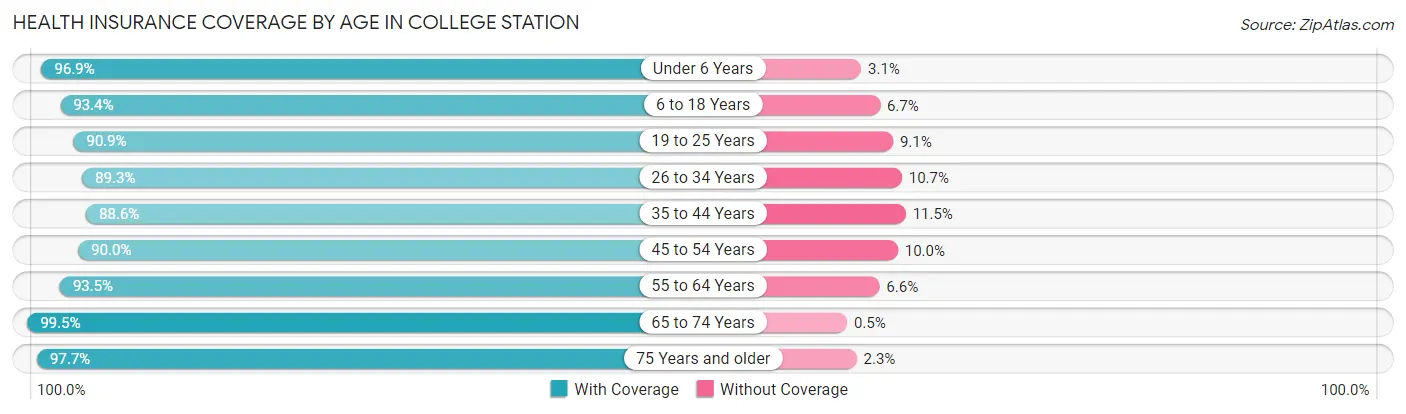
| Age Bracket | With Coverage | Without Coverage |
| Under 6 Years | 6,628 (96.9%) | 214 (3.1%) |
| 6 to 18 Years | 17,695 (93.3%) | 1,261 (6.7%) |
| 19 to 25 Years | 41,413 (90.9%) | 4,138 (9.1%) |
| 26 to 34 Years | 11,988 (89.3%) | 1,439 (10.7%) |
| 35 to 44 Years | 10,648 (88.5%) | 1,377 (11.5%) |
| 45 to 54 Years | 7,272 (90.0%) | 806 (10.0%) |
| 55 to 64 Years | 6,703 (93.4%) | 470 (6.6%) |
| 65 to 74 Years | 4,966 (99.5%) | 25 (0.5%) |
| 75 Years and older | 2,975 (97.7%) | 70 (2.3%) |
| Total | 110,288 (91.8%) | 9,800 (8.2%) |
Health Insurance Coverage by Citizenship Status in College Station
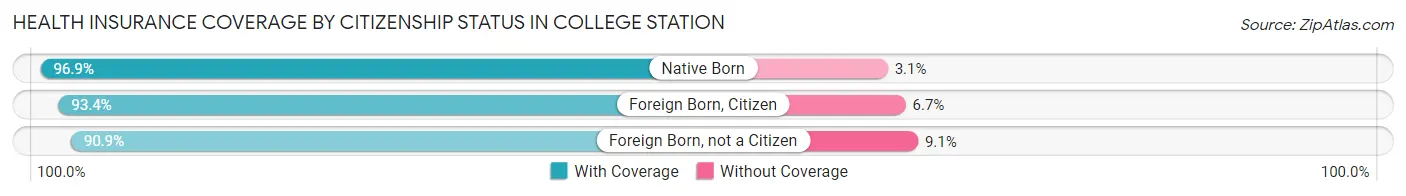
| Citizenship Status | With Coverage | Without Coverage |
| Native Born | 6,628 (96.9%) | 214 (3.1%) |
| Foreign Born, Citizen | 17,695 (93.3%) | 1,261 (6.7%) |
| Foreign Born, not a Citizen | 41,413 (90.9%) | 4,138 (9.1%) |
Health Insurance Coverage by Household Income in College Station
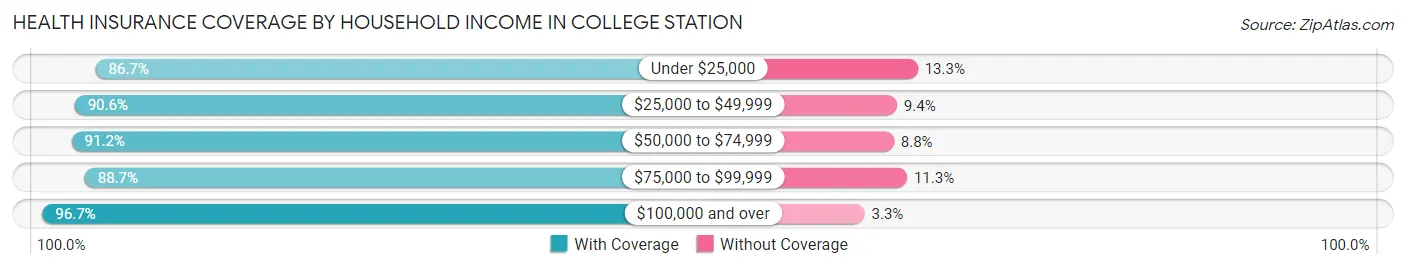
| Household Income | With Coverage | Without Coverage |
| Under $25,000 | 21,271 (86.7%) | 3,259 (13.3%) |
| $25,000 to $49,999 | 18,351 (90.6%) | 1,901 (9.4%) |
| $50,000 to $74,999 | 13,807 (91.2%) | 1,335 (8.8%) |
| $75,000 to $99,999 | 9,410 (88.7%) | 1,196 (11.3%) |
| $100,000 and over | 34,973 (96.7%) | 1,210 (3.3%) |
Public vs Private Health Insurance Coverage by Age in College Station
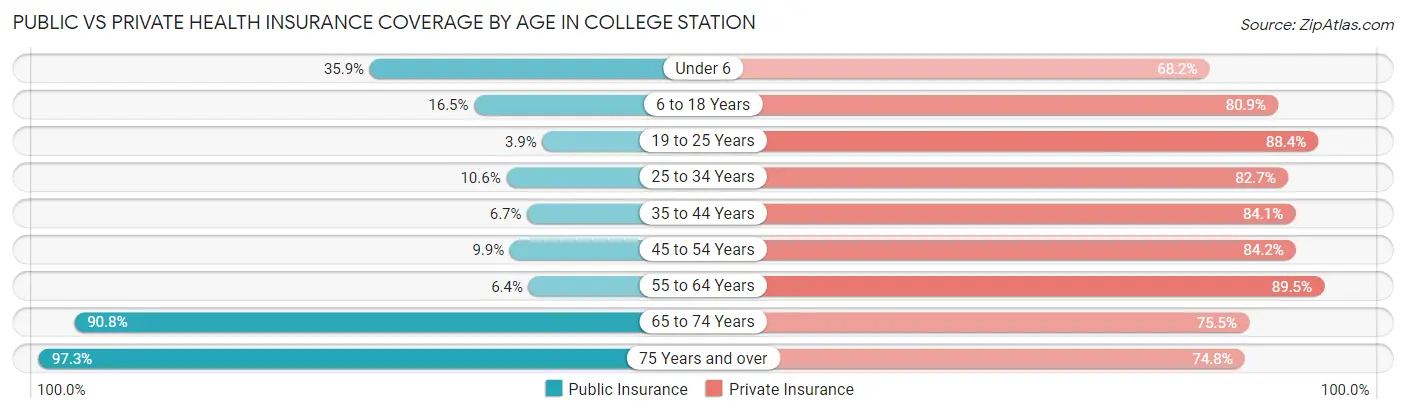
| Age Bracket | Public Insurance | Private Insurance |
| Under 6 | 2,456 (35.9%) | 4,666 (68.2%) |
| 6 to 18 Years | 3,132 (16.5%) | 15,340 (80.9%) |
| 19 to 25 Years | 1,754 (3.8%) | 40,272 (88.4%) |
| 25 to 34 Years | 1,416 (10.5%) | 11,107 (82.7%) |
| 35 to 44 Years | 803 (6.7%) | 10,115 (84.1%) |
| 45 to 54 Years | 799 (9.9%) | 6,805 (84.2%) |
| 55 to 64 Years | 460 (6.4%) | 6,418 (89.5%) |
| 65 to 74 Years | 4,531 (90.8%) | 3,770 (75.5%) |
| 75 Years and over | 2,964 (97.3%) | 2,276 (74.8%) |
| Total | 18,315 (15.2%) | 100,769 (83.9%) |
Disability Status by Sex by Age in College Station
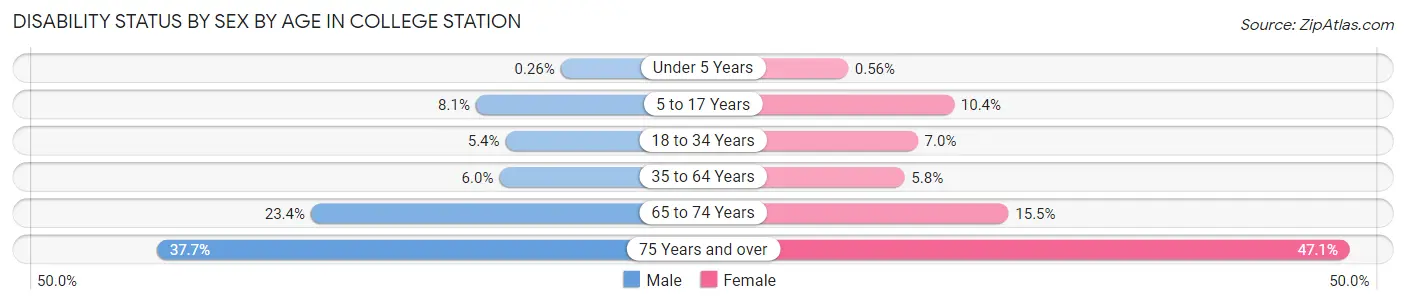
| Age Bracket | Male | Female |
| Under 5 Years | 7 (0.3%) | 16 (0.6%) |
| 5 to 17 Years | 603 (8.1%) | 727 (10.4%) |
| 18 to 34 Years | 1,846 (5.4%) | 2,148 (7.0%) |
| 35 to 64 Years | 811 (5.9%) | 793 (5.8%) |
| 65 to 74 Years | 533 (23.4%) | 420 (15.5%) |
| 75 Years and over | 503 (37.7%) | 807 (47.1%) |
Disability Class by Sex by Age in College Station
Disability Class: Hearing Difficulty
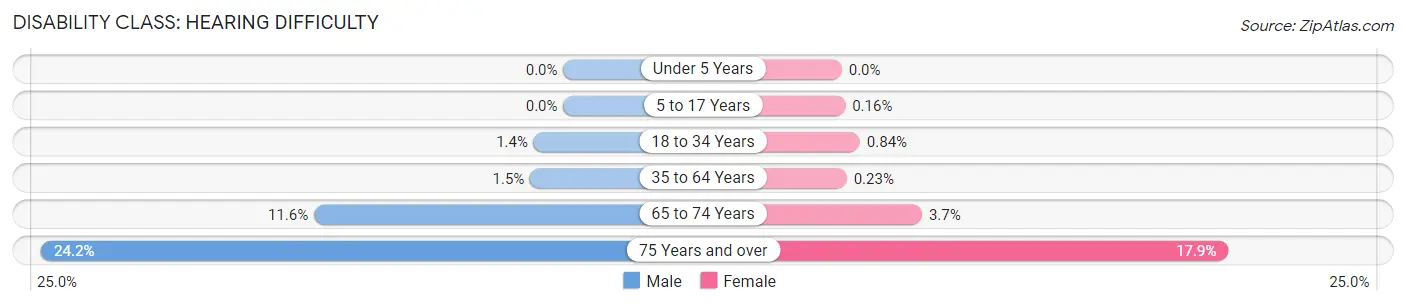
| Age Bracket | Male | Female |
| Under 5 Years | 0 (0.0%) | 0 (0.0%) |
| 5 to 17 Years | 0 (0.0%) | 11 (0.2%) |
| 18 to 34 Years | 469 (1.4%) | 256 (0.8%) |
| 35 to 64 Years | 210 (1.5%) | 32 (0.2%) |
| 65 to 74 Years | 263 (11.6%) | 101 (3.7%) |
| 75 Years and over | 323 (24.2%) | 307 (17.9%) |
Disability Class: Vision Difficulty
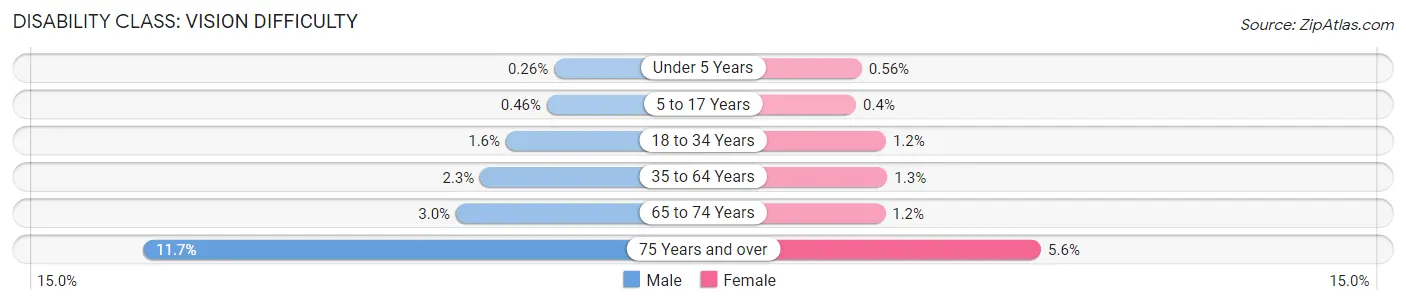
| Age Bracket | Male | Female |
| Under 5 Years | 7 (0.3%) | 16 (0.6%) |
| 5 to 17 Years | 34 (0.5%) | 28 (0.4%) |
| 18 to 34 Years | 549 (1.6%) | 374 (1.2%) |
| 35 to 64 Years | 316 (2.3%) | 173 (1.3%) |
| 65 to 74 Years | 68 (3.0%) | 33 (1.2%) |
| 75 Years and over | 156 (11.7%) | 95 (5.6%) |
Disability Class: Cognitive Difficulty
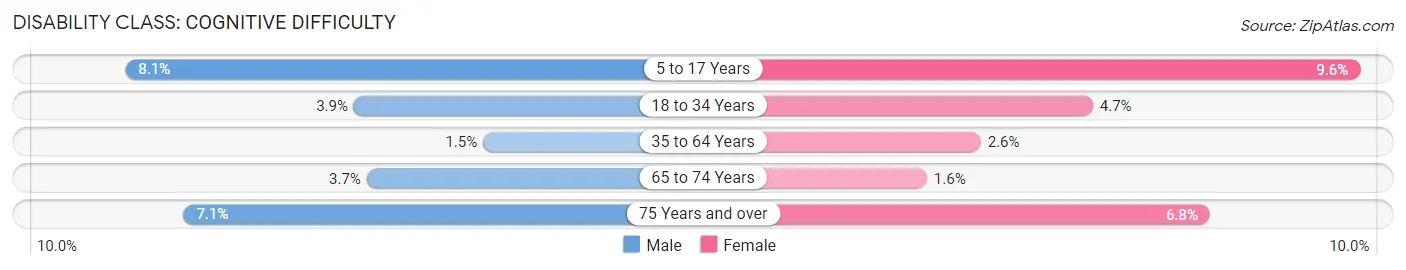
| Age Bracket | Male | Female |
| 5 to 17 Years | 603 (8.1%) | 673 (9.6%) |
| 18 to 34 Years | 1,336 (3.9%) | 1,422 (4.7%) |
| 35 to 64 Years | 203 (1.5%) | 352 (2.6%) |
| 65 to 74 Years | 83 (3.6%) | 43 (1.6%) |
| 75 Years and over | 94 (7.0%) | 117 (6.8%) |
Disability Class: Ambulatory Difficulty
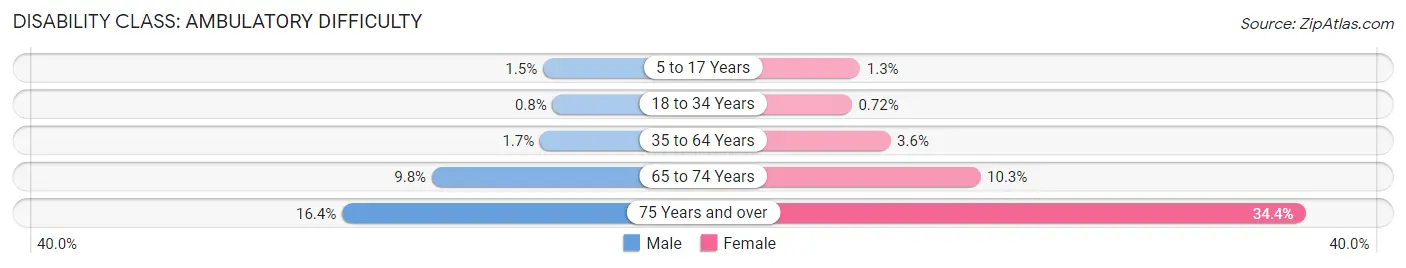
| Age Bracket | Male | Female |
| 5 to 17 Years | 112 (1.5%) | 94 (1.3%) |
| 18 to 34 Years | 276 (0.8%) | 219 (0.7%) |
| 35 to 64 Years | 235 (1.7%) | 490 (3.6%) |
| 65 to 74 Years | 222 (9.8%) | 279 (10.3%) |
| 75 Years and over | 219 (16.4%) | 589 (34.4%) |
Disability Class: Self-Care Difficulty
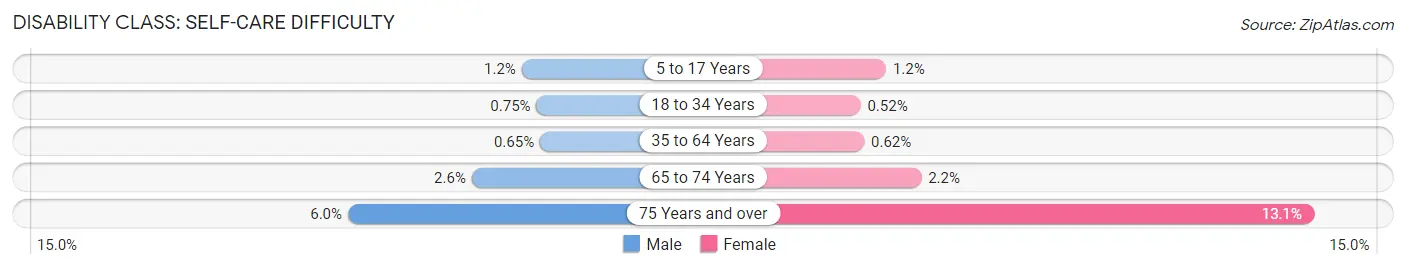
| Age Bracket | Male | Female |
| 5 to 17 Years | 86 (1.2%) | 86 (1.2%) |
| 18 to 34 Years | 257 (0.7%) | 160 (0.5%) |
| 35 to 64 Years | 89 (0.6%) | 85 (0.6%) |
| 65 to 74 Years | 58 (2.5%) | 60 (2.2%) |
| 75 Years and over | 80 (6.0%) | 225 (13.1%) |
Technology Access in College Station
Computing Device Access in College Station
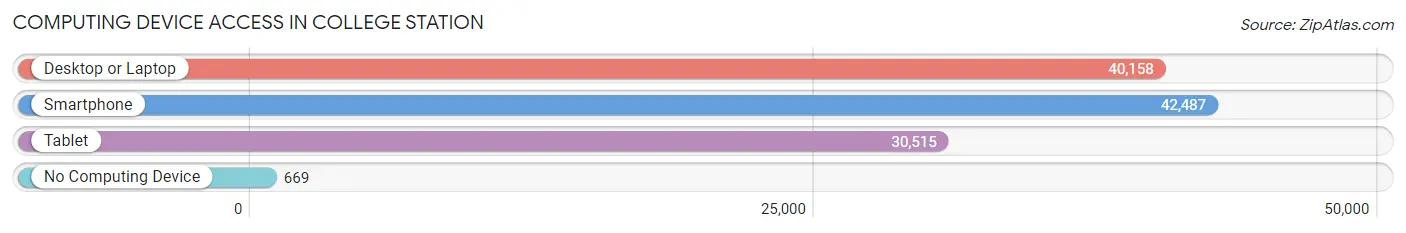
| Device Type | # Households | % Households |
| Desktop or Laptop | 40,158 | 91.2% |
| Smartphone | 42,487 | 96.5% |
| Tablet | 30,515 | 69.3% |
| No Computing Device | 669 | 1.5% |
| Total | 44,029 | 100.0% |
Internet Access in College Station
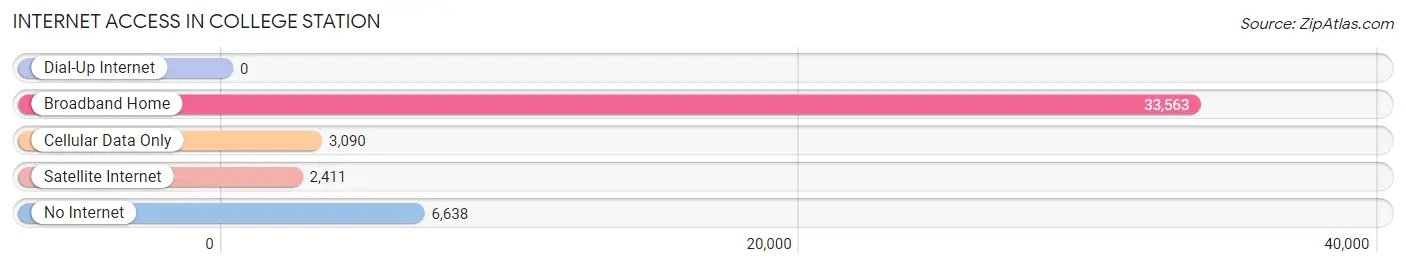
| Internet Type | # Households | % Households |
| Dial-Up Internet | 0 | 0.0% |
| Broadband Home | 33,563 | 76.2% |
| Cellular Data Only | 3,090 | 7.0% |
| Satellite Internet | 2,411 | 5.5% |
| No Internet | 6,638 | 15.1% |
| Total | 44,029 | 100.0% |
College Station Summary
History
College Station, Texas is a city located in Brazos County, Texas, United States. It is situated in the heart of the Brazos Valley, approximately 90 miles northwest of Houston and 87 miles northeast of Austin. The city is home to Texas A&M University, the flagship institution of the Texas A&M University System. The population of College Station was 93,857 at the 2010 census, making it the second largest city in the Brazos Valley, after Bryan.
The area around College Station was first settled in the 1840s by settlers from the nearby town of Navasota. The town of College Station was founded in 1860, when the Houston and Texas Central Railway passed through the area. The town was named for the railway station, which was located on the grounds of what is now Texas A&M University.
In the late 19th century, the town began to grow rapidly as the university expanded. By the early 20th century, College Station had become a major center for education and research. The city was officially incorporated in 1938, and the population had grown to over 5,000 by the 1950s.
Since then, College Station has continued to grow, and the population has now reached over 100,000. The city is home to a number of large employers, including Texas A&M University, the Bryan-College Station Regional Airport, and the Texas A&M Health Science Center.
Geography
College Station is located in the Brazos Valley, in the southeastern part of Texas. The city is situated at the intersection of Interstate Highway 45 and State Highway 6, approximately 90 miles northwest of Houston and 87 miles northeast of Austin.
The city has a total area of 44.9 square miles, of which 44.8 square miles is land and 0.1 square miles is water. The city is located at an elevation of approximately 300 feet above sea level.
The climate in College Station is classified as humid subtropical, with hot summers and mild winters. The average annual temperature is 68°F, and the average annual precipitation is 39.3 inches.
Economy
College Station is home to a number of large employers, including Texas A&M University, the Bryan-College Station Regional Airport, and the Texas A&M Health Science Center. The city is also home to a number of smaller businesses, including retail stores, restaurants, and professional services.
The city’s economy is largely driven by the presence of Texas A&M University, which is the largest employer in the city. The university employs over 20,000 people, and its annual economic impact on the city is estimated to be over $3 billion.
The city is also home to a number of other large employers, including the Bryan-College Station Regional Airport, which employs over 1,000 people, and the Texas A&M Health Science Center, which employs over 2,000 people.
Demographics
As of the 2010 census, the population of College Station was 93,857. The racial makeup of the city was 73.2% White, 11.3% African American, 0.7% Native American, 6.2% Asian, 0.1% Pacific Islander, 5.2% from other races, and 3.3% from two or more races. Hispanic or Latino of any race were 17.3% of the population.
The median income for a household in the city was $45,945, and the median income for a family was $60,945. The per capita income for the city was $23,837. About 11.2% of families and 17.2% of the population were below the poverty line, including 22.2% of those under age 18 and 8.2% of those age 65 or over.
Common Questions
What is Per Capita Income in College Station?
Per Capita income in College Station is $31,381.
What is the Median Family Income in College Station?
Median Family Income in College Station is $93,505.
What is the Median Household income in College Station?
Median Household Income in College Station is $52,397.
What is Income or Wage Gap in College Station?
Income or Wage Gap in College Station is 25.8%.
Women in College Station earn 74.2 cents for every dollar earned by a man.
What is Family Income Deficit in College Station?
Family Income Deficit in College Station is $12,294.
Families that are below poverty line in College Station earn $12,294 less on average than the poverty threshold level.
What is Inequality or Gini Index in College Station?
Inequality or Gini Index in College Station is 0.54.
What is the Total Population of College Station?
Total Population of College Station is 120,451.
What is the Total Male Population of College Station?
Total Male Population of College Station is 61,867.
What is the Total Female Population of College Station?
Total Female Population of College Station is 58,584.
What is the Ratio of Males per 100 Females in College Station?
There are 105.60 Males per 100 Females in College Station.
What is the Ratio of Females per 100 Males in College Station?
There are 94.69 Females per 100 Males in College Station.
What is the Median Population Age in College Station?
Median Population Age in College Station is 22.9 Years.
What is the Average Family Size in College Station
Average Family Size in College Station is 3.0 People.
What is the Average Household Size in College Station
Average Household Size in College Station is 2.4 People.
How Large is the Labor Force in College Station?
There are 63,369 People in the Labor Forcein in College Station.
What is the Percentage of People in the Labor Force in College Station?
61.6% of People are in the Labor Force in College Station.
What is the Unemployment Rate in College Station?
Unemployment Rate in College Station is 4.7%.