Lynnwood, WA Map & Demographics
Lynnwood Map
Lynnwood Overview
$37,758
PER CAPITA INCOME
$93,216
AVG FAMILY INCOME
$72,241
AVG HOUSEHOLD INCOME
27.8%
WAGE / INCOME GAP [ % ]
72.2¢/ $1
WAGE / INCOME GAP [ $ ]
$11,301
FAMILY INCOME DEFICIT
0.44
INEQUALITY / GINI INDEX
39,867
TOTAL POPULATION
19,523
MALE POPULATION
20,344
FEMALE POPULATION
95.96
MALES / 100 FEMALES
104.21
FEMALES / 100 MALES
39.3
MEDIAN AGE
3.1
AVG FAMILY SIZE
2.5
AVG HOUSEHOLD SIZE
21,068
LABOR FORCE [ PEOPLE ]
64.1%
PERCENT IN LABOR FORCE
4.1%
UNEMPLOYMENT RATE
Lynnwood Area Codes
Income in Lynnwood
Income Overview in Lynnwood
Per Capita Income in Lynnwood is $37,758, while median incomes of families and households are $93,216 and $72,241 respectively.
| Characteristic | Number | Measure |
| Per Capita Income | 39,867 | $37,758 |
| Median Family Income | 9,471 | $93,216 |
| Mean Family Income | 9,471 | $109,512 |
| Median Household Income | 15,817 | $72,241 |
| Mean Household Income | 15,817 | $92,784 |
| Income Deficit | 9,471 | $11,301 |
| Wage / Income Gap (%) | 39,867 | 27.80% |
| Wage / Income Gap ($) | 39,867 | 72.20¢ per $1 |
| Gini / Inequality Index | 39,867 | 0.44 |
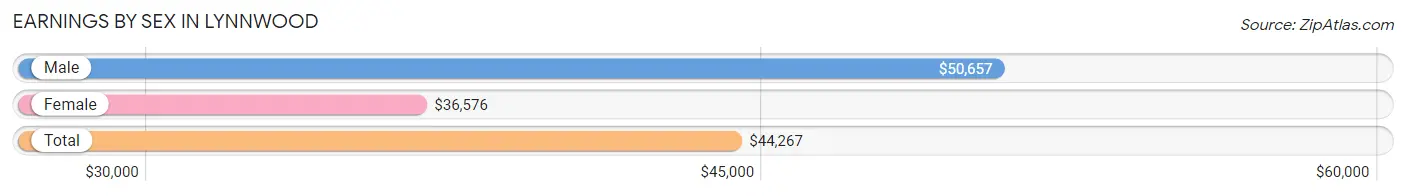
Earnings by Sex in Lynnwood
Average Earnings in Lynnwood are $44,267, $50,657 for men and $36,576 for women, a difference of 27.8%.
| Sex | Number | Average Earnings |
| Male | 12,101 (54.9%) | $50,657 |
| Female | 9,927 (45.1%) | $36,576 |
| Total | 22,028 (100.0%) | $44,267 |
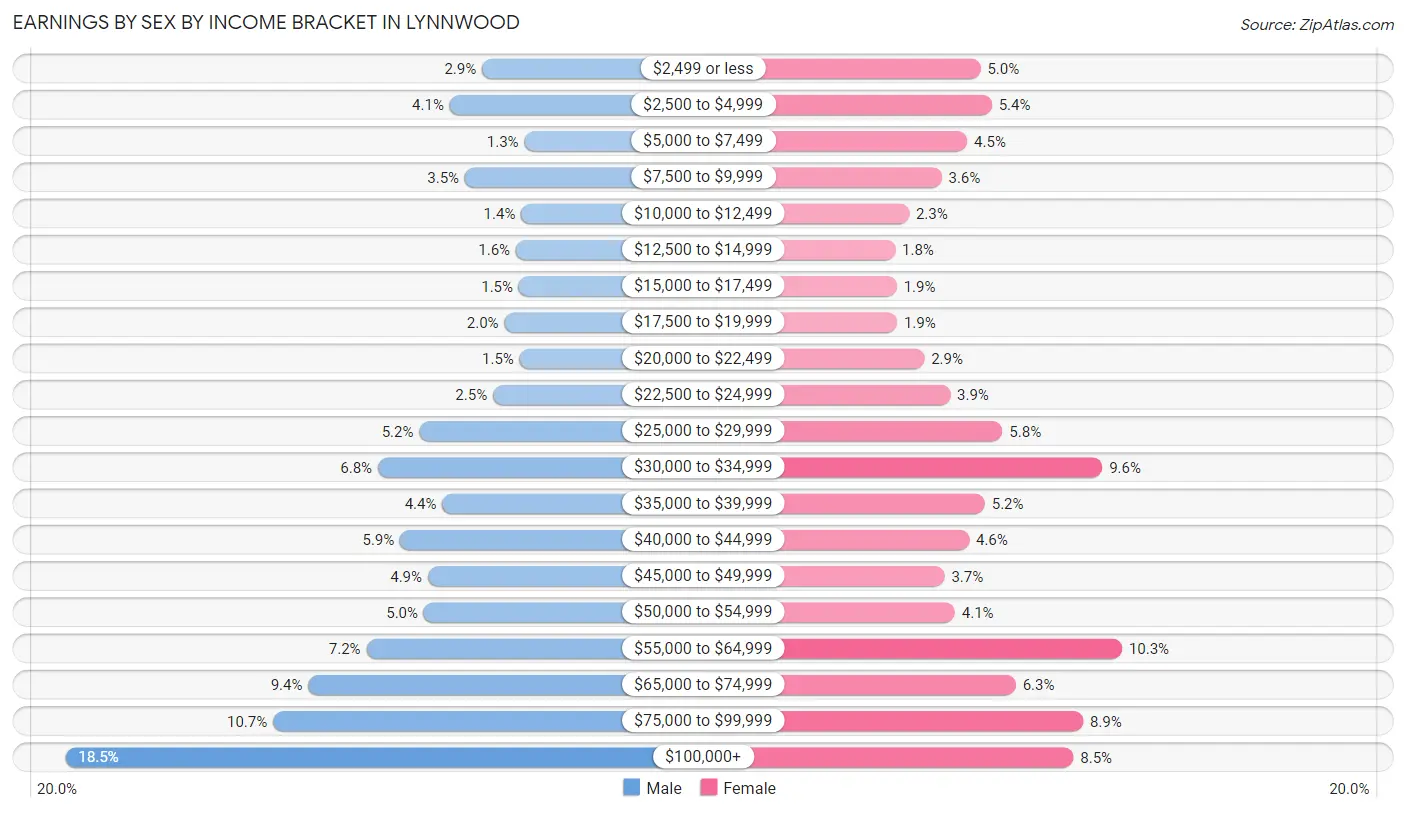
Earnings by Sex by Income Bracket in Lynnwood
The most common earnings brackets in Lynnwood are $100,000+ for men (2,235 | 18.5%) and $55,000 to $64,999 for women (1,023 | 10.3%).
| Income | Male | Female |
| $2,499 or less | 346 (2.9%) | 497 (5.0%) |
| $2,500 to $4,999 | 493 (4.1%) | 539 (5.4%) |
| $5,000 to $7,499 | 154 (1.3%) | 448 (4.5%) |
| $7,500 to $9,999 | 423 (3.5%) | 352 (3.5%) |
| $10,000 to $12,499 | 168 (1.4%) | 231 (2.3%) |
| $12,500 to $14,999 | 192 (1.6%) | 180 (1.8%) |
| $15,000 to $17,499 | 179 (1.5%) | 186 (1.9%) |
| $17,500 to $19,999 | 245 (2.0%) | 187 (1.9%) |
| $20,000 to $22,499 | 176 (1.5%) | 288 (2.9%) |
| $22,500 to $24,999 | 297 (2.5%) | 384 (3.9%) |
| $25,000 to $29,999 | 631 (5.2%) | 579 (5.8%) |
| $30,000 to $34,999 | 818 (6.8%) | 950 (9.6%) |
| $35,000 to $39,999 | 526 (4.3%) | 513 (5.2%) |
| $40,000 to $44,999 | 718 (5.9%) | 455 (4.6%) |
| $45,000 to $49,999 | 592 (4.9%) | 363 (3.7%) |
| $50,000 to $54,999 | 610 (5.0%) | 402 (4.1%) |
| $55,000 to $64,999 | 870 (7.2%) | 1,023 (10.3%) |
| $65,000 to $74,999 | 1,134 (9.4%) | 628 (6.3%) |
| $75,000 to $99,999 | 1,294 (10.7%) | 879 (8.8%) |
| $100,000+ | 2,235 (18.5%) | 843 (8.5%) |
| Total | 12,101 (100.0%) | 9,927 (100.0%) |
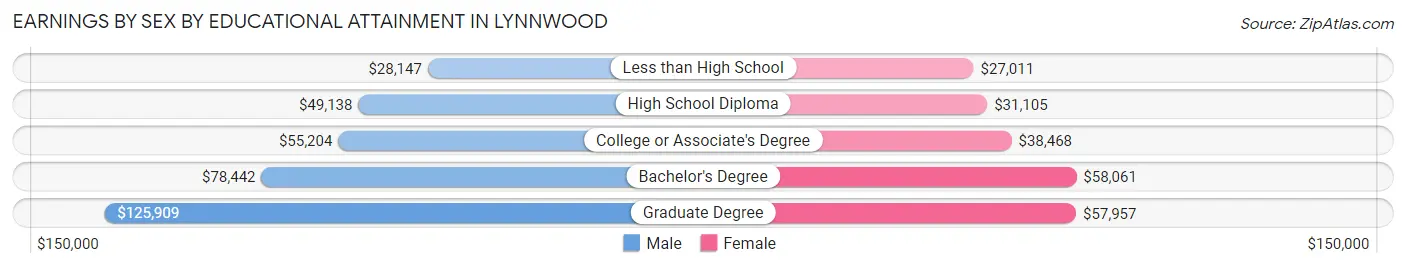
Earnings by Sex by Educational Attainment in Lynnwood
Average earnings in Lynnwood are $55,250 for men and $42,088 for women, a difference of 23.8%. Men with an educational attainment of graduate degree enjoy the highest average annual earnings of $125,909, while those with less than high school education earn the least with $28,147. Women with an educational attainment of bachelor's degree earn the most with the average annual earnings of $58,061, while those with less than high school education have the smallest earnings of $27,011.
| Educational Attainment | Male Income | Female Income |
| Less than High School | $28,147 | $27,011 |
| High School Diploma | $49,138 | $31,105 |
| College or Associate's Degree | $55,204 | $38,468 |
| Bachelor's Degree | $78,442 | $58,061 |
| Graduate Degree | $125,909 | $57,957 |
| Total | $55,250 | $42,088 |
Family Income in Lynnwood
Family Income Brackets in Lynnwood
According to the Lynnwood family income data, there are 1,979 families falling into the $100,000 to $149,999 income range, which is the most common income bracket and makes up 20.9% of all families. Conversely, the $10,000 to $14,999 income bracket is the least frequent group with only 66 families (0.7%) belonging to this category.
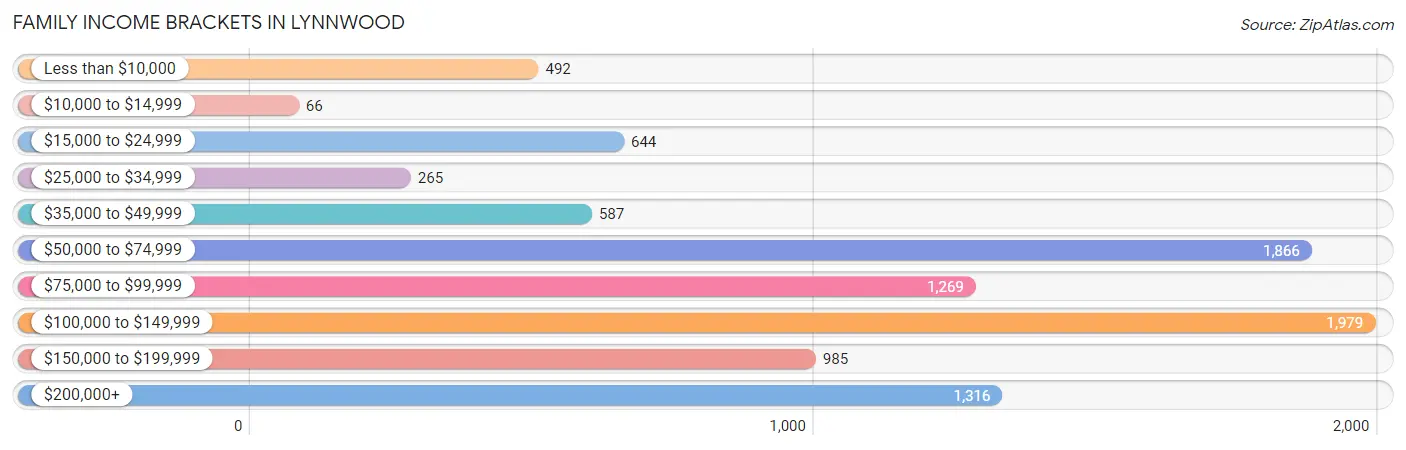
| Income Bracket | # Families | % Families |
| Less than $10,000 | 492 | 5.2% |
| $10,000 to $14,999 | 66 | 0.7% |
| $15,000 to $24,999 | 644 | 6.8% |
| $25,000 to $34,999 | 265 | 2.8% |
| $35,000 to $49,999 | 587 | 6.2% |
| $50,000 to $74,999 | 1,866 | 19.7% |
| $75,000 to $99,999 | 1,269 | 13.4% |
| $100,000 to $149,999 | 1,979 | 20.9% |
| $150,000 to $199,999 | 985 | 10.4% |
| $200,000+ | 1,316 | 13.9% |
Family Income by Famaliy Size in Lynnwood
6-person families (220 | 2.3%) account for the highest median family income in Lynnwood with $149,323 per family, while 2-person families (4,518 | 47.7%) have the highest median income of $36,100 per family member.
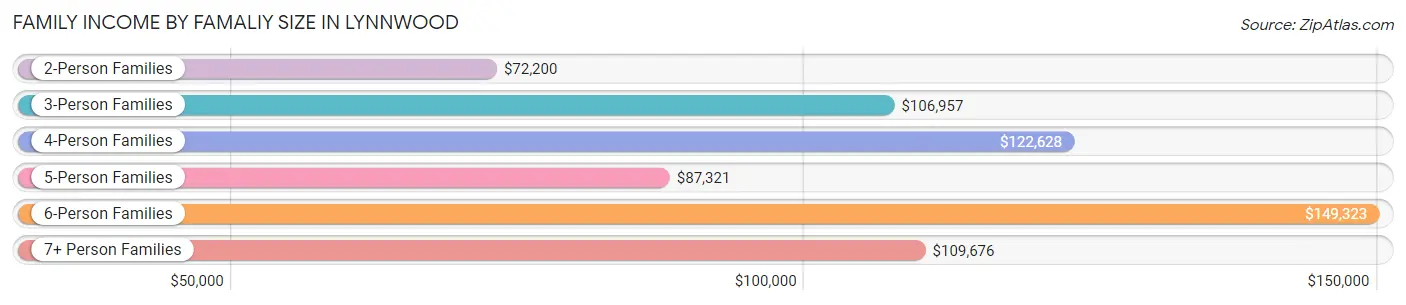
| Income Bracket | # Families | Median Income |
| 2-Person Families | 4,518 (47.7%) | $72,200 |
| 3-Person Families | 1,955 (20.6%) | $106,957 |
| 4-Person Families | 1,710 (18.1%) | $122,628 |
| 5-Person Families | 813 (8.6%) | $87,321 |
| 6-Person Families | 220 (2.3%) | $149,323 |
| 7+ Person Families | 255 (2.7%) | $109,676 |
| Total | 9,471 (100.0%) | $93,216 |
Family Income by Number of Earners in Lynnwood
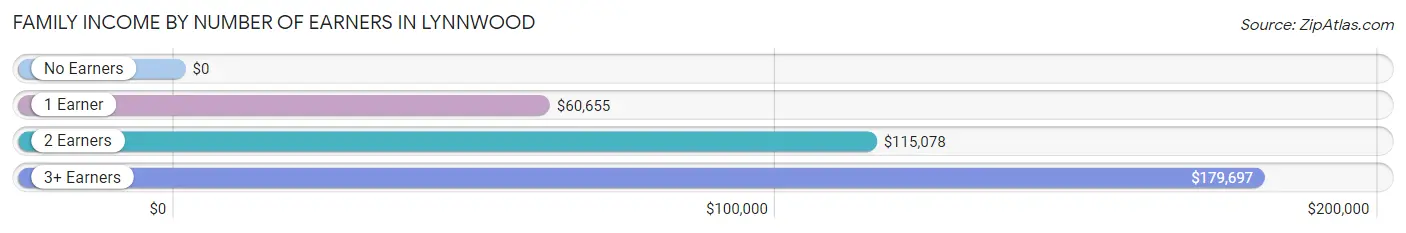
| Number of Earners | # Families | Median Income |
| No Earners | 1,293 (13.7%) | $0 |
| 1 Earner | 3,005 (31.7%) | $60,655 |
| 2 Earners | 3,945 (41.6%) | $115,078 |
| 3+ Earners | 1,228 (13.0%) | $179,697 |
| Total | 9,471 (100.0%) | $93,216 |
Household Income in Lynnwood
Household Income Brackets in Lynnwood
With 2,895 households falling in the category, the $100,000 to $149,999 income range is the most frequent in Lynnwood, accounting for 18.3% of all households. In contrast, only 554 households (3.5%) fall into the $10,000 to $14,999 income bracket, making it the least populous group.
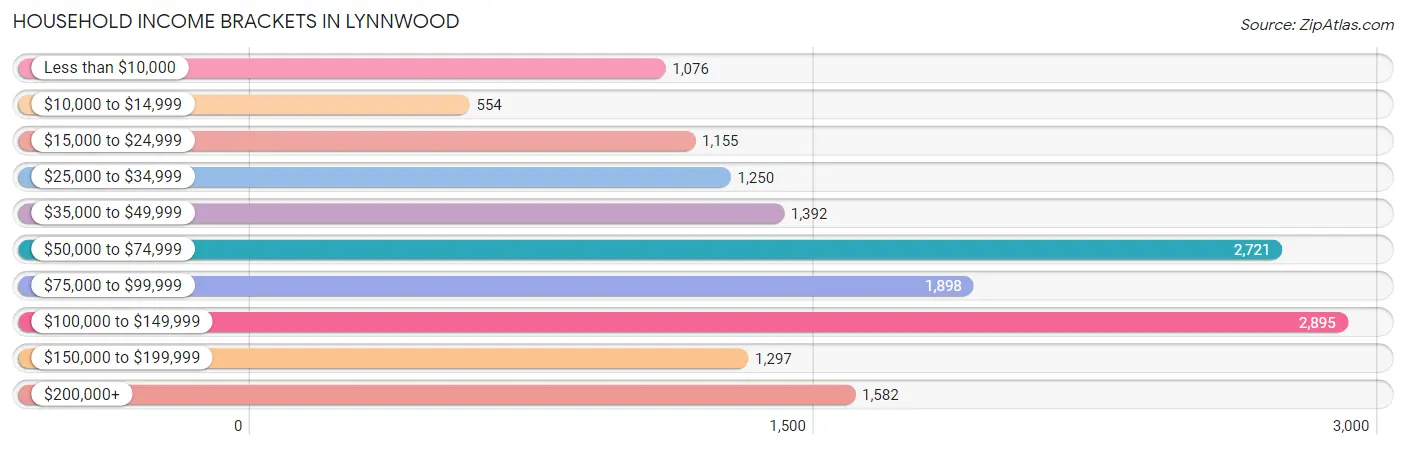
| Income Bracket | # Households | % Households |
| Less than $10,000 | 1,076 | 6.8% |
| $10,000 to $14,999 | 554 | 3.5% |
| $15,000 to $24,999 | 1,155 | 7.3% |
| $25,000 to $34,999 | 1,250 | 7.9% |
| $35,000 to $49,999 | 1,392 | 8.8% |
| $50,000 to $74,999 | 2,721 | 17.2% |
| $75,000 to $99,999 | 1,898 | 12.0% |
| $100,000 to $149,999 | 2,895 | 18.3% |
| $150,000 to $199,999 | 1,297 | 8.2% |
| $200,000+ | 1,582 | 10.0% |
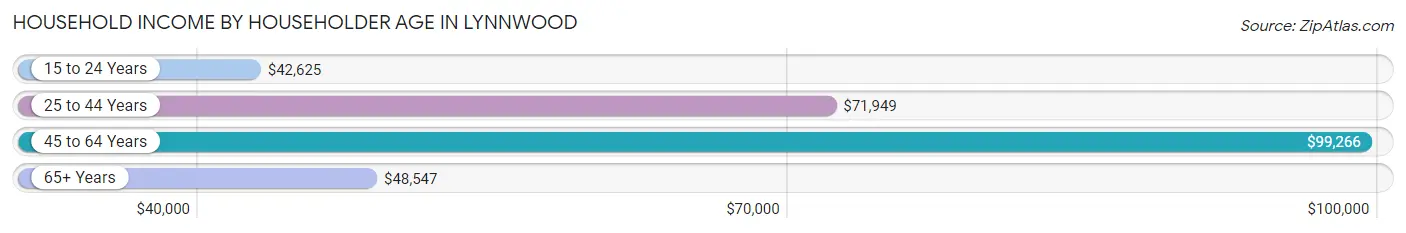
Household Income by Householder Age in Lynnwood
The median household income in Lynnwood is $72,241, with the highest median household income of $99,266 found in the 45 to 64 years age bracket for the primary householder. A total of 5,772 households (36.5%) fall into this category. Meanwhile, the 15 to 24 years age bracket for the primary householder has the lowest median household income of $42,625, with 524 households (3.3%) in this group.
| Income Bracket | # Households | Median Income |
| 15 to 24 Years | 524 (3.3%) | $42,625 |
| 25 to 44 Years | 5,467 (34.6%) | $71,949 |
| 45 to 64 Years | 5,772 (36.5%) | $99,266 |
| 65+ Years | 4,054 (25.6%) | $48,547 |
| Total | 15,817 (100.0%) | $72,241 |
Poverty in Lynnwood
Income Below Poverty by Sex and Age in Lynnwood
With 11.5% poverty level for males and 18.1% for females among the residents of Lynnwood, 6 to 11 year old males and 15 year old females are the most vulnerable to poverty, with 212 males (22.0%) and 93 females (42.3%) in their respective age groups living below the poverty level.
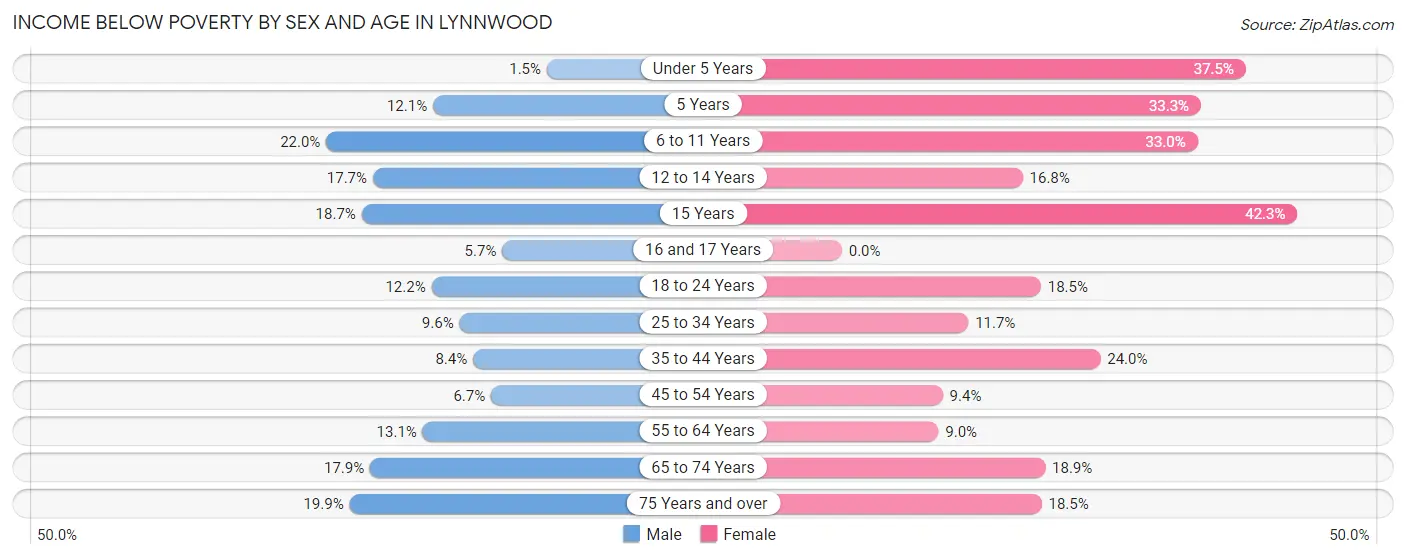
| Age Bracket | Male | Female |
| Under 5 Years | 16 (1.5%) | 520 (37.5%) |
| 5 Years | 42 (12.1%) | 46 (33.3%) |
| 6 to 11 Years | 212 (22.0%) | 426 (33.0%) |
| 12 to 14 Years | 131 (17.7%) | 95 (16.8%) |
| 15 Years | 44 (18.7%) | 93 (42.3%) |
| 16 and 17 Years | 20 (5.7%) | 0 (0.0%) |
| 18 to 24 Years | 195 (12.2%) | 230 (18.5%) |
| 25 to 34 Years | 308 (9.6%) | 359 (11.7%) |
| 35 to 44 Years | 251 (8.4%) | 658 (24.0%) |
| 45 to 54 Years | 177 (6.7%) | 234 (9.4%) |
| 55 to 64 Years | 333 (13.1%) | 228 (9.0%) |
| 65 to 74 Years | 271 (17.9%) | 411 (18.9%) |
| 75 Years and over | 217 (19.9%) | 332 (18.5%) |
| Total | 2,217 (11.5%) | 3,632 (18.1%) |
Income Above Poverty by Sex and Age in Lynnwood
According to the poverty statistics in Lynnwood, males aged under 5 years and females aged 16 and 17 years are the age groups that are most secure financially, with 98.5% of males and 100.0% of females in these age groups living above the poverty line.
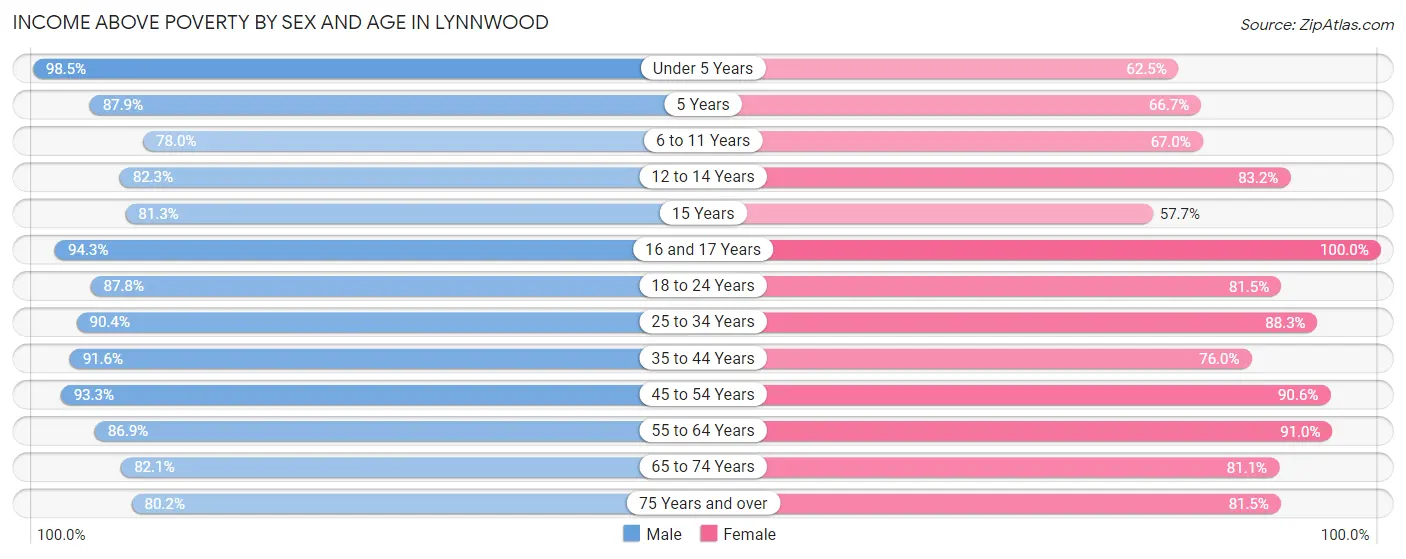
| Age Bracket | Male | Female |
| Under 5 Years | 1,031 (98.5%) | 867 (62.5%) |
| 5 Years | 305 (87.9%) | 92 (66.7%) |
| 6 to 11 Years | 751 (78.0%) | 864 (67.0%) |
| 12 to 14 Years | 610 (82.3%) | 471 (83.2%) |
| 15 Years | 191 (81.3%) | 127 (57.7%) |
| 16 and 17 Years | 333 (94.3%) | 386 (100.0%) |
| 18 to 24 Years | 1,398 (87.8%) | 1,015 (81.5%) |
| 25 to 34 Years | 2,888 (90.4%) | 2,701 (88.3%) |
| 35 to 44 Years | 2,744 (91.6%) | 2,085 (76.0%) |
| 45 to 54 Years | 2,461 (93.3%) | 2,267 (90.6%) |
| 55 to 64 Years | 2,217 (86.9%) | 2,316 (91.0%) |
| 65 to 74 Years | 1,240 (82.1%) | 1,767 (81.1%) |
| 75 Years and over | 876 (80.1%) | 1,459 (81.5%) |
| Total | 17,045 (88.5%) | 16,417 (81.9%) |
Income Below Poverty Among Married-Couple Families in Lynnwood
The poverty statistics for married-couple families in Lynnwood show that 8.3% or 541 of the total 6,561 families live below the poverty line. Families with 3 or 4 children have the highest poverty rate of 29.1%, comprising of 161 families. On the other hand, families with no children have the lowest poverty rate of 5.7%, which includes 208 families.
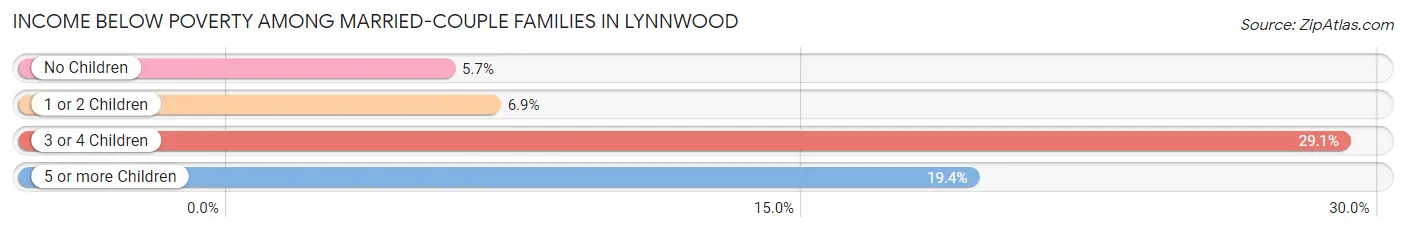
| Children | Above Poverty | Below Poverty |
| No Children | 3,460 (94.3%) | 208 (5.7%) |
| 1 or 2 Children | 2,092 (93.1%) | 154 (6.9%) |
| 3 or 4 Children | 393 (70.9%) | 161 (29.1%) |
| 5 or more Children | 75 (80.6%) | 18 (19.4%) |
| Total | 6,020 (91.7%) | 541 (8.3%) |
Income Below Poverty Among Single-Parent Households in Lynnwood
According to the poverty data in Lynnwood, 14.3% or 130 single-father households and 21.9% or 438 single-mother households are living below the poverty line. Among single-father households, those with 1 or 2 children have the highest poverty rate, with 115 households (20.6%) experiencing poverty. Likewise, among single-mother households, those with 3 or 4 children have the highest poverty rate, with 51 households (43.6%) falling below the poverty line.
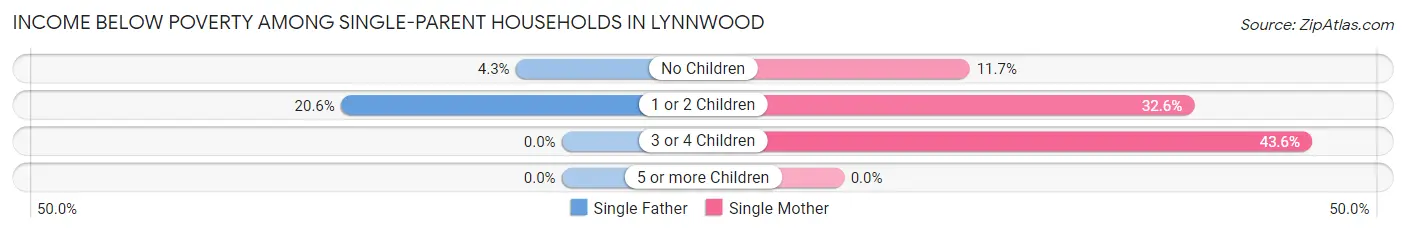
| Children | Single Father | Single Mother |
| No Children | 15 (4.3%) | 128 (11.7%) |
| 1 or 2 Children | 115 (20.6%) | 259 (32.6%) |
| 3 or 4 Children | 0 (0.0%) | 51 (43.6%) |
| 5 or more Children | 0 (0.0%) | 0 (0.0%) |
| Total | 130 (14.3%) | 438 (21.9%) |
Income Below Poverty Among Married-Couple vs Single-Parent Households in Lynnwood
The poverty data for Lynnwood shows that 541 of the married-couple family households (8.3%) and 568 of the single-parent households (19.5%) are living below the poverty level. Within the married-couple family households, those with 3 or 4 children have the highest poverty rate, with 161 households (29.1%) falling below the poverty line. Among the single-parent households, those with 3 or 4 children have the highest poverty rate, with 51 household (43.6%) living below poverty.
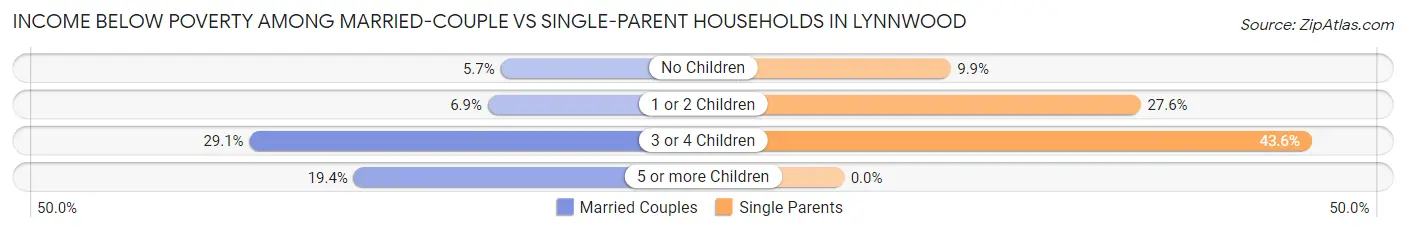
| Children | Married-Couple Families | Single-Parent Households |
| No Children | 208 (5.7%) | 143 (9.9%) |
| 1 or 2 Children | 154 (6.9%) | 374 (27.6%) |
| 3 or 4 Children | 161 (29.1%) | 51 (43.6%) |
| 5 or more Children | 18 (19.4%) | 0 (0.0%) |
| Total | 541 (8.3%) | 568 (19.5%) |
Race in Lynnwood
The most populous races in Lynnwood are White / Caucasian (21,870 | 54.9%), Asian (7,186 | 18.0%), and Hispanic or Latino (6,327 | 15.9%).
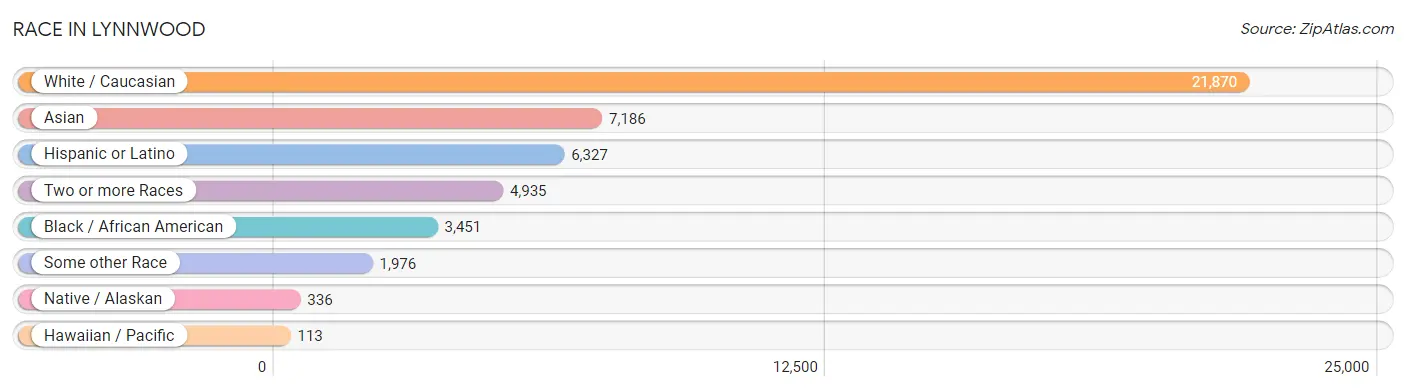
| Race | # Population | % Population |
| Asian | 7,186 | 18.0% |
| Black / African American | 3,451 | 8.7% |
| Hawaiian / Pacific | 113 | 0.3% |
| Hispanic or Latino | 6,327 | 15.9% |
| Native / Alaskan | 336 | 0.8% |
| White / Caucasian | 21,870 | 54.9% |
| Two or more Races | 4,935 | 12.4% |
| Some other Race | 1,976 | 5.0% |
| Total | 39,867 | 100.0% |
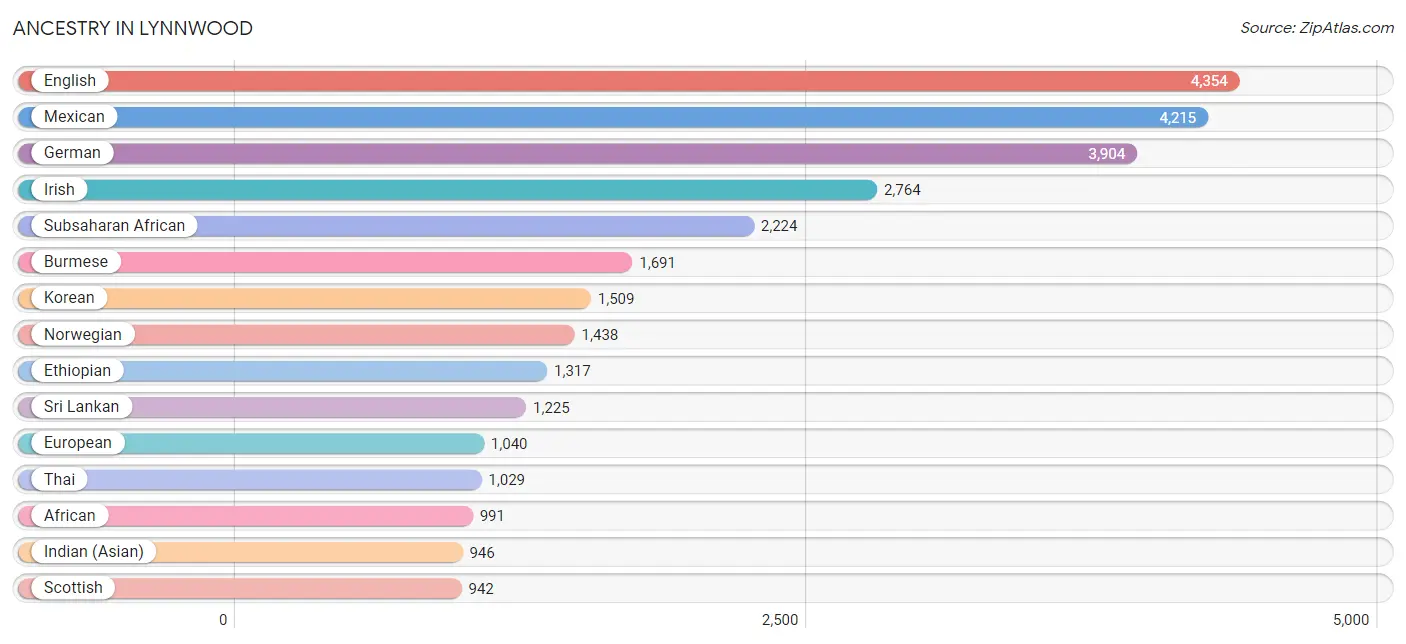
Ancestry in Lynnwood
The most populous ancestries reported in Lynnwood are English (4,354 | 10.9%), Mexican (4,215 | 10.6%), German (3,904 | 9.8%), Irish (2,764 | 6.9%), and Subsaharan African (2,224 | 5.6%), together accounting for 43.8% of all Lynnwood residents.
| Ancestry | # Population | % Population |
| African | 991 | 2.5% |
| Alaskan Athabascan | 41 | 0.1% |
| American | 864 | 2.2% |
| Apache | 165 | 0.4% |
| Arab | 245 | 0.6% |
| Argentinean | 70 | 0.2% |
| Armenian | 178 | 0.4% |
| Assyrian / Chaldean / Syriac | 19 | 0.1% |
| Austrian | 425 | 1.1% |
| Bangladeshi | 22 | 0.1% |
| Belgian | 63 | 0.2% |
| Bhutanese | 787 | 2.0% |
| Blackfeet | 19 | 0.1% |
| Brazilian | 6 | 0.0% |
| British | 172 | 0.4% |
| British West Indian | 20 | 0.1% |
| Bulgarian | 214 | 0.5% |
| Burmese | 1,691 | 4.2% |
| Cambodian | 110 | 0.3% |
| Canadian | 93 | 0.2% |
| Celtic | 17 | 0.0% |
| Central American | 679 | 1.7% |
| Cherokee | 101 | 0.3% |
| Chilean | 8 | 0.0% |
| Chippewa | 156 | 0.4% |
| Colombian | 206 | 0.5% |
| Colville | 4 | 0.0% |
| Costa Rican | 144 | 0.4% |
| Croatian | 70 | 0.2% |
| Cuban | 285 | 0.7% |
| Czech | 204 | 0.5% |
| Czechoslovakian | 74 | 0.2% |
| Danish | 251 | 0.6% |
| Dutch | 416 | 1.0% |
| Eastern European | 39 | 0.1% |
| Egyptian | 10 | 0.0% |
| English | 4,354 | 10.9% |
| Estonian | 20 | 0.1% |
| Ethiopian | 1,317 | 3.3% |
| European | 1,040 | 2.6% |
| Filipino | 43 | 0.1% |
| Finnish | 108 | 0.3% |
| French | 736 | 1.8% |
| French Canadian | 178 | 0.4% |
| German | 3,904 | 9.8% |
| Ghanaian | 60 | 0.2% |
| Greek | 19 | 0.1% |
| Guamanian / Chamorro | 54 | 0.1% |
| Guatemalan | 58 | 0.2% |
| Honduran | 174 | 0.4% |
| Hungarian | 47 | 0.1% |
| Icelander | 60 | 0.2% |
| Indian (Asian) | 946 | 2.4% |
| Inupiat | 19 | 0.1% |
| Iranian | 103 | 0.3% |
| Irish | 2,764 | 6.9% |
| Iroquois | 15 | 0.0% |
| Italian | 890 | 2.2% |
| Jamaican | 5 | 0.0% |
| Japanese | 583 | 1.5% |
| Korean | 1,509 | 3.8% |
| Laotian | 306 | 0.8% |
| Lebanese | 235 | 0.6% |
| Lithuanian | 140 | 0.4% |
| Luxembourger | 25 | 0.1% |
| Malaysian | 18 | 0.1% |
| Mexican | 4,215 | 10.6% |
| Mexican American Indian | 190 | 0.5% |
| Native Hawaiian | 104 | 0.3% |
| Nicaraguan | 38 | 0.1% |
| Nigerian | 51 | 0.1% |
| Northern European | 107 | 0.3% |
| Norwegian | 1,438 | 3.6% |
| Osage | 21 | 0.1% |
| Pakistani | 126 | 0.3% |
| Paraguayan | 44 | 0.1% |
| Pennsylvania German | 12 | 0.0% |
| Peruvian | 243 | 0.6% |
| Polish | 566 | 1.4% |
| Portuguese | 198 | 0.5% |
| Puerto Rican | 73 | 0.2% |
| Puget Sound Salish | 28 | 0.1% |
| Romanian | 47 | 0.1% |
| Russian | 547 | 1.4% |
| Salvadoran | 265 | 0.7% |
| Samoan | 25 | 0.1% |
| Scandinavian | 220 | 0.5% |
| Scotch-Irish | 245 | 0.6% |
| Scottish | 942 | 2.4% |
| Serbian | 85 | 0.2% |
| Sioux | 12 | 0.0% |
| Slavic | 260 | 0.6% |
| Slovak | 46 | 0.1% |
| Slovene | 8 | 0.0% |
| South American | 691 | 1.7% |
| South American Indian | 129 | 0.3% |
| Spaniard | 328 | 0.8% |
| Spanish | 46 | 0.1% |
| Sri Lankan | 1,225 | 3.1% |
| Subsaharan African | 2,224 | 5.6% |
| Swedish | 580 | 1.5% |
| Swiss | 235 | 0.6% |
| Thai | 1,029 | 2.6% |
| Tlingit-Haida | 15 | 0.0% |
| Turkish | 27 | 0.1% |
| Ukrainian | 285 | 0.7% |
| Venezuelan | 120 | 0.3% |
| Welsh | 235 | 0.6% |
| Yakama | 18 | 0.1% |
| Yugoslavian | 88 | 0.2% | View All 110 Rows |
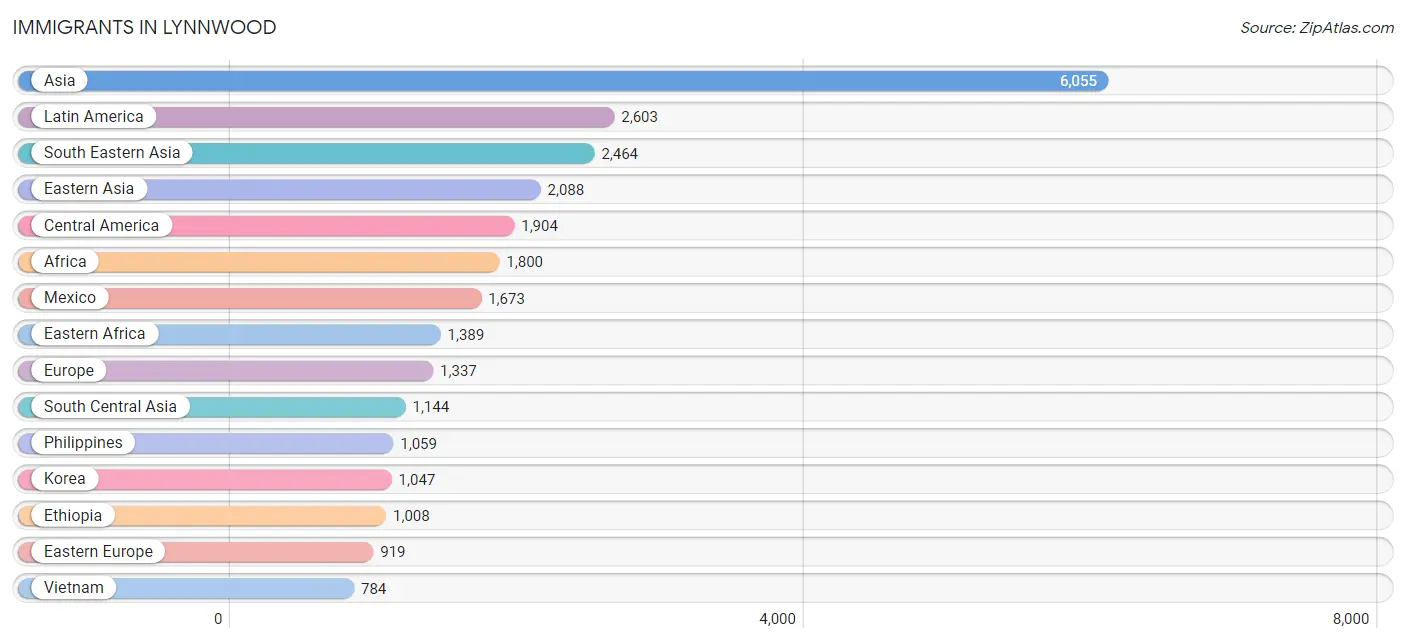
Immigrants in Lynnwood
The most numerous immigrant groups reported in Lynnwood came from Asia (6,055 | 15.2%), Latin America (2,603 | 6.5%), South Eastern Asia (2,464 | 6.2%), Eastern Asia (2,088 | 5.2%), and Central America (1,904 | 4.8%), together accounting for 37.9% of all Lynnwood residents.
| Immigration Origin | # Population | % Population |
| Africa | 1,800 | 4.5% |
| Argentina | 70 | 0.2% |
| Armenia | 248 | 0.6% |
| Asia | 6,055 | 15.2% |
| Australia | 19 | 0.1% |
| Belarus | 65 | 0.2% |
| Bosnia and Herzegovina | 139 | 0.4% |
| Brazil | 34 | 0.1% |
| Bulgaria | 133 | 0.3% |
| Cambodia | 340 | 0.9% |
| Canada | 76 | 0.2% |
| Caribbean | 152 | 0.4% |
| Central America | 1,904 | 4.8% |
| Chile | 8 | 0.0% |
| China | 747 | 1.9% |
| Colombia | 165 | 0.4% |
| Costa Rica | 25 | 0.1% |
| Cuba | 137 | 0.3% |
| Denmark | 14 | 0.0% |
| Eastern Africa | 1,389 | 3.5% |
| Eastern Asia | 2,088 | 5.2% |
| Eastern Europe | 919 | 2.3% |
| El Salvador | 119 | 0.3% |
| England | 49 | 0.1% |
| Eritrea | 316 | 0.8% |
| Ethiopia | 1,008 | 2.5% |
| Europe | 1,337 | 3.4% |
| Fiji | 39 | 0.1% |
| France | 21 | 0.1% |
| Germany | 178 | 0.4% |
| Ghana | 46 | 0.1% |
| Haiti | 15 | 0.0% |
| Honduras | 68 | 0.2% |
| Hong Kong | 38 | 0.1% |
| India | 783 | 2.0% |
| Indonesia | 185 | 0.5% |
| Iran | 81 | 0.2% |
| Israel | 6 | 0.0% |
| Italy | 10 | 0.0% |
| Japan | 174 | 0.4% |
| Kenya | 65 | 0.2% |
| Korea | 1,047 | 2.6% |
| Laos | 15 | 0.0% |
| Latin America | 2,603 | 6.5% |
| Lebanon | 78 | 0.2% |
| Lithuania | 50 | 0.1% |
| Mexico | 1,673 | 4.2% |
| Micronesia | 5 | 0.0% |
| Netherlands | 17 | 0.0% |
| Nicaragua | 19 | 0.1% |
| Nigeria | 28 | 0.1% |
| Northern Europe | 127 | 0.3% |
| Norway | 29 | 0.1% |
| Oceania | 147 | 0.4% |
| Pakistan | 173 | 0.4% |
| Peru | 171 | 0.4% |
| Philippines | 1,059 | 2.7% |
| Poland | 107 | 0.3% |
| Portugal | 42 | 0.1% |
| Romania | 24 | 0.1% |
| Russia | 216 | 0.5% |
| Scotland | 14 | 0.0% |
| South Africa | 4 | 0.0% |
| South America | 547 | 1.4% |
| South Central Asia | 1,144 | 2.9% |
| South Eastern Asia | 2,464 | 6.2% |
| Southern Europe | 75 | 0.2% |
| Spain | 23 | 0.1% |
| Sri Lanka | 107 | 0.3% |
| Taiwan | 165 | 0.4% |
| Thailand | 81 | 0.2% |
| Turkey | 27 | 0.1% |
| Ukraine | 181 | 0.4% |
| Venezuela | 99 | 0.3% |
| Vietnam | 784 | 2.0% |
| Western Africa | 407 | 1.0% |
| Western Asia | 359 | 0.9% |
| Western Europe | 216 | 0.5% | View All 78 Rows |
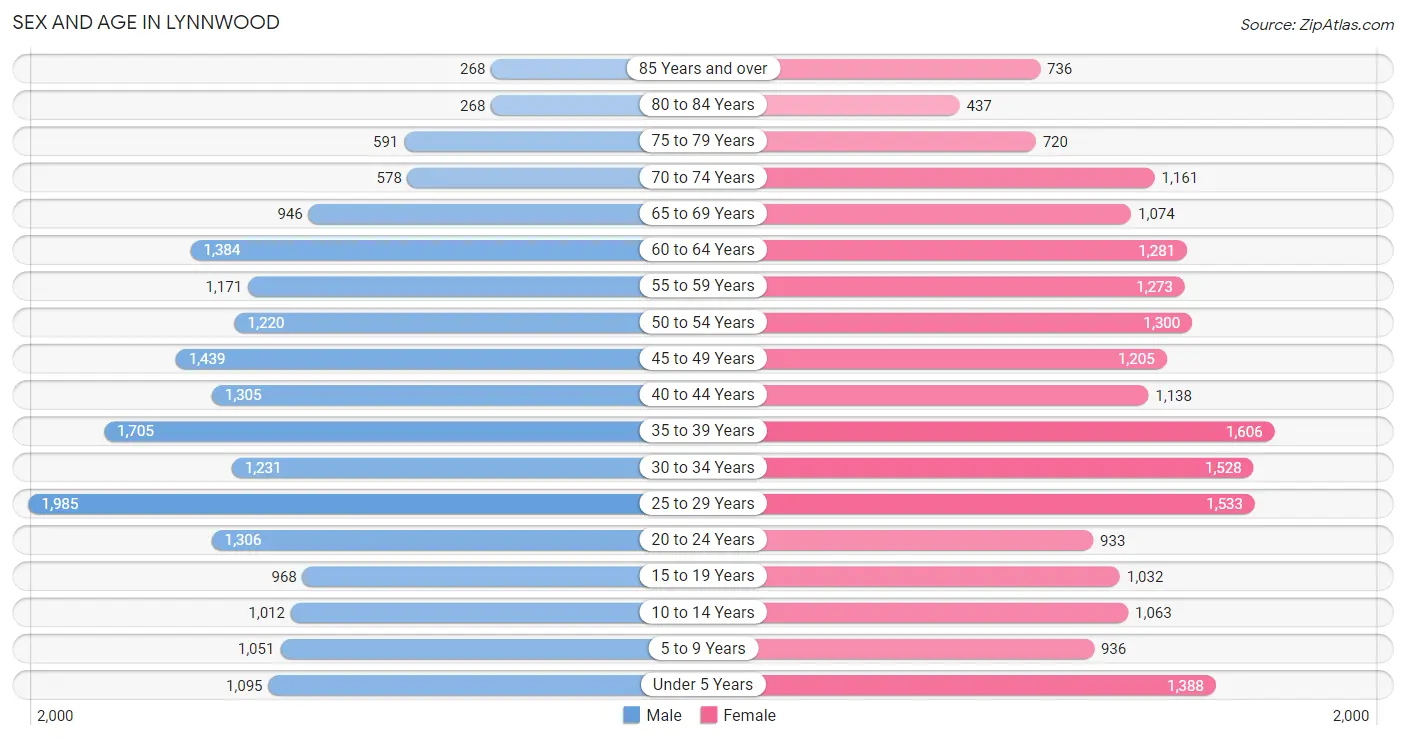
Sex and Age in Lynnwood
Sex and Age in Lynnwood
The most populous age groups in Lynnwood are 25 to 29 Years (1,985 | 10.2%) for men and 35 to 39 Years (1,606 | 7.9%) for women.
| Age Bracket | Male | Female |
| Under 5 Years | 1,095 (5.6%) | 1,388 (6.8%) |
| 5 to 9 Years | 1,051 (5.4%) | 936 (4.6%) |
| 10 to 14 Years | 1,012 (5.2%) | 1,063 (5.2%) |
| 15 to 19 Years | 968 (5.0%) | 1,032 (5.1%) |
| 20 to 24 Years | 1,306 (6.7%) | 933 (4.6%) |
| 25 to 29 Years | 1,985 (10.2%) | 1,533 (7.5%) |
| 30 to 34 Years | 1,231 (6.3%) | 1,528 (7.5%) |
| 35 to 39 Years | 1,705 (8.7%) | 1,606 (7.9%) |
| 40 to 44 Years | 1,305 (6.7%) | 1,138 (5.6%) |
| 45 to 49 Years | 1,439 (7.4%) | 1,205 (5.9%) |
| 50 to 54 Years | 1,220 (6.2%) | 1,300 (6.4%) |
| 55 to 59 Years | 1,171 (6.0%) | 1,273 (6.3%) |
| 60 to 64 Years | 1,384 (7.1%) | 1,281 (6.3%) |
| 65 to 69 Years | 946 (4.9%) | 1,074 (5.3%) |
| 70 to 74 Years | 578 (3.0%) | 1,161 (5.7%) |
| 75 to 79 Years | 591 (3.0%) | 720 (3.5%) |
| 80 to 84 Years | 268 (1.4%) | 437 (2.1%) |
| 85 Years and over | 268 (1.4%) | 736 (3.6%) |
| Total | 19,523 (100.0%) | 20,344 (100.0%) |
Families and Households in Lynnwood
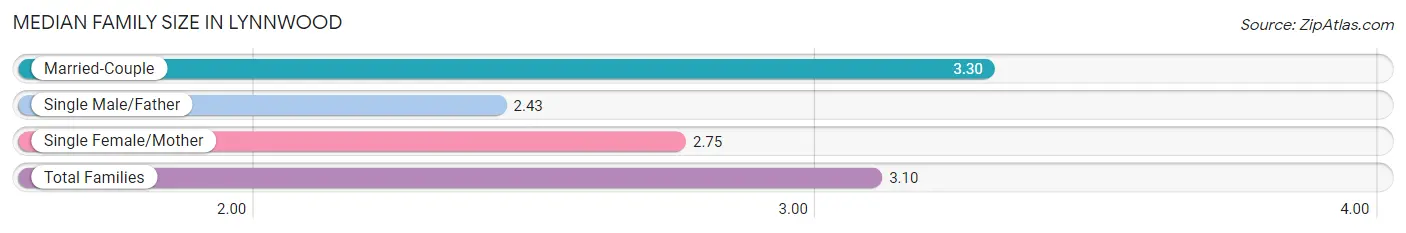
Median Family Size in Lynnwood
The median family size in Lynnwood is 3.10 persons per family, with married-couple families (6,561 | 69.3%) accounting for the largest median family size of 3.3 persons per family. On the other hand, single male/father families (909 | 9.6%) represent the smallest median family size with 2.43 persons per family.
| Family Type | # Families | Family Size |
| Married-Couple | 6,561 (69.3%) | 3.30 |
| Single Male/Father | 909 (9.6%) | 2.43 |
| Single Female/Mother | 2,001 (21.1%) | 2.75 |
| Total Families | 9,471 (100.0%) | 3.10 |
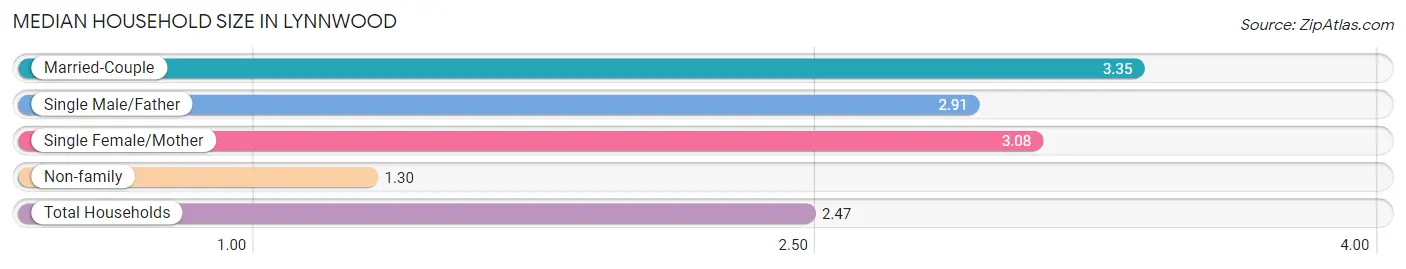
Median Household Size in Lynnwood
The median household size in Lynnwood is 2.47 persons per household, with married-couple households (6,561 | 41.5%) accounting for the largest median household size of 3.35 persons per household. non-family households (6,346 | 40.1%) represent the smallest median household size with 1.30 persons per household.
| Household Type | # Households | Household Size |
| Married-Couple | 6,561 (41.5%) | 3.35 |
| Single Male/Father | 909 (5.8%) | 2.91 |
| Single Female/Mother | 2,001 (12.7%) | 3.08 |
| Non-family | 6,346 (40.1%) | 1.30 |
| Total Households | 15,817 (100.0%) | 2.47 |
Household Size by Marriage Status in Lynnwood
Out of a total of 15,817 households in Lynnwood, 9,471 (59.9%) are family households, while 6,346 (40.1%) are nonfamily households. The most numerous type of family households are 2-person households, comprising 3,730, and the most common type of nonfamily households are 1-person households, comprising 4,682.
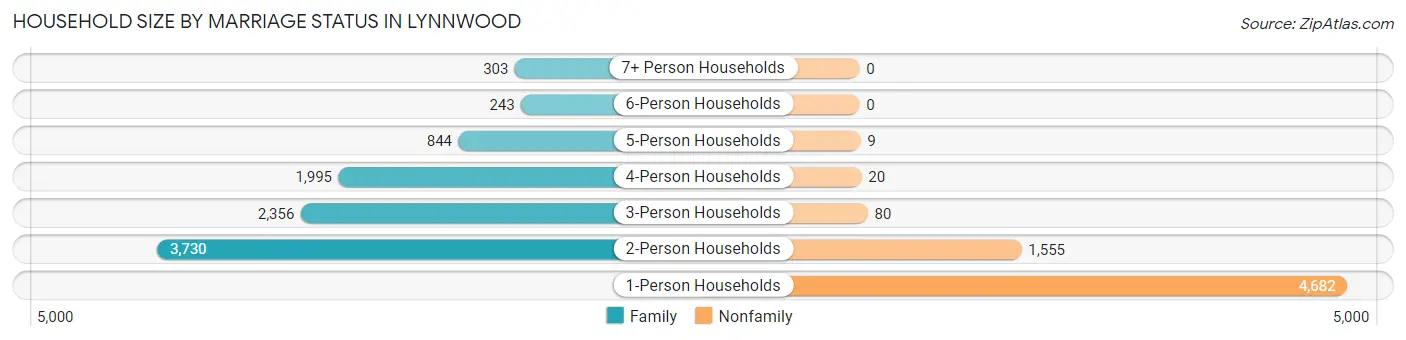
| Household Size | Family Households | Nonfamily Households |
| 1-Person Households | - | 4,682 (29.6%) |
| 2-Person Households | 3,730 (23.6%) | 1,555 (9.8%) |
| 3-Person Households | 2,356 (14.9%) | 80 (0.5%) |
| 4-Person Households | 1,995 (12.6%) | 20 (0.1%) |
| 5-Person Households | 844 (5.3%) | 9 (0.1%) |
| 6-Person Households | 243 (1.5%) | 0 (0.0%) |
| 7+ Person Households | 303 (1.9%) | 0 (0.0%) |
| Total | 9,471 (59.9%) | 6,346 (40.1%) |
Female Fertility in Lynnwood
Fertility by Age in Lynnwood
Average fertility rate in Lynnwood is 88.0 births per 1,000 women. Women in the age bracket of 35 to 50 years have the highest fertility rate with 122.0 births per 1,000 women. Women in the age bracket of 35 to 50 years acount for 62.2% of all women with births.
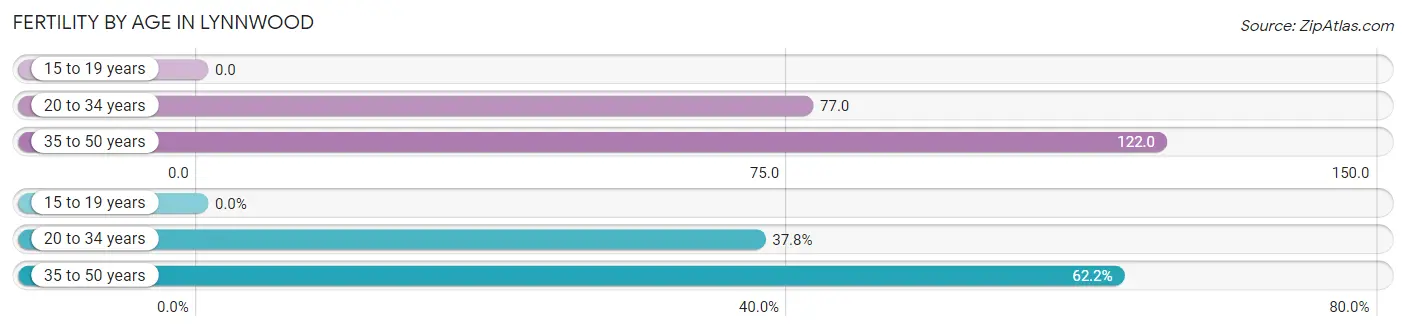
| Age Bracket | Women with Births | Births / 1,000 Women |
| 15 to 19 years | 0 (0.0%) | 0.0 |
| 20 to 34 years | 306 (37.8%) | 77.0 |
| 35 to 50 years | 503 (62.2%) | 122.0 |
| Total | 809 (100.0%) | 88.0 |
Fertility by Age by Marriage Status in Lynnwood
78.1% of women with births (809) in Lynnwood are married. The highest percentage of unmarried women with births falls into 20 to 34 years age bracket with 32.7% of them unmarried at the time of birth, while the lowest percentage of unmarried women with births belong to 35 to 50 years age bracket with 15.3% of them unmarried.
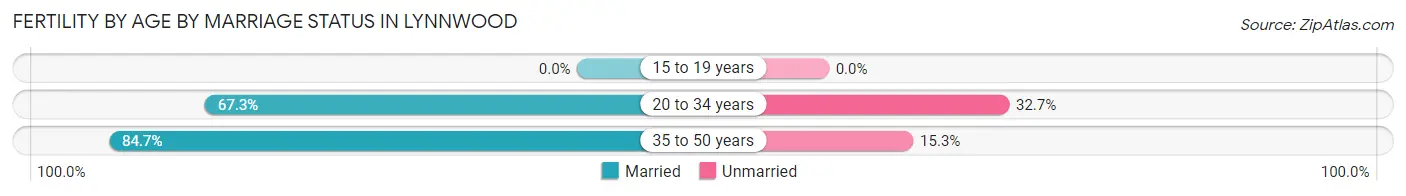
| Age Bracket | Married | Unmarried |
| 15 to 19 years | 0 (0.0%) | 0 (0.0%) |
| 20 to 34 years | 206 (67.3%) | 100 (32.7%) |
| 35 to 50 years | 426 (84.7%) | 77 (15.3%) |
| Total | 632 (78.1%) | 177 (21.9%) |
Fertility by Education in Lynnwood
Average fertility rate in Lynnwood is 88.0 births per 1,000 women. Women with the education attainment of less than high school have the highest fertility rate of 167.0 births per 1,000 women, while women with the education attainment of high school diploma have the lowest fertility at 38.0 births per 1,000 women. Women with the education attainment of college or associate's degree represent 30.5% of all women with births.
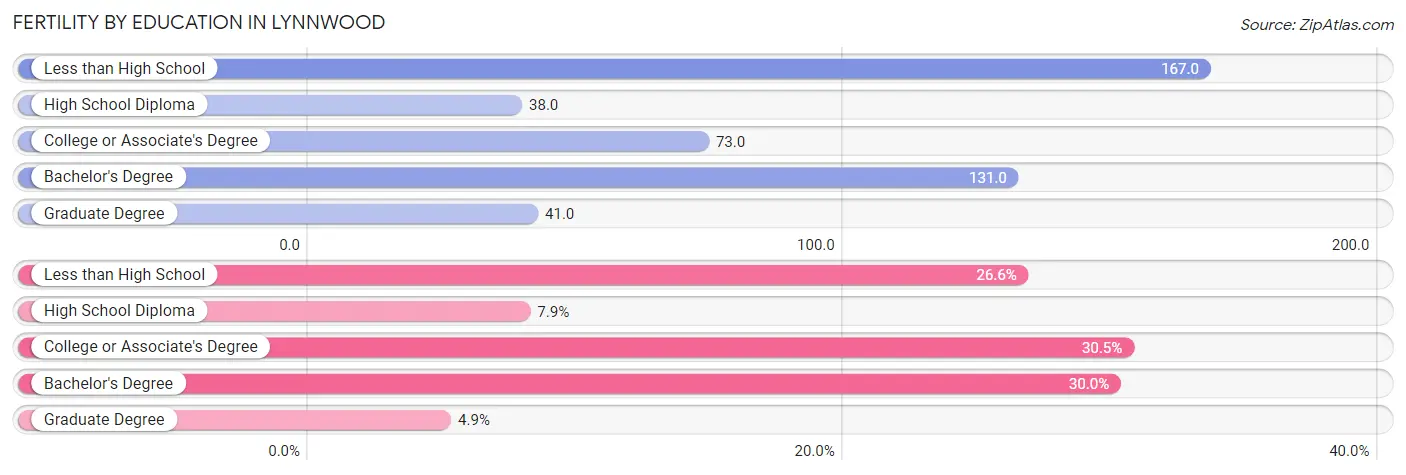
| Educational Attainment | Women with Births | Births / 1,000 Women |
| Less than High School | 215 (26.6%) | 167.0 |
| High School Diploma | 64 (7.9%) | 38.0 |
| College or Associate's Degree | 247 (30.5%) | 73.0 |
| Bachelor's Degree | 243 (30.0%) | 131.0 |
| Graduate Degree | 40 (4.9%) | 41.0 |
| Total | 809 (100.0%) | 88.0 |
Fertility by Education by Marriage Status in Lynnwood
21.9% of women with births in Lynnwood are unmarried. Women with the educational attainment of bachelor's degree are most likely to be married with 100.0% of them married at childbirth, while women with the educational attainment of high school diploma are least likely to be married with 79.7% of them unmarried at childbirth.
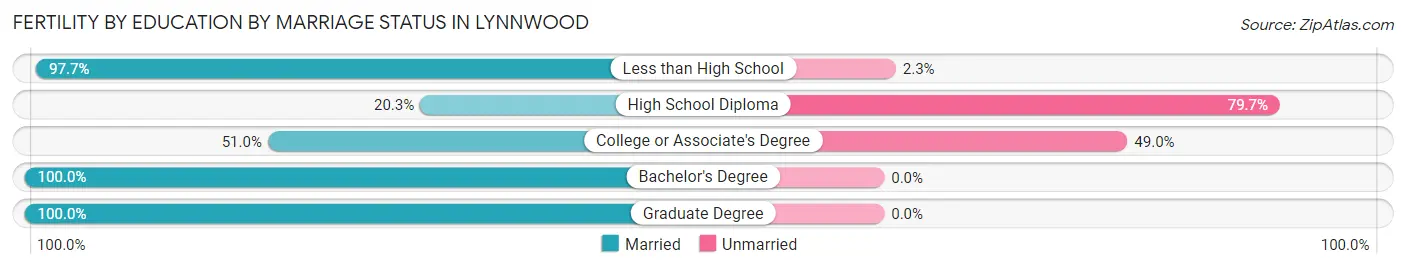
| Educational Attainment | Married | Unmarried |
| Less than High School | 210 (97.7%) | 5 (2.3%) |
| High School Diploma | 13 (20.3%) | 51 (79.7%) |
| College or Associate's Degree | 126 (51.0%) | 121 (49.0%) |
| Bachelor's Degree | 243 (100.0%) | 0 (0.0%) |
| Graduate Degree | 40 (100.0%) | 0 (0.0%) |
| Total | 632 (78.1%) | 177 (21.9%) |
Employment Characteristics in Lynnwood
Employment by Class of Employer in Lynnwood
Among the 19,584 employed individuals in Lynnwood, private company employees (13,397 | 68.4%), not-for-profit organizations (1,989 | 10.2%), and self-employed (not incorporated) (1,263 | 6.5%) make up the most common classes of employment.
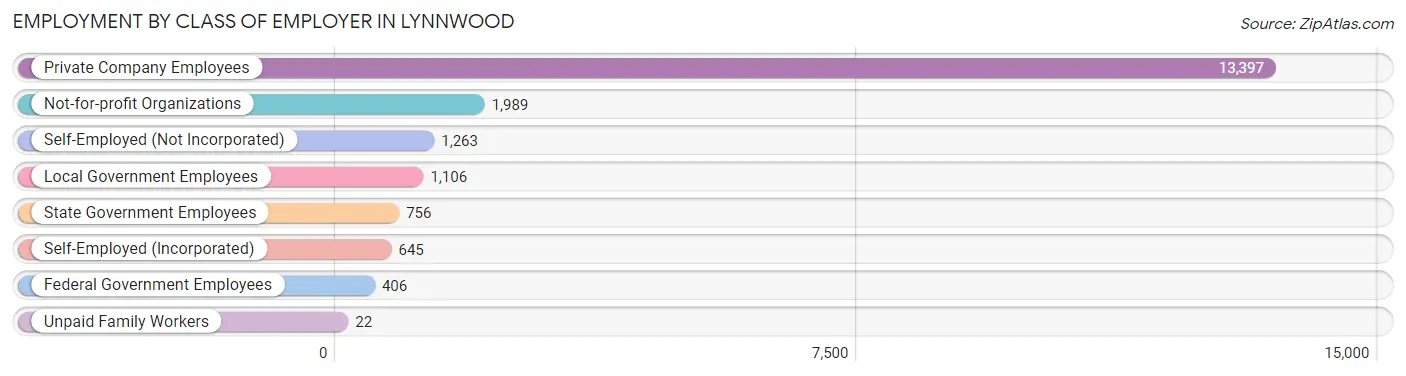
| Employer Class | # Employees | % Employees |
| Private Company Employees | 13,397 | 68.4% |
| Self-Employed (Incorporated) | 645 | 3.3% |
| Self-Employed (Not Incorporated) | 1,263 | 6.5% |
| Not-for-profit Organizations | 1,989 | 10.2% |
| Local Government Employees | 1,106 | 5.7% |
| State Government Employees | 756 | 3.9% |
| Federal Government Employees | 406 | 2.1% |
| Unpaid Family Workers | 22 | 0.1% |
| Total | 19,584 | 100.0% |
Employment Status by Age in Lynnwood
According to the labor force statistics for Lynnwood, out of the total population over 16 years of age (32,867), 64.1% or 21,068 individuals are in the labor force, with 4.1% or 864 of them unemployed. The age group with the highest labor force participation rate is 25 to 29 years, with 84.7% or 2,980 individuals in the labor force. Within the labor force, the 16 to 19 years age range has the highest percentage of unemployed individuals, with 9.3% or 57 of them being unemployed.
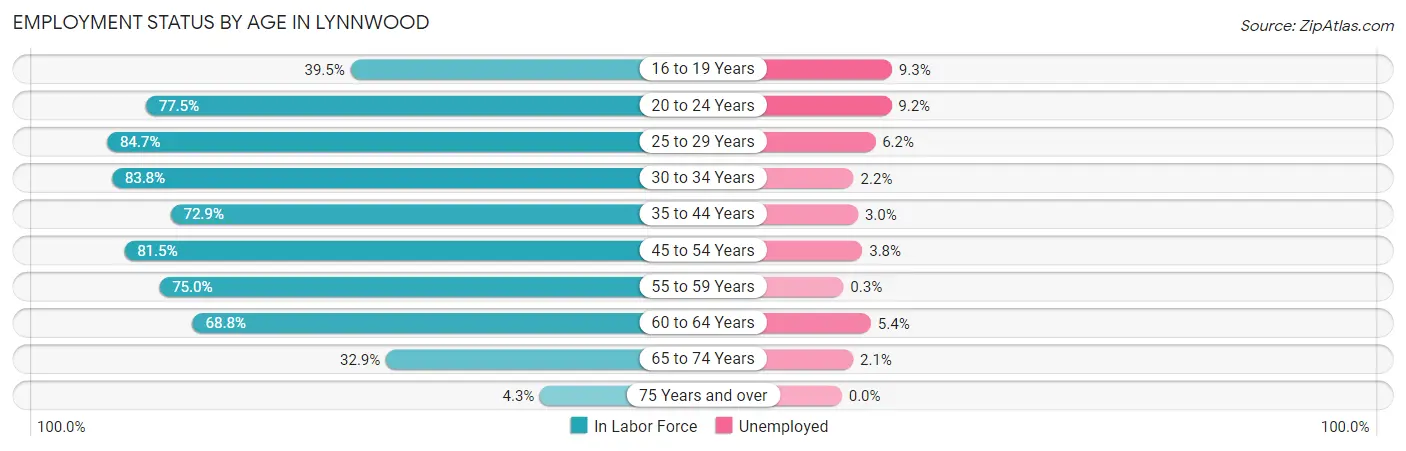
| Age Bracket | In Labor Force | Unemployed |
| 16 to 19 Years | 610 (39.5%) | 57 (9.3%) |
| 20 to 24 Years | 1,735 (77.5%) | 160 (9.2%) |
| 25 to 29 Years | 2,980 (84.7%) | 185 (6.2%) |
| 30 to 34 Years | 2,312 (83.8%) | 51 (2.2%) |
| 35 to 44 Years | 4,195 (72.9%) | 126 (3.0%) |
| 45 to 54 Years | 4,209 (81.5%) | 160 (3.8%) |
| 55 to 59 Years | 1,833 (75.0%) | 5 (0.3%) |
| 60 to 64 Years | 1,834 (68.8%) | 99 (5.4%) |
| 65 to 74 Years | 1,237 (32.9%) | 26 (2.1%) |
| 75 Years and over | 130 (4.3%) | 0 (0.0%) |
| Total | 21,068 (64.1%) | 864 (4.1%) |
Employment Status by Educational Attainment in Lynnwood
According to labor force statistics for Lynnwood, 77.8% of individuals (17,353) out of the total population between 25 and 64 years of age (22,304) are in the labor force, with 3.6% or 625 of them being unemployed. The group with the highest labor force participation rate are those with the educational attainment of bachelor's degree or higher, with 86.0% or 5,821 individuals in the labor force. Within the labor force, individuals with college / associate degree education have the highest percentage of unemployment, with 3.8% or 256 of them being unemployed.
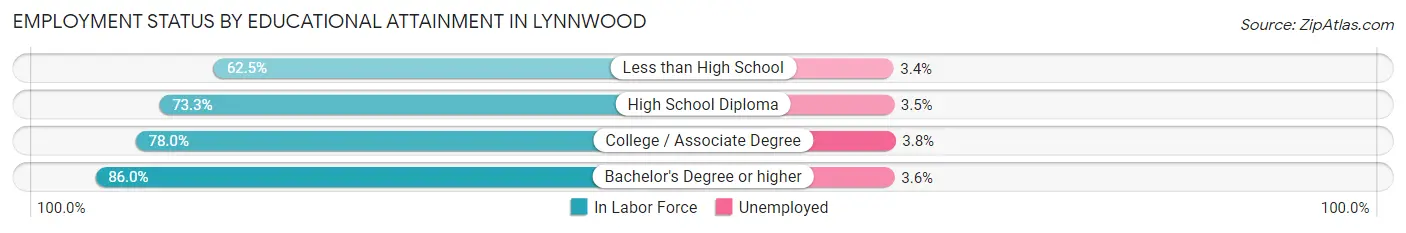
| Educational Attainment | In Labor Force | Unemployed |
| Less than High School | 1,513 (62.5%) | 82 (3.4%) |
| High School Diploma | 3,289 (73.3%) | 157 (3.5%) |
| College / Associate Degree | 6,729 (78.0%) | 328 (3.8%) |
| Bachelor's Degree or higher | 5,821 (86.0%) | 244 (3.6%) |
| Total | 17,353 (77.8%) | 803 (3.6%) |
Employment Occupations by Sex in Lynnwood
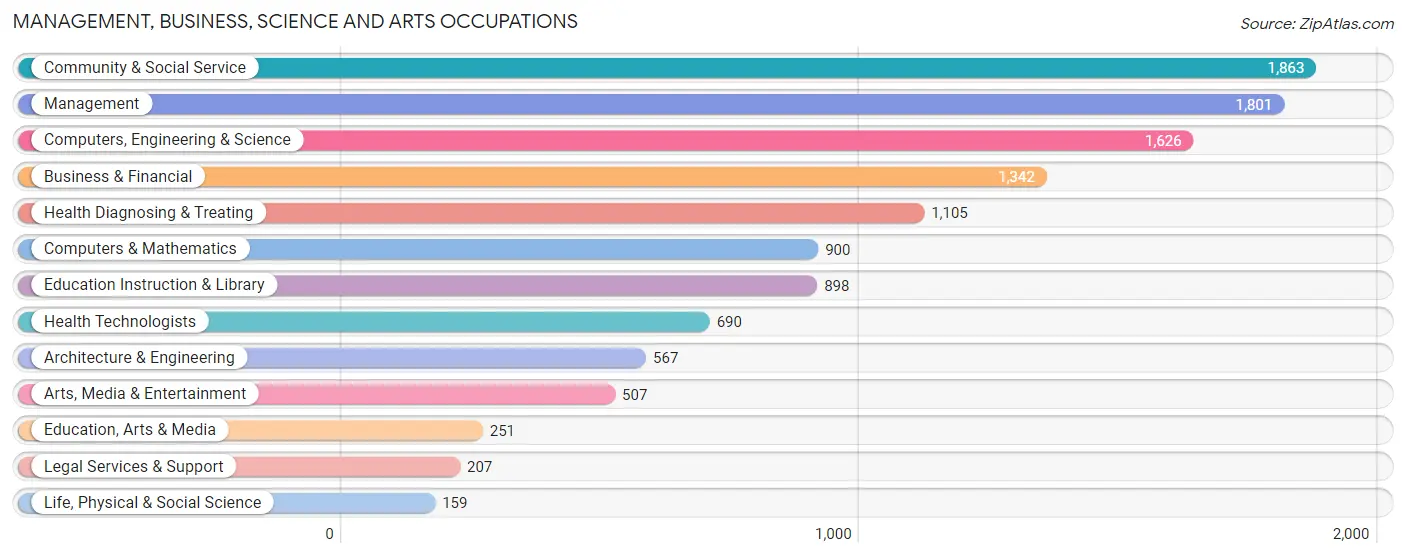
Management, Business, Science and Arts Occupations
The most common Management, Business, Science and Arts occupations in Lynnwood are Community & Social Service (1,863 | 9.2%), Management (1,801 | 8.9%), Computers, Engineering & Science (1,626 | 8.1%), Business & Financial (1,342 | 6.7%), and Health Diagnosing & Treating (1,105 | 5.5%).
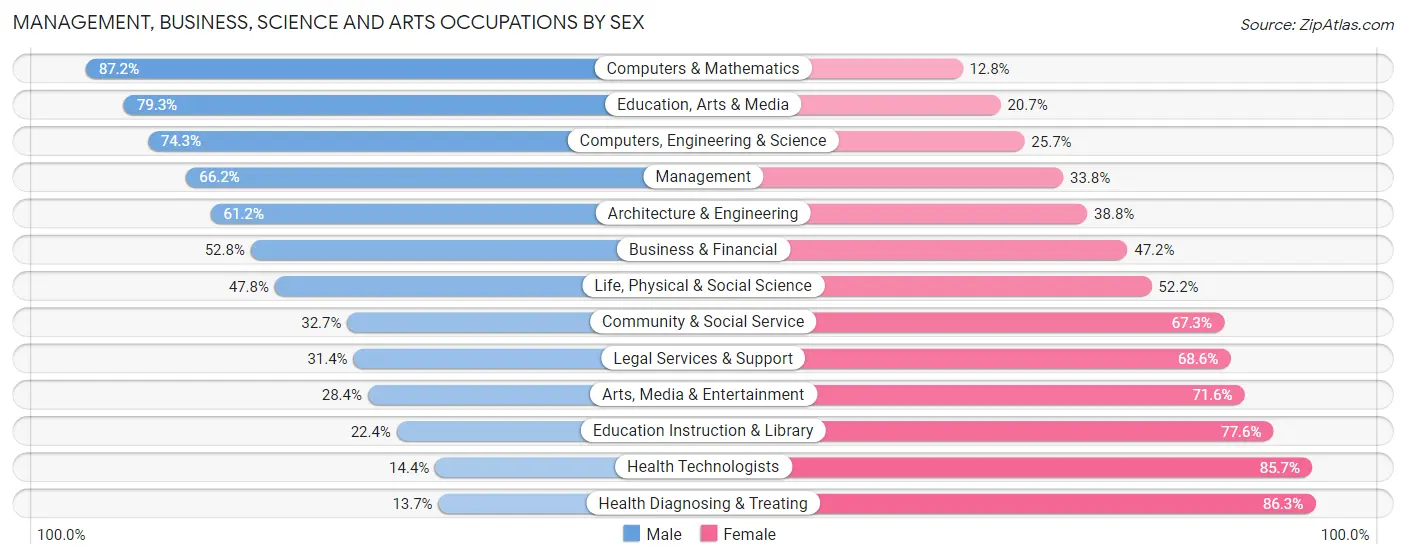
Management, Business, Science and Arts Occupations by Sex
Within the Management, Business, Science and Arts occupations in Lynnwood, the most male-oriented occupations are Computers & Mathematics (87.2%), Education, Arts & Media (79.3%), and Computers, Engineering & Science (74.3%), while the most female-oriented occupations are Health Diagnosing & Treating (86.3%), Health Technologists (85.7%), and Education Instruction & Library (77.6%).
| Occupation | Male | Female |
| Management | 1,193 (66.2%) | 608 (33.8%) |
| Business & Financial | 709 (52.8%) | 633 (47.2%) |
| Computers, Engineering & Science | 1,208 (74.3%) | 418 (25.7%) |
| Computers & Mathematics | 785 (87.2%) | 115 (12.8%) |
| Architecture & Engineering | 347 (61.2%) | 220 (38.8%) |
| Life, Physical & Social Science | 76 (47.8%) | 83 (52.2%) |
| Community & Social Service | 609 (32.7%) | 1,254 (67.3%) |
| Education, Arts & Media | 199 (79.3%) | 52 (20.7%) |
| Legal Services & Support | 65 (31.4%) | 142 (68.6%) |
| Education Instruction & Library | 201 (22.4%) | 697 (77.6%) |
| Arts, Media & Entertainment | 144 (28.4%) | 363 (71.6%) |
| Health Diagnosing & Treating | 151 (13.7%) | 954 (86.3%) |
| Health Technologists | 99 (14.3%) | 591 (85.7%) |
| Total (Category) | 3,870 (50.0%) | 3,867 (50.0%) |
| Total (Overall) | 11,184 (55.5%) | 8,981 (44.5%) |
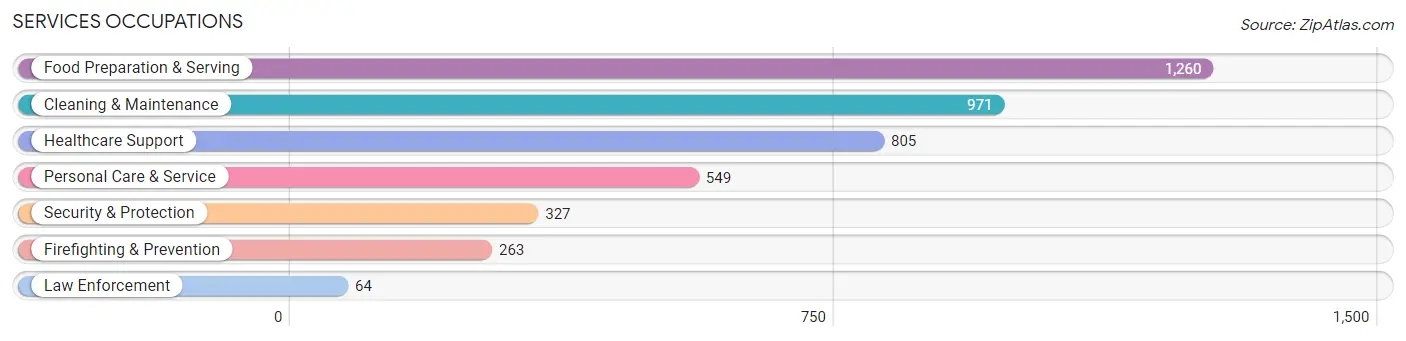
Services Occupations
The most common Services occupations in Lynnwood are Food Preparation & Serving (1,260 | 6.2%), Cleaning & Maintenance (971 | 4.8%), Healthcare Support (805 | 4.0%), Personal Care & Service (549 | 2.7%), and Security & Protection (327 | 1.6%).
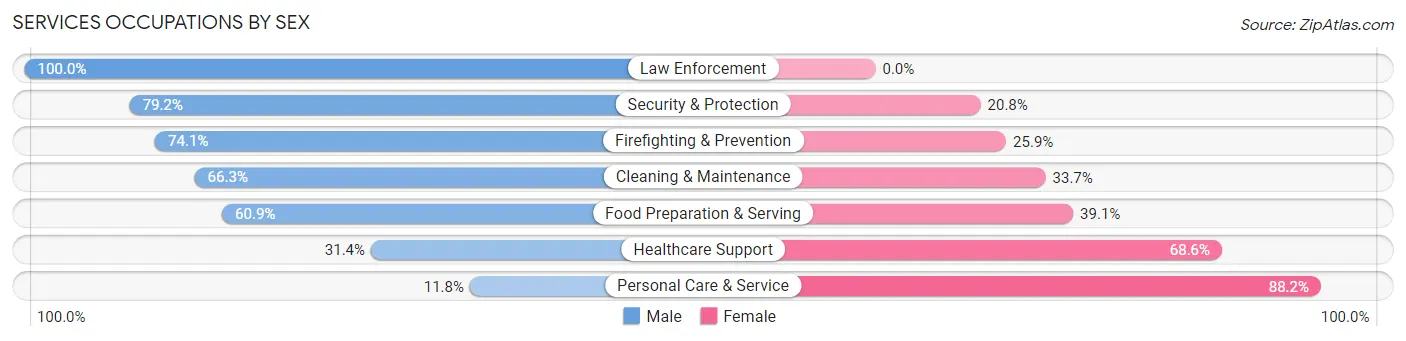
Services Occupations by Sex
Within the Services occupations in Lynnwood, the most male-oriented occupations are Law Enforcement (100.0%), Security & Protection (79.2%), and Firefighting & Prevention (74.1%), while the most female-oriented occupations are Personal Care & Service (88.2%), Healthcare Support (68.6%), and Food Preparation & Serving (39.1%).
| Occupation | Male | Female |
| Healthcare Support | 253 (31.4%) | 552 (68.6%) |
| Security & Protection | 259 (79.2%) | 68 (20.8%) |
| Firefighting & Prevention | 195 (74.1%) | 68 (25.9%) |
| Law Enforcement | 64 (100.0%) | 0 (0.0%) |
| Food Preparation & Serving | 767 (60.9%) | 493 (39.1%) |
| Cleaning & Maintenance | 644 (66.3%) | 327 (33.7%) |
| Personal Care & Service | 65 (11.8%) | 484 (88.2%) |
| Total (Category) | 1,988 (50.8%) | 1,924 (49.2%) |
| Total (Overall) | 11,184 (55.5%) | 8,981 (44.5%) |
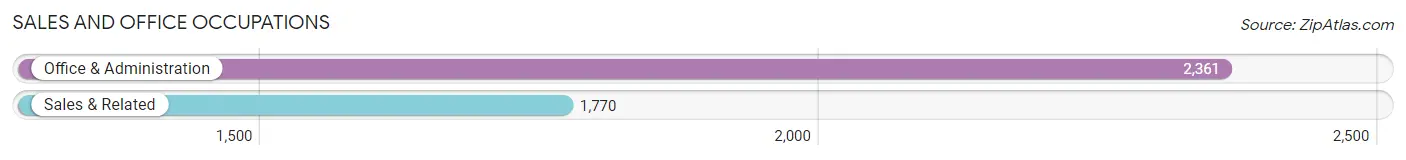
Sales and Office Occupations
The most common Sales and Office occupations in Lynnwood are Office & Administration (2,361 | 11.7%), and Sales & Related (1,770 | 8.8%).
Sales and Office Occupations by Sex
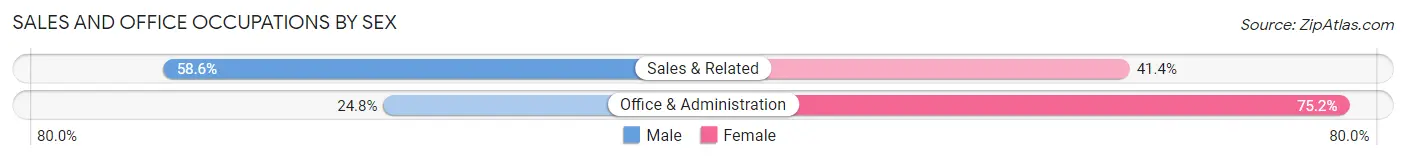
| Occupation | Male | Female |
| Sales & Related | 1,037 (58.6%) | 733 (41.4%) |
| Office & Administration | 586 (24.8%) | 1,775 (75.2%) |
| Total (Category) | 1,623 (39.3%) | 2,508 (60.7%) |
| Total (Overall) | 11,184 (55.5%) | 8,981 (44.5%) |
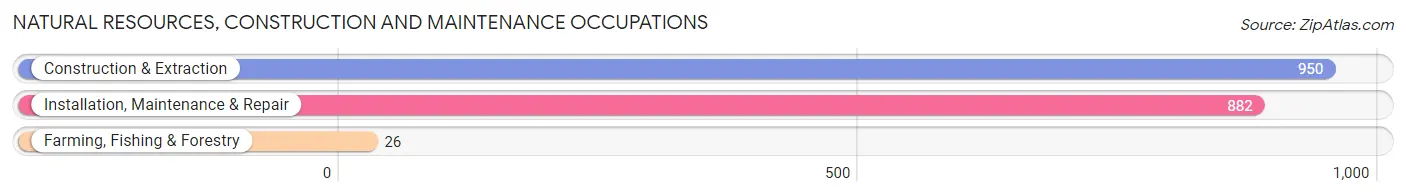
Natural Resources, Construction and Maintenance Occupations
The most common Natural Resources, Construction and Maintenance occupations in Lynnwood are Construction & Extraction (950 | 4.7%), Installation, Maintenance & Repair (882 | 4.4%), and Farming, Fishing & Forestry (26 | 0.1%).
Natural Resources, Construction and Maintenance Occupations by Sex
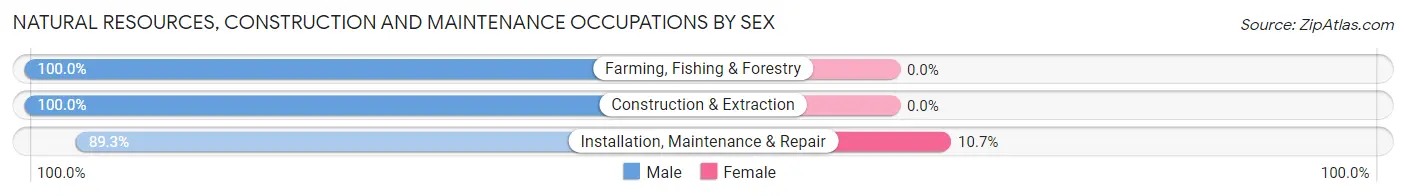
| Occupation | Male | Female |
| Farming, Fishing & Forestry | 26 (100.0%) | 0 (0.0%) |
| Construction & Extraction | 950 (100.0%) | 0 (0.0%) |
| Installation, Maintenance & Repair | 788 (89.3%) | 94 (10.7%) |
| Total (Category) | 1,764 (94.9%) | 94 (5.1%) |
| Total (Overall) | 11,184 (55.5%) | 8,981 (44.5%) |
Production, Transportation and Moving Occupations
The most common Production, Transportation and Moving occupations in Lynnwood are Transportation (984 | 4.9%), Production (816 | 4.1%), and Material Moving (727 | 3.6%).
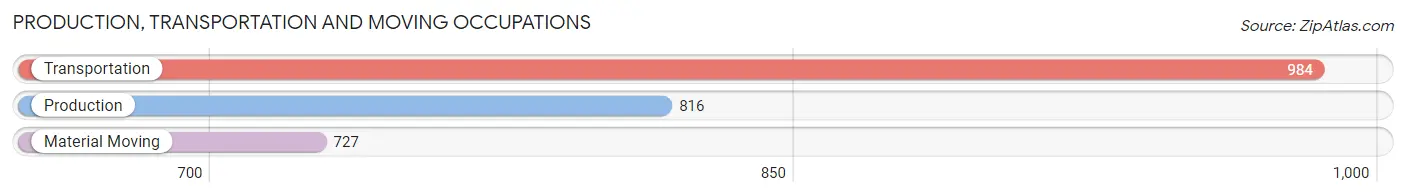
Production, Transportation and Moving Occupations by Sex
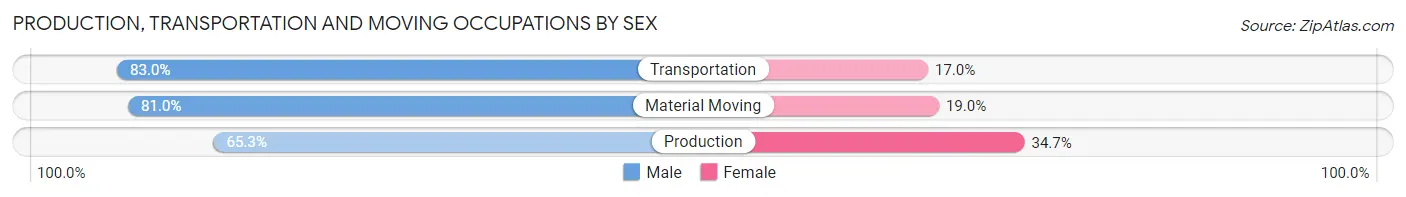
| Occupation | Male | Female |
| Production | 533 (65.3%) | 283 (34.7%) |
| Transportation | 817 (83.0%) | 167 (17.0%) |
| Material Moving | 589 (81.0%) | 138 (19.0%) |
| Total (Category) | 1,939 (76.7%) | 588 (23.3%) |
| Total (Overall) | 11,184 (55.5%) | 8,981 (44.5%) |
Employment Industries by Sex in Lynnwood
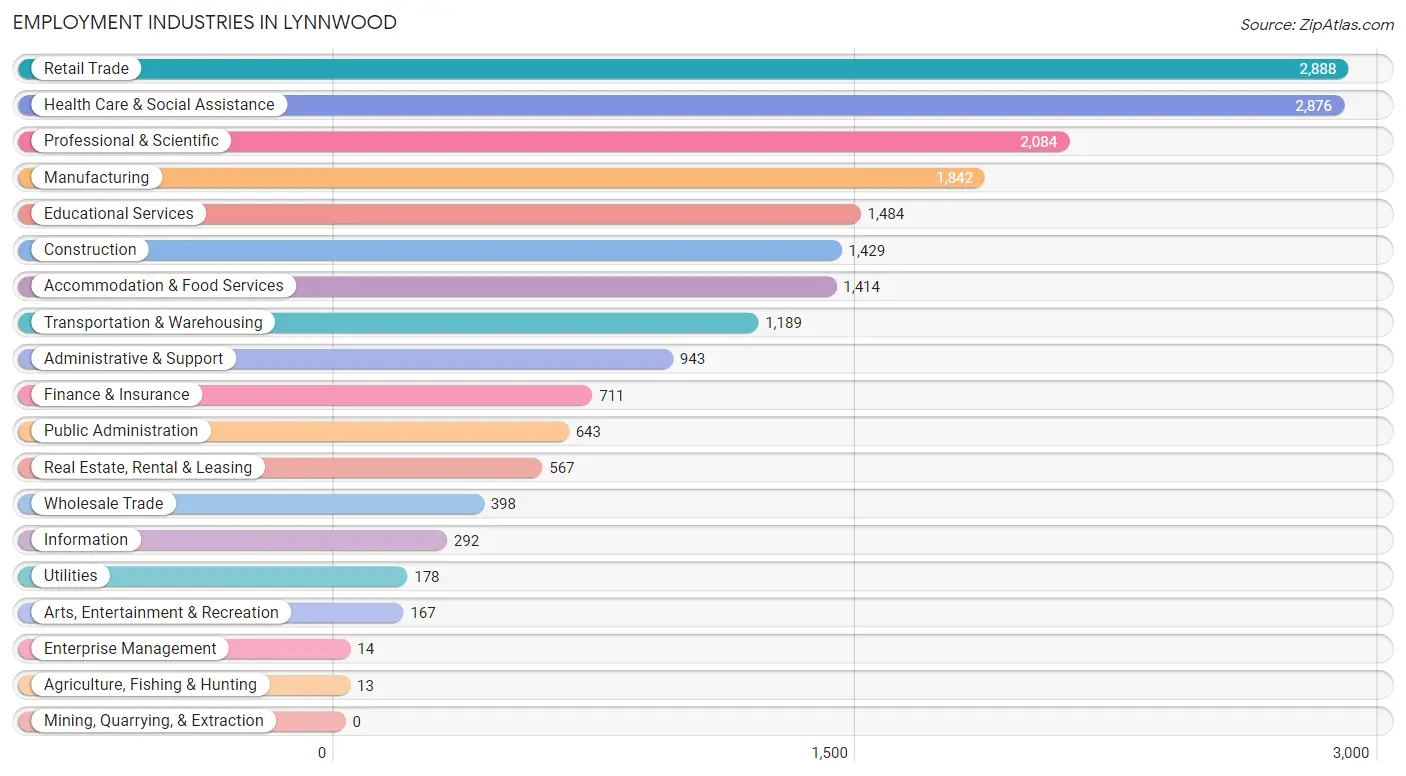
Employment Industries in Lynnwood
The major employment industries in Lynnwood include Retail Trade (2,888 | 14.3%), Health Care & Social Assistance (2,876 | 14.3%), Professional & Scientific (2,084 | 10.3%), Manufacturing (1,842 | 9.1%), and Educational Services (1,484 | 7.4%).
Employment Industries by Sex in Lynnwood
The Lynnwood industries that see more men than women are Agriculture, Fishing & Hunting (100.0%), Construction (92.3%), and Utilities (82.0%), whereas the industries that tend to have a higher number of women are Enterprise Management (100.0%), Health Care & Social Assistance (82.7%), and Educational Services (72.4%).
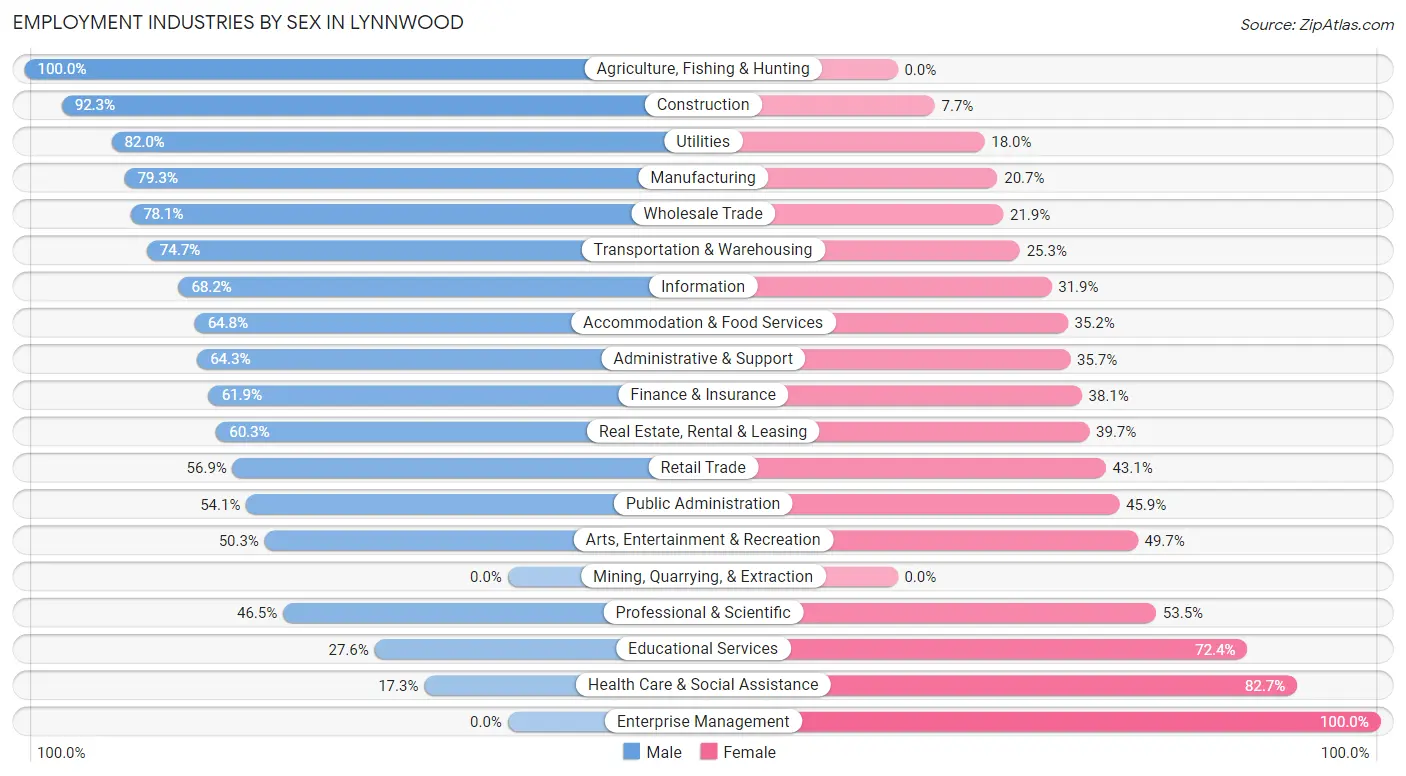
| Industry | Male | Female |
| Agriculture, Fishing & Hunting | 13 (100.0%) | 0 (0.0%) |
| Mining, Quarrying, & Extraction | 0 (0.0%) | 0 (0.0%) |
| Construction | 1,319 (92.3%) | 110 (7.7%) |
| Manufacturing | 1,461 (79.3%) | 381 (20.7%) |
| Wholesale Trade | 311 (78.1%) | 87 (21.9%) |
| Retail Trade | 1,644 (56.9%) | 1,244 (43.1%) |
| Transportation & Warehousing | 888 (74.7%) | 301 (25.3%) |
| Utilities | 146 (82.0%) | 32 (18.0%) |
| Information | 199 (68.1%) | 93 (31.9%) |
| Finance & Insurance | 440 (61.9%) | 271 (38.1%) |
| Real Estate, Rental & Leasing | 342 (60.3%) | 225 (39.7%) |
| Professional & Scientific | 969 (46.5%) | 1,115 (53.5%) |
| Enterprise Management | 0 (0.0%) | 14 (100.0%) |
| Administrative & Support | 606 (64.3%) | 337 (35.7%) |
| Educational Services | 409 (27.6%) | 1,075 (72.4%) |
| Health Care & Social Assistance | 497 (17.3%) | 2,379 (82.7%) |
| Arts, Entertainment & Recreation | 84 (50.3%) | 83 (49.7%) |
| Accommodation & Food Services | 916 (64.8%) | 498 (35.2%) |
| Public Administration | 348 (54.1%) | 295 (45.9%) |
| Total | 11,184 (55.5%) | 8,981 (44.5%) |
Education in Lynnwood
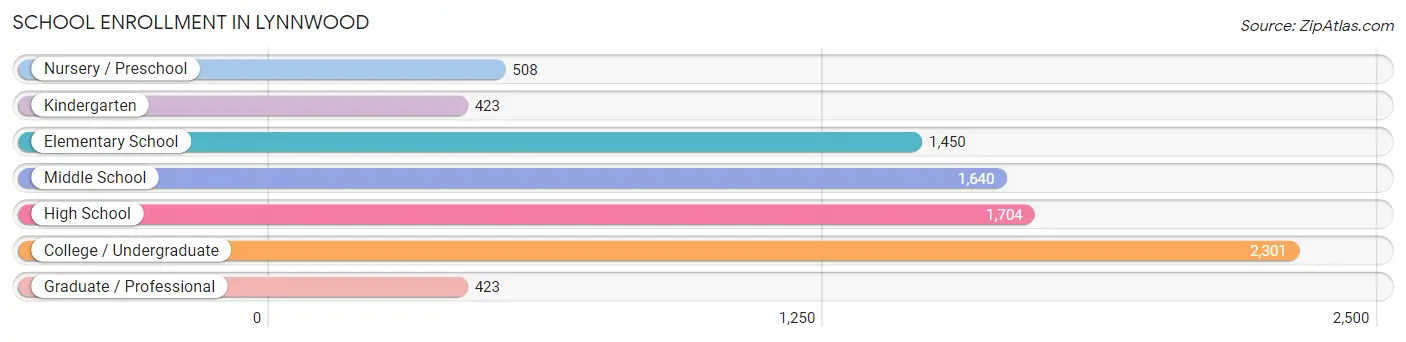
School Enrollment in Lynnwood
The most common levels of schooling among the 8,449 students in Lynnwood are college / undergraduate (2,301 | 27.2%), high school (1,704 | 20.2%), and middle school (1,640 | 19.4%).
| School Level | # Students | % Students |
| Nursery / Preschool | 508 | 6.0% |
| Kindergarten | 423 | 5.0% |
| Elementary School | 1,450 | 17.2% |
| Middle School | 1,640 | 19.4% |
| High School | 1,704 | 20.2% |
| College / Undergraduate | 2,301 | 27.2% |
| Graduate / Professional | 423 | 5.0% |
| Total | 8,449 | 100.0% |
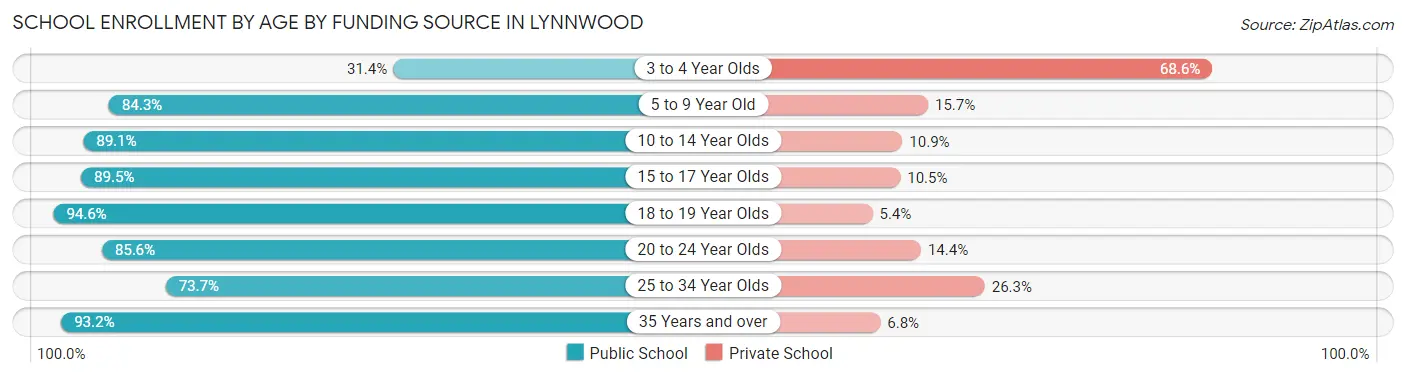
School Enrollment by Age by Funding Source in Lynnwood
Out of a total of 8,449 students who are enrolled in schools in Lynnwood, 1,293 (15.3%) attend a private institution, while the remaining 7,156 (84.7%) are enrolled in public schools. The age group of 3 to 4 year olds has the highest likelihood of being enrolled in private schools, with 256 (68.6% in the age bracket) enrolled. Conversely, the age group of 18 to 19 year olds has the lowest likelihood of being enrolled in a private school, with 633 (94.6% in the age bracket) attending a public institution.
| Age Bracket | Public School | Private School |
| 3 to 4 Year Olds | 117 (31.4%) | 256 (68.6%) |
| 5 to 9 Year Old | 1,588 (84.3%) | 296 (15.7%) |
| 10 to 14 Year Olds | 1,791 (89.1%) | 220 (10.9%) |
| 15 to 17 Year Olds | 1,061 (89.5%) | 125 (10.5%) |
| 18 to 19 Year Olds | 633 (94.6%) | 36 (5.4%) |
| 20 to 24 Year Olds | 731 (85.6%) | 123 (14.4%) |
| 25 to 34 Year Olds | 513 (73.7%) | 183 (26.3%) |
| 35 Years and over | 723 (93.2%) | 53 (6.8%) |
| Total | 7,156 (84.7%) | 1,293 (15.3%) |
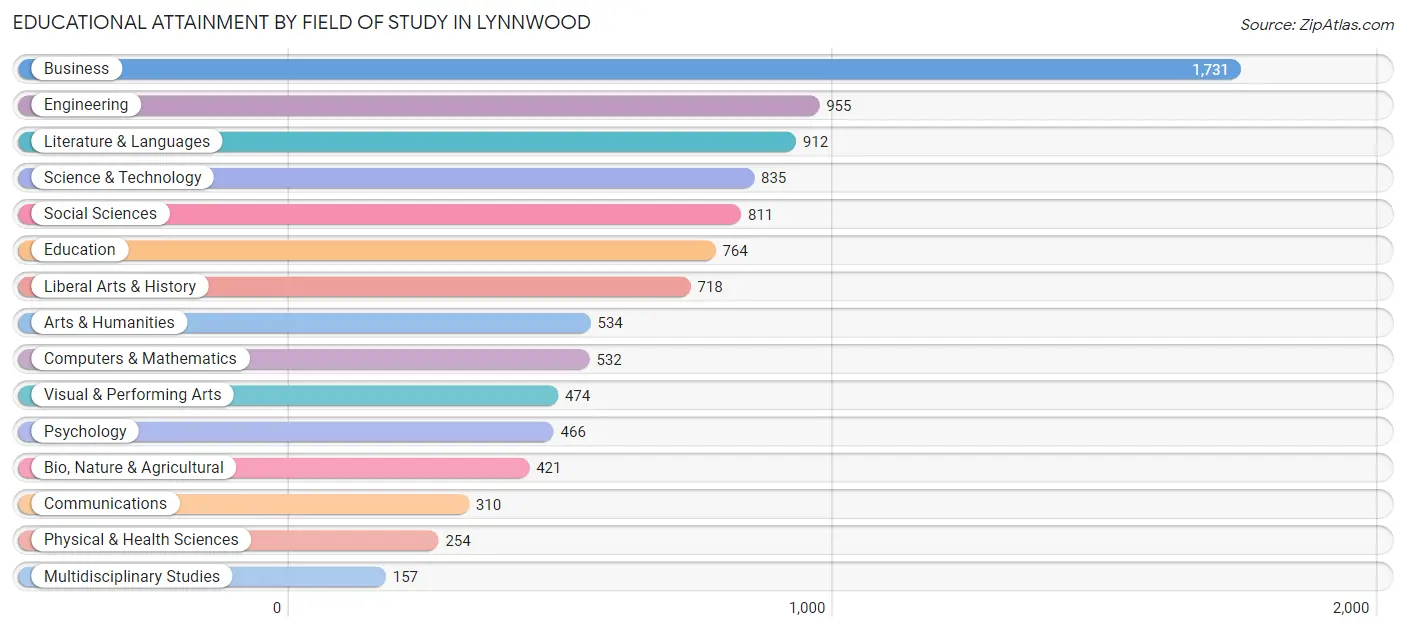
Educational Attainment by Field of Study in Lynnwood
Business (1,731 | 17.5%), engineering (955 | 9.7%), literature & languages (912 | 9.2%), science & technology (835 | 8.5%), and social sciences (811 | 8.2%) are the most common fields of study among 9,874 individuals in Lynnwood who have obtained a bachelor's degree or higher.
| Field of Study | # Graduates | % Graduates |
| Computers & Mathematics | 532 | 5.4% |
| Bio, Nature & Agricultural | 421 | 4.3% |
| Physical & Health Sciences | 254 | 2.6% |
| Psychology | 466 | 4.7% |
| Social Sciences | 811 | 8.2% |
| Engineering | 955 | 9.7% |
| Multidisciplinary Studies | 157 | 1.6% |
| Science & Technology | 835 | 8.5% |
| Business | 1,731 | 17.5% |
| Education | 764 | 7.7% |
| Literature & Languages | 912 | 9.2% |
| Liberal Arts & History | 718 | 7.3% |
| Visual & Performing Arts | 474 | 4.8% |
| Communications | 310 | 3.1% |
| Arts & Humanities | 534 | 5.4% |
| Total | 9,874 | 100.0% |
Transportation & Commute in Lynnwood
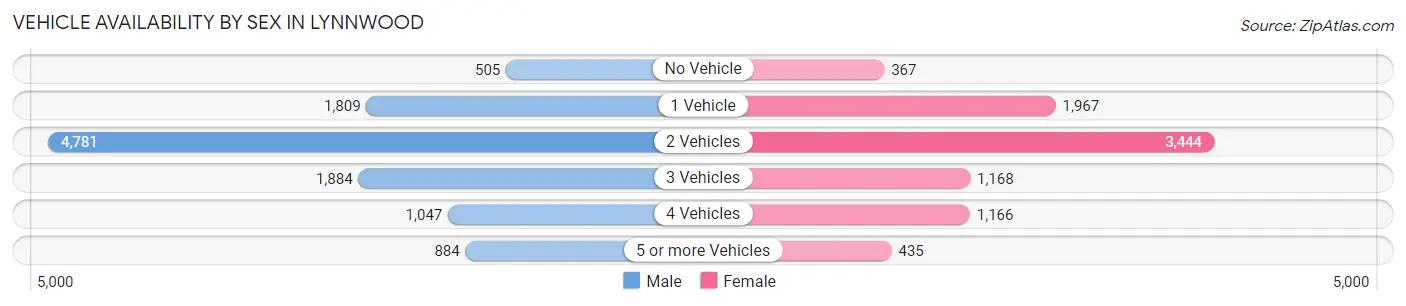
Vehicle Availability by Sex in Lynnwood
The most prevalent vehicle ownership categories in Lynnwood are males with 2 vehicles (4,781, accounting for 43.8%) and females with 2 vehicles (3,444, making up 55.9%).
| Vehicles Available | Male | Female |
| No Vehicle | 505 (4.6%) | 367 (4.3%) |
| 1 Vehicle | 1,809 (16.6%) | 1,967 (23.0%) |
| 2 Vehicles | 4,781 (43.8%) | 3,444 (40.3%) |
| 3 Vehicles | 1,884 (17.3%) | 1,168 (13.7%) |
| 4 Vehicles | 1,047 (9.6%) | 1,166 (13.6%) |
| 5 or more Vehicles | 884 (8.1%) | 435 (5.1%) |
| Total | 10,910 (100.0%) | 8,547 (100.0%) |
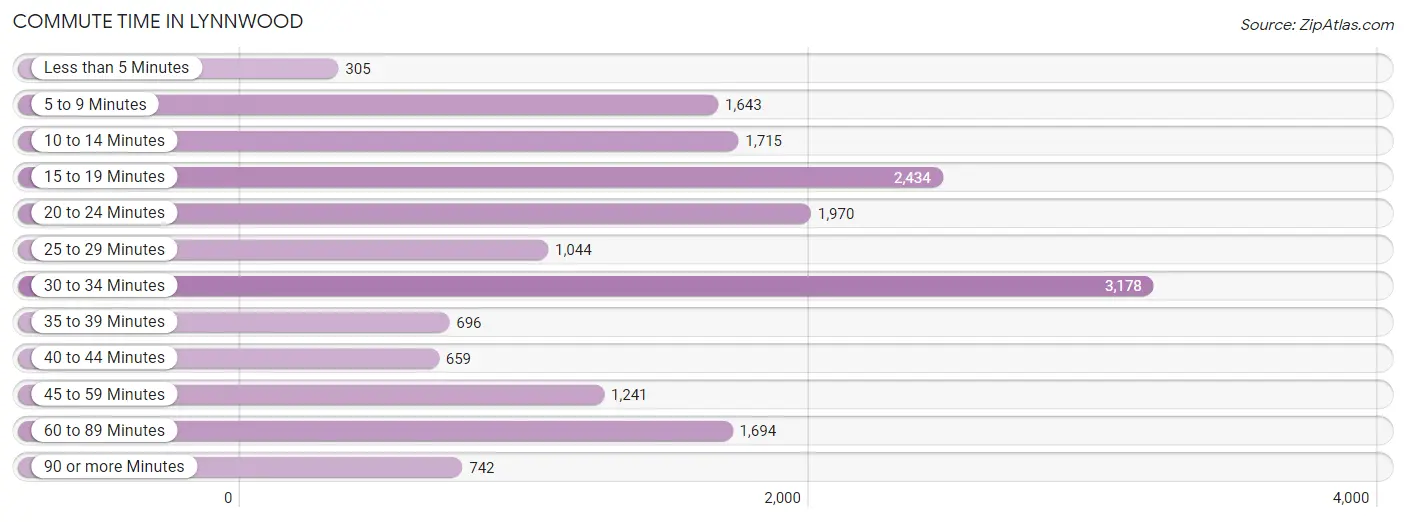
Commute Time in Lynnwood
The most frequently occuring commute durations in Lynnwood are 30 to 34 minutes (3,178 commuters, 18.3%), 15 to 19 minutes (2,434 commuters, 14.1%), and 20 to 24 minutes (1,970 commuters, 11.4%).
| Commute Time | # Commuters | % Commuters |
| Less than 5 Minutes | 305 | 1.8% |
| 5 to 9 Minutes | 1,643 | 9.5% |
| 10 to 14 Minutes | 1,715 | 9.9% |
| 15 to 19 Minutes | 2,434 | 14.1% |
| 20 to 24 Minutes | 1,970 | 11.4% |
| 25 to 29 Minutes | 1,044 | 6.0% |
| 30 to 34 Minutes | 3,178 | 18.3% |
| 35 to 39 Minutes | 696 | 4.0% |
| 40 to 44 Minutes | 659 | 3.8% |
| 45 to 59 Minutes | 1,241 | 7.2% |
| 60 to 89 Minutes | 1,694 | 9.8% |
| 90 or more Minutes | 742 | 4.3% |
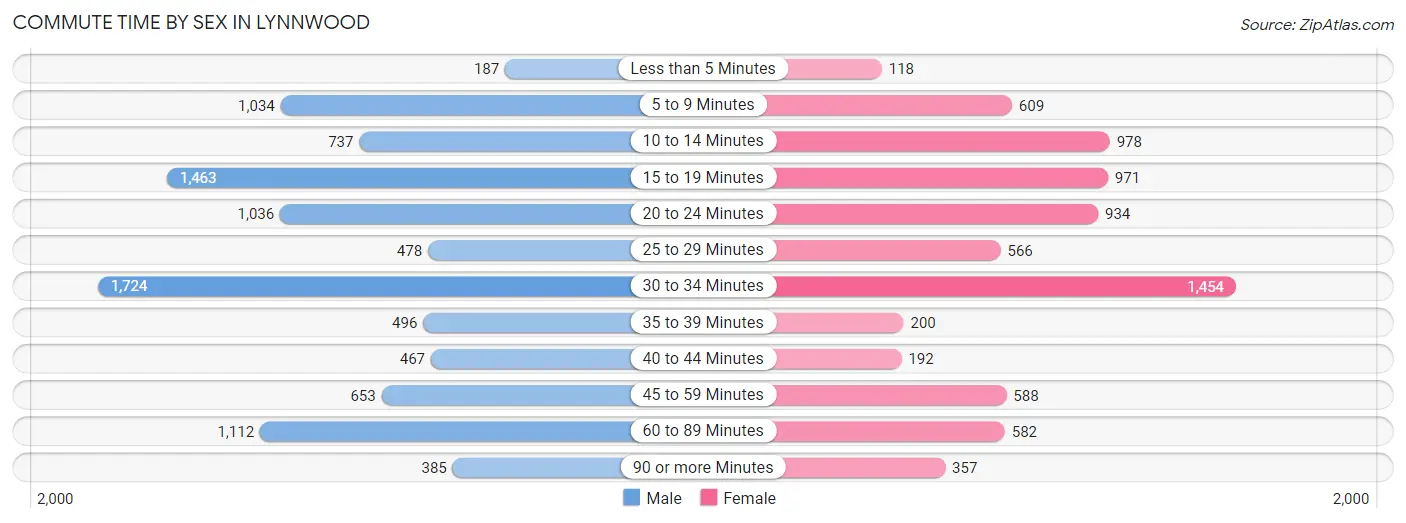
Commute Time by Sex in Lynnwood
The most common commute times in Lynnwood are 30 to 34 minutes (1,724 commuters, 17.6%) for males and 30 to 34 minutes (1,454 commuters, 19.3%) for females.
| Commute Time | Male | Female |
| Less than 5 Minutes | 187 (1.9%) | 118 (1.6%) |
| 5 to 9 Minutes | 1,034 (10.6%) | 609 (8.1%) |
| 10 to 14 Minutes | 737 (7.5%) | 978 (13.0%) |
| 15 to 19 Minutes | 1,463 (15.0%) | 971 (12.9%) |
| 20 to 24 Minutes | 1,036 (10.6%) | 934 (12.4%) |
| 25 to 29 Minutes | 478 (4.9%) | 566 (7.5%) |
| 30 to 34 Minutes | 1,724 (17.6%) | 1,454 (19.3%) |
| 35 to 39 Minutes | 496 (5.1%) | 200 (2.6%) |
| 40 to 44 Minutes | 467 (4.8%) | 192 (2.5%) |
| 45 to 59 Minutes | 653 (6.7%) | 588 (7.8%) |
| 60 to 89 Minutes | 1,112 (11.4%) | 582 (7.7%) |
| 90 or more Minutes | 385 (3.9%) | 357 (4.7%) |
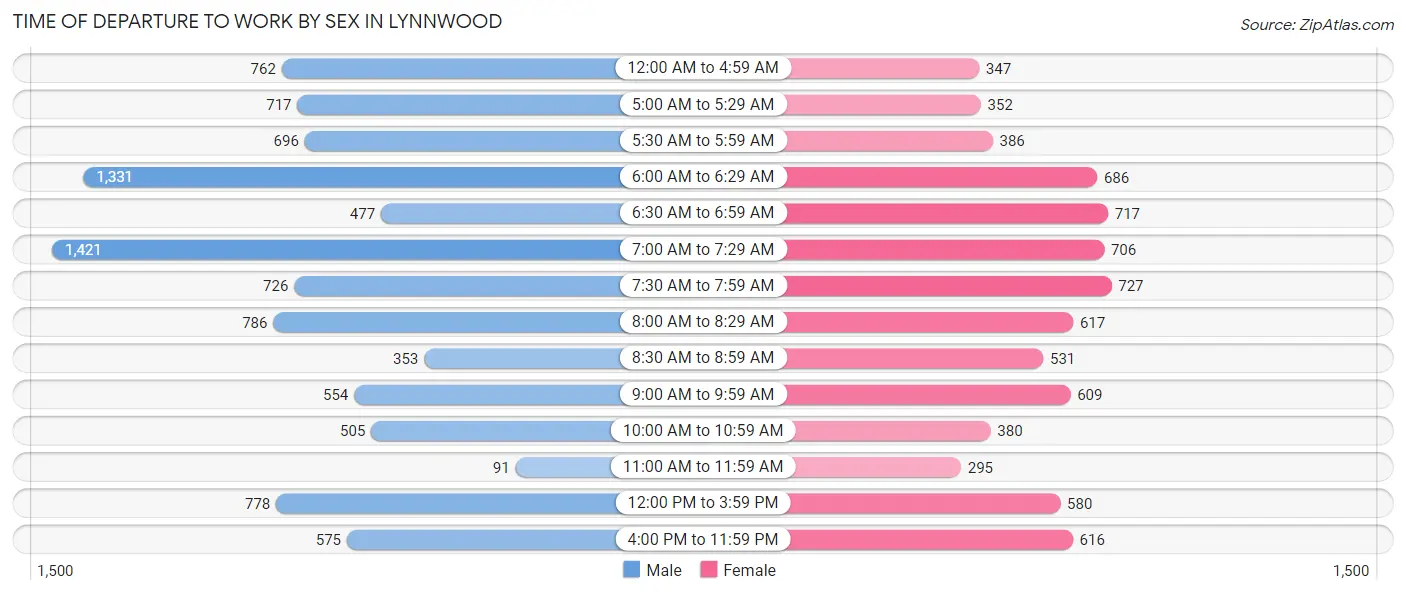
Time of Departure to Work by Sex in Lynnwood
The most frequent times of departure to work in Lynnwood are 7:00 AM to 7:29 AM (1,421, 14.5%) for males and 7:30 AM to 7:59 AM (727, 9.6%) for females.
| Time of Departure | Male | Female |
| 12:00 AM to 4:59 AM | 762 (7.8%) | 347 (4.6%) |
| 5:00 AM to 5:29 AM | 717 (7.3%) | 352 (4.7%) |
| 5:30 AM to 5:59 AM | 696 (7.1%) | 386 (5.1%) |
| 6:00 AM to 6:29 AM | 1,331 (13.6%) | 686 (9.1%) |
| 6:30 AM to 6:59 AM | 477 (4.9%) | 717 (9.5%) |
| 7:00 AM to 7:29 AM | 1,421 (14.5%) | 706 (9.3%) |
| 7:30 AM to 7:59 AM | 726 (7.4%) | 727 (9.6%) |
| 8:00 AM to 8:29 AM | 786 (8.0%) | 617 (8.2%) |
| 8:30 AM to 8:59 AM | 353 (3.6%) | 531 (7.0%) |
| 9:00 AM to 9:59 AM | 554 (5.7%) | 609 (8.1%) |
| 10:00 AM to 10:59 AM | 505 (5.2%) | 380 (5.0%) |
| 11:00 AM to 11:59 AM | 91 (0.9%) | 295 (3.9%) |
| 12:00 PM to 3:59 PM | 778 (8.0%) | 580 (7.7%) |
| 4:00 PM to 11:59 PM | 575 (5.9%) | 616 (8.2%) |
| Total | 9,772 (100.0%) | 7,549 (100.0%) |
Housing Occupancy in Lynnwood
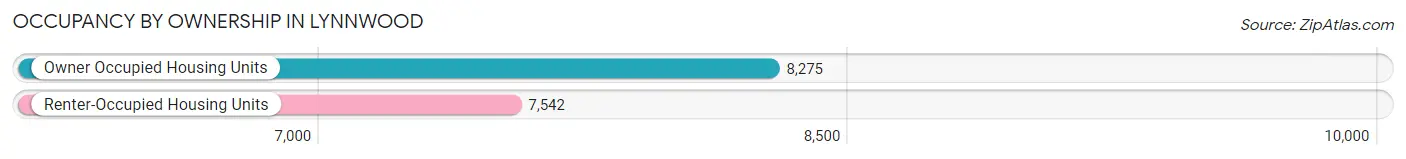
Occupancy by Ownership in Lynnwood
Of the total 15,817 dwellings in Lynnwood, owner-occupied units account for 8,275 (52.3%), while renter-occupied units make up 7,542 (47.7%).
| Occupancy | # Housing Units | % Housing Units |
| Owner Occupied Housing Units | 8,275 | 52.3% |
| Renter-Occupied Housing Units | 7,542 | 47.7% |
| Total Occupied Housing Units | 15,817 | 100.0% |
Occupancy by Household Size in Lynnwood
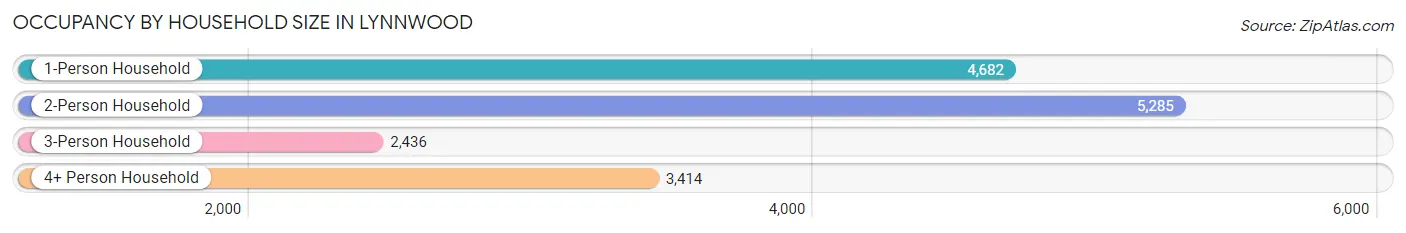
| Household Size | # Housing Units | % Housing Units |
| 1-Person Household | 4,682 | 29.6% |
| 2-Person Household | 5,285 | 33.4% |
| 3-Person Household | 2,436 | 15.4% |
| 4+ Person Household | 3,414 | 21.6% |
| Total Housing Units | 15,817 | 100.0% |
Occupancy by Ownership by Household Size in Lynnwood
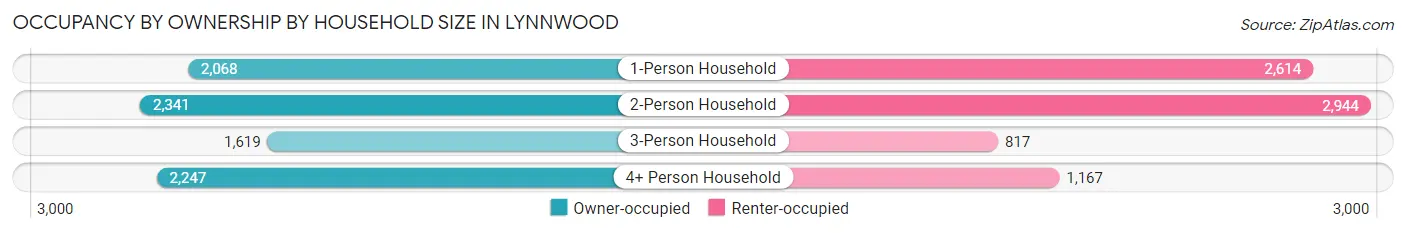
| Household Size | Owner-occupied | Renter-occupied |
| 1-Person Household | 2,068 (44.2%) | 2,614 (55.8%) |
| 2-Person Household | 2,341 (44.3%) | 2,944 (55.7%) |
| 3-Person Household | 1,619 (66.5%) | 817 (33.5%) |
| 4+ Person Household | 2,247 (65.8%) | 1,167 (34.2%) |
| Total Housing Units | 8,275 (52.3%) | 7,542 (47.7%) |
Occupancy by Educational Attainment in Lynnwood
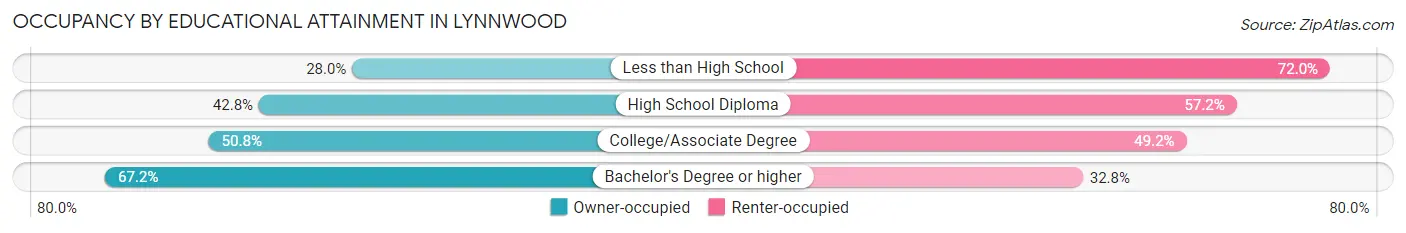
| Household Size | Owner-occupied | Renter-occupied |
| Less than High School | 540 (28.0%) | 1,386 (72.0%) |
| High School Diploma | 1,217 (42.8%) | 1,624 (57.2%) |
| College/Associate Degree | 2,817 (50.8%) | 2,728 (49.2%) |
| Bachelor's Degree or higher | 3,701 (67.2%) | 1,804 (32.8%) |
Occupancy by Age of Householder in Lynnwood
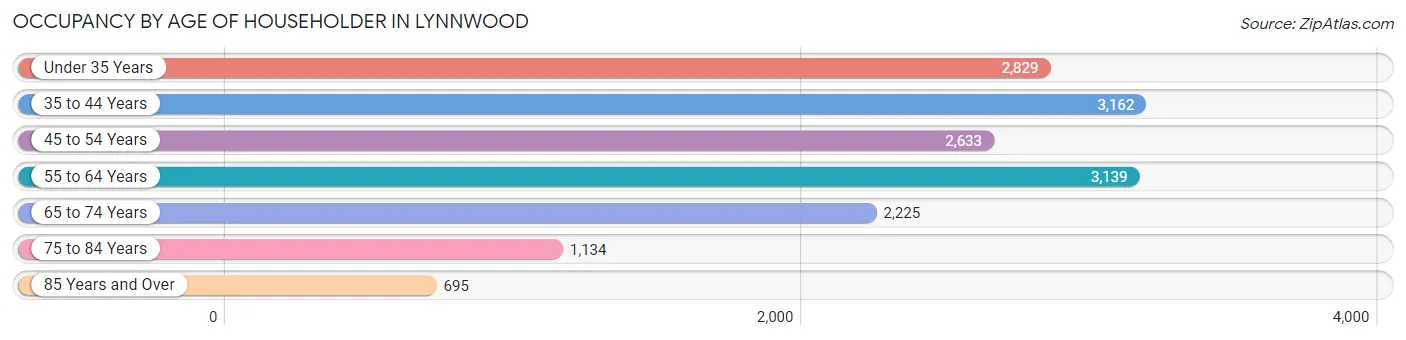
| Age Bracket | # Households | % Households |
| Under 35 Years | 2,829 | 17.9% |
| 35 to 44 Years | 3,162 | 20.0% |
| 45 to 54 Years | 2,633 | 16.7% |
| 55 to 64 Years | 3,139 | 19.9% |
| 65 to 74 Years | 2,225 | 14.1% |
| 75 to 84 Years | 1,134 | 7.2% |
| 85 Years and Over | 695 | 4.4% |
| Total | 15,817 | 100.0% |
Housing Finances in Lynnwood
Median Income by Occupancy in Lynnwood
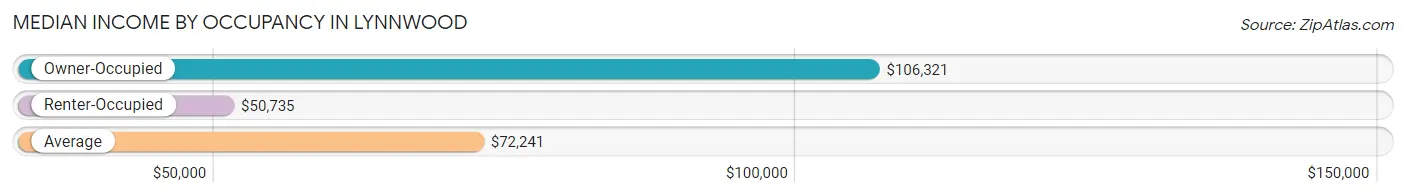
| Occupancy Type | # Households | Median Income |
| Owner-Occupied | 8,275 (52.3%) | $106,321 |
| Renter-Occupied | 7,542 (47.7%) | $50,735 |
| Average | 15,817 (100.0%) | $72,241 |
Occupancy by Householder Income Bracket in Lynnwood
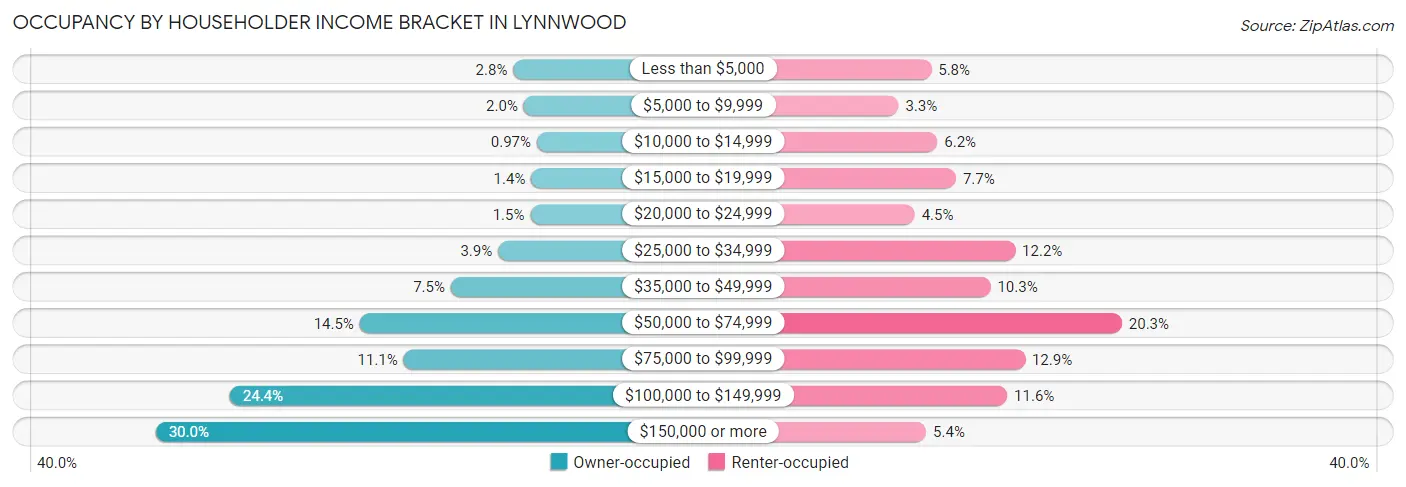
| Income Bracket | Owner-occupied | Renter-occupied |
| Less than $5,000 | 229 (2.8%) | 435 (5.8%) |
| $5,000 to $9,999 | 163 (2.0%) | 247 (3.3%) |
| $10,000 to $14,999 | 80 (1.0%) | 470 (6.2%) |
| $15,000 to $19,999 | 116 (1.4%) | 577 (7.6%) |
| $20,000 to $24,999 | 122 (1.5%) | 340 (4.5%) |
| $25,000 to $34,999 | 325 (3.9%) | 917 (12.2%) |
| $35,000 to $49,999 | 623 (7.5%) | 775 (10.3%) |
| $50,000 to $74,999 | 1,197 (14.5%) | 1,530 (20.3%) |
| $75,000 to $99,999 | 921 (11.1%) | 974 (12.9%) |
| $100,000 to $149,999 | 2,016 (24.4%) | 871 (11.6%) |
| $150,000 or more | 2,483 (30.0%) | 406 (5.4%) |
| Total | 8,275 (100.0%) | 7,542 (100.0%) |
Monthly Housing Cost Tiers in Lynnwood
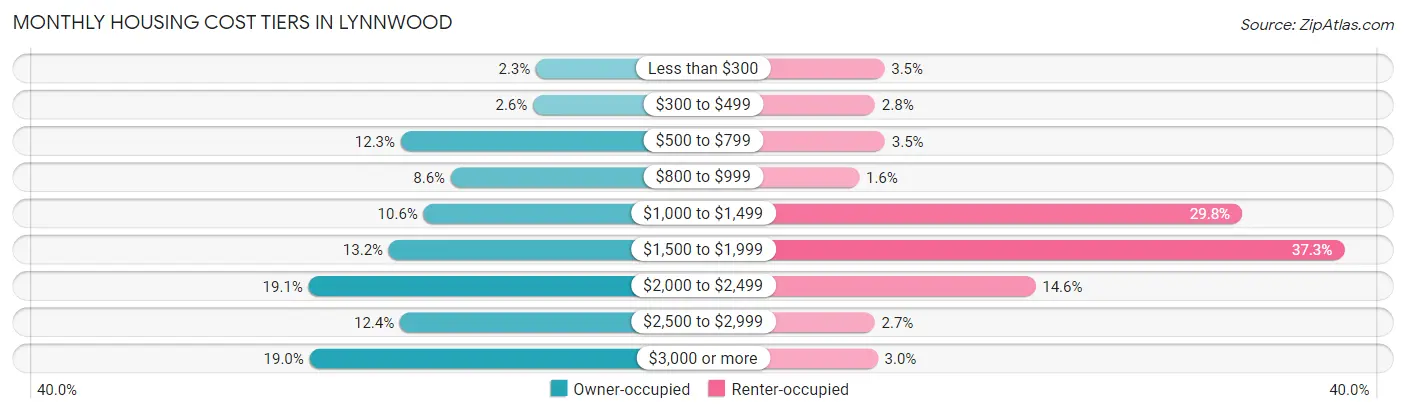
| Monthly Cost | Owner-occupied | Renter-occupied |
| Less than $300 | 193 (2.3%) | 260 (3.5%) |
| $300 to $499 | 211 (2.5%) | 208 (2.8%) |
| $500 to $799 | 1,017 (12.3%) | 263 (3.5%) |
| $800 to $999 | 712 (8.6%) | 120 (1.6%) |
| $1,000 to $1,499 | 878 (10.6%) | 2,247 (29.8%) |
| $1,500 to $1,999 | 1,090 (13.2%) | 2,814 (37.3%) |
| $2,000 to $2,499 | 1,579 (19.1%) | 1,099 (14.6%) |
| $2,500 to $2,999 | 1,022 (12.3%) | 207 (2.7%) |
| $3,000 or more | 1,573 (19.0%) | 223 (3.0%) |
| Total | 8,275 (100.0%) | 7,542 (100.0%) |
Physical Housing Characteristics in Lynnwood
Housing Structures in Lynnwood
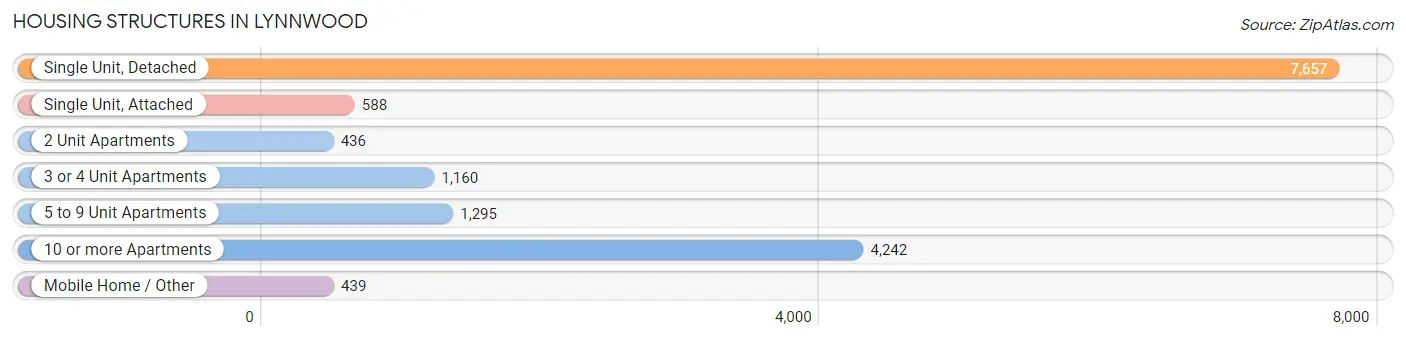
| Structure Type | # Housing Units | % Housing Units |
| Single Unit, Detached | 7,657 | 48.4% |
| Single Unit, Attached | 588 | 3.7% |
| 2 Unit Apartments | 436 | 2.8% |
| 3 or 4 Unit Apartments | 1,160 | 7.3% |
| 5 to 9 Unit Apartments | 1,295 | 8.2% |
| 10 or more Apartments | 4,242 | 26.8% |
| Mobile Home / Other | 439 | 2.8% |
| Total | 15,817 | 100.0% |
Housing Structures by Occupancy in Lynnwood
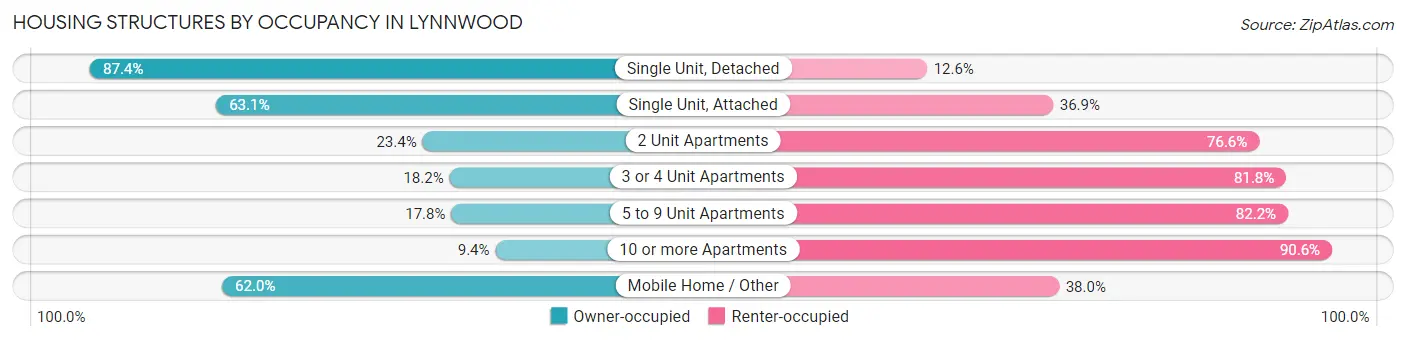
| Structure Type | Owner-occupied | Renter-occupied |
| Single Unit, Detached | 6,691 (87.4%) | 966 (12.6%) |
| Single Unit, Attached | 371 (63.1%) | 217 (36.9%) |
| 2 Unit Apartments | 102 (23.4%) | 334 (76.6%) |
| 3 or 4 Unit Apartments | 211 (18.2%) | 949 (81.8%) |
| 5 to 9 Unit Apartments | 231 (17.8%) | 1,064 (82.2%) |
| 10 or more Apartments | 397 (9.4%) | 3,845 (90.6%) |
| Mobile Home / Other | 272 (62.0%) | 167 (38.0%) |
| Total | 8,275 (52.3%) | 7,542 (47.7%) |
Housing Structures by Number of Rooms in Lynnwood
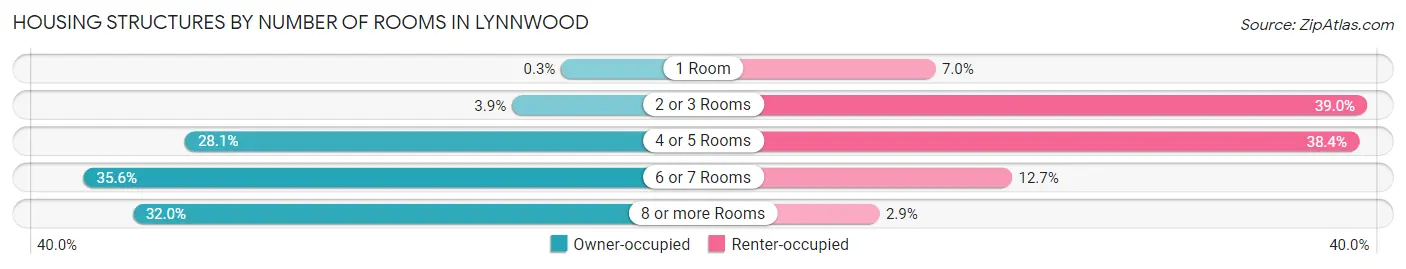
| Number of Rooms | Owner-occupied | Renter-occupied |
| 1 Room | 25 (0.3%) | 530 (7.0%) |
| 2 or 3 Rooms | 326 (3.9%) | 2,941 (39.0%) |
| 4 or 5 Rooms | 2,328 (28.1%) | 2,895 (38.4%) |
| 6 or 7 Rooms | 2,948 (35.6%) | 958 (12.7%) |
| 8 or more Rooms | 2,648 (32.0%) | 218 (2.9%) |
| Total | 8,275 (100.0%) | 7,542 (100.0%) |
Housing Structure by Heating Type in Lynnwood
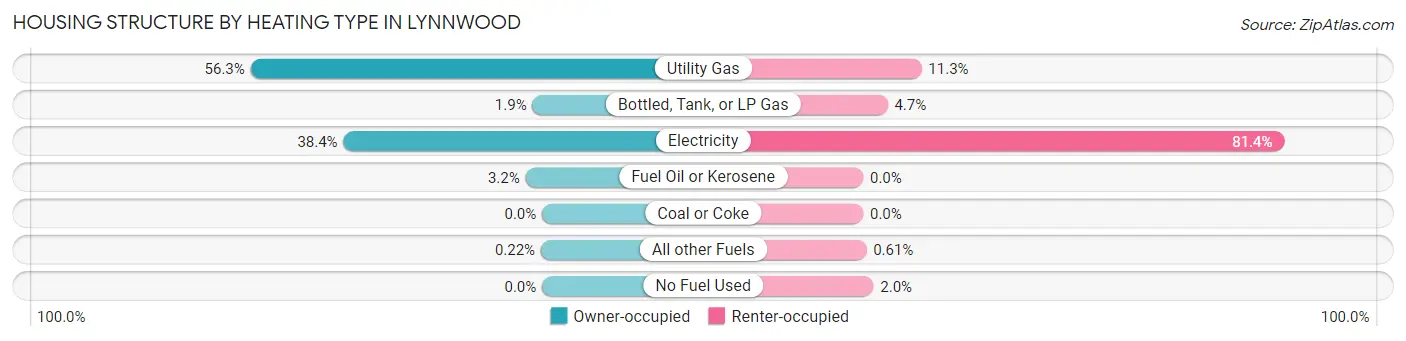
| Heating Type | Owner-occupied | Renter-occupied |
| Utility Gas | 4,661 (56.3%) | 851 (11.3%) |
| Bottled, Tank, or LP Gas | 154 (1.9%) | 356 (4.7%) |
| Electricity | 3,177 (38.4%) | 6,139 (81.4%) |
| Fuel Oil or Kerosene | 265 (3.2%) | 0 (0.0%) |
| Coal or Coke | 0 (0.0%) | 0 (0.0%) |
| All other Fuels | 18 (0.2%) | 46 (0.6%) |
| No Fuel Used | 0 (0.0%) | 150 (2.0%) |
| Total | 8,275 (100.0%) | 7,542 (100.0%) |
Household Vehicle Usage in Lynnwood
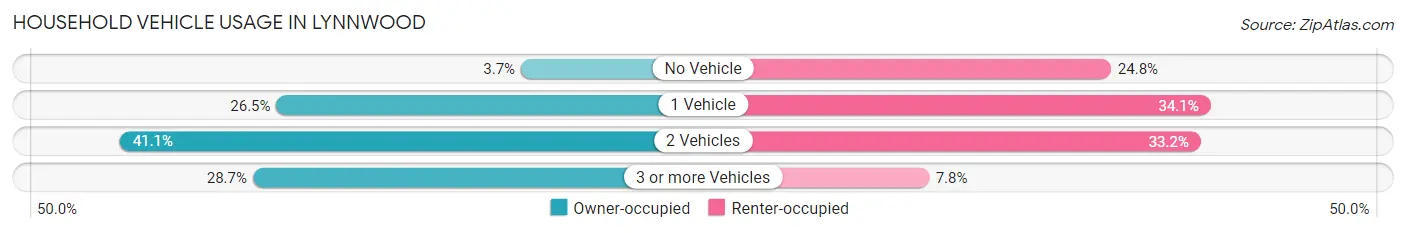
| Vehicles per Household | Owner-occupied | Renter-occupied |
| No Vehicle | 304 (3.7%) | 1,873 (24.8%) |
| 1 Vehicle | 2,193 (26.5%) | 2,574 (34.1%) |
| 2 Vehicles | 3,403 (41.1%) | 2,505 (33.2%) |
| 3 or more Vehicles | 2,375 (28.7%) | 590 (7.8%) |
| Total | 8,275 (100.0%) | 7,542 (100.0%) |
Real Estate & Mortgages in Lynnwood
Real Estate and Mortgage Overview in Lynnwood
| Characteristic | Without Mortgage | With Mortgage |
| Housing Units | 2,452 | 5,823 |
| Median Property Value | $519,400 | $621,600 |
| Median Household Income | $73,513 | $2,054 |
| Monthly Housing Costs | $768 | $1,573 |
| Real Estate Taxes | $4,418 | $175 |
Property Value by Mortgage Status in Lynnwood
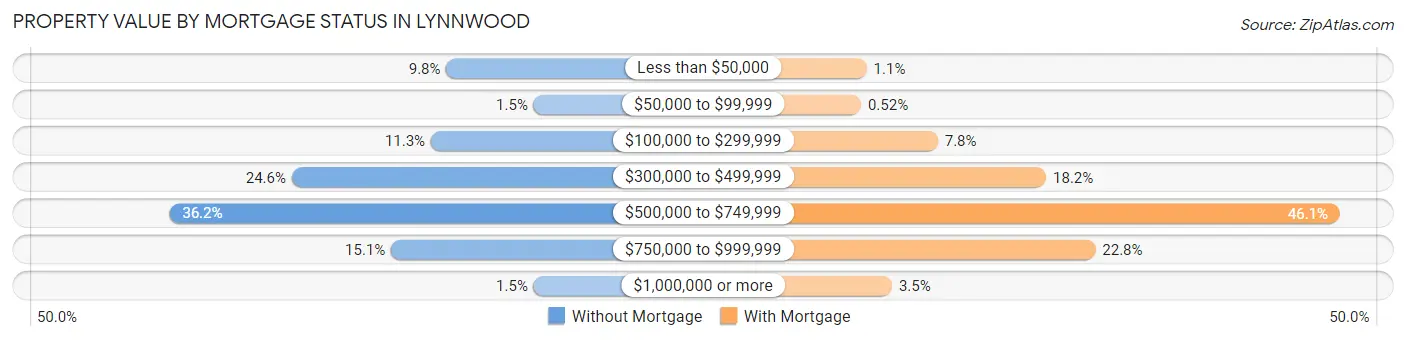
| Property Value | Without Mortgage | With Mortgage |
| Less than $50,000 | 241 (9.8%) | 62 (1.1%) |
| $50,000 to $99,999 | 37 (1.5%) | 30 (0.5%) |
| $100,000 to $299,999 | 277 (11.3%) | 456 (7.8%) |
| $300,000 to $499,999 | 602 (24.5%) | 1,057 (18.1%) |
| $500,000 to $749,999 | 888 (36.2%) | 2,686 (46.1%) |
| $750,000 to $999,999 | 370 (15.1%) | 1,330 (22.8%) |
| $1,000,000 or more | 37 (1.5%) | 202 (3.5%) |
| Total | 2,452 (100.0%) | 5,823 (100.0%) |
Household Income by Mortgage Status in Lynnwood
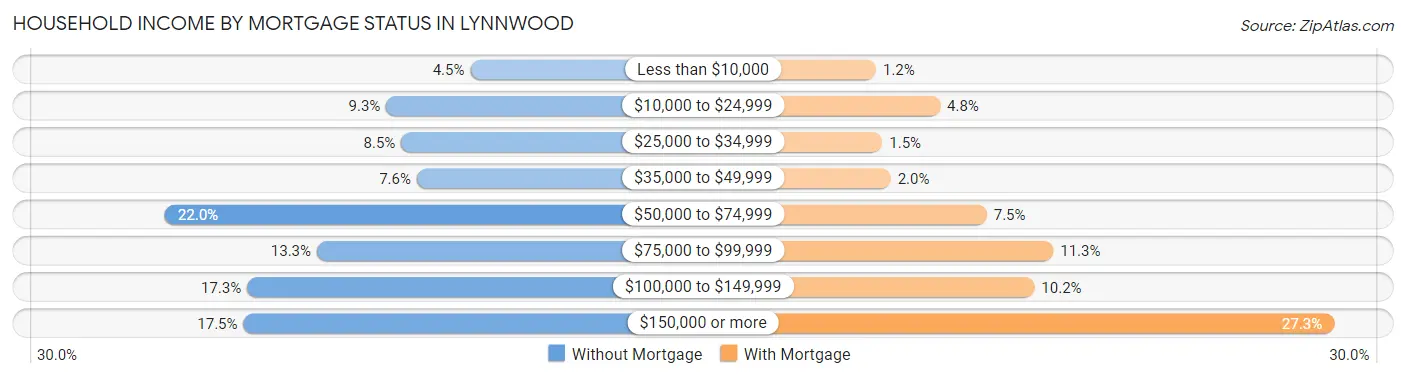
| Household Income | Without Mortgage | With Mortgage |
| Less than $10,000 | 111 (4.5%) | 68 (1.2%) |
| $10,000 to $24,999 | 229 (9.3%) | 281 (4.8%) |
| $25,000 to $34,999 | 208 (8.5%) | 89 (1.5%) |
| $35,000 to $49,999 | 186 (7.6%) | 117 (2.0%) |
| $50,000 to $74,999 | 539 (22.0%) | 437 (7.5%) |
| $75,000 to $99,999 | 326 (13.3%) | 658 (11.3%) |
| $100,000 to $149,999 | 424 (17.3%) | 595 (10.2%) |
| $150,000 or more | 429 (17.5%) | 1,592 (27.3%) |
| Total | 2,452 (100.0%) | 5,823 (100.0%) |
Property Value to Household Income Ratio in Lynnwood
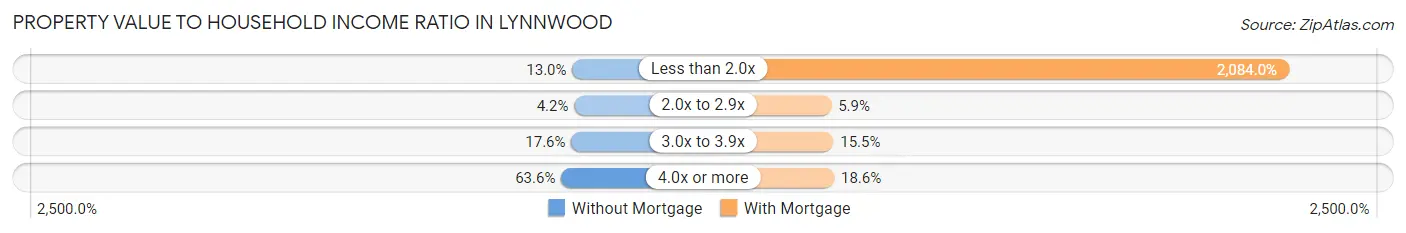
| Value-to-Income Ratio | Without Mortgage | With Mortgage |
| Less than 2.0x | 319 (13.0%) | 121,349 (2,084.0%) |
| 2.0x to 2.9x | 104 (4.2%) | 341 (5.9%) |
| 3.0x to 3.9x | 431 (17.6%) | 900 (15.5%) |
| 4.0x or more | 1,559 (63.6%) | 1,080 (18.5%) |
| Total | 2,452 (100.0%) | 5,823 (100.0%) |
Real Estate Taxes by Mortgage Status in Lynnwood
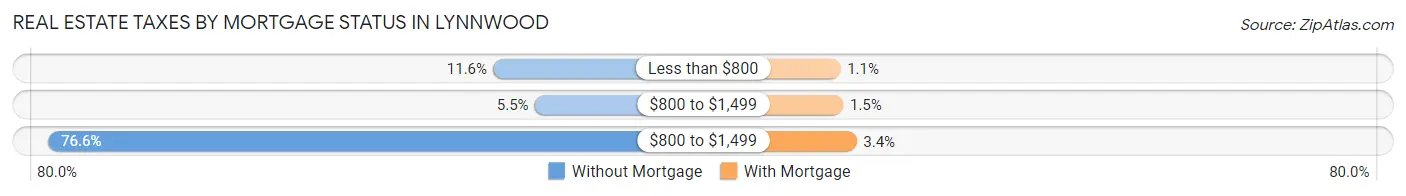
| Property Taxes | Without Mortgage | With Mortgage |
| Less than $800 | 284 (11.6%) | 61 (1.1%) |
| $800 to $1,499 | 135 (5.5%) | 85 (1.5%) |
| $800 to $1,499 | 1,877 (76.5%) | 198 (3.4%) |
| Total | 2,452 (100.0%) | 5,823 (100.0%) |
Health & Disability in Lynnwood
Health Insurance Coverage by Age in Lynnwood
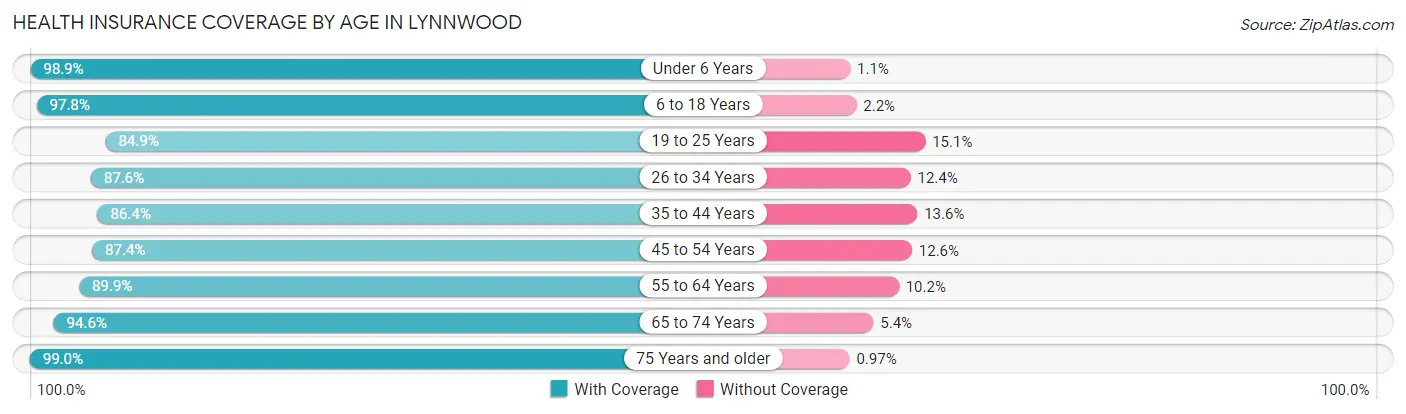
| Age Bracket | With Coverage | Without Coverage |
| Under 6 Years | 2,936 (98.9%) | 32 (1.1%) |
| 6 to 18 Years | 5,106 (97.8%) | 117 (2.2%) |
| 19 to 25 Years | 2,818 (84.9%) | 501 (15.1%) |
| 26 to 34 Years | 4,813 (87.6%) | 679 (12.4%) |
| 35 to 44 Years | 4,962 (86.4%) | 781 (13.6%) |
| 45 to 54 Years | 4,495 (87.4%) | 648 (12.6%) |
| 55 to 64 Years | 4,577 (89.8%) | 517 (10.2%) |
| 65 to 74 Years | 3,489 (94.6%) | 200 (5.4%) |
| 75 Years and older | 2,856 (99.0%) | 28 (1.0%) |
| Total | 36,052 (91.1%) | 3,503 (8.9%) |
Health Insurance Coverage by Citizenship Status in Lynnwood
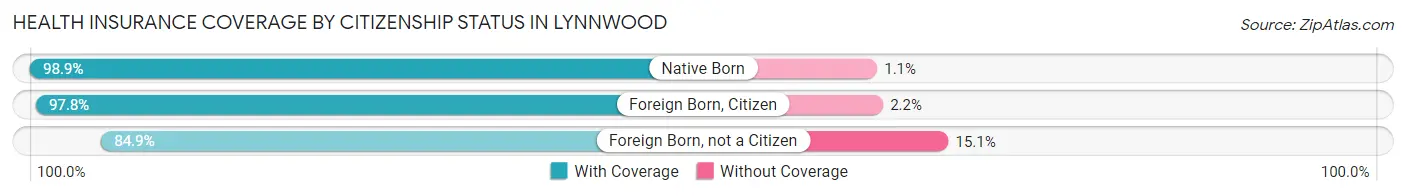
| Citizenship Status | With Coverage | Without Coverage |
| Native Born | 2,936 (98.9%) | 32 (1.1%) |
| Foreign Born, Citizen | 5,106 (97.8%) | 117 (2.2%) |
| Foreign Born, not a Citizen | 2,818 (84.9%) | 501 (15.1%) |
Health Insurance Coverage by Household Income in Lynnwood
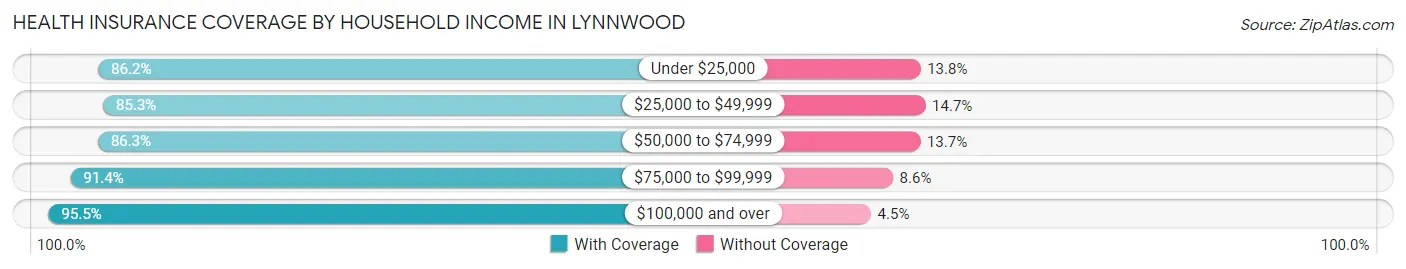
| Household Income | With Coverage | Without Coverage |
| Under $25,000 | 4,500 (86.2%) | 718 (13.8%) |
| $25,000 to $49,999 | 3,907 (85.3%) | 672 (14.7%) |
| $50,000 to $74,999 | 5,547 (86.3%) | 881 (13.7%) |
| $75,000 to $99,999 | 4,053 (91.4%) | 381 (8.6%) |
| $100,000 and over | 17,536 (95.5%) | 820 (4.5%) |
Public vs Private Health Insurance Coverage by Age in Lynnwood
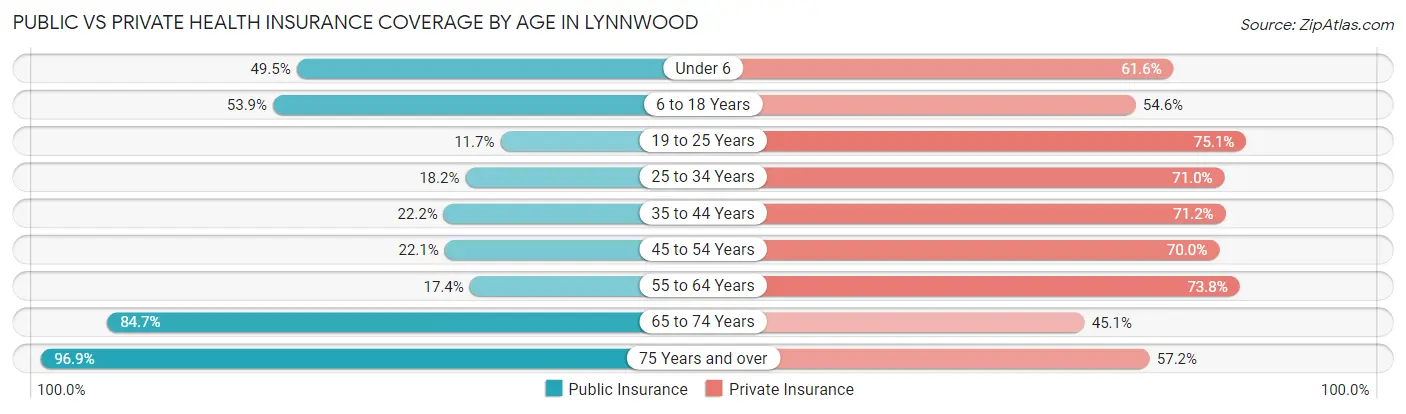
| Age Bracket | Public Insurance | Private Insurance |
| Under 6 | 1,470 (49.5%) | 1,827 (61.6%) |
| 6 to 18 Years | 2,816 (53.9%) | 2,851 (54.6%) |
| 19 to 25 Years | 389 (11.7%) | 2,491 (75.0%) |
| 25 to 34 Years | 1,000 (18.2%) | 3,900 (71.0%) |
| 35 to 44 Years | 1,277 (22.2%) | 4,089 (71.2%) |
| 45 to 54 Years | 1,134 (22.1%) | 3,601 (70.0%) |
| 55 to 64 Years | 887 (17.4%) | 3,760 (73.8%) |
| 65 to 74 Years | 3,123 (84.7%) | 1,664 (45.1%) |
| 75 Years and over | 2,795 (96.9%) | 1,649 (57.2%) |
| Total | 14,891 (37.7%) | 25,832 (65.3%) |
Disability Status by Sex by Age in Lynnwood
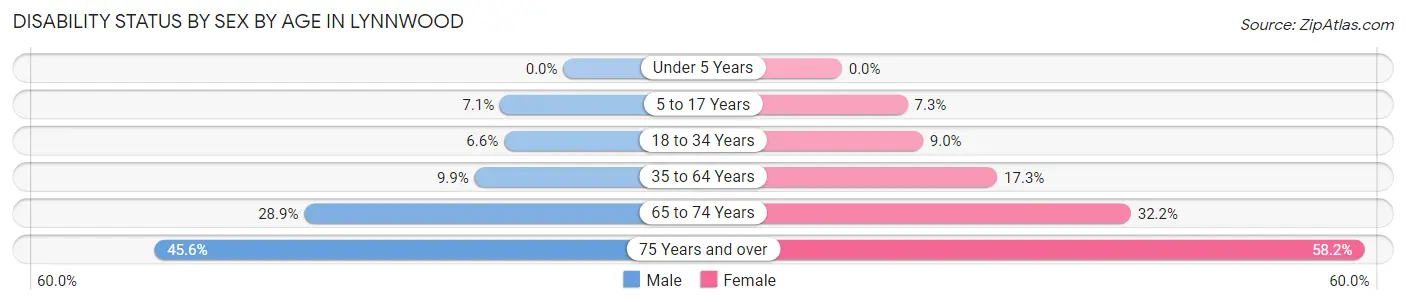
| Age Bracket | Male | Female |
| Under 5 Years | 0 (0.0%) | 0 (0.0%) |
| 5 to 17 Years | 187 (7.0%) | 191 (7.3%) |
| 18 to 34 Years | 320 (6.6%) | 399 (9.0%) |
| 35 to 64 Years | 810 (9.9%) | 1,348 (17.3%) |
| 65 to 74 Years | 436 (28.9%) | 701 (32.2%) |
| 75 Years and over | 498 (45.6%) | 1,042 (58.2%) |
Disability Class by Sex by Age in Lynnwood
Disability Class: Hearing Difficulty
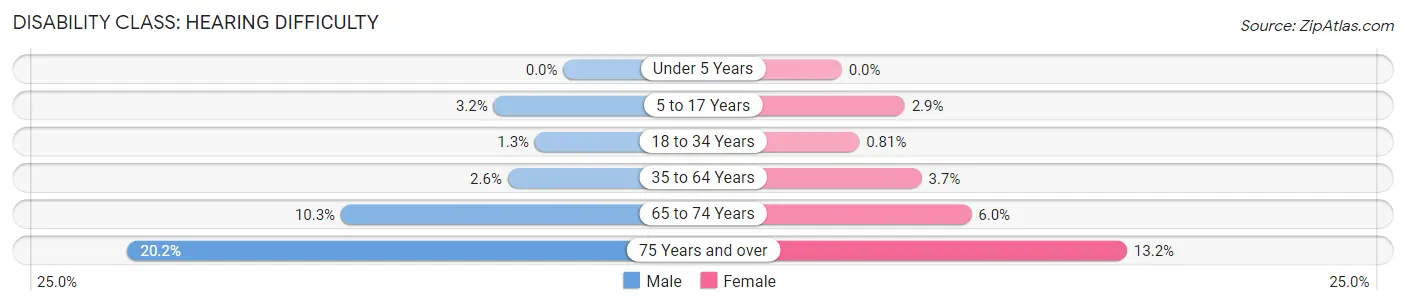
| Age Bracket | Male | Female |
| Under 5 Years | 0 (0.0%) | 0 (0.0%) |
| 5 to 17 Years | 86 (3.2%) | 76 (2.9%) |
| 18 to 34 Years | 64 (1.3%) | 36 (0.8%) |
| 35 to 64 Years | 211 (2.6%) | 288 (3.7%) |
| 65 to 74 Years | 156 (10.3%) | 131 (6.0%) |
| 75 Years and over | 221 (20.2%) | 237 (13.2%) |
Disability Class: Vision Difficulty
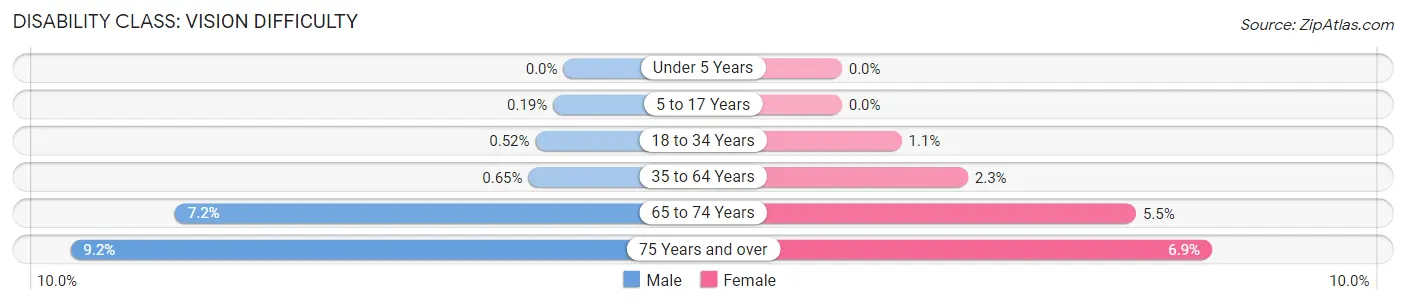
| Age Bracket | Male | Female |
| Under 5 Years | 0 (0.0%) | 0 (0.0%) |
| 5 to 17 Years | 5 (0.2%) | 0 (0.0%) |
| 18 to 34 Years | 25 (0.5%) | 49 (1.1%) |
| 35 to 64 Years | 53 (0.6%) | 182 (2.3%) |
| 65 to 74 Years | 109 (7.2%) | 119 (5.5%) |
| 75 Years and over | 100 (9.1%) | 123 (6.9%) |
Disability Class: Cognitive Difficulty
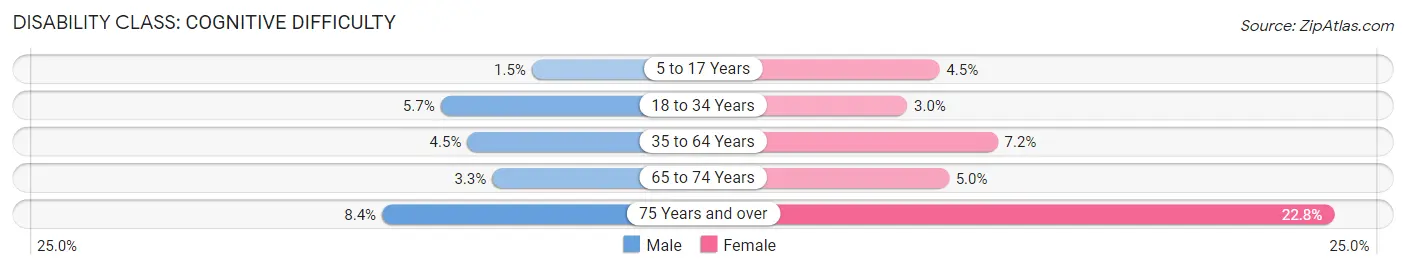
| Age Bracket | Male | Female |
| 5 to 17 Years | 39 (1.5%) | 118 (4.5%) |
| 18 to 34 Years | 276 (5.7%) | 134 (3.0%) |
| 35 to 64 Years | 365 (4.5%) | 563 (7.2%) |
| 65 to 74 Years | 50 (3.3%) | 108 (5.0%) |
| 75 Years and over | 92 (8.4%) | 409 (22.8%) |
Disability Class: Ambulatory Difficulty
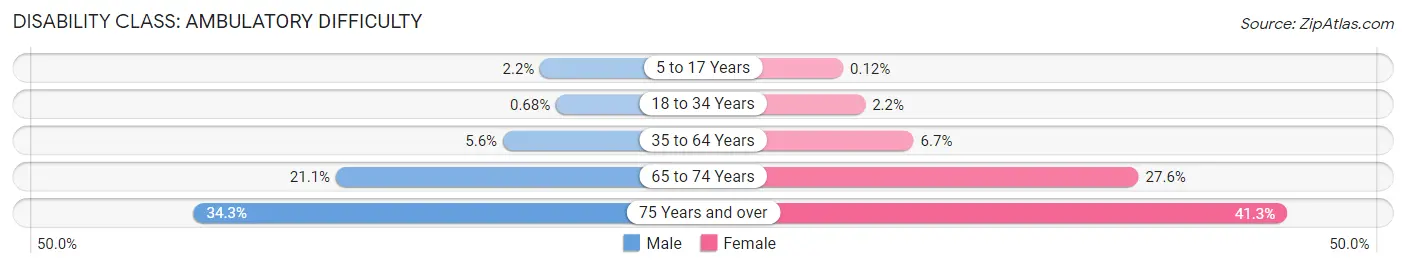
| Age Bracket | Male | Female |
| 5 to 17 Years | 57 (2.1%) | 3 (0.1%) |
| 18 to 34 Years | 33 (0.7%) | 96 (2.2%) |
| 35 to 64 Years | 459 (5.6%) | 520 (6.7%) |
| 65 to 74 Years | 319 (21.1%) | 600 (27.6%) |
| 75 Years and over | 375 (34.3%) | 740 (41.3%) |
Disability Class: Self-Care Difficulty
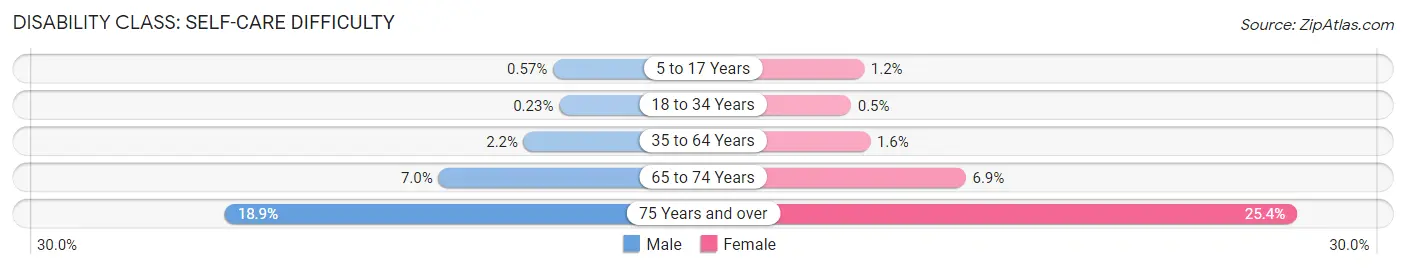
| Age Bracket | Male | Female |
| 5 to 17 Years | 15 (0.6%) | 32 (1.2%) |
| 18 to 34 Years | 11 (0.2%) | 22 (0.5%) |
| 35 to 64 Years | 180 (2.2%) | 122 (1.6%) |
| 65 to 74 Years | 105 (7.0%) | 150 (6.9%) |
| 75 Years and over | 206 (18.9%) | 454 (25.4%) |
Technology Access in Lynnwood
Computing Device Access in Lynnwood
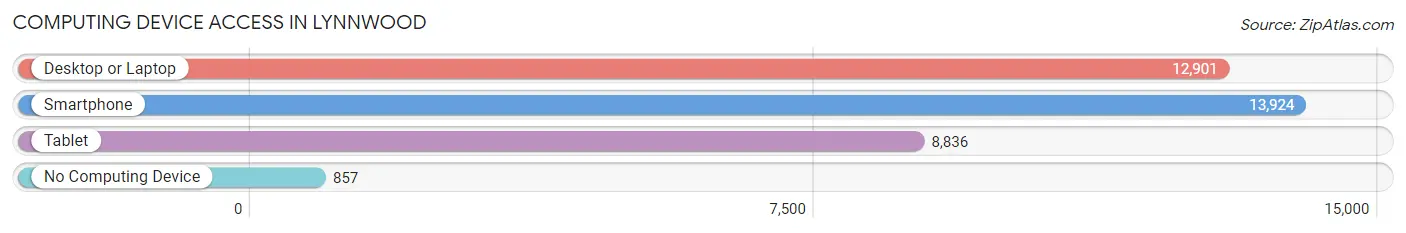
| Device Type | # Households | % Households |
| Desktop or Laptop | 12,901 | 81.6% |
| Smartphone | 13,924 | 88.0% |
| Tablet | 8,836 | 55.9% |
| No Computing Device | 857 | 5.4% |
| Total | 15,817 | 100.0% |
Internet Access in Lynnwood
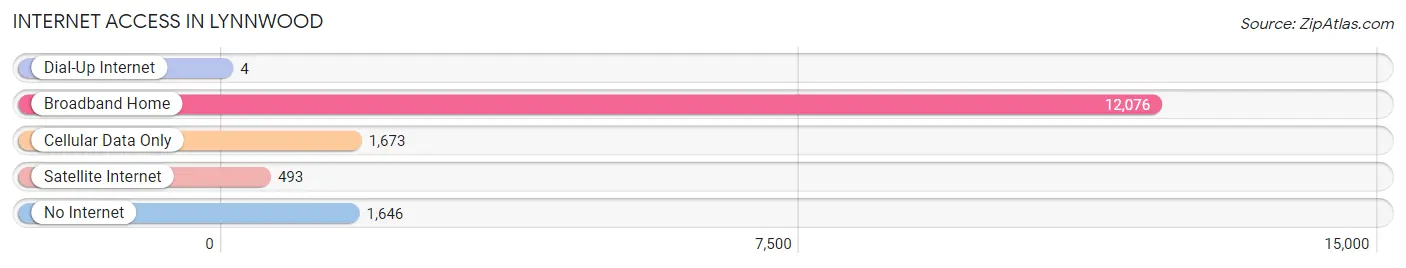
| Internet Type | # Households | % Households |
| Dial-Up Internet | 4 | 0.0% |
| Broadband Home | 12,076 | 76.3% |
| Cellular Data Only | 1,673 | 10.6% |
| Satellite Internet | 493 | 3.1% |
| No Internet | 1,646 | 10.4% |
| Total | 15,817 | 100.0% |
Lynnwood Summary
Lynnwood, Washington is a city located in Snohomish County, Washington, United States. It is situated approximately 20 miles north of Seattle and is part of the Seattle metropolitan area. As of the 2010 census, the city had a population of 35,836, making it the fourth largest city in Snohomish County.
History
The area that is now Lynnwood was originally inhabited by the Snohomish and Snoqualmie Native American tribes. The first European settlers arrived in the area in the late 1800s, and the area was officially incorporated as the city of Lynnwood in 1959.
The city was named after Lynnwood Larson, a local businessman who owned a large tract of land in the area. The city was initially developed as a residential suburb of Seattle, and it experienced rapid growth in the 1960s and 1970s.
Geography
Lynnwood is located in the western part of Snohomish County, Washington, at the intersection of Interstate 5 and Interstate 405. It is situated approximately 20 miles north of Seattle and is part of the Seattle metropolitan area.
The city has a total area of 8.7 square miles, of which 8.6 square miles is land and 0.1 square miles is water. The city is located in the Puget Sound lowlands, and its elevation is approximately 200 feet above sea level.
Economy
The economy of Lynnwood is largely based on retail, services, and light manufacturing. The city is home to several large retail centers, including Alderwood Mall, which is the largest shopping mall in Snohomish County.
The city is also home to several corporate headquarters, including Boeing, Microsoft, and Amazon. In addition, the city is home to several medical centers, including Swedish Medical Center and Providence Regional Medical Center.
Demographics
As of the 2010 census, the city had a population of 35,836. The racial makeup of the city was 68.2% White, 8.3% African American, 0.7% Native American, 11.3% Asian, 0.3% Pacific Islander, 5.2% from other races, and 6.2% from two or more races. Hispanic or Latino of any race were 11.7% of the population.
The median income for a household in the city was $60,945, and the median income for a family was $71,845. The per capita income for the city was $27,845. About 8.2% of families and 10.7% of the population were below the poverty line, including 14.2% of those under age 18 and 6.2% of those age 65 or over.
Common Questions
What is Per Capita Income in Lynnwood?
Per Capita income in Lynnwood is $37,758.
What is the Median Family Income in Lynnwood?
Median Family Income in Lynnwood is $93,216.
What is the Median Household income in Lynnwood?
Median Household Income in Lynnwood is $72,241.
What is Income or Wage Gap in Lynnwood?
Income or Wage Gap in Lynnwood is 27.8%.
Women in Lynnwood earn 72.2 cents for every dollar earned by a man.
What is Family Income Deficit in Lynnwood?
Family Income Deficit in Lynnwood is $11,301.
Families that are below poverty line in Lynnwood earn $11,301 less on average than the poverty threshold level.
What is Inequality or Gini Index in Lynnwood?
Inequality or Gini Index in Lynnwood is 0.44.
What is the Total Population of Lynnwood?
Total Population of Lynnwood is 39,867.
What is the Total Male Population of Lynnwood?
Total Male Population of Lynnwood is 19,523.
What is the Total Female Population of Lynnwood?
Total Female Population of Lynnwood is 20,344.
What is the Ratio of Males per 100 Females in Lynnwood?
There are 95.96 Males per 100 Females in Lynnwood.
What is the Ratio of Females per 100 Males in Lynnwood?
There are 104.21 Females per 100 Males in Lynnwood.
What is the Median Population Age in Lynnwood?
Median Population Age in Lynnwood is 39.3 Years.
What is the Average Family Size in Lynnwood
Average Family Size in Lynnwood is 3.1 People.
What is the Average Household Size in Lynnwood
Average Household Size in Lynnwood is 2.5 People.
How Large is the Labor Force in Lynnwood?
There are 21,068 People in the Labor Forcein in Lynnwood.
What is the Percentage of People in the Labor Force in Lynnwood?
64.1% of People are in the Labor Force in Lynnwood.
What is the Unemployment Rate in Lynnwood?
Unemployment Rate in Lynnwood is 4.1%.