Pasadena, CA Map & Demographics
Pasadena Map
Pasadena Overview
$59,655
PER CAPITA INCOME
$129,119
AVG FAMILY INCOME
$97,818
AVG HOUSEHOLD INCOME
12.9%
WAGE / INCOME GAP [ % ]
87.1¢/ $1
WAGE / INCOME GAP [ $ ]
$11,650
FAMILY INCOME DEFICIT
0.51
INEQUALITY / GINI INDEX
137,554
TOTAL POPULATION
67,594
MALE POPULATION
69,960
FEMALE POPULATION
96.62
MALES / 100 FEMALES
103.50
FEMALES / 100 MALES
39.9
MEDIAN AGE
3.1
AVG FAMILY SIZE
2.4
AVG HOUSEHOLD SIZE
77,930
LABOR FORCE [ PEOPLE ]
66.9%
PERCENT IN LABOR FORCE
5.2%
UNEMPLOYMENT RATE
Income in Pasadena
Income Overview in Pasadena
Per Capita Income in Pasadena is $59,655, while median incomes of families and households are $129,119 and $97,818 respectively.
| Characteristic | Number | Measure |
| Per Capita Income | 137,554 | $59,655 |
| Median Family Income | 30,590 | $129,119 |
| Mean Family Income | 30,590 | $177,834 |
| Median Household Income | 56,076 | $97,818 |
| Mean Household Income | 56,076 | $142,697 |
| Income Deficit | 30,590 | $11,650 |
| Wage / Income Gap (%) | 137,554 | 12.94% |
| Wage / Income Gap ($) | 137,554 | 87.06¢ per $1 |
| Gini / Inequality Index | 137,554 | 0.51 |
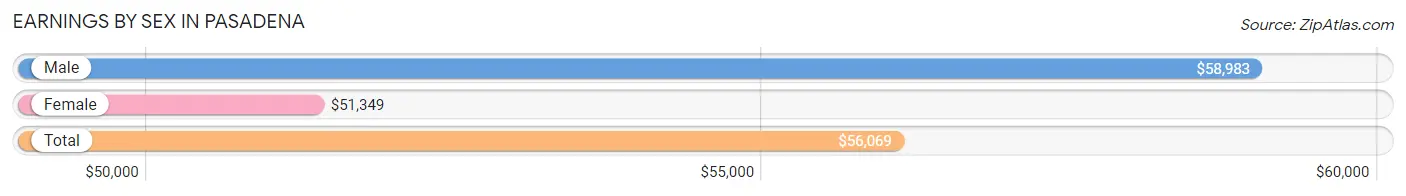
Earnings by Sex in Pasadena
Average Earnings in Pasadena are $56,069, $58,983 for men and $51,349 for women, a difference of 12.9%.
| Sex | Number | Average Earnings |
| Male | 42,119 (52.6%) | $58,983 |
| Female | 37,952 (47.4%) | $51,349 |
| Total | 80,071 (100.0%) | $56,069 |
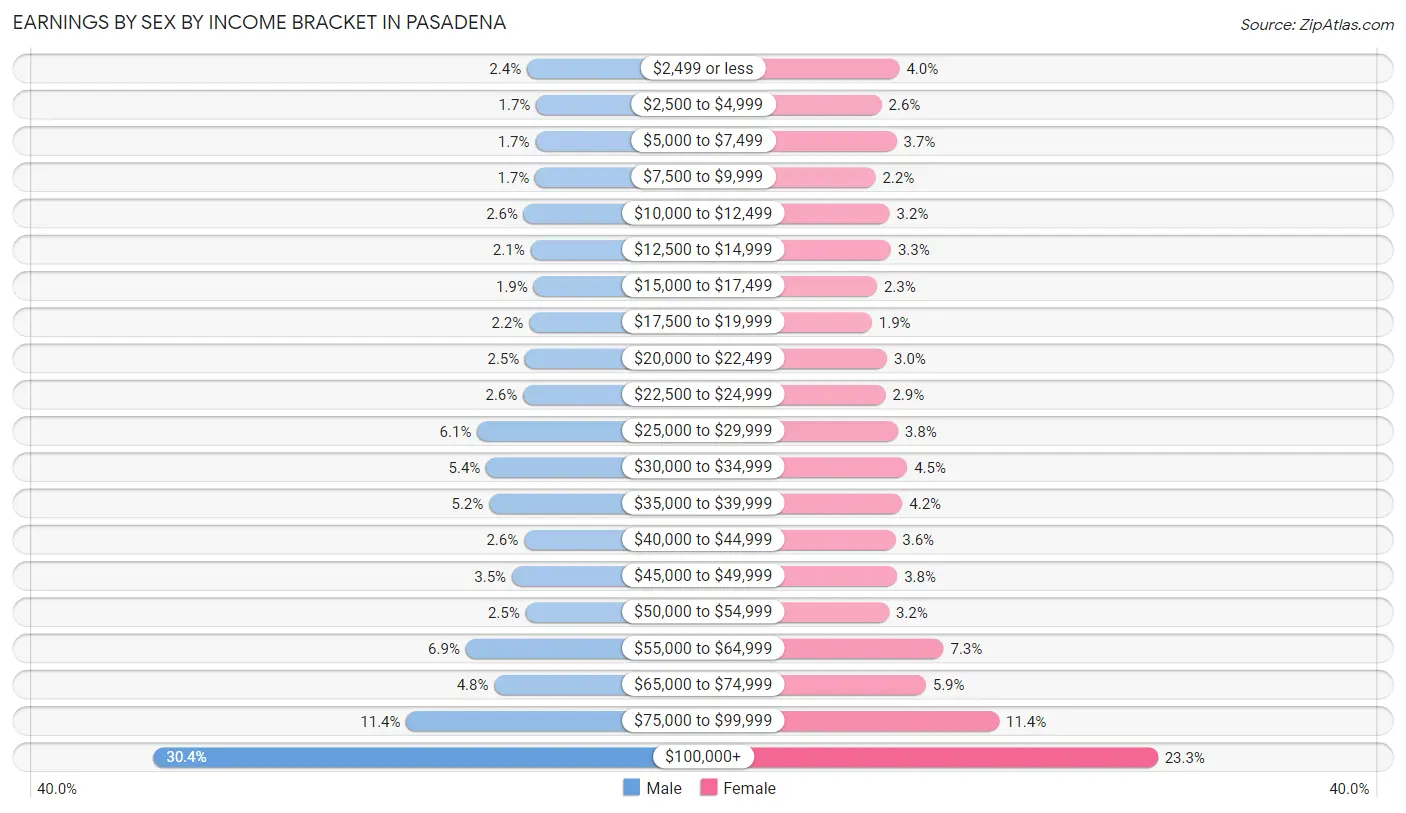
Earnings by Sex by Income Bracket in Pasadena
The most common earnings brackets in Pasadena are $100,000+ for men (12,784 | 30.3%) and $100,000+ for women (8,844 | 23.3%).
| Income | Male | Female |
| $2,499 or less | 988 (2.4%) | 1,499 (4.0%) |
| $2,500 to $4,999 | 699 (1.7%) | 991 (2.6%) |
| $5,000 to $7,499 | 723 (1.7%) | 1,414 (3.7%) |
| $7,500 to $9,999 | 732 (1.7%) | 815 (2.1%) |
| $10,000 to $12,499 | 1,091 (2.6%) | 1,218 (3.2%) |
| $12,500 to $14,999 | 881 (2.1%) | 1,258 (3.3%) |
| $15,000 to $17,499 | 785 (1.9%) | 858 (2.3%) |
| $17,500 to $19,999 | 922 (2.2%) | 712 (1.9%) |
| $20,000 to $22,499 | 1,048 (2.5%) | 1,147 (3.0%) |
| $22,500 to $24,999 | 1,112 (2.6%) | 1,100 (2.9%) |
| $25,000 to $29,999 | 2,560 (6.1%) | 1,452 (3.8%) |
| $30,000 to $34,999 | 2,278 (5.4%) | 1,719 (4.5%) |
| $35,000 to $39,999 | 2,187 (5.2%) | 1,580 (4.2%) |
| $40,000 to $44,999 | 1,083 (2.6%) | 1,383 (3.6%) |
| $45,000 to $49,999 | 1,467 (3.5%) | 1,434 (3.8%) |
| $50,000 to $54,999 | 1,037 (2.5%) | 1,198 (3.2%) |
| $55,000 to $64,999 | 2,922 (6.9%) | 2,753 (7.2%) |
| $65,000 to $74,999 | 2,021 (4.8%) | 2,246 (5.9%) |
| $75,000 to $99,999 | 4,799 (11.4%) | 4,331 (11.4%) |
| $100,000+ | 12,784 (30.3%) | 8,844 (23.3%) |
| Total | 42,119 (100.0%) | 37,952 (100.0%) |
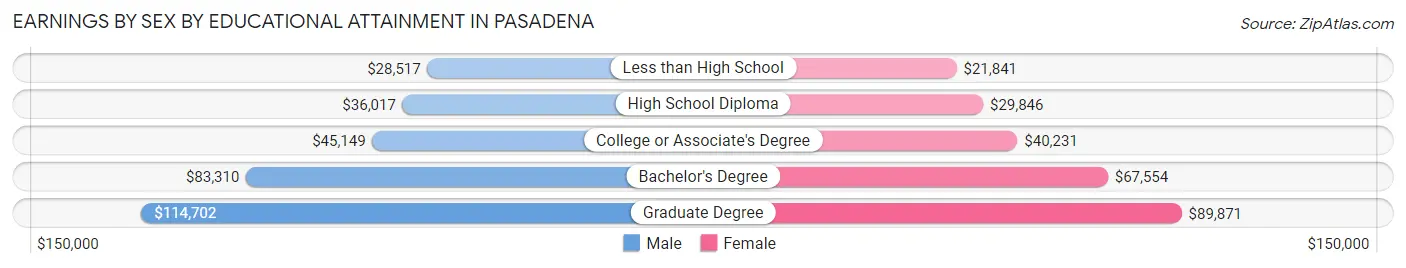
Earnings by Sex by Educational Attainment in Pasadena
Average earnings in Pasadena are $64,407 for men and $58,107 for women, a difference of 9.8%. Men with an educational attainment of graduate degree enjoy the highest average annual earnings of $114,702, while those with less than high school education earn the least with $28,517. Women with an educational attainment of graduate degree earn the most with the average annual earnings of $89,871, while those with less than high school education have the smallest earnings of $21,841.
| Educational Attainment | Male Income | Female Income |
| Less than High School | $28,517 | $21,841 |
| High School Diploma | $36,017 | $29,846 |
| College or Associate's Degree | $45,149 | $40,231 |
| Bachelor's Degree | $83,310 | $67,554 |
| Graduate Degree | $114,702 | $89,871 |
| Total | $64,407 | $58,107 |
Family Income in Pasadena
Family Income Brackets in Pasadena
According to the Pasadena family income data, there are 9,238 families falling into the $200,000+ income range, which is the most common income bracket and makes up 30.2% of all families. Conversely, the $10,000 to $14,999 income bracket is the least frequent group with only 336 families (1.1%) belonging to this category.
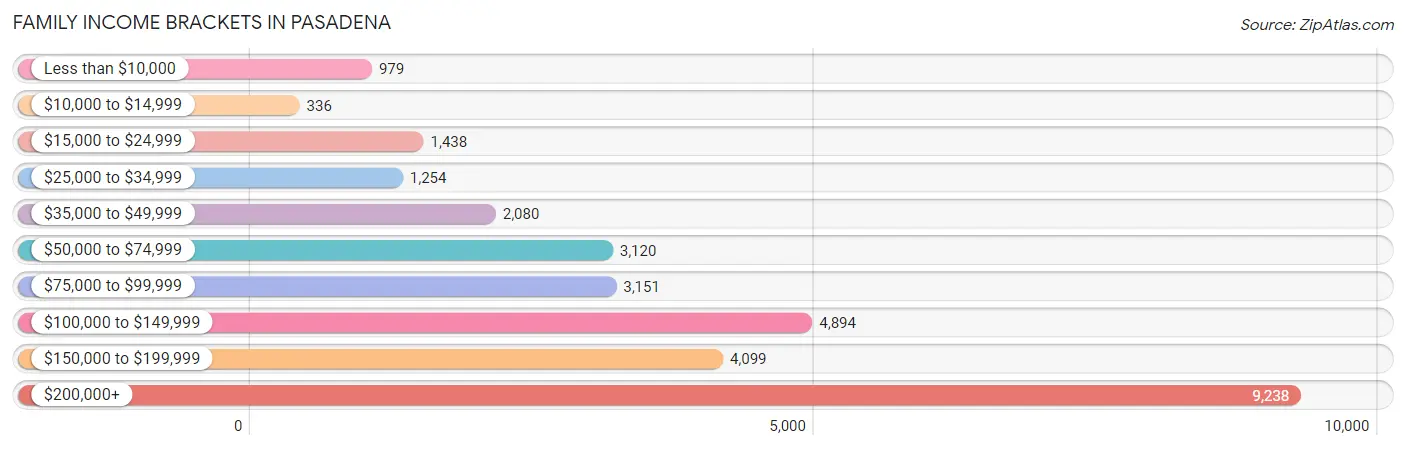
| Income Bracket | # Families | % Families |
| Less than $10,000 | 979 | 3.2% |
| $10,000 to $14,999 | 336 | 1.1% |
| $15,000 to $24,999 | 1,438 | 4.7% |
| $25,000 to $34,999 | 1,254 | 4.1% |
| $35,000 to $49,999 | 2,080 | 6.8% |
| $50,000 to $74,999 | 3,120 | 10.2% |
| $75,000 to $99,999 | 3,151 | 10.3% |
| $100,000 to $149,999 | 4,894 | 16.0% |
| $150,000 to $199,999 | 4,099 | 13.4% |
| $200,000+ | 9,238 | 30.2% |
Family Income by Famaliy Size in Pasadena
5-person families (2,295 | 7.5%) account for the highest median family income in Pasadena with $161,181 per family, while 2-person families (15,362 | 50.2%) have the highest median income of $64,337 per family member.
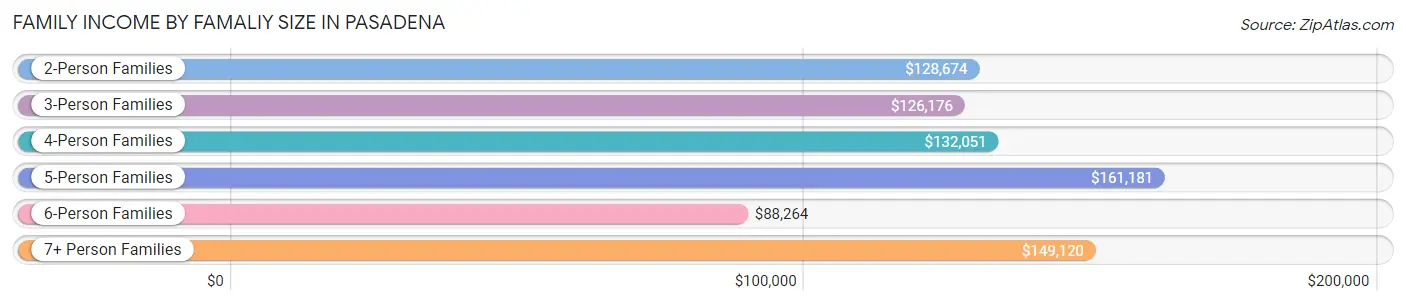
| Income Bracket | # Families | Median Income |
| 2-Person Families | 15,362 (50.2%) | $128,674 |
| 3-Person Families | 6,524 (21.3%) | $126,176 |
| 4-Person Families | 5,282 (17.3%) | $132,051 |
| 5-Person Families | 2,295 (7.5%) | $161,181 |
| 6-Person Families | 624 (2.0%) | $88,264 |
| 7+ Person Families | 503 (1.6%) | $149,120 |
| Total | 30,590 (100.0%) | $129,119 |
Family Income by Number of Earners in Pasadena
The median family income in Pasadena is $129,119, with families comprising 2 earners (14,863) having the highest median family income of $171,340, while families with no earners (3,317) have the lowest median family income of $50,707, accounting for 48.6% and 10.8% of families, respectively.
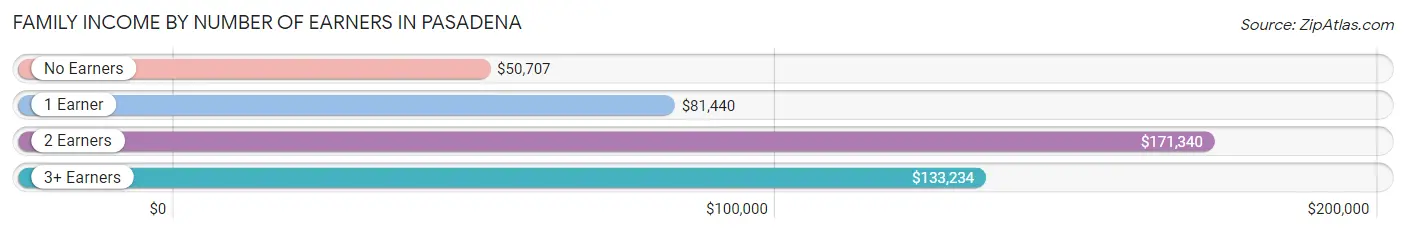
| Number of Earners | # Families | Median Income |
| No Earners | 3,317 (10.8%) | $50,707 |
| 1 Earner | 8,997 (29.4%) | $81,440 |
| 2 Earners | 14,863 (48.6%) | $171,340 |
| 3+ Earners | 3,413 (11.2%) | $133,234 |
| Total | 30,590 (100.0%) | $129,119 |
Household Income in Pasadena
Household Income Brackets in Pasadena
With 11,944 households falling in the category, the $200,000+ income range is the most frequent in Pasadena, accounting for 21.3% of all households. In contrast, only 2,467 households (4.4%) fall into the $10,000 to $14,999 income bracket, making it the least populous group.
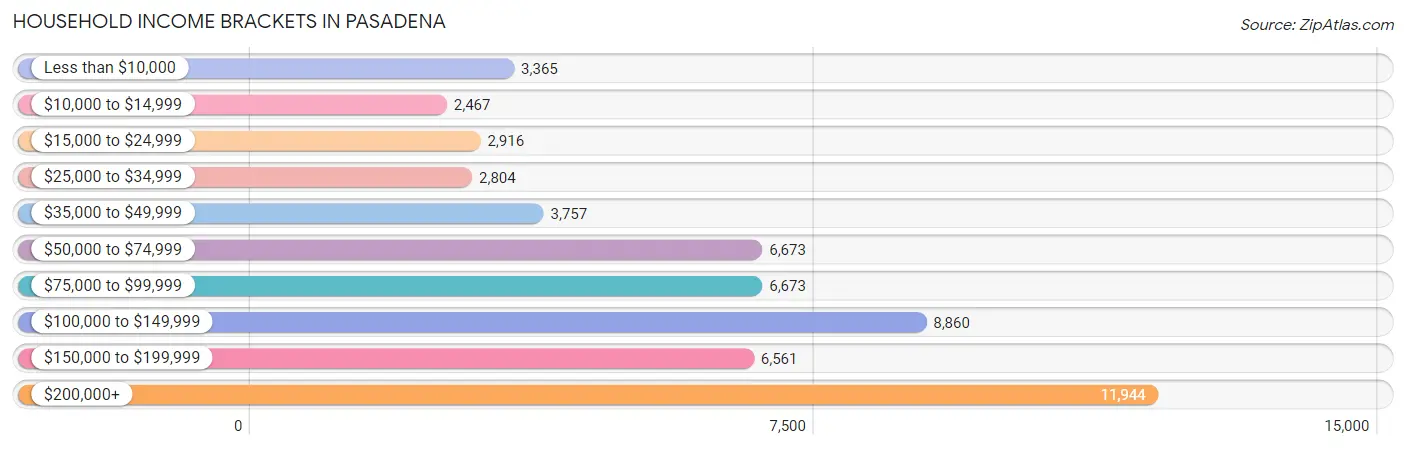
| Income Bracket | # Households | % Households |
| Less than $10,000 | 3,365 | 6.0% |
| $10,000 to $14,999 | 2,467 | 4.4% |
| $15,000 to $24,999 | 2,916 | 5.2% |
| $25,000 to $34,999 | 2,804 | 5.0% |
| $35,000 to $49,999 | 3,757 | 6.7% |
| $50,000 to $74,999 | 6,673 | 11.9% |
| $75,000 to $99,999 | 6,673 | 11.9% |
| $100,000 to $149,999 | 8,860 | 15.8% |
| $150,000 to $199,999 | 6,561 | 11.7% |
| $200,000+ | 11,944 | 21.3% |
Household Income by Householder Age in Pasadena
The median household income in Pasadena is $97,818, with the highest median household income of $113,669 found in the 25 to 44 years age bracket for the primary householder. A total of 21,271 households (37.9%) fall into this category. Meanwhile, the 15 to 24 years age bracket for the primary householder has the lowest median household income of $42,956, with 1,745 households (3.1%) in this group.
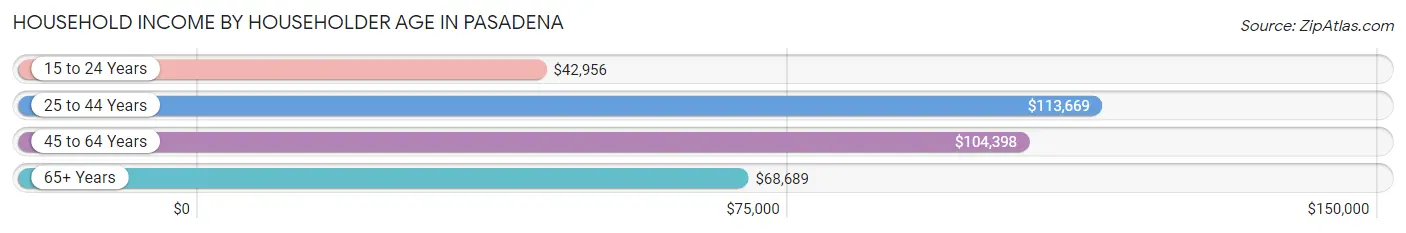
| Income Bracket | # Households | Median Income |
| 15 to 24 Years | 1,745 (3.1%) | $42,956 |
| 25 to 44 Years | 21,271 (37.9%) | $113,669 |
| 45 to 64 Years | 18,856 (33.6%) | $104,398 |
| 65+ Years | 14,204 (25.3%) | $68,689 |
| Total | 56,076 (100.0%) | $97,818 |
Poverty in Pasadena
Income Below Poverty by Sex and Age in Pasadena
With 12.4% poverty level for males and 14.4% for females among the residents of Pasadena, 18 to 24 year old males and 18 to 24 year old females are the most vulnerable to poverty, with 1,071 males (23.9%) and 1,421 females (29.5%) in their respective age groups living below the poverty level.
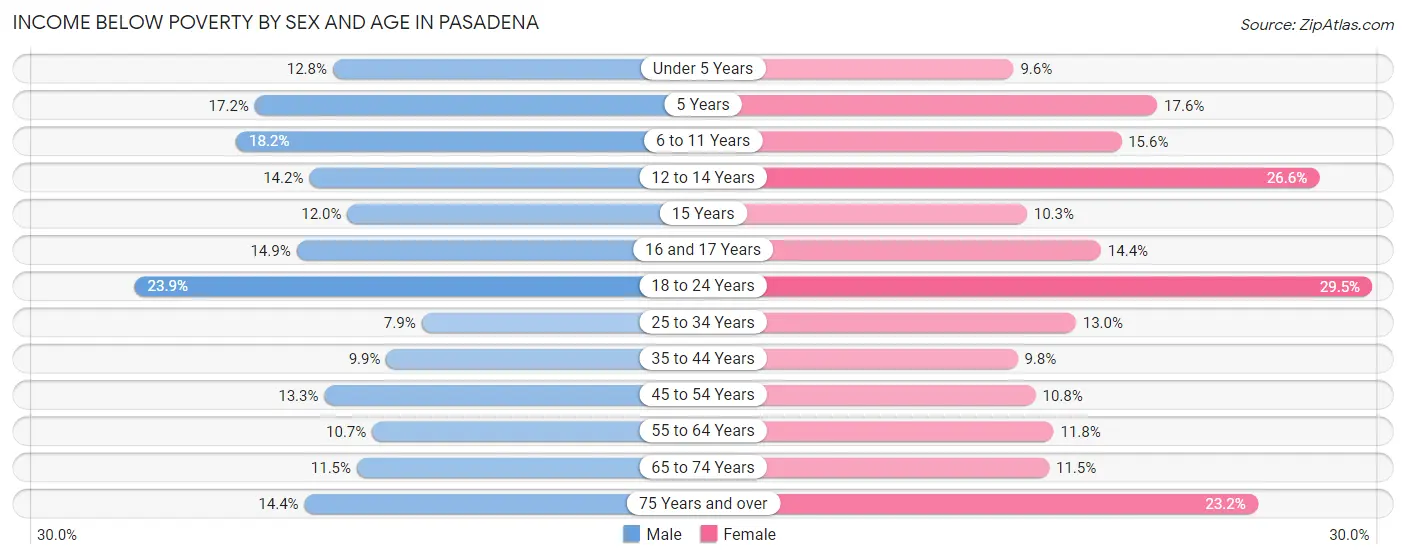
| Age Bracket | Male | Female |
| Under 5 Years | 455 (12.8%) | 326 (9.6%) |
| 5 Years | 82 (17.2%) | 75 (17.6%) |
| 6 to 11 Years | 712 (18.2%) | 549 (15.6%) |
| 12 to 14 Years | 286 (14.1%) | 530 (26.6%) |
| 15 Years | 89 (12.0%) | 55 (10.3%) |
| 16 and 17 Years | 170 (14.9%) | 166 (14.4%) |
| 18 to 24 Years | 1,071 (23.9%) | 1,421 (29.5%) |
| 25 to 34 Years | 1,003 (7.9%) | 1,558 (13.0%) |
| 35 to 44 Years | 1,078 (9.9%) | 993 (9.8%) |
| 45 to 54 Years | 1,208 (13.3%) | 995 (10.8%) |
| 55 to 64 Years | 866 (10.6%) | 969 (11.8%) |
| 65 to 74 Years | 573 (11.5%) | 788 (11.5%) |
| 75 Years and over | 600 (14.4%) | 1,465 (23.2%) |
| Total | 8,193 (12.4%) | 9,890 (14.4%) |
Income Above Poverty by Sex and Age in Pasadena
According to the poverty statistics in Pasadena, males aged 25 to 34 years and females aged under 5 years are the age groups that are most secure financially, with 92.1% of males and 90.4% of females in these age groups living above the poverty line.
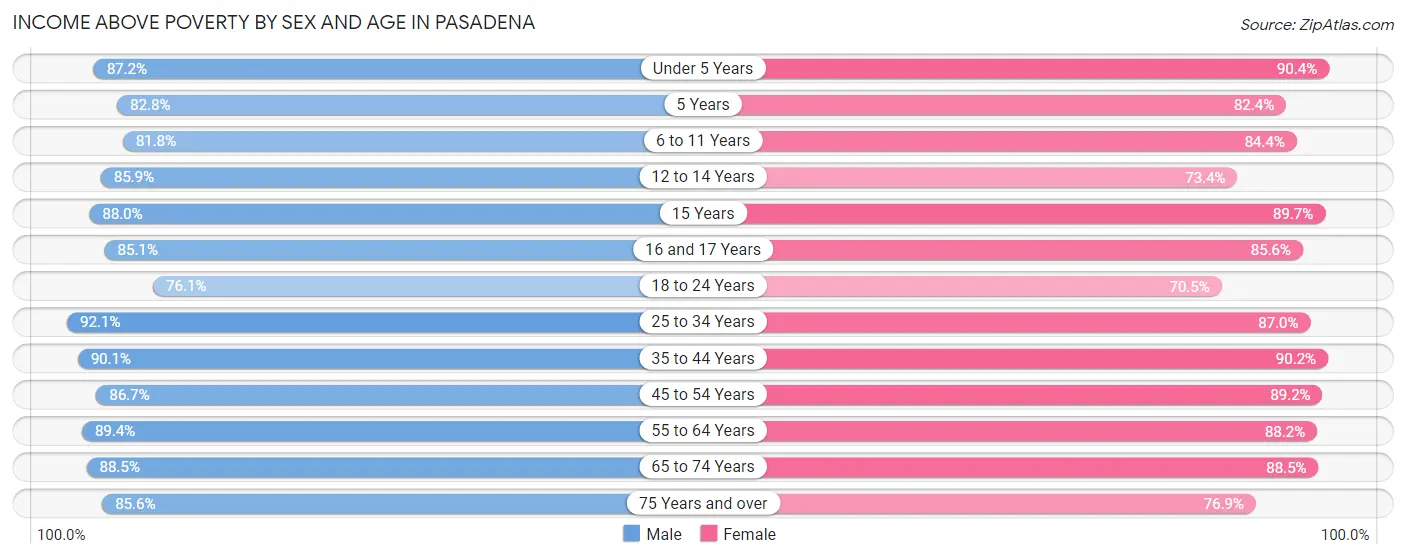
| Age Bracket | Male | Female |
| Under 5 Years | 3,089 (87.2%) | 3,083 (90.4%) |
| 5 Years | 395 (82.8%) | 352 (82.4%) |
| 6 to 11 Years | 3,196 (81.8%) | 2,979 (84.4%) |
| 12 to 14 Years | 1,735 (85.9%) | 1,465 (73.4%) |
| 15 Years | 651 (88.0%) | 479 (89.7%) |
| 16 and 17 Years | 974 (85.1%) | 984 (85.6%) |
| 18 to 24 Years | 3,415 (76.1%) | 3,393 (70.5%) |
| 25 to 34 Years | 11,691 (92.1%) | 10,400 (87.0%) |
| 35 to 44 Years | 9,853 (90.1%) | 9,162 (90.2%) |
| 45 to 54 Years | 7,871 (86.7%) | 8,227 (89.2%) |
| 55 to 64 Years | 7,266 (89.3%) | 7,252 (88.2%) |
| 65 to 74 Years | 4,409 (88.5%) | 6,042 (88.5%) |
| 75 Years and over | 3,561 (85.6%) | 4,862 (76.8%) |
| Total | 58,106 (87.6%) | 58,680 (85.6%) |
Income Below Poverty Among Married-Couple Families in Pasadena
The poverty statistics for married-couple families in Pasadena show that 4.4% or 968 of the total 21,993 families live below the poverty line. Families with 1 or 2 children have the highest poverty rate of 6.8%, comprising of 495 families. On the other hand, families with 5 or more children have the lowest poverty rate of 0.0%, which includes 0 families.
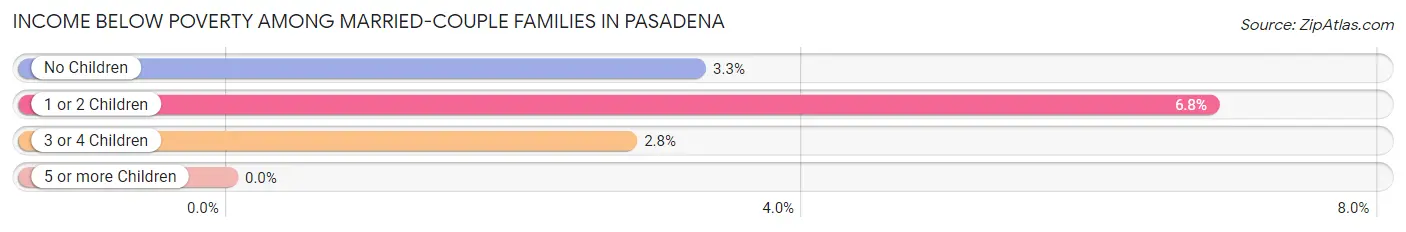
| Children | Above Poverty | Below Poverty |
| No Children | 13,114 (96.7%) | 442 (3.3%) |
| 1 or 2 Children | 6,757 (93.2%) | 495 (6.8%) |
| 3 or 4 Children | 1,084 (97.2%) | 31 (2.8%) |
| 5 or more Children | 70 (100.0%) | 0 (0.0%) |
| Total | 21,025 (95.6%) | 968 (4.4%) |
Income Below Poverty Among Single-Parent Households in Pasadena
According to the poverty data in Pasadena, 14.3% or 417 single-father households and 17.7% or 1,006 single-mother households are living below the poverty line. Among single-father households, those with 5 or more children have the highest poverty rate, with 22 households (100.0%) experiencing poverty. Likewise, among single-mother households, those with 5 or more children have the highest poverty rate, with 53 households (100.0%) falling below the poverty line.
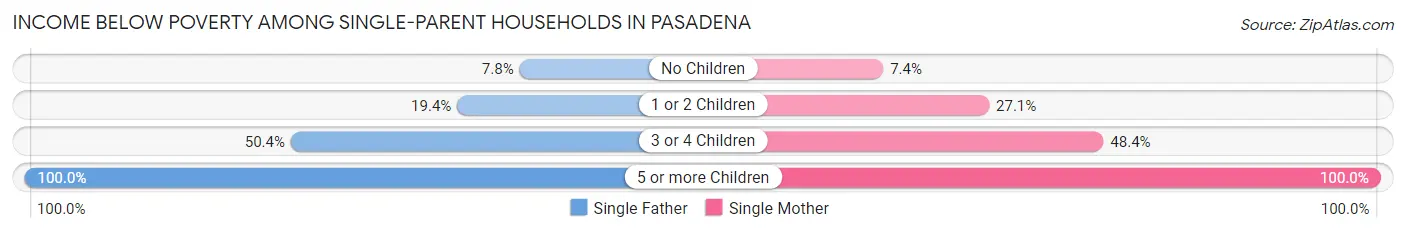
| Children | Single Father | Single Mother |
| No Children | 138 (7.8%) | 235 (7.4%) |
| 1 or 2 Children | 197 (19.4%) | 584 (27.1%) |
| 3 or 4 Children | 60 (50.4%) | 134 (48.4%) |
| 5 or more Children | 22 (100.0%) | 53 (100.0%) |
| Total | 417 (14.3%) | 1,006 (17.7%) |
Income Below Poverty Among Married-Couple vs Single-Parent Households in Pasadena
The poverty data for Pasadena shows that 968 of the married-couple family households (4.4%) and 1,423 of the single-parent households (16.6%) are living below the poverty level. Within the married-couple family households, those with 1 or 2 children have the highest poverty rate, with 495 households (6.8%) falling below the poverty line. Among the single-parent households, those with 5 or more children have the highest poverty rate, with 75 household (100.0%) living below poverty.
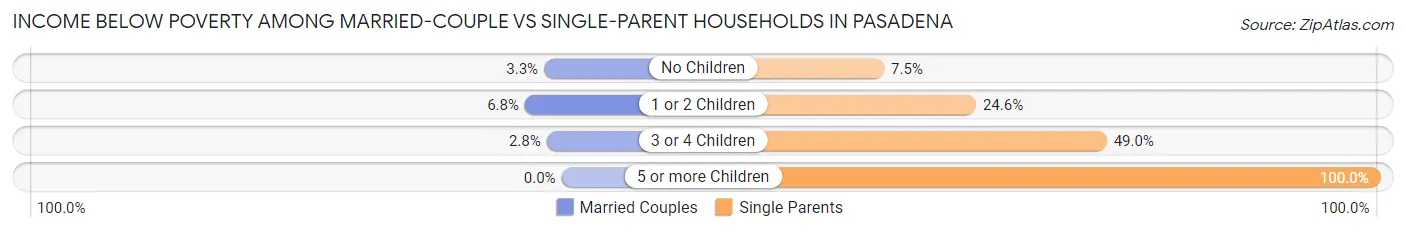
| Children | Married-Couple Families | Single-Parent Households |
| No Children | 442 (3.3%) | 373 (7.5%) |
| 1 or 2 Children | 495 (6.8%) | 781 (24.6%) |
| 3 or 4 Children | 31 (2.8%) | 194 (49.0%) |
| 5 or more Children | 0 (0.0%) | 75 (100.0%) |
| Total | 968 (4.4%) | 1,423 (16.6%) |
Race in Pasadena
The most populous races in Pasadena are White / Caucasian (59,090 | 43.0%), Hispanic or Latino (48,538 | 35.3%), and Some other Race (24,984 | 18.2%).
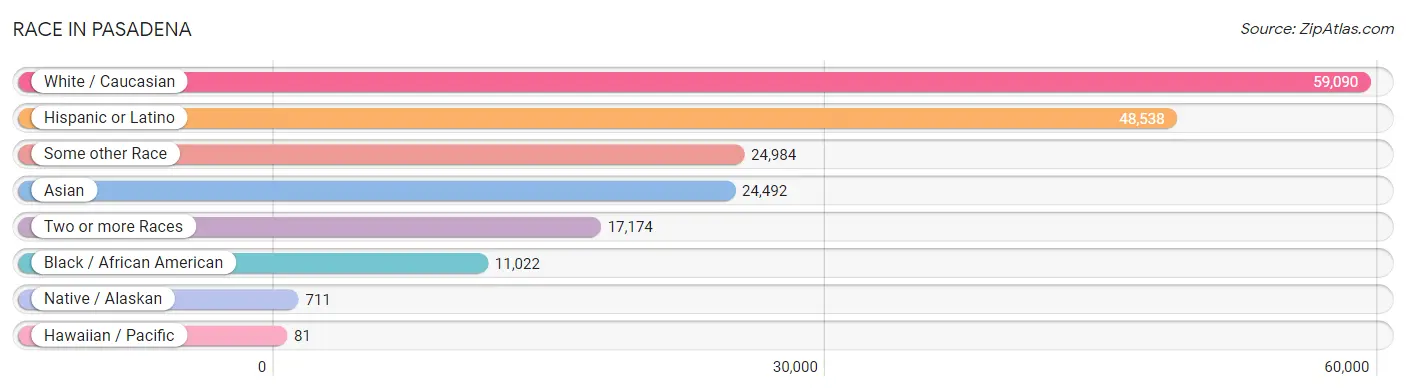
| Race | # Population | % Population |
| Asian | 24,492 | 17.8% |
| Black / African American | 11,022 | 8.0% |
| Hawaiian / Pacific | 81 | 0.1% |
| Hispanic or Latino | 48,538 | 35.3% |
| Native / Alaskan | 711 | 0.5% |
| White / Caucasian | 59,090 | 43.0% |
| Two or more Races | 17,174 | 12.5% |
| Some other Race | 24,984 | 18.2% |
| Total | 137,554 | 100.0% |
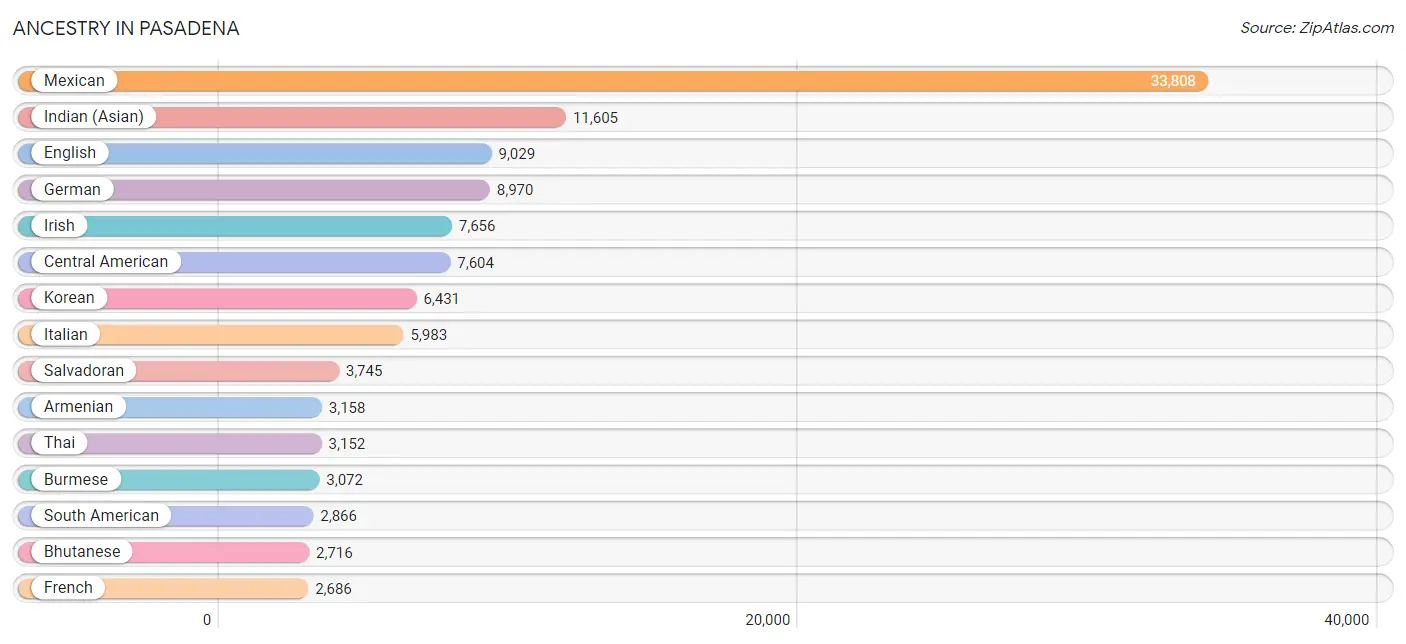
Ancestry in Pasadena
The most populous ancestries reported in Pasadena are Mexican (33,808 | 24.6%), Indian (Asian) (11,605 | 8.4%), English (9,029 | 6.6%), German (8,970 | 6.5%), and Irish (7,656 | 5.6%), together accounting for 51.7% of all Pasadena residents.
| Ancestry | # Population | % Population |
| Afghan | 158 | 0.1% |
| African | 342 | 0.3% |
| Albanian | 294 | 0.2% |
| Alsatian | 13 | 0.0% |
| American | 2,443 | 1.8% |
| Apache | 109 | 0.1% |
| Arab | 1,629 | 1.2% |
| Argentinean | 278 | 0.2% |
| Armenian | 3,158 | 2.3% |
| Assyrian / Chaldean / Syriac | 2 | 0.0% |
| Australian | 72 | 0.1% |
| Austrian | 206 | 0.2% |
| Barbadian | 15 | 0.0% |
| Basque | 10 | 0.0% |
| Belgian | 63 | 0.1% |
| Belizean | 9 | 0.0% |
| Bhutanese | 2,716 | 2.0% |
| Blackfeet | 52 | 0.0% |
| Bolivian | 415 | 0.3% |
| Brazilian | 102 | 0.1% |
| British | 1,183 | 0.9% |
| British West Indian | 9 | 0.0% |
| Bulgarian | 4 | 0.0% |
| Burmese | 3,072 | 2.2% |
| Canadian | 339 | 0.3% |
| Celtic | 7 | 0.0% |
| Central American | 7,604 | 5.5% |
| Central American Indian | 174 | 0.1% |
| Cherokee | 185 | 0.1% |
| Chickasaw | 44 | 0.0% |
| Chilean | 177 | 0.1% |
| Chinese | 14 | 0.0% |
| Chippewa | 45 | 0.0% |
| Choctaw | 78 | 0.1% |
| Colombian | 761 | 0.5% |
| Costa Rican | 300 | 0.2% |
| Croatian | 183 | 0.1% |
| Cuban | 775 | 0.6% |
| Czech | 262 | 0.2% |
| Czechoslovakian | 63 | 0.1% |
| Danish | 533 | 0.4% |
| Delaware | 8 | 0.0% |
| Dominican | 133 | 0.1% |
| Dutch | 1,132 | 0.8% |
| Eastern European | 708 | 0.5% |
| Ecuadorian | 501 | 0.4% |
| Egyptian | 567 | 0.4% |
| English | 9,029 | 6.6% |
| Estonian | 33 | 0.0% |
| Ethiopian | 115 | 0.1% |
| European | 2,322 | 1.7% |
| Filipino | 1,022 | 0.7% |
| Finnish | 286 | 0.2% |
| French | 2,686 | 1.9% |
| French American Indian | 7 | 0.0% |
| French Canadian | 339 | 0.3% |
| German | 8,970 | 6.5% |
| Greek | 651 | 0.5% |
| Guamanian / Chamorro | 65 | 0.1% |
| Guatemalan | 1,848 | 1.3% |
| Guyanese | 23 | 0.0% |
| Haitian | 35 | 0.0% |
| Honduran | 1,298 | 0.9% |
| Hungarian | 454 | 0.3% |
| Icelander | 83 | 0.1% |
| Indian (Asian) | 11,605 | 8.4% |
| Indonesian | 167 | 0.1% |
| Iranian | 900 | 0.6% |
| Irish | 7,656 | 5.6% |
| Israeli | 117 | 0.1% |
| Italian | 5,983 | 4.3% |
| Jamaican | 190 | 0.1% |
| Japanese | 102 | 0.1% |
| Jordanian | 119 | 0.1% |
| Korean | 6,431 | 4.7% |
| Laotian | 333 | 0.2% |
| Latvian | 54 | 0.0% |
| Lebanese | 562 | 0.4% |
| Liberian | 20 | 0.0% |
| Lithuanian | 366 | 0.3% |
| Macedonian | 23 | 0.0% |
| Malaysian | 60 | 0.0% |
| Maltese | 13 | 0.0% |
| Mexican | 33,808 | 24.6% |
| Mexican American Indian | 613 | 0.4% |
| Mongolian | 15 | 0.0% |
| Moroccan | 36 | 0.0% |
| Native Hawaiian | 142 | 0.1% |
| Navajo | 57 | 0.0% |
| New Zealander | 10 | 0.0% |
| Nicaraguan | 291 | 0.2% |
| Nigerian | 379 | 0.3% |
| Northern European | 391 | 0.3% |
| Norwegian | 1,290 | 0.9% |
| Okinawan | 54 | 0.0% |
| Osage | 5 | 0.0% |
| Pakistani | 393 | 0.3% |
| Palestinian | 36 | 0.0% |
| Panamanian | 47 | 0.0% |
| Pennsylvania German | 36 | 0.0% |
| Peruvian | 578 | 0.4% |
| Polish | 1,367 | 1.0% |
| Portuguese | 377 | 0.3% |
| Pueblo | 8 | 0.0% |
| Puerto Rican | 966 | 0.7% |
| Romanian | 300 | 0.2% |
| Russian | 1,639 | 1.2% |
| Salvadoran | 3,745 | 2.7% |
| Samoan | 106 | 0.1% |
| Scandinavian | 426 | 0.3% |
| Scotch-Irish | 878 | 0.6% |
| Scottish | 1,523 | 1.1% |
| Serbian | 109 | 0.1% |
| Sioux | 12 | 0.0% |
| Slavic | 18 | 0.0% |
| Slovak | 79 | 0.1% |
| Slovene | 24 | 0.0% |
| South African | 104 | 0.1% |
| South American | 2,866 | 2.1% |
| South American Indian | 53 | 0.0% |
| Spaniard | 930 | 0.7% |
| Spanish | 427 | 0.3% |
| Spanish American Indian | 3 | 0.0% |
| Sri Lankan | 1,139 | 0.8% |
| Subsaharan African | 990 | 0.7% |
| Sudanese | 7 | 0.0% |
| Swedish | 1,121 | 0.8% |
| Swiss | 342 | 0.3% |
| Syrian | 74 | 0.1% |
| Thai | 3,152 | 2.3% |
| Tohono O'Odham | 7 | 0.0% |
| Trinidadian and Tobagonian | 8 | 0.0% |
| Turkish | 79 | 0.1% |
| Ugandan | 9 | 0.0% |
| Ukrainian | 694 | 0.5% |
| Uruguayan | 11 | 0.0% |
| Venezuelan | 145 | 0.1% |
| Vietnamese | 38 | 0.0% |
| Welsh | 439 | 0.3% |
| West Indian | 210 | 0.2% |
| Yaqui | 51 | 0.0% |
| Yugoslavian | 100 | 0.1% | View All 142 Rows |
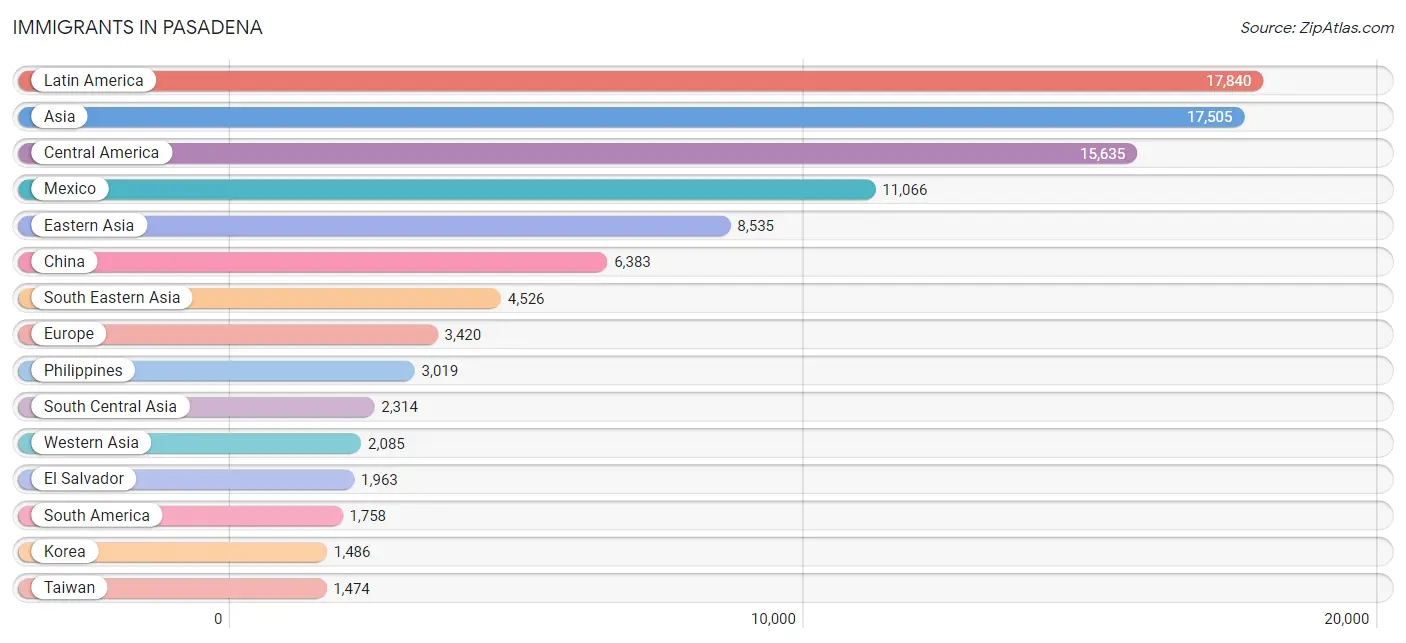
Immigrants in Pasadena
The most numerous immigrant groups reported in Pasadena came from Latin America (17,840 | 13.0%), Asia (17,505 | 12.7%), Central America (15,635 | 11.4%), Mexico (11,066 | 8.0%), and Eastern Asia (8,535 | 6.2%), together accounting for 51.3% of all Pasadena residents.
| Immigration Origin | # Population | % Population |
| Afghanistan | 53 | 0.0% |
| Africa | 802 | 0.6% |
| Albania | 96 | 0.1% |
| Argentina | 255 | 0.2% |
| Armenia | 385 | 0.3% |
| Asia | 17,505 | 12.7% |
| Australia | 221 | 0.2% |
| Austria | 26 | 0.0% |
| Bangladesh | 31 | 0.0% |
| Barbados | 6 | 0.0% |
| Belarus | 44 | 0.0% |
| Belize | 41 | 0.0% |
| Bolivia | 146 | 0.1% |
| Bosnia and Herzegovina | 67 | 0.1% |
| Brazil | 61 | 0.0% |
| Cambodia | 38 | 0.0% |
| Cameroon | 10 | 0.0% |
| Canada | 588 | 0.4% |
| Caribbean | 447 | 0.3% |
| Central America | 15,635 | 11.4% |
| Chile | 60 | 0.0% |
| China | 6,383 | 4.6% |
| Colombia | 470 | 0.3% |
| Costa Rica | 96 | 0.1% |
| Cuba | 198 | 0.1% |
| Czechoslovakia | 79 | 0.1% |
| Denmark | 47 | 0.0% |
| Dominica | 59 | 0.0% |
| Dominican Republic | 71 | 0.1% |
| Eastern Africa | 280 | 0.2% |
| Eastern Asia | 8,535 | 6.2% |
| Eastern Europe | 1,018 | 0.7% |
| Ecuador | 244 | 0.2% |
| Egypt | 113 | 0.1% |
| El Salvador | 1,963 | 1.4% |
| England | 503 | 0.4% |
| Ethiopia | 69 | 0.1% |
| Europe | 3,420 | 2.5% |
| France | 147 | 0.1% |
| Germany | 351 | 0.3% |
| Greece | 41 | 0.0% |
| Guatemala | 1,271 | 0.9% |
| Honduras | 1,020 | 0.7% |
| Hong Kong | 418 | 0.3% |
| Hungary | 81 | 0.1% |
| India | 1,193 | 0.9% |
| Indonesia | 196 | 0.1% |
| Iran | 730 | 0.5% |
| Iraq | 83 | 0.1% |
| Ireland | 25 | 0.0% |
| Israel | 108 | 0.1% |
| Italy | 198 | 0.1% |
| Jamaica | 49 | 0.0% |
| Japan | 666 | 0.5% |
| Jordan | 57 | 0.0% |
| Kazakhstan | 30 | 0.0% |
| Kenya | 52 | 0.0% |
| Korea | 1,486 | 1.1% |
| Kuwait | 68 | 0.1% |
| Laos | 76 | 0.1% |
| Latin America | 17,840 | 13.0% |
| Latvia | 1 | 0.0% |
| Lebanon | 832 | 0.6% |
| Lithuania | 31 | 0.0% |
| Malaysia | 41 | 0.0% |
| Mexico | 11,066 | 8.0% |
| Micronesia | 46 | 0.0% |
| Middle Africa | 10 | 0.0% |
| Moldova | 14 | 0.0% |
| Netherlands | 204 | 0.2% |
| Nicaragua | 134 | 0.1% |
| Nigeria | 214 | 0.2% |
| Northern Africa | 153 | 0.1% |
| Northern Europe | 1,113 | 0.8% |
| Norway | 40 | 0.0% |
| Oceania | 293 | 0.2% |
| Pakistan | 163 | 0.1% |
| Panama | 44 | 0.0% |
| Peru | 400 | 0.3% |
| Philippines | 3,019 | 2.2% |
| Poland | 137 | 0.1% |
| Romania | 68 | 0.1% |
| Russia | 178 | 0.1% |
| Serbia | 14 | 0.0% |
| Singapore | 197 | 0.1% |
| South Africa | 129 | 0.1% |
| South America | 1,758 | 1.3% |
| South Central Asia | 2,314 | 1.7% |
| South Eastern Asia | 4,526 | 3.3% |
| Southern Europe | 438 | 0.3% |
| Spain | 199 | 0.1% |
| Sri Lanka | 49 | 0.0% |
| Sudan | 40 | 0.0% |
| Sweden | 77 | 0.1% |
| Switzerland | 123 | 0.1% |
| Syria | 411 | 0.3% |
| Taiwan | 1,474 | 1.1% |
| Thailand | 219 | 0.2% |
| Trinidad and Tobago | 57 | 0.0% |
| Turkey | 102 | 0.1% |
| Uganda | 152 | 0.1% |
| Ukraine | 169 | 0.1% |
| Uruguay | 11 | 0.0% |
| Uzbekistan | 42 | 0.0% |
| Venezuela | 94 | 0.1% |
| Vietnam | 647 | 0.5% |
| Western Africa | 214 | 0.2% |
| Western Asia | 2,085 | 1.5% |
| Western Europe | 851 | 0.6% | View All 109 Rows |
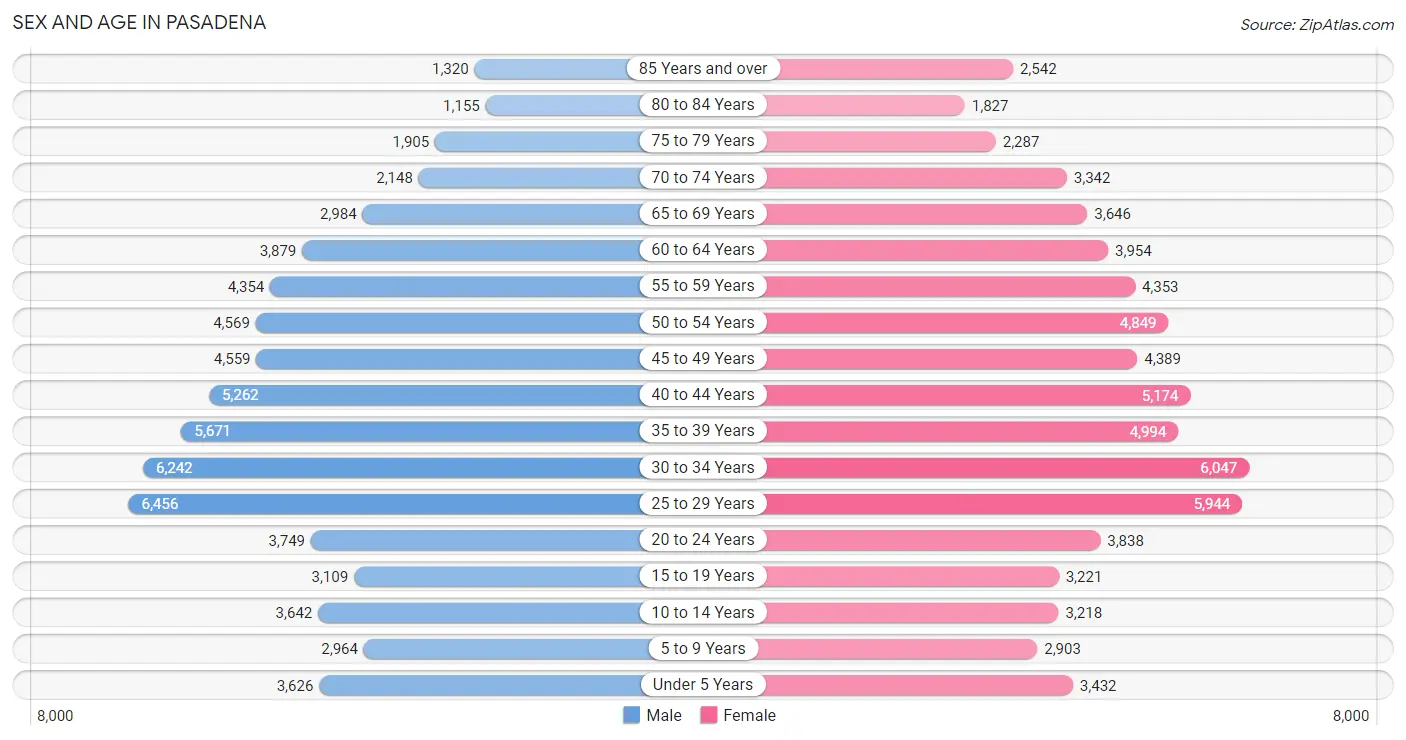
Sex and Age in Pasadena
Sex and Age in Pasadena
The most populous age groups in Pasadena are 25 to 29 Years (6,456 | 9.6%) for men and 30 to 34 Years (6,047 | 8.6%) for women.
| Age Bracket | Male | Female |
| Under 5 Years | 3,626 (5.4%) | 3,432 (4.9%) |
| 5 to 9 Years | 2,964 (4.4%) | 2,903 (4.2%) |
| 10 to 14 Years | 3,642 (5.4%) | 3,218 (4.6%) |
| 15 to 19 Years | 3,109 (4.6%) | 3,221 (4.6%) |
| 20 to 24 Years | 3,749 (5.6%) | 3,838 (5.5%) |
| 25 to 29 Years | 6,456 (9.6%) | 5,944 (8.5%) |
| 30 to 34 Years | 6,242 (9.2%) | 6,047 (8.6%) |
| 35 to 39 Years | 5,671 (8.4%) | 4,994 (7.1%) |
| 40 to 44 Years | 5,262 (7.8%) | 5,174 (7.4%) |
| 45 to 49 Years | 4,559 (6.7%) | 4,389 (6.3%) |
| 50 to 54 Years | 4,569 (6.8%) | 4,849 (6.9%) |
| 55 to 59 Years | 4,354 (6.4%) | 4,353 (6.2%) |
| 60 to 64 Years | 3,879 (5.7%) | 3,954 (5.7%) |
| 65 to 69 Years | 2,984 (4.4%) | 3,646 (5.2%) |
| 70 to 74 Years | 2,148 (3.2%) | 3,342 (4.8%) |
| 75 to 79 Years | 1,905 (2.8%) | 2,287 (3.3%) |
| 80 to 84 Years | 1,155 (1.7%) | 1,827 (2.6%) |
| 85 Years and over | 1,320 (1.9%) | 2,542 (3.6%) |
| Total | 67,594 (100.0%) | 69,960 (100.0%) |
Families and Households in Pasadena
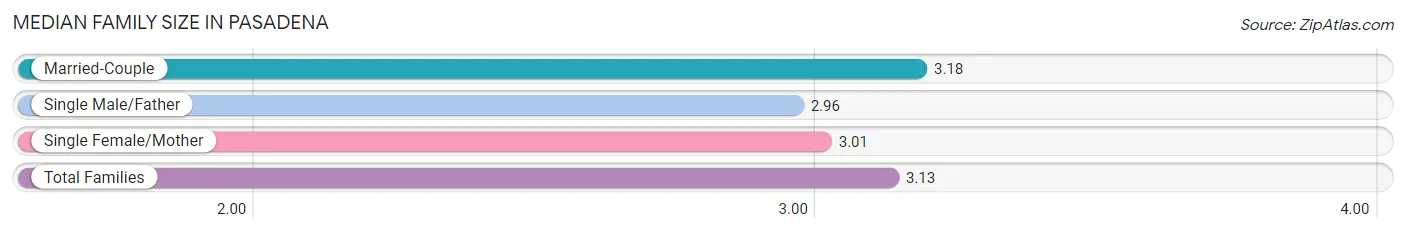
Median Family Size in Pasadena
The median family size in Pasadena is 3.13 persons per family, with married-couple families (21,993 | 71.9%) accounting for the largest median family size of 3.18 persons per family. On the other hand, single male/father families (2,920 | 9.6%) represent the smallest median family size with 2.96 persons per family.
| Family Type | # Families | Family Size |
| Married-Couple | 21,993 (71.9%) | 3.18 |
| Single Male/Father | 2,920 (9.6%) | 2.96 |
| Single Female/Mother | 5,677 (18.6%) | 3.01 |
| Total Families | 30,590 (100.0%) | 3.13 |
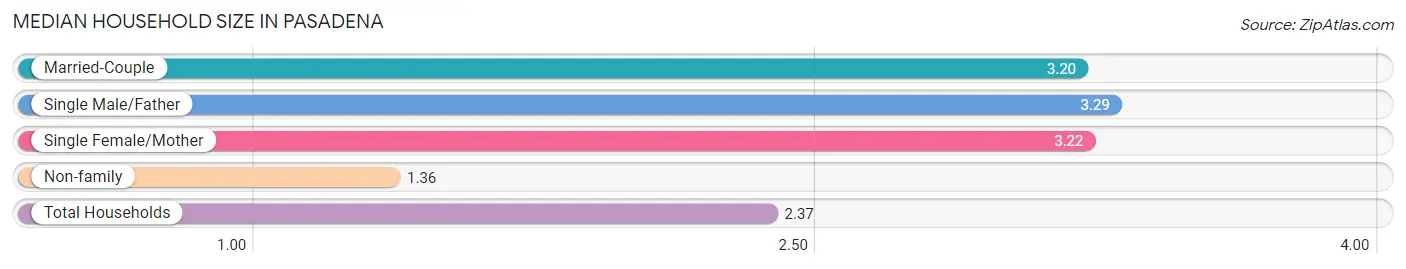
Median Household Size in Pasadena
The median household size in Pasadena is 2.37 persons per household, with single male/father households (2,920 | 5.2%) accounting for the largest median household size of 3.29 persons per household. non-family households (25,486 | 45.5%) represent the smallest median household size with 1.36 persons per household.
| Household Type | # Households | Household Size |
| Married-Couple | 21,993 (39.2%) | 3.20 |
| Single Male/Father | 2,920 (5.2%) | 3.29 |
| Single Female/Mother | 5,677 (10.1%) | 3.22 |
| Non-family | 25,486 (45.5%) | 1.36 |
| Total Households | 56,076 (100.0%) | 2.37 |
Household Size by Marriage Status in Pasadena
Out of a total of 56,076 households in Pasadena, 30,590 (54.5%) are family households, while 25,486 (45.5%) are nonfamily households. The most numerous type of family households are 2-person households, comprising 14,130, and the most common type of nonfamily households are 1-person households, comprising 19,298.
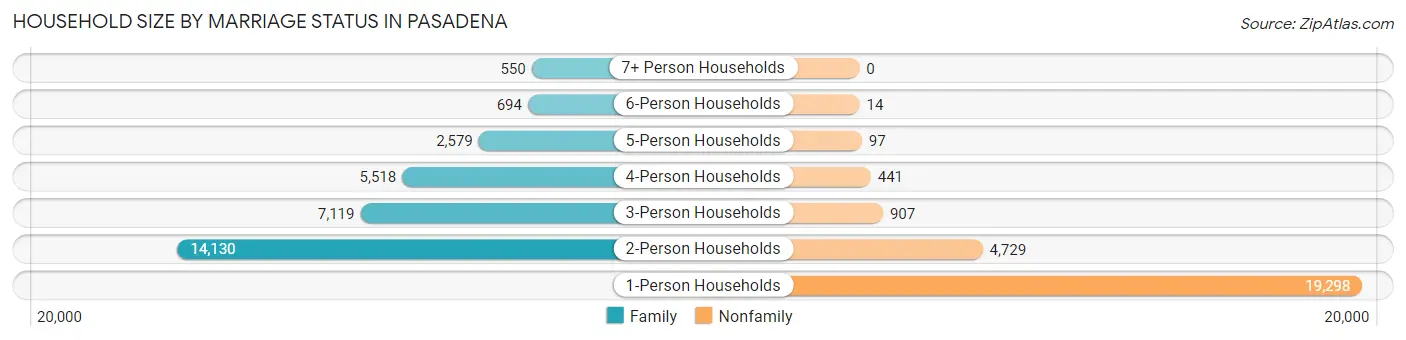
| Household Size | Family Households | Nonfamily Households |
| 1-Person Households | - | 19,298 (34.4%) |
| 2-Person Households | 14,130 (25.2%) | 4,729 (8.4%) |
| 3-Person Households | 7,119 (12.7%) | 907 (1.6%) |
| 4-Person Households | 5,518 (9.8%) | 441 (0.8%) |
| 5-Person Households | 2,579 (4.6%) | 97 (0.2%) |
| 6-Person Households | 694 (1.2%) | 14 (0.0%) |
| 7+ Person Households | 550 (1.0%) | 0 (0.0%) |
| Total | 30,590 (54.5%) | 25,486 (45.5%) |
Female Fertility in Pasadena
Fertility by Age in Pasadena
Average fertility rate in Pasadena is 41.0 births per 1,000 women. Women in the age bracket of 20 to 34 years have the highest fertility rate with 53.0 births per 1,000 women. Women in the age bracket of 20 to 34 years acount for 58.9% of all women with births.
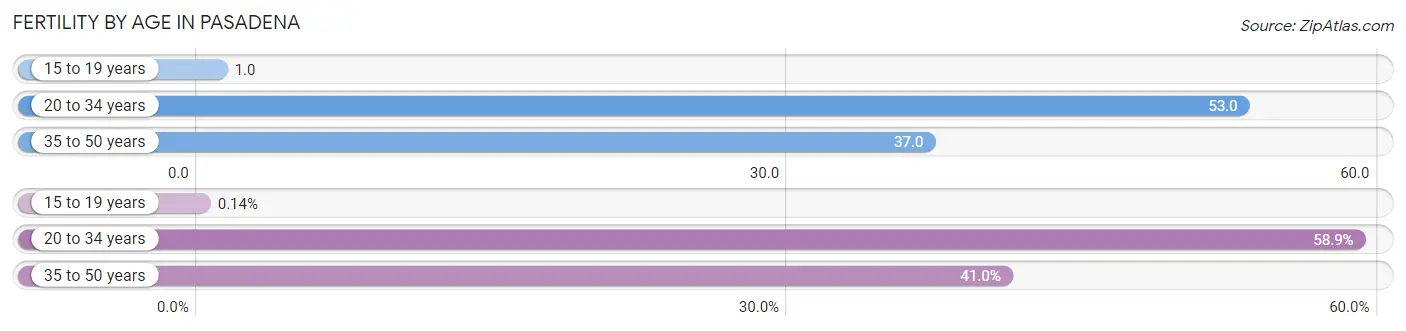
| Age Bracket | Women with Births | Births / 1,000 Women |
| 15 to 19 years | 2 (0.1%) | 1.0 |
| 20 to 34 years | 833 (58.9%) | 53.0 |
| 35 to 50 years | 579 (40.9%) | 37.0 |
| Total | 1,414 (100.0%) | 41.0 |
Fertility by Age by Marriage Status in Pasadena
80.4% of women with births (1,414) in Pasadena are married. The highest percentage of unmarried women with births falls into 15 to 19 years age bracket with 50.0% of them unmarried at the time of birth, while the lowest percentage of unmarried women with births belong to 35 to 50 years age bracket with 9.7% of them unmarried.
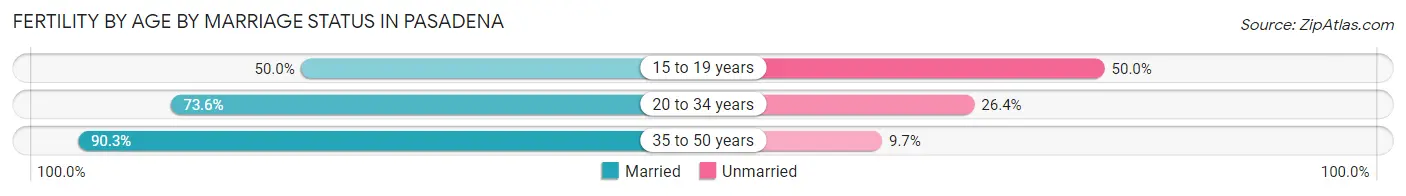
| Age Bracket | Married | Unmarried |
| 15 to 19 years | 1 (50.0%) | 1 (50.0%) |
| 20 to 34 years | 613 (73.6%) | 220 (26.4%) |
| 35 to 50 years | 523 (90.3%) | 56 (9.7%) |
| Total | 1,137 (80.4%) | 277 (19.6%) |
Fertility by Education in Pasadena
Average fertility rate in Pasadena is 41.0 births per 1,000 women. Women with the education attainment of graduate degree have the highest fertility rate of 58.0 births per 1,000 women, while women with the education attainment of less than high school have the lowest fertility at 13.0 births per 1,000 women. Women with the education attainment of graduate degree represent 34.2% of all women with births.
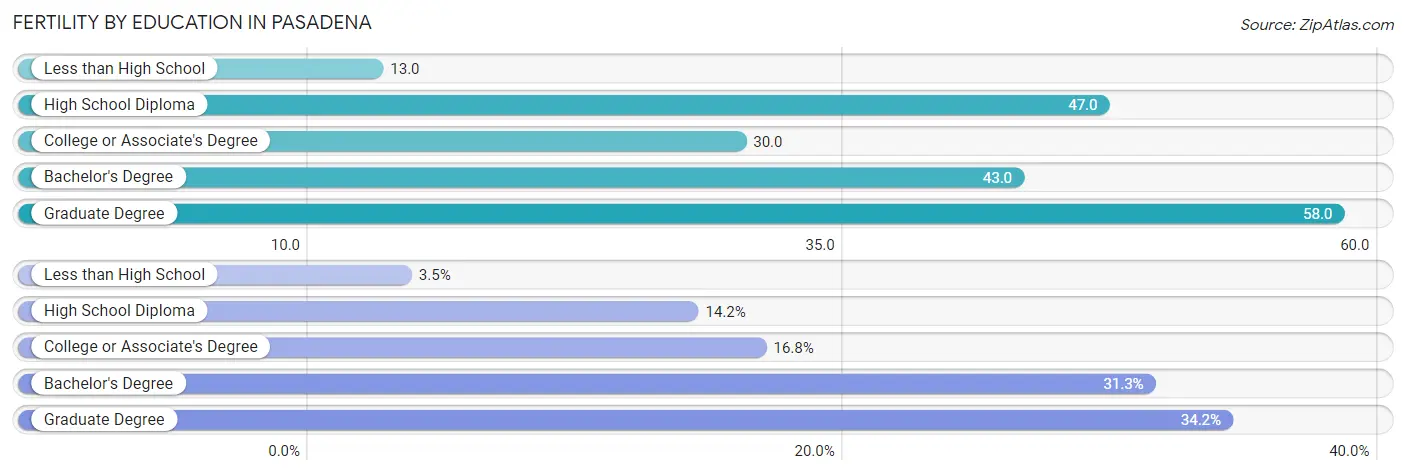
| Educational Attainment | Women with Births | Births / 1,000 Women |
| Less than High School | 49 (3.5%) | 13.0 |
| High School Diploma | 201 (14.2%) | 47.0 |
| College or Associate's Degree | 237 (16.8%) | 30.0 |
| Bachelor's Degree | 443 (31.3%) | 43.0 |
| Graduate Degree | 484 (34.2%) | 58.0 |
| Total | 1,414 (100.0%) | 41.0 |
Fertility by Education by Marriage Status in Pasadena
19.6% of women with births in Pasadena are unmarried. Women with the educational attainment of graduate degree are most likely to be married with 96.7% of them married at childbirth, while women with the educational attainment of college or associate's degree are least likely to be married with 59.9% of them unmarried at childbirth.
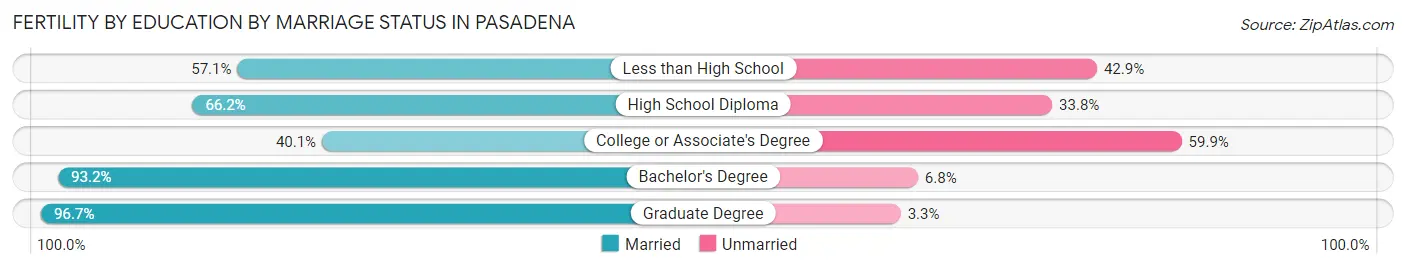
| Educational Attainment | Married | Unmarried |
| Less than High School | 28 (57.1%) | 21 (42.9%) |
| High School Diploma | 133 (66.2%) | 68 (33.8%) |
| College or Associate's Degree | 95 (40.1%) | 142 (59.9%) |
| Bachelor's Degree | 413 (93.2%) | 30 (6.8%) |
| Graduate Degree | 468 (96.7%) | 16 (3.3%) |
| Total | 1,137 (80.4%) | 277 (19.6%) |
Employment Characteristics in Pasadena
Employment by Class of Employer in Pasadena
Among the 72,376 employed individuals in Pasadena, private company employees (41,350 | 57.1%), not-for-profit organizations (10,133 | 14.0%), and self-employed (not incorporated) (7,528 | 10.4%) make up the most common classes of employment.
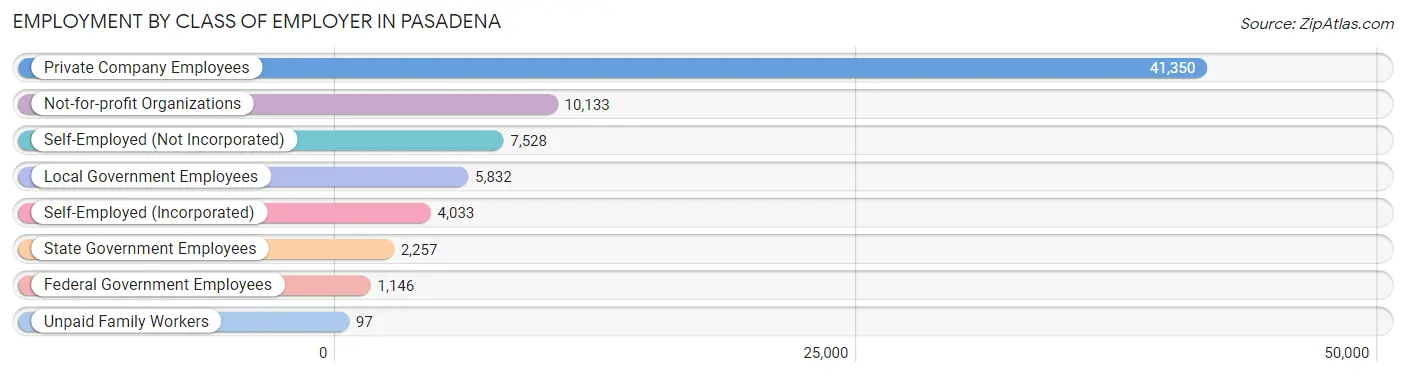
| Employer Class | # Employees | % Employees |
| Private Company Employees | 41,350 | 57.1% |
| Self-Employed (Incorporated) | 4,033 | 5.6% |
| Self-Employed (Not Incorporated) | 7,528 | 10.4% |
| Not-for-profit Organizations | 10,133 | 14.0% |
| Local Government Employees | 5,832 | 8.1% |
| State Government Employees | 2,257 | 3.1% |
| Federal Government Employees | 1,146 | 1.6% |
| Unpaid Family Workers | 97 | 0.1% |
| Total | 72,376 | 100.0% |
Employment Status by Age in Pasadena
According to the labor force statistics for Pasadena, out of the total population over 16 years of age (116,487), 66.9% or 77,930 individuals are in the labor force, with 5.2% or 4,052 of them unemployed. The age group with the highest labor force participation rate is 30 to 34 years, with 88.5% or 10,876 individuals in the labor force. Within the labor force, the 16 to 19 years age range has the highest percentage of unemployed individuals, with 17.2% or 209 of them being unemployed.
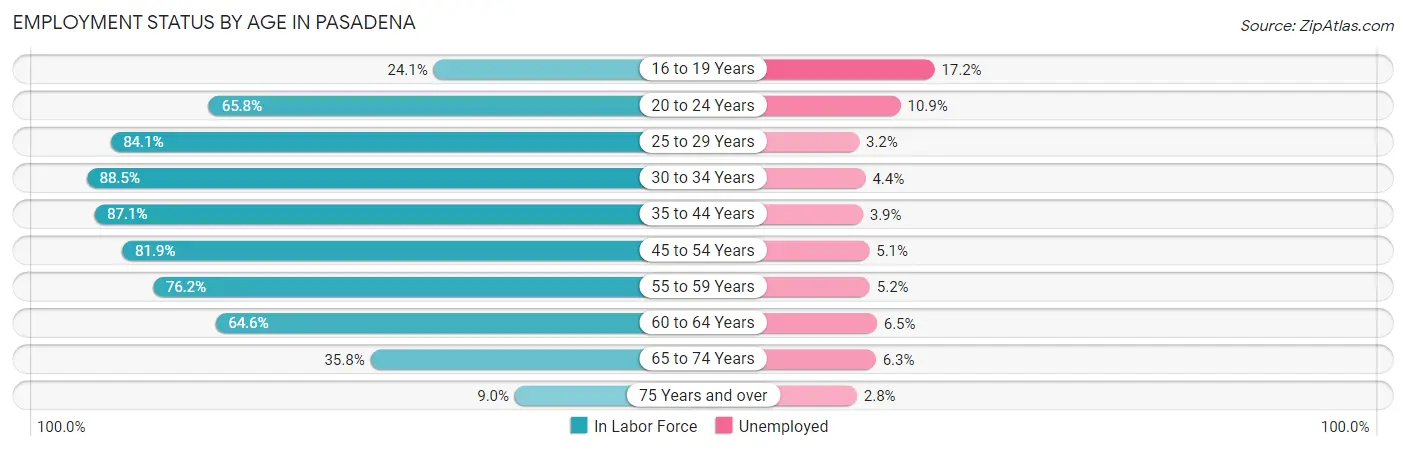
| Age Bracket | In Labor Force | Unemployed |
| 16 to 19 Years | 1,217 (24.1%) | 209 (17.2%) |
| 20 to 24 Years | 4,992 (65.8%) | 544 (10.9%) |
| 25 to 29 Years | 10,428 (84.1%) | 334 (3.2%) |
| 30 to 34 Years | 10,876 (88.5%) | 479 (4.4%) |
| 35 to 44 Years | 18,379 (87.1%) | 717 (3.9%) |
| 45 to 54 Years | 15,042 (81.9%) | 767 (5.1%) |
| 55 to 59 Years | 6,635 (76.2%) | 345 (5.2%) |
| 60 to 64 Years | 5,060 (64.6%) | 329 (6.5%) |
| 65 to 74 Years | 4,339 (35.8%) | 273 (6.3%) |
| 75 Years and over | 993 (9.0%) | 28 (2.8%) |
| Total | 77,930 (66.9%) | 4,052 (5.2%) |
Employment Status by Educational Attainment in Pasadena
According to labor force statistics for Pasadena, 82.3% of individuals (66,413) out of the total population between 25 and 64 years of age (80,696) are in the labor force, with 4.5% or 2,989 of them being unemployed. The group with the highest labor force participation rate are those with the educational attainment of bachelor's degree or higher, with 89.4% or 40,664 individuals in the labor force. Within the labor force, individuals with high school diploma education have the highest percentage of unemployment, with 5.7% or 465 of them being unemployed.
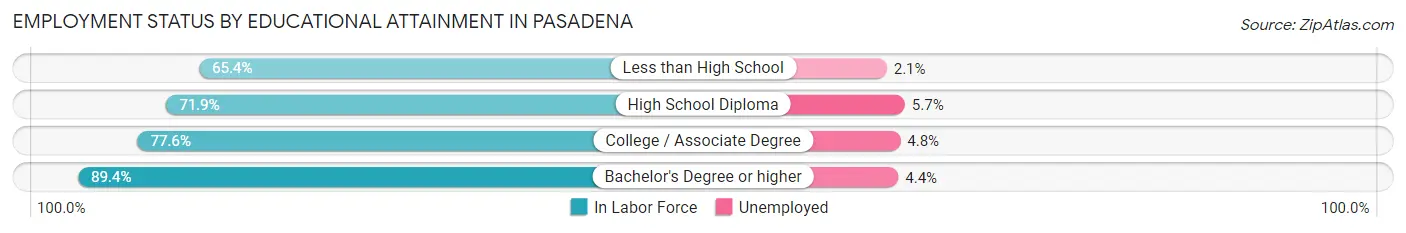
| Educational Attainment | In Labor Force | Unemployed |
| Less than High School | 4,866 (65.4%) | 156 (2.1%) |
| High School Diploma | 8,151 (71.9%) | 646 (5.7%) |
| College / Associate Degree | 12,751 (77.6%) | 789 (4.8%) |
| Bachelor's Degree or higher | 40,664 (89.4%) | 2,001 (4.4%) |
| Total | 66,413 (82.3%) | 3,631 (4.5%) |
Employment Occupations by Sex in Pasadena
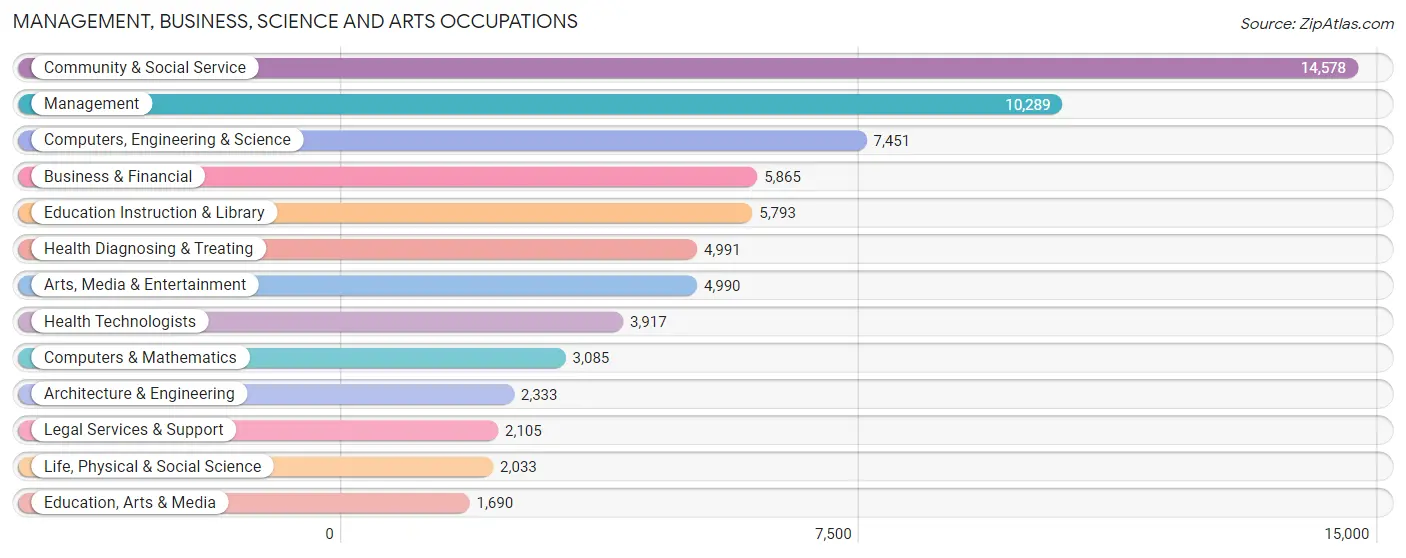
Management, Business, Science and Arts Occupations
The most common Management, Business, Science and Arts occupations in Pasadena are Community & Social Service (14,578 | 19.7%), Management (10,289 | 13.9%), Computers, Engineering & Science (7,451 | 10.1%), Business & Financial (5,865 | 7.9%), and Education Instruction & Library (5,793 | 7.8%).
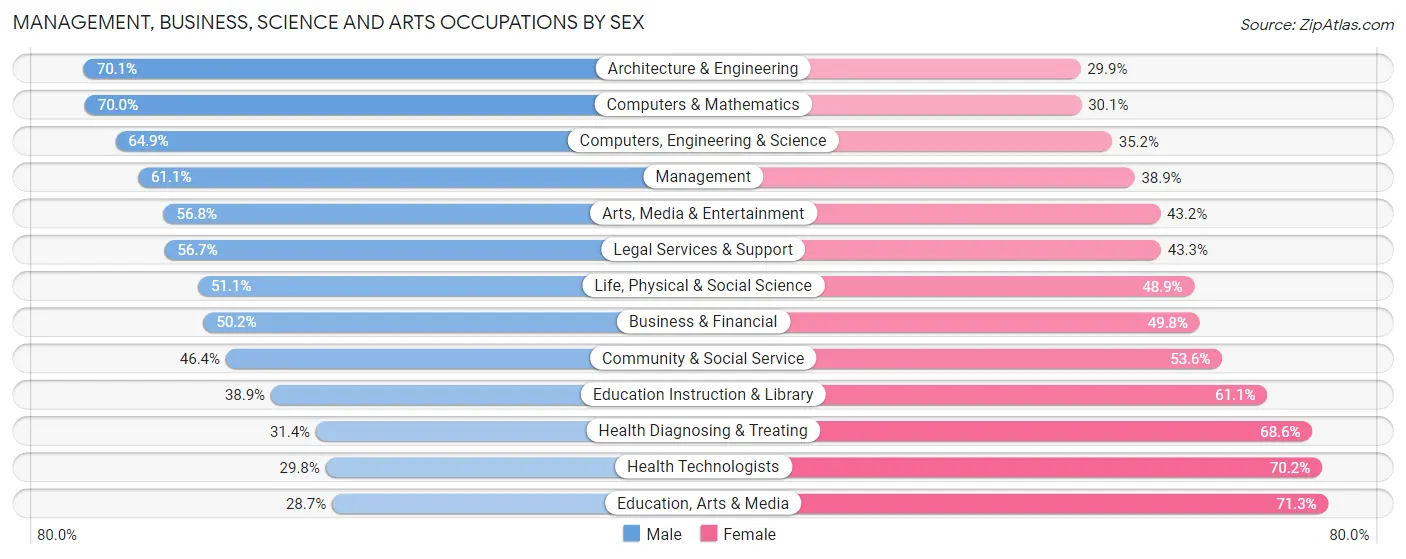
Management, Business, Science and Arts Occupations by Sex
Within the Management, Business, Science and Arts occupations in Pasadena, the most male-oriented occupations are Architecture & Engineering (70.1%), Computers & Mathematics (70.0%), and Computers, Engineering & Science (64.8%), while the most female-oriented occupations are Education, Arts & Media (71.3%), Health Technologists (70.2%), and Health Diagnosing & Treating (68.6%).
| Occupation | Male | Female |
| Management | 6,283 (61.1%) | 4,006 (38.9%) |
| Business & Financial | 2,942 (50.2%) | 2,923 (49.8%) |
| Computers, Engineering & Science | 4,832 (64.8%) | 2,619 (35.1%) |
| Computers & Mathematics | 2,158 (70.0%) | 927 (30.0%) |
| Architecture & Engineering | 1,636 (70.1%) | 697 (29.9%) |
| Life, Physical & Social Science | 1,038 (51.1%) | 995 (48.9%) |
| Community & Social Service | 6,765 (46.4%) | 7,813 (53.6%) |
| Education, Arts & Media | 485 (28.7%) | 1,205 (71.3%) |
| Legal Services & Support | 1,193 (56.7%) | 912 (43.3%) |
| Education Instruction & Library | 2,253 (38.9%) | 3,540 (61.1%) |
| Arts, Media & Entertainment | 2,834 (56.8%) | 2,156 (43.2%) |
| Health Diagnosing & Treating | 1,566 (31.4%) | 3,425 (68.6%) |
| Health Technologists | 1,166 (29.8%) | 2,751 (70.2%) |
| Total (Category) | 22,388 (51.9%) | 20,786 (48.1%) |
| Total (Overall) | 39,364 (53.2%) | 34,566 (46.8%) |
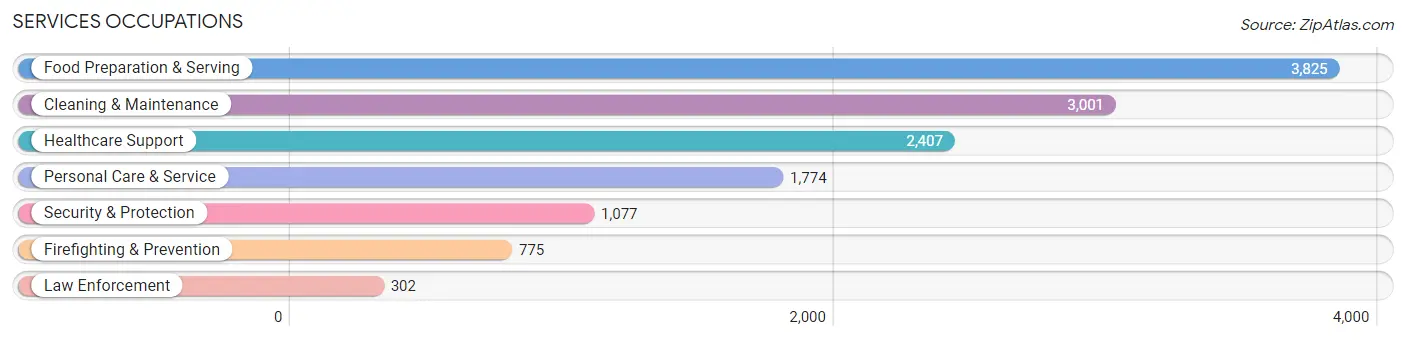
Services Occupations
The most common Services occupations in Pasadena are Food Preparation & Serving (3,825 | 5.2%), Cleaning & Maintenance (3,001 | 4.1%), Healthcare Support (2,407 | 3.3%), Personal Care & Service (1,774 | 2.4%), and Security & Protection (1,077 | 1.5%).
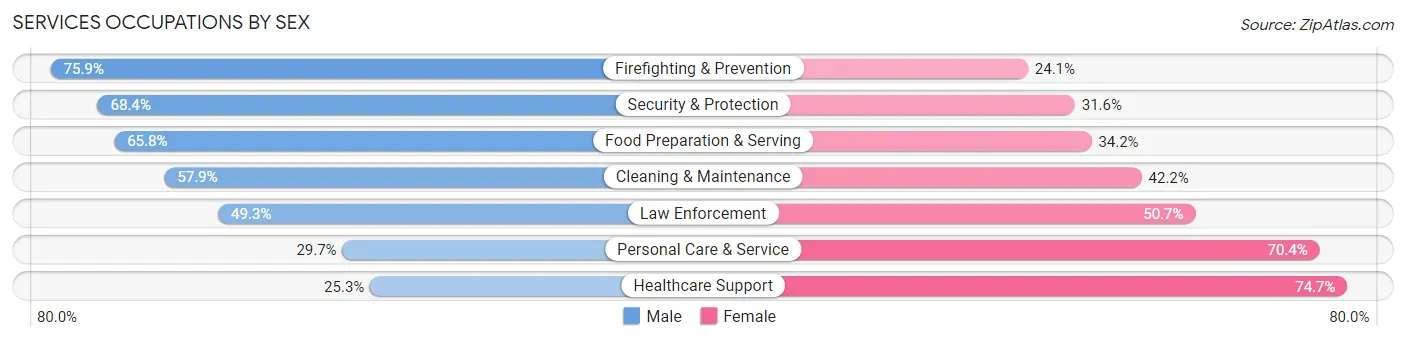
Services Occupations by Sex
Within the Services occupations in Pasadena, the most male-oriented occupations are Firefighting & Prevention (75.9%), Security & Protection (68.4%), and Food Preparation & Serving (65.8%), while the most female-oriented occupations are Healthcare Support (74.7%), Personal Care & Service (70.4%), and Law Enforcement (50.7%).
| Occupation | Male | Female |
| Healthcare Support | 608 (25.3%) | 1,799 (74.7%) |
| Security & Protection | 737 (68.4%) | 340 (31.6%) |
| Firefighting & Prevention | 588 (75.9%) | 187 (24.1%) |
| Law Enforcement | 149 (49.3%) | 153 (50.7%) |
| Food Preparation & Serving | 2,517 (65.8%) | 1,308 (34.2%) |
| Cleaning & Maintenance | 1,736 (57.9%) | 1,265 (42.1%) |
| Personal Care & Service | 526 (29.6%) | 1,248 (70.4%) |
| Total (Category) | 6,124 (50.7%) | 5,960 (49.3%) |
| Total (Overall) | 39,364 (53.2%) | 34,566 (46.8%) |
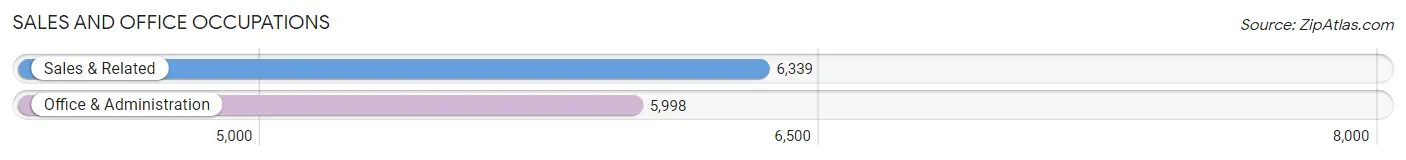
Sales and Office Occupations
The most common Sales and Office occupations in Pasadena are Sales & Related (6,339 | 8.6%), and Office & Administration (5,998 | 8.1%).
Sales and Office Occupations by Sex
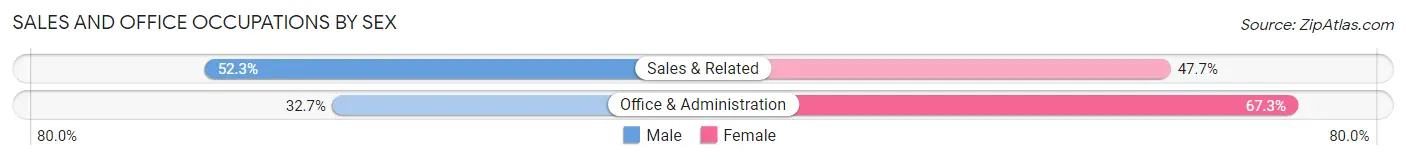
| Occupation | Male | Female |
| Sales & Related | 3,314 (52.3%) | 3,025 (47.7%) |
| Office & Administration | 1,964 (32.7%) | 4,034 (67.3%) |
| Total (Category) | 5,278 (42.8%) | 7,059 (57.2%) |
| Total (Overall) | 39,364 (53.2%) | 34,566 (46.8%) |
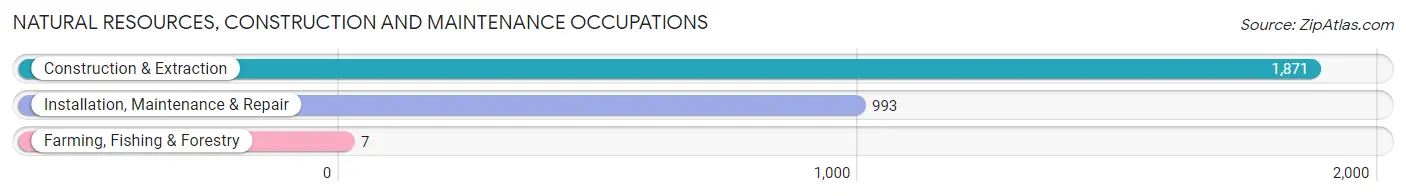
Natural Resources, Construction and Maintenance Occupations
The most common Natural Resources, Construction and Maintenance occupations in Pasadena are Construction & Extraction (1,871 | 2.5%), Installation, Maintenance & Repair (993 | 1.3%), and Farming, Fishing & Forestry (7 | 0.0%).
Natural Resources, Construction and Maintenance Occupations by Sex
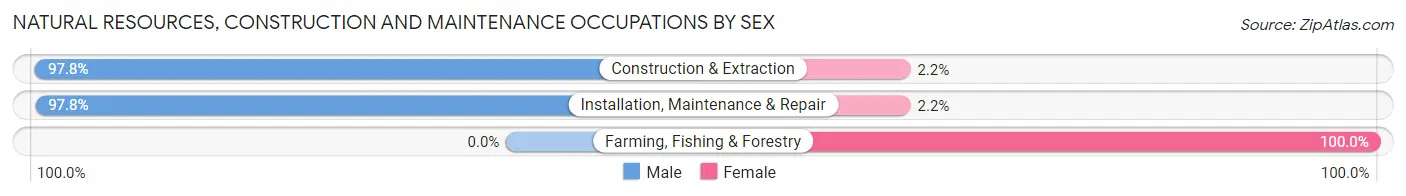
| Occupation | Male | Female |
| Farming, Fishing & Forestry | 0 (0.0%) | 7 (100.0%) |
| Construction & Extraction | 1,830 (97.8%) | 41 (2.2%) |
| Installation, Maintenance & Repair | 971 (97.8%) | 22 (2.2%) |
| Total (Category) | 2,801 (97.6%) | 70 (2.4%) |
| Total (Overall) | 39,364 (53.2%) | 34,566 (46.8%) |
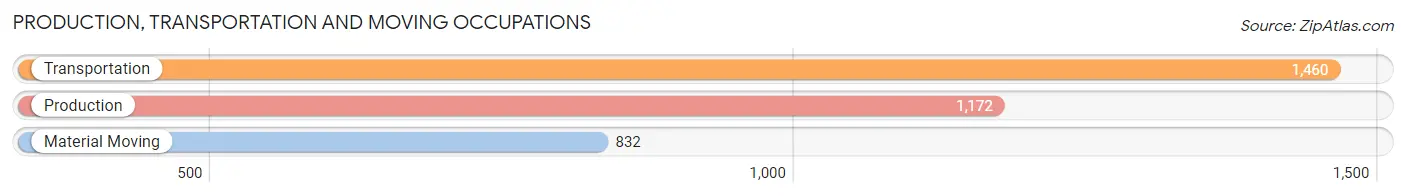
Production, Transportation and Moving Occupations
The most common Production, Transportation and Moving occupations in Pasadena are Transportation (1,460 | 2.0%), Production (1,172 | 1.6%), and Material Moving (832 | 1.1%).
Production, Transportation and Moving Occupations by Sex
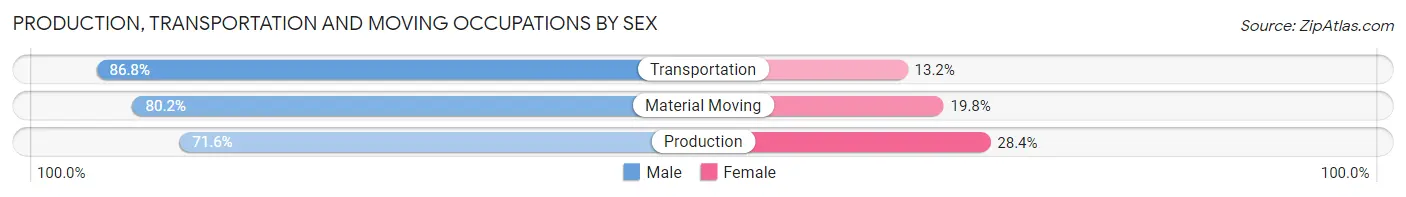
| Occupation | Male | Female |
| Production | 839 (71.6%) | 333 (28.4%) |
| Transportation | 1,267 (86.8%) | 193 (13.2%) |
| Material Moving | 667 (80.2%) | 165 (19.8%) |
| Total (Category) | 2,773 (80.0%) | 691 (20.0%) |
| Total (Overall) | 39,364 (53.2%) | 34,566 (46.8%) |
Employment Industries by Sex in Pasadena
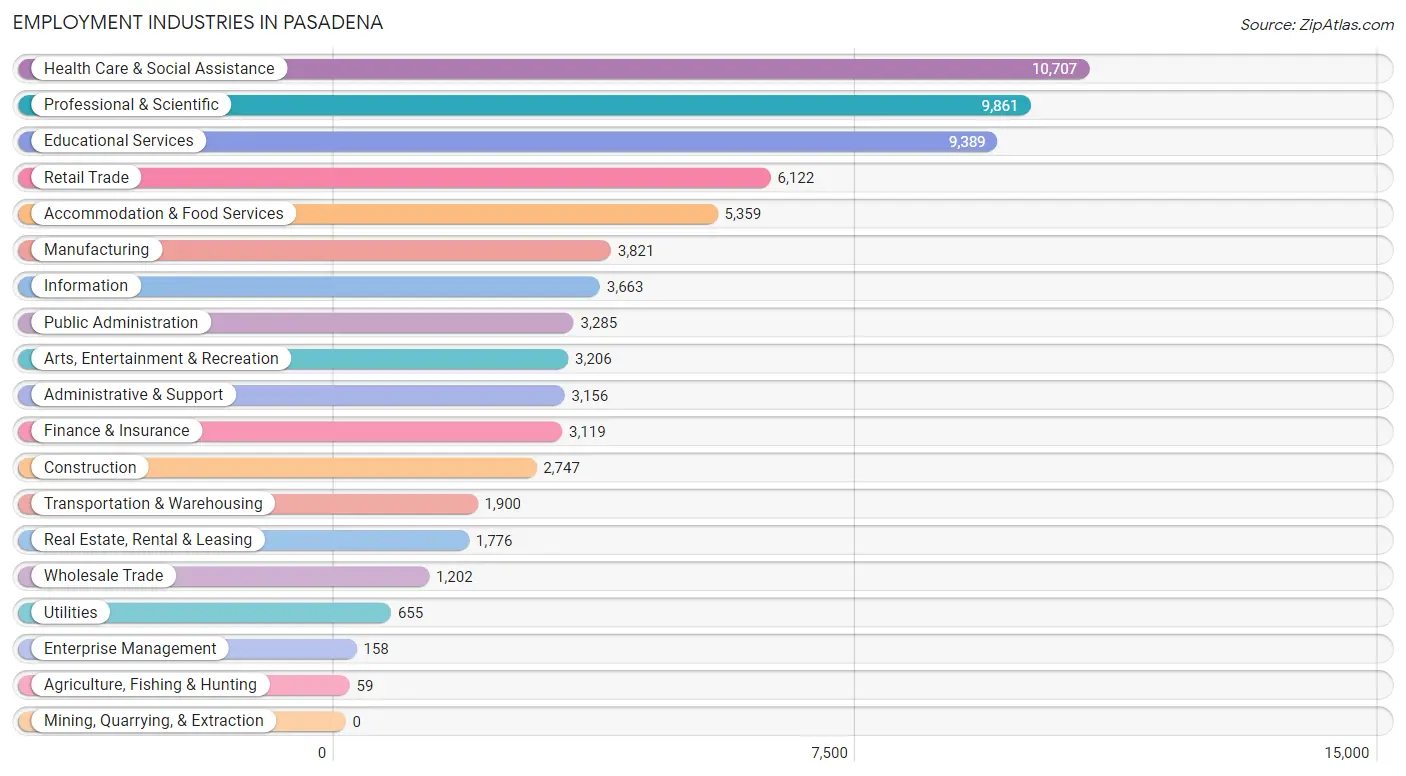
Employment Industries in Pasadena
The major employment industries in Pasadena include Health Care & Social Assistance (10,707 | 14.5%), Professional & Scientific (9,861 | 13.3%), Educational Services (9,389 | 12.7%), Retail Trade (6,122 | 8.3%), and Accommodation & Food Services (5,359 | 7.2%).
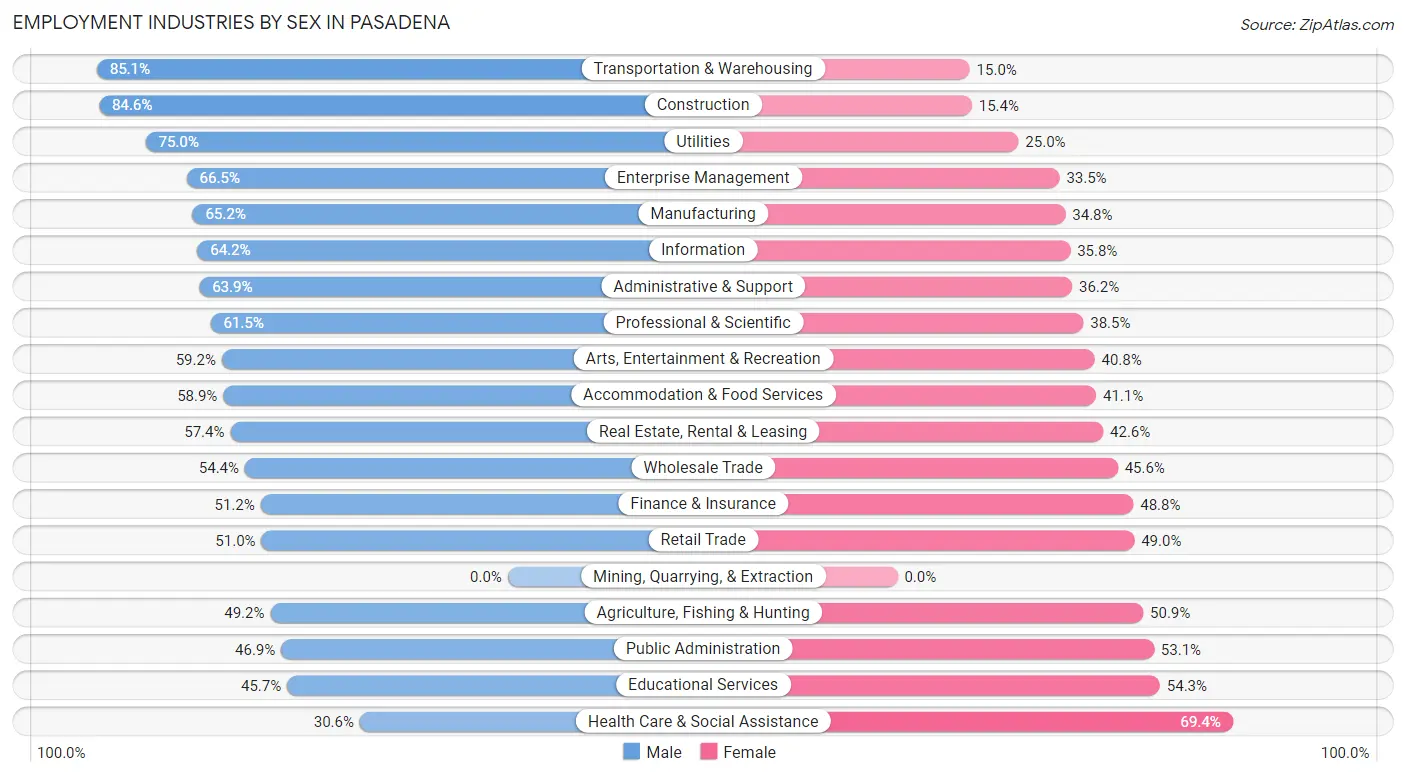
Employment Industries by Sex in Pasadena
The Pasadena industries that see more men than women are Transportation & Warehousing (85.1%), Construction (84.6%), and Utilities (75.0%), whereas the industries that tend to have a higher number of women are Health Care & Social Assistance (69.4%), Educational Services (54.3%), and Public Administration (53.1%).
| Industry | Male | Female |
| Agriculture, Fishing & Hunting | 29 (49.1%) | 30 (50.8%) |
| Mining, Quarrying, & Extraction | 0 (0.0%) | 0 (0.0%) |
| Construction | 2,324 (84.6%) | 423 (15.4%) |
| Manufacturing | 2,493 (65.2%) | 1,328 (34.8%) |
| Wholesale Trade | 654 (54.4%) | 548 (45.6%) |
| Retail Trade | 3,121 (51.0%) | 3,001 (49.0%) |
| Transportation & Warehousing | 1,616 (85.1%) | 284 (14.9%) |
| Utilities | 491 (75.0%) | 164 (25.0%) |
| Information | 2,353 (64.2%) | 1,310 (35.8%) |
| Finance & Insurance | 1,596 (51.2%) | 1,523 (48.8%) |
| Real Estate, Rental & Leasing | 1,020 (57.4%) | 756 (42.6%) |
| Professional & Scientific | 6,066 (61.5%) | 3,795 (38.5%) |
| Enterprise Management | 105 (66.5%) | 53 (33.5%) |
| Administrative & Support | 2,015 (63.8%) | 1,141 (36.1%) |
| Educational Services | 4,289 (45.7%) | 5,100 (54.3%) |
| Health Care & Social Assistance | 3,278 (30.6%) | 7,429 (69.4%) |
| Arts, Entertainment & Recreation | 1,898 (59.2%) | 1,308 (40.8%) |
| Accommodation & Food Services | 3,156 (58.9%) | 2,203 (41.1%) |
| Public Administration | 1,541 (46.9%) | 1,744 (53.1%) |
| Total | 39,364 (53.2%) | 34,566 (46.8%) |
Education in Pasadena
School Enrollment in Pasadena
The most common levels of schooling among the 30,213 students in Pasadena are college / undergraduate (7,994 | 26.5%), middle school (5,358 | 17.7%), and high school (5,169 | 17.1%).
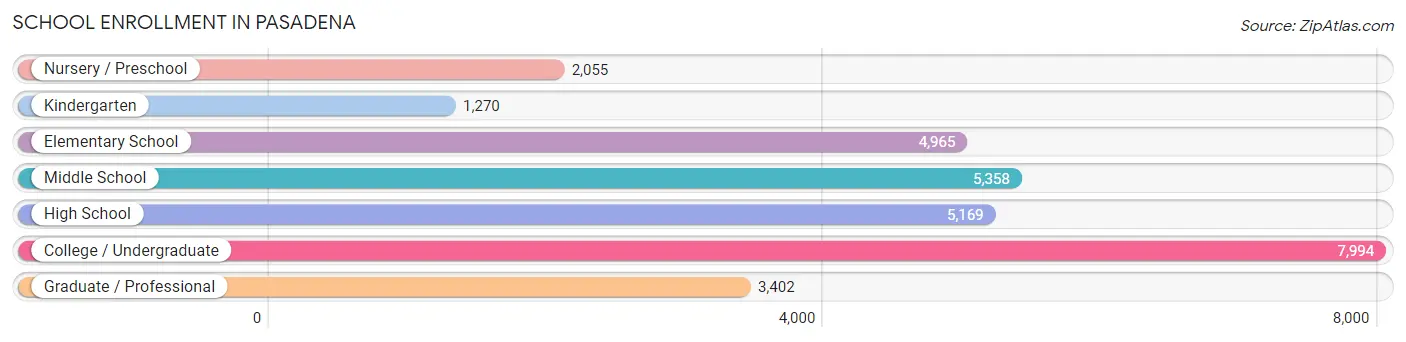
| School Level | # Students | % Students |
| Nursery / Preschool | 2,055 | 6.8% |
| Kindergarten | 1,270 | 4.2% |
| Elementary School | 4,965 | 16.4% |
| Middle School | 5,358 | 17.7% |
| High School | 5,169 | 17.1% |
| College / Undergraduate | 7,994 | 26.5% |
| Graduate / Professional | 3,402 | 11.3% |
| Total | 30,213 | 100.0% |
School Enrollment by Age by Funding Source in Pasadena
Out of a total of 30,213 students who are enrolled in schools in Pasadena, 10,212 (33.8%) attend a private institution, while the remaining 20,001 (66.2%) are enrolled in public schools. The age group of 3 to 4 year olds has the highest likelihood of being enrolled in private schools, with 1,212 (61.5% in the age bracket) enrolled. Conversely, the age group of 10 to 14 year olds has the lowest likelihood of being enrolled in a private school, with 5,149 (76.0% in the age bracket) attending a public institution.
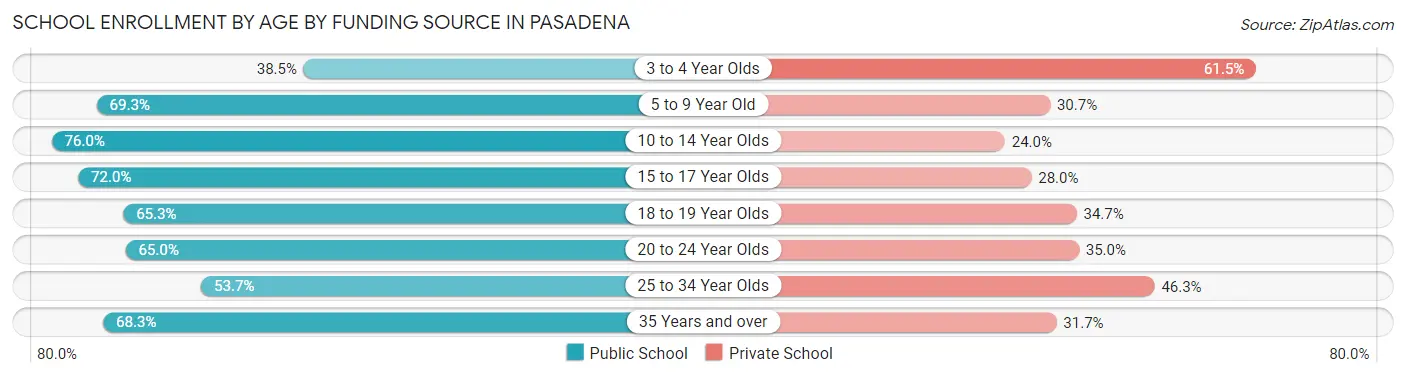
| Age Bracket | Public School | Private School |
| 3 to 4 Year Olds | 760 (38.5%) | 1,212 (61.5%) |
| 5 to 9 Year Old | 3,939 (69.3%) | 1,748 (30.7%) |
| 10 to 14 Year Olds | 5,149 (76.0%) | 1,627 (24.0%) |
| 15 to 17 Year Olds | 2,545 (72.0%) | 988 (28.0%) |
| 18 to 19 Year Olds | 1,517 (65.3%) | 806 (34.7%) |
| 20 to 24 Year Olds | 2,677 (65.0%) | 1,444 (35.0%) |
| 25 to 34 Year Olds | 2,039 (53.7%) | 1,759 (46.3%) |
| 35 Years and over | 1,368 (68.3%) | 635 (31.7%) |
| Total | 20,001 (66.2%) | 10,212 (33.8%) |
Educational Attainment by Field of Study in Pasadena
Business (9,087 | 14.8%), social sciences (7,800 | 12.7%), visual & performing arts (6,165 | 10.1%), engineering (5,467 | 8.9%), and literature & languages (4,196 | 6.8%) are the most common fields of study among 61,321 individuals in Pasadena who have obtained a bachelor's degree or higher.
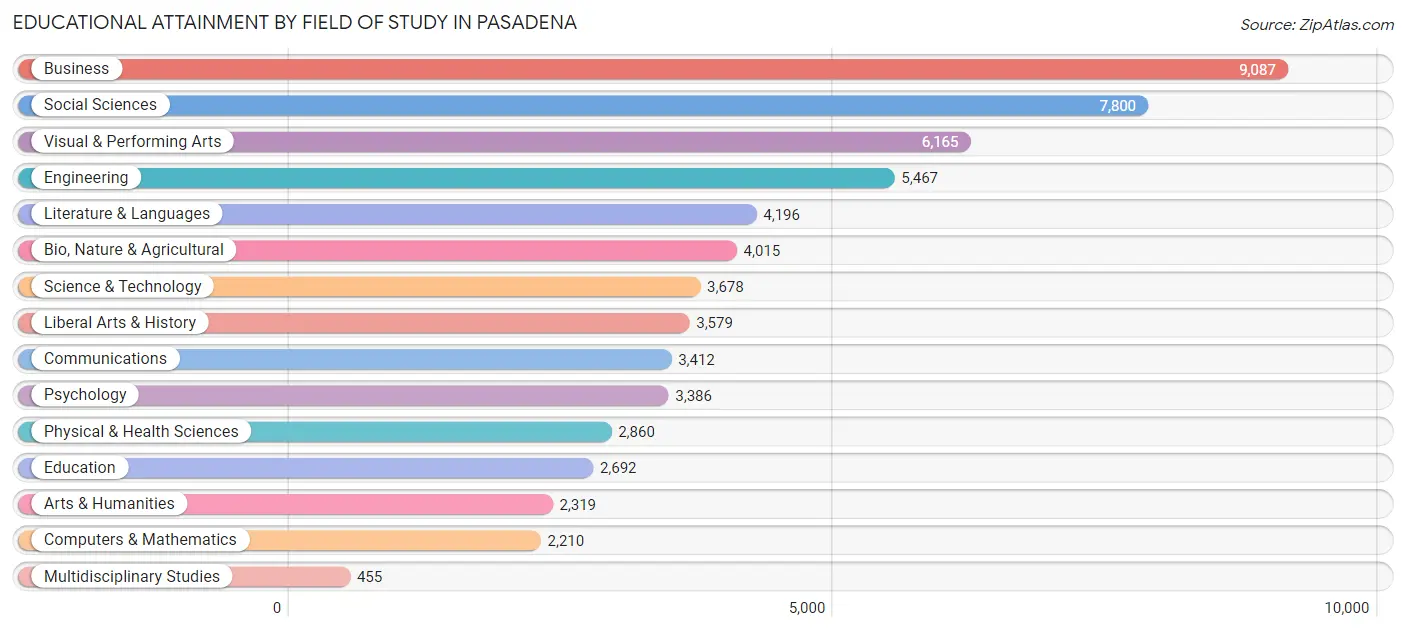
| Field of Study | # Graduates | % Graduates |
| Computers & Mathematics | 2,210 | 3.6% |
| Bio, Nature & Agricultural | 4,015 | 6.6% |
| Physical & Health Sciences | 2,860 | 4.7% |
| Psychology | 3,386 | 5.5% |
| Social Sciences | 7,800 | 12.7% |
| Engineering | 5,467 | 8.9% |
| Multidisciplinary Studies | 455 | 0.7% |
| Science & Technology | 3,678 | 6.0% |
| Business | 9,087 | 14.8% |
| Education | 2,692 | 4.4% |
| Literature & Languages | 4,196 | 6.8% |
| Liberal Arts & History | 3,579 | 5.8% |
| Visual & Performing Arts | 6,165 | 10.1% |
| Communications | 3,412 | 5.6% |
| Arts & Humanities | 2,319 | 3.8% |
| Total | 61,321 | 100.0% |
Transportation & Commute in Pasadena
Vehicle Availability by Sex in Pasadena
The most prevalent vehicle ownership categories in Pasadena are males with 2 vehicles (16,824, accounting for 43.6%) and females with 2 vehicles (13,856, making up 50.6%).
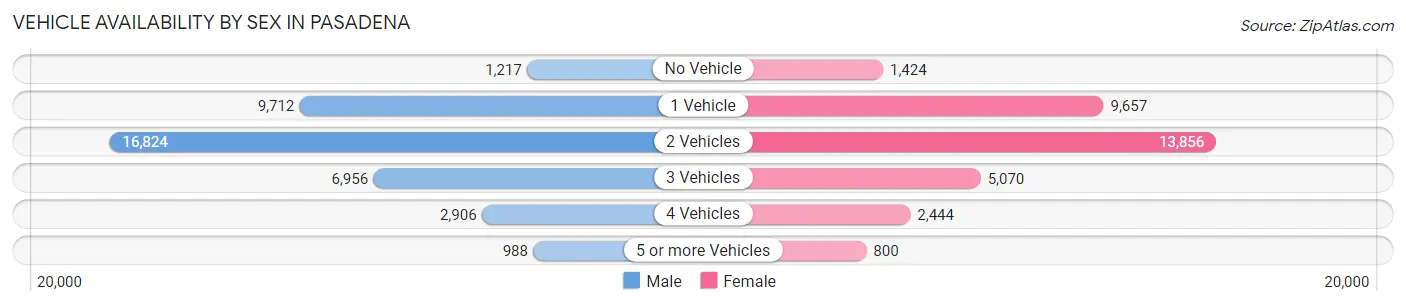
| Vehicles Available | Male | Female |
| No Vehicle | 1,217 (3.2%) | 1,424 (4.3%) |
| 1 Vehicle | 9,712 (25.2%) | 9,657 (29.0%) |
| 2 Vehicles | 16,824 (43.6%) | 13,856 (41.7%) |
| 3 Vehicles | 6,956 (18.0%) | 5,070 (15.2%) |
| 4 Vehicles | 2,906 (7.5%) | 2,444 (7.3%) |
| 5 or more Vehicles | 988 (2.6%) | 800 (2.4%) |
| Total | 38,603 (100.0%) | 33,251 (100.0%) |
Commute Time in Pasadena
The most frequently occuring commute durations in Pasadena are 30 to 34 minutes (8,908 commuters, 15.4%), 15 to 19 minutes (8,627 commuters, 14.9%), and 10 to 14 minutes (8,568 commuters, 14.8%).
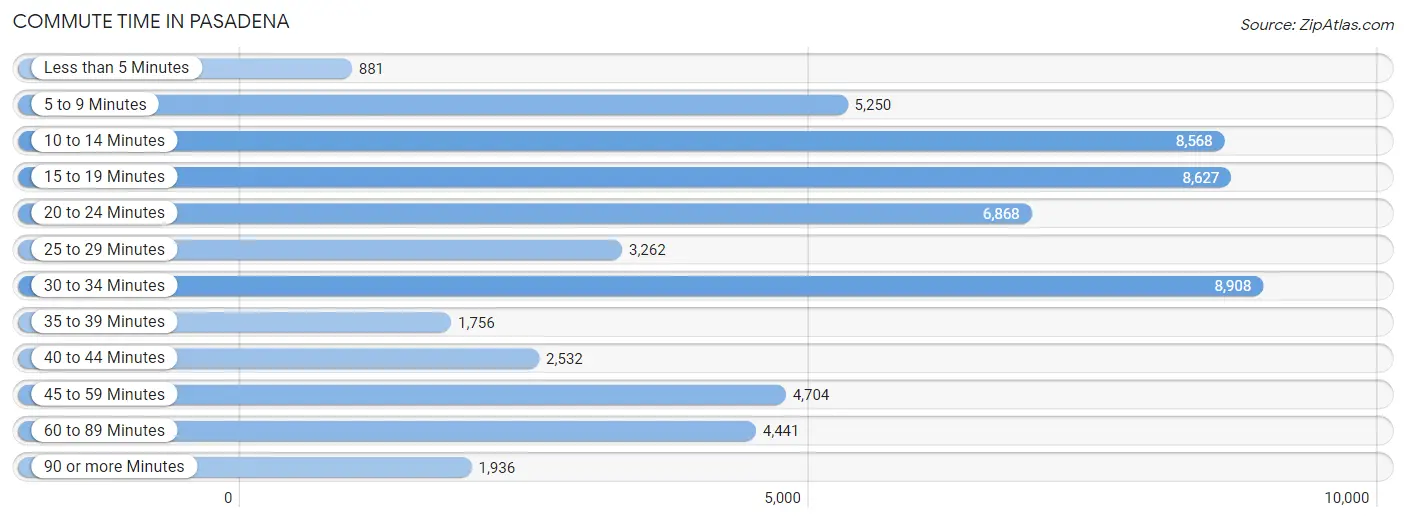
| Commute Time | # Commuters | % Commuters |
| Less than 5 Minutes | 881 | 1.5% |
| 5 to 9 Minutes | 5,250 | 9.1% |
| 10 to 14 Minutes | 8,568 | 14.8% |
| 15 to 19 Minutes | 8,627 | 14.9% |
| 20 to 24 Minutes | 6,868 | 11.9% |
| 25 to 29 Minutes | 3,262 | 5.7% |
| 30 to 34 Minutes | 8,908 | 15.4% |
| 35 to 39 Minutes | 1,756 | 3.0% |
| 40 to 44 Minutes | 2,532 | 4.4% |
| 45 to 59 Minutes | 4,704 | 8.2% |
| 60 to 89 Minutes | 4,441 | 7.7% |
| 90 or more Minutes | 1,936 | 3.4% |
Commute Time by Sex in Pasadena
The most common commute times in Pasadena are 30 to 34 minutes (4,809 commuters, 15.5%) for males and 10 to 14 minutes (4,406 commuters, 16.5%) for females.
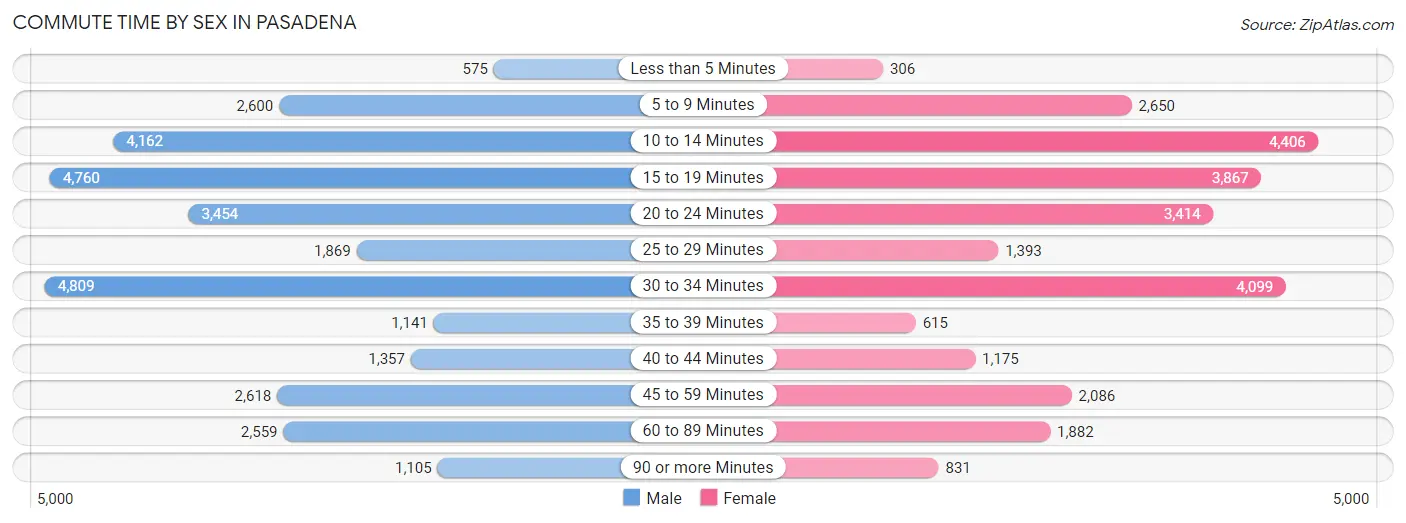
| Commute Time | Male | Female |
| Less than 5 Minutes | 575 (1.8%) | 306 (1.1%) |
| 5 to 9 Minutes | 2,600 (8.4%) | 2,650 (9.9%) |
| 10 to 14 Minutes | 4,162 (13.4%) | 4,406 (16.5%) |
| 15 to 19 Minutes | 4,760 (15.3%) | 3,867 (14.5%) |
| 20 to 24 Minutes | 3,454 (11.1%) | 3,414 (12.8%) |
| 25 to 29 Minutes | 1,869 (6.0%) | 1,393 (5.2%) |
| 30 to 34 Minutes | 4,809 (15.5%) | 4,099 (15.3%) |
| 35 to 39 Minutes | 1,141 (3.7%) | 615 (2.3%) |
| 40 to 44 Minutes | 1,357 (4.4%) | 1,175 (4.4%) |
| 45 to 59 Minutes | 2,618 (8.4%) | 2,086 (7.8%) |
| 60 to 89 Minutes | 2,559 (8.3%) | 1,882 (7.0%) |
| 90 or more Minutes | 1,105 (3.6%) | 831 (3.1%) |
Time of Departure to Work by Sex in Pasadena
The most frequent times of departure to work in Pasadena are 8:00 AM to 8:29 AM (6,100, 19.7%) for males and 8:00 AM to 8:29 AM (5,271, 19.7%) for females.
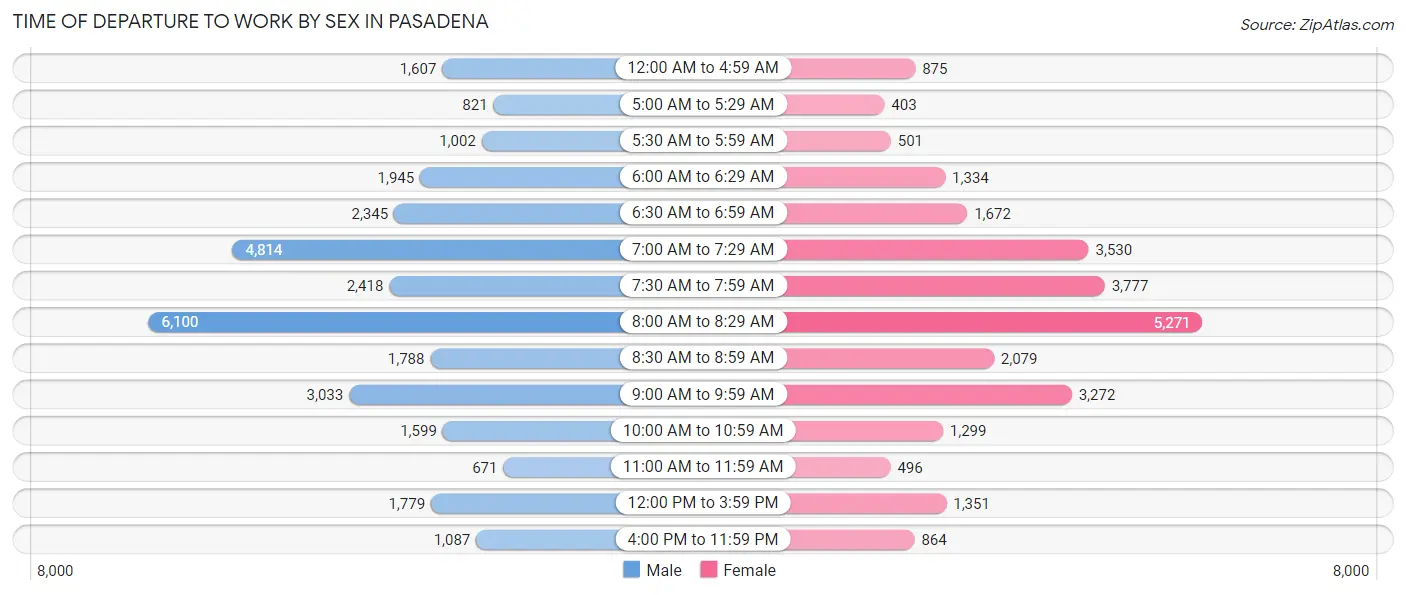
| Time of Departure | Male | Female |
| 12:00 AM to 4:59 AM | 1,607 (5.2%) | 875 (3.3%) |
| 5:00 AM to 5:29 AM | 821 (2.6%) | 403 (1.5%) |
| 5:30 AM to 5:59 AM | 1,002 (3.2%) | 501 (1.9%) |
| 6:00 AM to 6:29 AM | 1,945 (6.3%) | 1,334 (5.0%) |
| 6:30 AM to 6:59 AM | 2,345 (7.6%) | 1,672 (6.3%) |
| 7:00 AM to 7:29 AM | 4,814 (15.5%) | 3,530 (13.2%) |
| 7:30 AM to 7:59 AM | 2,418 (7.8%) | 3,777 (14.1%) |
| 8:00 AM to 8:29 AM | 6,100 (19.7%) | 5,271 (19.7%) |
| 8:30 AM to 8:59 AM | 1,788 (5.8%) | 2,079 (7.8%) |
| 9:00 AM to 9:59 AM | 3,033 (9.8%) | 3,272 (12.2%) |
| 10:00 AM to 10:59 AM | 1,599 (5.2%) | 1,299 (4.9%) |
| 11:00 AM to 11:59 AM | 671 (2.2%) | 496 (1.9%) |
| 12:00 PM to 3:59 PM | 1,779 (5.7%) | 1,351 (5.1%) |
| 4:00 PM to 11:59 PM | 1,087 (3.5%) | 864 (3.2%) |
| Total | 31,009 (100.0%) | 26,724 (100.0%) |
Housing Occupancy in Pasadena
Occupancy by Ownership in Pasadena
Of the total 56,076 dwellings in Pasadena, owner-occupied units account for 23,622 (42.1%), while renter-occupied units make up 32,454 (57.9%).
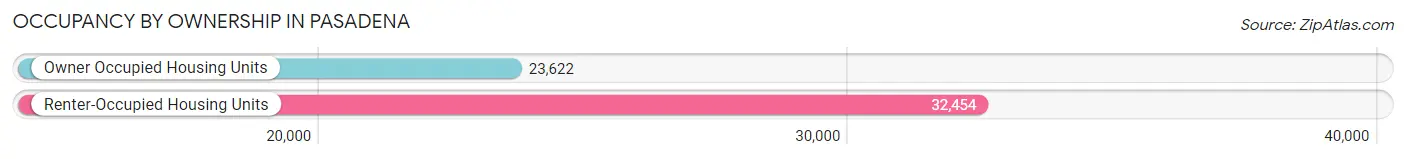
| Occupancy | # Housing Units | % Housing Units |
| Owner Occupied Housing Units | 23,622 | 42.1% |
| Renter-Occupied Housing Units | 32,454 | 57.9% |
| Total Occupied Housing Units | 56,076 | 100.0% |
Occupancy by Household Size in Pasadena
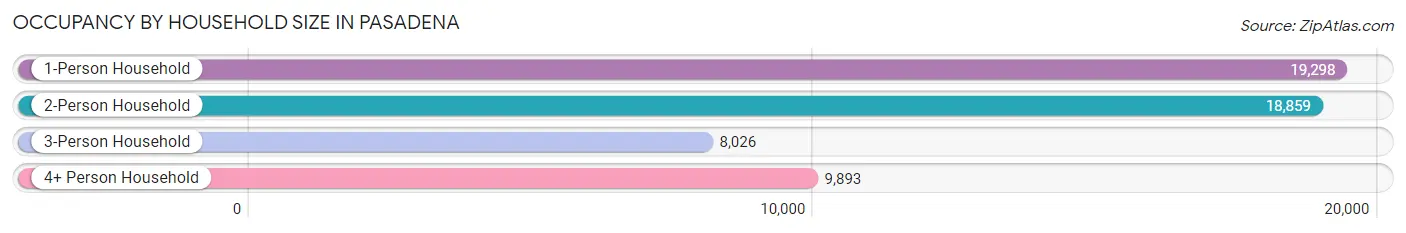
| Household Size | # Housing Units | % Housing Units |
| 1-Person Household | 19,298 | 34.4% |
| 2-Person Household | 18,859 | 33.6% |
| 3-Person Household | 8,026 | 14.3% |
| 4+ Person Household | 9,893 | 17.6% |
| Total Housing Units | 56,076 | 100.0% |
Occupancy by Ownership by Household Size in Pasadena
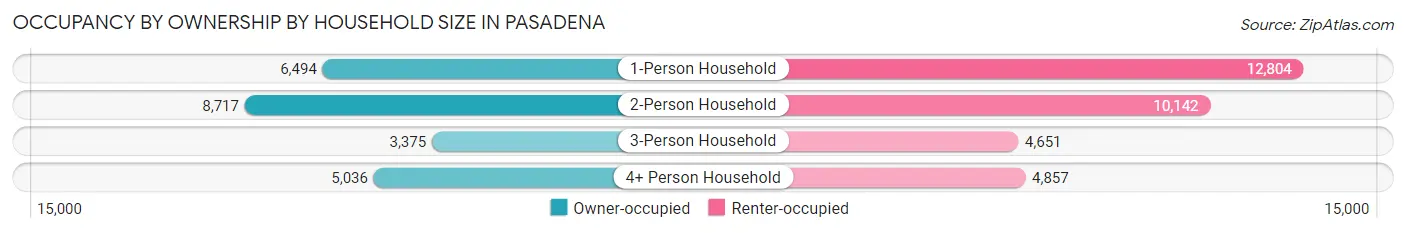
| Household Size | Owner-occupied | Renter-occupied |
| 1-Person Household | 6,494 (33.7%) | 12,804 (66.3%) |
| 2-Person Household | 8,717 (46.2%) | 10,142 (53.8%) |
| 3-Person Household | 3,375 (42.0%) | 4,651 (58.0%) |
| 4+ Person Household | 5,036 (50.9%) | 4,857 (49.1%) |
| Total Housing Units | 23,622 (42.1%) | 32,454 (57.9%) |
Occupancy by Educational Attainment in Pasadena
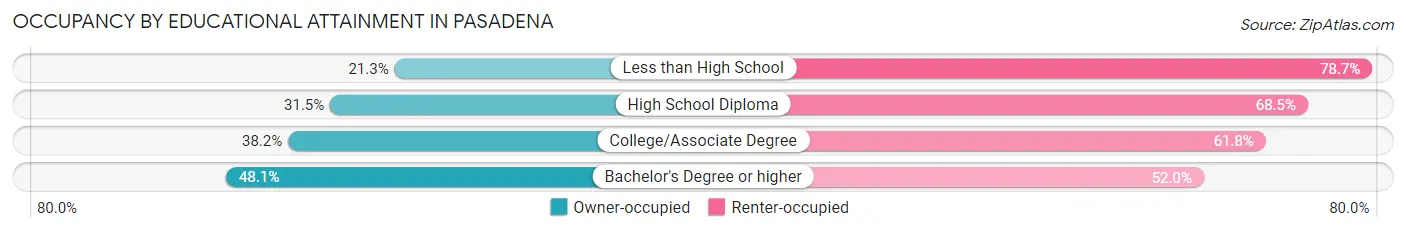
| Household Size | Owner-occupied | Renter-occupied |
| Less than High School | 951 (21.3%) | 3,508 (78.7%) |
| High School Diploma | 1,817 (31.5%) | 3,944 (68.5%) |
| College/Associate Degree | 4,585 (38.2%) | 7,410 (61.8%) |
| Bachelor's Degree or higher | 16,269 (48.0%) | 17,592 (51.9%) |
Occupancy by Age of Householder in Pasadena
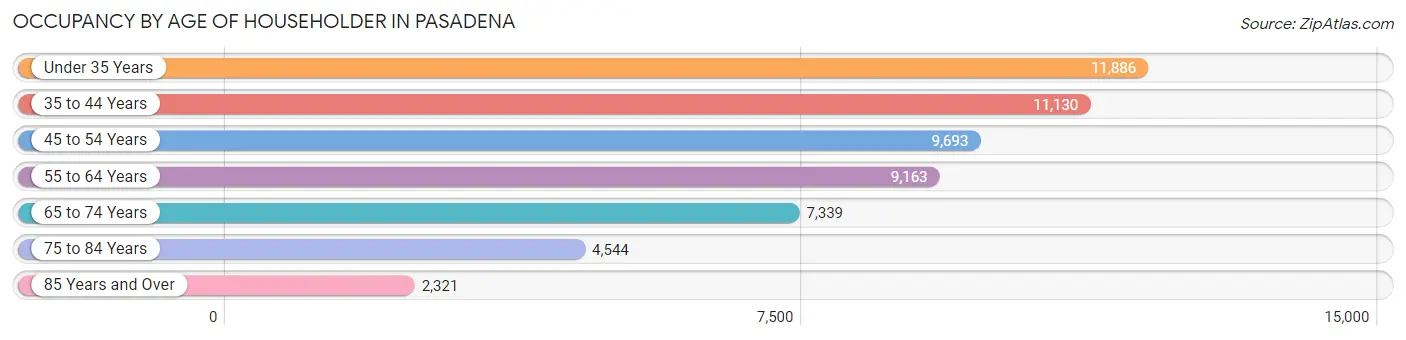
| Age Bracket | # Households | % Households |
| Under 35 Years | 11,886 | 21.2% |
| 35 to 44 Years | 11,130 | 19.9% |
| 45 to 54 Years | 9,693 | 17.3% |
| 55 to 64 Years | 9,163 | 16.3% |
| 65 to 74 Years | 7,339 | 13.1% |
| 75 to 84 Years | 4,544 | 8.1% |
| 85 Years and Over | 2,321 | 4.1% |
| Total | 56,076 | 100.0% |
Housing Finances in Pasadena
Median Income by Occupancy in Pasadena
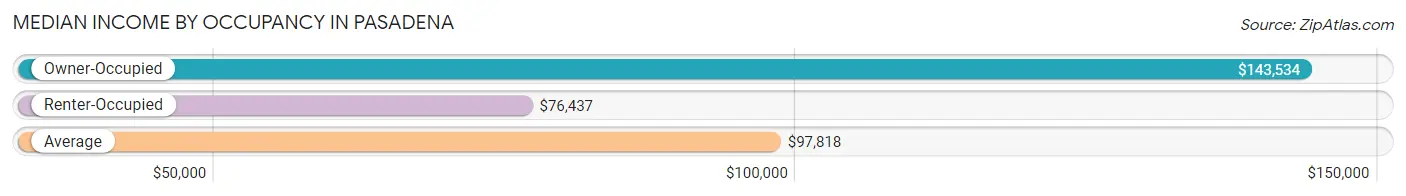
| Occupancy Type | # Households | Median Income |
| Owner-Occupied | 23,622 (42.1%) | $143,534 |
| Renter-Occupied | 32,454 (57.9%) | $76,437 |
| Average | 56,076 (100.0%) | $97,818 |
Occupancy by Householder Income Bracket in Pasadena
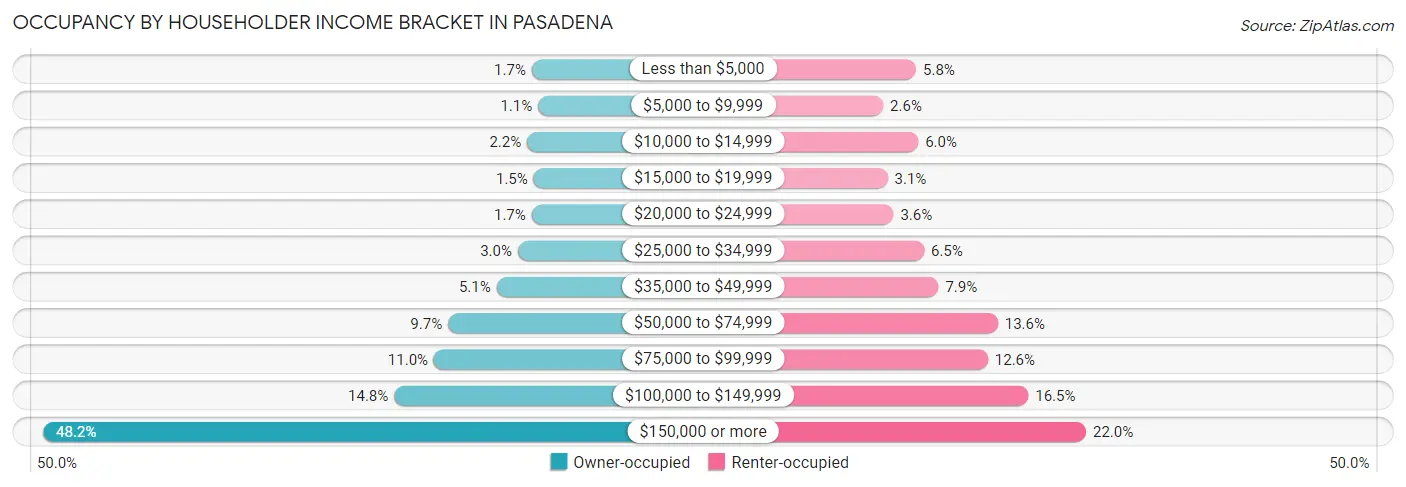
| Income Bracket | Owner-occupied | Renter-occupied |
| Less than $5,000 | 401 (1.7%) | 1,871 (5.8%) |
| $5,000 to $9,999 | 259 (1.1%) | 852 (2.6%) |
| $10,000 to $14,999 | 509 (2.1%) | 1,939 (6.0%) |
| $15,000 to $19,999 | 358 (1.5%) | 991 (3.0%) |
| $20,000 to $24,999 | 405 (1.7%) | 1,170 (3.6%) |
| $25,000 to $34,999 | 715 (3.0%) | 2,115 (6.5%) |
| $35,000 to $49,999 | 1,192 (5.1%) | 2,564 (7.9%) |
| $50,000 to $74,999 | 2,287 (9.7%) | 4,399 (13.6%) |
| $75,000 to $99,999 | 2,602 (11.0%) | 4,089 (12.6%) |
| $100,000 to $149,999 | 3,498 (14.8%) | 5,339 (16.5%) |
| $150,000 or more | 11,396 (48.2%) | 7,125 (22.0%) |
| Total | 23,622 (100.0%) | 32,454 (100.0%) |
Monthly Housing Cost Tiers in Pasadena
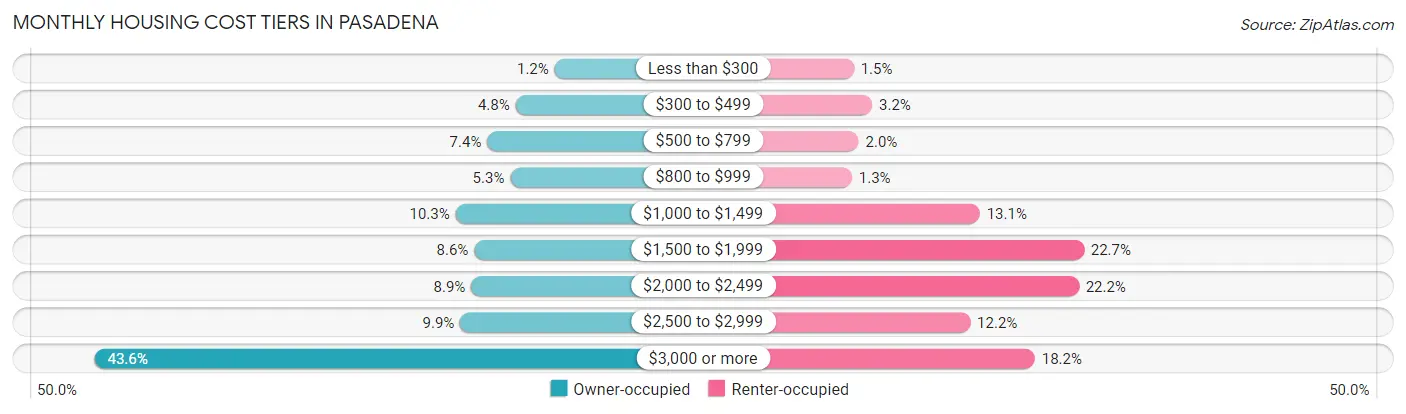
| Monthly Cost | Owner-occupied | Renter-occupied |
| Less than $300 | 286 (1.2%) | 486 (1.5%) |
| $300 to $499 | 1,134 (4.8%) | 1,034 (3.2%) |
| $500 to $799 | 1,750 (7.4%) | 634 (1.9%) |
| $800 to $999 | 1,250 (5.3%) | 431 (1.3%) |
| $1,000 to $1,499 | 2,440 (10.3%) | 4,250 (13.1%) |
| $1,500 to $1,999 | 2,033 (8.6%) | 7,361 (22.7%) |
| $2,000 to $2,499 | 2,100 (8.9%) | 7,209 (22.2%) |
| $2,500 to $2,999 | 2,339 (9.9%) | 3,966 (12.2%) |
| $3,000 or more | 10,290 (43.6%) | 5,898 (18.2%) |
| Total | 23,622 (100.0%) | 32,454 (100.0%) |
Physical Housing Characteristics in Pasadena
Housing Structures in Pasadena
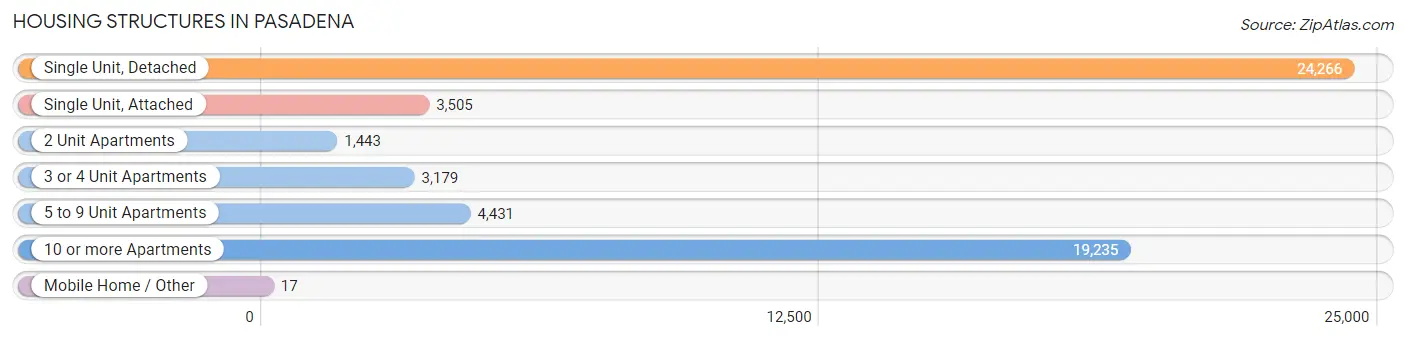
| Structure Type | # Housing Units | % Housing Units |
| Single Unit, Detached | 24,266 | 43.3% |
| Single Unit, Attached | 3,505 | 6.2% |
| 2 Unit Apartments | 1,443 | 2.6% |
| 3 or 4 Unit Apartments | 3,179 | 5.7% |
| 5 to 9 Unit Apartments | 4,431 | 7.9% |
| 10 or more Apartments | 19,235 | 34.3% |
| Mobile Home / Other | 17 | 0.0% |
| Total | 56,076 | 100.0% |
Housing Structures by Occupancy in Pasadena
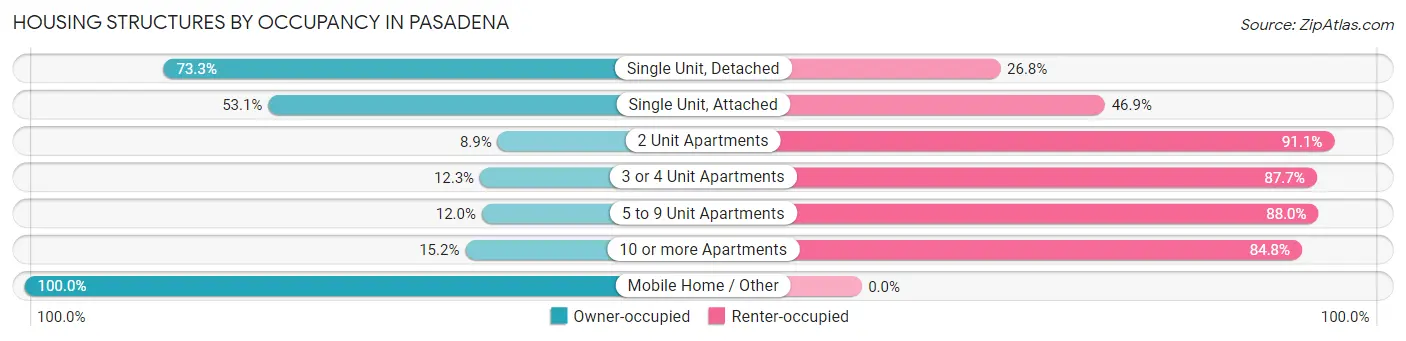
| Structure Type | Owner-occupied | Renter-occupied |
| Single Unit, Detached | 17,776 (73.3%) | 6,490 (26.8%) |
| Single Unit, Attached | 1,861 (53.1%) | 1,644 (46.9%) |
| 2 Unit Apartments | 129 (8.9%) | 1,314 (91.1%) |
| 3 or 4 Unit Apartments | 392 (12.3%) | 2,787 (87.7%) |
| 5 to 9 Unit Apartments | 531 (12.0%) | 3,900 (88.0%) |
| 10 or more Apartments | 2,916 (15.2%) | 16,319 (84.8%) |
| Mobile Home / Other | 17 (100.0%) | 0 (0.0%) |
| Total | 23,622 (42.1%) | 32,454 (57.9%) |
Housing Structures by Number of Rooms in Pasadena
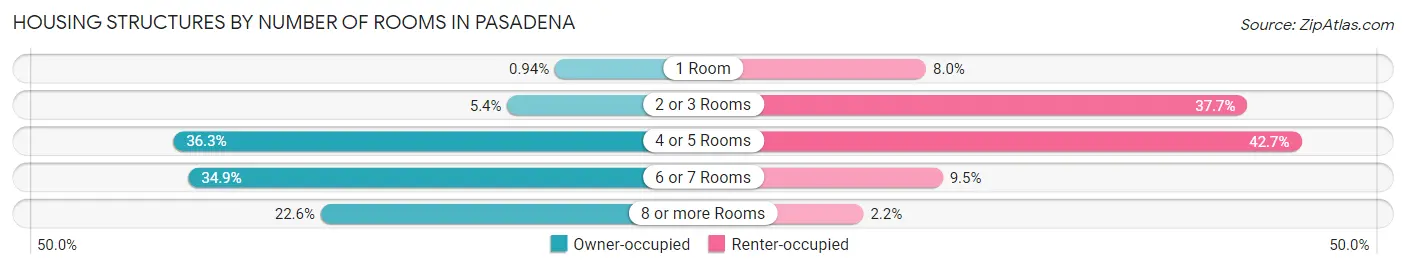
| Number of Rooms | Owner-occupied | Renter-occupied |
| 1 Room | 222 (0.9%) | 2,587 (8.0%) |
| 2 or 3 Rooms | 1,264 (5.3%) | 12,226 (37.7%) |
| 4 or 5 Rooms | 8,563 (36.2%) | 13,847 (42.7%) |
| 6 or 7 Rooms | 8,233 (34.8%) | 3,086 (9.5%) |
| 8 or more Rooms | 5,340 (22.6%) | 708 (2.2%) |
| Total | 23,622 (100.0%) | 32,454 (100.0%) |
Housing Structure by Heating Type in Pasadena
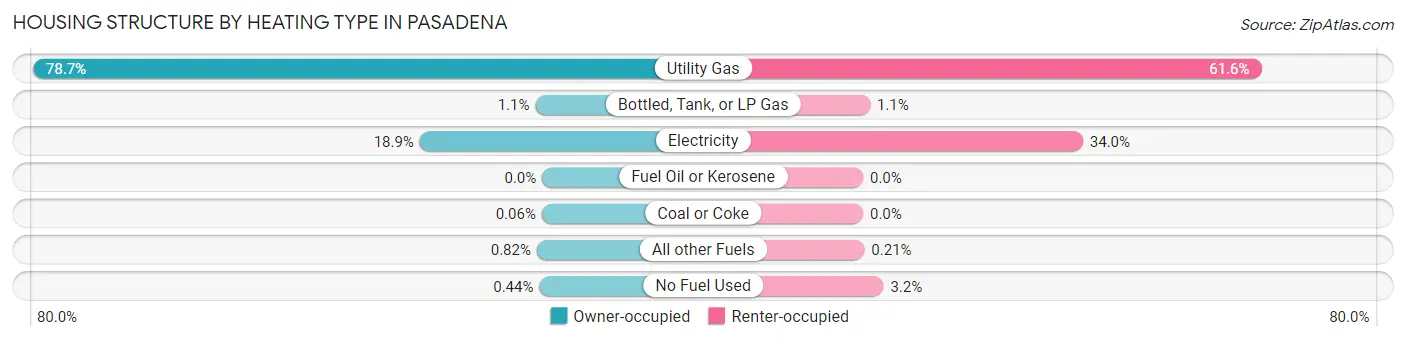
| Heating Type | Owner-occupied | Renter-occupied |
| Utility Gas | 18,593 (78.7%) | 19,979 (61.6%) |
| Bottled, Tank, or LP Gas | 249 (1.1%) | 352 (1.1%) |
| Electricity | 4,469 (18.9%) | 11,028 (34.0%) |
| Fuel Oil or Kerosene | 0 (0.0%) | 0 (0.0%) |
| Coal or Coke | 14 (0.1%) | 0 (0.0%) |
| All other Fuels | 194 (0.8%) | 68 (0.2%) |
| No Fuel Used | 103 (0.4%) | 1,027 (3.2%) |
| Total | 23,622 (100.0%) | 32,454 (100.0%) |
Household Vehicle Usage in Pasadena
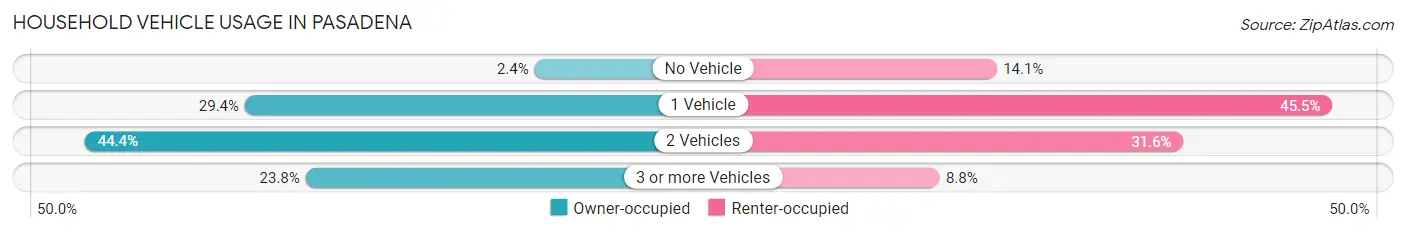
| Vehicles per Household | Owner-occupied | Renter-occupied |
| No Vehicle | 568 (2.4%) | 4,584 (14.1%) |
| 1 Vehicle | 6,955 (29.4%) | 14,764 (45.5%) |
| 2 Vehicles | 10,483 (44.4%) | 10,256 (31.6%) |
| 3 or more Vehicles | 5,616 (23.8%) | 2,850 (8.8%) |
| Total | 23,622 (100.0%) | 32,454 (100.0%) |
Real Estate & Mortgages in Pasadena
Real Estate and Mortgage Overview in Pasadena
| Characteristic | Without Mortgage | With Mortgage |
| Housing Units | 7,473 | 16,149 |
| Median Property Value | $974,900 | $984,300 |
| Median Household Income | $94,764 | $8,859 |
| Monthly Housing Costs | $920 | $10,000 |
| Real Estate Taxes | $4,273 | $63 |
Property Value by Mortgage Status in Pasadena
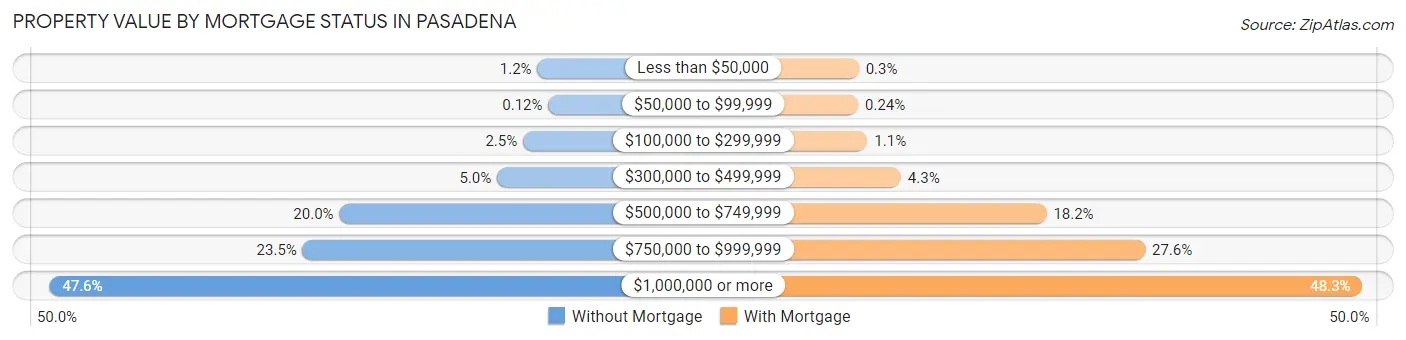
| Property Value | Without Mortgage | With Mortgage |
| Less than $50,000 | 87 (1.2%) | 48 (0.3%) |
| $50,000 to $99,999 | 9 (0.1%) | 38 (0.2%) |
| $100,000 to $299,999 | 189 (2.5%) | 182 (1.1%) |
| $300,000 to $499,999 | 374 (5.0%) | 698 (4.3%) |
| $500,000 to $749,999 | 1,496 (20.0%) | 2,936 (18.2%) |
| $750,000 to $999,999 | 1,758 (23.5%) | 4,452 (27.6%) |
| $1,000,000 or more | 3,560 (47.6%) | 7,795 (48.3%) |
| Total | 7,473 (100.0%) | 16,149 (100.0%) |
Household Income by Mortgage Status in Pasadena
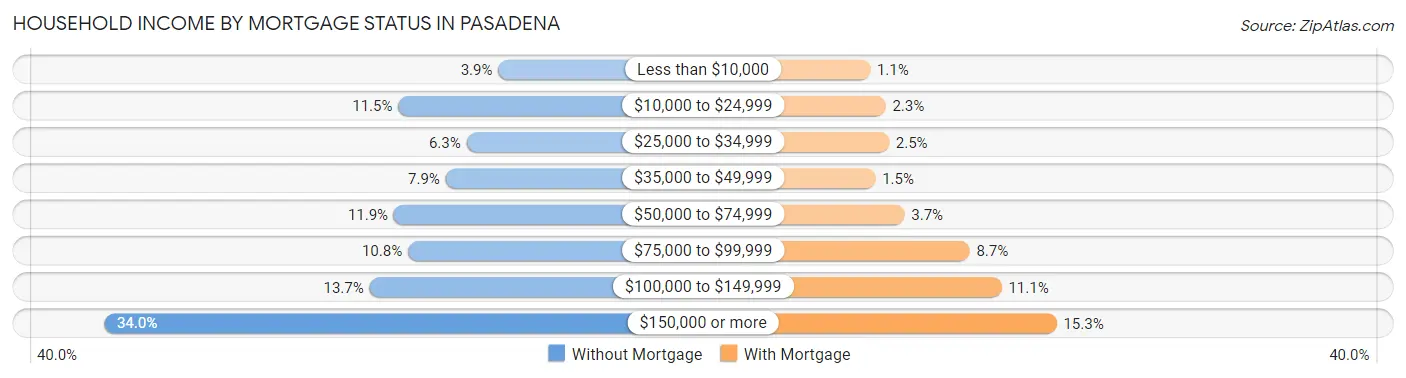
| Household Income | Without Mortgage | With Mortgage |
| Less than $10,000 | 292 (3.9%) | 177 (1.1%) |
| $10,000 to $24,999 | 862 (11.5%) | 368 (2.3%) |
| $25,000 to $34,999 | 473 (6.3%) | 410 (2.5%) |
| $35,000 to $49,999 | 592 (7.9%) | 242 (1.5%) |
| $50,000 to $74,999 | 886 (11.9%) | 600 (3.7%) |
| $75,000 to $99,999 | 806 (10.8%) | 1,401 (8.7%) |
| $100,000 to $149,999 | 1,025 (13.7%) | 1,796 (11.1%) |
| $150,000 or more | 2,537 (34.0%) | 2,473 (15.3%) |
| Total | 7,473 (100.0%) | 16,149 (100.0%) |
Property Value to Household Income Ratio in Pasadena
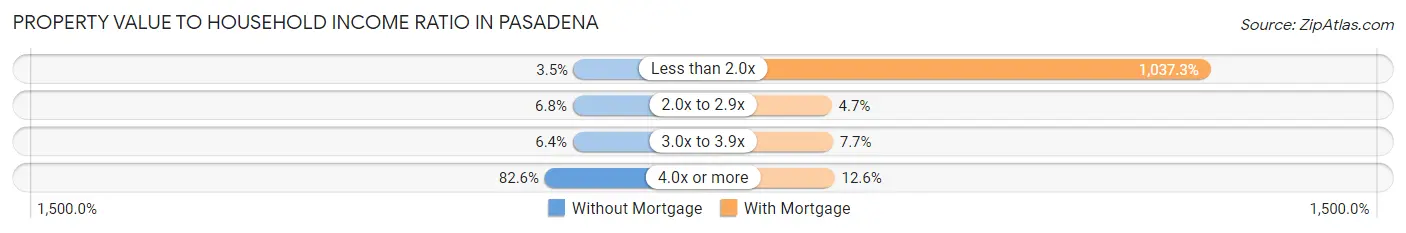
| Value-to-Income Ratio | Without Mortgage | With Mortgage |
| Less than 2.0x | 263 (3.5%) | 167,506 (1,037.3%) |
| 2.0x to 2.9x | 505 (6.8%) | 751 (4.6%) |
| 3.0x to 3.9x | 475 (6.4%) | 1,249 (7.7%) |
| 4.0x or more | 6,176 (82.6%) | 2,036 (12.6%) |
| Total | 7,473 (100.0%) | 16,149 (100.0%) |
Real Estate Taxes by Mortgage Status in Pasadena
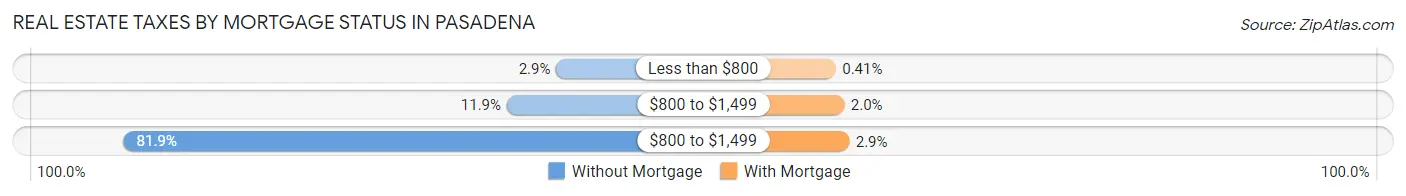
| Property Taxes | Without Mortgage | With Mortgage |
| Less than $800 | 216 (2.9%) | 66 (0.4%) |
| $800 to $1,499 | 891 (11.9%) | 318 (2.0%) |
| $800 to $1,499 | 6,121 (81.9%) | 463 (2.9%) |
| Total | 7,473 (100.0%) | 16,149 (100.0%) |
Health & Disability in Pasadena
Health Insurance Coverage by Age in Pasadena
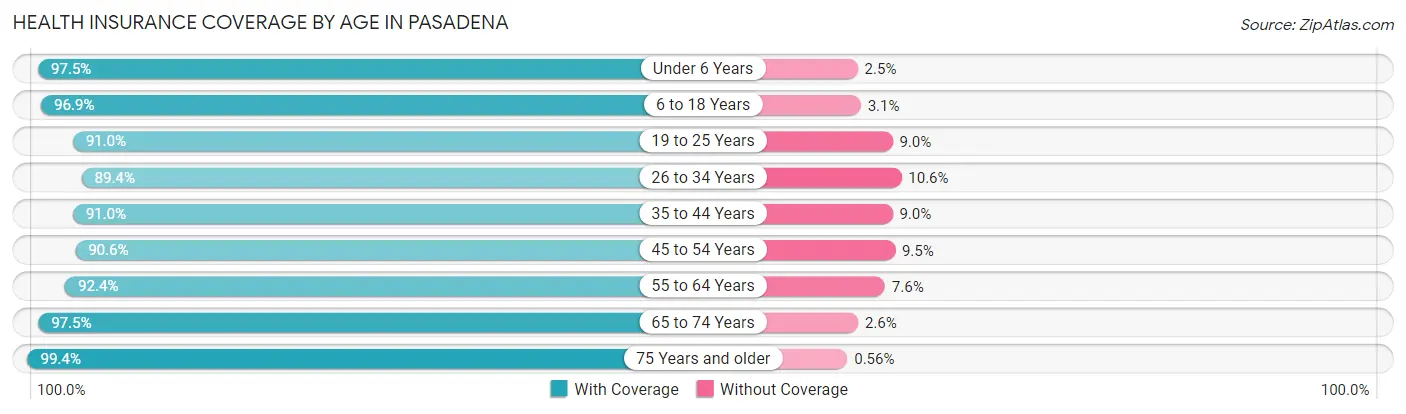
| Age Bracket | With Coverage | Without Coverage |
| Under 6 Years | 7,818 (97.5%) | 200 (2.5%) |
| 6 to 18 Years | 16,146 (96.9%) | 512 (3.1%) |
| 19 to 25 Years | 10,486 (91.0%) | 1,035 (9.0%) |
| 26 to 34 Years | 19,752 (89.4%) | 2,352 (10.6%) |
| 35 to 44 Years | 19,198 (91.0%) | 1,895 (9.0%) |
| 45 to 54 Years | 16,573 (90.5%) | 1,730 (9.5%) |
| 55 to 64 Years | 15,115 (92.4%) | 1,238 (7.6%) |
| 65 to 74 Years | 11,511 (97.5%) | 301 (2.5%) |
| 75 Years and older | 10,429 (99.4%) | 59 (0.6%) |
| Total | 127,028 (93.2%) | 9,322 (6.8%) |
Health Insurance Coverage by Citizenship Status in Pasadena
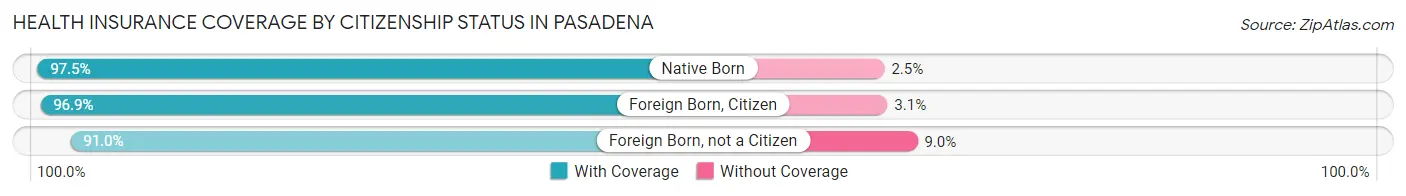
| Citizenship Status | With Coverage | Without Coverage |
| Native Born | 7,818 (97.5%) | 200 (2.5%) |
| Foreign Born, Citizen | 16,146 (96.9%) | 512 (3.1%) |
| Foreign Born, not a Citizen | 10,486 (91.0%) | 1,035 (9.0%) |
Health Insurance Coverage by Household Income in Pasadena
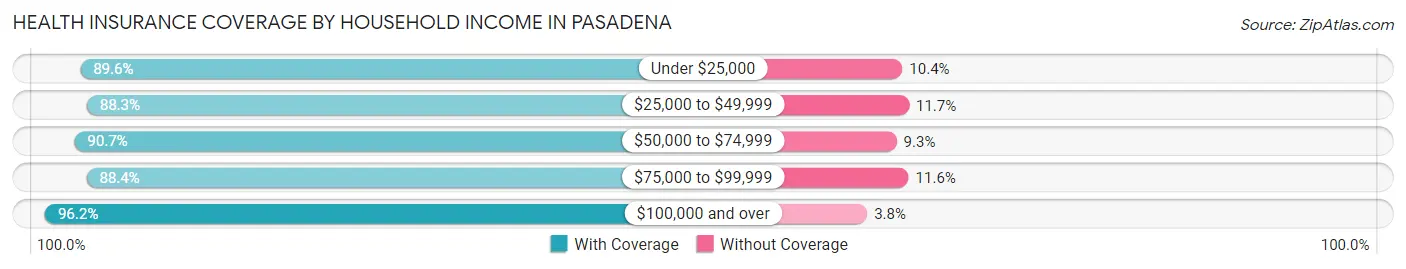
| Household Income | With Coverage | Without Coverage |
| Under $25,000 | 13,312 (89.6%) | 1,549 (10.4%) |
| $25,000 to $49,999 | 12,102 (88.3%) | 1,598 (11.7%) |
| $50,000 to $74,999 | 13,577 (90.7%) | 1,399 (9.3%) |
| $75,000 to $99,999 | 13,785 (88.4%) | 1,807 (11.6%) |
| $100,000 and over | 70,866 (96.2%) | 2,819 (3.8%) |
Public vs Private Health Insurance Coverage by Age in Pasadena
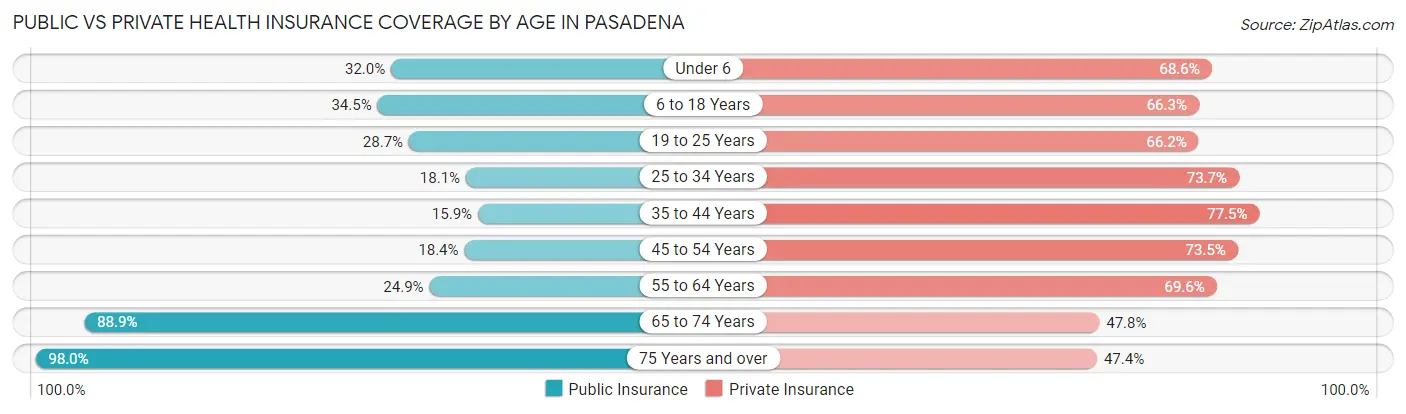
| Age Bracket | Public Insurance | Private Insurance |
| Under 6 | 2,564 (32.0%) | 5,503 (68.6%) |
| 6 to 18 Years | 5,747 (34.5%) | 11,036 (66.2%) |
| 19 to 25 Years | 3,303 (28.7%) | 7,629 (66.2%) |
| 25 to 34 Years | 3,999 (18.1%) | 16,288 (73.7%) |
| 35 to 44 Years | 3,345 (15.9%) | 16,342 (77.5%) |
| 45 to 54 Years | 3,362 (18.4%) | 13,448 (73.5%) |
| 55 to 64 Years | 4,066 (24.9%) | 11,376 (69.6%) |
| 65 to 74 Years | 10,506 (88.9%) | 5,646 (47.8%) |
| 75 Years and over | 10,278 (98.0%) | 4,968 (47.4%) |
| Total | 47,170 (34.6%) | 92,236 (67.6%) |
Disability Status by Sex by Age in Pasadena
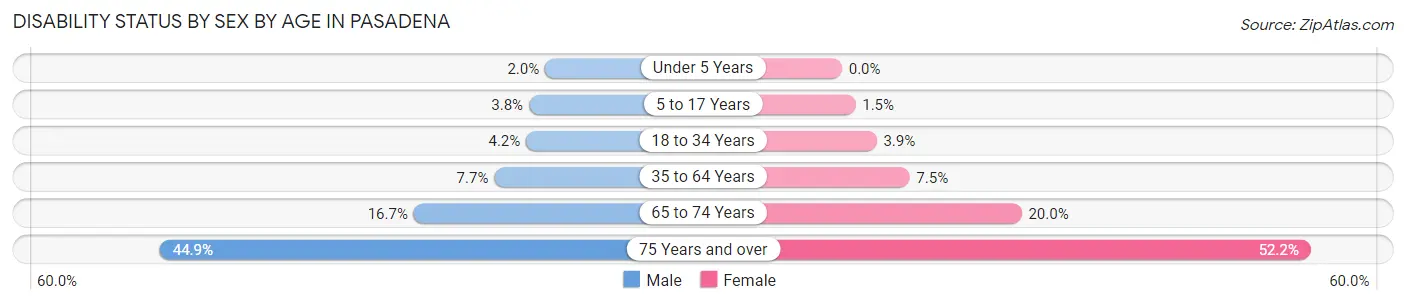
| Age Bracket | Male | Female |
| Under 5 Years | 74 (2.0%) | 0 (0.0%) |
| 5 to 17 Years | 325 (3.8%) | 117 (1.5%) |
| 18 to 34 Years | 732 (4.2%) | 668 (3.9%) |
| 35 to 64 Years | 2,166 (7.7%) | 2,080 (7.5%) |
| 65 to 74 Years | 830 (16.7%) | 1,367 (20.0%) |
| 75 Years and over | 1,870 (44.9%) | 3,304 (52.2%) |
Disability Class by Sex by Age in Pasadena
Disability Class: Hearing Difficulty
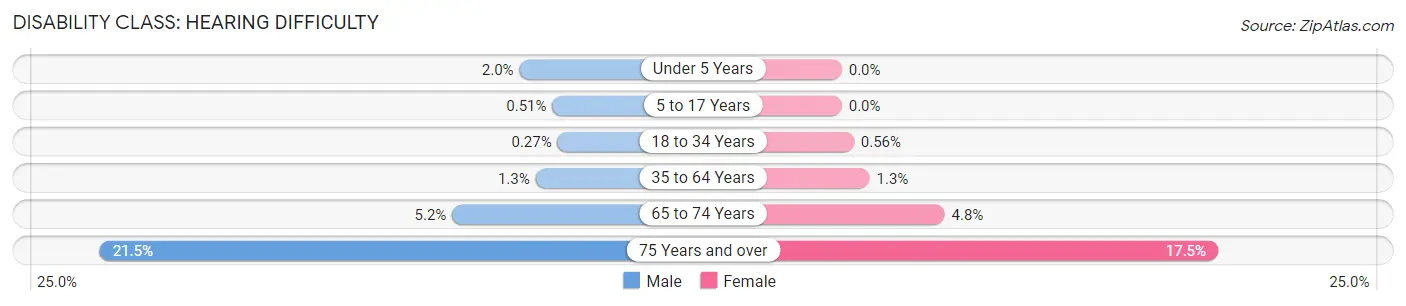
| Age Bracket | Male | Female |
| Under 5 Years | 74 (2.0%) | 0 (0.0%) |
| 5 to 17 Years | 43 (0.5%) | 0 (0.0%) |
| 18 to 34 Years | 48 (0.3%) | 97 (0.6%) |
| 35 to 64 Years | 363 (1.3%) | 357 (1.3%) |
| 65 to 74 Years | 257 (5.2%) | 326 (4.8%) |
| 75 Years and over | 895 (21.5%) | 1,104 (17.4%) |
Disability Class: Vision Difficulty
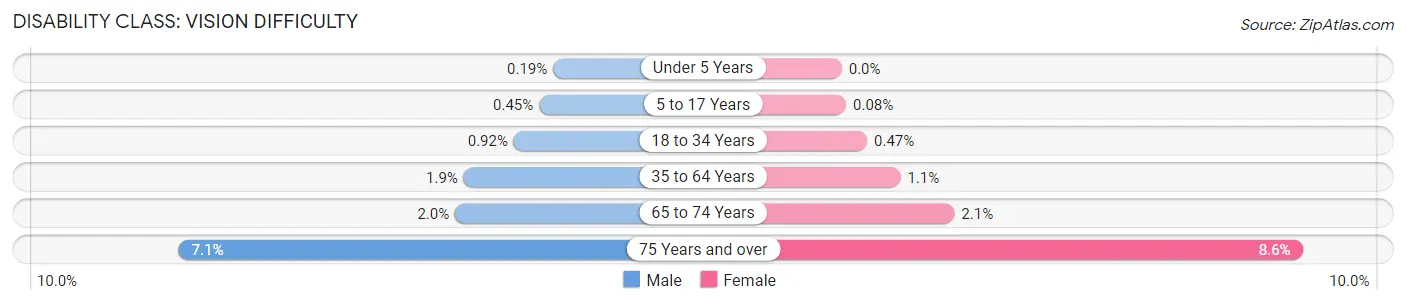
| Age Bracket | Male | Female |
| Under 5 Years | 7 (0.2%) | 0 (0.0%) |
| 5 to 17 Years | 38 (0.4%) | 6 (0.1%) |
| 18 to 34 Years | 163 (0.9%) | 82 (0.5%) |
| 35 to 64 Years | 522 (1.8%) | 302 (1.1%) |
| 65 to 74 Years | 100 (2.0%) | 143 (2.1%) |
| 75 Years and over | 297 (7.1%) | 541 (8.6%) |
Disability Class: Cognitive Difficulty
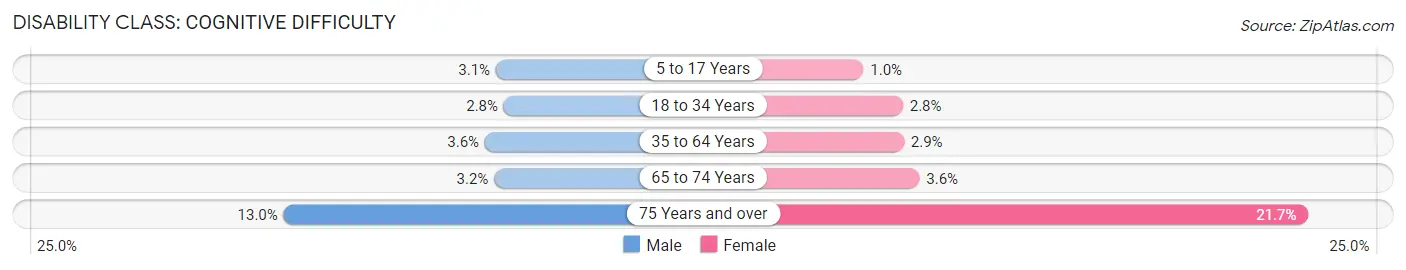
| Age Bracket | Male | Female |
| 5 to 17 Years | 266 (3.1%) | 78 (1.0%) |
| 18 to 34 Years | 486 (2.8%) | 491 (2.8%) |
| 35 to 64 Years | 1,025 (3.6%) | 796 (2.9%) |
| 65 to 74 Years | 160 (3.2%) | 246 (3.6%) |
| 75 Years and over | 540 (13.0%) | 1,370 (21.6%) |
Disability Class: Ambulatory Difficulty
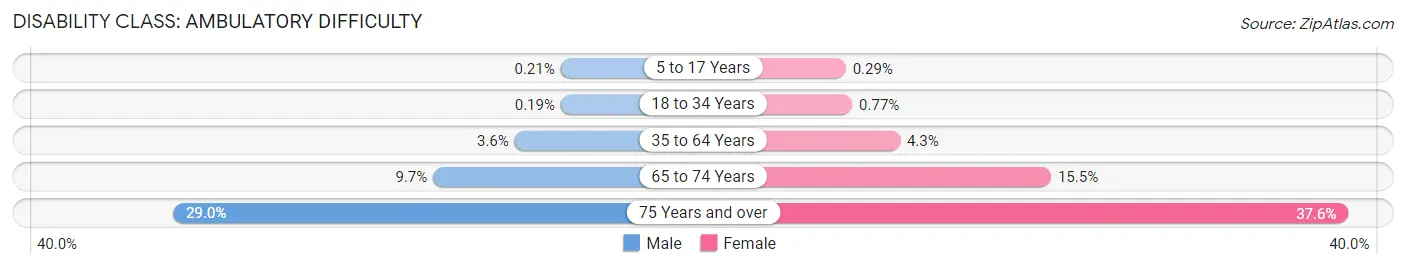
| Age Bracket | Male | Female |
| 5 to 17 Years | 18 (0.2%) | 23 (0.3%) |
| 18 to 34 Years | 34 (0.2%) | 133 (0.8%) |
| 35 to 64 Years | 1,018 (3.6%) | 1,193 (4.3%) |
| 65 to 74 Years | 482 (9.7%) | 1,061 (15.5%) |
| 75 Years and over | 1,206 (29.0%) | 2,379 (37.6%) |
Disability Class: Self-Care Difficulty
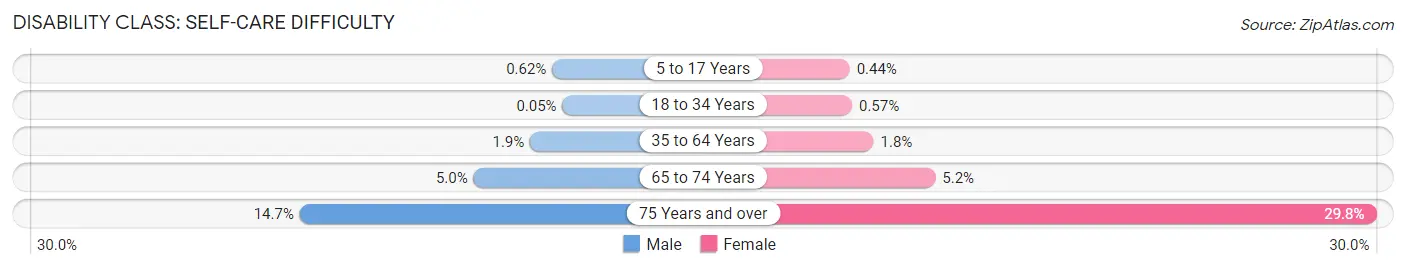
| Age Bracket | Male | Female |
| 5 to 17 Years | 53 (0.6%) | 34 (0.4%) |
| 18 to 34 Years | 9 (0.1%) | 99 (0.6%) |
| 35 to 64 Years | 521 (1.8%) | 488 (1.8%) |
| 65 to 74 Years | 249 (5.0%) | 356 (5.2%) |
| 75 Years and over | 611 (14.7%) | 1,883 (29.8%) |
Technology Access in Pasadena
Computing Device Access in Pasadena
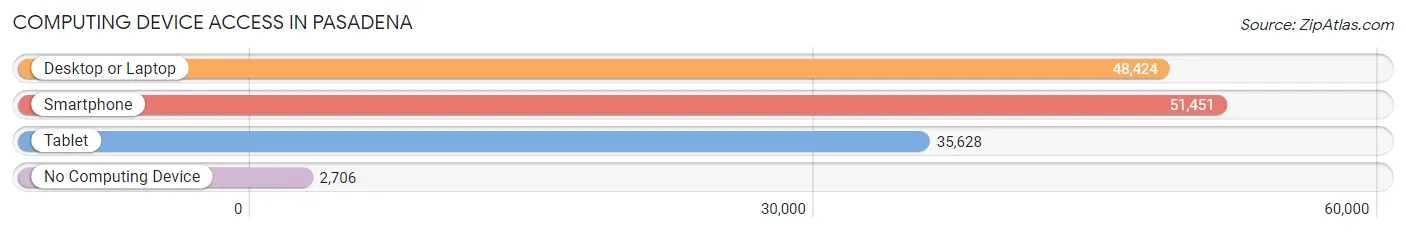
| Device Type | # Households | % Households |
| Desktop or Laptop | 48,424 | 86.4% |
| Smartphone | 51,451 | 91.7% |
| Tablet | 35,628 | 63.5% |
| No Computing Device | 2,706 | 4.8% |
| Total | 56,076 | 100.0% |
Internet Access in Pasadena
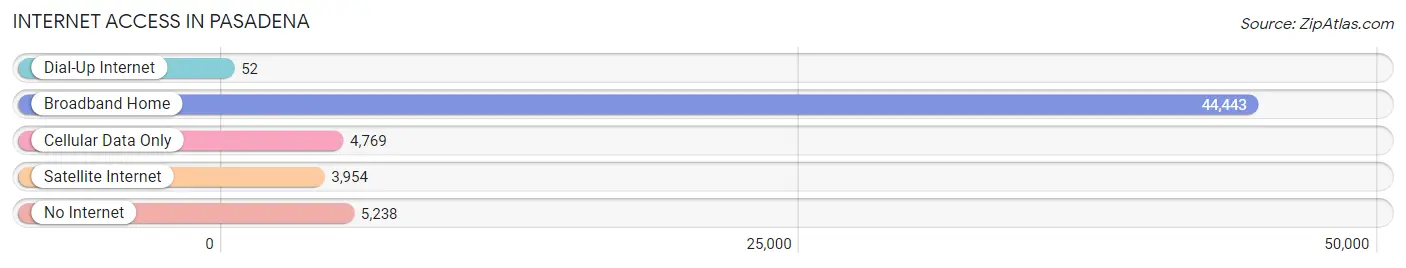
| Internet Type | # Households | % Households |
| Dial-Up Internet | 52 | 0.1% |
| Broadband Home | 44,443 | 79.2% |
| Cellular Data Only | 4,769 | 8.5% |
| Satellite Internet | 3,954 | 7.0% |
| No Internet | 5,238 | 9.3% |
| Total | 56,076 | 100.0% |
Pasadena Summary
Pasadena, California is a city located in Los Angeles County, California, United States. It is located 11 miles (18 km) northeast of downtown Los Angeles and is part of the Greater Los Angeles Area. Pasadena is known for its history, culture, and its many attractions, including the Rose Bowl, the Norton Simon Museum, and the California Institute of Technology (Caltech).
History
Pasadena was founded in 1874 by a group of settlers from Indiana, Ohio, and Kentucky. The city was named after the Chippewa word for “valley”, and was originally intended to be a resort town. The city quickly grew, and by the early 1900s, it was a popular destination for wealthy Angelenos.
In the 1920s, Pasadena became a center for the arts, with the opening of the Pasadena Playhouse and the Pasadena Art Museum. The city also became a hub for the aerospace industry, with the establishment of the Jet Propulsion Laboratory (JPL) in the 1940s.
Geography
Pasadena is located in the San Gabriel Valley, at the base of the San Gabriel Mountains. The city covers an area of 23.2 square miles (60.1 km2), and is bordered by the cities of South Pasadena, San Marino, and Altadena. The city is divided into several neighborhoods, including Old Pasadena, the Playhouse District, and the Civic Center.
Economy
Pasadena is home to a diverse economy, with a mix of industries including aerospace, healthcare, education, and technology. The city is home to several major employers, including Caltech, JPL, Kaiser Permanente, and the Huntington Memorial Hospital.
The city also has a thriving tourism industry, with attractions such as the Rose Bowl, the Norton Simon Museum, and the Gamble House. The city also hosts several annual events, including the Rose Parade, the Tournament of Roses, and the Pasadena Half Marathon.
Demographics
As of the 2010 census, Pasadena had a population of 137,122. The city is racially diverse, with a population that is 44.2% White, 11.2% African American, 0.7% Native American, 28.2% Asian, and 15.1% Hispanic or Latino. The median household income is $63,936, and the median home value is $637,400.
Pasadena is a vibrant and diverse city, with a rich history and a thriving economy. The city is home to several major employers, and is a popular destination for tourists and residents alike. With its many attractions, Pasadena is a great place to live, work, and play.
Common Questions
What is Per Capita Income in Pasadena?
Per Capita income in Pasadena is $59,655.
What is the Median Family Income in Pasadena?
Median Family Income in Pasadena is $129,119.
What is the Median Household income in Pasadena?
Median Household Income in Pasadena is $97,818.
What is Income or Wage Gap in Pasadena?
Income or Wage Gap in Pasadena is 12.9%.
Women in Pasadena earn 87.1 cents for every dollar earned by a man.
What is Family Income Deficit in Pasadena?
Family Income Deficit in Pasadena is $11,650.
Families that are below poverty line in Pasadena earn $11,650 less on average than the poverty threshold level.
What is Inequality or Gini Index in Pasadena?
Inequality or Gini Index in Pasadena is 0.51.
What is the Total Population of Pasadena?
Total Population of Pasadena is 137,554.
What is the Total Male Population of Pasadena?
Total Male Population of Pasadena is 67,594.
What is the Total Female Population of Pasadena?
Total Female Population of Pasadena is 69,960.
What is the Ratio of Males per 100 Females in Pasadena?
There are 96.62 Males per 100 Females in Pasadena.
What is the Ratio of Females per 100 Males in Pasadena?
There are 103.50 Females per 100 Males in Pasadena.
What is the Median Population Age in Pasadena?
Median Population Age in Pasadena is 39.9 Years.
What is the Average Family Size in Pasadena
Average Family Size in Pasadena is 3.1 People.
What is the Average Household Size in Pasadena
Average Household Size in Pasadena is 2.4 People.
How Large is the Labor Force in Pasadena?
There are 77,930 People in the Labor Forcein in Pasadena.
What is the Percentage of People in the Labor Force in Pasadena?
66.9% of People are in the Labor Force in Pasadena.
What is the Unemployment Rate in Pasadena?
Unemployment Rate in Pasadena is 5.2%.