Chandler, AZ Map & Demographics
Chandler Map
Chandler Overview
$48,987
PER CAPITA INCOME
$115,100
AVG FAMILY INCOME
$99,374
AVG HOUSEHOLD INCOME
24.6%
WAGE / INCOME GAP [ % ]
75.4¢/ $1
WAGE / INCOME GAP [ $ ]
$11,758
FAMILY INCOME DEFICIT
0.42
INEQUALITY / GINI INDEX
275,618
TOTAL POPULATION
138,117
MALE POPULATION
137,501
FEMALE POPULATION
100.45
MALES / 100 FEMALES
99.55
FEMALES / 100 MALES
37.0
MEDIAN AGE
3.1
AVG FAMILY SIZE
2.6
AVG HOUSEHOLD SIZE
156,375
LABOR FORCE [ PEOPLE ]
71.6%
PERCENT IN LABOR FORCE
3.8%
UNEMPLOYMENT RATE
Income in Chandler
Income Overview in Chandler
Per Capita Income in Chandler is $48,987, while median incomes of families and households are $115,100 and $99,374 respectively.
| Characteristic | Number | Measure |
| Per Capita Income | 275,618 | $48,987 |
| Median Family Income | 71,634 | $115,100 |
| Mean Family Income | 71,634 | $143,385 |
| Median Household Income | 104,419 | $99,374 |
| Mean Household Income | 104,419 | $127,475 |
| Income Deficit | 71,634 | $11,758 |
| Wage / Income Gap (%) | 275,618 | 24.60% |
| Wage / Income Gap ($) | 275,618 | 75.40¢ per $1 |
| Gini / Inequality Index | 275,618 | 0.42 |
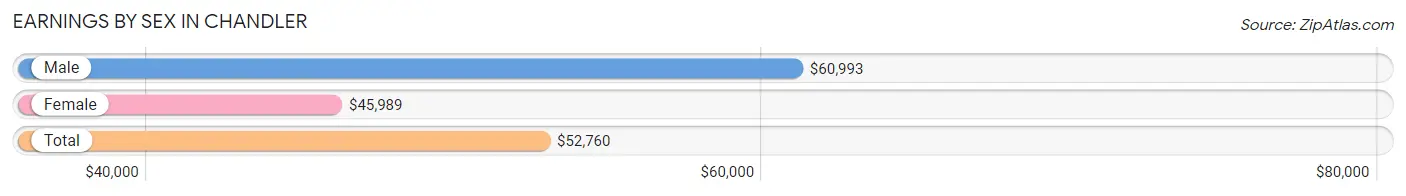
Earnings by Sex in Chandler
Average Earnings in Chandler are $52,760, $60,993 for men and $45,989 for women, a difference of 24.6%.
| Sex | Number | Average Earnings |
| Male | 87,285 (54.1%) | $60,993 |
| Female | 73,964 (45.9%) | $45,989 |
| Total | 161,249 (100.0%) | $52,760 |
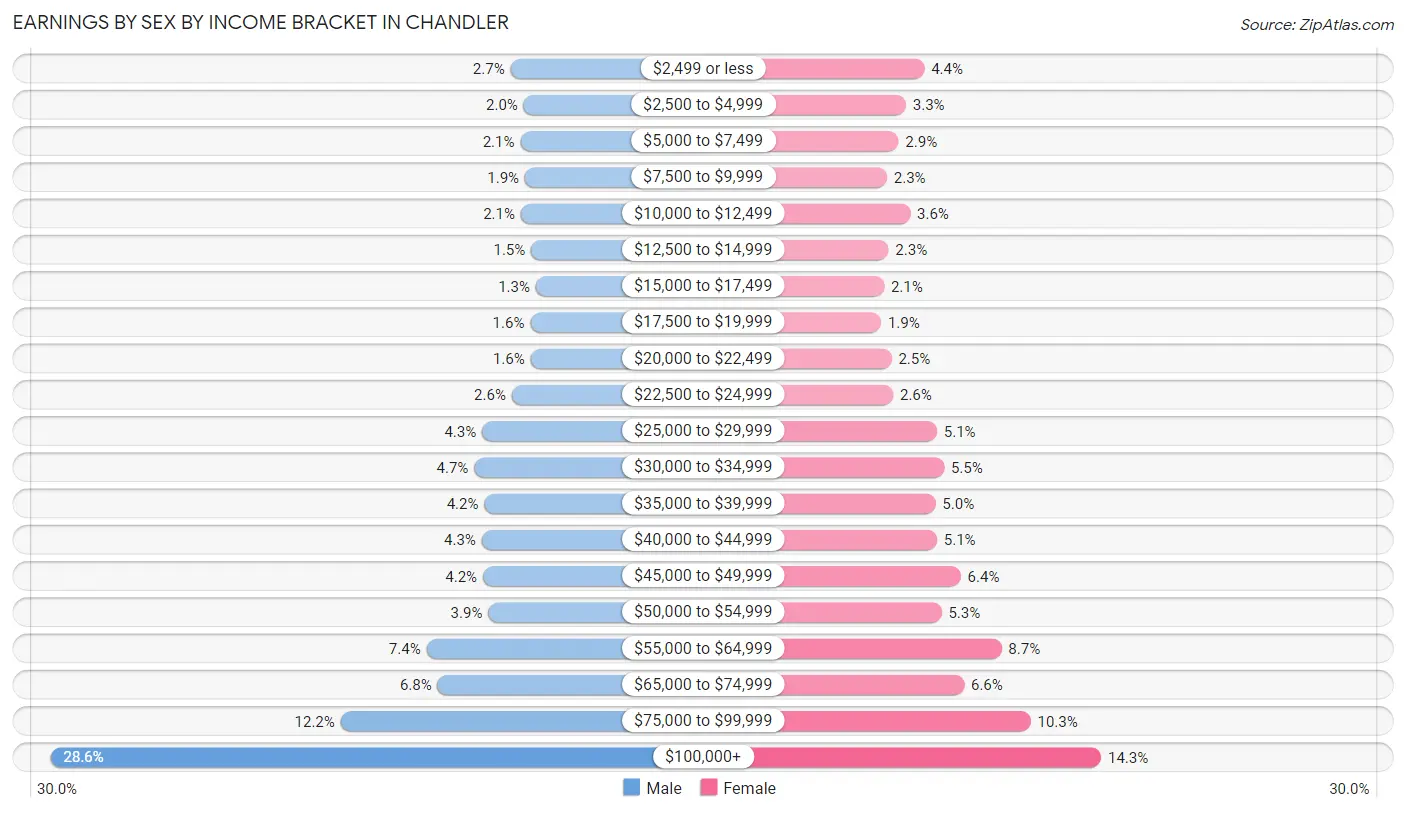
Earnings by Sex by Income Bracket in Chandler
The most common earnings brackets in Chandler are $100,000+ for men (24,922 | 28.5%) and $100,000+ for women (10,568 | 14.3%).
| Income | Male | Female |
| $2,499 or less | 2,350 (2.7%) | 3,221 (4.3%) |
| $2,500 to $4,999 | 1,704 (1.9%) | 2,452 (3.3%) |
| $5,000 to $7,499 | 1,871 (2.1%) | 2,144 (2.9%) |
| $7,500 to $9,999 | 1,639 (1.9%) | 1,667 (2.2%) |
| $10,000 to $12,499 | 1,843 (2.1%) | 2,631 (3.6%) |
| $12,500 to $14,999 | 1,336 (1.5%) | 1,728 (2.3%) |
| $15,000 to $17,499 | 1,112 (1.3%) | 1,547 (2.1%) |
| $17,500 to $19,999 | 1,381 (1.6%) | 1,421 (1.9%) |
| $20,000 to $22,499 | 1,366 (1.6%) | 1,855 (2.5%) |
| $22,500 to $24,999 | 2,284 (2.6%) | 1,921 (2.6%) |
| $25,000 to $29,999 | 3,745 (4.3%) | 3,745 (5.1%) |
| $30,000 to $34,999 | 4,130 (4.7%) | 4,036 (5.5%) |
| $35,000 to $39,999 | 3,628 (4.2%) | 3,680 (5.0%) |
| $40,000 to $44,999 | 3,762 (4.3%) | 3,741 (5.1%) |
| $45,000 to $49,999 | 3,699 (4.2%) | 4,730 (6.4%) |
| $50,000 to $54,999 | 3,435 (3.9%) | 3,937 (5.3%) |
| $55,000 to $64,999 | 6,470 (7.4%) | 6,425 (8.7%) |
| $65,000 to $74,999 | 5,923 (6.8%) | 4,877 (6.6%) |
| $75,000 to $99,999 | 10,685 (12.2%) | 7,638 (10.3%) |
| $100,000+ | 24,922 (28.5%) | 10,568 (14.3%) |
| Total | 87,285 (100.0%) | 73,964 (100.0%) |
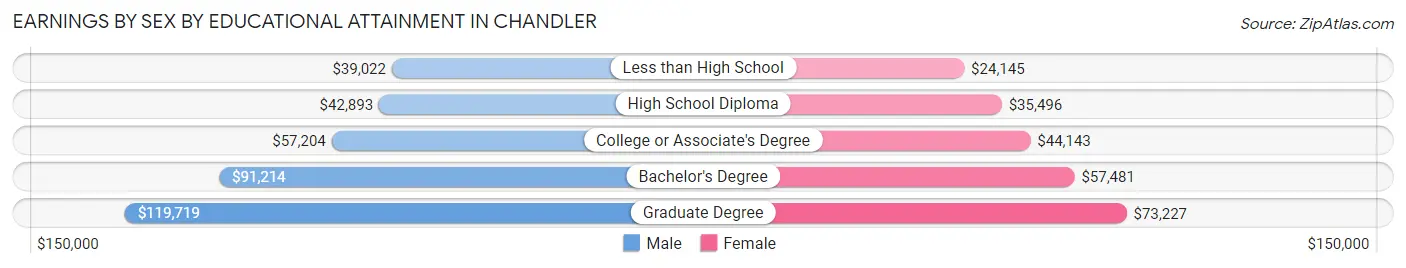
Earnings by Sex by Educational Attainment in Chandler
Average earnings in Chandler are $69,697 for men and $50,406 for women, a difference of 27.7%. Men with an educational attainment of graduate degree enjoy the highest average annual earnings of $119,719, while those with less than high school education earn the least with $39,022. Women with an educational attainment of graduate degree earn the most with the average annual earnings of $73,227, while those with less than high school education have the smallest earnings of $24,145.
| Educational Attainment | Male Income | Female Income |
| Less than High School | $39,022 | $24,145 |
| High School Diploma | $42,893 | $35,496 |
| College or Associate's Degree | $57,204 | $44,143 |
| Bachelor's Degree | $91,214 | $57,481 |
| Graduate Degree | $119,719 | $73,227 |
| Total | $69,697 | $50,406 |
Family Income in Chandler
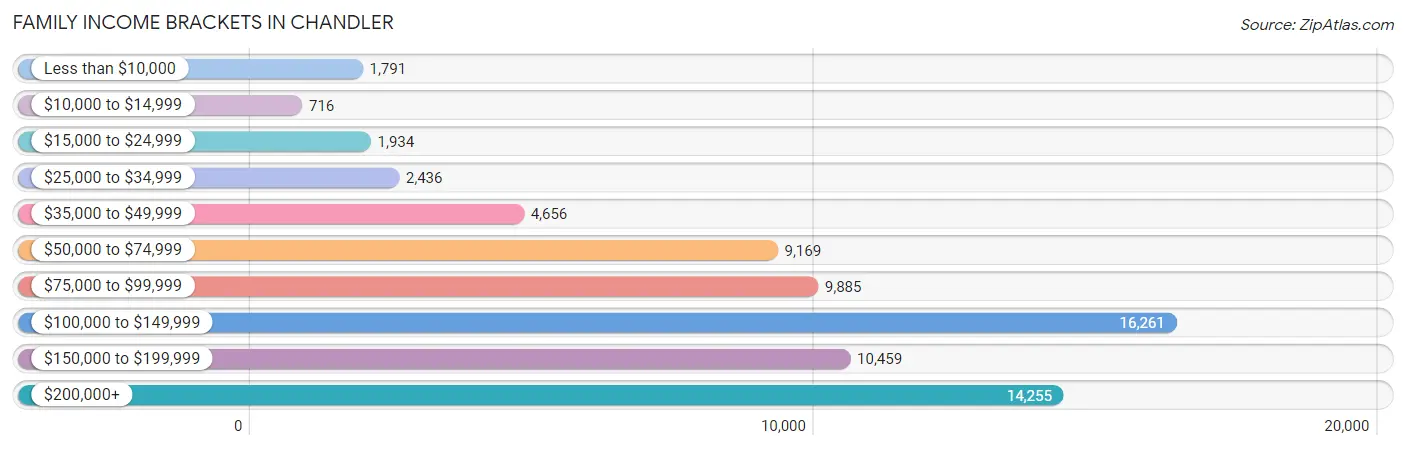
Family Income Brackets in Chandler
According to the Chandler family income data, there are 16,261 families falling into the $100,000 to $149,999 income range, which is the most common income bracket and makes up 22.7% of all families. Conversely, the $10,000 to $14,999 income bracket is the least frequent group with only 716 families (1.0%) belonging to this category.
| Income Bracket | # Families | % Families |
| Less than $10,000 | 1,791 | 2.5% |
| $10,000 to $14,999 | 716 | 1.0% |
| $15,000 to $24,999 | 1,934 | 2.7% |
| $25,000 to $34,999 | 2,436 | 3.4% |
| $35,000 to $49,999 | 4,656 | 6.5% |
| $50,000 to $74,999 | 9,169 | 12.8% |
| $75,000 to $99,999 | 9,885 | 13.8% |
| $100,000 to $149,999 | 16,261 | 22.7% |
| $150,000 to $199,999 | 10,459 | 14.6% |
| $200,000+ | 14,255 | 19.9% |
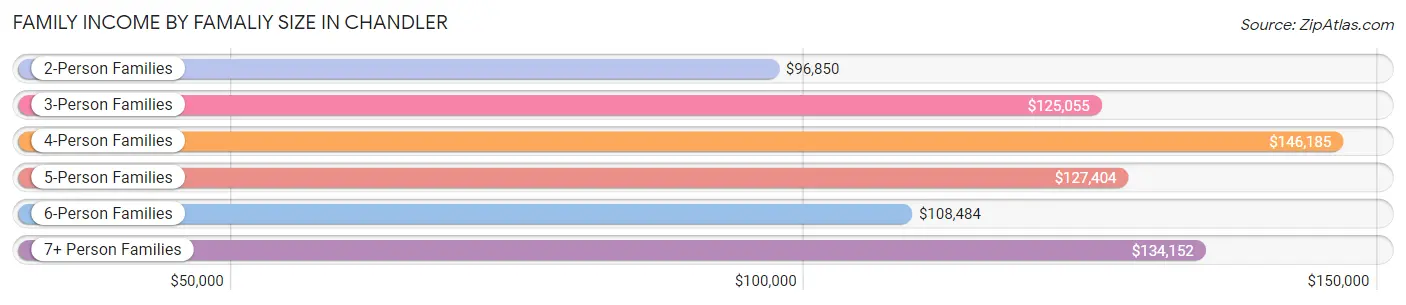
Family Income by Famaliy Size in Chandler
4-person families (14,537 | 20.3%) account for the highest median family income in Chandler with $146,185 per family, while 2-person families (30,563 | 42.7%) have the highest median income of $48,425 per family member.
| Income Bracket | # Families | Median Income |
| 2-Person Families | 30,563 (42.7%) | $96,850 |
| 3-Person Families | 17,722 (24.7%) | $125,055 |
| 4-Person Families | 14,537 (20.3%) | $146,185 |
| 5-Person Families | 5,612 (7.8%) | $127,404 |
| 6-Person Families | 2,352 (3.3%) | $108,484 |
| 7+ Person Families | 848 (1.2%) | $134,152 |
| Total | 71,634 (100.0%) | $115,100 |
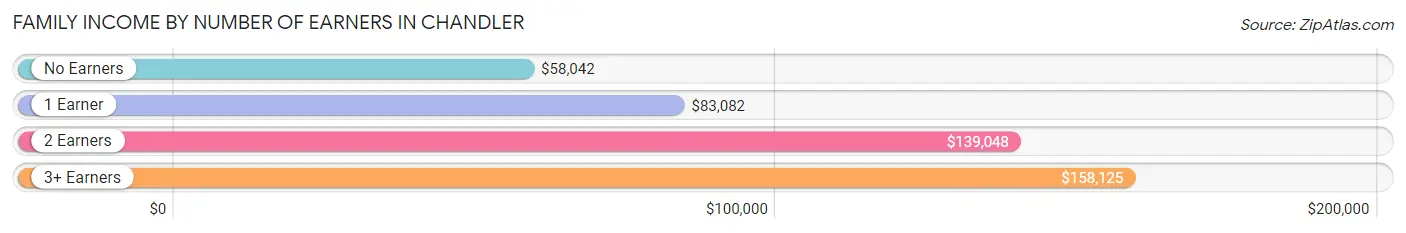
Family Income by Number of Earners in Chandler
The median family income in Chandler is $115,100, with families comprising 3+ earners (9,482) having the highest median family income of $158,125, while families with no earners (7,430) have the lowest median family income of $58,042, accounting for 13.2% and 10.4% of families, respectively.
| Number of Earners | # Families | Median Income |
| No Earners | 7,430 (10.4%) | $58,042 |
| 1 Earner | 22,101 (30.8%) | $83,082 |
| 2 Earners | 32,621 (45.5%) | $139,048 |
| 3+ Earners | 9,482 (13.2%) | $158,125 |
| Total | 71,634 (100.0%) | $115,100 |
Household Income in Chandler
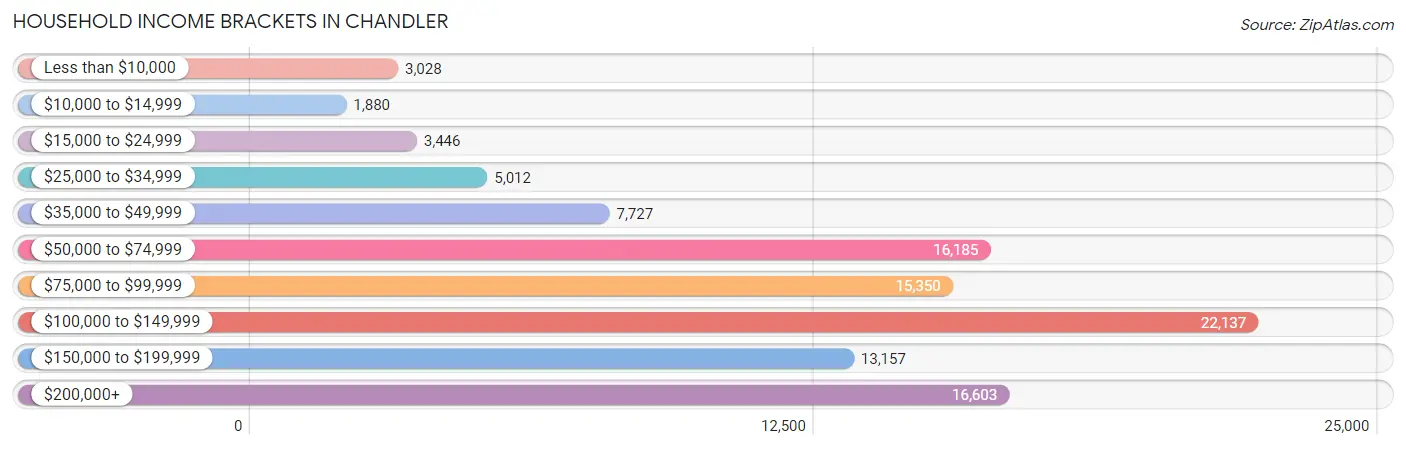
Household Income Brackets in Chandler
With 22,137 households falling in the category, the $100,000 to $149,999 income range is the most frequent in Chandler, accounting for 21.2% of all households. In contrast, only 1,880 households (1.8%) fall into the $10,000 to $14,999 income bracket, making it the least populous group.
| Income Bracket | # Households | % Households |
| Less than $10,000 | 3,028 | 2.9% |
| $10,000 to $14,999 | 1,880 | 1.8% |
| $15,000 to $24,999 | 3,446 | 3.3% |
| $25,000 to $34,999 | 5,012 | 4.8% |
| $35,000 to $49,999 | 7,727 | 7.4% |
| $50,000 to $74,999 | 16,185 | 15.5% |
| $75,000 to $99,999 | 15,350 | 14.7% |
| $100,000 to $149,999 | 22,137 | 21.2% |
| $150,000 to $199,999 | 13,157 | 12.6% |
| $200,000+ | 16,603 | 15.9% |
Household Income by Householder Age in Chandler
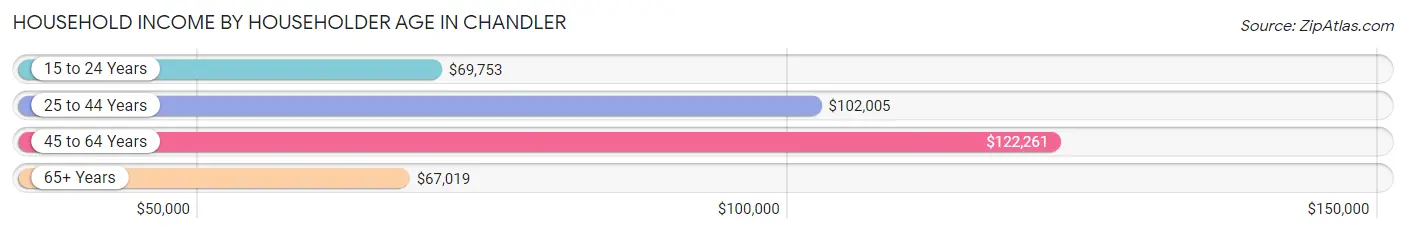
The median household income in Chandler is $99,374, with the highest median household income of $122,261 found in the 45 to 64 years age bracket for the primary householder. A total of 41,067 households (39.3%) fall into this category. Meanwhile, the 65+ years age bracket for the primary householder has the lowest median household income of $67,019, with 19,363 households (18.5%) in this group.
| Income Bracket | # Households | Median Income |
| 15 to 24 Years | 3,493 (3.4%) | $69,753 |
| 25 to 44 Years | 40,496 (38.8%) | $102,005 |
| 45 to 64 Years | 41,067 (39.3%) | $122,261 |
| 65+ Years | 19,363 (18.5%) | $67,019 |
| Total | 104,419 (100.0%) | $99,374 |
Poverty in Chandler
Income Below Poverty by Sex and Age in Chandler
With 6.5% poverty level for males and 9.0% for females among the residents of Chandler, 5 year old males and 5 year old females are the most vulnerable to poverty, with 258 males (14.7%) and 195 females (12.5%) in their respective age groups living below the poverty level.
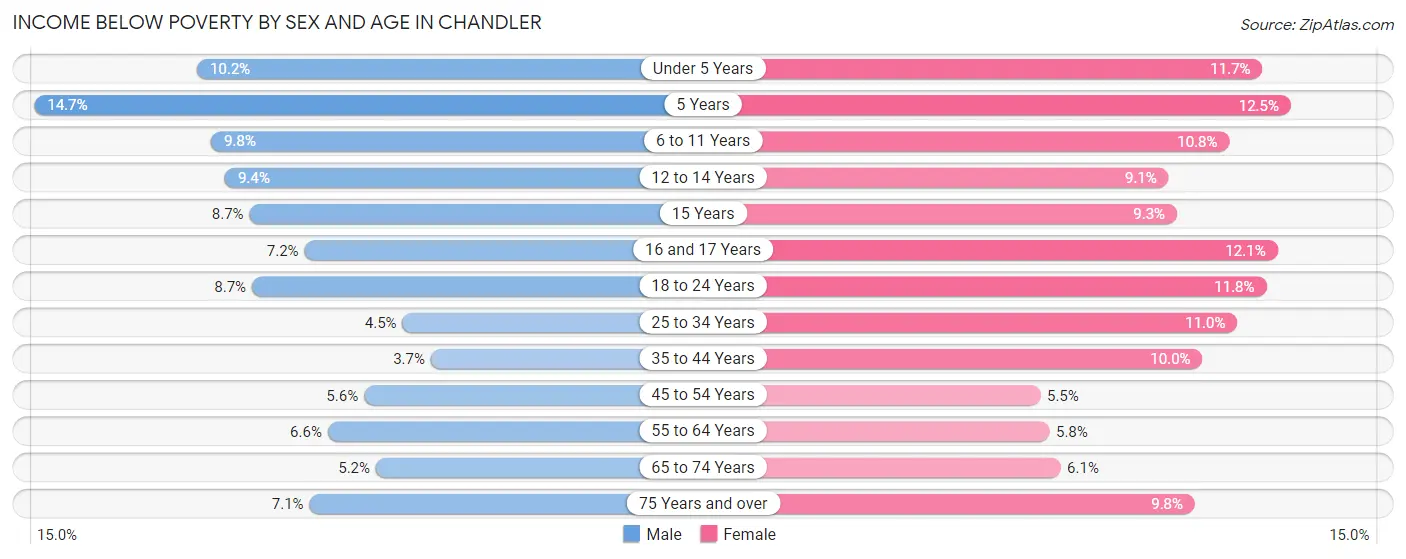
| Age Bracket | Male | Female |
| Under 5 Years | 748 (10.2%) | 872 (11.7%) |
| 5 Years | 258 (14.7%) | 195 (12.5%) |
| 6 to 11 Years | 1,095 (9.8%) | 1,168 (10.8%) |
| 12 to 14 Years | 587 (9.4%) | 536 (9.1%) |
| 15 Years | 175 (8.7%) | 184 (9.3%) |
| 16 and 17 Years | 302 (7.2%) | 407 (12.1%) |
| 18 to 24 Years | 1,061 (8.7%) | 1,203 (11.8%) |
| 25 to 34 Years | 942 (4.5%) | 2,263 (11.0%) |
| 35 to 44 Years | 783 (3.7%) | 1,980 (10.0%) |
| 45 to 54 Years | 1,093 (5.6%) | 1,104 (5.5%) |
| 55 to 64 Years | 1,003 (6.6%) | 946 (5.8%) |
| 65 to 74 Years | 497 (5.2%) | 688 (6.1%) |
| 75 Years and over | 390 (7.1%) | 760 (9.8%) |
| Total | 8,934 (6.5%) | 12,306 (9.0%) |
Income Above Poverty by Sex and Age in Chandler
According to the poverty statistics in Chandler, males aged 35 to 44 years and females aged 45 to 54 years are the age groups that are most secure financially, with 96.3% of males and 94.5% of females in these age groups living above the poverty line.
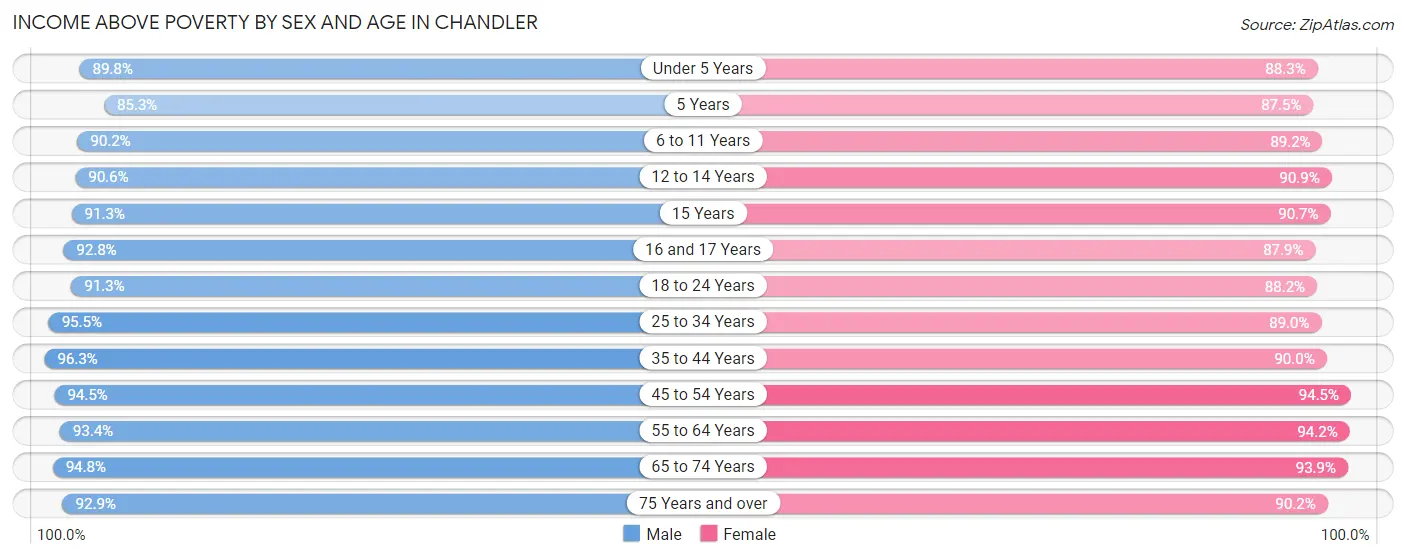
| Age Bracket | Male | Female |
| Under 5 Years | 6,582 (89.8%) | 6,574 (88.3%) |
| 5 Years | 1,494 (85.3%) | 1,365 (87.5%) |
| 6 to 11 Years | 10,064 (90.2%) | 9,657 (89.2%) |
| 12 to 14 Years | 5,647 (90.6%) | 5,353 (90.9%) |
| 15 Years | 1,828 (91.3%) | 1,788 (90.7%) |
| 16 and 17 Years | 3,886 (92.8%) | 2,947 (87.9%) |
| 18 to 24 Years | 11,179 (91.3%) | 8,971 (88.2%) |
| 25 to 34 Years | 20,084 (95.5%) | 18,298 (89.0%) |
| 35 to 44 Years | 20,431 (96.3%) | 17,748 (90.0%) |
| 45 to 54 Years | 18,591 (94.5%) | 18,885 (94.5%) |
| 55 to 64 Years | 14,293 (93.4%) | 15,457 (94.2%) |
| 65 to 74 Years | 9,033 (94.8%) | 10,625 (93.9%) |
| 75 Years and over | 5,123 (92.9%) | 6,974 (90.2%) |
| Total | 128,235 (93.5%) | 124,642 (91.0%) |
Income Below Poverty Among Married-Couple Families in Chandler
The poverty statistics for married-couple families in Chandler show that 3.5% or 1,847 of the total 53,507 families live below the poverty line. Families with 5 or more children have the highest poverty rate of 10.0%, comprising of 28 families. On the other hand, families with no children have the lowest poverty rate of 2.1%, which includes 605 families.
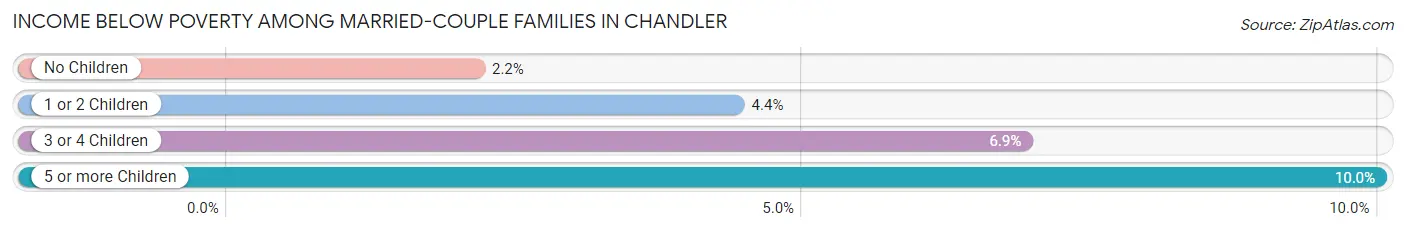
| Children | Above Poverty | Below Poverty |
| No Children | 27,594 (97.9%) | 605 (2.1%) |
| 1 or 2 Children | 19,683 (95.6%) | 907 (4.4%) |
| 3 or 4 Children | 4,131 (93.1%) | 307 (6.9%) |
| 5 or more Children | 252 (90.0%) | 28 (10.0%) |
| Total | 51,660 (96.6%) | 1,847 (3.5%) |
Income Below Poverty Among Single-Parent Households in Chandler
According to the poverty data in Chandler, 4.4% or 260 single-father households and 17.4% or 2,127 single-mother households are living below the poverty line. Among single-father households, those with no children have the highest poverty rate, with 104 households (4.7%) experiencing poverty. Likewise, among single-mother households, those with 3 or 4 children have the highest poverty rate, with 259 households (34.8%) falling below the poverty line.
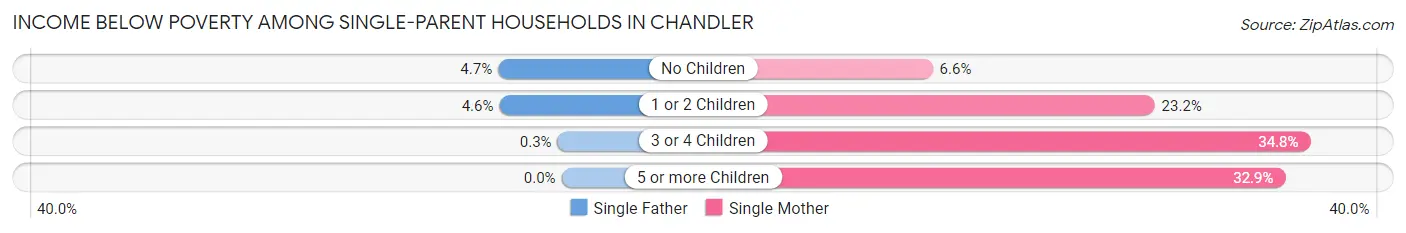
| Children | Single Father | Single Mother |
| No Children | 104 (4.7%) | 322 (6.6%) |
| 1 or 2 Children | 155 (4.6%) | 1,495 (23.2%) |
| 3 or 4 Children | 1 (0.3%) | 259 (34.8%) |
| 5 or more Children | 0 (0.0%) | 51 (32.9%) |
| Total | 260 (4.4%) | 2,127 (17.4%) |
Income Below Poverty Among Married-Couple vs Single-Parent Households in Chandler
The poverty data for Chandler shows that 1,847 of the married-couple family households (3.5%) and 2,387 of the single-parent households (13.2%) are living below the poverty level. Within the married-couple family households, those with 5 or more children have the highest poverty rate, with 28 households (10.0%) falling below the poverty line. Among the single-parent households, those with 5 or more children have the highest poverty rate, with 51 household (26.0%) living below poverty.
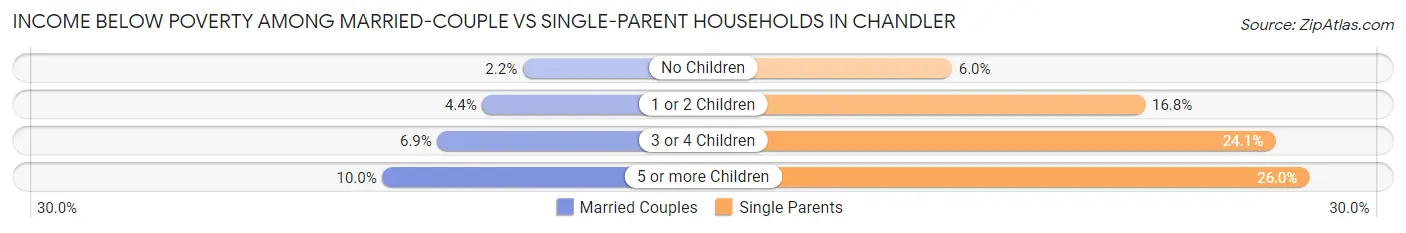
| Children | Married-Couple Families | Single-Parent Households |
| No Children | 605 (2.1%) | 426 (6.0%) |
| 1 or 2 Children | 907 (4.4%) | 1,650 (16.8%) |
| 3 or 4 Children | 307 (6.9%) | 260 (24.1%) |
| 5 or more Children | 28 (10.0%) | 51 (26.0%) |
| Total | 1,847 (3.5%) | 2,387 (13.2%) |
Race in Chandler
The most populous races in Chandler are White / Caucasian (176,771 | 64.1%), Hispanic or Latino (58,453 | 21.2%), and Asian (32,581 | 11.8%).
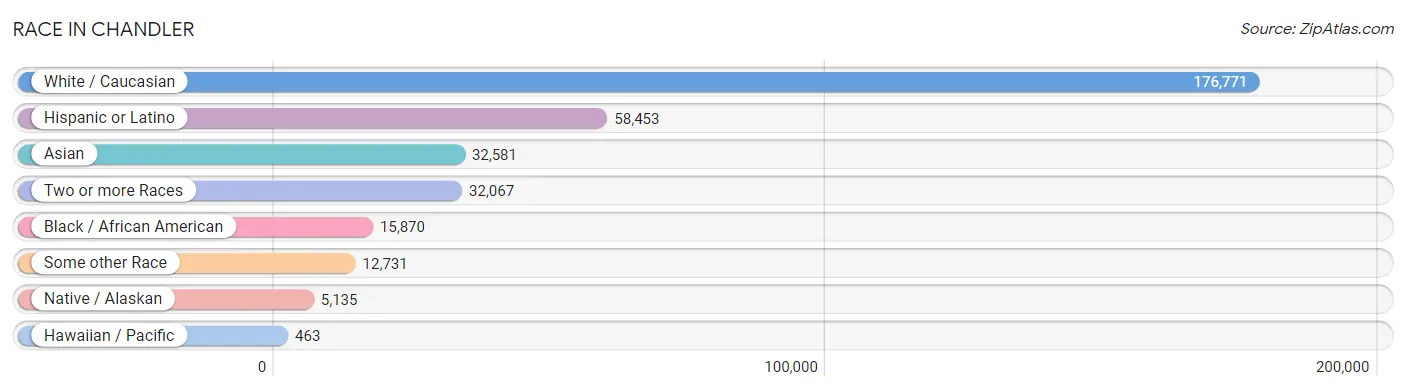
| Race | # Population | % Population |
| Asian | 32,581 | 11.8% |
| Black / African American | 15,870 | 5.8% |
| Hawaiian / Pacific | 463 | 0.2% |
| Hispanic or Latino | 58,453 | 21.2% |
| Native / Alaskan | 5,135 | 1.9% |
| White / Caucasian | 176,771 | 64.1% |
| Two or more Races | 32,067 | 11.6% |
| Some other Race | 12,731 | 4.6% |
| Total | 275,618 | 100.0% |
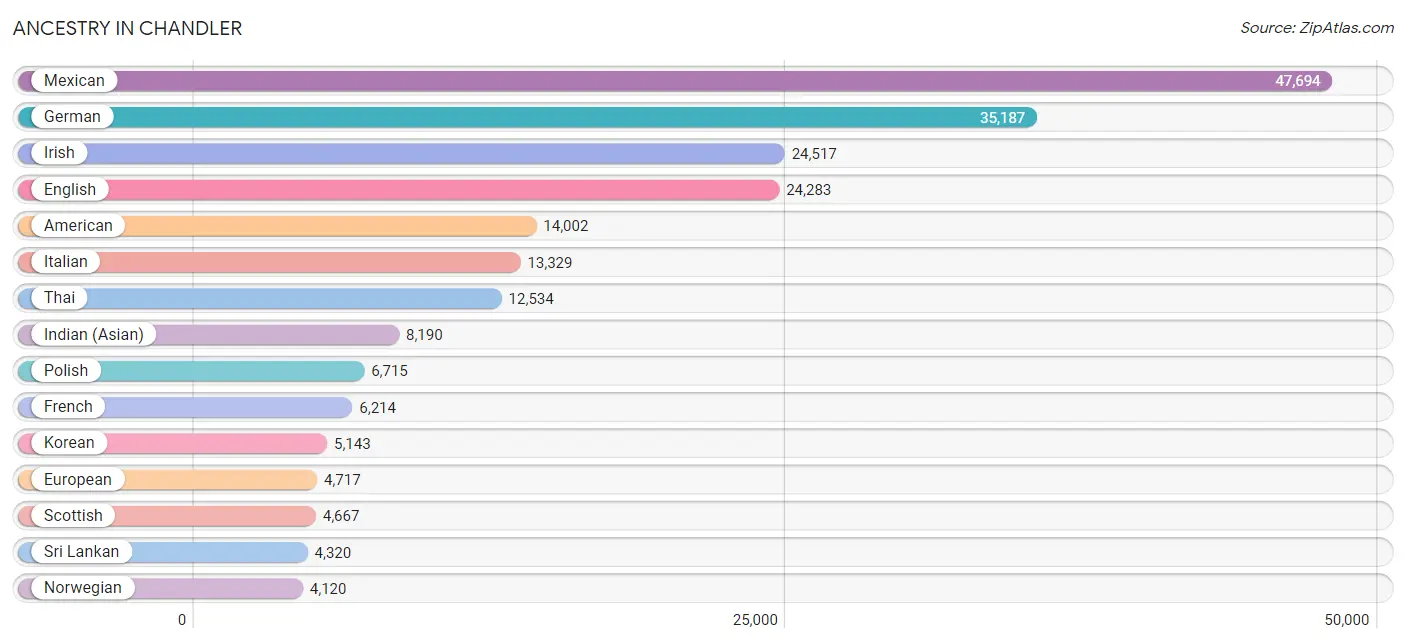
Ancestry in Chandler
The most populous ancestries reported in Chandler are Mexican (47,694 | 17.3%), German (35,187 | 12.8%), Irish (24,517 | 8.9%), English (24,283 | 8.8%), and American (14,002 | 5.1%), together accounting for 52.9% of all Chandler residents.
| Ancestry | # Population | % Population |
| Afghan | 66 | 0.0% |
| African | 875 | 0.3% |
| Alaskan Athabascan | 36 | 0.0% |
| Albanian | 118 | 0.0% |
| Aleut | 170 | 0.1% |
| American | 14,002 | 5.1% |
| Apache | 177 | 0.1% |
| Arab | 2,685 | 1.0% |
| Argentinean | 215 | 0.1% |
| Armenian | 460 | 0.2% |
| Assyrian / Chaldean / Syriac | 470 | 0.2% |
| Australian | 11 | 0.0% |
| Austrian | 646 | 0.2% |
| Bahamian | 18 | 0.0% |
| Bangladeshi | 12 | 0.0% |
| Basque | 97 | 0.0% |
| Belgian | 240 | 0.1% |
| Bhutanese | 2,599 | 0.9% |
| Blackfeet | 56 | 0.0% |
| Bolivian | 101 | 0.0% |
| Brazilian | 122 | 0.0% |
| British | 1,615 | 0.6% |
| Bulgarian | 112 | 0.0% |
| Burmese | 2,519 | 0.9% |
| Canadian | 727 | 0.3% |
| Cape Verdean | 17 | 0.0% |
| Carpatho Rusyn | 18 | 0.0% |
| Central American | 2,426 | 0.9% |
| Central American Indian | 256 | 0.1% |
| Cherokee | 583 | 0.2% |
| Cheyenne | 2 | 0.0% |
| Chickasaw | 58 | 0.0% |
| Chilean | 52 | 0.0% |
| Chippewa | 45 | 0.0% |
| Choctaw | 308 | 0.1% |
| Colombian | 486 | 0.2% |
| Comanche | 2 | 0.0% |
| Costa Rican | 693 | 0.3% |
| Creek | 21 | 0.0% |
| Croatian | 590 | 0.2% |
| Cuban | 465 | 0.2% |
| Cypriot | 7 | 0.0% |
| Czech | 906 | 0.3% |
| Czechoslovakian | 336 | 0.1% |
| Danish | 1,219 | 0.4% |
| Dominican | 279 | 0.1% |
| Dutch | 2,906 | 1.1% |
| Eastern European | 620 | 0.2% |
| Ecuadorian | 238 | 0.1% |
| Egyptian | 406 | 0.2% |
| English | 24,283 | 8.8% |
| Estonian | 35 | 0.0% |
| Ethiopian | 353 | 0.1% |
| European | 4,717 | 1.7% |
| Filipino | 648 | 0.2% |
| Finnish | 614 | 0.2% |
| French | 6,214 | 2.2% |
| French Canadian | 1,103 | 0.4% |
| German | 35,187 | 12.8% |
| Ghanaian | 118 | 0.0% |
| Greek | 900 | 0.3% |
| Guamanian / Chamorro | 111 | 0.0% |
| Guatemalan | 905 | 0.3% |
| Guyanese | 69 | 0.0% |
| Haitian | 106 | 0.0% |
| Honduran | 16 | 0.0% |
| Hopi | 146 | 0.1% |
| Hungarian | 777 | 0.3% |
| Icelander | 51 | 0.0% |
| Indian (Asian) | 8,190 | 3.0% |
| Indonesian | 67 | 0.0% |
| Inupiat | 205 | 0.1% |
| Iranian | 936 | 0.3% |
| Iraqi | 332 | 0.1% |
| Irish | 24,517 | 8.9% |
| Iroquois | 59 | 0.0% |
| Israeli | 274 | 0.1% |
| Italian | 13,329 | 4.8% |
| Jamaican | 353 | 0.1% |
| Japanese | 559 | 0.2% |
| Jordanian | 323 | 0.1% |
| Kenyan | 8 | 0.0% |
| Kiowa | 30 | 0.0% |
| Korean | 5,143 | 1.9% |
| Laotian | 334 | 0.1% |
| Latvian | 10 | 0.0% |
| Lebanese | 730 | 0.3% |
| Lithuanian | 486 | 0.2% |
| Luxembourger | 79 | 0.0% |
| Macedonian | 28 | 0.0% |
| Malaysian | 75 | 0.0% |
| Maltese | 15 | 0.0% |
| Menominee | 2 | 0.0% |
| Mexican | 47,694 | 17.3% |
| Mexican American Indian | 580 | 0.2% |
| Mongolian | 169 | 0.1% |
| Moroccan | 71 | 0.0% |
| Native Hawaiian | 528 | 0.2% |
| Navajo | 3,121 | 1.1% |
| New Zealander | 12 | 0.0% |
| Nicaraguan | 203 | 0.1% |
| Nigerian | 539 | 0.2% |
| Northern European | 397 | 0.1% |
| Norwegian | 4,120 | 1.5% |
| Osage | 24 | 0.0% |
| Pakistani | 379 | 0.1% |
| Palestinian | 9 | 0.0% |
| Panamanian | 95 | 0.0% |
| Paraguayan | 29 | 0.0% |
| Pennsylvania German | 95 | 0.0% |
| Peruvian | 507 | 0.2% |
| Pima | 352 | 0.1% |
| Polish | 6,715 | 2.4% |
| Portuguese | 681 | 0.3% |
| Potawatomi | 185 | 0.1% |
| Pueblo | 85 | 0.0% |
| Puerto Rican | 2,439 | 0.9% |
| Puget Sound Salish | 2 | 0.0% |
| Romanian | 247 | 0.1% |
| Russian | 2,022 | 0.7% |
| Salvadoran | 514 | 0.2% |
| Samoan | 193 | 0.1% |
| Scandinavian | 1,245 | 0.4% |
| Scotch-Irish | 1,754 | 0.6% |
| Scottish | 4,667 | 1.7% |
| Seminole | 9 | 0.0% |
| Senegalese | 110 | 0.0% |
| Serbian | 254 | 0.1% |
| Shoshone | 122 | 0.0% |
| Sierra Leonean | 123 | 0.0% |
| Sioux | 36 | 0.0% |
| Slavic | 218 | 0.1% |
| Slovak | 408 | 0.2% |
| Slovene | 173 | 0.1% |
| South African | 28 | 0.0% |
| South American | 1,907 | 0.7% |
| South American Indian | 50 | 0.0% |
| Spaniard | 813 | 0.3% |
| Spanish | 847 | 0.3% |
| Spanish American | 64 | 0.0% |
| Sri Lankan | 4,320 | 1.6% |
| Subsaharan African | 2,376 | 0.9% |
| Sudanese | 73 | 0.0% |
| Swedish | 3,296 | 1.2% |
| Swiss | 445 | 0.2% |
| Syrian | 311 | 0.1% |
| Thai | 12,534 | 4.5% |
| Tlingit-Haida | 197 | 0.1% |
| Tohono O'Odham | 247 | 0.1% |
| Tongan | 45 | 0.0% |
| Trinidadian and Tobagonian | 141 | 0.1% |
| Tsimshian | 26 | 0.0% |
| Turkish | 564 | 0.2% |
| Ukrainian | 701 | 0.3% |
| Uruguayan | 5 | 0.0% |
| Venezuelan | 274 | 0.1% |
| Vietnamese | 1,171 | 0.4% |
| Welsh | 1,628 | 0.6% |
| Yaqui | 239 | 0.1% |
| Yugoslavian | 361 | 0.1% |
| Zimbabwean | 55 | 0.0% | View All 161 Rows |
Immigrants in Chandler
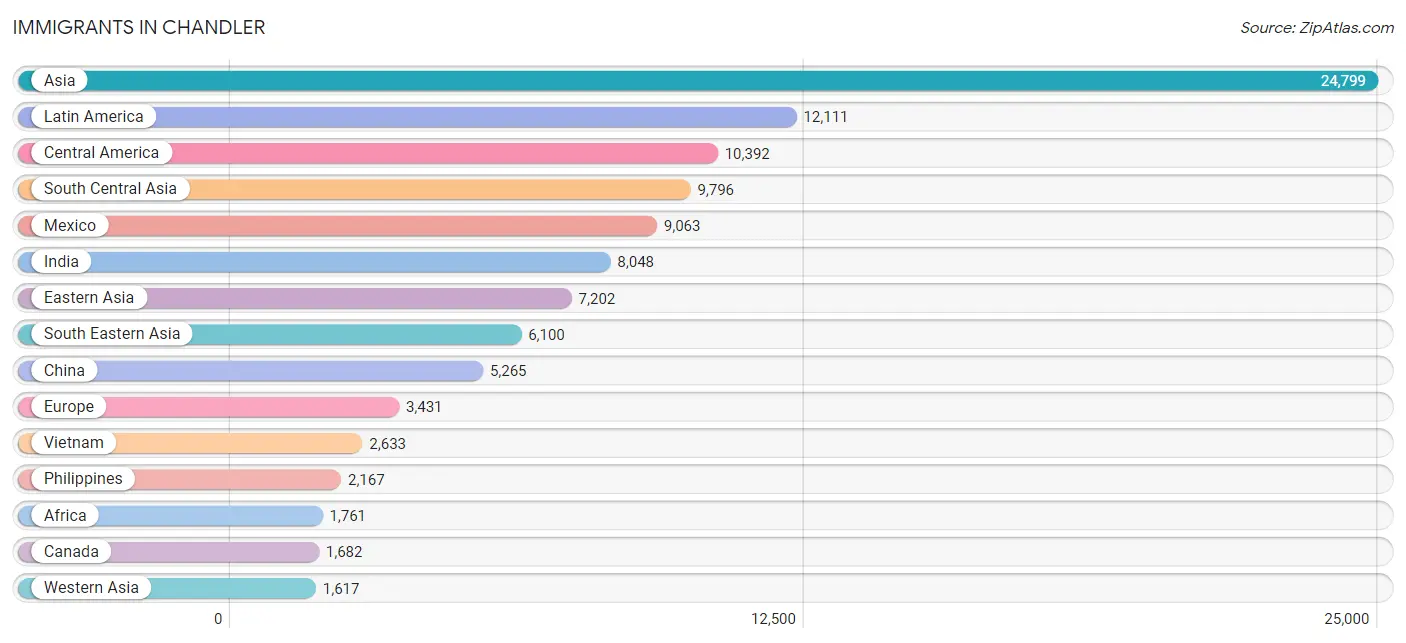
The most numerous immigrant groups reported in Chandler came from Asia (24,799 | 9.0%), Latin America (12,111 | 4.4%), Central America (10,392 | 3.8%), South Central Asia (9,796 | 3.5%), and Mexico (9,063 | 3.3%), together accounting for 24.0% of all Chandler residents.
| Immigration Origin | # Population | % Population |
| Afghanistan | 22 | 0.0% |
| Africa | 1,761 | 0.6% |
| Albania | 70 | 0.0% |
| Argentina | 100 | 0.0% |
| Armenia | 15 | 0.0% |
| Asia | 24,799 | 9.0% |
| Australia | 76 | 0.0% |
| Austria | 21 | 0.0% |
| Bahamas | 18 | 0.0% |
| Bangladesh | 722 | 0.3% |
| Belgium | 15 | 0.0% |
| Bolivia | 47 | 0.0% |
| Bosnia and Herzegovina | 108 | 0.0% |
| Brazil | 96 | 0.0% |
| Bulgaria | 61 | 0.0% |
| Cambodia | 317 | 0.1% |
| Canada | 1,682 | 0.6% |
| Caribbean | 482 | 0.2% |
| Central America | 10,392 | 3.8% |
| Chile | 33 | 0.0% |
| China | 5,265 | 1.9% |
| Colombia | 274 | 0.1% |
| Costa Rica | 409 | 0.2% |
| Croatia | 83 | 0.0% |
| Cuba | 162 | 0.1% |
| Czechoslovakia | 38 | 0.0% |
| Denmark | 18 | 0.0% |
| Dominican Republic | 108 | 0.0% |
| Eastern Africa | 540 | 0.2% |
| Eastern Asia | 7,202 | 2.6% |
| Eastern Europe | 1,210 | 0.4% |
| Ecuador | 33 | 0.0% |
| Egypt | 238 | 0.1% |
| El Salvador | 249 | 0.1% |
| England | 477 | 0.2% |
| Ethiopia | 343 | 0.1% |
| Europe | 3,431 | 1.2% |
| France | 145 | 0.1% |
| Germany | 425 | 0.2% |
| Ghana | 104 | 0.0% |
| Greece | 25 | 0.0% |
| Guatemala | 575 | 0.2% |
| Guyana | 70 | 0.0% |
| Haiti | 108 | 0.0% |
| Hong Kong | 210 | 0.1% |
| Hungary | 50 | 0.0% |
| India | 8,048 | 2.9% |
| Indonesia | 275 | 0.1% |
| Iran | 520 | 0.2% |
| Iraq | 241 | 0.1% |
| Ireland | 93 | 0.0% |
| Israel | 135 | 0.1% |
| Italy | 95 | 0.0% |
| Jamaica | 13 | 0.0% |
| Japan | 604 | 0.2% |
| Jordan | 235 | 0.1% |
| Kazakhstan | 33 | 0.0% |
| Kenya | 41 | 0.0% |
| Korea | 1,333 | 0.5% |
| Kuwait | 20 | 0.0% |
| Laos | 47 | 0.0% |
| Latin America | 12,111 | 4.4% |
| Lebanon | 164 | 0.1% |
| Malaysia | 259 | 0.1% |
| Mexico | 9,063 | 3.3% |
| Micronesia | 3 | 0.0% |
| Middle Africa | 56 | 0.0% |
| Morocco | 25 | 0.0% |
| Nepal | 164 | 0.1% |
| Netherlands | 113 | 0.0% |
| Nicaragua | 55 | 0.0% |
| Nigeria | 348 | 0.1% |
| North Macedonia | 12 | 0.0% |
| Northern Africa | 313 | 0.1% |
| Northern Europe | 1,237 | 0.4% |
| Oceania | 90 | 0.0% |
| Pakistan | 234 | 0.1% |
| Panama | 41 | 0.0% |
| Peru | 288 | 0.1% |
| Philippines | 2,167 | 0.8% |
| Poland | 179 | 0.1% |
| Portugal | 17 | 0.0% |
| Romania | 95 | 0.0% |
| Russia | 177 | 0.1% |
| Saudi Arabia | 47 | 0.0% |
| Scotland | 61 | 0.0% |
| Senegal | 117 | 0.0% |
| Serbia | 19 | 0.0% |
| Sierra Leone | 59 | 0.0% |
| Singapore | 137 | 0.1% |
| South Africa | 106 | 0.0% |
| South America | 1,237 | 0.4% |
| South Central Asia | 9,796 | 3.5% |
| South Eastern Asia | 6,100 | 2.2% |
| Southern Europe | 229 | 0.1% |
| Spain | 92 | 0.0% |
| Sri Lanka | 43 | 0.0% |
| Sudan | 50 | 0.0% |
| Sweden | 49 | 0.0% |
| Switzerland | 36 | 0.0% |
| Syria | 283 | 0.1% |
| Taiwan | 1,028 | 0.4% |
| Thailand | 192 | 0.1% |
| Trinidad and Tobago | 61 | 0.0% |
| Turkey | 393 | 0.1% |
| Uganda | 28 | 0.0% |
| Ukraine | 264 | 0.1% |
| Uruguay | 5 | 0.0% |
| Uzbekistan | 6 | 0.0% |
| Venezuela | 262 | 0.1% |
| Vietnam | 2,633 | 1.0% |
| Western Africa | 671 | 0.2% |
| Western Asia | 1,617 | 0.6% |
| Western Europe | 755 | 0.3% |
| Yemen | 58 | 0.0% |
| Zaire | 56 | 0.0% |
| Zimbabwe | 61 | 0.0% | View All 117 Rows |
Sex and Age in Chandler
Sex and Age in Chandler
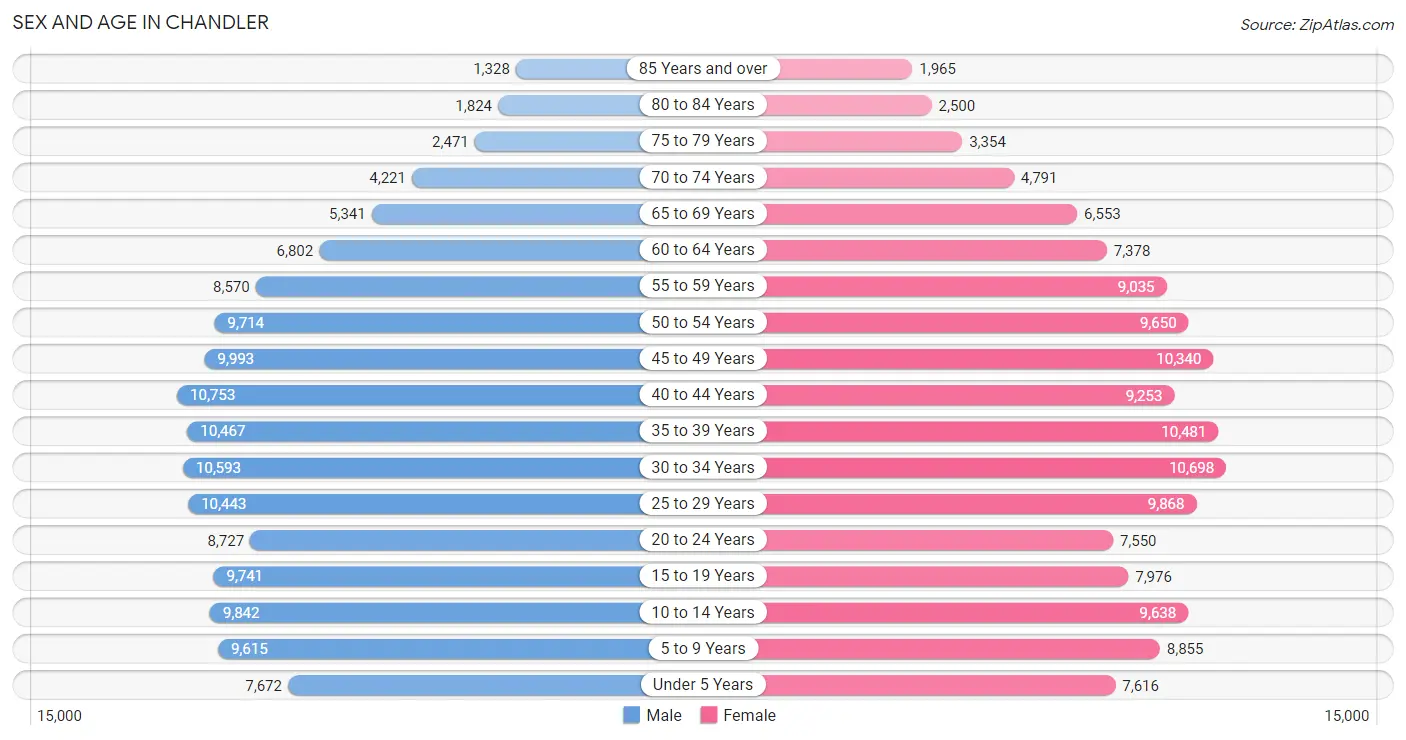
The most populous age groups in Chandler are 40 to 44 Years (10,753 | 7.8%) for men and 30 to 34 Years (10,698 | 7.8%) for women.
| Age Bracket | Male | Female |
| Under 5 Years | 7,672 (5.6%) | 7,616 (5.5%) |
| 5 to 9 Years | 9,615 (7.0%) | 8,855 (6.4%) |
| 10 to 14 Years | 9,842 (7.1%) | 9,638 (7.0%) |
| 15 to 19 Years | 9,741 (7.0%) | 7,976 (5.8%) |
| 20 to 24 Years | 8,727 (6.3%) | 7,550 (5.5%) |
| 25 to 29 Years | 10,443 (7.6%) | 9,868 (7.2%) |
| 30 to 34 Years | 10,593 (7.7%) | 10,698 (7.8%) |
| 35 to 39 Years | 10,467 (7.6%) | 10,481 (7.6%) |
| 40 to 44 Years | 10,753 (7.8%) | 9,253 (6.7%) |
| 45 to 49 Years | 9,993 (7.2%) | 10,340 (7.5%) |
| 50 to 54 Years | 9,714 (7.0%) | 9,650 (7.0%) |
| 55 to 59 Years | 8,570 (6.2%) | 9,035 (6.6%) |
| 60 to 64 Years | 6,802 (4.9%) | 7,378 (5.4%) |
| 65 to 69 Years | 5,341 (3.9%) | 6,553 (4.8%) |
| 70 to 74 Years | 4,221 (3.1%) | 4,791 (3.5%) |
| 75 to 79 Years | 2,471 (1.8%) | 3,354 (2.4%) |
| 80 to 84 Years | 1,824 (1.3%) | 2,500 (1.8%) |
| 85 Years and over | 1,328 (1.0%) | 1,965 (1.4%) |
| Total | 138,117 (100.0%) | 137,501 (100.0%) |
Families and Households in Chandler
Median Family Size in Chandler
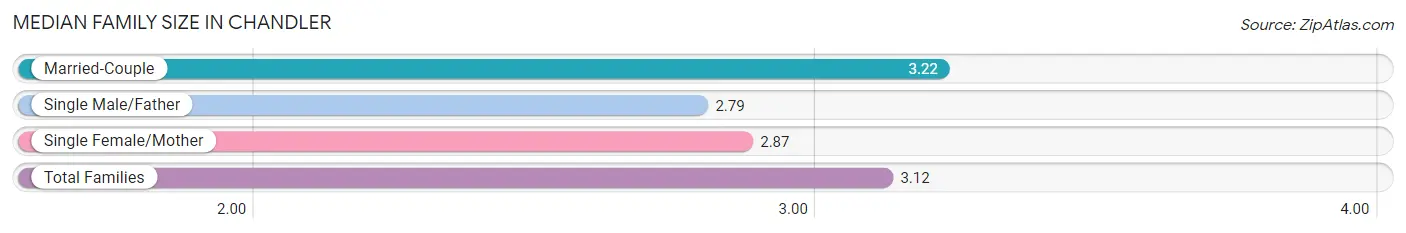
The median family size in Chandler is 3.12 persons per family, with married-couple families (53,507 | 74.7%) accounting for the largest median family size of 3.22 persons per family. On the other hand, single male/father families (5,919 | 8.3%) represent the smallest median family size with 2.79 persons per family.
| Family Type | # Families | Family Size |
| Married-Couple | 53,507 (74.7%) | 3.22 |
| Single Male/Father | 5,919 (8.3%) | 2.79 |
| Single Female/Mother | 12,208 (17.0%) | 2.87 |
| Total Families | 71,634 (100.0%) | 3.12 |
Median Household Size in Chandler
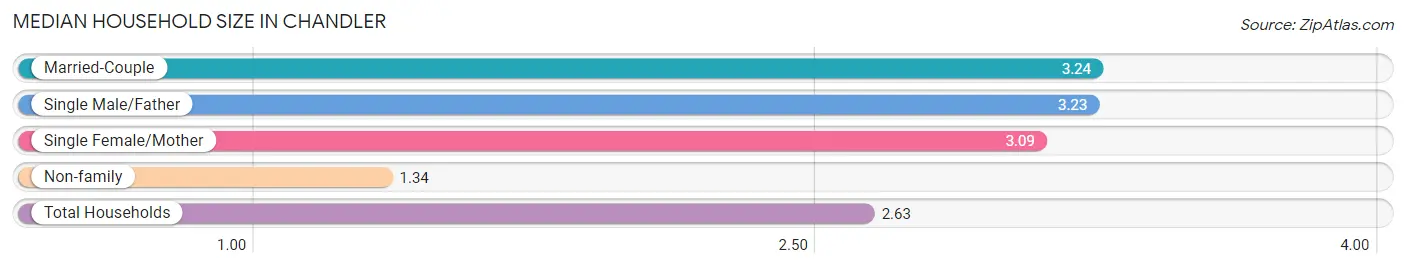
The median household size in Chandler is 2.63 persons per household, with married-couple households (53,507 | 51.2%) accounting for the largest median household size of 3.24 persons per household. non-family households (32,785 | 31.4%) represent the smallest median household size with 1.34 persons per household.
| Household Type | # Households | Household Size |
| Married-Couple | 53,507 (51.2%) | 3.24 |
| Single Male/Father | 5,919 (5.7%) | 3.23 |
| Single Female/Mother | 12,208 (11.7%) | 3.09 |
| Non-family | 32,785 (31.4%) | 1.34 |
| Total Households | 104,419 (100.0%) | 2.63 |
Household Size by Marriage Status in Chandler
Out of a total of 104,419 households in Chandler, 71,634 (68.6%) are family households, while 32,785 (31.4%) are nonfamily households. The most numerous type of family households are 2-person households, comprising 28,153, and the most common type of nonfamily households are 1-person households, comprising 24,037.
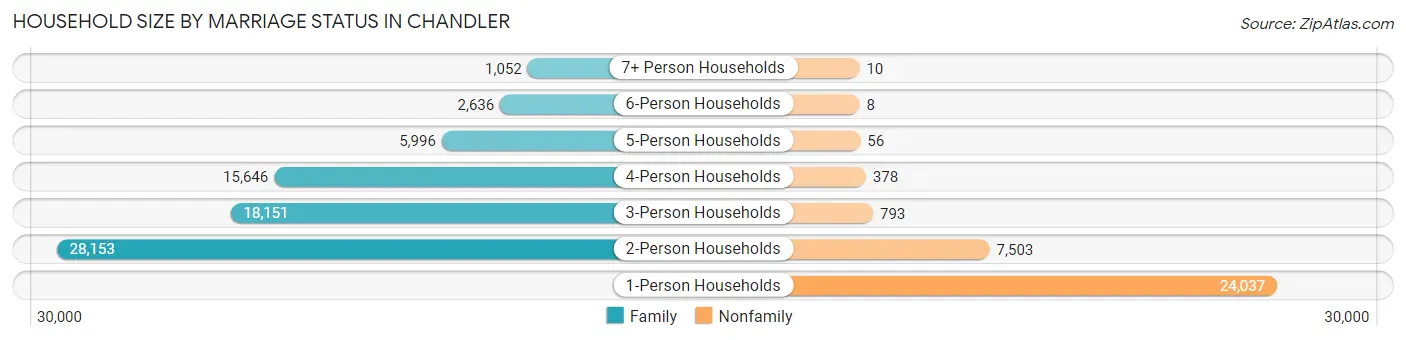
| Household Size | Family Households | Nonfamily Households |
| 1-Person Households | - | 24,037 (23.0%) |
| 2-Person Households | 28,153 (27.0%) | 7,503 (7.2%) |
| 3-Person Households | 18,151 (17.4%) | 793 (0.8%) |
| 4-Person Households | 15,646 (15.0%) | 378 (0.4%) |
| 5-Person Households | 5,996 (5.7%) | 56 (0.1%) |
| 6-Person Households | 2,636 (2.5%) | 8 (0.0%) |
| 7+ Person Households | 1,052 (1.0%) | 10 (0.0%) |
| Total | 71,634 (68.6%) | 32,785 (31.4%) |
Female Fertility in Chandler
Fertility by Age in Chandler
Average fertility rate in Chandler is 48.0 births per 1,000 women. Women in the age bracket of 20 to 34 years have the highest fertility rate with 83.0 births per 1,000 women. Women in the age bracket of 20 to 34 years acount for 70.4% of all women with births.
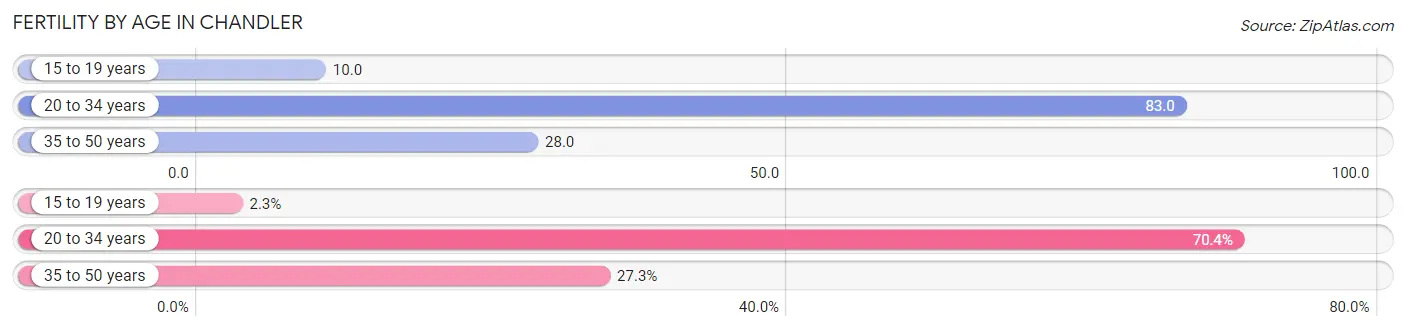
| Age Bracket | Women with Births | Births / 1,000 Women |
| 15 to 19 years | 78 (2.3%) | 10.0 |
| 20 to 34 years | 2,341 (70.4%) | 83.0 |
| 35 to 50 years | 908 (27.3%) | 28.0 |
| Total | 3,327 (100.0%) | 48.0 |
Fertility by Age by Marriage Status in Chandler
73.3% of women with births (3,327) in Chandler are married. The highest percentage of unmarried women with births falls into 15 to 19 years age bracket with 100.0% of them unmarried at the time of birth, while the lowest percentage of unmarried women with births belong to 35 to 50 years age bracket with 9.5% of them unmarried.
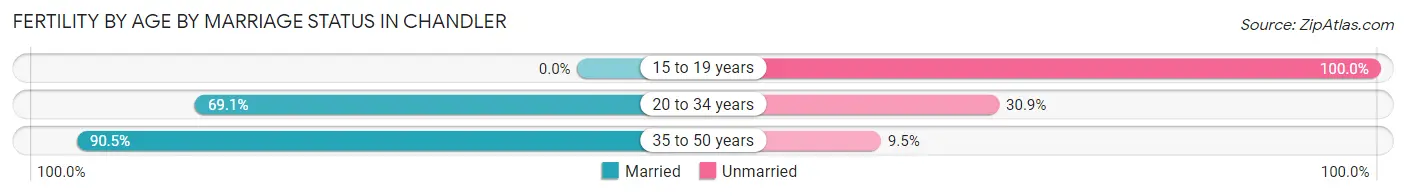
| Age Bracket | Married | Unmarried |
| 15 to 19 years | 0 (0.0%) | 78 (100.0%) |
| 20 to 34 years | 1,618 (69.1%) | 723 (30.9%) |
| 35 to 50 years | 822 (90.5%) | 86 (9.5%) |
| Total | 2,439 (73.3%) | 888 (26.7%) |
Fertility by Education in Chandler
Average fertility rate in Chandler is 48.0 births per 1,000 women. Women with the education attainment of graduate degree have the highest fertility rate of 63.0 births per 1,000 women, while women with the education attainment of less than high school have the lowest fertility at 25.0 births per 1,000 women. Women with the education attainment of bachelor's degree represent 34.4% of all women with births.
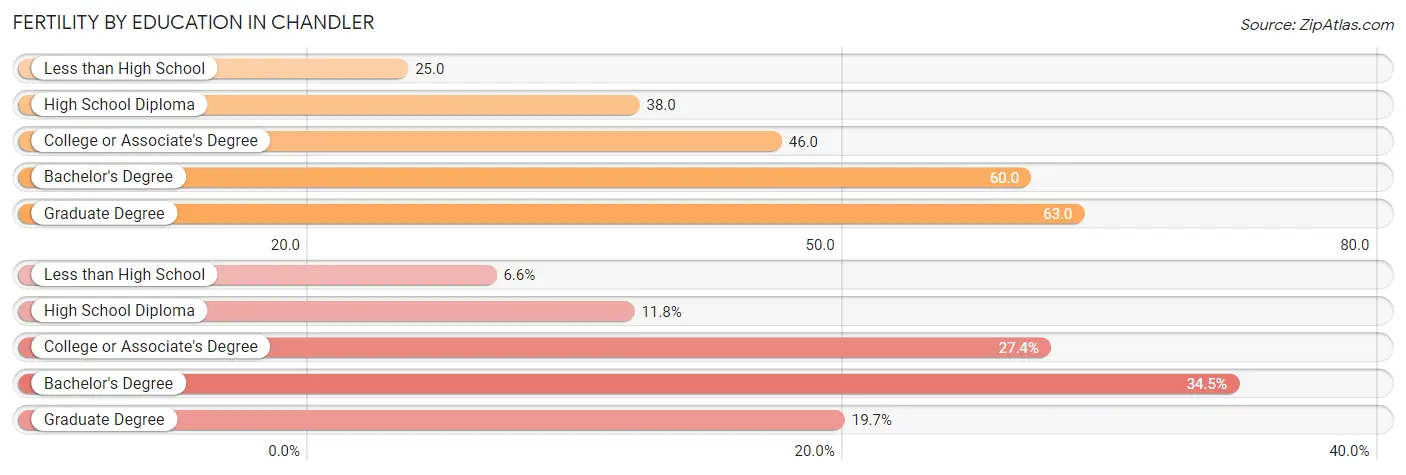
| Educational Attainment | Women with Births | Births / 1,000 Women |
| Less than High School | 221 (6.6%) | 25.0 |
| High School Diploma | 393 (11.8%) | 38.0 |
| College or Associate's Degree | 912 (27.4%) | 46.0 |
| Bachelor's Degree | 1,146 (34.4%) | 60.0 |
| Graduate Degree | 655 (19.7%) | 63.0 |
| Total | 3,327 (100.0%) | 48.0 |
Fertility by Education by Marriage Status in Chandler
26.7% of women with births in Chandler are unmarried. Women with the educational attainment of graduate degree are most likely to be married with 98.3% of them married at childbirth, while women with the educational attainment of high school diploma are least likely to be married with 77.9% of them unmarried at childbirth.
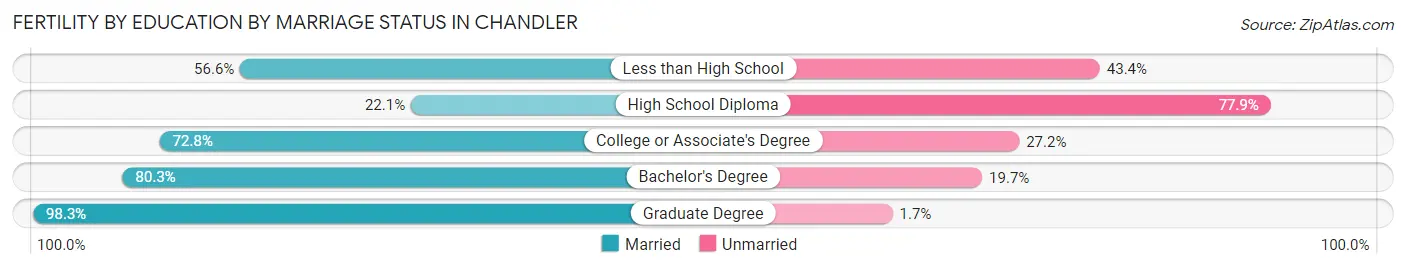
| Educational Attainment | Married | Unmarried |
| Less than High School | 125 (56.6%) | 96 (43.4%) |
| High School Diploma | 87 (22.1%) | 306 (77.9%) |
| College or Associate's Degree | 664 (72.8%) | 248 (27.2%) |
| Bachelor's Degree | 920 (80.3%) | 226 (19.7%) |
| Graduate Degree | 644 (98.3%) | 11 (1.7%) |
| Total | 2,439 (73.3%) | 888 (26.7%) |
Employment Characteristics in Chandler
Employment by Class of Employer in Chandler
Among the 148,161 employed individuals in Chandler, private company employees (110,307 | 74.5%), not-for-profit organizations (9,606 | 6.5%), and local government employees (8,178 | 5.5%) make up the most common classes of employment.
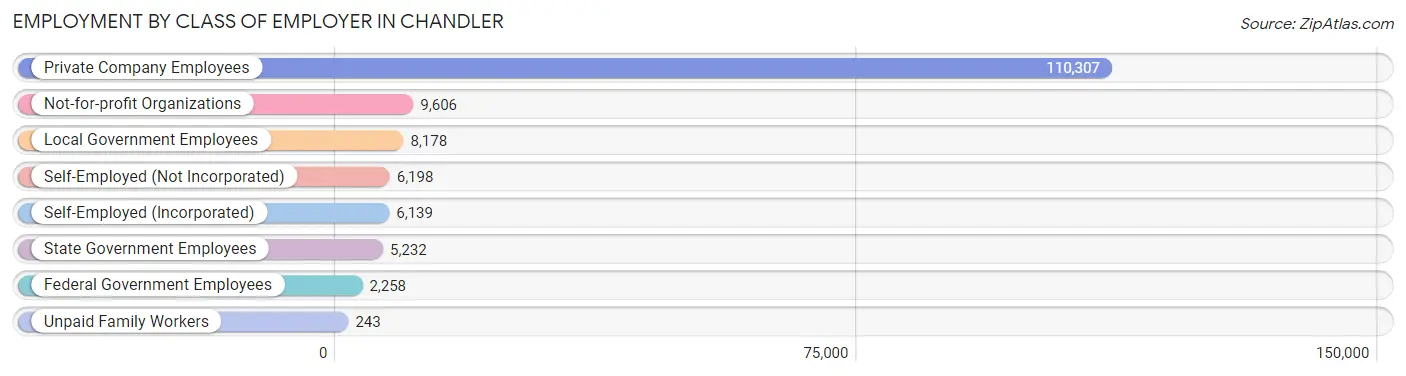
| Employer Class | # Employees | % Employees |
| Private Company Employees | 110,307 | 74.5% |
| Self-Employed (Incorporated) | 6,139 | 4.1% |
| Self-Employed (Not Incorporated) | 6,198 | 4.2% |
| Not-for-profit Organizations | 9,606 | 6.5% |
| Local Government Employees | 8,178 | 5.5% |
| State Government Employees | 5,232 | 3.5% |
| Federal Government Employees | 2,258 | 1.5% |
| Unpaid Family Workers | 243 | 0.2% |
| Total | 148,161 | 100.0% |
Employment Status by Age in Chandler
According to the labor force statistics for Chandler, out of the total population over 16 years of age (218,401), 71.6% or 156,375 individuals are in the labor force, with 3.8% or 5,942 of them unemployed. The age group with the highest labor force participation rate is 25 to 29 years, with 90.5% or 18,381 individuals in the labor force. Within the labor force, the 16 to 19 years age range has the highest percentage of unemployed individuals, with 13.9% or 802 of them being unemployed.
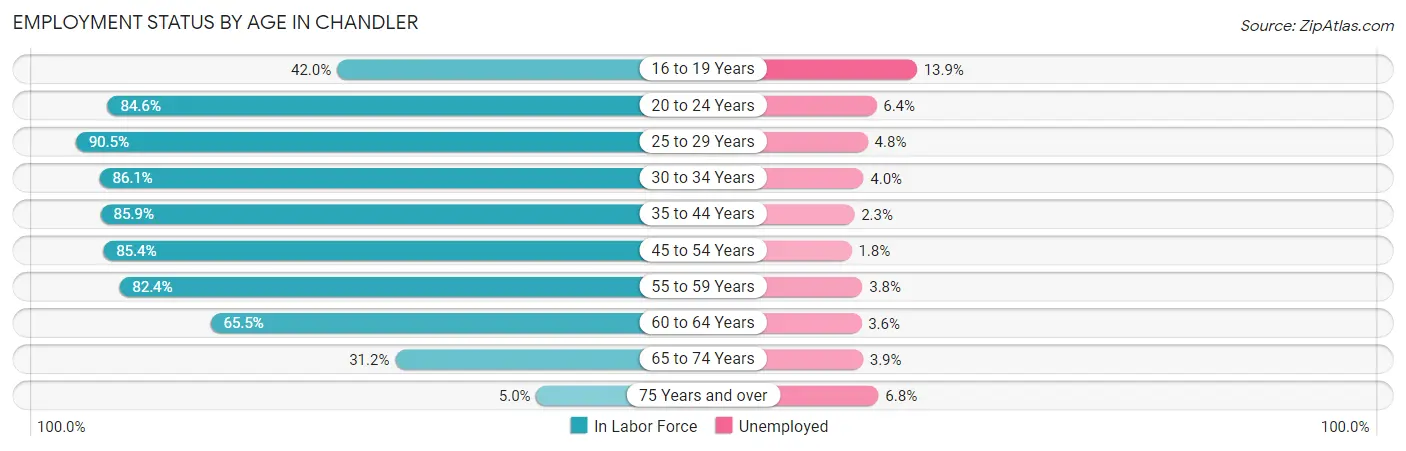
| Age Bracket | In Labor Force | Unemployed |
| 16 to 19 Years | 5,770 (42.0%) | 802 (13.9%) |
| 20 to 24 Years | 13,770 (84.6%) | 881 (6.4%) |
| 25 to 29 Years | 18,381 (90.5%) | 882 (4.8%) |
| 30 to 34 Years | 18,332 (86.1%) | 733 (4.0%) |
| 35 to 44 Years | 35,179 (85.9%) | 809 (2.3%) |
| 45 to 54 Years | 33,901 (85.4%) | 610 (1.8%) |
| 55 to 59 Years | 14,507 (82.4%) | 551 (3.8%) |
| 60 to 64 Years | 9,288 (65.5%) | 334 (3.6%) |
| 65 to 74 Years | 6,523 (31.2%) | 254 (3.9%) |
| 75 Years and over | 672 (5.0%) | 46 (6.8%) |
| Total | 156,375 (71.6%) | 5,942 (3.8%) |
Employment Status by Educational Attainment in Chandler
According to labor force statistics for Chandler, 84.1% of individuals (129,546) out of the total population between 25 and 64 years of age (154,038) are in the labor force, with 3.1% or 4,016 of them being unemployed. The group with the highest labor force participation rate are those with the educational attainment of bachelor's degree or higher, with 87.7% or 65,463 individuals in the labor force. Within the labor force, individuals with less than high school education have the highest percentage of unemployment, with 4.2% or 218 of them being unemployed.
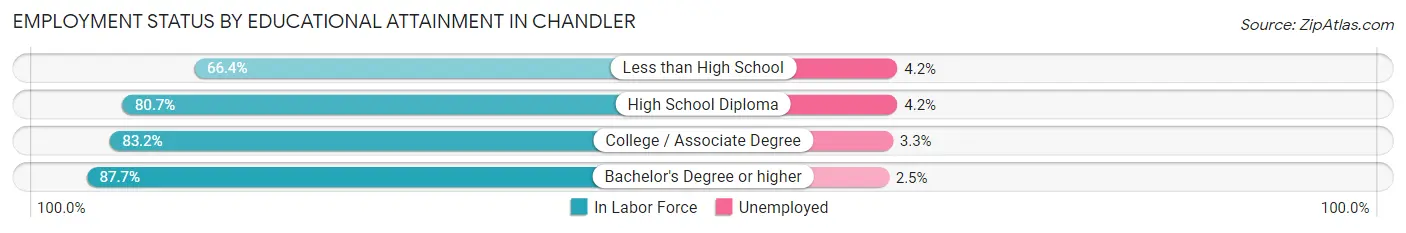
| Educational Attainment | In Labor Force | Unemployed |
| Less than High School | 5,202 (66.4%) | 329 (4.2%) |
| High School Diploma | 20,140 (80.7%) | 1,048 (4.2%) |
| College / Associate Degree | 38,773 (83.2%) | 1,538 (3.3%) |
| Bachelor's Degree or higher | 65,463 (87.7%) | 1,866 (2.5%) |
| Total | 129,546 (84.1%) | 4,775 (3.1%) |
Employment Occupations by Sex in Chandler
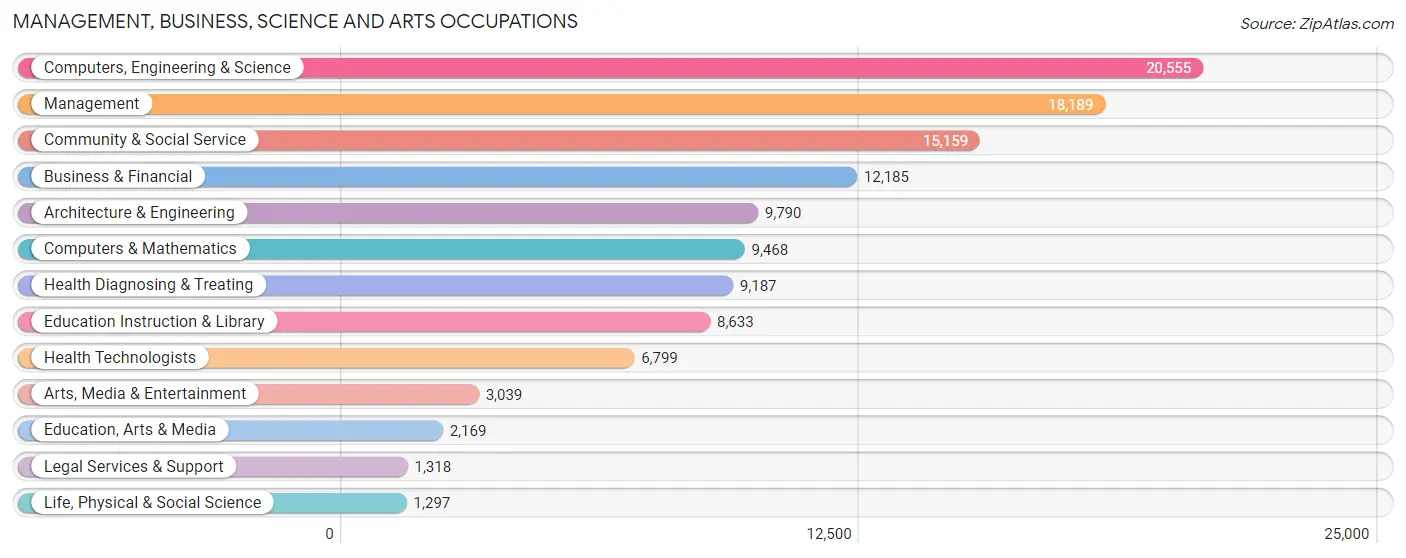
Management, Business, Science and Arts Occupations
The most common Management, Business, Science and Arts occupations in Chandler are Computers, Engineering & Science (20,555 | 13.7%), Management (18,189 | 12.1%), Community & Social Service (15,159 | 10.1%), Business & Financial (12,185 | 8.1%), and Architecture & Engineering (9,790 | 6.5%).
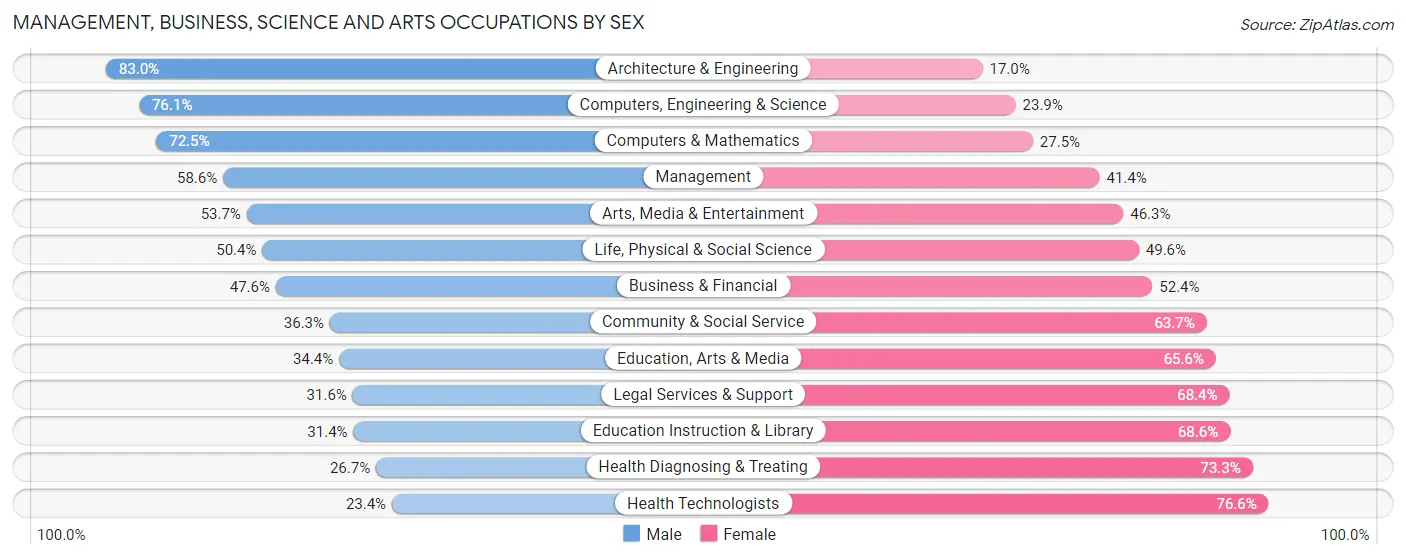
Management, Business, Science and Arts Occupations by Sex
Within the Management, Business, Science and Arts occupations in Chandler, the most male-oriented occupations are Architecture & Engineering (83.0%), Computers, Engineering & Science (76.1%), and Computers & Mathematics (72.5%), while the most female-oriented occupations are Health Technologists (76.6%), Health Diagnosing & Treating (73.3%), and Education Instruction & Library (68.6%).
| Occupation | Male | Female |
| Management | 10,660 (58.6%) | 7,529 (41.4%) |
| Business & Financial | 5,800 (47.6%) | 6,385 (52.4%) |
| Computers, Engineering & Science | 15,649 (76.1%) | 4,906 (23.9%) |
| Computers & Mathematics | 6,866 (72.5%) | 2,602 (27.5%) |
| Architecture & Engineering | 8,129 (83.0%) | 1,661 (17.0%) |
| Life, Physical & Social Science | 654 (50.4%) | 643 (49.6%) |
| Community & Social Service | 5,505 (36.3%) | 9,654 (63.7%) |
| Education, Arts & Media | 746 (34.4%) | 1,423 (65.6%) |
| Legal Services & Support | 416 (31.6%) | 902 (68.4%) |
| Education Instruction & Library | 2,712 (31.4%) | 5,921 (68.6%) |
| Arts, Media & Entertainment | 1,631 (53.7%) | 1,408 (46.3%) |
| Health Diagnosing & Treating | 2,453 (26.7%) | 6,734 (73.3%) |
| Health Technologists | 1,589 (23.4%) | 5,210 (76.6%) |
| Total (Category) | 40,067 (53.2%) | 35,208 (46.8%) |
| Total (Overall) | 81,838 (54.5%) | 68,438 (45.5%) |
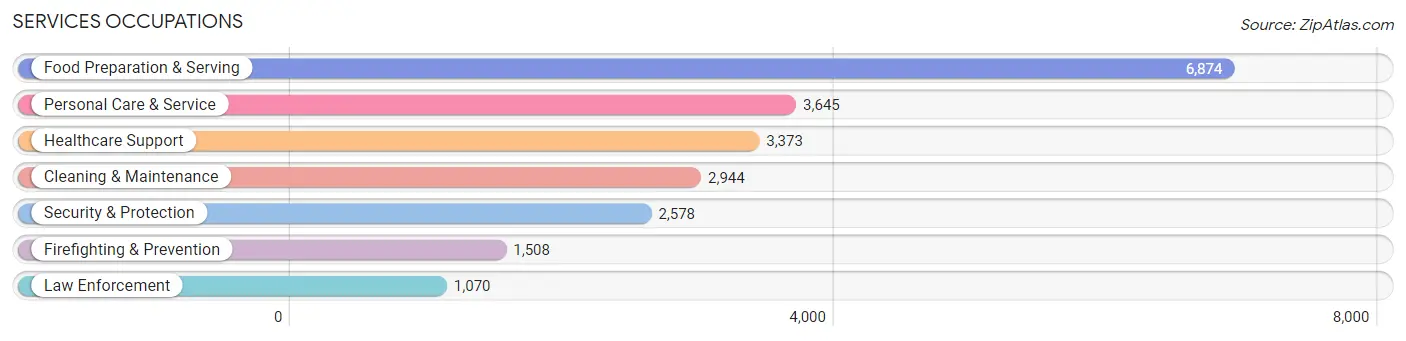
Services Occupations
The most common Services occupations in Chandler are Food Preparation & Serving (6,874 | 4.6%), Personal Care & Service (3,645 | 2.4%), Healthcare Support (3,373 | 2.2%), Cleaning & Maintenance (2,944 | 2.0%), and Security & Protection (2,578 | 1.7%).
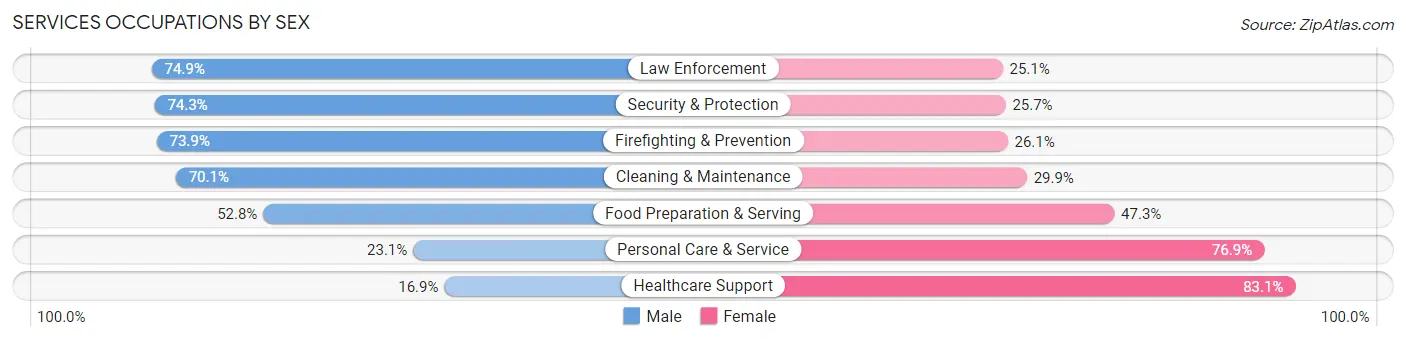
Services Occupations by Sex
Within the Services occupations in Chandler, the most male-oriented occupations are Law Enforcement (74.9%), Security & Protection (74.3%), and Firefighting & Prevention (73.9%), while the most female-oriented occupations are Healthcare Support (83.1%), Personal Care & Service (76.9%), and Food Preparation & Serving (47.2%).
| Occupation | Male | Female |
| Healthcare Support | 570 (16.9%) | 2,803 (83.1%) |
| Security & Protection | 1,915 (74.3%) | 663 (25.7%) |
| Firefighting & Prevention | 1,114 (73.9%) | 394 (26.1%) |
| Law Enforcement | 801 (74.9%) | 269 (25.1%) |
| Food Preparation & Serving | 3,626 (52.7%) | 3,248 (47.2%) |
| Cleaning & Maintenance | 2,063 (70.1%) | 881 (29.9%) |
| Personal Care & Service | 841 (23.1%) | 2,804 (76.9%) |
| Total (Category) | 9,015 (46.4%) | 10,399 (53.6%) |
| Total (Overall) | 81,838 (54.5%) | 68,438 (45.5%) |
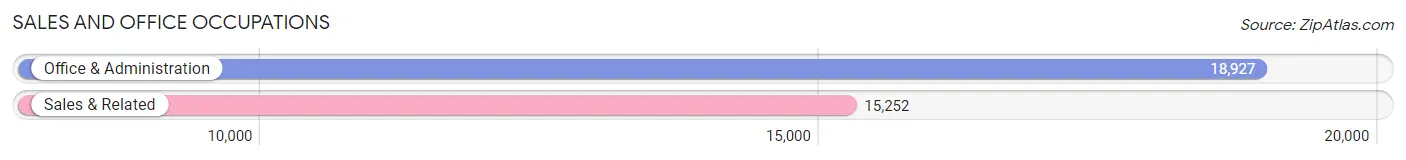
Sales and Office Occupations
The most common Sales and Office occupations in Chandler are Office & Administration (18,927 | 12.6%), and Sales & Related (15,252 | 10.2%).
Sales and Office Occupations by Sex
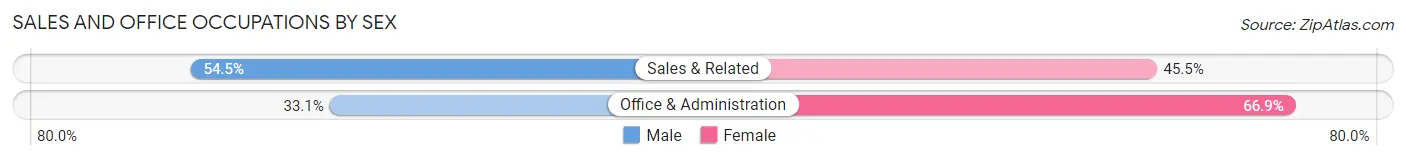
| Occupation | Male | Female |
| Sales & Related | 8,306 (54.5%) | 6,946 (45.5%) |
| Office & Administration | 6,263 (33.1%) | 12,664 (66.9%) |
| Total (Category) | 14,569 (42.6%) | 19,610 (57.4%) |
| Total (Overall) | 81,838 (54.5%) | 68,438 (45.5%) |
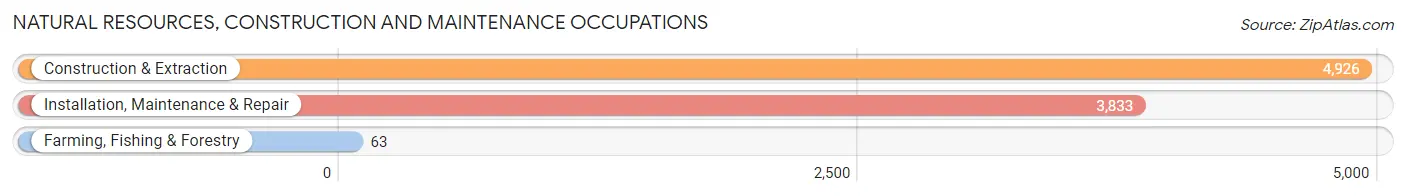
Natural Resources, Construction and Maintenance Occupations
The most common Natural Resources, Construction and Maintenance occupations in Chandler are Construction & Extraction (4,926 | 3.3%), Installation, Maintenance & Repair (3,833 | 2.5%), and Farming, Fishing & Forestry (63 | 0.0%).
Natural Resources, Construction and Maintenance Occupations by Sex
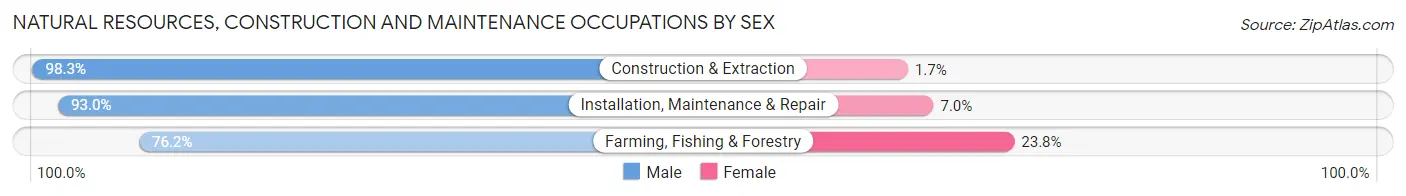
| Occupation | Male | Female |
| Farming, Fishing & Forestry | 48 (76.2%) | 15 (23.8%) |
| Construction & Extraction | 4,843 (98.3%) | 83 (1.7%) |
| Installation, Maintenance & Repair | 3,565 (93.0%) | 268 (7.0%) |
| Total (Category) | 8,456 (95.9%) | 366 (4.2%) |
| Total (Overall) | 81,838 (54.5%) | 68,438 (45.5%) |
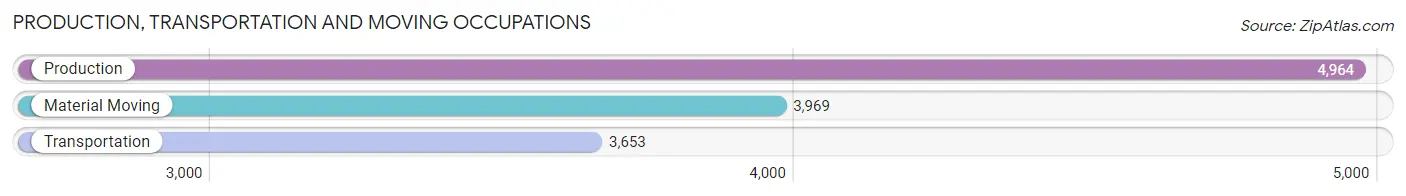
Production, Transportation and Moving Occupations
The most common Production, Transportation and Moving occupations in Chandler are Production (4,964 | 3.3%), Material Moving (3,969 | 2.6%), and Transportation (3,653 | 2.4%).
Production, Transportation and Moving Occupations by Sex
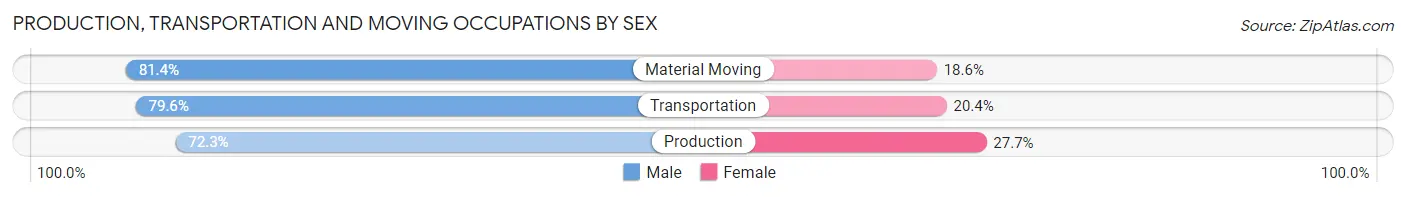
| Occupation | Male | Female |
| Production | 3,590 (72.3%) | 1,374 (27.7%) |
| Transportation | 2,909 (79.6%) | 744 (20.4%) |
| Material Moving | 3,232 (81.4%) | 737 (18.6%) |
| Total (Category) | 9,731 (77.3%) | 2,855 (22.7%) |
| Total (Overall) | 81,838 (54.5%) | 68,438 (45.5%) |
Employment Industries by Sex in Chandler
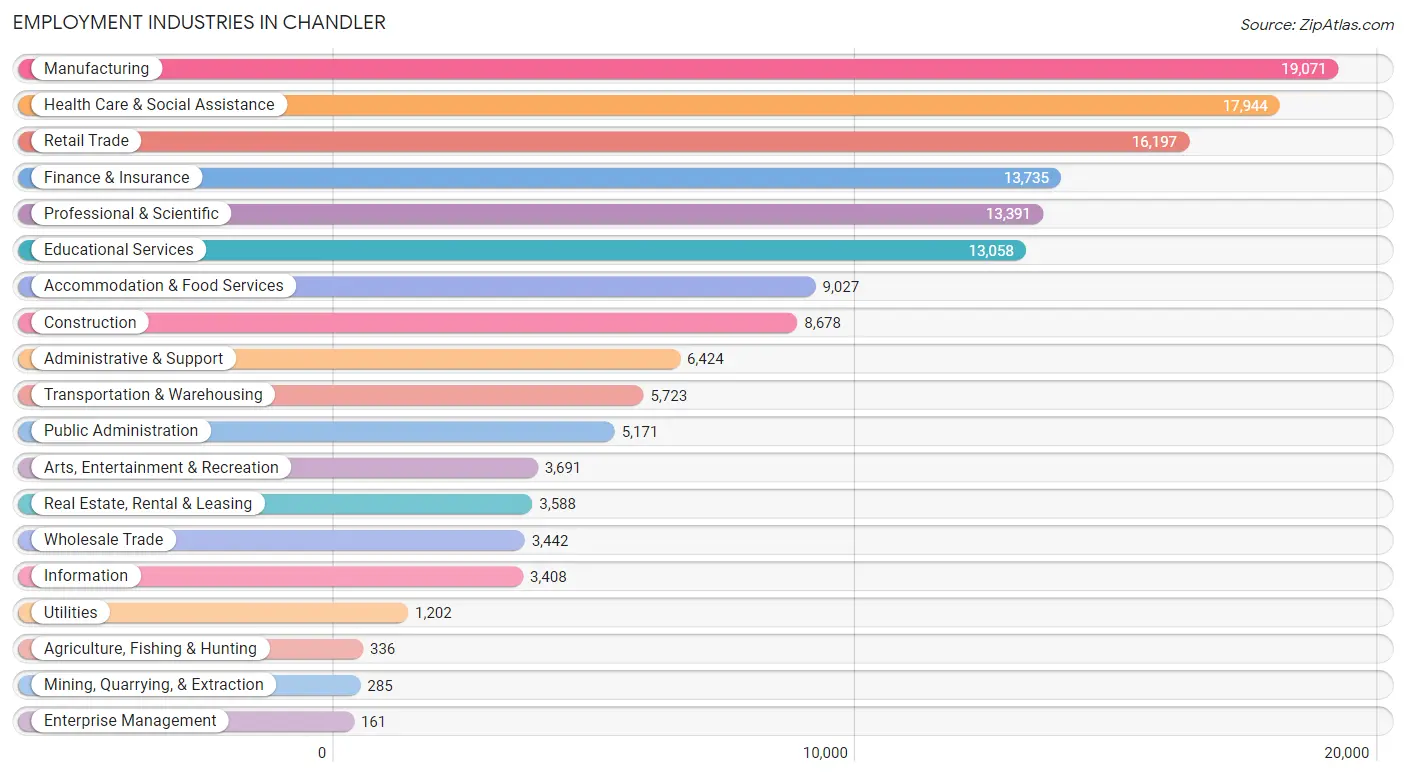
Employment Industries in Chandler
The major employment industries in Chandler include Manufacturing (19,071 | 12.7%), Health Care & Social Assistance (17,944 | 11.9%), Retail Trade (16,197 | 10.8%), Finance & Insurance (13,735 | 9.1%), and Professional & Scientific (13,391 | 8.9%).
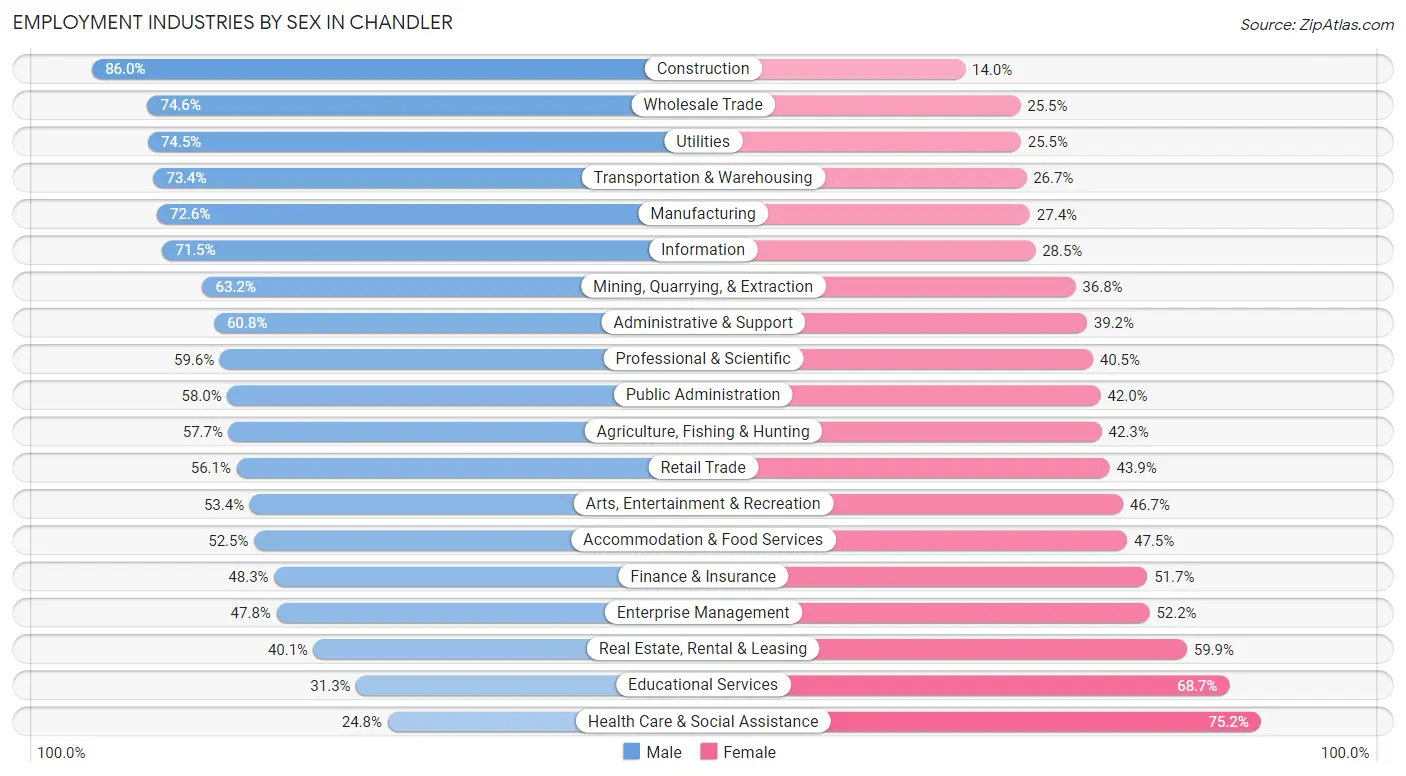
Employment Industries by Sex in Chandler
The Chandler industries that see more men than women are Construction (86.0%), Wholesale Trade (74.6%), and Utilities (74.5%), whereas the industries that tend to have a higher number of women are Health Care & Social Assistance (75.2%), Educational Services (68.7%), and Real Estate, Rental & Leasing (59.9%).
| Industry | Male | Female |
| Agriculture, Fishing & Hunting | 194 (57.7%) | 142 (42.3%) |
| Mining, Quarrying, & Extraction | 180 (63.2%) | 105 (36.8%) |
| Construction | 7,463 (86.0%) | 1,215 (14.0%) |
| Manufacturing | 13,841 (72.6%) | 5,230 (27.4%) |
| Wholesale Trade | 2,566 (74.6%) | 876 (25.5%) |
| Retail Trade | 9,084 (56.1%) | 7,113 (43.9%) |
| Transportation & Warehousing | 4,198 (73.4%) | 1,525 (26.7%) |
| Utilities | 895 (74.5%) | 307 (25.5%) |
| Information | 2,436 (71.5%) | 972 (28.5%) |
| Finance & Insurance | 6,632 (48.3%) | 7,103 (51.7%) |
| Real Estate, Rental & Leasing | 1,439 (40.1%) | 2,149 (59.9%) |
| Professional & Scientific | 7,974 (59.6%) | 5,417 (40.5%) |
| Enterprise Management | 77 (47.8%) | 84 (52.2%) |
| Administrative & Support | 3,905 (60.8%) | 2,519 (39.2%) |
| Educational Services | 4,090 (31.3%) | 8,968 (68.7%) |
| Health Care & Social Assistance | 4,456 (24.8%) | 13,488 (75.2%) |
| Arts, Entertainment & Recreation | 1,969 (53.3%) | 1,722 (46.7%) |
| Accommodation & Food Services | 4,736 (52.5%) | 4,291 (47.5%) |
| Public Administration | 2,998 (58.0%) | 2,173 (42.0%) |
| Total | 81,838 (54.5%) | 68,438 (45.5%) |
Education in Chandler
School Enrollment in Chandler
The most common levels of schooling among the 70,405 students in Chandler are high school (15,509 | 22.0%), middle school (15,370 | 21.8%), and elementary school (14,862 | 21.1%).
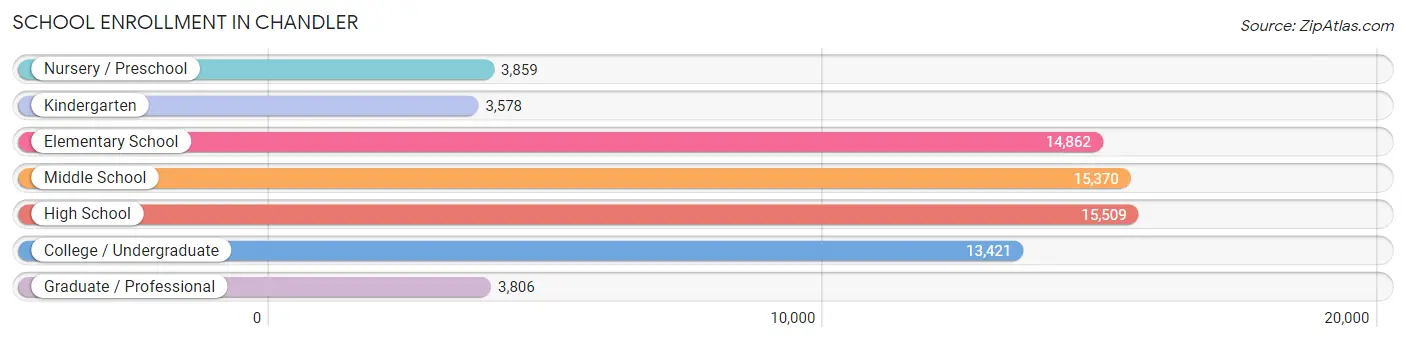
| School Level | # Students | % Students |
| Nursery / Preschool | 3,859 | 5.5% |
| Kindergarten | 3,578 | 5.1% |
| Elementary School | 14,862 | 21.1% |
| Middle School | 15,370 | 21.8% |
| High School | 15,509 | 22.0% |
| College / Undergraduate | 13,421 | 19.1% |
| Graduate / Professional | 3,806 | 5.4% |
| Total | 70,405 | 100.0% |
School Enrollment by Age by Funding Source in Chandler
Out of a total of 70,405 students who are enrolled in schools in Chandler, 10,702 (15.2%) attend a private institution, while the remaining 59,703 (84.8%) are enrolled in public schools. The age group of 3 to 4 year olds has the highest likelihood of being enrolled in private schools, with 1,489 (46.4% in the age bracket) enrolled. Conversely, the age group of 15 to 17 year olds has the lowest likelihood of being enrolled in a private school, with 10,546 (93.7% in the age bracket) attending a public institution.
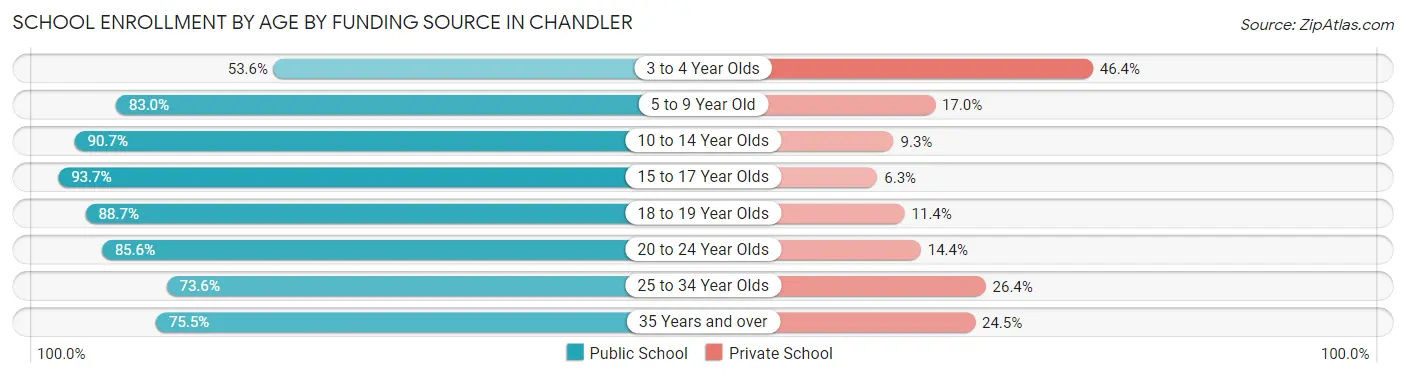
| Age Bracket | Public School | Private School |
| 3 to 4 Year Olds | 1,719 (53.6%) | 1,489 (46.4%) |
| 5 to 9 Year Old | 14,542 (83.0%) | 2,980 (17.0%) |
| 10 to 14 Year Olds | 17,379 (90.7%) | 1,781 (9.3%) |
| 15 to 17 Year Olds | 10,546 (93.7%) | 706 (6.3%) |
| 18 to 19 Year Olds | 3,766 (88.6%) | 482 (11.4%) |
| 20 to 24 Year Olds | 4,625 (85.6%) | 776 (14.4%) |
| 25 to 34 Year Olds | 3,765 (73.6%) | 1,353 (26.4%) |
| 35 Years and over | 3,396 (75.5%) | 1,100 (24.5%) |
| Total | 59,703 (84.8%) | 10,702 (15.2%) |
Educational Attainment by Field of Study in Chandler
Business (19,916 | 21.5%), engineering (14,057 | 15.1%), education (8,954 | 9.7%), science & technology (8,643 | 9.3%), and arts & humanities (5,750 | 6.2%) are the most common fields of study among 92,795 individuals in Chandler who have obtained a bachelor's degree or higher.
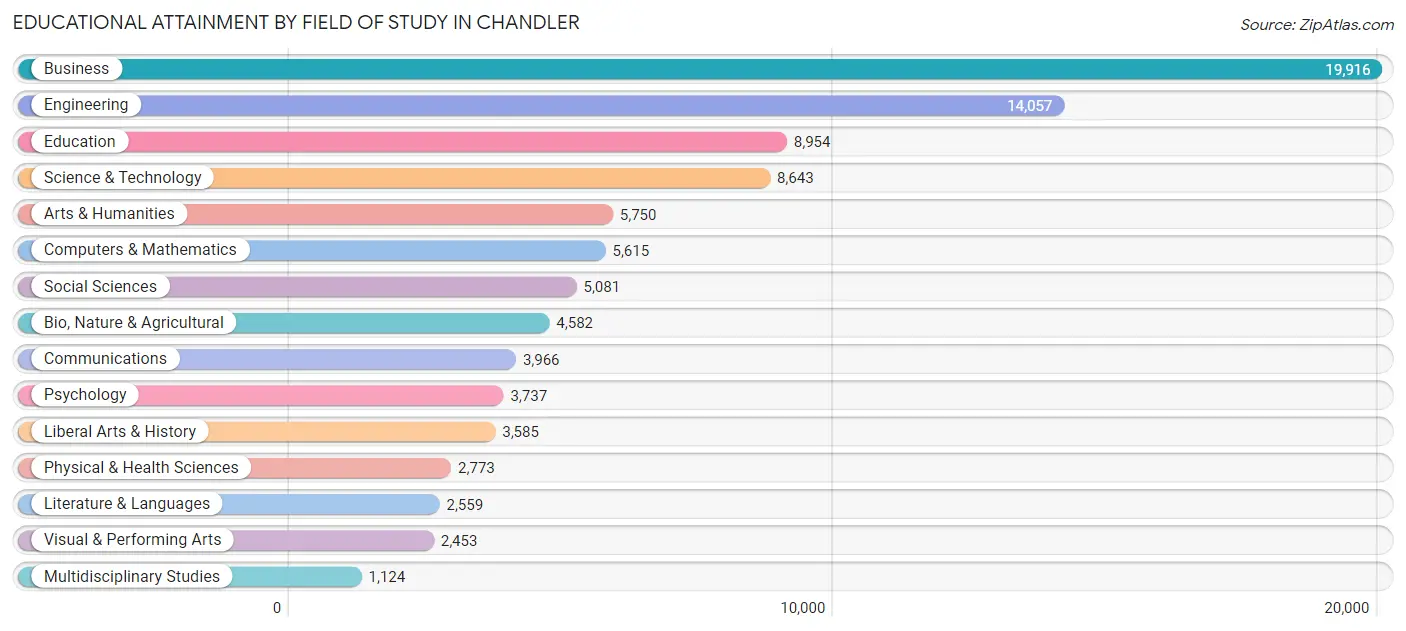
| Field of Study | # Graduates | % Graduates |
| Computers & Mathematics | 5,615 | 6.0% |
| Bio, Nature & Agricultural | 4,582 | 4.9% |
| Physical & Health Sciences | 2,773 | 3.0% |
| Psychology | 3,737 | 4.0% |
| Social Sciences | 5,081 | 5.5% |
| Engineering | 14,057 | 15.1% |
| Multidisciplinary Studies | 1,124 | 1.2% |
| Science & Technology | 8,643 | 9.3% |
| Business | 19,916 | 21.5% |
| Education | 8,954 | 9.7% |
| Literature & Languages | 2,559 | 2.8% |
| Liberal Arts & History | 3,585 | 3.9% |
| Visual & Performing Arts | 2,453 | 2.6% |
| Communications | 3,966 | 4.3% |
| Arts & Humanities | 5,750 | 6.2% |
| Total | 92,795 | 100.0% |
Transportation & Commute in Chandler
Vehicle Availability by Sex in Chandler
The most prevalent vehicle ownership categories in Chandler are males with 2 vehicles (38,660, accounting for 47.8%) and females with 2 vehicles (29,977, making up 57.6%).
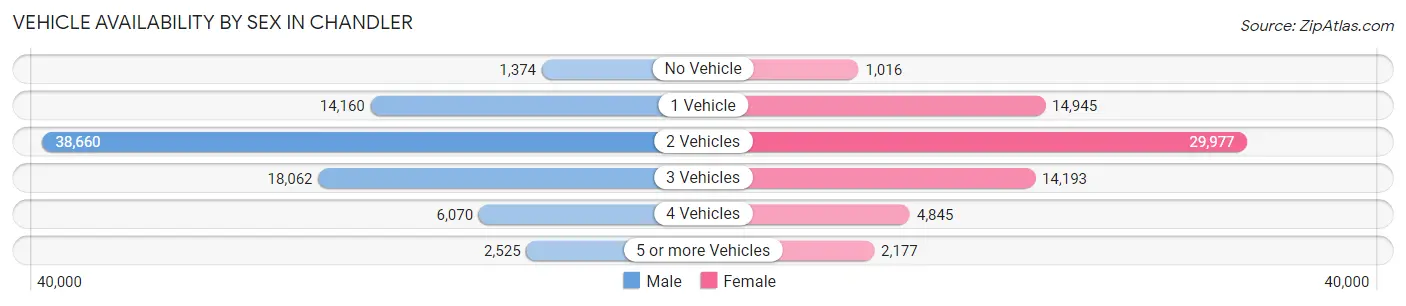
| Vehicles Available | Male | Female |
| No Vehicle | 1,374 (1.7%) | 1,016 (1.5%) |
| 1 Vehicle | 14,160 (17.5%) | 14,945 (22.3%) |
| 2 Vehicles | 38,660 (47.8%) | 29,977 (44.6%) |
| 3 Vehicles | 18,062 (22.3%) | 14,193 (21.1%) |
| 4 Vehicles | 6,070 (7.5%) | 4,845 (7.2%) |
| 5 or more Vehicles | 2,525 (3.1%) | 2,177 (3.2%) |
| Total | 80,851 (100.0%) | 67,153 (100.0%) |
Commute Time in Chandler
The most frequently occuring commute durations in Chandler are 15 to 19 minutes (20,232 commuters, 17.0%), 20 to 24 minutes (18,599 commuters, 15.6%), and 10 to 14 minutes (17,158 commuters, 14.4%).
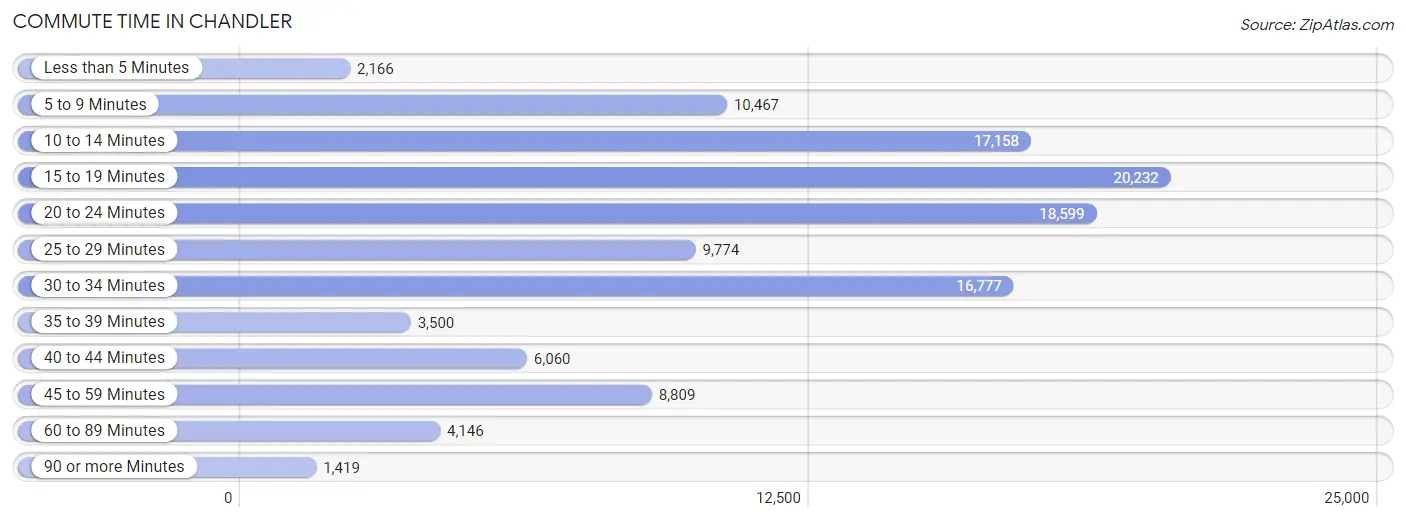
| Commute Time | # Commuters | % Commuters |
| Less than 5 Minutes | 2,166 | 1.8% |
| 5 to 9 Minutes | 10,467 | 8.8% |
| 10 to 14 Minutes | 17,158 | 14.4% |
| 15 to 19 Minutes | 20,232 | 17.0% |
| 20 to 24 Minutes | 18,599 | 15.6% |
| 25 to 29 Minutes | 9,774 | 8.2% |
| 30 to 34 Minutes | 16,777 | 14.1% |
| 35 to 39 Minutes | 3,500 | 2.9% |
| 40 to 44 Minutes | 6,060 | 5.1% |
| 45 to 59 Minutes | 8,809 | 7.4% |
| 60 to 89 Minutes | 4,146 | 3.5% |
| 90 or more Minutes | 1,419 | 1.2% |
Commute Time by Sex in Chandler
The most common commute times in Chandler are 15 to 19 minutes (11,359 commuters, 17.3%) for males and 15 to 19 minutes (8,873 commuters, 16.6%) for females.
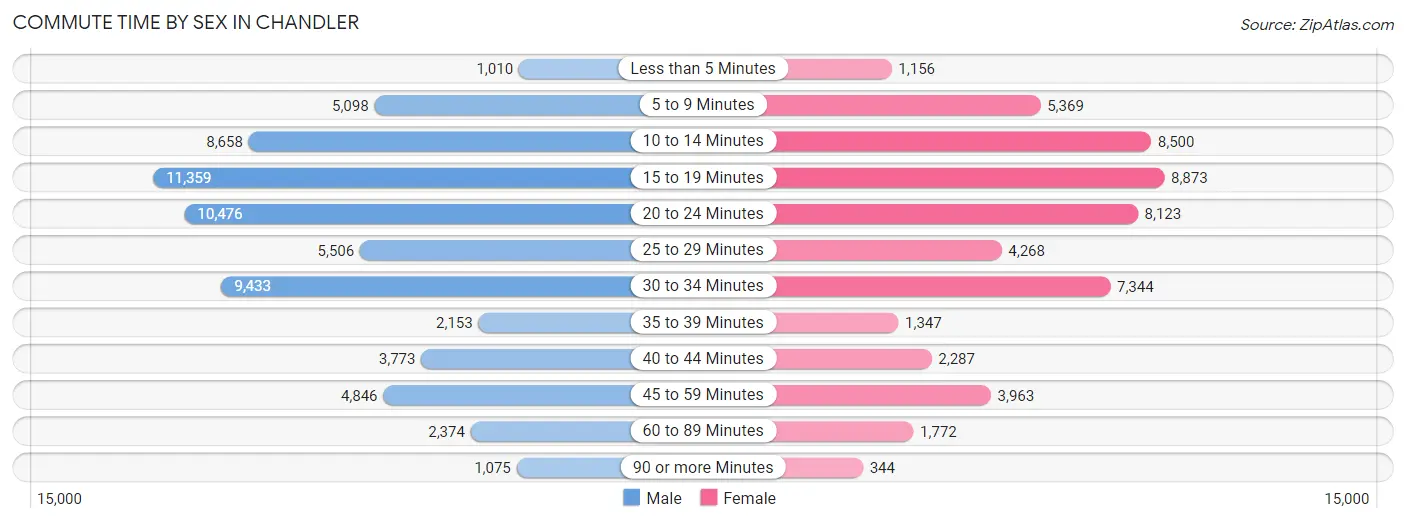
| Commute Time | Male | Female |
| Less than 5 Minutes | 1,010 (1.5%) | 1,156 (2.2%) |
| 5 to 9 Minutes | 5,098 (7.7%) | 5,369 (10.1%) |
| 10 to 14 Minutes | 8,658 (13.2%) | 8,500 (15.9%) |
| 15 to 19 Minutes | 11,359 (17.3%) | 8,873 (16.6%) |
| 20 to 24 Minutes | 10,476 (15.9%) | 8,123 (15.2%) |
| 25 to 29 Minutes | 5,506 (8.4%) | 4,268 (8.0%) |
| 30 to 34 Minutes | 9,433 (14.3%) | 7,344 (13.8%) |
| 35 to 39 Minutes | 2,153 (3.3%) | 1,347 (2.5%) |
| 40 to 44 Minutes | 3,773 (5.7%) | 2,287 (4.3%) |
| 45 to 59 Minutes | 4,846 (7.4%) | 3,963 (7.4%) |
| 60 to 89 Minutes | 2,374 (3.6%) | 1,772 (3.3%) |
| 90 or more Minutes | 1,075 (1.6%) | 344 (0.6%) |
Time of Departure to Work by Sex in Chandler
The most frequent times of departure to work in Chandler are 7:00 AM to 7:29 AM (8,492, 12.9%) for males and 7:30 AM to 7:59 AM (7,473, 14.0%) for females.
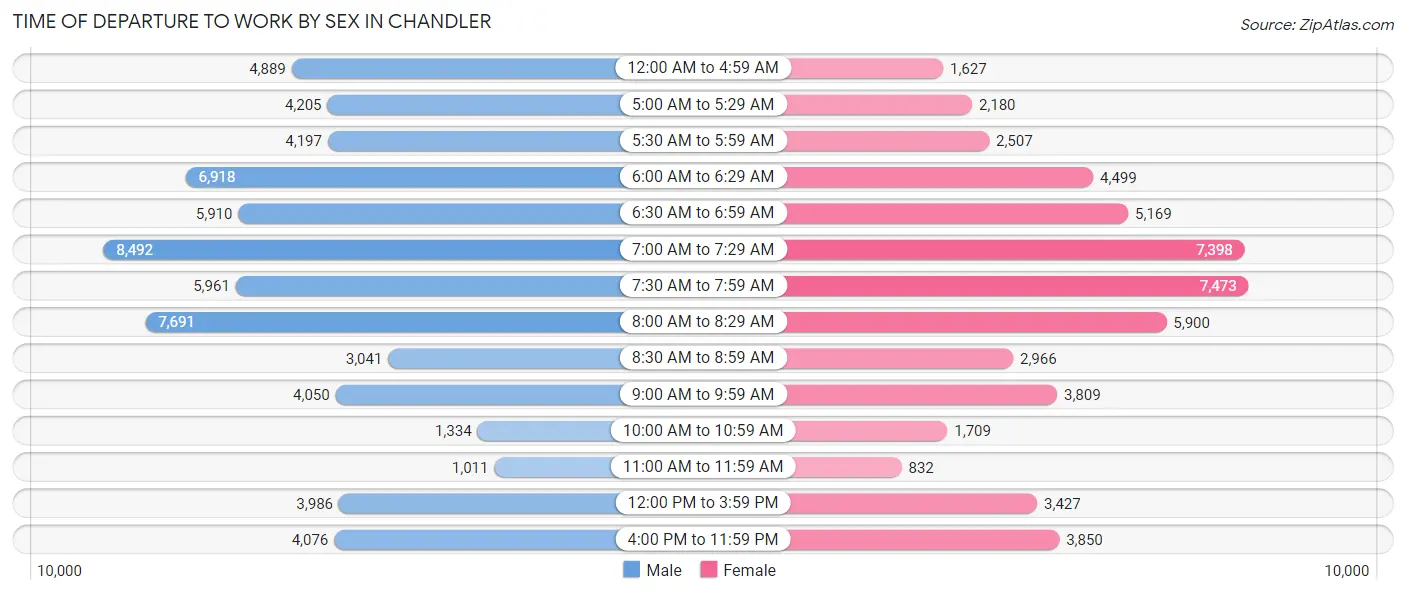
| Time of Departure | Male | Female |
| 12:00 AM to 4:59 AM | 4,889 (7.4%) | 1,627 (3.0%) |
| 5:00 AM to 5:29 AM | 4,205 (6.4%) | 2,180 (4.1%) |
| 5:30 AM to 5:59 AM | 4,197 (6.4%) | 2,507 (4.7%) |
| 6:00 AM to 6:29 AM | 6,918 (10.5%) | 4,499 (8.4%) |
| 6:30 AM to 6:59 AM | 5,910 (9.0%) | 5,169 (9.7%) |
| 7:00 AM to 7:29 AM | 8,492 (12.9%) | 7,398 (13.9%) |
| 7:30 AM to 7:59 AM | 5,961 (9.1%) | 7,473 (14.0%) |
| 8:00 AM to 8:29 AM | 7,691 (11.7%) | 5,900 (11.1%) |
| 8:30 AM to 8:59 AM | 3,041 (4.6%) | 2,966 (5.6%) |
| 9:00 AM to 9:59 AM | 4,050 (6.2%) | 3,809 (7.1%) |
| 10:00 AM to 10:59 AM | 1,334 (2.0%) | 1,709 (3.2%) |
| 11:00 AM to 11:59 AM | 1,011 (1.5%) | 832 (1.6%) |
| 12:00 PM to 3:59 PM | 3,986 (6.1%) | 3,427 (6.4%) |
| 4:00 PM to 11:59 PM | 4,076 (6.2%) | 3,850 (7.2%) |
| Total | 65,761 (100.0%) | 53,346 (100.0%) |
Housing Occupancy in Chandler
Occupancy by Ownership in Chandler
Of the total 104,419 dwellings in Chandler, owner-occupied units account for 67,461 (64.6%), while renter-occupied units make up 36,958 (35.4%).
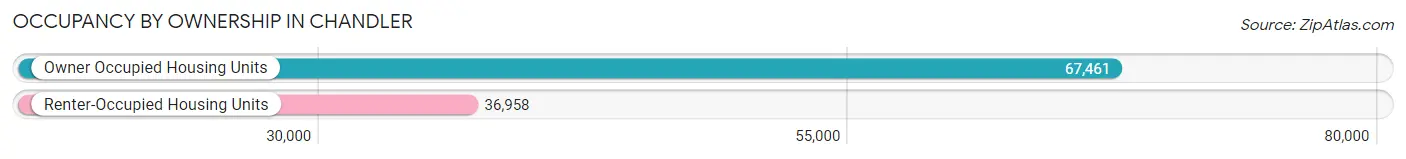
| Occupancy | # Housing Units | % Housing Units |
| Owner Occupied Housing Units | 67,461 | 64.6% |
| Renter-Occupied Housing Units | 36,958 | 35.4% |
| Total Occupied Housing Units | 104,419 | 100.0% |
Occupancy by Household Size in Chandler
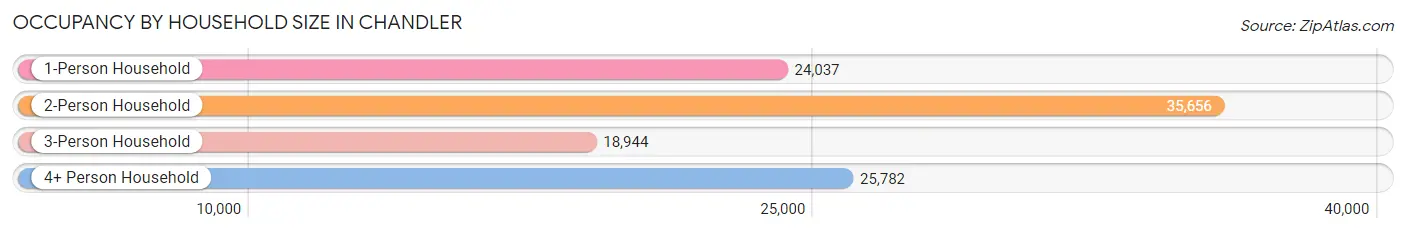
| Household Size | # Housing Units | % Housing Units |
| 1-Person Household | 24,037 | 23.0% |
| 2-Person Household | 35,656 | 34.2% |
| 3-Person Household | 18,944 | 18.1% |
| 4+ Person Household | 25,782 | 24.7% |
| Total Housing Units | 104,419 | 100.0% |
Occupancy by Ownership by Household Size in Chandler
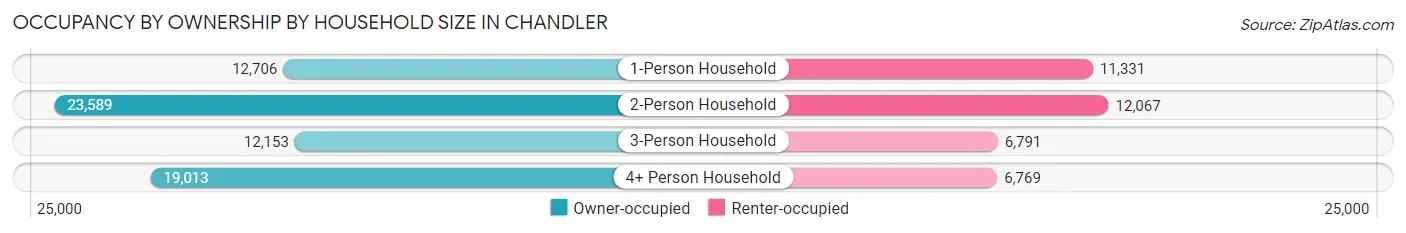
| Household Size | Owner-occupied | Renter-occupied |
| 1-Person Household | 12,706 (52.9%) | 11,331 (47.1%) |
| 2-Person Household | 23,589 (66.2%) | 12,067 (33.8%) |
| 3-Person Household | 12,153 (64.1%) | 6,791 (35.8%) |
| 4+ Person Household | 19,013 (73.8%) | 6,769 (26.3%) |
| Total Housing Units | 67,461 (64.6%) | 36,958 (35.4%) |
Occupancy by Educational Attainment in Chandler
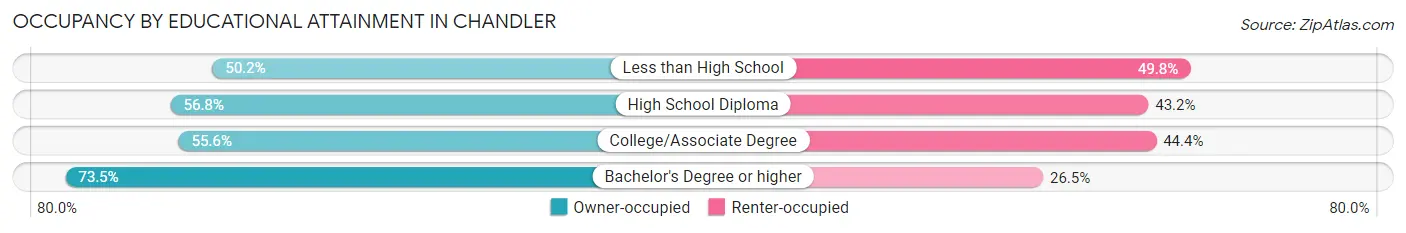
| Household Size | Owner-occupied | Renter-occupied |
| Less than High School | 2,194 (50.2%) | 2,175 (49.8%) |
| High School Diploma | 8,322 (56.8%) | 6,319 (43.2%) |
| College/Associate Degree | 18,122 (55.6%) | 14,485 (44.4%) |
| Bachelor's Degree or higher | 38,823 (73.5%) | 13,979 (26.5%) |
Occupancy by Age of Householder in Chandler
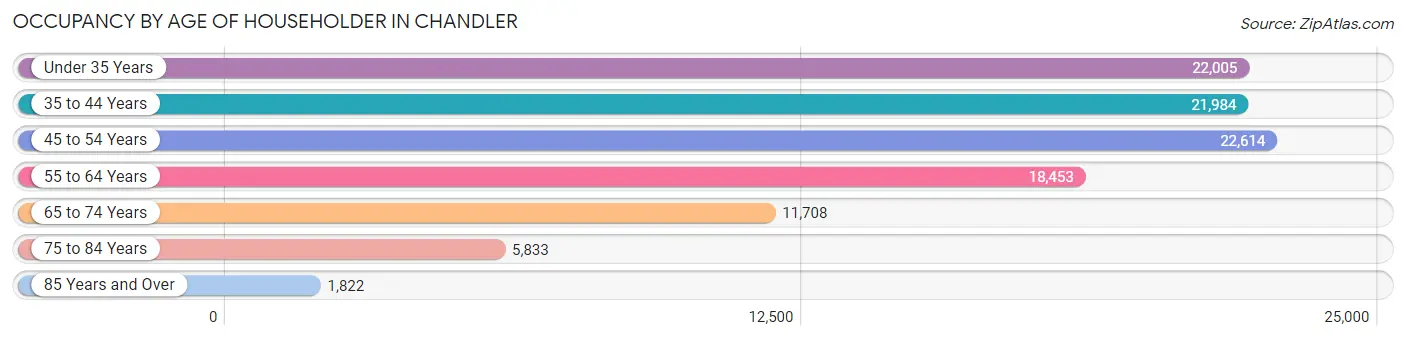
| Age Bracket | # Households | % Households |
| Under 35 Years | 22,005 | 21.1% |
| 35 to 44 Years | 21,984 | 21.0% |
| 45 to 54 Years | 22,614 | 21.7% |
| 55 to 64 Years | 18,453 | 17.7% |
| 65 to 74 Years | 11,708 | 11.2% |
| 75 to 84 Years | 5,833 | 5.6% |
| 85 Years and Over | 1,822 | 1.7% |
| Total | 104,419 | 100.0% |
Housing Finances in Chandler
Median Income by Occupancy in Chandler
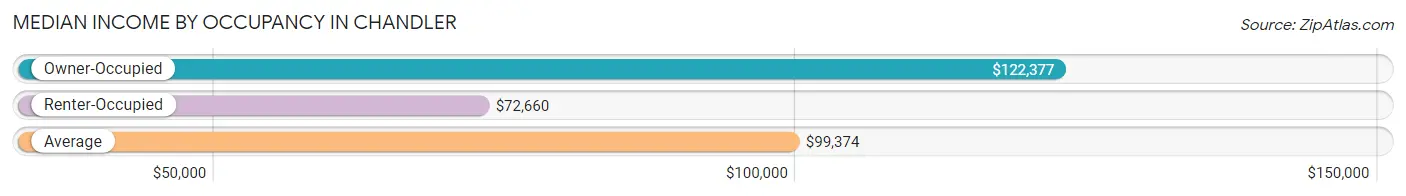
| Occupancy Type | # Households | Median Income |
| Owner-Occupied | 67,461 (64.6%) | $122,377 |
| Renter-Occupied | 36,958 (35.4%) | $72,660 |
| Average | 104,419 (100.0%) | $99,374 |
Occupancy by Householder Income Bracket in Chandler
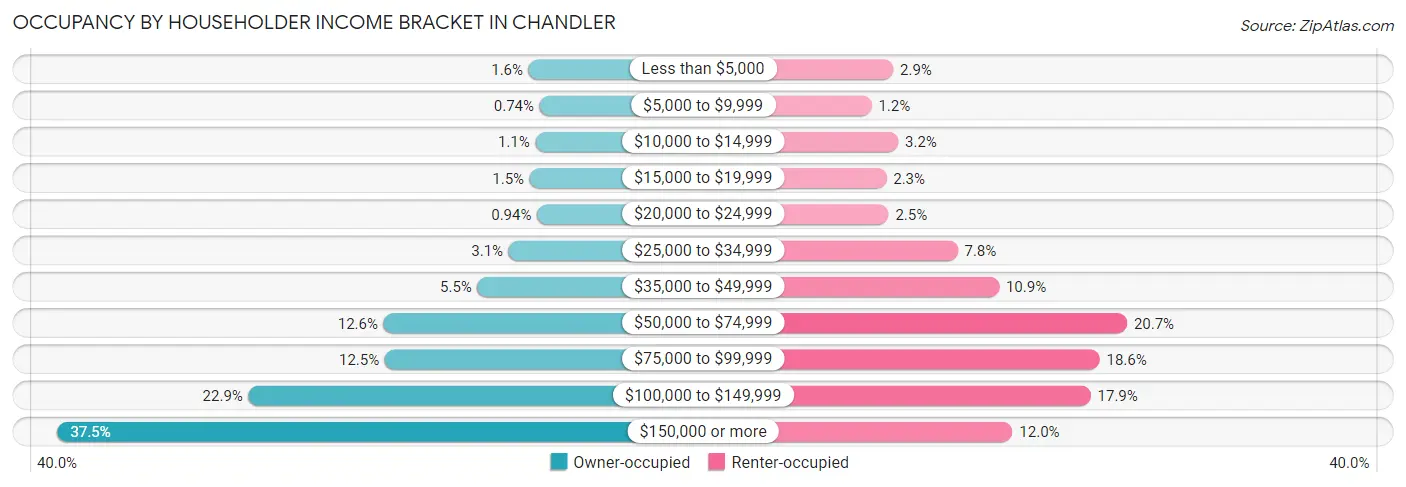
| Income Bracket | Owner-occupied | Renter-occupied |
| Less than $5,000 | 1,063 (1.6%) | 1,058 (2.9%) |
| $5,000 to $9,999 | 502 (0.7%) | 446 (1.2%) |
| $10,000 to $14,999 | 722 (1.1%) | 1,198 (3.2%) |
| $15,000 to $19,999 | 1,010 (1.5%) | 864 (2.3%) |
| $20,000 to $24,999 | 632 (0.9%) | 929 (2.5%) |
| $25,000 to $34,999 | 2,090 (3.1%) | 2,873 (7.8%) |
| $35,000 to $49,999 | 3,700 (5.5%) | 4,040 (10.9%) |
| $50,000 to $74,999 | 8,518 (12.6%) | 7,642 (20.7%) |
| $75,000 to $99,999 | 8,457 (12.5%) | 6,872 (18.6%) |
| $100,000 to $149,999 | 15,469 (22.9%) | 6,621 (17.9%) |
| $150,000 or more | 25,298 (37.5%) | 4,415 (11.9%) |
| Total | 67,461 (100.0%) | 36,958 (100.0%) |
Monthly Housing Cost Tiers in Chandler
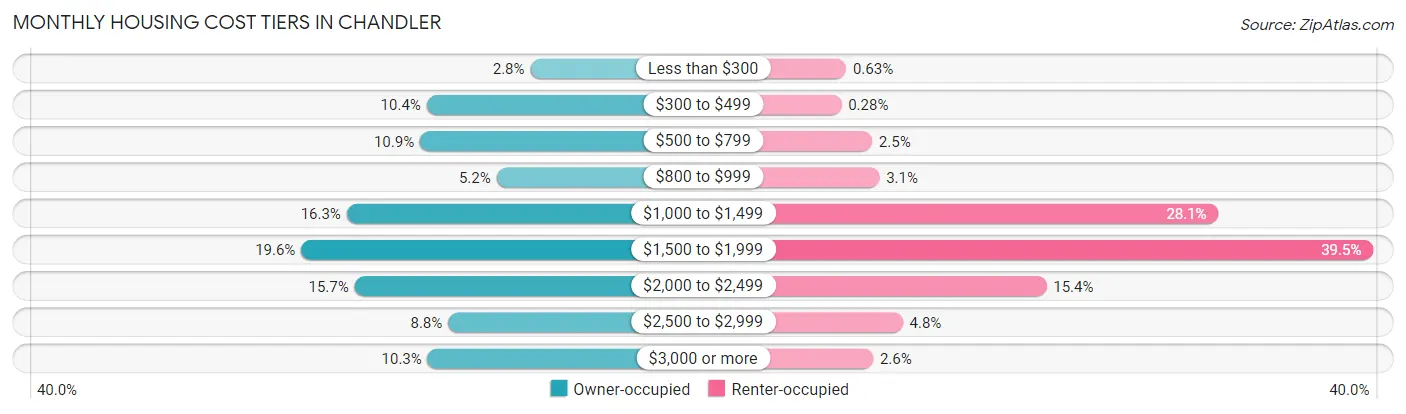
| Monthly Cost | Owner-occupied | Renter-occupied |
| Less than $300 | 1,852 (2.8%) | 233 (0.6%) |
| $300 to $499 | 7,007 (10.4%) | 105 (0.3%) |
| $500 to $799 | 7,341 (10.9%) | 937 (2.5%) |
| $800 to $999 | 3,537 (5.2%) | 1,137 (3.1%) |
| $1,000 to $1,499 | 10,986 (16.3%) | 10,370 (28.1%) |
| $1,500 to $1,999 | 13,240 (19.6%) | 14,583 (39.5%) |
| $2,000 to $2,499 | 10,594 (15.7%) | 5,683 (15.4%) |
| $2,500 to $2,999 | 5,941 (8.8%) | 1,775 (4.8%) |
| $3,000 or more | 6,963 (10.3%) | 968 (2.6%) |
| Total | 67,461 (100.0%) | 36,958 (100.0%) |
Physical Housing Characteristics in Chandler
Housing Structures in Chandler
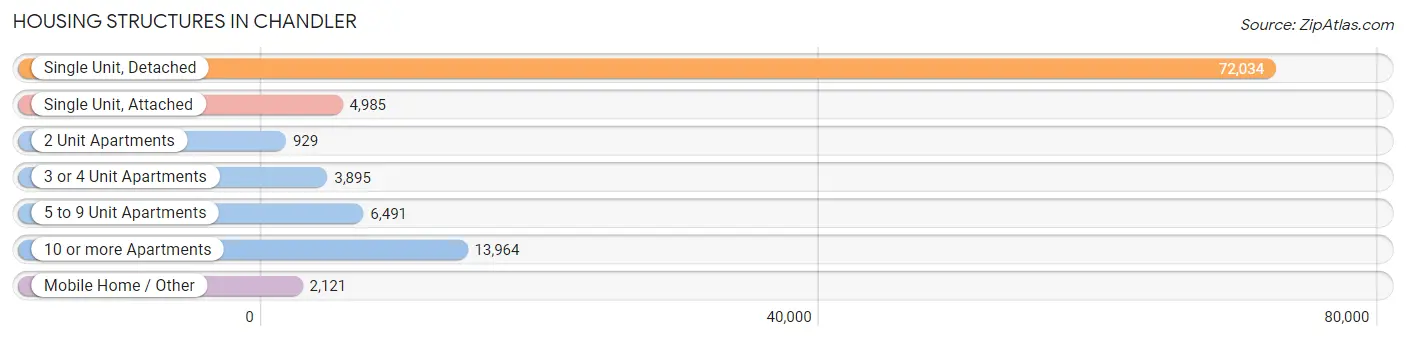
| Structure Type | # Housing Units | % Housing Units |
| Single Unit, Detached | 72,034 | 69.0% |
| Single Unit, Attached | 4,985 | 4.8% |
| 2 Unit Apartments | 929 | 0.9% |
| 3 or 4 Unit Apartments | 3,895 | 3.7% |
| 5 to 9 Unit Apartments | 6,491 | 6.2% |
| 10 or more Apartments | 13,964 | 13.4% |
| Mobile Home / Other | 2,121 | 2.0% |
| Total | 104,419 | 100.0% |
Housing Structures by Occupancy in Chandler
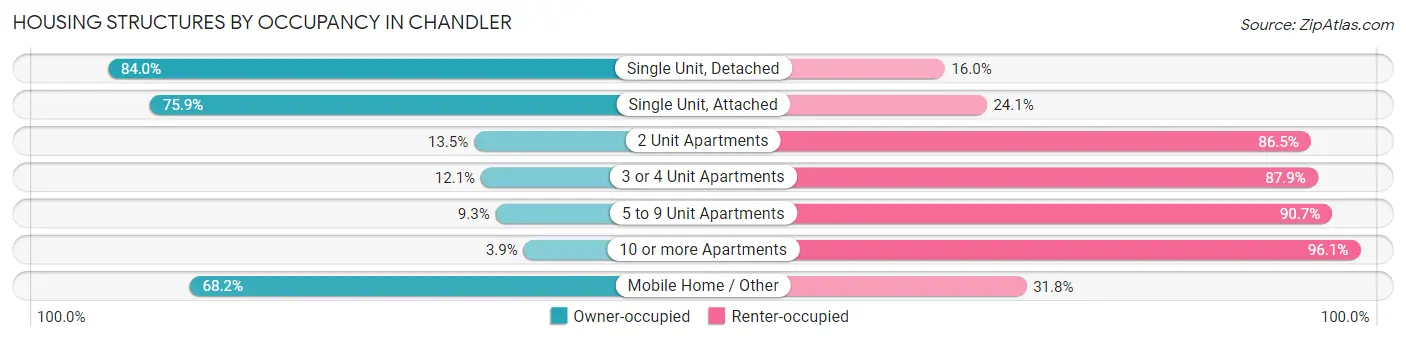
| Structure Type | Owner-occupied | Renter-occupied |
| Single Unit, Detached | 60,479 (84.0%) | 11,555 (16.0%) |
| Single Unit, Attached | 3,782 (75.9%) | 1,203 (24.1%) |
| 2 Unit Apartments | 125 (13.5%) | 804 (86.5%) |
| 3 or 4 Unit Apartments | 473 (12.1%) | 3,422 (87.9%) |
| 5 to 9 Unit Apartments | 606 (9.3%) | 5,885 (90.7%) |
| 10 or more Apartments | 549 (3.9%) | 13,415 (96.1%) |
| Mobile Home / Other | 1,447 (68.2%) | 674 (31.8%) |
| Total | 67,461 (64.6%) | 36,958 (35.4%) |
Housing Structures by Number of Rooms in Chandler
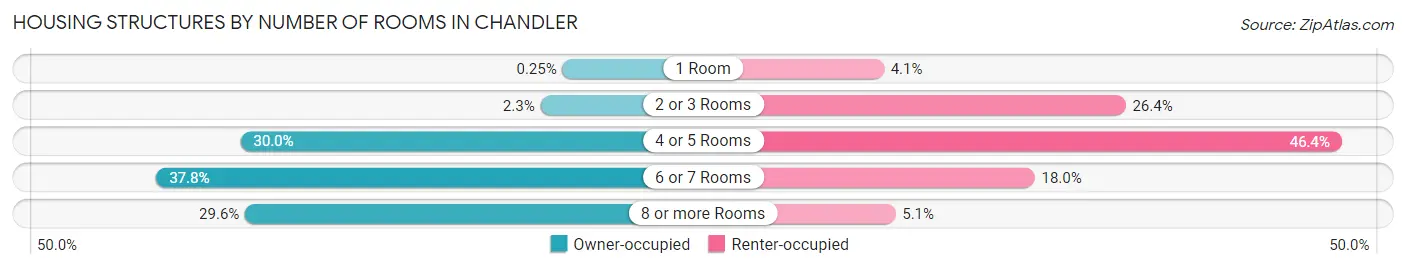
| Number of Rooms | Owner-occupied | Renter-occupied |
| 1 Room | 167 (0.3%) | 1,498 (4.1%) |
| 2 or 3 Rooms | 1,542 (2.3%) | 9,761 (26.4%) |
| 4 or 5 Rooms | 20,267 (30.0%) | 17,153 (46.4%) |
| 6 or 7 Rooms | 25,517 (37.8%) | 6,652 (18.0%) |
| 8 or more Rooms | 19,968 (29.6%) | 1,894 (5.1%) |
| Total | 67,461 (100.0%) | 36,958 (100.0%) |
Housing Structure by Heating Type in Chandler
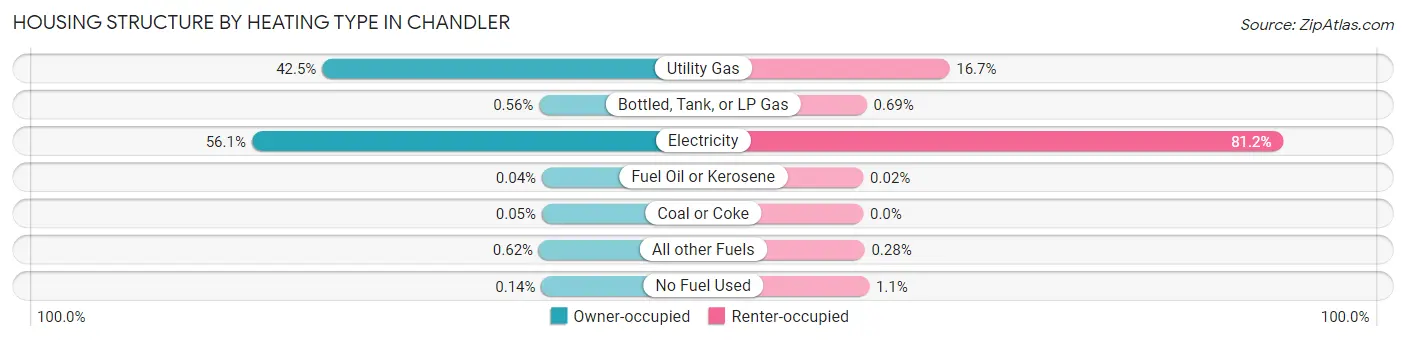
| Heating Type | Owner-occupied | Renter-occupied |
| Utility Gas | 28,663 (42.5%) | 6,159 (16.7%) |
| Bottled, Tank, or LP Gas | 377 (0.6%) | 256 (0.7%) |
| Electricity | 37,850 (56.1%) | 30,008 (81.2%) |
| Fuel Oil or Kerosene | 26 (0.0%) | 9 (0.0%) |
| Coal or Coke | 32 (0.1%) | 0 (0.0%) |
| All other Fuels | 417 (0.6%) | 103 (0.3%) |
| No Fuel Used | 96 (0.1%) | 423 (1.1%) |
| Total | 67,461 (100.0%) | 36,958 (100.0%) |
Household Vehicle Usage in Chandler
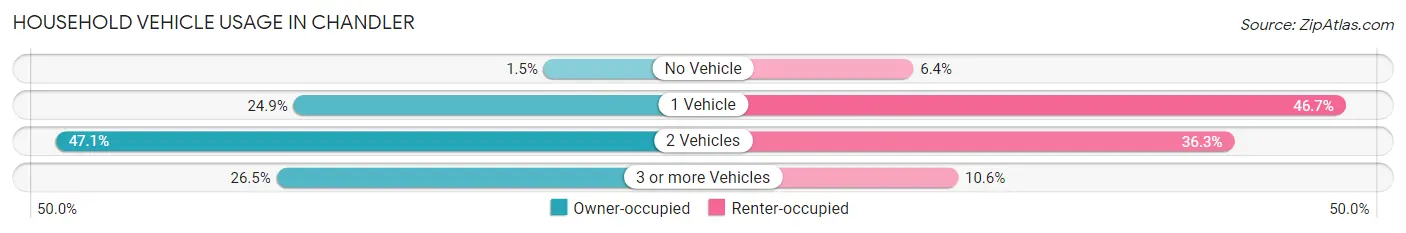
| Vehicles per Household | Owner-occupied | Renter-occupied |
| No Vehicle | 1,029 (1.5%) | 2,358 (6.4%) |
| 1 Vehicle | 16,798 (24.9%) | 17,270 (46.7%) |
| 2 Vehicles | 31,770 (47.1%) | 13,426 (36.3%) |
| 3 or more Vehicles | 17,864 (26.5%) | 3,904 (10.6%) |
| Total | 67,461 (100.0%) | 36,958 (100.0%) |
Real Estate & Mortgages in Chandler
Real Estate and Mortgage Overview in Chandler
| Characteristic | Without Mortgage | With Mortgage |
| Housing Units | 17,795 | 49,666 |
| Median Property Value | $383,200 | $438,600 |
| Median Household Income | $86,657 | $20,279 |
| Monthly Housing Costs | $515 | $6,883 |
| Real Estate Taxes | $2,078 | $1,181 |
Property Value by Mortgage Status in Chandler
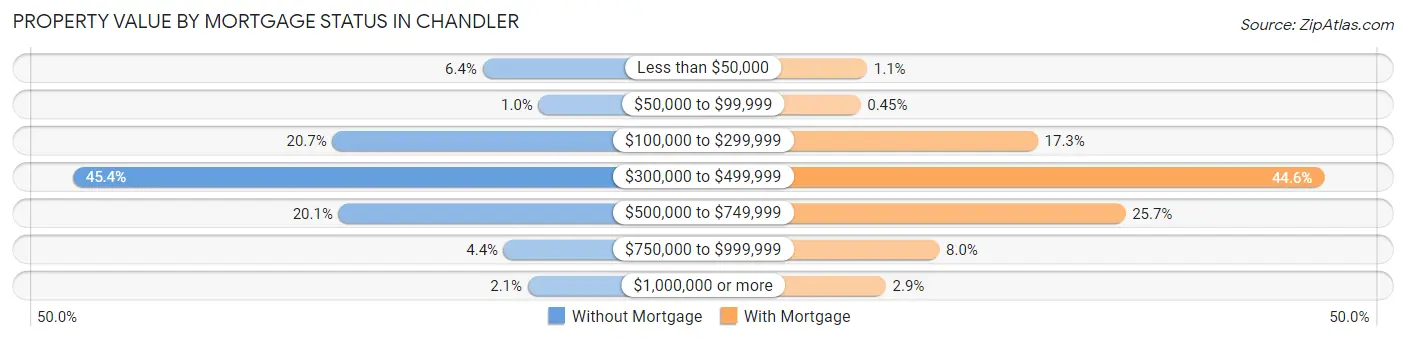
| Property Value | Without Mortgage | With Mortgage |
| Less than $50,000 | 1,134 (6.4%) | 535 (1.1%) |
| $50,000 to $99,999 | 185 (1.0%) | 224 (0.4%) |
| $100,000 to $299,999 | 3,679 (20.7%) | 8,611 (17.3%) |
| $300,000 to $499,999 | 8,081 (45.4%) | 22,168 (44.6%) |
| $500,000 to $749,999 | 3,574 (20.1%) | 12,756 (25.7%) |
| $750,000 to $999,999 | 774 (4.3%) | 3,951 (8.0%) |
| $1,000,000 or more | 368 (2.1%) | 1,421 (2.9%) |
| Total | 17,795 (100.0%) | 49,666 (100.0%) |
Household Income by Mortgage Status in Chandler
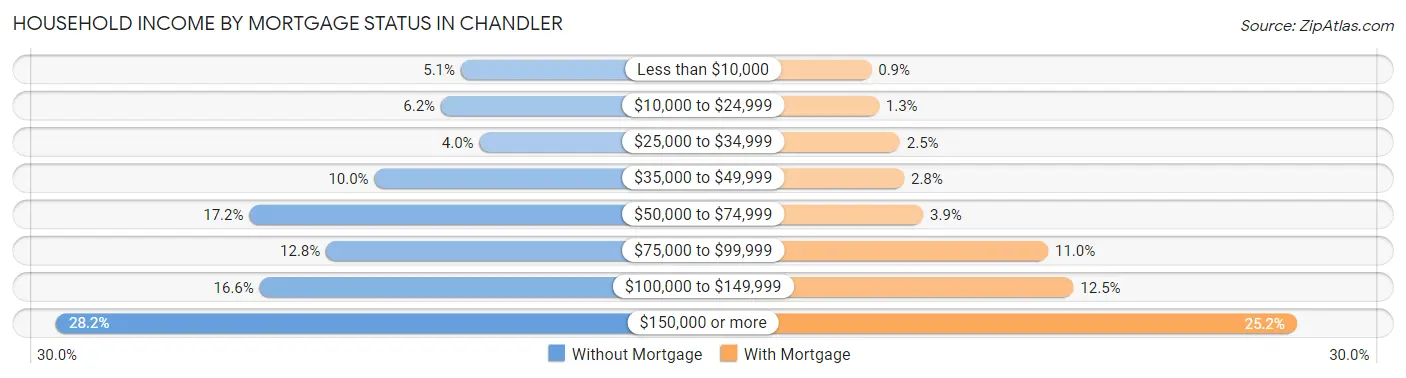
| Household Income | Without Mortgage | With Mortgage |
| Less than $10,000 | 902 (5.1%) | 445 (0.9%) |
| $10,000 to $24,999 | 1,105 (6.2%) | 663 (1.3%) |
| $25,000 to $34,999 | 714 (4.0%) | 1,259 (2.5%) |
| $35,000 to $49,999 | 1,781 (10.0%) | 1,376 (2.8%) |
| $50,000 to $74,999 | 3,053 (17.2%) | 1,919 (3.9%) |
| $75,000 to $99,999 | 2,273 (12.8%) | 5,465 (11.0%) |
| $100,000 to $149,999 | 2,948 (16.6%) | 6,184 (12.4%) |
| $150,000 or more | 5,019 (28.2%) | 12,521 (25.2%) |
| Total | 17,795 (100.0%) | 49,666 (100.0%) |
Property Value to Household Income Ratio in Chandler
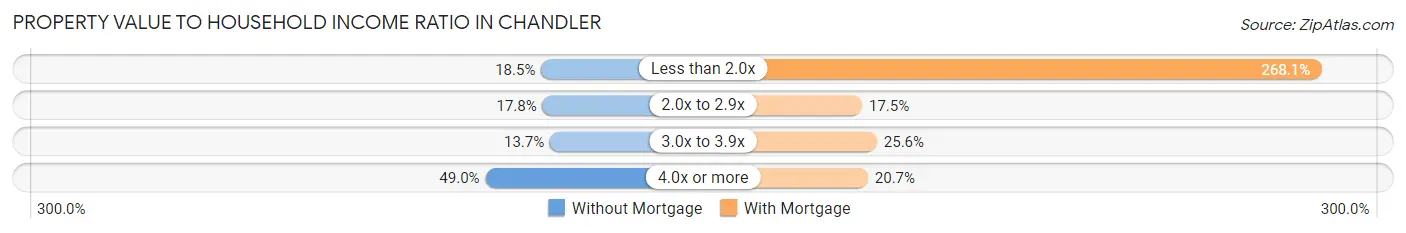
| Value-to-Income Ratio | Without Mortgage | With Mortgage |
| Less than 2.0x | 3,295 (18.5%) | 133,152 (268.1%) |
| 2.0x to 2.9x | 3,167 (17.8%) | 8,690 (17.5%) |
| 3.0x to 3.9x | 2,439 (13.7%) | 12,711 (25.6%) |
| 4.0x or more | 8,711 (48.9%) | 10,263 (20.7%) |
| Total | 17,795 (100.0%) | 49,666 (100.0%) |
Real Estate Taxes by Mortgage Status in Chandler
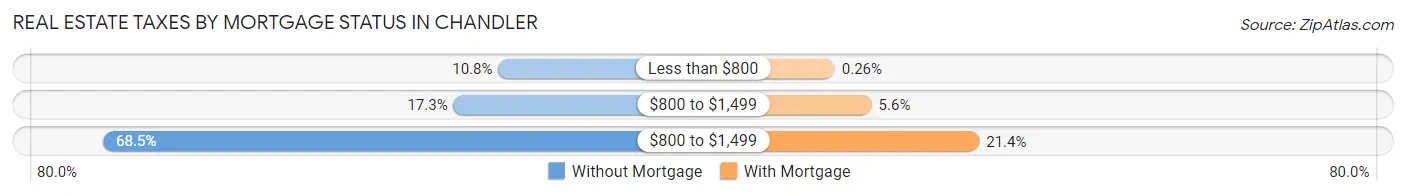
| Property Taxes | Without Mortgage | With Mortgage |
| Less than $800 | 1,920 (10.8%) | 129 (0.3%) |
| $800 to $1,499 | 3,084 (17.3%) | 2,803 (5.6%) |
| $800 to $1,499 | 12,193 (68.5%) | 10,614 (21.4%) |
| Total | 17,795 (100.0%) | 49,666 (100.0%) |
Health & Disability in Chandler
Health Insurance Coverage by Age in Chandler
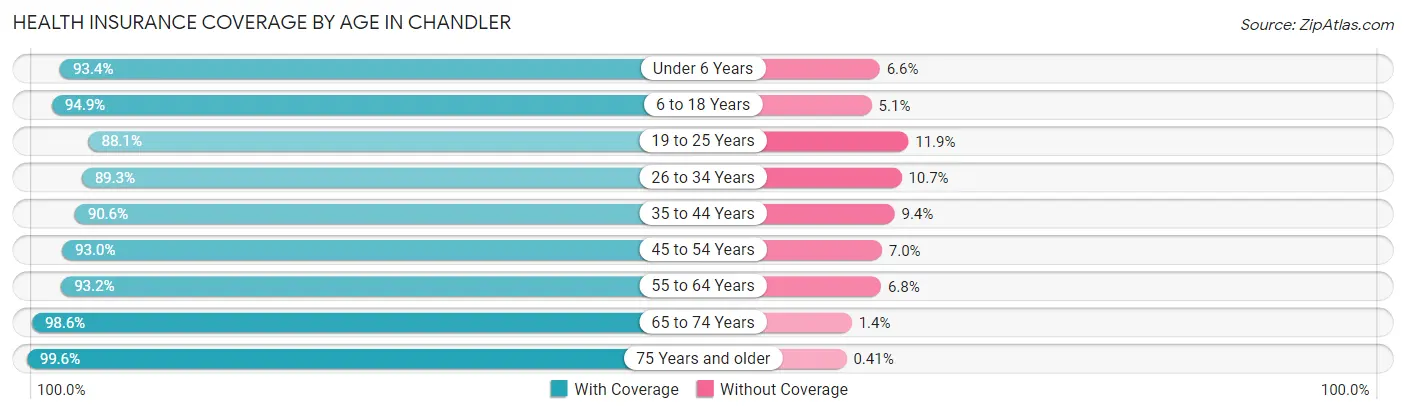
| Age Bracket | With Coverage | Without Coverage |
| Under 6 Years | 17,422 (93.4%) | 1,232 (6.6%) |
| 6 to 18 Years | 46,950 (94.9%) | 2,523 (5.1%) |
| 19 to 25 Years | 20,416 (88.1%) | 2,765 (11.9%) |
| 26 to 34 Years | 33,400 (89.3%) | 3,984 (10.7%) |
| 35 to 44 Years | 37,094 (90.6%) | 3,836 (9.4%) |
| 45 to 54 Years | 36,899 (93.0%) | 2,776 (7.0%) |
| 55 to 64 Years | 29,535 (93.2%) | 2,168 (6.8%) |
| 65 to 74 Years | 20,556 (98.6%) | 287 (1.4%) |
| 75 Years and older | 13,193 (99.6%) | 54 (0.4%) |
| Total | 255,465 (92.9%) | 19,625 (7.1%) |
Health Insurance Coverage by Citizenship Status in Chandler
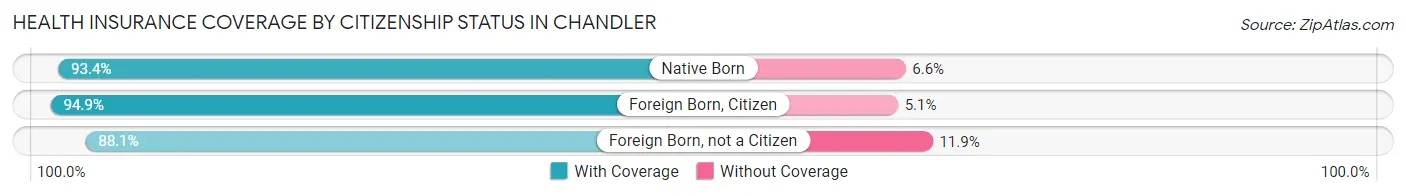
| Citizenship Status | With Coverage | Without Coverage |
| Native Born | 17,422 (93.4%) | 1,232 (6.6%) |
| Foreign Born, Citizen | 46,950 (94.9%) | 2,523 (5.1%) |
| Foreign Born, not a Citizen | 20,416 (88.1%) | 2,765 (11.9%) |
Health Insurance Coverage by Household Income in Chandler
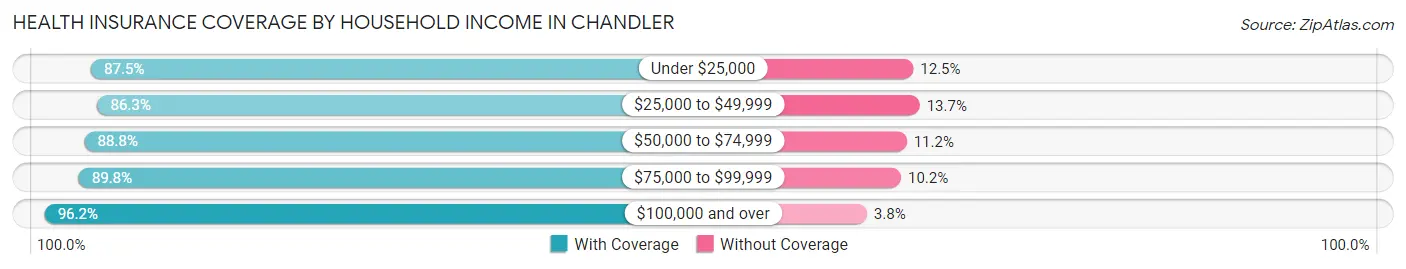
| Household Income | With Coverage | Without Coverage |
| Under $25,000 | 14,585 (87.5%) | 2,077 (12.5%) |
| $25,000 to $49,999 | 23,302 (86.3%) | 3,687 (13.7%) |
| $50,000 to $74,999 | 32,133 (88.8%) | 4,066 (11.2%) |
| $75,000 to $99,999 | 33,782 (89.8%) | 3,821 (10.2%) |
| $100,000 and over | 150,896 (96.2%) | 5,914 (3.8%) |
Public vs Private Health Insurance Coverage by Age in Chandler
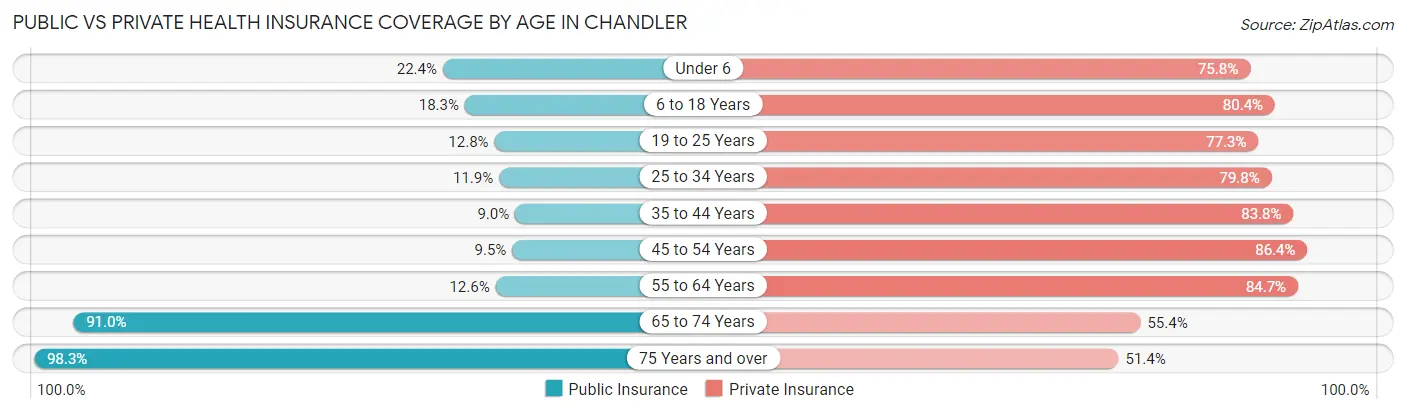
| Age Bracket | Public Insurance | Private Insurance |
| Under 6 | 4,172 (22.4%) | 14,133 (75.8%) |
| 6 to 18 Years | 9,055 (18.3%) | 39,765 (80.4%) |
| 19 to 25 Years | 2,967 (12.8%) | 17,922 (77.3%) |
| 25 to 34 Years | 4,462 (11.9%) | 29,818 (79.8%) |
| 35 to 44 Years | 3,667 (9.0%) | 34,305 (83.8%) |
| 45 to 54 Years | 3,770 (9.5%) | 34,284 (86.4%) |
| 55 to 64 Years | 3,993 (12.6%) | 26,839 (84.7%) |
| 65 to 74 Years | 18,961 (91.0%) | 11,555 (55.4%) |
| 75 Years and over | 13,017 (98.3%) | 6,805 (51.4%) |
| Total | 64,064 (23.3%) | 215,426 (78.3%) |
Disability Status by Sex by Age in Chandler
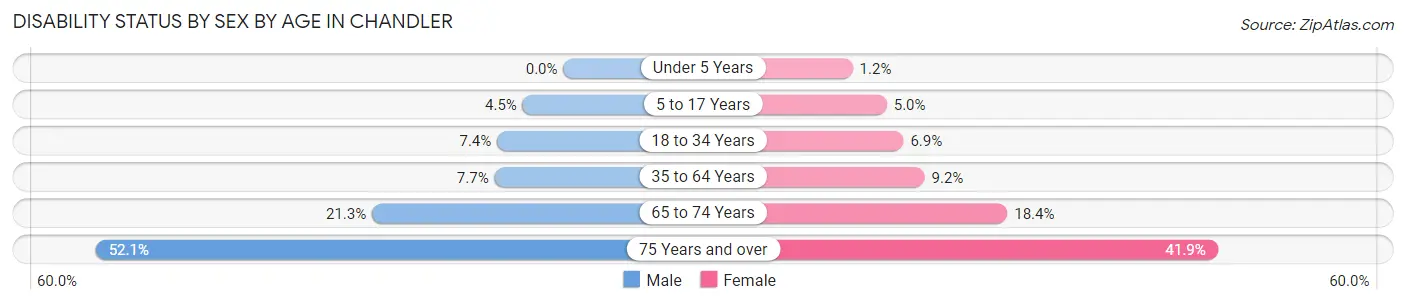
| Age Bracket | Male | Female |
| Under 5 Years | 0 (0.0%) | 92 (1.2%) |
| 5 to 17 Years | 1,161 (4.5%) | 1,193 (5.0%) |
| 18 to 34 Years | 2,449 (7.4%) | 2,114 (6.9%) |
| 35 to 64 Years | 4,312 (7.7%) | 5,174 (9.2%) |
| 65 to 74 Years | 2,031 (21.3%) | 2,085 (18.4%) |
| 75 Years and over | 2,871 (52.1%) | 3,237 (41.8%) |
Disability Class by Sex by Age in Chandler
Disability Class: Hearing Difficulty
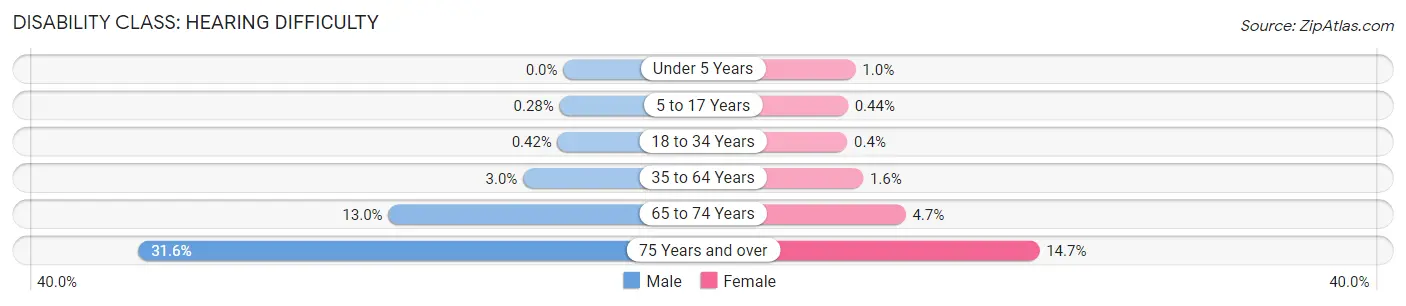
| Age Bracket | Male | Female |
| Under 5 Years | 0 (0.0%) | 77 (1.0%) |
| 5 to 17 Years | 71 (0.3%) | 105 (0.4%) |
| 18 to 34 Years | 140 (0.4%) | 124 (0.4%) |
| 35 to 64 Years | 1,672 (3.0%) | 881 (1.6%) |
| 65 to 74 Years | 1,238 (13.0%) | 535 (4.7%) |
| 75 Years and over | 1,740 (31.6%) | 1,134 (14.7%) |
Disability Class: Vision Difficulty
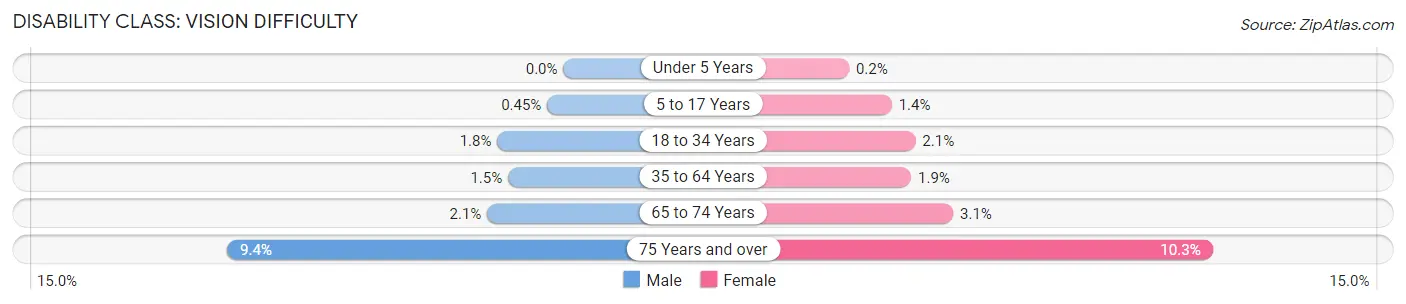
| Age Bracket | Male | Female |
| Under 5 Years | 0 (0.0%) | 15 (0.2%) |
| 5 to 17 Years | 115 (0.4%) | 330 (1.4%) |
| 18 to 34 Years | 609 (1.8%) | 630 (2.1%) |
| 35 to 64 Years | 865 (1.5%) | 1,084 (1.9%) |
| 65 to 74 Years | 202 (2.1%) | 351 (3.1%) |
| 75 Years and over | 516 (9.4%) | 798 (10.3%) |
Disability Class: Cognitive Difficulty
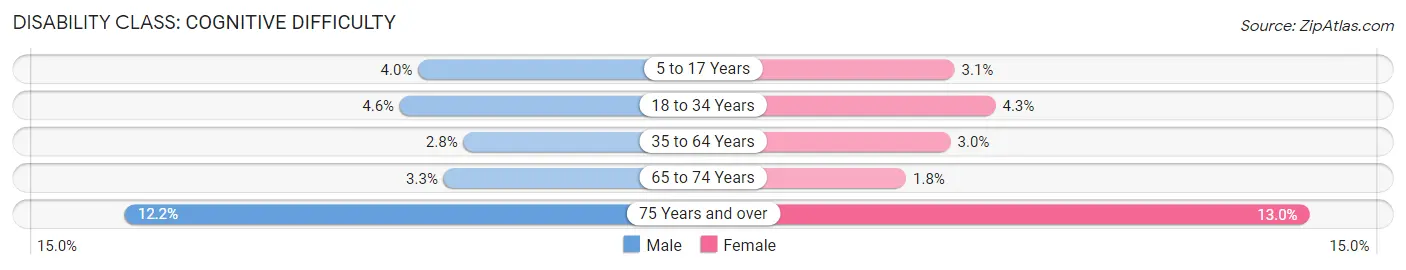
| Age Bracket | Male | Female |
| 5 to 17 Years | 1,036 (4.0%) | 749 (3.1%) |
| 18 to 34 Years | 1,511 (4.5%) | 1,316 (4.3%) |
| 35 to 64 Years | 1,563 (2.8%) | 1,699 (3.0%) |
| 65 to 74 Years | 317 (3.3%) | 202 (1.8%) |
| 75 Years and over | 673 (12.2%) | 1,007 (13.0%) |
Disability Class: Ambulatory Difficulty
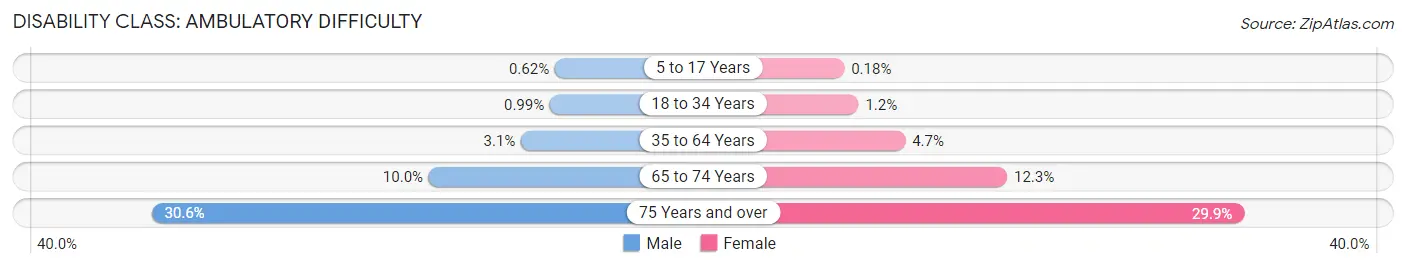
| Age Bracket | Male | Female |
| 5 to 17 Years | 159 (0.6%) | 43 (0.2%) |
| 18 to 34 Years | 328 (1.0%) | 382 (1.2%) |
| 35 to 64 Years | 1,756 (3.1%) | 2,646 (4.7%) |
| 65 to 74 Years | 951 (10.0%) | 1,388 (12.3%) |
| 75 Years and over | 1,686 (30.6%) | 2,310 (29.9%) |
Disability Class: Self-Care Difficulty
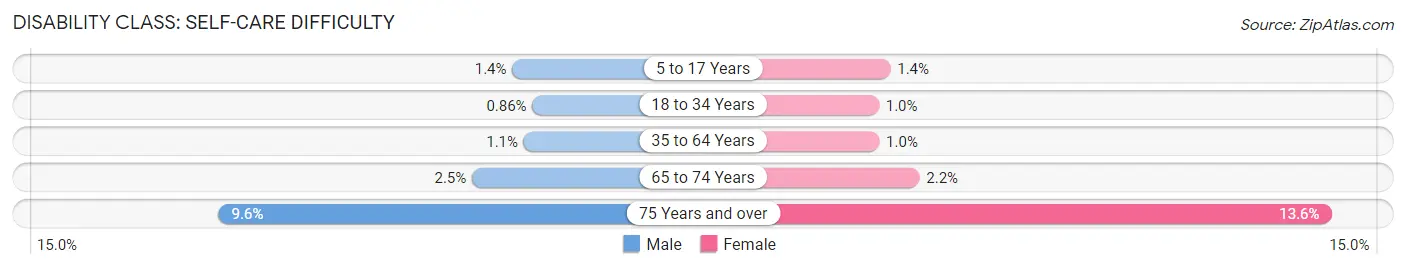
| Age Bracket | Male | Female |
| 5 to 17 Years | 364 (1.4%) | 322 (1.3%) |
| 18 to 34 Years | 287 (0.9%) | 316 (1.0%) |
| 35 to 64 Years | 619 (1.1%) | 583 (1.0%) |
| 65 to 74 Years | 242 (2.5%) | 244 (2.2%) |
| 75 Years and over | 529 (9.6%) | 1,054 (13.6%) |
Technology Access in Chandler
Computing Device Access in Chandler
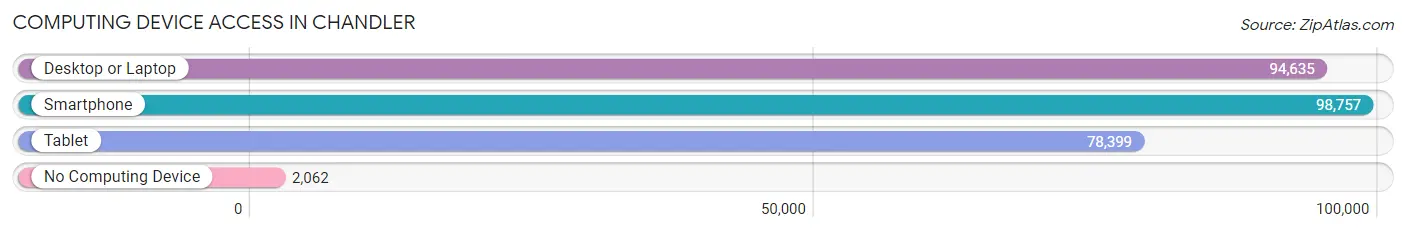
| Device Type | # Households | % Households |
| Desktop or Laptop | 94,635 | 90.6% |
| Smartphone | 98,757 | 94.6% |
| Tablet | 78,399 | 75.1% |
| No Computing Device | 2,062 | 2.0% |
| Total | 104,419 | 100.0% |
Internet Access in Chandler
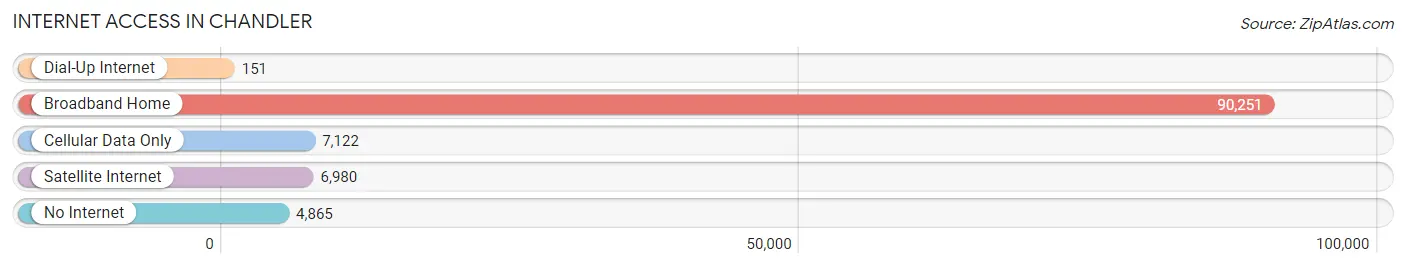
| Internet Type | # Households | % Households |
| Dial-Up Internet | 151 | 0.1% |
| Broadband Home | 90,251 | 86.4% |
| Cellular Data Only | 7,122 | 6.8% |
| Satellite Internet | 6,980 | 6.7% |
| No Internet | 4,865 | 4.7% |
| Total | 104,419 | 100.0% |
Chandler Summary
Chandler, Arizona is a city located in the southeastern part of the state, in Maricopa County. It is a suburb of Phoenix, the state capital, and is located about 20 miles southeast of downtown Phoenix. The city is bordered by Tempe to the west, Gilbert to the south, and Mesa to the east. As of 2019, the population of Chandler was estimated to be over 260,000, making it the fourth-largest city in Arizona.
History
Chandler was founded in 1912 by Dr. Alexander John Chandler, a veterinarian from Illinois. He purchased 80 acres of land in the area and began to develop it into a town. He named the town Chandler after himself, and it was incorporated in 1920.
In the early years, Chandler was a farming community, with cotton and alfalfa being the main crops. The town also had a few small businesses, such as a general store and a blacksmith shop.
In the 1950s, Chandler began to experience rapid growth due to the development of the Intel Corporation in nearby Mesa. Intel's presence in the area brought many new jobs and people to the city, and the population of Chandler began to grow rapidly.
Geography
Chandler is located in the southeastern part of Arizona, in Maricopa County. It is bordered by Tempe to the west, Gilbert to the south, and Mesa to the east. The city is located about 20 miles southeast of downtown Phoenix.
The city has a total area of 58.0 square miles, of which 57.9 square miles is land and 0.1 square miles is water. The city is located in the Sonoran Desert, and the climate is hot and dry, with temperatures reaching over 100 degrees Fahrenheit in the summer months.
Economy
Chandler is a major economic center in the Phoenix metropolitan area. The city is home to several major employers, including Intel, Bank of America, Wells Fargo, and PayPal. The city also has a thriving tourism industry, with many visitors coming to the city to visit its many attractions, such as the Chandler Center for the Arts and the Chandler Museum.
The city also has a strong manufacturing sector, with many companies producing electronics, aerospace components, and medical devices. The city is also home to several major retail centers, such as the Chandler Fashion Center and the Chandler Pavilions.
Demographics
As of 2019, the population of Chandler was estimated to be over 260,000. The city has a diverse population, with the largest ethnic groups being White (63.2%), Hispanic or Latino (25.3%), and Asian (5.2%).
The median household income in Chandler is $76,845, and the median home value is $272,400. The city has a low unemployment rate of 3.7%, and the poverty rate is 8.3%.
Conclusion
Chandler, Arizona is a city located in the southeastern part of the state, in Maricopa County. It is a suburb of Phoenix, the state capital, and is located about 20 miles southeast of downtown Phoenix. The city is bordered by Tempe to the west, Gilbert to the south, and Mesa to the east. As of 2019, the population of Chandler was estimated to be over 260,000, making it the fourth-largest city in Arizona.
Chandler has a diverse economy, with major employers such as Intel, Bank of America, Wells Fargo, and PayPal. The city also has a thriving tourism industry, with many visitors coming to the city to visit its many attractions. The city also has a strong manufacturing sector, with many companies producing electronics, aerospace components, and medical devices.
The population of Chandler is diverse, with the largest ethnic groups being White (63.2%), Hispanic or Latino (25.3%), and Asian (5.2%). The median household income in Chandler is $76,845, and the median home value is $272,400. The city has a low unemployment rate of 3.7%, and the poverty rate is 8.3%.
Common Questions
What is Per Capita Income in Chandler?
Per Capita income in Chandler is $48,987.
What is the Median Family Income in Chandler?
Median Family Income in Chandler is $115,100.
What is the Median Household income in Chandler?
Median Household Income in Chandler is $99,374.
What is Income or Wage Gap in Chandler?
Income or Wage Gap in Chandler is 24.6%.
Women in Chandler earn 75.4 cents for every dollar earned by a man.
What is Family Income Deficit in Chandler?
Family Income Deficit in Chandler is $11,758.
Families that are below poverty line in Chandler earn $11,758 less on average than the poverty threshold level.
What is Inequality or Gini Index in Chandler?
Inequality or Gini Index in Chandler is 0.42.
What is the Total Population of Chandler?
Total Population of Chandler is 275,618.
What is the Total Male Population of Chandler?
Total Male Population of Chandler is 138,117.
What is the Total Female Population of Chandler?
Total Female Population of Chandler is 137,501.
What is the Ratio of Males per 100 Females in Chandler?
There are 100.45 Males per 100 Females in Chandler.
What is the Ratio of Females per 100 Males in Chandler?
There are 99.55 Females per 100 Males in Chandler.
What is the Median Population Age in Chandler?
Median Population Age in Chandler is 37.0 Years.
What is the Average Family Size in Chandler
Average Family Size in Chandler is 3.1 People.
What is the Average Household Size in Chandler
Average Household Size in Chandler is 2.6 People.
How Large is the Labor Force in Chandler?
There are 156,375 People in the Labor Forcein in Chandler.
What is the Percentage of People in the Labor Force in Chandler?
71.6% of People are in the Labor Force in Chandler.
What is the Unemployment Rate in Chandler?
Unemployment Rate in Chandler is 3.8%.