Hayward, CA Map & Demographics
Hayward Map
Hayward Overview
$42,311
PER CAPITA INCOME
$113,934
AVG FAMILY INCOME
$105,371
AVG HOUSEHOLD INCOME
21.0%
WAGE / INCOME GAP [ % ]
79.0¢/ $1
WAGE / INCOME GAP [ $ ]
$9,826
FAMILY INCOME DEFICIT
0.41
INEQUALITY / GINI INDEX
160,602
TOTAL POPULATION
82,187
MALE POPULATION
78,415
FEMALE POPULATION
104.81
MALES / 100 FEMALES
95.41
FEMALES / 100 MALES
37.6
MEDIAN AGE
3.6
AVG FAMILY SIZE
3.2
AVG HOUSEHOLD SIZE
88,399
LABOR FORCE [ PEOPLE ]
66.8%
PERCENT IN LABOR FORCE
5.7%
UNEMPLOYMENT RATE
Income in Hayward
Income Overview in Hayward
Per Capita Income in Hayward is $42,311, while median incomes of families and households are $113,934 and $105,371 respectively.
| Characteristic | Number | Measure |
| Per Capita Income | 160,602 | $42,311 |
| Median Family Income | 36,187 | $113,934 |
| Mean Family Income | 36,187 | $139,404 |
| Median Household Income | 49,542 | $105,371 |
| Mean Household Income | 49,542 | $129,952 |
| Income Deficit | 36,187 | $9,826 |
| Wage / Income Gap (%) | 160,602 | 20.96% |
| Wage / Income Gap ($) | 160,602 | 79.04¢ per $1 |
| Gini / Inequality Index | 160,602 | 0.41 |
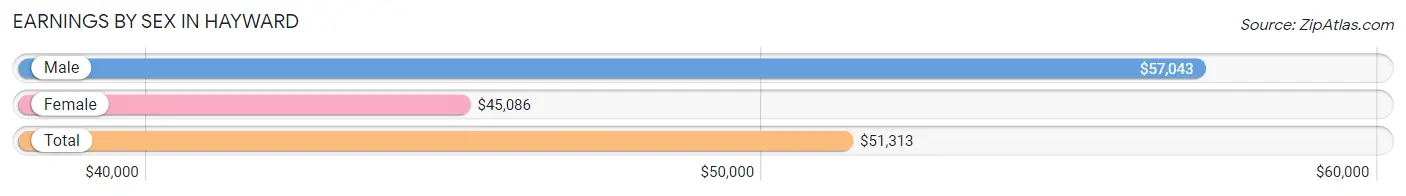
Earnings by Sex in Hayward
Average Earnings in Hayward are $51,313, $57,043 for men and $45,086 for women, a difference of 21.0%.
| Sex | Number | Average Earnings |
| Male | 48,595 (54.4%) | $57,043 |
| Female | 40,657 (45.6%) | $45,086 |
| Total | 89,252 (100.0%) | $51,313 |
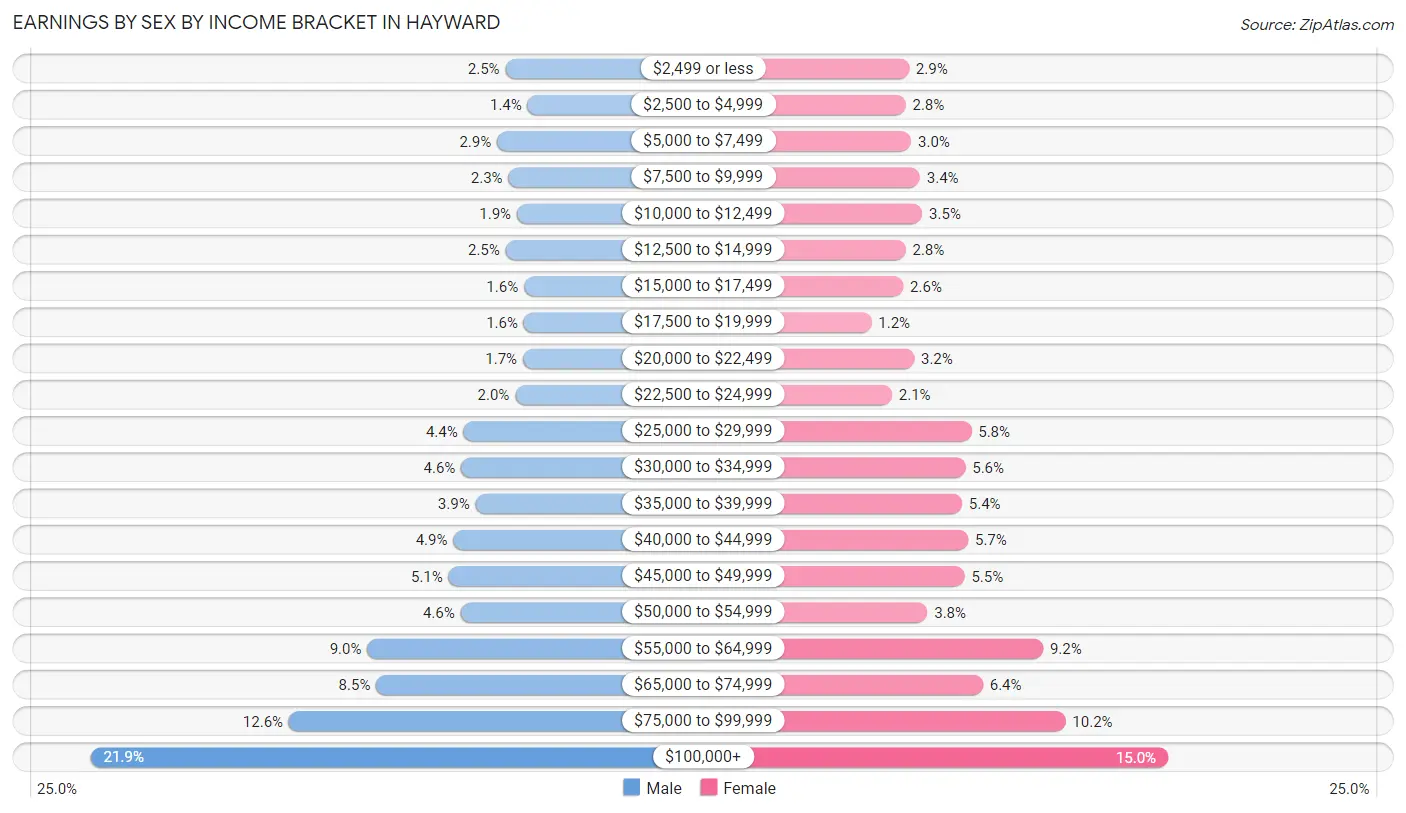
Earnings by Sex by Income Bracket in Hayward
The most common earnings brackets in Hayward are $100,000+ for men (10,645 | 21.9%) and $100,000+ for women (6,115 | 15.0%).
| Income | Male | Female |
| $2,499 or less | 1,206 (2.5%) | 1,185 (2.9%) |
| $2,500 to $4,999 | 701 (1.4%) | 1,119 (2.8%) |
| $5,000 to $7,499 | 1,395 (2.9%) | 1,223 (3.0%) |
| $7,500 to $9,999 | 1,139 (2.3%) | 1,390 (3.4%) |
| $10,000 to $12,499 | 942 (1.9%) | 1,434 (3.5%) |
| $12,500 to $14,999 | 1,200 (2.5%) | 1,120 (2.8%) |
| $15,000 to $17,499 | 783 (1.6%) | 1,073 (2.6%) |
| $17,500 to $19,999 | 786 (1.6%) | 467 (1.1%) |
| $20,000 to $22,499 | 809 (1.7%) | 1,282 (3.2%) |
| $22,500 to $24,999 | 982 (2.0%) | 858 (2.1%) |
| $25,000 to $29,999 | 2,160 (4.4%) | 2,369 (5.8%) |
| $30,000 to $34,999 | 2,211 (4.5%) | 2,257 (5.6%) |
| $35,000 to $39,999 | 1,887 (3.9%) | 2,192 (5.4%) |
| $40,000 to $44,999 | 2,392 (4.9%) | 2,311 (5.7%) |
| $45,000 to $49,999 | 2,500 (5.1%) | 2,240 (5.5%) |
| $50,000 to $54,999 | 2,227 (4.6%) | 1,532 (3.8%) |
| $55,000 to $64,999 | 4,350 (8.9%) | 3,735 (9.2%) |
| $65,000 to $74,999 | 4,146 (8.5%) | 2,591 (6.4%) |
| $75,000 to $99,999 | 6,134 (12.6%) | 4,164 (10.2%) |
| $100,000+ | 10,645 (21.9%) | 6,115 (15.0%) |
| Total | 48,595 (100.0%) | 40,657 (100.0%) |
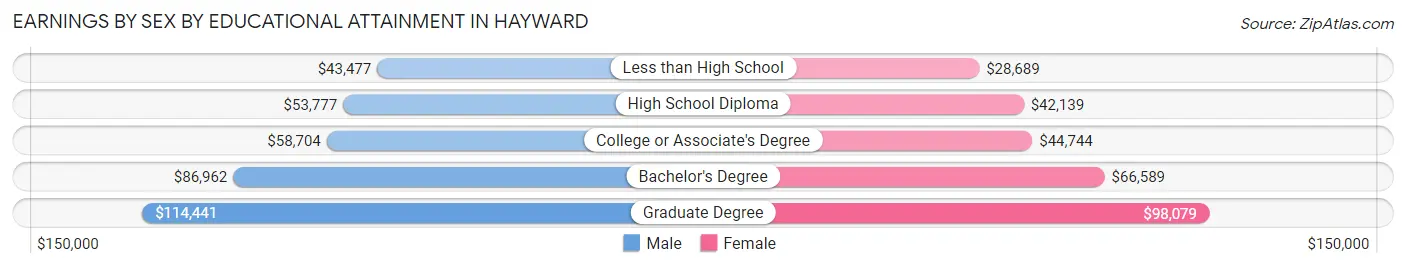
Earnings by Sex by Educational Attainment in Hayward
Average earnings in Hayward are $59,980 for men and $49,347 for women, a difference of 17.7%. Men with an educational attainment of graduate degree enjoy the highest average annual earnings of $114,441, while those with less than high school education earn the least with $43,477. Women with an educational attainment of graduate degree earn the most with the average annual earnings of $98,079, while those with less than high school education have the smallest earnings of $28,689.
| Educational Attainment | Male Income | Female Income |
| Less than High School | $43,477 | $28,689 |
| High School Diploma | $53,777 | $42,139 |
| College or Associate's Degree | $58,704 | $44,744 |
| Bachelor's Degree | $86,962 | $66,589 |
| Graduate Degree | $114,441 | $98,079 |
| Total | $59,980 | $49,347 |
Family Income in Hayward
Family Income Brackets in Hayward
According to the Hayward family income data, there are 7,816 families falling into the $200,000+ income range, which is the most common income bracket and makes up 21.6% of all families. Conversely, the $10,000 to $14,999 income bracket is the least frequent group with only 434 families (1.2%) belonging to this category.
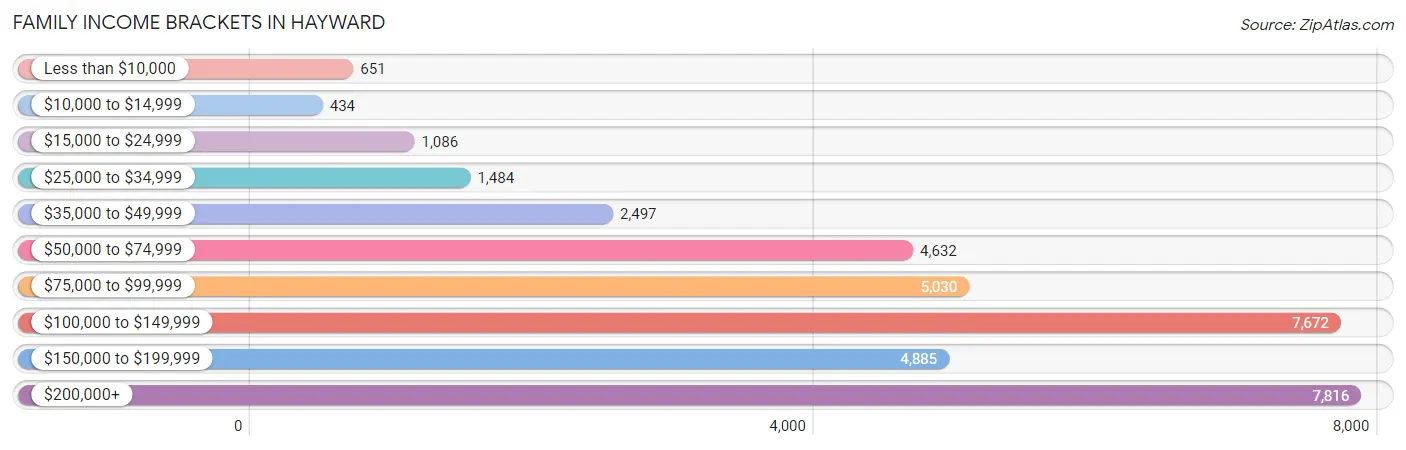
| Income Bracket | # Families | % Families |
| Less than $10,000 | 651 | 1.8% |
| $10,000 to $14,999 | 434 | 1.2% |
| $15,000 to $24,999 | 1,086 | 3.0% |
| $25,000 to $34,999 | 1,484 | 4.1% |
| $35,000 to $49,999 | 2,497 | 6.9% |
| $50,000 to $74,999 | 4,632 | 12.8% |
| $75,000 to $99,999 | 5,030 | 13.9% |
| $100,000 to $149,999 | 7,672 | 21.2% |
| $150,000 to $199,999 | 4,885 | 13.5% |
| $200,000+ | 7,816 | 21.6% |
Family Income by Famaliy Size in Hayward
7+ person families (1,268 | 3.5%) account for the highest median family income in Hayward with $164,611 per family, while 2-person families (12,304 | 34.0%) have the highest median income of $46,418 per family member.
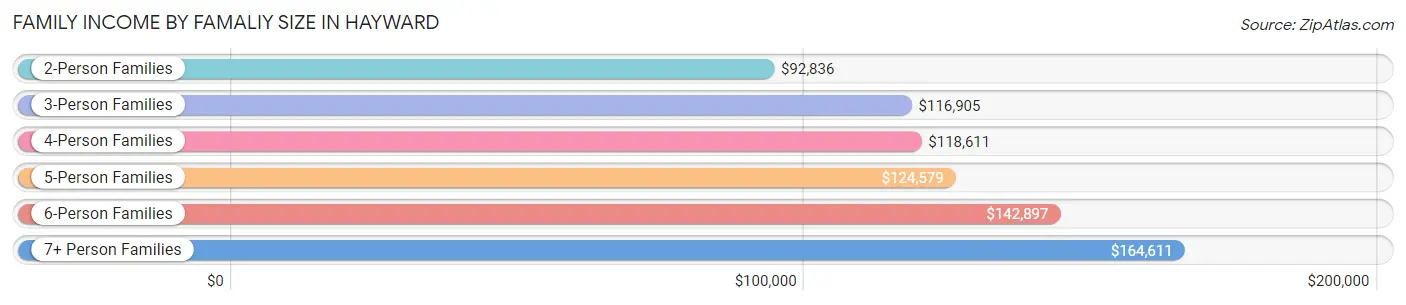
| Income Bracket | # Families | Median Income |
| 2-Person Families | 12,304 (34.0%) | $92,836 |
| 3-Person Families | 8,697 (24.0%) | $116,905 |
| 4-Person Families | 7,830 (21.6%) | $118,611 |
| 5-Person Families | 4,206 (11.6%) | $124,579 |
| 6-Person Families | 1,882 (5.2%) | $142,897 |
| 7+ Person Families | 1,268 (3.5%) | $164,611 |
| Total | 36,187 (100.0%) | $113,934 |
Family Income by Number of Earners in Hayward
The median family income in Hayward is $113,934, with families comprising 3+ earners (7,164) having the highest median family income of $170,357, while families with no earners (3,173) have the lowest median family income of $47,636, accounting for 19.8% and 8.8% of families, respectively.
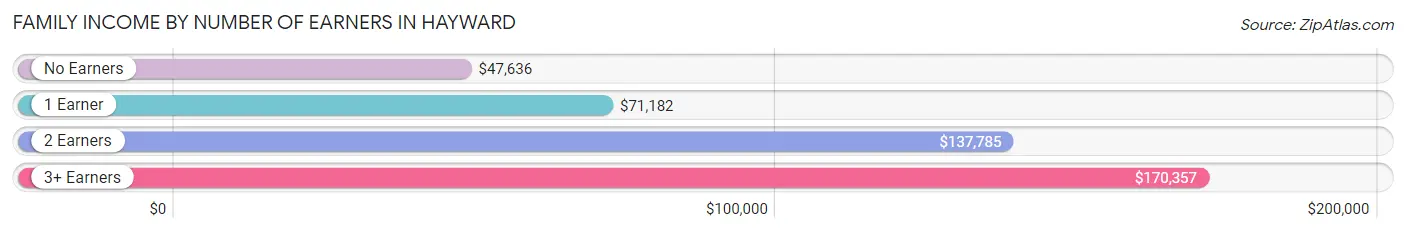
| Number of Earners | # Families | Median Income |
| No Earners | 3,173 (8.8%) | $47,636 |
| 1 Earner | 10,821 (29.9%) | $71,182 |
| 2 Earners | 15,029 (41.5%) | $137,785 |
| 3+ Earners | 7,164 (19.8%) | $170,357 |
| Total | 36,187 (100.0%) | $113,934 |
Household Income in Hayward
Household Income Brackets in Hayward
With 10,057 households falling in the category, the $100,000 to $149,999 income range is the most frequent in Hayward, accounting for 20.3% of all households. In contrast, only 1,139 households (2.3%) fall into the $10,000 to $14,999 income bracket, making it the least populous group.
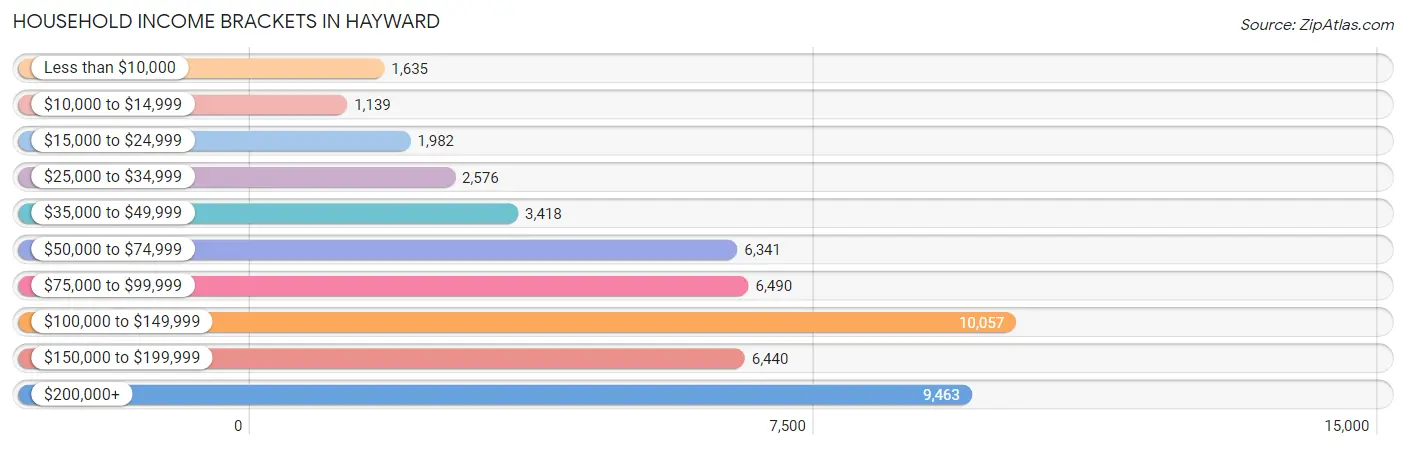
| Income Bracket | # Households | % Households |
| Less than $10,000 | 1,635 | 3.3% |
| $10,000 to $14,999 | 1,139 | 2.3% |
| $15,000 to $24,999 | 1,982 | 4.0% |
| $25,000 to $34,999 | 2,576 | 5.2% |
| $35,000 to $49,999 | 3,418 | 6.9% |
| $50,000 to $74,999 | 6,341 | 12.8% |
| $75,000 to $99,999 | 6,490 | 13.1% |
| $100,000 to $149,999 | 10,057 | 20.3% |
| $150,000 to $199,999 | 6,440 | 13.0% |
| $200,000+ | 9,463 | 19.1% |
Household Income by Householder Age in Hayward
The median household income in Hayward is $105,371, with the highest median household income of $119,866 found in the 25 to 44 years age bracket for the primary householder. A total of 17,595 households (35.5%) fall into this category. Meanwhile, the 65+ years age bracket for the primary householder has the lowest median household income of $66,719, with 10,577 households (21.3%) in this group.
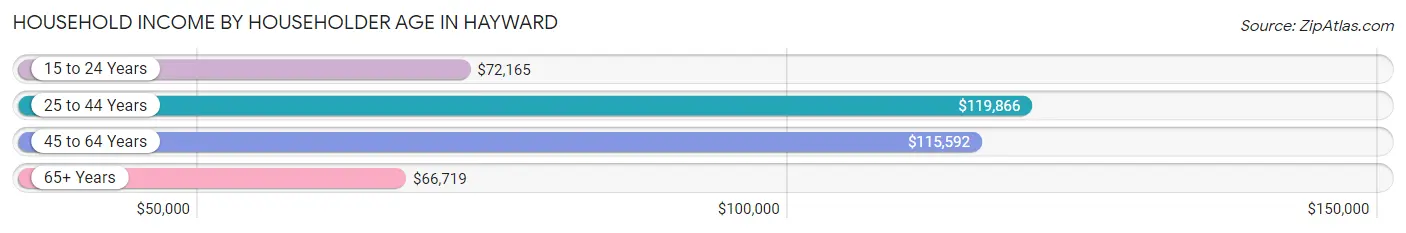
| Income Bracket | # Households | Median Income |
| 15 to 24 Years | 1,059 (2.1%) | $72,165 |
| 25 to 44 Years | 17,595 (35.5%) | $119,866 |
| 45 to 64 Years | 20,311 (41.0%) | $115,592 |
| 65+ Years | 10,577 (21.3%) | $66,719 |
| Total | 49,542 (100.0%) | $105,371 |
Poverty in Hayward
Income Below Poverty by Sex and Age in Hayward
With 9.5% poverty level for males and 9.7% for females among the residents of Hayward, 16 and 17 year old males and 5 year old females are the most vulnerable to poverty, with 330 males (15.0%) and 160 females (14.9%) in their respective age groups living below the poverty level.
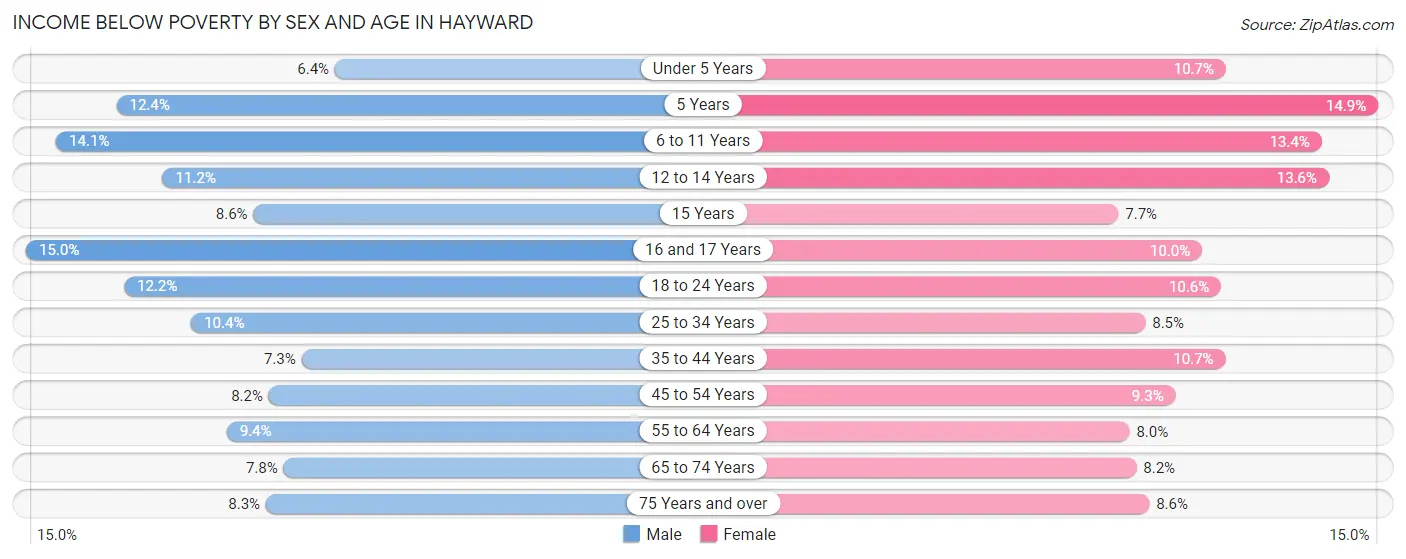
| Age Bracket | Male | Female |
| Under 5 Years | 319 (6.4%) | 408 (10.7%) |
| 5 Years | 111 (12.4%) | 160 (14.9%) |
| 6 to 11 Years | 722 (14.1%) | 605 (13.4%) |
| 12 to 14 Years | 320 (11.2%) | 373 (13.6%) |
| 15 Years | 84 (8.6%) | 62 (7.7%) |
| 16 and 17 Years | 330 (15.0%) | 169 (10.0%) |
| 18 to 24 Years | 810 (12.2%) | 667 (10.6%) |
| 25 to 34 Years | 1,562 (10.4%) | 1,041 (8.5%) |
| 35 to 44 Years | 870 (7.3%) | 1,199 (10.7%) |
| 45 to 54 Years | 868 (8.2%) | 954 (9.3%) |
| 55 to 64 Years | 975 (9.4%) | 867 (8.0%) |
| 65 to 74 Years | 462 (7.8%) | 536 (8.2%) |
| 75 Years and over | 260 (8.3%) | 421 (8.6%) |
| Total | 7,693 (9.5%) | 7,462 (9.7%) |
Income Above Poverty by Sex and Age in Hayward
According to the poverty statistics in Hayward, males aged under 5 years and females aged 15 years are the age groups that are most secure financially, with 93.6% of males and 92.3% of females in these age groups living above the poverty line.
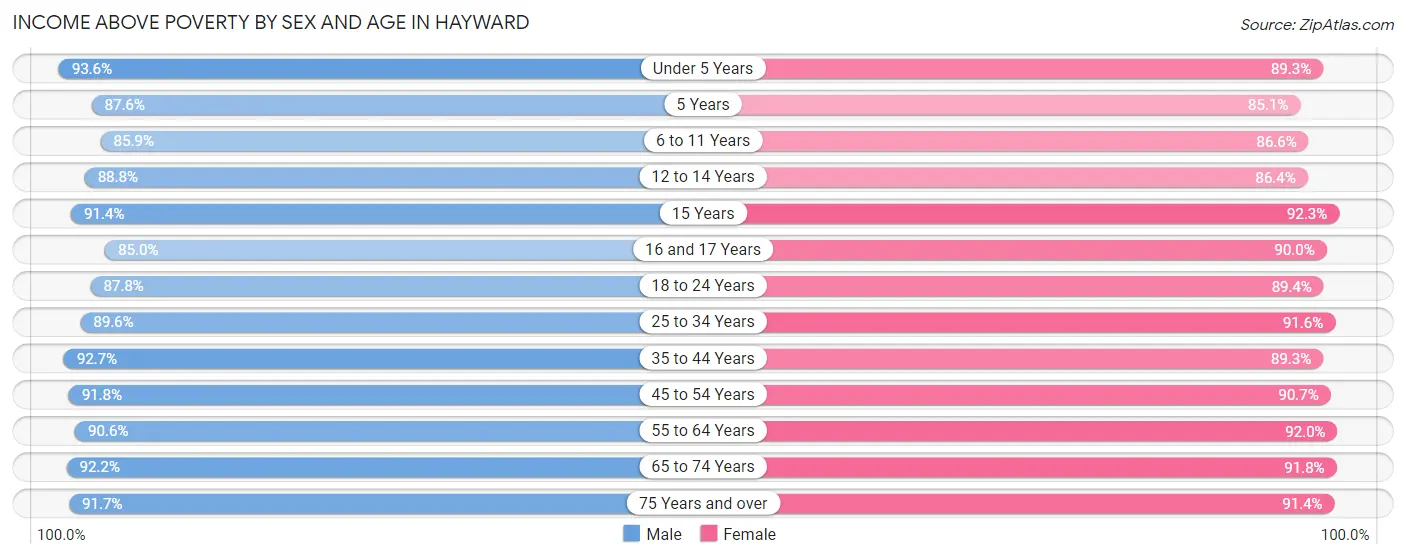
| Age Bracket | Male | Female |
| Under 5 Years | 4,693 (93.6%) | 3,408 (89.3%) |
| 5 Years | 781 (87.6%) | 912 (85.1%) |
| 6 to 11 Years | 4,391 (85.9%) | 3,925 (86.6%) |
| 12 to 14 Years | 2,547 (88.8%) | 2,378 (86.4%) |
| 15 Years | 889 (91.4%) | 743 (92.3%) |
| 16 and 17 Years | 1,876 (85.0%) | 1,516 (90.0%) |
| 18 to 24 Years | 5,811 (87.8%) | 5,651 (89.4%) |
| 25 to 34 Years | 13,520 (89.6%) | 11,273 (91.5%) |
| 35 to 44 Years | 11,065 (92.7%) | 10,026 (89.3%) |
| 45 to 54 Years | 9,719 (91.8%) | 9,320 (90.7%) |
| 55 to 64 Years | 9,436 (90.6%) | 9,962 (92.0%) |
| 65 to 74 Years | 5,465 (92.2%) | 6,001 (91.8%) |
| 75 Years and over | 2,881 (91.7%) | 4,497 (91.4%) |
| Total | 73,074 (90.5%) | 69,612 (90.3%) |
Income Below Poverty Among Married-Couple Families in Hayward
The poverty statistics for married-couple families in Hayward show that 3.1% or 769 of the total 25,164 families live below the poverty line. Families with 5 or more children have the highest poverty rate of 21.9%, comprising of 28 families. On the other hand, families with no children have the lowest poverty rate of 2.5%, which includes 328 families.
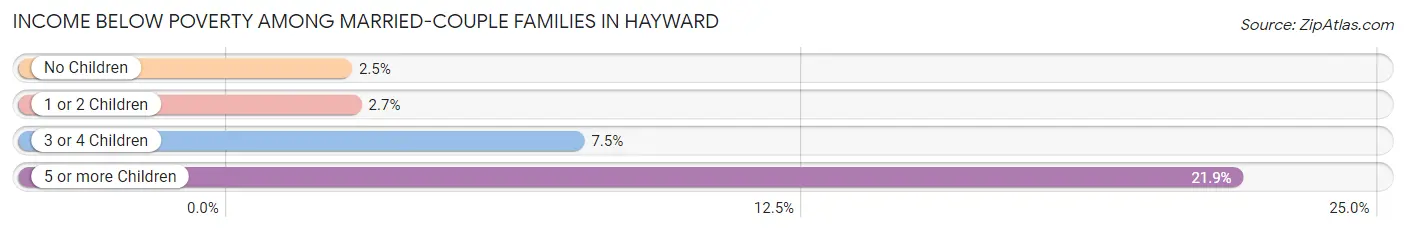
| Children | Above Poverty | Below Poverty |
| No Children | 12,879 (97.5%) | 328 (2.5%) |
| 1 or 2 Children | 9,613 (97.3%) | 266 (2.7%) |
| 3 or 4 Children | 1,803 (92.5%) | 147 (7.5%) |
| 5 or more Children | 100 (78.1%) | 28 (21.9%) |
| Total | 24,395 (96.9%) | 769 (3.1%) |
Income Below Poverty Among Single-Parent Households in Hayward
According to the poverty data in Hayward, 13.9% or 473 single-father households and 14.7% or 1,120 single-mother households are living below the poverty line. Among single-father households, those with 3 or 4 children have the highest poverty rate, with 69 households (47.6%) experiencing poverty. Likewise, among single-mother households, those with 3 or 4 children have the highest poverty rate, with 167 households (27.4%) falling below the poverty line.
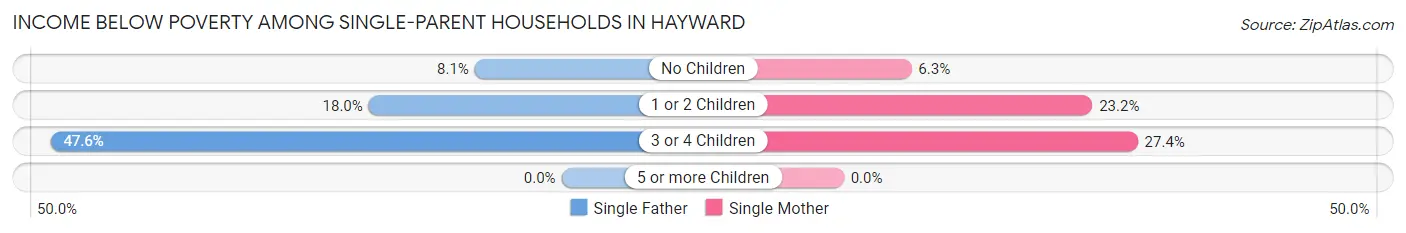
| Children | Single Father | Single Mother |
| No Children | 149 (8.1%) | 248 (6.3%) |
| 1 or 2 Children | 255 (18.0%) | 705 (23.2%) |
| 3 or 4 Children | 69 (47.6%) | 167 (27.4%) |
| 5 or more Children | 0 (0.0%) | 0 (0.0%) |
| Total | 473 (13.9%) | 1,120 (14.7%) |
Income Below Poverty Among Married-Couple vs Single-Parent Households in Hayward
The poverty data for Hayward shows that 769 of the married-couple family households (3.1%) and 1,593 of the single-parent households (14.4%) are living below the poverty level. Within the married-couple family households, those with 5 or more children have the highest poverty rate, with 28 households (21.9%) falling below the poverty line. Among the single-parent households, those with 3 or 4 children have the highest poverty rate, with 236 household (31.3%) living below poverty.
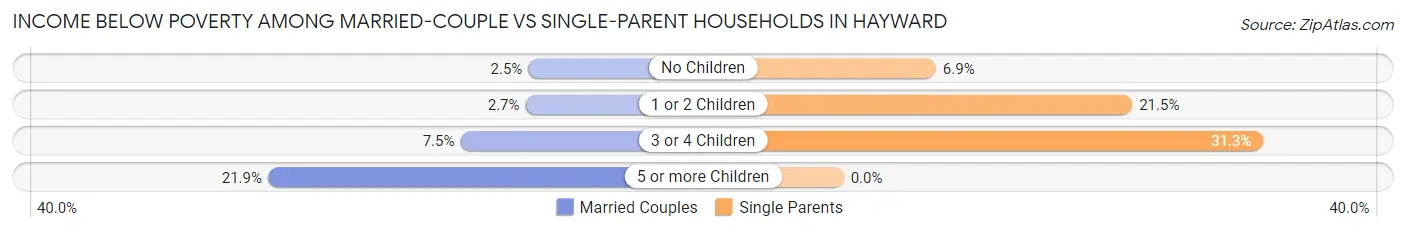
| Children | Married-Couple Families | Single-Parent Households |
| No Children | 328 (2.5%) | 397 (6.9%) |
| 1 or 2 Children | 266 (2.7%) | 960 (21.5%) |
| 3 or 4 Children | 147 (7.5%) | 236 (31.3%) |
| 5 or more Children | 28 (21.9%) | 0 (0.0%) |
| Total | 769 (3.1%) | 1,593 (14.4%) |
Race in Hayward
The most populous races in Hayward are Hispanic or Latino (63,692 | 39.7%), Asian (47,563 | 29.6%), and Some other Race (37,636 | 23.4%).
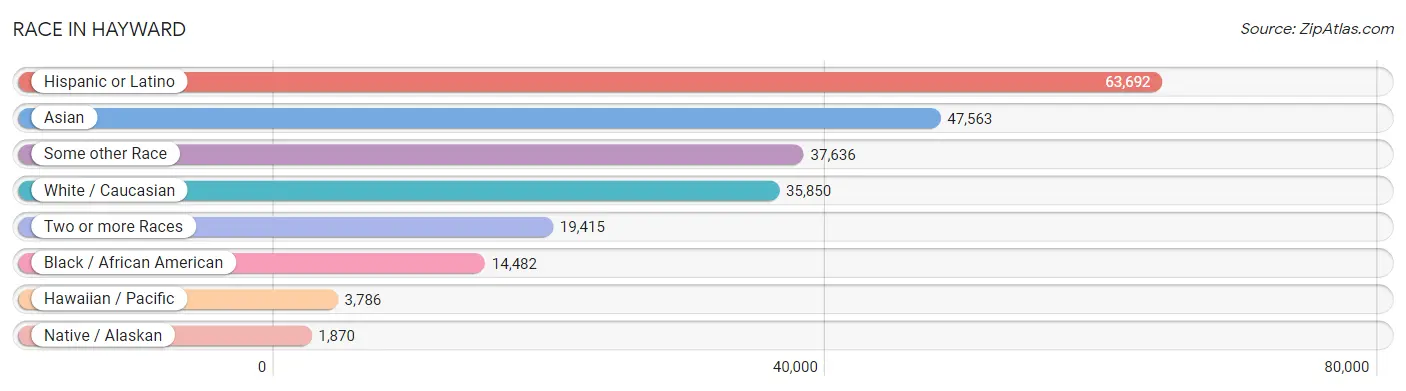
| Race | # Population | % Population |
| Asian | 47,563 | 29.6% |
| Black / African American | 14,482 | 9.0% |
| Hawaiian / Pacific | 3,786 | 2.4% |
| Hispanic or Latino | 63,692 | 39.7% |
| Native / Alaskan | 1,870 | 1.2% |
| White / Caucasian | 35,850 | 22.3% |
| Two or more Races | 19,415 | 12.1% |
| Some other Race | 37,636 | 23.4% |
| Total | 160,602 | 100.0% |
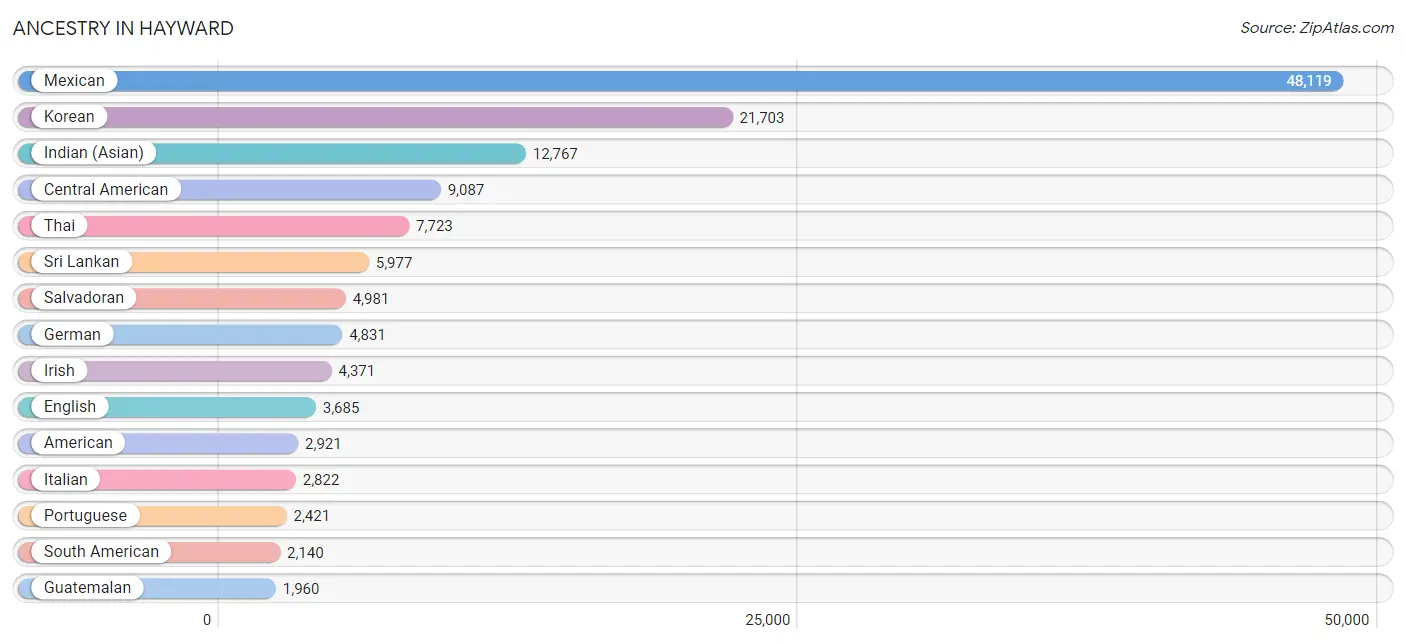
Ancestry in Hayward
The most populous ancestries reported in Hayward are Mexican (48,119 | 30.0%), Korean (21,703 | 13.5%), Indian (Asian) (12,767 | 8.0%), Central American (9,087 | 5.7%), and Thai (7,723 | 4.8%), together accounting for 61.9% of all Hayward residents.
| Ancestry | # Population | % Population |
| Afghan | 1,806 | 1.1% |
| African | 810 | 0.5% |
| American | 2,921 | 1.8% |
| Apache | 77 | 0.1% |
| Arab | 1,482 | 0.9% |
| Argentinean | 148 | 0.1% |
| Armenian | 34 | 0.0% |
| Assyrian / Chaldean / Syriac | 36 | 0.0% |
| Australian | 19 | 0.0% |
| Austrian | 34 | 0.0% |
| Bangladeshi | 149 | 0.1% |
| Barbadian | 16 | 0.0% |
| Belgian | 52 | 0.0% |
| Belizean | 32 | 0.0% |
| Bhutanese | 1,617 | 1.0% |
| Blackfeet | 45 | 0.0% |
| Bolivian | 93 | 0.1% |
| Brazilian | 153 | 0.1% |
| British | 265 | 0.2% |
| British West Indian | 17 | 0.0% |
| Bulgarian | 192 | 0.1% |
| Burmese | 1,017 | 0.6% |
| Canadian | 65 | 0.0% |
| Cape Verdean | 17 | 0.0% |
| Carpatho Rusyn | 5 | 0.0% |
| Central American | 9,087 | 5.7% |
| Central American Indian | 704 | 0.4% |
| Cherokee | 484 | 0.3% |
| Chickasaw | 26 | 0.0% |
| Chilean | 71 | 0.0% |
| Chinese | 4 | 0.0% |
| Choctaw | 109 | 0.1% |
| Colombian | 480 | 0.3% |
| Comanche | 13 | 0.0% |
| Costa Rican | 39 | 0.0% |
| Cree | 5 | 0.0% |
| Creek | 34 | 0.0% |
| Croatian | 160 | 0.1% |
| Cuban | 200 | 0.1% |
| Czech | 176 | 0.1% |
| Czechoslovakian | 10 | 0.0% |
| Danish | 337 | 0.2% |
| Dominican | 34 | 0.0% |
| Dutch | 480 | 0.3% |
| Eastern European | 47 | 0.0% |
| Ecuadorian | 71 | 0.0% |
| Egyptian | 335 | 0.2% |
| English | 3,685 | 2.3% |
| Ethiopian | 240 | 0.2% |
| European | 1,150 | 0.7% |
| Fijian | 72 | 0.0% |
| Filipino | 338 | 0.2% |
| Finnish | 97 | 0.1% |
| French | 1,098 | 0.7% |
| French Canadian | 94 | 0.1% |
| German | 4,831 | 3.0% |
| Ghanaian | 188 | 0.1% |
| Greek | 207 | 0.1% |
| Guamanian / Chamorro | 608 | 0.4% |
| Guatemalan | 1,960 | 1.2% |
| Guyanese | 9 | 0.0% |
| Honduran | 456 | 0.3% |
| Hopi | 11 | 0.0% |
| Hungarian | 99 | 0.1% |
| Indian (Asian) | 12,767 | 8.0% |
| Indonesian | 281 | 0.2% |
| Iranian | 100 | 0.1% |
| Irish | 4,371 | 2.7% |
| Italian | 2,822 | 1.8% |
| Jamaican | 56 | 0.0% |
| Japanese | 458 | 0.3% |
| Jordanian | 114 | 0.1% |
| Kenyan | 103 | 0.1% |
| Kiowa | 33 | 0.0% |
| Korean | 21,703 | 13.5% |
| Laotian | 709 | 0.4% |
| Latvian | 30 | 0.0% |
| Lebanese | 166 | 0.1% |
| Liberian | 44 | 0.0% |
| Lithuanian | 30 | 0.0% |
| Malaysian | 321 | 0.2% |
| Maltese | 5 | 0.0% |
| Mexican | 48,119 | 30.0% |
| Mexican American Indian | 631 | 0.4% |
| Mongolian | 75 | 0.1% |
| Moroccan | 30 | 0.0% |
| Native Hawaiian | 995 | 0.6% |
| Navajo | 35 | 0.0% |
| New Zealander | 34 | 0.0% |
| Nicaraguan | 1,515 | 0.9% |
| Nigerian | 325 | 0.2% |
| Northern European | 180 | 0.1% |
| Norwegian | 548 | 0.3% |
| Pakistani | 226 | 0.1% |
| Palestinian | 223 | 0.1% |
| Panamanian | 136 | 0.1% |
| Pennsylvania German | 10 | 0.0% |
| Peruvian | 1,179 | 0.7% |
| Polish | 631 | 0.4% |
| Portuguese | 2,421 | 1.5% |
| Pueblo | 14 | 0.0% |
| Puerto Rican | 1,462 | 0.9% |
| Romanian | 79 | 0.1% |
| Russian | 296 | 0.2% |
| Salvadoran | 4,981 | 3.1% |
| Samoan | 701 | 0.4% |
| Scandinavian | 132 | 0.1% |
| Scotch-Irish | 335 | 0.2% |
| Scottish | 889 | 0.5% |
| Senegalese | 44 | 0.0% |
| Serbian | 9 | 0.0% |
| Shoshone | 8 | 0.0% |
| Sierra Leonean | 5 | 0.0% |
| Sioux | 51 | 0.0% |
| Slavic | 43 | 0.0% |
| Slovak | 13 | 0.0% |
| Slovene | 54 | 0.0% |
| South American | 2,140 | 1.3% |
| South American Indian | 55 | 0.0% |
| Spaniard | 654 | 0.4% |
| Spanish | 479 | 0.3% |
| Spanish American | 41 | 0.0% |
| Spanish American Indian | 8 | 0.0% |
| Sri Lankan | 5,977 | 3.7% |
| Subsaharan African | 1,766 | 1.1% |
| Swedish | 502 | 0.3% |
| Swiss | 75 | 0.1% |
| Syrian | 7 | 0.0% |
| Thai | 7,723 | 4.8% |
| Tlingit-Haida | 1 | 0.0% |
| Tongan | 476 | 0.3% |
| Trinidadian and Tobagonian | 13 | 0.0% |
| Turkish | 60 | 0.0% |
| Ukrainian | 141 | 0.1% |
| Uruguayan | 30 | 0.0% |
| Ute | 21 | 0.0% |
| Venezuelan | 36 | 0.0% |
| Vietnamese | 25 | 0.0% |
| Welsh | 180 | 0.1% |
| West Indian | 17 | 0.0% |
| Yakama | 16 | 0.0% |
| Yaqui | 30 | 0.0% |
| Yugoslavian | 19 | 0.0% | View All 143 Rows |
Immigrants in Hayward
The most numerous immigrant groups reported in Hayward came from Asia (33,088 | 20.6%), Latin America (26,027 | 16.2%), Central America (24,152 | 15.0%), Mexico (18,033 | 11.2%), and South Eastern Asia (17,606 | 11.0%), together accounting for 74.0% of all Hayward residents.
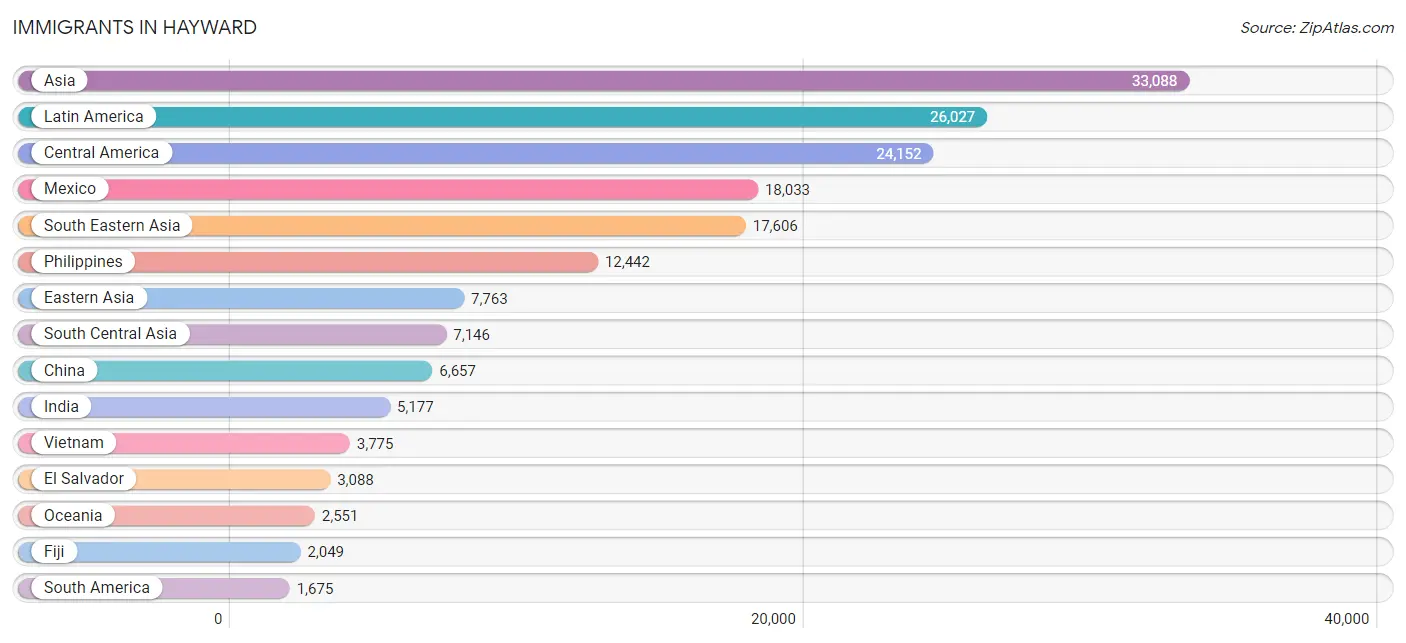
| Immigration Origin | # Population | % Population |
| Afghanistan | 1,481 | 0.9% |
| Africa | 1,466 | 0.9% |
| Argentina | 98 | 0.1% |
| Asia | 33,088 | 20.6% |
| Australia | 21 | 0.0% |
| Bangladesh | 33 | 0.0% |
| Belarus | 13 | 0.0% |
| Belize | 11 | 0.0% |
| Bolivia | 80 | 0.1% |
| Brazil | 148 | 0.1% |
| Bulgaria | 76 | 0.1% |
| Cambodia | 73 | 0.1% |
| Cameroon | 46 | 0.0% |
| Canada | 236 | 0.2% |
| Caribbean | 200 | 0.1% |
| Central America | 24,152 | 15.0% |
| Chile | 68 | 0.0% |
| China | 6,657 | 4.2% |
| Colombia | 322 | 0.2% |
| Congo | 21 | 0.0% |
| Costa Rica | 41 | 0.0% |
| Croatia | 74 | 0.1% |
| Cuba | 44 | 0.0% |
| Czechoslovakia | 15 | 0.0% |
| Dominican Republic | 31 | 0.0% |
| Eastern Africa | 387 | 0.2% |
| Eastern Asia | 7,763 | 4.8% |
| Eastern Europe | 814 | 0.5% |
| Ecuador | 22 | 0.0% |
| Egypt | 332 | 0.2% |
| El Salvador | 3,088 | 1.9% |
| England | 56 | 0.0% |
| Ethiopia | 270 | 0.2% |
| Europe | 1,471 | 0.9% |
| Fiji | 2,049 | 1.3% |
| France | 45 | 0.0% |
| Germany | 254 | 0.2% |
| Ghana | 215 | 0.1% |
| Greece | 43 | 0.0% |
| Grenada | 17 | 0.0% |
| Guatemala | 1,672 | 1.0% |
| Guyana | 9 | 0.0% |
| Honduras | 374 | 0.2% |
| Hong Kong | 1,413 | 0.9% |
| Hungary | 5 | 0.0% |
| India | 5,177 | 3.2% |
| Indonesia | 410 | 0.3% |
| Iran | 112 | 0.1% |
| Iraq | 65 | 0.0% |
| Ireland | 1 | 0.0% |
| Israel | 115 | 0.1% |
| Italy | 42 | 0.0% |
| Jamaica | 47 | 0.0% |
| Japan | 403 | 0.3% |
| Jordan | 34 | 0.0% |
| Kenya | 94 | 0.1% |
| Korea | 703 | 0.4% |
| Kuwait | 52 | 0.0% |
| Laos | 101 | 0.1% |
| Latin America | 26,027 | 16.2% |
| Lebanon | 85 | 0.1% |
| Liberia | 109 | 0.1% |
| Malaysia | 181 | 0.1% |
| Mexico | 18,033 | 11.2% |
| Middle Africa | 67 | 0.0% |
| Nepal | 123 | 0.1% |
| Netherlands | 26 | 0.0% |
| Nicaragua | 884 | 0.5% |
| Nigeria | 245 | 0.2% |
| Northern Africa | 354 | 0.2% |
| Northern Europe | 99 | 0.1% |
| Oceania | 2,551 | 1.6% |
| Pakistan | 150 | 0.1% |
| Panama | 14 | 0.0% |
| Peru | 909 | 0.6% |
| Philippines | 12,442 | 7.7% |
| Poland | 132 | 0.1% |
| Portugal | 90 | 0.1% |
| Romania | 79 | 0.1% |
| Russia | 137 | 0.1% |
| Saudi Arabia | 52 | 0.0% |
| Scotland | 32 | 0.0% |
| Sierra Leone | 58 | 0.0% |
| Singapore | 63 | 0.0% |
| South Africa | 2 | 0.0% |
| South America | 1,675 | 1.0% |
| South Central Asia | 7,146 | 4.4% |
| South Eastern Asia | 17,606 | 11.0% |
| Southern Europe | 233 | 0.2% |
| Spain | 53 | 0.0% |
| Sri Lanka | 48 | 0.0% |
| Taiwan | 523 | 0.3% |
| Thailand | 233 | 0.2% |
| Trinidad and Tobago | 61 | 0.0% |
| Turkey | 37 | 0.0% |
| Ukraine | 271 | 0.2% |
| Uruguay | 13 | 0.0% |
| Uzbekistan | 22 | 0.0% |
| Venezuela | 6 | 0.0% |
| Vietnam | 3,775 | 2.4% |
| Western Africa | 650 | 0.4% |
| Western Asia | 440 | 0.3% |
| Western Europe | 325 | 0.2% | View All 103 Rows |
Sex and Age in Hayward
Sex and Age in Hayward
The most populous age groups in Hayward are 30 to 34 Years (7,819 | 9.5%) for men and 30 to 34 Years (6,848 | 8.7%) for women.
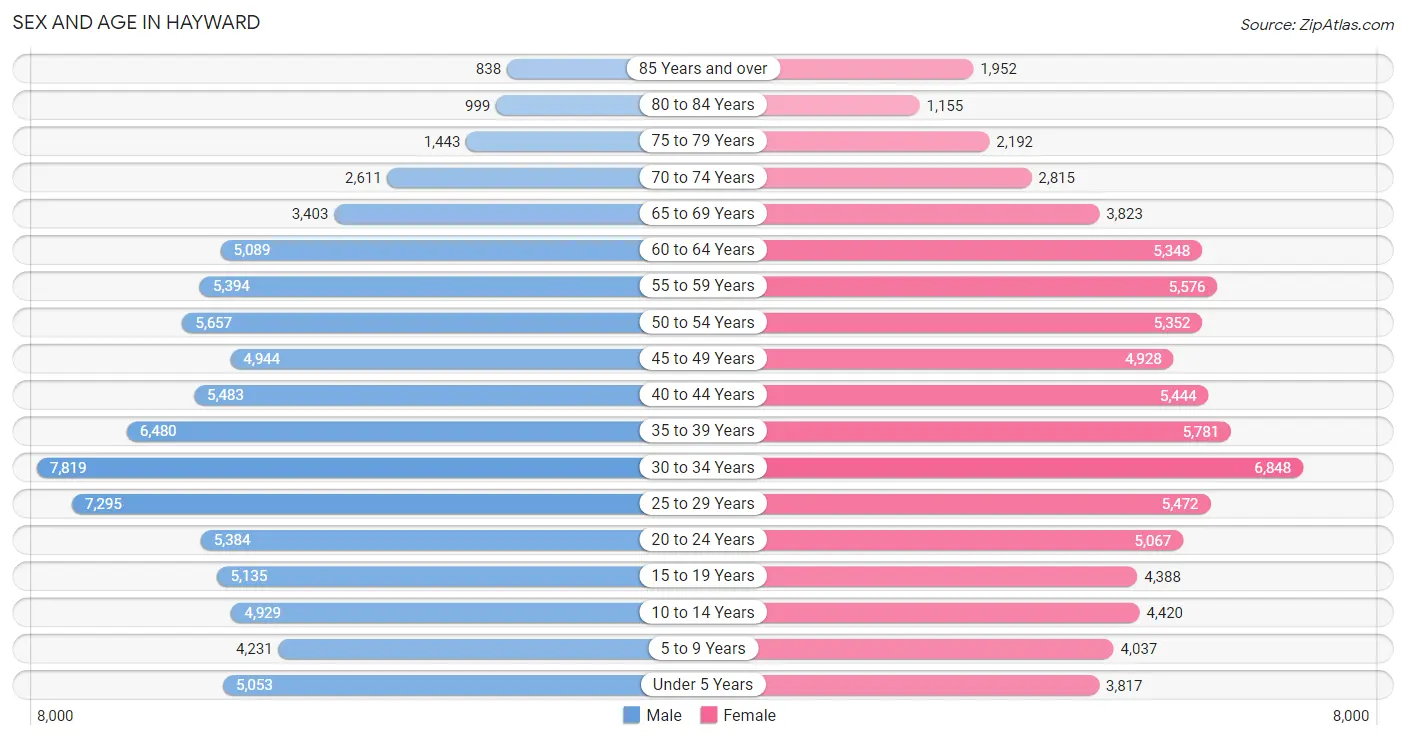
| Age Bracket | Male | Female |
| Under 5 Years | 5,053 (6.1%) | 3,817 (4.9%) |
| 5 to 9 Years | 4,231 (5.1%) | 4,037 (5.1%) |
| 10 to 14 Years | 4,929 (6.0%) | 4,420 (5.6%) |
| 15 to 19 Years | 5,135 (6.2%) | 4,388 (5.6%) |
| 20 to 24 Years | 5,384 (6.6%) | 5,067 (6.5%) |
| 25 to 29 Years | 7,295 (8.9%) | 5,472 (7.0%) |
| 30 to 34 Years | 7,819 (9.5%) | 6,848 (8.7%) |
| 35 to 39 Years | 6,480 (7.9%) | 5,781 (7.4%) |
| 40 to 44 Years | 5,483 (6.7%) | 5,444 (6.9%) |
| 45 to 49 Years | 4,944 (6.0%) | 4,928 (6.3%) |
| 50 to 54 Years | 5,657 (6.9%) | 5,352 (6.8%) |
| 55 to 59 Years | 5,394 (6.6%) | 5,576 (7.1%) |
| 60 to 64 Years | 5,089 (6.2%) | 5,348 (6.8%) |
| 65 to 69 Years | 3,403 (4.1%) | 3,823 (4.9%) |
| 70 to 74 Years | 2,611 (3.2%) | 2,815 (3.6%) |
| 75 to 79 Years | 1,443 (1.8%) | 2,192 (2.8%) |
| 80 to 84 Years | 999 (1.2%) | 1,155 (1.5%) |
| 85 Years and over | 838 (1.0%) | 1,952 (2.5%) |
| Total | 82,187 (100.0%) | 78,415 (100.0%) |
Families and Households in Hayward
Median Family Size in Hayward
The median family size in Hayward is 3.63 persons per family, with married-couple families (25,164 | 69.5%) accounting for the largest median family size of 3.69 persons per family. On the other hand, single male/father families (3,408 | 9.4%) represent the smallest median family size with 3.32 persons per family.
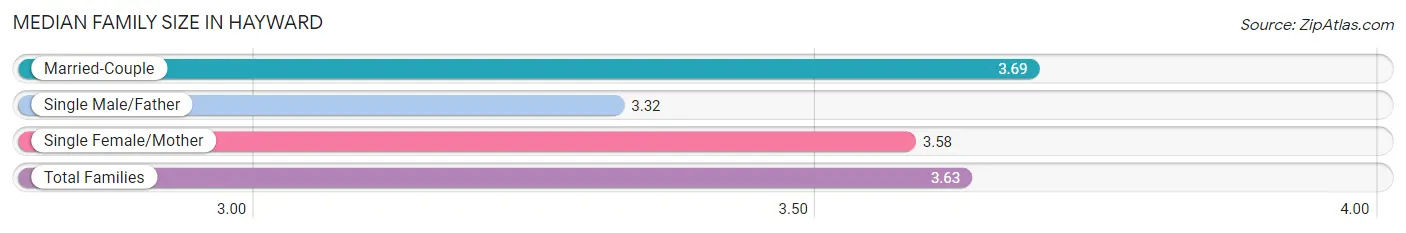
| Family Type | # Families | Family Size |
| Married-Couple | 25,164 (69.5%) | 3.69 |
| Single Male/Father | 3,408 (9.4%) | 3.32 |
| Single Female/Mother | 7,615 (21.0%) | 3.58 |
| Total Families | 36,187 (100.0%) | 3.63 |
Median Household Size in Hayward
The median household size in Hayward is 3.17 persons per household, with single female/mother households (7,615 | 15.4%) accounting for the largest median household size of 3.85 persons per household. non-family households (13,355 | 27.0%) represent the smallest median household size with 1.51 persons per household.
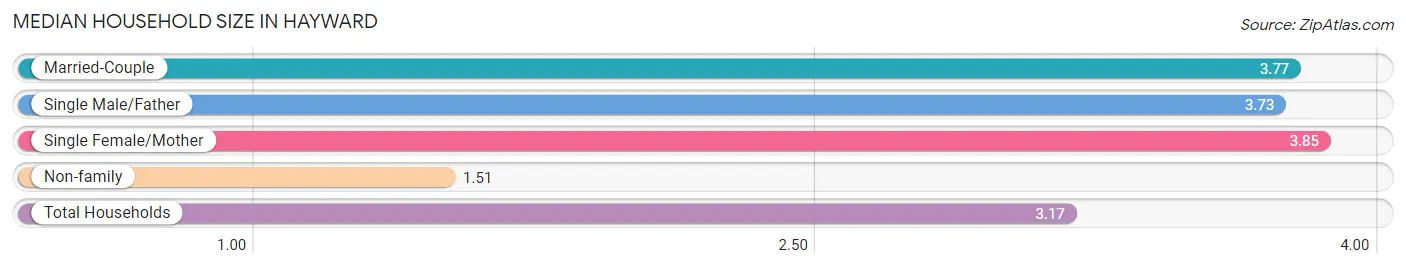
| Household Type | # Households | Household Size |
| Married-Couple | 25,164 (50.8%) | 3.77 |
| Single Male/Father | 3,408 (6.9%) | 3.73 |
| Single Female/Mother | 7,615 (15.4%) | 3.85 |
| Non-family | 13,355 (27.0%) | 1.51 |
| Total Households | 49,542 (100.0%) | 3.17 |
Household Size by Marriage Status in Hayward
Out of a total of 49,542 households in Hayward, 36,187 (73.0%) are family households, while 13,355 (27.0%) are nonfamily households. The most numerous type of family households are 2-person households, comprising 10,784, and the most common type of nonfamily households are 1-person households, comprising 9,335.
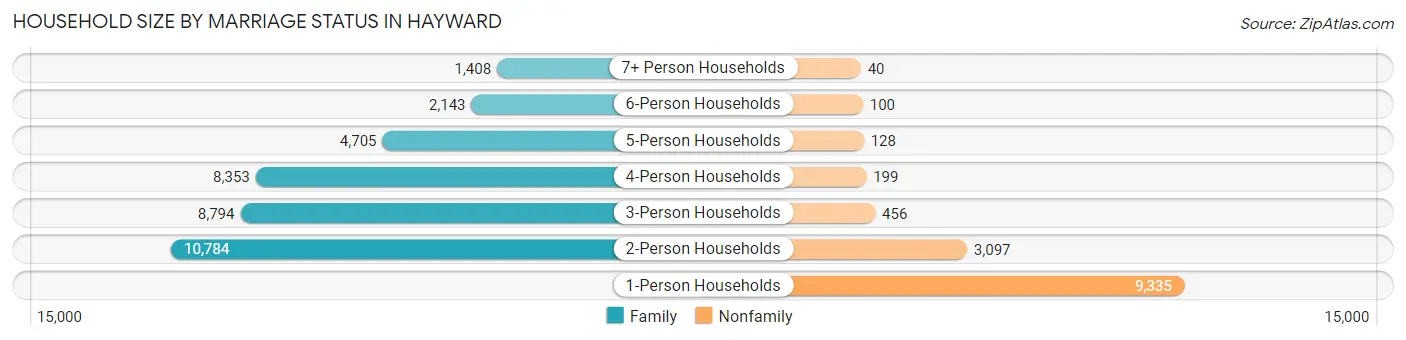
| Household Size | Family Households | Nonfamily Households |
| 1-Person Households | - | 9,335 (18.8%) |
| 2-Person Households | 10,784 (21.8%) | 3,097 (6.2%) |
| 3-Person Households | 8,794 (17.7%) | 456 (0.9%) |
| 4-Person Households | 8,353 (16.9%) | 199 (0.4%) |
| 5-Person Households | 4,705 (9.5%) | 128 (0.3%) |
| 6-Person Households | 2,143 (4.3%) | 100 (0.2%) |
| 7+ Person Households | 1,408 (2.8%) | 40 (0.1%) |
| Total | 36,187 (73.0%) | 13,355 (27.0%) |
Female Fertility in Hayward
Fertility by Age in Hayward
Average fertility rate in Hayward is 49.0 births per 1,000 women. Women in the age bracket of 20 to 34 years have the highest fertility rate with 77.0 births per 1,000 women. Women in the age bracket of 20 to 34 years acount for 69.9% of all women with births.
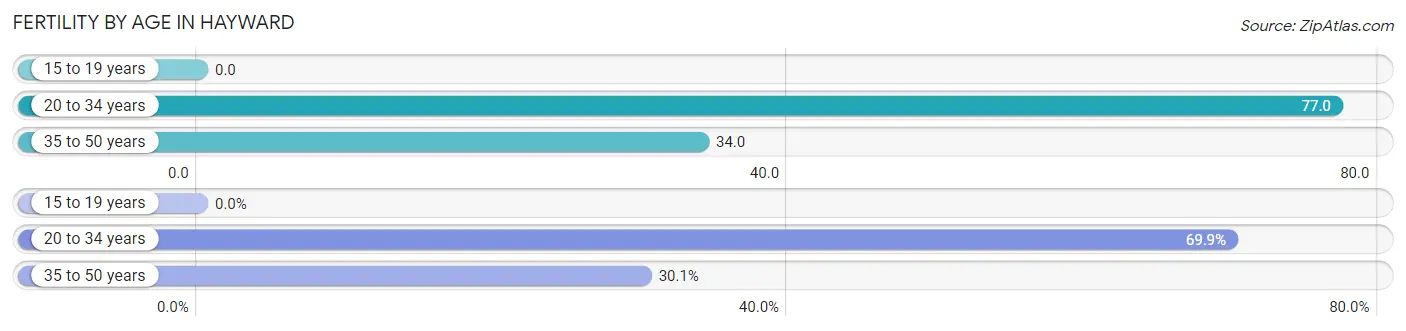
| Age Bracket | Women with Births | Births / 1,000 Women |
| 15 to 19 years | 0 (0.0%) | 0.0 |
| 20 to 34 years | 1,339 (69.9%) | 77.0 |
| 35 to 50 years | 577 (30.1%) | 34.0 |
| Total | 1,916 (100.0%) | 49.0 |
Fertility by Age by Marriage Status in Hayward
81.7% of women with births (1,916) in Hayward are married. The highest percentage of unmarried women with births falls into 20 to 34 years age bracket with 19.6% of them unmarried at the time of birth, while the lowest percentage of unmarried women with births belong to 35 to 50 years age bracket with 15.2% of them unmarried.
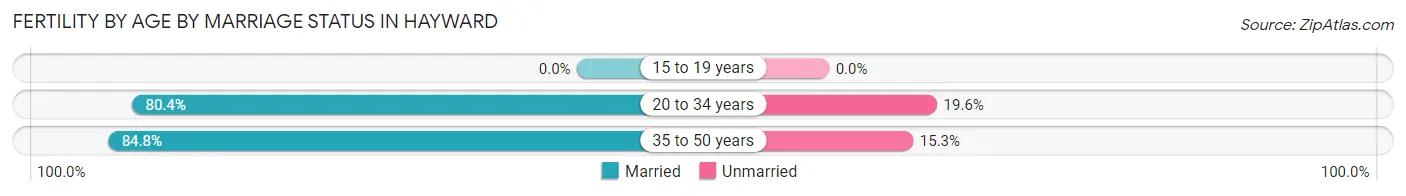
| Age Bracket | Married | Unmarried |
| 15 to 19 years | 0 (0.0%) | 0 (0.0%) |
| 20 to 34 years | 1,077 (80.4%) | 262 (19.6%) |
| 35 to 50 years | 489 (84.8%) | 88 (15.2%) |
| Total | 1,565 (81.7%) | 351 (18.3%) |
Fertility by Education in Hayward
Average fertility rate in Hayward is 49.0 births per 1,000 women. Women with the education attainment of graduate degree have the highest fertility rate of 140.0 births per 1,000 women, while women with the education attainment of less than high school have the lowest fertility at 12.0 births per 1,000 women. Women with the education attainment of college or associate's degree represent 30.0% of all women with births.
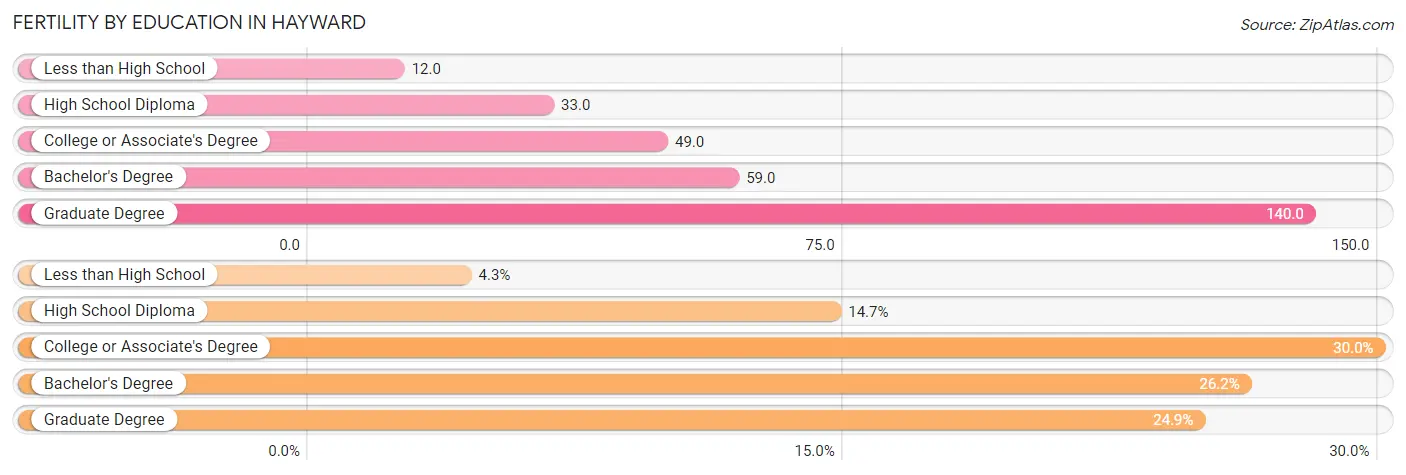
| Educational Attainment | Women with Births | Births / 1,000 Women |
| Less than High School | 82 (4.3%) | 12.0 |
| High School Diploma | 281 (14.7%) | 33.0 |
| College or Associate's Degree | 574 (30.0%) | 49.0 |
| Bachelor's Degree | 502 (26.2%) | 59.0 |
| Graduate Degree | 477 (24.9%) | 140.0 |
| Total | 1,916 (100.0%) | 49.0 |
Fertility by Education by Marriage Status in Hayward
18.3% of women with births in Hayward are unmarried. Women with the educational attainment of graduate degree are most likely to be married with 97.7% of them married at childbirth, while women with the educational attainment of high school diploma are least likely to be married with 53.7% of them unmarried at childbirth.
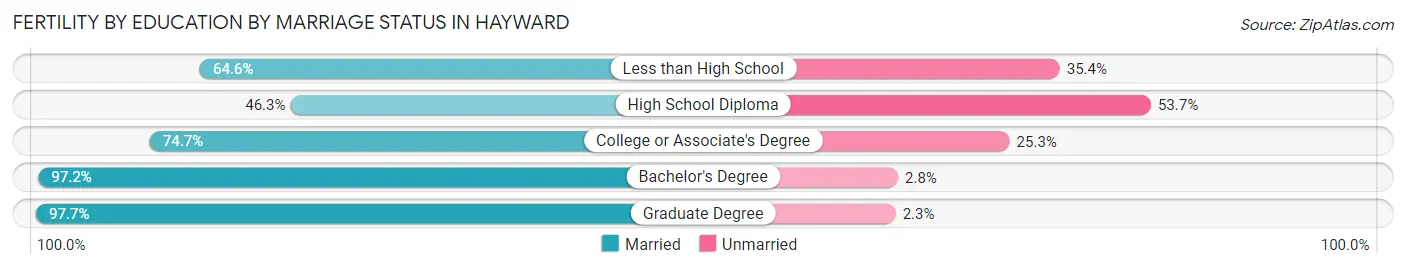
| Educational Attainment | Married | Unmarried |
| Less than High School | 53 (64.6%) | 29 (35.4%) |
| High School Diploma | 130 (46.3%) | 151 (53.7%) |
| College or Associate's Degree | 429 (74.7%) | 145 (25.3%) |
| Bachelor's Degree | 488 (97.2%) | 14 (2.8%) |
| Graduate Degree | 466 (97.7%) | 11 (2.3%) |
| Total | 1,565 (81.7%) | 351 (18.3%) |
Employment Characteristics in Hayward
Employment by Class of Employer in Hayward
Among the 75,514 employed individuals in Hayward, private company employees (55,220 | 73.1%), not-for-profit organizations (6,397 | 8.5%), and local government employees (5,025 | 6.7%) make up the most common classes of employment.
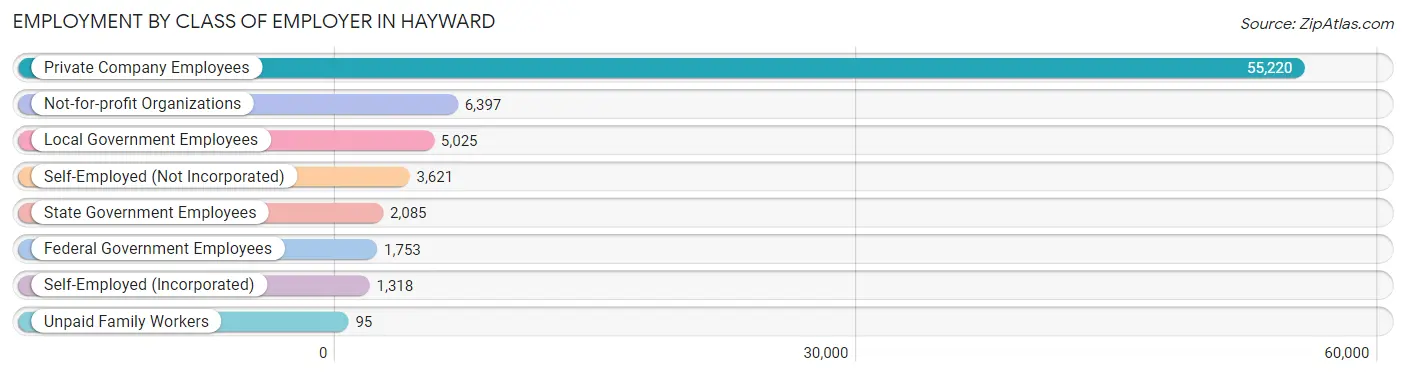
| Employer Class | # Employees | % Employees |
| Private Company Employees | 55,220 | 73.1% |
| Self-Employed (Incorporated) | 1,318 | 1.8% |
| Self-Employed (Not Incorporated) | 3,621 | 4.8% |
| Not-for-profit Organizations | 6,397 | 8.5% |
| Local Government Employees | 5,025 | 6.7% |
| State Government Employees | 2,085 | 2.8% |
| Federal Government Employees | 1,753 | 2.3% |
| Unpaid Family Workers | 95 | 0.1% |
| Total | 75,514 | 100.0% |
Employment Status by Age in Hayward
According to the labor force statistics for Hayward, out of the total population over 16 years of age (132,334), 66.8% or 88,399 individuals are in the labor force, with 5.7% or 5,039 of them unemployed. The age group with the highest labor force participation rate is 30 to 34 years, with 87.2% or 12,790 individuals in the labor force. Within the labor force, the 75 years and over age range has the highest percentage of unemployed individuals, with 18.1% or 79 of them being unemployed.
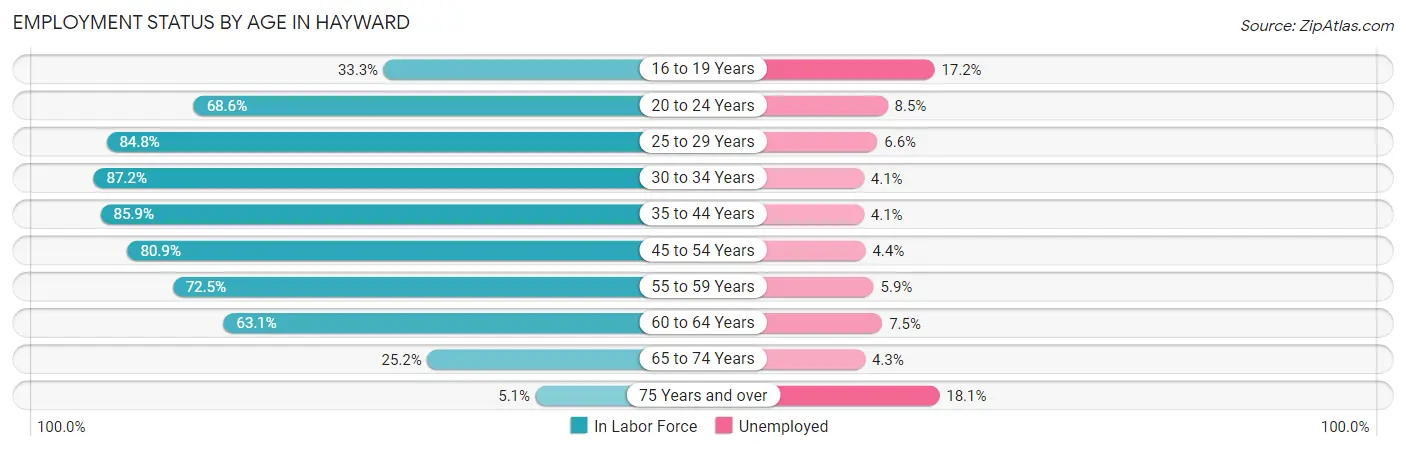
| Age Bracket | In Labor Force | Unemployed |
| 16 to 19 Years | 2,578 (33.3%) | 443 (17.2%) |
| 20 to 24 Years | 7,169 (68.6%) | 609 (8.5%) |
| 25 to 29 Years | 10,826 (84.8%) | 715 (6.6%) |
| 30 to 34 Years | 12,790 (87.2%) | 524 (4.1%) |
| 35 to 44 Years | 19,918 (85.9%) | 817 (4.1%) |
| 45 to 54 Years | 16,893 (80.9%) | 743 (4.4%) |
| 55 to 59 Years | 7,953 (72.5%) | 469 (5.9%) |
| 60 to 64 Years | 6,586 (63.1%) | 494 (7.5%) |
| 65 to 74 Years | 3,188 (25.2%) | 137 (4.3%) |
| 75 Years and over | 438 (5.1%) | 79 (18.1%) |
| Total | 88,399 (66.8%) | 5,039 (5.7%) |
Employment Status by Educational Attainment in Hayward
According to labor force statistics for Hayward, 80.7% of individuals (74,978) out of the total population between 25 and 64 years of age (92,910) are in the labor force, with 5.0% or 3,749 of them being unemployed. The group with the highest labor force participation rate are those with the educational attainment of bachelor's degree or higher, with 88.4% or 26,853 individuals in the labor force. Within the labor force, individuals with college / associate degree education have the highest percentage of unemployment, with 5.6% or 1,153 of them being unemployed.
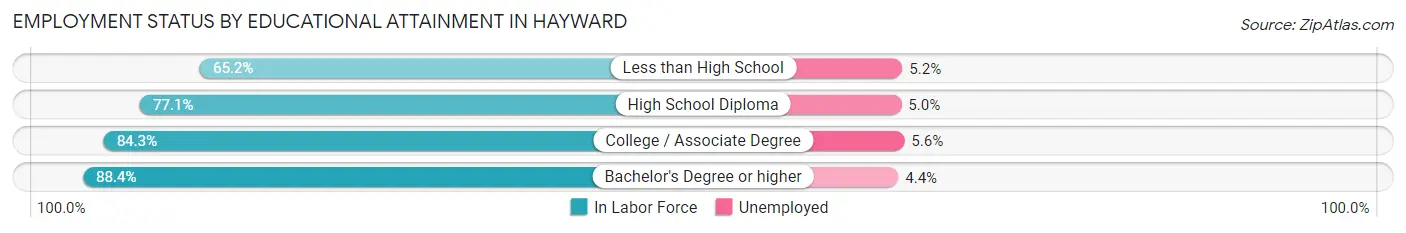
| Educational Attainment | In Labor Force | Unemployed |
| Less than High School | 9,950 (65.2%) | 794 (5.2%) |
| High School Diploma | 17,613 (77.1%) | 1,142 (5.0%) |
| College / Associate Degree | 20,593 (84.3%) | 1,368 (5.6%) |
| Bachelor's Degree or higher | 26,853 (88.4%) | 1,337 (4.4%) |
| Total | 74,978 (80.7%) | 4,646 (5.0%) |
Employment Occupations by Sex in Hayward
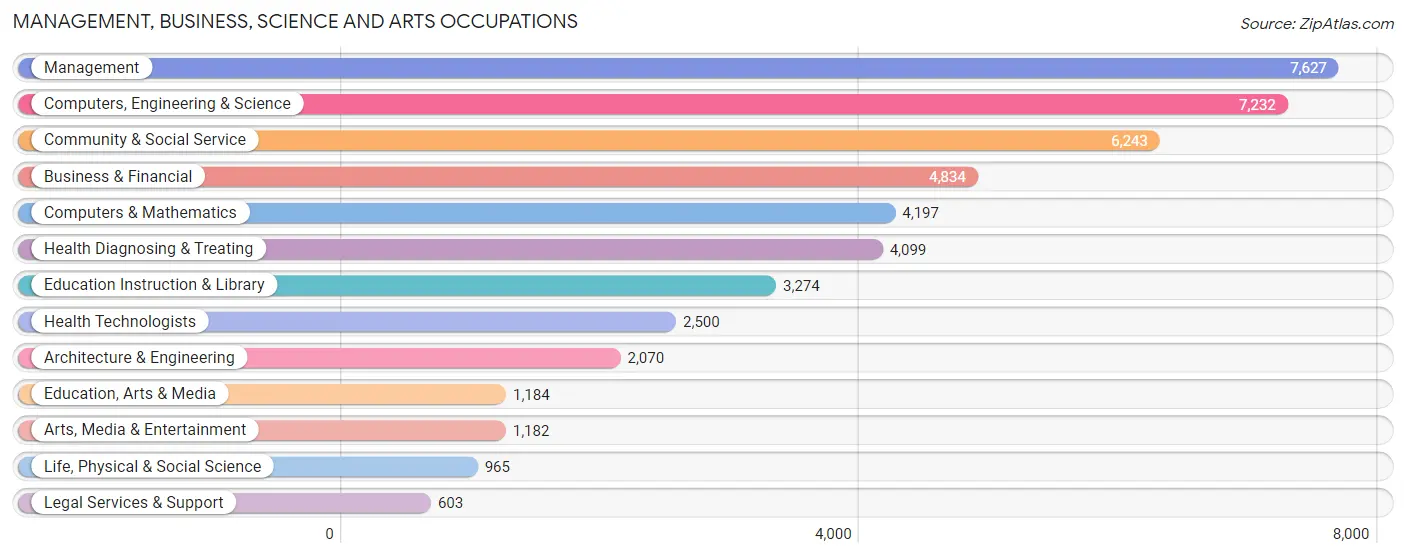
Management, Business, Science and Arts Occupations
The most common Management, Business, Science and Arts occupations in Hayward are Management (7,627 | 9.2%), Computers, Engineering & Science (7,232 | 8.7%), Community & Social Service (6,243 | 7.5%), Business & Financial (4,834 | 5.8%), and Computers & Mathematics (4,197 | 5.1%).
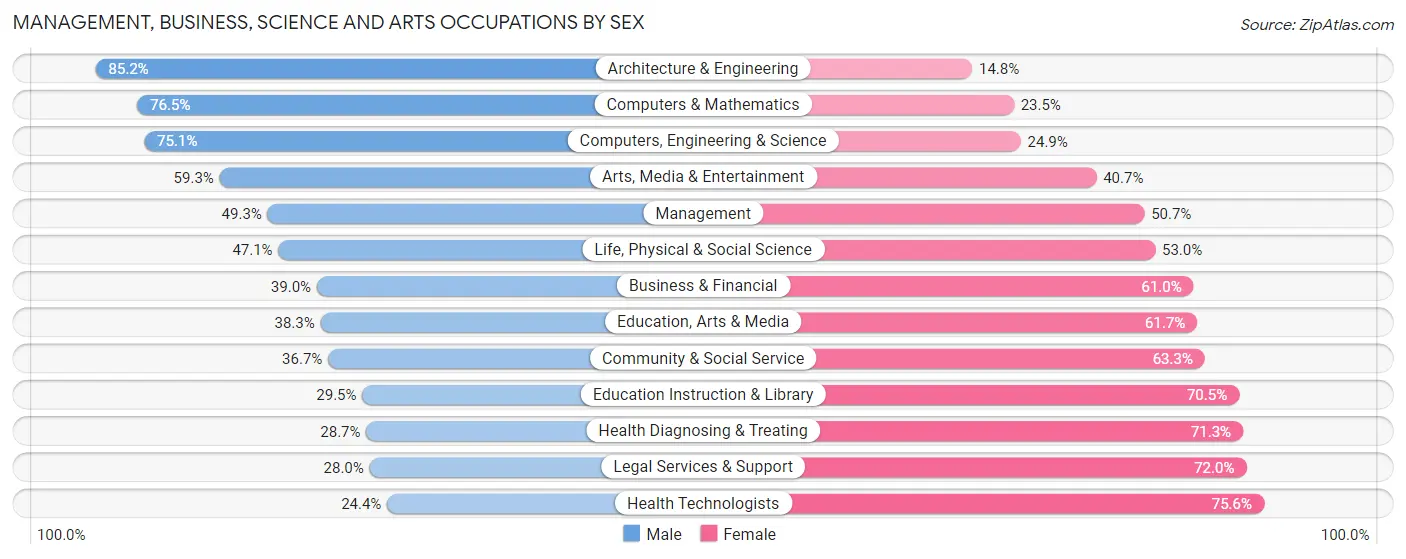
Management, Business, Science and Arts Occupations by Sex
Within the Management, Business, Science and Arts occupations in Hayward, the most male-oriented occupations are Architecture & Engineering (85.2%), Computers & Mathematics (76.5%), and Computers, Engineering & Science (75.1%), while the most female-oriented occupations are Health Technologists (75.6%), Legal Services & Support (72.0%), and Health Diagnosing & Treating (71.3%).
| Occupation | Male | Female |
| Management | 3,760 (49.3%) | 3,867 (50.7%) |
| Business & Financial | 1,886 (39.0%) | 2,948 (61.0%) |
| Computers, Engineering & Science | 5,430 (75.1%) | 1,802 (24.9%) |
| Computers & Mathematics | 3,212 (76.5%) | 985 (23.5%) |
| Architecture & Engineering | 1,764 (85.2%) | 306 (14.8%) |
| Life, Physical & Social Science | 454 (47.0%) | 511 (52.9%) |
| Community & Social Service | 2,290 (36.7%) | 3,953 (63.3%) |
| Education, Arts & Media | 453 (38.3%) | 731 (61.7%) |
| Legal Services & Support | 169 (28.0%) | 434 (72.0%) |
| Education Instruction & Library | 967 (29.5%) | 2,307 (70.5%) |
| Arts, Media & Entertainment | 701 (59.3%) | 481 (40.7%) |
| Health Diagnosing & Treating | 1,177 (28.7%) | 2,922 (71.3%) |
| Health Technologists | 609 (24.4%) | 1,891 (75.6%) |
| Total (Category) | 14,543 (48.4%) | 15,492 (51.6%) |
| Total (Overall) | 45,103 (54.2%) | 38,063 (45.8%) |
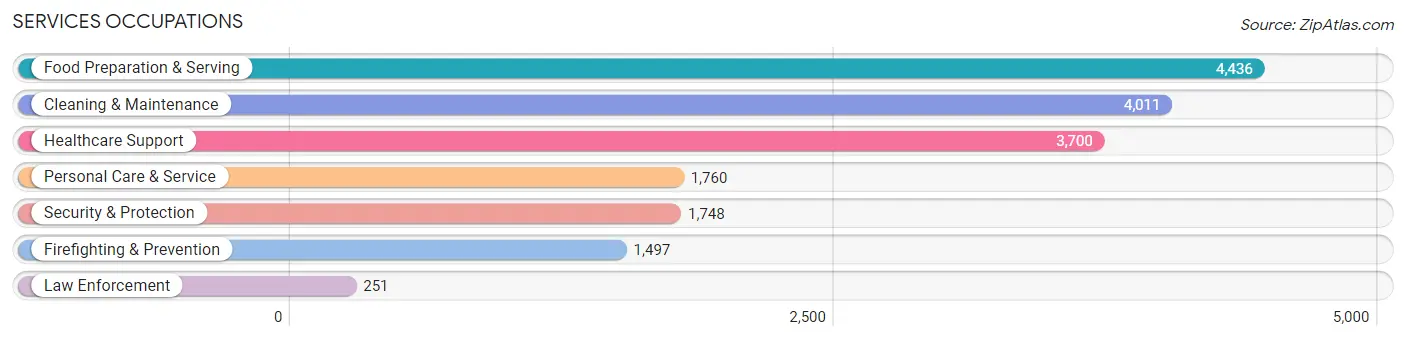
Services Occupations
The most common Services occupations in Hayward are Food Preparation & Serving (4,436 | 5.3%), Cleaning & Maintenance (4,011 | 4.8%), Healthcare Support (3,700 | 4.4%), Personal Care & Service (1,760 | 2.1%), and Security & Protection (1,748 | 2.1%).
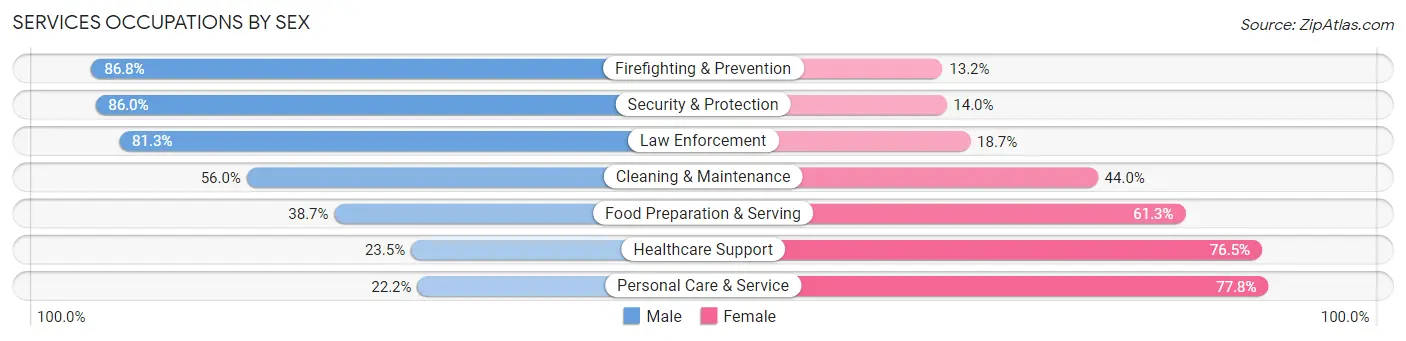
Services Occupations by Sex
Within the Services occupations in Hayward, the most male-oriented occupations are Firefighting & Prevention (86.8%), Security & Protection (86.0%), and Law Enforcement (81.3%), while the most female-oriented occupations are Personal Care & Service (77.8%), Healthcare Support (76.5%), and Food Preparation & Serving (61.3%).
| Occupation | Male | Female |
| Healthcare Support | 869 (23.5%) | 2,831 (76.5%) |
| Security & Protection | 1,503 (86.0%) | 245 (14.0%) |
| Firefighting & Prevention | 1,299 (86.8%) | 198 (13.2%) |
| Law Enforcement | 204 (81.3%) | 47 (18.7%) |
| Food Preparation & Serving | 1,715 (38.7%) | 2,721 (61.3%) |
| Cleaning & Maintenance | 2,247 (56.0%) | 1,764 (44.0%) |
| Personal Care & Service | 391 (22.2%) | 1,369 (77.8%) |
| Total (Category) | 6,725 (43.0%) | 8,930 (57.0%) |
| Total (Overall) | 45,103 (54.2%) | 38,063 (45.8%) |
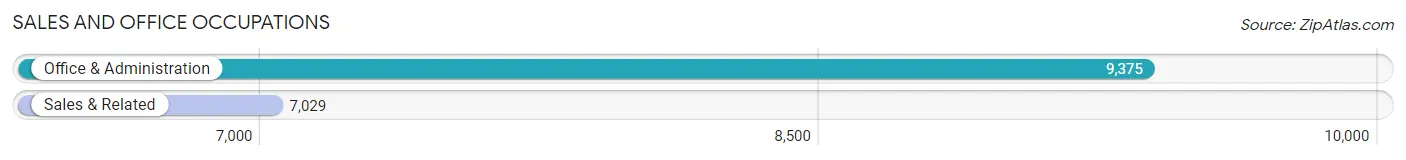
Sales and Office Occupations
The most common Sales and Office occupations in Hayward are Office & Administration (9,375 | 11.3%), and Sales & Related (7,029 | 8.5%).
Sales and Office Occupations by Sex
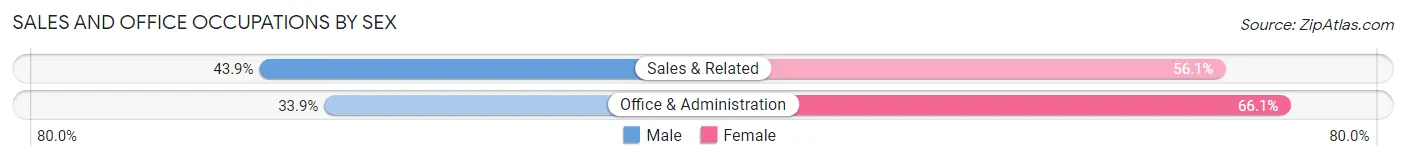
| Occupation | Male | Female |
| Sales & Related | 3,084 (43.9%) | 3,945 (56.1%) |
| Office & Administration | 3,179 (33.9%) | 6,196 (66.1%) |
| Total (Category) | 6,263 (38.2%) | 10,141 (61.8%) |
| Total (Overall) | 45,103 (54.2%) | 38,063 (45.8%) |
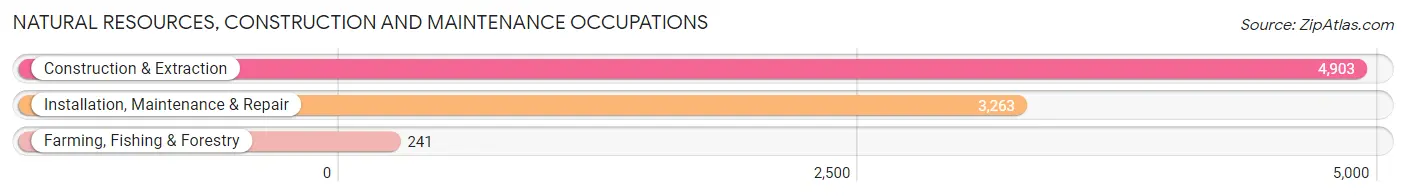
Natural Resources, Construction and Maintenance Occupations
The most common Natural Resources, Construction and Maintenance occupations in Hayward are Construction & Extraction (4,903 | 5.9%), Installation, Maintenance & Repair (3,263 | 3.9%), and Farming, Fishing & Forestry (241 | 0.3%).
Natural Resources, Construction and Maintenance Occupations by Sex
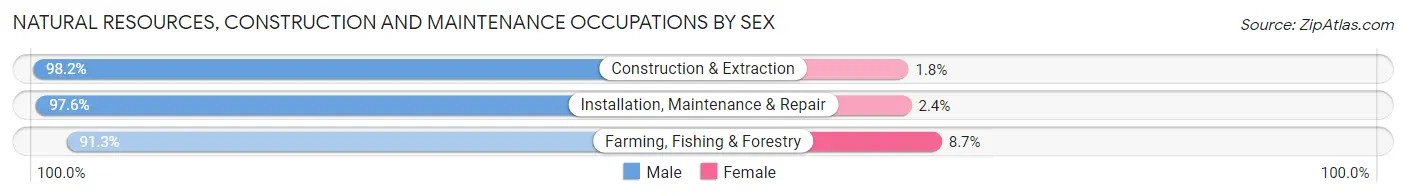
| Occupation | Male | Female |
| Farming, Fishing & Forestry | 220 (91.3%) | 21 (8.7%) |
| Construction & Extraction | 4,815 (98.2%) | 88 (1.8%) |
| Installation, Maintenance & Repair | 3,184 (97.6%) | 79 (2.4%) |
| Total (Category) | 8,219 (97.8%) | 188 (2.2%) |
| Total (Overall) | 45,103 (54.2%) | 38,063 (45.8%) |
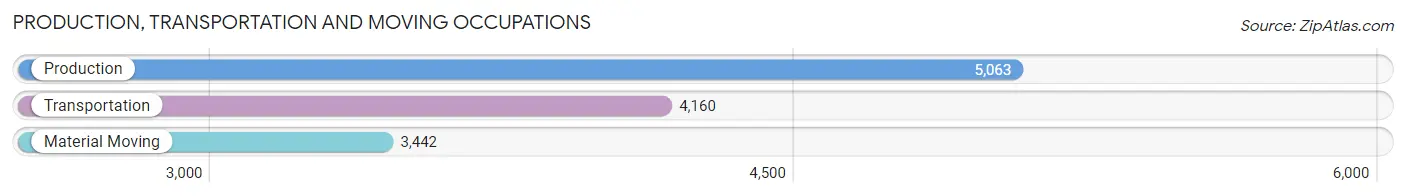
Production, Transportation and Moving Occupations
The most common Production, Transportation and Moving occupations in Hayward are Production (5,063 | 6.1%), Transportation (4,160 | 5.0%), and Material Moving (3,442 | 4.1%).
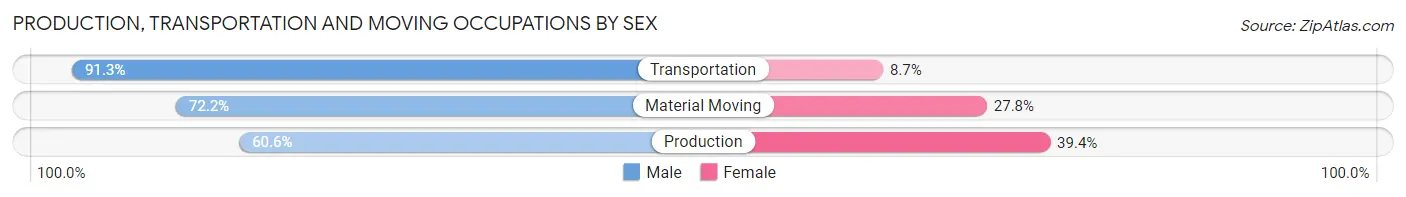
Production, Transportation and Moving Occupations by Sex
| Occupation | Male | Female |
| Production | 3,069 (60.6%) | 1,994 (39.4%) |
| Transportation | 3,798 (91.3%) | 362 (8.7%) |
| Material Moving | 2,486 (72.2%) | 956 (27.8%) |
| Total (Category) | 9,353 (73.9%) | 3,312 (26.2%) |
| Total (Overall) | 45,103 (54.2%) | 38,063 (45.8%) |
Employment Industries by Sex in Hayward
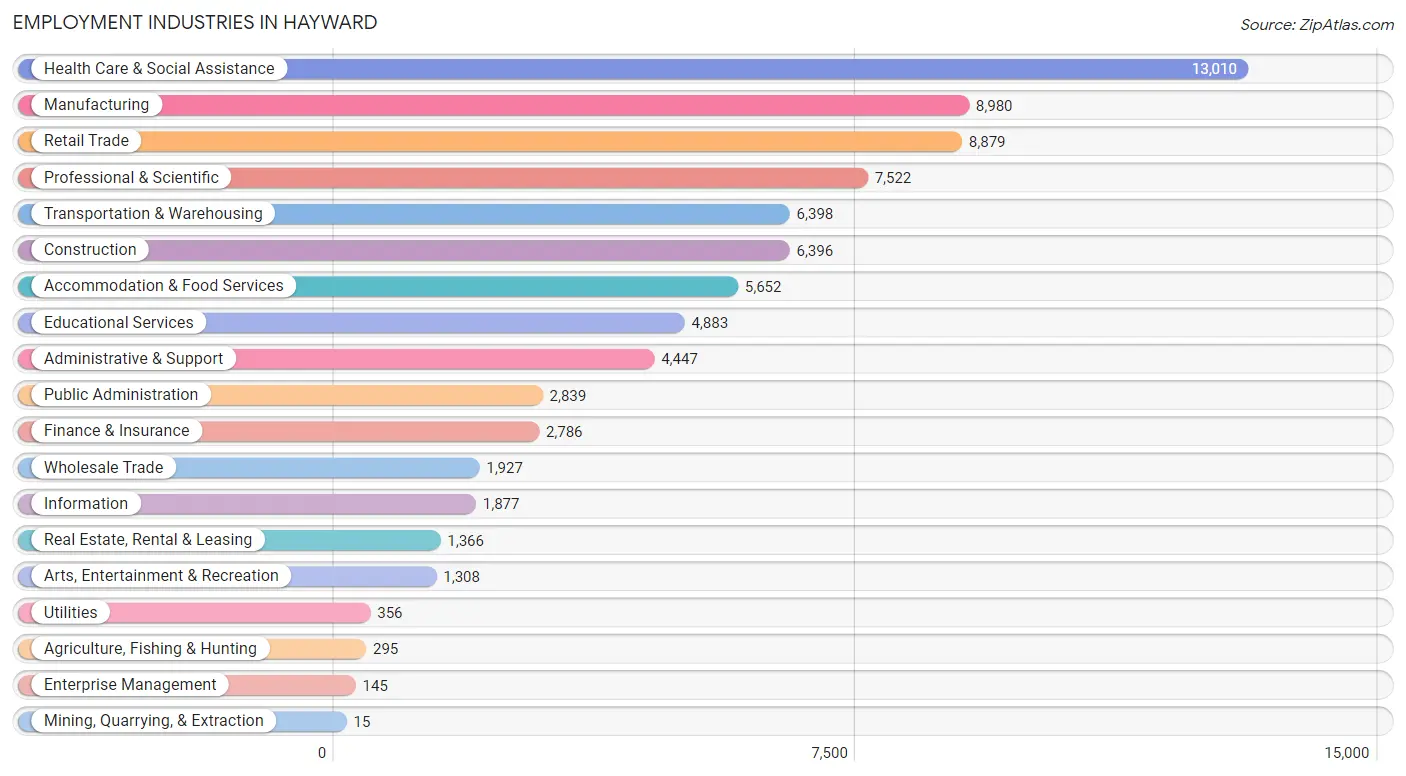
Employment Industries in Hayward
The major employment industries in Hayward include Health Care & Social Assistance (13,010 | 15.6%), Manufacturing (8,980 | 10.8%), Retail Trade (8,879 | 10.7%), Professional & Scientific (7,522 | 9.0%), and Transportation & Warehousing (6,398 | 7.7%).
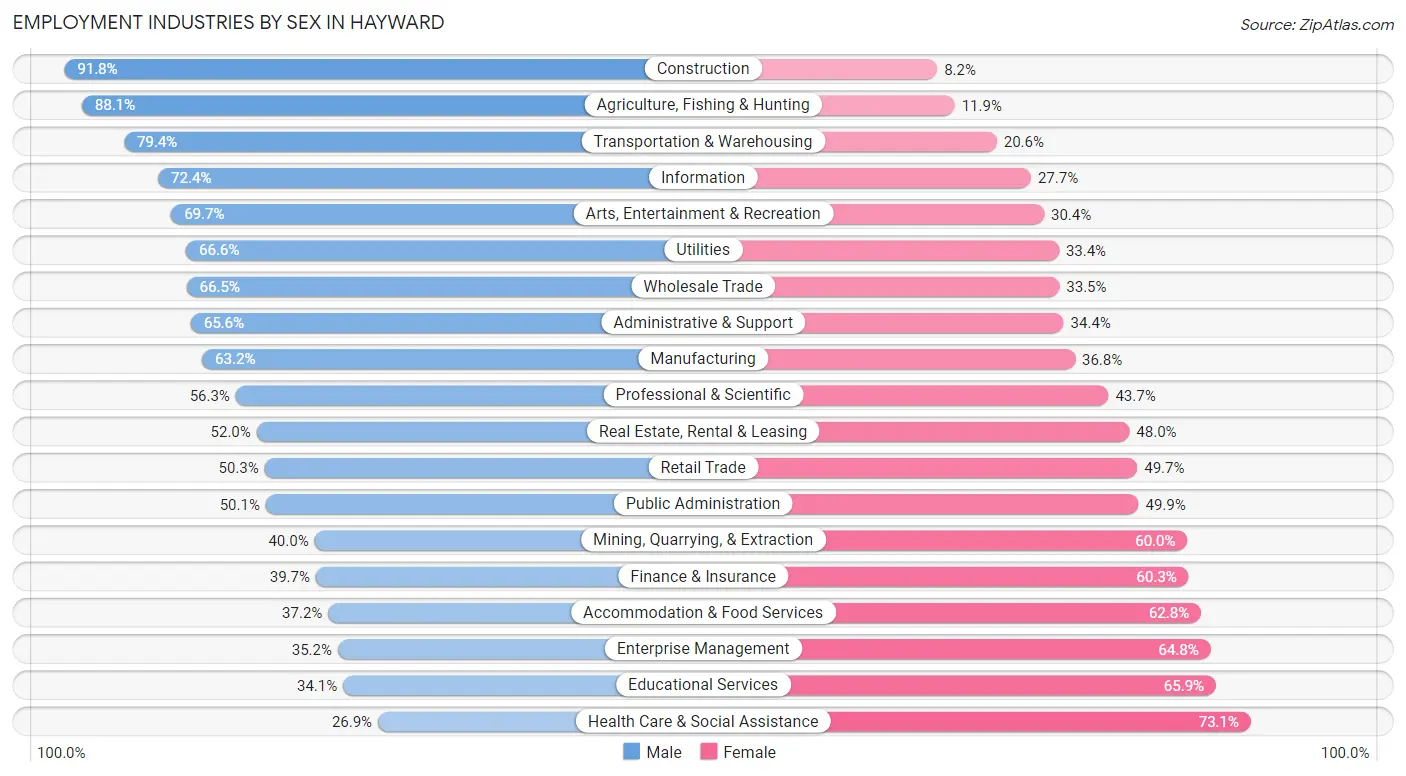
Employment Industries by Sex in Hayward
The Hayward industries that see more men than women are Construction (91.8%), Agriculture, Fishing & Hunting (88.1%), and Transportation & Warehousing (79.4%), whereas the industries that tend to have a higher number of women are Health Care & Social Assistance (73.1%), Educational Services (65.9%), and Enterprise Management (64.8%).
| Industry | Male | Female |
| Agriculture, Fishing & Hunting | 260 (88.1%) | 35 (11.9%) |
| Mining, Quarrying, & Extraction | 6 (40.0%) | 9 (60.0%) |
| Construction | 5,869 (91.8%) | 527 (8.2%) |
| Manufacturing | 5,679 (63.2%) | 3,301 (36.8%) |
| Wholesale Trade | 1,281 (66.5%) | 646 (33.5%) |
| Retail Trade | 4,470 (50.3%) | 4,409 (49.7%) |
| Transportation & Warehousing | 5,082 (79.4%) | 1,316 (20.6%) |
| Utilities | 237 (66.6%) | 119 (33.4%) |
| Information | 1,358 (72.4%) | 519 (27.7%) |
| Finance & Insurance | 1,107 (39.7%) | 1,679 (60.3%) |
| Real Estate, Rental & Leasing | 710 (52.0%) | 656 (48.0%) |
| Professional & Scientific | 4,236 (56.3%) | 3,286 (43.7%) |
| Enterprise Management | 51 (35.2%) | 94 (64.8%) |
| Administrative & Support | 2,917 (65.6%) | 1,530 (34.4%) |
| Educational Services | 1,664 (34.1%) | 3,219 (65.9%) |
| Health Care & Social Assistance | 3,494 (26.9%) | 9,516 (73.1%) |
| Arts, Entertainment & Recreation | 911 (69.7%) | 397 (30.3%) |
| Accommodation & Food Services | 2,101 (37.2%) | 3,551 (62.8%) |
| Public Administration | 1,422 (50.1%) | 1,417 (49.9%) |
| Total | 45,103 (54.2%) | 38,063 (45.8%) |
Education in Hayward
School Enrollment in Hayward
The most common levels of schooling among the 36,962 students in Hayward are college / undergraduate (10,231 | 27.7%), high school (7,667 | 20.7%), and middle school (7,203 | 19.5%).
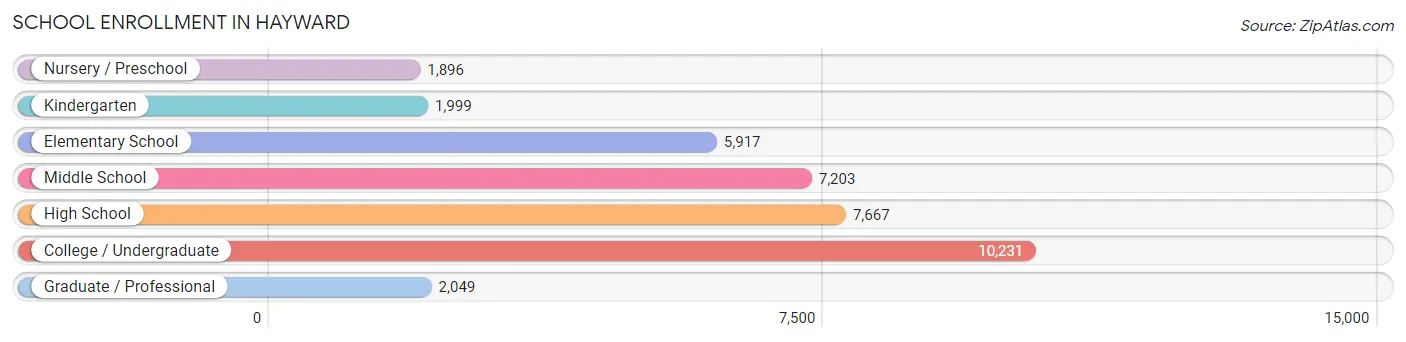
| School Level | # Students | % Students |
| Nursery / Preschool | 1,896 | 5.1% |
| Kindergarten | 1,999 | 5.4% |
| Elementary School | 5,917 | 16.0% |
| Middle School | 7,203 | 19.5% |
| High School | 7,667 | 20.7% |
| College / Undergraduate | 10,231 | 27.7% |
| Graduate / Professional | 2,049 | 5.5% |
| Total | 36,962 | 100.0% |
School Enrollment by Age by Funding Source in Hayward
Out of a total of 36,962 students who are enrolled in schools in Hayward, 4,546 (12.3%) attend a private institution, while the remaining 32,416 (87.7%) are enrolled in public schools. The age group of 3 to 4 year olds has the highest likelihood of being enrolled in private schools, with 709 (48.5% in the age bracket) enrolled. Conversely, the age group of 20 to 24 year olds has the lowest likelihood of being enrolled in a private school, with 4,500 (92.9% in the age bracket) attending a public institution.
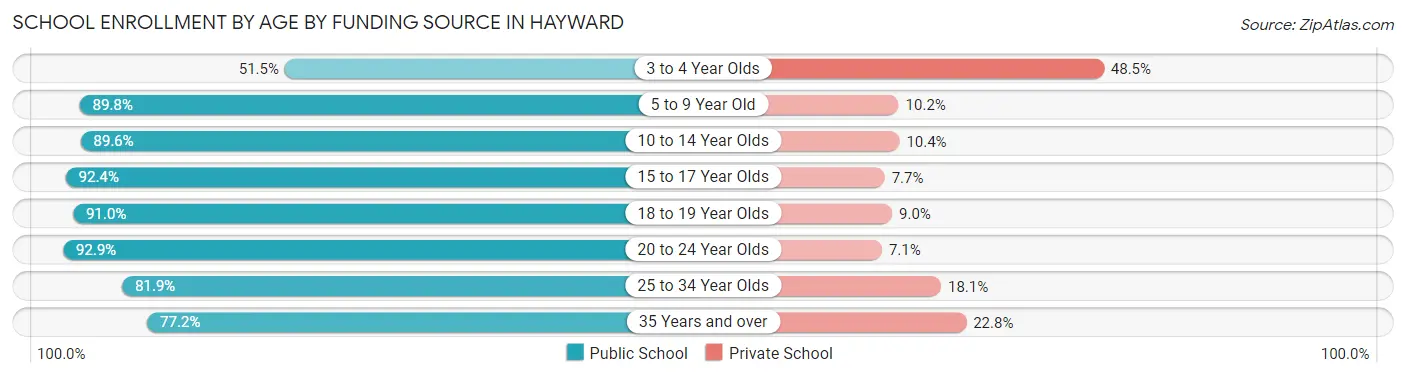
| Age Bracket | Public School | Private School |
| 3 to 4 Year Olds | 754 (51.5%) | 709 (48.5%) |
| 5 to 9 Year Old | 6,914 (89.8%) | 789 (10.2%) |
| 10 to 14 Year Olds | 8,196 (89.6%) | 950 (10.4%) |
| 15 to 17 Year Olds | 5,057 (92.3%) | 419 (7.6%) |
| 18 to 19 Year Olds | 2,542 (91.0%) | 252 (9.0%) |
| 20 to 24 Year Olds | 4,500 (92.9%) | 346 (7.1%) |
| 25 to 34 Year Olds | 2,902 (81.9%) | 643 (18.1%) |
| 35 Years and over | 1,535 (77.2%) | 454 (22.8%) |
| Total | 32,416 (87.7%) | 4,546 (12.3%) |
Educational Attainment by Field of Study in Hayward
Business (7,736 | 20.3%), science & technology (4,468 | 11.7%), engineering (4,307 | 11.3%), social sciences (3,476 | 9.1%), and computers & mathematics (2,908 | 7.6%) are the most common fields of study among 38,081 individuals in Hayward who have obtained a bachelor's degree or higher.
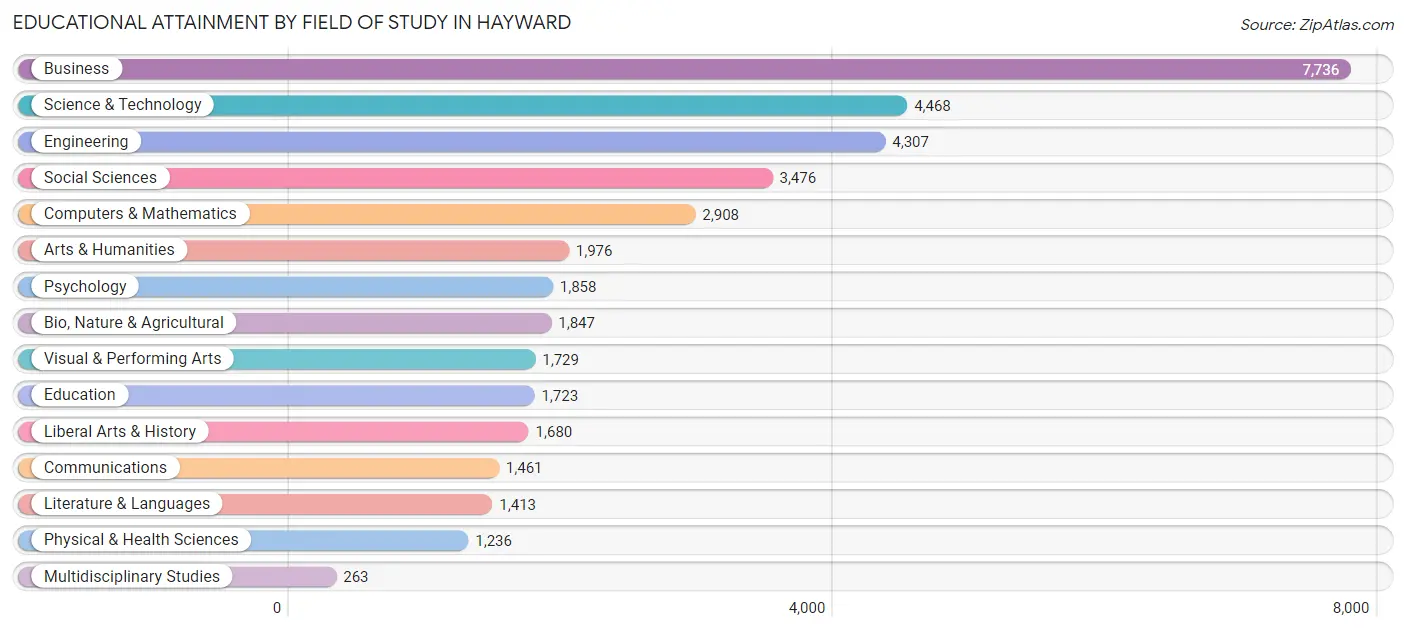
| Field of Study | # Graduates | % Graduates |
| Computers & Mathematics | 2,908 | 7.6% |
| Bio, Nature & Agricultural | 1,847 | 4.9% |
| Physical & Health Sciences | 1,236 | 3.3% |
| Psychology | 1,858 | 4.9% |
| Social Sciences | 3,476 | 9.1% |
| Engineering | 4,307 | 11.3% |
| Multidisciplinary Studies | 263 | 0.7% |
| Science & Technology | 4,468 | 11.7% |
| Business | 7,736 | 20.3% |
| Education | 1,723 | 4.5% |
| Literature & Languages | 1,413 | 3.7% |
| Liberal Arts & History | 1,680 | 4.4% |
| Visual & Performing Arts | 1,729 | 4.5% |
| Communications | 1,461 | 3.8% |
| Arts & Humanities | 1,976 | 5.2% |
| Total | 38,081 | 100.0% |
Transportation & Commute in Hayward
Vehicle Availability by Sex in Hayward
The most prevalent vehicle ownership categories in Hayward are males with 2 vehicles (14,515, accounting for 35.5%) and females with 2 vehicles (11,634, making up 42.7%).
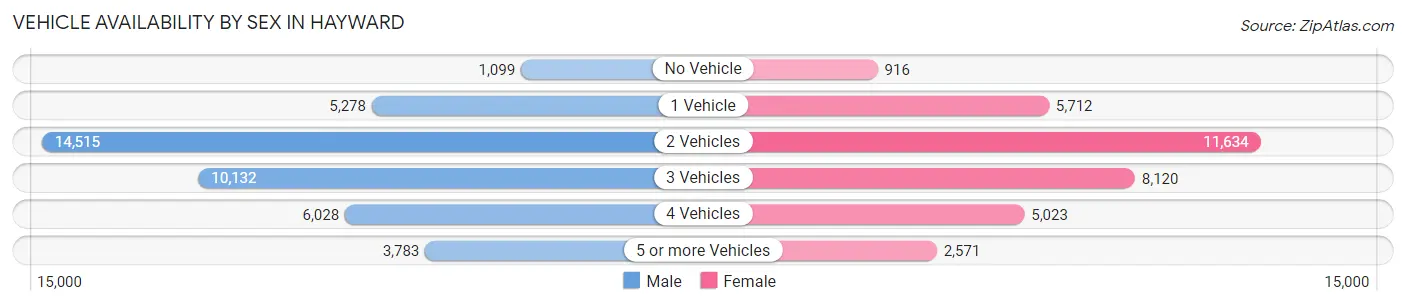
| Vehicles Available | Male | Female |
| No Vehicle | 1,099 (2.7%) | 916 (2.7%) |
| 1 Vehicle | 5,278 (12.9%) | 5,712 (16.8%) |
| 2 Vehicles | 14,515 (35.5%) | 11,634 (34.2%) |
| 3 Vehicles | 10,132 (24.8%) | 8,120 (23.9%) |
| 4 Vehicles | 6,028 (14.8%) | 5,023 (14.8%) |
| 5 or more Vehicles | 3,783 (9.3%) | 2,571 (7.6%) |
| Total | 40,835 (100.0%) | 33,976 (100.0%) |
Commute Time in Hayward
The most frequently occuring commute durations in Hayward are 30 to 34 minutes (11,325 commuters, 16.9%), 15 to 19 minutes (9,177 commuters, 13.7%), and 45 to 59 minutes (8,717 commuters, 13.0%).
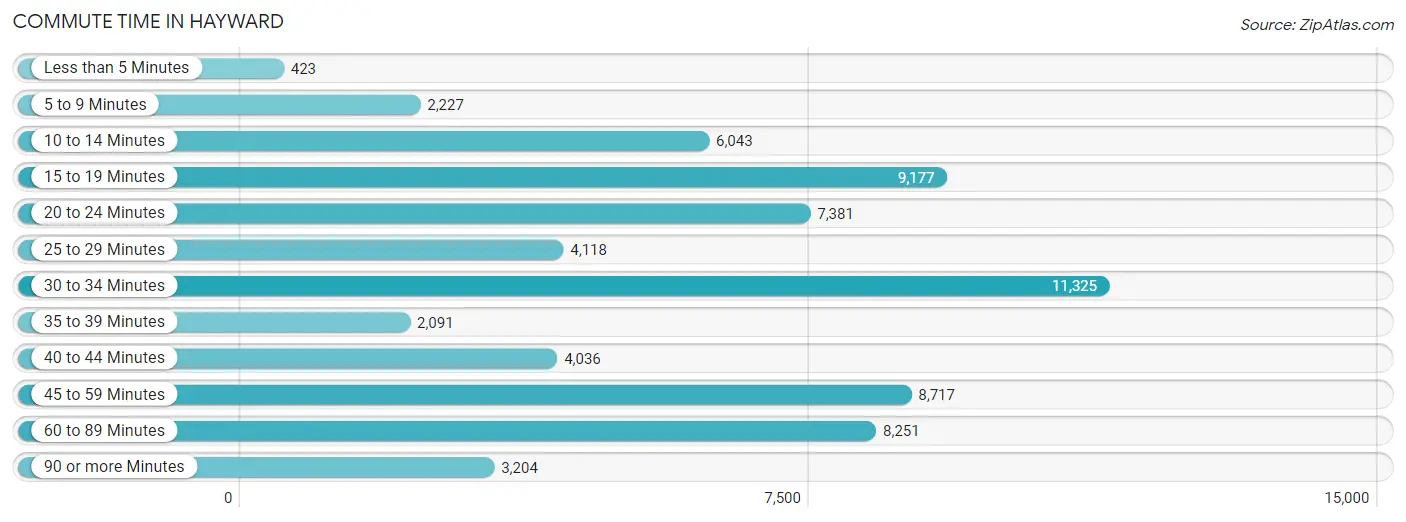
| Commute Time | # Commuters | % Commuters |
| Less than 5 Minutes | 423 | 0.6% |
| 5 to 9 Minutes | 2,227 | 3.3% |
| 10 to 14 Minutes | 6,043 | 9.0% |
| 15 to 19 Minutes | 9,177 | 13.7% |
| 20 to 24 Minutes | 7,381 | 11.0% |
| 25 to 29 Minutes | 4,118 | 6.1% |
| 30 to 34 Minutes | 11,325 | 16.9% |
| 35 to 39 Minutes | 2,091 | 3.1% |
| 40 to 44 Minutes | 4,036 | 6.0% |
| 45 to 59 Minutes | 8,717 | 13.0% |
| 60 to 89 Minutes | 8,251 | 12.3% |
| 90 or more Minutes | 3,204 | 4.8% |
Commute Time by Sex in Hayward
The most common commute times in Hayward are 30 to 34 minutes (6,616 commuters, 17.8%) for males and 15 to 19 minutes (4,725 commuters, 15.9%) for females.
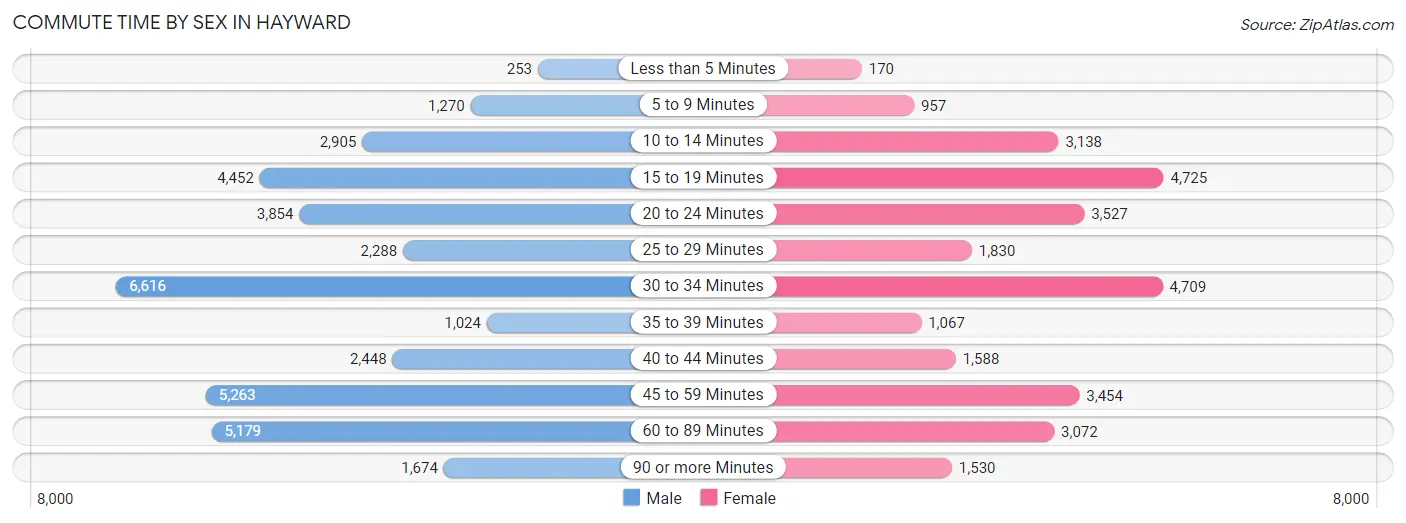
| Commute Time | Male | Female |
| Less than 5 Minutes | 253 (0.7%) | 170 (0.6%) |
| 5 to 9 Minutes | 1,270 (3.4%) | 957 (3.2%) |
| 10 to 14 Minutes | 2,905 (7.8%) | 3,138 (10.5%) |
| 15 to 19 Minutes | 4,452 (12.0%) | 4,725 (15.9%) |
| 20 to 24 Minutes | 3,854 (10.3%) | 3,527 (11.8%) |
| 25 to 29 Minutes | 2,288 (6.1%) | 1,830 (6.1%) |
| 30 to 34 Minutes | 6,616 (17.8%) | 4,709 (15.8%) |
| 35 to 39 Minutes | 1,024 (2.8%) | 1,067 (3.6%) |
| 40 to 44 Minutes | 2,448 (6.6%) | 1,588 (5.3%) |
| 45 to 59 Minutes | 5,263 (14.1%) | 3,454 (11.6%) |
| 60 to 89 Minutes | 5,179 (13.9%) | 3,072 (10.3%) |
| 90 or more Minutes | 1,674 (4.5%) | 1,530 (5.1%) |
Time of Departure to Work by Sex in Hayward
The most frequent times of departure to work in Hayward are 7:00 AM to 7:29 AM (5,775, 15.5%) for males and 7:00 AM to 7:29 AM (4,933, 16.6%) for females.
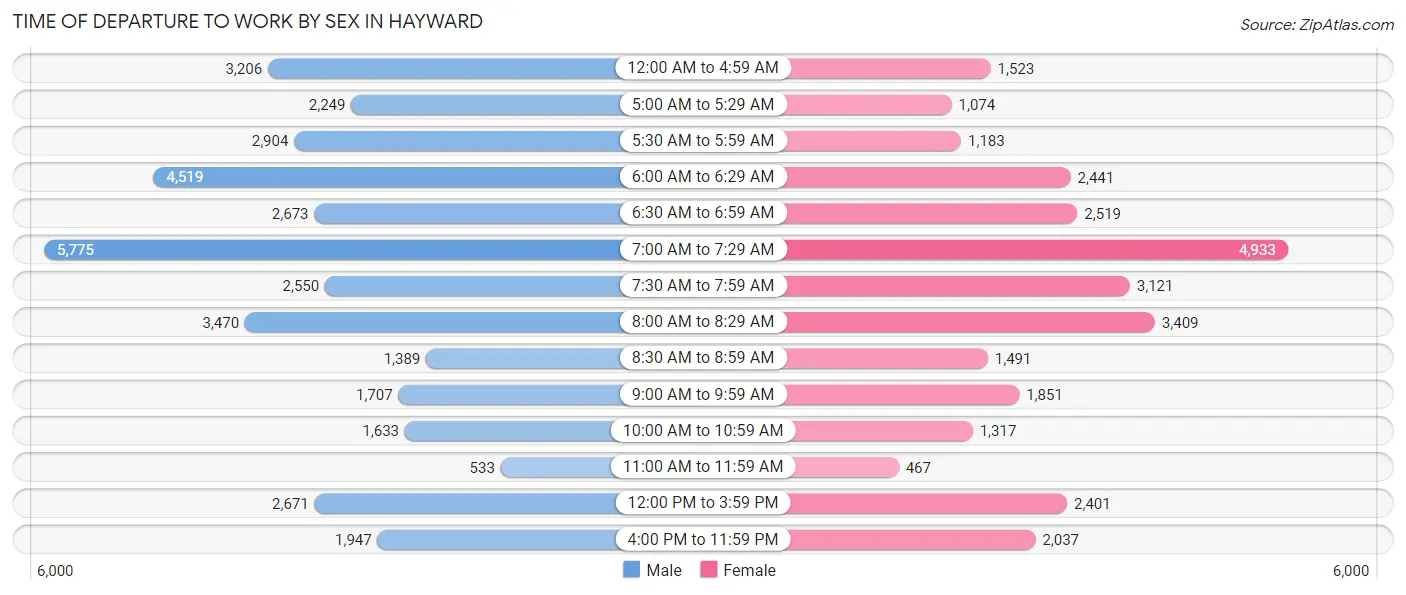
| Time of Departure | Male | Female |
| 12:00 AM to 4:59 AM | 3,206 (8.6%) | 1,523 (5.1%) |
| 5:00 AM to 5:29 AM | 2,249 (6.0%) | 1,074 (3.6%) |
| 5:30 AM to 5:59 AM | 2,904 (7.8%) | 1,183 (4.0%) |
| 6:00 AM to 6:29 AM | 4,519 (12.1%) | 2,441 (8.2%) |
| 6:30 AM to 6:59 AM | 2,673 (7.2%) | 2,519 (8.5%) |
| 7:00 AM to 7:29 AM | 5,775 (15.5%) | 4,933 (16.6%) |
| 7:30 AM to 7:59 AM | 2,550 (6.9%) | 3,121 (10.5%) |
| 8:00 AM to 8:29 AM | 3,470 (9.3%) | 3,409 (11.5%) |
| 8:30 AM to 8:59 AM | 1,389 (3.7%) | 1,491 (5.0%) |
| 9:00 AM to 9:59 AM | 1,707 (4.6%) | 1,851 (6.2%) |
| 10:00 AM to 10:59 AM | 1,633 (4.4%) | 1,317 (4.4%) |
| 11:00 AM to 11:59 AM | 533 (1.4%) | 467 (1.6%) |
| 12:00 PM to 3:59 PM | 2,671 (7.2%) | 2,401 (8.1%) |
| 4:00 PM to 11:59 PM | 1,947 (5.2%) | 2,037 (6.8%) |
| Total | 37,226 (100.0%) | 29,767 (100.0%) |
Housing Occupancy in Hayward
Occupancy by Ownership in Hayward
Of the total 49,542 dwellings in Hayward, owner-occupied units account for 27,993 (56.5%), while renter-occupied units make up 21,549 (43.5%).
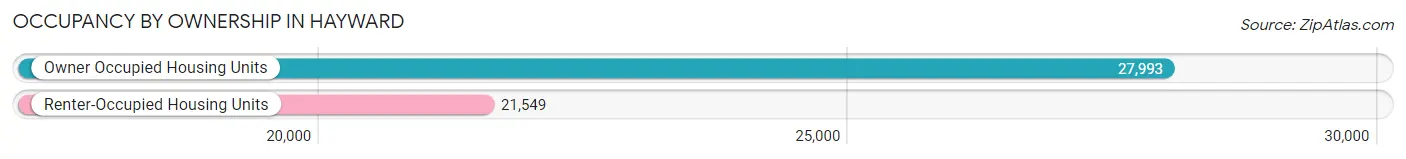
| Occupancy | # Housing Units | % Housing Units |
| Owner Occupied Housing Units | 27,993 | 56.5% |
| Renter-Occupied Housing Units | 21,549 | 43.5% |
| Total Occupied Housing Units | 49,542 | 100.0% |
Occupancy by Household Size in Hayward
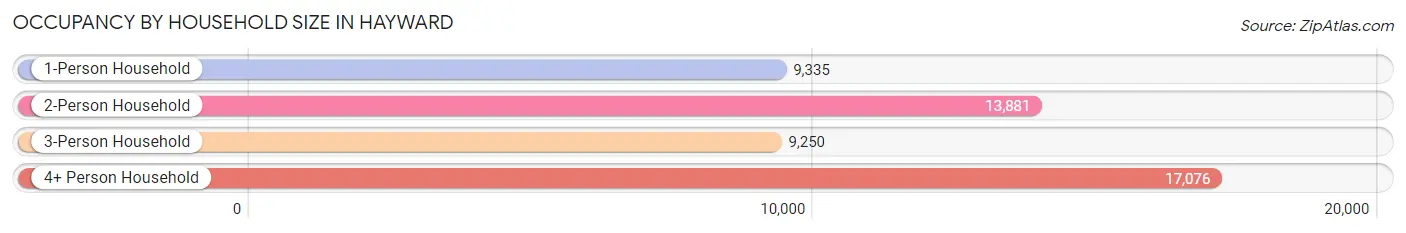
| Household Size | # Housing Units | % Housing Units |
| 1-Person Household | 9,335 | 18.8% |
| 2-Person Household | 13,881 | 28.0% |
| 3-Person Household | 9,250 | 18.7% |
| 4+ Person Household | 17,076 | 34.5% |
| Total Housing Units | 49,542 | 100.0% |
Occupancy by Ownership by Household Size in Hayward
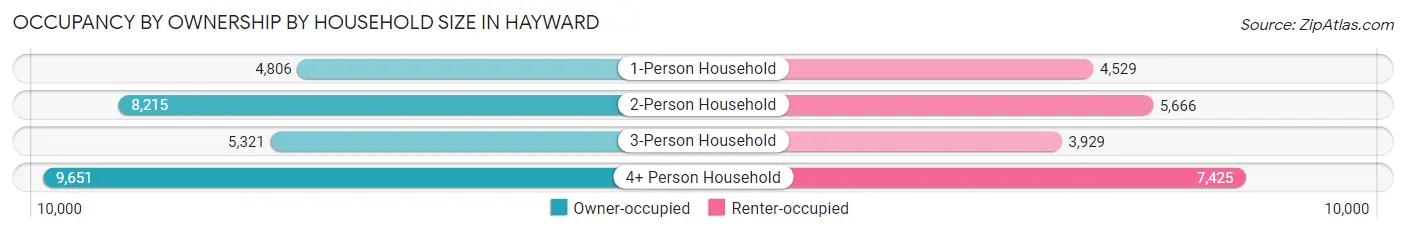
| Household Size | Owner-occupied | Renter-occupied |
| 1-Person Household | 4,806 (51.5%) | 4,529 (48.5%) |
| 2-Person Household | 8,215 (59.2%) | 5,666 (40.8%) |
| 3-Person Household | 5,321 (57.5%) | 3,929 (42.5%) |
| 4+ Person Household | 9,651 (56.5%) | 7,425 (43.5%) |
| Total Housing Units | 27,993 (56.5%) | 21,549 (43.5%) |
Occupancy by Educational Attainment in Hayward
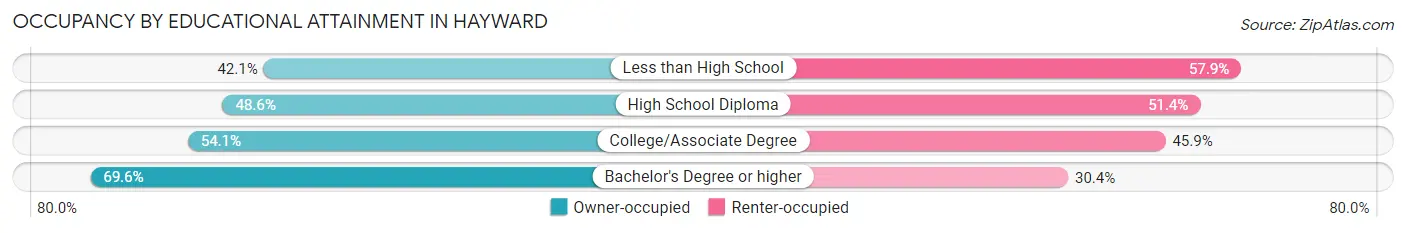
| Household Size | Owner-occupied | Renter-occupied |
| Less than High School | 3,221 (42.1%) | 4,428 (57.9%) |
| High School Diploma | 5,256 (48.6%) | 5,556 (51.4%) |
| College/Associate Degree | 7,377 (54.1%) | 6,256 (45.9%) |
| Bachelor's Degree or higher | 12,139 (69.6%) | 5,309 (30.4%) |
Occupancy by Age of Householder in Hayward
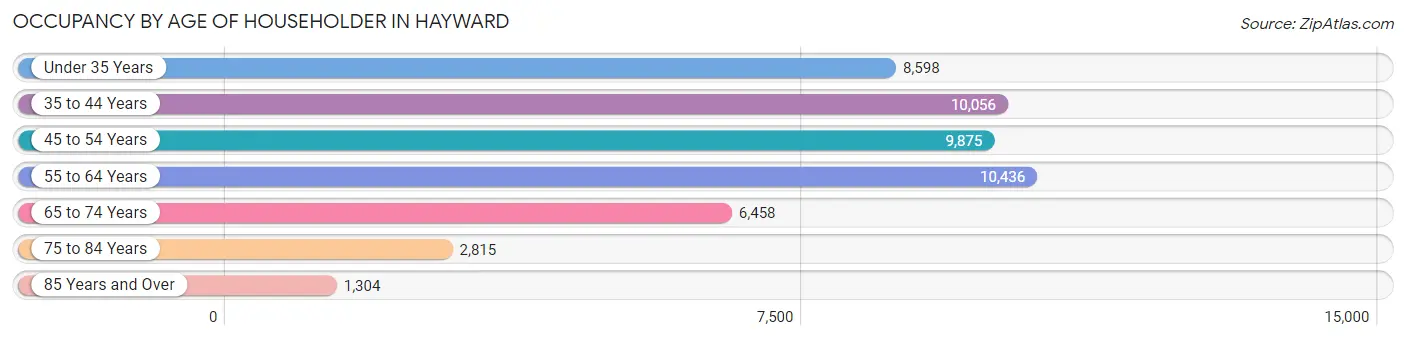
| Age Bracket | # Households | % Households |
| Under 35 Years | 8,598 | 17.3% |
| 35 to 44 Years | 10,056 | 20.3% |
| 45 to 54 Years | 9,875 | 19.9% |
| 55 to 64 Years | 10,436 | 21.1% |
| 65 to 74 Years | 6,458 | 13.0% |
| 75 to 84 Years | 2,815 | 5.7% |
| 85 Years and Over | 1,304 | 2.6% |
| Total | 49,542 | 100.0% |
Housing Finances in Hayward
Median Income by Occupancy in Hayward
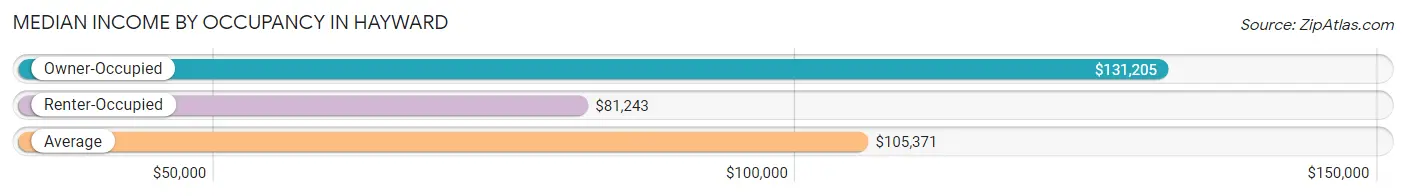
| Occupancy Type | # Households | Median Income |
| Owner-Occupied | 27,993 (56.5%) | $131,205 |
| Renter-Occupied | 21,549 (43.5%) | $81,243 |
| Average | 49,542 (100.0%) | $105,371 |
Occupancy by Householder Income Bracket in Hayward
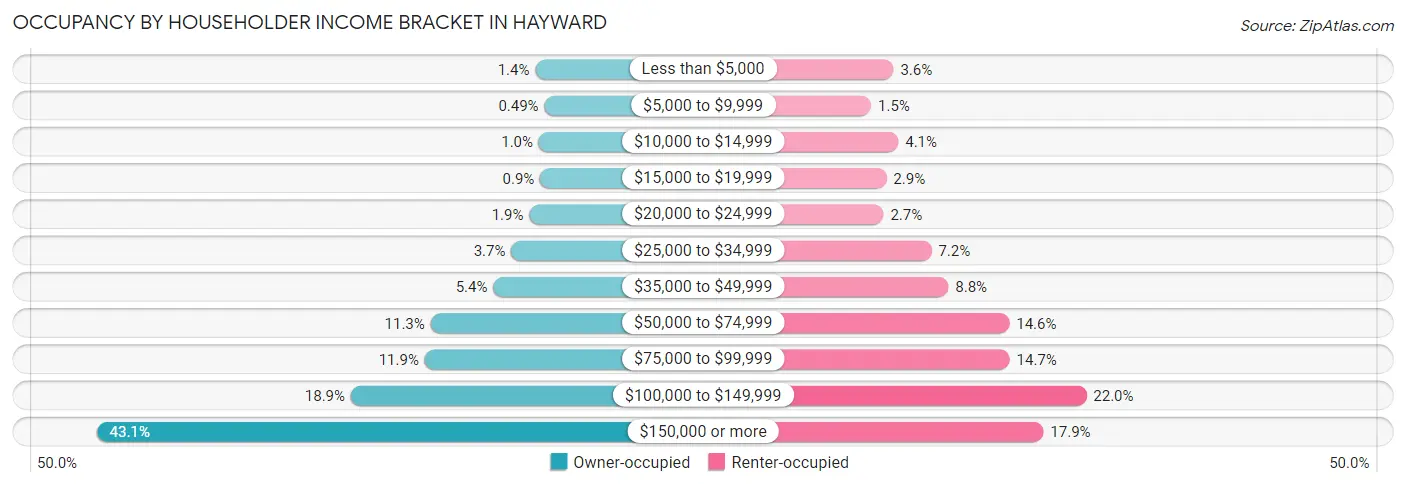
| Income Bracket | Owner-occupied | Renter-occupied |
| Less than $5,000 | 380 (1.4%) | 777 (3.6%) |
| $5,000 to $9,999 | 138 (0.5%) | 318 (1.5%) |
| $10,000 to $14,999 | 285 (1.0%) | 877 (4.1%) |
| $15,000 to $19,999 | 252 (0.9%) | 633 (2.9%) |
| $20,000 to $24,999 | 539 (1.9%) | 574 (2.7%) |
| $25,000 to $34,999 | 1,021 (3.6%) | 1,558 (7.2%) |
| $35,000 to $49,999 | 1,500 (5.4%) | 1,904 (8.8%) |
| $50,000 to $74,999 | 3,173 (11.3%) | 3,154 (14.6%) |
| $75,000 to $99,999 | 3,328 (11.9%) | 3,163 (14.7%) |
| $100,000 to $149,999 | 5,300 (18.9%) | 4,736 (22.0%) |
| $150,000 or more | 12,077 (43.1%) | 3,855 (17.9%) |
| Total | 27,993 (100.0%) | 21,549 (100.0%) |
Monthly Housing Cost Tiers in Hayward
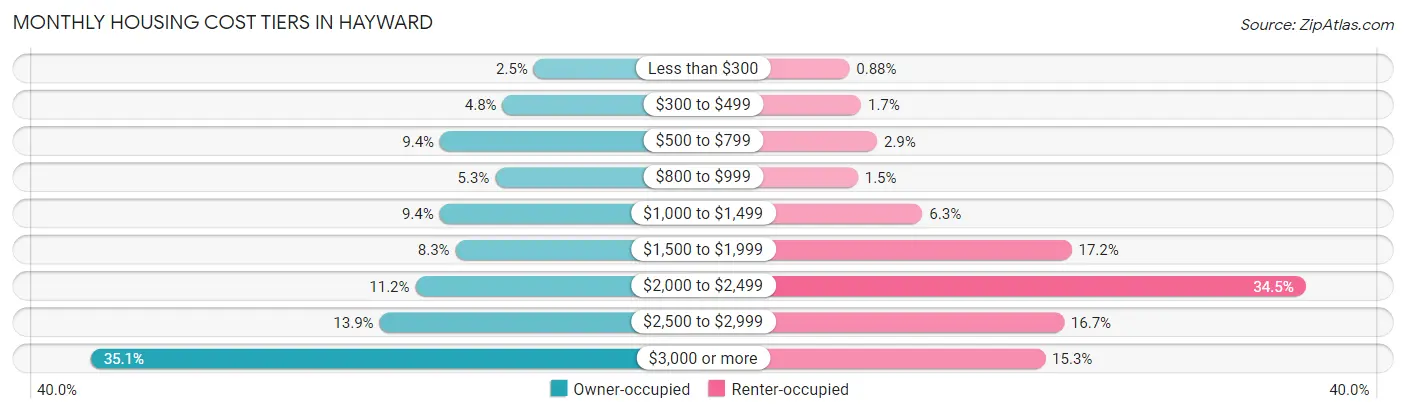
| Monthly Cost | Owner-occupied | Renter-occupied |
| Less than $300 | 704 (2.5%) | 190 (0.9%) |
| $300 to $499 | 1,346 (4.8%) | 376 (1.7%) |
| $500 to $799 | 2,634 (9.4%) | 630 (2.9%) |
| $800 to $999 | 1,494 (5.3%) | 324 (1.5%) |
| $1,000 to $1,499 | 2,643 (9.4%) | 1,348 (6.3%) |
| $1,500 to $1,999 | 2,314 (8.3%) | 3,715 (17.2%) |
| $2,000 to $2,499 | 3,142 (11.2%) | 7,428 (34.5%) |
| $2,500 to $2,999 | 3,883 (13.9%) | 3,595 (16.7%) |
| $3,000 or more | 9,833 (35.1%) | 3,297 (15.3%) |
| Total | 27,993 (100.0%) | 21,549 (100.0%) |
Physical Housing Characteristics in Hayward
Housing Structures in Hayward
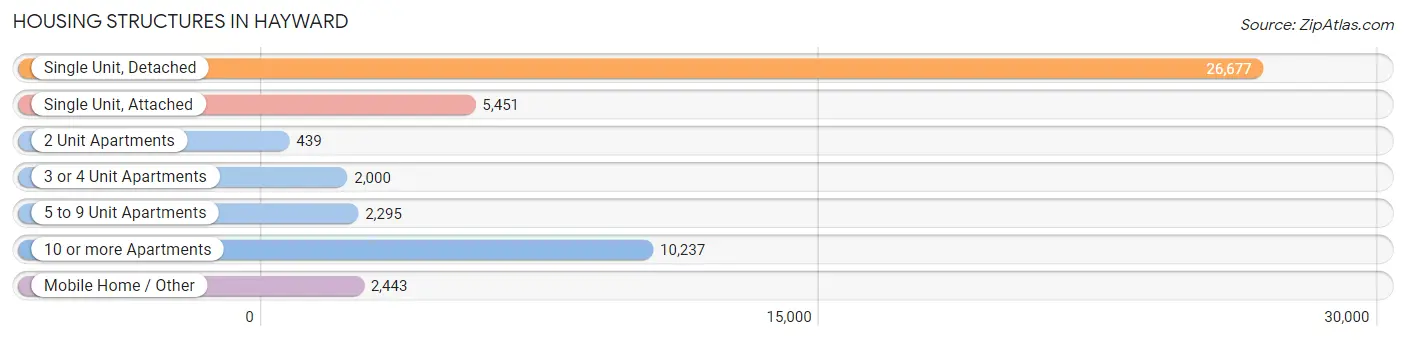
| Structure Type | # Housing Units | % Housing Units |
| Single Unit, Detached | 26,677 | 53.8% |
| Single Unit, Attached | 5,451 | 11.0% |
| 2 Unit Apartments | 439 | 0.9% |
| 3 or 4 Unit Apartments | 2,000 | 4.0% |
| 5 to 9 Unit Apartments | 2,295 | 4.6% |
| 10 or more Apartments | 10,237 | 20.7% |
| Mobile Home / Other | 2,443 | 4.9% |
| Total | 49,542 | 100.0% |
Housing Structures by Occupancy in Hayward
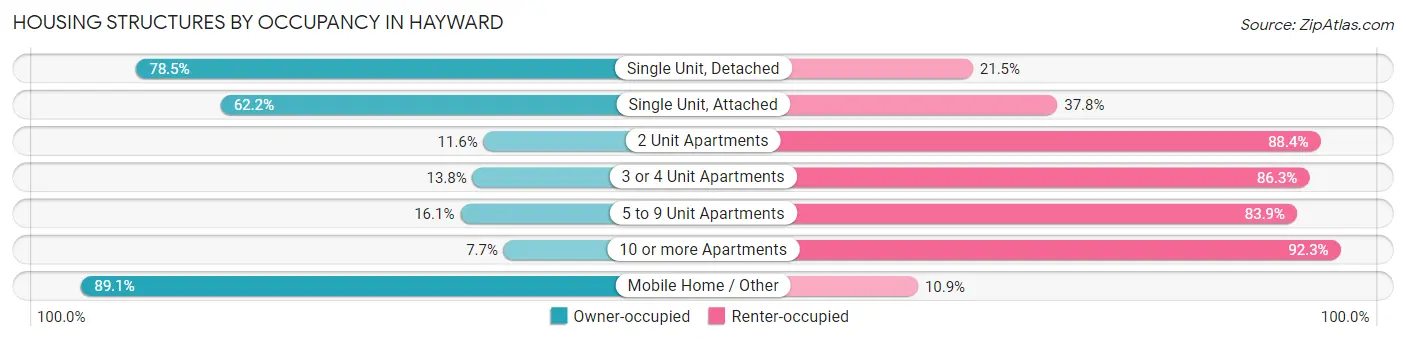
| Structure Type | Owner-occupied | Renter-occupied |
| Single Unit, Detached | 20,938 (78.5%) | 5,739 (21.5%) |
| Single Unit, Attached | 3,392 (62.2%) | 2,059 (37.8%) |
| 2 Unit Apartments | 51 (11.6%) | 388 (88.4%) |
| 3 or 4 Unit Apartments | 275 (13.8%) | 1,725 (86.3%) |
| 5 to 9 Unit Apartments | 370 (16.1%) | 1,925 (83.9%) |
| 10 or more Apartments | 791 (7.7%) | 9,446 (92.3%) |
| Mobile Home / Other | 2,176 (89.1%) | 267 (10.9%) |
| Total | 27,993 (56.5%) | 21,549 (43.5%) |
Housing Structures by Number of Rooms in Hayward
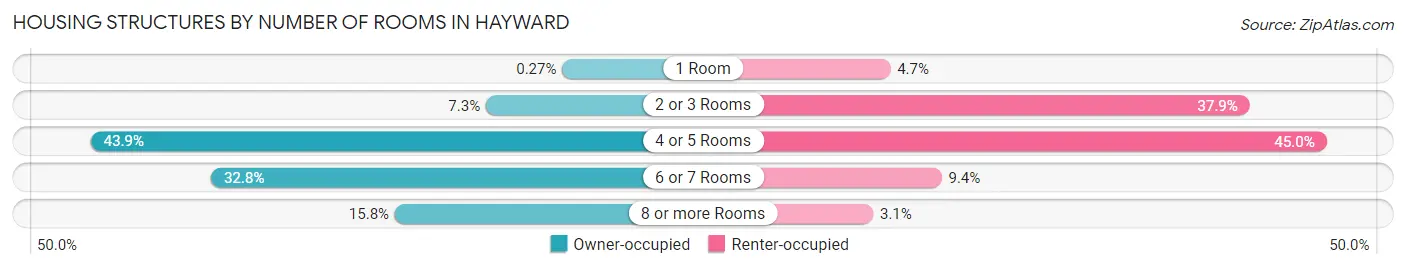
| Number of Rooms | Owner-occupied | Renter-occupied |
| 1 Room | 76 (0.3%) | 1,001 (4.6%) |
| 2 or 3 Rooms | 2,052 (7.3%) | 8,165 (37.9%) |
| 4 or 5 Rooms | 12,285 (43.9%) | 9,698 (45.0%) |
| 6 or 7 Rooms | 9,171 (32.8%) | 2,025 (9.4%) |
| 8 or more Rooms | 4,409 (15.8%) | 660 (3.1%) |
| Total | 27,993 (100.0%) | 21,549 (100.0%) |
Housing Structure by Heating Type in Hayward

| Heating Type | Owner-occupied | Renter-occupied |
| Utility Gas | 20,697 (73.9%) | 12,861 (59.7%) |
| Bottled, Tank, or LP Gas | 540 (1.9%) | 464 (2.1%) |
| Electricity | 5,872 (21.0%) | 7,188 (33.4%) |
| Fuel Oil or Kerosene | 16 (0.1%) | 25 (0.1%) |
| Coal or Coke | 0 (0.0%) | 0 (0.0%) |
| All other Fuels | 422 (1.5%) | 121 (0.6%) |
| No Fuel Used | 446 (1.6%) | 890 (4.1%) |
| Total | 27,993 (100.0%) | 21,549 (100.0%) |
Household Vehicle Usage in Hayward
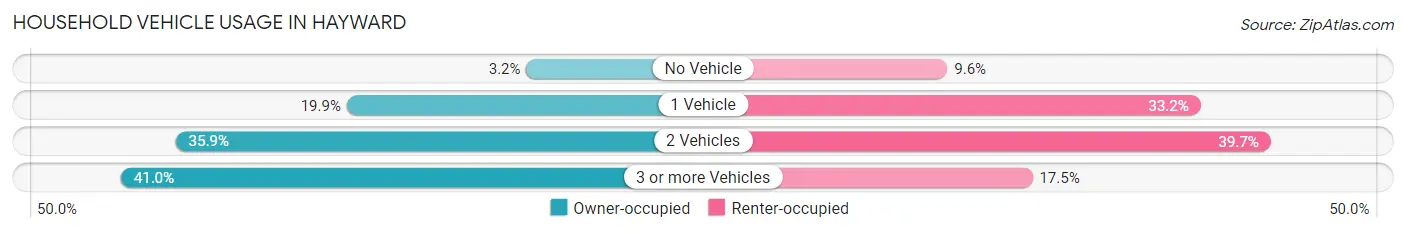
| Vehicles per Household | Owner-occupied | Renter-occupied |
| No Vehicle | 885 (3.2%) | 2,061 (9.6%) |
| 1 Vehicle | 5,578 (19.9%) | 7,152 (33.2%) |
| 2 Vehicles | 10,049 (35.9%) | 8,563 (39.7%) |
| 3 or more Vehicles | 11,481 (41.0%) | 3,773 (17.5%) |
| Total | 27,993 (100.0%) | 21,549 (100.0%) |
Real Estate & Mortgages in Hayward
Real Estate and Mortgage Overview in Hayward
| Characteristic | Without Mortgage | With Mortgage |
| Housing Units | 7,682 | 20,311 |
| Median Property Value | $702,800 | $797,300 |
| Median Household Income | $86,556 | $10,026 |
| Monthly Housing Costs | $737 | $9,820 |
| Real Estate Taxes | $3,160 | $528 |
Property Value by Mortgage Status in Hayward
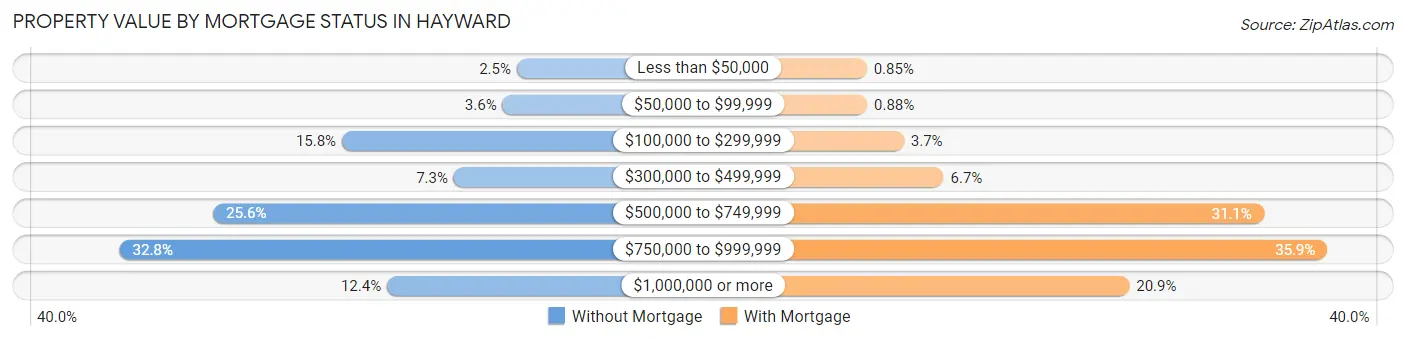
| Property Value | Without Mortgage | With Mortgage |
| Less than $50,000 | 192 (2.5%) | 172 (0.9%) |
| $50,000 to $99,999 | 276 (3.6%) | 179 (0.9%) |
| $100,000 to $299,999 | 1,215 (15.8%) | 747 (3.7%) |
| $300,000 to $499,999 | 561 (7.3%) | 1,362 (6.7%) |
| $500,000 to $749,999 | 1,969 (25.6%) | 6,316 (31.1%) |
| $750,000 to $999,999 | 2,517 (32.8%) | 7,299 (35.9%) |
| $1,000,000 or more | 952 (12.4%) | 4,236 (20.9%) |
| Total | 7,682 (100.0%) | 20,311 (100.0%) |
Household Income by Mortgage Status in Hayward
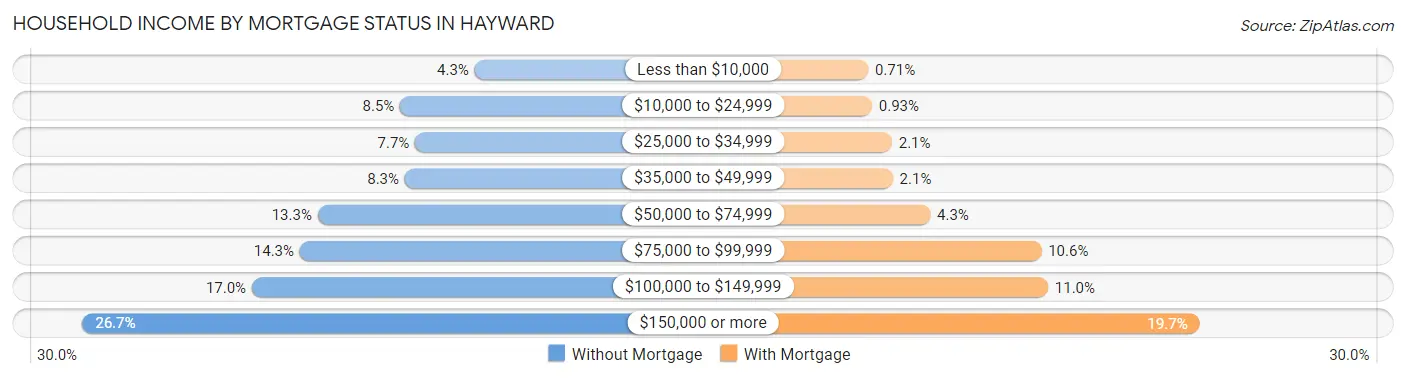
| Household Income | Without Mortgage | With Mortgage |
| Less than $10,000 | 329 (4.3%) | 145 (0.7%) |
| $10,000 to $24,999 | 656 (8.5%) | 189 (0.9%) |
| $25,000 to $34,999 | 590 (7.7%) | 420 (2.1%) |
| $35,000 to $49,999 | 635 (8.3%) | 431 (2.1%) |
| $50,000 to $74,999 | 1,018 (13.3%) | 865 (4.3%) |
| $75,000 to $99,999 | 1,096 (14.3%) | 2,155 (10.6%) |
| $100,000 to $149,999 | 1,307 (17.0%) | 2,232 (11.0%) |
| $150,000 or more | 2,051 (26.7%) | 3,993 (19.7%) |
| Total | 7,682 (100.0%) | 20,311 (100.0%) |
Property Value to Household Income Ratio in Hayward
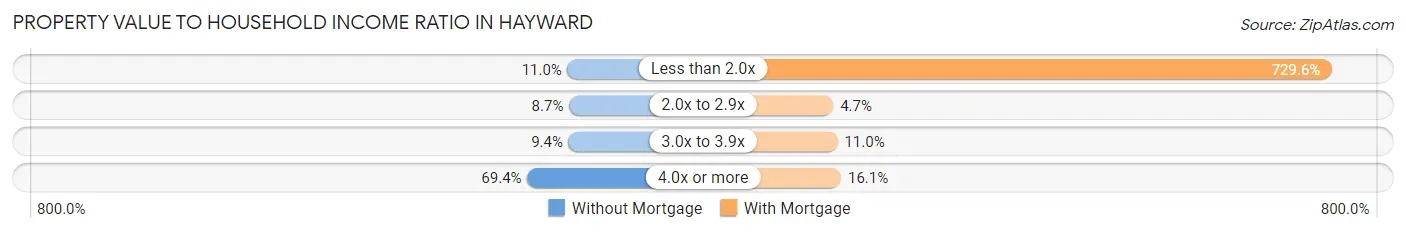
| Value-to-Income Ratio | Without Mortgage | With Mortgage |
| Less than 2.0x | 841 (11.0%) | 148,191 (729.6%) |
| 2.0x to 2.9x | 669 (8.7%) | 962 (4.7%) |
| 3.0x to 3.9x | 719 (9.4%) | 2,235 (11.0%) |
| 4.0x or more | 5,334 (69.4%) | 3,278 (16.1%) |
| Total | 7,682 (100.0%) | 20,311 (100.0%) |
Real Estate Taxes by Mortgage Status in Hayward
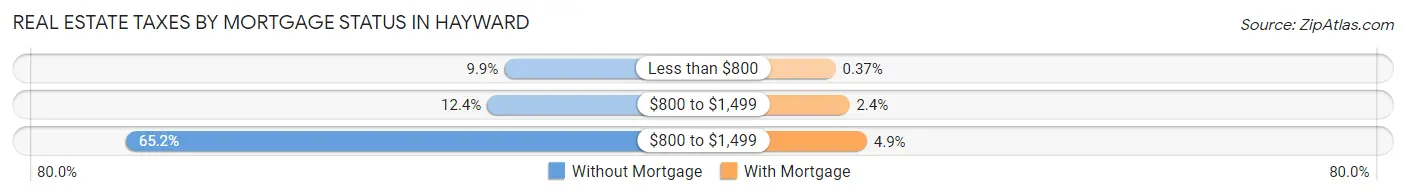
| Property Taxes | Without Mortgage | With Mortgage |
| Less than $800 | 763 (9.9%) | 75 (0.4%) |
| $800 to $1,499 | 954 (12.4%) | 487 (2.4%) |
| $800 to $1,499 | 5,009 (65.2%) | 1,003 (4.9%) |
| Total | 7,682 (100.0%) | 20,311 (100.0%) |
Health & Disability in Hayward
Health Insurance Coverage by Age in Hayward
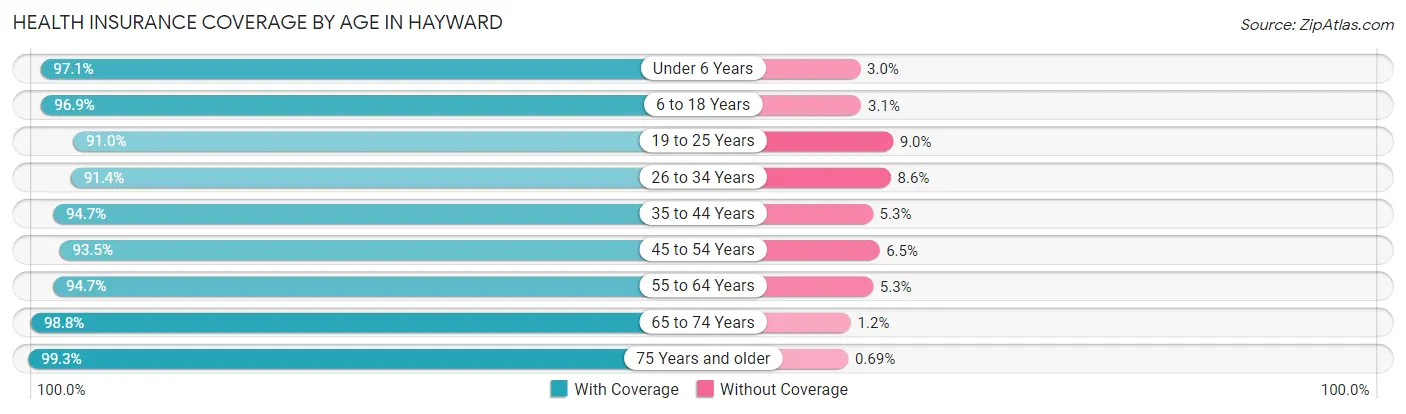
| Age Bracket | With Coverage | Without Coverage |
| Under 6 Years | 10,550 (97.1%) | 321 (2.9%) |
| 6 to 18 Years | 22,854 (96.9%) | 740 (3.1%) |
| 19 to 25 Years | 13,461 (91.0%) | 1,337 (9.0%) |
| 26 to 34 Years | 22,362 (91.4%) | 2,113 (8.6%) |
| 35 to 44 Years | 21,906 (94.7%) | 1,223 (5.3%) |
| 45 to 54 Years | 19,503 (93.5%) | 1,358 (6.5%) |
| 55 to 64 Years | 20,110 (94.7%) | 1,130 (5.3%) |
| 65 to 74 Years | 12,316 (98.8%) | 148 (1.2%) |
| 75 Years and older | 8,003 (99.3%) | 56 (0.7%) |
| Total | 151,065 (94.7%) | 8,426 (5.3%) |
Health Insurance Coverage by Citizenship Status in Hayward
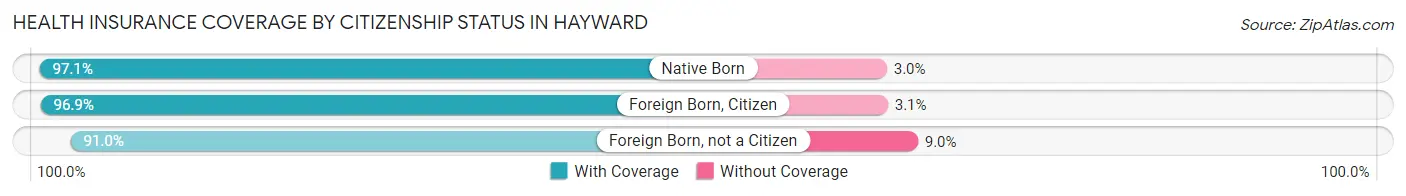
| Citizenship Status | With Coverage | Without Coverage |
| Native Born | 10,550 (97.1%) | 321 (2.9%) |
| Foreign Born, Citizen | 22,854 (96.9%) | 740 (3.1%) |
| Foreign Born, not a Citizen | 13,461 (91.0%) | 1,337 (9.0%) |
Health Insurance Coverage by Household Income in Hayward
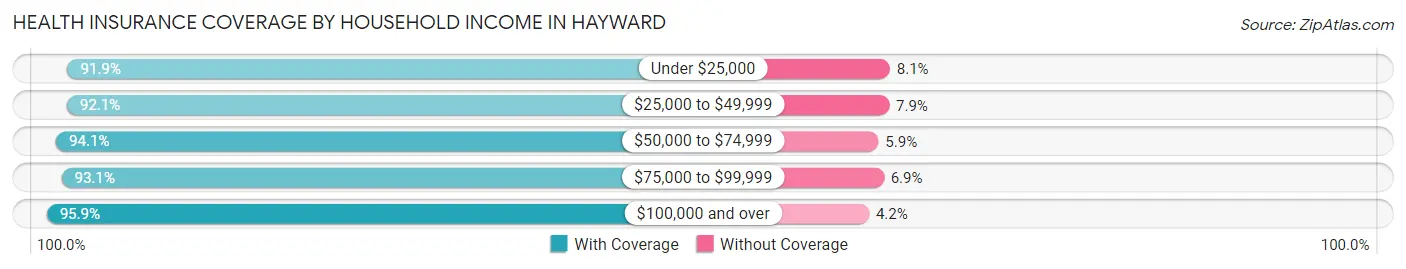
| Household Income | With Coverage | Without Coverage |
| Under $25,000 | 8,219 (91.9%) | 721 (8.1%) |
| $25,000 to $49,999 | 14,347 (92.1%) | 1,235 (7.9%) |
| $50,000 to $74,999 | 16,336 (94.1%) | 1,028 (5.9%) |
| $75,000 to $99,999 | 18,347 (93.1%) | 1,364 (6.9%) |
| $100,000 and over | 91,241 (95.9%) | 3,947 (4.2%) |
Public vs Private Health Insurance Coverage by Age in Hayward
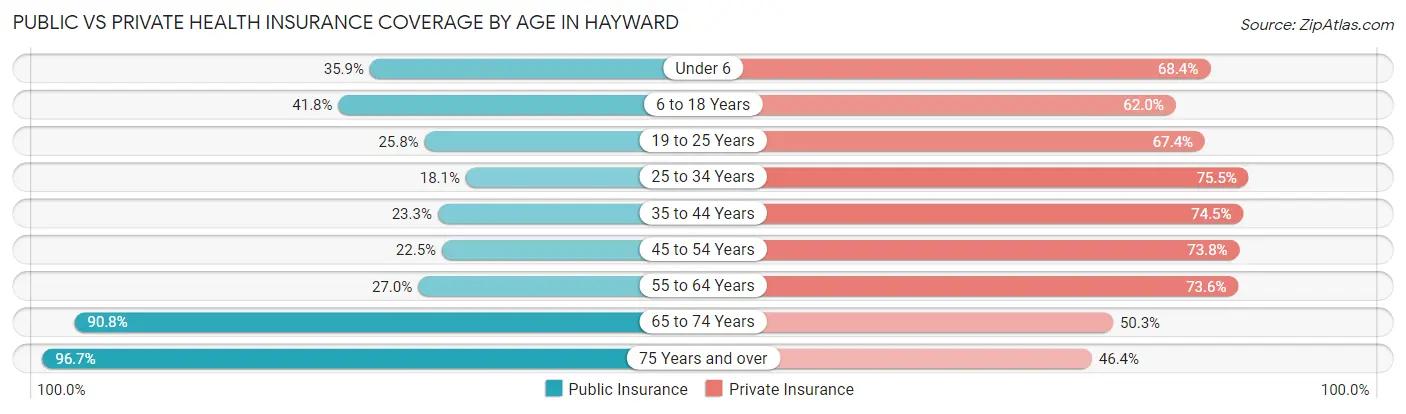
| Age Bracket | Public Insurance | Private Insurance |
| Under 6 | 3,905 (35.9%) | 7,431 (68.4%) |
| 6 to 18 Years | 9,853 (41.8%) | 14,618 (62.0%) |
| 19 to 25 Years | 3,815 (25.8%) | 9,973 (67.4%) |
| 25 to 34 Years | 4,433 (18.1%) | 18,483 (75.5%) |
| 35 to 44 Years | 5,394 (23.3%) | 17,237 (74.5%) |
| 45 to 54 Years | 4,702 (22.5%) | 15,395 (73.8%) |
| 55 to 64 Years | 5,729 (27.0%) | 15,628 (73.6%) |
| 65 to 74 Years | 11,312 (90.8%) | 6,273 (50.3%) |
| 75 Years and over | 7,794 (96.7%) | 3,741 (46.4%) |
| Total | 56,937 (35.7%) | 108,779 (68.2%) |
Disability Status by Sex by Age in Hayward
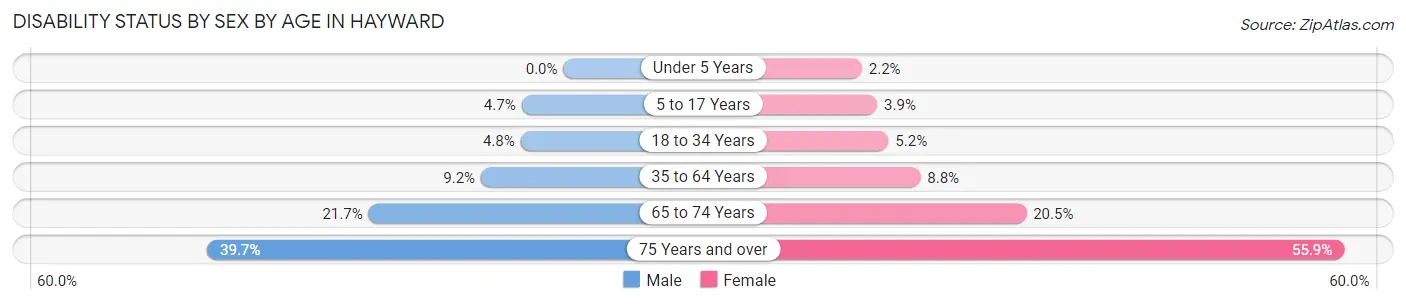
| Age Bracket | Male | Female |
| Under 5 Years | 0 (0.0%) | 85 (2.2%) |
| 5 to 17 Years | 575 (4.7%) | 432 (3.9%) |
| 18 to 34 Years | 1,063 (4.8%) | 1,001 (5.2%) |
| 35 to 64 Years | 3,020 (9.2%) | 2,830 (8.7%) |
| 65 to 74 Years | 1,286 (21.7%) | 1,343 (20.5%) |
| 75 Years and over | 1,246 (39.7%) | 2,751 (55.9%) |
Disability Class by Sex by Age in Hayward
Disability Class: Hearing Difficulty
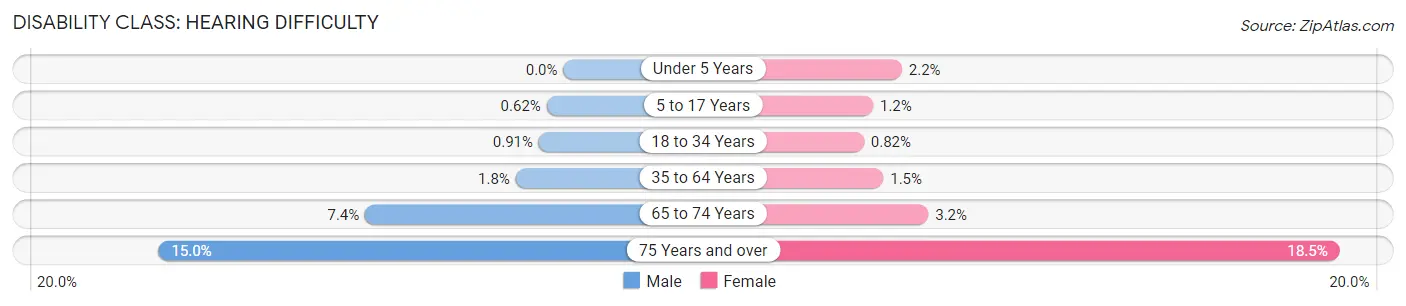
| Age Bracket | Male | Female |
| Under 5 Years | 0 (0.0%) | 85 (2.2%) |
| 5 to 17 Years | 77 (0.6%) | 127 (1.2%) |
| 18 to 34 Years | 203 (0.9%) | 159 (0.8%) |
| 35 to 64 Years | 582 (1.8%) | 499 (1.5%) |
| 65 to 74 Years | 436 (7.4%) | 210 (3.2%) |
| 75 Years and over | 472 (15.0%) | 909 (18.5%) |
Disability Class: Vision Difficulty
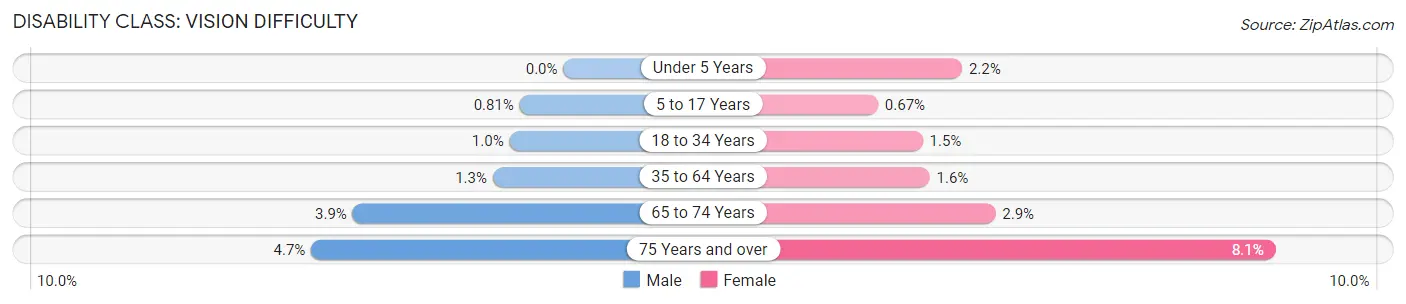
| Age Bracket | Male | Female |
| Under 5 Years | 0 (0.0%) | 85 (2.2%) |
| 5 to 17 Years | 100 (0.8%) | 73 (0.7%) |
| 18 to 34 Years | 222 (1.0%) | 289 (1.5%) |
| 35 to 64 Years | 431 (1.3%) | 527 (1.6%) |
| 65 to 74 Years | 232 (3.9%) | 186 (2.9%) |
| 75 Years and over | 147 (4.7%) | 396 (8.1%) |
Disability Class: Cognitive Difficulty
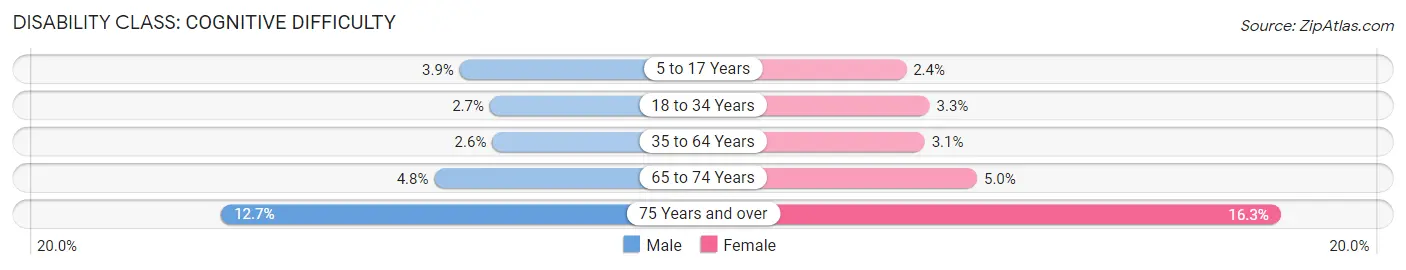
| Age Bracket | Male | Female |
| 5 to 17 Years | 475 (3.8%) | 262 (2.4%) |
| 18 to 34 Years | 609 (2.7%) | 628 (3.3%) |
| 35 to 64 Years | 867 (2.6%) | 995 (3.1%) |
| 65 to 74 Years | 284 (4.8%) | 328 (5.0%) |
| 75 Years and over | 399 (12.7%) | 801 (16.3%) |
Disability Class: Ambulatory Difficulty
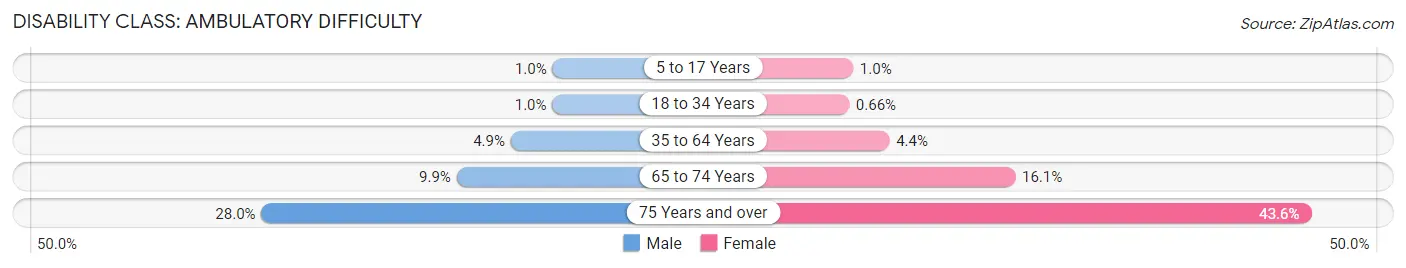
| Age Bracket | Male | Female |
| 5 to 17 Years | 124 (1.0%) | 113 (1.0%) |
| 18 to 34 Years | 227 (1.0%) | 127 (0.7%) |
| 35 to 64 Years | 1,604 (4.9%) | 1,423 (4.4%) |
| 65 to 74 Years | 587 (9.9%) | 1,051 (16.1%) |
| 75 Years and over | 880 (28.0%) | 2,143 (43.6%) |
Disability Class: Self-Care Difficulty
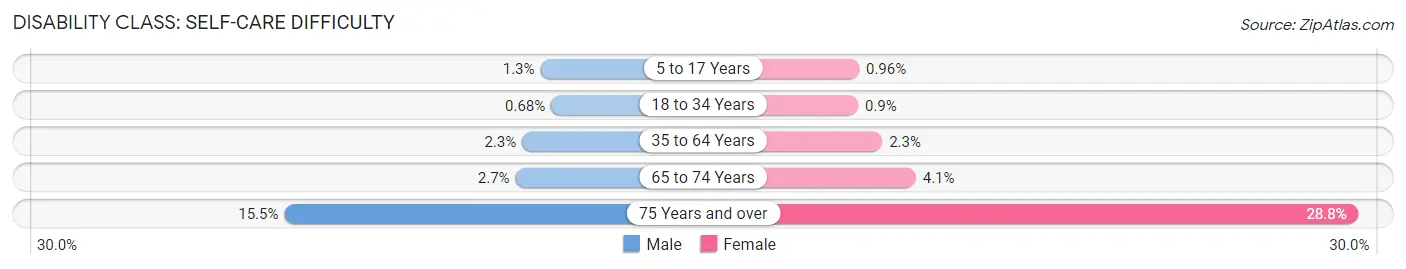
| Age Bracket | Male | Female |
| 5 to 17 Years | 158 (1.3%) | 105 (1.0%) |
| 18 to 34 Years | 151 (0.7%) | 173 (0.9%) |
| 35 to 64 Years | 756 (2.3%) | 728 (2.2%) |
| 65 to 74 Years | 158 (2.7%) | 269 (4.1%) |
| 75 Years and over | 488 (15.5%) | 1,415 (28.8%) |
Technology Access in Hayward
Computing Device Access in Hayward
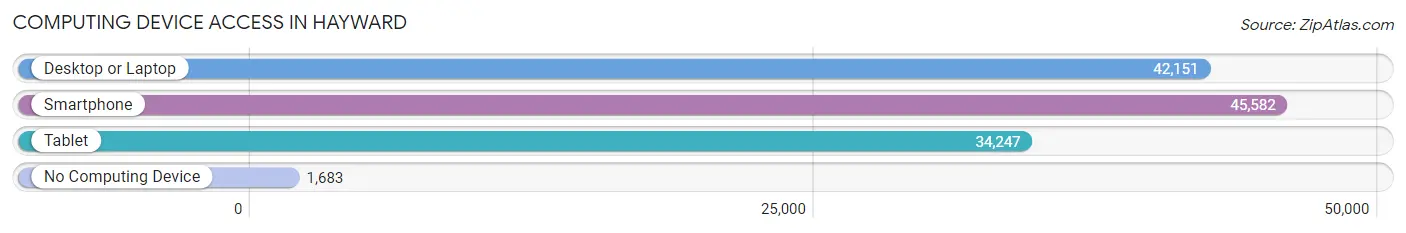
| Device Type | # Households | % Households |
| Desktop or Laptop | 42,151 | 85.1% |
| Smartphone | 45,582 | 92.0% |
| Tablet | 34,247 | 69.1% |
| No Computing Device | 1,683 | 3.4% |
| Total | 49,542 | 100.0% |
Internet Access in Hayward
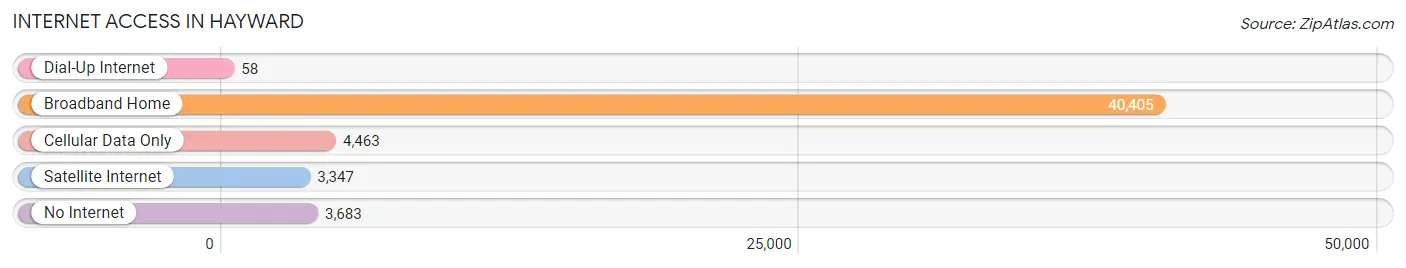
| Internet Type | # Households | % Households |
| Dial-Up Internet | 58 | 0.1% |
| Broadband Home | 40,405 | 81.6% |
| Cellular Data Only | 4,463 | 9.0% |
| Satellite Internet | 3,347 | 6.8% |
| No Internet | 3,683 | 7.4% |
| Total | 49,542 | 100.0% |
Hayward Summary
Hayward, California is a city located in Alameda County, in the San Francisco Bay Area. It is the sixth largest city in the Bay Area, with a population of over 150,000 people. Hayward is known for its diverse population, its vibrant economy, and its rich history.
Geography
Hayward is located in the East Bay region of the San Francisco Bay Area, about 25 miles southeast of San Francisco. It is bordered by the cities of San Leandro to the north, Union City to the south, and Castro Valley to the east. The city is situated on the Hayward Fault, a major fault line that runs through the Bay Area. The city is also home to several parks and open spaces, including the Hayward Regional Shoreline, the Hayward Japanese Gardens, and the Don Castro Regional Recreation Area.
History
The area that is now Hayward was originally inhabited by the Ohlone people, who lived in the area for thousands of years before the arrival of Europeans. The first Europeans to settle in the area were Spanish missionaries, who established a mission in the area in 1772. The area was later settled by American settlers in the mid-1800s, and the city of Hayward was officially incorporated in 1876.
In the early 20th century, Hayward experienced a period of rapid growth, as the city became a major center for agriculture and industry. The city was home to several large canneries, as well as a number of other factories and businesses. The city also became a major transportation hub, with the construction of the Southern Pacific Railroad in the late 19th century.
Economy
Today, Hayward is a major economic center in the Bay Area. The city is home to a number of large companies, including the headquarters of the healthcare company Kaiser Permanente, the software company Oracle, and the food company Ghirardelli. The city is also home to several major hospitals, including St. Rose Hospital and Eden Medical Center.
The city is also home to a number of educational institutions, including California State University, East Bay, Chabot College, and the University of California, Berkeley. The city is also home to a number of cultural attractions, including the Hayward Japanese Gardens, the Hayward Area Historical Society, and the Hayward Shoreline Interpretive Center.
Demographics
As of the 2010 census, Hayward had a population of 144,186 people. The racial makeup of the city was 44.3% White, 24.3% Hispanic or Latino, 18.3% Asian, 10.2% African American, and 2.9% other. The median household income in the city was $63,837, and the median home value was $541,000.
Conclusion
Hayward, California is a vibrant city located in the East Bay region of the San Francisco Bay Area. It is known for its diverse population, its vibrant economy, and its rich history. The city is home to a number of large companies, educational institutions, and cultural attractions, making it a great place to live and work.
Common Questions
What is Per Capita Income in Hayward?
Per Capita income in Hayward is $42,311.
What is the Median Family Income in Hayward?
Median Family Income in Hayward is $113,934.
What is the Median Household income in Hayward?
Median Household Income in Hayward is $105,371.
What is Income or Wage Gap in Hayward?
Income or Wage Gap in Hayward is 21.0%.
Women in Hayward earn 79.0 cents for every dollar earned by a man.
What is Family Income Deficit in Hayward?
Family Income Deficit in Hayward is $9,826.
Families that are below poverty line in Hayward earn $9,826 less on average than the poverty threshold level.
What is Inequality or Gini Index in Hayward?
Inequality or Gini Index in Hayward is 0.41.
What is the Total Population of Hayward?
Total Population of Hayward is 160,602.
What is the Total Male Population of Hayward?
Total Male Population of Hayward is 82,187.
What is the Total Female Population of Hayward?
Total Female Population of Hayward is 78,415.
What is the Ratio of Males per 100 Females in Hayward?
There are 104.81 Males per 100 Females in Hayward.
What is the Ratio of Females per 100 Males in Hayward?
There are 95.41 Females per 100 Males in Hayward.
What is the Median Population Age in Hayward?
Median Population Age in Hayward is 37.6 Years.
What is the Average Family Size in Hayward
Average Family Size in Hayward is 3.6 People.
What is the Average Household Size in Hayward
Average Household Size in Hayward is 3.2 People.
How Large is the Labor Force in Hayward?
There are 88,399 People in the Labor Forcein in Hayward.
What is the Percentage of People in the Labor Force in Hayward?
66.8% of People are in the Labor Force in Hayward.
What is the Unemployment Rate in Hayward?
Unemployment Rate in Hayward is 5.7%.