San Ramon, CA Map & Demographics
San Ramon Map
San Ramon Overview
$77,696
PER CAPITA INCOME
$220,820
AVG FAMILY INCOME
$190,829
AVG HOUSEHOLD INCOME
47.4%
WAGE / INCOME GAP [ % ]
52.6¢/ $1
WAGE / INCOME GAP [ $ ]
0.40
INEQUALITY / GINI INDEX
86,119
TOTAL POPULATION
43,059
MALE POPULATION
43,060
FEMALE POPULATION
100.00
MALES / 100 FEMALES
100.00
FEMALES / 100 MALES
40.5
MEDIAN AGE
3.3
AVG FAMILY SIZE
2.9
AVG HOUSEHOLD SIZE
45,414
LABOR FORCE [ PEOPLE ]
69.3%
PERCENT IN LABOR FORCE
5.0%
UNEMPLOYMENT RATE
San Ramon Area Codes
Income in San Ramon
Income Overview in San Ramon
Per Capita Income in San Ramon is $77,696, while median incomes of families and households are $220,820 and $190,829 respectively.
| Characteristic | Number | Measure |
| Per Capita Income | 86,119 | $77,696 |
| Median Family Income | 23,452 | $220,820 |
| Mean Family Income | 23,452 | $248,315 |
| Median Household Income | 29,585 | $190,829 |
| Mean Household Income | 29,585 | $224,236 |
| Income Deficit | 23,452 | $0 |
| Wage / Income Gap (%) | 86,119 | 47.40% |
| Wage / Income Gap ($) | 86,119 | 52.60¢ per $1 |
| Gini / Inequality Index | 86,119 | 0.40 |
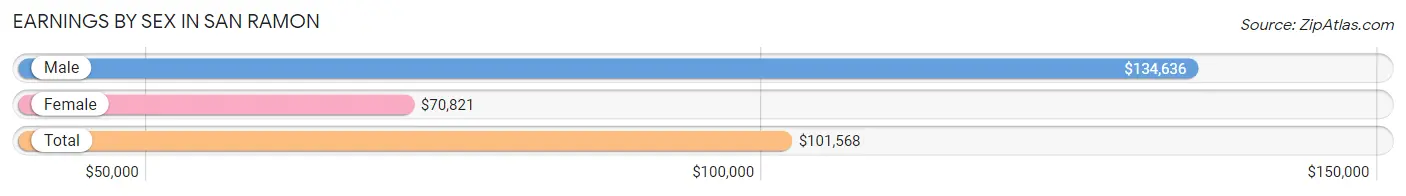
Earnings by Sex in San Ramon
Average Earnings in San Ramon are $101,568, $134,636 for men and $70,821 for women, a difference of 47.4%.
| Sex | Number | Average Earnings |
| Male | 25,998 (55.4%) | $134,636 |
| Female | 20,950 (44.6%) | $70,821 |
| Total | 46,948 (100.0%) | $101,568 |
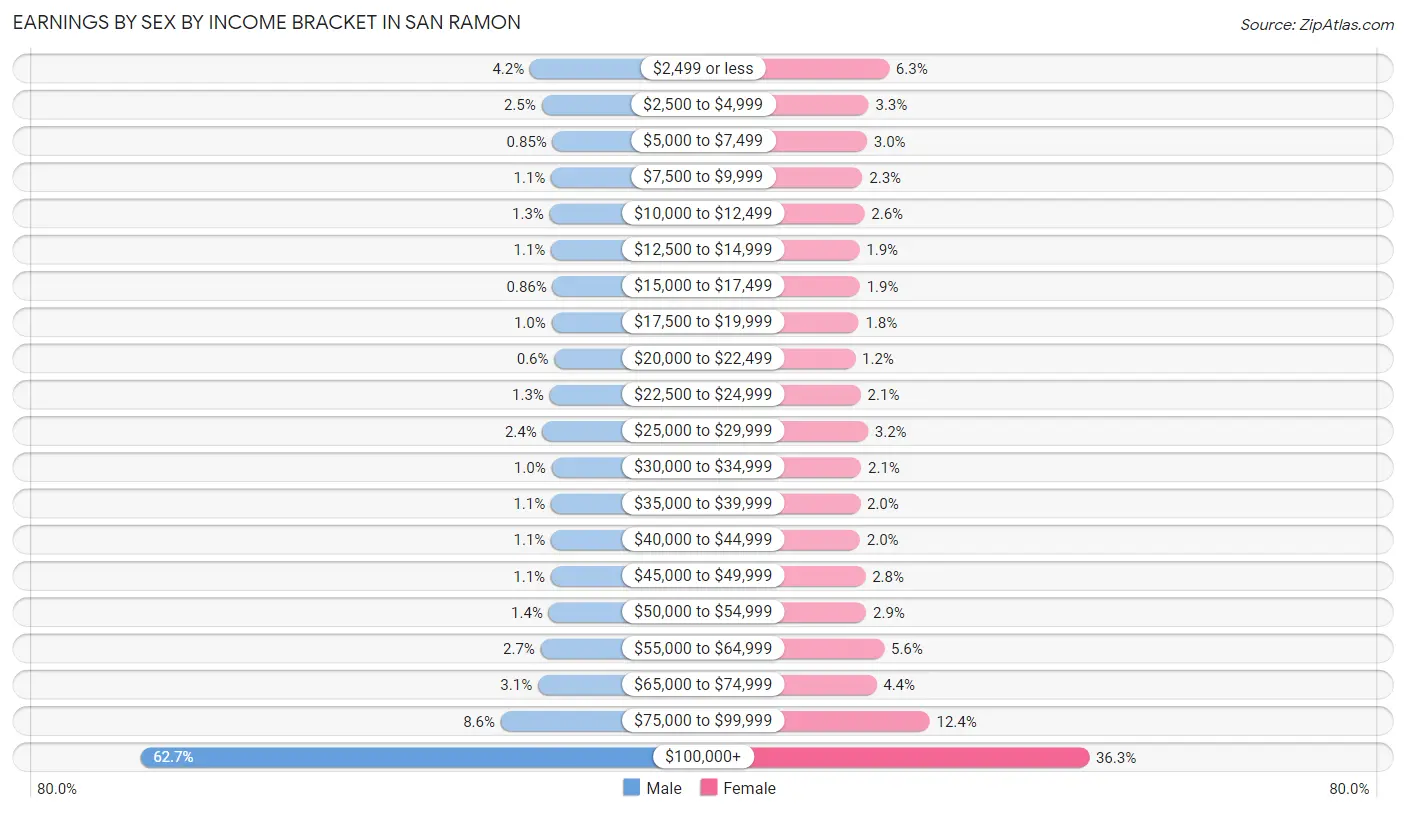
Earnings by Sex by Income Bracket in San Ramon
The most common earnings brackets in San Ramon are $100,000+ for men (16,293 | 62.7%) and $100,000+ for women (7,605 | 36.3%).
| Income | Male | Female |
| $2,499 or less | 1,102 (4.2%) | 1,321 (6.3%) |
| $2,500 to $4,999 | 655 (2.5%) | 683 (3.3%) |
| $5,000 to $7,499 | 222 (0.9%) | 631 (3.0%) |
| $7,500 to $9,999 | 282 (1.1%) | 488 (2.3%) |
| $10,000 to $12,499 | 339 (1.3%) | 550 (2.6%) |
| $12,500 to $14,999 | 281 (1.1%) | 394 (1.9%) |
| $15,000 to $17,499 | 224 (0.9%) | 407 (1.9%) |
| $17,500 to $19,999 | 265 (1.0%) | 368 (1.8%) |
| $20,000 to $22,499 | 157 (0.6%) | 259 (1.2%) |
| $22,500 to $24,999 | 339 (1.3%) | 435 (2.1%) |
| $25,000 to $29,999 | 615 (2.4%) | 662 (3.2%) |
| $30,000 to $34,999 | 269 (1.0%) | 448 (2.1%) |
| $35,000 to $39,999 | 283 (1.1%) | 415 (2.0%) |
| $40,000 to $44,999 | 280 (1.1%) | 408 (1.9%) |
| $45,000 to $49,999 | 289 (1.1%) | 578 (2.8%) |
| $50,000 to $54,999 | 375 (1.4%) | 605 (2.9%) |
| $55,000 to $64,999 | 690 (2.6%) | 1,170 (5.6%) |
| $65,000 to $74,999 | 794 (3.0%) | 925 (4.4%) |
| $75,000 to $99,999 | 2,244 (8.6%) | 2,598 (12.4%) |
| $100,000+ | 16,293 (62.7%) | 7,605 (36.3%) |
| Total | 25,998 (100.0%) | 20,950 (100.0%) |
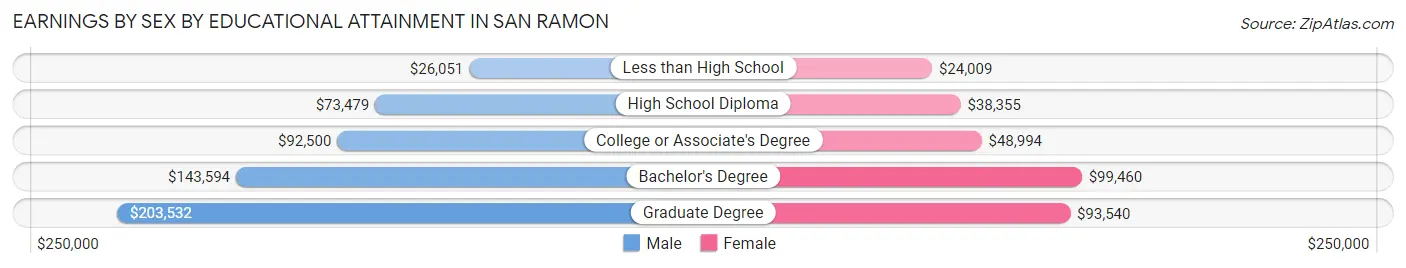
Earnings by Sex by Educational Attainment in San Ramon
Average earnings in San Ramon are $151,733 for men and $80,825 for women, a difference of 46.7%. Men with an educational attainment of graduate degree enjoy the highest average annual earnings of $203,532, while those with less than high school education earn the least with $26,051. Women with an educational attainment of bachelor's degree earn the most with the average annual earnings of $99,460, while those with less than high school education have the smallest earnings of $24,009.
| Educational Attainment | Male Income | Female Income |
| Less than High School | $26,051 | $24,009 |
| High School Diploma | $73,479 | $38,355 |
| College or Associate's Degree | $92,500 | $48,994 |
| Bachelor's Degree | $143,594 | $99,460 |
| Graduate Degree | $203,532 | $93,540 |
| Total | $151,733 | $80,825 |
Family Income in San Ramon
Family Income Brackets in San Ramon
According to the San Ramon family income data, there are 13,157 families falling into the $200,000+ income range, which is the most common income bracket and makes up 56.1% of all families. Conversely, the $10,000 to $14,999 income bracket is the least frequent group with only 141 families (0.6%) belonging to this category.
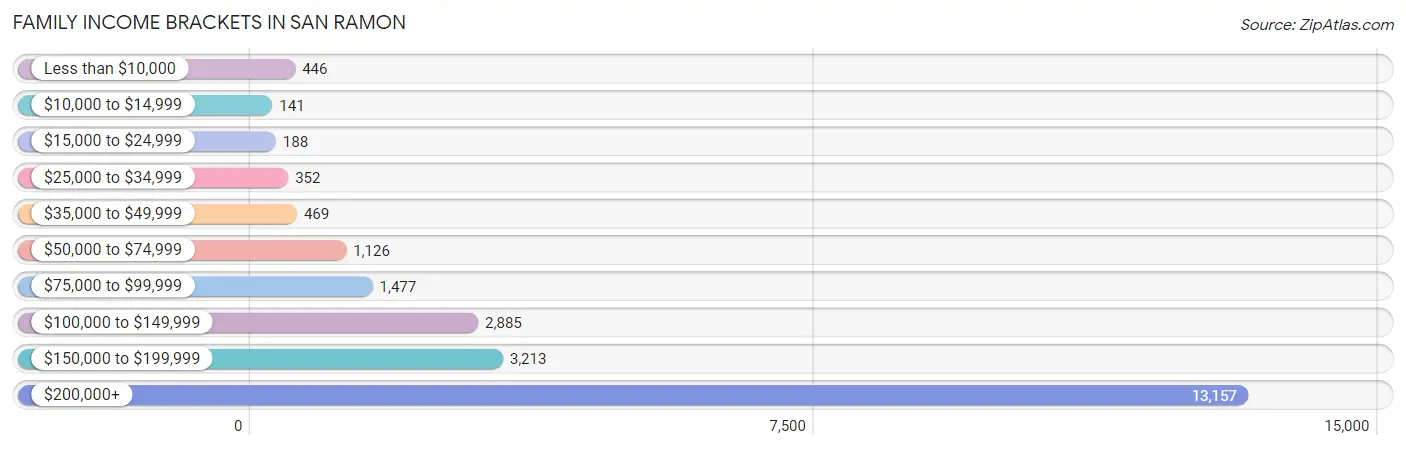
| Income Bracket | # Families | % Families |
| Less than $10,000 | 446 | 1.9% |
| $10,000 to $14,999 | 141 | 0.6% |
| $15,000 to $24,999 | 188 | 0.8% |
| $25,000 to $34,999 | 352 | 1.5% |
| $35,000 to $49,999 | 469 | 2.0% |
| $50,000 to $74,999 | 1,126 | 4.8% |
| $75,000 to $99,999 | 1,477 | 6.3% |
| $100,000 to $149,999 | 2,885 | 12.3% |
| $150,000 to $199,999 | 3,213 | 13.7% |
| $200,000+ | 13,157 | 56.1% |
Family Income by Famaliy Size in San Ramon
4-person families (7,618 | 32.5%) account for the highest median family income in San Ramon with $250,001 per family, while 2-person families (7,402 | 31.6%) have the highest median income of $78,696 per family member.
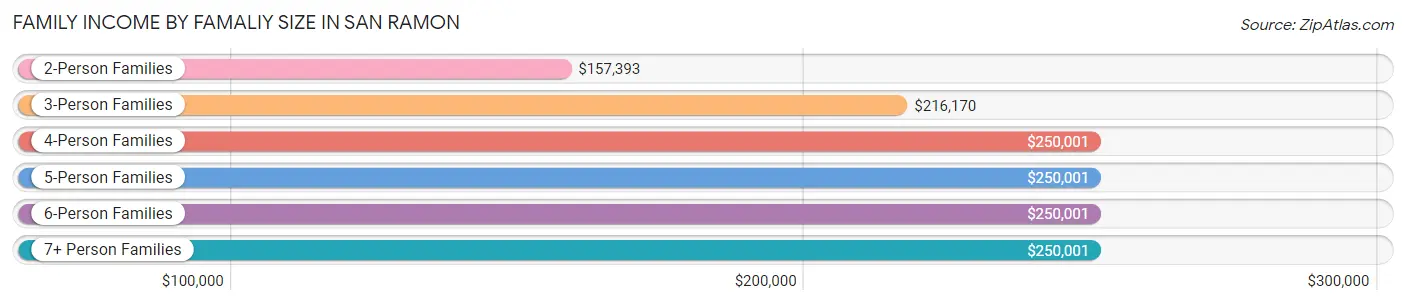
| Income Bracket | # Families | Median Income |
| 2-Person Families | 7,402 (31.6%) | $157,393 |
| 3-Person Families | 5,947 (25.4%) | $216,170 |
| 4-Person Families | 7,618 (32.5%) | $250,001 |
| 5-Person Families | 1,685 (7.2%) | $250,001 |
| 6-Person Families | 566 (2.4%) | $250,001 |
| 7+ Person Families | 234 (1.0%) | $250,001 |
| Total | 23,452 (100.0%) | $220,820 |
Family Income by Number of Earners in San Ramon
The median family income in San Ramon is $220,820, with families comprising 2 earners (11,193) having the highest median family income of $250,001, while families with no earners (1,687) have the lowest median family income of $68,197, accounting for 47.7% and 7.2% of families, respectively.
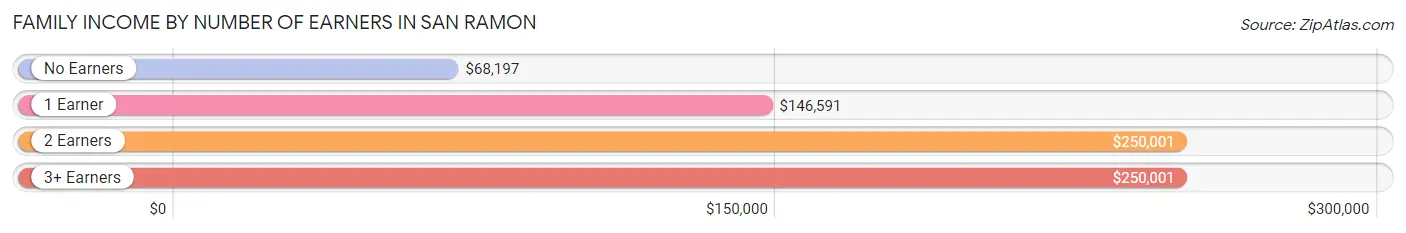
| Number of Earners | # Families | Median Income |
| No Earners | 1,687 (7.2%) | $68,197 |
| 1 Earner | 7,476 (31.9%) | $146,591 |
| 2 Earners | 11,193 (47.7%) | $250,001 |
| 3+ Earners | 3,096 (13.2%) | $250,001 |
| Total | 23,452 (100.0%) | $220,820 |
Household Income in San Ramon
Household Income Brackets in San Ramon
With 14,171 households falling in the category, the $200,000+ income range is the most frequent in San Ramon, accounting for 47.9% of all households. In contrast, only 414 households (1.4%) fall into the $10,000 to $14,999 income bracket, making it the least populous group.
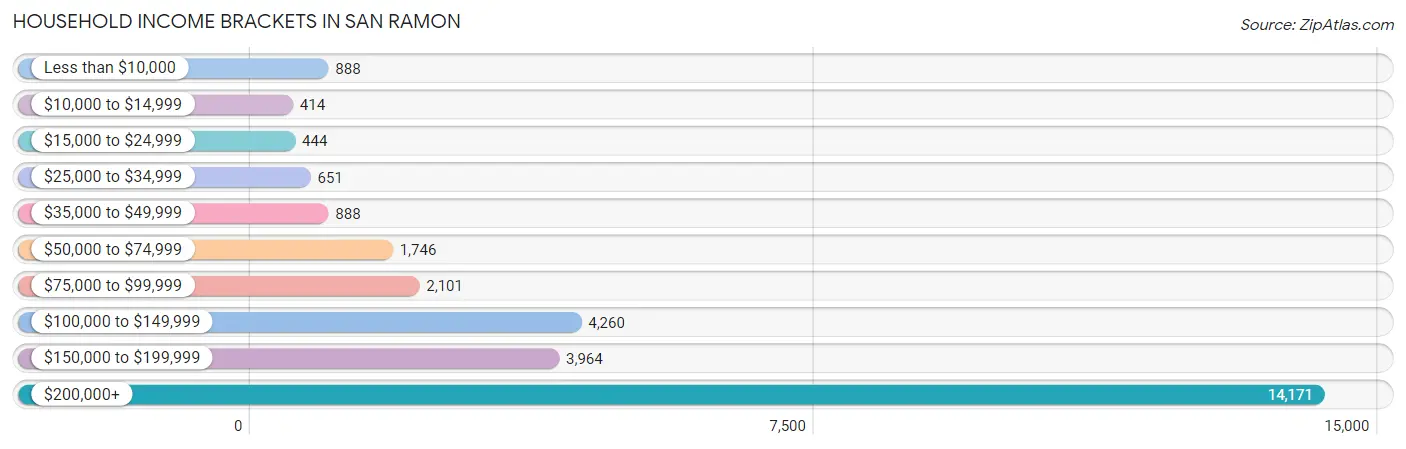
| Income Bracket | # Households | % Households |
| Less than $10,000 | 888 | 3.0% |
| $10,000 to $14,999 | 414 | 1.4% |
| $15,000 to $24,999 | 444 | 1.5% |
| $25,000 to $34,999 | 651 | 2.2% |
| $35,000 to $49,999 | 888 | 3.0% |
| $50,000 to $74,999 | 1,746 | 5.9% |
| $75,000 to $99,999 | 2,101 | 7.1% |
| $100,000 to $149,999 | 4,260 | 14.4% |
| $150,000 to $199,999 | 3,964 | 13.4% |
| $200,000+ | 14,171 | 47.9% |
Household Income by Householder Age in San Ramon
The median household income in San Ramon is $190,829, with the highest median household income of $221,910 found in the 45 to 64 years age bracket for the primary householder. A total of 15,017 households (50.8%) fall into this category. Meanwhile, the 15 to 24 years age bracket for the primary householder has the lowest median household income of $0, with 173 households (0.6%) in this group.
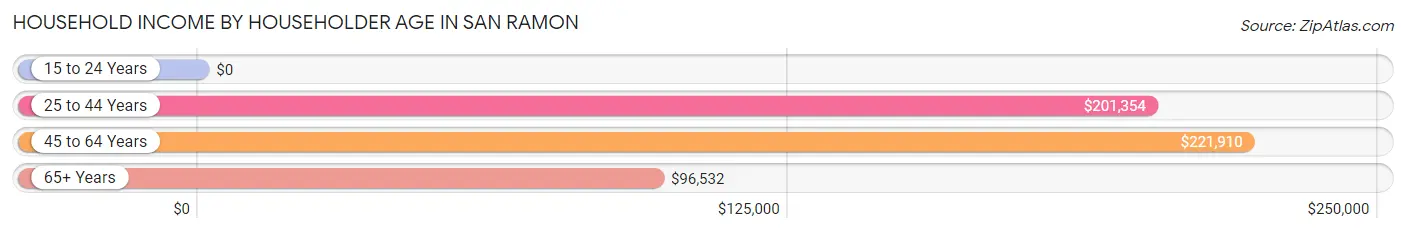
| Income Bracket | # Households | Median Income |
| 15 to 24 Years | 173 (0.6%) | $0 |
| 25 to 44 Years | 9,383 (31.7%) | $201,354 |
| 45 to 64 Years | 15,017 (50.8%) | $221,910 |
| 65+ Years | 5,012 (16.9%) | $96,532 |
| Total | 29,585 (100.0%) | $190,829 |
Poverty in San Ramon
Income Below Poverty by Sex and Age in San Ramon
With 2.9% poverty level for males and 5.6% for females among the residents of San Ramon, 75 year old and over males and 75 year old and over females are the most vulnerable to poverty, with 182 males (10.0%) and 330 females (13.0%) in their respective age groups living below the poverty level.
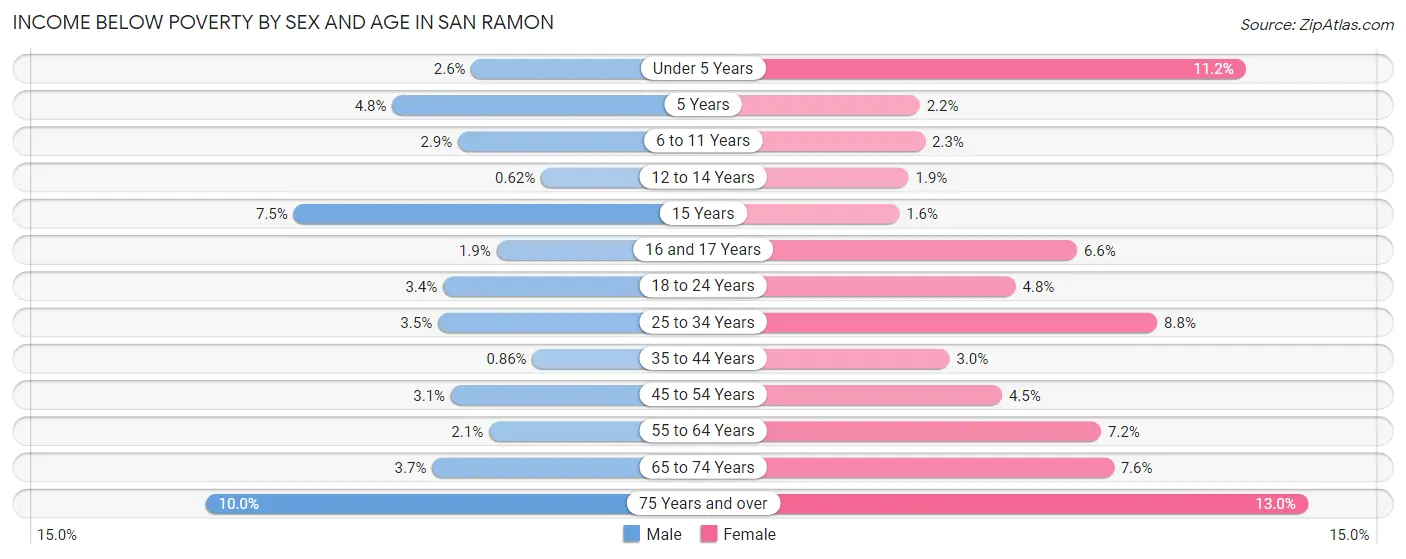
| Age Bracket | Male | Female |
| Under 5 Years | 53 (2.6%) | 258 (11.2%) |
| 5 Years | 20 (4.8%) | 15 (2.2%) |
| 6 to 11 Years | 115 (2.9%) | 99 (2.3%) |
| 12 to 14 Years | 18 (0.6%) | 41 (1.9%) |
| 15 Years | 60 (7.5%) | 14 (1.6%) |
| 16 and 17 Years | 30 (1.9%) | 77 (6.6%) |
| 18 to 24 Years | 120 (3.4%) | 113 (4.8%) |
| 25 to 34 Years | 122 (3.5%) | 309 (8.8%) |
| 35 to 44 Years | 52 (0.9%) | 225 (3.0%) |
| 45 to 54 Years | 259 (3.1%) | 355 (4.5%) |
| 55 to 64 Years | 119 (2.1%) | 330 (7.2%) |
| 65 to 74 Years | 85 (3.6%) | 229 (7.6%) |
| 75 Years and over | 182 (10.0%) | 330 (13.0%) |
| Total | 1,235 (2.9%) | 2,395 (5.6%) |
Income Above Poverty by Sex and Age in San Ramon
According to the poverty statistics in San Ramon, males aged 12 to 14 years and females aged 15 years are the age groups that are most secure financially, with 99.4% of males and 98.4% of females in these age groups living above the poverty line.
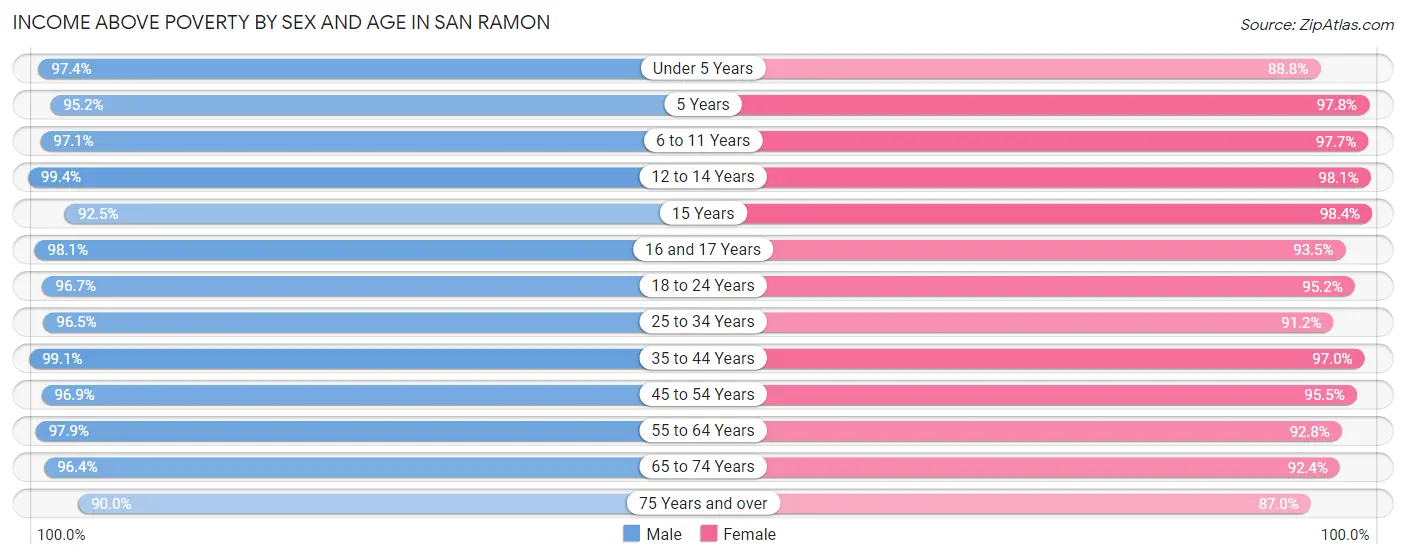
| Age Bracket | Male | Female |
| Under 5 Years | 2,014 (97.4%) | 2,038 (88.8%) |
| 5 Years | 400 (95.2%) | 677 (97.8%) |
| 6 to 11 Years | 3,813 (97.1%) | 4,160 (97.7%) |
| 12 to 14 Years | 2,884 (99.4%) | 2,166 (98.1%) |
| 15 Years | 739 (92.5%) | 859 (98.4%) |
| 16 and 17 Years | 1,582 (98.1%) | 1,098 (93.4%) |
| 18 to 24 Years | 3,463 (96.7%) | 2,224 (95.2%) |
| 25 to 34 Years | 3,369 (96.5%) | 3,209 (91.2%) |
| 35 to 44 Years | 5,972 (99.1%) | 7,273 (97.0%) |
| 45 to 54 Years | 8,013 (96.9%) | 7,603 (95.5%) |
| 55 to 64 Years | 5,638 (97.9%) | 4,238 (92.8%) |
| 65 to 74 Years | 2,246 (96.4%) | 2,795 (92.4%) |
| 75 Years and over | 1,645 (90.0%) | 2,215 (87.0%) |
| Total | 41,778 (97.1%) | 40,555 (94.4%) |
Income Below Poverty Among Married-Couple Families in San Ramon
The poverty statistics for married-couple families in San Ramon show that 1.3% or 262 of the total 20,199 families live below the poverty line. Families with 3 or 4 children have the highest poverty rate of 4.5%, comprising of 61 families. On the other hand, families with 1 or 2 children have the lowest poverty rate of 1.0%, which includes 103 families.
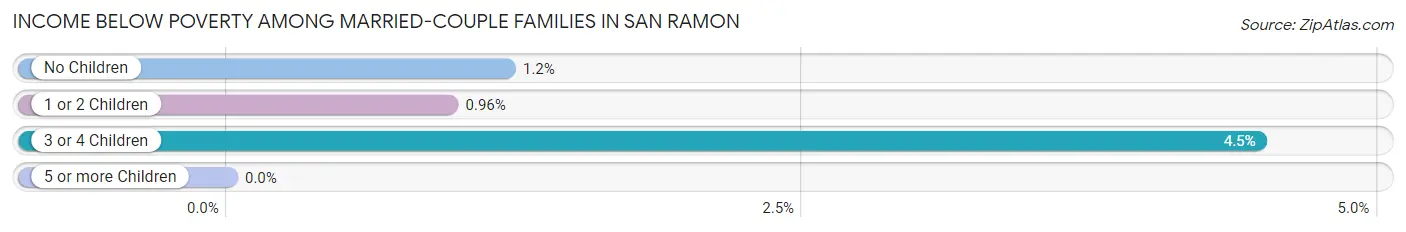
| Children | Above Poverty | Below Poverty |
| No Children | 7,969 (98.8%) | 98 (1.2%) |
| 1 or 2 Children | 10,666 (99.0%) | 103 (1.0%) |
| 3 or 4 Children | 1,302 (95.5%) | 61 (4.5%) |
| 5 or more Children | 0 (0.0%) | 0 (0.0%) |
| Total | 19,937 (98.7%) | 262 (1.3%) |
Income Below Poverty Among Single-Parent Households in San Ramon
According to the poverty data in San Ramon, 8.7% or 92 single-father households and 14.9% or 328 single-mother households are living below the poverty line. Among single-father households, those with no children have the highest poverty rate, with 49 households (10.6%) experiencing poverty. Likewise, among single-mother households, those with 3 or 4 children have the highest poverty rate, with 27 households (22.1%) falling below the poverty line.
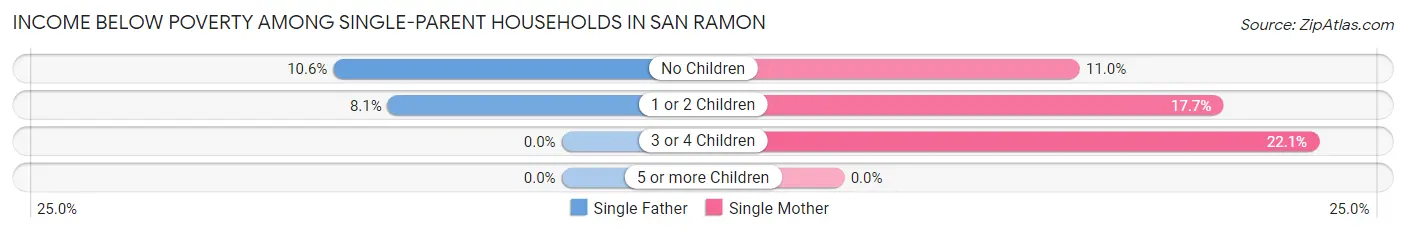
| Children | Single Father | Single Mother |
| No Children | 49 (10.6%) | 107 (11.0%) |
| 1 or 2 Children | 43 (8.1%) | 194 (17.7%) |
| 3 or 4 Children | 0 (0.0%) | 27 (22.1%) |
| 5 or more Children | 0 (0.0%) | 0 (0.0%) |
| Total | 92 (8.7%) | 328 (14.9%) |
Income Below Poverty Among Married-Couple vs Single-Parent Households in San Ramon
The poverty data for San Ramon shows that 262 of the married-couple family households (1.3%) and 420 of the single-parent households (12.9%) are living below the poverty level. Within the married-couple family households, those with 3 or 4 children have the highest poverty rate, with 61 households (4.5%) falling below the poverty line. Among the single-parent households, those with 3 or 4 children have the highest poverty rate, with 27 household (15.1%) living below poverty.
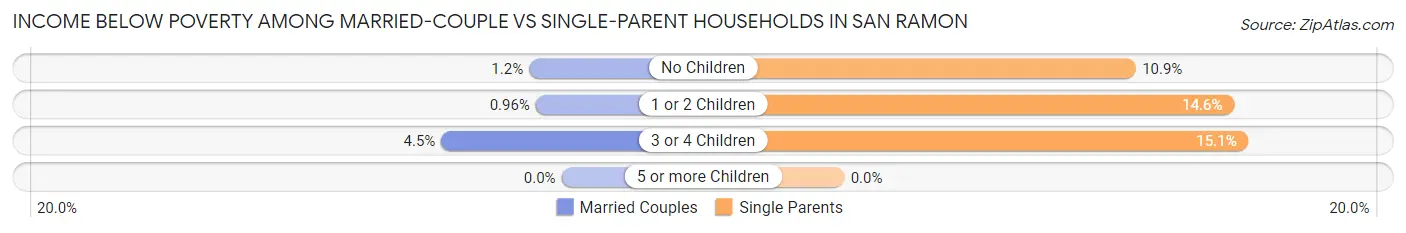
| Children | Married-Couple Families | Single-Parent Households |
| No Children | 98 (1.2%) | 156 (10.9%) |
| 1 or 2 Children | 103 (1.0%) | 237 (14.5%) |
| 3 or 4 Children | 61 (4.5%) | 27 (15.1%) |
| 5 or more Children | 0 (0.0%) | 0 (0.0%) |
| Total | 262 (1.3%) | 420 (12.9%) |
Race in San Ramon
The most populous races in San Ramon are Asian (41,421 | 48.1%), White / Caucasian (32,456 | 37.7%), and Hispanic or Latino (7,121 | 8.3%).
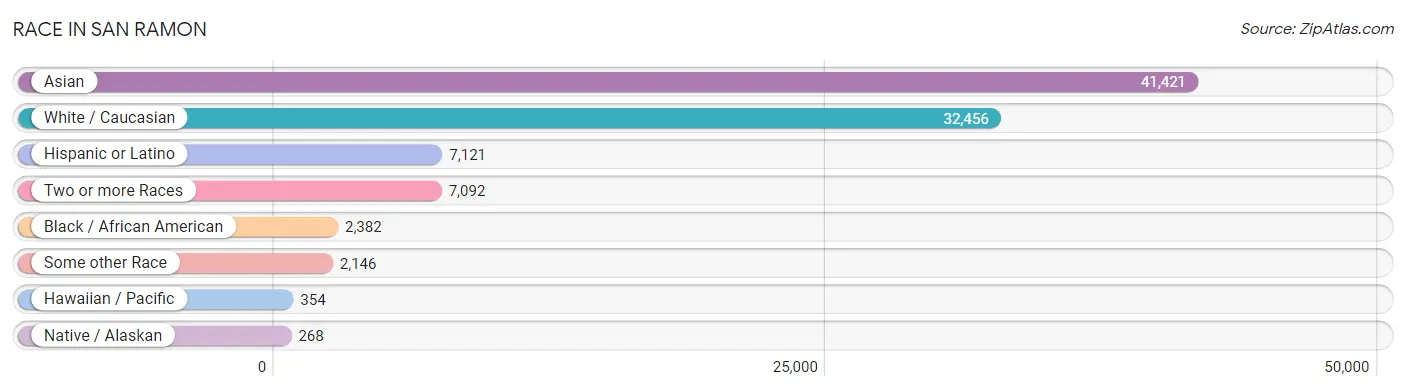
| Race | # Population | % Population |
| Asian | 41,421 | 48.1% |
| Black / African American | 2,382 | 2.8% |
| Hawaiian / Pacific | 354 | 0.4% |
| Hispanic or Latino | 7,121 | 8.3% |
| Native / Alaskan | 268 | 0.3% |
| White / Caucasian | 32,456 | 37.7% |
| Two or more Races | 7,092 | 8.2% |
| Some other Race | 2,146 | 2.5% |
| Total | 86,119 | 100.0% |
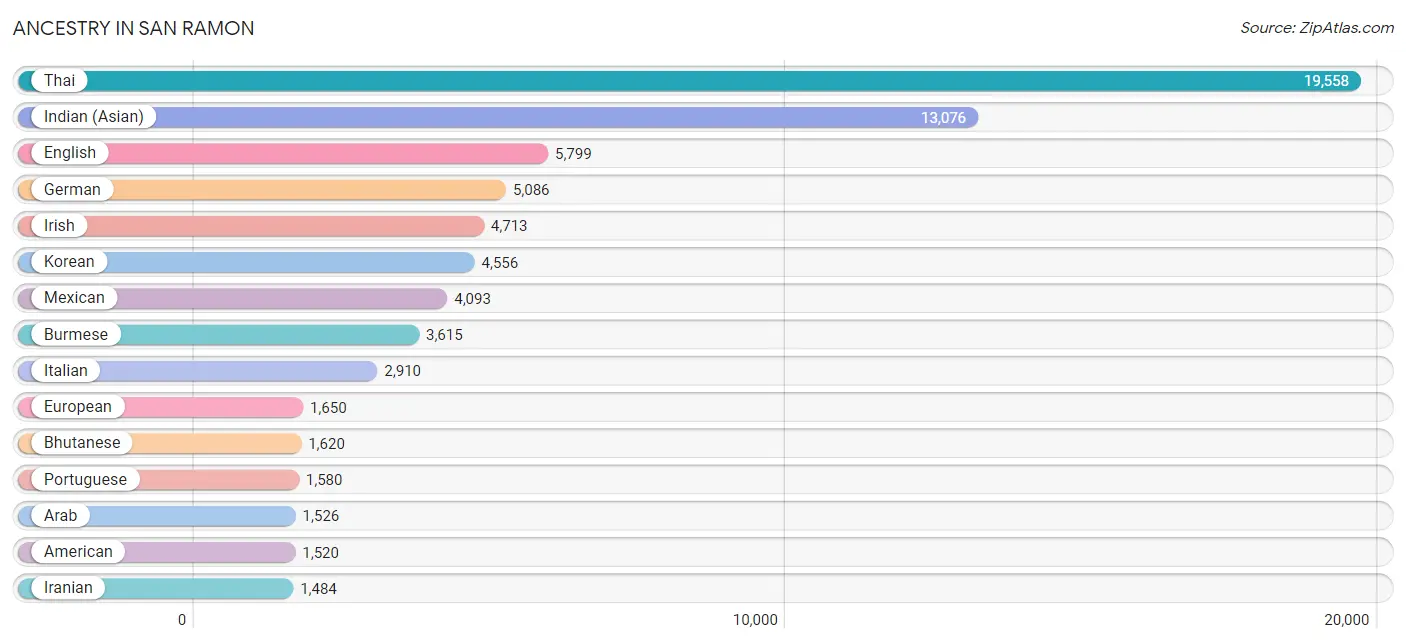
Ancestry in San Ramon
The most populous ancestries reported in San Ramon are Thai (19,558 | 22.7%), Indian (Asian) (13,076 | 15.2%), English (5,799 | 6.7%), German (5,086 | 5.9%), and Irish (4,713 | 5.5%), together accounting for 56.0% of all San Ramon residents.
| Ancestry | # Population | % Population |
| Afghan | 242 | 0.3% |
| African | 82 | 0.1% |
| Alsatian | 6 | 0.0% |
| American | 1,520 | 1.8% |
| Apache | 33 | 0.0% |
| Arab | 1,526 | 1.8% |
| Argentinean | 113 | 0.1% |
| Armenian | 289 | 0.3% |
| Assyrian / Chaldean / Syriac | 33 | 0.0% |
| Australian | 96 | 0.1% |
| Austrian | 128 | 0.2% |
| Bahamian | 12 | 0.0% |
| Bangladeshi | 11 | 0.0% |
| Basque | 8 | 0.0% |
| Belgian | 35 | 0.0% |
| Bermudan | 11 | 0.0% |
| Bhutanese | 1,620 | 1.9% |
| Blackfeet | 9 | 0.0% |
| Bolivian | 8 | 0.0% |
| Brazilian | 89 | 0.1% |
| British | 428 | 0.5% |
| Bulgarian | 74 | 0.1% |
| Burmese | 3,615 | 4.2% |
| Cambodian | 18 | 0.0% |
| Canadian | 86 | 0.1% |
| Central American | 574 | 0.7% |
| Central American Indian | 6 | 0.0% |
| Cherokee | 300 | 0.4% |
| Chilean | 18 | 0.0% |
| Choctaw | 104 | 0.1% |
| Colombian | 348 | 0.4% |
| Costa Rican | 40 | 0.1% |
| Croatian | 45 | 0.1% |
| Cuban | 58 | 0.1% |
| Czech | 100 | 0.1% |
| Czechoslovakian | 66 | 0.1% |
| Danish | 614 | 0.7% |
| Dominican | 94 | 0.1% |
| Dutch | 486 | 0.6% |
| Eastern European | 175 | 0.2% |
| Ecuadorian | 334 | 0.4% |
| Egyptian | 694 | 0.8% |
| English | 5,799 | 6.7% |
| Estonian | 63 | 0.1% |
| Ethiopian | 28 | 0.0% |
| European | 1,650 | 1.9% |
| Filipino | 693 | 0.8% |
| Finnish | 107 | 0.1% |
| French | 953 | 1.1% |
| French Canadian | 92 | 0.1% |
| German | 5,086 | 5.9% |
| Ghanaian | 9 | 0.0% |
| Greek | 674 | 0.8% |
| Guamanian / Chamorro | 92 | 0.1% |
| Guatemalan | 48 | 0.1% |
| Haitian | 52 | 0.1% |
| Honduran | 6 | 0.0% |
| Hungarian | 231 | 0.3% |
| Icelander | 24 | 0.0% |
| Indian (Asian) | 13,076 | 15.2% |
| Indonesian | 71 | 0.1% |
| Iranian | 1,484 | 1.7% |
| Iraqi | 53 | 0.1% |
| Irish | 4,713 | 5.5% |
| Israeli | 11 | 0.0% |
| Italian | 2,910 | 3.4% |
| Jamaican | 31 | 0.0% |
| Japanese | 225 | 0.3% |
| Jordanian | 10 | 0.0% |
| Korean | 4,556 | 5.3% |
| Laotian | 395 | 0.5% |
| Lebanese | 225 | 0.3% |
| Lithuanian | 105 | 0.1% |
| Maltese | 9 | 0.0% |
| Mexican | 4,093 | 4.8% |
| Mexican American Indian | 37 | 0.0% |
| Mongolian | 9 | 0.0% |
| Moroccan | 36 | 0.0% |
| Native Hawaiian | 213 | 0.3% |
| Navajo | 20 | 0.0% |
| Nepalese | 17 | 0.0% |
| Nicaraguan | 65 | 0.1% |
| Nigerian | 268 | 0.3% |
| Northern European | 198 | 0.2% |
| Norwegian | 575 | 0.7% |
| Okinawan | 17 | 0.0% |
| Pakistani | 74 | 0.1% |
| Palestinian | 8 | 0.0% |
| Panamanian | 199 | 0.2% |
| Peruvian | 222 | 0.3% |
| Pima | 7 | 0.0% |
| Polish | 983 | 1.1% |
| Portuguese | 1,580 | 1.8% |
| Puerto Rican | 273 | 0.3% |
| Romanian | 83 | 0.1% |
| Russian | 1,033 | 1.2% |
| Salvadoran | 191 | 0.2% |
| Samoan | 87 | 0.1% |
| Scandinavian | 246 | 0.3% |
| Scotch-Irish | 264 | 0.3% |
| Scottish | 1,080 | 1.3% |
| Slavic | 7 | 0.0% |
| Slovak | 109 | 0.1% |
| Slovene | 12 | 0.0% |
| South African | 96 | 0.1% |
| South American | 1,043 | 1.2% |
| Spaniard | 632 | 0.7% |
| Spanish | 114 | 0.1% |
| Spanish American | 126 | 0.2% |
| Sri Lankan | 804 | 0.9% |
| Subsaharan African | 483 | 0.6% |
| Swedish | 927 | 1.1% |
| Swiss | 62 | 0.1% |
| Syrian | 40 | 0.1% |
| Thai | 19,558 | 22.7% |
| Tongan | 137 | 0.2% |
| Trinidadian and Tobagonian | 69 | 0.1% |
| Turkish | 80 | 0.1% |
| Ukrainian | 192 | 0.2% |
| Vietnamese | 6 | 0.0% |
| Welsh | 292 | 0.3% |
| Yugoslavian | 62 | 0.1% | View All 122 Rows |
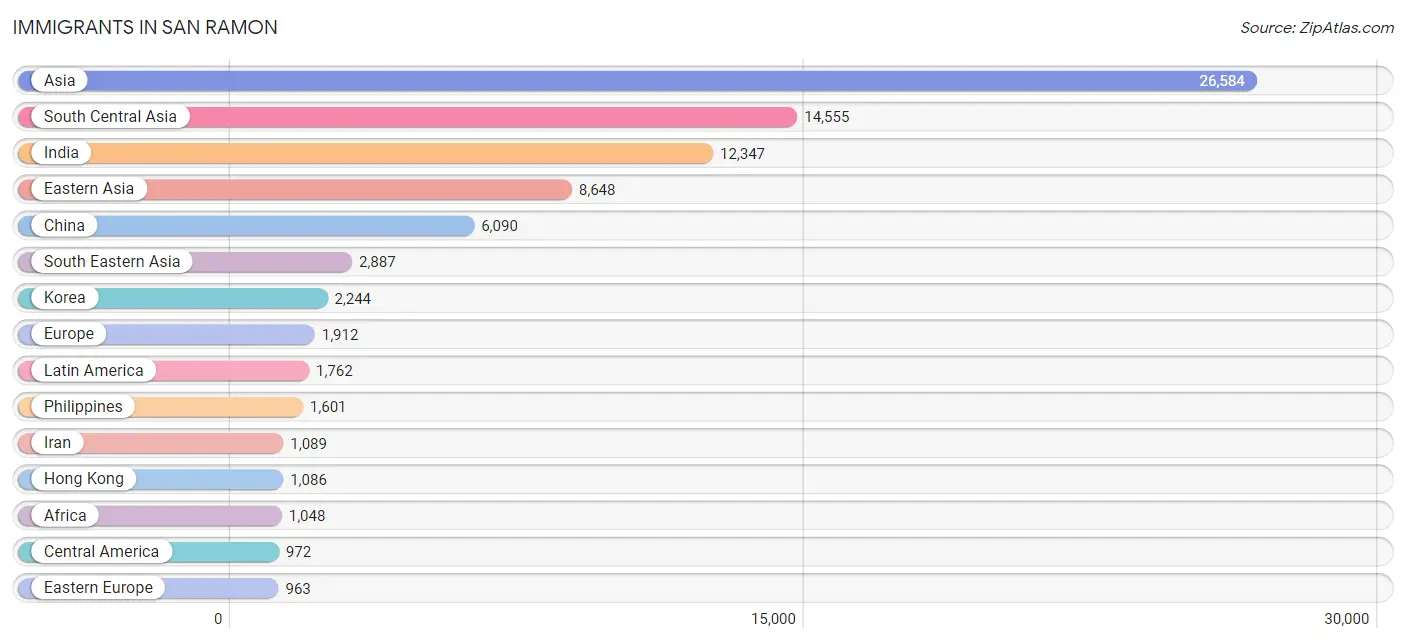
Immigrants in San Ramon
The most numerous immigrant groups reported in San Ramon came from Asia (26,584 | 30.9%), South Central Asia (14,555 | 16.9%), India (12,347 | 14.3%), Eastern Asia (8,648 | 10.0%), and China (6,090 | 7.1%), together accounting for 79.2% of all San Ramon residents.
| Immigration Origin | # Population | % Population |
| Afghanistan | 148 | 0.2% |
| Africa | 1,048 | 1.2% |
| Argentina | 120 | 0.1% |
| Armenia | 12 | 0.0% |
| Asia | 26,584 | 30.9% |
| Australia | 61 | 0.1% |
| Austria | 13 | 0.0% |
| Azores | 8 | 0.0% |
| Bangladesh | 6 | 0.0% |
| Belarus | 97 | 0.1% |
| Belgium | 6 | 0.0% |
| Brazil | 182 | 0.2% |
| Bulgaria | 50 | 0.1% |
| Cambodia | 48 | 0.1% |
| Canada | 237 | 0.3% |
| Caribbean | 136 | 0.2% |
| Central America | 972 | 1.1% |
| Chile | 26 | 0.0% |
| China | 6,090 | 7.1% |
| Colombia | 193 | 0.2% |
| Costa Rica | 11 | 0.0% |
| Czechoslovakia | 9 | 0.0% |
| Denmark | 81 | 0.1% |
| Dominican Republic | 6 | 0.0% |
| Eastern Africa | 117 | 0.1% |
| Eastern Asia | 8,648 | 10.0% |
| Eastern Europe | 963 | 1.1% |
| Ecuador | 30 | 0.0% |
| Egypt | 614 | 0.7% |
| El Salvador | 149 | 0.2% |
| England | 143 | 0.2% |
| Ethiopia | 28 | 0.0% |
| Europe | 1,912 | 2.2% |
| Fiji | 114 | 0.1% |
| France | 80 | 0.1% |
| Germany | 190 | 0.2% |
| Ghana | 9 | 0.0% |
| Greece | 21 | 0.0% |
| Guatemala | 33 | 0.0% |
| Haiti | 52 | 0.1% |
| Honduras | 3 | 0.0% |
| Hong Kong | 1,086 | 1.3% |
| Hungary | 55 | 0.1% |
| India | 12,347 | 14.3% |
| Indonesia | 323 | 0.4% |
| Iran | 1,089 | 1.3% |
| Iraq | 74 | 0.1% |
| Ireland | 49 | 0.1% |
| Israel | 137 | 0.2% |
| Italy | 16 | 0.0% |
| Japan | 296 | 0.3% |
| Jordan | 15 | 0.0% |
| Kazakhstan | 28 | 0.0% |
| Kenya | 50 | 0.1% |
| Korea | 2,244 | 2.6% |
| Laos | 16 | 0.0% |
| Latin America | 1,762 | 2.1% |
| Lebanon | 148 | 0.2% |
| Lithuania | 13 | 0.0% |
| Malaysia | 55 | 0.1% |
| Mexico | 647 | 0.7% |
| Morocco | 36 | 0.0% |
| Nepal | 59 | 0.1% |
| Netherlands | 46 | 0.1% |
| Nicaragua | 89 | 0.1% |
| Nigeria | 177 | 0.2% |
| Northern Africa | 657 | 0.8% |
| Northern Europe | 454 | 0.5% |
| Oceania | 304 | 0.4% |
| Pakistan | 587 | 0.7% |
| Panama | 15 | 0.0% |
| Peru | 103 | 0.1% |
| Philippines | 1,601 | 1.9% |
| Portugal | 53 | 0.1% |
| Romania | 134 | 0.2% |
| Russia | 468 | 0.5% |
| Saudi Arabia | 26 | 0.0% |
| Scotland | 17 | 0.0% |
| Singapore | 75 | 0.1% |
| South Africa | 88 | 0.1% |
| South America | 654 | 0.8% |
| South Central Asia | 14,555 | 16.9% |
| South Eastern Asia | 2,887 | 3.4% |
| Southern Europe | 160 | 0.2% |
| Spain | 70 | 0.1% |
| Sri Lanka | 267 | 0.3% |
| Syria | 15 | 0.0% |
| Taiwan | 855 | 1.0% |
| Thailand | 44 | 0.1% |
| Trinidad and Tobago | 78 | 0.1% |
| Turkey | 26 | 0.0% |
| Uganda | 7 | 0.0% |
| Ukraine | 92 | 0.1% |
| Uzbekistan | 24 | 0.0% |
| Vietnam | 629 | 0.7% |
| Western Africa | 186 | 0.2% |
| Western Asia | 485 | 0.6% |
| Western Europe | 335 | 0.4% | View All 98 Rows |
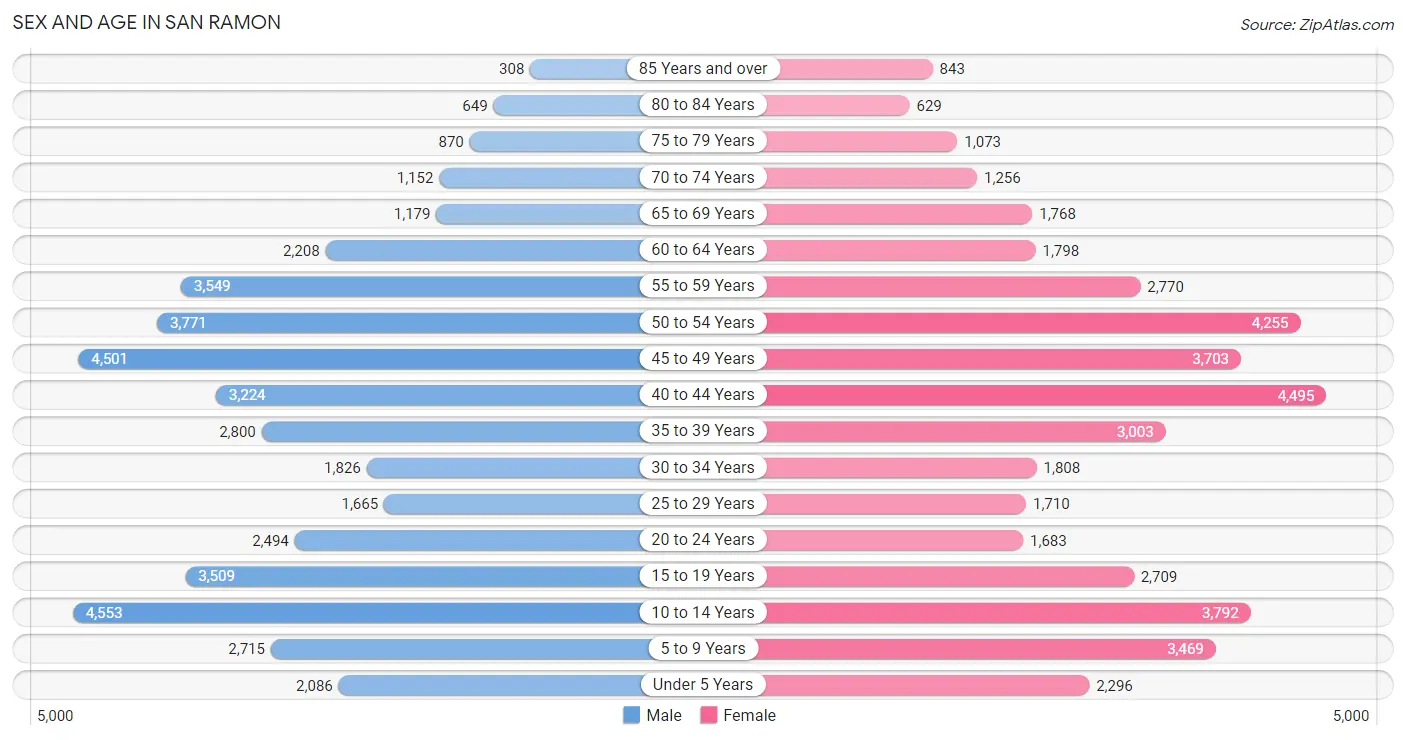
Sex and Age in San Ramon
Sex and Age in San Ramon
The most populous age groups in San Ramon are 10 to 14 Years (4,553 | 10.6%) for men and 40 to 44 Years (4,495 | 10.4%) for women.
| Age Bracket | Male | Female |
| Under 5 Years | 2,086 (4.8%) | 2,296 (5.3%) |
| 5 to 9 Years | 2,715 (6.3%) | 3,469 (8.1%) |
| 10 to 14 Years | 4,553 (10.6%) | 3,792 (8.8%) |
| 15 to 19 Years | 3,509 (8.2%) | 2,709 (6.3%) |
| 20 to 24 Years | 2,494 (5.8%) | 1,683 (3.9%) |
| 25 to 29 Years | 1,665 (3.9%) | 1,710 (4.0%) |
| 30 to 34 Years | 1,826 (4.2%) | 1,808 (4.2%) |
| 35 to 39 Years | 2,800 (6.5%) | 3,003 (7.0%) |
| 40 to 44 Years | 3,224 (7.5%) | 4,495 (10.4%) |
| 45 to 49 Years | 4,501 (10.4%) | 3,703 (8.6%) |
| 50 to 54 Years | 3,771 (8.8%) | 4,255 (9.9%) |
| 55 to 59 Years | 3,549 (8.2%) | 2,770 (6.4%) |
| 60 to 64 Years | 2,208 (5.1%) | 1,798 (4.2%) |
| 65 to 69 Years | 1,179 (2.7%) | 1,768 (4.1%) |
| 70 to 74 Years | 1,152 (2.7%) | 1,256 (2.9%) |
| 75 to 79 Years | 870 (2.0%) | 1,073 (2.5%) |
| 80 to 84 Years | 649 (1.5%) | 629 (1.5%) |
| 85 Years and over | 308 (0.7%) | 843 (2.0%) |
| Total | 43,059 (100.0%) | 43,060 (100.0%) |
Families and Households in San Ramon
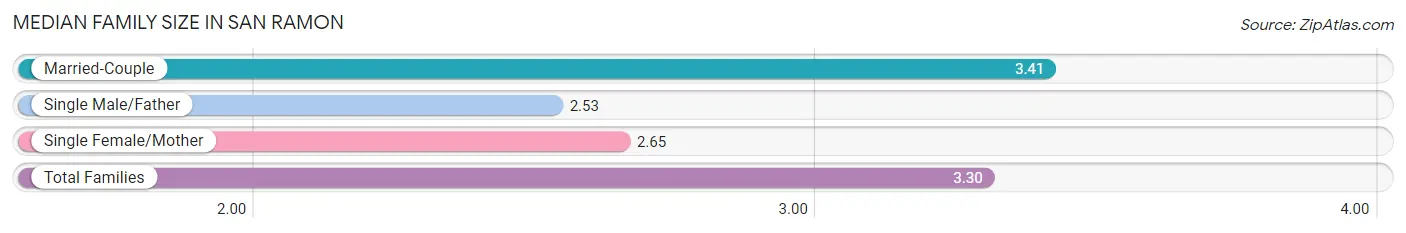
Median Family Size in San Ramon
The median family size in San Ramon is 3.30 persons per family, with married-couple families (20,199 | 86.1%) accounting for the largest median family size of 3.41 persons per family. On the other hand, single male/father families (1,057 | 4.5%) represent the smallest median family size with 2.53 persons per family.
| Family Type | # Families | Family Size |
| Married-Couple | 20,199 (86.1%) | 3.41 |
| Single Male/Father | 1,057 (4.5%) | 2.53 |
| Single Female/Mother | 2,196 (9.4%) | 2.65 |
| Total Families | 23,452 (100.0%) | 3.30 |
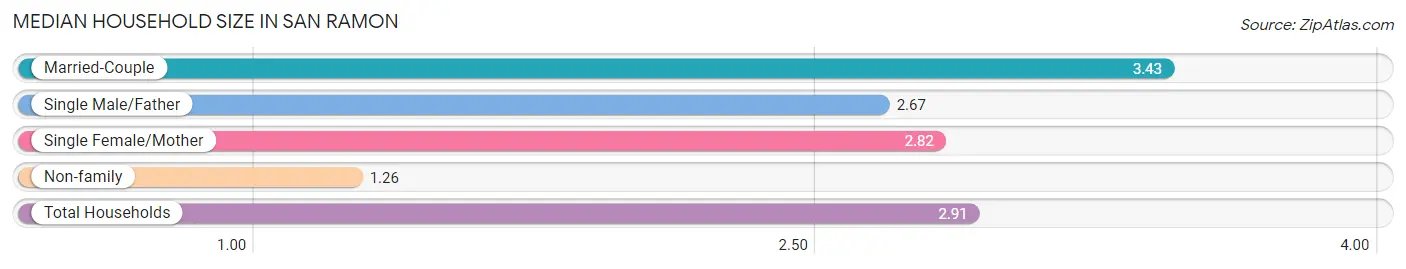
Median Household Size in San Ramon
The median household size in San Ramon is 2.91 persons per household, with married-couple households (20,199 | 68.3%) accounting for the largest median household size of 3.43 persons per household. non-family households (6,133 | 20.7%) represent the smallest median household size with 1.26 persons per household.
| Household Type | # Households | Household Size |
| Married-Couple | 20,199 (68.3%) | 3.43 |
| Single Male/Father | 1,057 (3.6%) | 2.67 |
| Single Female/Mother | 2,196 (7.4%) | 2.82 |
| Non-family | 6,133 (20.7%) | 1.26 |
| Total Households | 29,585 (100.0%) | 2.91 |
Household Size by Marriage Status in San Ramon
Out of a total of 29,585 households in San Ramon, 23,452 (79.3%) are family households, while 6,133 (20.7%) are nonfamily households. The most numerous type of family households are 4-person households, comprising 7,656, and the most common type of nonfamily households are 1-person households, comprising 4,818.
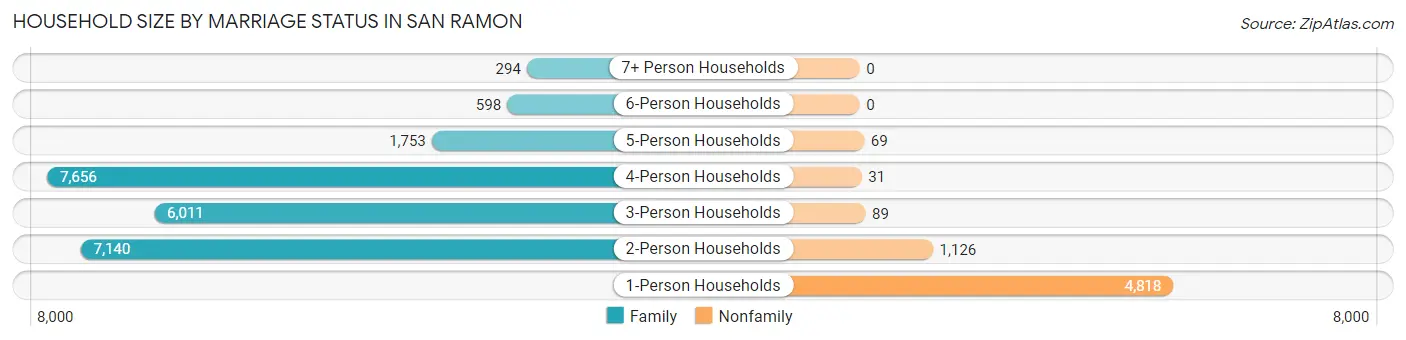
| Household Size | Family Households | Nonfamily Households |
| 1-Person Households | - | 4,818 (16.3%) |
| 2-Person Households | 7,140 (24.1%) | 1,126 (3.8%) |
| 3-Person Households | 6,011 (20.3%) | 89 (0.3%) |
| 4-Person Households | 7,656 (25.9%) | 31 (0.1%) |
| 5-Person Households | 1,753 (5.9%) | 69 (0.2%) |
| 6-Person Households | 598 (2.0%) | 0 (0.0%) |
| 7+ Person Households | 294 (1.0%) | 0 (0.0%) |
| Total | 23,452 (79.3%) | 6,133 (20.7%) |
Female Fertility in San Ramon
Fertility by Age in San Ramon
Average fertility rate in San Ramon is 44.0 births per 1,000 women. Women in the age bracket of 20 to 34 years have the highest fertility rate with 82.0 births per 1,000 women. Women in the age bracket of 35 to 50 years acount for 51.5% of all women with births.
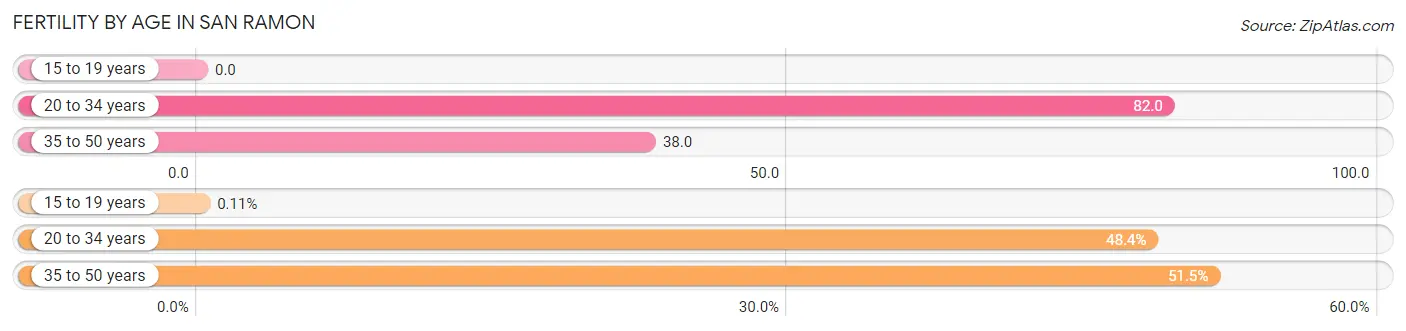
| Age Bracket | Women with Births | Births / 1,000 Women |
| 15 to 19 years | 1 (0.1%) | 0.0 |
| 20 to 34 years | 429 (48.4%) | 82.0 |
| 35 to 50 years | 457 (51.5%) | 38.0 |
| Total | 887 (100.0%) | 44.0 |
Fertility by Age by Marriage Status in San Ramon
96.8% of women with births (887) in San Ramon are married. The highest percentage of unmarried women with births falls into 15 to 19 years age bracket with 100.0% of them unmarried at the time of birth, while the lowest percentage of unmarried women with births belong to 35 to 50 years age bracket with 1.7% of them unmarried.
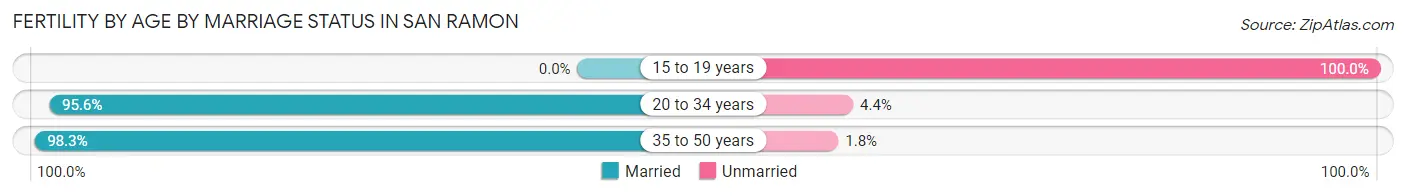
| Age Bracket | Married | Unmarried |
| 15 to 19 years | 0 (0.0%) | 1 (100.0%) |
| 20 to 34 years | 410 (95.6%) | 19 (4.4%) |
| 35 to 50 years | 449 (98.3%) | 8 (1.8%) |
| Total | 859 (96.8%) | 28 (3.2%) |
Fertility by Education in San Ramon
Average fertility rate in San Ramon is 44.0 births per 1,000 women. Women with the education attainment of high school diploma have the highest fertility rate of 63.0 births per 1,000 women, while women with the education attainment of less than high school have the lowest fertility at 14.0 births per 1,000 women. Women with the education attainment of bachelor's degree represent 39.5% of all women with births.
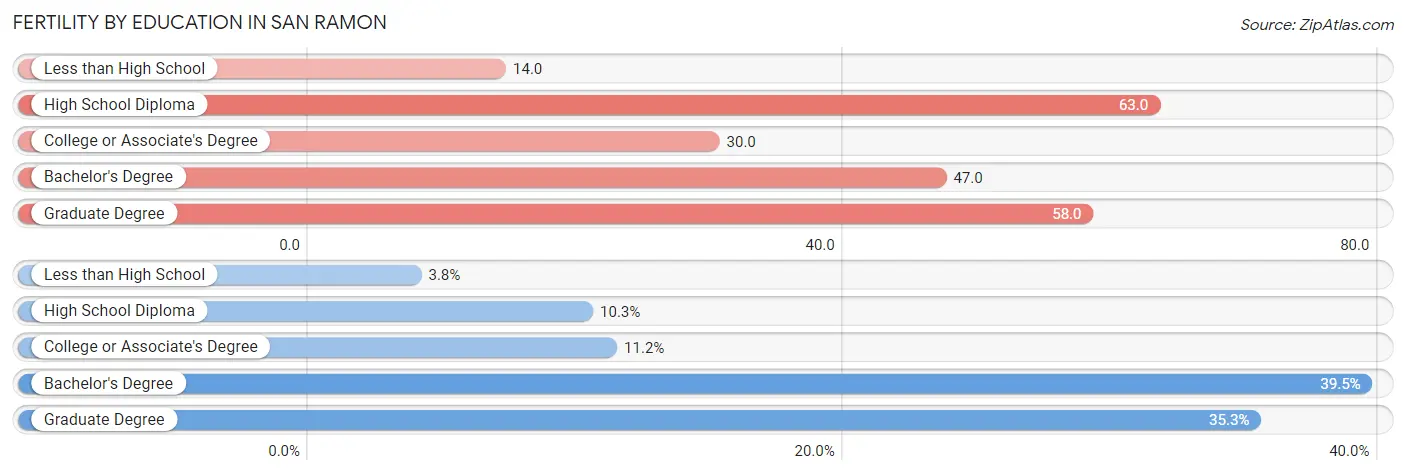
| Educational Attainment | Women with Births | Births / 1,000 Women |
| Less than High School | 34 (3.8%) | 14.0 |
| High School Diploma | 91 (10.3%) | 63.0 |
| College or Associate's Degree | 99 (11.2%) | 30.0 |
| Bachelor's Degree | 350 (39.5%) | 47.0 |
| Graduate Degree | 313 (35.3%) | 58.0 |
| Total | 887 (100.0%) | 44.0 |
Fertility by Education by Marriage Status in San Ramon
3.2% of women with births in San Ramon are unmarried. Women with the educational attainment of high school diploma are most likely to be married with 100.0% of them married at childbirth, while women with the educational attainment of college or associate's degree are least likely to be married with 8.1% of them unmarried at childbirth.
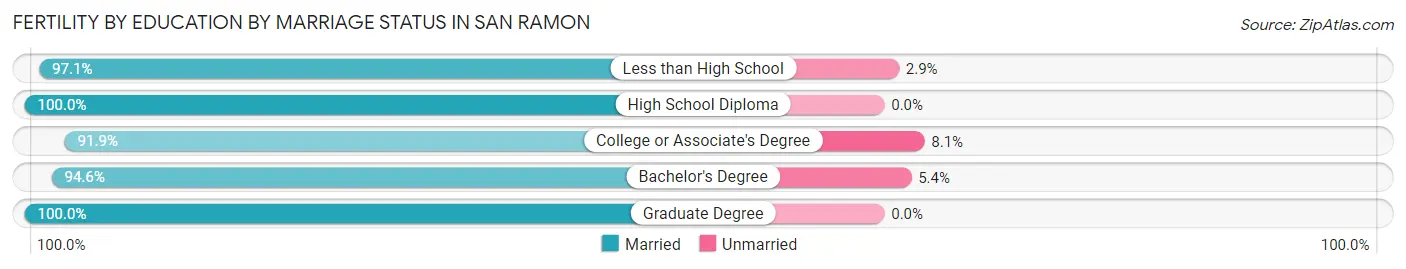
| Educational Attainment | Married | Unmarried |
| Less than High School | 33 (97.1%) | 1 (2.9%) |
| High School Diploma | 91 (100.0%) | 0 (0.0%) |
| College or Associate's Degree | 91 (91.9%) | 8 (8.1%) |
| Bachelor's Degree | 331 (94.6%) | 19 (5.4%) |
| Graduate Degree | 313 (100.0%) | 0 (0.0%) |
| Total | 859 (96.8%) | 28 (3.2%) |
Employment Characteristics in San Ramon
Employment by Class of Employer in San Ramon
Among the 42,193 employed individuals in San Ramon, private company employees (30,887 | 73.2%), local government employees (3,049 | 7.2%), and not-for-profit organizations (2,812 | 6.7%) make up the most common classes of employment.
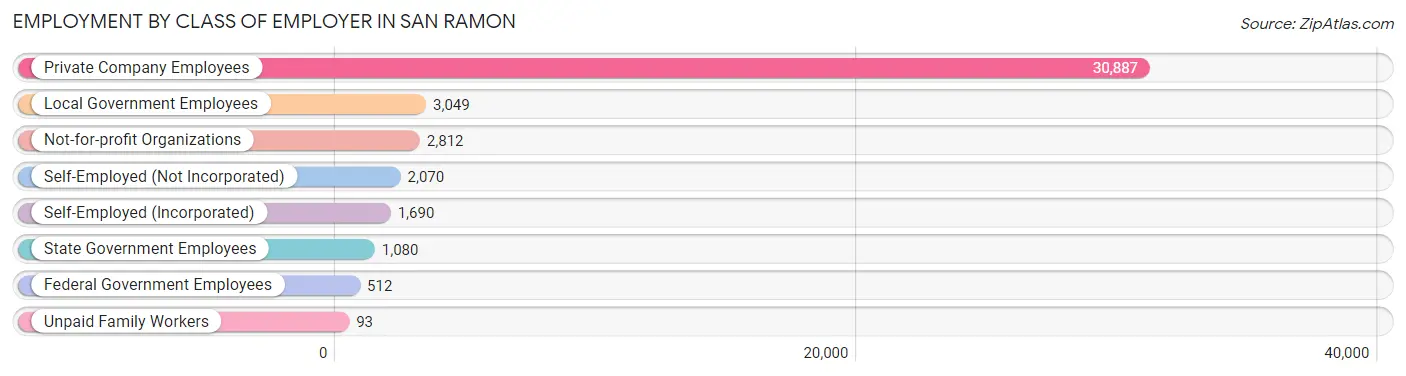
| Employer Class | # Employees | % Employees |
| Private Company Employees | 30,887 | 73.2% |
| Self-Employed (Incorporated) | 1,690 | 4.0% |
| Self-Employed (Not Incorporated) | 2,070 | 4.9% |
| Not-for-profit Organizations | 2,812 | 6.7% |
| Local Government Employees | 3,049 | 7.2% |
| State Government Employees | 1,080 | 2.6% |
| Federal Government Employees | 512 | 1.2% |
| Unpaid Family Workers | 93 | 0.2% |
| Total | 42,193 | 100.0% |
Employment Status by Age in San Ramon
According to the labor force statistics for San Ramon, out of the total population over 16 years of age (65,533), 69.3% or 45,414 individuals are in the labor force, with 5.0% or 2,271 of them unemployed. The age group with the highest labor force participation rate is 45 to 54 years, with 85.8% or 13,925 individuals in the labor force. Within the labor force, the 20 to 24 years age range has the highest percentage of unemployed individuals, with 11.9% or 369 of them being unemployed.
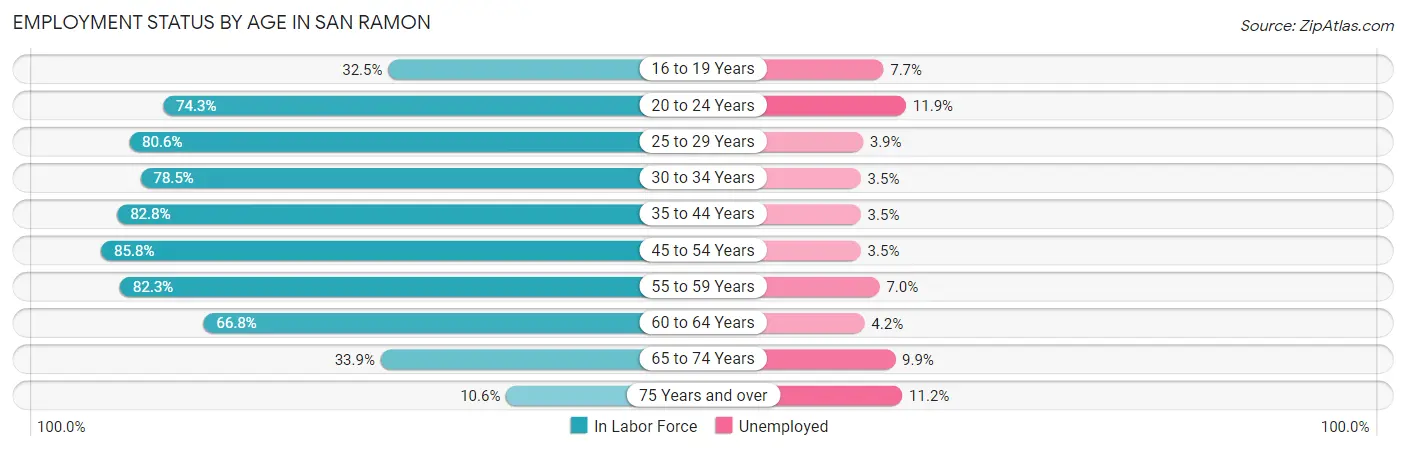
| Age Bracket | In Labor Force | Unemployed |
| 16 to 19 Years | 1,476 (32.5%) | 114 (7.7%) |
| 20 to 24 Years | 3,104 (74.3%) | 369 (11.9%) |
| 25 to 29 Years | 2,720 (80.6%) | 106 (3.9%) |
| 30 to 34 Years | 2,853 (78.5%) | 100 (3.5%) |
| 35 to 44 Years | 11,196 (82.8%) | 392 (3.5%) |
| 45 to 54 Years | 13,925 (85.8%) | 487 (3.5%) |
| 55 to 59 Years | 5,201 (82.3%) | 364 (7.0%) |
| 60 to 64 Years | 2,676 (66.8%) | 112 (4.2%) |
| 65 to 74 Years | 1,815 (33.9%) | 180 (9.9%) |
| 75 Years and over | 463 (10.6%) | 52 (11.2%) |
| Total | 45,414 (69.3%) | 2,271 (5.0%) |
Employment Status by Educational Attainment in San Ramon
According to labor force statistics for San Ramon, 81.9% of individuals (38,563) out of the total population between 25 and 64 years of age (47,086) are in the labor force, with 4.0% or 1,543 of them being unemployed. The group with the highest labor force participation rate are those with the educational attainment of bachelor's degree or higher, with 85.7% or 30,309 individuals in the labor force. Within the labor force, individuals with college / associate degree education have the highest percentage of unemployment, with 8.1% or 455 of them being unemployed.
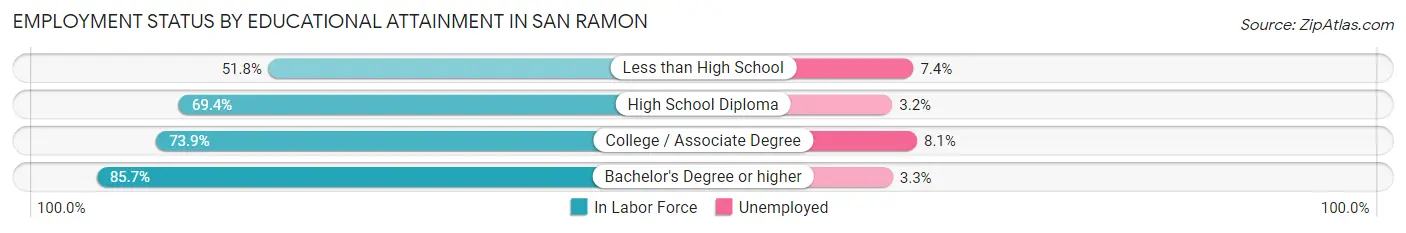
| Educational Attainment | In Labor Force | Unemployed |
| Less than High School | 636 (51.8%) | 91 (7.4%) |
| High School Diploma | 2,008 (69.4%) | 93 (3.2%) |
| College / Associate Degree | 5,616 (73.9%) | 616 (8.1%) |
| Bachelor's Degree or higher | 30,309 (85.7%) | 1,167 (3.3%) |
| Total | 38,563 (81.9%) | 1,883 (4.0%) |
Employment Occupations by Sex in San Ramon
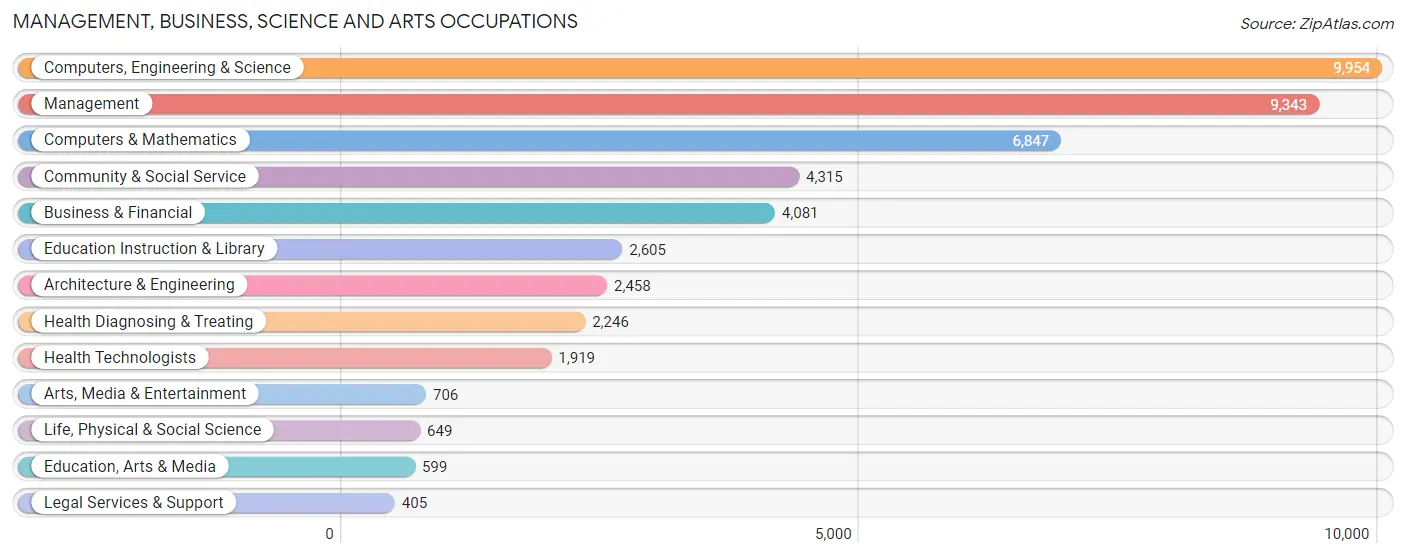
Management, Business, Science and Arts Occupations
The most common Management, Business, Science and Arts occupations in San Ramon are Computers, Engineering & Science (9,954 | 23.1%), Management (9,343 | 21.7%), Computers & Mathematics (6,847 | 15.9%), Community & Social Service (4,315 | 10.0%), and Business & Financial (4,081 | 9.5%).
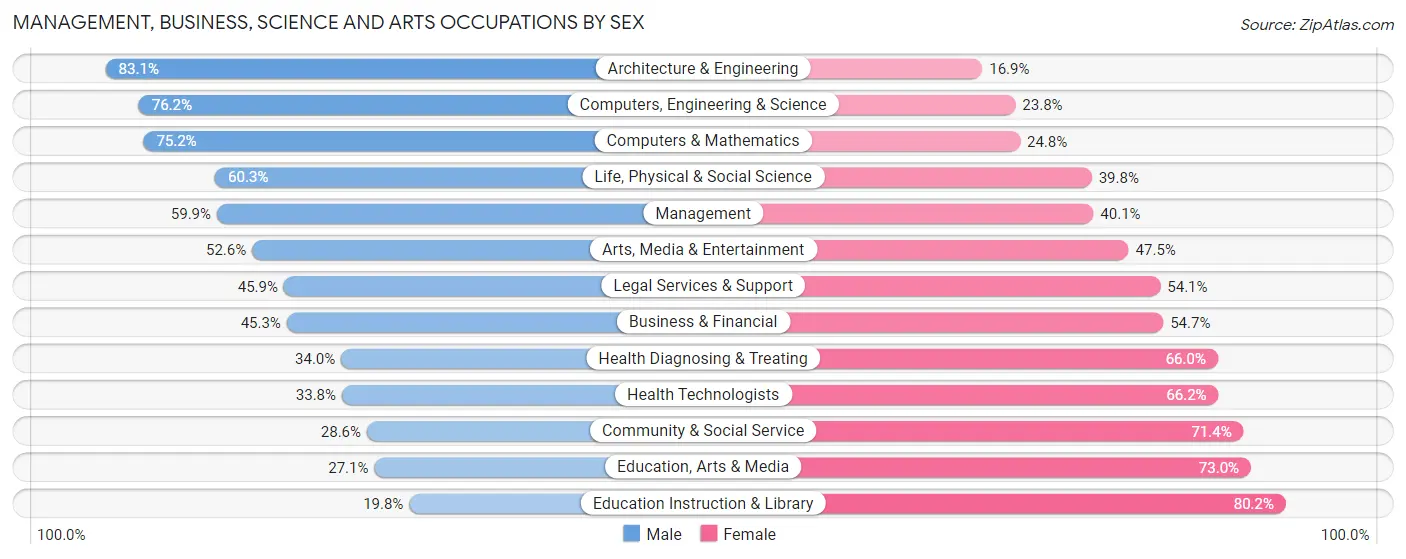
Management, Business, Science and Arts Occupations by Sex
Within the Management, Business, Science and Arts occupations in San Ramon, the most male-oriented occupations are Architecture & Engineering (83.1%), Computers, Engineering & Science (76.2%), and Computers & Mathematics (75.2%), while the most female-oriented occupations are Education Instruction & Library (80.2%), Education, Arts & Media (73.0%), and Community & Social Service (71.4%).
| Occupation | Male | Female |
| Management | 5,596 (59.9%) | 3,747 (40.1%) |
| Business & Financial | 1,850 (45.3%) | 2,231 (54.7%) |
| Computers, Engineering & Science | 7,582 (76.2%) | 2,372 (23.8%) |
| Computers & Mathematics | 5,149 (75.2%) | 1,698 (24.8%) |
| Architecture & Engineering | 2,042 (83.1%) | 416 (16.9%) |
| Life, Physical & Social Science | 391 (60.3%) | 258 (39.8%) |
| Community & Social Service | 1,234 (28.6%) | 3,081 (71.4%) |
| Education, Arts & Media | 162 (27.1%) | 437 (73.0%) |
| Legal Services & Support | 186 (45.9%) | 219 (54.1%) |
| Education Instruction & Library | 515 (19.8%) | 2,090 (80.2%) |
| Arts, Media & Entertainment | 371 (52.5%) | 335 (47.4%) |
| Health Diagnosing & Treating | 763 (34.0%) | 1,483 (66.0%) |
| Health Technologists | 649 (33.8%) | 1,270 (66.2%) |
| Total (Category) | 17,025 (56.9%) | 12,914 (43.1%) |
| Total (Overall) | 24,299 (56.3%) | 18,836 (43.7%) |
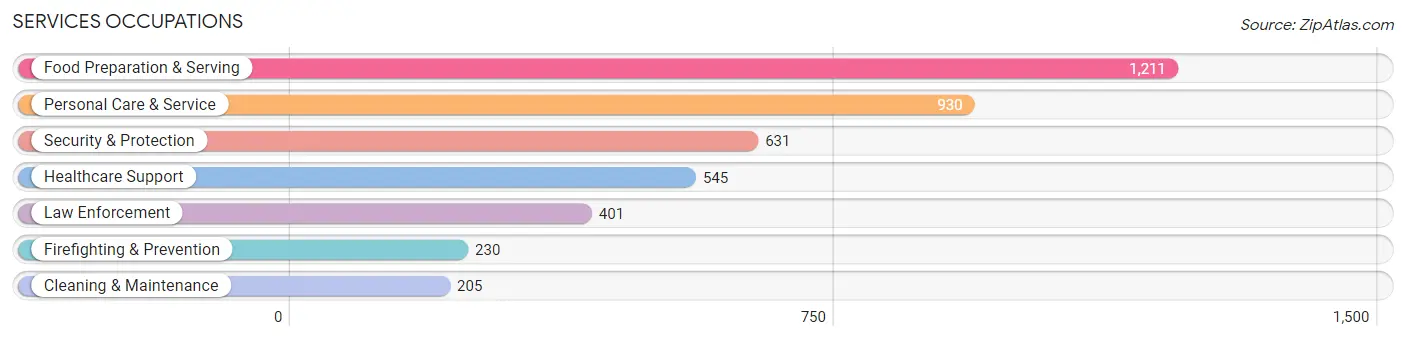
Services Occupations
The most common Services occupations in San Ramon are Food Preparation & Serving (1,211 | 2.8%), Personal Care & Service (930 | 2.2%), Security & Protection (631 | 1.5%), Healthcare Support (545 | 1.3%), and Law Enforcement (401 | 0.9%).
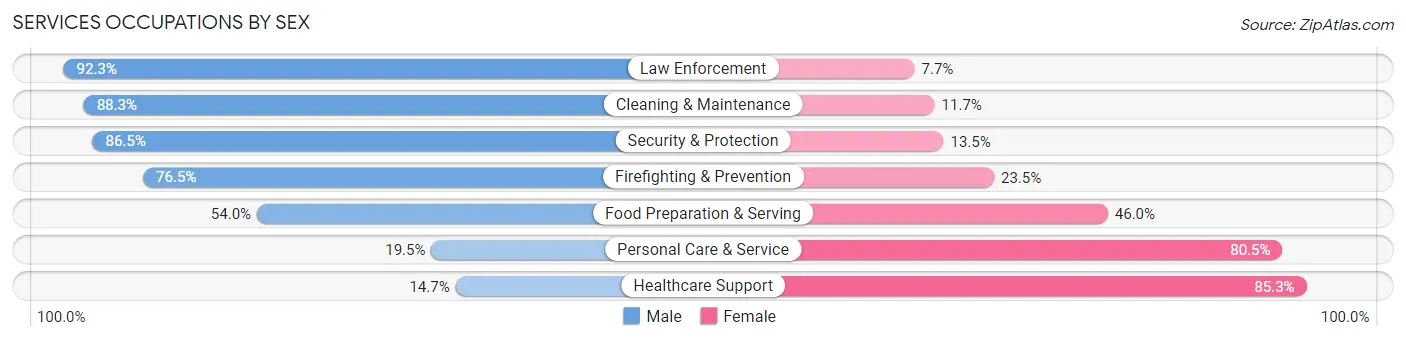
Services Occupations by Sex
Within the Services occupations in San Ramon, the most male-oriented occupations are Law Enforcement (92.3%), Cleaning & Maintenance (88.3%), and Security & Protection (86.5%), while the most female-oriented occupations are Healthcare Support (85.3%), Personal Care & Service (80.5%), and Food Preparation & Serving (46.0%).
| Occupation | Male | Female |
| Healthcare Support | 80 (14.7%) | 465 (85.3%) |
| Security & Protection | 546 (86.5%) | 85 (13.5%) |
| Firefighting & Prevention | 176 (76.5%) | 54 (23.5%) |
| Law Enforcement | 370 (92.3%) | 31 (7.7%) |
| Food Preparation & Serving | 654 (54.0%) | 557 (46.0%) |
| Cleaning & Maintenance | 181 (88.3%) | 24 (11.7%) |
| Personal Care & Service | 181 (19.5%) | 749 (80.5%) |
| Total (Category) | 1,642 (46.6%) | 1,880 (53.4%) |
| Total (Overall) | 24,299 (56.3%) | 18,836 (43.7%) |
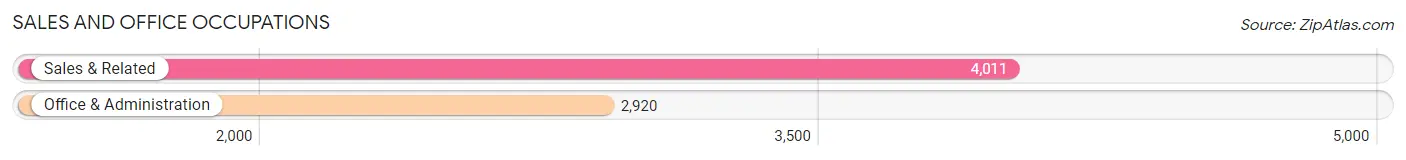
Sales and Office Occupations
The most common Sales and Office occupations in San Ramon are Sales & Related (4,011 | 9.3%), and Office & Administration (2,920 | 6.8%).
Sales and Office Occupations by Sex
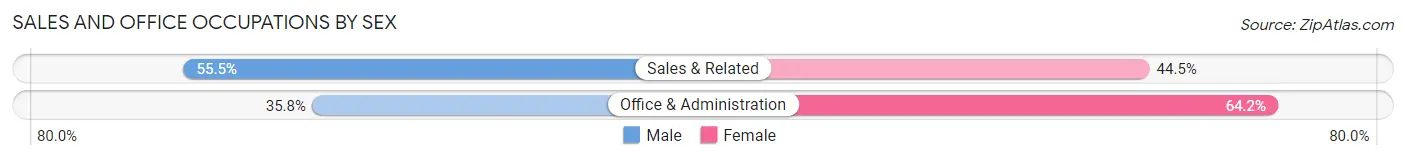
| Occupation | Male | Female |
| Sales & Related | 2,227 (55.5%) | 1,784 (44.5%) |
| Office & Administration | 1,046 (35.8%) | 1,874 (64.2%) |
| Total (Category) | 3,273 (47.2%) | 3,658 (52.8%) |
| Total (Overall) | 24,299 (56.3%) | 18,836 (43.7%) |
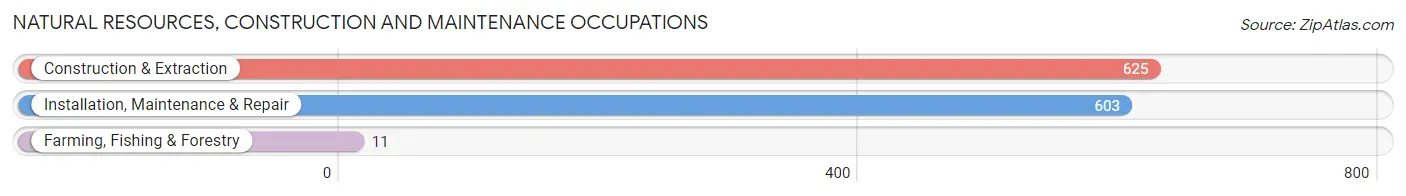
Natural Resources, Construction and Maintenance Occupations
The most common Natural Resources, Construction and Maintenance occupations in San Ramon are Construction & Extraction (625 | 1.5%), Installation, Maintenance & Repair (603 | 1.4%), and Farming, Fishing & Forestry (11 | 0.0%).
Natural Resources, Construction and Maintenance Occupations by Sex
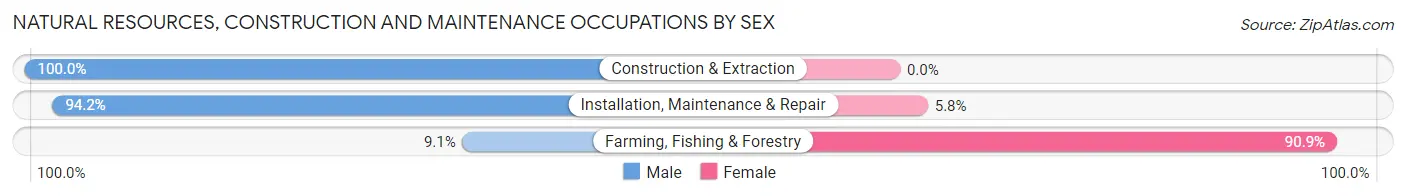
| Occupation | Male | Female |
| Farming, Fishing & Forestry | 1 (9.1%) | 10 (90.9%) |
| Construction & Extraction | 625 (100.0%) | 0 (0.0%) |
| Installation, Maintenance & Repair | 568 (94.2%) | 35 (5.8%) |
| Total (Category) | 1,194 (96.4%) | 45 (3.6%) |
| Total (Overall) | 24,299 (56.3%) | 18,836 (43.7%) |
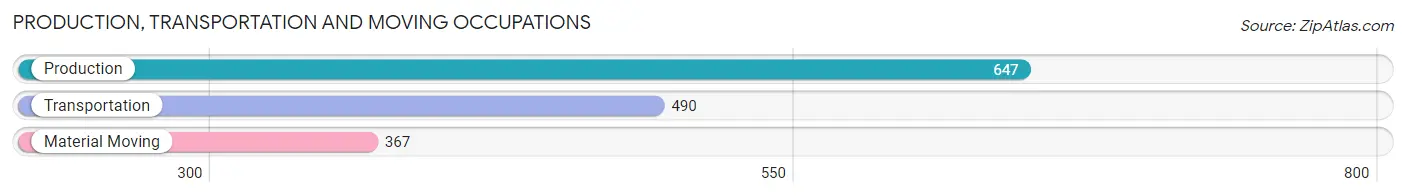
Production, Transportation and Moving Occupations
The most common Production, Transportation and Moving occupations in San Ramon are Production (647 | 1.5%), Transportation (490 | 1.1%), and Material Moving (367 | 0.9%).
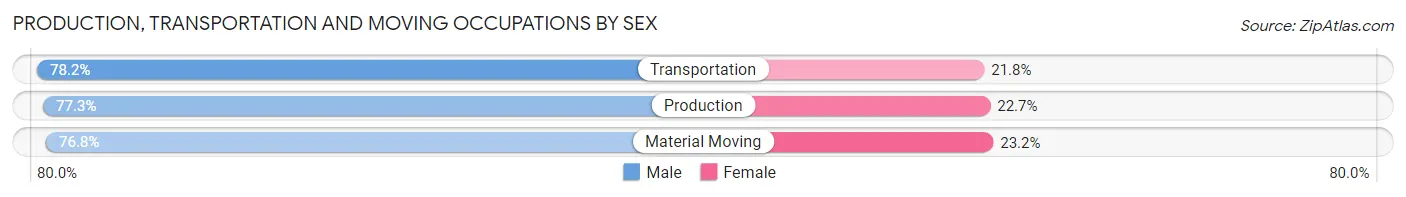
Production, Transportation and Moving Occupations by Sex
| Occupation | Male | Female |
| Production | 500 (77.3%) | 147 (22.7%) |
| Transportation | 383 (78.2%) | 107 (21.8%) |
| Material Moving | 282 (76.8%) | 85 (23.2%) |
| Total (Category) | 1,165 (77.5%) | 339 (22.5%) |
| Total (Overall) | 24,299 (56.3%) | 18,836 (43.7%) |
Employment Industries by Sex in San Ramon
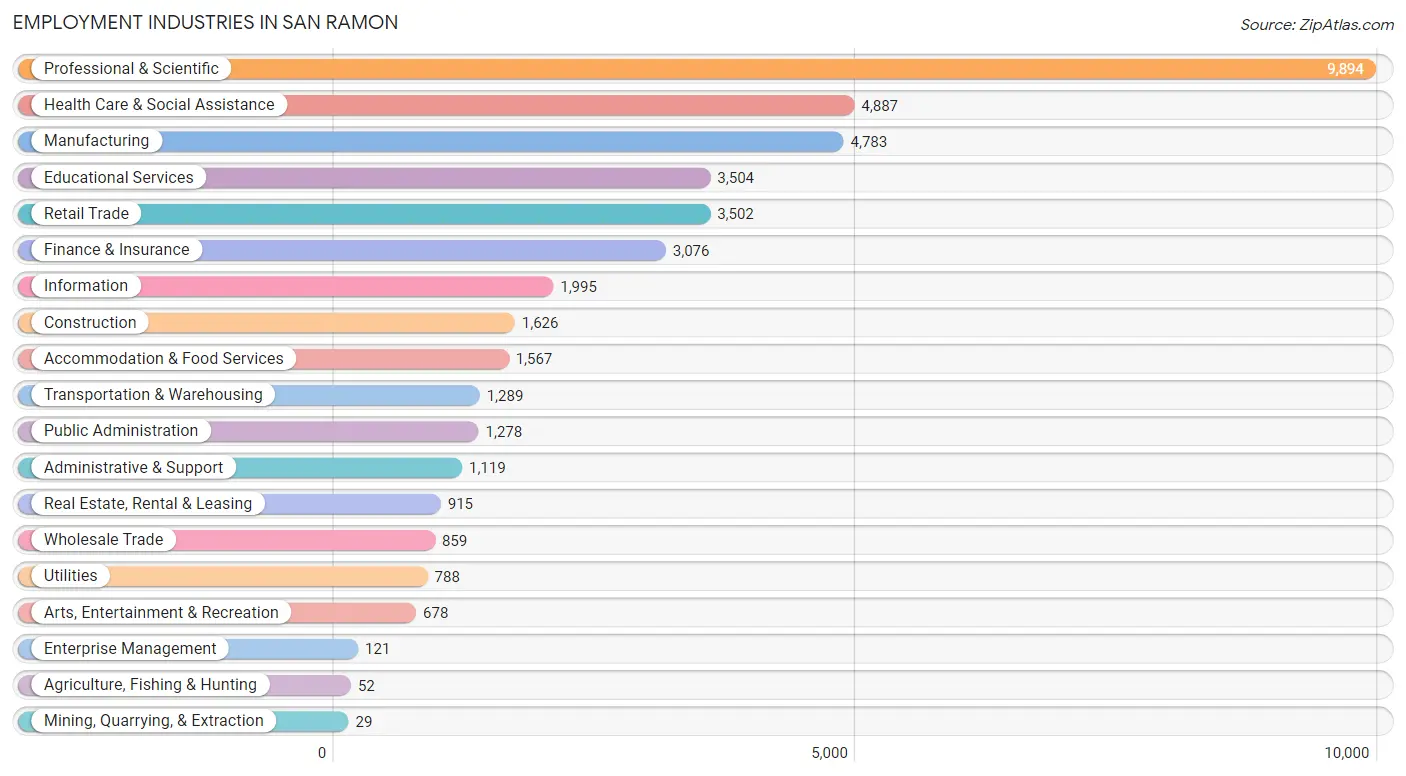
Employment Industries in San Ramon
The major employment industries in San Ramon include Professional & Scientific (9,894 | 22.9%), Health Care & Social Assistance (4,887 | 11.3%), Manufacturing (4,783 | 11.1%), Educational Services (3,504 | 8.1%), and Retail Trade (3,502 | 8.1%).
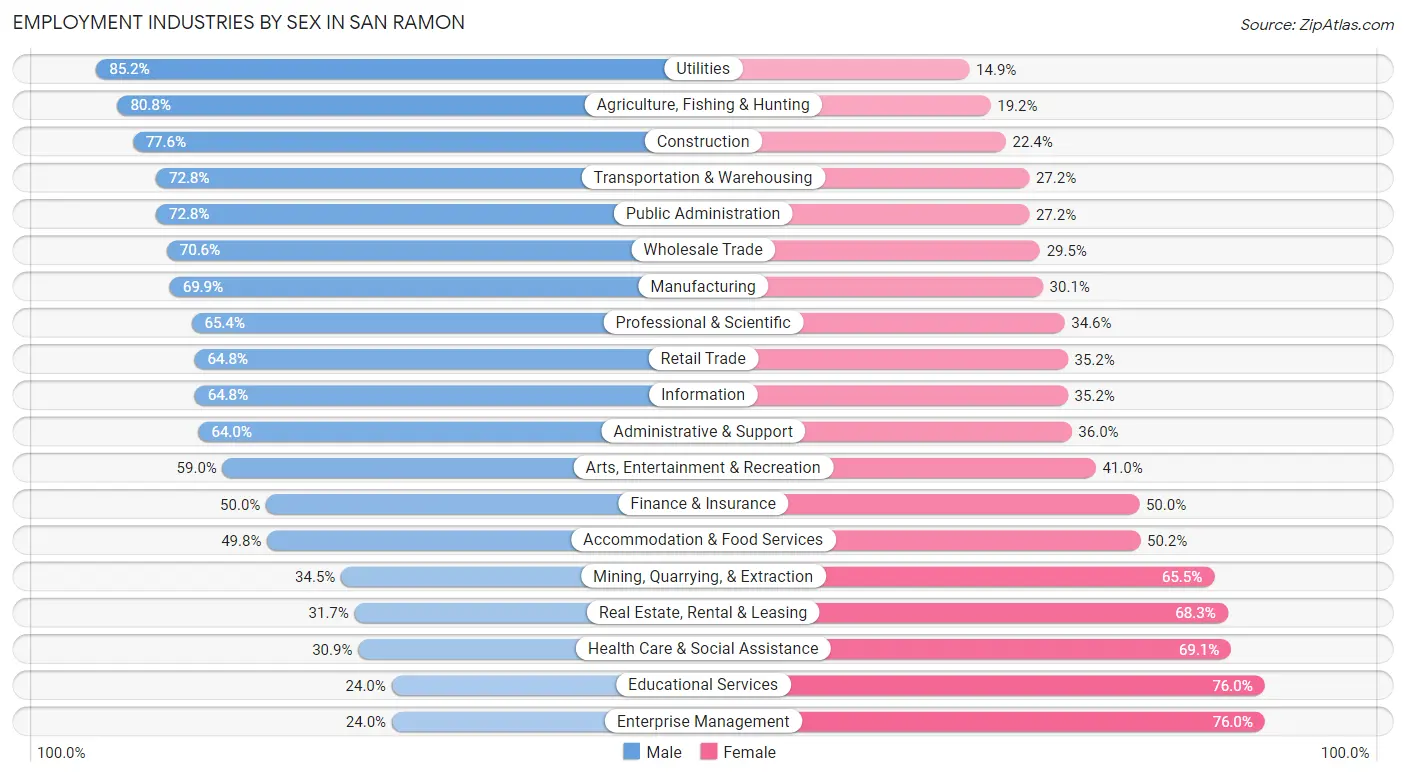
Employment Industries by Sex in San Ramon
The San Ramon industries that see more men than women are Utilities (85.2%), Agriculture, Fishing & Hunting (80.8%), and Construction (77.6%), whereas the industries that tend to have a higher number of women are Enterprise Management (76.0%), Educational Services (76.0%), and Health Care & Social Assistance (69.1%).
| Industry | Male | Female |
| Agriculture, Fishing & Hunting | 42 (80.8%) | 10 (19.2%) |
| Mining, Quarrying, & Extraction | 10 (34.5%) | 19 (65.5%) |
| Construction | 1,262 (77.6%) | 364 (22.4%) |
| Manufacturing | 3,345 (69.9%) | 1,438 (30.1%) |
| Wholesale Trade | 606 (70.6%) | 253 (29.4%) |
| Retail Trade | 2,269 (64.8%) | 1,233 (35.2%) |
| Transportation & Warehousing | 938 (72.8%) | 351 (27.2%) |
| Utilities | 671 (85.2%) | 117 (14.8%) |
| Information | 1,292 (64.8%) | 703 (35.2%) |
| Finance & Insurance | 1,538 (50.0%) | 1,538 (50.0%) |
| Real Estate, Rental & Leasing | 290 (31.7%) | 625 (68.3%) |
| Professional & Scientific | 6,475 (65.4%) | 3,419 (34.6%) |
| Enterprise Management | 29 (24.0%) | 92 (76.0%) |
| Administrative & Support | 716 (64.0%) | 403 (36.0%) |
| Educational Services | 842 (24.0%) | 2,662 (76.0%) |
| Health Care & Social Assistance | 1,512 (30.9%) | 3,375 (69.1%) |
| Arts, Entertainment & Recreation | 400 (59.0%) | 278 (41.0%) |
| Accommodation & Food Services | 780 (49.8%) | 787 (50.2%) |
| Public Administration | 930 (72.8%) | 348 (27.2%) |
| Total | 24,299 (56.3%) | 18,836 (43.7%) |
Education in San Ramon
School Enrollment in San Ramon
The most common levels of schooling among the 26,024 students in San Ramon are high school (6,323 | 24.3%), middle school (6,097 | 23.4%), and elementary school (5,186 | 19.9%).
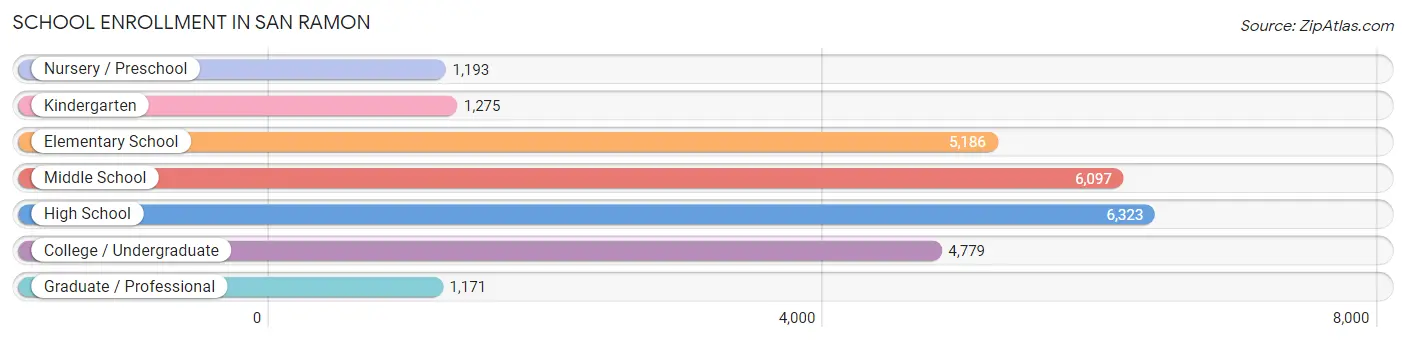
| School Level | # Students | % Students |
| Nursery / Preschool | 1,193 | 4.6% |
| Kindergarten | 1,275 | 4.9% |
| Elementary School | 5,186 | 19.9% |
| Middle School | 6,097 | 23.4% |
| High School | 6,323 | 24.3% |
| College / Undergraduate | 4,779 | 18.4% |
| Graduate / Professional | 1,171 | 4.5% |
| Total | 26,024 | 100.0% |
School Enrollment by Age by Funding Source in San Ramon
Out of a total of 26,024 students who are enrolled in schools in San Ramon, 2,915 (11.2%) attend a private institution, while the remaining 23,109 (88.8%) are enrolled in public schools. The age group of 3 to 4 year olds has the highest likelihood of being enrolled in private schools, with 769 (73.7% in the age bracket) enrolled. Conversely, the age group of 15 to 17 year olds has the lowest likelihood of being enrolled in a private school, with 4,365 (98.2% in the age bracket) attending a public institution.
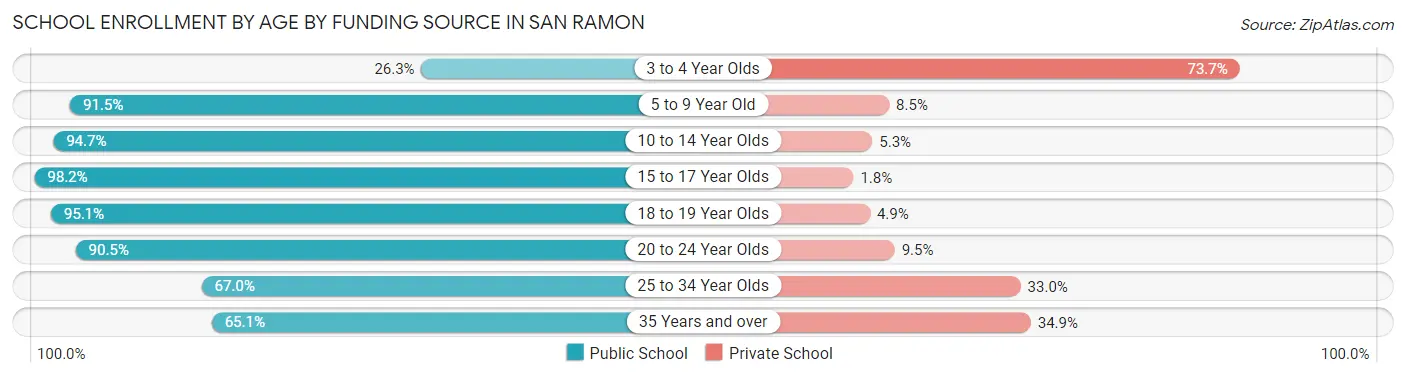
| Age Bracket | Public School | Private School |
| 3 to 4 Year Olds | 274 (26.3%) | 769 (73.7%) |
| 5 to 9 Year Old | 5,351 (91.5%) | 495 (8.5%) |
| 10 to 14 Year Olds | 7,629 (94.7%) | 430 (5.3%) |
| 15 to 17 Year Olds | 4,365 (98.2%) | 81 (1.8%) |
| 18 to 19 Year Olds | 1,572 (95.1%) | 81 (4.9%) |
| 20 to 24 Year Olds | 2,378 (90.5%) | 250 (9.5%) |
| 25 to 34 Year Olds | 740 (67.0%) | 364 (33.0%) |
| 35 Years and over | 811 (65.1%) | 434 (34.9%) |
| Total | 23,109 (88.8%) | 2,915 (11.2%) |
Educational Attainment by Field of Study in San Ramon
Engineering (8,216 | 19.2%), business (7,783 | 18.2%), computers & mathematics (6,188 | 14.5%), social sciences (3,290 | 7.7%), and science & technology (3,130 | 7.3%) are the most common fields of study among 42,712 individuals in San Ramon who have obtained a bachelor's degree or higher.
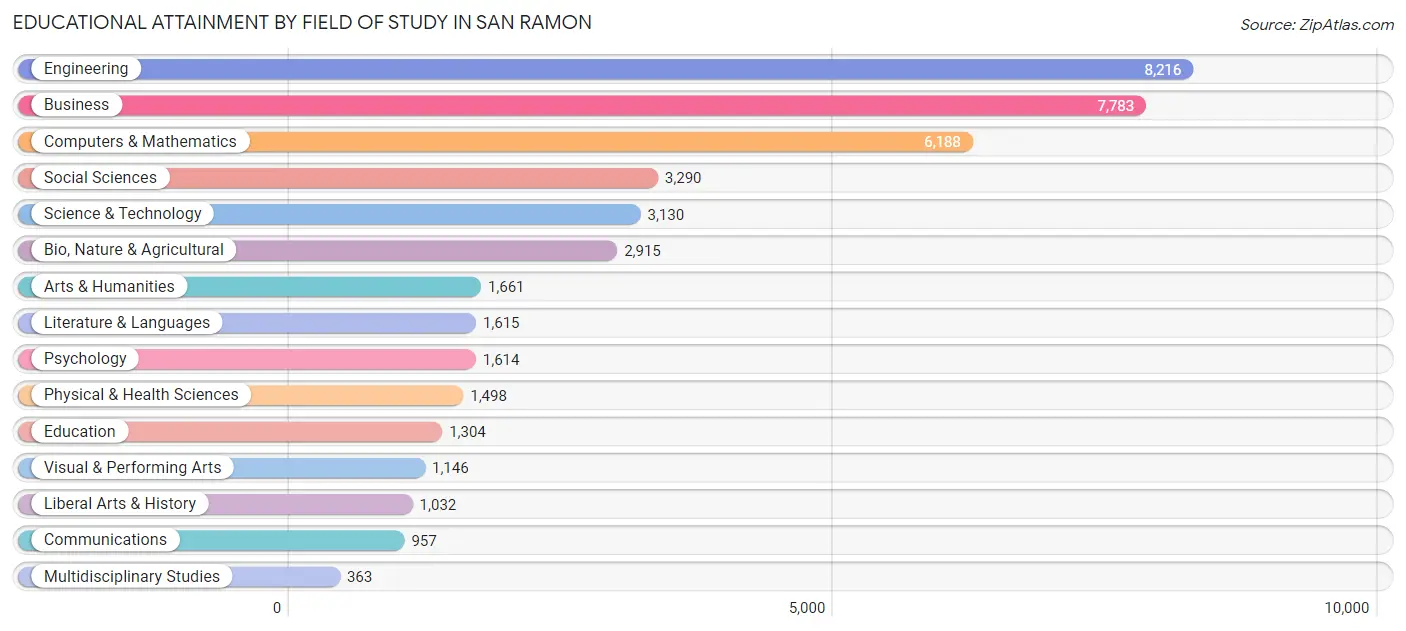
| Field of Study | # Graduates | % Graduates |
| Computers & Mathematics | 6,188 | 14.5% |
| Bio, Nature & Agricultural | 2,915 | 6.8% |
| Physical & Health Sciences | 1,498 | 3.5% |
| Psychology | 1,614 | 3.8% |
| Social Sciences | 3,290 | 7.7% |
| Engineering | 8,216 | 19.2% |
| Multidisciplinary Studies | 363 | 0.9% |
| Science & Technology | 3,130 | 7.3% |
| Business | 7,783 | 18.2% |
| Education | 1,304 | 3.0% |
| Literature & Languages | 1,615 | 3.8% |
| Liberal Arts & History | 1,032 | 2.4% |
| Visual & Performing Arts | 1,146 | 2.7% |
| Communications | 957 | 2.2% |
| Arts & Humanities | 1,661 | 3.9% |
| Total | 42,712 | 100.0% |
Transportation & Commute in San Ramon
Vehicle Availability by Sex in San Ramon
The most prevalent vehicle ownership categories in San Ramon are males with 2 vehicles (11,442, accounting for 47.8%) and females with 2 vehicles (8,058, making up 62.8%).
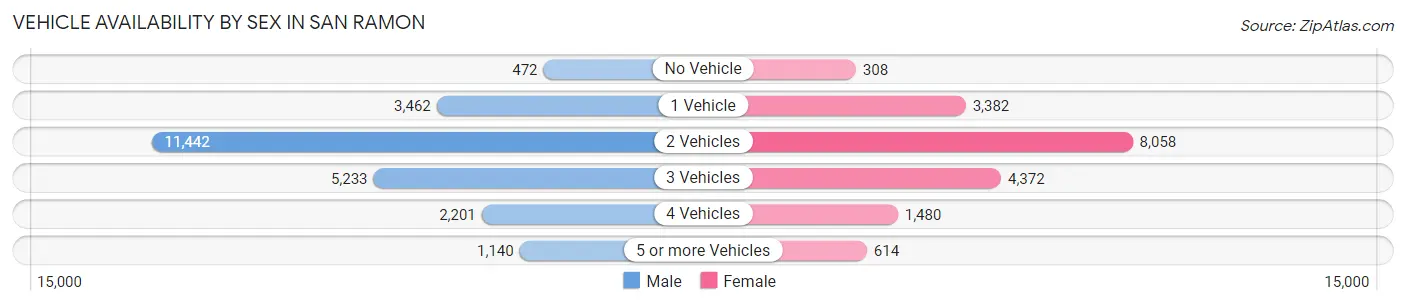
| Vehicles Available | Male | Female |
| No Vehicle | 472 (2.0%) | 308 (1.7%) |
| 1 Vehicle | 3,462 (14.5%) | 3,382 (18.6%) |
| 2 Vehicles | 11,442 (47.8%) | 8,058 (44.2%) |
| 3 Vehicles | 5,233 (21.8%) | 4,372 (24.0%) |
| 4 Vehicles | 2,201 (9.2%) | 1,480 (8.1%) |
| 5 or more Vehicles | 1,140 (4.8%) | 614 (3.4%) |
| Total | 23,950 (100.0%) | 18,214 (100.0%) |
Commute Time in San Ramon
The most frequently occuring commute durations in San Ramon are 60 to 89 minutes (5,214 commuters, 17.2%), 15 to 19 minutes (3,936 commuters, 13.0%), and 10 to 14 minutes (3,851 commuters, 12.7%).
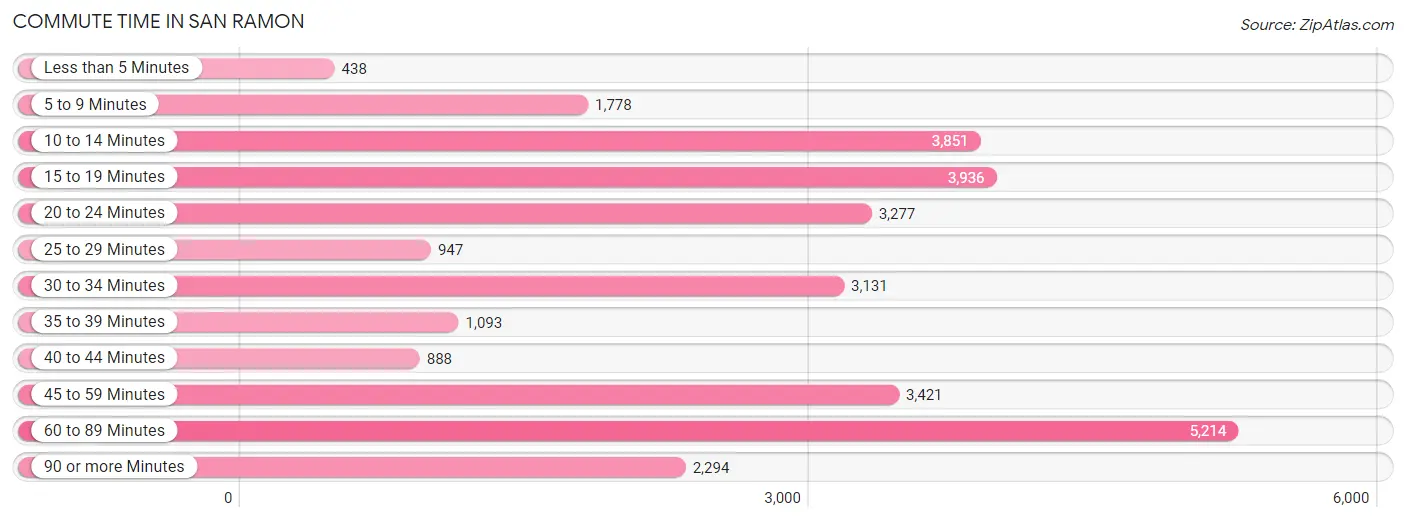
| Commute Time | # Commuters | % Commuters |
| Less than 5 Minutes | 438 | 1.5% |
| 5 to 9 Minutes | 1,778 | 5.9% |
| 10 to 14 Minutes | 3,851 | 12.7% |
| 15 to 19 Minutes | 3,936 | 13.0% |
| 20 to 24 Minutes | 3,277 | 10.8% |
| 25 to 29 Minutes | 947 | 3.1% |
| 30 to 34 Minutes | 3,131 | 10.3% |
| 35 to 39 Minutes | 1,093 | 3.6% |
| 40 to 44 Minutes | 888 | 2.9% |
| 45 to 59 Minutes | 3,421 | 11.3% |
| 60 to 89 Minutes | 5,214 | 17.2% |
| 90 or more Minutes | 2,294 | 7.6% |
Commute Time by Sex in San Ramon
The most common commute times in San Ramon are 60 to 89 minutes (3,701 commuters, 21.0%) for males and 15 to 19 minutes (2,340 commuters, 18.5%) for females.
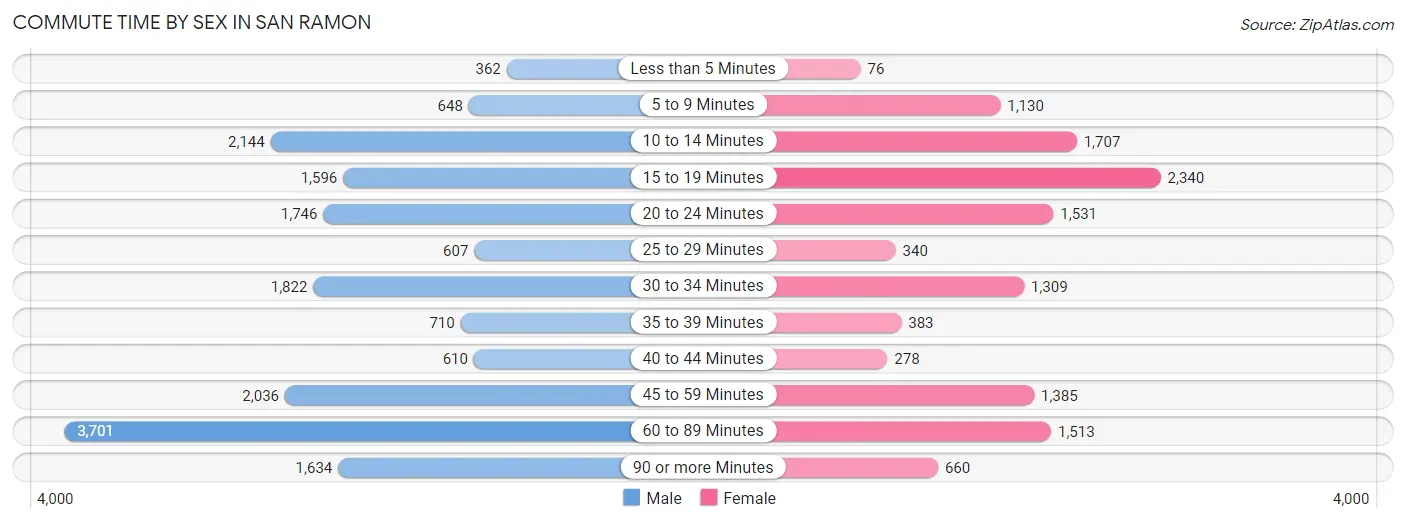
| Commute Time | Male | Female |
| Less than 5 Minutes | 362 (2.1%) | 76 (0.6%) |
| 5 to 9 Minutes | 648 (3.7%) | 1,130 (8.9%) |
| 10 to 14 Minutes | 2,144 (12.2%) | 1,707 (13.5%) |
| 15 to 19 Minutes | 1,596 (9.1%) | 2,340 (18.5%) |
| 20 to 24 Minutes | 1,746 (9.9%) | 1,531 (12.1%) |
| 25 to 29 Minutes | 607 (3.5%) | 340 (2.7%) |
| 30 to 34 Minutes | 1,822 (10.3%) | 1,309 (10.3%) |
| 35 to 39 Minutes | 710 (4.0%) | 383 (3.0%) |
| 40 to 44 Minutes | 610 (3.5%) | 278 (2.2%) |
| 45 to 59 Minutes | 2,036 (11.6%) | 1,385 (11.0%) |
| 60 to 89 Minutes | 3,701 (21.0%) | 1,513 (12.0%) |
| 90 or more Minutes | 1,634 (9.3%) | 660 (5.2%) |
Time of Departure to Work by Sex in San Ramon
The most frequent times of departure to work in San Ramon are 8:00 AM to 8:29 AM (3,331, 18.9%) for males and 7:00 AM to 7:29 AM (2,131, 16.8%) for females.
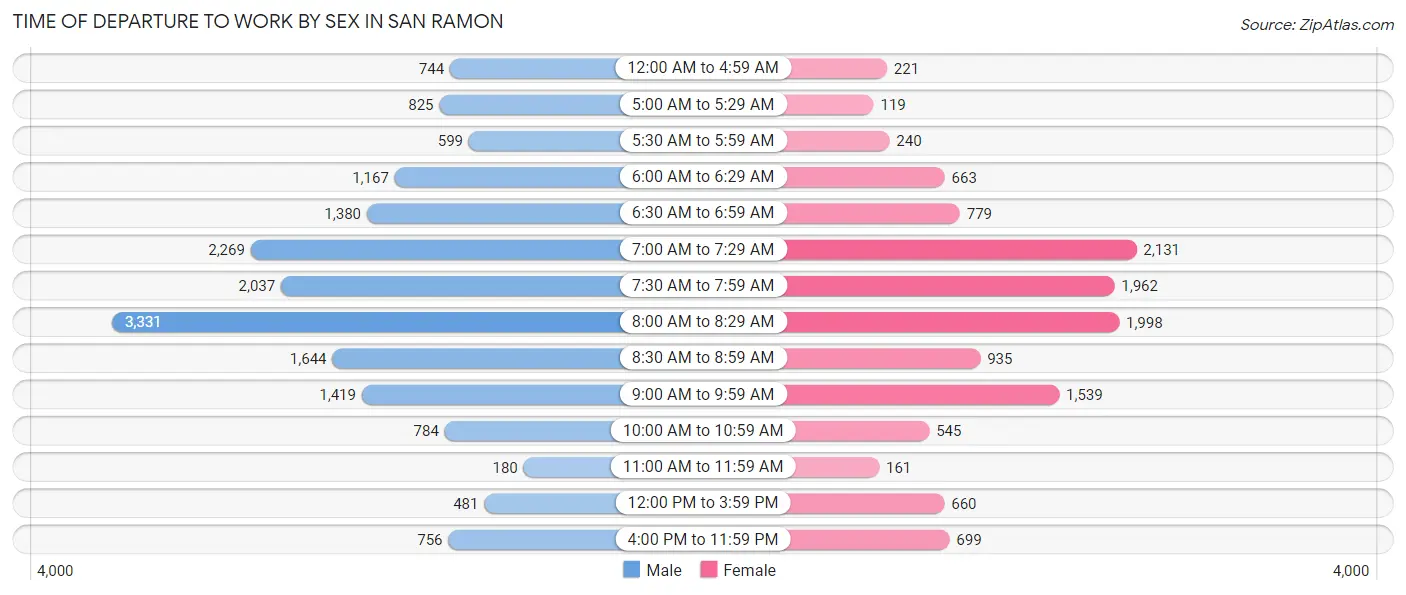
| Time of Departure | Male | Female |
| 12:00 AM to 4:59 AM | 744 (4.2%) | 221 (1.8%) |
| 5:00 AM to 5:29 AM | 825 (4.7%) | 119 (0.9%) |
| 5:30 AM to 5:59 AM | 599 (3.4%) | 240 (1.9%) |
| 6:00 AM to 6:29 AM | 1,167 (6.6%) | 663 (5.2%) |
| 6:30 AM to 6:59 AM | 1,380 (7.8%) | 779 (6.2%) |
| 7:00 AM to 7:29 AM | 2,269 (12.9%) | 2,131 (16.8%) |
| 7:30 AM to 7:59 AM | 2,037 (11.6%) | 1,962 (15.5%) |
| 8:00 AM to 8:29 AM | 3,331 (18.9%) | 1,998 (15.8%) |
| 8:30 AM to 8:59 AM | 1,644 (9.3%) | 935 (7.4%) |
| 9:00 AM to 9:59 AM | 1,419 (8.1%) | 1,539 (12.2%) |
| 10:00 AM to 10:59 AM | 784 (4.4%) | 545 (4.3%) |
| 11:00 AM to 11:59 AM | 180 (1.0%) | 161 (1.3%) |
| 12:00 PM to 3:59 PM | 481 (2.7%) | 660 (5.2%) |
| 4:00 PM to 11:59 PM | 756 (4.3%) | 699 (5.5%) |
| Total | 17,616 (100.0%) | 12,652 (100.0%) |
Housing Occupancy in San Ramon
Occupancy by Ownership in San Ramon
Of the total 29,585 dwellings in San Ramon, owner-occupied units account for 21,047 (71.1%), while renter-occupied units make up 8,538 (28.9%).
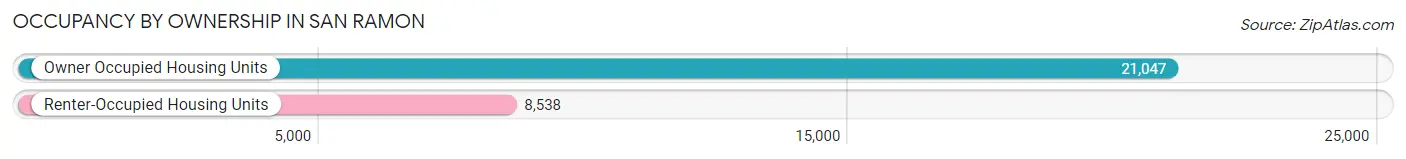
| Occupancy | # Housing Units | % Housing Units |
| Owner Occupied Housing Units | 21,047 | 71.1% |
| Renter-Occupied Housing Units | 8,538 | 28.9% |
| Total Occupied Housing Units | 29,585 | 100.0% |
Occupancy by Household Size in San Ramon
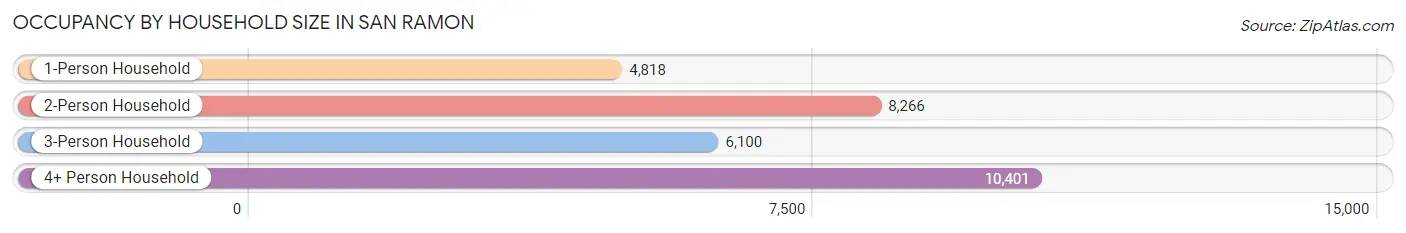
| Household Size | # Housing Units | % Housing Units |
| 1-Person Household | 4,818 | 16.3% |
| 2-Person Household | 8,266 | 27.9% |
| 3-Person Household | 6,100 | 20.6% |
| 4+ Person Household | 10,401 | 35.2% |
| Total Housing Units | 29,585 | 100.0% |
Occupancy by Ownership by Household Size in San Ramon
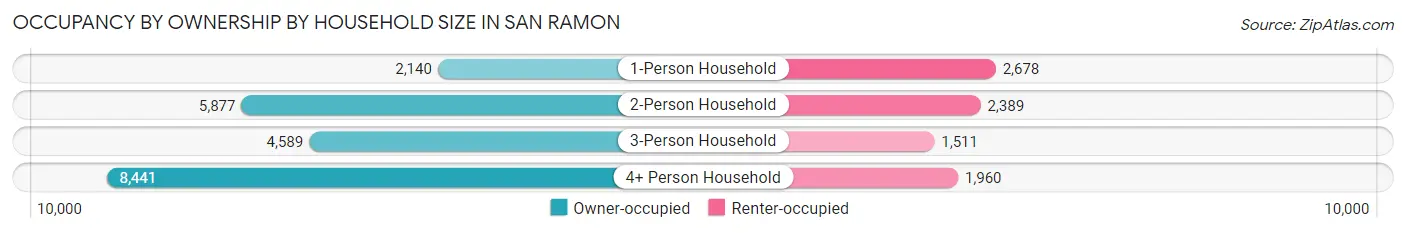
| Household Size | Owner-occupied | Renter-occupied |
| 1-Person Household | 2,140 (44.4%) | 2,678 (55.6%) |
| 2-Person Household | 5,877 (71.1%) | 2,389 (28.9%) |
| 3-Person Household | 4,589 (75.2%) | 1,511 (24.8%) |
| 4+ Person Household | 8,441 (81.2%) | 1,960 (18.8%) |
| Total Housing Units | 21,047 (71.1%) | 8,538 (28.9%) |
Occupancy by Educational Attainment in San Ramon
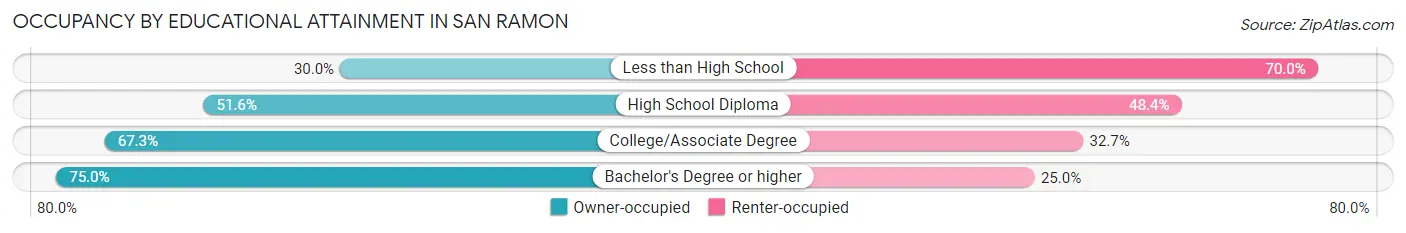
| Household Size | Owner-occupied | Renter-occupied |
| Less than High School | 164 (30.0%) | 383 (70.0%) |
| High School Diploma | 1,077 (51.6%) | 1,010 (48.4%) |
| College/Associate Degree | 3,482 (67.3%) | 1,694 (32.7%) |
| Bachelor's Degree or higher | 16,324 (75.0%) | 5,451 (25.0%) |
Occupancy by Age of Householder in San Ramon
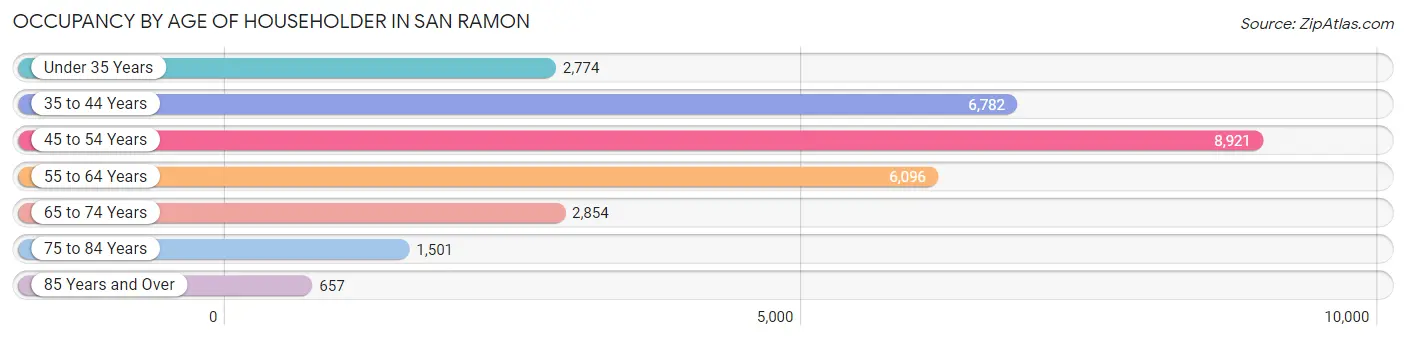
| Age Bracket | # Households | % Households |
| Under 35 Years | 2,774 | 9.4% |
| 35 to 44 Years | 6,782 | 22.9% |
| 45 to 54 Years | 8,921 | 30.1% |
| 55 to 64 Years | 6,096 | 20.6% |
| 65 to 74 Years | 2,854 | 9.7% |
| 75 to 84 Years | 1,501 | 5.1% |
| 85 Years and Over | 657 | 2.2% |
| Total | 29,585 | 100.0% |
Housing Finances in San Ramon
Median Income by Occupancy in San Ramon
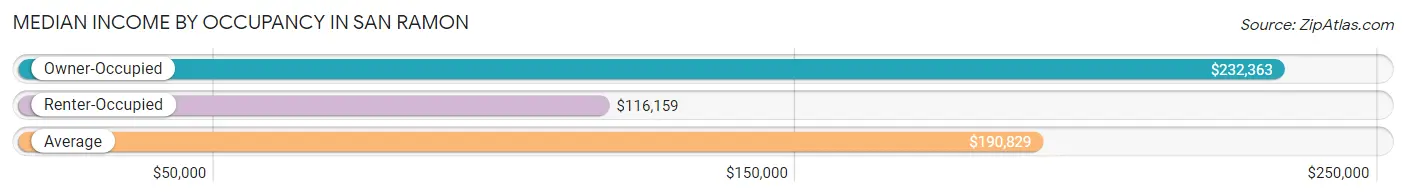
| Occupancy Type | # Households | Median Income |
| Owner-Occupied | 21,047 (71.1%) | $232,363 |
| Renter-Occupied | 8,538 (28.9%) | $116,159 |
| Average | 29,585 (100.0%) | $190,829 |
Occupancy by Householder Income Bracket in San Ramon
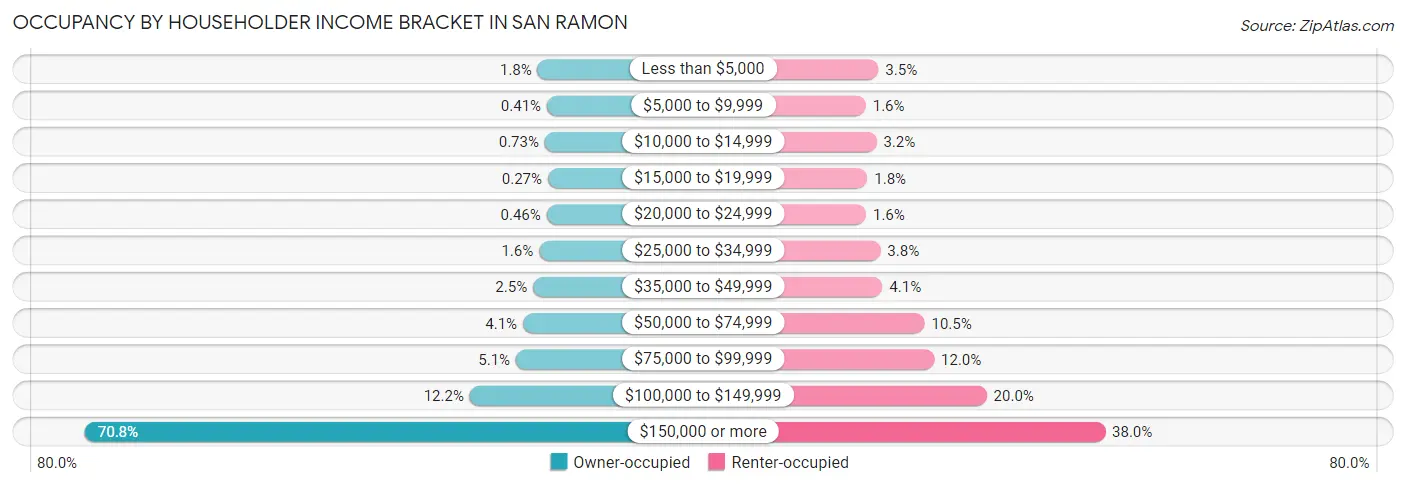
| Income Bracket | Owner-occupied | Renter-occupied |
| Less than $5,000 | 385 (1.8%) | 297 (3.5%) |
| $5,000 to $9,999 | 86 (0.4%) | 133 (1.6%) |
| $10,000 to $14,999 | 153 (0.7%) | 272 (3.2%) |
| $15,000 to $19,999 | 56 (0.3%) | 154 (1.8%) |
| $20,000 to $24,999 | 96 (0.5%) | 137 (1.6%) |
| $25,000 to $34,999 | 339 (1.6%) | 324 (3.8%) |
| $35,000 to $49,999 | 532 (2.5%) | 349 (4.1%) |
| $50,000 to $74,999 | 854 (4.1%) | 897 (10.5%) |
| $75,000 to $99,999 | 1,080 (5.1%) | 1,022 (12.0%) |
| $100,000 to $149,999 | 2,562 (12.2%) | 1,706 (20.0%) |
| $150,000 or more | 14,904 (70.8%) | 3,247 (38.0%) |
| Total | 21,047 (100.0%) | 8,538 (100.0%) |
Monthly Housing Cost Tiers in San Ramon
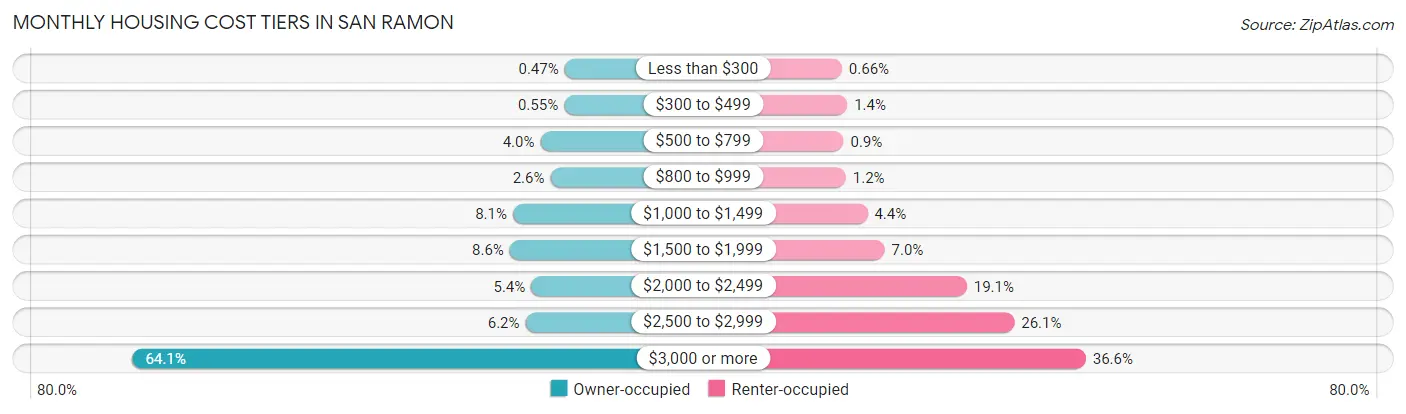
| Monthly Cost | Owner-occupied | Renter-occupied |
| Less than $300 | 99 (0.5%) | 56 (0.7%) |
| $300 to $499 | 116 (0.5%) | 123 (1.4%) |
| $500 to $799 | 851 (4.0%) | 77 (0.9%) |
| $800 to $999 | 540 (2.6%) | 106 (1.2%) |
| $1,000 to $1,499 | 1,703 (8.1%) | 378 (4.4%) |
| $1,500 to $1,999 | 1,800 (8.6%) | 593 (7.0%) |
| $2,000 to $2,499 | 1,134 (5.4%) | 1,627 (19.1%) |
| $2,500 to $2,999 | 1,313 (6.2%) | 2,224 (26.1%) |
| $3,000 or more | 13,491 (64.1%) | 3,124 (36.6%) |
| Total | 21,047 (100.0%) | 8,538 (100.0%) |
Physical Housing Characteristics in San Ramon
Housing Structures in San Ramon
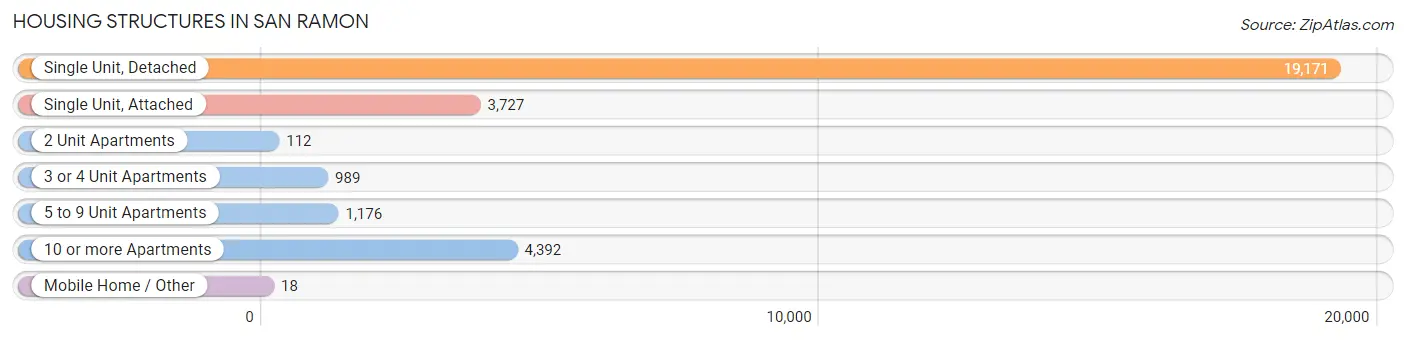
| Structure Type | # Housing Units | % Housing Units |
| Single Unit, Detached | 19,171 | 64.8% |
| Single Unit, Attached | 3,727 | 12.6% |
| 2 Unit Apartments | 112 | 0.4% |
| 3 or 4 Unit Apartments | 989 | 3.3% |
| 5 to 9 Unit Apartments | 1,176 | 4.0% |
| 10 or more Apartments | 4,392 | 14.8% |
| Mobile Home / Other | 18 | 0.1% |
| Total | 29,585 | 100.0% |
Housing Structures by Occupancy in San Ramon
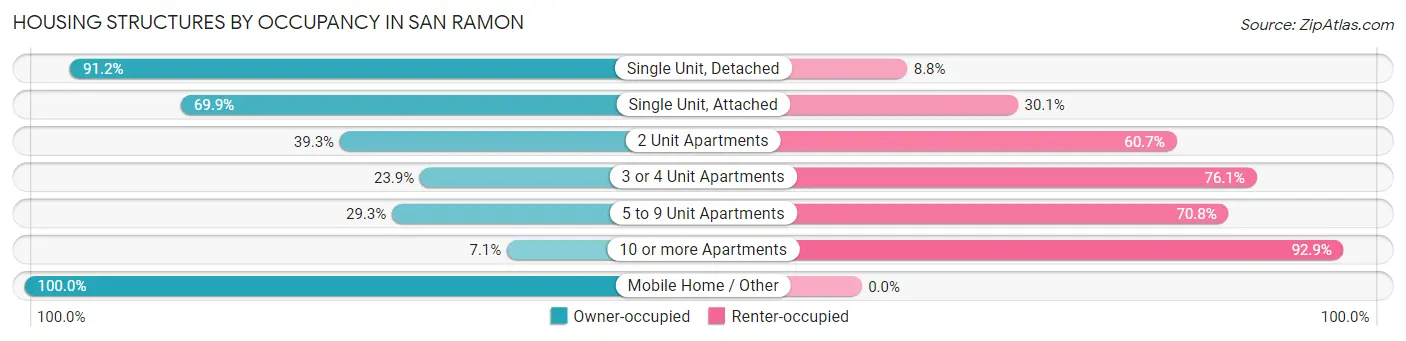
| Structure Type | Owner-occupied | Renter-occupied |
| Single Unit, Detached | 17,488 (91.2%) | 1,683 (8.8%) |
| Single Unit, Attached | 2,605 (69.9%) | 1,122 (30.1%) |
| 2 Unit Apartments | 44 (39.3%) | 68 (60.7%) |
| 3 or 4 Unit Apartments | 236 (23.9%) | 753 (76.1%) |
| 5 to 9 Unit Apartments | 344 (29.2%) | 832 (70.8%) |
| 10 or more Apartments | 312 (7.1%) | 4,080 (92.9%) |
| Mobile Home / Other | 18 (100.0%) | 0 (0.0%) |
| Total | 21,047 (71.1%) | 8,538 (28.9%) |
Housing Structures by Number of Rooms in San Ramon
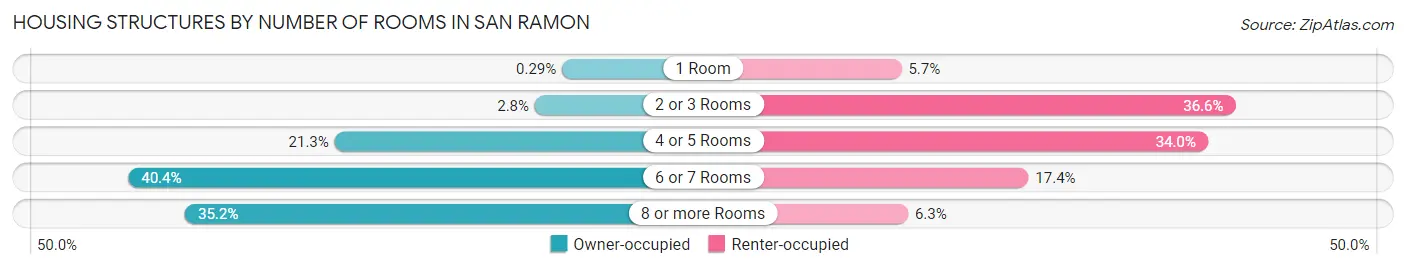
| Number of Rooms | Owner-occupied | Renter-occupied |
| 1 Room | 61 (0.3%) | 486 (5.7%) |
| 2 or 3 Rooms | 591 (2.8%) | 3,122 (36.6%) |
| 4 or 5 Rooms | 4,490 (21.3%) | 2,905 (34.0%) |
| 6 or 7 Rooms | 8,505 (40.4%) | 1,488 (17.4%) |
| 8 or more Rooms | 7,400 (35.2%) | 537 (6.3%) |
| Total | 21,047 (100.0%) | 8,538 (100.0%) |
Housing Structure by Heating Type in San Ramon
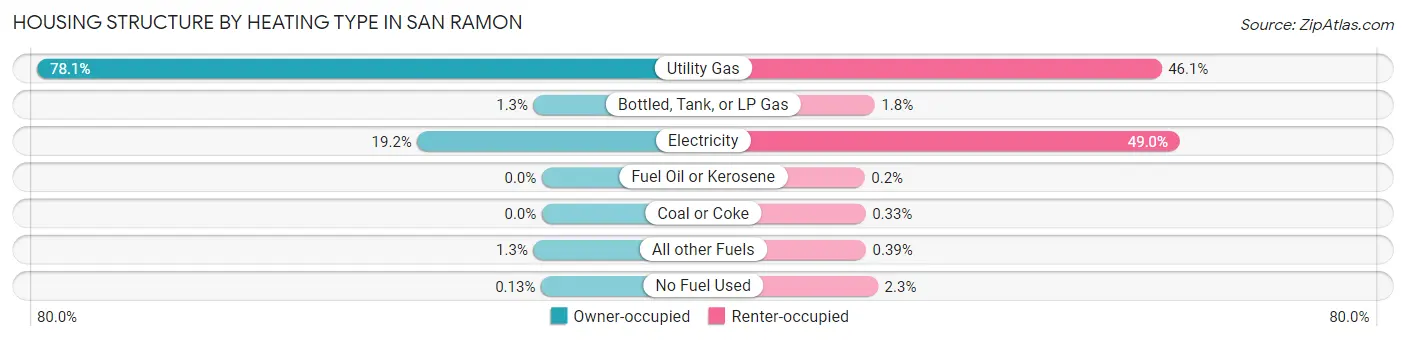
| Heating Type | Owner-occupied | Renter-occupied |
| Utility Gas | 16,432 (78.1%) | 3,935 (46.1%) |
| Bottled, Tank, or LP Gas | 267 (1.3%) | 151 (1.8%) |
| Electricity | 4,050 (19.2%) | 4,181 (49.0%) |
| Fuel Oil or Kerosene | 0 (0.0%) | 17 (0.2%) |
| Coal or Coke | 0 (0.0%) | 28 (0.3%) |
| All other Fuels | 271 (1.3%) | 33 (0.4%) |
| No Fuel Used | 27 (0.1%) | 193 (2.3%) |
| Total | 21,047 (100.0%) | 8,538 (100.0%) |
Household Vehicle Usage in San Ramon
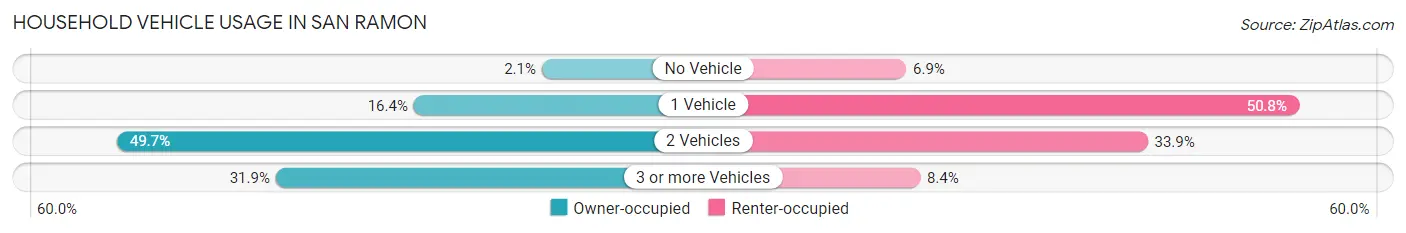
| Vehicles per Household | Owner-occupied | Renter-occupied |
| No Vehicle | 433 (2.1%) | 585 (6.9%) |
| 1 Vehicle | 3,453 (16.4%) | 4,341 (50.8%) |
| 2 Vehicles | 10,453 (49.7%) | 2,894 (33.9%) |
| 3 or more Vehicles | 6,708 (31.9%) | 718 (8.4%) |
| Total | 21,047 (100.0%) | 8,538 (100.0%) |
Real Estate & Mortgages in San Ramon
Real Estate and Mortgage Overview in San Ramon
| Characteristic | Without Mortgage | With Mortgage |
| Housing Units | 4,500 | 16,547 |
| Median Property Value | $1,181,100 | $1,286,800 |
| Median Household Income | $158,194 | $12,507 |
| Monthly Housing Costs | $1,308 | $13,460 |
| Real Estate Taxes | $9,525 | $95 |
Property Value by Mortgage Status in San Ramon
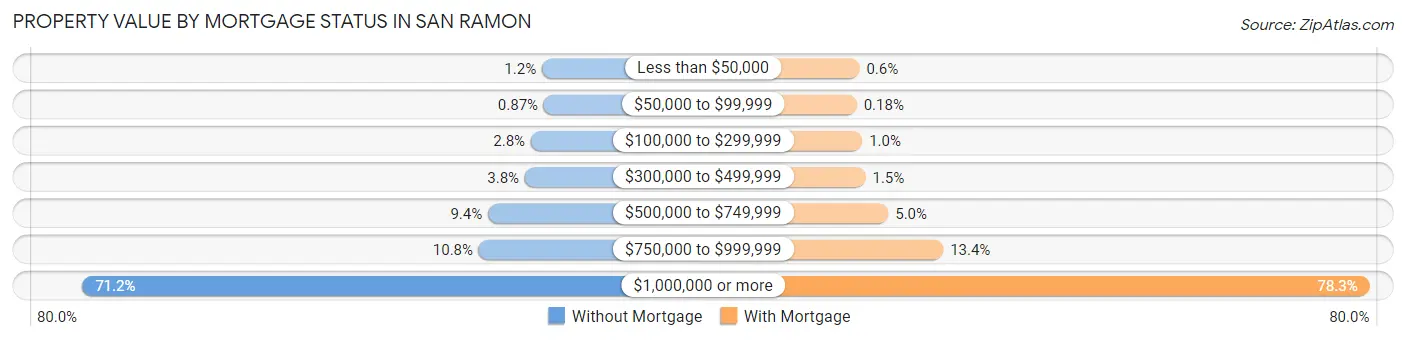
| Property Value | Without Mortgage | With Mortgage |
| Less than $50,000 | 52 (1.2%) | 100 (0.6%) |
| $50,000 to $99,999 | 39 (0.9%) | 29 (0.2%) |
| $100,000 to $299,999 | 128 (2.8%) | 169 (1.0%) |
| $300,000 to $499,999 | 169 (3.8%) | 251 (1.5%) |
| $500,000 to $749,999 | 422 (9.4%) | 825 (5.0%) |
| $750,000 to $999,999 | 485 (10.8%) | 2,211 (13.4%) |
| $1,000,000 or more | 3,205 (71.2%) | 12,962 (78.3%) |
| Total | 4,500 (100.0%) | 16,547 (100.0%) |
Household Income by Mortgage Status in San Ramon
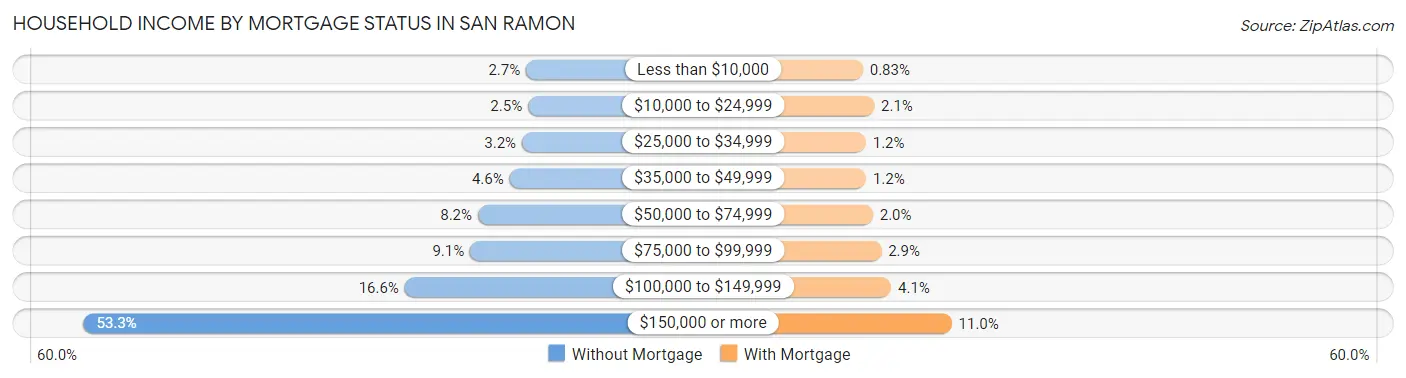
| Household Income | Without Mortgage | With Mortgage |
| Less than $10,000 | 121 (2.7%) | 137 (0.8%) |
| $10,000 to $24,999 | 111 (2.5%) | 350 (2.1%) |
| $25,000 to $34,999 | 142 (3.2%) | 194 (1.2%) |
| $35,000 to $49,999 | 206 (4.6%) | 197 (1.2%) |
| $50,000 to $74,999 | 369 (8.2%) | 326 (2.0%) |
| $75,000 to $99,999 | 409 (9.1%) | 485 (2.9%) |
| $100,000 to $149,999 | 745 (16.6%) | 671 (4.1%) |
| $150,000 or more | 2,397 (53.3%) | 1,817 (11.0%) |
| Total | 4,500 (100.0%) | 16,547 (100.0%) |
Property Value to Household Income Ratio in San Ramon
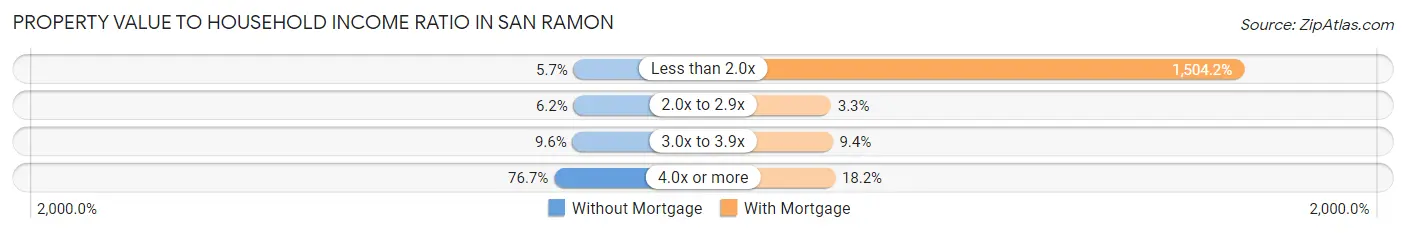
| Value-to-Income Ratio | Without Mortgage | With Mortgage |
| Less than 2.0x | 255 (5.7%) | 248,899 (1,504.2%) |
| 2.0x to 2.9x | 281 (6.2%) | 537 (3.3%) |
| 3.0x to 3.9x | 431 (9.6%) | 1,547 (9.3%) |
| 4.0x or more | 3,453 (76.7%) | 3,007 (18.2%) |
| Total | 4,500 (100.0%) | 16,547 (100.0%) |
Real Estate Taxes by Mortgage Status in San Ramon
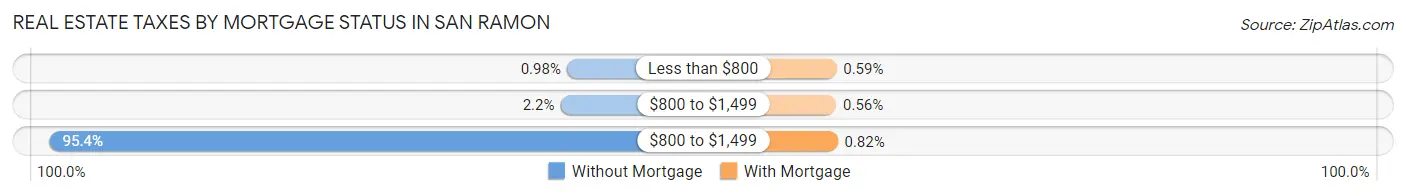
| Property Taxes | Without Mortgage | With Mortgage |
| Less than $800 | 44 (1.0%) | 98 (0.6%) |
| $800 to $1,499 | 97 (2.2%) | 92 (0.6%) |
| $800 to $1,499 | 4,294 (95.4%) | 136 (0.8%) |
| Total | 4,500 (100.0%) | 16,547 (100.0%) |
Health & Disability in San Ramon
Health Insurance Coverage by Age in San Ramon
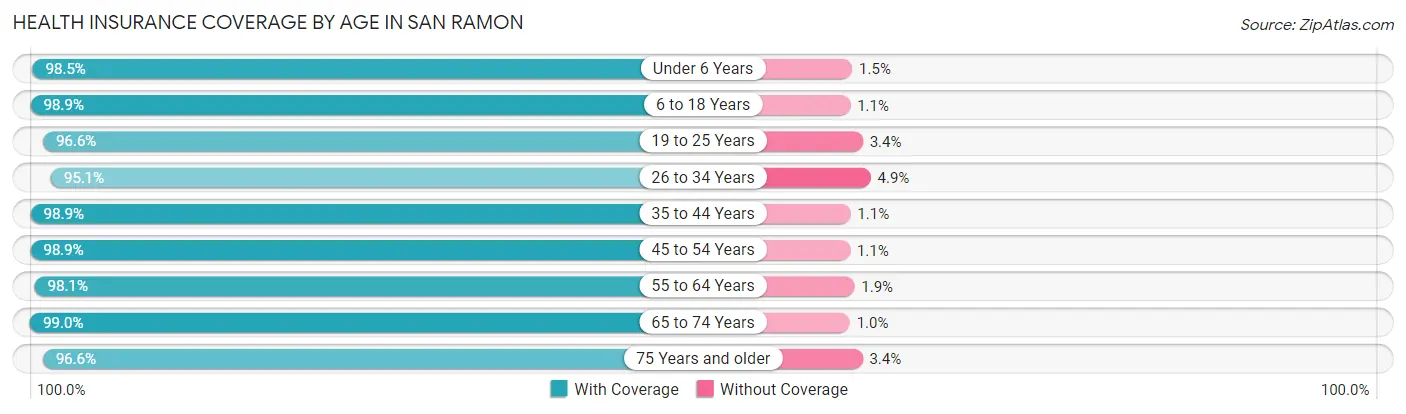
| Age Bracket | With Coverage | Without Coverage |
| Under 6 Years | 5,413 (98.5%) | 81 (1.5%) |
| 6 to 18 Years | 18,765 (98.9%) | 208 (1.1%) |
| 19 to 25 Years | 5,547 (96.6%) | 197 (3.4%) |
| 26 to 34 Years | 5,766 (95.1%) | 297 (4.9%) |
| 35 to 44 Years | 13,368 (98.9%) | 154 (1.1%) |
| 45 to 54 Years | 16,058 (98.9%) | 172 (1.1%) |
| 55 to 64 Years | 10,132 (98.1%) | 193 (1.9%) |
| 65 to 74 Years | 5,301 (99.0%) | 54 (1.0%) |
| 75 Years and older | 4,224 (96.6%) | 148 (3.4%) |
| Total | 84,574 (98.3%) | 1,504 (1.8%) |
Health Insurance Coverage by Citizenship Status in San Ramon
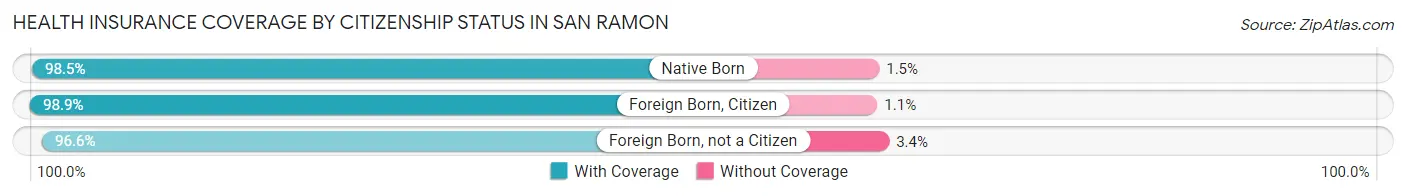
| Citizenship Status | With Coverage | Without Coverage |
| Native Born | 5,413 (98.5%) | 81 (1.5%) |
| Foreign Born, Citizen | 18,765 (98.9%) | 208 (1.1%) |
| Foreign Born, not a Citizen | 5,547 (96.6%) | 197 (3.4%) |
Health Insurance Coverage by Household Income in San Ramon
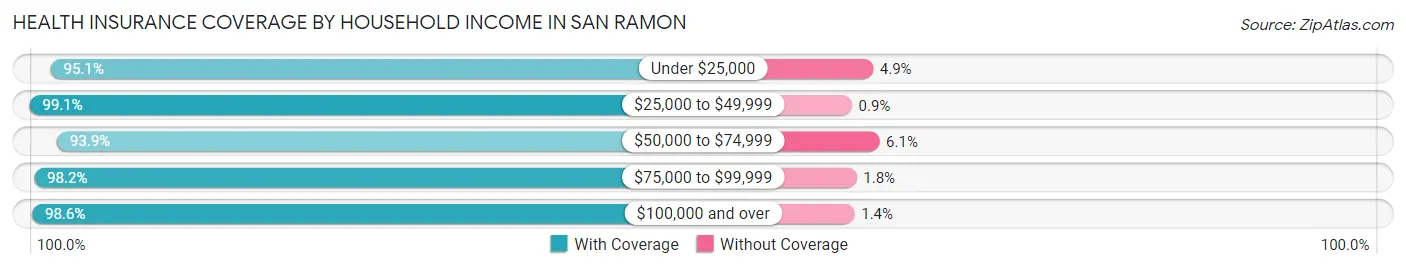
| Household Income | With Coverage | Without Coverage |
| Under $25,000 | 3,062 (95.1%) | 157 (4.9%) |
| $25,000 to $49,999 | 2,650 (99.1%) | 24 (0.9%) |
| $50,000 to $74,999 | 3,641 (93.9%) | 235 (6.1%) |
| $75,000 to $99,999 | 4,598 (98.2%) | 84 (1.8%) |
| $100,000 and over | 70,497 (98.6%) | 1,000 (1.4%) |
Public vs Private Health Insurance Coverage by Age in San Ramon
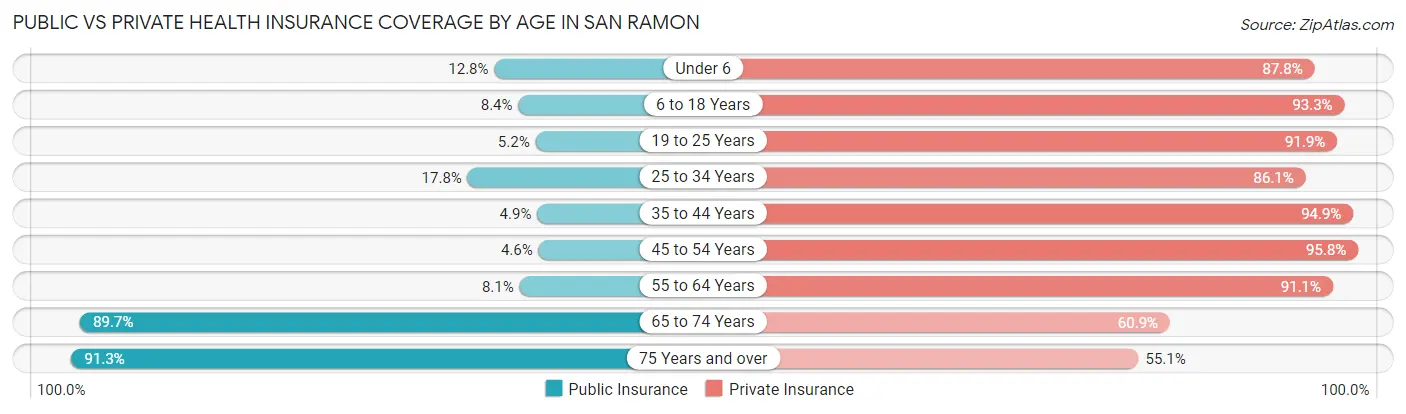
| Age Bracket | Public Insurance | Private Insurance |
| Under 6 | 704 (12.8%) | 4,821 (87.7%) |
| 6 to 18 Years | 1,585 (8.4%) | 17,700 (93.3%) |
| 19 to 25 Years | 297 (5.2%) | 5,281 (91.9%) |
| 25 to 34 Years | 1,077 (17.8%) | 5,219 (86.1%) |
| 35 to 44 Years | 656 (4.9%) | 12,835 (94.9%) |
| 45 to 54 Years | 746 (4.6%) | 15,555 (95.8%) |
| 55 to 64 Years | 839 (8.1%) | 9,410 (91.1%) |
| 65 to 74 Years | 4,804 (89.7%) | 3,261 (60.9%) |
| 75 Years and over | 3,992 (91.3%) | 2,408 (55.1%) |
| Total | 14,700 (17.1%) | 76,490 (88.9%) |
Disability Status by Sex by Age in San Ramon
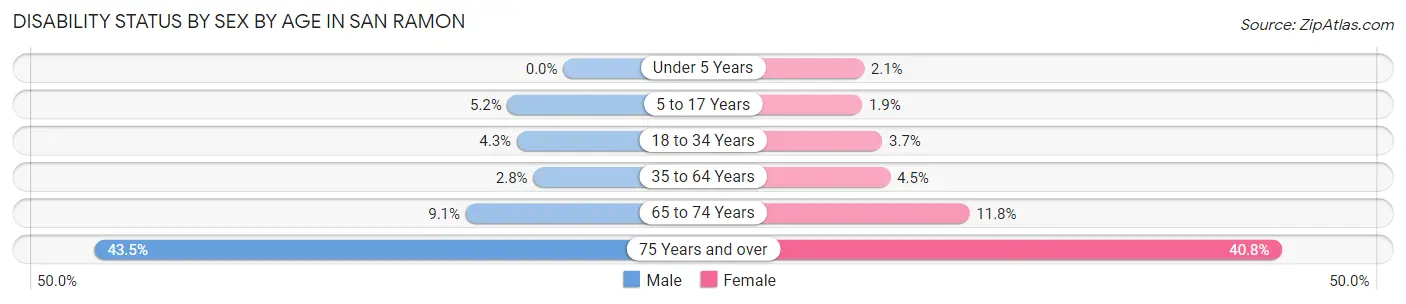
| Age Bracket | Male | Female |
| Under 5 Years | 0 (0.0%) | 47 (2.1%) |
| 5 to 17 Years | 500 (5.2%) | 174 (1.9%) |
| 18 to 34 Years | 304 (4.3%) | 219 (3.7%) |
| 35 to 64 Years | 558 (2.8%) | 897 (4.5%) |
| 65 to 74 Years | 211 (9.0%) | 358 (11.8%) |
| 75 Years and over | 795 (43.5%) | 1,038 (40.8%) |
Disability Class by Sex by Age in San Ramon
Disability Class: Hearing Difficulty
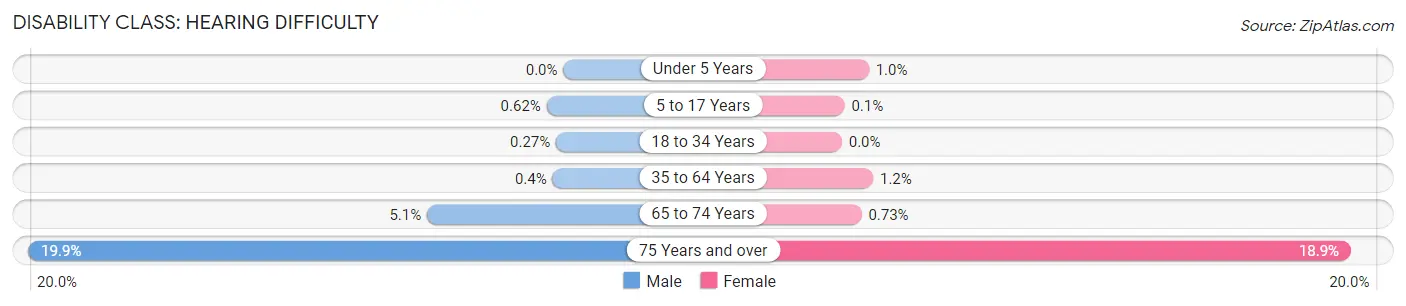
| Age Bracket | Male | Female |
| Under 5 Years | 0 (0.0%) | 23 (1.0%) |
| 5 to 17 Years | 60 (0.6%) | 9 (0.1%) |
| 18 to 34 Years | 19 (0.3%) | 0 (0.0%) |
| 35 to 64 Years | 80 (0.4%) | 232 (1.2%) |
| 65 to 74 Years | 118 (5.1%) | 22 (0.7%) |
| 75 Years and over | 363 (19.9%) | 481 (18.9%) |
Disability Class: Vision Difficulty
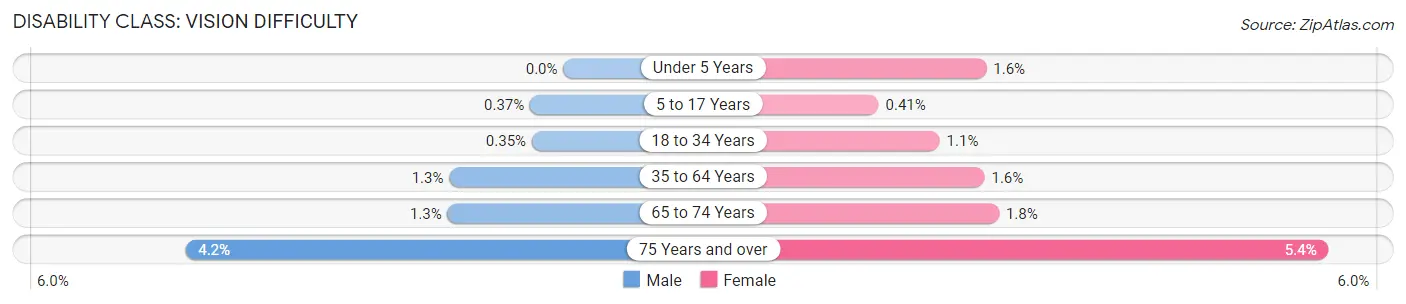
| Age Bracket | Male | Female |
| Under 5 Years | 0 (0.0%) | 37 (1.6%) |
| 5 to 17 Years | 36 (0.4%) | 38 (0.4%) |
| 18 to 34 Years | 25 (0.4%) | 64 (1.1%) |
| 35 to 64 Years | 254 (1.3%) | 318 (1.6%) |
| 65 to 74 Years | 30 (1.3%) | 53 (1.8%) |
| 75 Years and over | 77 (4.2%) | 138 (5.4%) |
Disability Class: Cognitive Difficulty
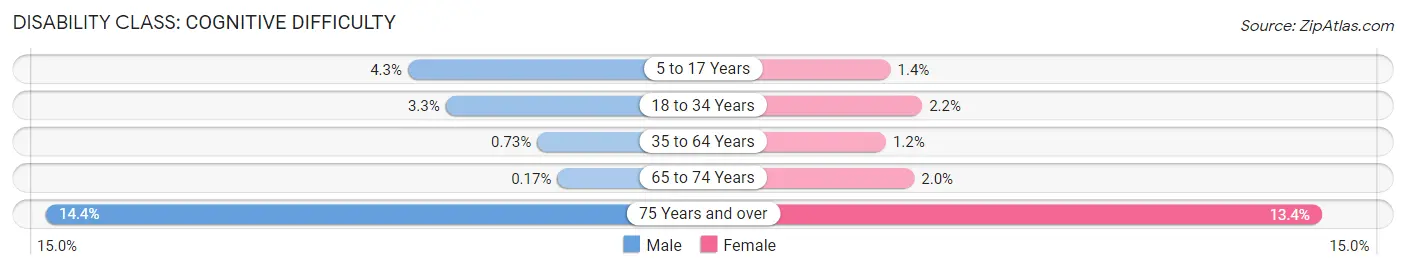
| Age Bracket | Male | Female |
| 5 to 17 Years | 419 (4.3%) | 127 (1.4%) |
| 18 to 34 Years | 231 (3.3%) | 131 (2.2%) |
| 35 to 64 Years | 147 (0.7%) | 246 (1.2%) |
| 65 to 74 Years | 4 (0.2%) | 61 (2.0%) |
| 75 Years and over | 263 (14.4%) | 340 (13.4%) |
Disability Class: Ambulatory Difficulty
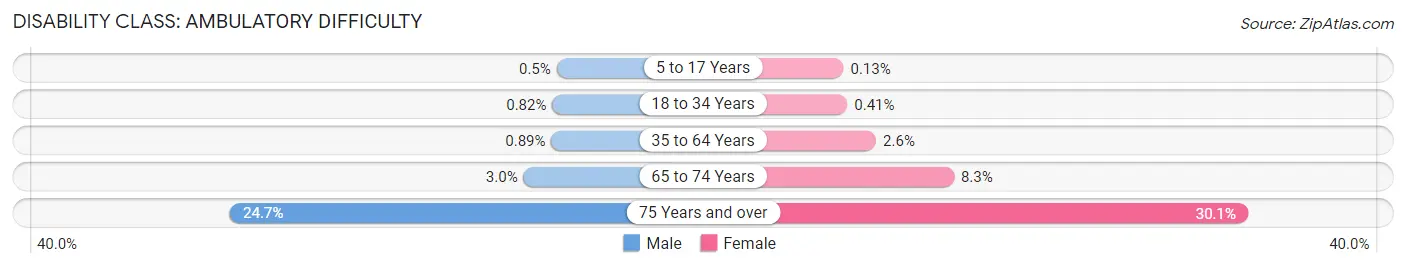
| Age Bracket | Male | Female |
| 5 to 17 Years | 48 (0.5%) | 12 (0.1%) |
| 18 to 34 Years | 58 (0.8%) | 24 (0.4%) |
| 35 to 64 Years | 179 (0.9%) | 511 (2.5%) |
| 65 to 74 Years | 69 (3.0%) | 252 (8.3%) |
| 75 Years and over | 452 (24.7%) | 767 (30.1%) |
Disability Class: Self-Care Difficulty
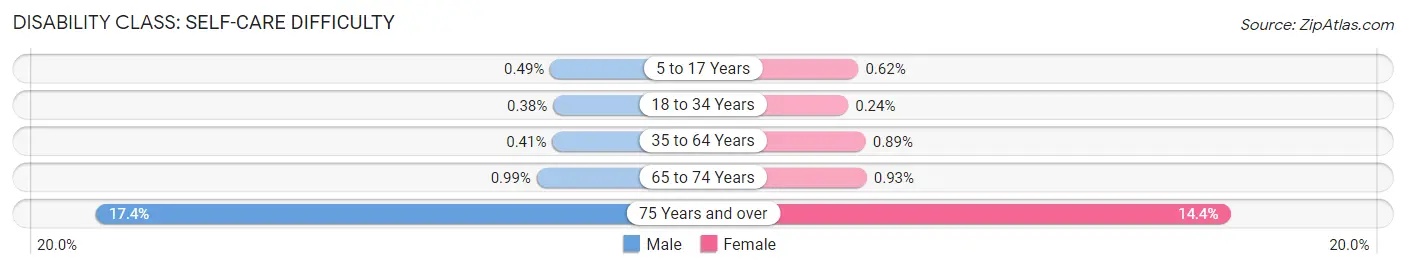
| Age Bracket | Male | Female |
| 5 to 17 Years | 47 (0.5%) | 58 (0.6%) |
| 18 to 34 Years | 27 (0.4%) | 14 (0.2%) |
| 35 to 64 Years | 82 (0.4%) | 178 (0.9%) |
| 65 to 74 Years | 23 (1.0%) | 28 (0.9%) |
| 75 Years and over | 317 (17.3%) | 367 (14.4%) |
Technology Access in San Ramon
Computing Device Access in San Ramon
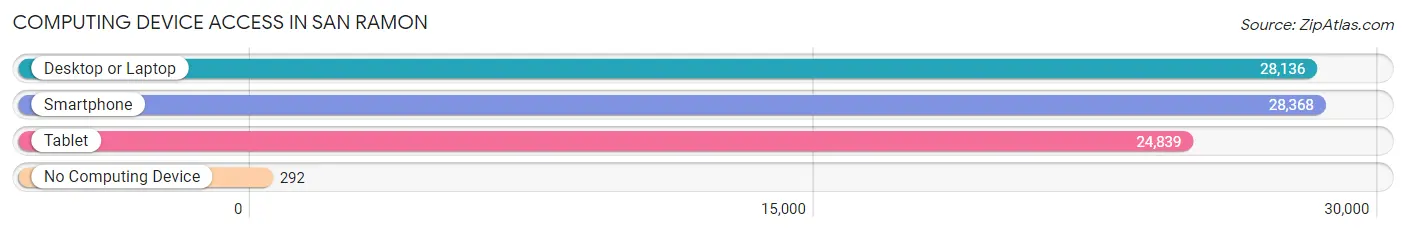
| Device Type | # Households | % Households |
| Desktop or Laptop | 28,136 | 95.1% |
| Smartphone | 28,368 | 95.9% |
| Tablet | 24,839 | 84.0% |
| No Computing Device | 292 | 1.0% |
| Total | 29,585 | 100.0% |
Internet Access in San Ramon
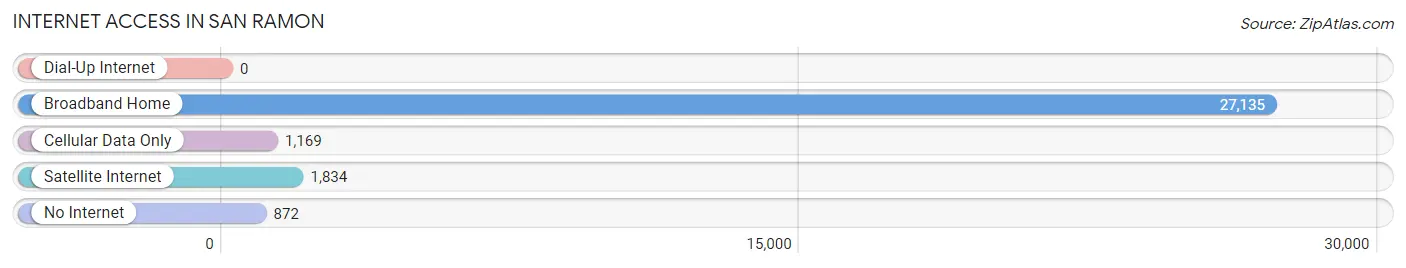
| Internet Type | # Households | % Households |
| Dial-Up Internet | 0 | 0.0% |
| Broadband Home | 27,135 | 91.7% |
| Cellular Data Only | 1,169 | 4.0% |
| Satellite Internet | 1,834 | 6.2% |
| No Internet | 872 | 2.9% |
| Total | 29,585 | 100.0% |
San Ramon Summary
San Ramon is a city located in the San Francisco Bay Area of California. It is situated in Contra Costa County, approximately 35 miles east of San Francisco. The city is bordered by Danville to the north, Dublin to the east, and Pleasanton to the south. San Ramon is a vibrant and growing community with a population of approximately 75,000 people.
History
San Ramon was originally inhabited by the Ohlone people, who were the first inhabitants of the area. The Ohlone people lived in the area for thousands of years before the arrival of the Spanish in the late 1700s. The Spanish established a mission in the area in 1797, which was later abandoned in 1834.
In 1848, the area was ceded to the United States as part of the Treaty of Guadalupe Hidalgo. The area was then divided into land grants, with the majority of the land being granted to the Donner and Murphy families. The Donner family established a ranch in the area, which was later sold to the Murphy family in 1856.
In 1868, the area was incorporated as the Town of San Ramon. The town was named after the nearby San Ramon Valley, which was named after the Spanish explorer, Ramon. The town grew slowly over the next few decades, with the population reaching just over 1,000 people by the turn of the century.
In the 1950s, the population of San Ramon began to grow rapidly due to the influx of people from the Bay Area. The population continued to grow throughout the 1960s and 1970s, and in 1983, the city was officially incorporated as the City of San Ramon.
Geography
San Ramon is located in the San Francisco Bay Area of California. It is situated in Contra Costa County, approximately 35 miles east of San Francisco. The city is bordered by Danville to the north, Dublin to the east, and Pleasanton to the south.
The city covers an area of approximately 18 square miles, with the majority of the land being used for residential and commercial development. The city is located in the San Ramon Valley, which is surrounded by rolling hills and mountains. The valley is home to several creeks and streams, including San Ramon Creek, which flows through the city.
Economy
San Ramon is home to a diverse and vibrant economy. The city is home to several major employers, including Chevron, AT&T, and 24 Hour Fitness. The city is also home to several technology companies, including Oracle, Workday, and Veeva Systems.
The city is also home to several shopping centers, including the San Ramon Valley Plaza and the Bishop Ranch Shopping Center. The city is also home to several restaurants, bars, and entertainment venues.
Demographics
As of the 2020 census, the population of San Ramon was estimated to be 75,000 people. The population is diverse, with the majority of the population being white (63.2%), followed by Asian (25.2%), Hispanic (7.2%), and African American (2.2%).
The median household income in San Ramon is $128,000, which is significantly higher than the national average of $60,000. The median home value in San Ramon is $1,000,000, which is significantly higher than the national average of $200,000.
Conclusion
San Ramon is a vibrant and growing city located in the San Francisco Bay Area of California. The city has a rich history, diverse geography, and a thriving economy. The population of San Ramon is diverse and the median household income is significantly higher than the national average. San Ramon is a great place to live, work, and play.
Common Questions
What is Per Capita Income in San Ramon?
Per Capita income in San Ramon is $77,696.
What is the Median Family Income in San Ramon?
Median Family Income in San Ramon is $220,820.
What is the Median Household income in San Ramon?
Median Household Income in San Ramon is $190,829.
What is Income or Wage Gap in San Ramon?
Income or Wage Gap in San Ramon is 47.4%.
Women in San Ramon earn 52.6 cents for every dollar earned by a man.
What is Inequality or Gini Index in San Ramon?
Inequality or Gini Index in San Ramon is 0.40.
What is the Total Population of San Ramon?
Total Population of San Ramon is 86,119.
What is the Total Male Population of San Ramon?
Total Male Population of San Ramon is 43,059.
What is the Total Female Population of San Ramon?
Total Female Population of San Ramon is 43,060.
What is the Ratio of Males per 100 Females in San Ramon?
There are 100.00 Males per 100 Females in San Ramon.
What is the Ratio of Females per 100 Males in San Ramon?
There are 100.00 Females per 100 Males in San Ramon.
What is the Median Population Age in San Ramon?
Median Population Age in San Ramon is 40.5 Years.
What is the Average Family Size in San Ramon
Average Family Size in San Ramon is 3.3 People.
What is the Average Household Size in San Ramon
Average Household Size in San Ramon is 2.9 People.
How Large is the Labor Force in San Ramon?
There are 45,414 People in the Labor Forcein in San Ramon.
What is the Percentage of People in the Labor Force in San Ramon?
69.3% of People are in the Labor Force in San Ramon.
What is the Unemployment Rate in San Ramon?
Unemployment Rate in San Ramon is 5.0%.