Rancho Cucamonga, CA Map & Demographics
Rancho Cucamonga Map
Rancho Cucamonga Overview
$44,345
PER CAPITA INCOME
$117,921
AVG FAMILY INCOME
$105,534
AVG HOUSEHOLD INCOME
23.8%
WAGE / INCOME GAP [ % ]
76.2¢/ $1
WAGE / INCOME GAP [ $ ]
$11,481
FAMILY INCOME DEFICIT
0.43
INEQUALITY / GINI INDEX
174,696
TOTAL POPULATION
86,873
MALE POPULATION
87,823
FEMALE POPULATION
98.92
MALES / 100 FEMALES
101.09
FEMALES / 100 MALES
37.5
MEDIAN AGE
3.4
AVG FAMILY SIZE
3.0
AVG HOUSEHOLD SIZE
91,650
LABOR FORCE [ PEOPLE ]
65.9%
PERCENT IN LABOR FORCE
5.4%
UNEMPLOYMENT RATE
Rancho Cucamonga Area Codes
Income in Rancho Cucamonga
Income Overview in Rancho Cucamonga
Per Capita Income in Rancho Cucamonga is $44,345, while median incomes of families and households are $117,921 and $105,534 respectively.
| Characteristic | Number | Measure |
| Per Capita Income | 174,696 | $44,345 |
| Median Family Income | 44,254 | $117,921 |
| Mean Family Income | 44,254 | $144,683 |
| Median Household Income | 57,553 | $105,534 |
| Mean Household Income | 57,553 | $131,572 |
| Income Deficit | 44,254 | $11,481 |
| Wage / Income Gap (%) | 174,696 | 23.80% |
| Wage / Income Gap ($) | 174,696 | 76.20¢ per $1 |
| Gini / Inequality Index | 174,696 | 0.43 |
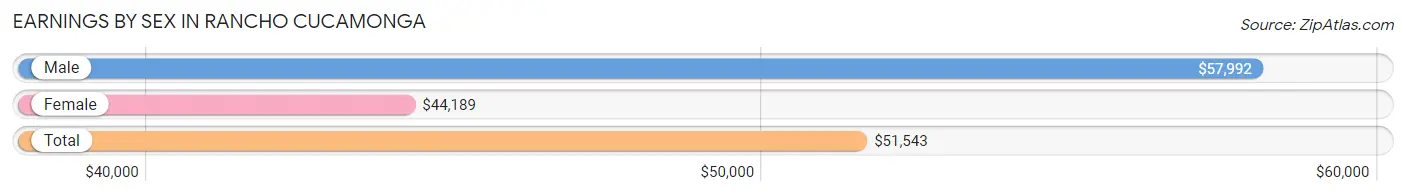
Earnings by Sex in Rancho Cucamonga
Average Earnings in Rancho Cucamonga are $51,543, $57,992 for men and $44,189 for women, a difference of 23.8%.
| Sex | Number | Average Earnings |
| Male | 49,123 (52.4%) | $57,992 |
| Female | 44,525 (47.5%) | $44,189 |
| Total | 93,648 (100.0%) | $51,543 |
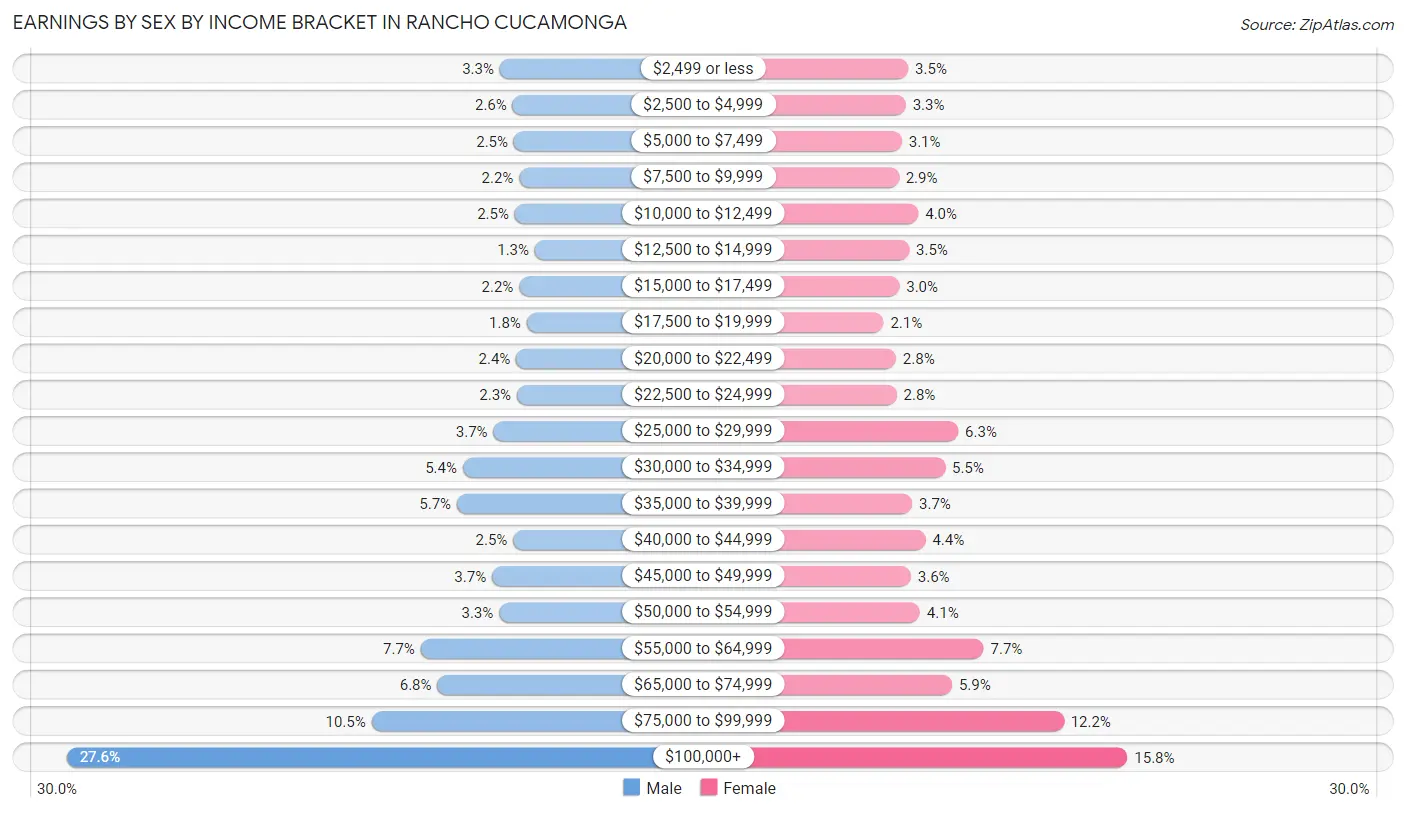
Earnings by Sex by Income Bracket in Rancho Cucamonga
The most common earnings brackets in Rancho Cucamonga are $100,000+ for men (13,575 | 27.6%) and $100,000+ for women (7,020 | 15.8%).
| Income | Male | Female |
| $2,499 or less | 1,616 (3.3%) | 1,535 (3.5%) |
| $2,500 to $4,999 | 1,261 (2.6%) | 1,476 (3.3%) |
| $5,000 to $7,499 | 1,227 (2.5%) | 1,374 (3.1%) |
| $7,500 to $9,999 | 1,083 (2.2%) | 1,302 (2.9%) |
| $10,000 to $12,499 | 1,204 (2.5%) | 1,789 (4.0%) |
| $12,500 to $14,999 | 647 (1.3%) | 1,558 (3.5%) |
| $15,000 to $17,499 | 1,079 (2.2%) | 1,312 (2.9%) |
| $17,500 to $19,999 | 873 (1.8%) | 915 (2.1%) |
| $20,000 to $22,499 | 1,166 (2.4%) | 1,228 (2.8%) |
| $22,500 to $24,999 | 1,144 (2.3%) | 1,245 (2.8%) |
| $25,000 to $29,999 | 1,794 (3.6%) | 2,787 (6.3%) |
| $30,000 to $34,999 | 2,636 (5.4%) | 2,460 (5.5%) |
| $35,000 to $39,999 | 2,800 (5.7%) | 1,636 (3.7%) |
| $40,000 to $44,999 | 1,249 (2.5%) | 1,970 (4.4%) |
| $45,000 to $49,999 | 1,832 (3.7%) | 1,604 (3.6%) |
| $50,000 to $54,999 | 1,634 (3.3%) | 1,832 (4.1%) |
| $55,000 to $64,999 | 3,804 (7.7%) | 3,424 (7.7%) |
| $65,000 to $74,999 | 3,341 (6.8%) | 2,631 (5.9%) |
| $75,000 to $99,999 | 5,158 (10.5%) | 5,427 (12.2%) |
| $100,000+ | 13,575 (27.6%) | 7,020 (15.8%) |
| Total | 49,123 (100.0%) | 44,525 (100.0%) |
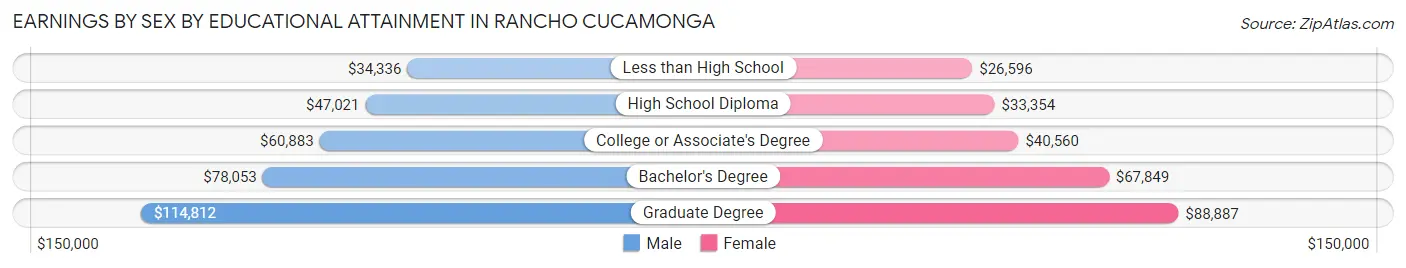
Earnings by Sex by Educational Attainment in Rancho Cucamonga
Average earnings in Rancho Cucamonga are $65,530 for men and $51,253 for women, a difference of 21.8%. Men with an educational attainment of graduate degree enjoy the highest average annual earnings of $114,812, while those with less than high school education earn the least with $34,336. Women with an educational attainment of graduate degree earn the most with the average annual earnings of $88,887, while those with less than high school education have the smallest earnings of $26,596.
| Educational Attainment | Male Income | Female Income |
| Less than High School | $34,336 | $26,596 |
| High School Diploma | $47,021 | $33,354 |
| College or Associate's Degree | $60,883 | $40,560 |
| Bachelor's Degree | $78,053 | $67,849 |
| Graduate Degree | $114,812 | $88,887 |
| Total | $65,530 | $51,253 |
Family Income in Rancho Cucamonga
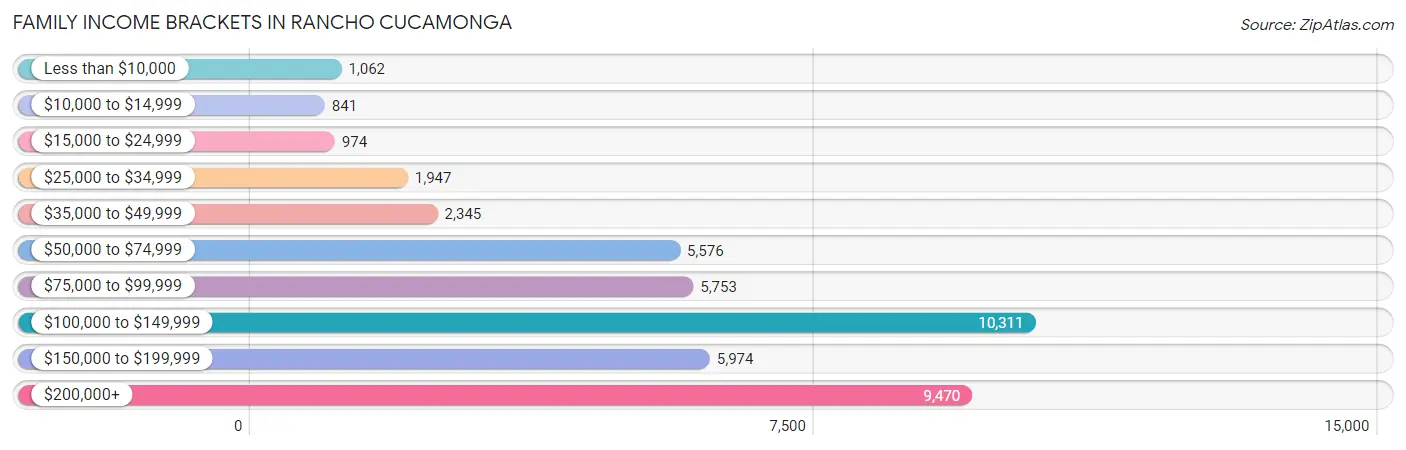
Family Income Brackets in Rancho Cucamonga
According to the Rancho Cucamonga family income data, there are 10,311 families falling into the $100,000 to $149,999 income range, which is the most common income bracket and makes up 23.3% of all families. Conversely, the $10,000 to $14,999 income bracket is the least frequent group with only 841 families (1.9%) belonging to this category.
| Income Bracket | # Families | % Families |
| Less than $10,000 | 1,062 | 2.4% |
| $10,000 to $14,999 | 841 | 1.9% |
| $15,000 to $24,999 | 974 | 2.2% |
| $25,000 to $34,999 | 1,947 | 4.4% |
| $35,000 to $49,999 | 2,345 | 5.3% |
| $50,000 to $74,999 | 5,576 | 12.6% |
| $75,000 to $99,999 | 5,753 | 13.0% |
| $100,000 to $149,999 | 10,311 | 23.3% |
| $150,000 to $199,999 | 5,974 | 13.5% |
| $200,000+ | 9,470 | 21.4% |
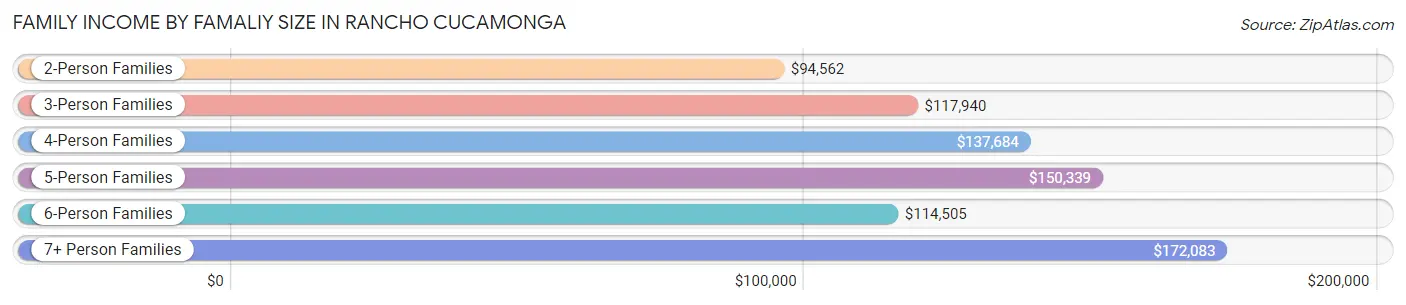
Family Income by Famaliy Size in Rancho Cucamonga
7+ person families (972 | 2.2%) account for the highest median family income in Rancho Cucamonga with $172,083 per family, while 2-person families (16,730 | 37.8%) have the highest median income of $47,281 per family member.
| Income Bracket | # Families | Median Income |
| 2-Person Families | 16,730 (37.8%) | $94,562 |
| 3-Person Families | 10,213 (23.1%) | $117,940 |
| 4-Person Families | 9,942 (22.5%) | $137,684 |
| 5-Person Families | 5,060 (11.4%) | $150,339 |
| 6-Person Families | 1,337 (3.0%) | $114,505 |
| 7+ Person Families | 972 (2.2%) | $172,083 |
| Total | 44,254 (100.0%) | $117,921 |
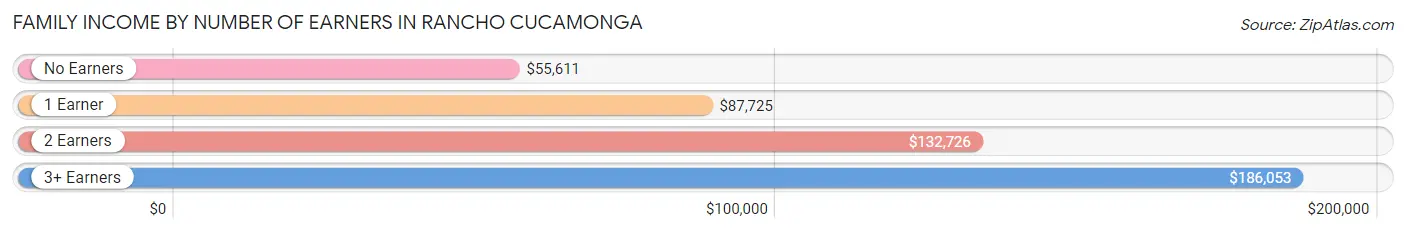
Family Income by Number of Earners in Rancho Cucamonga
The median family income in Rancho Cucamonga is $117,921, with families comprising 3+ earners (7,886) having the highest median family income of $186,053, while families with no earners (4,982) have the lowest median family income of $55,611, accounting for 17.8% and 11.3% of families, respectively.
| Number of Earners | # Families | Median Income |
| No Earners | 4,982 (11.3%) | $55,611 |
| 1 Earner | 13,013 (29.4%) | $87,725 |
| 2 Earners | 18,373 (41.5%) | $132,726 |
| 3+ Earners | 7,886 (17.8%) | $186,053 |
| Total | 44,254 (100.0%) | $117,921 |
Household Income in Rancho Cucamonga
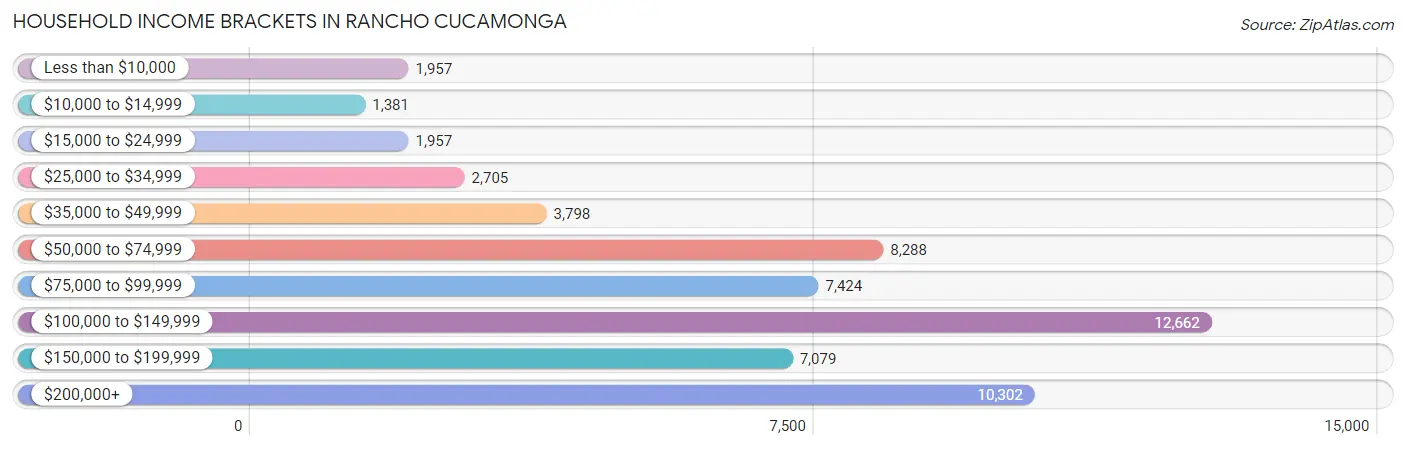
Household Income Brackets in Rancho Cucamonga
With 12,662 households falling in the category, the $100,000 to $149,999 income range is the most frequent in Rancho Cucamonga, accounting for 22.0% of all households. In contrast, only 1,381 households (2.4%) fall into the $10,000 to $14,999 income bracket, making it the least populous group.
| Income Bracket | # Households | % Households |
| Less than $10,000 | 1,957 | 3.4% |
| $10,000 to $14,999 | 1,381 | 2.4% |
| $15,000 to $24,999 | 1,957 | 3.4% |
| $25,000 to $34,999 | 2,705 | 4.7% |
| $35,000 to $49,999 | 3,798 | 6.6% |
| $50,000 to $74,999 | 8,288 | 14.4% |
| $75,000 to $99,999 | 7,424 | 12.9% |
| $100,000 to $149,999 | 12,662 | 22.0% |
| $150,000 to $199,999 | 7,079 | 12.3% |
| $200,000+ | 10,302 | 17.9% |
Household Income by Householder Age in Rancho Cucamonga
The median household income in Rancho Cucamonga is $105,534, with the highest median household income of $120,059 found in the 45 to 64 years age bracket for the primary householder. A total of 25,484 households (44.3%) fall into this category. Meanwhile, the 15 to 24 years age bracket for the primary householder has the lowest median household income of $48,836, with 789 households (1.4%) in this group.
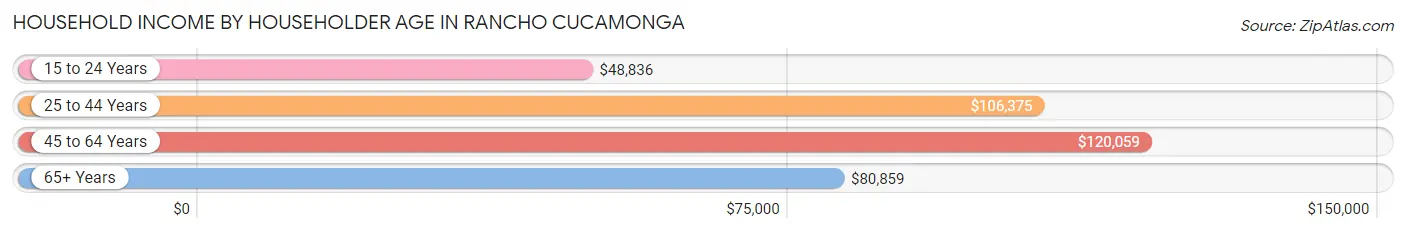
| Income Bracket | # Households | Median Income |
| 15 to 24 Years | 789 (1.4%) | $48,836 |
| 25 to 44 Years | 19,262 (33.5%) | $106,375 |
| 45 to 64 Years | 25,484 (44.3%) | $120,059 |
| 65+ Years | 12,018 (20.9%) | $80,859 |
| Total | 57,553 (100.0%) | $105,534 |
Poverty in Rancho Cucamonga
Income Below Poverty by Sex and Age in Rancho Cucamonga
With 6.3% poverty level for males and 8.7% for females among the residents of Rancho Cucamonga, under 5 year old males and 75 year old and over females are the most vulnerable to poverty, with 754 males (12.3%) and 595 females (12.5%) in their respective age groups living below the poverty level.
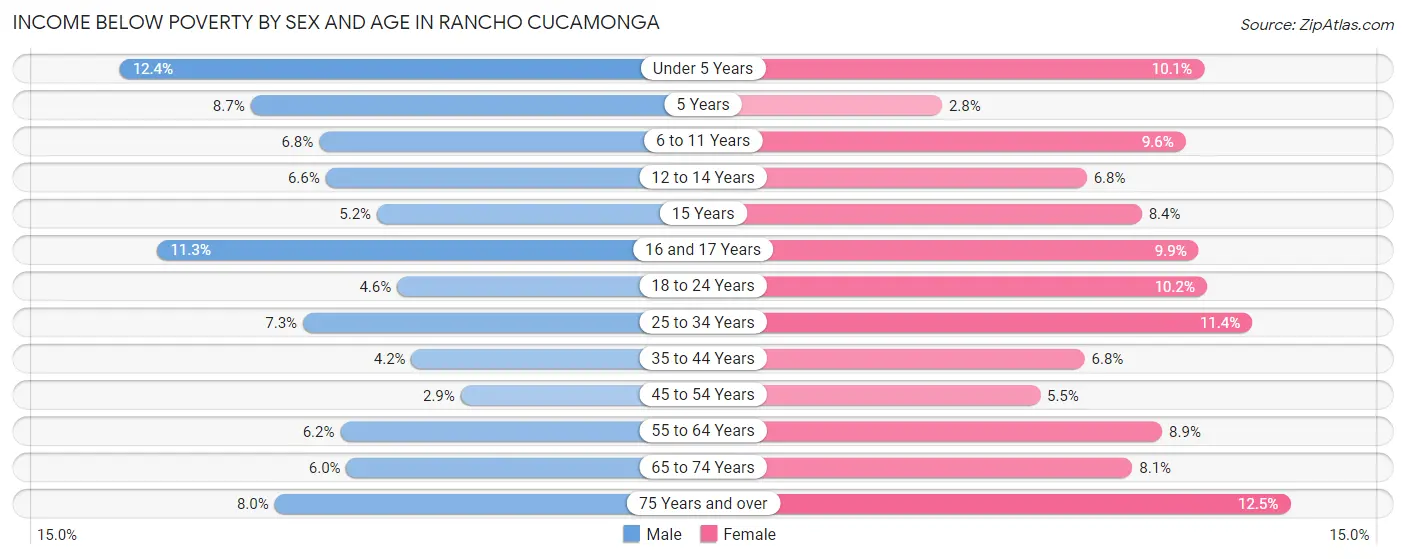
| Age Bracket | Male | Female |
| Under 5 Years | 754 (12.3%) | 524 (10.1%) |
| 5 Years | 82 (8.7%) | 26 (2.8%) |
| 6 to 11 Years | 443 (6.8%) | 593 (9.6%) |
| 12 to 14 Years | 248 (6.6%) | 206 (6.8%) |
| 15 Years | 63 (5.2%) | 112 (8.4%) |
| 16 and 17 Years | 242 (11.3%) | 182 (9.9%) |
| 18 to 24 Years | 322 (4.6%) | 734 (10.2%) |
| 25 to 34 Years | 993 (7.2%) | 1,511 (11.4%) |
| 35 to 44 Years | 442 (4.2%) | 740 (6.8%) |
| 45 to 54 Years | 326 (2.9%) | 701 (5.5%) |
| 55 to 64 Years | 675 (6.2%) | 1,065 (8.9%) |
| 65 to 74 Years | 383 (6.0%) | 647 (8.1%) |
| 75 Years and over | 313 (8.0%) | 595 (12.5%) |
| Total | 5,286 (6.3%) | 7,636 (8.7%) |
Income Above Poverty by Sex and Age in Rancho Cucamonga
According to the poverty statistics in Rancho Cucamonga, males aged 45 to 54 years and females aged 5 years are the age groups that are most secure financially, with 97.1% of males and 97.2% of females in these age groups living above the poverty line.
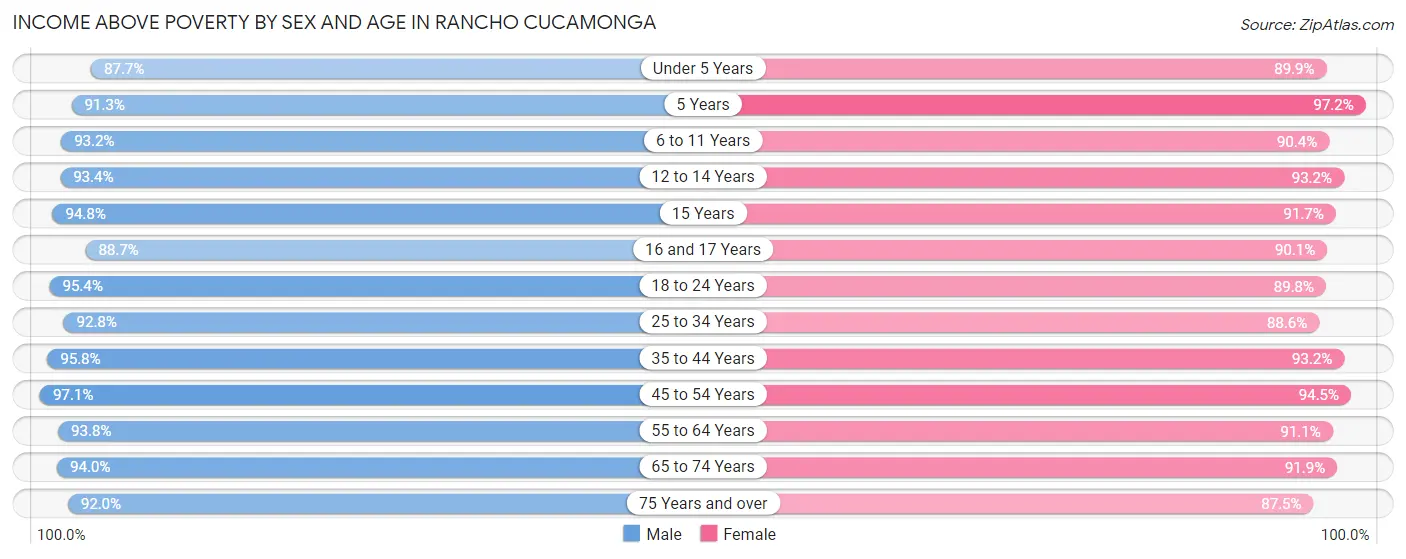
| Age Bracket | Male | Female |
| Under 5 Years | 5,351 (87.6%) | 4,674 (89.9%) |
| 5 Years | 859 (91.3%) | 906 (97.2%) |
| 6 to 11 Years | 6,068 (93.2%) | 5,606 (90.4%) |
| 12 to 14 Years | 3,499 (93.4%) | 2,816 (93.2%) |
| 15 Years | 1,152 (94.8%) | 1,230 (91.6%) |
| 16 and 17 Years | 1,899 (88.7%) | 1,651 (90.1%) |
| 18 to 24 Years | 6,626 (95.4%) | 6,490 (89.8%) |
| 25 to 34 Years | 12,711 (92.7%) | 11,716 (88.6%) |
| 35 to 44 Years | 10,019 (95.8%) | 10,213 (93.2%) |
| 45 to 54 Years | 11,071 (97.1%) | 12,004 (94.5%) |
| 55 to 64 Years | 10,191 (93.8%) | 10,879 (91.1%) |
| 65 to 74 Years | 5,953 (94.0%) | 7,346 (91.9%) |
| 75 Years and over | 3,582 (92.0%) | 4,173 (87.5%) |
| Total | 78,981 (93.7%) | 79,704 (91.3%) |
Income Below Poverty Among Married-Couple Families in Rancho Cucamonga
The poverty statistics for married-couple families in Rancho Cucamonga show that 3.3% or 1,063 of the total 32,376 families live below the poverty line. Families with 3 or 4 children have the highest poverty rate of 8.6%, comprising of 232 families. On the other hand, families with no children have the lowest poverty rate of 2.7%, which includes 495 families.
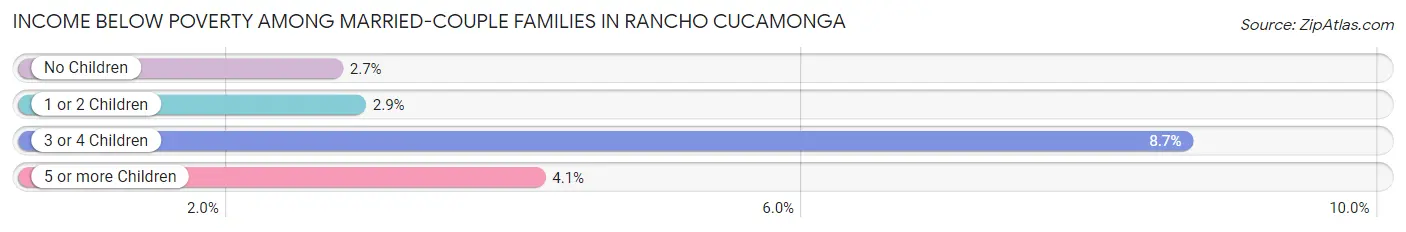
| Children | Above Poverty | Below Poverty |
| No Children | 17,629 (97.3%) | 495 (2.7%) |
| 1 or 2 Children | 11,096 (97.1%) | 330 (2.9%) |
| 3 or 4 Children | 2,449 (91.3%) | 232 (8.6%) |
| 5 or more Children | 139 (95.9%) | 6 (4.1%) |
| Total | 31,313 (96.7%) | 1,063 (3.3%) |
Income Below Poverty Among Single-Parent Households in Rancho Cucamonga
According to the poverty data in Rancho Cucamonga, 11.6% or 454 single-father households and 16.1% or 1,278 single-mother households are living below the poverty line. Among single-father households, those with 1 or 2 children have the highest poverty rate, with 253 households (19.9%) experiencing poverty. Likewise, among single-mother households, those with 5 or more children have the highest poverty rate, with 17 households (50.0%) falling below the poverty line.
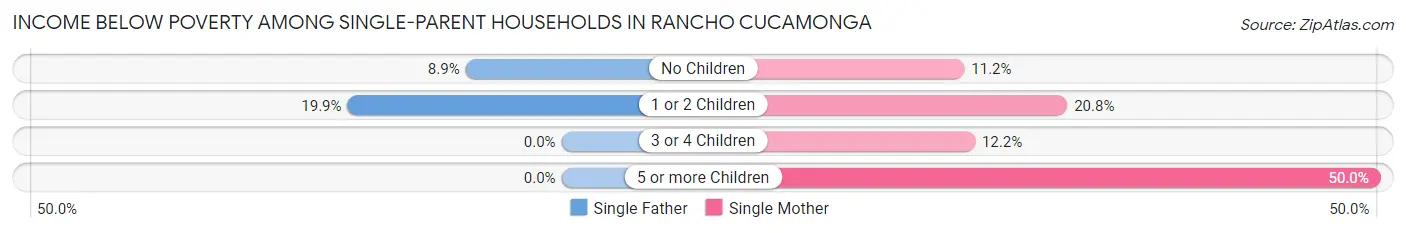
| Children | Single Father | Single Mother |
| No Children | 201 (8.9%) | 443 (11.2%) |
| 1 or 2 Children | 253 (19.9%) | 801 (20.8%) |
| 3 or 4 Children | 0 (0.0%) | 17 (12.2%) |
| 5 or more Children | 0 (0.0%) | 17 (50.0%) |
| Total | 454 (11.6%) | 1,278 (16.1%) |
Income Below Poverty Among Married-Couple vs Single-Parent Households in Rancho Cucamonga
The poverty data for Rancho Cucamonga shows that 1,063 of the married-couple family households (3.3%) and 1,732 of the single-parent households (14.6%) are living below the poverty level. Within the married-couple family households, those with 3 or 4 children have the highest poverty rate, with 232 households (8.6%) falling below the poverty line. Among the single-parent households, those with 5 or more children have the highest poverty rate, with 17 household (23.9%) living below poverty.
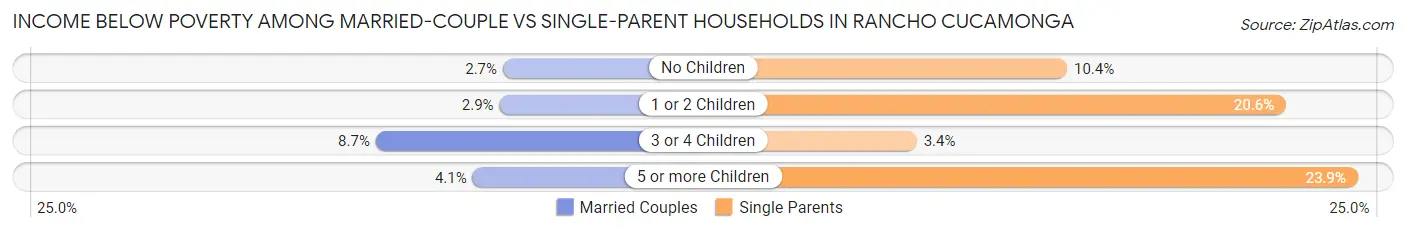
| Children | Married-Couple Families | Single-Parent Households |
| No Children | 495 (2.7%) | 644 (10.4%) |
| 1 or 2 Children | 330 (2.9%) | 1,054 (20.6%) |
| 3 or 4 Children | 232 (8.6%) | 17 (3.4%) |
| 5 or more Children | 6 (4.1%) | 17 (23.9%) |
| Total | 1,063 (3.3%) | 1,732 (14.6%) |
Race in Rancho Cucamonga
The most populous races in Rancho Cucamonga are White / Caucasian (81,767 | 46.8%), Hispanic or Latino (69,012 | 39.5%), and Two or more Races (26,747 | 15.3%).
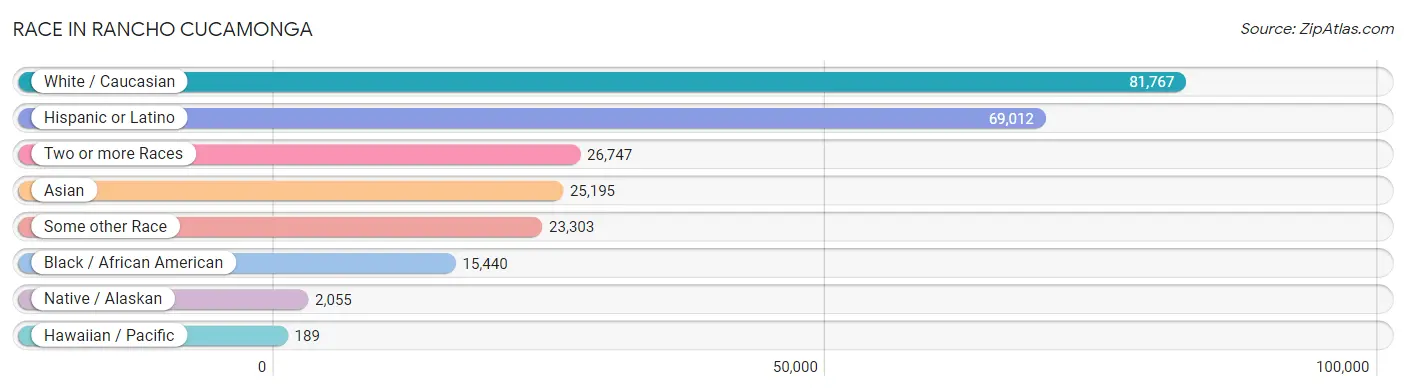
| Race | # Population | % Population |
| Asian | 25,195 | 14.4% |
| Black / African American | 15,440 | 8.8% |
| Hawaiian / Pacific | 189 | 0.1% |
| Hispanic or Latino | 69,012 | 39.5% |
| Native / Alaskan | 2,055 | 1.2% |
| White / Caucasian | 81,767 | 46.8% |
| Two or more Races | 26,747 | 15.3% |
| Some other Race | 23,303 | 13.3% |
| Total | 174,696 | 100.0% |
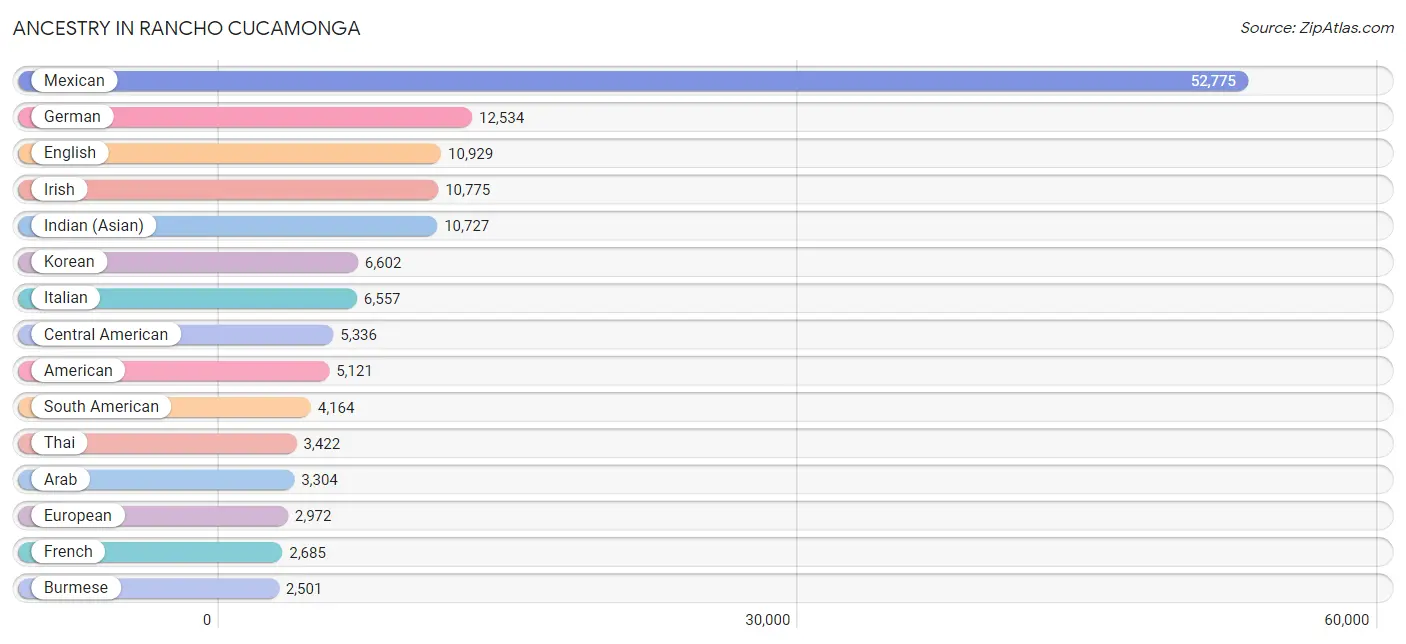
Ancestry in Rancho Cucamonga
The most populous ancestries reported in Rancho Cucamonga are Mexican (52,775 | 30.2%), German (12,534 | 7.2%), English (10,929 | 6.3%), Irish (10,775 | 6.2%), and Indian (Asian) (10,727 | 6.1%), together accounting for 55.9% of all Rancho Cucamonga residents.
| Ancestry | # Population | % Population |
| Afghan | 164 | 0.1% |
| African | 901 | 0.5% |
| Alaskan Athabascan | 10 | 0.0% |
| Alsatian | 11 | 0.0% |
| American | 5,121 | 2.9% |
| Apache | 35 | 0.0% |
| Arab | 3,304 | 1.9% |
| Argentinean | 1,252 | 0.7% |
| Armenian | 524 | 0.3% |
| Assyrian / Chaldean / Syriac | 11 | 0.0% |
| Austrian | 268 | 0.2% |
| Basque | 101 | 0.1% |
| Belgian | 61 | 0.0% |
| Belizean | 155 | 0.1% |
| Bhutanese | 1,515 | 0.9% |
| Blackfeet | 11 | 0.0% |
| Bolivian | 35 | 0.0% |
| Brazilian | 12 | 0.0% |
| British | 484 | 0.3% |
| British West Indian | 29 | 0.0% |
| Burmese | 2,501 | 1.4% |
| Canadian | 269 | 0.2% |
| Cape Verdean | 26 | 0.0% |
| Celtic | 11 | 0.0% |
| Central American | 5,336 | 3.0% |
| Central American Indian | 325 | 0.2% |
| Cherokee | 282 | 0.2% |
| Cheyenne | 56 | 0.0% |
| Chilean | 159 | 0.1% |
| Chippewa | 14 | 0.0% |
| Choctaw | 482 | 0.3% |
| Colombian | 852 | 0.5% |
| Costa Rican | 317 | 0.2% |
| Croatian | 230 | 0.1% |
| Cuban | 762 | 0.4% |
| Czech | 263 | 0.2% |
| Czechoslovakian | 136 | 0.1% |
| Danish | 446 | 0.3% |
| Dominican | 56 | 0.0% |
| Dutch | 1,284 | 0.7% |
| Eastern European | 309 | 0.2% |
| Ecuadorian | 492 | 0.3% |
| Egyptian | 633 | 0.4% |
| English | 10,929 | 6.3% |
| Estonian | 11 | 0.0% |
| European | 2,972 | 1.7% |
| Filipino | 855 | 0.5% |
| Finnish | 110 | 0.1% |
| French | 2,685 | 1.5% |
| French Canadian | 583 | 0.3% |
| German | 12,534 | 7.2% |
| Ghanaian | 187 | 0.1% |
| Greek | 118 | 0.1% |
| Guamanian / Chamorro | 293 | 0.2% |
| Guatemalan | 1,752 | 1.0% |
| Guyanese | 76 | 0.0% |
| Haitian | 39 | 0.0% |
| Honduran | 480 | 0.3% |
| Hopi | 5 | 0.0% |
| Hungarian | 232 | 0.1% |
| Indian (Asian) | 10,727 | 6.1% |
| Indonesian | 132 | 0.1% |
| Iranian | 422 | 0.2% |
| Iraqi | 66 | 0.0% |
| Irish | 10,775 | 6.2% |
| Italian | 6,557 | 3.7% |
| Jamaican | 146 | 0.1% |
| Japanese | 116 | 0.1% |
| Jordanian | 402 | 0.2% |
| Kenyan | 178 | 0.1% |
| Korean | 6,602 | 3.8% |
| Laotian | 1,286 | 0.7% |
| Latvian | 29 | 0.0% |
| Lebanese | 321 | 0.2% |
| Lithuanian | 142 | 0.1% |
| Malaysian | 85 | 0.1% |
| Maltese | 37 | 0.0% |
| Mexican | 52,775 | 30.2% |
| Mexican American Indian | 1,286 | 0.7% |
| Moroccan | 21 | 0.0% |
| Native Hawaiian | 124 | 0.1% |
| Navajo | 215 | 0.1% |
| Nepalese | 70 | 0.0% |
| Nicaraguan | 460 | 0.3% |
| Nigerian | 636 | 0.4% |
| Northern European | 451 | 0.3% |
| Norwegian | 1,348 | 0.8% |
| Pakistani | 776 | 0.4% |
| Palestinian | 406 | 0.2% |
| Panamanian | 96 | 0.1% |
| Paraguayan | 11 | 0.0% |
| Pennsylvania German | 9 | 0.0% |
| Peruvian | 1,308 | 0.7% |
| Pima | 45 | 0.0% |
| Polish | 1,776 | 1.0% |
| Portuguese | 632 | 0.4% |
| Pueblo | 44 | 0.0% |
| Puerto Rican | 1,146 | 0.7% |
| Romanian | 75 | 0.0% |
| Russian | 536 | 0.3% |
| Salvadoran | 2,210 | 1.3% |
| Samoan | 59 | 0.0% |
| Scandinavian | 402 | 0.2% |
| Scotch-Irish | 1,023 | 0.6% |
| Scottish | 1,589 | 0.9% |
| Serbian | 35 | 0.0% |
| Shoshone | 50 | 0.0% |
| Sioux | 195 | 0.1% |
| Slavic | 50 | 0.0% |
| Slovak | 165 | 0.1% |
| Slovene | 171 | 0.1% |
| South African | 50 | 0.0% |
| South American | 4,164 | 2.4% |
| South American Indian | 6 | 0.0% |
| Spaniard | 678 | 0.4% |
| Spanish | 726 | 0.4% |
| Sri Lankan | 2,006 | 1.1% |
| Subsaharan African | 2,124 | 1.2% |
| Sudanese | 56 | 0.0% |
| Swedish | 1,417 | 0.8% |
| Swiss | 200 | 0.1% |
| Syrian | 668 | 0.4% |
| Thai | 3,422 | 2.0% |
| Tongan | 53 | 0.0% |
| Trinidadian and Tobagonian | 317 | 0.2% |
| Turkish | 57 | 0.0% |
| Ugandan | 1 | 0.0% |
| Ukrainian | 202 | 0.1% |
| Venezuelan | 46 | 0.0% |
| Vietnamese | 27 | 0.0% |
| Welsh | 876 | 0.5% |
| West Indian | 175 | 0.1% |
| Yaqui | 139 | 0.1% |
| Yugoslavian | 60 | 0.0% |
| Yuman | 12 | 0.0% | View All 135 Rows |
Immigrants in Rancho Cucamonga
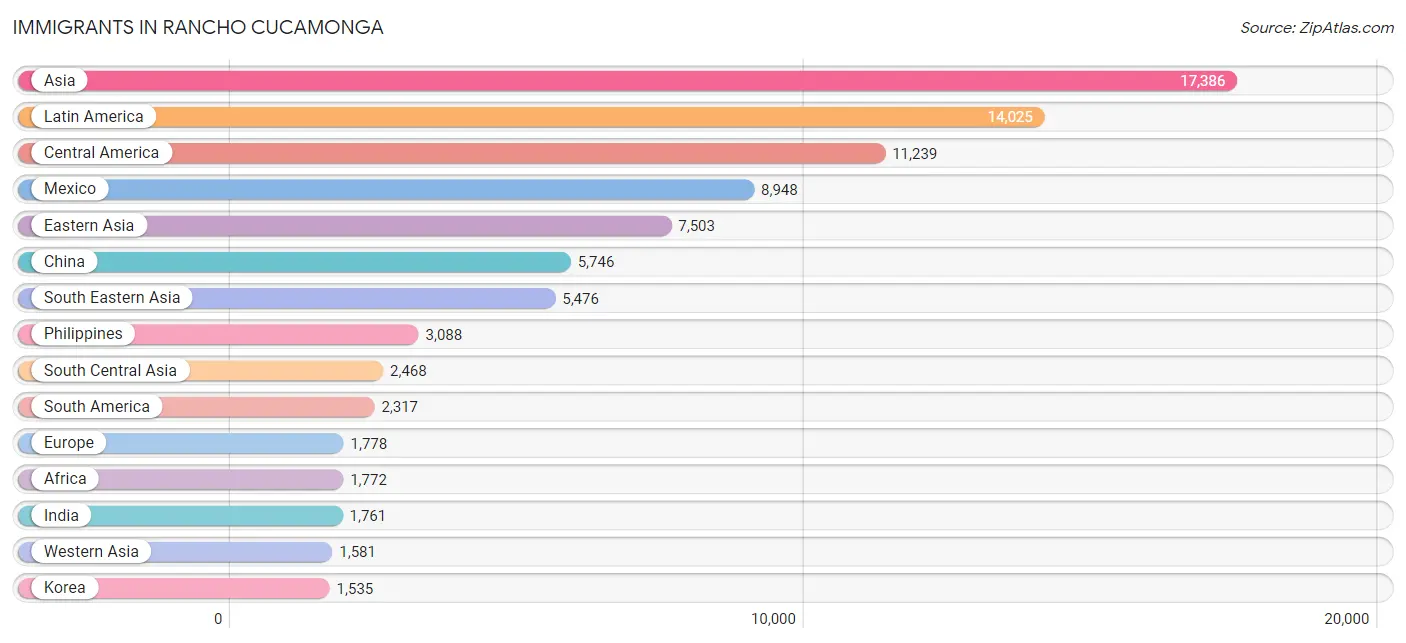
The most numerous immigrant groups reported in Rancho Cucamonga came from Asia (17,386 | 10.0%), Latin America (14,025 | 8.0%), Central America (11,239 | 6.4%), Mexico (8,948 | 5.1%), and Eastern Asia (7,503 | 4.3%), together accounting for 33.8% of all Rancho Cucamonga residents.
| Immigration Origin | # Population | % Population |
| Afghanistan | 163 | 0.1% |
| Africa | 1,772 | 1.0% |
| Argentina | 608 | 0.4% |
| Armenia | 57 | 0.0% |
| Asia | 17,386 | 10.0% |
| Australia | 7 | 0.0% |
| Azores | 114 | 0.1% |
| Bangladesh | 97 | 0.1% |
| Belize | 77 | 0.0% |
| Bolivia | 25 | 0.0% |
| Brazil | 41 | 0.0% |
| Cambodia | 48 | 0.0% |
| Canada | 466 | 0.3% |
| Caribbean | 469 | 0.3% |
| Central America | 11,239 | 6.4% |
| Chile | 1 | 0.0% |
| China | 5,746 | 3.3% |
| Colombia | 623 | 0.4% |
| Costa Rica | 92 | 0.1% |
| Croatia | 20 | 0.0% |
| Cuba | 214 | 0.1% |
| Czechoslovakia | 10 | 0.0% |
| Denmark | 29 | 0.0% |
| Dominican Republic | 9 | 0.0% |
| Eastern Africa | 323 | 0.2% |
| Eastern Asia | 7,503 | 4.3% |
| Eastern Europe | 158 | 0.1% |
| Ecuador | 118 | 0.1% |
| Egypt | 1,114 | 0.6% |
| El Salvador | 978 | 0.6% |
| England | 341 | 0.2% |
| Ethiopia | 72 | 0.0% |
| Europe | 1,778 | 1.0% |
| France | 174 | 0.1% |
| Germany | 271 | 0.2% |
| Ghana | 32 | 0.0% |
| Greece | 34 | 0.0% |
| Guatemala | 559 | 0.3% |
| Guyana | 85 | 0.1% |
| Haiti | 27 | 0.0% |
| Honduras | 199 | 0.1% |
| Hong Kong | 595 | 0.3% |
| India | 1,761 | 1.0% |
| Indonesia | 738 | 0.4% |
| Iran | 252 | 0.1% |
| Iraq | 178 | 0.1% |
| Israel | 45 | 0.0% |
| Italy | 149 | 0.1% |
| Jamaica | 92 | 0.1% |
| Japan | 222 | 0.1% |
| Jordan | 280 | 0.2% |
| Kenya | 66 | 0.0% |
| Korea | 1,535 | 0.9% |
| Kuwait | 91 | 0.1% |
| Laos | 60 | 0.0% |
| Latin America | 14,025 | 8.0% |
| Lebanon | 237 | 0.1% |
| Liberia | 27 | 0.0% |
| Malaysia | 123 | 0.1% |
| Mexico | 8,948 | 5.1% |
| Morocco | 7 | 0.0% |
| Netherlands | 134 | 0.1% |
| Nicaragua | 279 | 0.2% |
| Nigeria | 204 | 0.1% |
| Northern Africa | 1,145 | 0.7% |
| Northern Europe | 609 | 0.4% |
| Norway | 2 | 0.0% |
| Oceania | 7 | 0.0% |
| Pakistan | 190 | 0.1% |
| Panama | 107 | 0.1% |
| Peru | 811 | 0.5% |
| Philippines | 3,088 | 1.8% |
| Poland | 59 | 0.0% |
| Portugal | 169 | 0.1% |
| Romania | 48 | 0.0% |
| Saudi Arabia | 35 | 0.0% |
| South America | 2,317 | 1.3% |
| South Central Asia | 2,468 | 1.4% |
| South Eastern Asia | 5,476 | 3.1% |
| Southern Europe | 432 | 0.3% |
| Spain | 72 | 0.0% |
| Sri Lanka | 5 | 0.0% |
| Sudan | 24 | 0.0% |
| Sweden | 51 | 0.0% |
| Syria | 467 | 0.3% |
| Taiwan | 1,010 | 0.6% |
| Thailand | 353 | 0.2% |
| Trinidad and Tobago | 102 | 0.1% |
| Turkey | 41 | 0.0% |
| Uganda | 3 | 0.0% |
| Vietnam | 952 | 0.5% |
| Western Africa | 263 | 0.2% |
| Western Asia | 1,581 | 0.9% |
| Western Europe | 579 | 0.3% |
| Zimbabwe | 182 | 0.1% | View All 95 Rows |
Sex and Age in Rancho Cucamonga
Sex and Age in Rancho Cucamonga
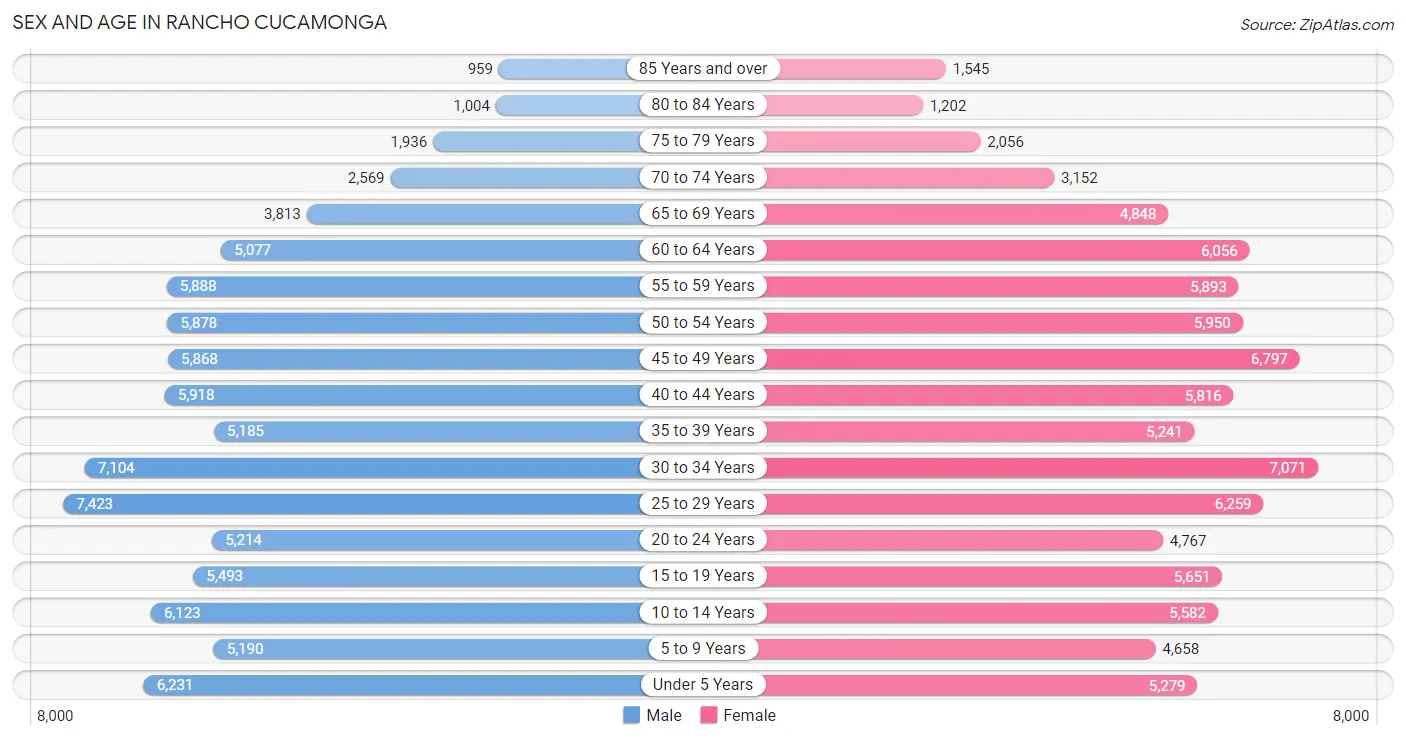
The most populous age groups in Rancho Cucamonga are 25 to 29 Years (7,423 | 8.5%) for men and 30 to 34 Years (7,071 | 8.1%) for women.
| Age Bracket | Male | Female |
| Under 5 Years | 6,231 (7.2%) | 5,279 (6.0%) |
| 5 to 9 Years | 5,190 (6.0%) | 4,658 (5.3%) |
| 10 to 14 Years | 6,123 (7.0%) | 5,582 (6.4%) |
| 15 to 19 Years | 5,493 (6.3%) | 5,651 (6.4%) |
| 20 to 24 Years | 5,214 (6.0%) | 4,767 (5.4%) |
| 25 to 29 Years | 7,423 (8.5%) | 6,259 (7.1%) |
| 30 to 34 Years | 7,104 (8.2%) | 7,071 (8.1%) |
| 35 to 39 Years | 5,185 (6.0%) | 5,241 (6.0%) |
| 40 to 44 Years | 5,918 (6.8%) | 5,816 (6.6%) |
| 45 to 49 Years | 5,868 (6.8%) | 6,797 (7.7%) |
| 50 to 54 Years | 5,878 (6.8%) | 5,950 (6.8%) |
| 55 to 59 Years | 5,888 (6.8%) | 5,893 (6.7%) |
| 60 to 64 Years | 5,077 (5.8%) | 6,056 (6.9%) |
| 65 to 69 Years | 3,813 (4.4%) | 4,848 (5.5%) |
| 70 to 74 Years | 2,569 (3.0%) | 3,152 (3.6%) |
| 75 to 79 Years | 1,936 (2.2%) | 2,056 (2.3%) |
| 80 to 84 Years | 1,004 (1.2%) | 1,202 (1.4%) |
| 85 Years and over | 959 (1.1%) | 1,545 (1.8%) |
| Total | 86,873 (100.0%) | 87,823 (100.0%) |
Families and Households in Rancho Cucamonga
Median Family Size in Rancho Cucamonga
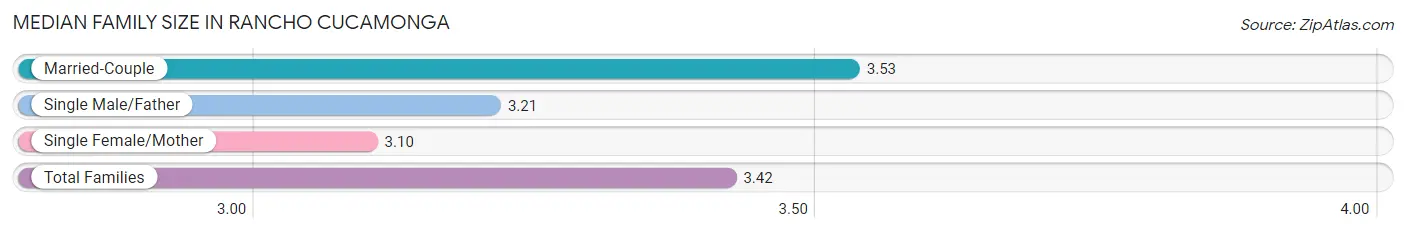
The median family size in Rancho Cucamonga is 3.42 persons per family, with married-couple families (32,376 | 73.2%) accounting for the largest median family size of 3.53 persons per family. On the other hand, single female/mother families (7,963 | 18.0%) represent the smallest median family size with 3.10 persons per family.
| Family Type | # Families | Family Size |
| Married-Couple | 32,376 (73.2%) | 3.53 |
| Single Male/Father | 3,915 (8.8%) | 3.21 |
| Single Female/Mother | 7,963 (18.0%) | 3.10 |
| Total Families | 44,254 (100.0%) | 3.42 |
Median Household Size in Rancho Cucamonga
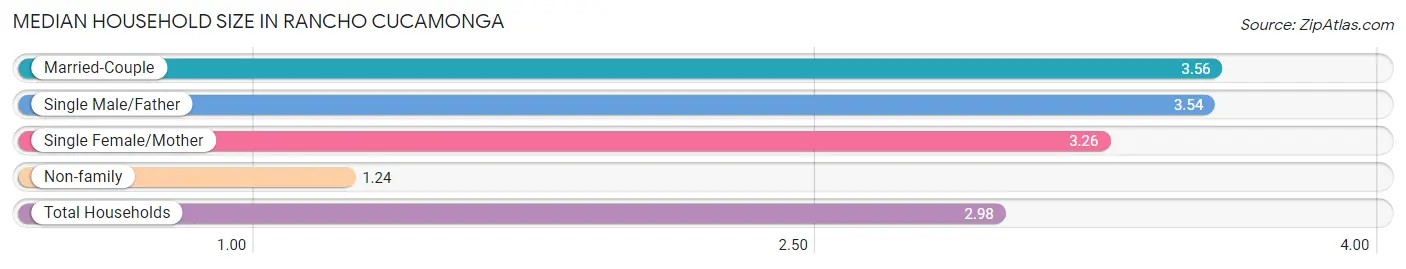
The median household size in Rancho Cucamonga is 2.98 persons per household, with married-couple households (32,376 | 56.2%) accounting for the largest median household size of 3.56 persons per household. non-family households (13,299 | 23.1%) represent the smallest median household size with 1.24 persons per household.
| Household Type | # Households | Household Size |
| Married-Couple | 32,376 (56.2%) | 3.56 |
| Single Male/Father | 3,915 (6.8%) | 3.54 |
| Single Female/Mother | 7,963 (13.8%) | 3.26 |
| Non-family | 13,299 (23.1%) | 1.24 |
| Total Households | 57,553 (100.0%) | 2.98 |
Household Size by Marriage Status in Rancho Cucamonga
Out of a total of 57,553 households in Rancho Cucamonga, 44,254 (76.9%) are family households, while 13,299 (23.1%) are nonfamily households. The most numerous type of family households are 2-person households, comprising 15,101, and the most common type of nonfamily households are 1-person households, comprising 10,999.
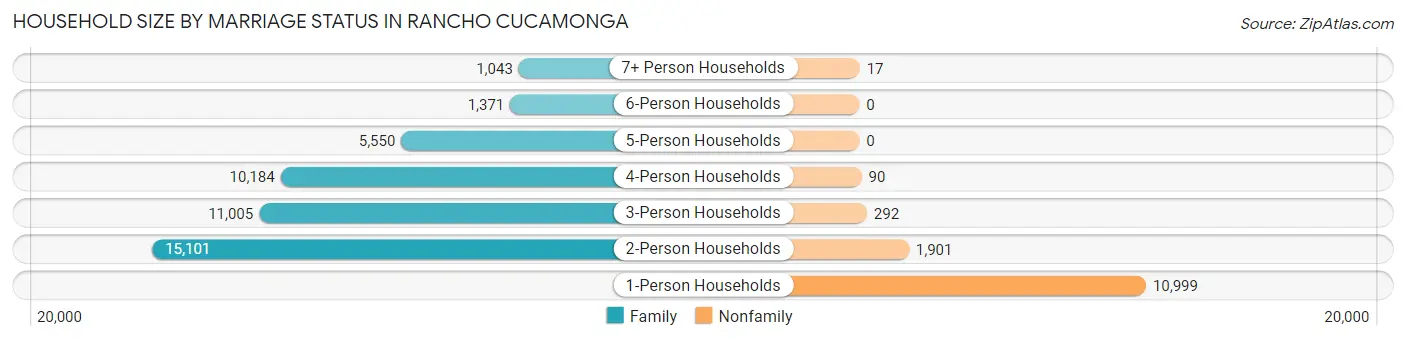
| Household Size | Family Households | Nonfamily Households |
| 1-Person Households | - | 10,999 (19.1%) |
| 2-Person Households | 15,101 (26.2%) | 1,901 (3.3%) |
| 3-Person Households | 11,005 (19.1%) | 292 (0.5%) |
| 4-Person Households | 10,184 (17.7%) | 90 (0.2%) |
| 5-Person Households | 5,550 (9.6%) | 0 (0.0%) |
| 6-Person Households | 1,371 (2.4%) | 0 (0.0%) |
| 7+ Person Households | 1,043 (1.8%) | 17 (0.0%) |
| Total | 44,254 (76.9%) | 13,299 (23.1%) |
Female Fertility in Rancho Cucamonga
Fertility by Age in Rancho Cucamonga
Average fertility rate in Rancho Cucamonga is 50.0 births per 1,000 women. Women in the age bracket of 20 to 34 years have the highest fertility rate with 80.0 births per 1,000 women. Women in the age bracket of 20 to 34 years acount for 67.6% of all women with births.
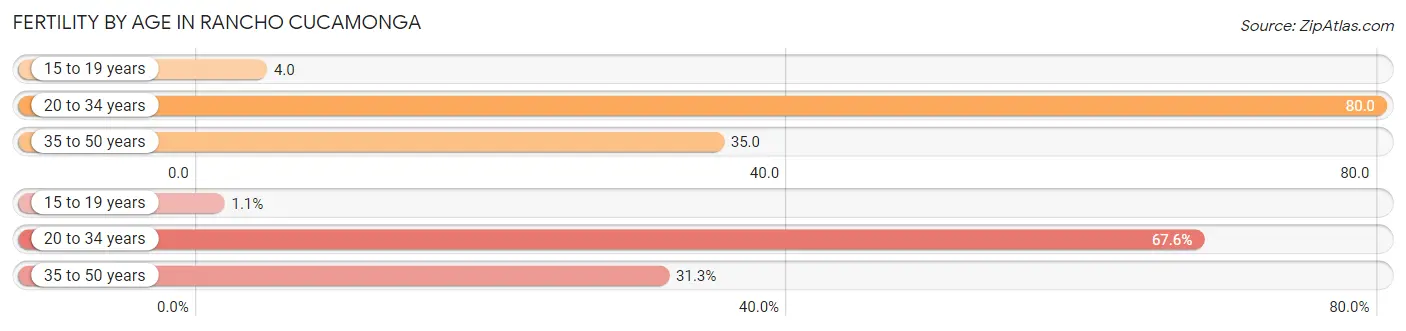
| Age Bracket | Women with Births | Births / 1,000 Women |
| 15 to 19 years | 24 (1.1%) | 4.0 |
| 20 to 34 years | 1,447 (67.6%) | 80.0 |
| 35 to 50 years | 670 (31.3%) | 35.0 |
| Total | 2,141 (100.0%) | 50.0 |
Fertility by Age by Marriage Status in Rancho Cucamonga
71.9% of women with births (2,141) in Rancho Cucamonga are married. The highest percentage of unmarried women with births falls into 15 to 19 years age bracket with 100.0% of them unmarried at the time of birth, while the lowest percentage of unmarried women with births belong to 35 to 50 years age bracket with 20.3% of them unmarried.
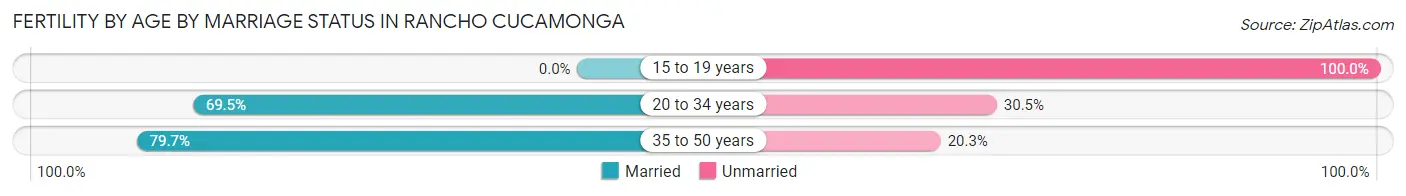
| Age Bracket | Married | Unmarried |
| 15 to 19 years | 0 (0.0%) | 24 (100.0%) |
| 20 to 34 years | 1,006 (69.5%) | 441 (30.5%) |
| 35 to 50 years | 534 (79.7%) | 136 (20.3%) |
| Total | 1,539 (71.9%) | 602 (28.1%) |
Fertility by Education in Rancho Cucamonga
Average fertility rate in Rancho Cucamonga is 50.0 births per 1,000 women. Women with the education attainment of bachelor's degree have the highest fertility rate of 68.0 births per 1,000 women, while women with the education attainment of less than high school have the lowest fertility at 13.0 births per 1,000 women. Women with the education attainment of college or associate's degree represent 41.7% of all women with births.
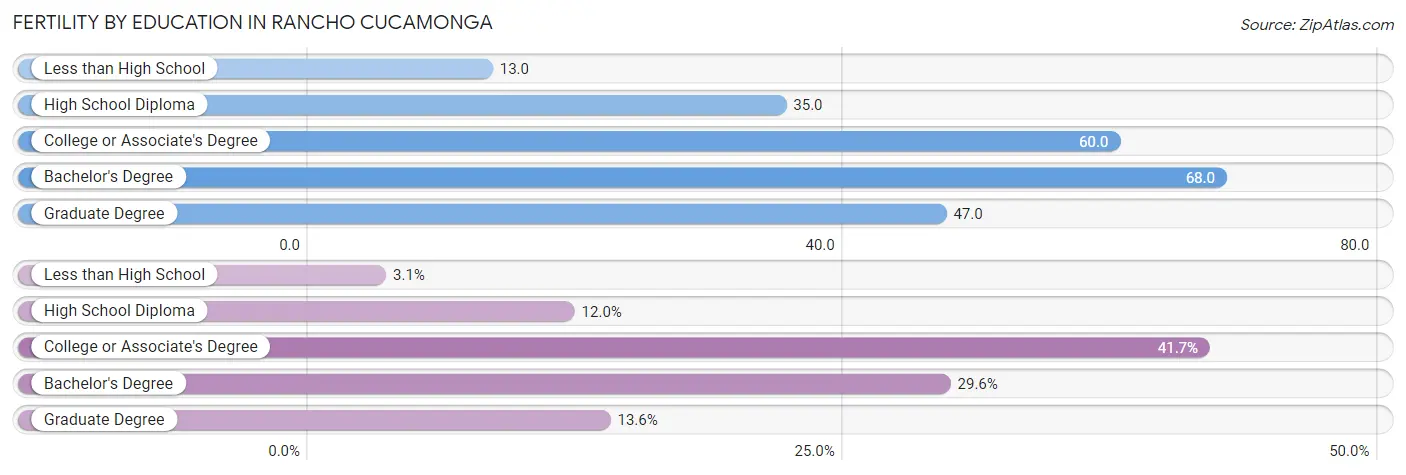
| Educational Attainment | Women with Births | Births / 1,000 Women |
| Less than High School | 67 (3.1%) | 13.0 |
| High School Diploma | 256 (12.0%) | 35.0 |
| College or Associate's Degree | 893 (41.7%) | 60.0 |
| Bachelor's Degree | 633 (29.6%) | 68.0 |
| Graduate Degree | 292 (13.6%) | 47.0 |
| Total | 2,141 (100.0%) | 50.0 |
Fertility by Education by Marriage Status in Rancho Cucamonga
28.1% of women with births in Rancho Cucamonga are unmarried. Women with the educational attainment of graduate degree are most likely to be married with 100.0% of them married at childbirth, while women with the educational attainment of less than high school are least likely to be married with 53.7% of them unmarried at childbirth.
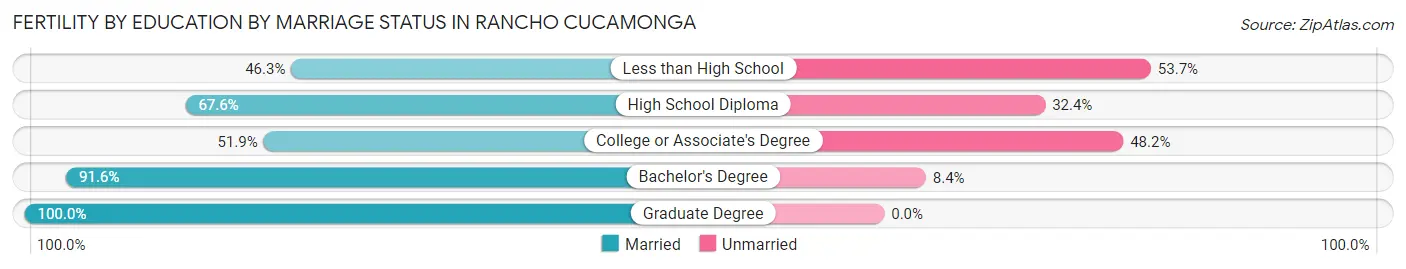
| Educational Attainment | Married | Unmarried |
| Less than High School | 31 (46.3%) | 36 (53.7%) |
| High School Diploma | 173 (67.6%) | 83 (32.4%) |
| College or Associate's Degree | 463 (51.8%) | 430 (48.1%) |
| Bachelor's Degree | 580 (91.6%) | 53 (8.4%) |
| Graduate Degree | 292 (100.0%) | 0 (0.0%) |
| Total | 1,539 (71.9%) | 602 (28.1%) |
Employment Characteristics in Rancho Cucamonga
Employment by Class of Employer in Rancho Cucamonga
Among the 84,224 employed individuals in Rancho Cucamonga, private company employees (53,436 | 63.4%), local government employees (11,072 | 13.2%), and not-for-profit organizations (6,135 | 7.3%) make up the most common classes of employment.
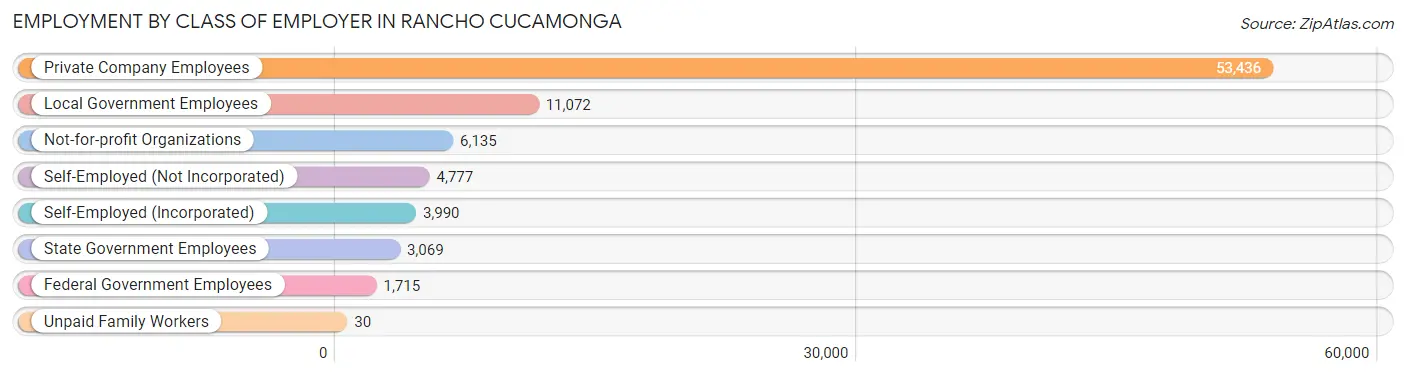
| Employer Class | # Employees | % Employees |
| Private Company Employees | 53,436 | 63.4% |
| Self-Employed (Incorporated) | 3,990 | 4.7% |
| Self-Employed (Not Incorporated) | 4,777 | 5.7% |
| Not-for-profit Organizations | 6,135 | 7.3% |
| Local Government Employees | 11,072 | 13.2% |
| State Government Employees | 3,069 | 3.6% |
| Federal Government Employees | 1,715 | 2.0% |
| Unpaid Family Workers | 30 | 0.0% |
| Total | 84,224 | 100.0% |
Employment Status by Age in Rancho Cucamonga
According to the labor force statistics for Rancho Cucamonga, out of the total population over 16 years of age (139,074), 65.9% or 91,650 individuals are in the labor force, with 5.4% or 4,949 of them unemployed. The age group with the highest labor force participation rate is 45 to 54 years, with 83.8% or 20,525 individuals in the labor force. Within the labor force, the 16 to 19 years age range has the highest percentage of unemployed individuals, with 15.0% or 471 of them being unemployed.
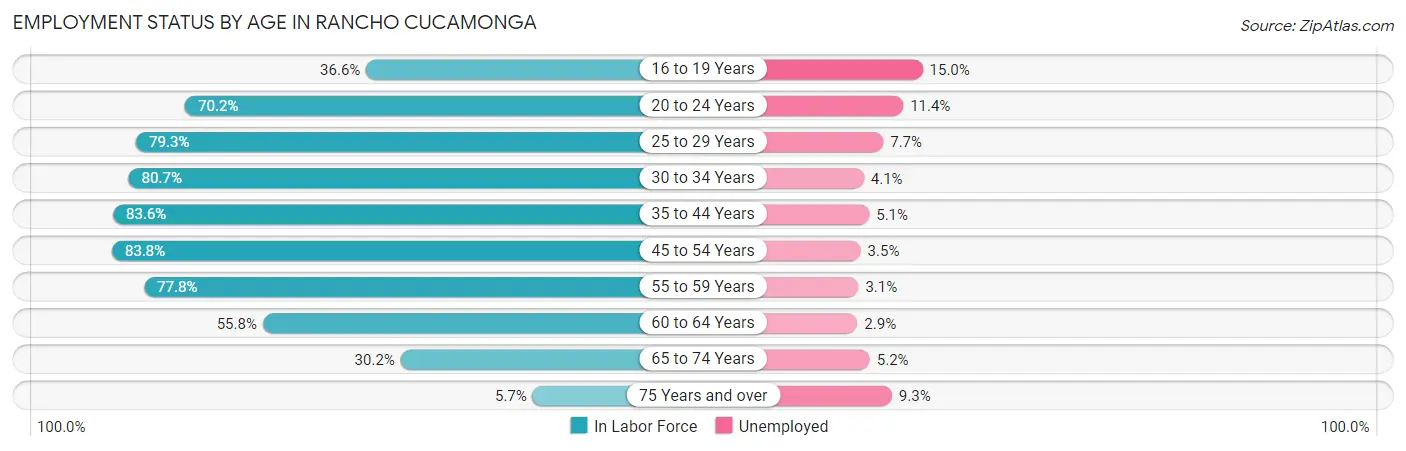
| Age Bracket | In Labor Force | Unemployed |
| 16 to 19 Years | 3,142 (36.6%) | 471 (15.0%) |
| 20 to 24 Years | 7,007 (70.2%) | 799 (11.4%) |
| 25 to 29 Years | 10,850 (79.3%) | 835 (7.7%) |
| 30 to 34 Years | 11,439 (80.7%) | 469 (4.1%) |
| 35 to 44 Years | 18,526 (83.6%) | 945 (5.1%) |
| 45 to 54 Years | 20,525 (83.8%) | 718 (3.5%) |
| 55 to 59 Years | 9,166 (77.8%) | 284 (3.1%) |
| 60 to 64 Years | 6,212 (55.8%) | 180 (2.9%) |
| 65 to 74 Years | 4,343 (30.2%) | 226 (5.2%) |
| 75 Years and over | 496 (5.7%) | 46 (9.3%) |
| Total | 91,650 (65.9%) | 4,949 (5.4%) |
Employment Status by Educational Attainment in Rancho Cucamonga
According to labor force statistics for Rancho Cucamonga, 78.7% of individuals (76,673) out of the total population between 25 and 64 years of age (97,424) are in the labor force, with 4.5% or 3,450 of them being unemployed. The group with the highest labor force participation rate are those with the educational attainment of bachelor's degree or higher, with 86.5% or 32,901 individuals in the labor force. Within the labor force, individuals with less than high school education have the highest percentage of unemployment, with 7.7% or 283 of them being unemployed.
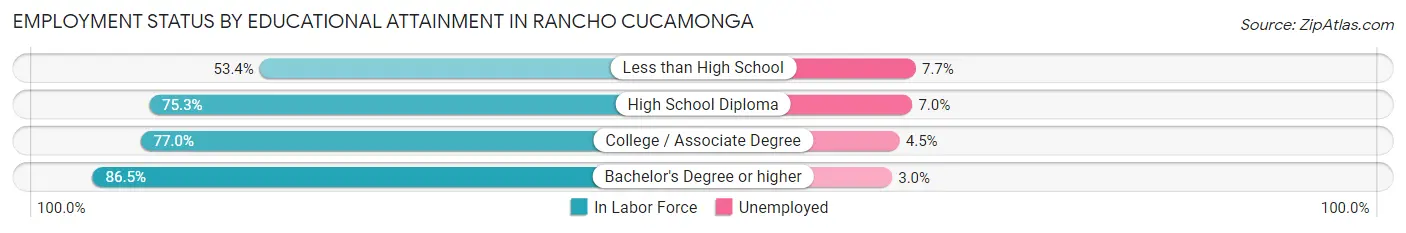
| Educational Attainment | In Labor Force | Unemployed |
| Less than High School | 3,673 (53.4%) | 530 (7.7%) |
| High School Diploma | 13,132 (75.3%) | 1,221 (7.0%) |
| College / Associate Degree | 27,005 (77.0%) | 1,578 (4.5%) |
| Bachelor's Degree or higher | 32,901 (86.5%) | 1,141 (3.0%) |
| Total | 76,673 (78.7%) | 4,384 (4.5%) |
Employment Occupations by Sex in Rancho Cucamonga
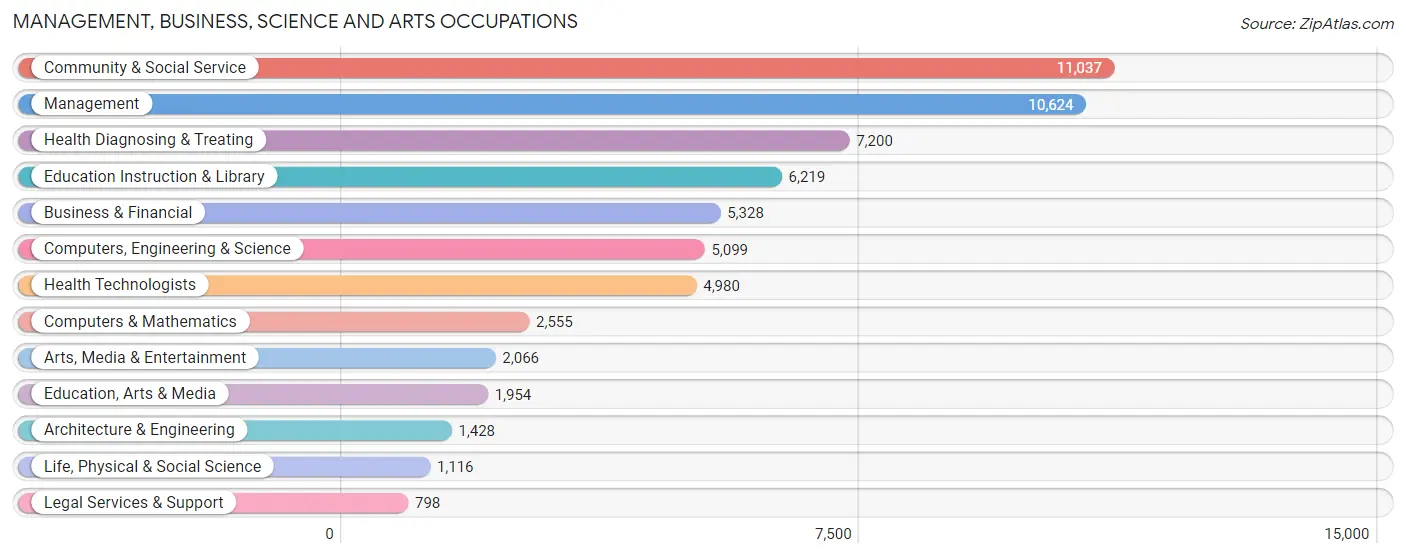
Management, Business, Science and Arts Occupations
The most common Management, Business, Science and Arts occupations in Rancho Cucamonga are Community & Social Service (11,037 | 12.7%), Management (10,624 | 12.2%), Health Diagnosing & Treating (7,200 | 8.3%), Education Instruction & Library (6,219 | 7.2%), and Business & Financial (5,328 | 6.1%).
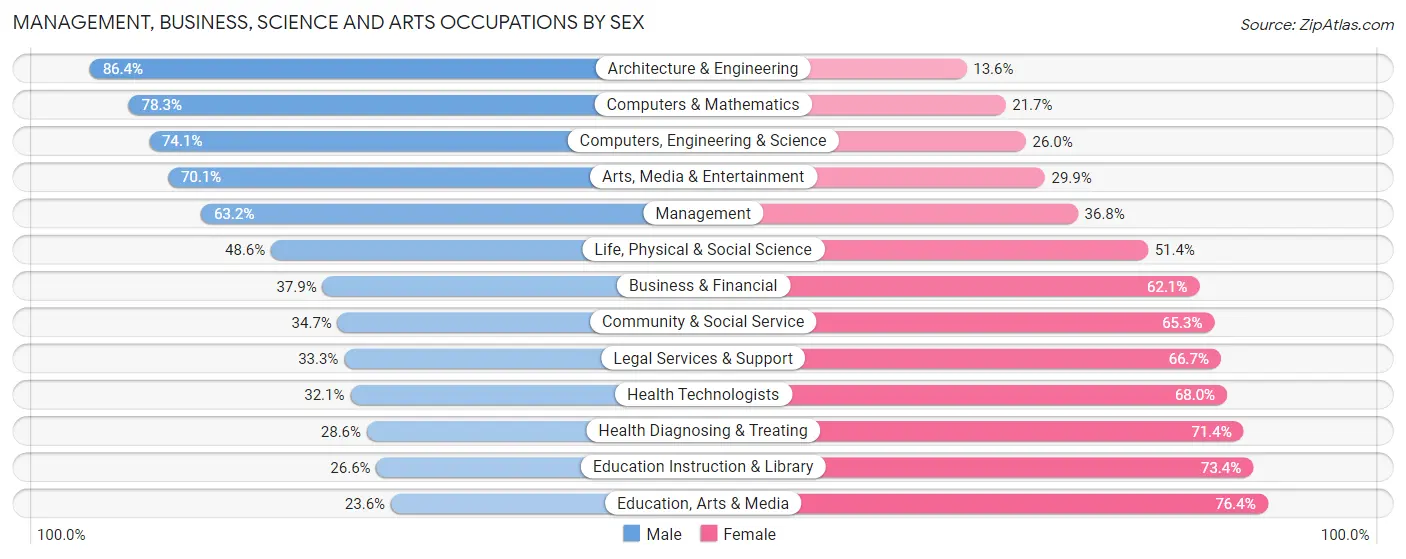
Management, Business, Science and Arts Occupations by Sex
Within the Management, Business, Science and Arts occupations in Rancho Cucamonga, the most male-oriented occupations are Architecture & Engineering (86.4%), Computers & Mathematics (78.3%), and Computers, Engineering & Science (74.1%), while the most female-oriented occupations are Education, Arts & Media (76.4%), Education Instruction & Library (73.4%), and Health Diagnosing & Treating (71.4%).
| Occupation | Male | Female |
| Management | 6,714 (63.2%) | 3,910 (36.8%) |
| Business & Financial | 2,017 (37.9%) | 3,311 (62.1%) |
| Computers, Engineering & Science | 3,776 (74.1%) | 1,323 (26.0%) |
| Computers & Mathematics | 2,000 (78.3%) | 555 (21.7%) |
| Architecture & Engineering | 1,234 (86.4%) | 194 (13.6%) |
| Life, Physical & Social Science | 542 (48.6%) | 574 (51.4%) |
| Community & Social Service | 3,830 (34.7%) | 7,207 (65.3%) |
| Education, Arts & Media | 461 (23.6%) | 1,493 (76.4%) |
| Legal Services & Support | 266 (33.3%) | 532 (66.7%) |
| Education Instruction & Library | 1,655 (26.6%) | 4,564 (73.4%) |
| Arts, Media & Entertainment | 1,448 (70.1%) | 618 (29.9%) |
| Health Diagnosing & Treating | 2,059 (28.6%) | 5,141 (71.4%) |
| Health Technologists | 1,596 (32.1%) | 3,384 (67.9%) |
| Total (Category) | 18,396 (46.8%) | 20,892 (53.2%) |
| Total (Overall) | 45,876 (52.9%) | 40,838 (47.1%) |
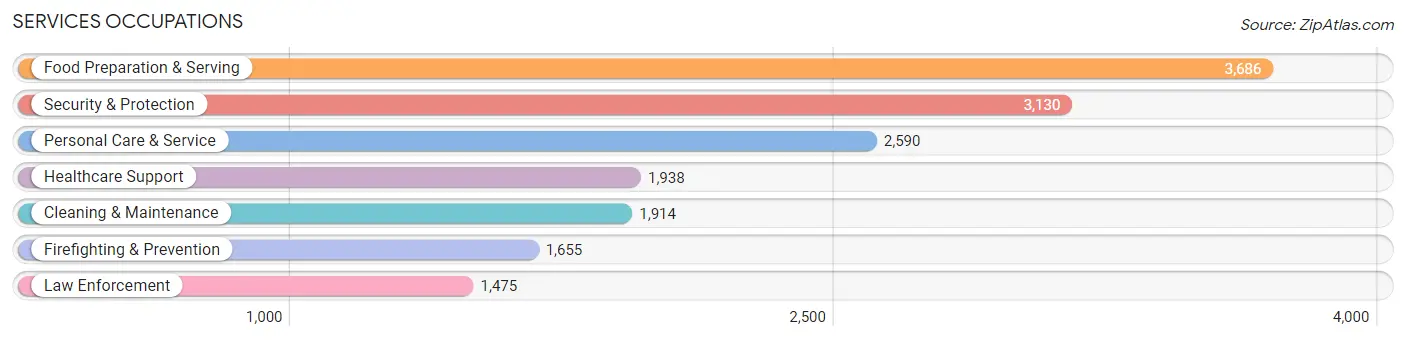
Services Occupations
The most common Services occupations in Rancho Cucamonga are Food Preparation & Serving (3,686 | 4.3%), Security & Protection (3,130 | 3.6%), Personal Care & Service (2,590 | 3.0%), Healthcare Support (1,938 | 2.2%), and Cleaning & Maintenance (1,914 | 2.2%).
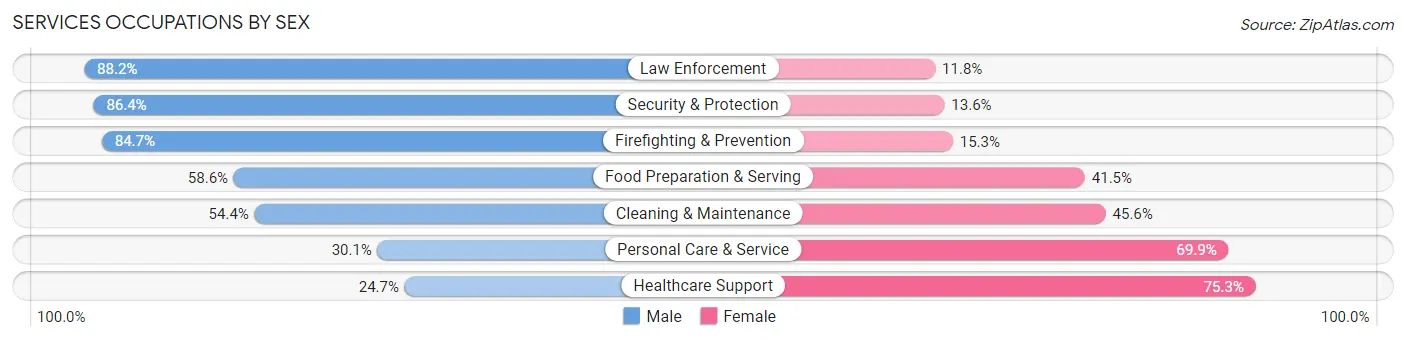
Services Occupations by Sex
Within the Services occupations in Rancho Cucamonga, the most male-oriented occupations are Law Enforcement (88.2%), Security & Protection (86.4%), and Firefighting & Prevention (84.7%), while the most female-oriented occupations are Healthcare Support (75.3%), Personal Care & Service (69.9%), and Cleaning & Maintenance (45.6%).
| Occupation | Male | Female |
| Healthcare Support | 479 (24.7%) | 1,459 (75.3%) |
| Security & Protection | 2,703 (86.4%) | 427 (13.6%) |
| Firefighting & Prevention | 1,402 (84.7%) | 253 (15.3%) |
| Law Enforcement | 1,301 (88.2%) | 174 (11.8%) |
| Food Preparation & Serving | 2,158 (58.6%) | 1,528 (41.4%) |
| Cleaning & Maintenance | 1,042 (54.4%) | 872 (45.6%) |
| Personal Care & Service | 779 (30.1%) | 1,811 (69.9%) |
| Total (Category) | 7,161 (54.0%) | 6,097 (46.0%) |
| Total (Overall) | 45,876 (52.9%) | 40,838 (47.1%) |
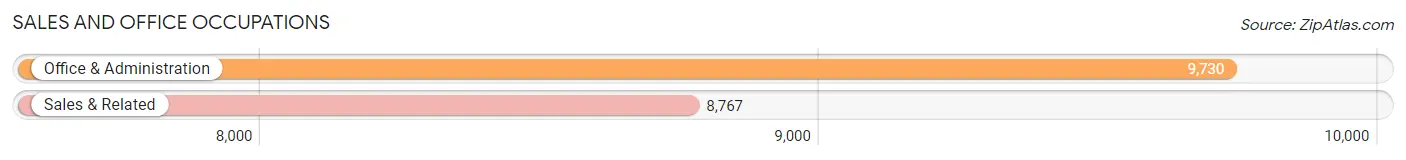
Sales and Office Occupations
The most common Sales and Office occupations in Rancho Cucamonga are Office & Administration (9,730 | 11.2%), and Sales & Related (8,767 | 10.1%).
Sales and Office Occupations by Sex
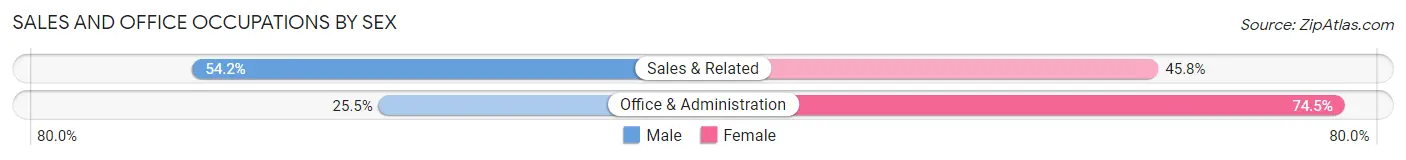
| Occupation | Male | Female |
| Sales & Related | 4,750 (54.2%) | 4,017 (45.8%) |
| Office & Administration | 2,485 (25.5%) | 7,245 (74.5%) |
| Total (Category) | 7,235 (39.1%) | 11,262 (60.9%) |
| Total (Overall) | 45,876 (52.9%) | 40,838 (47.1%) |
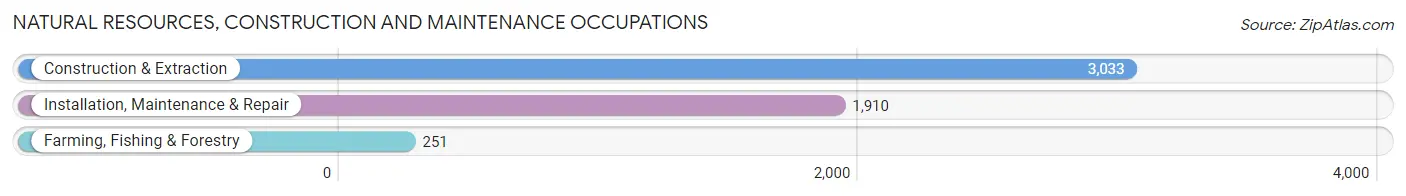
Natural Resources, Construction and Maintenance Occupations
The most common Natural Resources, Construction and Maintenance occupations in Rancho Cucamonga are Construction & Extraction (3,033 | 3.5%), Installation, Maintenance & Repair (1,910 | 2.2%), and Farming, Fishing & Forestry (251 | 0.3%).
Natural Resources, Construction and Maintenance Occupations by Sex
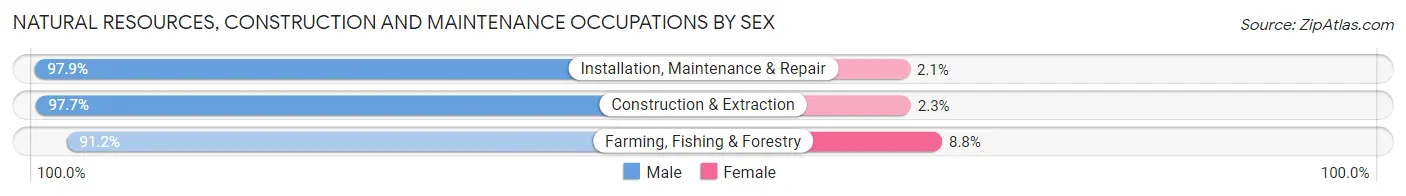
| Occupation | Male | Female |
| Farming, Fishing & Forestry | 229 (91.2%) | 22 (8.8%) |
| Construction & Extraction | 2,964 (97.7%) | 69 (2.3%) |
| Installation, Maintenance & Repair | 1,870 (97.9%) | 40 (2.1%) |
| Total (Category) | 5,063 (97.5%) | 131 (2.5%) |
| Total (Overall) | 45,876 (52.9%) | 40,838 (47.1%) |
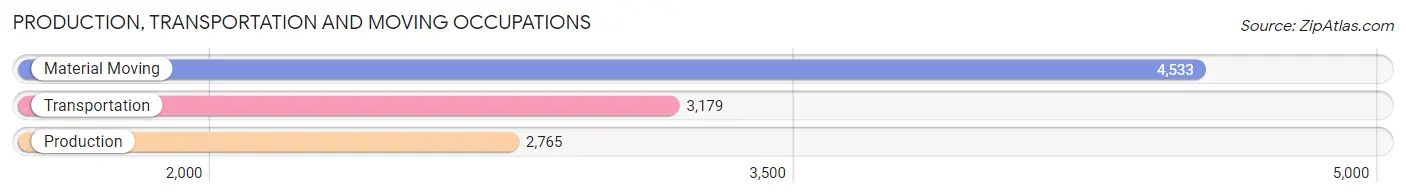
Production, Transportation and Moving Occupations
The most common Production, Transportation and Moving occupations in Rancho Cucamonga are Material Moving (4,533 | 5.2%), Transportation (3,179 | 3.7%), and Production (2,765 | 3.2%).
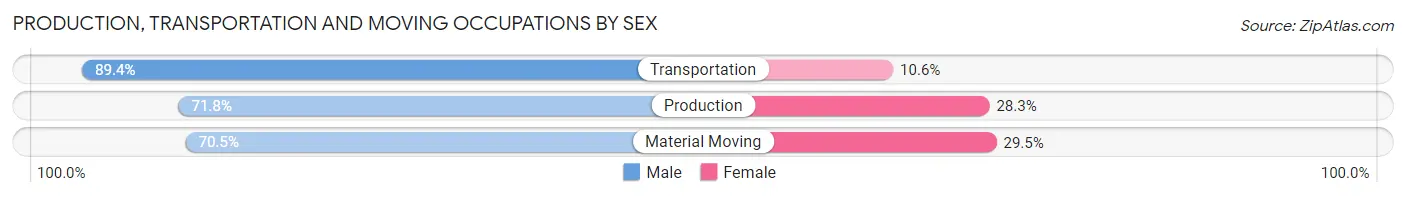
Production, Transportation and Moving Occupations by Sex
| Occupation | Male | Female |
| Production | 1,984 (71.8%) | 781 (28.2%) |
| Transportation | 2,843 (89.4%) | 336 (10.6%) |
| Material Moving | 3,194 (70.5%) | 1,339 (29.5%) |
| Total (Category) | 8,021 (76.6%) | 2,456 (23.4%) |
| Total (Overall) | 45,876 (52.9%) | 40,838 (47.1%) |
Employment Industries by Sex in Rancho Cucamonga
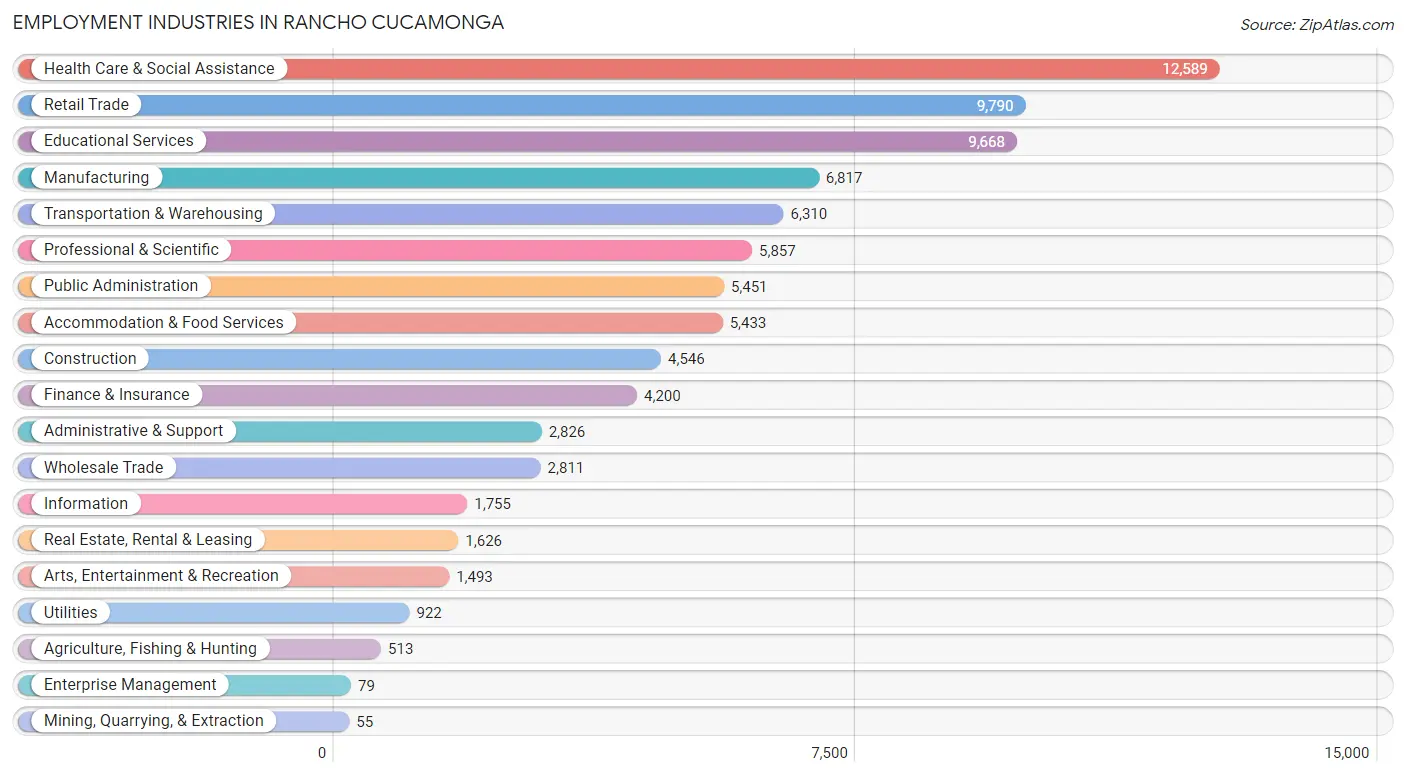
Employment Industries in Rancho Cucamonga
The major employment industries in Rancho Cucamonga include Health Care & Social Assistance (12,589 | 14.5%), Retail Trade (9,790 | 11.3%), Educational Services (9,668 | 11.2%), Manufacturing (6,817 | 7.9%), and Transportation & Warehousing (6,310 | 7.3%).
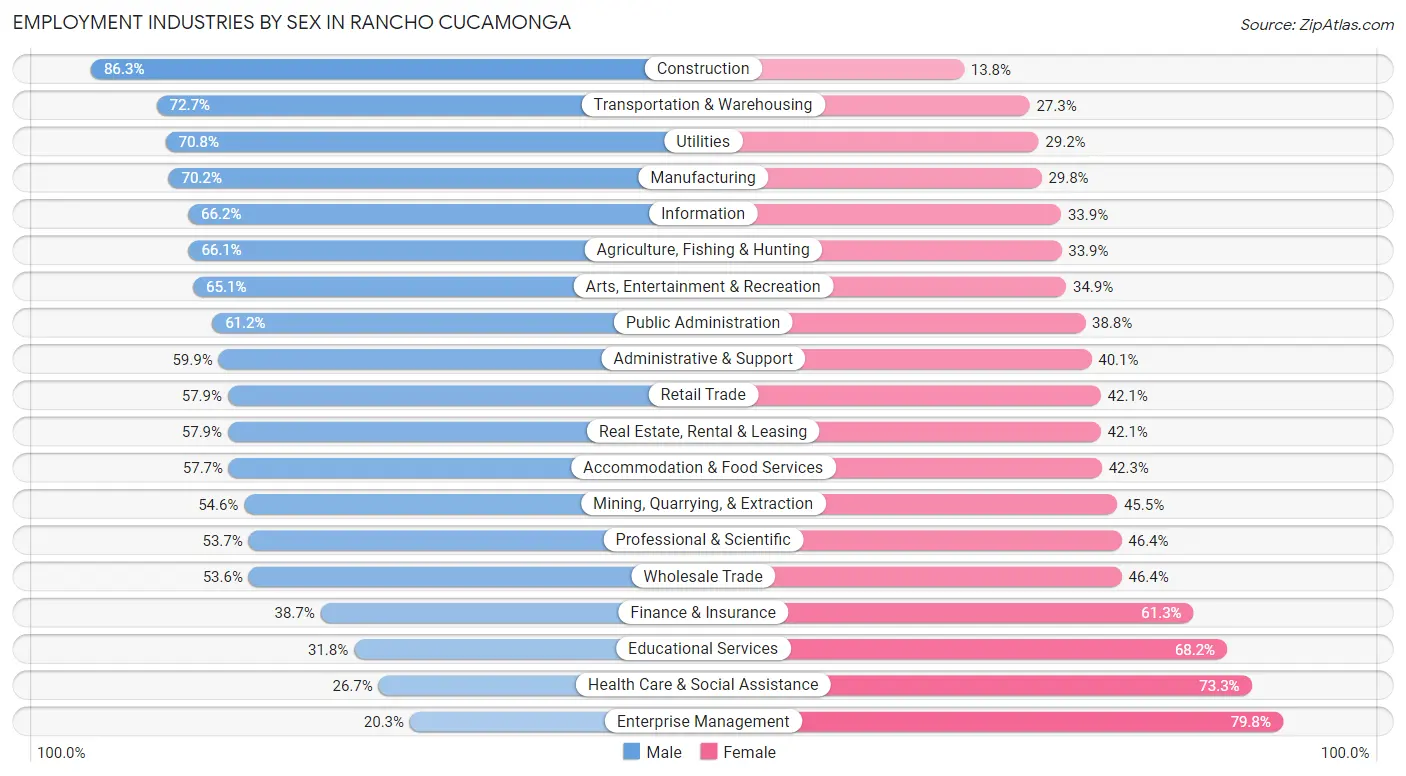
Employment Industries by Sex in Rancho Cucamonga
The Rancho Cucamonga industries that see more men than women are Construction (86.3%), Transportation & Warehousing (72.7%), and Utilities (70.8%), whereas the industries that tend to have a higher number of women are Enterprise Management (79.7%), Health Care & Social Assistance (73.3%), and Educational Services (68.2%).
| Industry | Male | Female |
| Agriculture, Fishing & Hunting | 339 (66.1%) | 174 (33.9%) |
| Mining, Quarrying, & Extraction | 30 (54.5%) | 25 (45.5%) |
| Construction | 3,921 (86.3%) | 625 (13.8%) |
| Manufacturing | 4,785 (70.2%) | 2,032 (29.8%) |
| Wholesale Trade | 1,507 (53.6%) | 1,304 (46.4%) |
| Retail Trade | 5,672 (57.9%) | 4,118 (42.1%) |
| Transportation & Warehousing | 4,585 (72.7%) | 1,725 (27.3%) |
| Utilities | 653 (70.8%) | 269 (29.2%) |
| Information | 1,161 (66.1%) | 594 (33.9%) |
| Finance & Insurance | 1,627 (38.7%) | 2,573 (61.3%) |
| Real Estate, Rental & Leasing | 942 (57.9%) | 684 (42.1%) |
| Professional & Scientific | 3,142 (53.6%) | 2,715 (46.4%) |
| Enterprise Management | 16 (20.3%) | 63 (79.7%) |
| Administrative & Support | 1,692 (59.9%) | 1,134 (40.1%) |
| Educational Services | 3,074 (31.8%) | 6,594 (68.2%) |
| Health Care & Social Assistance | 3,366 (26.7%) | 9,223 (73.3%) |
| Arts, Entertainment & Recreation | 972 (65.1%) | 521 (34.9%) |
| Accommodation & Food Services | 3,136 (57.7%) | 2,297 (42.3%) |
| Public Administration | 3,334 (61.2%) | 2,117 (38.8%) |
| Total | 45,876 (52.9%) | 40,838 (47.1%) |
Education in Rancho Cucamonga
School Enrollment in Rancho Cucamonga
The most common levels of schooling among the 47,102 students in Rancho Cucamonga are college / undergraduate (13,324 | 28.3%), high school (9,672 | 20.5%), and middle school (8,799 | 18.7%).
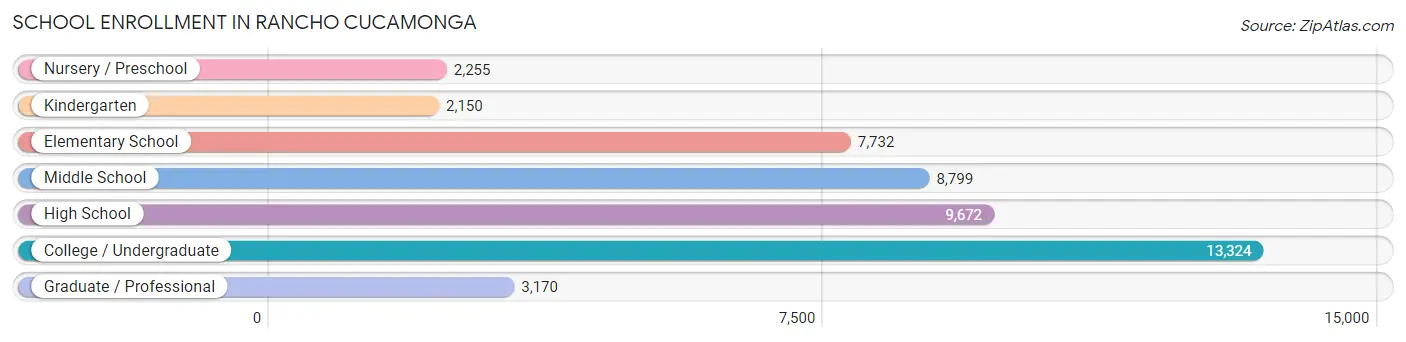
| School Level | # Students | % Students |
| Nursery / Preschool | 2,255 | 4.8% |
| Kindergarten | 2,150 | 4.6% |
| Elementary School | 7,732 | 16.4% |
| Middle School | 8,799 | 18.7% |
| High School | 9,672 | 20.5% |
| College / Undergraduate | 13,324 | 28.3% |
| Graduate / Professional | 3,170 | 6.7% |
| Total | 47,102 | 100.0% |
School Enrollment by Age by Funding Source in Rancho Cucamonga
Out of a total of 47,102 students who are enrolled in schools in Rancho Cucamonga, 7,489 (15.9%) attend a private institution, while the remaining 39,613 (84.1%) are enrolled in public schools. The age group of 3 to 4 year olds has the highest likelihood of being enrolled in private schools, with 927 (47.3% in the age bracket) enrolled. Conversely, the age group of 18 to 19 year olds has the lowest likelihood of being enrolled in a private school, with 3,425 (95.8% in the age bracket) attending a public institution.
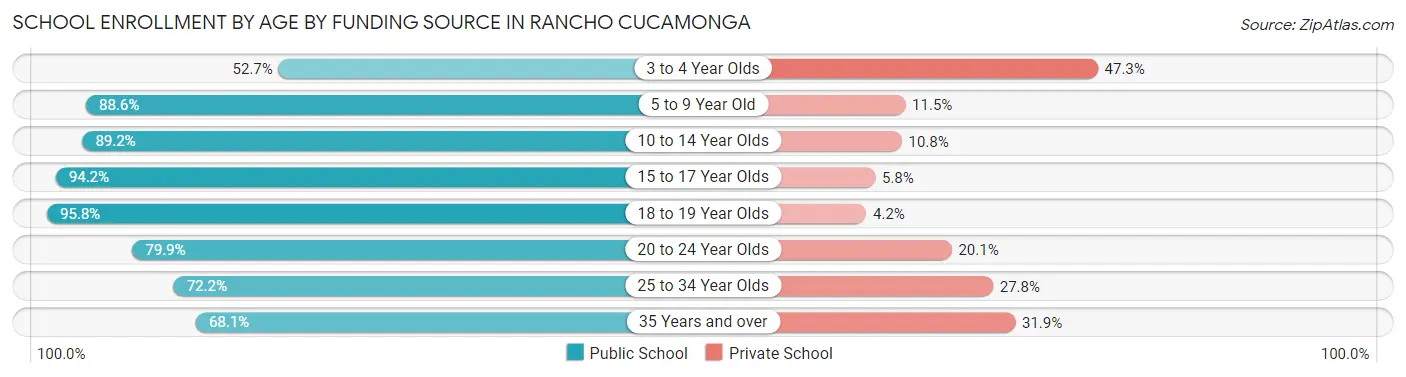
| Age Bracket | Public School | Private School |
| 3 to 4 Year Olds | 1,033 (52.7%) | 927 (47.3%) |
| 5 to 9 Year Old | 8,160 (88.5%) | 1,055 (11.5%) |
| 10 to 14 Year Olds | 10,242 (89.2%) | 1,238 (10.8%) |
| 15 to 17 Year Olds | 6,095 (94.2%) | 377 (5.8%) |
| 18 to 19 Year Olds | 3,425 (95.8%) | 149 (4.2%) |
| 20 to 24 Year Olds | 4,343 (79.9%) | 1,091 (20.1%) |
| 25 to 34 Year Olds | 3,897 (72.2%) | 1,499 (27.8%) |
| 35 Years and over | 2,431 (68.1%) | 1,140 (31.9%) |
| Total | 39,613 (84.1%) | 7,489 (15.9%) |
Educational Attainment by Field of Study in Rancho Cucamonga
Business (11,518 | 24.4%), science & technology (4,551 | 9.7%), social sciences (4,021 | 8.5%), bio, nature & agricultural (3,485 | 7.4%), and arts & humanities (3,485 | 7.4%) are the most common fields of study among 47,141 individuals in Rancho Cucamonga who have obtained a bachelor's degree or higher.
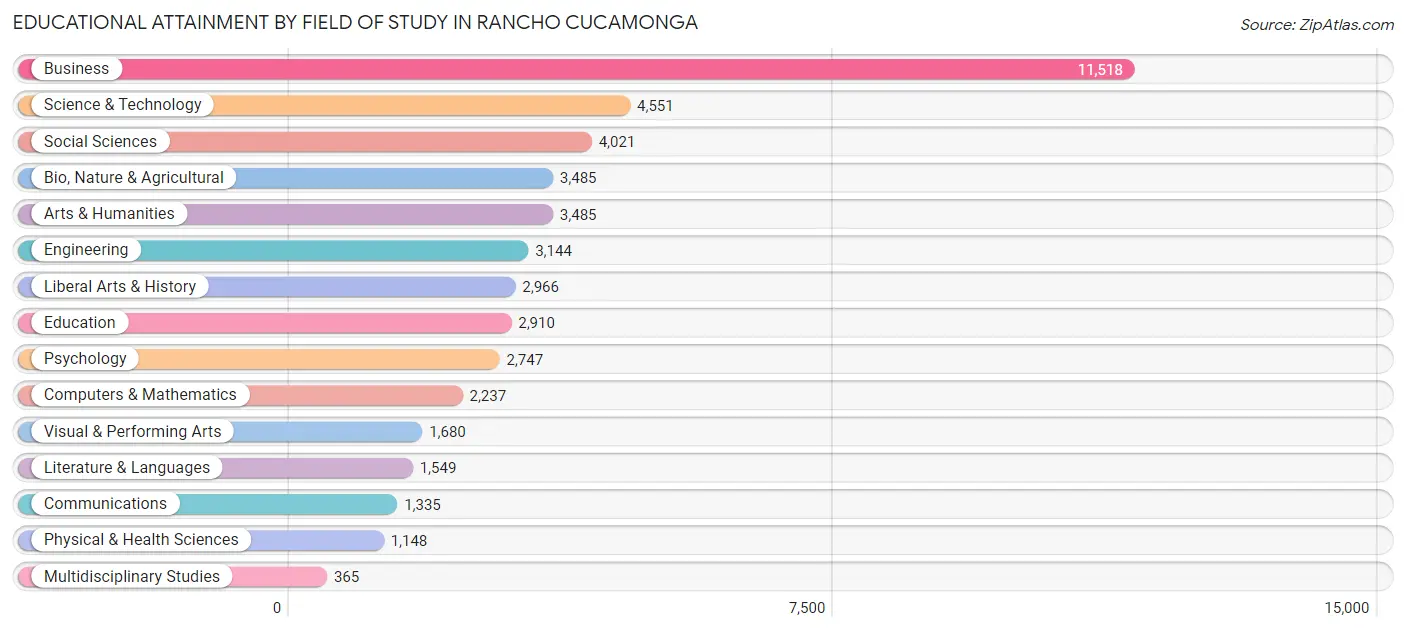
| Field of Study | # Graduates | % Graduates |
| Computers & Mathematics | 2,237 | 4.8% |
| Bio, Nature & Agricultural | 3,485 | 7.4% |
| Physical & Health Sciences | 1,148 | 2.4% |
| Psychology | 2,747 | 5.8% |
| Social Sciences | 4,021 | 8.5% |
| Engineering | 3,144 | 6.7% |
| Multidisciplinary Studies | 365 | 0.8% |
| Science & Technology | 4,551 | 9.7% |
| Business | 11,518 | 24.4% |
| Education | 2,910 | 6.2% |
| Literature & Languages | 1,549 | 3.3% |
| Liberal Arts & History | 2,966 | 6.3% |
| Visual & Performing Arts | 1,680 | 3.6% |
| Communications | 1,335 | 2.8% |
| Arts & Humanities | 3,485 | 7.4% |
| Total | 47,141 | 100.0% |
Transportation & Commute in Rancho Cucamonga
Vehicle Availability by Sex in Rancho Cucamonga
The most prevalent vehicle ownership categories in Rancho Cucamonga are males with 2 vehicles (18,273, accounting for 40.8%) and females with 2 vehicles (14,647, making up 46.4%).
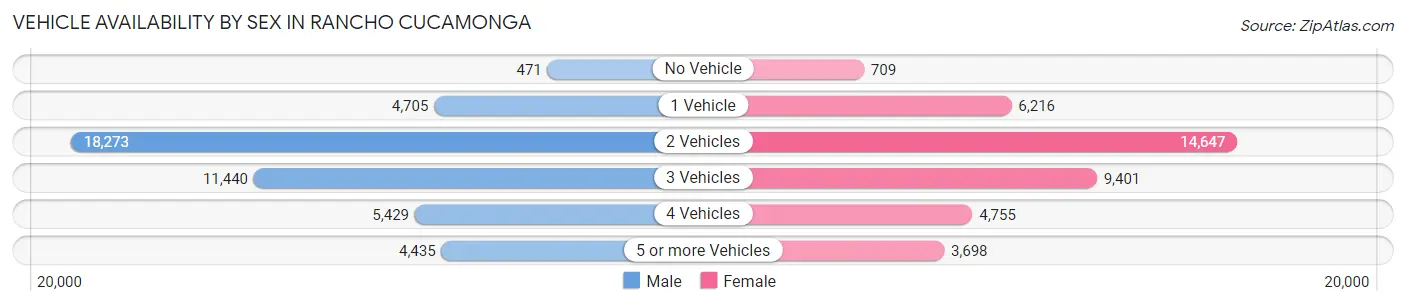
| Vehicles Available | Male | Female |
| No Vehicle | 471 (1.1%) | 709 (1.8%) |
| 1 Vehicle | 4,705 (10.5%) | 6,216 (15.8%) |
| 2 Vehicles | 18,273 (40.8%) | 14,647 (37.1%) |
| 3 Vehicles | 11,440 (25.6%) | 9,401 (23.8%) |
| 4 Vehicles | 5,429 (12.1%) | 4,755 (12.1%) |
| 5 or more Vehicles | 4,435 (9.9%) | 3,698 (9.4%) |
| Total | 44,753 (100.0%) | 39,426 (100.0%) |
Commute Time in Rancho Cucamonga
The most frequently occuring commute durations in Rancho Cucamonga are 30 to 34 minutes (11,255 commuters, 14.9%), 20 to 24 minutes (10,435 commuters, 13.8%), and 15 to 19 minutes (9,416 commuters, 12.5%).
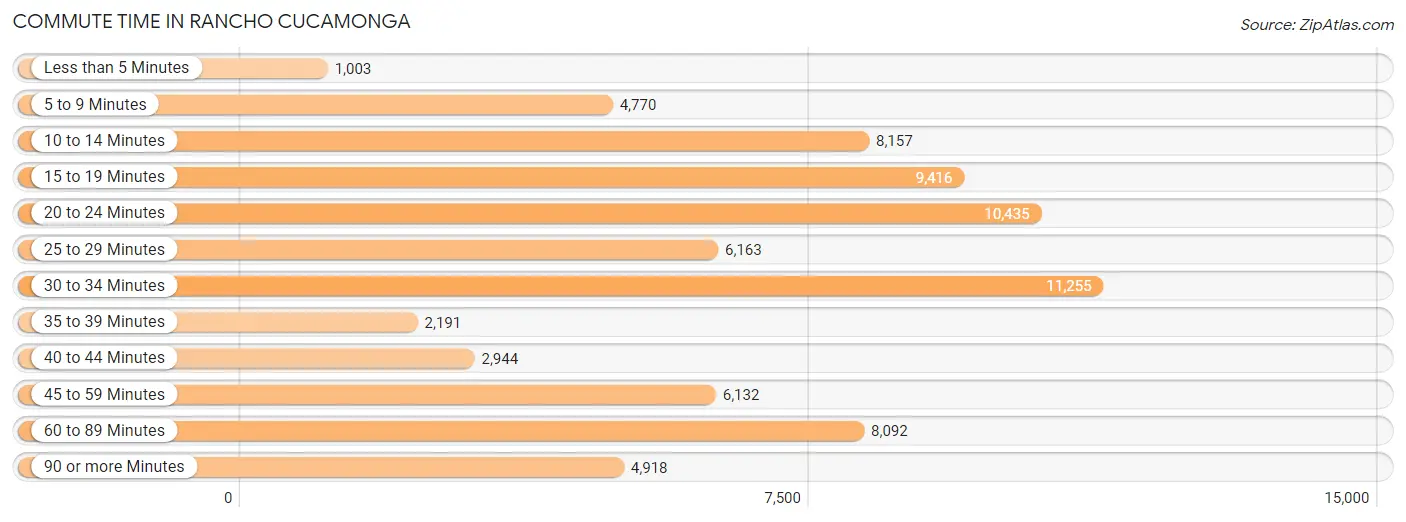
| Commute Time | # Commuters | % Commuters |
| Less than 5 Minutes | 1,003 | 1.3% |
| 5 to 9 Minutes | 4,770 | 6.3% |
| 10 to 14 Minutes | 8,157 | 10.8% |
| 15 to 19 Minutes | 9,416 | 12.5% |
| 20 to 24 Minutes | 10,435 | 13.8% |
| 25 to 29 Minutes | 6,163 | 8.2% |
| 30 to 34 Minutes | 11,255 | 14.9% |
| 35 to 39 Minutes | 2,191 | 2.9% |
| 40 to 44 Minutes | 2,944 | 3.9% |
| 45 to 59 Minutes | 6,132 | 8.1% |
| 60 to 89 Minutes | 8,092 | 10.7% |
| 90 or more Minutes | 4,918 | 6.5% |
Commute Time by Sex in Rancho Cucamonga
The most common commute times in Rancho Cucamonga are 20 to 24 minutes (5,888 commuters, 14.4%) for males and 30 to 34 minutes (5,518 commuters, 16.0%) for females.
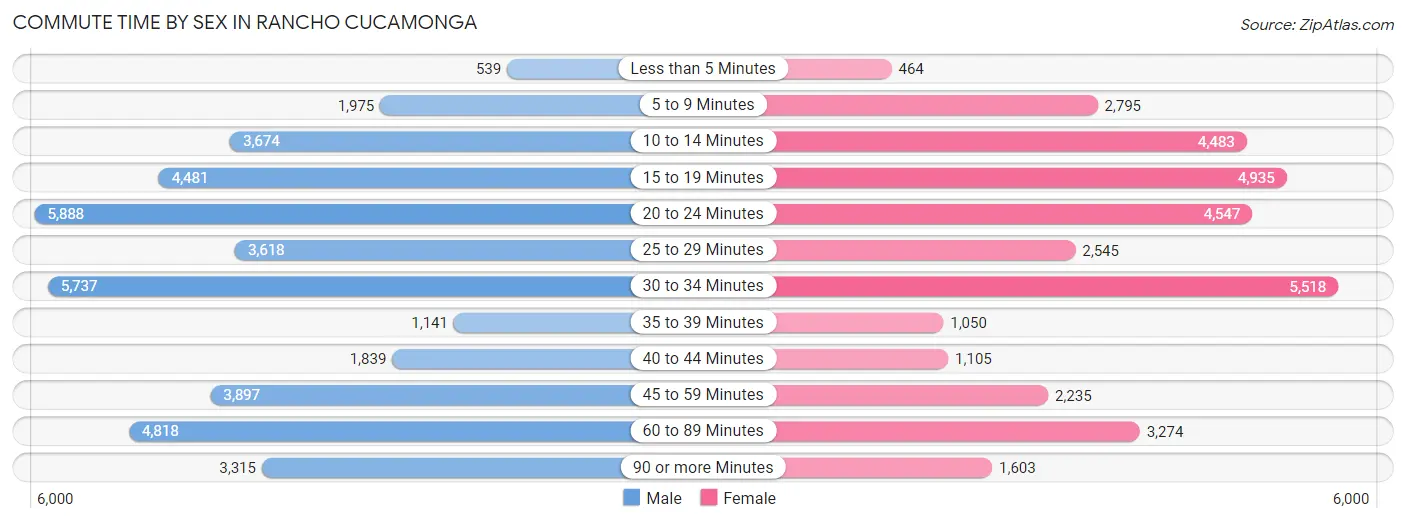
| Commute Time | Male | Female |
| Less than 5 Minutes | 539 (1.3%) | 464 (1.3%) |
| 5 to 9 Minutes | 1,975 (4.8%) | 2,795 (8.1%) |
| 10 to 14 Minutes | 3,674 (9.0%) | 4,483 (13.0%) |
| 15 to 19 Minutes | 4,481 (11.0%) | 4,935 (14.3%) |
| 20 to 24 Minutes | 5,888 (14.4%) | 4,547 (13.2%) |
| 25 to 29 Minutes | 3,618 (8.8%) | 2,545 (7.4%) |
| 30 to 34 Minutes | 5,737 (14.0%) | 5,518 (16.0%) |
| 35 to 39 Minutes | 1,141 (2.8%) | 1,050 (3.0%) |
| 40 to 44 Minutes | 1,839 (4.5%) | 1,105 (3.2%) |
| 45 to 59 Minutes | 3,897 (9.5%) | 2,235 (6.5%) |
| 60 to 89 Minutes | 4,818 (11.8%) | 3,274 (9.5%) |
| 90 or more Minutes | 3,315 (8.1%) | 1,603 (4.6%) |
Time of Departure to Work by Sex in Rancho Cucamonga
The most frequent times of departure to work in Rancho Cucamonga are 7:00 AM to 7:29 AM (5,031, 12.3%) for males and 7:00 AM to 7:29 AM (5,327, 15.4%) for females.
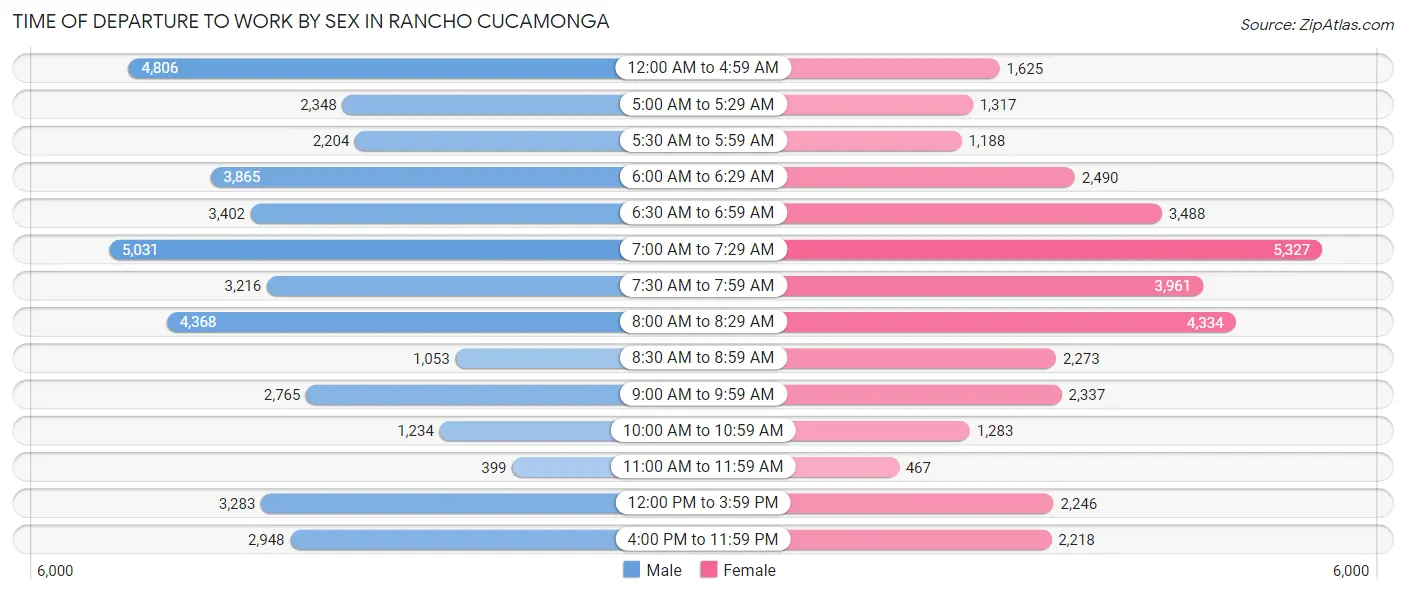
| Time of Departure | Male | Female |
| 12:00 AM to 4:59 AM | 4,806 (11.7%) | 1,625 (4.7%) |
| 5:00 AM to 5:29 AM | 2,348 (5.7%) | 1,317 (3.8%) |
| 5:30 AM to 5:59 AM | 2,204 (5.4%) | 1,188 (3.4%) |
| 6:00 AM to 6:29 AM | 3,865 (9.4%) | 2,490 (7.2%) |
| 6:30 AM to 6:59 AM | 3,402 (8.3%) | 3,488 (10.1%) |
| 7:00 AM to 7:29 AM | 5,031 (12.3%) | 5,327 (15.4%) |
| 7:30 AM to 7:59 AM | 3,216 (7.9%) | 3,961 (11.5%) |
| 8:00 AM to 8:29 AM | 4,368 (10.7%) | 4,334 (12.5%) |
| 8:30 AM to 8:59 AM | 1,053 (2.6%) | 2,273 (6.6%) |
| 9:00 AM to 9:59 AM | 2,765 (6.8%) | 2,337 (6.8%) |
| 10:00 AM to 10:59 AM | 1,234 (3.0%) | 1,283 (3.7%) |
| 11:00 AM to 11:59 AM | 399 (1.0%) | 467 (1.3%) |
| 12:00 PM to 3:59 PM | 3,283 (8.0%) | 2,246 (6.5%) |
| 4:00 PM to 11:59 PM | 2,948 (7.2%) | 2,218 (6.4%) |
| Total | 40,922 (100.0%) | 34,554 (100.0%) |
Housing Occupancy in Rancho Cucamonga
Occupancy by Ownership in Rancho Cucamonga
Of the total 57,553 dwellings in Rancho Cucamonga, owner-occupied units account for 36,412 (63.3%), while renter-occupied units make up 21,141 (36.7%).
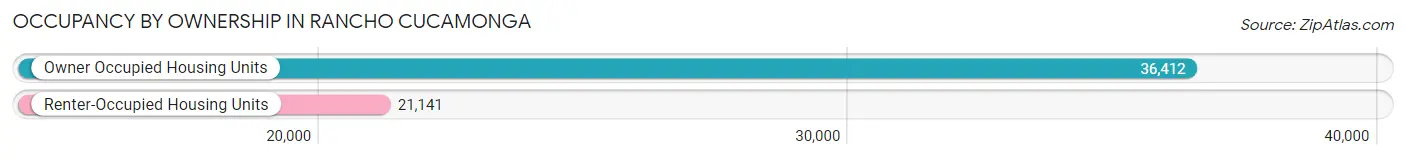
| Occupancy | # Housing Units | % Housing Units |
| Owner Occupied Housing Units | 36,412 | 63.3% |
| Renter-Occupied Housing Units | 21,141 | 36.7% |
| Total Occupied Housing Units | 57,553 | 100.0% |
Occupancy by Household Size in Rancho Cucamonga
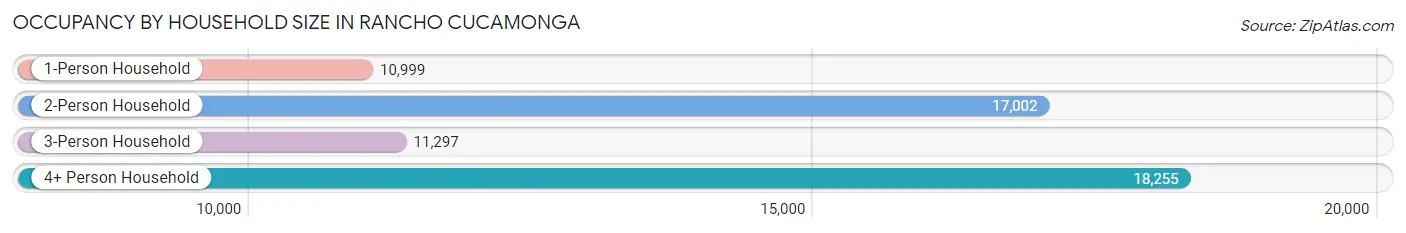
| Household Size | # Housing Units | % Housing Units |
| 1-Person Household | 10,999 | 19.1% |
| 2-Person Household | 17,002 | 29.5% |
| 3-Person Household | 11,297 | 19.6% |
| 4+ Person Household | 18,255 | 31.7% |
| Total Housing Units | 57,553 | 100.0% |
Occupancy by Ownership by Household Size in Rancho Cucamonga
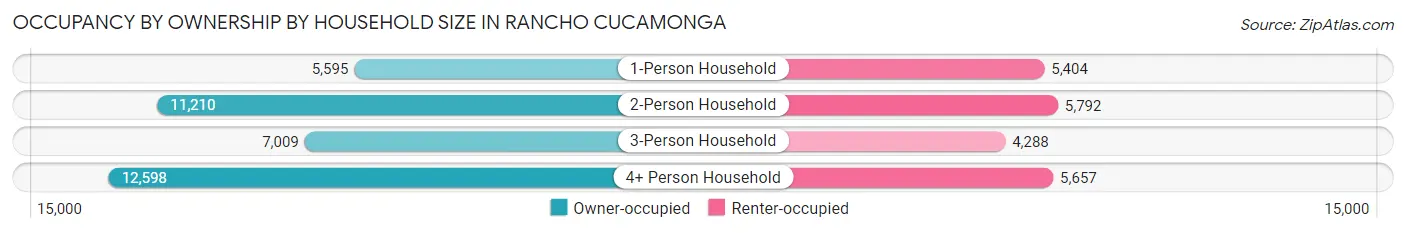
| Household Size | Owner-occupied | Renter-occupied |
| 1-Person Household | 5,595 (50.9%) | 5,404 (49.1%) |
| 2-Person Household | 11,210 (65.9%) | 5,792 (34.1%) |
| 3-Person Household | 7,009 (62.0%) | 4,288 (38.0%) |
| 4+ Person Household | 12,598 (69.0%) | 5,657 (31.0%) |
| Total Housing Units | 36,412 (63.3%) | 21,141 (36.7%) |
Occupancy by Educational Attainment in Rancho Cucamonga
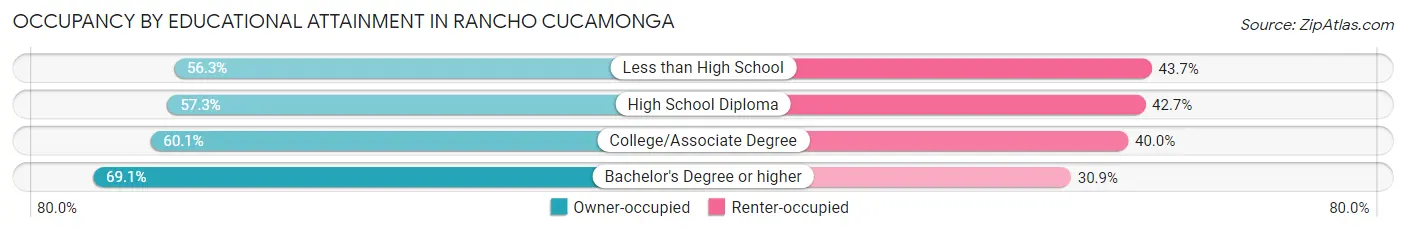
| Household Size | Owner-occupied | Renter-occupied |
| Less than High School | 1,904 (56.3%) | 1,477 (43.7%) |
| High School Diploma | 5,117 (57.3%) | 3,807 (42.7%) |
| College/Associate Degree | 12,504 (60.1%) | 8,317 (40.0%) |
| Bachelor's Degree or higher | 16,887 (69.1%) | 7,540 (30.9%) |
Occupancy by Age of Householder in Rancho Cucamonga
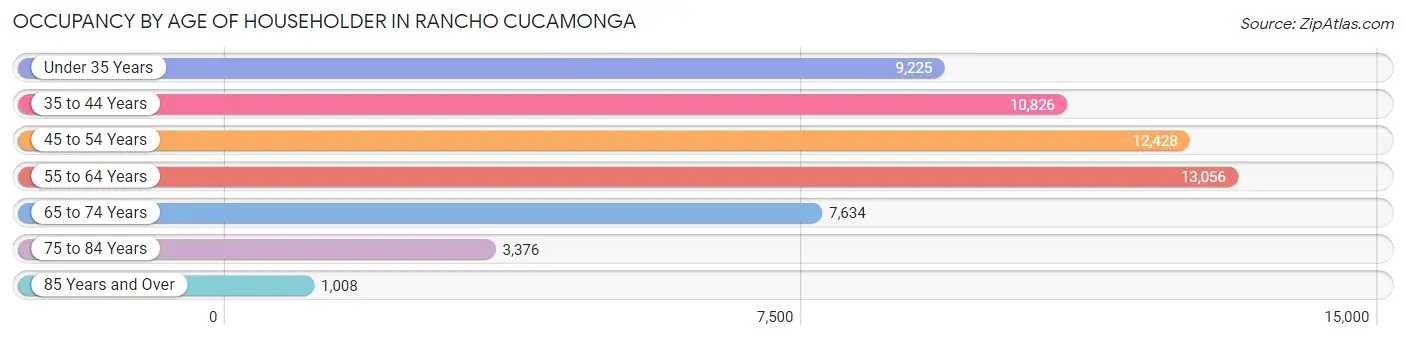
| Age Bracket | # Households | % Households |
| Under 35 Years | 9,225 | 16.0% |
| 35 to 44 Years | 10,826 | 18.8% |
| 45 to 54 Years | 12,428 | 21.6% |
| 55 to 64 Years | 13,056 | 22.7% |
| 65 to 74 Years | 7,634 | 13.3% |
| 75 to 84 Years | 3,376 | 5.9% |
| 85 Years and Over | 1,008 | 1.8% |
| Total | 57,553 | 100.0% |
Housing Finances in Rancho Cucamonga
Median Income by Occupancy in Rancho Cucamonga
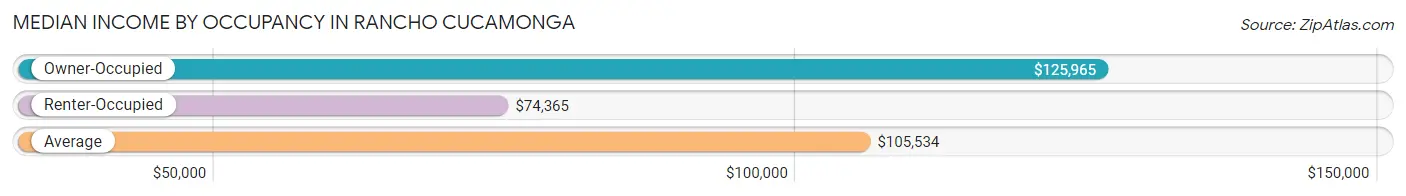
| Occupancy Type | # Households | Median Income |
| Owner-Occupied | 36,412 (63.3%) | $125,965 |
| Renter-Occupied | 21,141 (36.7%) | $74,365 |
| Average | 57,553 (100.0%) | $105,534 |
Occupancy by Householder Income Bracket in Rancho Cucamonga
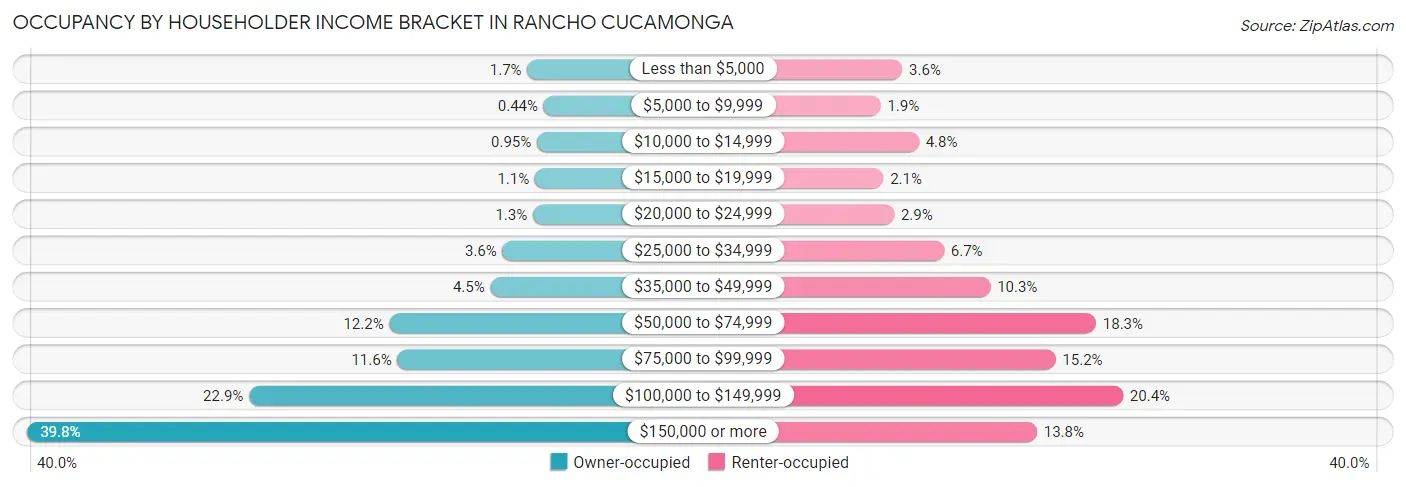
| Income Bracket | Owner-occupied | Renter-occupied |
| Less than $5,000 | 614 (1.7%) | 751 (3.5%) |
| $5,000 to $9,999 | 162 (0.4%) | 402 (1.9%) |
| $10,000 to $14,999 | 345 (0.9%) | 1,016 (4.8%) |
| $15,000 to $19,999 | 405 (1.1%) | 447 (2.1%) |
| $20,000 to $24,999 | 458 (1.3%) | 619 (2.9%) |
| $25,000 to $34,999 | 1,304 (3.6%) | 1,422 (6.7%) |
| $35,000 to $49,999 | 1,637 (4.5%) | 2,169 (10.3%) |
| $50,000 to $74,999 | 4,441 (12.2%) | 3,870 (18.3%) |
| $75,000 to $99,999 | 4,220 (11.6%) | 3,219 (15.2%) |
| $100,000 to $149,999 | 8,334 (22.9%) | 4,307 (20.4%) |
| $150,000 or more | 14,492 (39.8%) | 2,919 (13.8%) |
| Total | 36,412 (100.0%) | 21,141 (100.0%) |
Monthly Housing Cost Tiers in Rancho Cucamonga
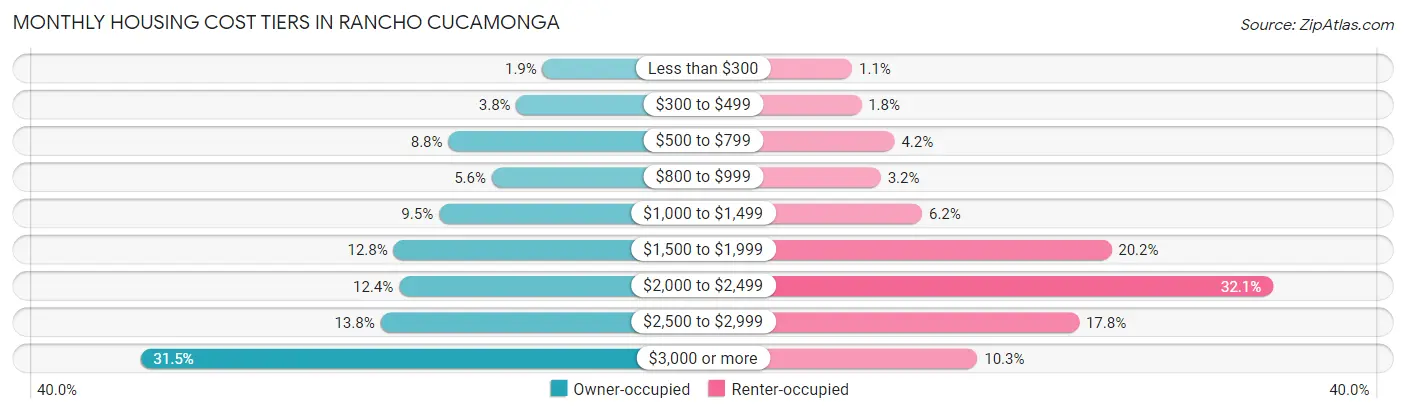
| Monthly Cost | Owner-occupied | Renter-occupied |
| Less than $300 | 675 (1.8%) | 228 (1.1%) |
| $300 to $499 | 1,377 (3.8%) | 371 (1.8%) |
| $500 to $799 | 3,201 (8.8%) | 888 (4.2%) |
| $800 to $999 | 2,034 (5.6%) | 674 (3.2%) |
| $1,000 to $1,499 | 3,451 (9.5%) | 1,317 (6.2%) |
| $1,500 to $1,999 | 4,671 (12.8%) | 4,265 (20.2%) |
| $2,000 to $2,499 | 4,523 (12.4%) | 6,782 (32.1%) |
| $2,500 to $2,999 | 5,022 (13.8%) | 3,762 (17.8%) |
| $3,000 or more | 11,458 (31.5%) | 2,178 (10.3%) |
| Total | 36,412 (100.0%) | 21,141 (100.0%) |
Physical Housing Characteristics in Rancho Cucamonga
Housing Structures in Rancho Cucamonga
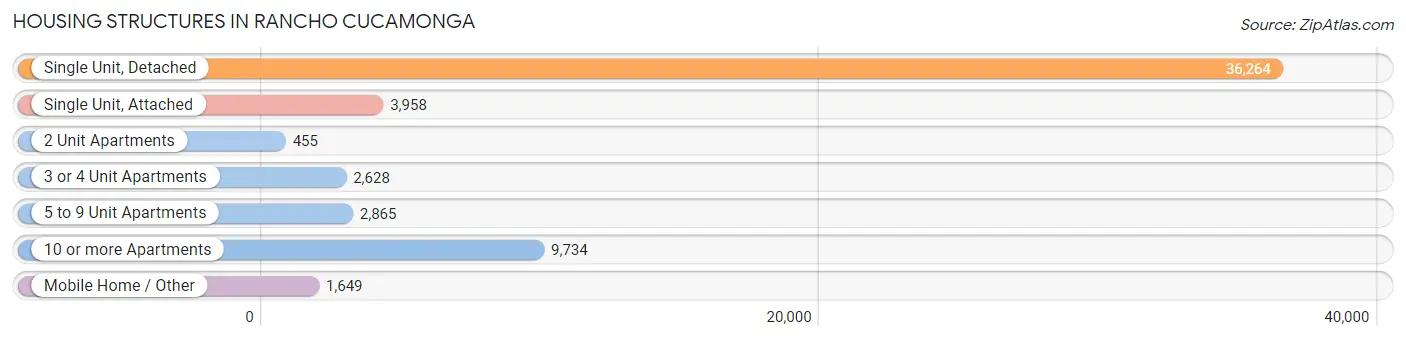
| Structure Type | # Housing Units | % Housing Units |
| Single Unit, Detached | 36,264 | 63.0% |
| Single Unit, Attached | 3,958 | 6.9% |
| 2 Unit Apartments | 455 | 0.8% |
| 3 or 4 Unit Apartments | 2,628 | 4.6% |
| 5 to 9 Unit Apartments | 2,865 | 5.0% |
| 10 or more Apartments | 9,734 | 16.9% |
| Mobile Home / Other | 1,649 | 2.9% |
| Total | 57,553 | 100.0% |
Housing Structures by Occupancy in Rancho Cucamonga
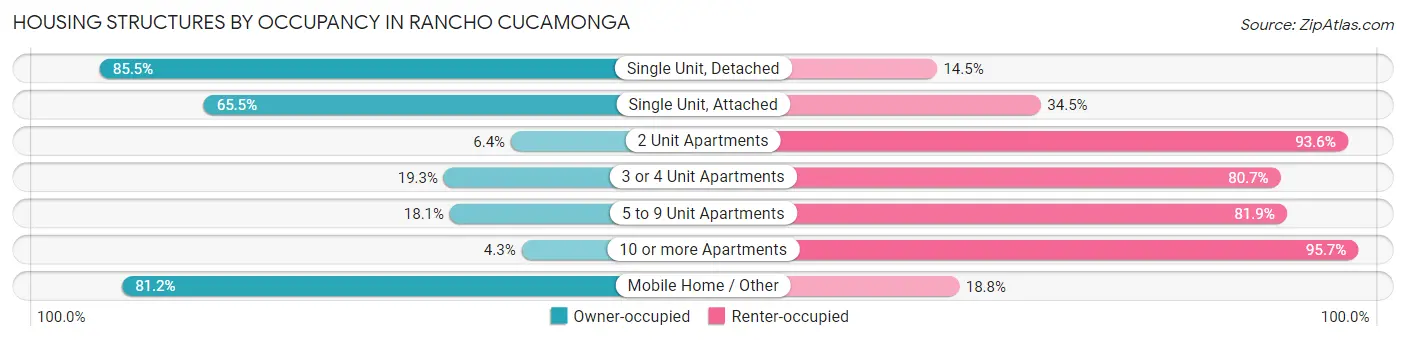
| Structure Type | Owner-occupied | Renter-occupied |
| Single Unit, Detached | 31,005 (85.5%) | 5,259 (14.5%) |
| Single Unit, Attached | 2,592 (65.5%) | 1,366 (34.5%) |
| 2 Unit Apartments | 29 (6.4%) | 426 (93.6%) |
| 3 or 4 Unit Apartments | 507 (19.3%) | 2,121 (80.7%) |
| 5 to 9 Unit Apartments | 519 (18.1%) | 2,346 (81.9%) |
| 10 or more Apartments | 421 (4.3%) | 9,313 (95.7%) |
| Mobile Home / Other | 1,339 (81.2%) | 310 (18.8%) |
| Total | 36,412 (63.3%) | 21,141 (36.7%) |
Housing Structures by Number of Rooms in Rancho Cucamonga
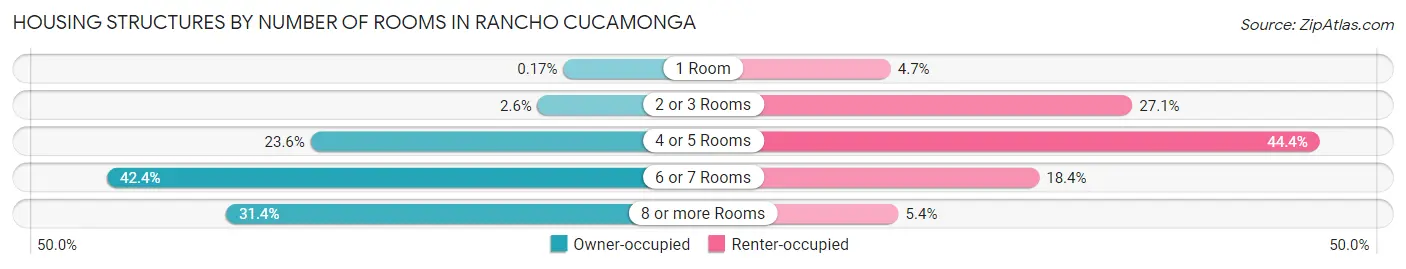
| Number of Rooms | Owner-occupied | Renter-occupied |
| 1 Room | 63 (0.2%) | 996 (4.7%) |
| 2 or 3 Rooms | 930 (2.5%) | 5,719 (27.1%) |
| 4 or 5 Rooms | 8,576 (23.5%) | 9,379 (44.4%) |
| 6 or 7 Rooms | 15,425 (42.4%) | 3,899 (18.4%) |
| 8 or more Rooms | 11,418 (31.4%) | 1,148 (5.4%) |
| Total | 36,412 (100.0%) | 21,141 (100.0%) |
Housing Structure by Heating Type in Rancho Cucamonga
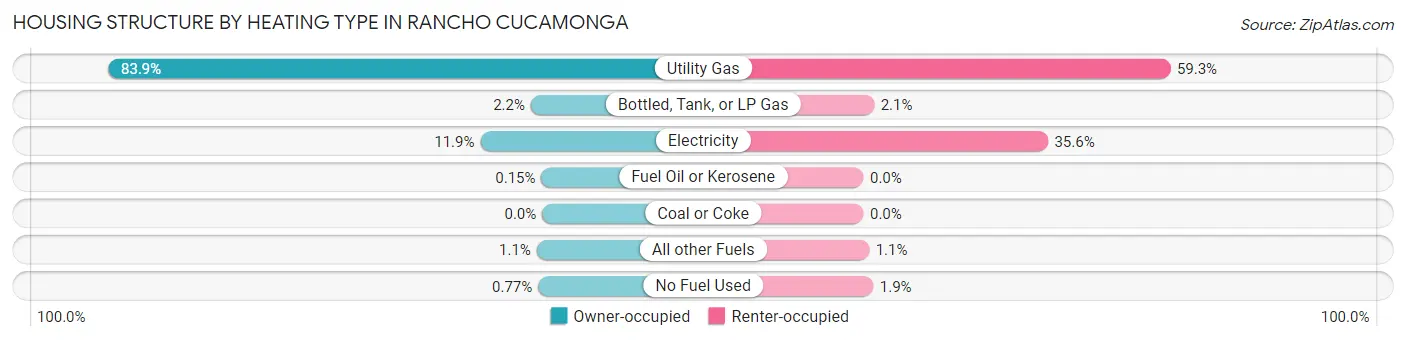
| Heating Type | Owner-occupied | Renter-occupied |
| Utility Gas | 30,552 (83.9%) | 12,537 (59.3%) |
| Bottled, Tank, or LP Gas | 796 (2.2%) | 435 (2.1%) |
| Electricity | 4,346 (11.9%) | 7,535 (35.6%) |
| Fuel Oil or Kerosene | 56 (0.2%) | 0 (0.0%) |
| Coal or Coke | 0 (0.0%) | 0 (0.0%) |
| All other Fuels | 382 (1.1%) | 233 (1.1%) |
| No Fuel Used | 280 (0.8%) | 401 (1.9%) |
| Total | 36,412 (100.0%) | 21,141 (100.0%) |
Household Vehicle Usage in Rancho Cucamonga
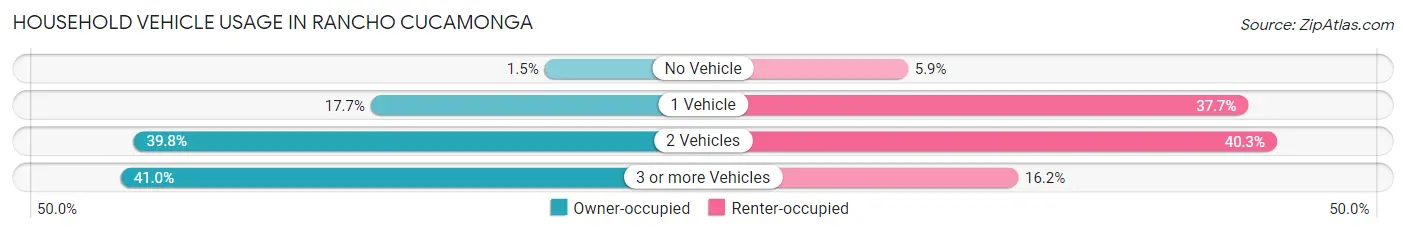
| Vehicles per Household | Owner-occupied | Renter-occupied |
| No Vehicle | 536 (1.5%) | 1,242 (5.9%) |
| 1 Vehicle | 6,439 (17.7%) | 7,960 (37.7%) |
| 2 Vehicles | 14,502 (39.8%) | 8,522 (40.3%) |
| 3 or more Vehicles | 14,935 (41.0%) | 3,417 (16.2%) |
| Total | 36,412 (100.0%) | 21,141 (100.0%) |
Real Estate & Mortgages in Rancho Cucamonga
Real Estate and Mortgage Overview in Rancho Cucamonga
| Characteristic | Without Mortgage | With Mortgage |
| Housing Units | 9,394 | 27,018 |
| Median Property Value | $618,500 | $668,600 |
| Median Household Income | $86,277 | $12,045 |
| Monthly Housing Costs | $753 | $11,424 |
| Real Estate Taxes | $3,777 | $349 |
Property Value by Mortgage Status in Rancho Cucamonga
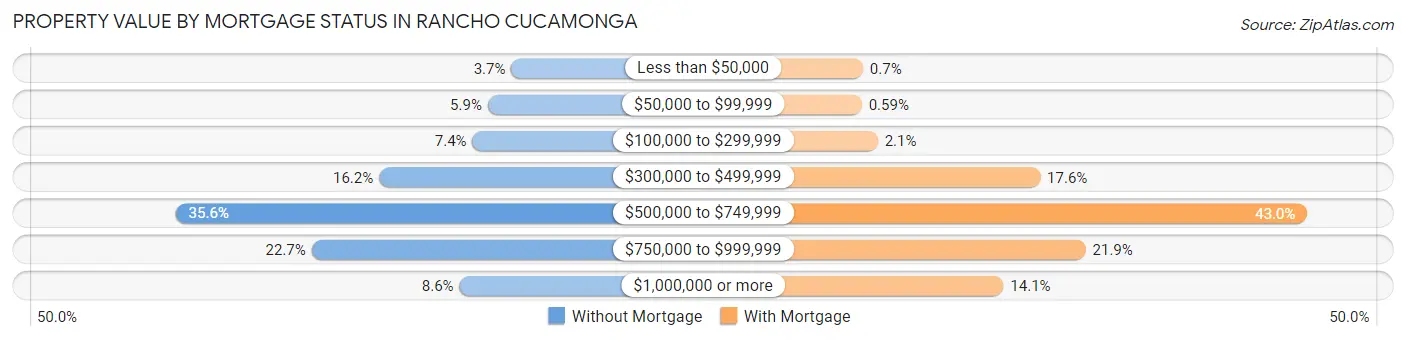
| Property Value | Without Mortgage | With Mortgage |
| Less than $50,000 | 343 (3.6%) | 190 (0.7%) |
| $50,000 to $99,999 | 553 (5.9%) | 160 (0.6%) |
| $100,000 to $299,999 | 690 (7.3%) | 571 (2.1%) |
| $300,000 to $499,999 | 1,526 (16.2%) | 4,749 (17.6%) |
| $500,000 to $749,999 | 3,345 (35.6%) | 11,623 (43.0%) |
| $750,000 to $999,999 | 2,130 (22.7%) | 5,920 (21.9%) |
| $1,000,000 or more | 807 (8.6%) | 3,805 (14.1%) |
| Total | 9,394 (100.0%) | 27,018 (100.0%) |
Household Income by Mortgage Status in Rancho Cucamonga
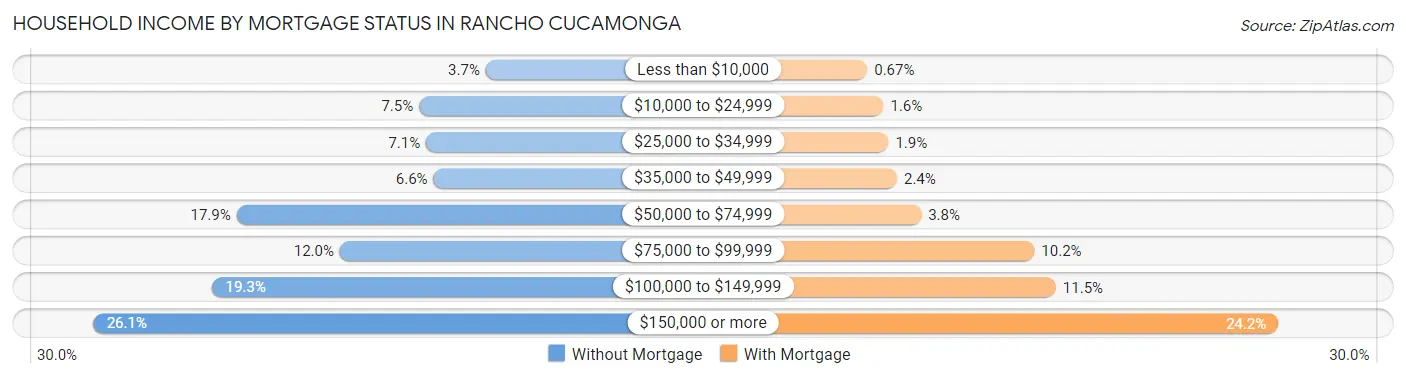
| Household Income | Without Mortgage | With Mortgage |
| Less than $10,000 | 343 (3.6%) | 181 (0.7%) |
| $10,000 to $24,999 | 701 (7.5%) | 433 (1.6%) |
| $25,000 to $34,999 | 663 (7.1%) | 507 (1.9%) |
| $35,000 to $49,999 | 624 (6.6%) | 641 (2.4%) |
| $50,000 to $74,999 | 1,681 (17.9%) | 1,013 (3.7%) |
| $75,000 to $99,999 | 1,126 (12.0%) | 2,760 (10.2%) |
| $100,000 to $149,999 | 1,809 (19.3%) | 3,094 (11.5%) |
| $150,000 or more | 2,447 (26.1%) | 6,525 (24.1%) |
| Total | 9,394 (100.0%) | 27,018 (100.0%) |
Property Value to Household Income Ratio in Rancho Cucamonga
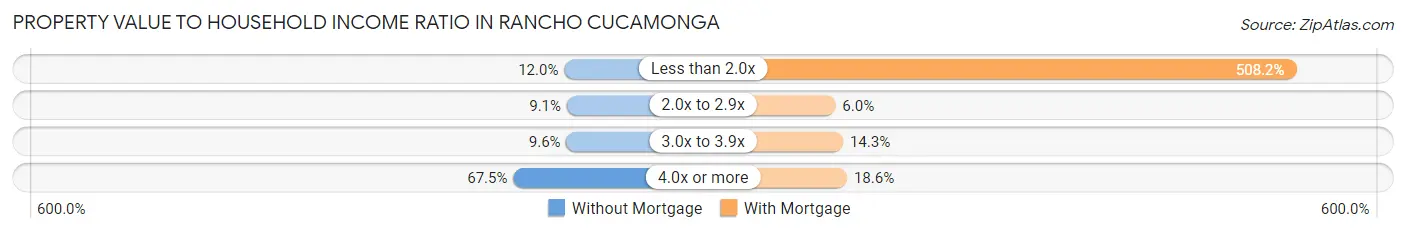
| Value-to-Income Ratio | Without Mortgage | With Mortgage |
| Less than 2.0x | 1,124 (12.0%) | 137,313 (508.2%) |
| 2.0x to 2.9x | 855 (9.1%) | 1,617 (6.0%) |
| 3.0x to 3.9x | 903 (9.6%) | 3,849 (14.2%) |
| 4.0x or more | 6,338 (67.5%) | 5,021 (18.6%) |
| Total | 9,394 (100.0%) | 27,018 (100.0%) |
Real Estate Taxes by Mortgage Status in Rancho Cucamonga
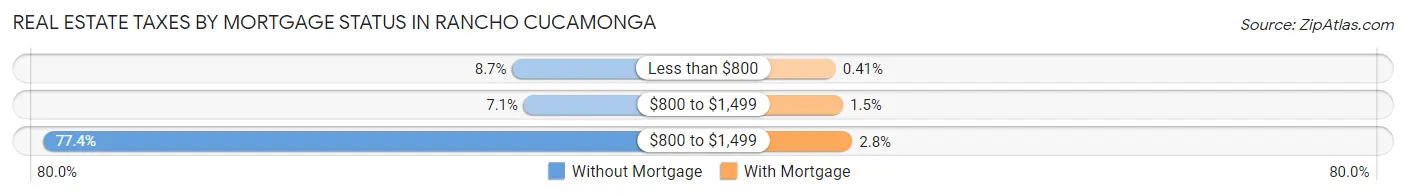
| Property Taxes | Without Mortgage | With Mortgage |
| Less than $800 | 820 (8.7%) | 110 (0.4%) |
| $800 to $1,499 | 662 (7.0%) | 397 (1.5%) |
| $800 to $1,499 | 7,266 (77.3%) | 762 (2.8%) |
| Total | 9,394 (100.0%) | 27,018 (100.0%) |
Health & Disability in Rancho Cucamonga
Health Insurance Coverage by Age in Rancho Cucamonga
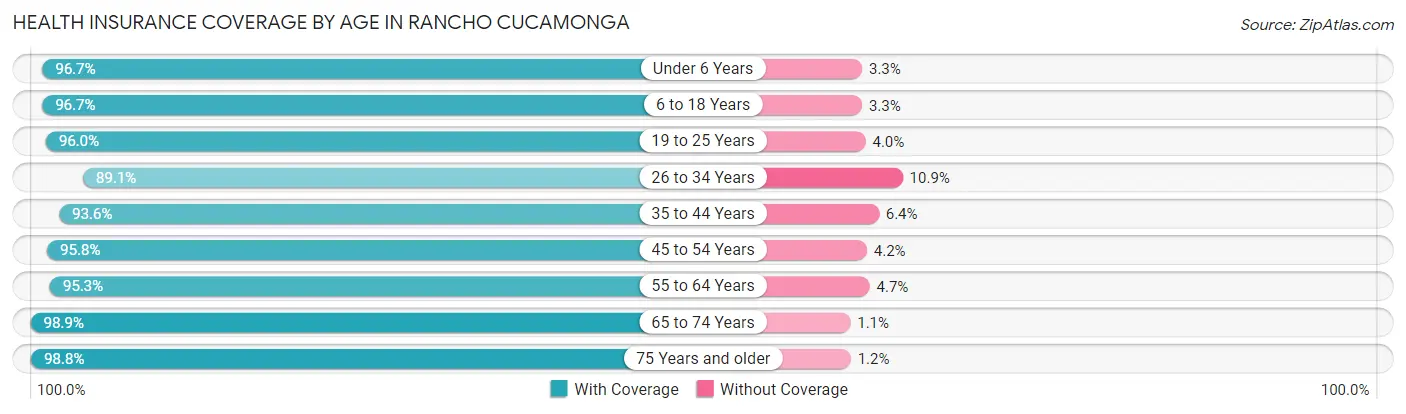
| Age Bracket | With Coverage | Without Coverage |
| Under 6 Years | 12,940 (96.7%) | 443 (3.3%) |
| 6 to 18 Years | 27,567 (96.7%) | 938 (3.3%) |
| 19 to 25 Years | 13,927 (96.0%) | 575 (4.0%) |
| 26 to 34 Years | 21,655 (89.1%) | 2,643 (10.9%) |
| 35 to 44 Years | 20,021 (93.6%) | 1,375 (6.4%) |
| 45 to 54 Years | 23,088 (95.8%) | 1,014 (4.2%) |
| 55 to 64 Years | 21,733 (95.3%) | 1,077 (4.7%) |
| 65 to 74 Years | 14,169 (98.9%) | 160 (1.1%) |
| 75 Years and older | 8,559 (98.8%) | 104 (1.2%) |
| Total | 163,659 (95.2%) | 8,329 (4.8%) |
Health Insurance Coverage by Citizenship Status in Rancho Cucamonga
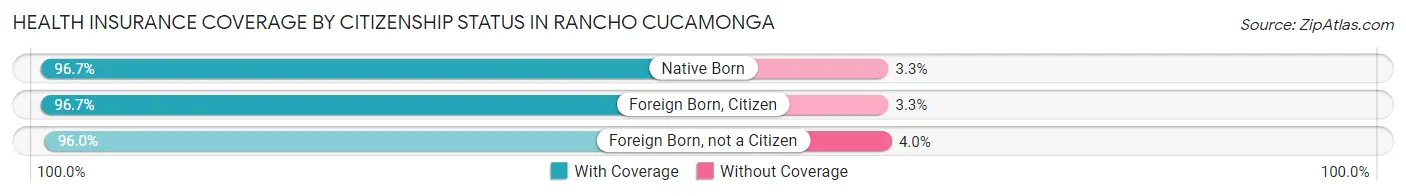
| Citizenship Status | With Coverage | Without Coverage |
| Native Born | 12,940 (96.7%) | 443 (3.3%) |
| Foreign Born, Citizen | 27,567 (96.7%) | 938 (3.3%) |
| Foreign Born, not a Citizen | 13,927 (96.0%) | 575 (4.0%) |
Health Insurance Coverage by Household Income in Rancho Cucamonga
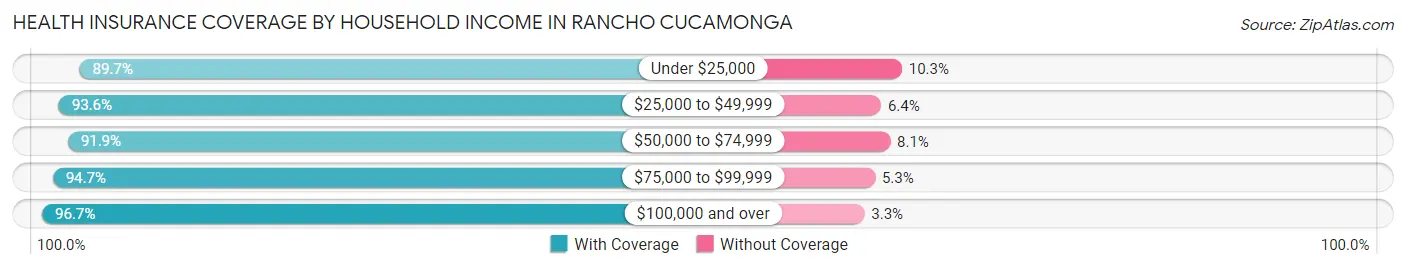
| Household Income | With Coverage | Without Coverage |
| Under $25,000 | 8,884 (89.7%) | 1,020 (10.3%) |
| $25,000 to $49,999 | 15,352 (93.6%) | 1,051 (6.4%) |
| $50,000 to $74,999 | 19,174 (91.9%) | 1,692 (8.1%) |
| $75,000 to $99,999 | 20,548 (94.7%) | 1,143 (5.3%) |
| $100,000 and over | 99,388 (96.7%) | 3,377 (3.3%) |
Public vs Private Health Insurance Coverage by Age in Rancho Cucamonga
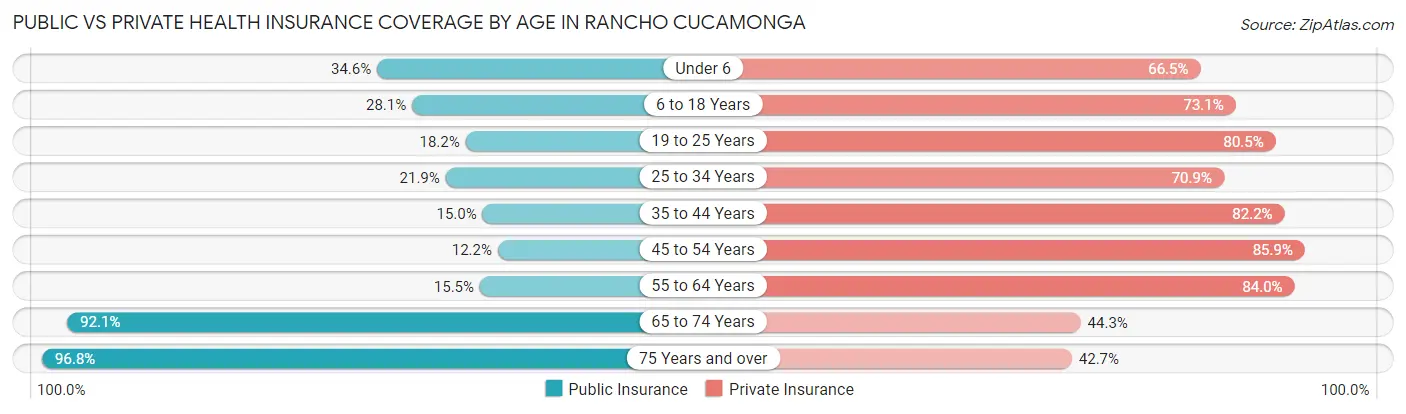
| Age Bracket | Public Insurance | Private Insurance |
| Under 6 | 4,628 (34.6%) | 8,904 (66.5%) |
| 6 to 18 Years | 8,008 (28.1%) | 20,832 (73.1%) |
| 19 to 25 Years | 2,634 (18.2%) | 11,675 (80.5%) |
| 25 to 34 Years | 5,310 (21.8%) | 17,226 (70.9%) |
| 35 to 44 Years | 3,210 (15.0%) | 17,577 (82.2%) |
| 45 to 54 Years | 2,930 (12.2%) | 20,708 (85.9%) |
| 55 to 64 Years | 3,535 (15.5%) | 19,163 (84.0%) |
| 65 to 74 Years | 13,196 (92.1%) | 6,354 (44.3%) |
| 75 Years and over | 8,384 (96.8%) | 3,699 (42.7%) |
| Total | 51,835 (30.1%) | 126,138 (73.3%) |
Disability Status by Sex by Age in Rancho Cucamonga
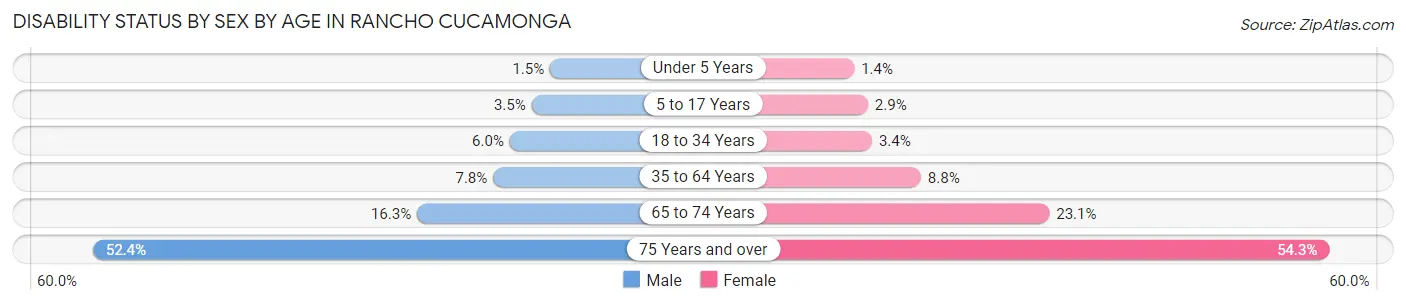
| Age Bracket | Male | Female |
| Under 5 Years | 92 (1.5%) | 73 (1.4%) |
| 5 to 17 Years | 519 (3.5%) | 391 (2.9%) |
| 18 to 34 Years | 1,233 (6.0%) | 688 (3.4%) |
| 35 to 64 Years | 2,559 (7.8%) | 3,136 (8.8%) |
| 65 to 74 Years | 1,033 (16.3%) | 1,847 (23.1%) |
| 75 Years and over | 2,041 (52.4%) | 2,588 (54.3%) |
Disability Class by Sex by Age in Rancho Cucamonga
Disability Class: Hearing Difficulty
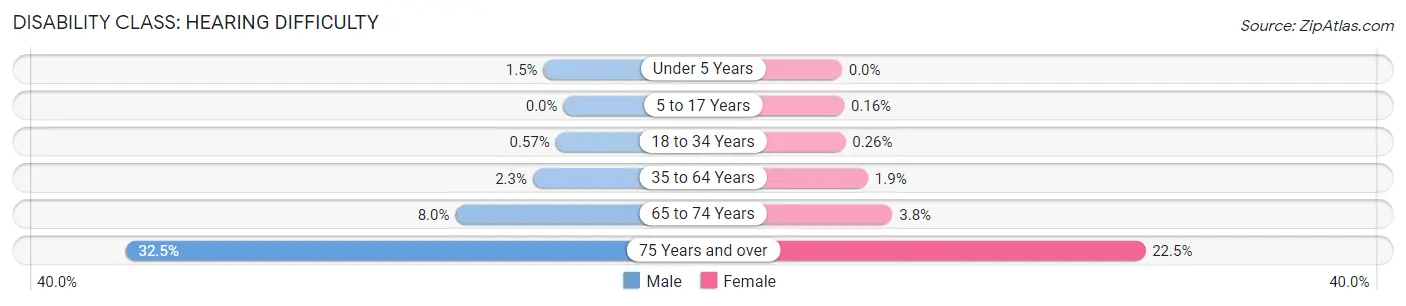
| Age Bracket | Male | Female |
| Under 5 Years | 92 (1.5%) | 0 (0.0%) |
| 5 to 17 Years | 0 (0.0%) | 21 (0.2%) |
| 18 to 34 Years | 117 (0.6%) | 53 (0.3%) |
| 35 to 64 Years | 742 (2.3%) | 691 (1.9%) |
| 65 to 74 Years | 508 (8.0%) | 300 (3.7%) |
| 75 Years and over | 1,266 (32.5%) | 1,074 (22.5%) |
Disability Class: Vision Difficulty
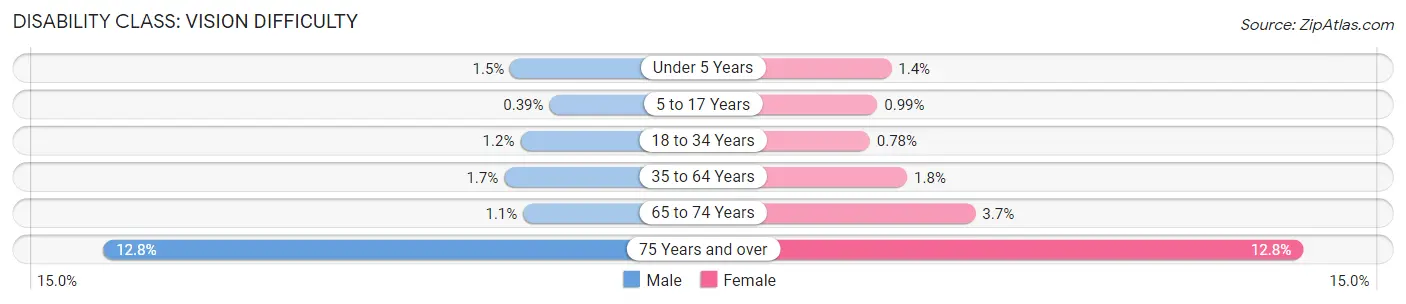
| Age Bracket | Male | Female |
| Under 5 Years | 92 (1.5%) | 73 (1.4%) |
| 5 to 17 Years | 57 (0.4%) | 133 (1.0%) |
| 18 to 34 Years | 247 (1.2%) | 159 (0.8%) |
| 35 to 64 Years | 541 (1.7%) | 647 (1.8%) |
| 65 to 74 Years | 71 (1.1%) | 297 (3.7%) |
| 75 Years and over | 499 (12.8%) | 612 (12.8%) |
Disability Class: Cognitive Difficulty
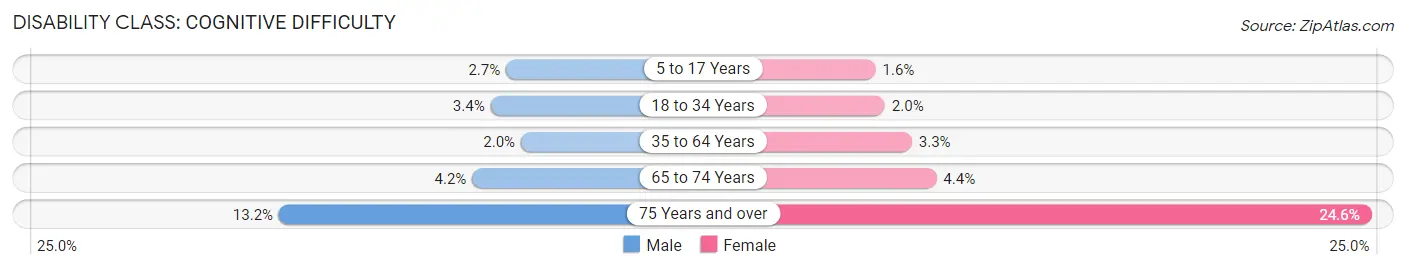
| Age Bracket | Male | Female |
| 5 to 17 Years | 390 (2.7%) | 211 (1.6%) |
| 18 to 34 Years | 698 (3.4%) | 408 (2.0%) |
| 35 to 64 Years | 645 (2.0%) | 1,158 (3.3%) |
| 65 to 74 Years | 268 (4.2%) | 351 (4.4%) |
| 75 Years and over | 514 (13.2%) | 1,172 (24.6%) |
Disability Class: Ambulatory Difficulty
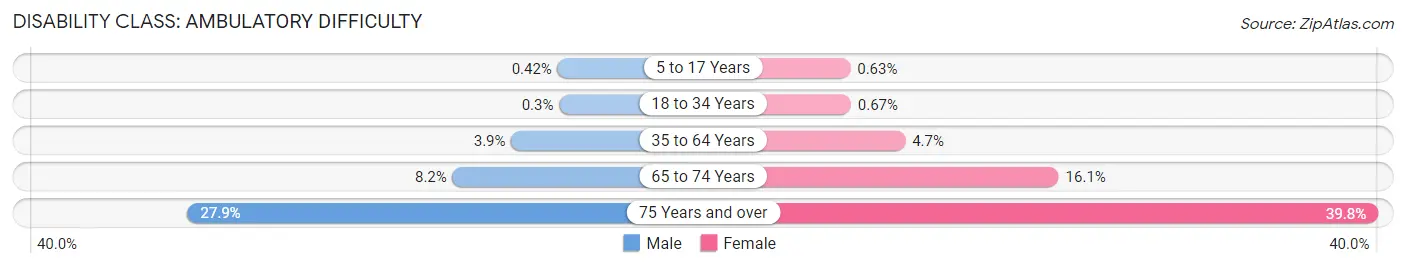
| Age Bracket | Male | Female |
| 5 to 17 Years | 62 (0.4%) | 85 (0.6%) |
| 18 to 34 Years | 61 (0.3%) | 137 (0.7%) |
| 35 to 64 Years | 1,262 (3.9%) | 1,678 (4.7%) |
| 65 to 74 Years | 521 (8.2%) | 1,287 (16.1%) |
| 75 Years and over | 1,087 (27.9%) | 1,898 (39.8%) |
Disability Class: Self-Care Difficulty
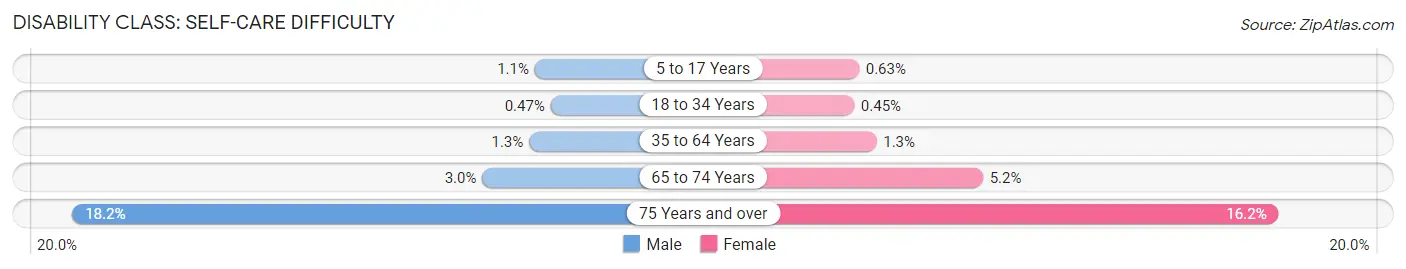
| Age Bracket | Male | Female |
| 5 to 17 Years | 156 (1.1%) | 85 (0.6%) |
| 18 to 34 Years | 98 (0.5%) | 91 (0.4%) |
| 35 to 64 Years | 417 (1.3%) | 456 (1.3%) |
| 65 to 74 Years | 191 (3.0%) | 418 (5.2%) |
| 75 Years and over | 710 (18.2%) | 773 (16.2%) |
Technology Access in Rancho Cucamonga
Computing Device Access in Rancho Cucamonga
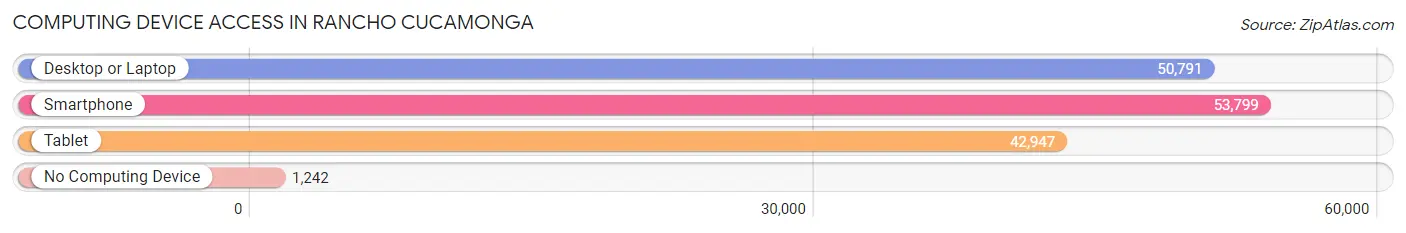
| Device Type | # Households | % Households |
| Desktop or Laptop | 50,791 | 88.2% |
| Smartphone | 53,799 | 93.5% |
| Tablet | 42,947 | 74.6% |
| No Computing Device | 1,242 | 2.2% |
| Total | 57,553 | 100.0% |
Internet Access in Rancho Cucamonga
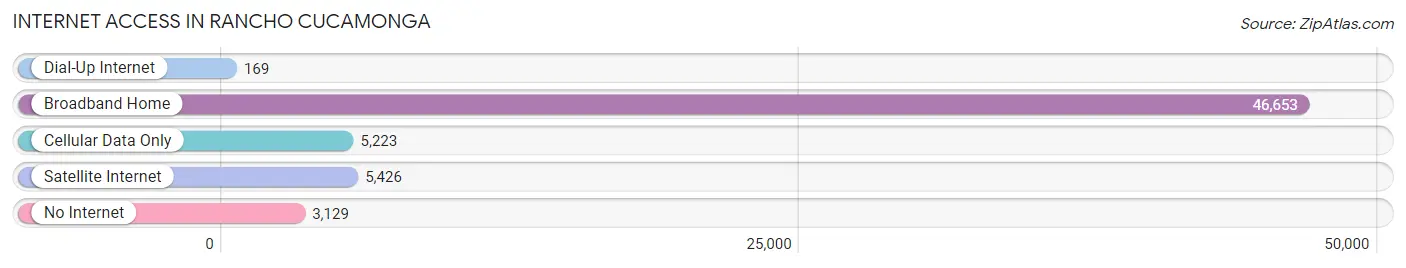
| Internet Type | # Households | % Households |
| Dial-Up Internet | 169 | 0.3% |
| Broadband Home | 46,653 | 81.1% |
| Cellular Data Only | 5,223 | 9.1% |
| Satellite Internet | 5,426 | 9.4% |
| No Internet | 3,129 | 5.4% |
| Total | 57,553 | 100.0% |
Rancho Cucamonga Summary
Rancho Cucamonga is a city located in the southwestern corner of San Bernardino County, California. It is situated at the foothills of the San Gabriel Mountains, approximately 37 miles east of Los Angeles. The city is home to a population of over 177,000 people, making it the 17th most populous city in the state of California.
History
Rancho Cucamonga was originally inhabited by the Tongva Native American tribe. The area was first explored by Spanish missionaries in the late 1700s, and the first land grant was issued in 1839. The area was then divided into five separate ranchos, including Rancho Cucamonga. The rancho was named after the cucamonga, a type of wild grape that grew in the area.
In the late 1800s, the area began to be developed for agriculture, and the first winery was established in 1877. The area was then incorporated as a city in 1977, and has since grown to become one of the most populous cities in the state.
Geography
Rancho Cucamonga is located in the southwestern corner of San Bernardino County, California. It is situated at the foothills of the San Gabriel Mountains, approximately 37 miles east of Los Angeles. The city covers an area of 39.6 square miles, and is bordered by the cities of Upland, Ontario, Fontana, and Rialto.
The city is divided into several distinct neighborhoods, including Alta Loma, Etiwanda, and Terra Vista. The city is also home to several parks and recreational areas, including Cucamonga-Guasti Regional Park, Red Hill Park, and Victoria Gardens.
Economy
Rancho Cucamonga is home to a diverse economy, with a variety of industries represented. The city is home to several major employers, including the Ontario International Airport, the University of La Verne, and the Ontario Mills Mall. The city is also home to several corporate headquarters, including the headquarters of the San Manuel Band of Mission Indians, and the headquarters of the Ontario International Airport.
The city is also home to a thriving retail sector, with several major shopping centers located in the city. The city is also home to several major restaurants, including the popular In-N-Out Burger chain.
Demographics
As of the 2010 census, the population of Rancho Cucamonga was 177,423. The racial makeup of the city was 57.2% White, 4.2% African American, 1.2% Native American, 15.2% Asian, 0.3% Pacific Islander, and 21.1% from other races. The median household income was $76,824, and the median family income was $86,824. The city is also home to a large Hispanic population, with over 40% of the population identifying as Hispanic or Latino.
Common Questions
What is Per Capita Income in Rancho Cucamonga?
Per Capita income in Rancho Cucamonga is $44,345.
What is the Median Family Income in Rancho Cucamonga?
Median Family Income in Rancho Cucamonga is $117,921.
What is the Median Household income in Rancho Cucamonga?
Median Household Income in Rancho Cucamonga is $105,534.
What is Income or Wage Gap in Rancho Cucamonga?
Income or Wage Gap in Rancho Cucamonga is 23.8%.
Women in Rancho Cucamonga earn 76.2 cents for every dollar earned by a man.
What is Family Income Deficit in Rancho Cucamonga?
Family Income Deficit in Rancho Cucamonga is $11,481.
Families that are below poverty line in Rancho Cucamonga earn $11,481 less on average than the poverty threshold level.
What is Inequality or Gini Index in Rancho Cucamonga?
Inequality or Gini Index in Rancho Cucamonga is 0.43.
What is the Total Population of Rancho Cucamonga?
Total Population of Rancho Cucamonga is 174,696.
What is the Total Male Population of Rancho Cucamonga?
Total Male Population of Rancho Cucamonga is 86,873.
What is the Total Female Population of Rancho Cucamonga?
Total Female Population of Rancho Cucamonga is 87,823.
What is the Ratio of Males per 100 Females in Rancho Cucamonga?
There are 98.92 Males per 100 Females in Rancho Cucamonga.
What is the Ratio of Females per 100 Males in Rancho Cucamonga?
There are 101.09 Females per 100 Males in Rancho Cucamonga.
What is the Median Population Age in Rancho Cucamonga?
Median Population Age in Rancho Cucamonga is 37.5 Years.
What is the Average Family Size in Rancho Cucamonga
Average Family Size in Rancho Cucamonga is 3.4 People.
What is the Average Household Size in Rancho Cucamonga
Average Household Size in Rancho Cucamonga is 3.0 People.
How Large is the Labor Force in Rancho Cucamonga?
There are 91,650 People in the Labor Forcein in Rancho Cucamonga.
What is the Percentage of People in the Labor Force in Rancho Cucamonga?
65.9% of People are in the Labor Force in Rancho Cucamonga.
What is the Unemployment Rate in Rancho Cucamonga?
Unemployment Rate in Rancho Cucamonga is 5.4%.