San Carlos, CA Map & Demographics
San Carlos Map
San Carlos Overview
$113,618
PER CAPITA INCOME
$250,001
AVG FAMILY INCOME
$219,413
AVG HOUSEHOLD INCOME
27.9%
WAGE / INCOME GAP [ % ]
72.1¢/ $1
WAGE / INCOME GAP [ $ ]
$15,699
FAMILY INCOME DEFICIT
0.46
INEQUALITY / GINI INDEX
30,490
TOTAL POPULATION
14,914
MALE POPULATION
15,576
FEMALE POPULATION
95.75
MALES / 100 FEMALES
104.44
FEMALES / 100 MALES
41.7
MEDIAN AGE
3.1
AVG FAMILY SIZE
2.7
AVG HOUSEHOLD SIZE
17,252
LABOR FORCE [ PEOPLE ]
70.9%
PERCENT IN LABOR FORCE
4.1%
UNEMPLOYMENT RATE
San Carlos Zip Codes
San Carlos Area Codes
Income in San Carlos
Income Overview in San Carlos
Per Capita Income in San Carlos is $113,618, while median incomes of families and households are $250,001 and $219,413 respectively.
| Characteristic | Number | Measure |
| Per Capita Income | 30,490 | $113,618 |
| Median Family Income | 8,236 | $250,001 |
| Mean Family Income | 8,236 | $351,286 |
| Median Household Income | 11,361 | $219,413 |
| Mean Household Income | 11,361 | $298,397 |
| Income Deficit | 8,236 | $15,699 |
| Wage / Income Gap (%) | 30,490 | 27.90% |
| Wage / Income Gap ($) | 30,490 | 72.10¢ per $1 |
| Gini / Inequality Index | 30,490 | 0.46 |
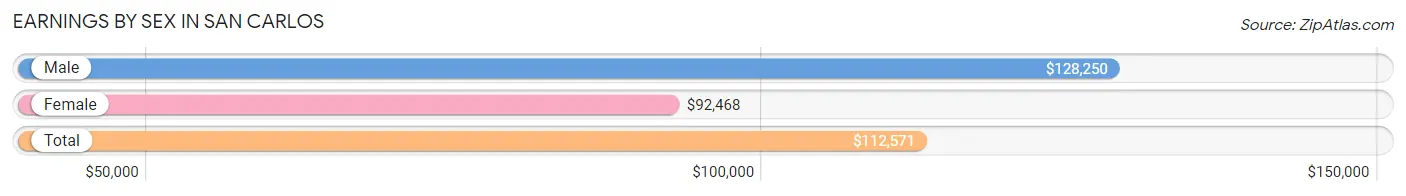
Earnings by Sex in San Carlos
Average Earnings in San Carlos are $112,571, $128,250 for men and $92,468 for women, a difference of 27.9%.
| Sex | Number | Average Earnings |
| Male | 9,289 (51.4%) | $128,250 |
| Female | 8,769 (48.6%) | $92,468 |
| Total | 18,058 (100.0%) | $112,571 |
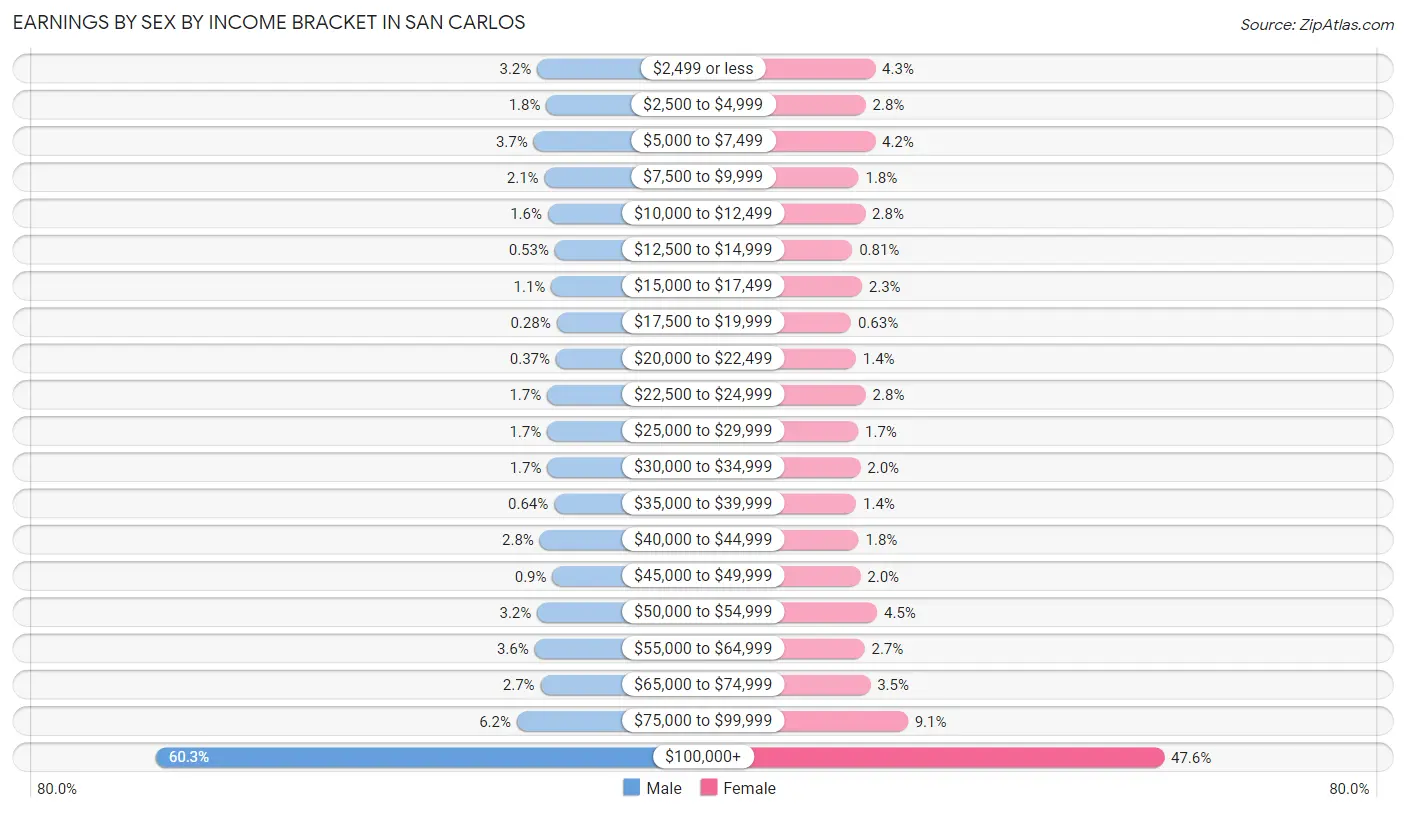
Earnings by Sex by Income Bracket in San Carlos
The most common earnings brackets in San Carlos are $100,000+ for men (5,603 | 60.3%) and $100,000+ for women (4,170 | 47.5%).
| Income | Male | Female |
| $2,499 or less | 295 (3.2%) | 373 (4.3%) |
| $2,500 to $4,999 | 168 (1.8%) | 247 (2.8%) |
| $5,000 to $7,499 | 346 (3.7%) | 371 (4.2%) |
| $7,500 to $9,999 | 194 (2.1%) | 154 (1.8%) |
| $10,000 to $12,499 | 147 (1.6%) | 241 (2.8%) |
| $12,500 to $14,999 | 49 (0.5%) | 71 (0.8%) |
| $15,000 to $17,499 | 99 (1.1%) | 198 (2.3%) |
| $17,500 to $19,999 | 26 (0.3%) | 55 (0.6%) |
| $20,000 to $22,499 | 34 (0.4%) | 119 (1.4%) |
| $22,500 to $24,999 | 158 (1.7%) | 248 (2.8%) |
| $25,000 to $29,999 | 157 (1.7%) | 149 (1.7%) |
| $30,000 to $34,999 | 154 (1.7%) | 178 (2.0%) |
| $35,000 to $39,999 | 59 (0.6%) | 122 (1.4%) |
| $40,000 to $44,999 | 260 (2.8%) | 155 (1.8%) |
| $45,000 to $49,999 | 84 (0.9%) | 178 (2.0%) |
| $50,000 to $54,999 | 295 (3.2%) | 398 (4.5%) |
| $55,000 to $64,999 | 332 (3.6%) | 233 (2.7%) |
| $65,000 to $74,999 | 250 (2.7%) | 308 (3.5%) |
| $75,000 to $99,999 | 579 (6.2%) | 801 (9.1%) |
| $100,000+ | 5,603 (60.3%) | 4,170 (47.5%) |
| Total | 9,289 (100.0%) | 8,769 (100.0%) |
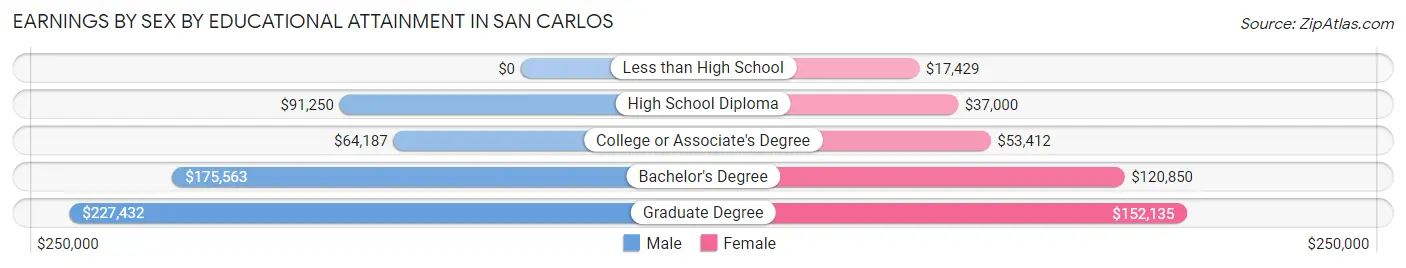
Earnings by Sex by Educational Attainment in San Carlos
Average earnings in San Carlos are $144,357 for men and $108,426 for women, a difference of 24.9%. Men with an educational attainment of graduate degree enjoy the highest average annual earnings of $227,432, while those with college or associate's degree education earn the least with $64,187. Women with an educational attainment of graduate degree earn the most with the average annual earnings of $152,135, while those with less than high school education have the smallest earnings of $17,429.
| Educational Attainment | Male Income | Female Income |
| Less than High School | - | - |
| High School Diploma | $91,250 | $37,000 |
| College or Associate's Degree | $64,187 | $53,412 |
| Bachelor's Degree | $175,563 | $120,850 |
| Graduate Degree | $227,432 | $152,135 |
| Total | $144,357 | $108,426 |
Family Income in San Carlos
Family Income Brackets in San Carlos
According to the San Carlos family income data, there are 5,255 families falling into the $200,000+ income range, which is the most common income bracket and makes up 63.8% of all families. Conversely, the $10,000 to $14,999 income bracket is the least frequent group with only 8 families (0.1%) belonging to this category.
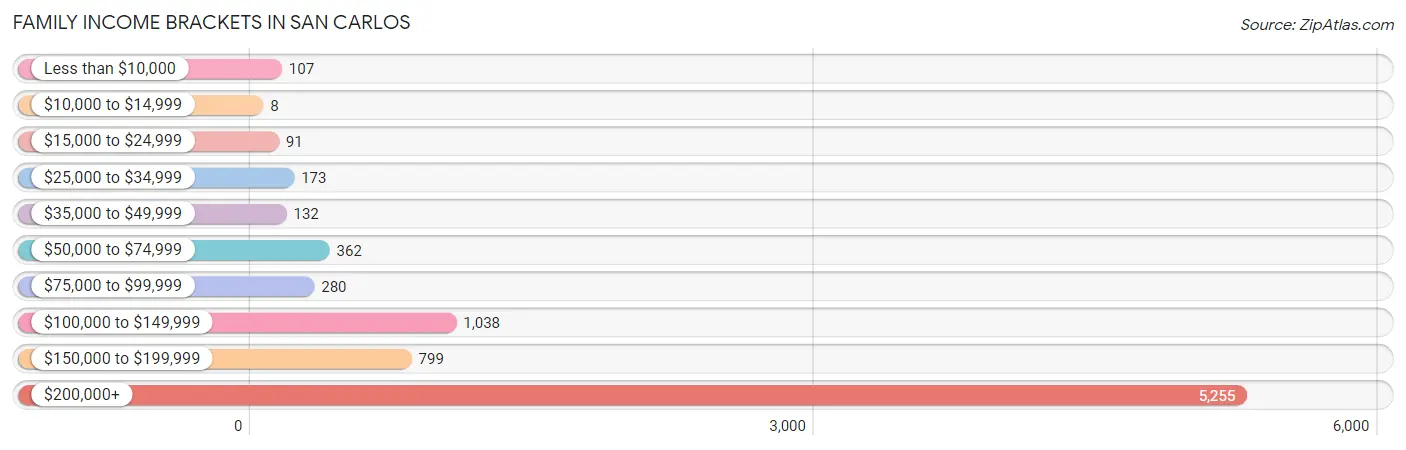
| Income Bracket | # Families | % Families |
| Less than $10,000 | 107 | 1.3% |
| $10,000 to $14,999 | 8 | 0.1% |
| $15,000 to $24,999 | 91 | 1.1% |
| $25,000 to $34,999 | 173 | 2.1% |
| $35,000 to $49,999 | 132 | 1.6% |
| $50,000 to $74,999 | 362 | 4.4% |
| $75,000 to $99,999 | 280 | 3.4% |
| $100,000 to $149,999 | 1,038 | 12.6% |
| $150,000 to $199,999 | 799 | 9.7% |
| $200,000+ | 5,255 | 63.8% |
Family Income by Famaliy Size in San Carlos
3-person families (2,399 | 29.1%) account for the highest median family income in San Carlos with $250,001 per family, while 2-person families (3,451 | 41.9%) have the highest median income of $96,264 per family member.
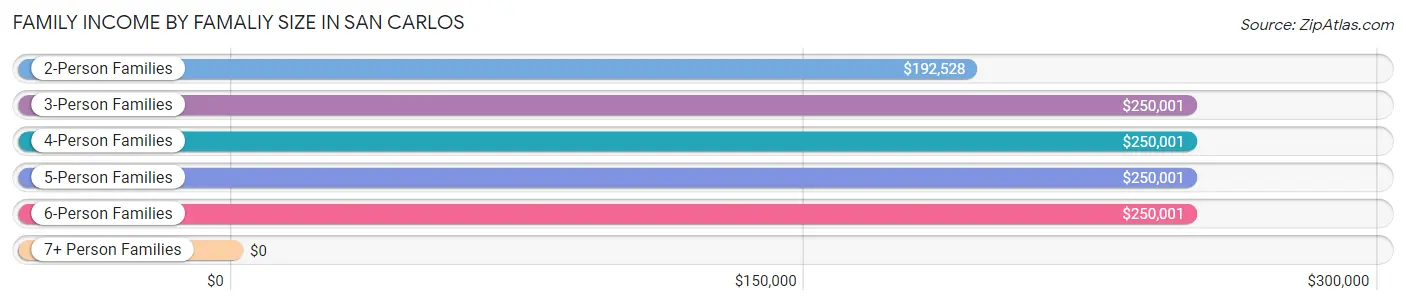
| Income Bracket | # Families | Median Income |
| 2-Person Families | 3,451 (41.9%) | $192,528 |
| 3-Person Families | 2,399 (29.1%) | $250,001 |
| 4-Person Families | 1,803 (21.9%) | $250,001 |
| 5-Person Families | 475 (5.8%) | $250,001 |
| 6-Person Families | 91 (1.1%) | $250,001 |
| 7+ Person Families | 17 (0.2%) | $0 |
| Total | 8,236 (100.0%) | $250,001 |
Family Income by Number of Earners in San Carlos
The median family income in San Carlos is $250,001, with families comprising 2 earners (4,287) having the highest median family income of $250,001, while families with no earners (794) have the lowest median family income of $121,447, accounting for 52.0% and 9.6% of families, respectively.
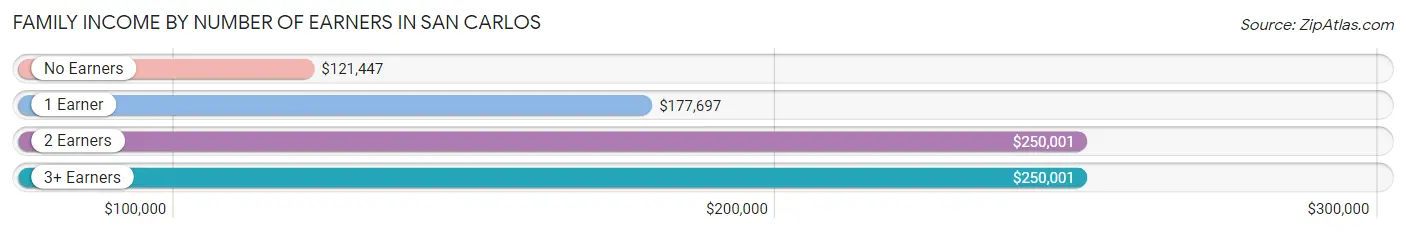
| Number of Earners | # Families | Median Income |
| No Earners | 794 (9.6%) | $121,447 |
| 1 Earner | 2,197 (26.7%) | $177,697 |
| 2 Earners | 4,287 (52.0%) | $250,001 |
| 3+ Earners | 958 (11.6%) | $250,001 |
| Total | 8,236 (100.0%) | $250,001 |
Household Income in San Carlos
Household Income Brackets in San Carlos
With 6,044 households falling in the category, the $200,000+ income range is the most frequent in San Carlos, accounting for 53.2% of all households. In contrast, only 80 households (0.7%) fall into the $10,000 to $14,999 income bracket, making it the least populous group.
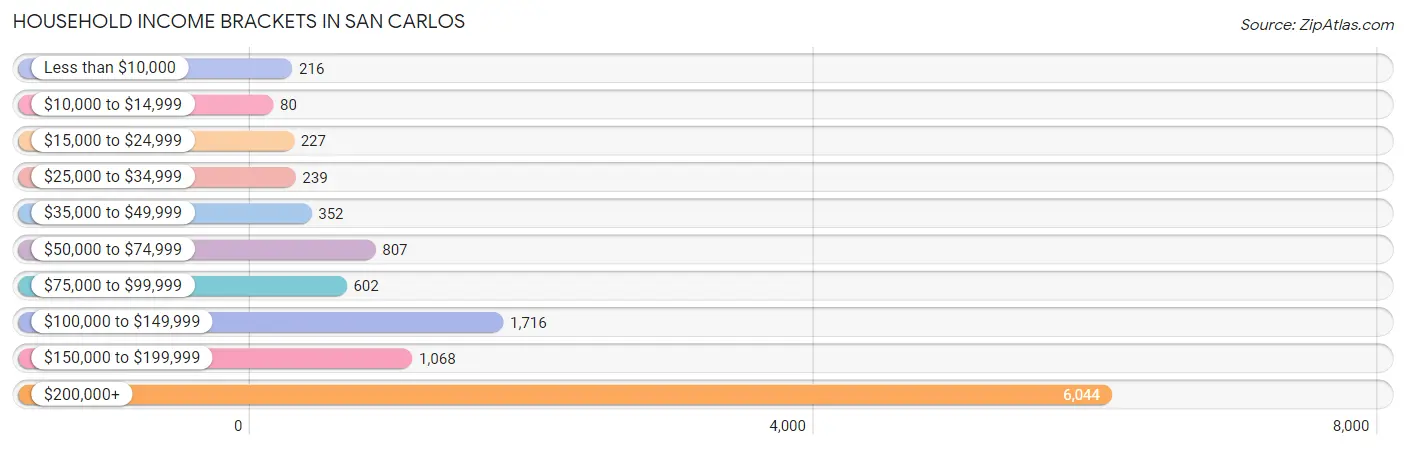
| Income Bracket | # Households | % Households |
| Less than $10,000 | 216 | 1.9% |
| $10,000 to $14,999 | 80 | 0.7% |
| $15,000 to $24,999 | 227 | 2.0% |
| $25,000 to $34,999 | 239 | 2.1% |
| $35,000 to $49,999 | 352 | 3.1% |
| $50,000 to $74,999 | 807 | 7.1% |
| $75,000 to $99,999 | 602 | 5.3% |
| $100,000 to $149,999 | 1,716 | 15.1% |
| $150,000 to $199,999 | 1,068 | 9.4% |
| $200,000+ | 6,044 | 53.2% |
Household Income by Householder Age in San Carlos
The median household income in San Carlos is $219,413, with the highest median household income of $250,001 found in the 25 to 44 years age bracket for the primary householder. A total of 3,645 households (32.1%) fall into this category. Meanwhile, the 15 to 24 years age bracket for the primary householder has the lowest median household income of $89,194, with 42 households (0.4%) in this group.
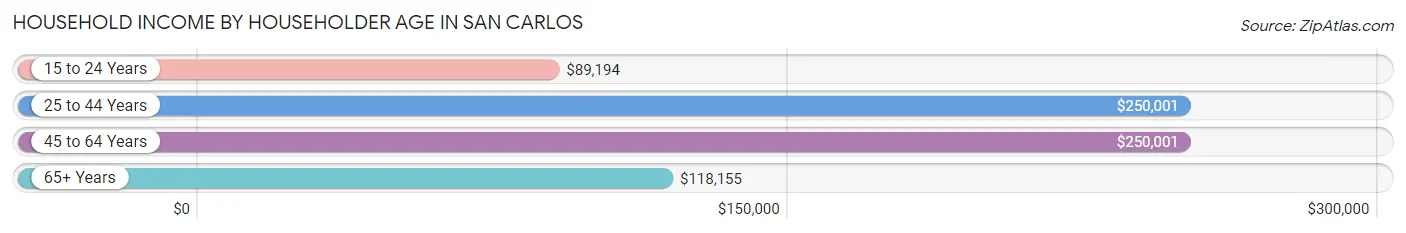
| Income Bracket | # Households | Median Income |
| 15 to 24 Years | 42 (0.4%) | $89,194 |
| 25 to 44 Years | 3,645 (32.1%) | $250,001 |
| 45 to 64 Years | 4,671 (41.1%) | $250,001 |
| 65+ Years | 3,003 (26.4%) | $118,155 |
| Total | 11,361 (100.0%) | $219,413 |
Poverty in San Carlos
Income Below Poverty by Sex and Age in San Carlos
With 2.1% poverty level for males and 3.8% for females among the residents of San Carlos, 15 year old males and 5 year old females are the most vulnerable to poverty, with 21 males (9.9%) and 63 females (31.3%) in their respective age groups living below the poverty level.
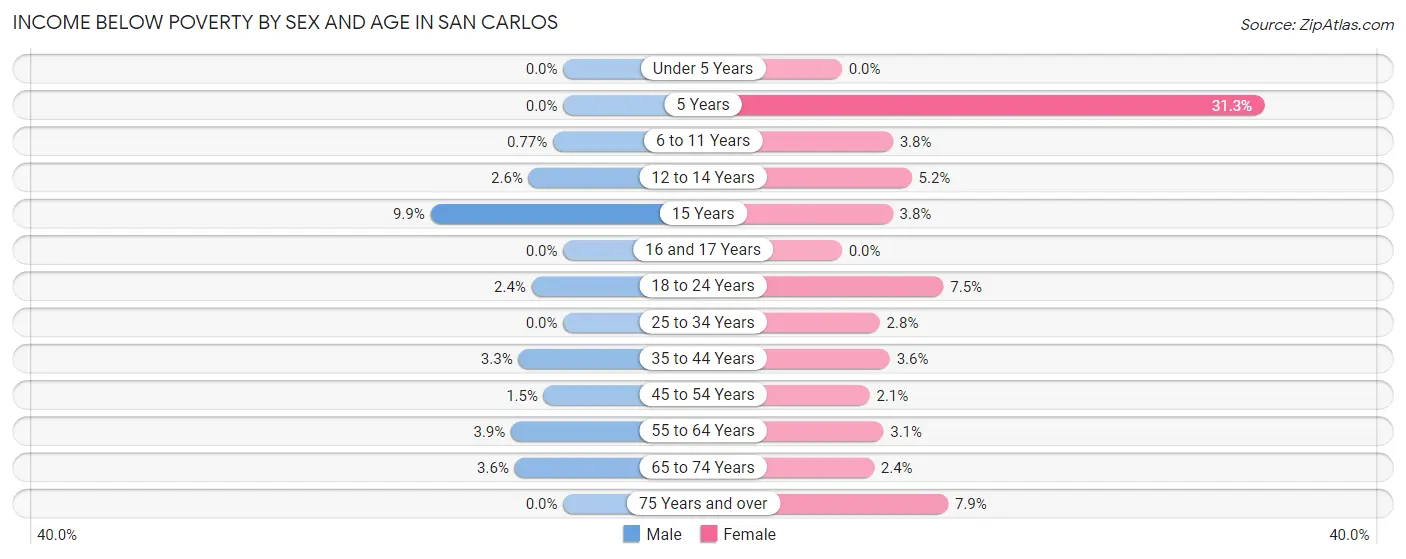
| Age Bracket | Male | Female |
| Under 5 Years | 0 (0.0%) | 0 (0.0%) |
| 5 Years | 0 (0.0%) | 63 (31.3%) |
| 6 to 11 Years | 8 (0.8%) | 45 (3.8%) |
| 12 to 14 Years | 20 (2.6%) | 31 (5.2%) |
| 15 Years | 21 (9.9%) | 6 (3.8%) |
| 16 and 17 Years | 0 (0.0%) | 0 (0.0%) |
| 18 to 24 Years | 19 (2.4%) | 57 (7.5%) |
| 25 to 34 Years | 0 (0.0%) | 41 (2.8%) |
| 35 to 44 Years | 88 (3.3%) | 83 (3.6%) |
| 45 to 54 Years | 32 (1.5%) | 48 (2.1%) |
| 55 to 64 Years | 78 (3.9%) | 70 (3.1%) |
| 65 to 74 Years | 44 (3.6%) | 39 (2.4%) |
| 75 Years and over | 0 (0.0%) | 106 (7.9%) |
| Total | 310 (2.1%) | 589 (3.8%) |
Income Above Poverty by Sex and Age in San Carlos
According to the poverty statistics in San Carlos, males aged under 5 years and females aged under 5 years are the age groups that are most secure financially, with 100.0% of males and 100.0% of females in these age groups living above the poverty line.

| Age Bracket | Male | Female |
| Under 5 Years | 795 (100.0%) | 837 (100.0%) |
| 5 Years | 225 (100.0%) | 138 (68.7%) |
| 6 to 11 Years | 1,036 (99.2%) | 1,144 (96.2%) |
| 12 to 14 Years | 759 (97.4%) | 567 (94.8%) |
| 15 Years | 192 (90.1%) | 153 (96.2%) |
| 16 and 17 Years | 574 (100.0%) | 410 (100.0%) |
| 18 to 24 Years | 789 (97.7%) | 699 (92.5%) |
| 25 to 34 Years | 1,461 (100.0%) | 1,417 (97.2%) |
| 35 to 44 Years | 2,557 (96.7%) | 2,246 (96.4%) |
| 45 to 54 Years | 2,172 (98.6%) | 2,277 (97.9%) |
| 55 to 64 Years | 1,932 (96.1%) | 2,206 (96.9%) |
| 65 to 74 Years | 1,174 (96.4%) | 1,597 (97.6%) |
| 75 Years and over | 857 (100.0%) | 1,239 (92.1%) |
| Total | 14,523 (97.9%) | 14,930 (96.2%) |
Income Below Poverty Among Married-Couple Families in San Carlos
The poverty statistics for married-couple families in San Carlos show that 1.1% or 79 of the total 7,037 families live below the poverty line. Families with 3 or 4 children have the highest poverty rate of 4.8%, comprising of 21 families. On the other hand, families with no children have the lowest poverty rate of 0.0%, which includes 0 families.
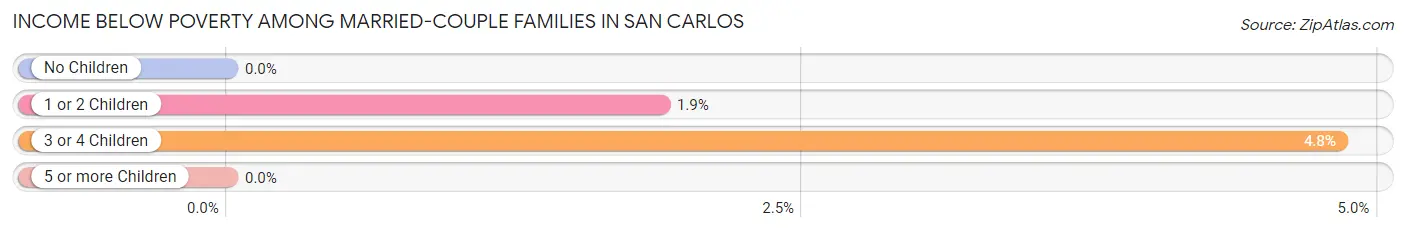
| Children | Above Poverty | Below Poverty |
| No Children | 3,512 (100.0%) | 0 (0.0%) |
| 1 or 2 Children | 3,032 (98.1%) | 58 (1.9%) |
| 3 or 4 Children | 414 (95.2%) | 21 (4.8%) |
| 5 or more Children | 0 (0.0%) | 0 (0.0%) |
| Total | 6,958 (98.9%) | 79 (1.1%) |
Income Below Poverty Among Single-Parent Households in San Carlos
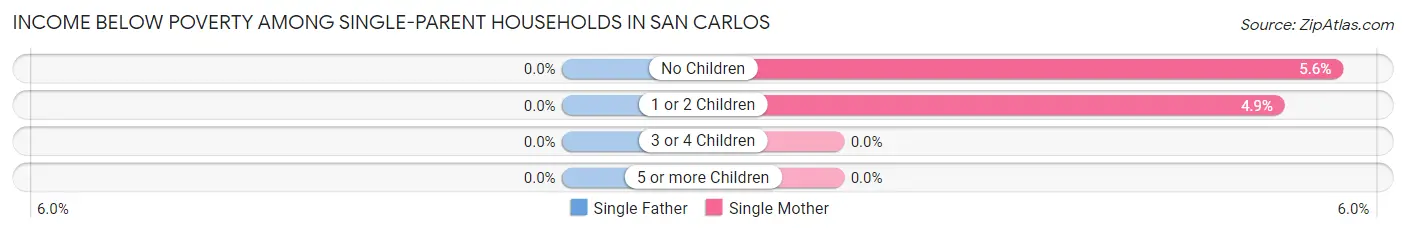
| Children | Single Father | Single Mother |
| No Children | 0 (0.0%) | 27 (5.6%) |
| 1 or 2 Children | 0 (0.0%) | 21 (4.9%) |
| 3 or 4 Children | 0 (0.0%) | 0 (0.0%) |
| 5 or more Children | 0 (0.0%) | 0 (0.0%) |
| Total | 0 (0.0%) | 48 (5.1%) |
Income Below Poverty Among Married-Couple vs Single-Parent Households in San Carlos
The poverty data for San Carlos shows that 79 of the married-couple family households (1.1%) and 48 of the single-parent households (4.0%) are living below the poverty level. Within the married-couple family households, those with 3 or 4 children have the highest poverty rate, with 21 households (4.8%) falling below the poverty line. Among the single-parent households, those with no children have the highest poverty rate, with 27 household (4.7%) living below poverty.
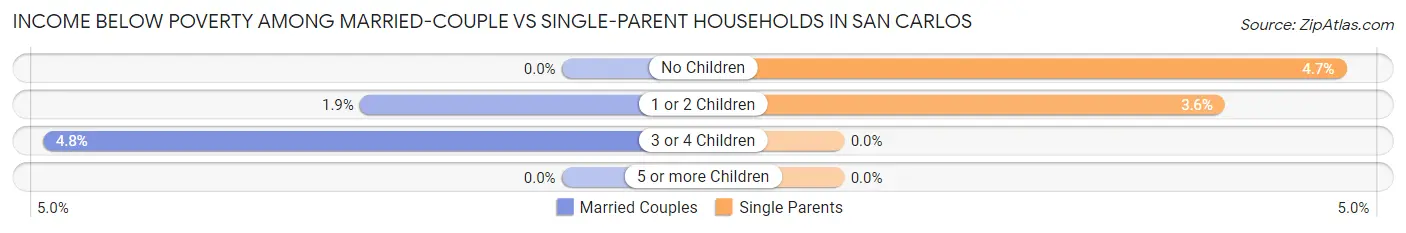
| Children | Married-Couple Families | Single-Parent Households |
| No Children | 0 (0.0%) | 27 (4.7%) |
| 1 or 2 Children | 58 (1.9%) | 21 (3.5%) |
| 3 or 4 Children | 21 (4.8%) | 0 (0.0%) |
| 5 or more Children | 0 (0.0%) | 0 (0.0%) |
| Total | 79 (1.1%) | 48 (4.0%) |
Race in San Carlos
The most populous races in San Carlos are White / Caucasian (19,343 | 63.4%), Asian (6,222 | 20.4%), and Two or more Races (3,606 | 11.8%).
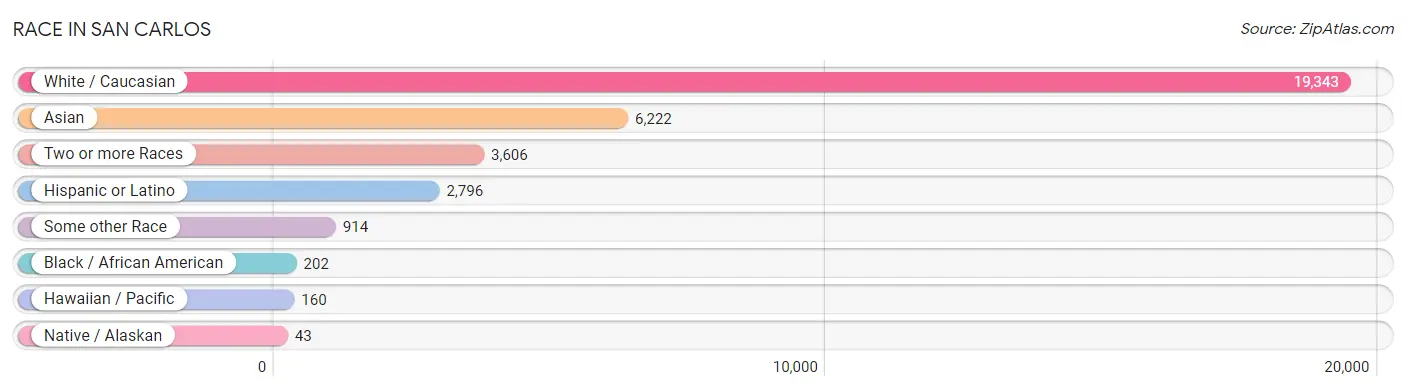
| Race | # Population | % Population |
| Asian | 6,222 | 20.4% |
| Black / African American | 202 | 0.7% |
| Hawaiian / Pacific | 160 | 0.5% |
| Hispanic or Latino | 2,796 | 9.2% |
| Native / Alaskan | 43 | 0.1% |
| White / Caucasian | 19,343 | 63.4% |
| Two or more Races | 3,606 | 11.8% |
| Some other Race | 914 | 3.0% |
| Total | 30,490 | 100.0% |
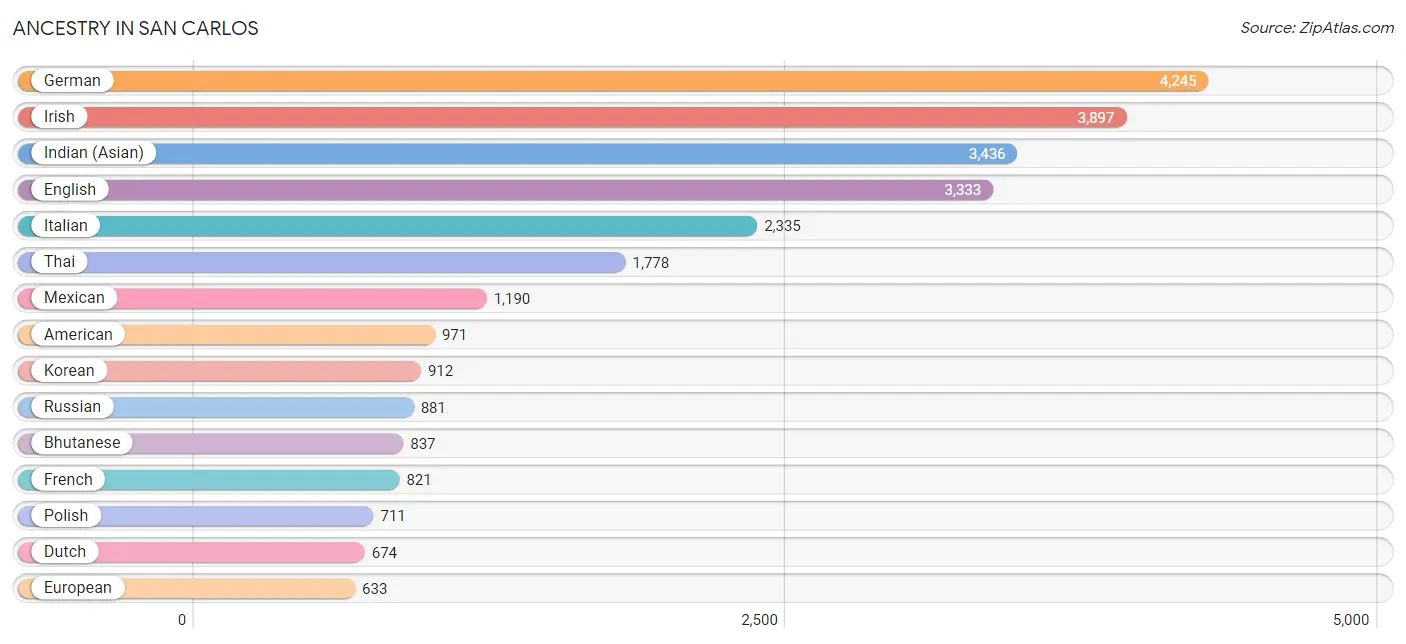
Ancestry in San Carlos
The most populous ancestries reported in San Carlos are German (4,245 | 13.9%), Irish (3,897 | 12.8%), Indian (Asian) (3,436 | 11.3%), English (3,333 | 10.9%), and Italian (2,335 | 7.7%), together accounting for 56.6% of all San Carlos residents.
| Ancestry | # Population | % Population |
| African | 49 | 0.2% |
| Albanian | 4 | 0.0% |
| American | 971 | 3.2% |
| Arab | 246 | 0.8% |
| Argentinean | 123 | 0.4% |
| Armenian | 75 | 0.3% |
| Australian | 22 | 0.1% |
| Austrian | 150 | 0.5% |
| Basque | 30 | 0.1% |
| Belgian | 54 | 0.2% |
| Bhutanese | 837 | 2.8% |
| Blackfeet | 4 | 0.0% |
| Bolivian | 83 | 0.3% |
| Brazilian | 106 | 0.4% |
| British | 379 | 1.2% |
| Burmese | 453 | 1.5% |
| Cambodian | 2 | 0.0% |
| Canadian | 97 | 0.3% |
| Celtic | 10 | 0.0% |
| Central American | 388 | 1.3% |
| Central American Indian | 8 | 0.0% |
| Cherokee | 48 | 0.2% |
| Chilean | 68 | 0.2% |
| Choctaw | 2 | 0.0% |
| Colombian | 20 | 0.1% |
| Costa Rican | 6 | 0.0% |
| Creek | 12 | 0.0% |
| Croatian | 74 | 0.2% |
| Cuban | 127 | 0.4% |
| Czech | 322 | 1.1% |
| Danish | 331 | 1.1% |
| Dutch | 674 | 2.2% |
| Eastern European | 216 | 0.7% |
| Ecuadorian | 23 | 0.1% |
| Egyptian | 47 | 0.2% |
| English | 3,333 | 10.9% |
| Estonian | 10 | 0.0% |
| European | 633 | 2.1% |
| Filipino | 146 | 0.5% |
| Finnish | 26 | 0.1% |
| French | 821 | 2.7% |
| French Canadian | 127 | 0.4% |
| German | 4,245 | 13.9% |
| Greek | 510 | 1.7% |
| Guamanian / Chamorro | 32 | 0.1% |
| Hungarian | 129 | 0.4% |
| Indian (Asian) | 3,436 | 11.3% |
| Indonesian | 80 | 0.3% |
| Iranian | 306 | 1.0% |
| Irish | 3,897 | 12.8% |
| Israeli | 10 | 0.0% |
| Italian | 2,335 | 7.7% |
| Jordanian | 21 | 0.1% |
| Kenyan | 7 | 0.0% |
| Korean | 912 | 3.0% |
| Laotian | 284 | 0.9% |
| Latvian | 6 | 0.0% |
| Lebanese | 101 | 0.3% |
| Lithuanian | 60 | 0.2% |
| Maltese | 220 | 0.7% |
| Mexican | 1,190 | 3.9% |
| Native Hawaiian | 29 | 0.1% |
| Navajo | 2 | 0.0% |
| New Zealander | 18 | 0.1% |
| Nicaraguan | 72 | 0.2% |
| Northern European | 196 | 0.6% |
| Norwegian | 333 | 1.1% |
| Okinawan | 10 | 0.0% |
| Ottawa | 23 | 0.1% |
| Pakistani | 123 | 0.4% |
| Palestinian | 8 | 0.0% |
| Pennsylvania German | 10 | 0.0% |
| Peruvian | 126 | 0.4% |
| Polish | 711 | 2.3% |
| Portuguese | 226 | 0.7% |
| Puerto Rican | 43 | 0.1% |
| Romanian | 110 | 0.4% |
| Russian | 881 | 2.9% |
| Salvadoran | 296 | 1.0% |
| Scandinavian | 72 | 0.2% |
| Scotch-Irish | 123 | 0.4% |
| Scottish | 606 | 2.0% |
| Serbian | 39 | 0.1% |
| Slavic | 5 | 0.0% |
| Slovak | 10 | 0.0% |
| Slovene | 19 | 0.1% |
| South American | 477 | 1.6% |
| Spaniard | 353 | 1.2% |
| Spanish | 116 | 0.4% |
| Sri Lankan | 394 | 1.3% |
| Subsaharan African | 63 | 0.2% |
| Swedish | 469 | 1.5% |
| Swiss | 202 | 0.7% |
| Syrian | 36 | 0.1% |
| Thai | 1,778 | 5.8% |
| Tongan | 102 | 0.3% |
| Trinidadian and Tobagonian | 36 | 0.1% |
| Turkish | 64 | 0.2% |
| Ukrainian | 123 | 0.4% |
| Uruguayan | 13 | 0.0% |
| Ute | 36 | 0.1% |
| Vietnamese | 60 | 0.2% |
| Welsh | 303 | 1.0% |
| Yugoslavian | 4 | 0.0% | View All 104 Rows |
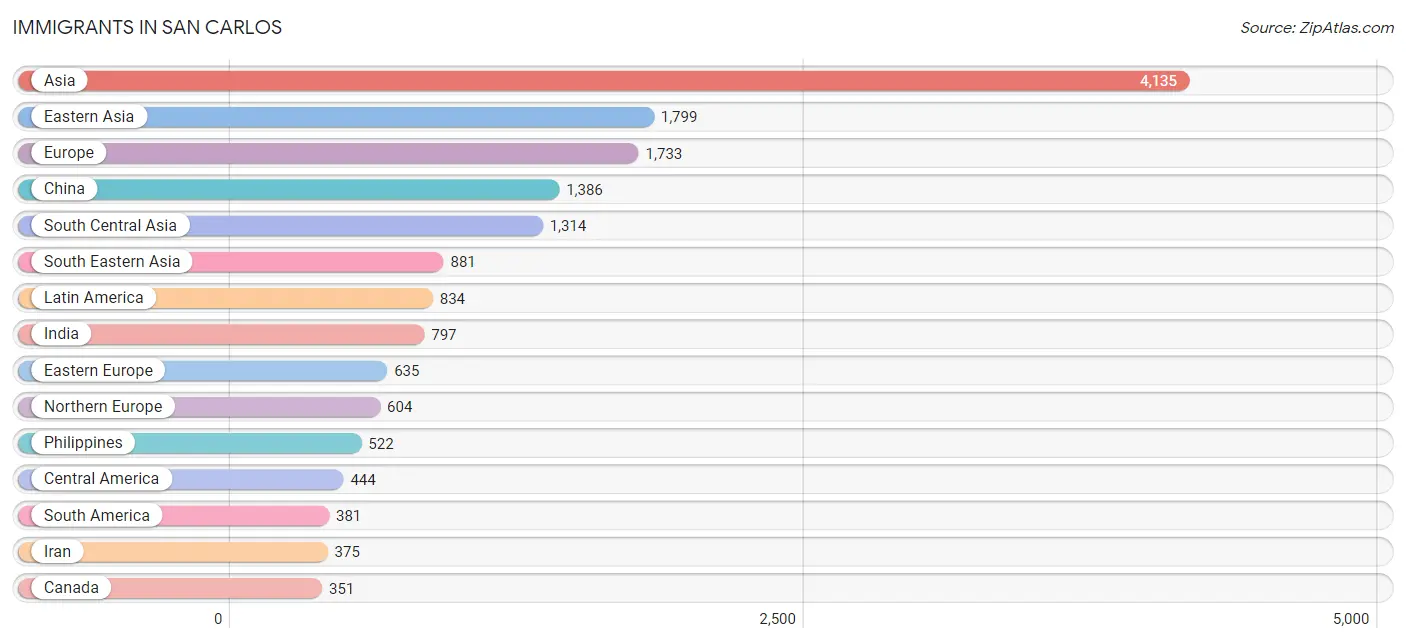
Immigrants in San Carlos
The most numerous immigrant groups reported in San Carlos came from Asia (4,135 | 13.6%), Eastern Asia (1,799 | 5.9%), Europe (1,733 | 5.7%), China (1,386 | 4.5%), and South Central Asia (1,314 | 4.3%), together accounting for 34.0% of all San Carlos residents.
| Immigration Origin | # Population | % Population |
| Africa | 97 | 0.3% |
| Argentina | 55 | 0.2% |
| Asia | 4,135 | 13.6% |
| Australia | 46 | 0.2% |
| Austria | 9 | 0.0% |
| Bangladesh | 74 | 0.2% |
| Belarus | 11 | 0.0% |
| Bolivia | 57 | 0.2% |
| Brazil | 93 | 0.3% |
| Bulgaria | 24 | 0.1% |
| Canada | 351 | 1.1% |
| Caribbean | 9 | 0.0% |
| Central America | 444 | 1.5% |
| Chile | 34 | 0.1% |
| China | 1,386 | 4.5% |
| Colombia | 16 | 0.1% |
| Croatia | 26 | 0.1% |
| Czechoslovakia | 86 | 0.3% |
| Denmark | 73 | 0.2% |
| Eastern Africa | 23 | 0.1% |
| Eastern Asia | 1,799 | 5.9% |
| Eastern Europe | 635 | 2.1% |
| Egypt | 49 | 0.2% |
| El Salvador | 86 | 0.3% |
| England | 99 | 0.3% |
| Europe | 1,733 | 5.7% |
| Fiji | 52 | 0.2% |
| France | 44 | 0.1% |
| Germany | 188 | 0.6% |
| Greece | 56 | 0.2% |
| Hong Kong | 242 | 0.8% |
| India | 797 | 2.6% |
| Indonesia | 15 | 0.1% |
| Iran | 375 | 1.2% |
| Ireland | 35 | 0.1% |
| Israel | 10 | 0.0% |
| Italy | 84 | 0.3% |
| Japan | 178 | 0.6% |
| Jordan | 20 | 0.1% |
| Kazakhstan | 22 | 0.1% |
| Kenya | 7 | 0.0% |
| Korea | 235 | 0.8% |
| Kuwait | 21 | 0.1% |
| Laos | 10 | 0.0% |
| Latin America | 834 | 2.7% |
| Lebanon | 21 | 0.1% |
| Malaysia | 13 | 0.0% |
| Mexico | 317 | 1.0% |
| Nepal | 33 | 0.1% |
| Netherlands | 11 | 0.0% |
| Nicaragua | 41 | 0.1% |
| Northern Africa | 49 | 0.2% |
| Northern Europe | 604 | 2.0% |
| Norway | 9 | 0.0% |
| Oceania | 286 | 0.9% |
| Pakistan | 13 | 0.0% |
| Peru | 113 | 0.4% |
| Philippines | 522 | 1.7% |
| Poland | 29 | 0.1% |
| Romania | 92 | 0.3% |
| Russia | 234 | 0.8% |
| Scotland | 18 | 0.1% |
| Singapore | 87 | 0.3% |
| South Africa | 25 | 0.1% |
| South America | 381 | 1.3% |
| South Central Asia | 1,314 | 4.3% |
| South Eastern Asia | 881 | 2.9% |
| Southern Europe | 188 | 0.6% |
| Spain | 24 | 0.1% |
| Sweden | 51 | 0.2% |
| Switzerland | 54 | 0.2% |
| Taiwan | 239 | 0.8% |
| Thailand | 43 | 0.1% |
| Trinidad and Tobago | 9 | 0.0% |
| Turkey | 64 | 0.2% |
| Ukraine | 127 | 0.4% |
| Uruguay | 13 | 0.0% |
| Vietnam | 156 | 0.5% |
| Western Asia | 141 | 0.5% |
| Western Europe | 306 | 1.0% |
| Zimbabwe | 10 | 0.0% | View All 81 Rows |
Sex and Age in San Carlos
Sex and Age in San Carlos
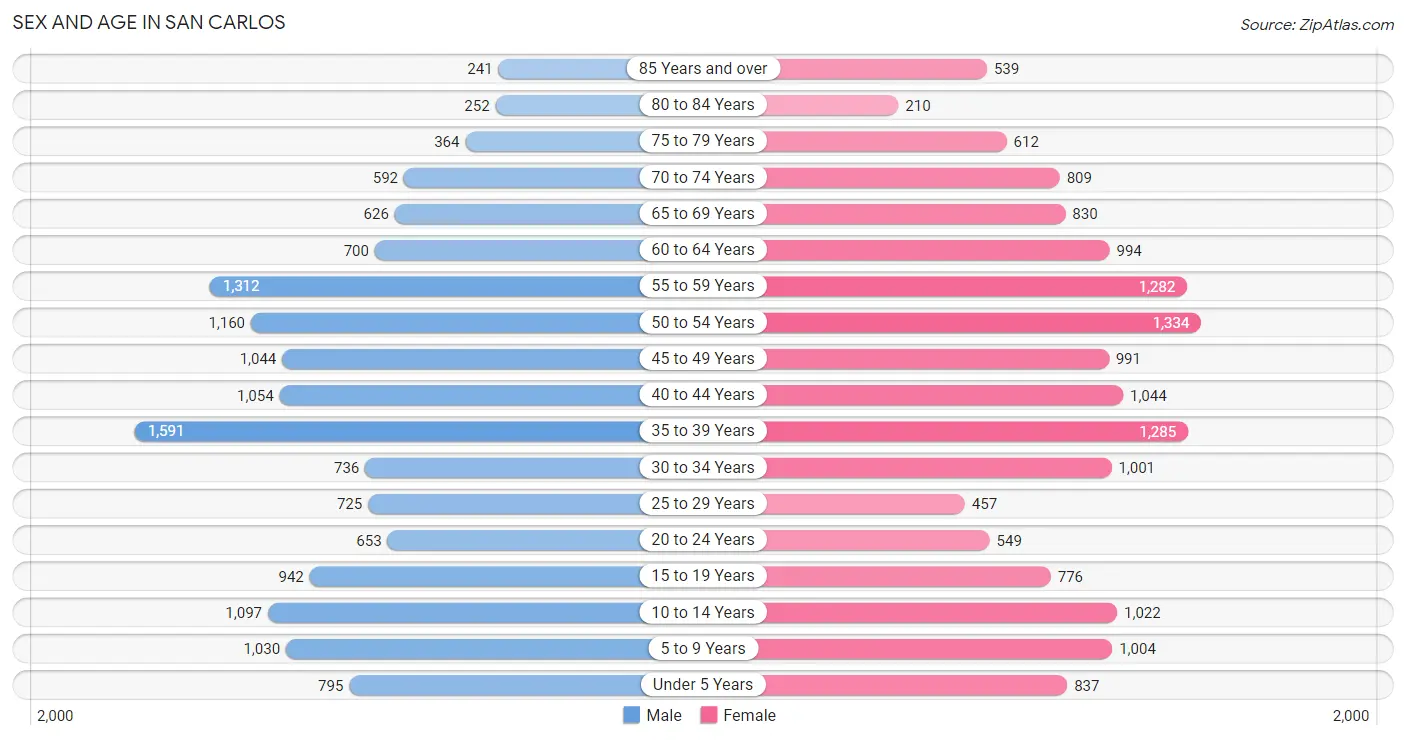
The most populous age groups in San Carlos are 35 to 39 Years (1,591 | 10.7%) for men and 50 to 54 Years (1,334 | 8.6%) for women.
| Age Bracket | Male | Female |
| Under 5 Years | 795 (5.3%) | 837 (5.4%) |
| 5 to 9 Years | 1,030 (6.9%) | 1,004 (6.5%) |
| 10 to 14 Years | 1,097 (7.4%) | 1,022 (6.6%) |
| 15 to 19 Years | 942 (6.3%) | 776 (5.0%) |
| 20 to 24 Years | 653 (4.4%) | 549 (3.5%) |
| 25 to 29 Years | 725 (4.9%) | 457 (2.9%) |
| 30 to 34 Years | 736 (4.9%) | 1,001 (6.4%) |
| 35 to 39 Years | 1,591 (10.7%) | 1,285 (8.3%) |
| 40 to 44 Years | 1,054 (7.1%) | 1,044 (6.7%) |
| 45 to 49 Years | 1,044 (7.0%) | 991 (6.4%) |
| 50 to 54 Years | 1,160 (7.8%) | 1,334 (8.6%) |
| 55 to 59 Years | 1,312 (8.8%) | 1,282 (8.2%) |
| 60 to 64 Years | 700 (4.7%) | 994 (6.4%) |
| 65 to 69 Years | 626 (4.2%) | 830 (5.3%) |
| 70 to 74 Years | 592 (4.0%) | 809 (5.2%) |
| 75 to 79 Years | 364 (2.4%) | 612 (3.9%) |
| 80 to 84 Years | 252 (1.7%) | 210 (1.3%) |
| 85 Years and over | 241 (1.6%) | 539 (3.5%) |
| Total | 14,914 (100.0%) | 15,576 (100.0%) |
Families and Households in San Carlos
Median Family Size in San Carlos
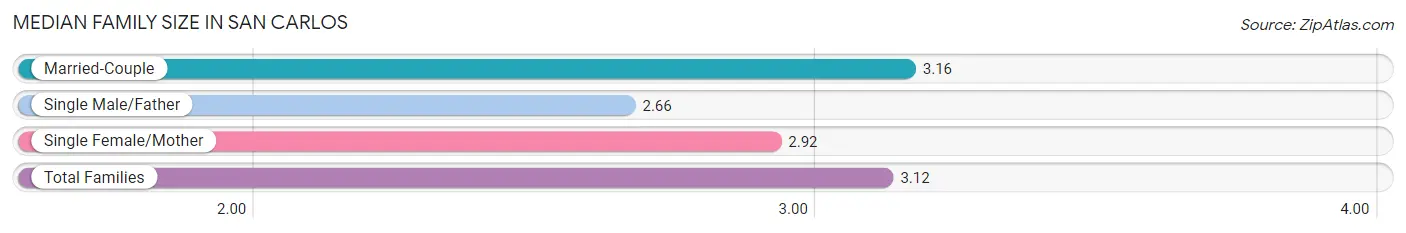
The median family size in San Carlos is 3.12 persons per family, with married-couple families (7,037 | 85.4%) accounting for the largest median family size of 3.16 persons per family. On the other hand, single male/father families (259 | 3.1%) represent the smallest median family size with 2.66 persons per family.
| Family Type | # Families | Family Size |
| Married-Couple | 7,037 (85.4%) | 3.16 |
| Single Male/Father | 259 (3.1%) | 2.66 |
| Single Female/Mother | 940 (11.4%) | 2.92 |
| Total Families | 8,236 (100.0%) | 3.12 |
Median Household Size in San Carlos
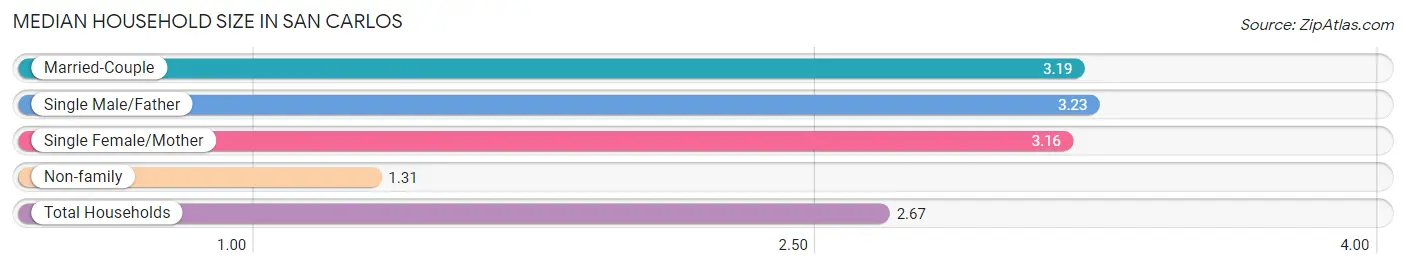
The median household size in San Carlos is 2.67 persons per household, with single male/father households (259 | 2.3%) accounting for the largest median household size of 3.23 persons per household. non-family households (3,125 | 27.5%) represent the smallest median household size with 1.31 persons per household.
| Household Type | # Households | Household Size |
| Married-Couple | 7,037 (61.9%) | 3.19 |
| Single Male/Father | 259 (2.3%) | 3.23 |
| Single Female/Mother | 940 (8.3%) | 3.16 |
| Non-family | 3,125 (27.5%) | 1.31 |
| Total Households | 11,361 (100.0%) | 2.67 |
Household Size by Marriage Status in San Carlos
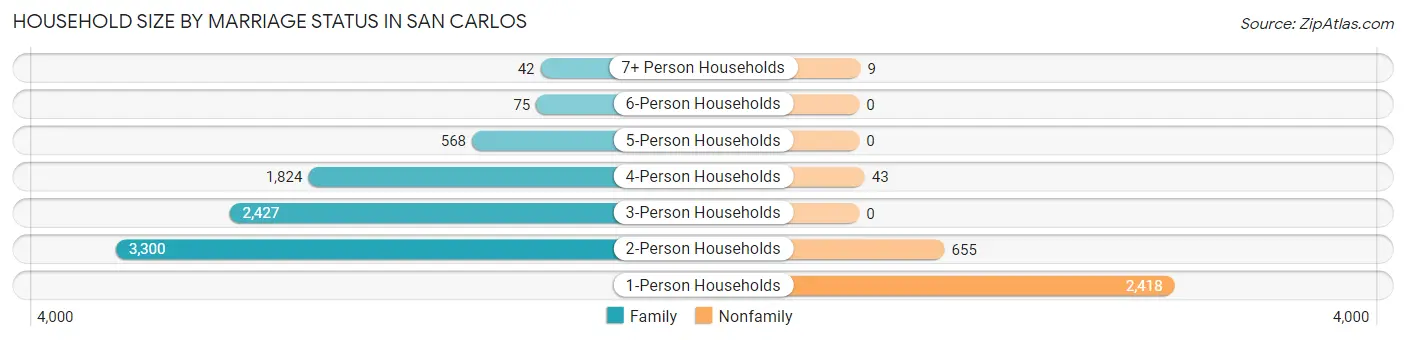
Out of a total of 11,361 households in San Carlos, 8,236 (72.5%) are family households, while 3,125 (27.5%) are nonfamily households. The most numerous type of family households are 2-person households, comprising 3,300, and the most common type of nonfamily households are 1-person households, comprising 2,418.
| Household Size | Family Households | Nonfamily Households |
| 1-Person Households | - | 2,418 (21.3%) |
| 2-Person Households | 3,300 (29.0%) | 655 (5.8%) |
| 3-Person Households | 2,427 (21.4%) | 0 (0.0%) |
| 4-Person Households | 1,824 (16.1%) | 43 (0.4%) |
| 5-Person Households | 568 (5.0%) | 0 (0.0%) |
| 6-Person Households | 75 (0.7%) | 0 (0.0%) |
| 7+ Person Households | 42 (0.4%) | 9 (0.1%) |
| Total | 8,236 (72.5%) | 3,125 (27.5%) |
Female Fertility in San Carlos
Fertility by Age in San Carlos
Average fertility rate in San Carlos is 72.0 births per 1,000 women. Women in the age bracket of 20 to 34 years have the highest fertility rate with 139.0 births per 1,000 women. Women in the age bracket of 20 to 34 years acount for 60.1% of all women with births.
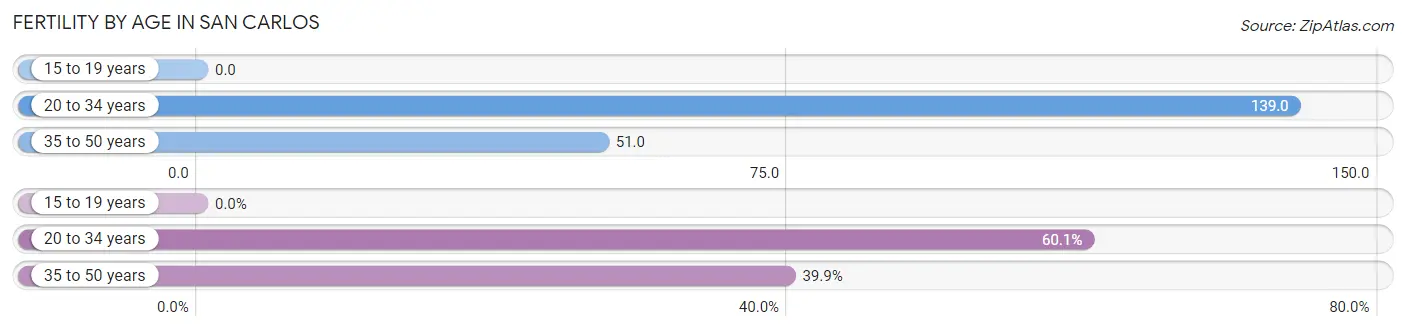
| Age Bracket | Women with Births | Births / 1,000 Women |
| 15 to 19 years | 0 (0.0%) | 0.0 |
| 20 to 34 years | 279 (60.1%) | 139.0 |
| 35 to 50 years | 185 (39.9%) | 51.0 |
| Total | 464 (100.0%) | 72.0 |
Fertility by Age by Marriage Status in San Carlos
89.7% of women with births (464) in San Carlos are married. The highest percentage of unmarried women with births falls into 35 to 50 years age bracket with 26.0% of them unmarried at the time of birth, while the lowest percentage of unmarried women with births belong to 20 to 34 years age bracket with 0.0% of them unmarried.
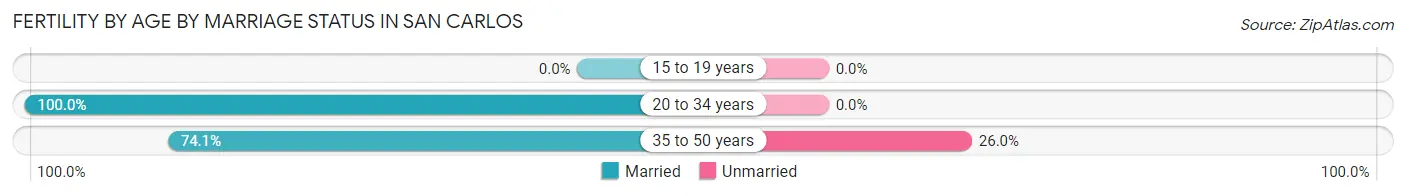
| Age Bracket | Married | Unmarried |
| 15 to 19 years | 0 (0.0%) | 0 (0.0%) |
| 20 to 34 years | 279 (100.0%) | 0 (0.0%) |
| 35 to 50 years | 137 (74.1%) | 48 (26.0%) |
| Total | 416 (89.7%) | 48 (10.3%) |
Fertility by Education in San Carlos
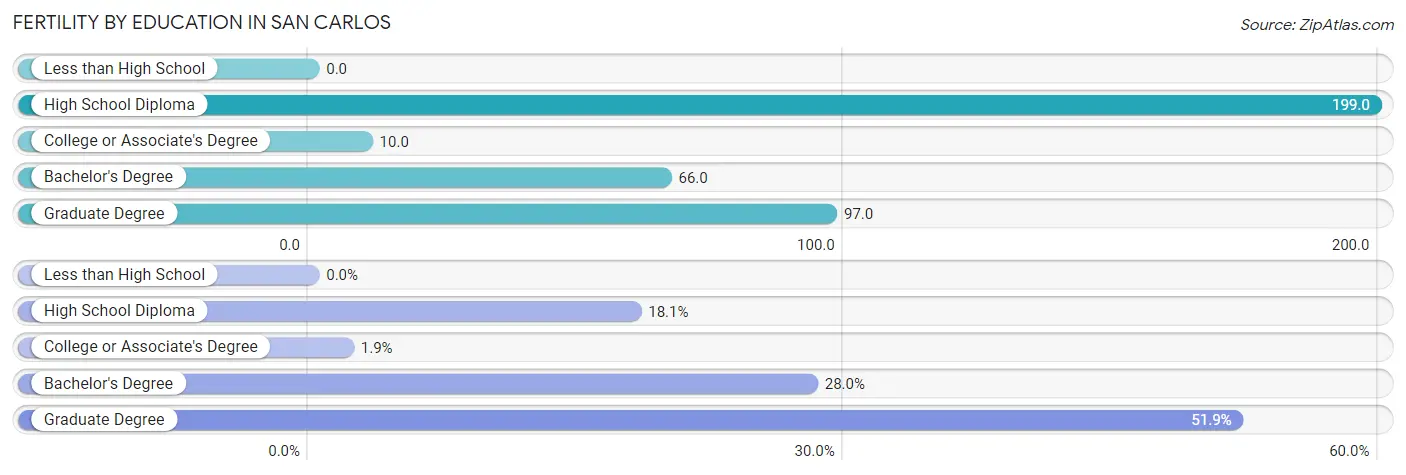
| Educational Attainment | Women with Births | Births / 1,000 Women |
| Less than High School | 0 (0.0%) | 0.0 |
| High School Diploma | 84 (18.1%) | 199.0 |
| College or Associate's Degree | 9 (1.9%) | 10.0 |
| Bachelor's Degree | 130 (28.0%) | 66.0 |
| Graduate Degree | 241 (51.9%) | 97.0 |
| Total | 464 (100.0%) | 72.0 |
Fertility by Education by Marriage Status in San Carlos
10.3% of women with births in San Carlos are unmarried. Women with the educational attainment of college or associate's degree are most likely to be married with 100.0% of them married at childbirth, while women with the educational attainment of high school diploma are least likely to be married with 57.1% of them unmarried at childbirth.
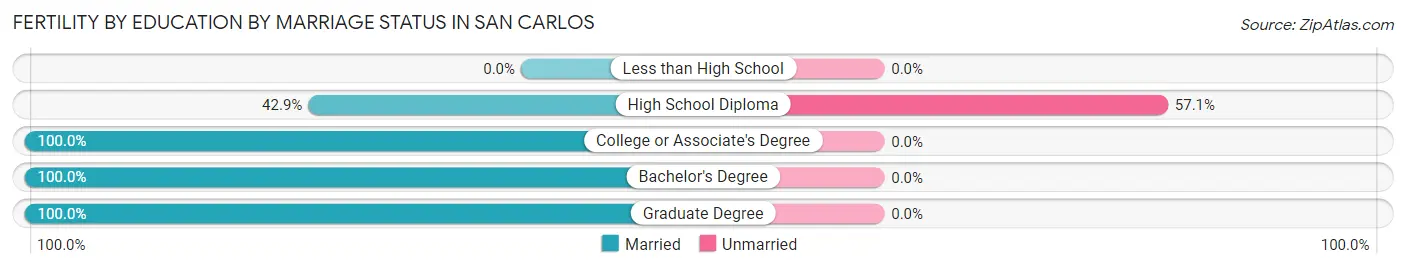
| Educational Attainment | Married | Unmarried |
| Less than High School | 0 (0.0%) | 0 (0.0%) |
| High School Diploma | 36 (42.9%) | 48 (57.1%) |
| College or Associate's Degree | 9 (100.0%) | 0 (0.0%) |
| Bachelor's Degree | 130 (100.0%) | 0 (0.0%) |
| Graduate Degree | 241 (100.0%) | 0 (0.0%) |
| Total | 416 (89.7%) | 48 (10.3%) |
Employment Characteristics in San Carlos
Employment by Class of Employer in San Carlos
Among the 16,338 employed individuals in San Carlos, private company employees (11,742 | 71.9%), not-for-profit organizations (1,334 | 8.2%), and self-employed (not incorporated) (1,150 | 7.0%) make up the most common classes of employment.
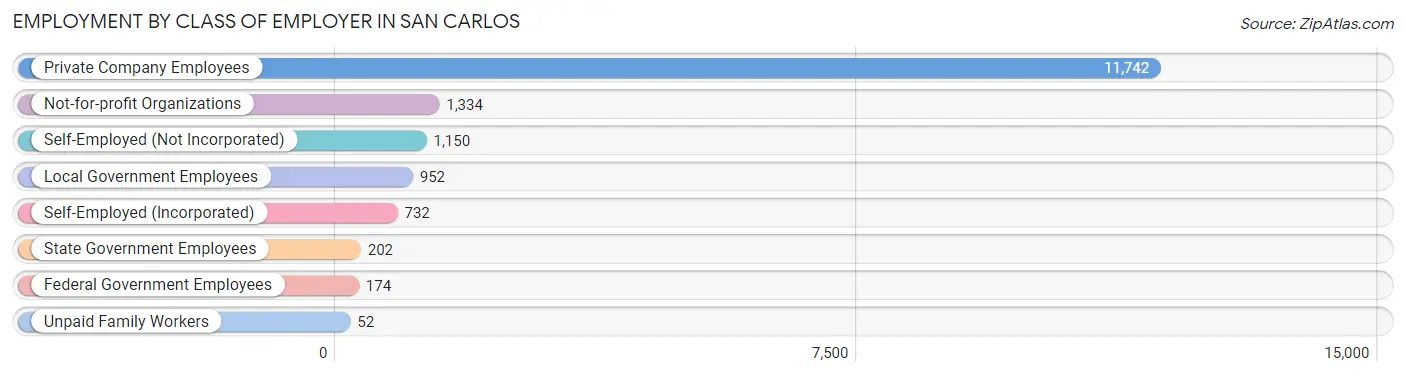
| Employer Class | # Employees | % Employees |
| Private Company Employees | 11,742 | 71.9% |
| Self-Employed (Incorporated) | 732 | 4.5% |
| Self-Employed (Not Incorporated) | 1,150 | 7.0% |
| Not-for-profit Organizations | 1,334 | 8.2% |
| Local Government Employees | 952 | 5.8% |
| State Government Employees | 202 | 1.2% |
| Federal Government Employees | 174 | 1.1% |
| Unpaid Family Workers | 52 | 0.3% |
| Total | 16,338 | 100.0% |
Employment Status by Age in San Carlos
According to the labor force statistics for San Carlos, out of the total population over 16 years of age (24,333), 70.9% or 17,252 individuals are in the labor force, with 4.1% or 707 of them unemployed. The age group with the highest labor force participation rate is 30 to 34 years, with 93.8% or 1,629 individuals in the labor force. Within the labor force, the 20 to 24 years age range has the highest percentage of unemployed individuals, with 9.4% or 69 of them being unemployed.
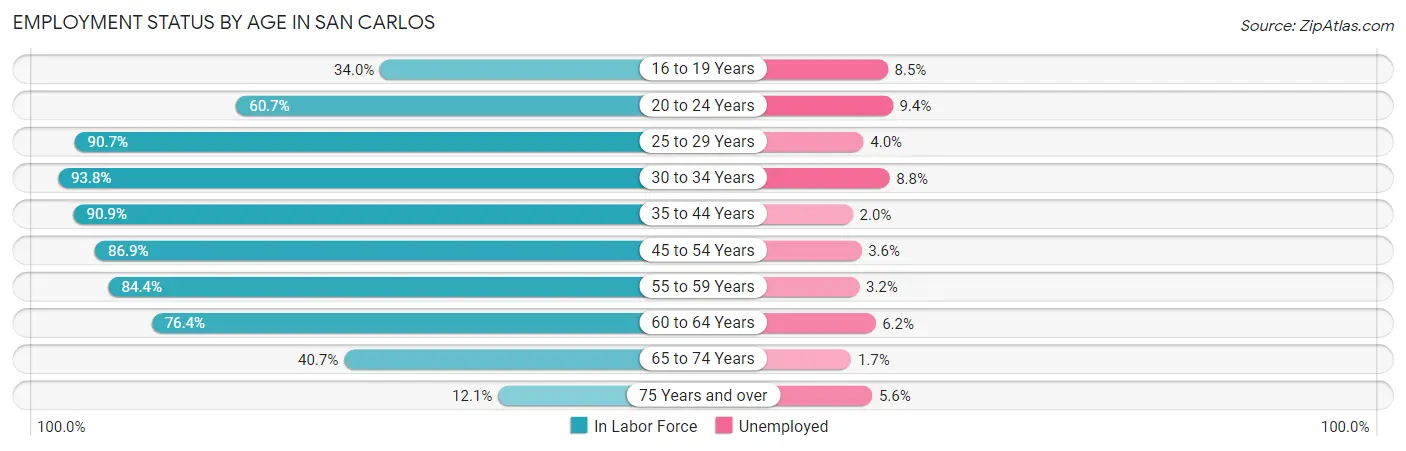
| Age Bracket | In Labor Force | Unemployed |
| 16 to 19 Years | 458 (34.0%) | 39 (8.5%) |
| 20 to 24 Years | 730 (60.7%) | 69 (9.4%) |
| 25 to 29 Years | 1,072 (90.7%) | 43 (4.0%) |
| 30 to 34 Years | 1,629 (93.8%) | 143 (8.8%) |
| 35 to 44 Years | 4,521 (90.9%) | 90 (2.0%) |
| 45 to 54 Years | 3,936 (86.9%) | 142 (3.6%) |
| 55 to 59 Years | 2,189 (84.4%) | 70 (3.2%) |
| 60 to 64 Years | 1,294 (76.4%) | 80 (6.2%) |
| 65 to 74 Years | 1,163 (40.7%) | 20 (1.7%) |
| 75 Years and over | 268 (12.1%) | 15 (5.6%) |
| Total | 17,252 (70.9%) | 707 (4.1%) |
Employment Status by Educational Attainment in San Carlos
According to labor force statistics for San Carlos, 87.6% of individuals (14,638) out of the total population between 25 and 64 years of age (16,710) are in the labor force, with 3.9% or 571 of them being unemployed. The group with the highest labor force participation rate are those with the educational attainment of bachelor's degree or higher, with 90.2% or 10,676 individuals in the labor force. Within the labor force, individuals with college / associate degree education have the highest percentage of unemployment, with 8.3% or 222 of them being unemployed.
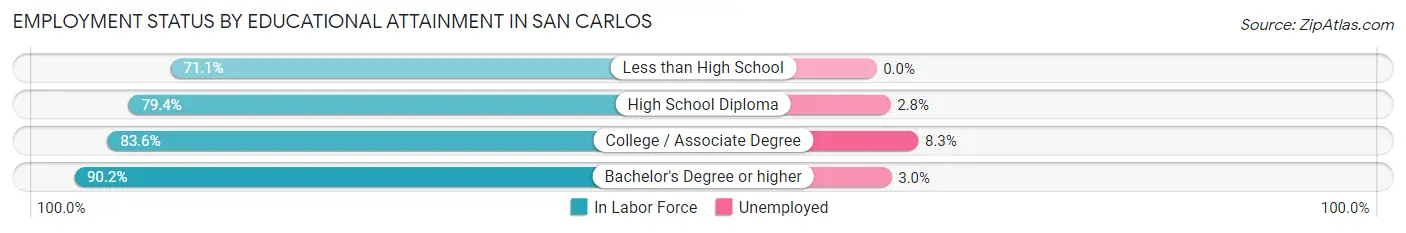
| Educational Attainment | In Labor Force | Unemployed |
| Less than High School | 330 (71.1%) | 0 (0.0%) |
| High School Diploma | 967 (79.4%) | 34 (2.8%) |
| College / Associate Degree | 2,669 (83.6%) | 265 (8.3%) |
| Bachelor's Degree or higher | 10,676 (90.2%) | 355 (3.0%) |
| Total | 14,638 (87.6%) | 652 (3.9%) |
Employment Occupations by Sex in San Carlos
Management, Business, Science and Arts Occupations
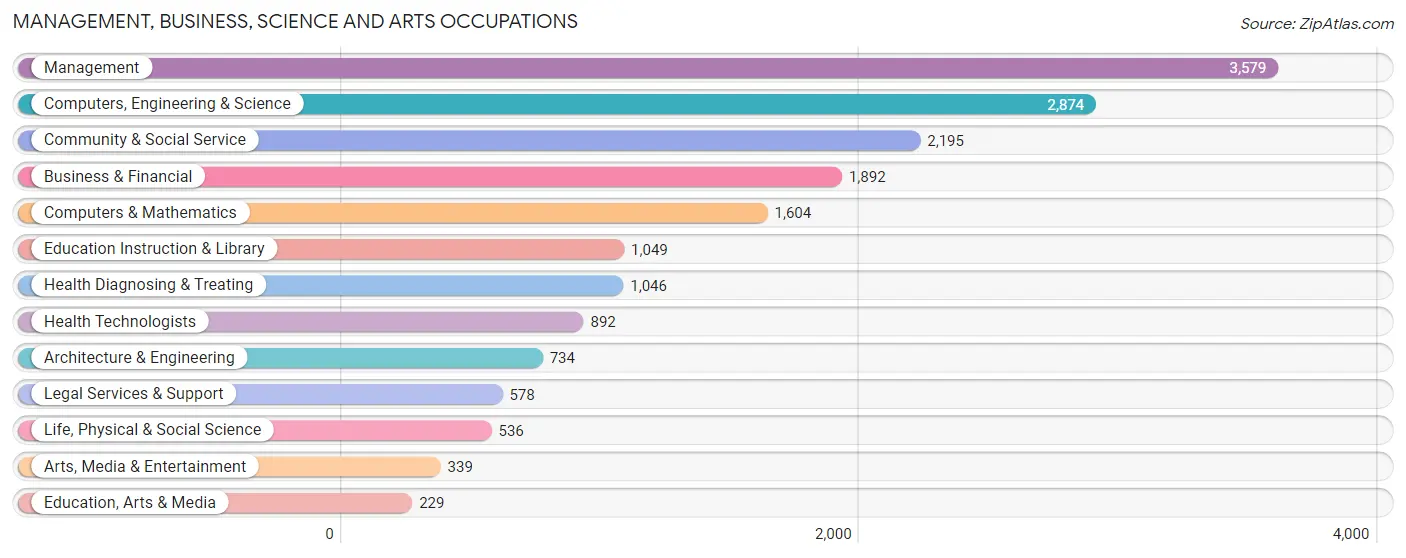
The most common Management, Business, Science and Arts occupations in San Carlos are Management (3,579 | 21.6%), Computers, Engineering & Science (2,874 | 17.4%), Community & Social Service (2,195 | 13.3%), Business & Financial (1,892 | 11.4%), and Computers & Mathematics (1,604 | 9.7%).
Management, Business, Science and Arts Occupations by Sex
Within the Management, Business, Science and Arts occupations in San Carlos, the most male-oriented occupations are Computers & Mathematics (77.0%), Architecture & Engineering (77.0%), and Computers, Engineering & Science (72.9%), while the most female-oriented occupations are Health Diagnosing & Treating (73.5%), Education, Arts & Media (73.4%), and Health Technologists (72.7%).
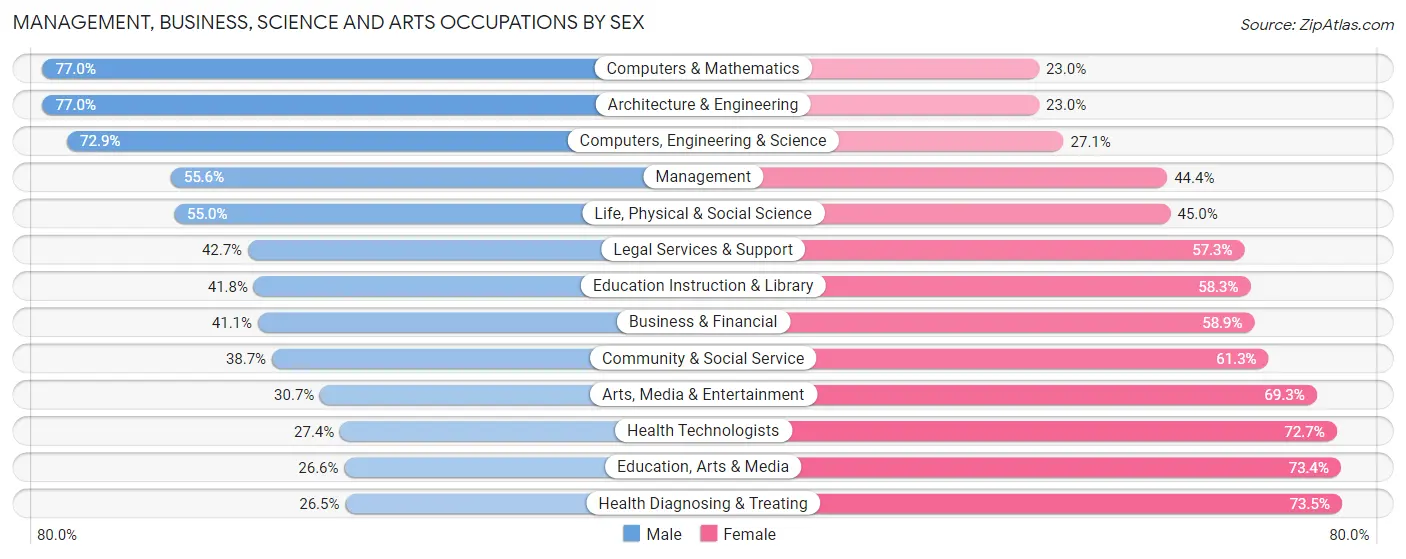
| Occupation | Male | Female |
| Management | 1,990 (55.6%) | 1,589 (44.4%) |
| Business & Financial | 777 (41.1%) | 1,115 (58.9%) |
| Computers, Engineering & Science | 2,095 (72.9%) | 779 (27.1%) |
| Computers & Mathematics | 1,235 (77.0%) | 369 (23.0%) |
| Architecture & Engineering | 565 (77.0%) | 169 (23.0%) |
| Life, Physical & Social Science | 295 (55.0%) | 241 (45.0%) |
| Community & Social Service | 850 (38.7%) | 1,345 (61.3%) |
| Education, Arts & Media | 61 (26.6%) | 168 (73.4%) |
| Legal Services & Support | 247 (42.7%) | 331 (57.3%) |
| Education Instruction & Library | 438 (41.7%) | 611 (58.3%) |
| Arts, Media & Entertainment | 104 (30.7%) | 235 (69.3%) |
| Health Diagnosing & Treating | 277 (26.5%) | 769 (73.5%) |
| Health Technologists | 244 (27.4%) | 648 (72.7%) |
| Total (Category) | 5,989 (51.7%) | 5,597 (48.3%) |
| Total (Overall) | 8,592 (51.9%) | 7,950 (48.1%) |
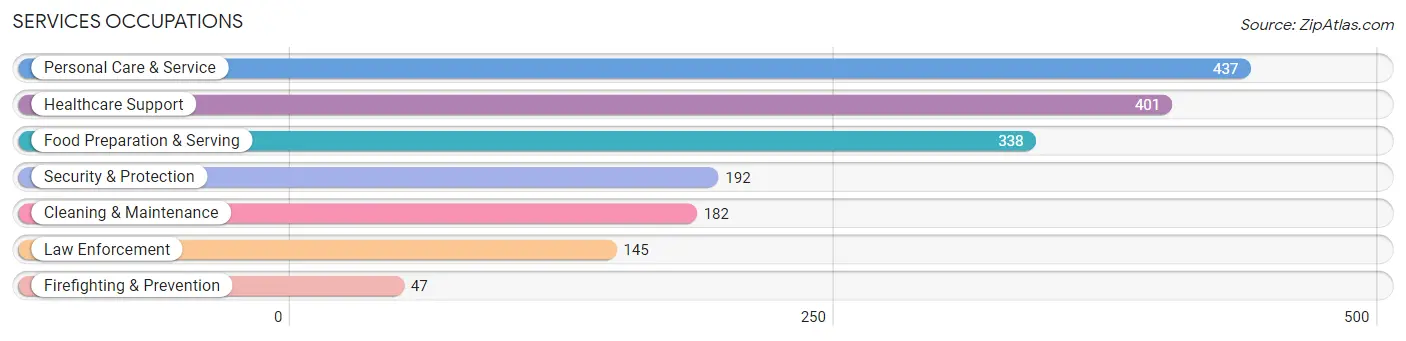
Services Occupations
The most common Services occupations in San Carlos are Personal Care & Service (437 | 2.6%), Healthcare Support (401 | 2.4%), Food Preparation & Serving (338 | 2.0%), Security & Protection (192 | 1.2%), and Cleaning & Maintenance (182 | 1.1%).
Services Occupations by Sex
Within the Services occupations in San Carlos, the most male-oriented occupations are Law Enforcement (100.0%), Security & Protection (93.2%), and Firefighting & Prevention (72.3%), while the most female-oriented occupations are Personal Care & Service (75.5%), Healthcare Support (70.8%), and Food Preparation & Serving (56.2%).
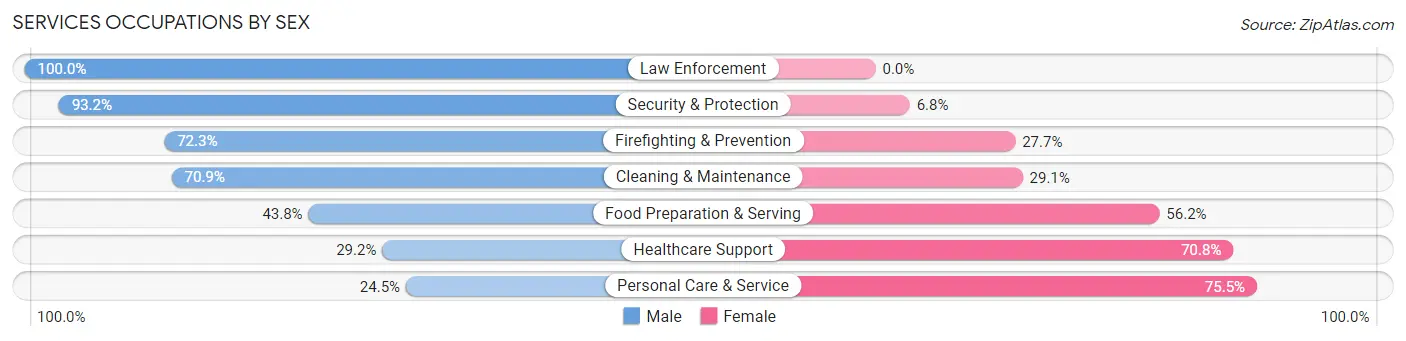
| Occupation | Male | Female |
| Healthcare Support | 117 (29.2%) | 284 (70.8%) |
| Security & Protection | 179 (93.2%) | 13 (6.8%) |
| Firefighting & Prevention | 34 (72.3%) | 13 (27.7%) |
| Law Enforcement | 145 (100.0%) | 0 (0.0%) |
| Food Preparation & Serving | 148 (43.8%) | 190 (56.2%) |
| Cleaning & Maintenance | 129 (70.9%) | 53 (29.1%) |
| Personal Care & Service | 107 (24.5%) | 330 (75.5%) |
| Total (Category) | 680 (43.9%) | 870 (56.1%) |
| Total (Overall) | 8,592 (51.9%) | 7,950 (48.1%) |
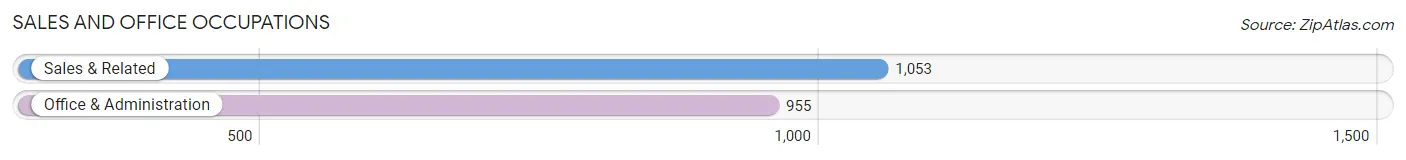
Sales and Office Occupations
The most common Sales and Office occupations in San Carlos are Sales & Related (1,053 | 6.4%), and Office & Administration (955 | 5.8%).
Sales and Office Occupations by Sex
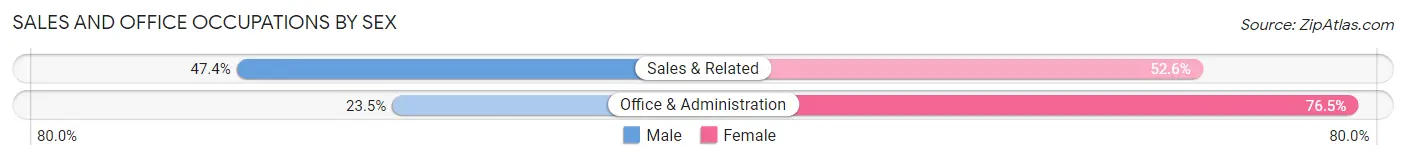
| Occupation | Male | Female |
| Sales & Related | 499 (47.4%) | 554 (52.6%) |
| Office & Administration | 224 (23.5%) | 731 (76.5%) |
| Total (Category) | 723 (36.0%) | 1,285 (64.0%) |
| Total (Overall) | 8,592 (51.9%) | 7,950 (48.1%) |
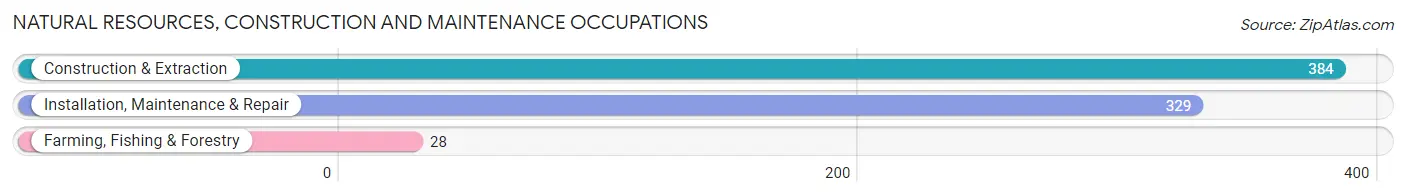
Natural Resources, Construction and Maintenance Occupations
The most common Natural Resources, Construction and Maintenance occupations in San Carlos are Construction & Extraction (384 | 2.3%), Installation, Maintenance & Repair (329 | 2.0%), and Farming, Fishing & Forestry (28 | 0.2%).
Natural Resources, Construction and Maintenance Occupations by Sex
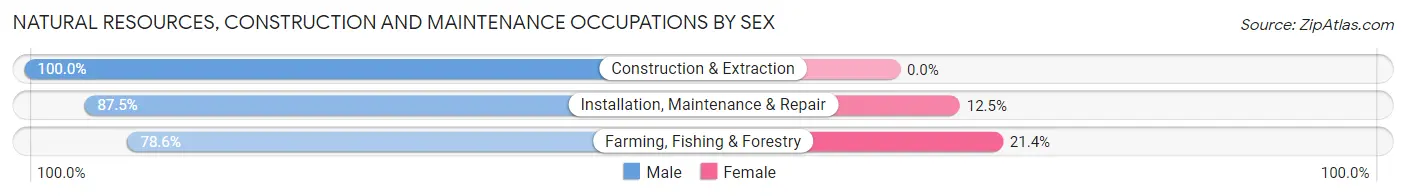
| Occupation | Male | Female |
| Farming, Fishing & Forestry | 22 (78.6%) | 6 (21.4%) |
| Construction & Extraction | 384 (100.0%) | 0 (0.0%) |
| Installation, Maintenance & Repair | 288 (87.5%) | 41 (12.5%) |
| Total (Category) | 694 (93.7%) | 47 (6.3%) |
| Total (Overall) | 8,592 (51.9%) | 7,950 (48.1%) |
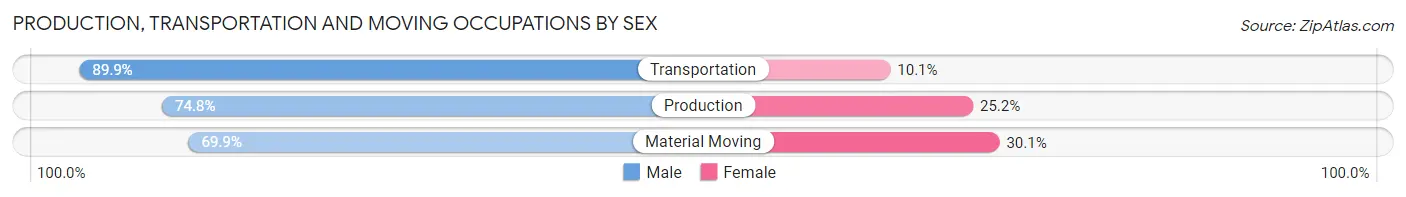
Production, Transportation and Moving Occupations
The most common Production, Transportation and Moving occupations in San Carlos are Material Moving (256 | 1.5%), Production (222 | 1.3%), and Transportation (179 | 1.1%).
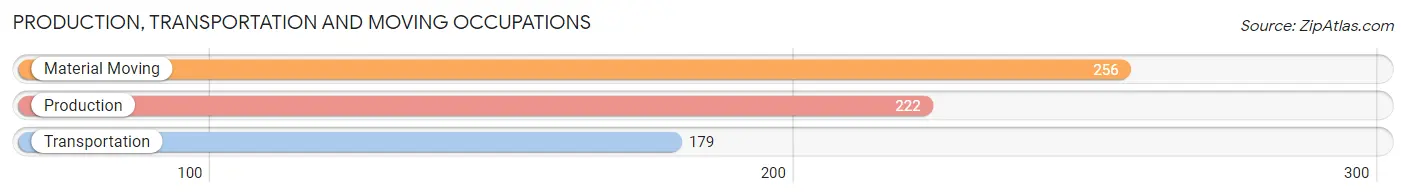
Production, Transportation and Moving Occupations by Sex
| Occupation | Male | Female |
| Production | 166 (74.8%) | 56 (25.2%) |
| Transportation | 161 (89.9%) | 18 (10.1%) |
| Material Moving | 179 (69.9%) | 77 (30.1%) |
| Total (Category) | 506 (77.0%) | 151 (23.0%) |
| Total (Overall) | 8,592 (51.9%) | 7,950 (48.1%) |
Employment Industries by Sex in San Carlos
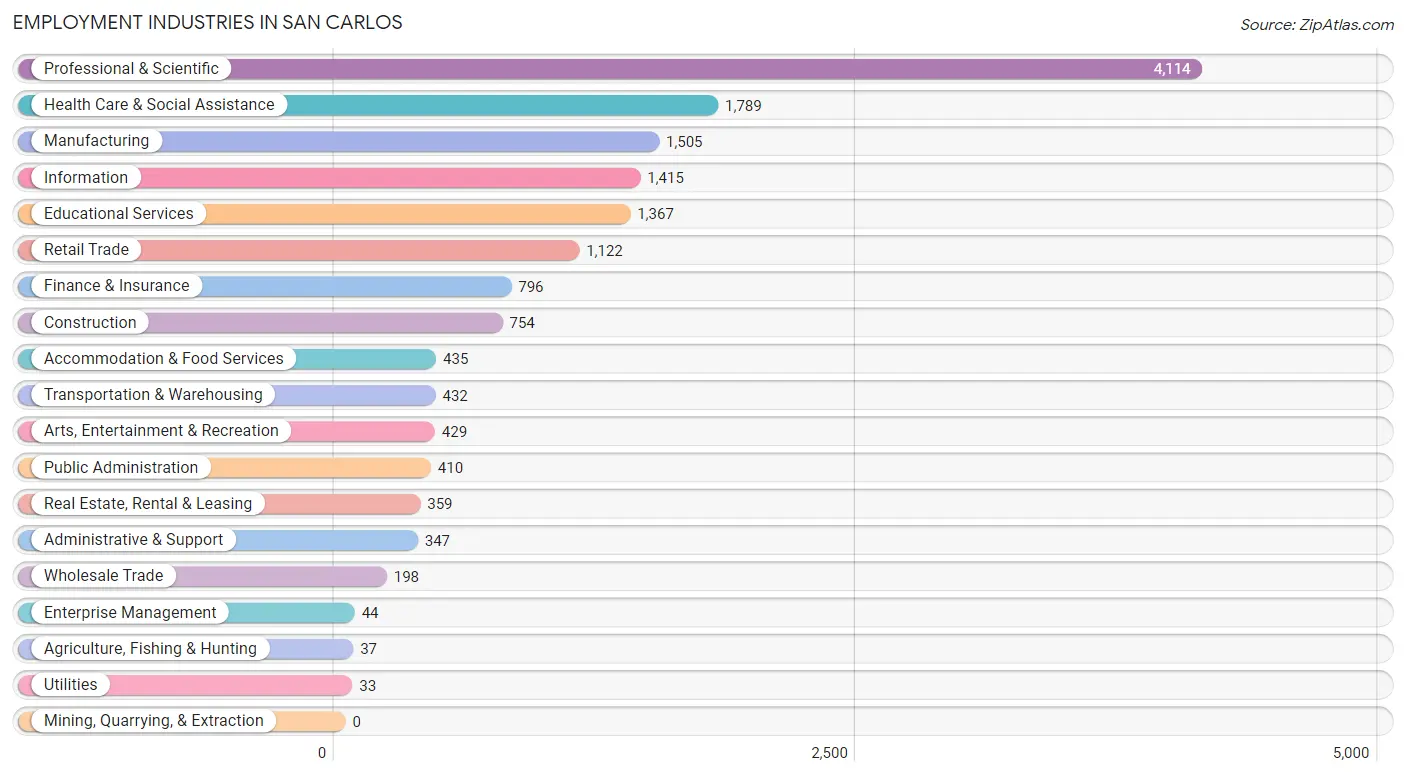
Employment Industries in San Carlos
The major employment industries in San Carlos include Professional & Scientific (4,114 | 24.9%), Health Care & Social Assistance (1,789 | 10.8%), Manufacturing (1,505 | 9.1%), Information (1,415 | 8.6%), and Educational Services (1,367 | 8.3%).
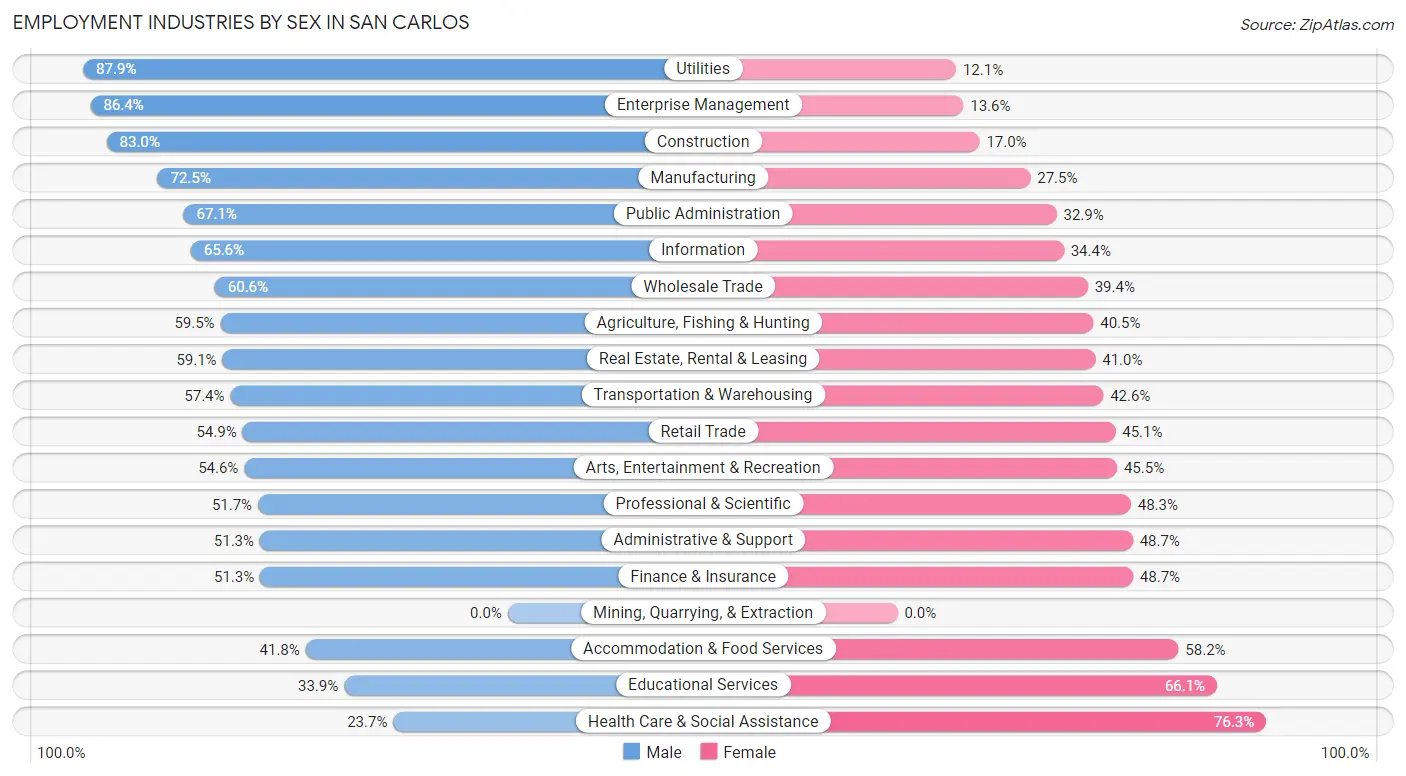
Employment Industries by Sex in San Carlos
The San Carlos industries that see more men than women are Utilities (87.9%), Enterprise Management (86.4%), and Construction (83.0%), whereas the industries that tend to have a higher number of women are Health Care & Social Assistance (76.3%), Educational Services (66.1%), and Accommodation & Food Services (58.2%).
| Industry | Male | Female |
| Agriculture, Fishing & Hunting | 22 (59.5%) | 15 (40.5%) |
| Mining, Quarrying, & Extraction | 0 (0.0%) | 0 (0.0%) |
| Construction | 626 (83.0%) | 128 (17.0%) |
| Manufacturing | 1,091 (72.5%) | 414 (27.5%) |
| Wholesale Trade | 120 (60.6%) | 78 (39.4%) |
| Retail Trade | 616 (54.9%) | 506 (45.1%) |
| Transportation & Warehousing | 248 (57.4%) | 184 (42.6%) |
| Utilities | 29 (87.9%) | 4 (12.1%) |
| Information | 928 (65.6%) | 487 (34.4%) |
| Finance & Insurance | 408 (51.3%) | 388 (48.7%) |
| Real Estate, Rental & Leasing | 212 (59.1%) | 147 (40.9%) |
| Professional & Scientific | 2,127 (51.7%) | 1,987 (48.3%) |
| Enterprise Management | 38 (86.4%) | 6 (13.6%) |
| Administrative & Support | 178 (51.3%) | 169 (48.7%) |
| Educational Services | 463 (33.9%) | 904 (66.1%) |
| Health Care & Social Assistance | 424 (23.7%) | 1,365 (76.3%) |
| Arts, Entertainment & Recreation | 234 (54.5%) | 195 (45.5%) |
| Accommodation & Food Services | 182 (41.8%) | 253 (58.2%) |
| Public Administration | 275 (67.1%) | 135 (32.9%) |
| Total | 8,592 (51.9%) | 7,950 (48.1%) |
Education in San Carlos
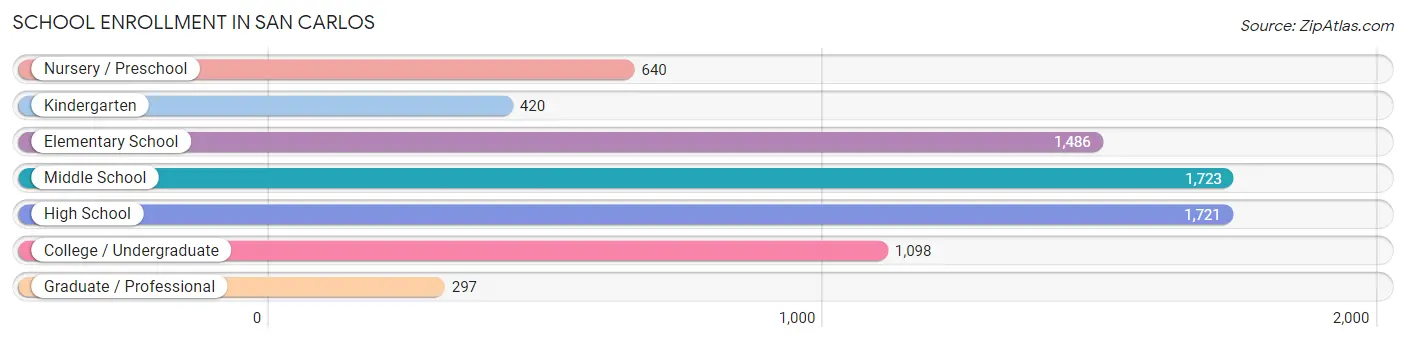
School Enrollment in San Carlos
The most common levels of schooling among the 7,385 students in San Carlos are middle school (1,723 | 23.3%), high school (1,721 | 23.3%), and elementary school (1,486 | 20.1%).
| School Level | # Students | % Students |
| Nursery / Preschool | 640 | 8.7% |
| Kindergarten | 420 | 5.7% |
| Elementary School | 1,486 | 20.1% |
| Middle School | 1,723 | 23.3% |
| High School | 1,721 | 23.3% |
| College / Undergraduate | 1,098 | 14.9% |
| Graduate / Professional | 297 | 4.0% |
| Total | 7,385 | 100.0% |
School Enrollment by Age by Funding Source in San Carlos
Out of a total of 7,385 students who are enrolled in schools in San Carlos, 1,470 (19.9%) attend a private institution, while the remaining 5,915 (80.1%) are enrolled in public schools. The age group of 3 to 4 year olds has the highest likelihood of being enrolled in private schools, with 357 (78.3% in the age bracket) enrolled. Conversely, the age group of 20 to 24 year olds has the lowest likelihood of being enrolled in a private school, with 574 (93.5% in the age bracket) attending a public institution.
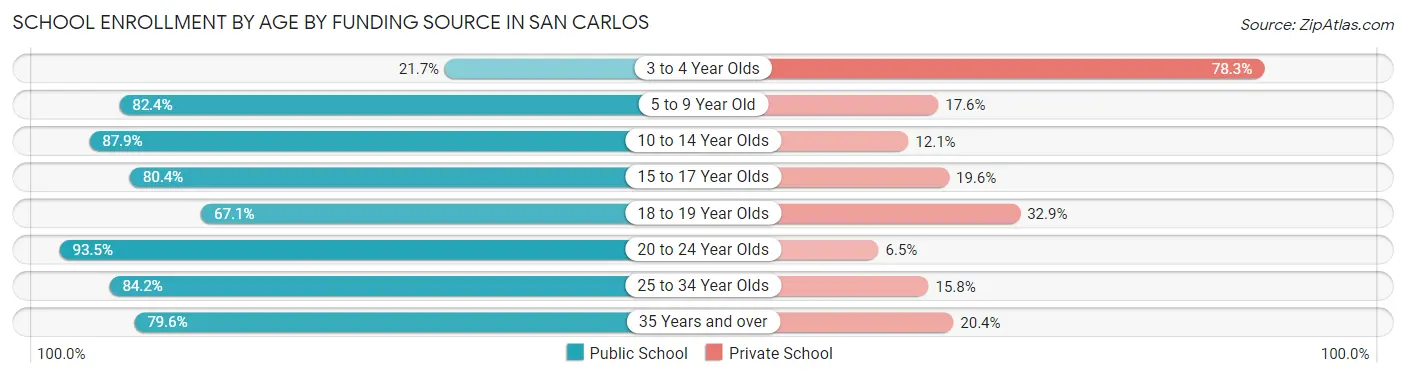
| Age Bracket | Public School | Private School |
| 3 to 4 Year Olds | 99 (21.7%) | 357 (78.3%) |
| 5 to 9 Year Old | 1,629 (82.4%) | 349 (17.6%) |
| 10 to 14 Year Olds | 1,845 (87.9%) | 253 (12.1%) |
| 15 to 17 Year Olds | 1,049 (80.4%) | 256 (19.6%) |
| 18 to 19 Year Olds | 202 (67.1%) | 99 (32.9%) |
| 20 to 24 Year Olds | 574 (93.5%) | 40 (6.5%) |
| 25 to 34 Year Olds | 261 (84.2%) | 49 (15.8%) |
| 35 Years and over | 257 (79.6%) | 66 (20.4%) |
| Total | 5,915 (80.1%) | 1,470 (19.9%) |
Educational Attainment by Field of Study in San Carlos
Engineering (2,242 | 14.2%), business (2,111 | 13.4%), social sciences (1,981 | 12.6%), computers & mathematics (1,655 | 10.5%), and bio, nature & agricultural (1,616 | 10.3%) are the most common fields of study among 15,747 individuals in San Carlos who have obtained a bachelor's degree or higher.
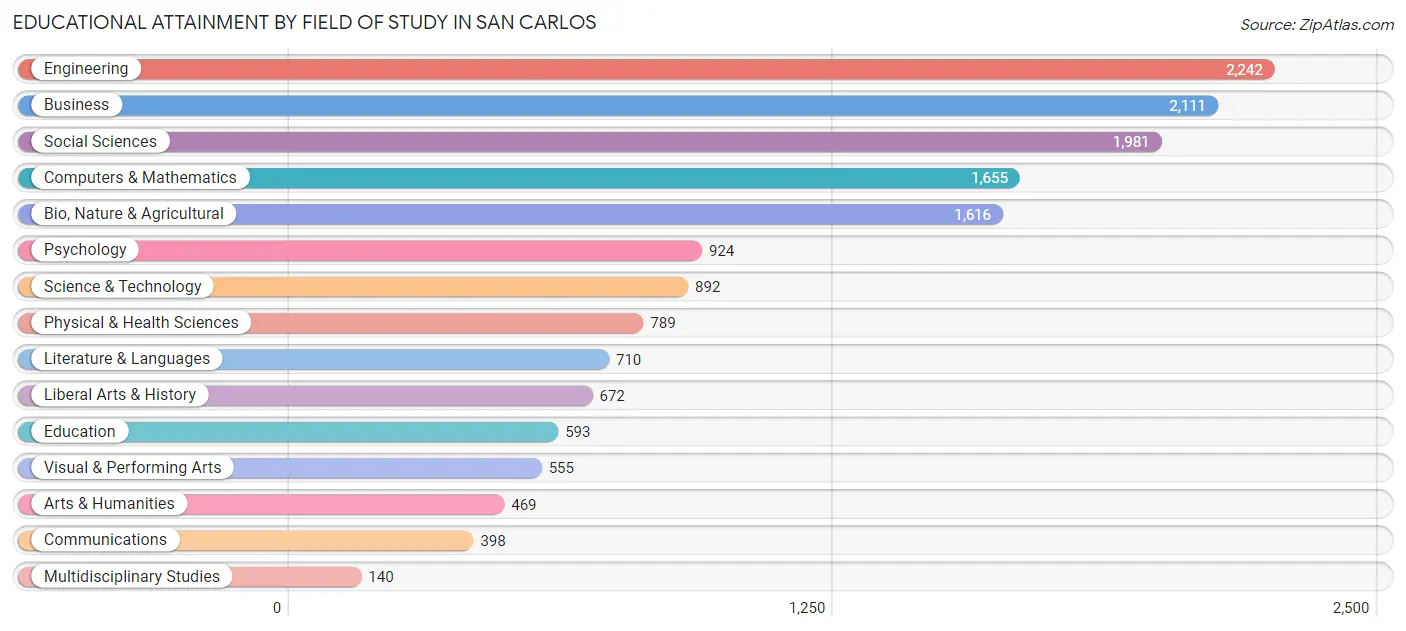
| Field of Study | # Graduates | % Graduates |
| Computers & Mathematics | 1,655 | 10.5% |
| Bio, Nature & Agricultural | 1,616 | 10.3% |
| Physical & Health Sciences | 789 | 5.0% |
| Psychology | 924 | 5.9% |
| Social Sciences | 1,981 | 12.6% |
| Engineering | 2,242 | 14.2% |
| Multidisciplinary Studies | 140 | 0.9% |
| Science & Technology | 892 | 5.7% |
| Business | 2,111 | 13.4% |
| Education | 593 | 3.8% |
| Literature & Languages | 710 | 4.5% |
| Liberal Arts & History | 672 | 4.3% |
| Visual & Performing Arts | 555 | 3.5% |
| Communications | 398 | 2.5% |
| Arts & Humanities | 469 | 3.0% |
| Total | 15,747 | 100.0% |
Transportation & Commute in San Carlos
Vehicle Availability by Sex in San Carlos
The most prevalent vehicle ownership categories in San Carlos are males with 2 vehicles (4,446, accounting for 52.2%) and females with 2 vehicles (3,501, making up 57.4%).
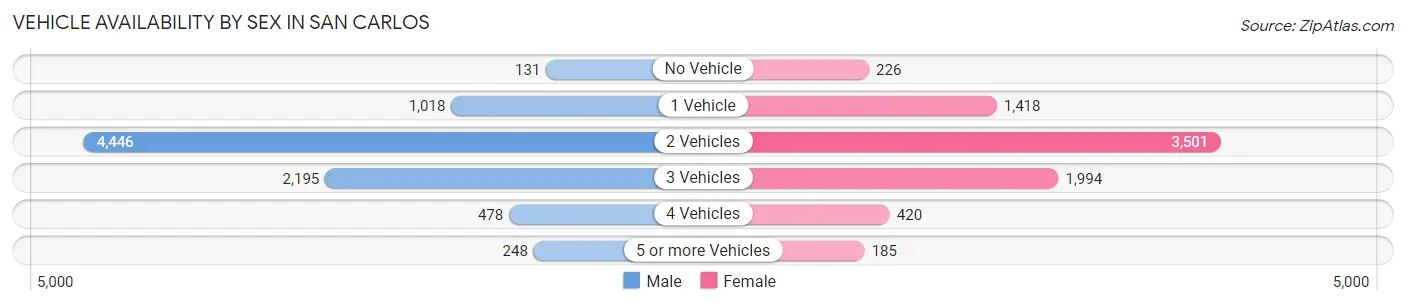
| Vehicles Available | Male | Female |
| No Vehicle | 131 (1.5%) | 226 (2.9%) |
| 1 Vehicle | 1,018 (11.9%) | 1,418 (18.3%) |
| 2 Vehicles | 4,446 (52.2%) | 3,501 (45.2%) |
| 3 Vehicles | 2,195 (25.8%) | 1,994 (25.8%) |
| 4 Vehicles | 478 (5.6%) | 420 (5.4%) |
| 5 or more Vehicles | 248 (2.9%) | 185 (2.4%) |
| Total | 8,516 (100.0%) | 7,744 (100.0%) |
Commute Time in San Carlos
The most frequently occuring commute durations in San Carlos are 15 to 19 minutes (1,773 commuters, 15.2%), 30 to 34 minutes (1,676 commuters, 14.4%), and 20 to 24 minutes (1,545 commuters, 13.3%).
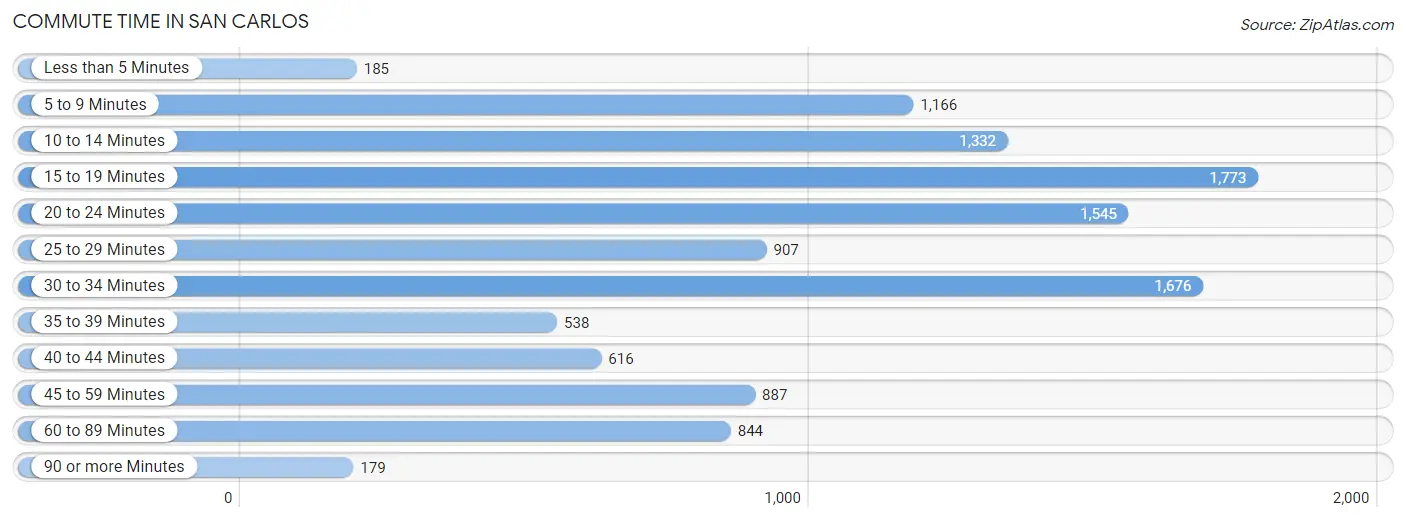
| Commute Time | # Commuters | % Commuters |
| Less than 5 Minutes | 185 | 1.6% |
| 5 to 9 Minutes | 1,166 | 10.0% |
| 10 to 14 Minutes | 1,332 | 11.4% |
| 15 to 19 Minutes | 1,773 | 15.2% |
| 20 to 24 Minutes | 1,545 | 13.3% |
| 25 to 29 Minutes | 907 | 7.8% |
| 30 to 34 Minutes | 1,676 | 14.4% |
| 35 to 39 Minutes | 538 | 4.6% |
| 40 to 44 Minutes | 616 | 5.3% |
| 45 to 59 Minutes | 887 | 7.6% |
| 60 to 89 Minutes | 844 | 7.2% |
| 90 or more Minutes | 179 | 1.5% |
Commute Time by Sex in San Carlos
The most common commute times in San Carlos are 30 to 34 minutes (962 commuters, 15.4%) for males and 15 to 19 minutes (929 commuters, 17.2%) for females.
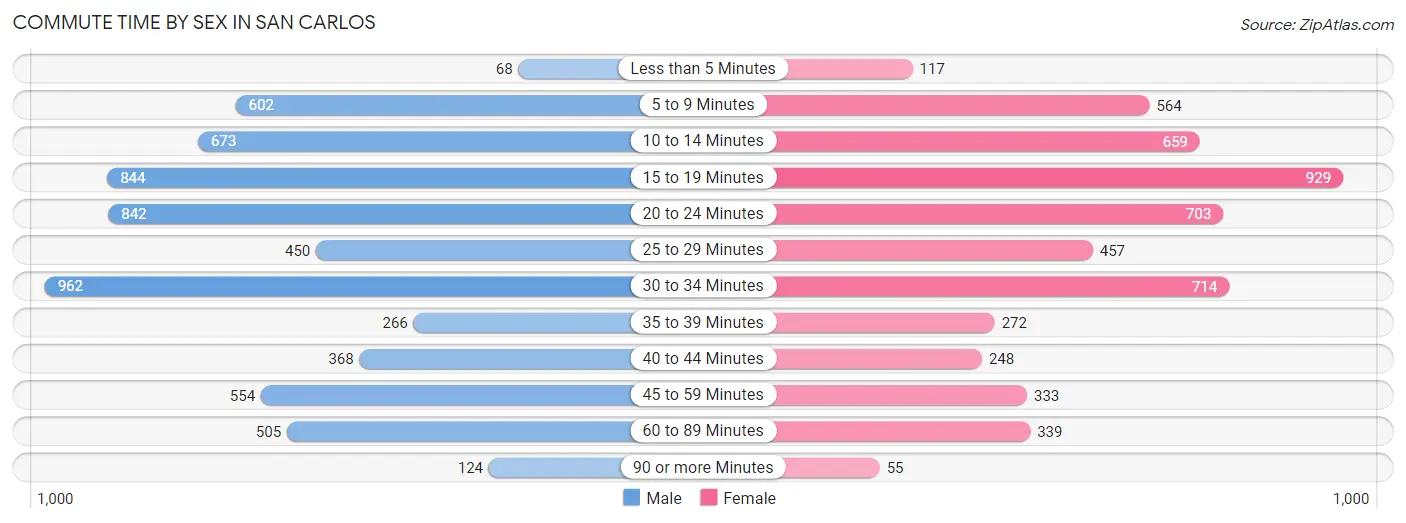
| Commute Time | Male | Female |
| Less than 5 Minutes | 68 (1.1%) | 117 (2.2%) |
| 5 to 9 Minutes | 602 (9.6%) | 564 (10.5%) |
| 10 to 14 Minutes | 673 (10.7%) | 659 (12.2%) |
| 15 to 19 Minutes | 844 (13.5%) | 929 (17.2%) |
| 20 to 24 Minutes | 842 (13.5%) | 703 (13.0%) |
| 25 to 29 Minutes | 450 (7.2%) | 457 (8.5%) |
| 30 to 34 Minutes | 962 (15.4%) | 714 (13.3%) |
| 35 to 39 Minutes | 266 (4.3%) | 272 (5.1%) |
| 40 to 44 Minutes | 368 (5.9%) | 248 (4.6%) |
| 45 to 59 Minutes | 554 (8.8%) | 333 (6.2%) |
| 60 to 89 Minutes | 505 (8.1%) | 339 (6.3%) |
| 90 or more Minutes | 124 (2.0%) | 55 (1.0%) |
Time of Departure to Work by Sex in San Carlos
The most frequent times of departure to work in San Carlos are 8:00 AM to 8:29 AM (1,400, 22.4%) for males and 8:00 AM to 8:29 AM (1,125, 20.9%) for females.
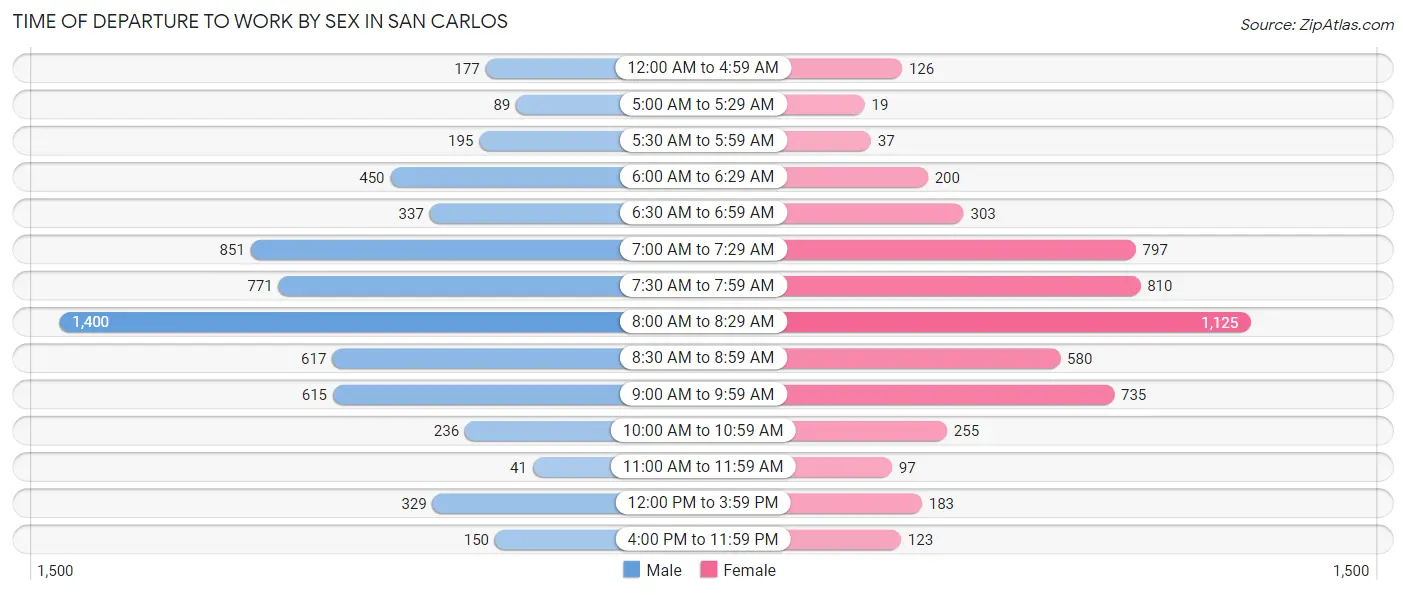
| Time of Departure | Male | Female |
| 12:00 AM to 4:59 AM | 177 (2.8%) | 126 (2.3%) |
| 5:00 AM to 5:29 AM | 89 (1.4%) | 19 (0.4%) |
| 5:30 AM to 5:59 AM | 195 (3.1%) | 37 (0.7%) |
| 6:00 AM to 6:29 AM | 450 (7.2%) | 200 (3.7%) |
| 6:30 AM to 6:59 AM | 337 (5.4%) | 303 (5.6%) |
| 7:00 AM to 7:29 AM | 851 (13.6%) | 797 (14.8%) |
| 7:30 AM to 7:59 AM | 771 (12.3%) | 810 (15.0%) |
| 8:00 AM to 8:29 AM | 1,400 (22.4%) | 1,125 (20.9%) |
| 8:30 AM to 8:59 AM | 617 (9.9%) | 580 (10.8%) |
| 9:00 AM to 9:59 AM | 615 (9.8%) | 735 (13.6%) |
| 10:00 AM to 10:59 AM | 236 (3.8%) | 255 (4.7%) |
| 11:00 AM to 11:59 AM | 41 (0.7%) | 97 (1.8%) |
| 12:00 PM to 3:59 PM | 329 (5.3%) | 183 (3.4%) |
| 4:00 PM to 11:59 PM | 150 (2.4%) | 123 (2.3%) |
| Total | 6,258 (100.0%) | 5,390 (100.0%) |
Housing Occupancy in San Carlos
Occupancy by Ownership in San Carlos
Of the total 11,361 dwellings in San Carlos, owner-occupied units account for 7,887 (69.4%), while renter-occupied units make up 3,474 (30.6%).
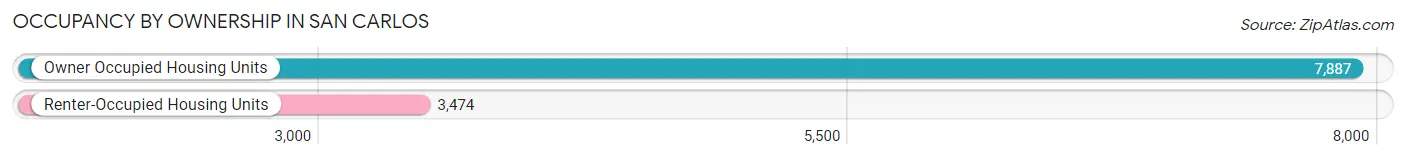
| Occupancy | # Housing Units | % Housing Units |
| Owner Occupied Housing Units | 7,887 | 69.4% |
| Renter-Occupied Housing Units | 3,474 | 30.6% |
| Total Occupied Housing Units | 11,361 | 100.0% |
Occupancy by Household Size in San Carlos
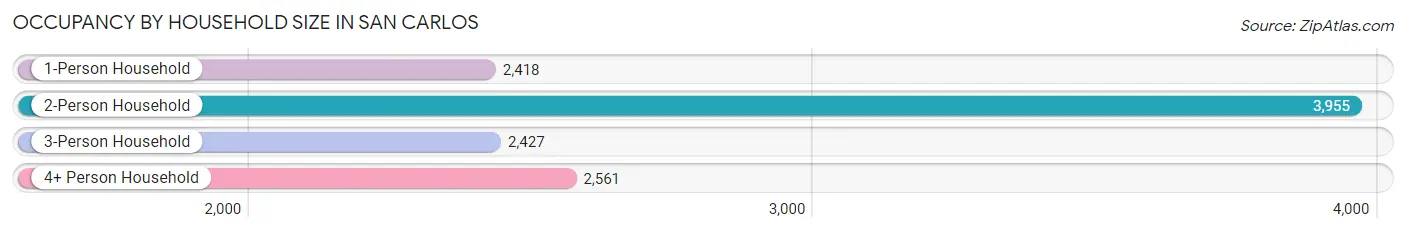
| Household Size | # Housing Units | % Housing Units |
| 1-Person Household | 2,418 | 21.3% |
| 2-Person Household | 3,955 | 34.8% |
| 3-Person Household | 2,427 | 21.4% |
| 4+ Person Household | 2,561 | 22.5% |
| Total Housing Units | 11,361 | 100.0% |
Occupancy by Ownership by Household Size in San Carlos
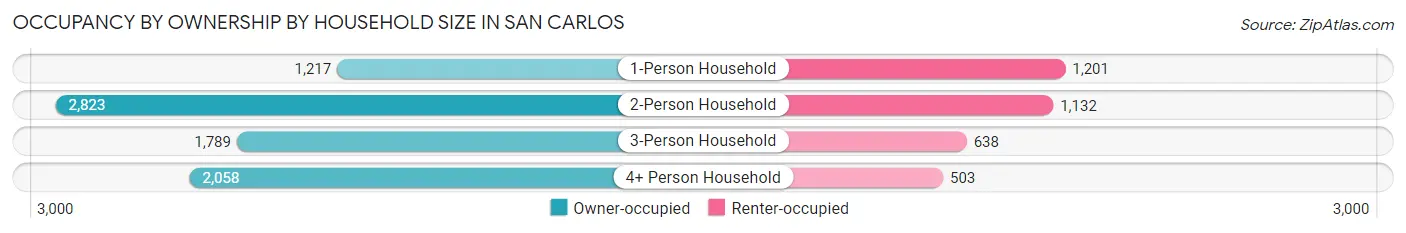
| Household Size | Owner-occupied | Renter-occupied |
| 1-Person Household | 1,217 (50.3%) | 1,201 (49.7%) |
| 2-Person Household | 2,823 (71.4%) | 1,132 (28.6%) |
| 3-Person Household | 1,789 (73.7%) | 638 (26.3%) |
| 4+ Person Household | 2,058 (80.4%) | 503 (19.6%) |
| Total Housing Units | 7,887 (69.4%) | 3,474 (30.6%) |
Occupancy by Educational Attainment in San Carlos
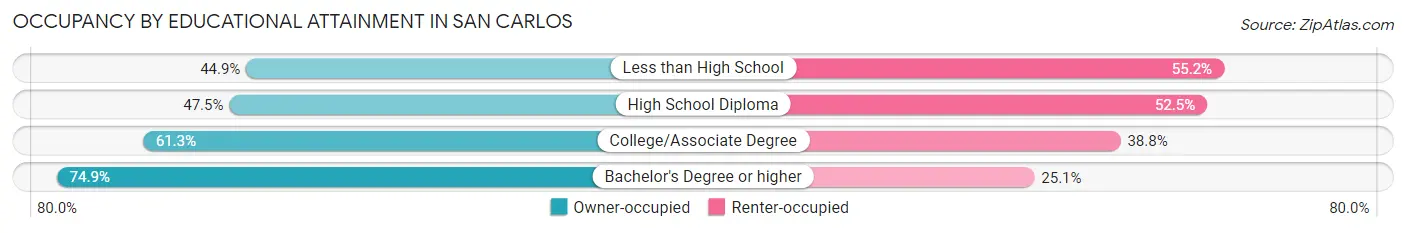
| Household Size | Owner-occupied | Renter-occupied |
| Less than High School | 148 (44.9%) | 182 (55.1%) |
| High School Diploma | 346 (47.5%) | 382 (52.5%) |
| College/Associate Degree | 1,456 (61.3%) | 921 (38.8%) |
| Bachelor's Degree or higher | 5,937 (74.9%) | 1,989 (25.1%) |
Occupancy by Age of Householder in San Carlos
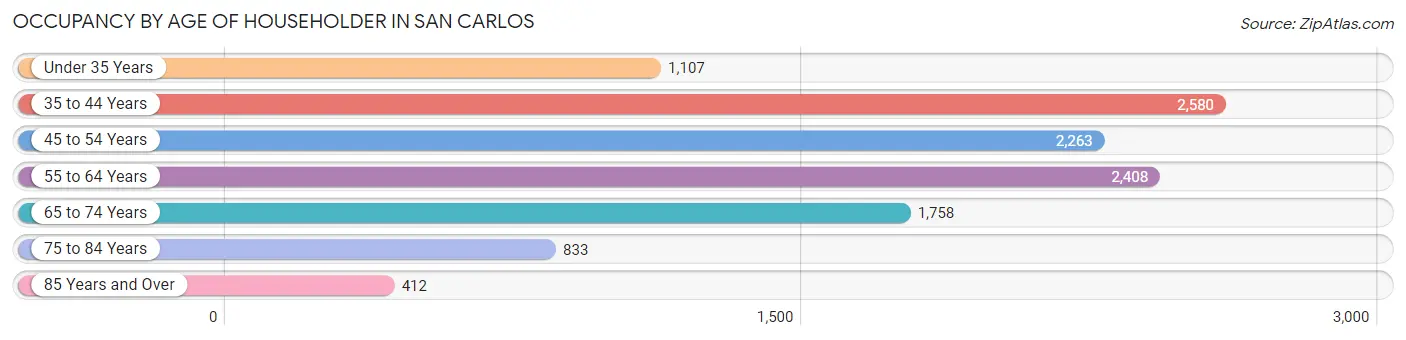
| Age Bracket | # Households | % Households |
| Under 35 Years | 1,107 | 9.7% |
| 35 to 44 Years | 2,580 | 22.7% |
| 45 to 54 Years | 2,263 | 19.9% |
| 55 to 64 Years | 2,408 | 21.2% |
| 65 to 74 Years | 1,758 | 15.5% |
| 75 to 84 Years | 833 | 7.3% |
| 85 Years and Over | 412 | 3.6% |
| Total | 11,361 | 100.0% |
Housing Finances in San Carlos
Median Income by Occupancy in San Carlos
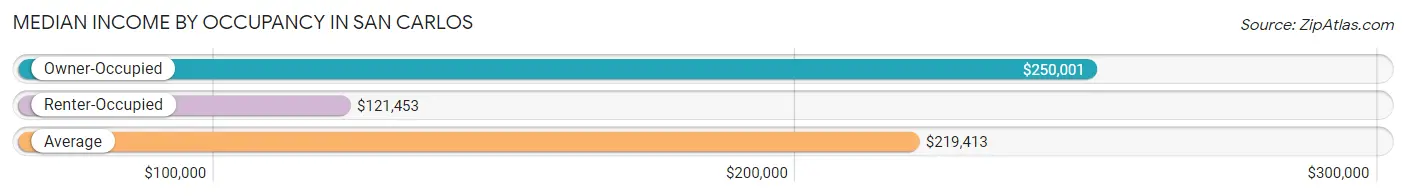
| Occupancy Type | # Households | Median Income |
| Owner-Occupied | 7,887 (69.4%) | $250,001 |
| Renter-Occupied | 3,474 (30.6%) | $121,453 |
| Average | 11,361 (100.0%) | $219,413 |
Occupancy by Householder Income Bracket in San Carlos
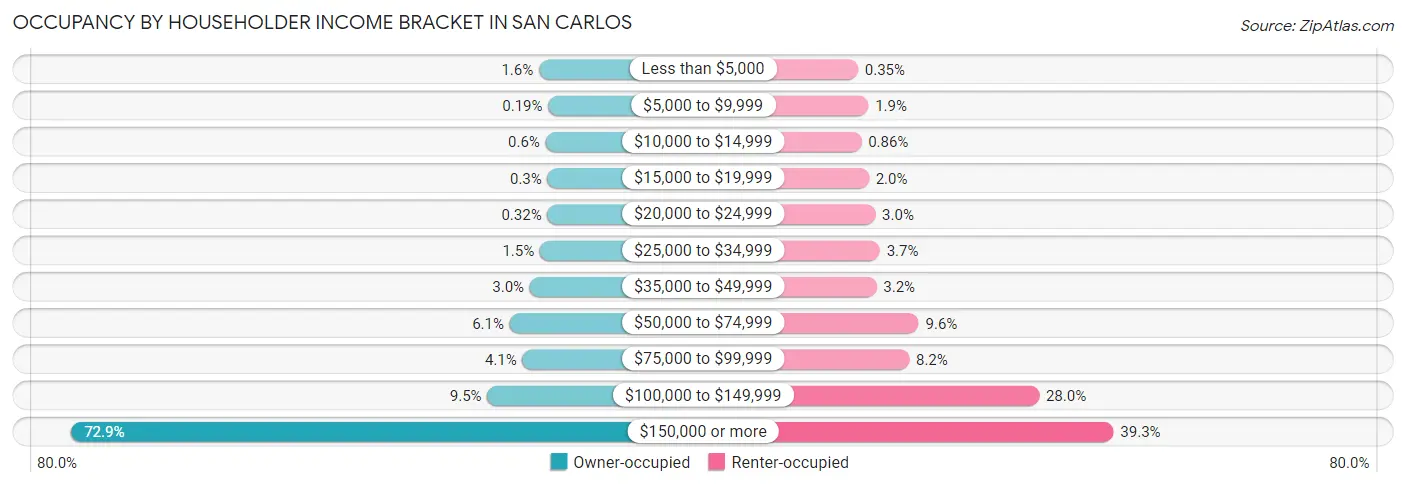
| Income Bracket | Owner-occupied | Renter-occupied |
| Less than $5,000 | 127 (1.6%) | 12 (0.4%) |
| $5,000 to $9,999 | 15 (0.2%) | 67 (1.9%) |
| $10,000 to $14,999 | 47 (0.6%) | 30 (0.9%) |
| $15,000 to $19,999 | 24 (0.3%) | 70 (2.0%) |
| $20,000 to $24,999 | 25 (0.3%) | 104 (3.0%) |
| $25,000 to $34,999 | 114 (1.5%) | 128 (3.7%) |
| $35,000 to $49,999 | 237 (3.0%) | 110 (3.2%) |
| $50,000 to $74,999 | 478 (6.1%) | 334 (9.6%) |
| $75,000 to $99,999 | 324 (4.1%) | 283 (8.2%) |
| $100,000 to $149,999 | 747 (9.5%) | 971 (28.0%) |
| $150,000 or more | 5,749 (72.9%) | 1,365 (39.3%) |
| Total | 7,887 (100.0%) | 3,474 (100.0%) |
Monthly Housing Cost Tiers in San Carlos
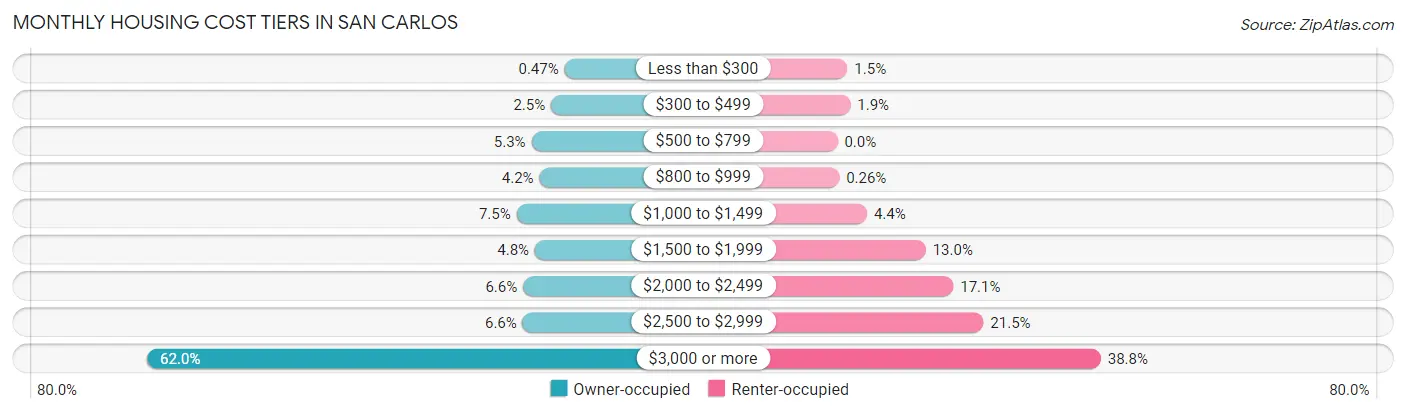
| Monthly Cost | Owner-occupied | Renter-occupied |
| Less than $300 | 37 (0.5%) | 51 (1.5%) |
| $300 to $499 | 194 (2.5%) | 66 (1.9%) |
| $500 to $799 | 421 (5.3%) | 0 (0.0%) |
| $800 to $999 | 329 (4.2%) | 9 (0.3%) |
| $1,000 to $1,499 | 595 (7.5%) | 151 (4.3%) |
| $1,500 to $1,999 | 381 (4.8%) | 452 (13.0%) |
| $2,000 to $2,499 | 519 (6.6%) | 593 (17.1%) |
| $2,500 to $2,999 | 524 (6.6%) | 747 (21.5%) |
| $3,000 or more | 4,887 (62.0%) | 1,348 (38.8%) |
| Total | 7,887 (100.0%) | 3,474 (100.0%) |
Physical Housing Characteristics in San Carlos
Housing Structures in San Carlos
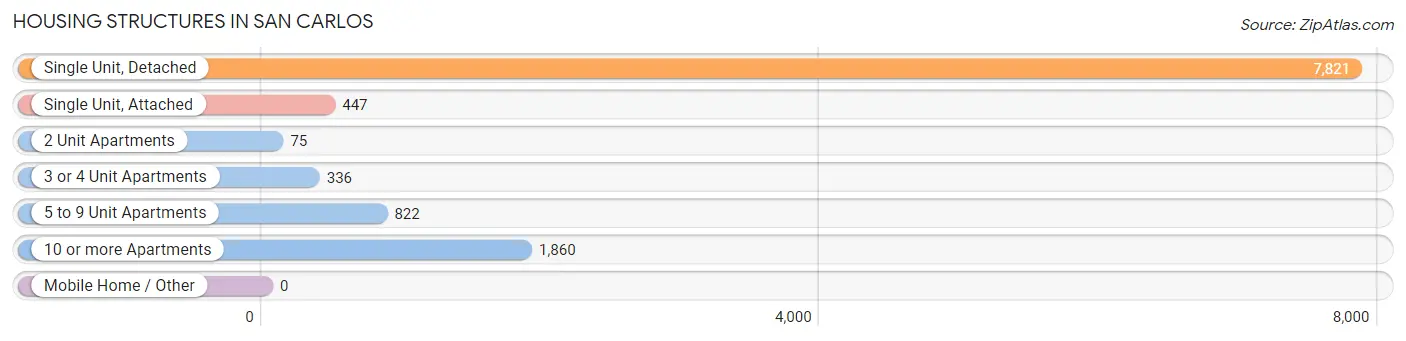
| Structure Type | # Housing Units | % Housing Units |
| Single Unit, Detached | 7,821 | 68.8% |
| Single Unit, Attached | 447 | 3.9% |
| 2 Unit Apartments | 75 | 0.7% |
| 3 or 4 Unit Apartments | 336 | 3.0% |
| 5 to 9 Unit Apartments | 822 | 7.2% |
| 10 or more Apartments | 1,860 | 16.4% |
| Mobile Home / Other | 0 | 0.0% |
| Total | 11,361 | 100.0% |
Housing Structures by Occupancy in San Carlos
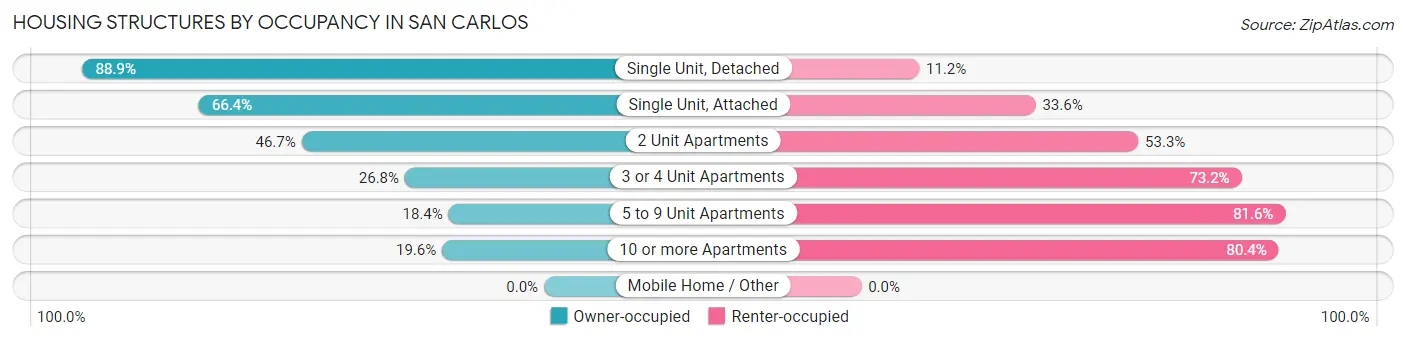
| Structure Type | Owner-occupied | Renter-occupied |
| Single Unit, Detached | 6,949 (88.8%) | 872 (11.2%) |
| Single Unit, Attached | 297 (66.4%) | 150 (33.6%) |
| 2 Unit Apartments | 35 (46.7%) | 40 (53.3%) |
| 3 or 4 Unit Apartments | 90 (26.8%) | 246 (73.2%) |
| 5 to 9 Unit Apartments | 151 (18.4%) | 671 (81.6%) |
| 10 or more Apartments | 365 (19.6%) | 1,495 (80.4%) |
| Mobile Home / Other | 0 (0.0%) | 0 (0.0%) |
| Total | 7,887 (69.4%) | 3,474 (30.6%) |
Housing Structures by Number of Rooms in San Carlos
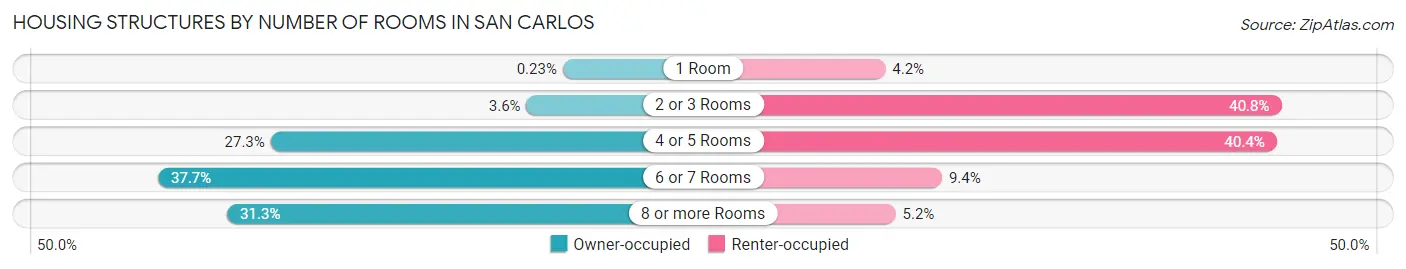
| Number of Rooms | Owner-occupied | Renter-occupied |
| 1 Room | 18 (0.2%) | 146 (4.2%) |
| 2 or 3 Rooms | 283 (3.6%) | 1,418 (40.8%) |
| 4 or 5 Rooms | 2,149 (27.3%) | 1,403 (40.4%) |
| 6 or 7 Rooms | 2,971 (37.7%) | 328 (9.4%) |
| 8 or more Rooms | 2,466 (31.3%) | 179 (5.1%) |
| Total | 7,887 (100.0%) | 3,474 (100.0%) |
Housing Structure by Heating Type in San Carlos
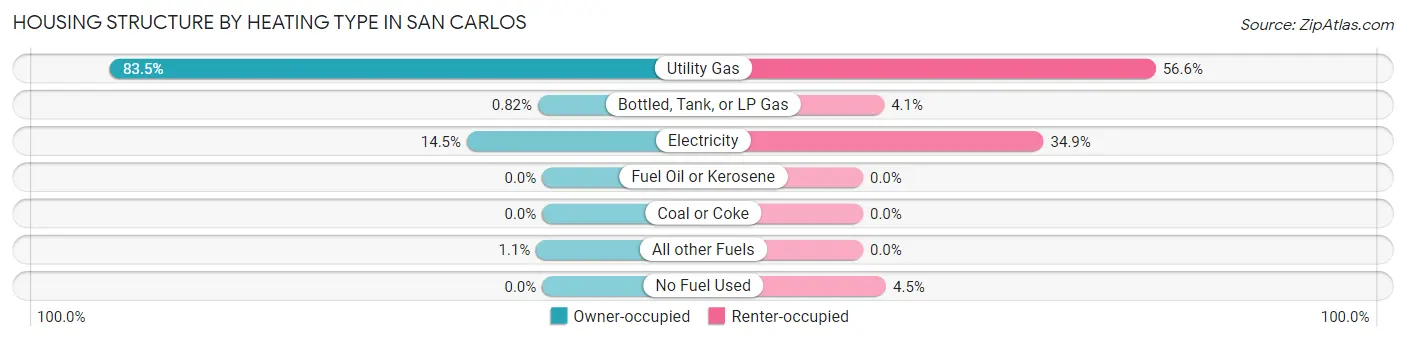
| Heating Type | Owner-occupied | Renter-occupied |
| Utility Gas | 6,585 (83.5%) | 1,965 (56.6%) |
| Bottled, Tank, or LP Gas | 65 (0.8%) | 142 (4.1%) |
| Electricity | 1,147 (14.5%) | 1,212 (34.9%) |
| Fuel Oil or Kerosene | 0 (0.0%) | 0 (0.0%) |
| Coal or Coke | 0 (0.0%) | 0 (0.0%) |
| All other Fuels | 90 (1.1%) | 0 (0.0%) |
| No Fuel Used | 0 (0.0%) | 155 (4.5%) |
| Total | 7,887 (100.0%) | 3,474 (100.0%) |
Household Vehicle Usage in San Carlos
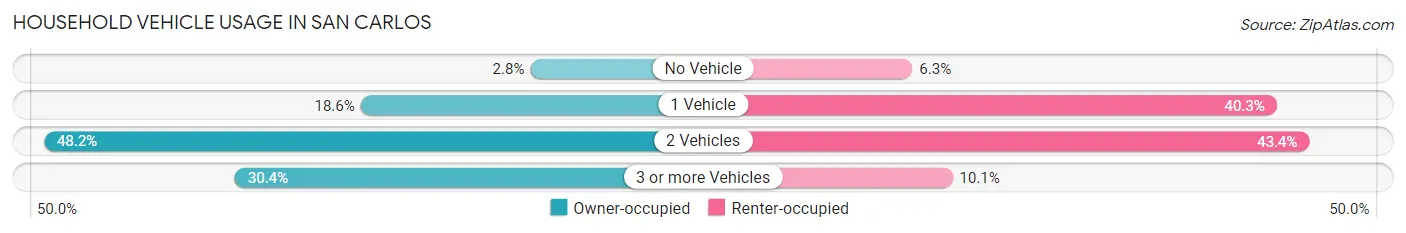
| Vehicles per Household | Owner-occupied | Renter-occupied |
| No Vehicle | 221 (2.8%) | 219 (6.3%) |
| 1 Vehicle | 1,470 (18.6%) | 1,400 (40.3%) |
| 2 Vehicles | 3,801 (48.2%) | 1,506 (43.3%) |
| 3 or more Vehicles | 2,395 (30.4%) | 349 (10.1%) |
| Total | 7,887 (100.0%) | 3,474 (100.0%) |
Real Estate & Mortgages in San Carlos
Real Estate and Mortgage Overview in San Carlos
| Characteristic | Without Mortgage | With Mortgage |
| Housing Units | 2,137 | 5,750 |
| Median Property Value | $2,000,001 | $2,000,001 |
| Median Household Income | $149,219 | $4,688 |
| Monthly Housing Costs | $1,085 | $4,853 |
| Real Estate Taxes | $7,187 | $31 |
Property Value by Mortgage Status in San Carlos
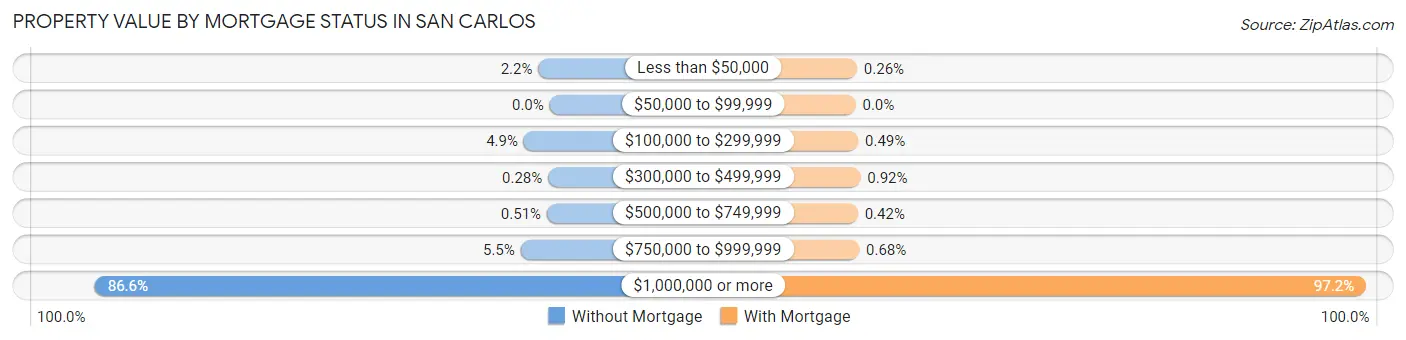
| Property Value | Without Mortgage | With Mortgage |
| Less than $50,000 | 46 (2.1%) | 15 (0.3%) |
| $50,000 to $99,999 | 0 (0.0%) | 0 (0.0%) |
| $100,000 to $299,999 | 105 (4.9%) | 28 (0.5%) |
| $300,000 to $499,999 | 6 (0.3%) | 53 (0.9%) |
| $500,000 to $749,999 | 11 (0.5%) | 24 (0.4%) |
| $750,000 to $999,999 | 118 (5.5%) | 39 (0.7%) |
| $1,000,000 or more | 1,851 (86.6%) | 5,591 (97.2%) |
| Total | 2,137 (100.0%) | 5,750 (100.0%) |
Household Income by Mortgage Status in San Carlos
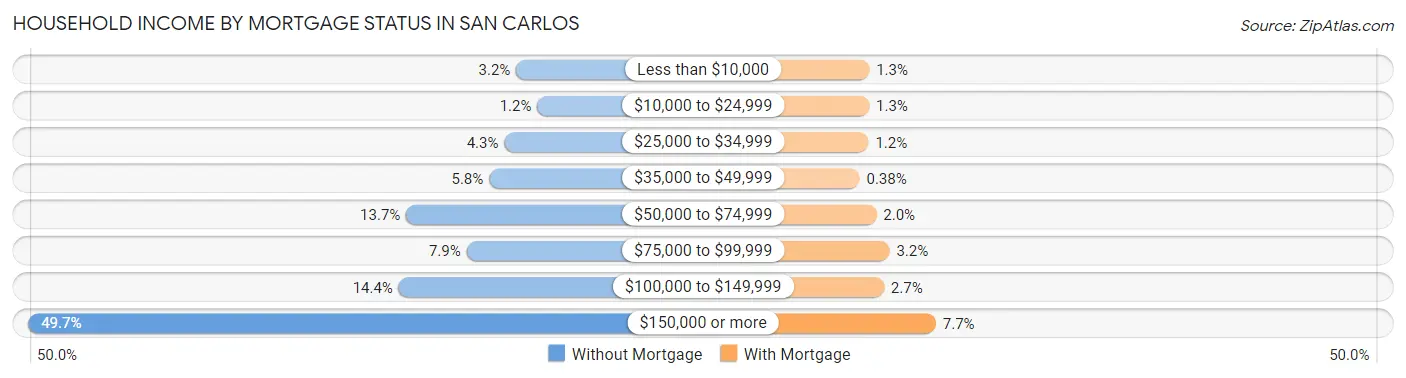
| Household Income | Without Mortgage | With Mortgage |
| Less than $10,000 | 68 (3.2%) | 75 (1.3%) |
| $10,000 to $24,999 | 25 (1.2%) | 74 (1.3%) |
| $25,000 to $34,999 | 92 (4.3%) | 71 (1.2%) |
| $35,000 to $49,999 | 123 (5.8%) | 22 (0.4%) |
| $50,000 to $74,999 | 292 (13.7%) | 114 (2.0%) |
| $75,000 to $99,999 | 169 (7.9%) | 186 (3.2%) |
| $100,000 to $149,999 | 307 (14.4%) | 155 (2.7%) |
| $150,000 or more | 1,061 (49.6%) | 440 (7.6%) |
| Total | 2,137 (100.0%) | 5,750 (100.0%) |
Property Value to Household Income Ratio in San Carlos
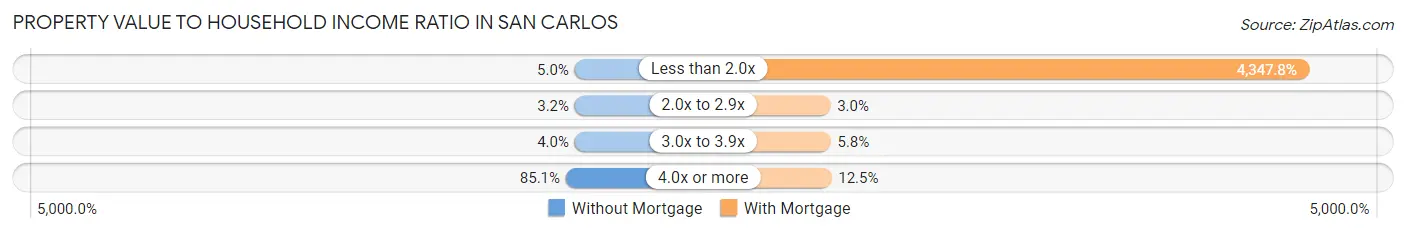
| Value-to-Income Ratio | Without Mortgage | With Mortgage |
| Less than 2.0x | 106 (5.0%) | 250,001 (4,347.8%) |
| 2.0x to 2.9x | 68 (3.2%) | 173 (3.0%) |
| 3.0x to 3.9x | 86 (4.0%) | 335 (5.8%) |
| 4.0x or more | 1,818 (85.1%) | 717 (12.5%) |
| Total | 2,137 (100.0%) | 5,750 (100.0%) |
Real Estate Taxes by Mortgage Status in San Carlos
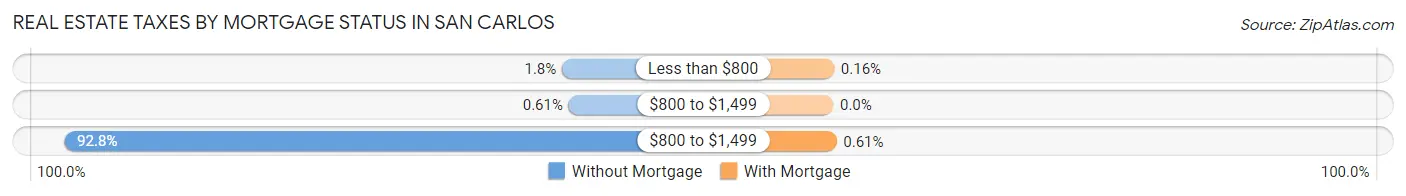
| Property Taxes | Without Mortgage | With Mortgage |
| Less than $800 | 39 (1.8%) | 9 (0.2%) |
| $800 to $1,499 | 13 (0.6%) | 0 (0.0%) |
| $800 to $1,499 | 1,983 (92.8%) | 35 (0.6%) |
| Total | 2,137 (100.0%) | 5,750 (100.0%) |
Health & Disability in San Carlos
Health Insurance Coverage by Age in San Carlos
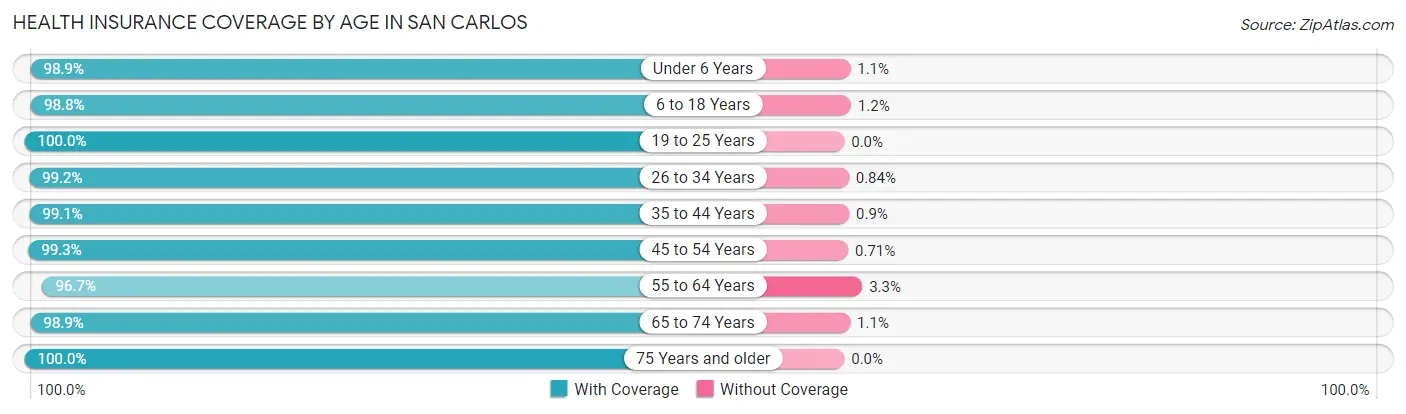
| Age Bracket | With Coverage | Without Coverage |
| Under 6 Years | 2,035 (98.9%) | 23 (1.1%) |
| 6 to 18 Years | 5,316 (98.8%) | 66 (1.2%) |
| 19 to 25 Years | 1,441 (100.0%) | 0 (0.0%) |
| 26 to 34 Years | 2,713 (99.2%) | 23 (0.8%) |
| 35 to 44 Years | 4,929 (99.1%) | 45 (0.9%) |
| 45 to 54 Years | 4,497 (99.3%) | 32 (0.7%) |
| 55 to 64 Years | 4,143 (96.7%) | 143 (3.3%) |
| 65 to 74 Years | 2,823 (98.9%) | 31 (1.1%) |
| 75 Years and older | 2,202 (100.0%) | 0 (0.0%) |
| Total | 30,099 (98.8%) | 363 (1.2%) |
Health Insurance Coverage by Citizenship Status in San Carlos
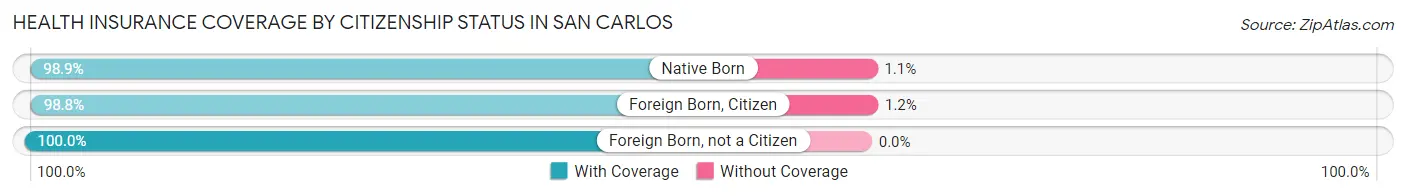
| Citizenship Status | With Coverage | Without Coverage |
| Native Born | 2,035 (98.9%) | 23 (1.1%) |
| Foreign Born, Citizen | 5,316 (98.8%) | 66 (1.2%) |
| Foreign Born, not a Citizen | 1,441 (100.0%) | 0 (0.0%) |
Health Insurance Coverage by Household Income in San Carlos
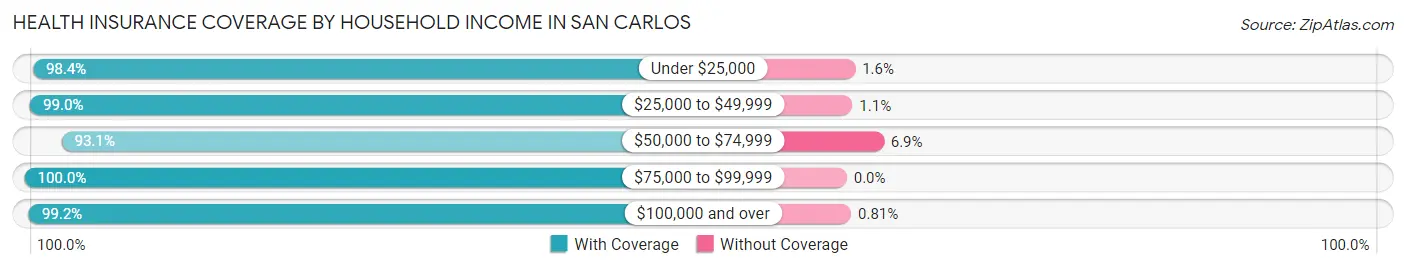
| Household Income | With Coverage | Without Coverage |
| Under $25,000 | 880 (98.4%) | 14 (1.6%) |
| $25,000 to $49,999 | 944 (99.0%) | 10 (1.1%) |
| $50,000 to $74,999 | 1,424 (93.1%) | 106 (6.9%) |
| $75,000 to $99,999 | 1,153 (100.0%) | 0 (0.0%) |
| $100,000 and over | 25,596 (99.2%) | 209 (0.8%) |
Public vs Private Health Insurance Coverage by Age in San Carlos
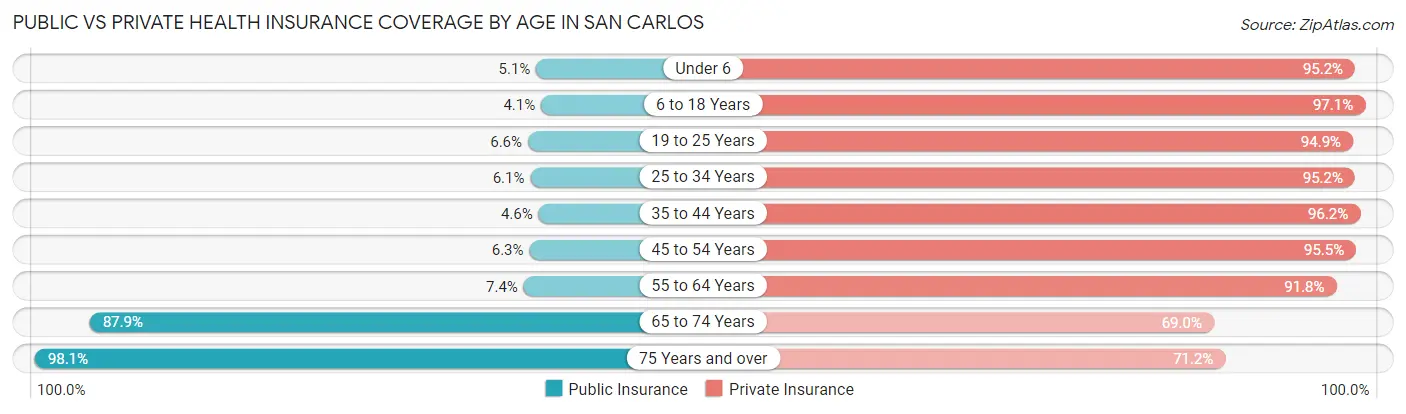
| Age Bracket | Public Insurance | Private Insurance |
| Under 6 | 104 (5.1%) | 1,960 (95.2%) |
| 6 to 18 Years | 223 (4.1%) | 5,226 (97.1%) |
| 19 to 25 Years | 95 (6.6%) | 1,367 (94.9%) |
| 25 to 34 Years | 168 (6.1%) | 2,605 (95.2%) |
| 35 to 44 Years | 229 (4.6%) | 4,785 (96.2%) |
| 45 to 54 Years | 286 (6.3%) | 4,323 (95.5%) |
| 55 to 64 Years | 316 (7.4%) | 3,934 (91.8%) |
| 65 to 74 Years | 2,509 (87.9%) | 1,970 (69.0%) |
| 75 Years and over | 2,160 (98.1%) | 1,567 (71.2%) |
| Total | 6,090 (20.0%) | 27,737 (91.0%) |
Disability Status by Sex by Age in San Carlos
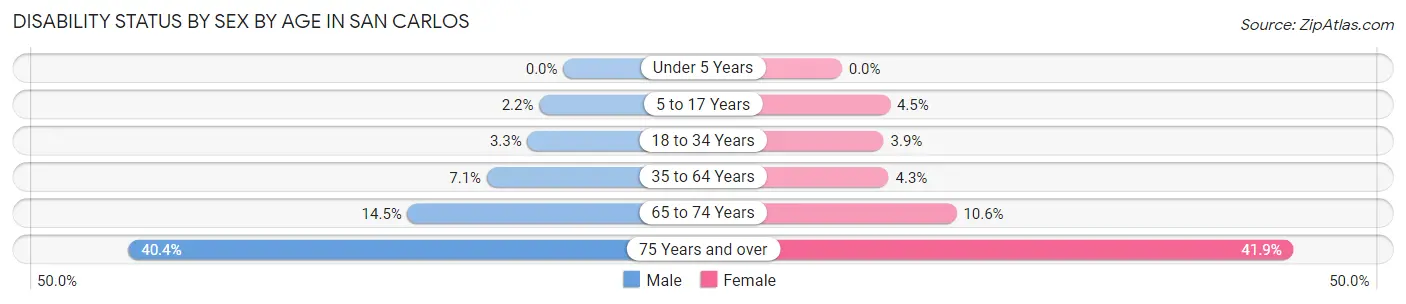
| Age Bracket | Male | Female |
| Under 5 Years | 0 (0.0%) | 0 (0.0%) |
| 5 to 17 Years | 65 (2.2%) | 116 (4.5%) |
| 18 to 34 Years | 75 (3.3%) | 86 (3.9%) |
| 35 to 64 Years | 486 (7.1%) | 301 (4.3%) |
| 65 to 74 Years | 176 (14.4%) | 174 (10.6%) |
| 75 Years and over | 346 (40.4%) | 564 (41.9%) |
Disability Class by Sex by Age in San Carlos
Disability Class: Hearing Difficulty
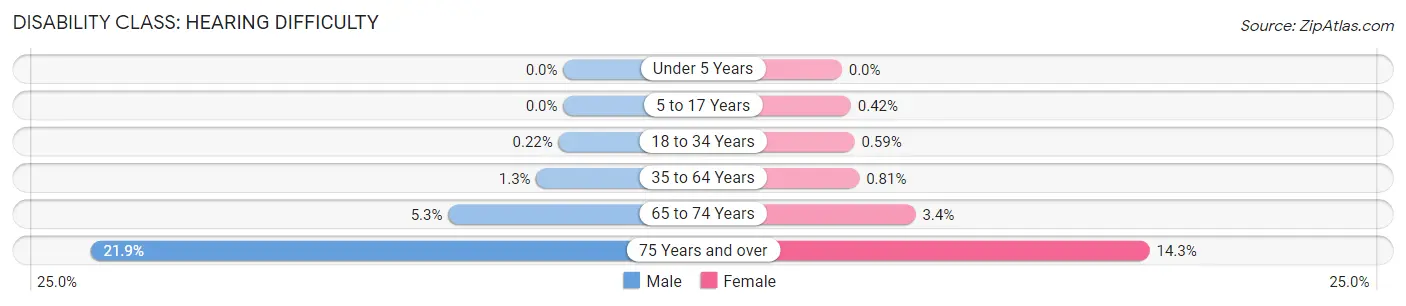
| Age Bracket | Male | Female |
| Under 5 Years | 0 (0.0%) | 0 (0.0%) |
| 5 to 17 Years | 0 (0.0%) | 11 (0.4%) |
| 18 to 34 Years | 5 (0.2%) | 13 (0.6%) |
| 35 to 64 Years | 86 (1.3%) | 56 (0.8%) |
| 65 to 74 Years | 65 (5.3%) | 56 (3.4%) |
| 75 Years and over | 188 (21.9%) | 192 (14.3%) |
Disability Class: Vision Difficulty
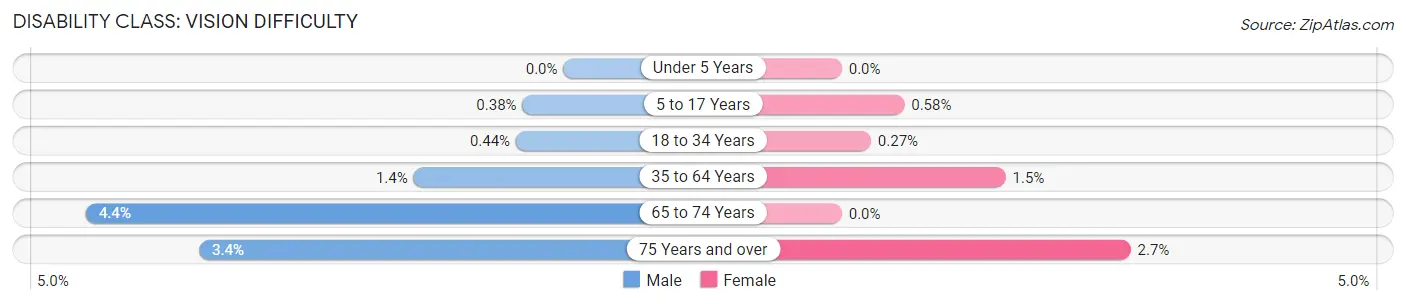
| Age Bracket | Male | Female |
| Under 5 Years | 0 (0.0%) | 0 (0.0%) |
| 5 to 17 Years | 11 (0.4%) | 15 (0.6%) |
| 18 to 34 Years | 10 (0.4%) | 6 (0.3%) |
| 35 to 64 Years | 95 (1.4%) | 105 (1.5%) |
| 65 to 74 Years | 54 (4.4%) | 0 (0.0%) |
| 75 Years and over | 29 (3.4%) | 36 (2.7%) |
Disability Class: Cognitive Difficulty
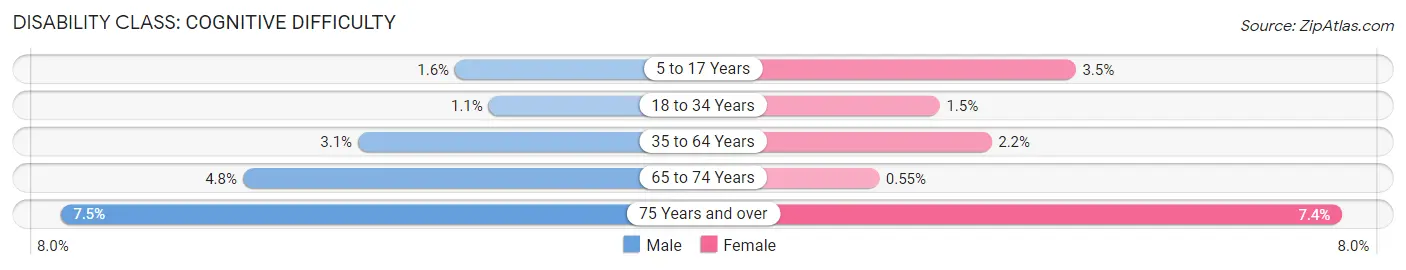
| Age Bracket | Male | Female |
| 5 to 17 Years | 47 (1.6%) | 90 (3.5%) |
| 18 to 34 Years | 25 (1.1%) | 32 (1.5%) |
| 35 to 64 Years | 209 (3.0%) | 154 (2.2%) |
| 65 to 74 Years | 58 (4.8%) | 9 (0.5%) |
| 75 Years and over | 64 (7.5%) | 100 (7.4%) |
Disability Class: Ambulatory Difficulty
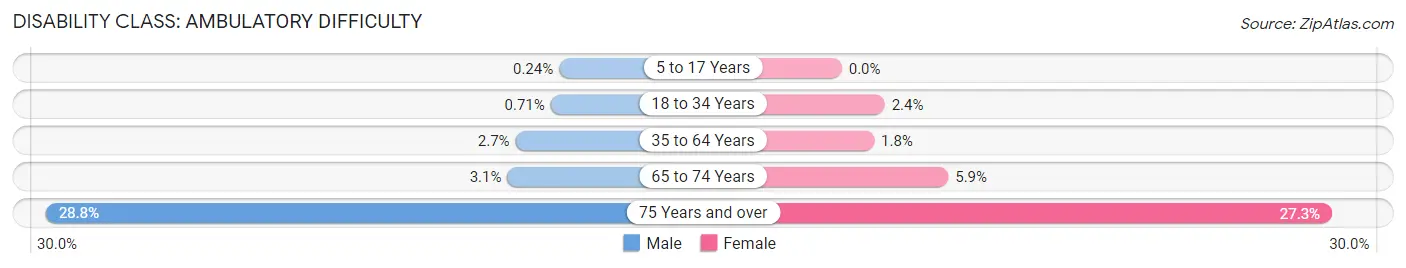
| Age Bracket | Male | Female |
| 5 to 17 Years | 7 (0.2%) | 0 (0.0%) |
| 18 to 34 Years | 16 (0.7%) | 53 (2.4%) |
| 35 to 64 Years | 183 (2.7%) | 125 (1.8%) |
| 65 to 74 Years | 38 (3.1%) | 97 (5.9%) |
| 75 Years and over | 247 (28.8%) | 367 (27.3%) |
Disability Class: Self-Care Difficulty
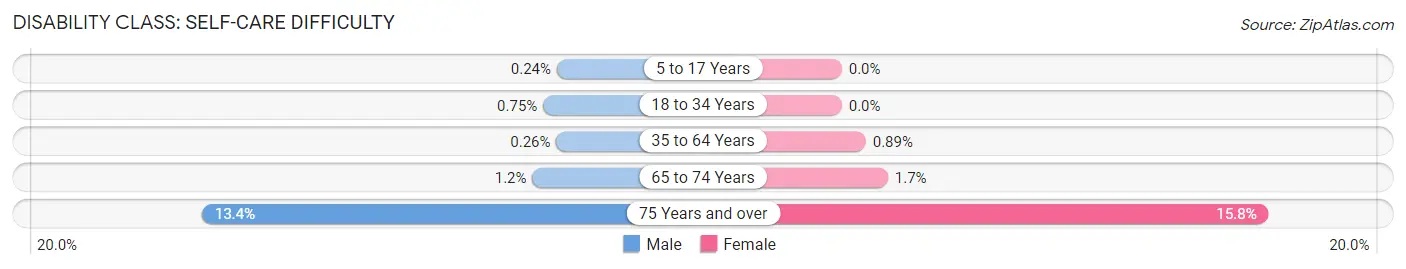
| Age Bracket | Male | Female |
| 5 to 17 Years | 7 (0.2%) | 0 (0.0%) |
| 18 to 34 Years | 17 (0.7%) | 0 (0.0%) |
| 35 to 64 Years | 18 (0.3%) | 62 (0.9%) |
| 65 to 74 Years | 14 (1.1%) | 28 (1.7%) |
| 75 Years and over | 115 (13.4%) | 213 (15.8%) |
Technology Access in San Carlos
Computing Device Access in San Carlos
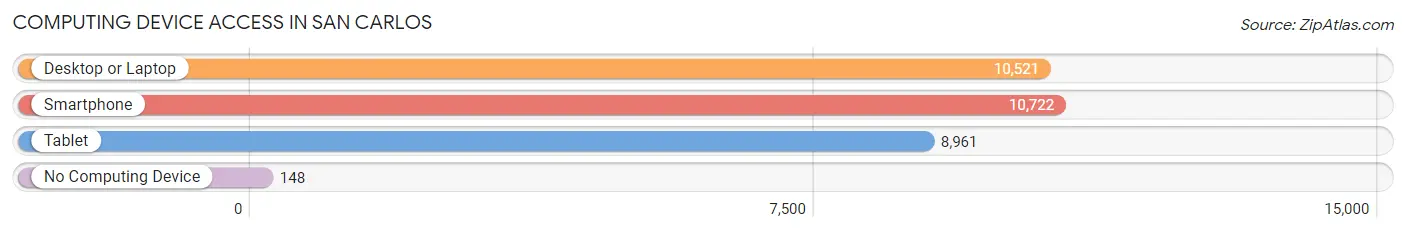
| Device Type | # Households | % Households |
| Desktop or Laptop | 10,521 | 92.6% |
| Smartphone | 10,722 | 94.4% |
| Tablet | 8,961 | 78.9% |
| No Computing Device | 148 | 1.3% |
| Total | 11,361 | 100.0% |
Internet Access in San Carlos
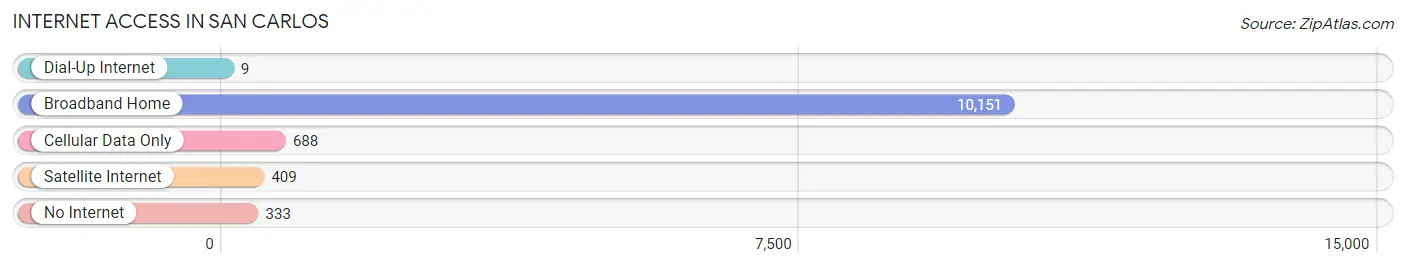
| Internet Type | # Households | % Households |
| Dial-Up Internet | 9 | 0.1% |
| Broadband Home | 10,151 | 89.3% |
| Cellular Data Only | 688 | 6.1% |
| Satellite Internet | 409 | 3.6% |
| No Internet | 333 | 2.9% |
| Total | 11,361 | 100.0% |
San Carlos Summary
San Carlos, California is a city located in San Mateo County, California, United States. It is situated between the cities of San Francisco and San Jose, and is part of the San Francisco Bay Area. The population of San Carlos was 28,406 at the 2010 census.
History
San Carlos was originally part of the Rancho de las Pulgas, a Mexican land grant given to the Arguello family in 1835. The city was incorporated in 1925, and was named after the Spanish mission of San Carlos Borromeo de Carmelo.
Geography
San Carlos is located at 37°30'N 122°17'W. It is situated in the San Francisco Bay Area, and is bordered by Belmont to the north, Redwood City to the east, San Mateo to the south, and the San Francisco Bay to the west. The city covers an area of 5.1 square miles, and has a population density of 5,541 people per square mile.
Economy
San Carlos is home to a variety of businesses, including technology, retail, and professional services. The city is also home to a number of corporate headquarters, including Oracle, SolarCity, and Shutterfly. The median household income in San Carlos is $107,837, and the median home value is $1,092,400.
Demographics
As of the 2010 census, the population of San Carlos was 28,406. The racial makeup of the city was 63.2% White, 0.8% African American, 0.3% Native American, 25.2% Asian, 0.2% Pacific Islander, 6.3% from other races, and 4.0% from two or more races. Hispanic or Latino of any race were 14.3% of the population.
The median age in San Carlos is 41.3 years, and the median age for males is 40.2 years and for females is 42.4 years. The median household income is $107,837, and the median home value is $1,092,400.
Conclusion
San Carlos is a city located in San Mateo County, California, United States. It is situated between the cities of San Francisco and San Jose, and is part of the San Francisco Bay Area. The population of San Carlos was 28,406 at the 2010 census. The city was originally part of the Rancho de las Pulgas, a Mexican land grant given to the Arguello family in 1835. San Carlos is home to a variety of businesses, including technology, retail, and professional services. The racial makeup of the city was 63.2% White, 0.8% African American, 0.3% Native American, 25.2% Asian, 0.2% Pacific Islander, 6.3% from other races, and 4.0% from two or more races. The median age in San Carlos is 41.3 years, and the median household income is $107,837, and the median home value is $1,092,400.
Common Questions
What is Per Capita Income in San Carlos?
Per Capita income in San Carlos is $113,618.
What is the Median Family Income in San Carlos?
Median Family Income in San Carlos is $250,001.
What is the Median Household income in San Carlos?
Median Household Income in San Carlos is $219,413.
What is Income or Wage Gap in San Carlos?
Income or Wage Gap in San Carlos is 27.9%.
Women in San Carlos earn 72.1 cents for every dollar earned by a man.
What is Family Income Deficit in San Carlos?
Family Income Deficit in San Carlos is $15,699.
Families that are below poverty line in San Carlos earn $15,699 less on average than the poverty threshold level.
What is Inequality or Gini Index in San Carlos?
Inequality or Gini Index in San Carlos is 0.46.
What is the Total Population of San Carlos?
Total Population of San Carlos is 30,490.
What is the Total Male Population of San Carlos?
Total Male Population of San Carlos is 14,914.
What is the Total Female Population of San Carlos?
Total Female Population of San Carlos is 15,576.
What is the Ratio of Males per 100 Females in San Carlos?
There are 95.75 Males per 100 Females in San Carlos.
What is the Ratio of Females per 100 Males in San Carlos?
There are 104.44 Females per 100 Males in San Carlos.
What is the Median Population Age in San Carlos?
Median Population Age in San Carlos is 41.7 Years.
What is the Average Family Size in San Carlos
Average Family Size in San Carlos is 3.1 People.
What is the Average Household Size in San Carlos
Average Household Size in San Carlos is 2.7 People.
How Large is the Labor Force in San Carlos?
There are 17,252 People in the Labor Forcein in San Carlos.
What is the Percentage of People in the Labor Force in San Carlos?
70.9% of People are in the Labor Force in San Carlos.
What is the Unemployment Rate in San Carlos?
Unemployment Rate in San Carlos is 4.1%.