Fremont, CA Map & Demographics
Fremont Map
Fremont Overview
$68,357
PER CAPITA INCOME
$188,107
AVG FAMILY INCOME
$169,023
AVG HOUSEHOLD INCOME
37.0%
WAGE / INCOME GAP [ % ]
63.0¢/ $1
WAGE / INCOME GAP [ $ ]
$10,481
FAMILY INCOME DEFICIT
0.41
INEQUALITY / GINI INDEX
228,795
TOTAL POPULATION
114,554
MALE POPULATION
114,241
FEMALE POPULATION
100.27
MALES / 100 FEMALES
99.73
FEMALES / 100 MALES
38.6
MEDIAN AGE
3.4
AVG FAMILY SIZE
3.0
AVG HOUSEHOLD SIZE
122,842
LABOR FORCE [ PEOPLE ]
67.5%
PERCENT IN LABOR FORCE
4.0%
UNEMPLOYMENT RATE
Income in Fremont
Income Overview in Fremont
Per Capita Income in Fremont is $68,357, while median incomes of families and households are $188,107 and $169,023 respectively.
| Characteristic | Number | Measure |
| Per Capita Income | 228,795 | $68,357 |
| Median Family Income | 59,611 | $188,107 |
| Mean Family Income | 59,611 | $223,952 |
| Median Household Income | 74,995 | $169,023 |
| Mean Household Income | 74,995 | $203,058 |
| Income Deficit | 59,611 | $10,481 |
| Wage / Income Gap (%) | 228,795 | 37.03% |
| Wage / Income Gap ($) | 228,795 | 62.97¢ per $1 |
| Gini / Inequality Index | 228,795 | 0.41 |
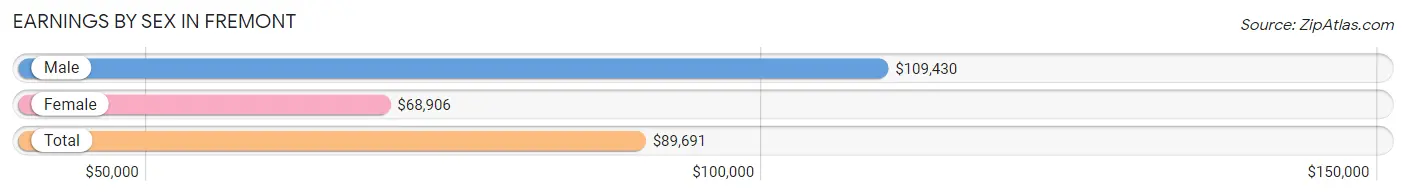
Earnings by Sex in Fremont
Average Earnings in Fremont are $89,691, $109,430 for men and $68,906 for women, a difference of 37.0%.
| Sex | Number | Average Earnings |
| Male | 69,782 (56.0%) | $109,430 |
| Female | 54,914 (44.0%) | $68,906 |
| Total | 124,696 (100.0%) | $89,691 |
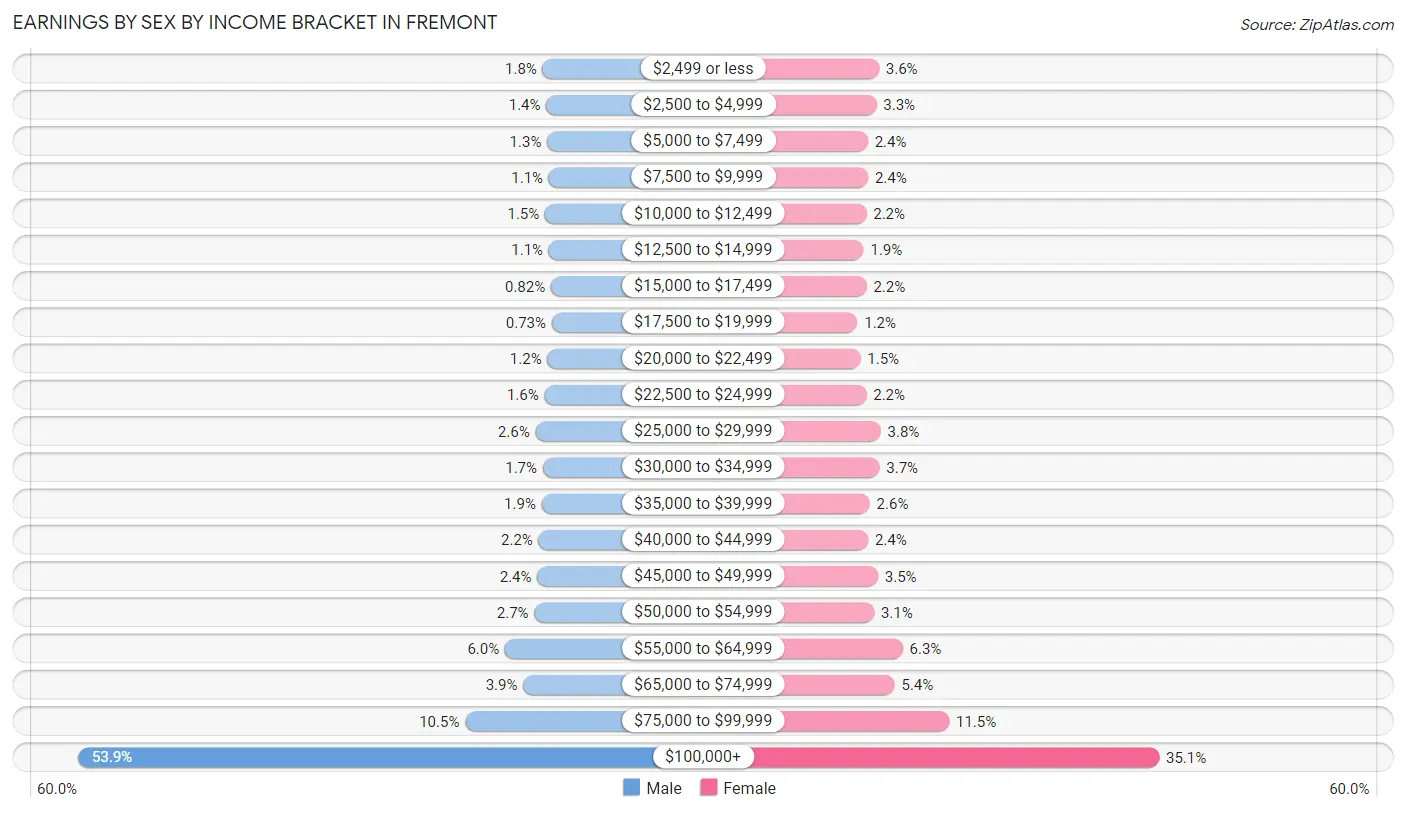
Earnings by Sex by Income Bracket in Fremont
The most common earnings brackets in Fremont are $100,000+ for men (37,604 | 53.9%) and $100,000+ for women (19,277 | 35.1%).
| Income | Male | Female |
| $2,499 or less | 1,225 (1.8%) | 1,976 (3.6%) |
| $2,500 to $4,999 | 940 (1.3%) | 1,821 (3.3%) |
| $5,000 to $7,499 | 872 (1.3%) | 1,293 (2.4%) |
| $7,500 to $9,999 | 742 (1.1%) | 1,309 (2.4%) |
| $10,000 to $12,499 | 1,042 (1.5%) | 1,203 (2.2%) |
| $12,500 to $14,999 | 743 (1.1%) | 1,030 (1.9%) |
| $15,000 to $17,499 | 570 (0.8%) | 1,212 (2.2%) |
| $17,500 to $19,999 | 507 (0.7%) | 646 (1.2%) |
| $20,000 to $22,499 | 848 (1.2%) | 836 (1.5%) |
| $22,500 to $24,999 | 1,079 (1.5%) | 1,201 (2.2%) |
| $25,000 to $29,999 | 1,790 (2.6%) | 2,089 (3.8%) |
| $30,000 to $34,999 | 1,216 (1.7%) | 2,011 (3.7%) |
| $35,000 to $39,999 | 1,308 (1.9%) | 1,412 (2.6%) |
| $40,000 to $44,999 | 1,540 (2.2%) | 1,305 (2.4%) |
| $45,000 to $49,999 | 1,645 (2.4%) | 1,916 (3.5%) |
| $50,000 to $54,999 | 1,874 (2.7%) | 1,675 (3.0%) |
| $55,000 to $64,999 | 4,182 (6.0%) | 3,444 (6.3%) |
| $65,000 to $74,999 | 2,747 (3.9%) | 2,951 (5.4%) |
| $75,000 to $99,999 | 7,308 (10.5%) | 6,307 (11.5%) |
| $100,000+ | 37,604 (53.9%) | 19,277 (35.1%) |
| Total | 69,782 (100.0%) | 54,914 (100.0%) |
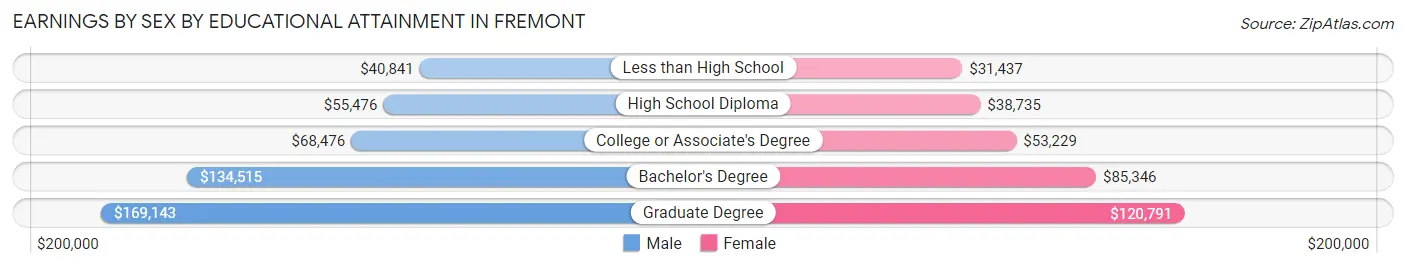
Earnings by Sex by Educational Attainment in Fremont
Average earnings in Fremont are $115,498 for men and $75,646 for women, a difference of 34.5%. Men with an educational attainment of graduate degree enjoy the highest average annual earnings of $169,143, while those with less than high school education earn the least with $40,841. Women with an educational attainment of graduate degree earn the most with the average annual earnings of $120,791, while those with less than high school education have the smallest earnings of $31,437.
| Educational Attainment | Male Income | Female Income |
| Less than High School | $40,841 | $31,437 |
| High School Diploma | $55,476 | $38,735 |
| College or Associate's Degree | $68,476 | $53,229 |
| Bachelor's Degree | $134,515 | $85,346 |
| Graduate Degree | $169,143 | $120,791 |
| Total | $115,498 | $75,646 |
Family Income in Fremont
Family Income Brackets in Fremont
According to the Fremont family income data, there are 27,660 families falling into the $200,000+ income range, which is the most common income bracket and makes up 46.4% of all families. Conversely, the $10,000 to $14,999 income bracket is the least frequent group with only 596 families (1.0%) belonging to this category.
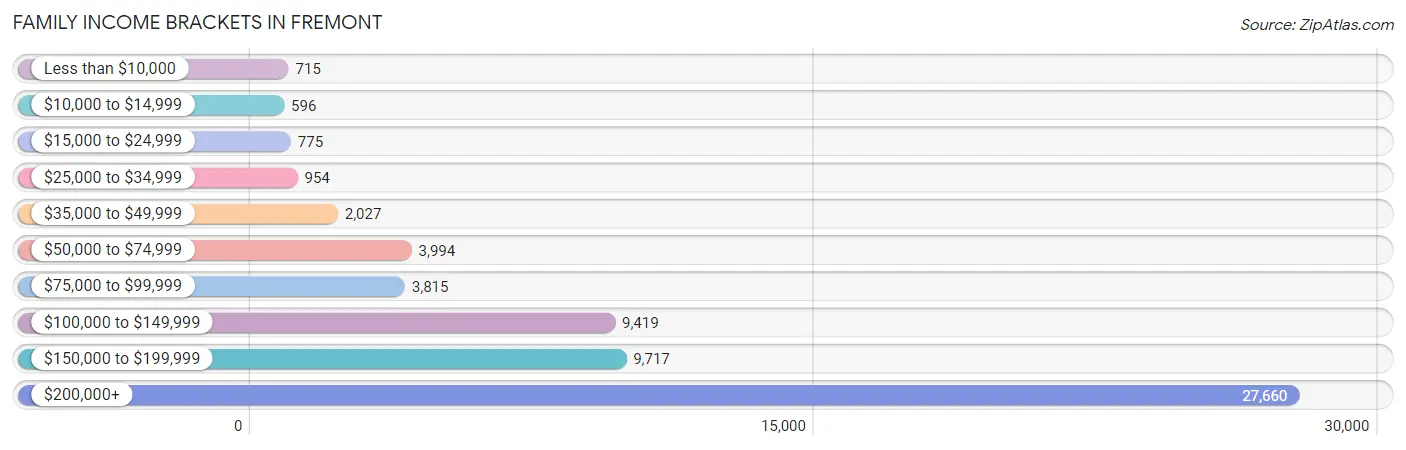
| Income Bracket | # Families | % Families |
| Less than $10,000 | 715 | 1.2% |
| $10,000 to $14,999 | 596 | 1.0% |
| $15,000 to $24,999 | 775 | 1.3% |
| $25,000 to $34,999 | 954 | 1.6% |
| $35,000 to $49,999 | 2,027 | 3.4% |
| $50,000 to $74,999 | 3,994 | 6.7% |
| $75,000 to $99,999 | 3,815 | 6.4% |
| $100,000 to $149,999 | 9,419 | 15.8% |
| $150,000 to $199,999 | 9,717 | 16.3% |
| $200,000+ | 27,660 | 46.4% |
Family Income by Famaliy Size in Fremont
4-person families (17,630 | 29.6%) account for the highest median family income in Fremont with $228,474 per family, while 2-person families (18,760 | 31.5%) have the highest median income of $70,784 per family member.
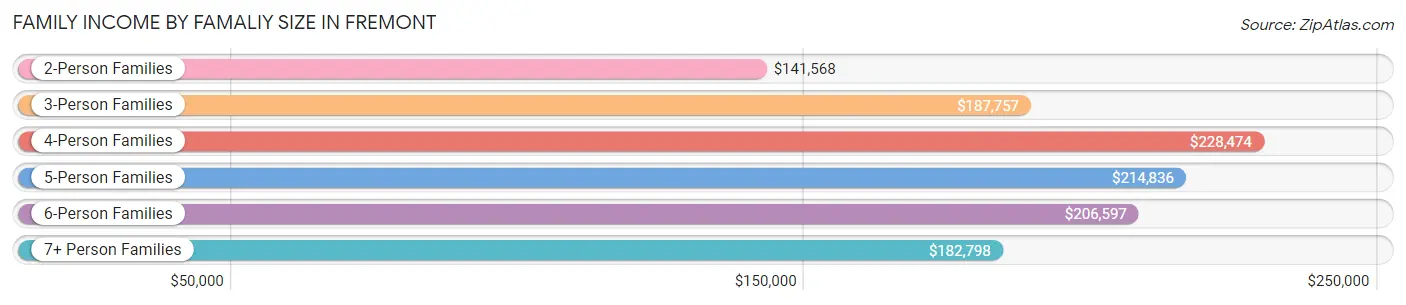
| Income Bracket | # Families | Median Income |
| 2-Person Families | 18,760 (31.5%) | $141,568 |
| 3-Person Families | 16,132 (27.1%) | $187,757 |
| 4-Person Families | 17,630 (29.6%) | $228,474 |
| 5-Person Families | 5,015 (8.4%) | $214,836 |
| 6-Person Families | 1,495 (2.5%) | $206,597 |
| 7+ Person Families | 579 (1.0%) | $182,798 |
| Total | 59,611 (100.0%) | $188,107 |
Family Income by Number of Earners in Fremont
The median family income in Fremont is $188,107, with families comprising 2 earners (29,375) having the highest median family income of $247,377, while families with no earners (4,388) have the lowest median family income of $60,625, accounting for 49.3% and 7.4% of families, respectively.
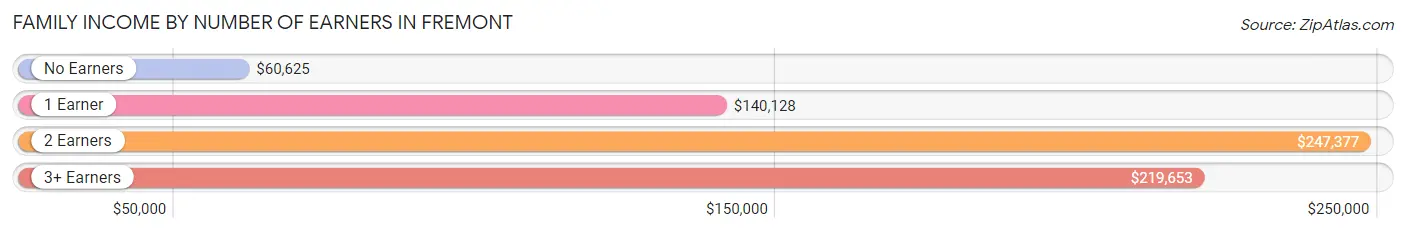
| Number of Earners | # Families | Median Income |
| No Earners | 4,388 (7.4%) | $60,625 |
| 1 Earner | 18,198 (30.5%) | $140,128 |
| 2 Earners | 29,375 (49.3%) | $247,377 |
| 3+ Earners | 7,650 (12.8%) | $219,653 |
| Total | 59,611 (100.0%) | $188,107 |
Household Income in Fremont
Household Income Brackets in Fremont
With 30,523 households falling in the category, the $200,000+ income range is the most frequent in Fremont, accounting for 40.7% of all households. In contrast, only 1,275 households (1.7%) fall into the $10,000 to $14,999 income bracket, making it the least populous group.
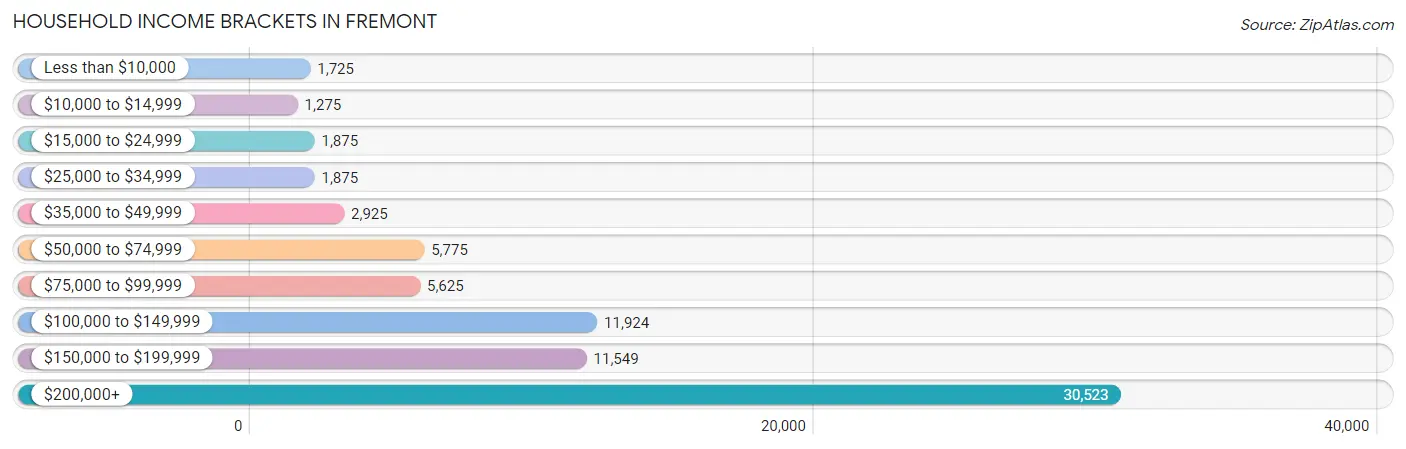
| Income Bracket | # Households | % Households |
| Less than $10,000 | 1,725 | 2.3% |
| $10,000 to $14,999 | 1,275 | 1.7% |
| $15,000 to $24,999 | 1,875 | 2.5% |
| $25,000 to $34,999 | 1,875 | 2.5% |
| $35,000 to $49,999 | 2,925 | 3.9% |
| $50,000 to $74,999 | 5,775 | 7.7% |
| $75,000 to $99,999 | 5,625 | 7.5% |
| $100,000 to $149,999 | 11,924 | 15.9% |
| $150,000 to $199,999 | 11,549 | 15.4% |
| $200,000+ | 30,523 | 40.7% |
Household Income by Householder Age in Fremont
The median household income in Fremont is $169,023, with the highest median household income of $196,541 found in the 25 to 44 years age bracket for the primary householder. A total of 29,451 households (39.3%) fall into this category. Meanwhile, the 65+ years age bracket for the primary householder has the lowest median household income of $90,083, with 14,124 households (18.8%) in this group.
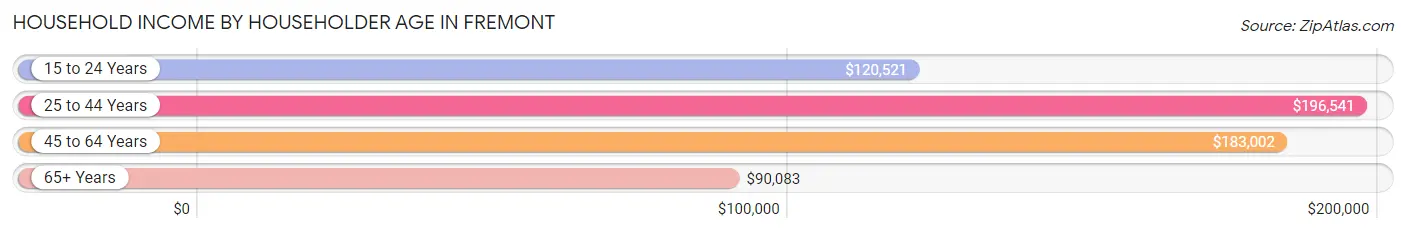
| Income Bracket | # Households | Median Income |
| 15 to 24 Years | 827 (1.1%) | $120,521 |
| 25 to 44 Years | 29,451 (39.3%) | $196,541 |
| 45 to 64 Years | 30,593 (40.8%) | $183,002 |
| 65+ Years | 14,124 (18.8%) | $90,083 |
| Total | 74,995 (100.0%) | $169,023 |
Poverty in Fremont
Income Below Poverty by Sex and Age in Fremont
With 4.6% poverty level for males and 6.0% for females among the residents of Fremont, 18 to 24 year old males and 5 year old females are the most vulnerable to poverty, with 597 males (8.5%) and 229 females (15.4%) in their respective age groups living below the poverty level.
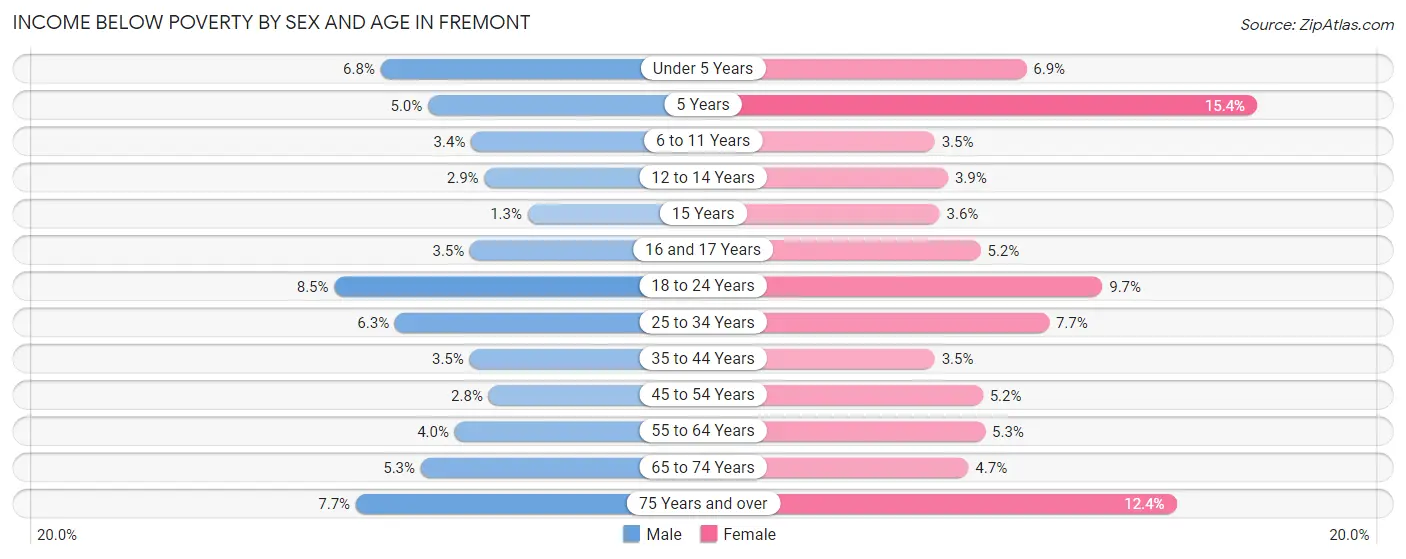
| Age Bracket | Male | Female |
| Under 5 Years | 421 (6.8%) | 472 (6.9%) |
| 5 Years | 69 (5.0%) | 229 (15.4%) |
| 6 to 11 Years | 320 (3.4%) | 340 (3.5%) |
| 12 to 14 Years | 135 (2.9%) | 160 (3.9%) |
| 15 Years | 17 (1.3%) | 43 (3.6%) |
| 16 and 17 Years | 100 (3.5%) | 147 (5.1%) |
| 18 to 24 Years | 597 (8.5%) | 643 (9.7%) |
| 25 to 34 Years | 1,070 (6.2%) | 1,316 (7.7%) |
| 35 to 44 Years | 687 (3.5%) | 660 (3.5%) |
| 45 to 54 Years | 484 (2.8%) | 793 (5.2%) |
| 55 to 64 Years | 552 (4.0%) | 701 (5.3%) |
| 65 to 74 Years | 424 (5.3%) | 407 (4.7%) |
| 75 Years and over | 397 (7.7%) | 930 (12.4%) |
| Total | 5,273 (4.6%) | 6,841 (6.0%) |
Income Above Poverty by Sex and Age in Fremont
According to the poverty statistics in Fremont, males aged 15 years and females aged 6 to 11 years are the age groups that are most secure financially, with 98.7% of males and 96.6% of females in these age groups living above the poverty line.
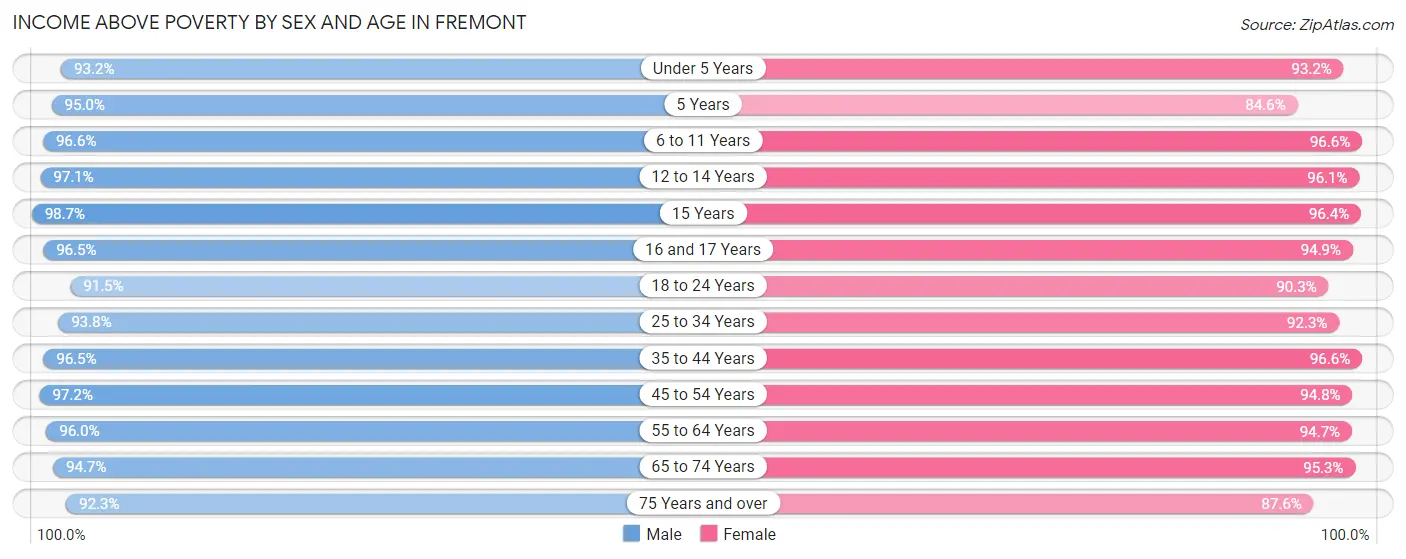
| Age Bracket | Male | Female |
| Under 5 Years | 5,790 (93.2%) | 6,419 (93.1%) |
| 5 Years | 1,305 (95.0%) | 1,257 (84.6%) |
| 6 to 11 Years | 9,032 (96.6%) | 9,509 (96.6%) |
| 12 to 14 Years | 4,468 (97.1%) | 3,903 (96.1%) |
| 15 Years | 1,271 (98.7%) | 1,142 (96.4%) |
| 16 and 17 Years | 2,793 (96.5%) | 2,707 (94.9%) |
| 18 to 24 Years | 6,428 (91.5%) | 6,009 (90.3%) |
| 25 to 34 Years | 16,054 (93.8%) | 15,793 (92.3%) |
| 35 to 44 Years | 19,080 (96.5%) | 18,460 (96.6%) |
| 45 to 54 Years | 16,968 (97.2%) | 14,373 (94.8%) |
| 55 to 64 Years | 13,138 (96.0%) | 12,472 (94.7%) |
| 65 to 74 Years | 7,590 (94.7%) | 8,252 (95.3%) |
| 75 Years and over | 4,762 (92.3%) | 6,555 (87.6%) |
| Total | 108,679 (95.4%) | 106,851 (94.0%) |
Income Below Poverty Among Married-Couple Families in Fremont
The poverty statistics for married-couple families in Fremont show that 2.3% or 1,149 of the total 50,431 families live below the poverty line. Families with 5 or more children have the highest poverty rate of 62.7%, comprising of 47 families. On the other hand, families with 1 or 2 children have the lowest poverty rate of 2.1%, which includes 531 families.
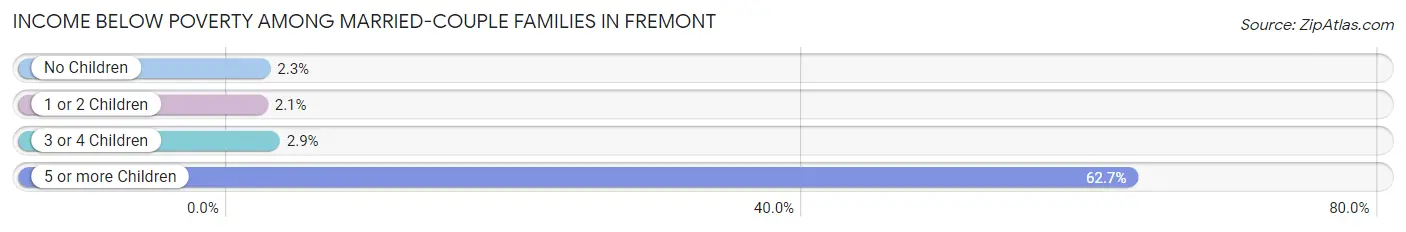
| Children | Above Poverty | Below Poverty |
| No Children | 21,976 (97.8%) | 506 (2.2%) |
| 1 or 2 Children | 25,110 (97.9%) | 531 (2.1%) |
| 3 or 4 Children | 2,168 (97.1%) | 65 (2.9%) |
| 5 or more Children | 28 (37.3%) | 47 (62.7%) |
| Total | 49,282 (97.7%) | 1,149 (2.3%) |
Income Below Poverty Among Single-Parent Households in Fremont
According to the poverty data in Fremont, 6.7% or 202 single-father households and 11.1% or 688 single-mother households are living below the poverty line. Among single-father households, those with no children have the highest poverty rate, with 150 households (7.3%) experiencing poverty. Likewise, among single-mother households, those with 3 or 4 children have the highest poverty rate, with 71 households (36.2%) falling below the poverty line.
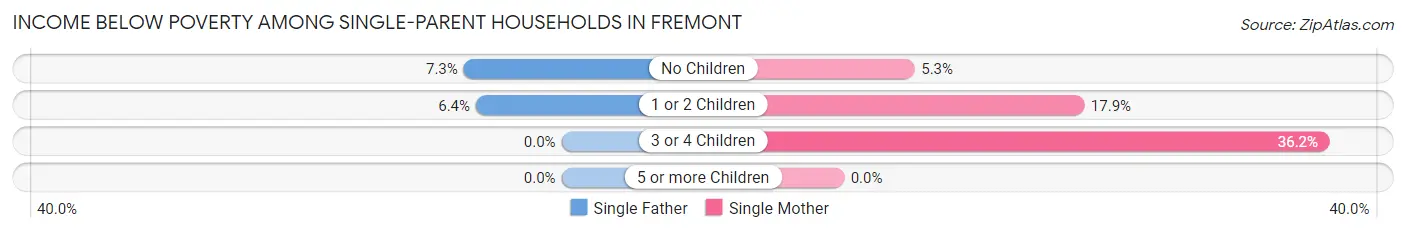
| Children | Single Father | Single Mother |
| No Children | 150 (7.3%) | 187 (5.3%) |
| 1 or 2 Children | 52 (6.4%) | 430 (17.9%) |
| 3 or 4 Children | 0 (0.0%) | 71 (36.2%) |
| 5 or more Children | 0 (0.0%) | 0 (0.0%) |
| Total | 202 (6.7%) | 688 (11.1%) |
Income Below Poverty Among Married-Couple vs Single-Parent Households in Fremont
The poverty data for Fremont shows that 1,149 of the married-couple family households (2.3%) and 890 of the single-parent households (9.7%) are living below the poverty level. Within the married-couple family households, those with 5 or more children have the highest poverty rate, with 47 households (62.7%) falling below the poverty line. Among the single-parent households, those with 3 or 4 children have the highest poverty rate, with 71 household (21.8%) living below poverty.
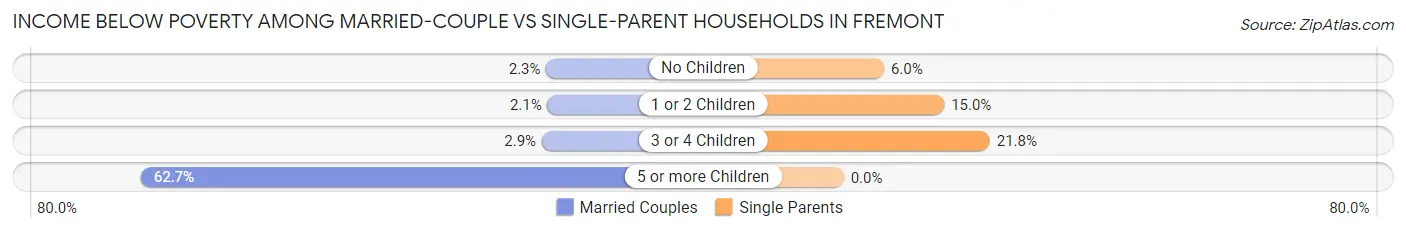
| Children | Married-Couple Families | Single-Parent Households |
| No Children | 506 (2.2%) | 337 (6.0%) |
| 1 or 2 Children | 531 (2.1%) | 482 (15.0%) |
| 3 or 4 Children | 65 (2.9%) | 71 (21.8%) |
| 5 or more Children | 47 (62.7%) | 0 (0.0%) |
| Total | 1,149 (2.3%) | 890 (9.7%) |
Race in Fremont
The most populous races in Fremont are Asian (141,372 | 61.8%), White / Caucasian (47,183 | 20.6%), and Hispanic or Latino (27,522 | 12.0%).
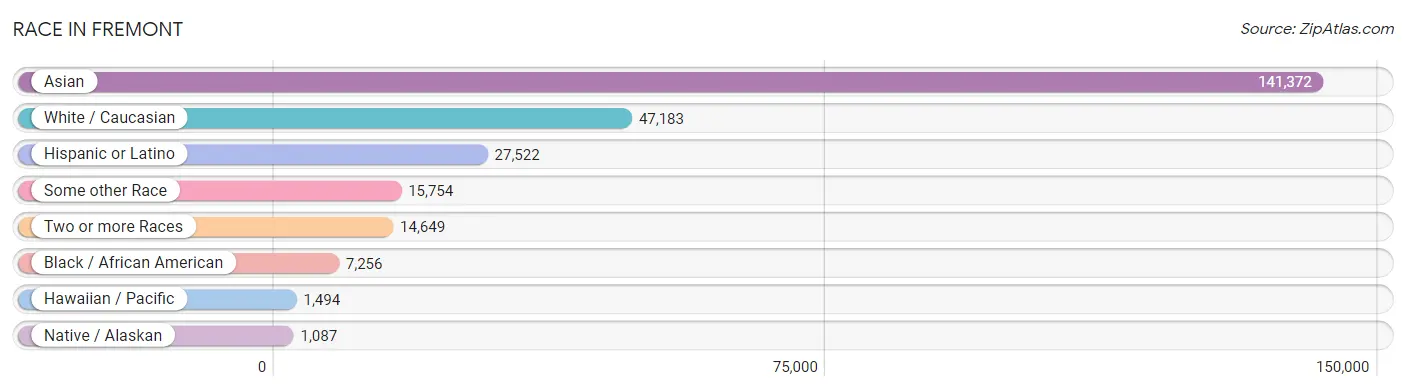
| Race | # Population | % Population |
| Asian | 141,372 | 61.8% |
| Black / African American | 7,256 | 3.2% |
| Hawaiian / Pacific | 1,494 | 0.6% |
| Hispanic or Latino | 27,522 | 12.0% |
| Native / Alaskan | 1,087 | 0.5% |
| White / Caucasian | 47,183 | 20.6% |
| Two or more Races | 14,649 | 6.4% |
| Some other Race | 15,754 | 6.9% |
| Total | 228,795 | 100.0% |
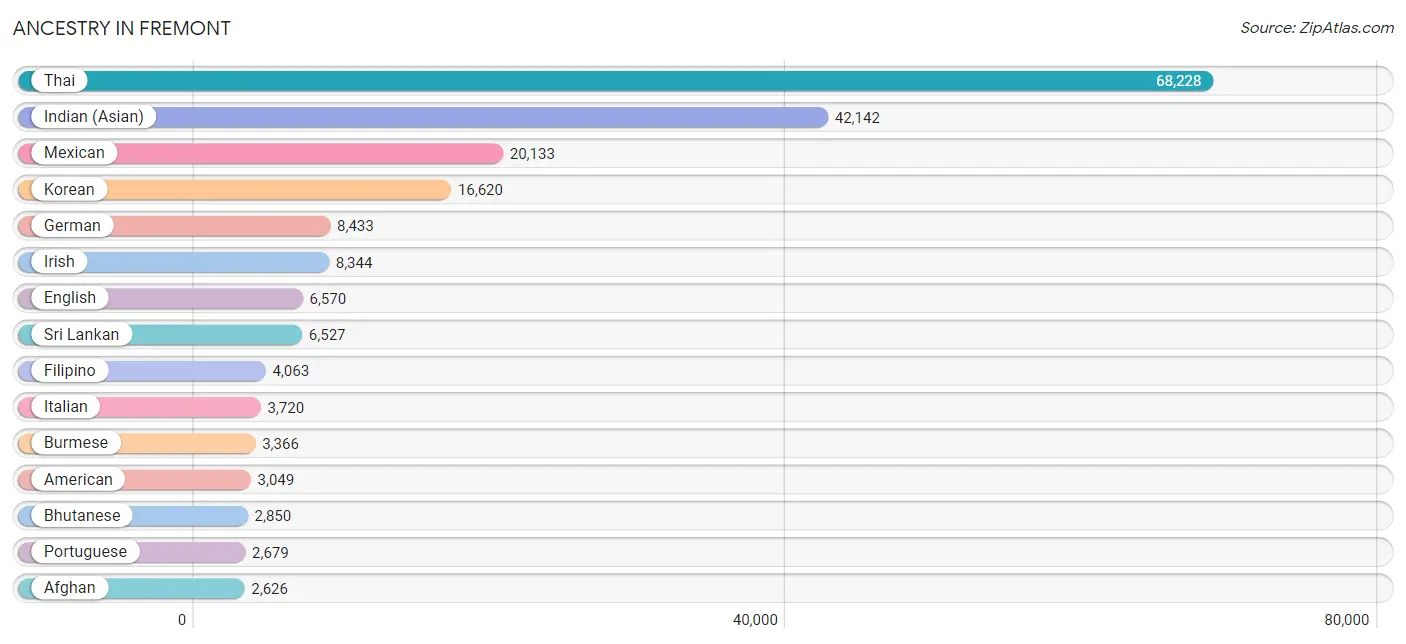
Ancestry in Fremont
The most populous ancestries reported in Fremont are Thai (68,228 | 29.8%), Indian (Asian) (42,142 | 18.4%), Mexican (20,133 | 8.8%), Korean (16,620 | 7.3%), and German (8,433 | 3.7%), together accounting for 68.0% of all Fremont residents.
| Ancestry | # Population | % Population |
| Afghan | 2,626 | 1.1% |
| African | 336 | 0.2% |
| American | 3,049 | 1.3% |
| Apache | 64 | 0.0% |
| Arab | 1,873 | 0.8% |
| Argentinean | 55 | 0.0% |
| Armenian | 395 | 0.2% |
| Assyrian / Chaldean / Syriac | 47 | 0.0% |
| Australian | 28 | 0.0% |
| Austrian | 101 | 0.0% |
| Bangladeshi | 84 | 0.0% |
| Barbadian | 25 | 0.0% |
| Basque | 15 | 0.0% |
| Belgian | 15 | 0.0% |
| Belizean | 24 | 0.0% |
| Bhutanese | 2,850 | 1.3% |
| Blackfeet | 118 | 0.1% |
| Bolivian | 27 | 0.0% |
| Brazilian | 322 | 0.1% |
| British | 1,086 | 0.5% |
| Bulgarian | 56 | 0.0% |
| Burmese | 3,366 | 1.5% |
| Cambodian | 115 | 0.1% |
| Canadian | 179 | 0.1% |
| Celtic | 16 | 0.0% |
| Central American | 1,880 | 0.8% |
| Central American Indian | 130 | 0.1% |
| Cherokee | 392 | 0.2% |
| Chickasaw | 6 | 0.0% |
| Chilean | 50 | 0.0% |
| Chinese | 15 | 0.0% |
| Chippewa | 65 | 0.0% |
| Choctaw | 112 | 0.1% |
| Colombian | 923 | 0.4% |
| Costa Rican | 76 | 0.0% |
| Creek | 8 | 0.0% |
| Croatian | 516 | 0.2% |
| Cuban | 124 | 0.1% |
| Czech | 443 | 0.2% |
| Czechoslovakian | 154 | 0.1% |
| Danish | 377 | 0.2% |
| Dominican | 107 | 0.1% |
| Dutch | 730 | 0.3% |
| Dutch West Indian | 13 | 0.0% |
| Eastern European | 268 | 0.1% |
| Ecuadorian | 20 | 0.0% |
| Egyptian | 122 | 0.1% |
| English | 6,570 | 2.9% |
| Ethiopian | 403 | 0.2% |
| European | 1,529 | 0.7% |
| Filipino | 4,063 | 1.8% |
| Finnish | 75 | 0.0% |
| French | 1,795 | 0.8% |
| French American Indian | 6 | 0.0% |
| French Canadian | 203 | 0.1% |
| German | 8,433 | 3.7% |
| Greek | 439 | 0.2% |
| Guamanian / Chamorro | 311 | 0.1% |
| Guatemalan | 189 | 0.1% |
| Haitian | 57 | 0.0% |
| Honduran | 123 | 0.1% |
| Hungarian | 300 | 0.1% |
| Icelander | 66 | 0.0% |
| Indian (Asian) | 42,142 | 18.4% |
| Indonesian | 1,622 | 0.7% |
| Inupiat | 2 | 0.0% |
| Iranian | 963 | 0.4% |
| Iraqi | 67 | 0.0% |
| Irish | 8,344 | 3.6% |
| Iroquois | 61 | 0.0% |
| Israeli | 18 | 0.0% |
| Italian | 3,720 | 1.6% |
| Jamaican | 91 | 0.0% |
| Japanese | 445 | 0.2% |
| Jordanian | 224 | 0.1% |
| Kenyan | 83 | 0.0% |
| Korean | 16,620 | 7.3% |
| Laotian | 388 | 0.2% |
| Latvian | 19 | 0.0% |
| Lebanese | 392 | 0.2% |
| Liberian | 69 | 0.0% |
| Lithuanian | 66 | 0.0% |
| Macedonian | 19 | 0.0% |
| Malaysian | 63 | 0.0% |
| Maltese | 18 | 0.0% |
| Mexican | 20,133 | 8.8% |
| Mexican American Indian | 308 | 0.1% |
| Mongolian | 126 | 0.1% |
| Moroccan | 212 | 0.1% |
| Native Hawaiian | 1,205 | 0.5% |
| Navajo | 169 | 0.1% |
| Nepalese | 82 | 0.0% |
| New Zealander | 26 | 0.0% |
| Nicaraguan | 449 | 0.2% |
| Nigerian | 114 | 0.1% |
| Northern European | 313 | 0.1% |
| Norwegian | 679 | 0.3% |
| Okinawan | 97 | 0.0% |
| Osage | 8 | 0.0% |
| Ottawa | 12 | 0.0% |
| Paiute | 9 | 0.0% |
| Pakistani | 515 | 0.2% |
| Palestinian | 43 | 0.0% |
| Panamanian | 107 | 0.1% |
| Pennsylvania German | 10 | 0.0% |
| Peruvian | 352 | 0.2% |
| Polish | 1,029 | 0.4% |
| Portuguese | 2,679 | 1.2% |
| Pueblo | 11 | 0.0% |
| Puerto Rican | 1,547 | 0.7% |
| Puget Sound Salish | 9 | 0.0% |
| Romanian | 320 | 0.1% |
| Russian | 1,025 | 0.4% |
| Salvadoran | 885 | 0.4% |
| Samoan | 405 | 0.2% |
| Scandinavian | 91 | 0.0% |
| Scotch-Irish | 540 | 0.2% |
| Scottish | 1,516 | 0.7% |
| Seminole | 32 | 0.0% |
| Serbian | 81 | 0.0% |
| Sioux | 2 | 0.0% |
| Slavic | 38 | 0.0% |
| Slovak | 44 | 0.0% |
| Slovene | 10 | 0.0% |
| South African | 44 | 0.0% |
| South American | 1,549 | 0.7% |
| Spaniard | 802 | 0.4% |
| Spanish | 763 | 0.3% |
| Sri Lankan | 6,527 | 2.9% |
| Subsaharan African | 1,078 | 0.5% |
| Swedish | 761 | 0.3% |
| Swiss | 318 | 0.1% |
| Syrian | 104 | 0.1% |
| Thai | 68,228 | 29.8% |
| Tohono O'Odham | 68 | 0.0% |
| Tongan | 386 | 0.2% |
| Trinidadian and Tobagonian | 77 | 0.0% |
| Turkish | 164 | 0.1% |
| Ugandan | 12 | 0.0% |
| Ukrainian | 513 | 0.2% |
| Ute | 16 | 0.0% |
| Venezuelan | 122 | 0.1% |
| Vietnamese | 336 | 0.2% |
| Welsh | 298 | 0.1% |
| West Indian | 24 | 0.0% |
| Yaqui | 20 | 0.0% |
| Yugoslavian | 32 | 0.0% | View All 147 Rows |
Immigrants in Fremont
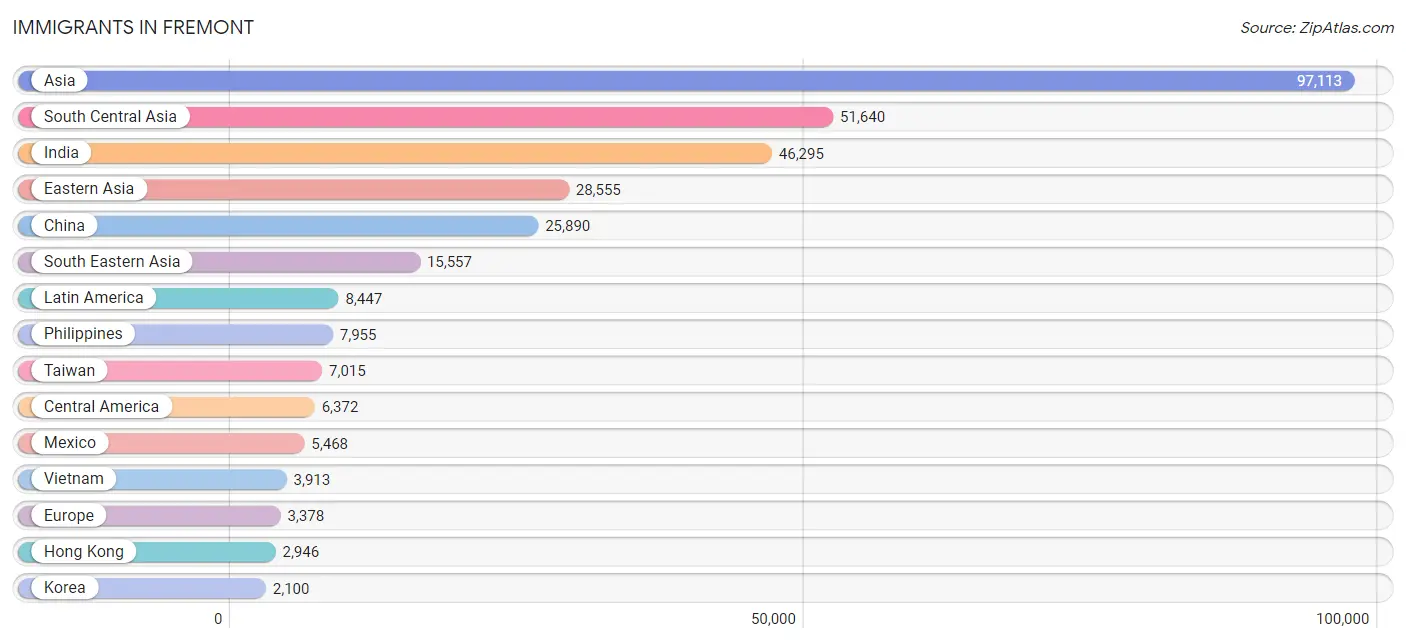
The most numerous immigrant groups reported in Fremont came from Asia (97,113 | 42.4%), South Central Asia (51,640 | 22.6%), India (46,295 | 20.2%), Eastern Asia (28,555 | 12.5%), and China (25,890 | 11.3%), together accounting for 109.1% of all Fremont residents.
| Immigration Origin | # Population | % Population |
| Afghanistan | 1,880 | 0.8% |
| Africa | 1,495 | 0.6% |
| Argentina | 34 | 0.0% |
| Armenia | 124 | 0.1% |
| Asia | 97,113 | 42.4% |
| Australia | 83 | 0.0% |
| Austria | 40 | 0.0% |
| Azores | 16 | 0.0% |
| Bangladesh | 859 | 0.4% |
| Belarus | 46 | 0.0% |
| Bolivia | 27 | 0.0% |
| Bosnia and Herzegovina | 11 | 0.0% |
| Brazil | 424 | 0.2% |
| Bulgaria | 15 | 0.0% |
| Cambodia | 142 | 0.1% |
| Canada | 693 | 0.3% |
| Caribbean | 313 | 0.1% |
| Central America | 6,372 | 2.8% |
| Chile | 23 | 0.0% |
| China | 25,890 | 11.3% |
| Colombia | 748 | 0.3% |
| Congo | 11 | 0.0% |
| Costa Rica | 46 | 0.0% |
| Croatia | 217 | 0.1% |
| Cuba | 45 | 0.0% |
| Dominican Republic | 58 | 0.0% |
| Eastern Africa | 725 | 0.3% |
| Eastern Asia | 28,555 | 12.5% |
| Eastern Europe | 1,494 | 0.6% |
| Egypt | 128 | 0.1% |
| El Salvador | 356 | 0.2% |
| England | 180 | 0.1% |
| Eritrea | 269 | 0.1% |
| Ethiopia | 237 | 0.1% |
| Europe | 3,378 | 1.5% |
| Fiji | 330 | 0.1% |
| France | 180 | 0.1% |
| Germany | 353 | 0.2% |
| Ghana | 14 | 0.0% |
| Greece | 86 | 0.0% |
| Guatemala | 95 | 0.0% |
| Guyana | 6 | 0.0% |
| Haiti | 57 | 0.0% |
| Honduras | 117 | 0.1% |
| Hong Kong | 2,946 | 1.3% |
| Hungary | 49 | 0.0% |
| India | 46,295 | 20.2% |
| Indonesia | 499 | 0.2% |
| Iran | 792 | 0.4% |
| Iraq | 65 | 0.0% |
| Ireland | 25 | 0.0% |
| Israel | 166 | 0.1% |
| Italy | 270 | 0.1% |
| Jamaica | 103 | 0.1% |
| Japan | 554 | 0.2% |
| Jordan | 161 | 0.1% |
| Kenya | 157 | 0.1% |
| Korea | 2,100 | 0.9% |
| Kuwait | 40 | 0.0% |
| Laos | 26 | 0.0% |
| Latin America | 8,447 | 3.7% |
| Latvia | 36 | 0.0% |
| Lebanon | 293 | 0.1% |
| Liberia | 72 | 0.0% |
| Malaysia | 493 | 0.2% |
| Mexico | 5,468 | 2.4% |
| Middle Africa | 11 | 0.0% |
| Moldova | 47 | 0.0% |
| Morocco | 145 | 0.1% |
| Nepal | 122 | 0.1% |
| Netherlands | 120 | 0.1% |
| Nicaragua | 212 | 0.1% |
| Nigeria | 73 | 0.0% |
| Northern Africa | 422 | 0.2% |
| Northern Europe | 526 | 0.2% |
| Norway | 8 | 0.0% |
| Oceania | 563 | 0.3% |
| Pakistan | 1,528 | 0.7% |
| Panama | 78 | 0.0% |
| Peru | 401 | 0.2% |
| Philippines | 7,955 | 3.5% |
| Poland | 38 | 0.0% |
| Portugal | 168 | 0.1% |
| Romania | 119 | 0.1% |
| Russia | 407 | 0.2% |
| Saudi Arabia | 31 | 0.0% |
| Scotland | 11 | 0.0% |
| Serbia | 14 | 0.0% |
| Singapore | 326 | 0.1% |
| South Africa | 92 | 0.0% |
| South America | 1,762 | 0.8% |
| South Central Asia | 51,640 | 22.6% |
| South Eastern Asia | 15,557 | 6.8% |
| Southern Europe | 581 | 0.3% |
| Spain | 53 | 0.0% |
| Sri Lanka | 130 | 0.1% |
| Sudan | 38 | 0.0% |
| Switzerland | 60 | 0.0% |
| Syria | 18 | 0.0% |
| Taiwan | 7,015 | 3.1% |
| Thailand | 356 | 0.2% |
| Trinidad and Tobago | 50 | 0.0% |
| Turkey | 79 | 0.0% |
| Uganda | 18 | 0.0% |
| Ukraine | 409 | 0.2% |
| Uzbekistan | 13 | 0.0% |
| Venezuela | 99 | 0.0% |
| Vietnam | 3,913 | 1.7% |
| Western Africa | 175 | 0.1% |
| Western Asia | 1,263 | 0.5% |
| Western Europe | 753 | 0.3% |
| Yemen | 57 | 0.0% | View All 112 Rows |
Sex and Age in Fremont
Sex and Age in Fremont
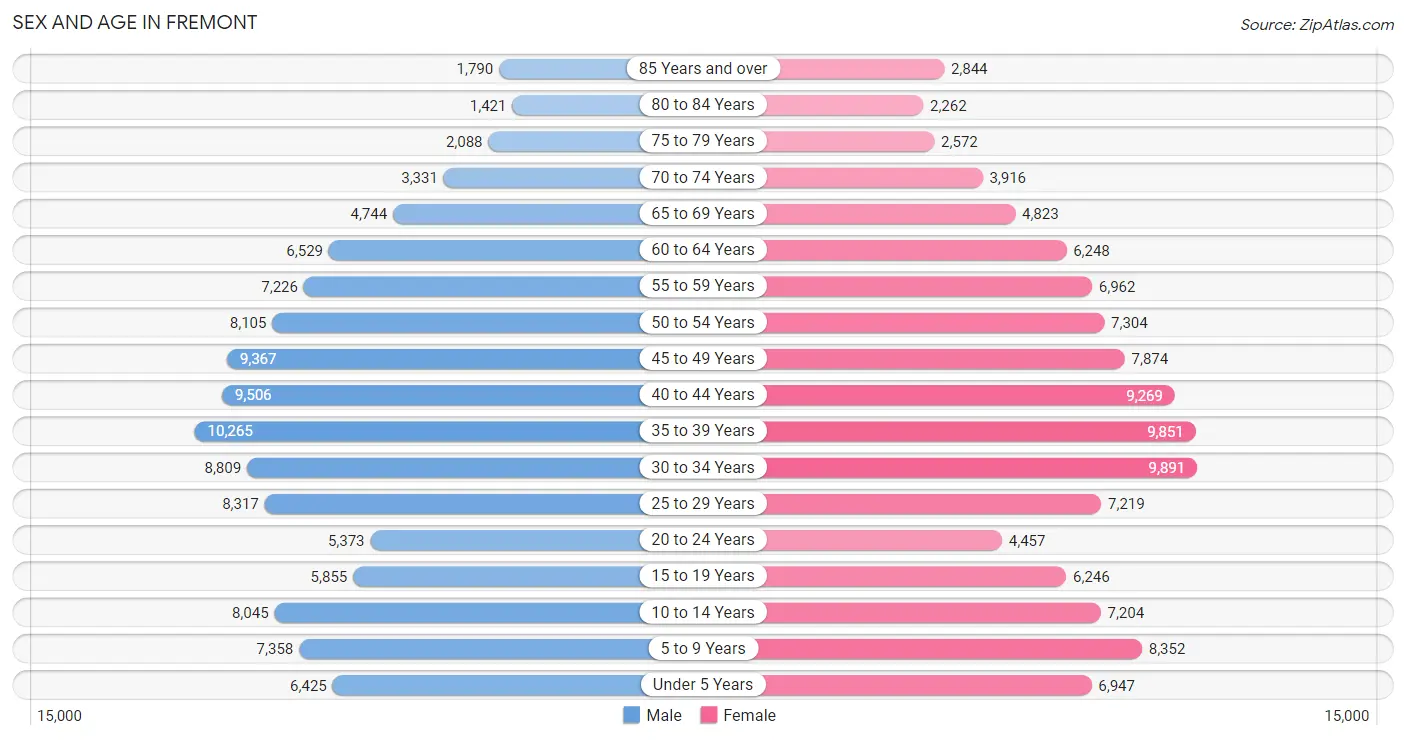
The most populous age groups in Fremont are 35 to 39 Years (10,265 | 9.0%) for men and 30 to 34 Years (9,891 | 8.7%) for women.
| Age Bracket | Male | Female |
| Under 5 Years | 6,425 (5.6%) | 6,947 (6.1%) |
| 5 to 9 Years | 7,358 (6.4%) | 8,352 (7.3%) |
| 10 to 14 Years | 8,045 (7.0%) | 7,204 (6.3%) |
| 15 to 19 Years | 5,855 (5.1%) | 6,246 (5.5%) |
| 20 to 24 Years | 5,373 (4.7%) | 4,457 (3.9%) |
| 25 to 29 Years | 8,317 (7.3%) | 7,219 (6.3%) |
| 30 to 34 Years | 8,809 (7.7%) | 9,891 (8.7%) |
| 35 to 39 Years | 10,265 (9.0%) | 9,851 (8.6%) |
| 40 to 44 Years | 9,506 (8.3%) | 9,269 (8.1%) |
| 45 to 49 Years | 9,367 (8.2%) | 7,874 (6.9%) |
| 50 to 54 Years | 8,105 (7.1%) | 7,304 (6.4%) |
| 55 to 59 Years | 7,226 (6.3%) | 6,962 (6.1%) |
| 60 to 64 Years | 6,529 (5.7%) | 6,248 (5.5%) |
| 65 to 69 Years | 4,744 (4.1%) | 4,823 (4.2%) |
| 70 to 74 Years | 3,331 (2.9%) | 3,916 (3.4%) |
| 75 to 79 Years | 2,088 (1.8%) | 2,572 (2.2%) |
| 80 to 84 Years | 1,421 (1.2%) | 2,262 (2.0%) |
| 85 Years and over | 1,790 (1.6%) | 2,844 (2.5%) |
| Total | 114,554 (100.0%) | 114,241 (100.0%) |
Families and Households in Fremont
Median Family Size in Fremont
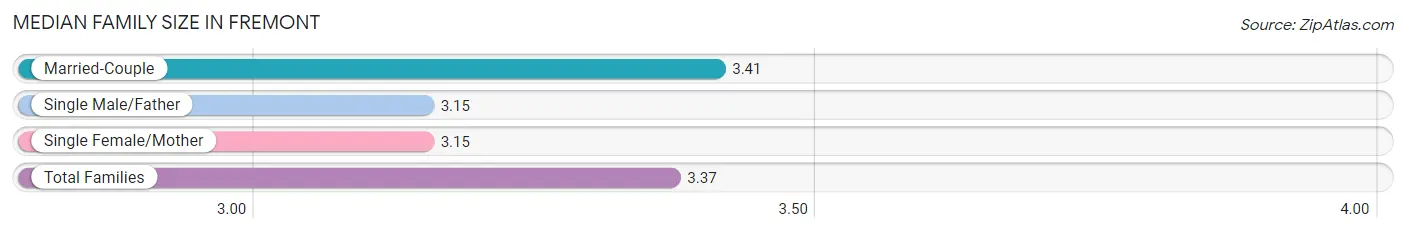
The median family size in Fremont is 3.37 persons per family, with married-couple families (50,431 | 84.6%) accounting for the largest median family size of 3.41 persons per family. On the other hand, single male/father families (3,002 | 5.0%) represent the smallest median family size with 3.15 persons per family.
| Family Type | # Families | Family Size |
| Married-Couple | 50,431 (84.6%) | 3.41 |
| Single Male/Father | 3,002 (5.0%) | 3.15 |
| Single Female/Mother | 6,178 (10.4%) | 3.15 |
| Total Families | 59,611 (100.0%) | 3.37 |
Median Household Size in Fremont
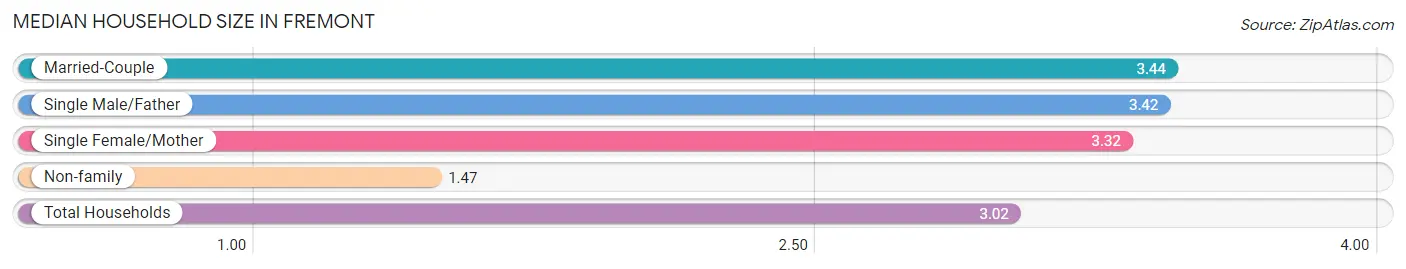
The median household size in Fremont is 3.02 persons per household, with married-couple households (50,431 | 67.2%) accounting for the largest median household size of 3.44 persons per household. non-family households (15,384 | 20.5%) represent the smallest median household size with 1.47 persons per household.
| Household Type | # Households | Household Size |
| Married-Couple | 50,431 (67.2%) | 3.44 |
| Single Male/Father | 3,002 (4.0%) | 3.42 |
| Single Female/Mother | 6,178 (8.2%) | 3.32 |
| Non-family | 15,384 (20.5%) | 1.47 |
| Total Households | 74,995 (100.0%) | 3.02 |
Household Size by Marriage Status in Fremont
Out of a total of 74,995 households in Fremont, 59,611 (79.5%) are family households, while 15,384 (20.5%) are nonfamily households. The most numerous type of family households are 2-person households, comprising 17,896, and the most common type of nonfamily households are 1-person households, comprising 11,500.
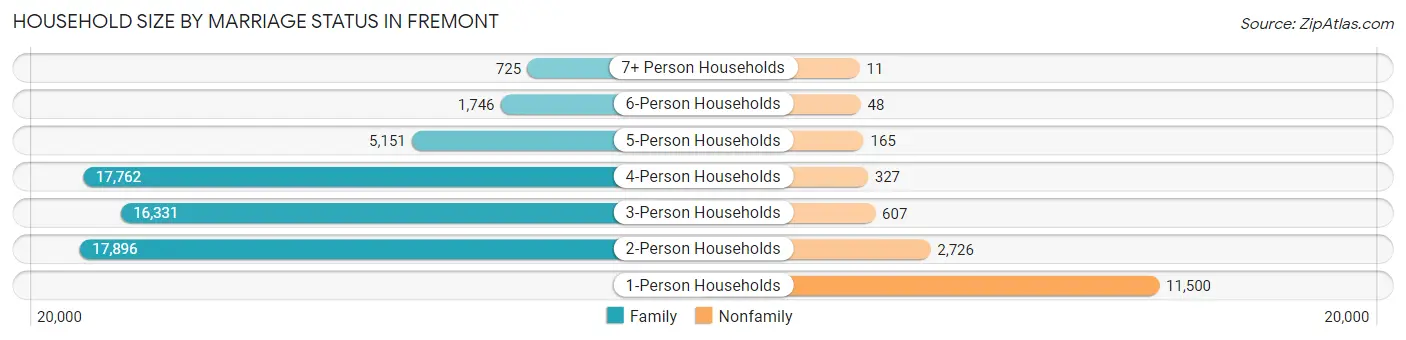
| Household Size | Family Households | Nonfamily Households |
| 1-Person Households | - | 11,500 (15.3%) |
| 2-Person Households | 17,896 (23.9%) | 2,726 (3.6%) |
| 3-Person Households | 16,331 (21.8%) | 607 (0.8%) |
| 4-Person Households | 17,762 (23.7%) | 327 (0.4%) |
| 5-Person Households | 5,151 (6.9%) | 165 (0.2%) |
| 6-Person Households | 1,746 (2.3%) | 48 (0.1%) |
| 7+ Person Households | 725 (1.0%) | 11 (0.0%) |
| Total | 59,611 (79.5%) | 15,384 (20.5%) |
Female Fertility in Fremont
Fertility by Age in Fremont
Average fertility rate in Fremont is 44.0 births per 1,000 women. Women in the age bracket of 20 to 34 years have the highest fertility rate with 68.0 births per 1,000 women. Women in the age bracket of 20 to 34 years acount for 59.4% of all women with births.
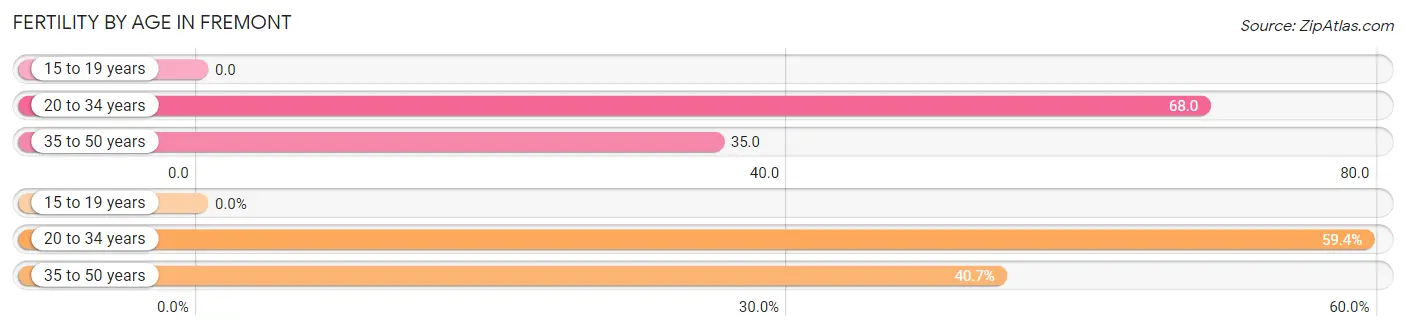
| Age Bracket | Women with Births | Births / 1,000 Women |
| 15 to 19 years | 0 (0.0%) | 0.0 |
| 20 to 34 years | 1,463 (59.4%) | 68.0 |
| 35 to 50 years | 1,002 (40.6%) | 35.0 |
| Total | 2,465 (100.0%) | 44.0 |
Fertility by Age by Marriage Status in Fremont
92.0% of women with births (2,465) in Fremont are married. The highest percentage of unmarried women with births falls into 20 to 34 years age bracket with 10.3% of them unmarried at the time of birth, while the lowest percentage of unmarried women with births belong to 35 to 50 years age bracket with 4.6% of them unmarried.
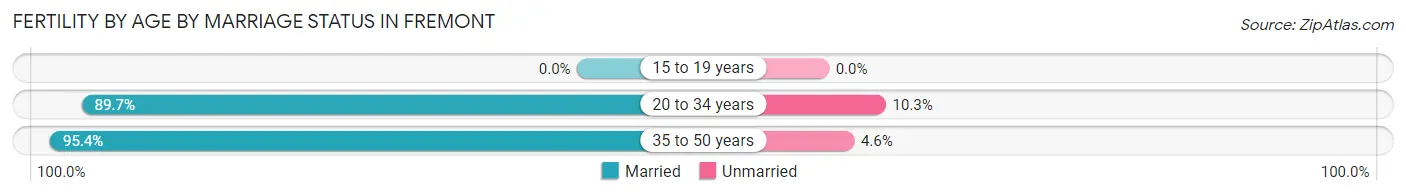
| Age Bracket | Married | Unmarried |
| 15 to 19 years | 0 (0.0%) | 0 (0.0%) |
| 20 to 34 years | 1,312 (89.7%) | 151 (10.3%) |
| 35 to 50 years | 956 (95.4%) | 46 (4.6%) |
| Total | 2,268 (92.0%) | 197 (8.0%) |
Fertility by Education in Fremont
Average fertility rate in Fremont is 44.0 births per 1,000 women. Women with the education attainment of graduate degree have the highest fertility rate of 67.0 births per 1,000 women, while women with the education attainment of college or associate's degree have the lowest fertility at 11.0 births per 1,000 women. Women with the education attainment of graduate degree represent 42.5% of all women with births.
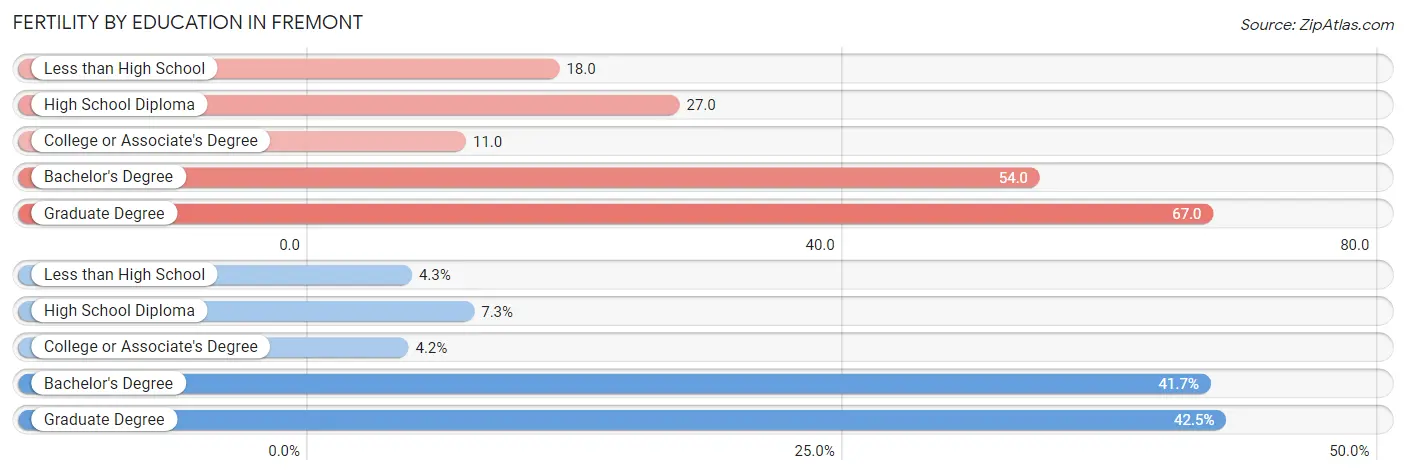
| Educational Attainment | Women with Births | Births / 1,000 Women |
| Less than High School | 107 (4.3%) | 18.0 |
| High School Diploma | 179 (7.3%) | 27.0 |
| College or Associate's Degree | 103 (4.2%) | 11.0 |
| Bachelor's Degree | 1,029 (41.7%) | 54.0 |
| Graduate Degree | 1,047 (42.5%) | 67.0 |
| Total | 2,465 (100.0%) | 44.0 |
Fertility by Education by Marriage Status in Fremont
8.0% of women with births in Fremont are unmarried. Women with the educational attainment of graduate degree are most likely to be married with 99.2% of them married at childbirth, while women with the educational attainment of college or associate's degree are least likely to be married with 55.3% of them unmarried at childbirth.
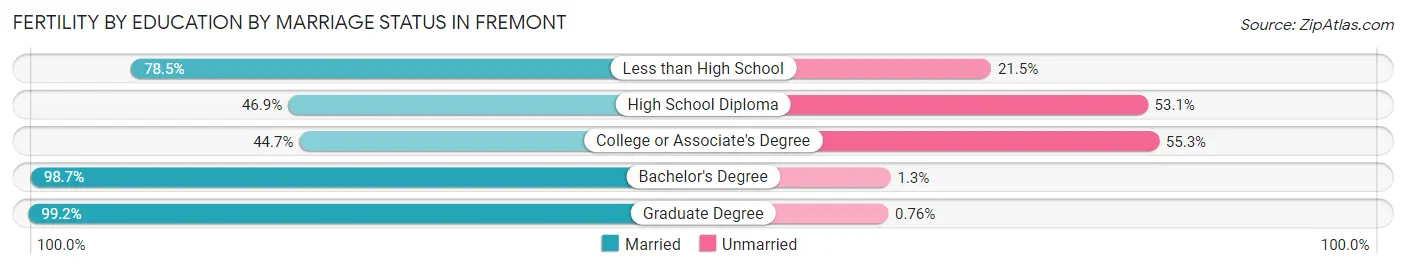
| Educational Attainment | Married | Unmarried |
| Less than High School | 84 (78.5%) | 23 (21.5%) |
| High School Diploma | 84 (46.9%) | 95 (53.1%) |
| College or Associate's Degree | 46 (44.7%) | 57 (55.3%) |
| Bachelor's Degree | 1,016 (98.7%) | 13 (1.3%) |
| Graduate Degree | 1,039 (99.2%) | 8 (0.8%) |
| Total | 2,268 (92.0%) | 197 (8.0%) |
Employment Characteristics in Fremont
Employment by Class of Employer in Fremont
Among the 105,115 employed individuals in Fremont, private company employees (82,042 | 78.0%), not-for-profit organizations (6,289 | 6.0%), and local government employees (6,077 | 5.8%) make up the most common classes of employment.
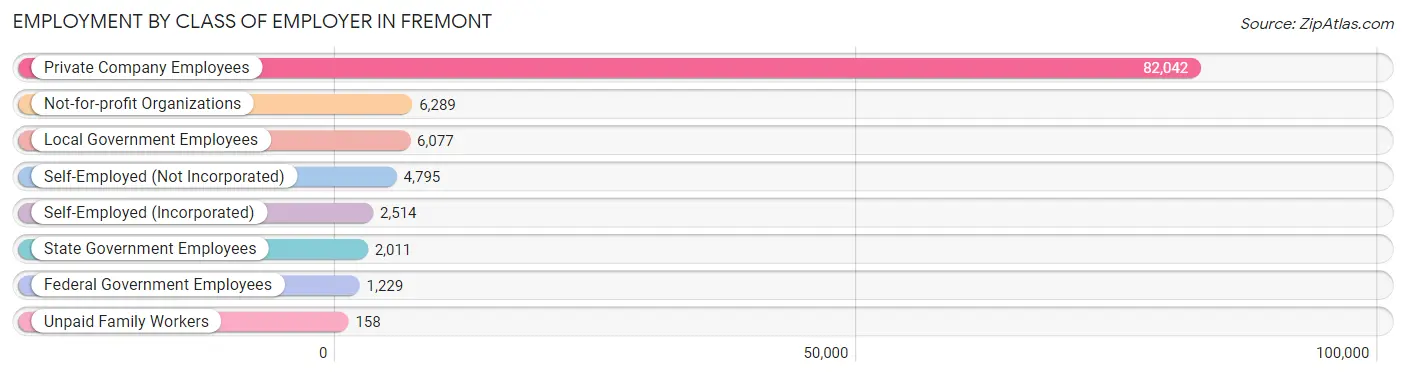
| Employer Class | # Employees | % Employees |
| Private Company Employees | 82,042 | 78.0% |
| Self-Employed (Incorporated) | 2,514 | 2.4% |
| Self-Employed (Not Incorporated) | 4,795 | 4.6% |
| Not-for-profit Organizations | 6,289 | 6.0% |
| Local Government Employees | 6,077 | 5.8% |
| State Government Employees | 2,011 | 1.9% |
| Federal Government Employees | 1,229 | 1.2% |
| Unpaid Family Workers | 158 | 0.2% |
| Total | 105,115 | 100.0% |
Employment Status by Age in Fremont
According to the labor force statistics for Fremont, out of the total population over 16 years of age (181,988), 67.5% or 122,842 individuals are in the labor force, with 4.0% or 4,914 of them unemployed. The age group with the highest labor force participation rate is 35 to 44 years, with 85.8% or 33,368 individuals in the labor force. Within the labor force, the 16 to 19 years age range has the highest percentage of unemployed individuals, with 12.5% or 315 of them being unemployed.
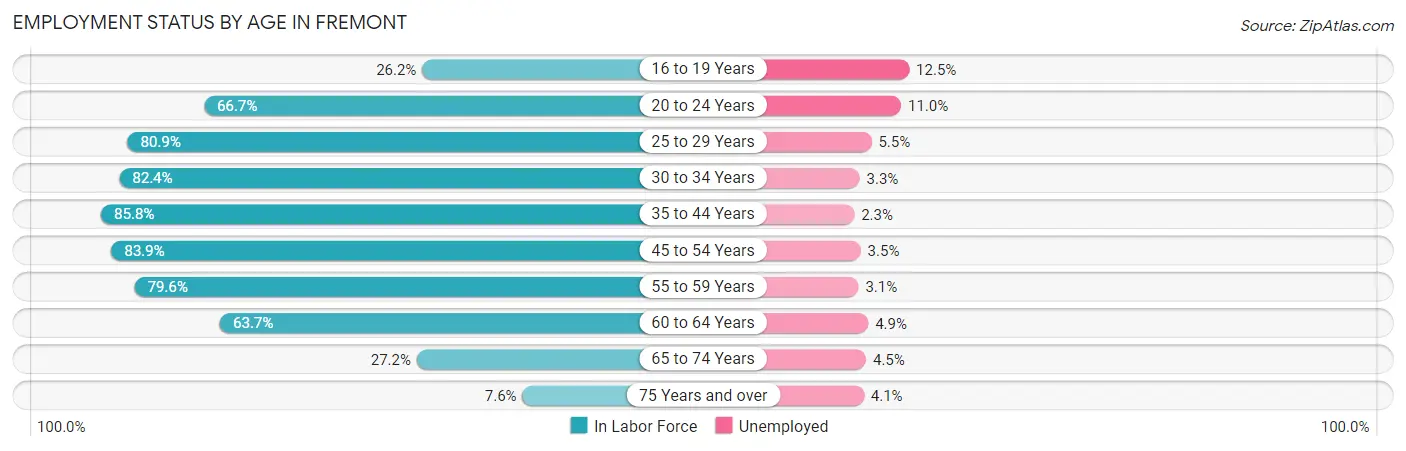
| Age Bracket | In Labor Force | Unemployed |
| 16 to 19 Years | 2,522 (26.2%) | 315 (12.5%) |
| 20 to 24 Years | 6,557 (66.7%) | 721 (11.0%) |
| 25 to 29 Years | 12,569 (80.9%) | 691 (5.5%) |
| 30 to 34 Years | 15,409 (82.4%) | 508 (3.3%) |
| 35 to 44 Years | 33,368 (85.8%) | 767 (2.3%) |
| 45 to 54 Years | 27,393 (83.9%) | 959 (3.5%) |
| 55 to 59 Years | 11,294 (79.6%) | 350 (3.1%) |
| 60 to 64 Years | 8,139 (63.7%) | 399 (4.9%) |
| 65 to 74 Years | 4,573 (27.2%) | 206 (4.5%) |
| 75 Years and over | 986 (7.6%) | 40 (4.1%) |
| Total | 122,842 (67.5%) | 4,914 (4.0%) |
Employment Status by Educational Attainment in Fremont
According to labor force statistics for Fremont, 81.5% of individuals (108,185) out of the total population between 25 and 64 years of age (132,742) are in the labor force, with 3.4% or 3,678 of them being unemployed. The group with the highest labor force participation rate are those with the educational attainment of bachelor's degree or higher, with 85.1% or 75,342 individuals in the labor force. Within the labor force, individuals with high school diploma education have the highest percentage of unemployment, with 5.3% or 660 of them being unemployed.
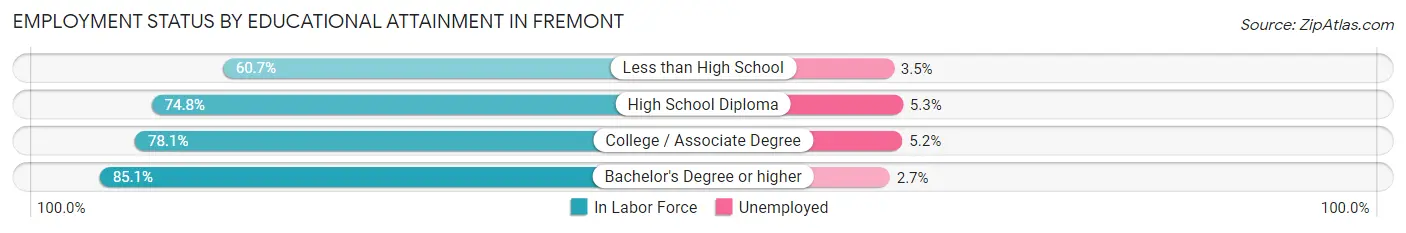
| Educational Attainment | In Labor Force | Unemployed |
| Less than High School | 4,034 (60.7%) | 233 (3.5%) |
| High School Diploma | 12,462 (74.8%) | 883 (5.3%) |
| College / Associate Degree | 16,324 (78.1%) | 1,087 (5.2%) |
| Bachelor's Degree or higher | 75,342 (85.1%) | 2,390 (2.7%) |
| Total | 108,185 (81.5%) | 4,513 (3.4%) |
Employment Occupations by Sex in Fremont
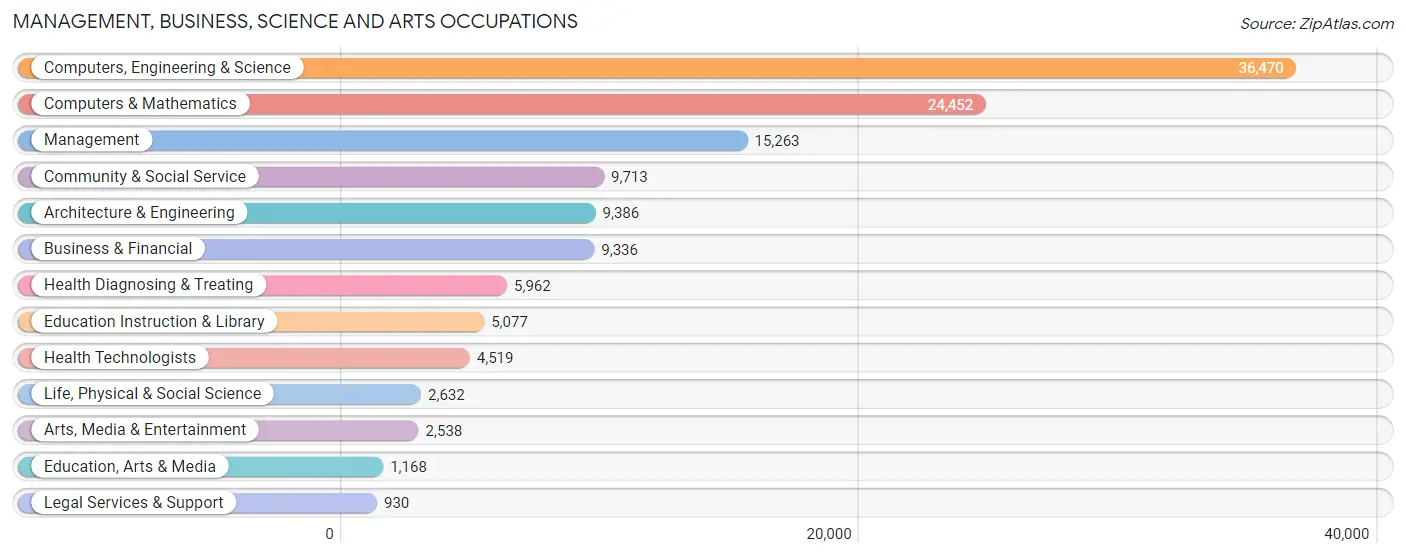
Management, Business, Science and Arts Occupations
The most common Management, Business, Science and Arts occupations in Fremont are Computers, Engineering & Science (36,470 | 31.0%), Computers & Mathematics (24,452 | 20.8%), Management (15,263 | 13.0%), Community & Social Service (9,713 | 8.3%), and Architecture & Engineering (9,386 | 8.0%).
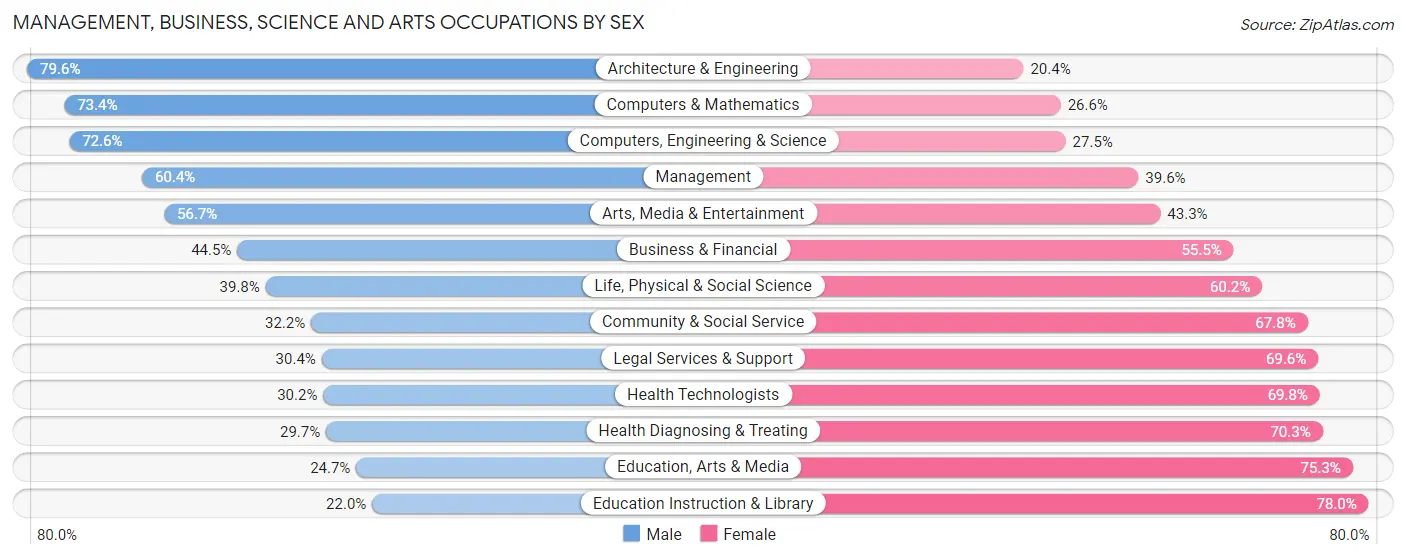
Management, Business, Science and Arts Occupations by Sex
Within the Management, Business, Science and Arts occupations in Fremont, the most male-oriented occupations are Architecture & Engineering (79.6%), Computers & Mathematics (73.4%), and Computers, Engineering & Science (72.6%), while the most female-oriented occupations are Education Instruction & Library (78.0%), Education, Arts & Media (75.3%), and Health Diagnosing & Treating (70.3%).
| Occupation | Male | Female |
| Management | 9,220 (60.4%) | 6,043 (39.6%) |
| Business & Financial | 4,156 (44.5%) | 5,180 (55.5%) |
| Computers, Engineering & Science | 26,460 (72.6%) | 10,010 (27.5%) |
| Computers & Mathematics | 17,943 (73.4%) | 6,509 (26.6%) |
| Architecture & Engineering | 7,470 (79.6%) | 1,916 (20.4%) |
| Life, Physical & Social Science | 1,047 (39.8%) | 1,585 (60.2%) |
| Community & Social Service | 3,128 (32.2%) | 6,585 (67.8%) |
| Education, Arts & Media | 288 (24.7%) | 880 (75.3%) |
| Legal Services & Support | 283 (30.4%) | 647 (69.6%) |
| Education Instruction & Library | 1,117 (22.0%) | 3,960 (78.0%) |
| Arts, Media & Entertainment | 1,440 (56.7%) | 1,098 (43.3%) |
| Health Diagnosing & Treating | 1,771 (29.7%) | 4,191 (70.3%) |
| Health Technologists | 1,363 (30.2%) | 3,156 (69.8%) |
| Total (Category) | 44,735 (58.3%) | 32,009 (41.7%) |
| Total (Overall) | 66,503 (56.5%) | 51,282 (43.5%) |
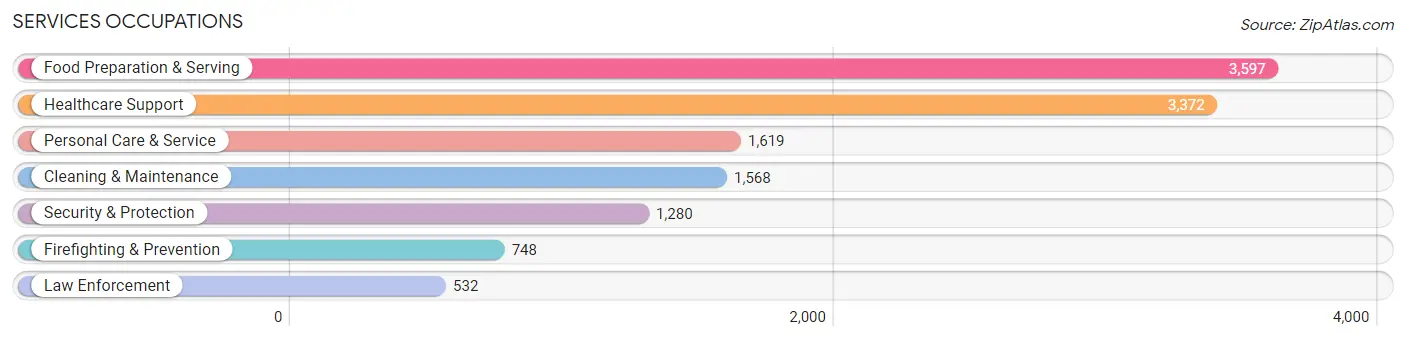
Services Occupations
The most common Services occupations in Fremont are Food Preparation & Serving (3,597 | 3.0%), Healthcare Support (3,372 | 2.9%), Personal Care & Service (1,619 | 1.4%), Cleaning & Maintenance (1,568 | 1.3%), and Security & Protection (1,280 | 1.1%).
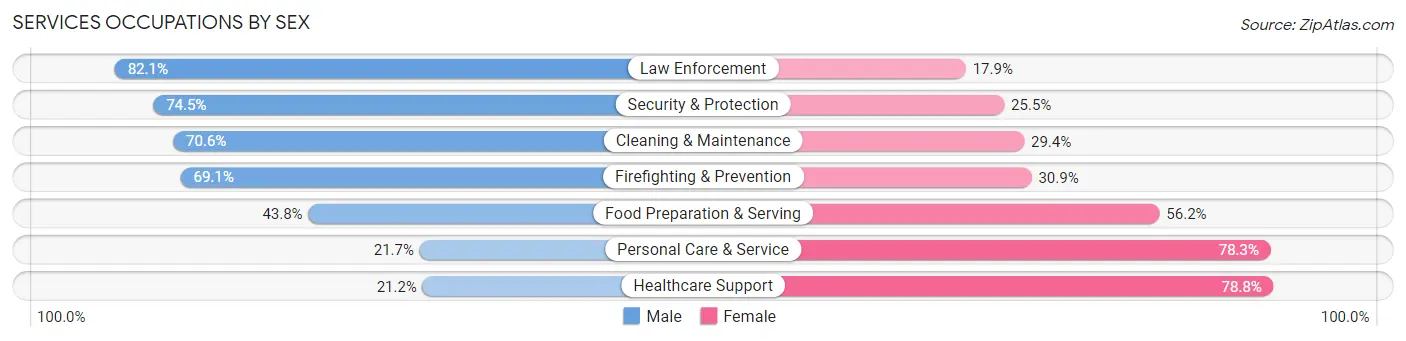
Services Occupations by Sex
Within the Services occupations in Fremont, the most male-oriented occupations are Law Enforcement (82.1%), Security & Protection (74.5%), and Cleaning & Maintenance (70.6%), while the most female-oriented occupations are Healthcare Support (78.8%), Personal Care & Service (78.3%), and Food Preparation & Serving (56.2%).
| Occupation | Male | Female |
| Healthcare Support | 714 (21.2%) | 2,658 (78.8%) |
| Security & Protection | 954 (74.5%) | 326 (25.5%) |
| Firefighting & Prevention | 517 (69.1%) | 231 (30.9%) |
| Law Enforcement | 437 (82.1%) | 95 (17.9%) |
| Food Preparation & Serving | 1,575 (43.8%) | 2,022 (56.2%) |
| Cleaning & Maintenance | 1,107 (70.6%) | 461 (29.4%) |
| Personal Care & Service | 352 (21.7%) | 1,267 (78.3%) |
| Total (Category) | 4,702 (41.1%) | 6,734 (58.9%) |
| Total (Overall) | 66,503 (56.5%) | 51,282 (43.5%) |
Sales and Office Occupations
The most common Sales and Office occupations in Fremont are Office & Administration (8,736 | 7.4%), and Sales & Related (7,727 | 6.6%).
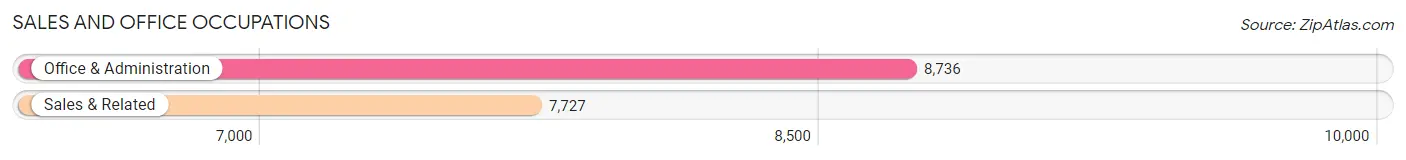
Sales and Office Occupations by Sex
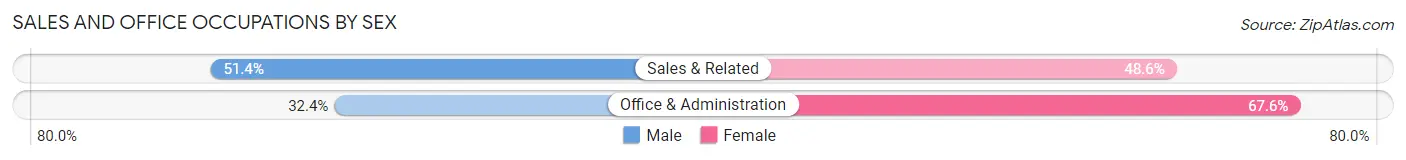
| Occupation | Male | Female |
| Sales & Related | 3,971 (51.4%) | 3,756 (48.6%) |
| Office & Administration | 2,828 (32.4%) | 5,908 (67.6%) |
| Total (Category) | 6,799 (41.3%) | 9,664 (58.7%) |
| Total (Overall) | 66,503 (56.5%) | 51,282 (43.5%) |
Natural Resources, Construction and Maintenance Occupations
The most common Natural Resources, Construction and Maintenance occupations in Fremont are Installation, Maintenance & Repair (2,275 | 1.9%), Construction & Extraction (2,181 | 1.8%), and Farming, Fishing & Forestry (83 | 0.1%).
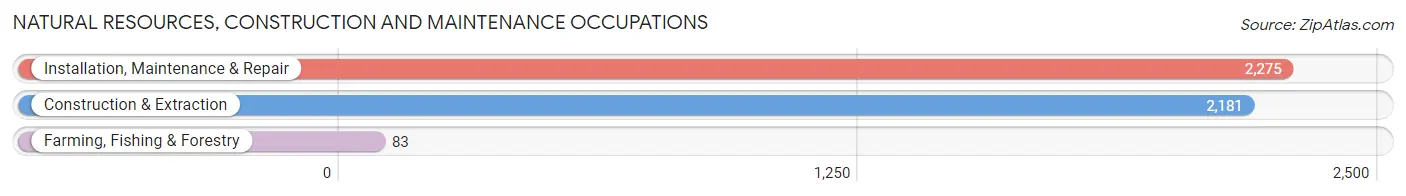
Natural Resources, Construction and Maintenance Occupations by Sex
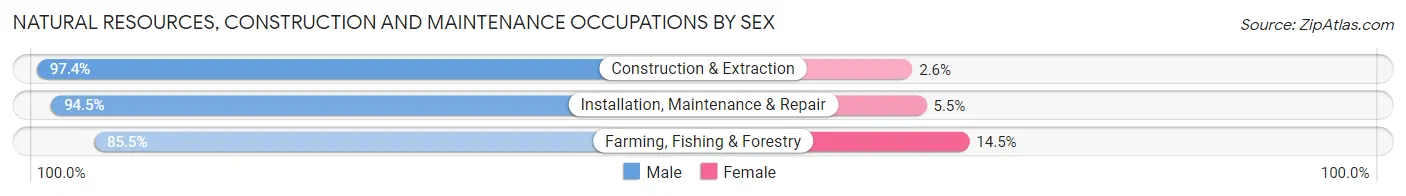
| Occupation | Male | Female |
| Farming, Fishing & Forestry | 71 (85.5%) | 12 (14.5%) |
| Construction & Extraction | 2,125 (97.4%) | 56 (2.6%) |
| Installation, Maintenance & Repair | 2,149 (94.5%) | 126 (5.5%) |
| Total (Category) | 4,345 (95.7%) | 194 (4.3%) |
| Total (Overall) | 66,503 (56.5%) | 51,282 (43.5%) |
Production, Transportation and Moving Occupations
The most common Production, Transportation and Moving occupations in Fremont are Production (3,680 | 3.1%), Material Moving (2,744 | 2.3%), and Transportation (2,179 | 1.8%).
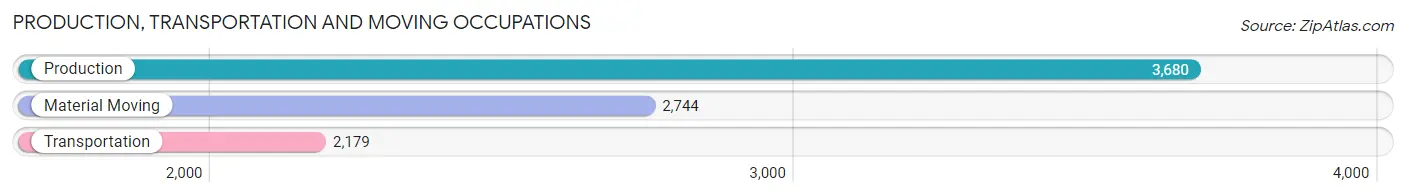
Production, Transportation and Moving Occupations by Sex
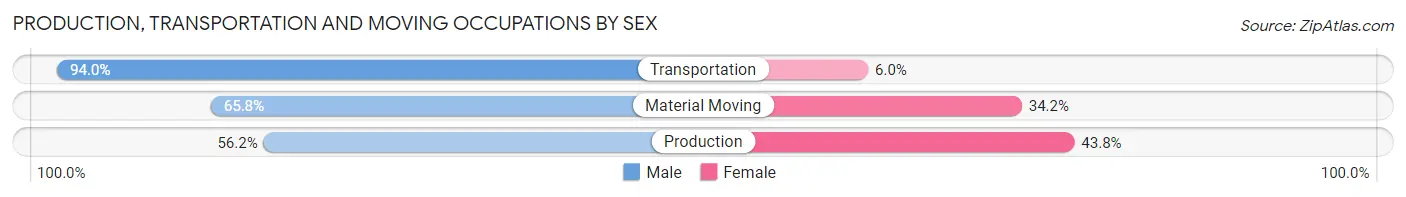
| Occupation | Male | Female |
| Production | 2,067 (56.2%) | 1,613 (43.8%) |
| Transportation | 2,049 (94.0%) | 130 (6.0%) |
| Material Moving | 1,806 (65.8%) | 938 (34.2%) |
| Total (Category) | 5,922 (68.8%) | 2,681 (31.2%) |
| Total (Overall) | 66,503 (56.5%) | 51,282 (43.5%) |
Employment Industries by Sex in Fremont
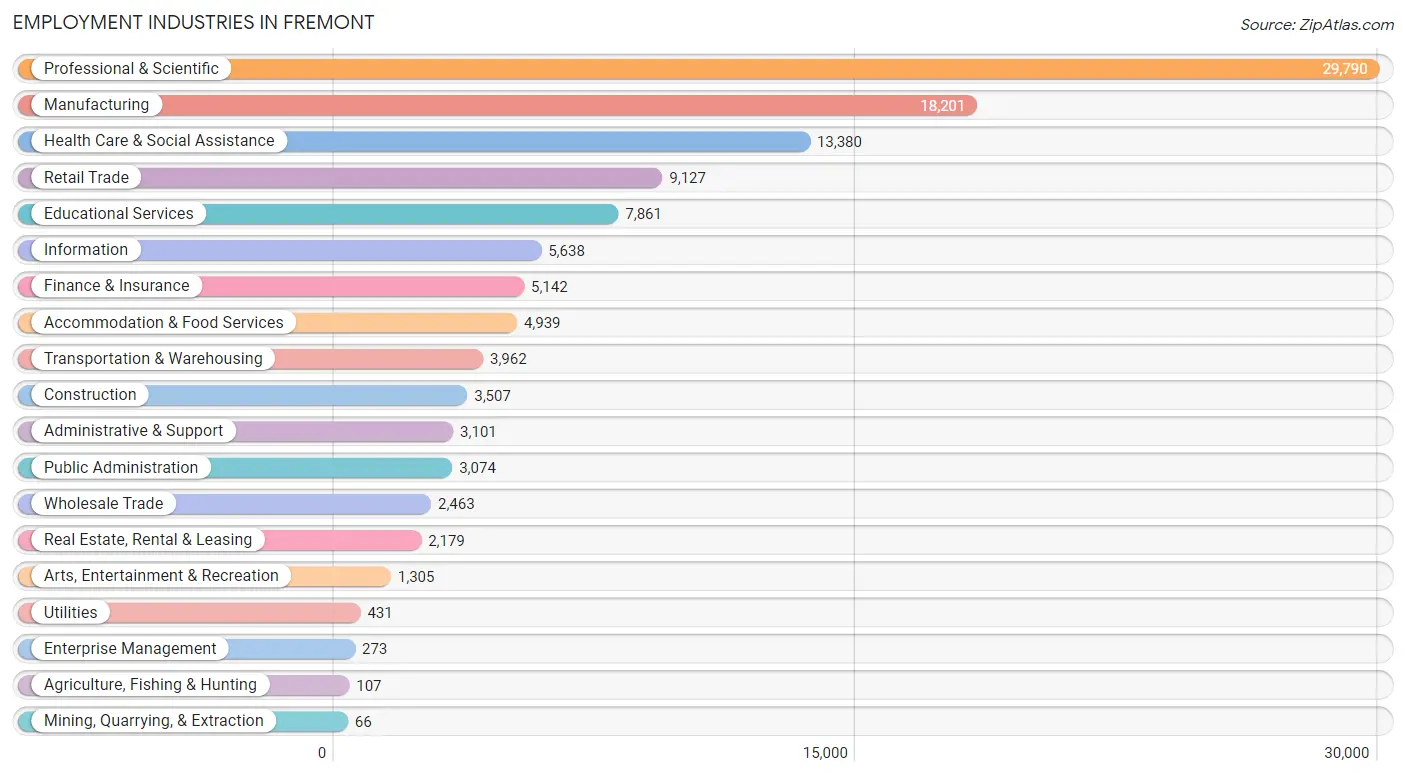
Employment Industries in Fremont
The major employment industries in Fremont include Professional & Scientific (29,790 | 25.3%), Manufacturing (18,201 | 15.4%), Health Care & Social Assistance (13,380 | 11.4%), Retail Trade (9,127 | 7.7%), and Educational Services (7,861 | 6.7%).
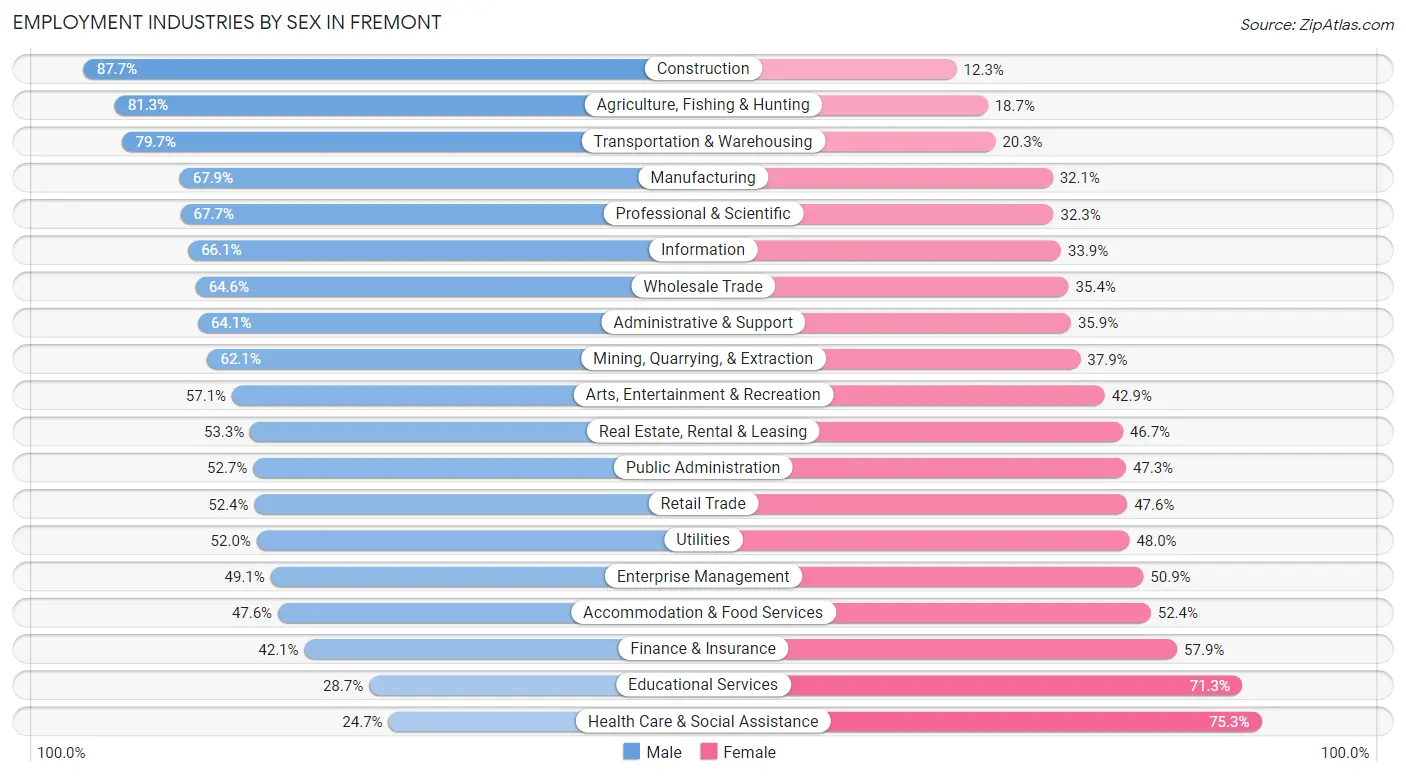
Employment Industries by Sex in Fremont
The Fremont industries that see more men than women are Construction (87.7%), Agriculture, Fishing & Hunting (81.3%), and Transportation & Warehousing (79.7%), whereas the industries that tend to have a higher number of women are Health Care & Social Assistance (75.3%), Educational Services (71.3%), and Finance & Insurance (57.9%).
| Industry | Male | Female |
| Agriculture, Fishing & Hunting | 87 (81.3%) | 20 (18.7%) |
| Mining, Quarrying, & Extraction | 41 (62.1%) | 25 (37.9%) |
| Construction | 3,077 (87.7%) | 430 (12.3%) |
| Manufacturing | 12,352 (67.9%) | 5,849 (32.1%) |
| Wholesale Trade | 1,590 (64.6%) | 873 (35.4%) |
| Retail Trade | 4,786 (52.4%) | 4,341 (47.6%) |
| Transportation & Warehousing | 3,158 (79.7%) | 804 (20.3%) |
| Utilities | 224 (52.0%) | 207 (48.0%) |
| Information | 3,728 (66.1%) | 1,910 (33.9%) |
| Finance & Insurance | 2,165 (42.1%) | 2,977 (57.9%) |
| Real Estate, Rental & Leasing | 1,162 (53.3%) | 1,017 (46.7%) |
| Professional & Scientific | 20,166 (67.7%) | 9,624 (32.3%) |
| Enterprise Management | 134 (49.1%) | 139 (50.9%) |
| Administrative & Support | 1,987 (64.1%) | 1,114 (35.9%) |
| Educational Services | 2,258 (28.7%) | 5,603 (71.3%) |
| Health Care & Social Assistance | 3,305 (24.7%) | 10,075 (75.3%) |
| Arts, Entertainment & Recreation | 745 (57.1%) | 560 (42.9%) |
| Accommodation & Food Services | 2,349 (47.6%) | 2,590 (52.4%) |
| Public Administration | 1,620 (52.7%) | 1,454 (47.3%) |
| Total | 66,503 (56.5%) | 51,282 (43.5%) |
Education in Fremont
School Enrollment in Fremont
The most common levels of schooling among the 56,792 students in Fremont are elementary school (12,488 | 22.0%), middle school (11,661 | 20.5%), and high school (10,884 | 19.2%).
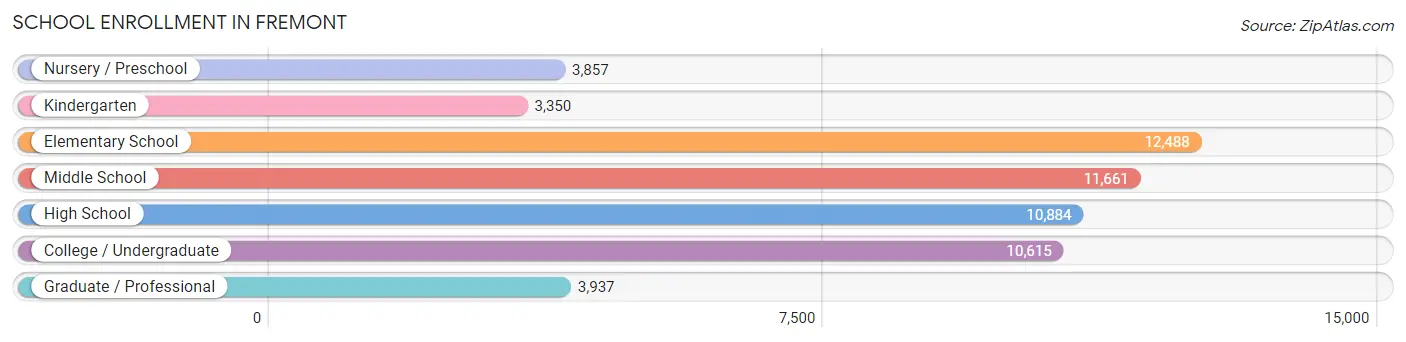
| School Level | # Students | % Students |
| Nursery / Preschool | 3,857 | 6.8% |
| Kindergarten | 3,350 | 5.9% |
| Elementary School | 12,488 | 22.0% |
| Middle School | 11,661 | 20.5% |
| High School | 10,884 | 19.2% |
| College / Undergraduate | 10,615 | 18.7% |
| Graduate / Professional | 3,937 | 6.9% |
| Total | 56,792 | 100.0% |
School Enrollment by Age by Funding Source in Fremont
Out of a total of 56,792 students who are enrolled in schools in Fremont, 9,995 (17.6%) attend a private institution, while the remaining 46,797 (82.4%) are enrolled in public schools. The age group of 3 to 4 year olds has the highest likelihood of being enrolled in private schools, with 2,386 (75.6% in the age bracket) enrolled. Conversely, the age group of 15 to 17 year olds has the lowest likelihood of being enrolled in a private school, with 7,470 (92.1% in the age bracket) attending a public institution.
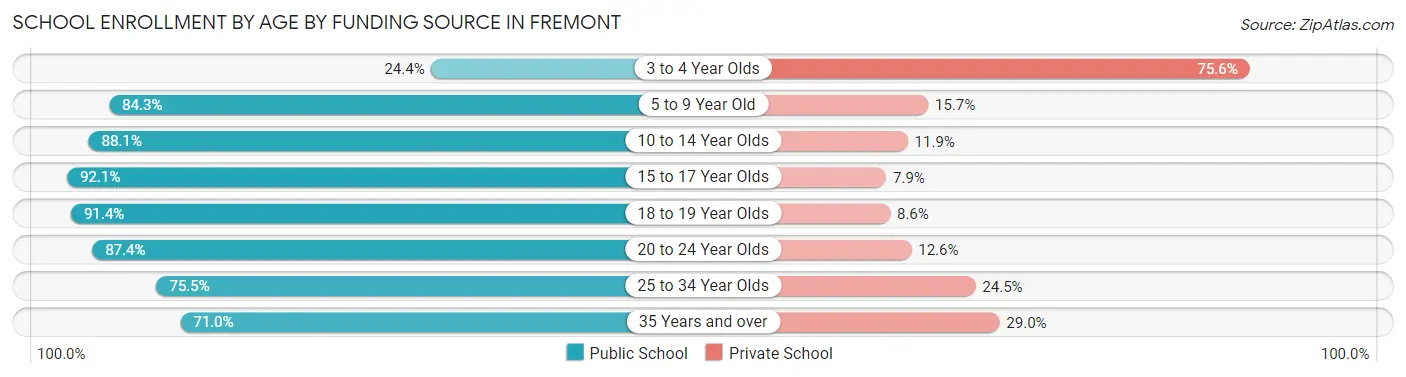
| Age Bracket | Public School | Private School |
| 3 to 4 Year Olds | 770 (24.4%) | 2,386 (75.6%) |
| 5 to 9 Year Old | 12,654 (84.3%) | 2,362 (15.7%) |
| 10 to 14 Year Olds | 13,088 (88.1%) | 1,772 (11.9%) |
| 15 to 17 Year Olds | 7,470 (92.1%) | 641 (7.9%) |
| 18 to 19 Year Olds | 3,139 (91.4%) | 297 (8.6%) |
| 20 to 24 Year Olds | 4,390 (87.4%) | 633 (12.6%) |
| 25 to 34 Year Olds | 3,438 (75.5%) | 1,118 (24.5%) |
| 35 Years and over | 1,870 (71.0%) | 764 (29.0%) |
| Total | 46,797 (82.4%) | 9,995 (17.6%) |
Educational Attainment by Field of Study in Fremont
Engineering (25,437 | 23.9%), computers & mathematics (20,289 | 19.1%), business (16,156 | 15.2%), science & technology (7,602 | 7.1%), and bio, nature & agricultural (6,151 | 5.8%) are the most common fields of study among 106,474 individuals in Fremont who have obtained a bachelor's degree or higher.
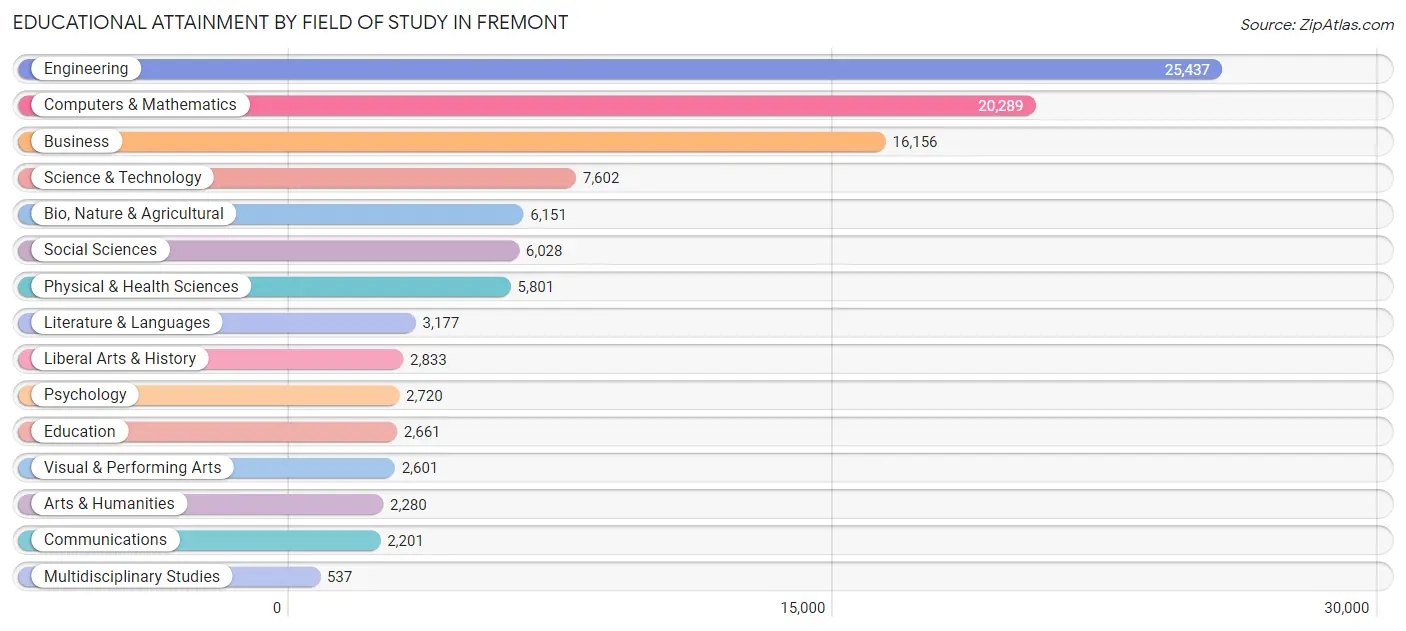
| Field of Study | # Graduates | % Graduates |
| Computers & Mathematics | 20,289 | 19.1% |
| Bio, Nature & Agricultural | 6,151 | 5.8% |
| Physical & Health Sciences | 5,801 | 5.4% |
| Psychology | 2,720 | 2.5% |
| Social Sciences | 6,028 | 5.7% |
| Engineering | 25,437 | 23.9% |
| Multidisciplinary Studies | 537 | 0.5% |
| Science & Technology | 7,602 | 7.1% |
| Business | 16,156 | 15.2% |
| Education | 2,661 | 2.5% |
| Literature & Languages | 3,177 | 3.0% |
| Liberal Arts & History | 2,833 | 2.7% |
| Visual & Performing Arts | 2,601 | 2.4% |
| Communications | 2,201 | 2.1% |
| Arts & Humanities | 2,280 | 2.1% |
| Total | 106,474 | 100.0% |
Transportation & Commute in Fremont
Vehicle Availability by Sex in Fremont
The most prevalent vehicle ownership categories in Fremont are males with 2 vehicles (24,989, accounting for 42.2%) and females with 2 vehicles (19,607, making up 54.8%).
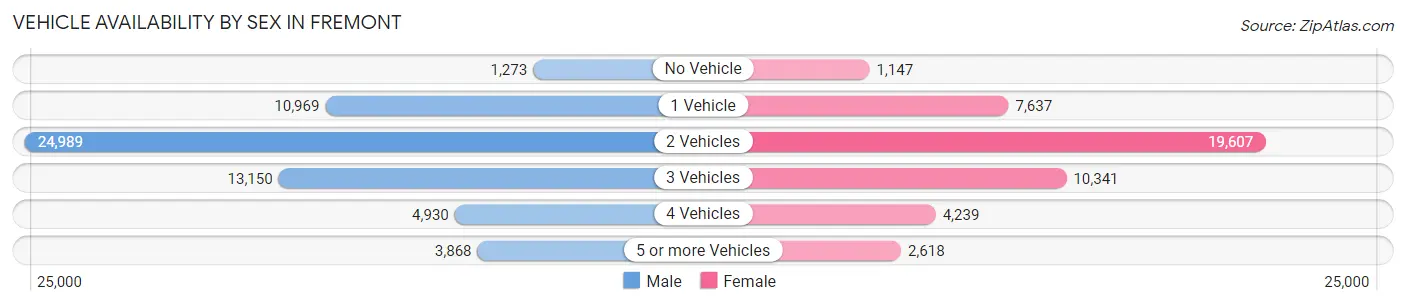
| Vehicles Available | Male | Female |
| No Vehicle | 1,273 (2.1%) | 1,147 (2.5%) |
| 1 Vehicle | 10,969 (18.5%) | 7,637 (16.8%) |
| 2 Vehicles | 24,989 (42.2%) | 19,607 (43.0%) |
| 3 Vehicles | 13,150 (22.2%) | 10,341 (22.7%) |
| 4 Vehicles | 4,930 (8.3%) | 4,239 (9.3%) |
| 5 or more Vehicles | 3,868 (6.5%) | 2,618 (5.7%) |
| Total | 59,179 (100.0%) | 45,589 (100.0%) |
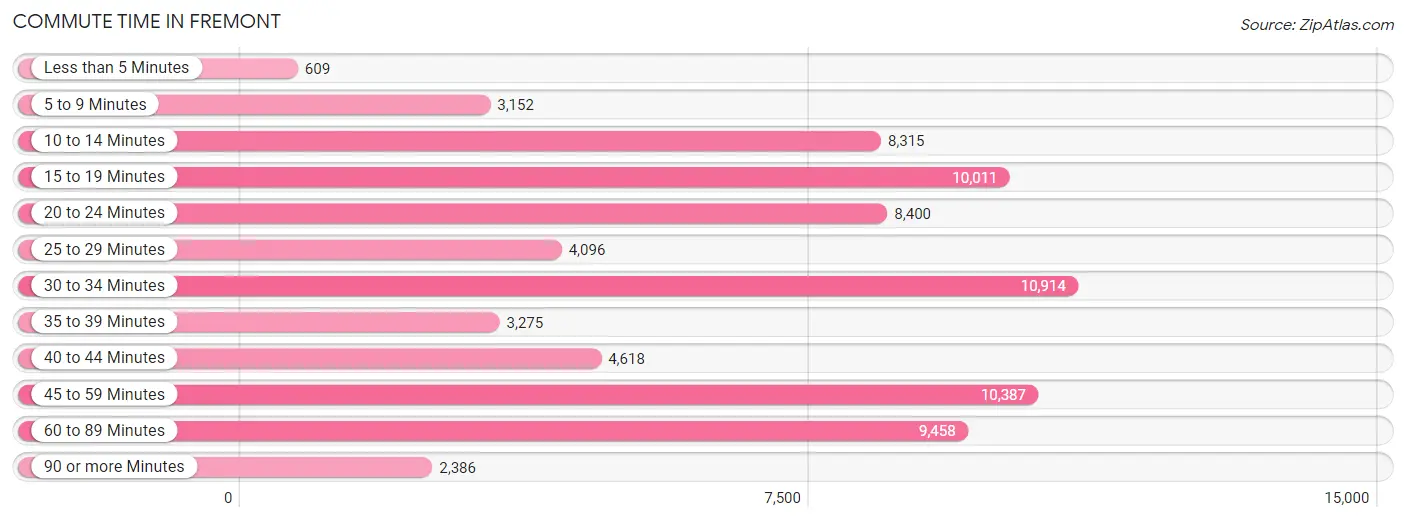
Commute Time in Fremont
The most frequently occuring commute durations in Fremont are 30 to 34 minutes (10,914 commuters, 14.4%), 45 to 59 minutes (10,387 commuters, 13.7%), and 15 to 19 minutes (10,011 commuters, 13.2%).
| Commute Time | # Commuters | % Commuters |
| Less than 5 Minutes | 609 | 0.8% |
| 5 to 9 Minutes | 3,152 | 4.2% |
| 10 to 14 Minutes | 8,315 | 11.0% |
| 15 to 19 Minutes | 10,011 | 13.2% |
| 20 to 24 Minutes | 8,400 | 11.1% |
| 25 to 29 Minutes | 4,096 | 5.4% |
| 30 to 34 Minutes | 10,914 | 14.4% |
| 35 to 39 Minutes | 3,275 | 4.3% |
| 40 to 44 Minutes | 4,618 | 6.1% |
| 45 to 59 Minutes | 10,387 | 13.7% |
| 60 to 89 Minutes | 9,458 | 12.5% |
| 90 or more Minutes | 2,386 | 3.2% |
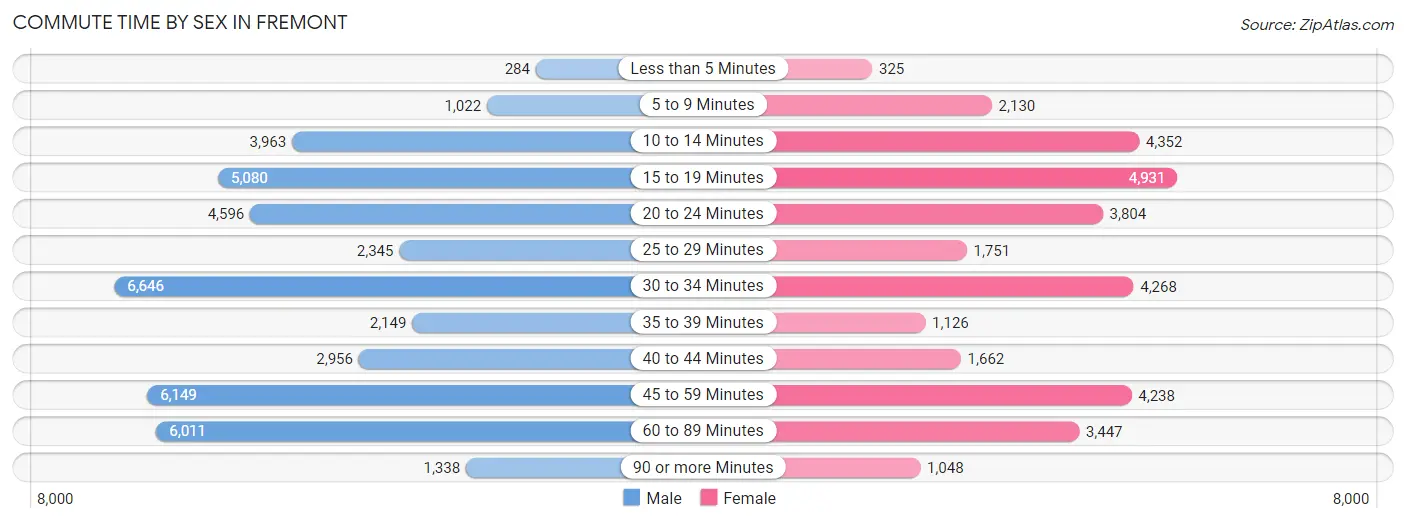
Commute Time by Sex in Fremont
The most common commute times in Fremont are 30 to 34 minutes (6,646 commuters, 15.6%) for males and 15 to 19 minutes (4,931 commuters, 14.9%) for females.
| Commute Time | Male | Female |
| Less than 5 Minutes | 284 (0.7%) | 325 (1.0%) |
| 5 to 9 Minutes | 1,022 (2.4%) | 2,130 (6.4%) |
| 10 to 14 Minutes | 3,963 (9.3%) | 4,352 (13.2%) |
| 15 to 19 Minutes | 5,080 (11.9%) | 4,931 (14.9%) |
| 20 to 24 Minutes | 4,596 (10.8%) | 3,804 (11.5%) |
| 25 to 29 Minutes | 2,345 (5.5%) | 1,751 (5.3%) |
| 30 to 34 Minutes | 6,646 (15.6%) | 4,268 (12.9%) |
| 35 to 39 Minutes | 2,149 (5.1%) | 1,126 (3.4%) |
| 40 to 44 Minutes | 2,956 (7.0%) | 1,662 (5.0%) |
| 45 to 59 Minutes | 6,149 (14.4%) | 4,238 (12.8%) |
| 60 to 89 Minutes | 6,011 (14.1%) | 3,447 (10.4%) |
| 90 or more Minutes | 1,338 (3.2%) | 1,048 (3.2%) |
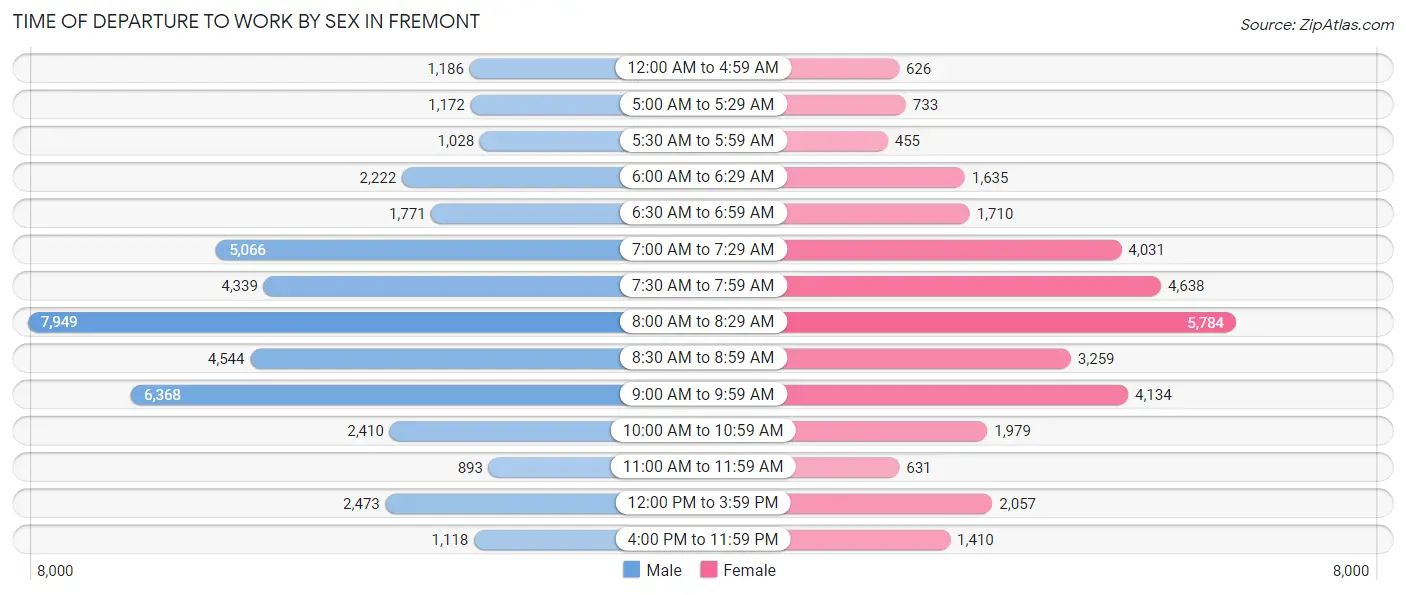
Time of Departure to Work by Sex in Fremont
The most frequent times of departure to work in Fremont are 8:00 AM to 8:29 AM (7,949, 18.7%) for males and 8:00 AM to 8:29 AM (5,784, 17.5%) for females.
| Time of Departure | Male | Female |
| 12:00 AM to 4:59 AM | 1,186 (2.8%) | 626 (1.9%) |
| 5:00 AM to 5:29 AM | 1,172 (2.8%) | 733 (2.2%) |
| 5:30 AM to 5:59 AM | 1,028 (2.4%) | 455 (1.4%) |
| 6:00 AM to 6:29 AM | 2,222 (5.2%) | 1,635 (4.9%) |
| 6:30 AM to 6:59 AM | 1,771 (4.2%) | 1,710 (5.2%) |
| 7:00 AM to 7:29 AM | 5,066 (11.9%) | 4,031 (12.2%) |
| 7:30 AM to 7:59 AM | 4,339 (10.2%) | 4,638 (14.0%) |
| 8:00 AM to 8:29 AM | 7,949 (18.7%) | 5,784 (17.5%) |
| 8:30 AM to 8:59 AM | 4,544 (10.7%) | 3,259 (9.9%) |
| 9:00 AM to 9:59 AM | 6,368 (15.0%) | 4,134 (12.5%) |
| 10:00 AM to 10:59 AM | 2,410 (5.7%) | 1,979 (6.0%) |
| 11:00 AM to 11:59 AM | 893 (2.1%) | 631 (1.9%) |
| 12:00 PM to 3:59 PM | 2,473 (5.8%) | 2,057 (6.2%) |
| 4:00 PM to 11:59 PM | 1,118 (2.6%) | 1,410 (4.3%) |
| Total | 42,539 (100.0%) | 33,082 (100.0%) |
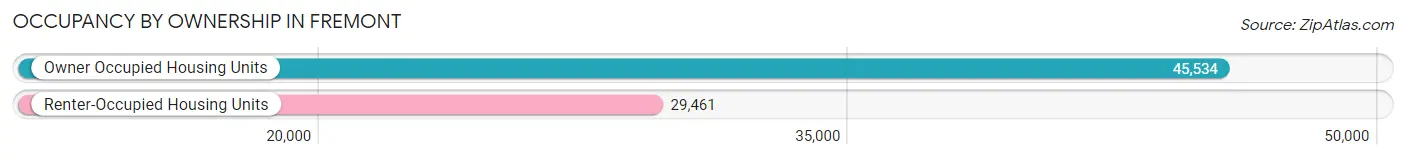
Housing Occupancy in Fremont
Occupancy by Ownership in Fremont
Of the total 74,995 dwellings in Fremont, owner-occupied units account for 45,534 (60.7%), while renter-occupied units make up 29,461 (39.3%).
| Occupancy | # Housing Units | % Housing Units |
| Owner Occupied Housing Units | 45,534 | 60.7% |
| Renter-Occupied Housing Units | 29,461 | 39.3% |
| Total Occupied Housing Units | 74,995 | 100.0% |
Occupancy by Household Size in Fremont
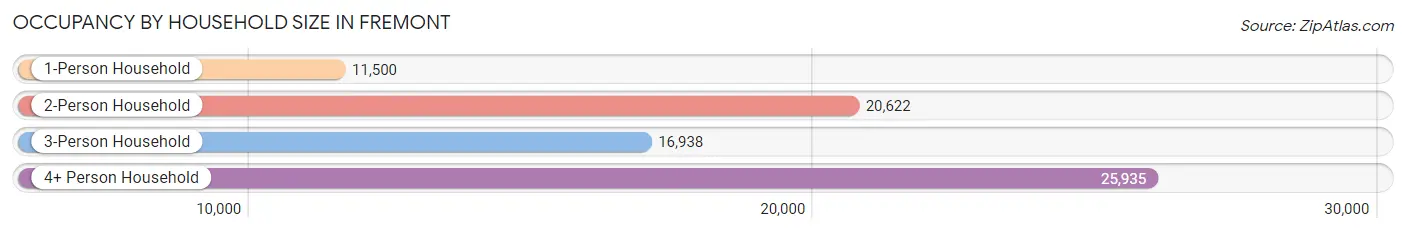
| Household Size | # Housing Units | % Housing Units |
| 1-Person Household | 11,500 | 15.3% |
| 2-Person Household | 20,622 | 27.5% |
| 3-Person Household | 16,938 | 22.6% |
| 4+ Person Household | 25,935 | 34.6% |
| Total Housing Units | 74,995 | 100.0% |
Occupancy by Ownership by Household Size in Fremont
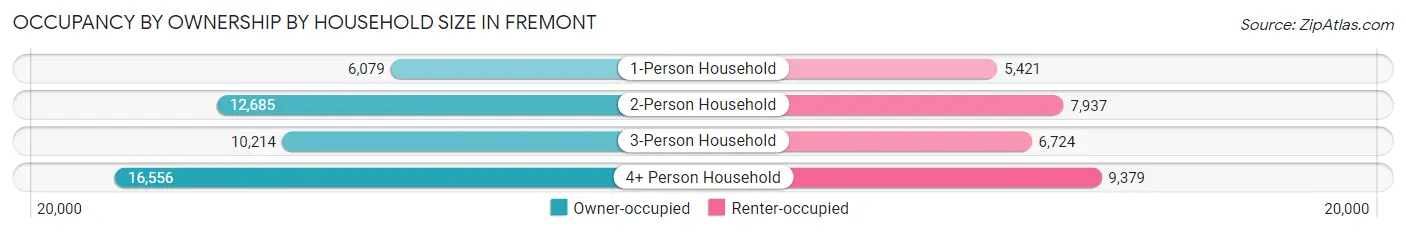
| Household Size | Owner-occupied | Renter-occupied |
| 1-Person Household | 6,079 (52.9%) | 5,421 (47.1%) |
| 2-Person Household | 12,685 (61.5%) | 7,937 (38.5%) |
| 3-Person Household | 10,214 (60.3%) | 6,724 (39.7%) |
| 4+ Person Household | 16,556 (63.8%) | 9,379 (36.2%) |
| Total Housing Units | 45,534 (60.7%) | 29,461 (39.3%) |
Occupancy by Educational Attainment in Fremont
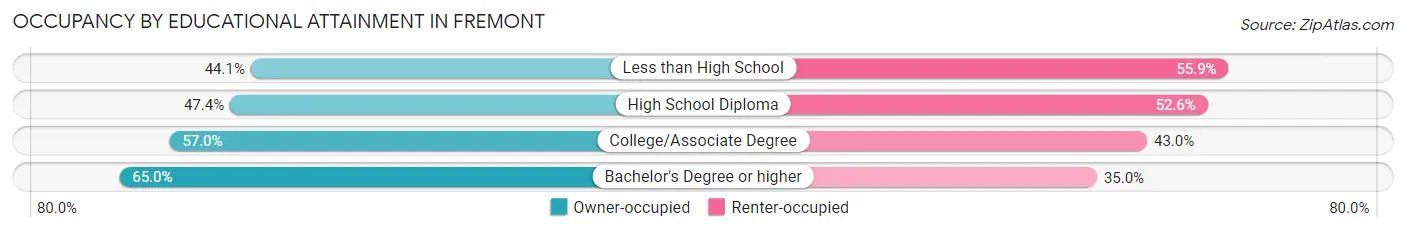
| Household Size | Owner-occupied | Renter-occupied |
| Less than High School | 1,285 (44.1%) | 1,627 (55.9%) |
| High School Diploma | 4,300 (47.4%) | 4,767 (52.6%) |
| College/Associate Degree | 7,167 (57.0%) | 5,400 (43.0%) |
| Bachelor's Degree or higher | 32,782 (65.0%) | 17,667 (35.0%) |
Occupancy by Age of Householder in Fremont
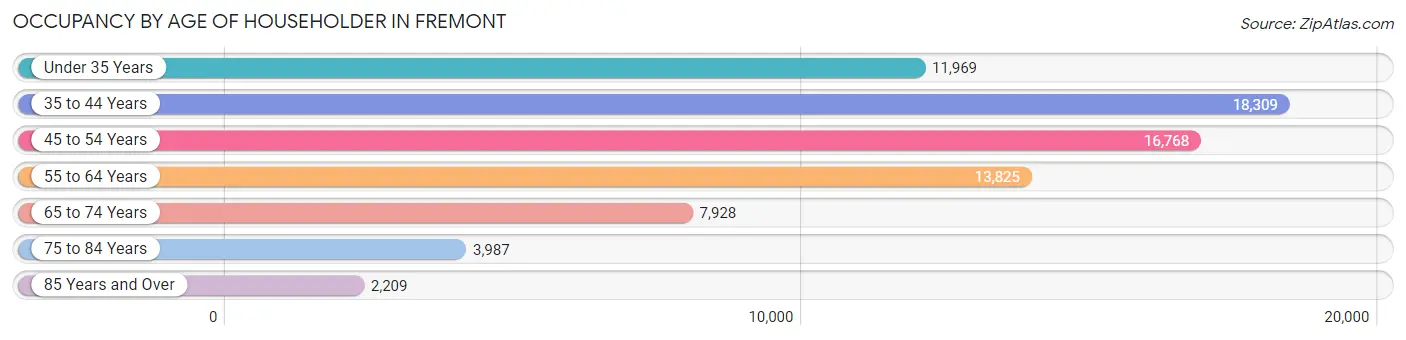
| Age Bracket | # Households | % Households |
| Under 35 Years | 11,969 | 16.0% |
| 35 to 44 Years | 18,309 | 24.4% |
| 45 to 54 Years | 16,768 | 22.4% |
| 55 to 64 Years | 13,825 | 18.4% |
| 65 to 74 Years | 7,928 | 10.6% |
| 75 to 84 Years | 3,987 | 5.3% |
| 85 Years and Over | 2,209 | 2.9% |
| Total | 74,995 | 100.0% |
Housing Finances in Fremont
Median Income by Occupancy in Fremont
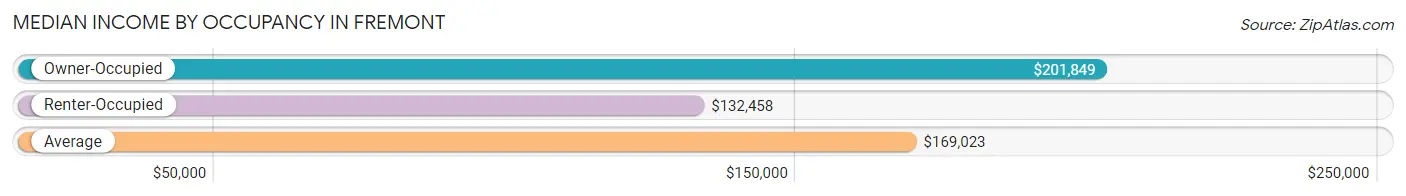
| Occupancy Type | # Households | Median Income |
| Owner-Occupied | 45,534 (60.7%) | $201,849 |
| Renter-Occupied | 29,461 (39.3%) | $132,458 |
| Average | 74,995 (100.0%) | $169,023 |
Occupancy by Householder Income Bracket in Fremont
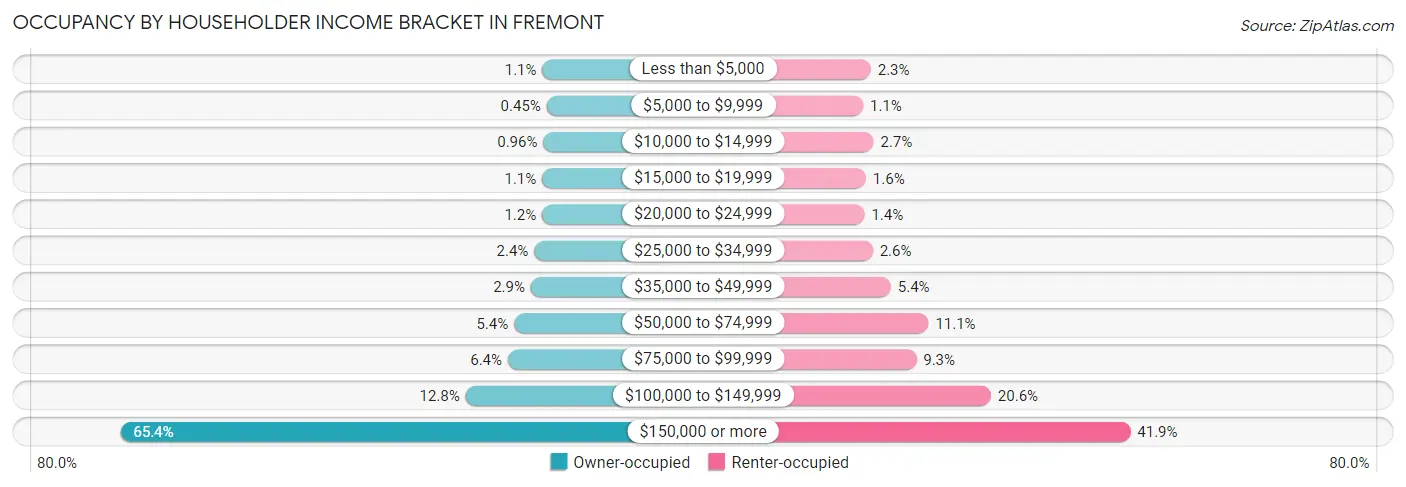
| Income Bracket | Owner-occupied | Renter-occupied |
| Less than $5,000 | 499 (1.1%) | 684 (2.3%) |
| $5,000 to $9,999 | 203 (0.4%) | 336 (1.1%) |
| $10,000 to $14,999 | 436 (1.0%) | 807 (2.7%) |
| $15,000 to $19,999 | 519 (1.1%) | 466 (1.6%) |
| $20,000 to $24,999 | 525 (1.1%) | 400 (1.4%) |
| $25,000 to $34,999 | 1,070 (2.4%) | 772 (2.6%) |
| $35,000 to $49,999 | 1,308 (2.9%) | 1,584 (5.4%) |
| $50,000 to $74,999 | 2,466 (5.4%) | 3,273 (11.1%) |
| $75,000 to $99,999 | 2,898 (6.4%) | 2,724 (9.2%) |
| $100,000 to $149,999 | 5,831 (12.8%) | 6,077 (20.6%) |
| $150,000 or more | 29,779 (65.4%) | 12,338 (41.9%) |
| Total | 45,534 (100.0%) | 29,461 (100.0%) |
Monthly Housing Cost Tiers in Fremont
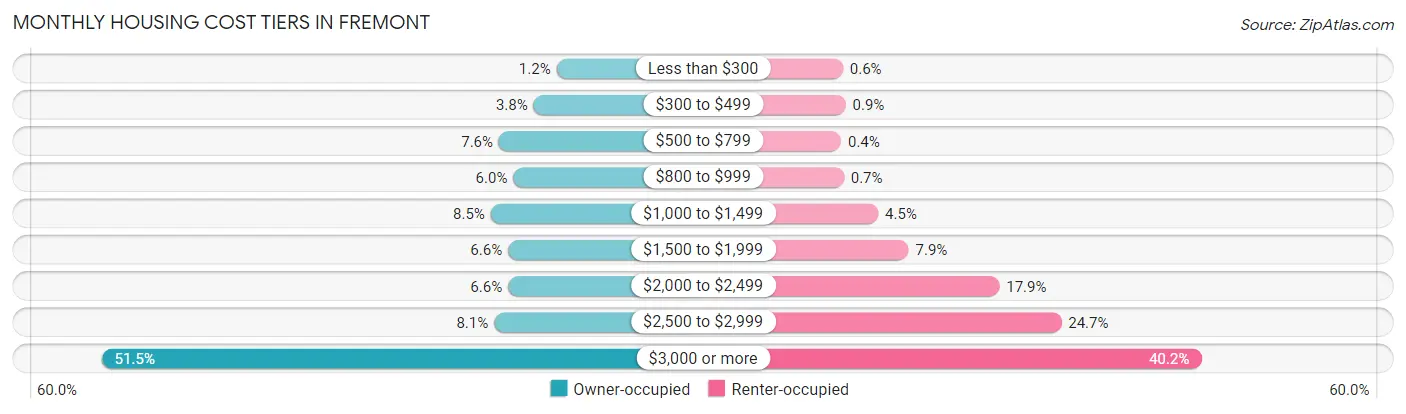
| Monthly Cost | Owner-occupied | Renter-occupied |
| Less than $300 | 563 (1.2%) | 176 (0.6%) |
| $300 to $499 | 1,722 (3.8%) | 266 (0.9%) |
| $500 to $799 | 3,466 (7.6%) | 117 (0.4%) |
| $800 to $999 | 2,740 (6.0%) | 206 (0.7%) |
| $1,000 to $1,499 | 3,877 (8.5%) | 1,327 (4.5%) |
| $1,500 to $1,999 | 3,005 (6.6%) | 2,315 (7.9%) |
| $2,000 to $2,499 | 3,005 (6.6%) | 5,267 (17.9%) |
| $2,500 to $2,999 | 3,706 (8.1%) | 7,287 (24.7%) |
| $3,000 or more | 23,450 (51.5%) | 11,840 (40.2%) |
| Total | 45,534 (100.0%) | 29,461 (100.0%) |
Physical Housing Characteristics in Fremont
Housing Structures in Fremont
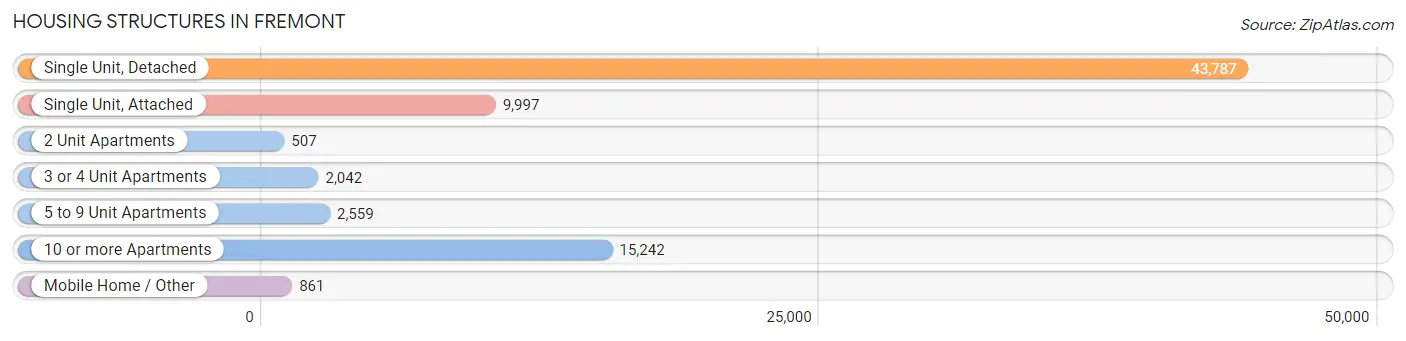
| Structure Type | # Housing Units | % Housing Units |
| Single Unit, Detached | 43,787 | 58.4% |
| Single Unit, Attached | 9,997 | 13.3% |
| 2 Unit Apartments | 507 | 0.7% |
| 3 or 4 Unit Apartments | 2,042 | 2.7% |
| 5 to 9 Unit Apartments | 2,559 | 3.4% |
| 10 or more Apartments | 15,242 | 20.3% |
| Mobile Home / Other | 861 | 1.1% |
| Total | 74,995 | 100.0% |
Housing Structures by Occupancy in Fremont
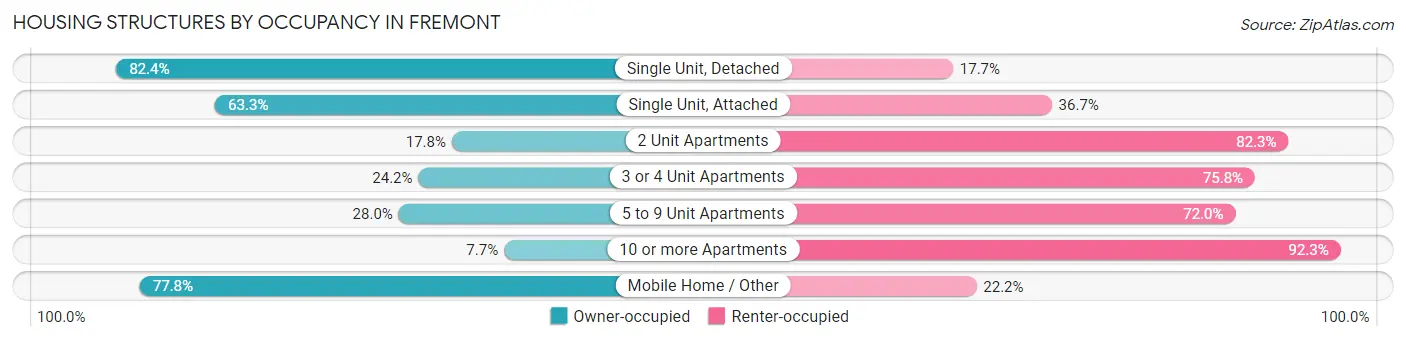
| Structure Type | Owner-occupied | Renter-occupied |
| Single Unit, Detached | 36,060 (82.4%) | 7,727 (17.6%) |
| Single Unit, Attached | 6,330 (63.3%) | 3,667 (36.7%) |
| 2 Unit Apartments | 90 (17.7%) | 417 (82.3%) |
| 3 or 4 Unit Apartments | 494 (24.2%) | 1,548 (75.8%) |
| 5 to 9 Unit Apartments | 716 (28.0%) | 1,843 (72.0%) |
| 10 or more Apartments | 1,174 (7.7%) | 14,068 (92.3%) |
| Mobile Home / Other | 670 (77.8%) | 191 (22.2%) |
| Total | 45,534 (60.7%) | 29,461 (39.3%) |
Housing Structures by Number of Rooms in Fremont
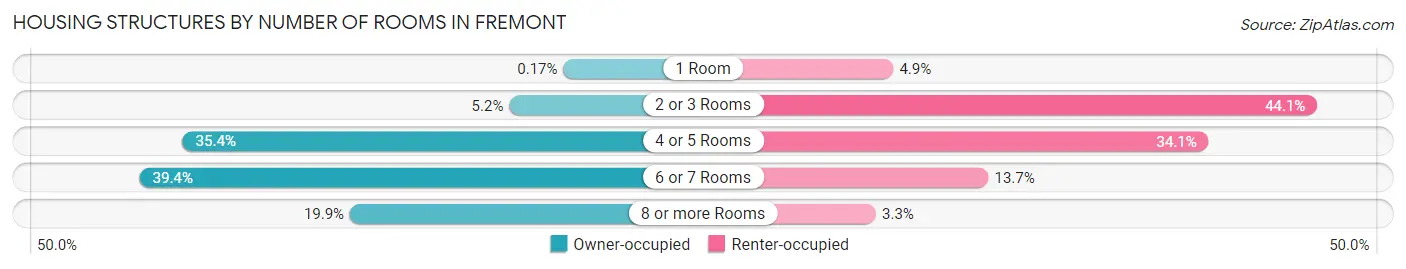
| Number of Rooms | Owner-occupied | Renter-occupied |
| 1 Room | 77 (0.2%) | 1,431 (4.9%) |
| 2 or 3 Rooms | 2,359 (5.2%) | 13,004 (44.1%) |
| 4 or 5 Rooms | 16,108 (35.4%) | 10,046 (34.1%) |
| 6 or 7 Rooms | 17,922 (39.4%) | 4,022 (13.7%) |
| 8 or more Rooms | 9,068 (19.9%) | 958 (3.3%) |
| Total | 45,534 (100.0%) | 29,461 (100.0%) |
Housing Structure by Heating Type in Fremont
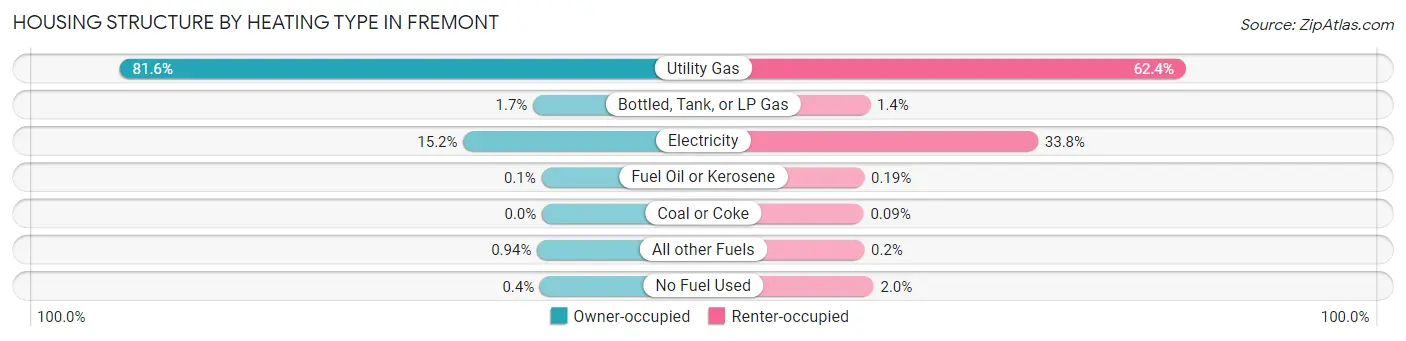
| Heating Type | Owner-occupied | Renter-occupied |
| Utility Gas | 37,169 (81.6%) | 18,369 (62.4%) |
| Bottled, Tank, or LP Gas | 786 (1.7%) | 399 (1.3%) |
| Electricity | 6,926 (15.2%) | 9,953 (33.8%) |
| Fuel Oil or Kerosene | 46 (0.1%) | 56 (0.2%) |
| Coal or Coke | 0 (0.0%) | 27 (0.1%) |
| All other Fuels | 427 (0.9%) | 59 (0.2%) |
| No Fuel Used | 180 (0.4%) | 598 (2.0%) |
| Total | 45,534 (100.0%) | 29,461 (100.0%) |
Household Vehicle Usage in Fremont
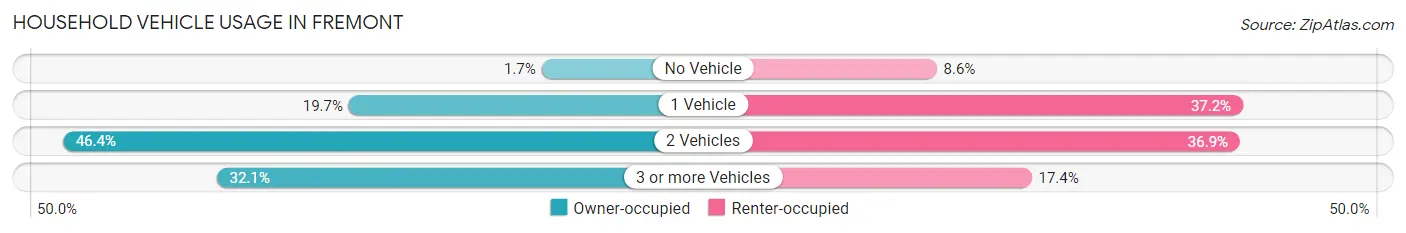
| Vehicles per Household | Owner-occupied | Renter-occupied |
| No Vehicle | 794 (1.7%) | 2,523 (8.6%) |
| 1 Vehicle | 8,989 (19.7%) | 10,944 (37.1%) |
| 2 Vehicles | 21,144 (46.4%) | 10,862 (36.9%) |
| 3 or more Vehicles | 14,607 (32.1%) | 5,132 (17.4%) |
| Total | 45,534 (100.0%) | 29,461 (100.0%) |
Real Estate & Mortgages in Fremont
Real Estate and Mortgage Overview in Fremont
| Characteristic | Without Mortgage | With Mortgage |
| Housing Units | 12,945 | 32,589 |
| Median Property Value | $1,169,000 | $1,258,400 |
| Median Household Income | $131,172 | $24,058 |
| Monthly Housing Costs | $892 | $23,282 |
| Real Estate Taxes | $5,852 | $228 |
Property Value by Mortgage Status in Fremont
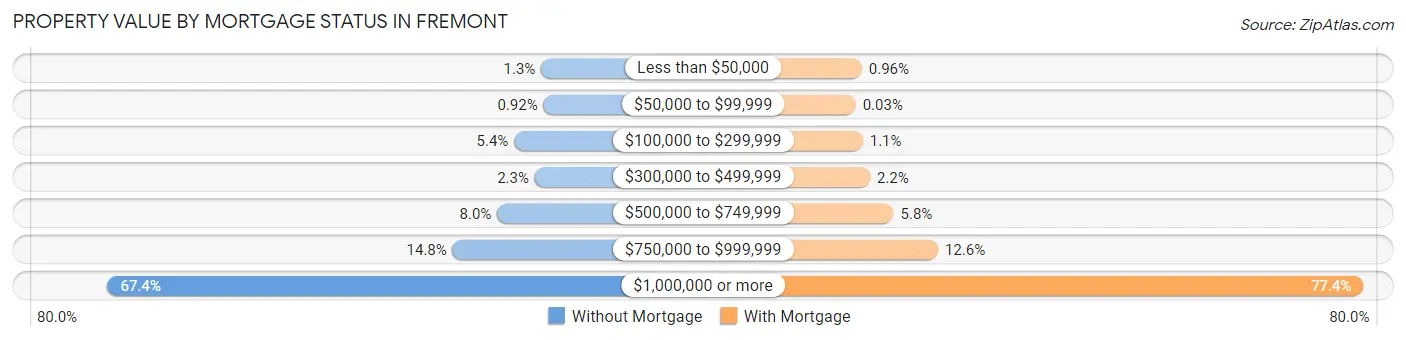
| Property Value | Without Mortgage | With Mortgage |
| Less than $50,000 | 166 (1.3%) | 314 (1.0%) |
| $50,000 to $99,999 | 119 (0.9%) | 10 (0.0%) |
| $100,000 to $299,999 | 699 (5.4%) | 357 (1.1%) |
| $300,000 to $499,999 | 293 (2.3%) | 720 (2.2%) |
| $500,000 to $749,999 | 1,034 (8.0%) | 1,889 (5.8%) |
| $750,000 to $999,999 | 1,915 (14.8%) | 4,093 (12.6%) |
| $1,000,000 or more | 8,719 (67.3%) | 25,206 (77.3%) |
| Total | 12,945 (100.0%) | 32,589 (100.0%) |
Household Income by Mortgage Status in Fremont
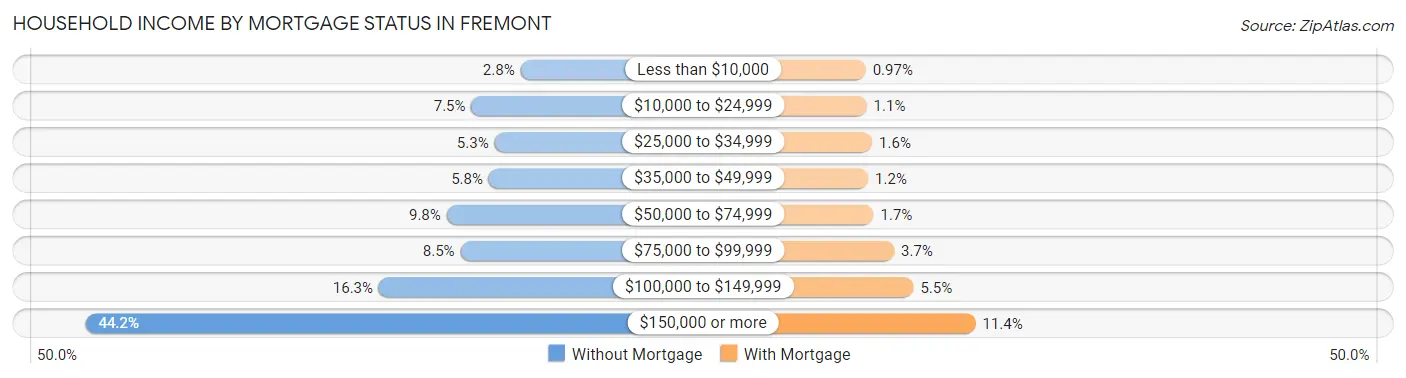
| Household Income | Without Mortgage | With Mortgage |
| Less than $10,000 | 358 (2.8%) | 315 (1.0%) |
| $10,000 to $24,999 | 964 (7.4%) | 344 (1.1%) |
| $25,000 to $34,999 | 679 (5.2%) | 516 (1.6%) |
| $35,000 to $49,999 | 749 (5.8%) | 391 (1.2%) |
| $50,000 to $74,999 | 1,270 (9.8%) | 559 (1.7%) |
| $75,000 to $99,999 | 1,099 (8.5%) | 1,196 (3.7%) |
| $100,000 to $149,999 | 2,105 (16.3%) | 1,799 (5.5%) |
| $150,000 or more | 5,721 (44.2%) | 3,726 (11.4%) |
| Total | 12,945 (100.0%) | 32,589 (100.0%) |
Property Value to Household Income Ratio in Fremont
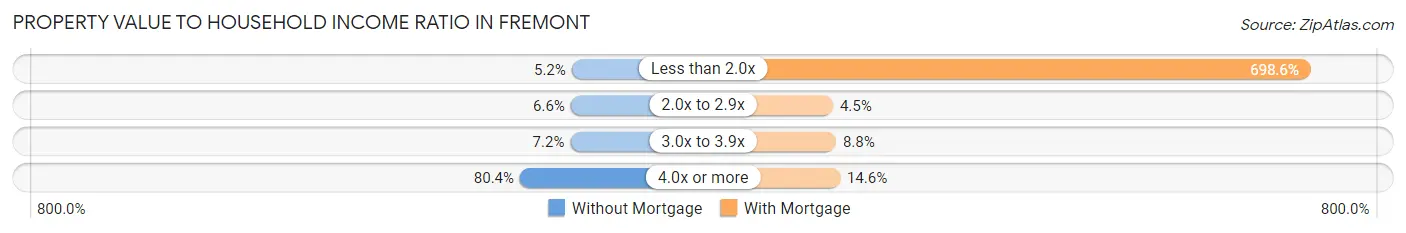
| Value-to-Income Ratio | Without Mortgage | With Mortgage |
| Less than 2.0x | 676 (5.2%) | 227,669 (698.6%) |
| 2.0x to 2.9x | 852 (6.6%) | 1,454 (4.5%) |
| 3.0x to 3.9x | 933 (7.2%) | 2,862 (8.8%) |
| 4.0x or more | 10,411 (80.4%) | 4,771 (14.6%) |
| Total | 12,945 (100.0%) | 32,589 (100.0%) |
Real Estate Taxes by Mortgage Status in Fremont
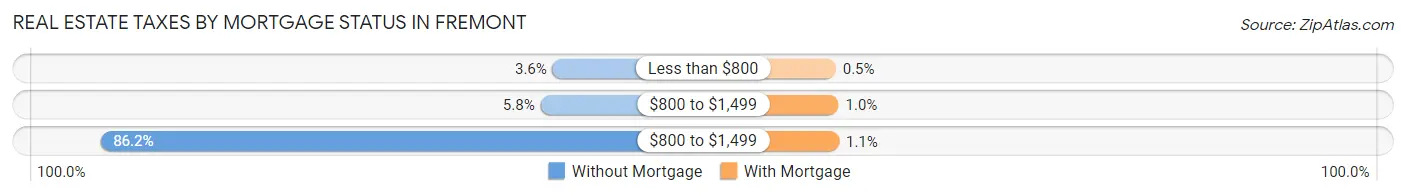
| Property Taxes | Without Mortgage | With Mortgage |
| Less than $800 | 461 (3.6%) | 163 (0.5%) |
| $800 to $1,499 | 747 (5.8%) | 332 (1.0%) |
| $800 to $1,499 | 11,156 (86.2%) | 355 (1.1%) |
| Total | 12,945 (100.0%) | 32,589 (100.0%) |
Health & Disability in Fremont
Health Insurance Coverage by Age in Fremont
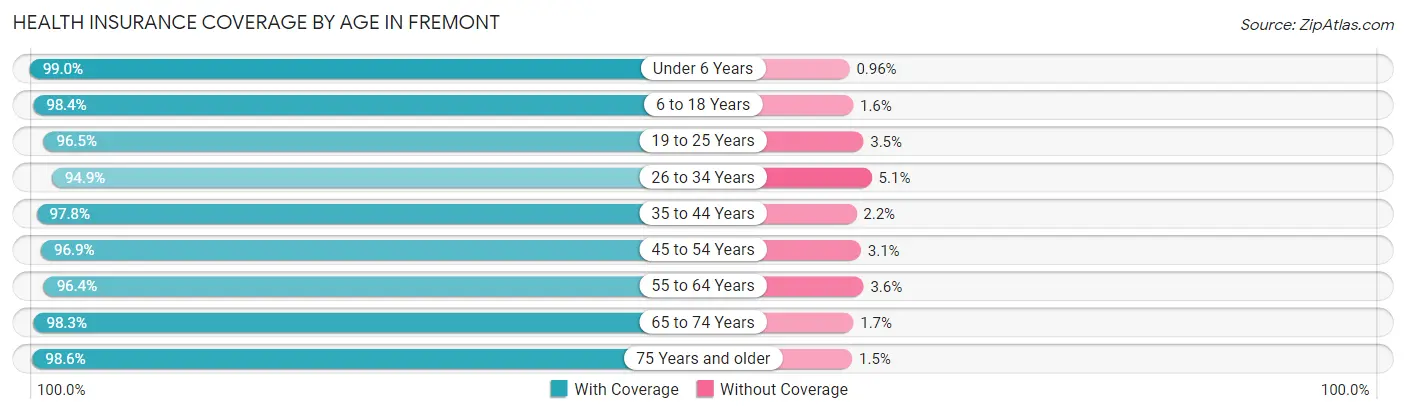
| Age Bracket | With Coverage | Without Coverage |
| Under 6 Years | 16,121 (99.0%) | 156 (1.0%) |
| 6 to 18 Years | 37,897 (98.4%) | 627 (1.6%) |
| 19 to 25 Years | 14,114 (96.5%) | 518 (3.5%) |
| 26 to 34 Years | 29,447 (94.9%) | 1,583 (5.1%) |
| 35 to 44 Years | 37,988 (97.8%) | 871 (2.2%) |
| 45 to 54 Years | 31,595 (96.9%) | 1,006 (3.1%) |
| 55 to 64 Years | 25,901 (96.4%) | 962 (3.6%) |
| 65 to 74 Years | 16,393 (98.3%) | 280 (1.7%) |
| 75 Years and older | 12,461 (98.6%) | 183 (1.5%) |
| Total | 221,917 (97.3%) | 6,186 (2.7%) |
Health Insurance Coverage by Citizenship Status in Fremont
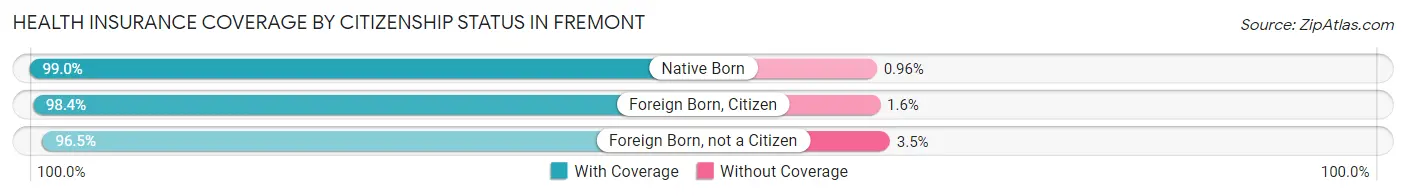
| Citizenship Status | With Coverage | Without Coverage |
| Native Born | 16,121 (99.0%) | 156 (1.0%) |
| Foreign Born, Citizen | 37,897 (98.4%) | 627 (1.6%) |
| Foreign Born, not a Citizen | 14,114 (96.5%) | 518 (3.5%) |
Health Insurance Coverage by Household Income in Fremont
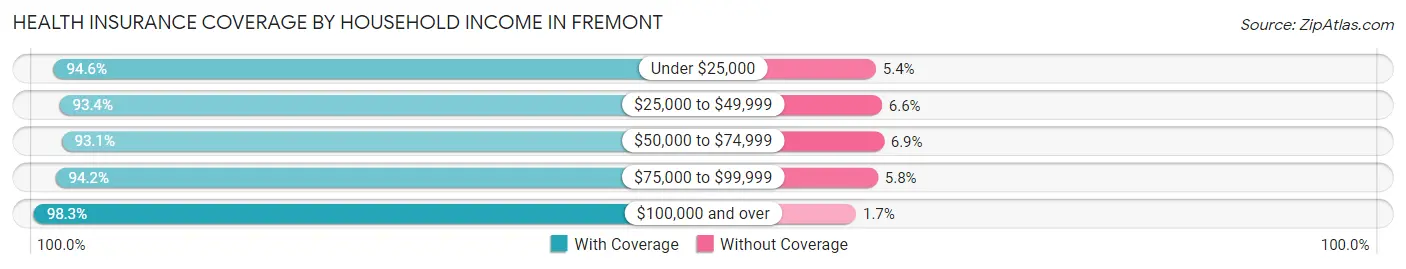
| Household Income | With Coverage | Without Coverage |
| Under $25,000 | 8,570 (94.6%) | 493 (5.4%) |
| $25,000 to $49,999 | 10,645 (93.4%) | 748 (6.6%) |
| $50,000 to $74,999 | 12,995 (93.1%) | 967 (6.9%) |
| $75,000 to $99,999 | 14,119 (94.2%) | 873 (5.8%) |
| $100,000 and over | 174,156 (98.3%) | 3,060 (1.7%) |
Public vs Private Health Insurance Coverage by Age in Fremont
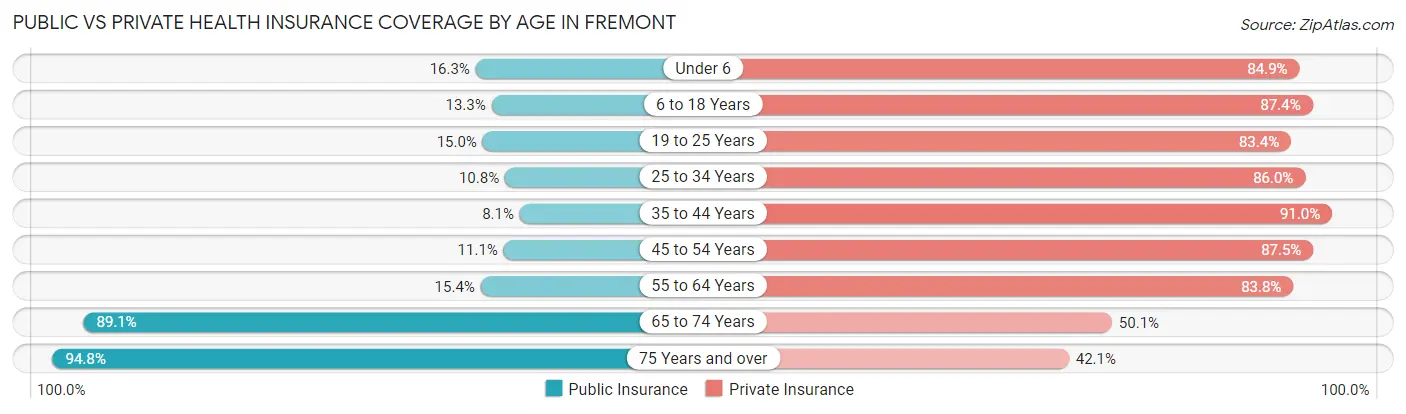
| Age Bracket | Public Insurance | Private Insurance |
| Under 6 | 2,649 (16.3%) | 13,825 (84.9%) |
| 6 to 18 Years | 5,130 (13.3%) | 33,655 (87.4%) |
| 19 to 25 Years | 2,191 (15.0%) | 12,198 (83.4%) |
| 25 to 34 Years | 3,362 (10.8%) | 26,689 (86.0%) |
| 35 to 44 Years | 3,141 (8.1%) | 35,359 (91.0%) |
| 45 to 54 Years | 3,611 (11.1%) | 28,524 (87.5%) |
| 55 to 64 Years | 4,123 (15.3%) | 22,506 (83.8%) |
| 65 to 74 Years | 14,850 (89.1%) | 8,360 (50.1%) |
| 75 Years and over | 11,986 (94.8%) | 5,328 (42.1%) |
| Total | 51,043 (22.4%) | 186,444 (81.7%) |
Disability Status by Sex by Age in Fremont
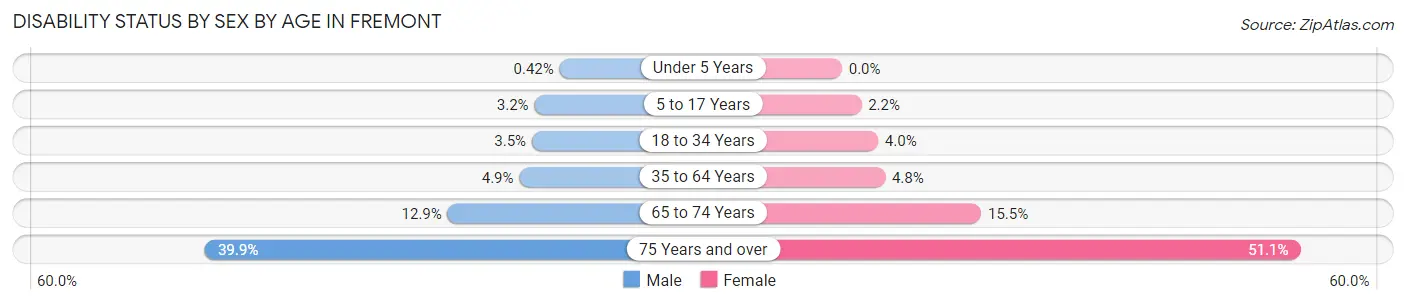
| Age Bracket | Male | Female |
| Under 5 Years | 27 (0.4%) | 0 (0.0%) |
| 5 to 17 Years | 630 (3.2%) | 423 (2.2%) |
| 18 to 34 Years | 845 (3.5%) | 956 (4.0%) |
| 35 to 64 Years | 2,491 (4.9%) | 2,280 (4.8%) |
| 65 to 74 Years | 1,033 (12.9%) | 1,343 (15.5%) |
| 75 Years and over | 2,059 (39.9%) | 3,822 (51.1%) |
Disability Class by Sex by Age in Fremont
Disability Class: Hearing Difficulty
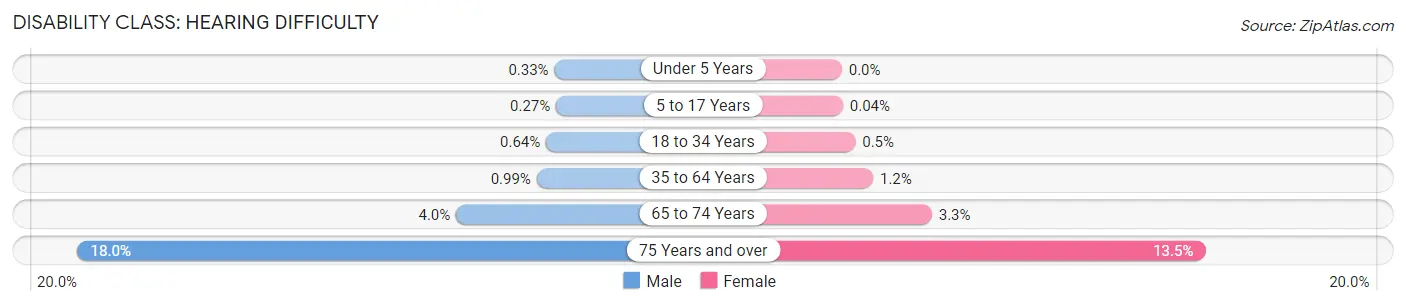
| Age Bracket | Male | Female |
| Under 5 Years | 21 (0.3%) | 0 (0.0%) |
| 5 to 17 Years | 53 (0.3%) | 7 (0.0%) |
| 18 to 34 Years | 155 (0.6%) | 118 (0.5%) |
| 35 to 64 Years | 502 (1.0%) | 550 (1.2%) |
| 65 to 74 Years | 319 (4.0%) | 289 (3.3%) |
| 75 Years and over | 930 (18.0%) | 1,010 (13.5%) |
Disability Class: Vision Difficulty
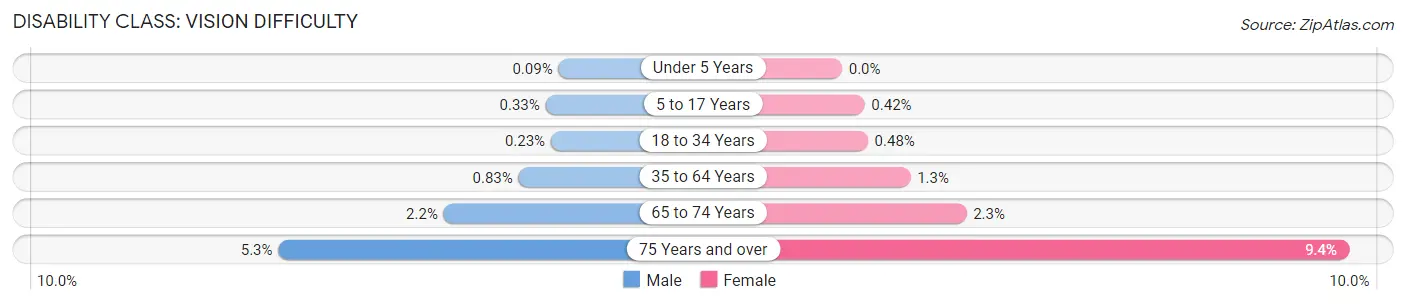
| Age Bracket | Male | Female |
| Under 5 Years | 6 (0.1%) | 0 (0.0%) |
| 5 to 17 Years | 64 (0.3%) | 83 (0.4%) |
| 18 to 34 Years | 55 (0.2%) | 113 (0.5%) |
| 35 to 64 Years | 423 (0.8%) | 603 (1.3%) |
| 65 to 74 Years | 178 (2.2%) | 200 (2.3%) |
| 75 Years and over | 273 (5.3%) | 704 (9.4%) |
Disability Class: Cognitive Difficulty
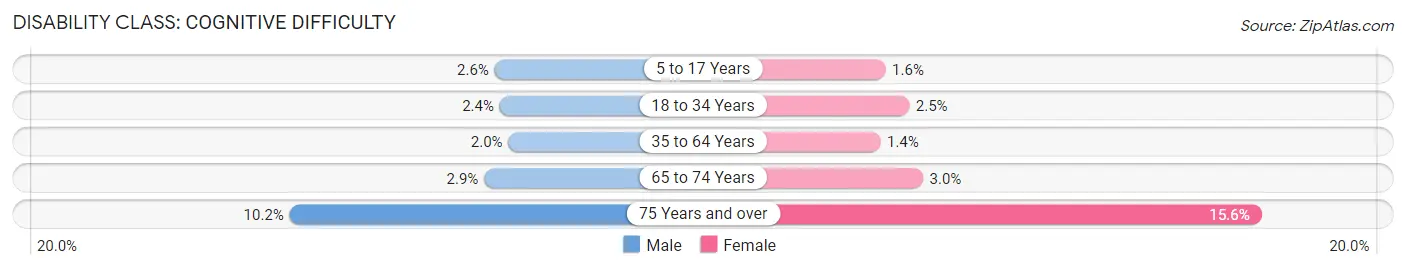
| Age Bracket | Male | Female |
| 5 to 17 Years | 499 (2.5%) | 316 (1.6%) |
| 18 to 34 Years | 571 (2.4%) | 591 (2.5%) |
| 35 to 64 Years | 1,038 (2.0%) | 673 (1.4%) |
| 65 to 74 Years | 236 (2.9%) | 260 (3.0%) |
| 75 Years and over | 524 (10.2%) | 1,166 (15.6%) |
Disability Class: Ambulatory Difficulty
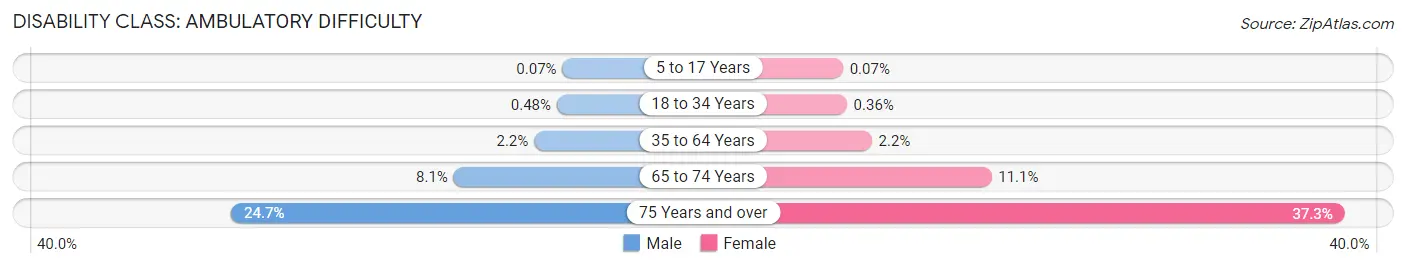
| Age Bracket | Male | Female |
| 5 to 17 Years | 13 (0.1%) | 13 (0.1%) |
| 18 to 34 Years | 115 (0.5%) | 86 (0.4%) |
| 35 to 64 Years | 1,105 (2.2%) | 1,050 (2.2%) |
| 65 to 74 Years | 652 (8.1%) | 961 (11.1%) |
| 75 Years and over | 1,272 (24.7%) | 2,794 (37.3%) |
Disability Class: Self-Care Difficulty
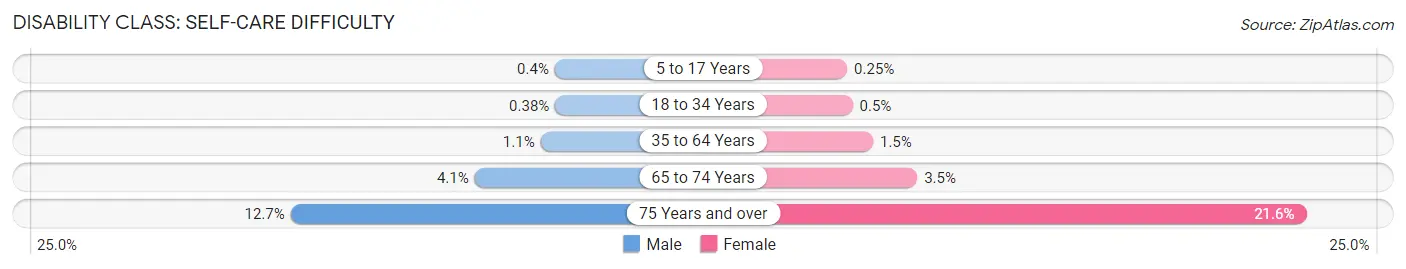
| Age Bracket | Male | Female |
| 5 to 17 Years | 79 (0.4%) | 49 (0.3%) |
| 18 to 34 Years | 92 (0.4%) | 118 (0.5%) |
| 35 to 64 Years | 538 (1.1%) | 690 (1.5%) |
| 65 to 74 Years | 330 (4.1%) | 303 (3.5%) |
| 75 Years and over | 653 (12.7%) | 1,613 (21.5%) |
Technology Access in Fremont
Computing Device Access in Fremont
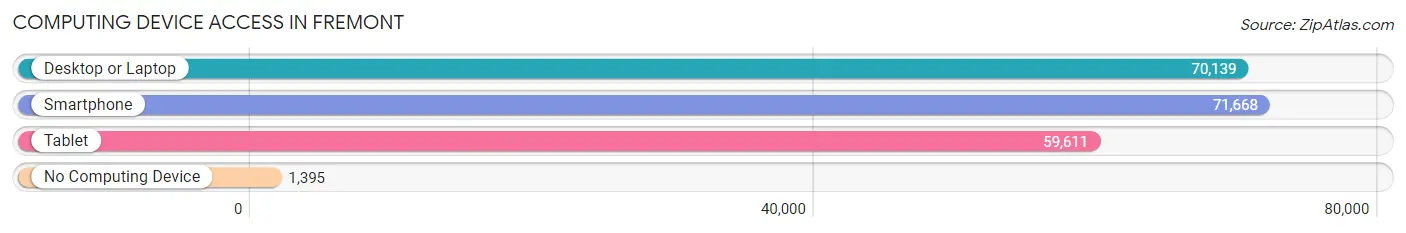
| Device Type | # Households | % Households |
| Desktop or Laptop | 70,139 | 93.5% |
| Smartphone | 71,668 | 95.6% |
| Tablet | 59,611 | 79.5% |
| No Computing Device | 1,395 | 1.9% |
| Total | 74,995 | 100.0% |
Internet Access in Fremont
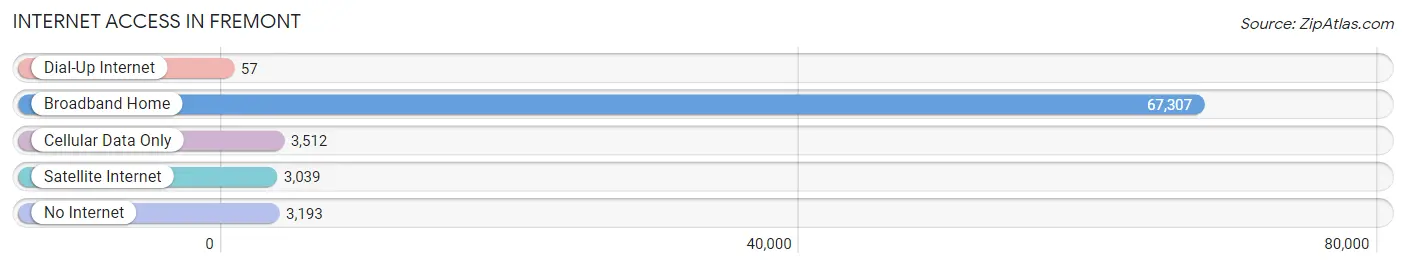
| Internet Type | # Households | % Households |
| Dial-Up Internet | 57 | 0.1% |
| Broadband Home | 67,307 | 89.7% |
| Cellular Data Only | 3,512 | 4.7% |
| Satellite Internet | 3,039 | 4.1% |
| No Internet | 3,193 | 4.3% |
| Total | 74,995 | 100.0% |
Fremont Summary
Fremont, California is a city located in the San Francisco Bay Area in Alameda County. It is the fourth most populous city in the Bay Area, with a population of 214,089 as of the 2010 census. Fremont is located in the East Bay region of the Bay Area, and is bordered by the cities of Newark, Union City, and Hayward. The city is situated at the eastern end of the San Francisco Bay, and is home to a number of technology companies, including Tesla Motors, Lam Research, and Seagate Technology.
History
Fremont was founded in 1956, when the city of Irvington merged with the towns of Centerville and Niles. The city was named after John Charles Fremont, an explorer and the first presidential candidate of the Republican Party. The city was incorporated in 1956, and has since grown to become one of the largest cities in the Bay Area.
Geography
Fremont is located in the East Bay region of the San Francisco Bay Area, and is bordered by the cities of Newark, Union City, and Hayward. The city is situated at the eastern end of the San Francisco Bay, and is home to a number of technology companies, including Tesla Motors, Lam Research, and Seagate Technology. The city covers an area of 87.2 square miles, and has a population density of 2,521 people per square mile.
Economy
Fremont is home to a number of technology companies, including Tesla Motors, Lam Research, and Seagate Technology. The city is also home to a number of manufacturing companies, including the NUMMI auto plant, which was formerly owned by General Motors and Toyota. The city is also home to a number of retail and service businesses, including the Fremont Hub Shopping Center, which is the largest shopping center in the city.
Demographics
As of the 2010 census, the population of Fremont was 214,089, with a population density of 2,521 people per square mile. The racial makeup of the city was 57.2% White, 18.2% Asian, 14.3% Hispanic or Latino, 8.2% African American, 0.7% Native American, and 0.5% Pacific Islander. The median household income in Fremont was $90,845, and the median family income was $103,817. The per capita income in Fremont was $37,845.
Common Questions
What is Per Capita Income in Fremont?
Per Capita income in Fremont is $68,357.
What is the Median Family Income in Fremont?
Median Family Income in Fremont is $188,107.
What is the Median Household income in Fremont?
Median Household Income in Fremont is $169,023.
What is Income or Wage Gap in Fremont?
Income or Wage Gap in Fremont is 37.0%.
Women in Fremont earn 63.0 cents for every dollar earned by a man.
What is Family Income Deficit in Fremont?
Family Income Deficit in Fremont is $10,481.
Families that are below poverty line in Fremont earn $10,481 less on average than the poverty threshold level.
What is Inequality or Gini Index in Fremont?
Inequality or Gini Index in Fremont is 0.41.
What is the Total Population of Fremont?
Total Population of Fremont is 228,795.
What is the Total Male Population of Fremont?
Total Male Population of Fremont is 114,554.
What is the Total Female Population of Fremont?
Total Female Population of Fremont is 114,241.
What is the Ratio of Males per 100 Females in Fremont?
There are 100.27 Males per 100 Females in Fremont.
What is the Ratio of Females per 100 Males in Fremont?
There are 99.73 Females per 100 Males in Fremont.
What is the Median Population Age in Fremont?
Median Population Age in Fremont is 38.6 Years.
What is the Average Family Size in Fremont
Average Family Size in Fremont is 3.4 People.
What is the Average Household Size in Fremont
Average Household Size in Fremont is 3.0 People.
How Large is the Labor Force in Fremont?
There are 122,842 People in the Labor Forcein in Fremont.
What is the Percentage of People in the Labor Force in Fremont?
67.5% of People are in the Labor Force in Fremont.
What is the Unemployment Rate in Fremont?
Unemployment Rate in Fremont is 4.0%.