Tempe, AZ Map & Demographics
Tempe Map
Tempe Overview
$40,495
PER CAPITA INCOME
$94,349
AVG FAMILY INCOME
$72,022
AVG HOUSEHOLD INCOME
13.2%
WAGE / INCOME GAP [ % ]
86.8¢/ $1
WAGE / INCOME GAP [ $ ]
$11,941
FAMILY INCOME DEFICIT
0.45
INEQUALITY / GINI INDEX
181,005
TOTAL POPULATION
96,435
MALE POPULATION
84,570
FEMALE POPULATION
114.03
MALES / 100 FEMALES
87.70
FEMALES / 100 MALES
29.7
MEDIAN AGE
2.9
AVG FAMILY SIZE
2.3
AVG HOUSEHOLD SIZE
111,857
LABOR FORCE [ PEOPLE ]
70.8%
PERCENT IN LABOR FORCE
5.7%
UNEMPLOYMENT RATE
Income in Tempe
Income Overview in Tempe
Per Capita Income in Tempe is $40,495, while median incomes of families and households are $94,349 and $72,022 respectively.
| Characteristic | Number | Measure |
| Per Capita Income | 181,005 | $40,495 |
| Median Family Income | 34,897 | $94,349 |
| Mean Family Income | 34,897 | $116,965 |
| Median Household Income | 75,701 | $72,022 |
| Mean Household Income | 75,701 | $94,284 |
| Income Deficit | 34,897 | $11,941 |
| Wage / Income Gap (%) | 181,005 | 13.18% |
| Wage / Income Gap ($) | 181,005 | 86.82¢ per $1 |
| Gini / Inequality Index | 181,005 | 0.45 |
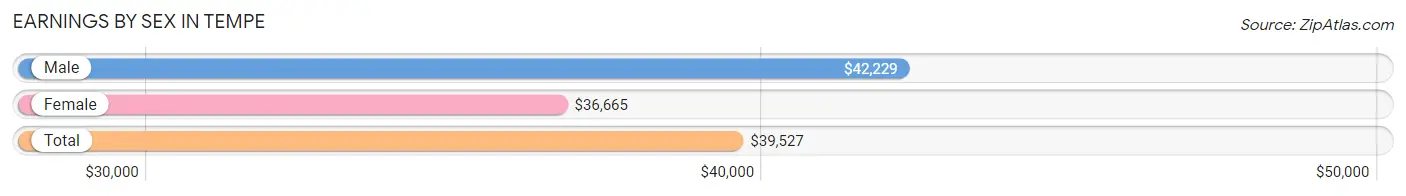
Earnings by Sex in Tempe
Average Earnings in Tempe are $39,527, $42,229 for men and $36,665 for women, a difference of 13.2%.
| Sex | Number | Average Earnings |
| Male | 66,633 (56.6%) | $42,229 |
| Female | 51,050 (43.4%) | $36,665 |
| Total | 117,683 (100.0%) | $39,527 |
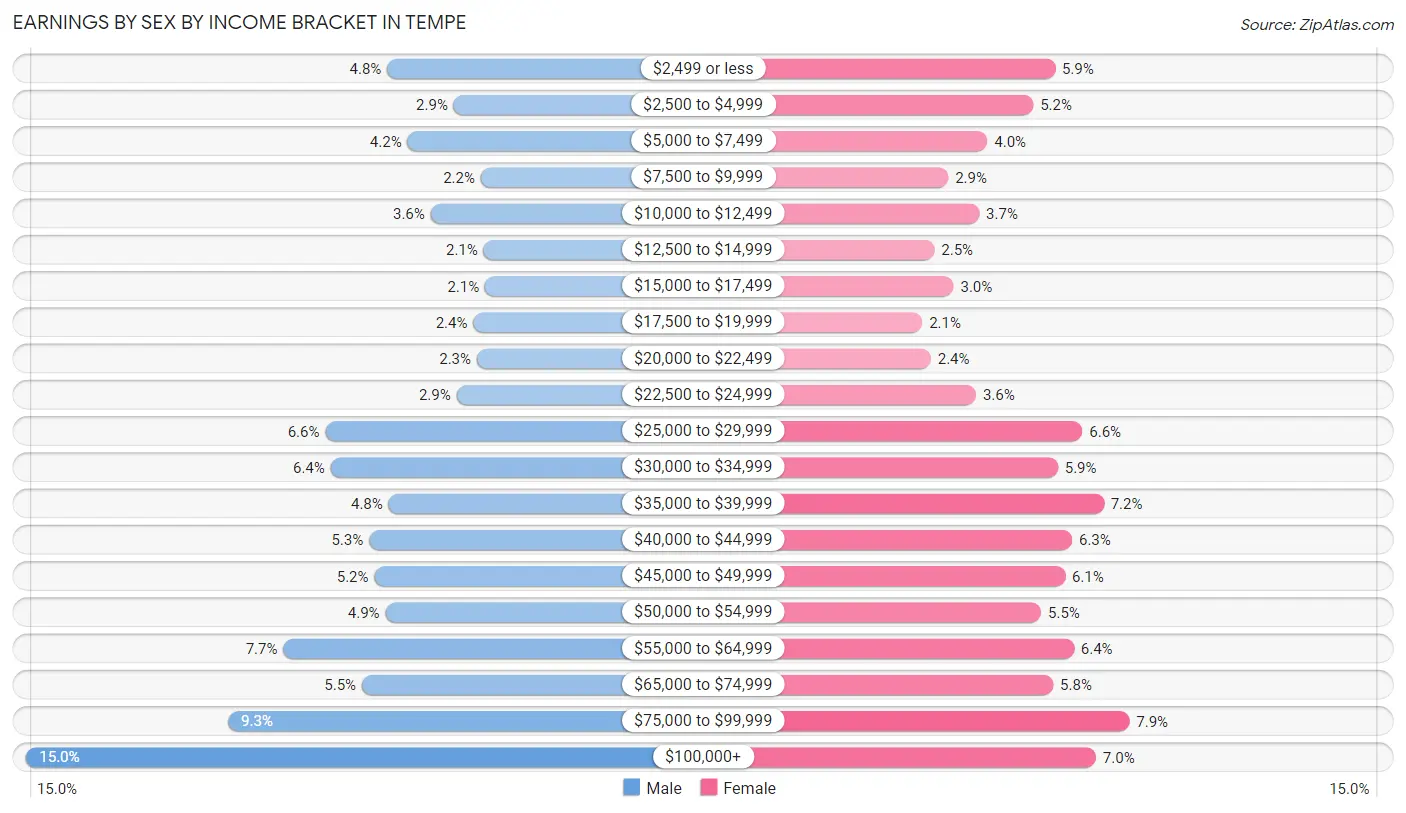
Earnings by Sex by Income Bracket in Tempe
The most common earnings brackets in Tempe are $100,000+ for men (9,962 | 14.9%) and $75,000 to $99,999 for women (4,051 | 7.9%).
| Income | Male | Female |
| $2,499 or less | 3,204 (4.8%) | 2,985 (5.9%) |
| $2,500 to $4,999 | 1,960 (2.9%) | 2,676 (5.2%) |
| $5,000 to $7,499 | 2,824 (4.2%) | 2,016 (4.0%) |
| $7,500 to $9,999 | 1,454 (2.2%) | 1,455 (2.9%) |
| $10,000 to $12,499 | 2,394 (3.6%) | 1,898 (3.7%) |
| $12,500 to $14,999 | 1,396 (2.1%) | 1,255 (2.5%) |
| $15,000 to $17,499 | 1,373 (2.1%) | 1,534 (3.0%) |
| $17,500 to $19,999 | 1,595 (2.4%) | 1,083 (2.1%) |
| $20,000 to $22,499 | 1,524 (2.3%) | 1,207 (2.4%) |
| $22,500 to $24,999 | 1,907 (2.9%) | 1,853 (3.6%) |
| $25,000 to $29,999 | 4,365 (6.6%) | 3,382 (6.6%) |
| $30,000 to $34,999 | 4,263 (6.4%) | 3,029 (5.9%) |
| $35,000 to $39,999 | 3,177 (4.8%) | 3,687 (7.2%) |
| $40,000 to $44,999 | 3,547 (5.3%) | 3,232 (6.3%) |
| $45,000 to $49,999 | 3,443 (5.2%) | 3,129 (6.1%) |
| $50,000 to $54,999 | 3,238 (4.9%) | 2,787 (5.5%) |
| $55,000 to $64,999 | 5,148 (7.7%) | 3,256 (6.4%) |
| $65,000 to $74,999 | 3,675 (5.5%) | 2,960 (5.8%) |
| $75,000 to $99,999 | 6,184 (9.3%) | 4,051 (7.9%) |
| $100,000+ | 9,962 (14.9%) | 3,575 (7.0%) |
| Total | 66,633 (100.0%) | 51,050 (100.0%) |
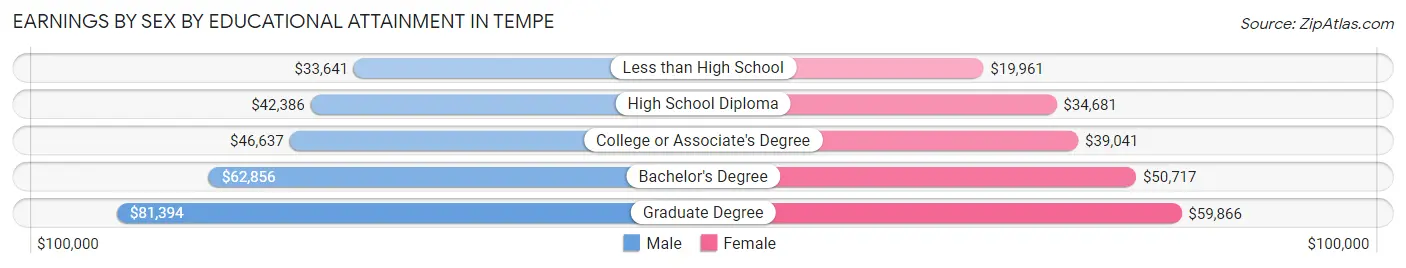
Earnings by Sex by Educational Attainment in Tempe
Average earnings in Tempe are $51,895 for men and $44,501 for women, a difference of 14.2%. Men with an educational attainment of graduate degree enjoy the highest average annual earnings of $81,394, while those with less than high school education earn the least with $33,641. Women with an educational attainment of graduate degree earn the most with the average annual earnings of $59,866, while those with less than high school education have the smallest earnings of $19,961.
| Educational Attainment | Male Income | Female Income |
| Less than High School | $33,641 | $19,961 |
| High School Diploma | $42,386 | $34,681 |
| College or Associate's Degree | $46,637 | $39,041 |
| Bachelor's Degree | $62,856 | $50,717 |
| Graduate Degree | $81,394 | $59,866 |
| Total | $51,895 | $44,501 |
Family Income in Tempe
Family Income Brackets in Tempe
According to the Tempe family income data, there are 7,363 families falling into the $100,000 to $149,999 income range, which is the most common income bracket and makes up 21.1% of all families. Conversely, the $10,000 to $14,999 income bracket is the least frequent group with only 733 families (2.1%) belonging to this category.
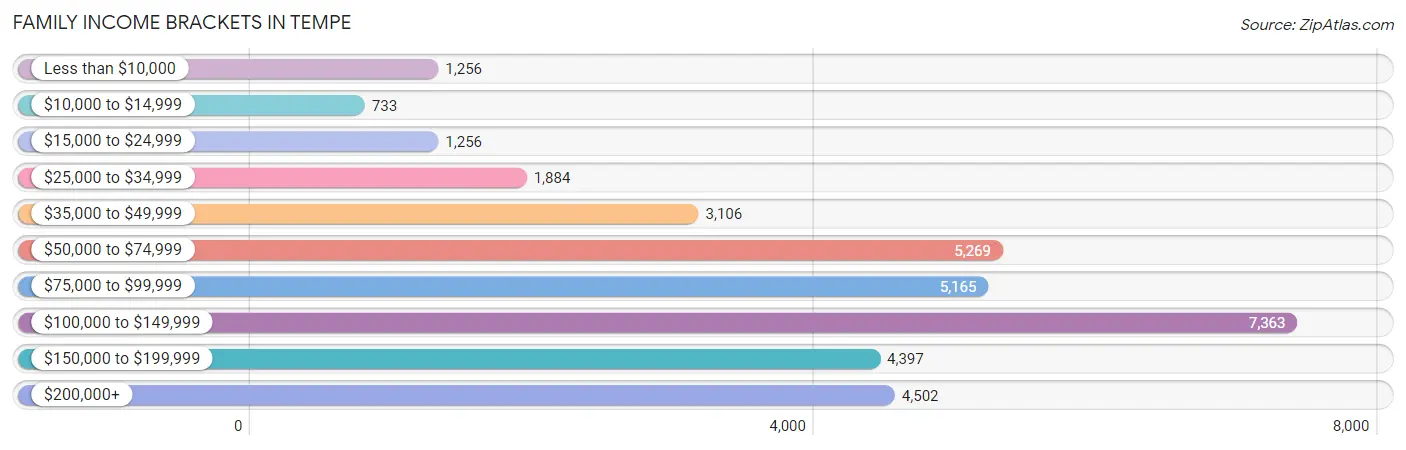
| Income Bracket | # Families | % Families |
| Less than $10,000 | 1,256 | 3.6% |
| $10,000 to $14,999 | 733 | 2.1% |
| $15,000 to $24,999 | 1,256 | 3.6% |
| $25,000 to $34,999 | 1,884 | 5.4% |
| $35,000 to $49,999 | 3,106 | 8.9% |
| $50,000 to $74,999 | 5,269 | 15.1% |
| $75,000 to $99,999 | 5,165 | 14.8% |
| $100,000 to $149,999 | 7,363 | 21.1% |
| $150,000 to $199,999 | 4,397 | 12.6% |
| $200,000+ | 4,502 | 12.9% |
Family Income by Famaliy Size in Tempe
4-person families (4,944 | 14.2%) account for the highest median family income in Tempe with $119,861 per family, while 2-person families (19,185 | 55.0%) have the highest median income of $44,657 per family member.
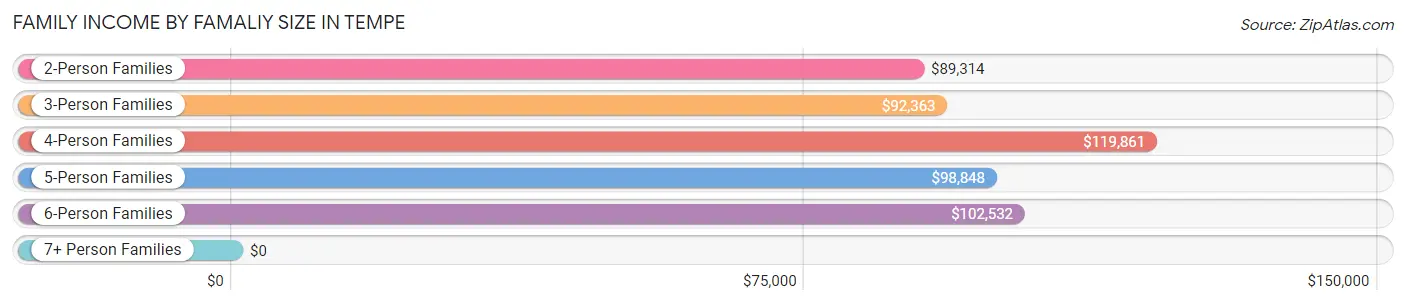
| Income Bracket | # Families | Median Income |
| 2-Person Families | 19,185 (55.0%) | $89,314 |
| 3-Person Families | 7,607 (21.8%) | $92,363 |
| 4-Person Families | 4,944 (14.2%) | $119,861 |
| 5-Person Families | 1,893 (5.4%) | $98,848 |
| 6-Person Families | 829 (2.4%) | $102,532 |
| 7+ Person Families | 439 (1.3%) | $0 |
| Total | 34,897 (100.0%) | $94,349 |
Family Income by Number of Earners in Tempe
The median family income in Tempe is $94,349, with families comprising 3+ earners (3,139) having the highest median family income of $134,975, while families with no earners (4,257) have the lowest median family income of $65,777, accounting for 9.0% and 12.2% of families, respectively.
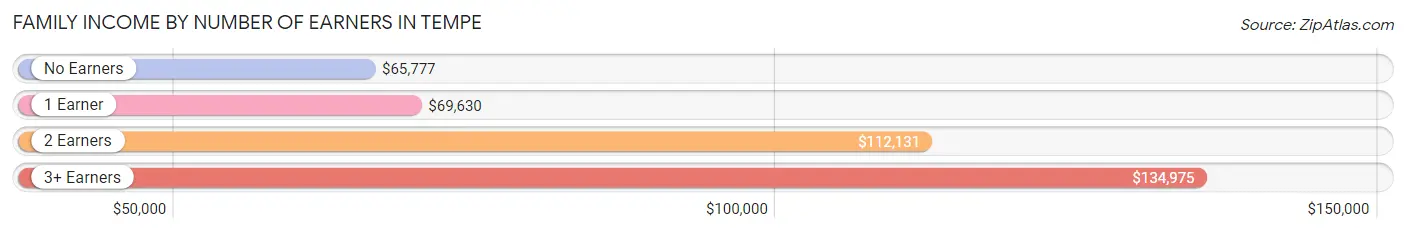
| Number of Earners | # Families | Median Income |
| No Earners | 4,257 (12.2%) | $65,777 |
| 1 Earner | 11,227 (32.2%) | $69,630 |
| 2 Earners | 16,274 (46.6%) | $112,131 |
| 3+ Earners | 3,139 (9.0%) | $134,975 |
| Total | 34,897 (100.0%) | $94,349 |
Household Income in Tempe
Household Income Brackets in Tempe
With 14,005 households falling in the category, the $50,000 to $74,999 income range is the most frequent in Tempe, accounting for 18.5% of all households. In contrast, only 2,120 households (2.8%) fall into the $10,000 to $14,999 income bracket, making it the least populous group.
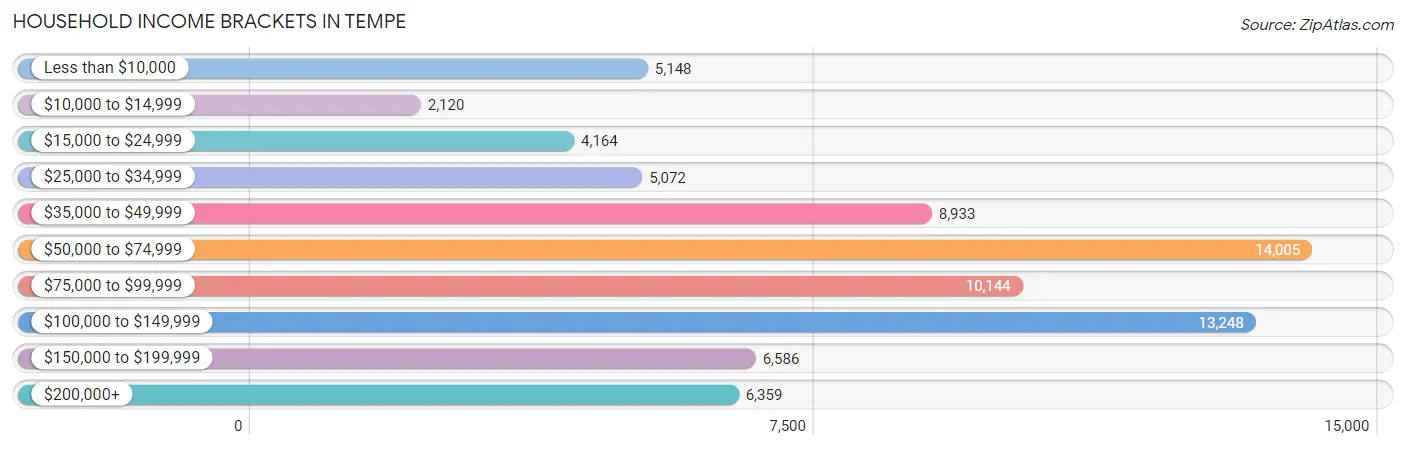
| Income Bracket | # Households | % Households |
| Less than $10,000 | 5,148 | 6.8% |
| $10,000 to $14,999 | 2,120 | 2.8% |
| $15,000 to $24,999 | 4,164 | 5.5% |
| $25,000 to $34,999 | 5,072 | 6.7% |
| $35,000 to $49,999 | 8,933 | 11.8% |
| $50,000 to $74,999 | 14,005 | 18.5% |
| $75,000 to $99,999 | 10,144 | 13.4% |
| $100,000 to $149,999 | 13,248 | 17.5% |
| $150,000 to $199,999 | 6,586 | 8.7% |
| $200,000+ | 6,359 | 8.4% |
Household Income by Householder Age in Tempe
The median household income in Tempe is $72,022, with the highest median household income of $85,992 found in the 45 to 64 years age bracket for the primary householder. A total of 19,582 households (25.9%) fall into this category. Meanwhile, the 15 to 24 years age bracket for the primary householder has the lowest median household income of $38,269, with 12,426 households (16.4%) in this group.
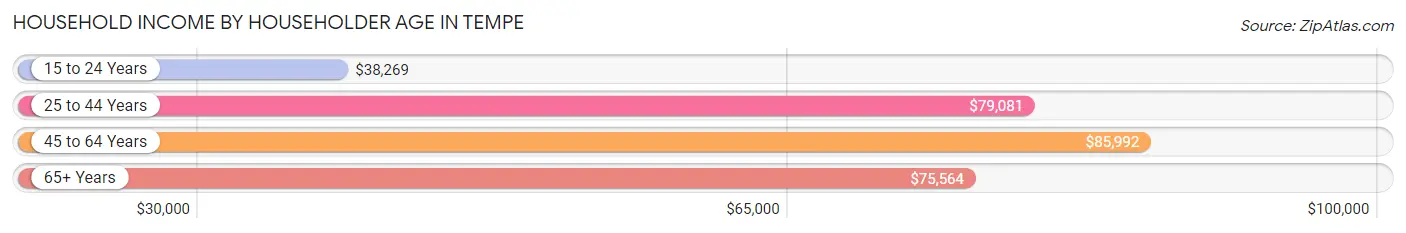
| Income Bracket | # Households | Median Income |
| 15 to 24 Years | 12,426 (16.4%) | $38,269 |
| 25 to 44 Years | 32,047 (42.3%) | $79,081 |
| 45 to 64 Years | 19,582 (25.9%) | $85,992 |
| 65+ Years | 11,646 (15.4%) | $75,564 |
| Total | 75,701 (100.0%) | $72,022 |
Poverty in Tempe
Income Below Poverty by Sex and Age in Tempe
With 16.8% poverty level for males and 16.7% for females among the residents of Tempe, 18 to 24 year old males and 18 to 24 year old females are the most vulnerable to poverty, with 7,051 males (40.5%) and 5,537 females (37.8%) in their respective age groups living below the poverty level.
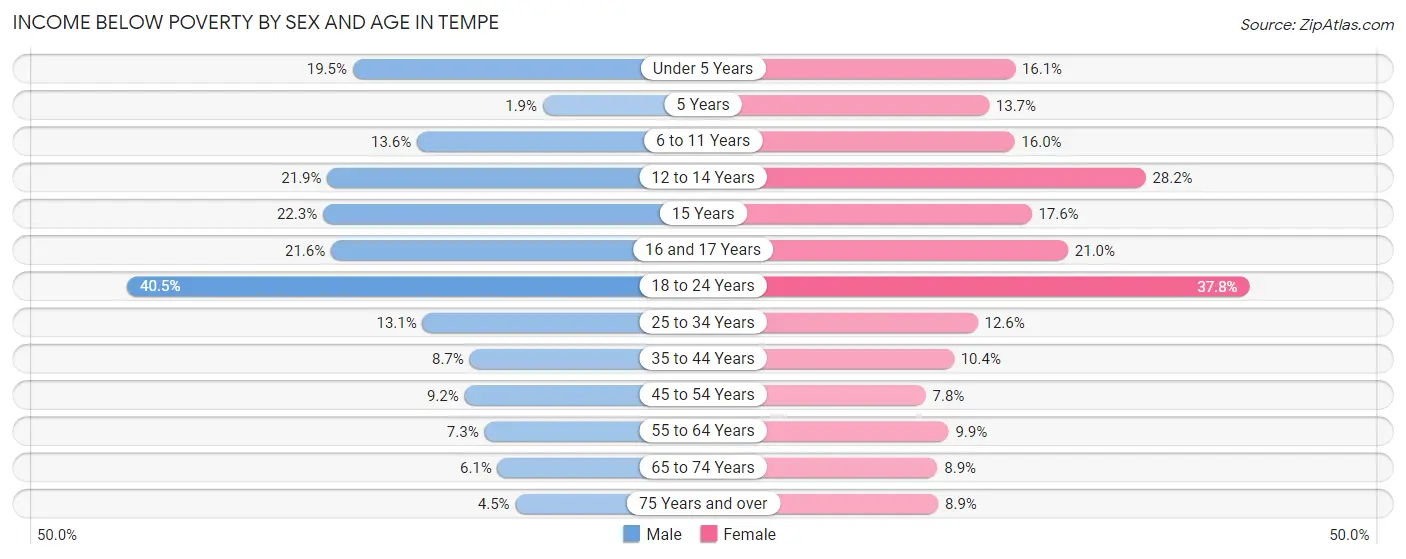
| Age Bracket | Male | Female |
| Under 5 Years | 839 (19.5%) | 503 (16.1%) |
| 5 Years | 10 (1.9%) | 114 (13.7%) |
| 6 to 11 Years | 570 (13.6%) | 603 (16.0%) |
| 12 to 14 Years | 451 (21.9%) | 581 (28.2%) |
| 15 Years | 178 (22.3%) | 151 (17.6%) |
| 16 and 17 Years | 293 (21.6%) | 329 (21.0%) |
| 18 to 24 Years | 7,051 (40.5%) | 5,537 (37.8%) |
| 25 to 34 Years | 3,173 (13.1%) | 2,209 (12.6%) |
| 35 to 44 Years | 1,021 (8.7%) | 986 (10.4%) |
| 45 to 54 Years | 747 (9.2%) | 548 (7.8%) |
| 55 to 64 Years | 593 (7.3%) | 878 (9.9%) |
| 65 to 74 Years | 322 (6.1%) | 506 (8.9%) |
| 75 Years and over | 159 (4.4%) | 377 (8.9%) |
| Total | 15,407 (16.8%) | 13,322 (16.7%) |
Income Above Poverty by Sex and Age in Tempe
According to the poverty statistics in Tempe, males aged 5 years and females aged 45 to 54 years are the age groups that are most secure financially, with 98.1% of males and 92.2% of females in these age groups living above the poverty line.
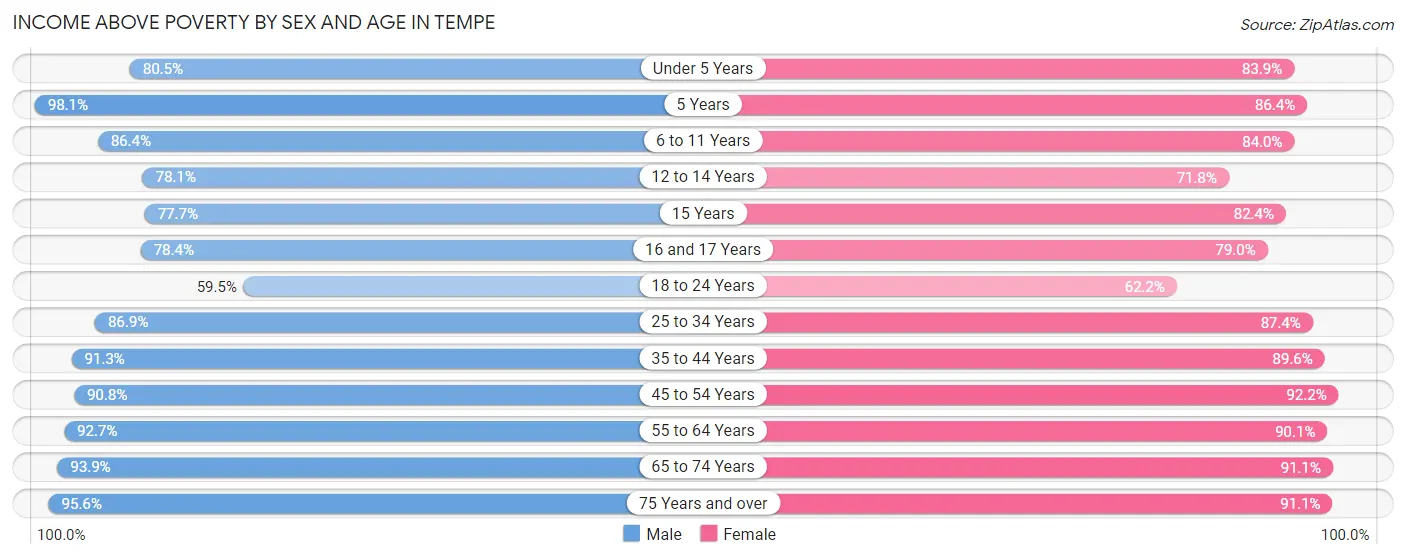
| Age Bracket | Male | Female |
| Under 5 Years | 3,454 (80.5%) | 2,627 (83.9%) |
| 5 Years | 517 (98.1%) | 721 (86.4%) |
| 6 to 11 Years | 3,627 (86.4%) | 3,161 (84.0%) |
| 12 to 14 Years | 1,608 (78.1%) | 1,481 (71.8%) |
| 15 Years | 620 (77.7%) | 707 (82.4%) |
| 16 and 17 Years | 1,066 (78.4%) | 1,239 (79.0%) |
| 18 to 24 Years | 10,365 (59.5%) | 9,100 (62.2%) |
| 25 to 34 Years | 21,100 (86.9%) | 15,327 (87.4%) |
| 35 to 44 Years | 10,718 (91.3%) | 8,506 (89.6%) |
| 45 to 54 Years | 7,400 (90.8%) | 6,496 (92.2%) |
| 55 to 64 Years | 7,512 (92.7%) | 7,995 (90.1%) |
| 65 to 74 Years | 4,957 (93.9%) | 5,197 (91.1%) |
| 75 Years and over | 3,417 (95.6%) | 3,840 (91.1%) |
| Total | 76,361 (83.2%) | 66,397 (83.3%) |
Income Below Poverty Among Married-Couple Families in Tempe
The poverty statistics for married-couple families in Tempe show that 4.1% or 954 of the total 23,369 families live below the poverty line. Families with 5 or more children have the highest poverty rate of 12.6%, comprising of 22 families. On the other hand, families with 3 or 4 children have the lowest poverty rate of 3.3%, which includes 52 families.
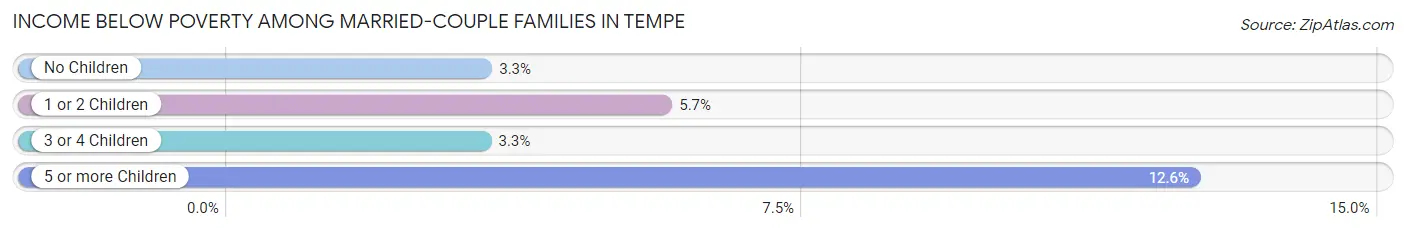
| Children | Above Poverty | Below Poverty |
| No Children | 14,242 (96.7%) | 489 (3.3%) |
| 1 or 2 Children | 6,500 (94.3%) | 391 (5.7%) |
| 3 or 4 Children | 1,520 (96.7%) | 52 (3.3%) |
| 5 or more Children | 153 (87.4%) | 22 (12.6%) |
| Total | 22,415 (95.9%) | 954 (4.1%) |
Income Below Poverty Among Single-Parent Households in Tempe
According to the poverty data in Tempe, 13.3% or 645 single-father households and 22.8% or 1,523 single-mother households are living below the poverty line. Among single-father households, those with 1 or 2 children have the highest poverty rate, with 394 households (21.0%) experiencing poverty. Likewise, among single-mother households, those with 5 or more children have the highest poverty rate, with 90 households (80.4%) falling below the poverty line.
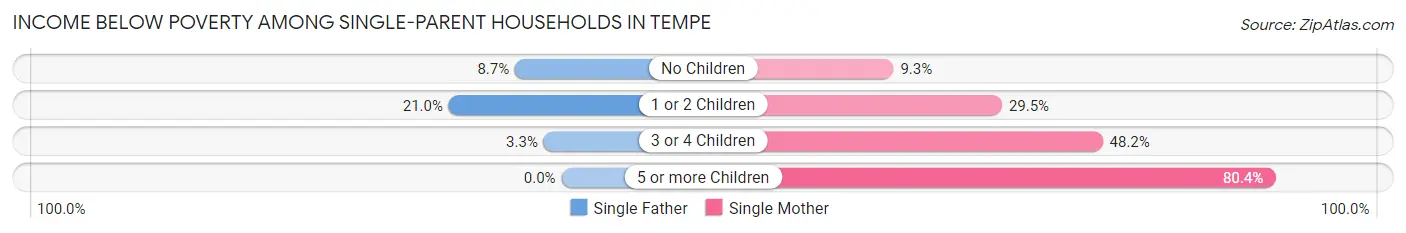
| Children | Single Father | Single Mother |
| No Children | 248 (8.6%) | 279 (9.3%) |
| 1 or 2 Children | 394 (21.0%) | 895 (29.5%) |
| 3 or 4 Children | 3 (3.3%) | 259 (48.2%) |
| 5 or more Children | 0 (0.0%) | 90 (80.4%) |
| Total | 645 (13.3%) | 1,523 (22.8%) |
Income Below Poverty Among Married-Couple vs Single-Parent Households in Tempe
The poverty data for Tempe shows that 954 of the married-couple family households (4.1%) and 2,168 of the single-parent households (18.8%) are living below the poverty level. Within the married-couple family households, those with 5 or more children have the highest poverty rate, with 22 households (12.6%) falling below the poverty line. Among the single-parent households, those with 5 or more children have the highest poverty rate, with 90 household (80.4%) living below poverty.
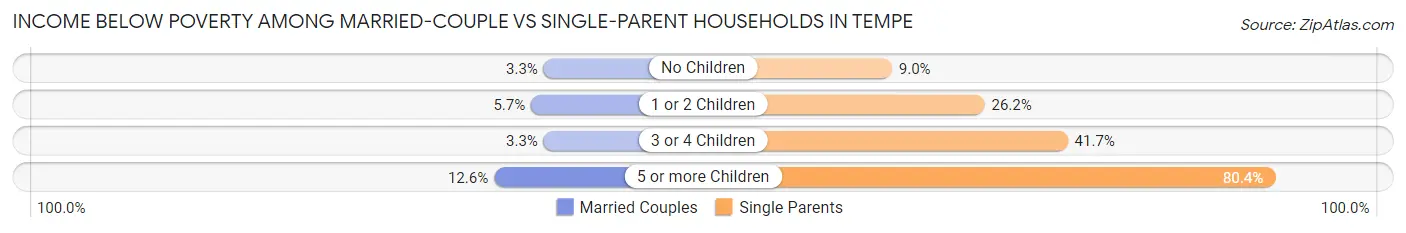
| Children | Married-Couple Families | Single-Parent Households |
| No Children | 489 (3.3%) | 527 (9.0%) |
| 1 or 2 Children | 391 (5.7%) | 1,289 (26.2%) |
| 3 or 4 Children | 52 (3.3%) | 262 (41.7%) |
| 5 or more Children | 22 (12.6%) | 90 (80.4%) |
| Total | 954 (4.1%) | 2,168 (18.8%) |
Race in Tempe
The most populous races in Tempe are White / Caucasian (113,334 | 62.6%), Hispanic or Latino (42,497 | 23.5%), and Two or more Races (20,070 | 11.1%).
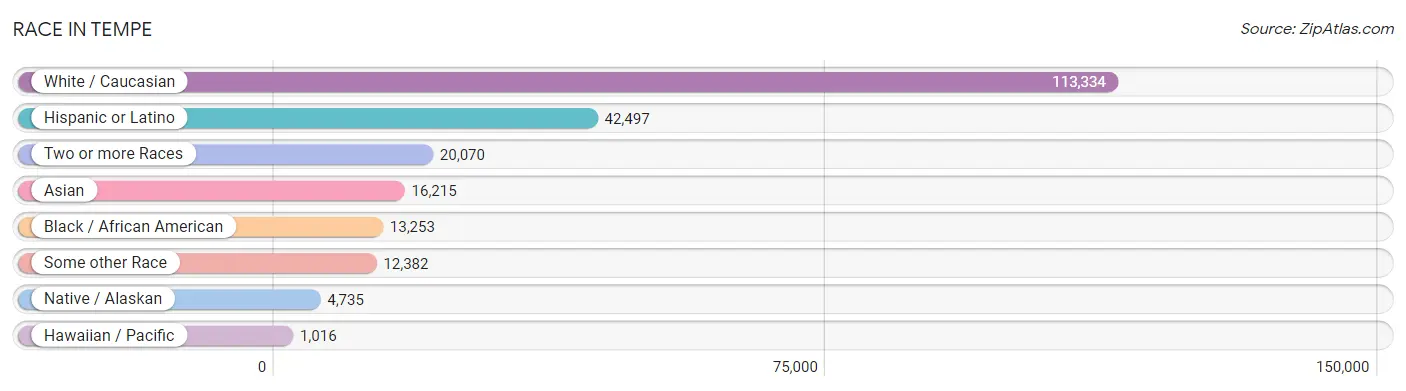
| Race | # Population | % Population |
| Asian | 16,215 | 9.0% |
| Black / African American | 13,253 | 7.3% |
| Hawaiian / Pacific | 1,016 | 0.6% |
| Hispanic or Latino | 42,497 | 23.5% |
| Native / Alaskan | 4,735 | 2.6% |
| White / Caucasian | 113,334 | 62.6% |
| Two or more Races | 20,070 | 11.1% |
| Some other Race | 12,382 | 6.8% |
| Total | 181,005 | 100.0% |
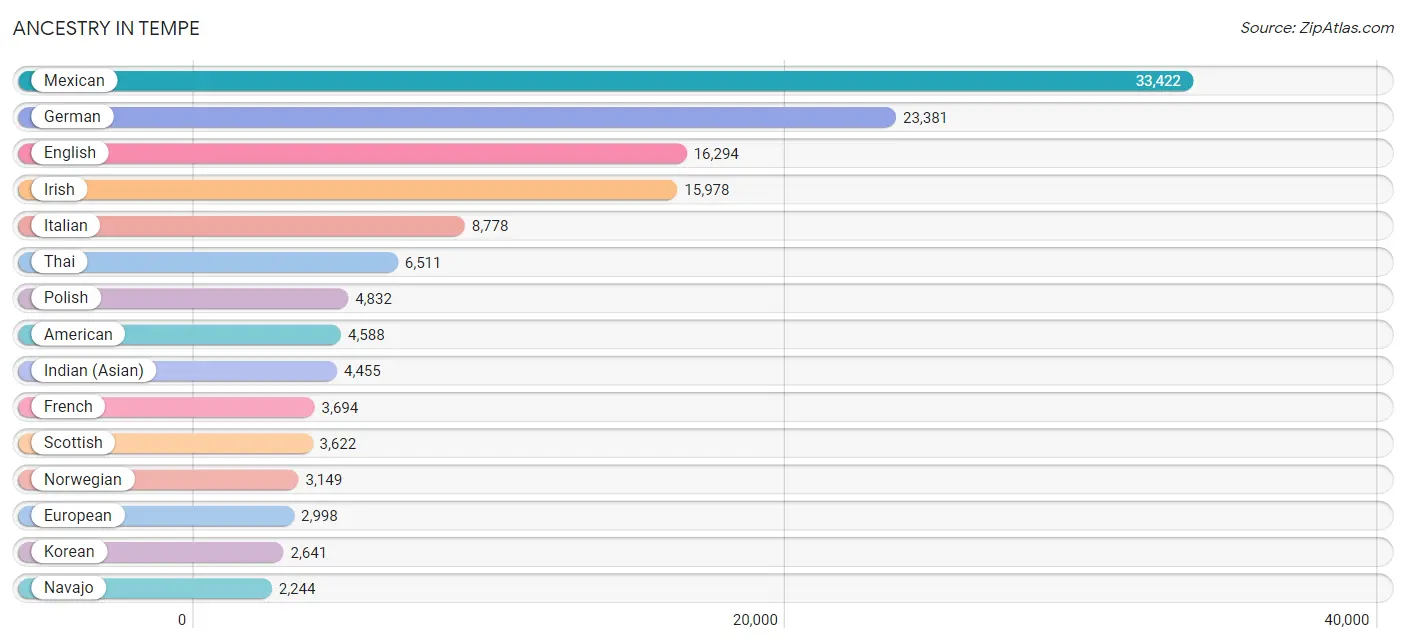
Ancestry in Tempe
The most populous ancestries reported in Tempe are Mexican (33,422 | 18.5%), German (23,381 | 12.9%), English (16,294 | 9.0%), Irish (15,978 | 8.8%), and Italian (8,778 | 4.9%), together accounting for 54.1% of all Tempe residents.
| Ancestry | # Population | % Population |
| Afghan | 88 | 0.1% |
| African | 645 | 0.4% |
| Alaska Native | 18 | 0.0% |
| Alaskan Athabascan | 12 | 0.0% |
| Albanian | 22 | 0.0% |
| American | 4,588 | 2.5% |
| Apache | 630 | 0.4% |
| Arab | 2,117 | 1.2% |
| Argentinean | 46 | 0.0% |
| Armenian | 117 | 0.1% |
| Australian | 22 | 0.0% |
| Austrian | 280 | 0.2% |
| Bahamian | 186 | 0.1% |
| Bangladeshi | 37 | 0.0% |
| Barbadian | 335 | 0.2% |
| Basque | 48 | 0.0% |
| Belgian | 247 | 0.1% |
| Belizean | 42 | 0.0% |
| Bhutanese | 1,399 | 0.8% |
| Blackfeet | 91 | 0.1% |
| Bolivian | 43 | 0.0% |
| Brazilian | 146 | 0.1% |
| British | 1,457 | 0.8% |
| Bulgarian | 116 | 0.1% |
| Burmese | 1,064 | 0.6% |
| Cambodian | 5 | 0.0% |
| Canadian | 371 | 0.2% |
| Celtic | 62 | 0.0% |
| Central American | 1,264 | 0.7% |
| Central American Indian | 396 | 0.2% |
| Cherokee | 508 | 0.3% |
| Cheyenne | 30 | 0.0% |
| Chickasaw | 6 | 0.0% |
| Chilean | 134 | 0.1% |
| Chippewa | 6 | 0.0% |
| Choctaw | 30 | 0.0% |
| Colombian | 702 | 0.4% |
| Comanche | 28 | 0.0% |
| Costa Rican | 159 | 0.1% |
| Creek | 11 | 0.0% |
| Croatian | 269 | 0.2% |
| Cuban | 754 | 0.4% |
| Cypriot | 11 | 0.0% |
| Czech | 924 | 0.5% |
| Czechoslovakian | 163 | 0.1% |
| Danish | 1,101 | 0.6% |
| Dominican | 251 | 0.1% |
| Dutch | 2,062 | 1.1% |
| Eastern European | 1,047 | 0.6% |
| Ecuadorian | 60 | 0.0% |
| Egyptian | 473 | 0.3% |
| English | 16,294 | 9.0% |
| Estonian | 13 | 0.0% |
| Ethiopian | 64 | 0.0% |
| European | 2,998 | 1.7% |
| Fijian | 72 | 0.0% |
| Filipino | 355 | 0.2% |
| Finnish | 532 | 0.3% |
| French | 3,694 | 2.0% |
| French Canadian | 757 | 0.4% |
| German | 23,381 | 12.9% |
| German Russian | 35 | 0.0% |
| Ghanaian | 64 | 0.0% |
| Greek | 1,262 | 0.7% |
| Guamanian / Chamorro | 163 | 0.1% |
| Guatemalan | 293 | 0.2% |
| Guyanese | 6 | 0.0% |
| Haitian | 12 | 0.0% |
| Honduran | 121 | 0.1% |
| Hopi | 120 | 0.1% |
| Hungarian | 593 | 0.3% |
| Icelander | 14 | 0.0% |
| Indian (Asian) | 4,455 | 2.5% |
| Indonesian | 85 | 0.1% |
| Inupiat | 79 | 0.0% |
| Iranian | 282 | 0.2% |
| Irish | 15,978 | 8.8% |
| Israeli | 59 | 0.0% |
| Italian | 8,778 | 4.9% |
| Jamaican | 402 | 0.2% |
| Japanese | 280 | 0.2% |
| Jordanian | 204 | 0.1% |
| Kiowa | 238 | 0.1% |
| Korean | 2,641 | 1.5% |
| Laotian | 264 | 0.2% |
| Latvian | 77 | 0.0% |
| Lebanese | 254 | 0.1% |
| Lithuanian | 182 | 0.1% |
| Luxembourger | 59 | 0.0% |
| Macedonian | 60 | 0.0% |
| Malaysian | 121 | 0.1% |
| Mexican | 33,422 | 18.5% |
| Mexican American Indian | 326 | 0.2% |
| Mongolian | 1 | 0.0% |
| Moroccan | 83 | 0.1% |
| Native Hawaiian | 589 | 0.3% |
| Navajo | 2,244 | 1.2% |
| New Zealander | 18 | 0.0% |
| Nicaraguan | 146 | 0.1% |
| Nigerian | 242 | 0.1% |
| Northern European | 231 | 0.1% |
| Norwegian | 3,149 | 1.7% |
| Okinawan | 31 | 0.0% |
| Pakistani | 414 | 0.2% |
| Palestinian | 115 | 0.1% |
| Panamanian | 31 | 0.0% |
| Peruvian | 340 | 0.2% |
| Pima | 346 | 0.2% |
| Polish | 4,832 | 2.7% |
| Portuguese | 352 | 0.2% |
| Potawatomi | 83 | 0.1% |
| Pueblo | 52 | 0.0% |
| Puerto Rican | 1,327 | 0.7% |
| Puget Sound Salish | 1 | 0.0% |
| Romanian | 177 | 0.1% |
| Russian | 1,665 | 0.9% |
| Salvadoran | 514 | 0.3% |
| Samoan | 225 | 0.1% |
| Scandinavian | 975 | 0.5% |
| Scotch-Irish | 1,177 | 0.6% |
| Scottish | 3,622 | 2.0% |
| Serbian | 81 | 0.0% |
| Sioux | 168 | 0.1% |
| Slavic | 61 | 0.0% |
| Slovak | 193 | 0.1% |
| Slovene | 27 | 0.0% |
| Somali | 842 | 0.5% |
| South African | 17 | 0.0% |
| South American | 1,494 | 0.8% |
| South American Indian | 107 | 0.1% |
| Soviet Union | 17 | 0.0% |
| Spaniard | 1,015 | 0.6% |
| Spanish | 1,190 | 0.7% |
| Spanish American | 153 | 0.1% |
| Spanish American Indian | 57 | 0.0% |
| Sri Lankan | 1,336 | 0.7% |
| Subsaharan African | 2,092 | 1.2% |
| Sudanese | 142 | 0.1% |
| Swedish | 1,853 | 1.0% |
| Swiss | 449 | 0.3% |
| Syrian | 56 | 0.0% |
| Thai | 6,511 | 3.6% |
| Tlingit-Haida | 20 | 0.0% |
| Tohono O'Odham | 89 | 0.1% |
| Tongan | 183 | 0.1% |
| Turkish | 82 | 0.1% |
| U.S. Virgin Islander | 62 | 0.0% |
| Ukrainian | 526 | 0.3% |
| Ute | 57 | 0.0% |
| Venezuelan | 155 | 0.1% |
| Vietnamese | 228 | 0.1% |
| Welsh | 1,110 | 0.6% |
| West Indian | 128 | 0.1% |
| Yaqui | 812 | 0.4% |
| Yugoslavian | 285 | 0.2% |
| Yuman | 21 | 0.0% | View All 156 Rows |
Immigrants in Tempe
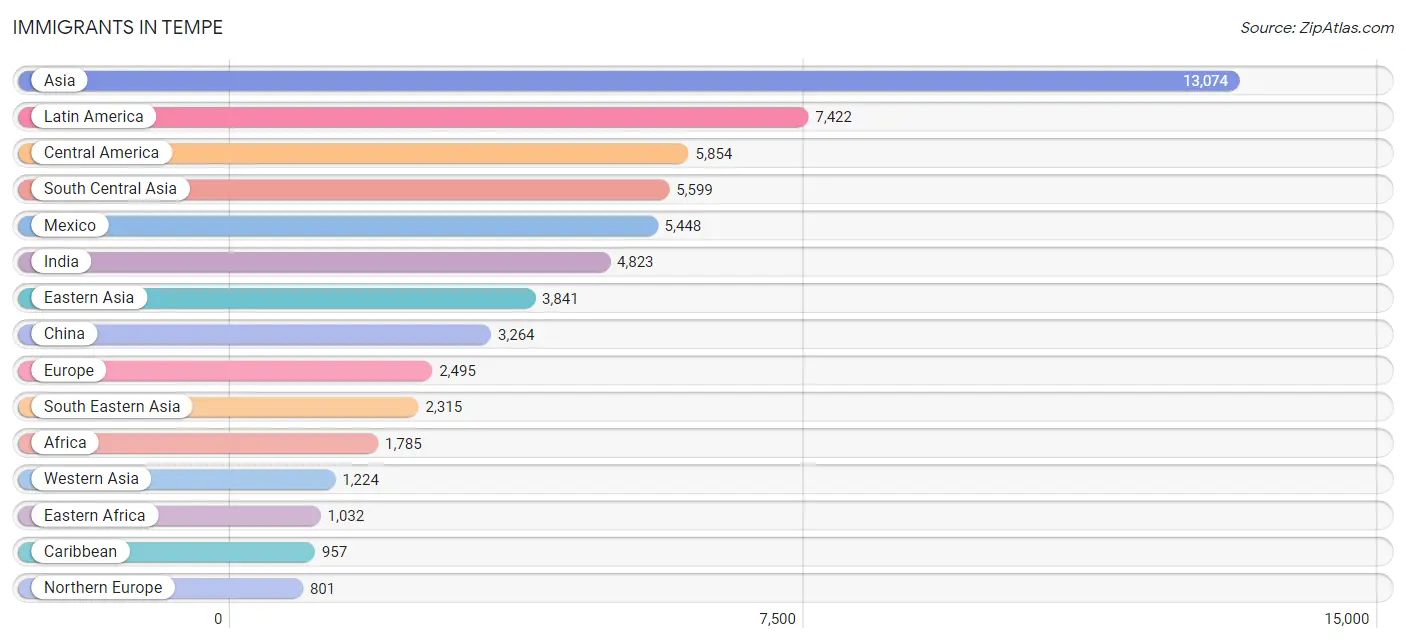
The most numerous immigrant groups reported in Tempe came from Asia (13,074 | 7.2%), Latin America (7,422 | 4.1%), Central America (5,854 | 3.2%), South Central Asia (5,599 | 3.1%), and Mexico (5,448 | 3.0%), together accounting for 20.6% of all Tempe residents.
| Immigration Origin | # Population | % Population |
| Afghanistan | 16 | 0.0% |
| Africa | 1,785 | 1.0% |
| Albania | 19 | 0.0% |
| Asia | 13,074 | 7.2% |
| Australia | 10 | 0.0% |
| Austria | 48 | 0.0% |
| Bahamas | 165 | 0.1% |
| Bangladesh | 194 | 0.1% |
| Barbados | 309 | 0.2% |
| Bolivia | 6 | 0.0% |
| Bosnia and Herzegovina | 67 | 0.0% |
| Brazil | 31 | 0.0% |
| Bulgaria | 104 | 0.1% |
| Cambodia | 138 | 0.1% |
| Cameroon | 34 | 0.0% |
| Canada | 723 | 0.4% |
| Caribbean | 957 | 0.5% |
| Central America | 5,854 | 3.2% |
| Chile | 73 | 0.0% |
| China | 3,264 | 1.8% |
| Colombia | 287 | 0.2% |
| Costa Rica | 15 | 0.0% |
| Cuba | 294 | 0.2% |
| Denmark | 27 | 0.0% |
| Dominican Republic | 148 | 0.1% |
| Eastern Africa | 1,032 | 0.6% |
| Eastern Asia | 3,841 | 2.1% |
| Eastern Europe | 784 | 0.4% |
| Ecuador | 43 | 0.0% |
| Egypt | 213 | 0.1% |
| El Salvador | 131 | 0.1% |
| England | 622 | 0.3% |
| Ethiopia | 56 | 0.0% |
| Europe | 2,495 | 1.4% |
| Fiji | 113 | 0.1% |
| France | 169 | 0.1% |
| Germany | 349 | 0.2% |
| Ghana | 154 | 0.1% |
| Guatemala | 117 | 0.1% |
| Guyana | 14 | 0.0% |
| Haiti | 18 | 0.0% |
| Honduras | 69 | 0.0% |
| Hong Kong | 86 | 0.1% |
| Hungary | 9 | 0.0% |
| India | 4,823 | 2.7% |
| Indonesia | 341 | 0.2% |
| Iran | 246 | 0.1% |
| Ireland | 11 | 0.0% |
| Italy | 162 | 0.1% |
| Jamaica | 15 | 0.0% |
| Japan | 185 | 0.1% |
| Jordan | 103 | 0.1% |
| Kenya | 362 | 0.2% |
| Korea | 392 | 0.2% |
| Kuwait | 158 | 0.1% |
| Laos | 36 | 0.0% |
| Latin America | 7,422 | 4.1% |
| Lebanon | 23 | 0.0% |
| Lithuania | 21 | 0.0% |
| Malaysia | 31 | 0.0% |
| Mexico | 5,448 | 3.0% |
| Middle Africa | 34 | 0.0% |
| Moldova | 43 | 0.0% |
| Morocco | 33 | 0.0% |
| Nepal | 86 | 0.1% |
| Netherlands | 60 | 0.0% |
| Nicaragua | 74 | 0.0% |
| Nigeria | 180 | 0.1% |
| Northern Africa | 346 | 0.2% |
| Northern Europe | 801 | 0.4% |
| Norway | 21 | 0.0% |
| Oceania | 286 | 0.2% |
| Pakistan | 179 | 0.1% |
| Peru | 85 | 0.1% |
| Philippines | 729 | 0.4% |
| Poland | 81 | 0.0% |
| Romania | 67 | 0.0% |
| Russia | 213 | 0.1% |
| Saudi Arabia | 419 | 0.2% |
| Scotland | 4 | 0.0% |
| Serbia | 7 | 0.0% |
| Singapore | 52 | 0.0% |
| Somalia | 457 | 0.3% |
| South Africa | 13 | 0.0% |
| South America | 611 | 0.3% |
| South Central Asia | 5,599 | 3.1% |
| South Eastern Asia | 2,315 | 1.3% |
| Southern Europe | 241 | 0.1% |
| Spain | 79 | 0.0% |
| Sri Lanka | 47 | 0.0% |
| Sudan | 100 | 0.1% |
| Sweden | 13 | 0.0% |
| Switzerland | 43 | 0.0% |
| Syria | 55 | 0.0% |
| Taiwan | 317 | 0.2% |
| Thailand | 173 | 0.1% |
| Turkey | 63 | 0.0% |
| Ukraine | 68 | 0.0% |
| Venezuela | 72 | 0.0% |
| Vietnam | 757 | 0.4% |
| Western Africa | 334 | 0.2% |
| Western Asia | 1,224 | 0.7% |
| Western Europe | 669 | 0.4% |
| Yemen | 33 | 0.0% |
| Zimbabwe | 6 | 0.0% | View All 105 Rows |
Sex and Age in Tempe
Sex and Age in Tempe
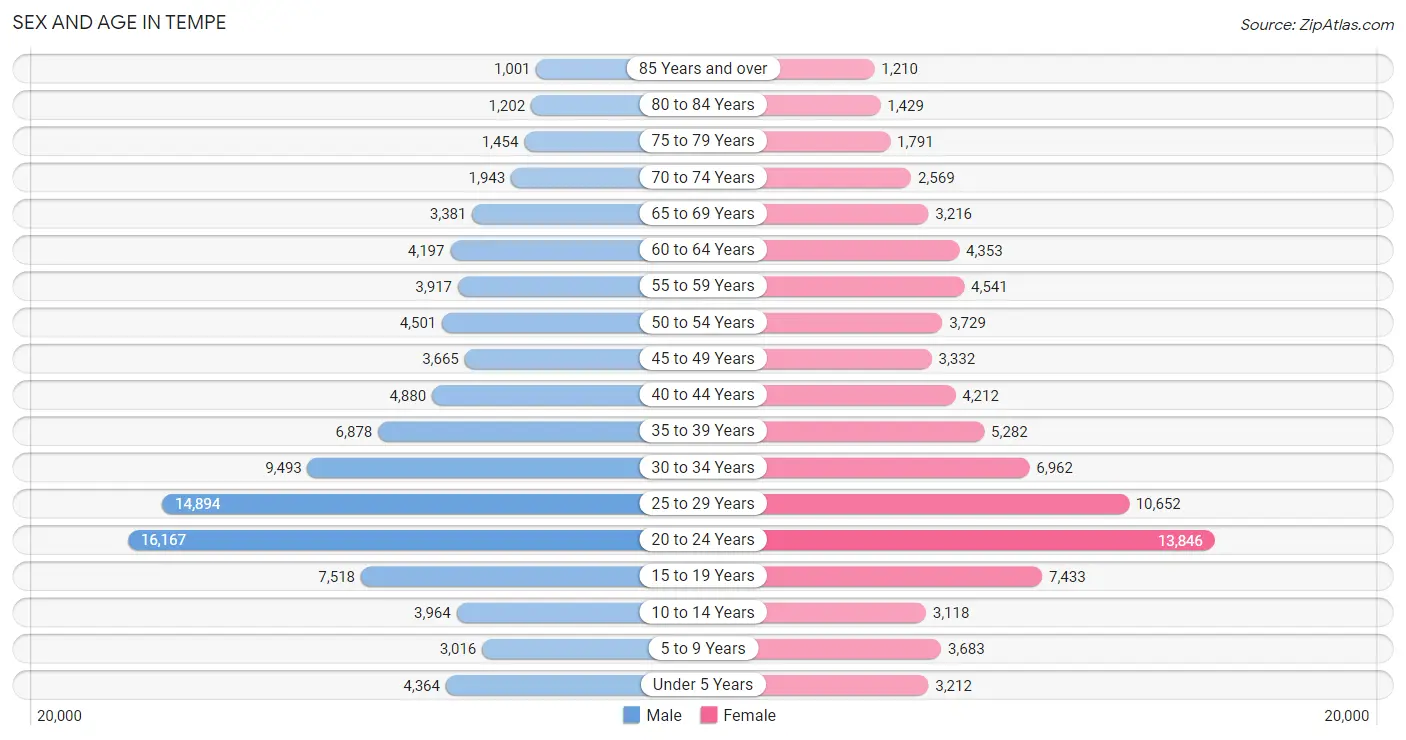
The most populous age groups in Tempe are 20 to 24 Years (16,167 | 16.8%) for men and 20 to 24 Years (13,846 | 16.4%) for women.
| Age Bracket | Male | Female |
| Under 5 Years | 4,364 (4.5%) | 3,212 (3.8%) |
| 5 to 9 Years | 3,016 (3.1%) | 3,683 (4.3%) |
| 10 to 14 Years | 3,964 (4.1%) | 3,118 (3.7%) |
| 15 to 19 Years | 7,518 (7.8%) | 7,433 (8.8%) |
| 20 to 24 Years | 16,167 (16.8%) | 13,846 (16.4%) |
| 25 to 29 Years | 14,894 (15.4%) | 10,652 (12.6%) |
| 30 to 34 Years | 9,493 (9.8%) | 6,962 (8.2%) |
| 35 to 39 Years | 6,878 (7.1%) | 5,282 (6.2%) |
| 40 to 44 Years | 4,880 (5.1%) | 4,212 (5.0%) |
| 45 to 49 Years | 3,665 (3.8%) | 3,332 (3.9%) |
| 50 to 54 Years | 4,501 (4.7%) | 3,729 (4.4%) |
| 55 to 59 Years | 3,917 (4.1%) | 4,541 (5.4%) |
| 60 to 64 Years | 4,197 (4.3%) | 4,353 (5.1%) |
| 65 to 69 Years | 3,381 (3.5%) | 3,216 (3.8%) |
| 70 to 74 Years | 1,943 (2.0%) | 2,569 (3.0%) |
| 75 to 79 Years | 1,454 (1.5%) | 1,791 (2.1%) |
| 80 to 84 Years | 1,202 (1.3%) | 1,429 (1.7%) |
| 85 Years and over | 1,001 (1.0%) | 1,210 (1.4%) |
| Total | 96,435 (100.0%) | 84,570 (100.0%) |
Families and Households in Tempe
Median Family Size in Tempe
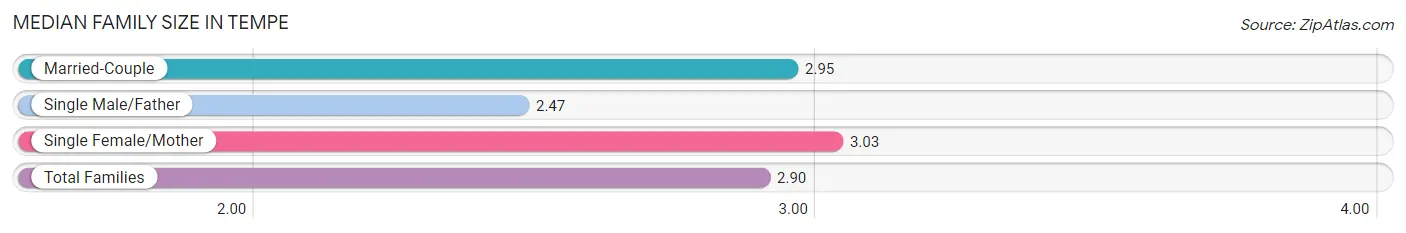
The median family size in Tempe is 2.90 persons per family, with single female/mother families (6,692 | 19.2%) accounting for the largest median family size of 3.03 persons per family. On the other hand, single male/father families (4,836 | 13.9%) represent the smallest median family size with 2.47 persons per family.
| Family Type | # Families | Family Size |
| Married-Couple | 23,369 (67.0%) | 2.95 |
| Single Male/Father | 4,836 (13.9%) | 2.47 |
| Single Female/Mother | 6,692 (19.2%) | 3.03 |
| Total Families | 34,897 (100.0%) | 2.90 |
Median Household Size in Tempe
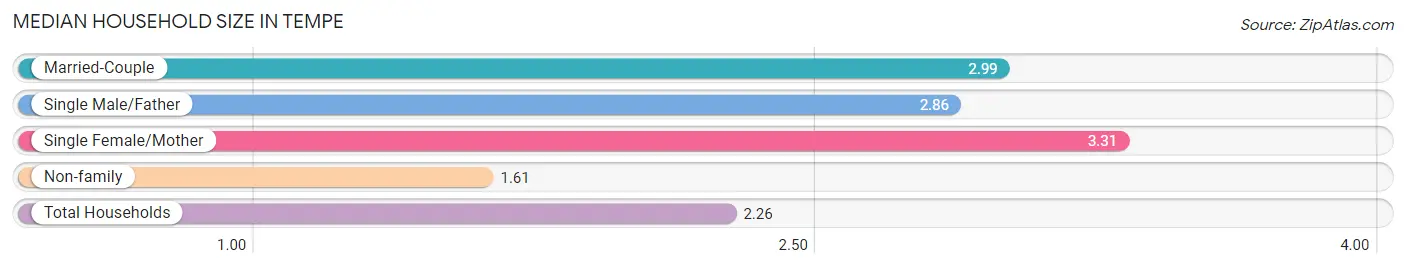
The median household size in Tempe is 2.26 persons per household, with single female/mother households (6,692 | 8.8%) accounting for the largest median household size of 3.31 persons per household. non-family households (40,804 | 53.9%) represent the smallest median household size with 1.61 persons per household.
| Household Type | # Households | Household Size |
| Married-Couple | 23,369 (30.9%) | 2.99 |
| Single Male/Father | 4,836 (6.4%) | 2.86 |
| Single Female/Mother | 6,692 (8.8%) | 3.31 |
| Non-family | 40,804 (53.9%) | 1.61 |
| Total Households | 75,701 (100.0%) | 2.26 |
Household Size by Marriage Status in Tempe
Out of a total of 75,701 households in Tempe, 34,897 (46.1%) are family households, while 40,804 (53.9%) are nonfamily households. The most numerous type of family households are 2-person households, comprising 17,169, and the most common type of nonfamily households are 1-person households, comprising 24,206.
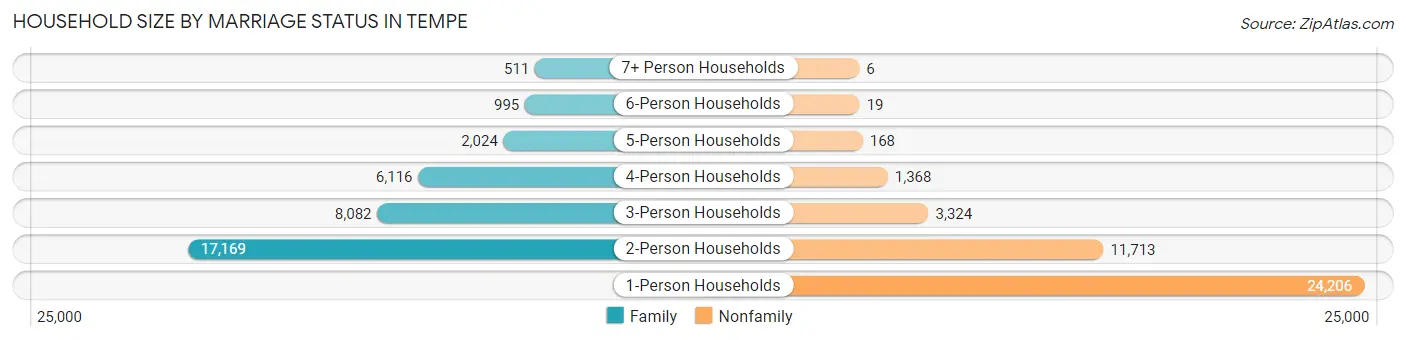
| Household Size | Family Households | Nonfamily Households |
| 1-Person Households | - | 24,206 (32.0%) |
| 2-Person Households | 17,169 (22.7%) | 11,713 (15.5%) |
| 3-Person Households | 8,082 (10.7%) | 3,324 (4.4%) |
| 4-Person Households | 6,116 (8.1%) | 1,368 (1.8%) |
| 5-Person Households | 2,024 (2.7%) | 168 (0.2%) |
| 6-Person Households | 995 (1.3%) | 19 (0.0%) |
| 7+ Person Households | 511 (0.7%) | 6 (0.0%) |
| Total | 34,897 (46.1%) | 40,804 (53.9%) |
Female Fertility in Tempe
Fertility by Age in Tempe
Average fertility rate in Tempe is 34.0 births per 1,000 women. Women in the age bracket of 20 to 34 years have the highest fertility rate with 39.0 births per 1,000 women. Women in the age bracket of 20 to 34 years acount for 69.7% of all women with births.
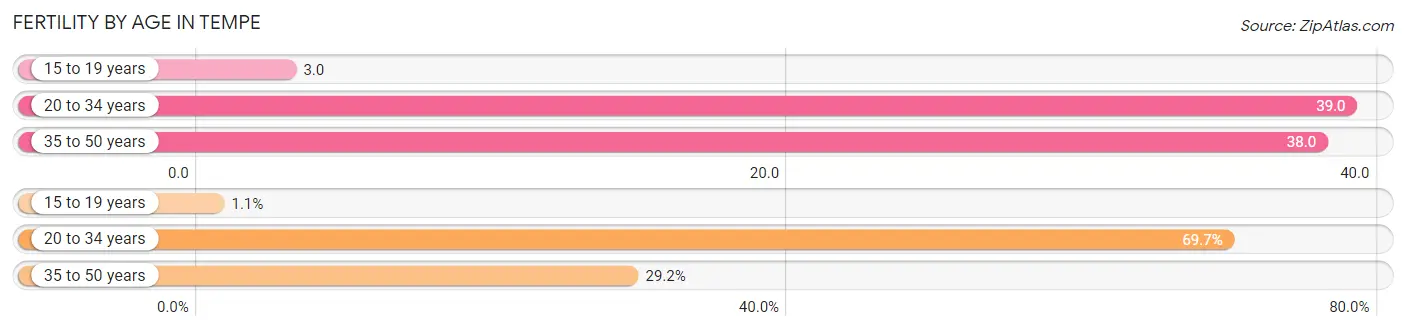
| Age Bracket | Women with Births | Births / 1,000 Women |
| 15 to 19 years | 20 (1.1%) | 3.0 |
| 20 to 34 years | 1,242 (69.7%) | 39.0 |
| 35 to 50 years | 521 (29.2%) | 38.0 |
| Total | 1,783 (100.0%) | 34.0 |
Fertility by Age by Marriage Status in Tempe
78.4% of women with births (1,783) in Tempe are married. The highest percentage of unmarried women with births falls into 15 to 19 years age bracket with 100.0% of them unmarried at the time of birth, while the lowest percentage of unmarried women with births belong to 35 to 50 years age bracket with 18.0% of them unmarried.
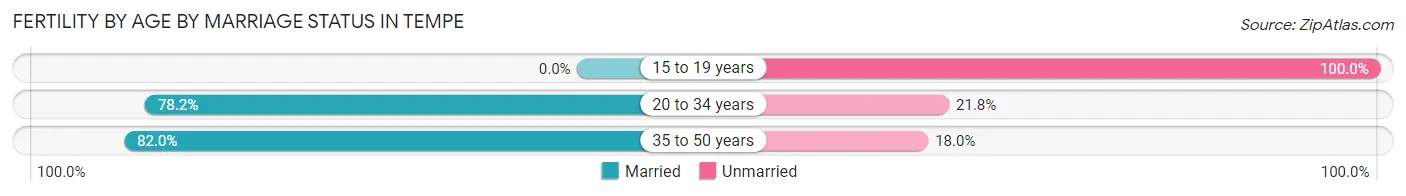
| Age Bracket | Married | Unmarried |
| 15 to 19 years | 0 (0.0%) | 20 (100.0%) |
| 20 to 34 years | 971 (78.2%) | 271 (21.8%) |
| 35 to 50 years | 427 (82.0%) | 94 (18.0%) |
| Total | 1,398 (78.4%) | 385 (21.6%) |
Fertility by Education in Tempe
Average fertility rate in Tempe is 34.0 births per 1,000 women. Women with the education attainment of less than high school have the highest fertility rate of 61.0 births per 1,000 women, while women with the education attainment of college or associate's degree have the lowest fertility at 26.0 births per 1,000 women. Women with the education attainment of college or associate's degree represent 29.2% of all women with births.
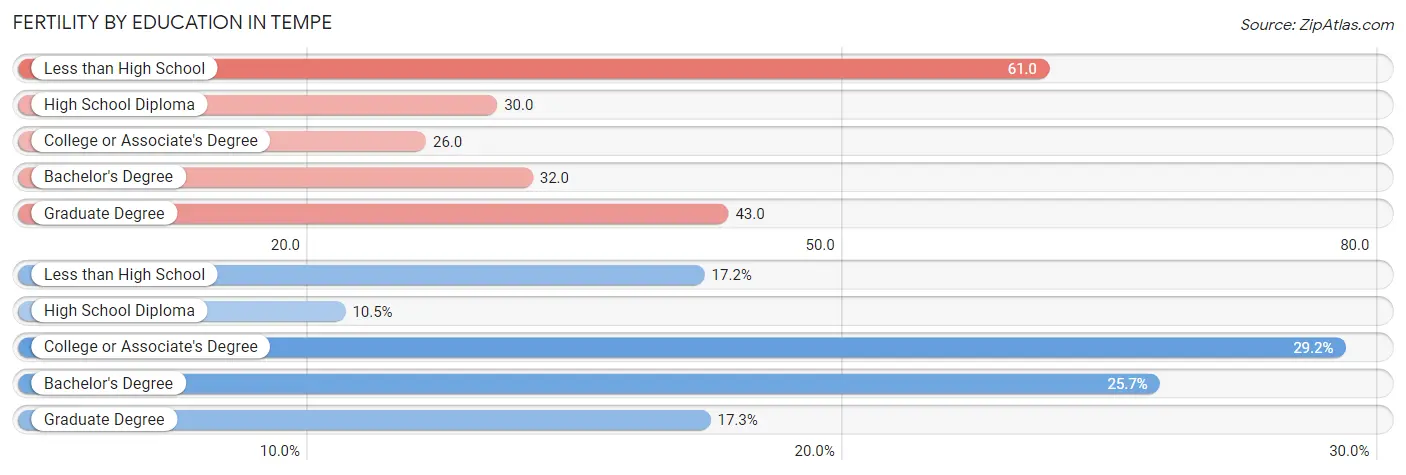
| Educational Attainment | Women with Births | Births / 1,000 Women |
| Less than High School | 307 (17.2%) | 61.0 |
| High School Diploma | 187 (10.5%) | 30.0 |
| College or Associate's Degree | 521 (29.2%) | 26.0 |
| Bachelor's Degree | 459 (25.7%) | 32.0 |
| Graduate Degree | 309 (17.3%) | 43.0 |
| Total | 1,783 (100.0%) | 34.0 |
Fertility by Education by Marriage Status in Tempe
21.6% of women with births in Tempe are unmarried. Women with the educational attainment of graduate degree are most likely to be married with 100.0% of them married at childbirth, while women with the educational attainment of college or associate's degree are least likely to be married with 38.0% of them unmarried at childbirth.
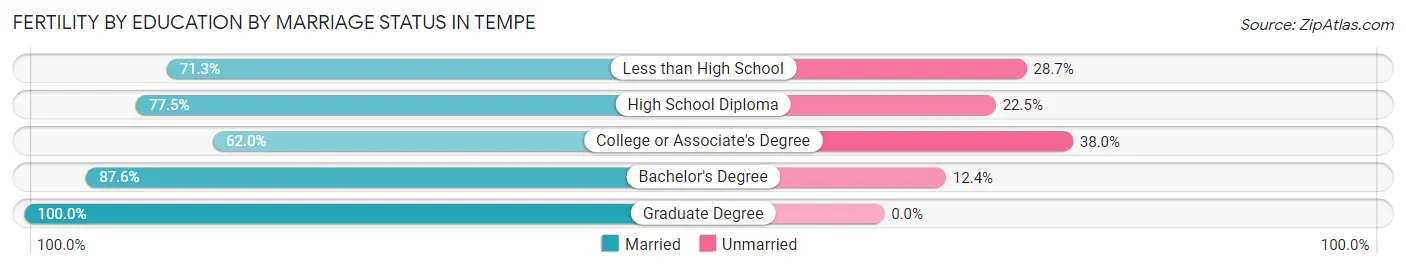
| Educational Attainment | Married | Unmarried |
| Less than High School | 219 (71.3%) | 88 (28.7%) |
| High School Diploma | 145 (77.5%) | 42 (22.5%) |
| College or Associate's Degree | 323 (62.0%) | 198 (38.0%) |
| Bachelor's Degree | 402 (87.6%) | 57 (12.4%) |
| Graduate Degree | 309 (100.0%) | 0 (0.0%) |
| Total | 1,398 (78.4%) | 385 (21.6%) |
Employment Characteristics in Tempe
Employment by Class of Employer in Tempe
Among the 103,168 employed individuals in Tempe, private company employees (73,019 | 70.8%), state government employees (7,684 | 7.4%), and not-for-profit organizations (7,128 | 6.9%) make up the most common classes of employment.
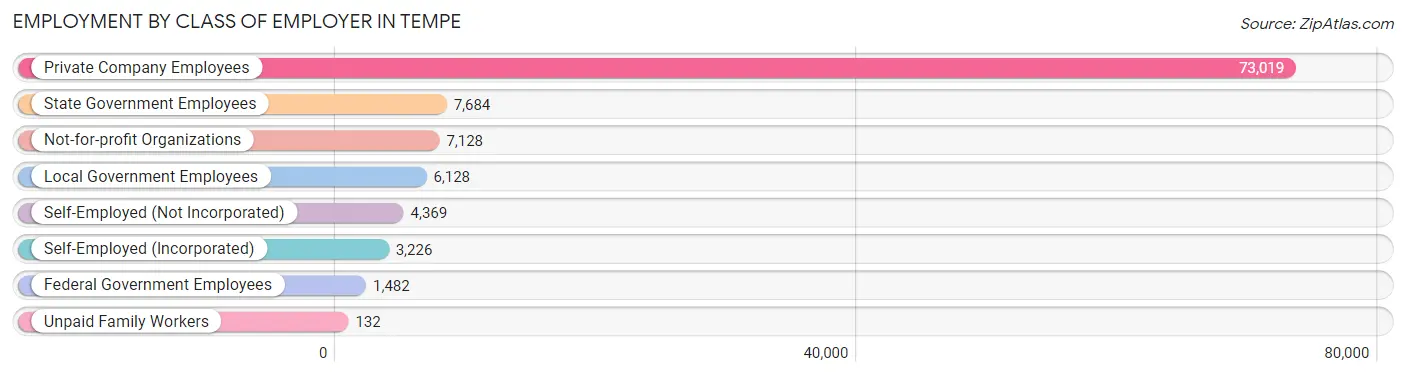
| Employer Class | # Employees | % Employees |
| Private Company Employees | 73,019 | 70.8% |
| Self-Employed (Incorporated) | 3,226 | 3.1% |
| Self-Employed (Not Incorporated) | 4,369 | 4.2% |
| Not-for-profit Organizations | 7,128 | 6.9% |
| Local Government Employees | 6,128 | 5.9% |
| State Government Employees | 7,684 | 7.4% |
| Federal Government Employees | 1,482 | 1.4% |
| Unpaid Family Workers | 132 | 0.1% |
| Total | 103,168 | 100.0% |
Employment Status by Age in Tempe
According to the labor force statistics for Tempe, out of the total population over 16 years of age (157,990), 70.8% or 111,857 individuals are in the labor force, with 5.7% or 6,376 of them unemployed. The age group with the highest labor force participation rate is 25 to 29 years, with 87.9% or 22,455 individuals in the labor force. Within the labor force, the 16 to 19 years age range has the highest percentage of unemployed individuals, with 9.3% or 445 of them being unemployed.
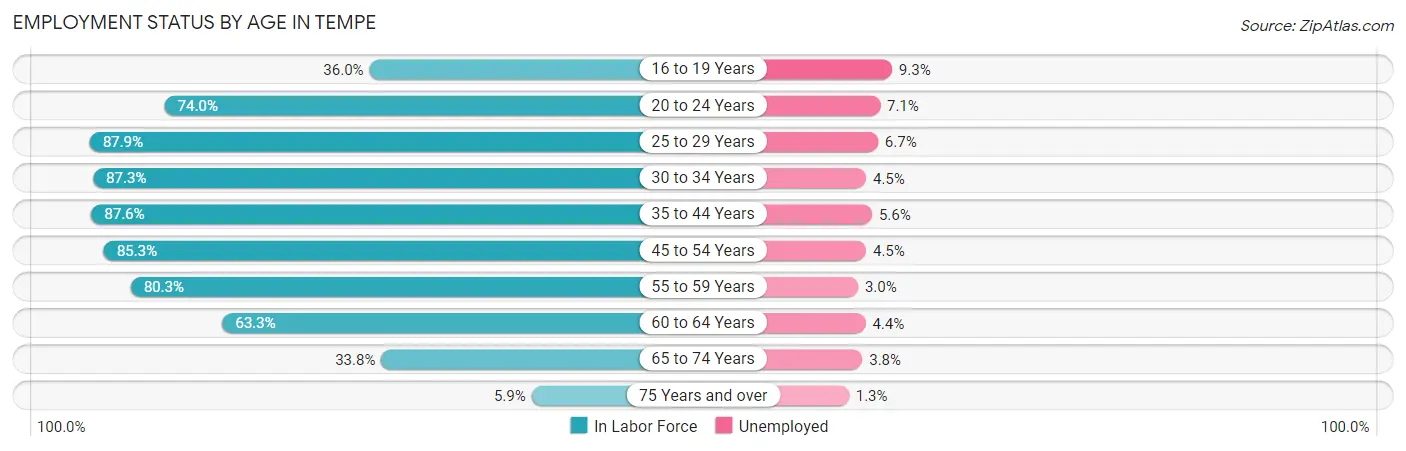
| Age Bracket | In Labor Force | Unemployed |
| 16 to 19 Years | 4,785 (36.0%) | 445 (9.3%) |
| 20 to 24 Years | 22,210 (74.0%) | 1,577 (7.1%) |
| 25 to 29 Years | 22,455 (87.9%) | 1,504 (6.7%) |
| 30 to 34 Years | 14,365 (87.3%) | 646 (4.5%) |
| 35 to 44 Years | 18,617 (87.6%) | 1,043 (5.6%) |
| 45 to 54 Years | 12,989 (85.3%) | 585 (4.5%) |
| 55 to 59 Years | 6,792 (80.3%) | 204 (3.0%) |
| 60 to 64 Years | 5,412 (63.3%) | 238 (4.4%) |
| 65 to 74 Years | 3,755 (33.8%) | 143 (3.8%) |
| 75 Years and over | 477 (5.9%) | 6 (1.3%) |
| Total | 111,857 (70.8%) | 6,376 (5.7%) |
Employment Status by Educational Attainment in Tempe
According to labor force statistics for Tempe, 84.4% of individuals (80,592) out of the total population between 25 and 64 years of age (95,488) are in the labor force, with 5.2% or 4,191 of them being unemployed. The group with the highest labor force participation rate are those with the educational attainment of bachelor's degree or higher, with 87.7% or 41,066 individuals in the labor force. Within the labor force, individuals with college / associate degree education have the highest percentage of unemployment, with 7.2% or 1,777 of them being unemployed.
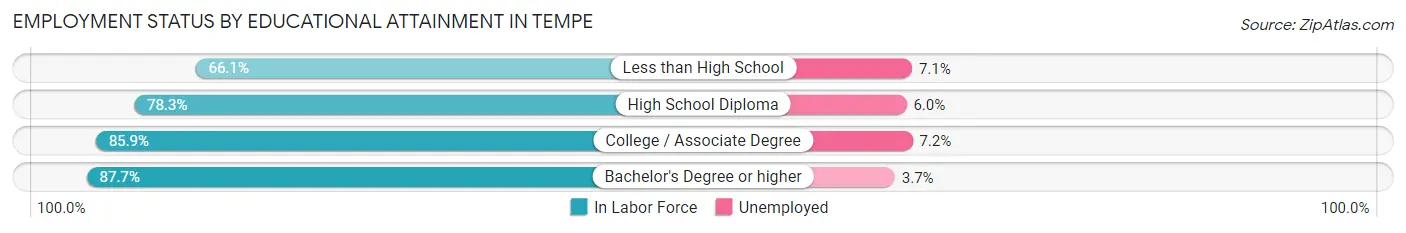
| Educational Attainment | In Labor Force | Unemployed |
| Less than High School | 3,873 (66.1%) | 416 (7.1%) |
| High School Diploma | 11,018 (78.3%) | 844 (6.0%) |
| College / Associate Degree | 24,680 (85.9%) | 2,069 (7.2%) |
| Bachelor's Degree or higher | 41,066 (87.7%) | 1,733 (3.7%) |
| Total | 80,592 (84.4%) | 4,965 (5.2%) |
Employment Occupations by Sex in Tempe
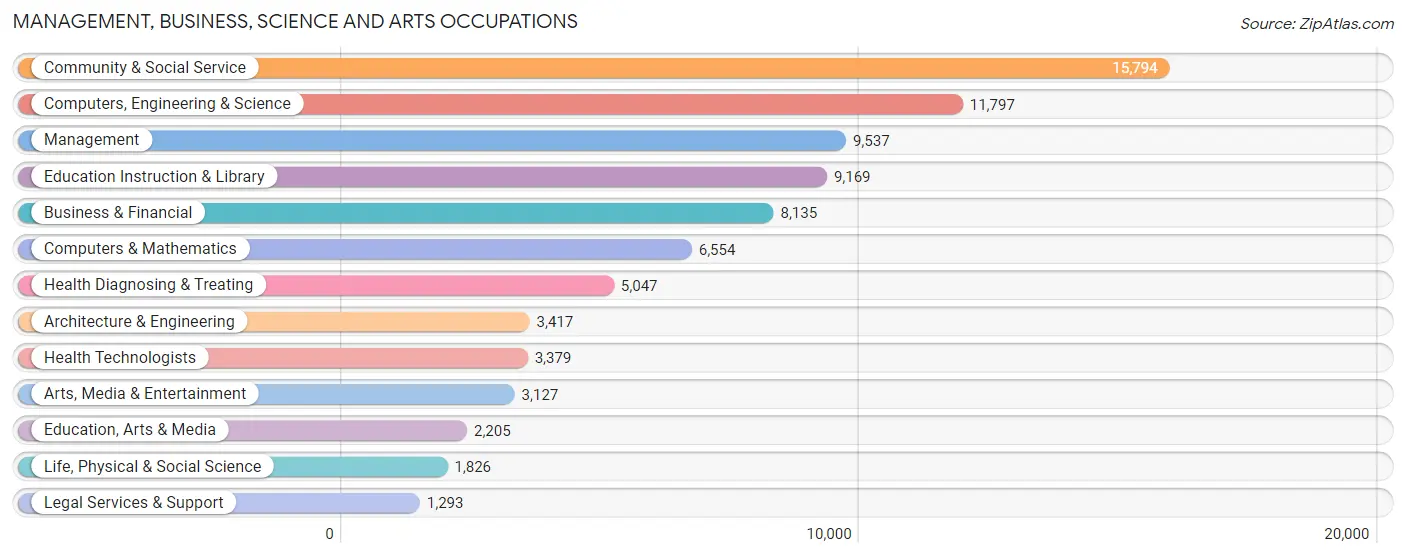
Management, Business, Science and Arts Occupations
The most common Management, Business, Science and Arts occupations in Tempe are Community & Social Service (15,794 | 15.0%), Computers, Engineering & Science (11,797 | 11.2%), Management (9,537 | 9.0%), Education Instruction & Library (9,169 | 8.7%), and Business & Financial (8,135 | 7.7%).
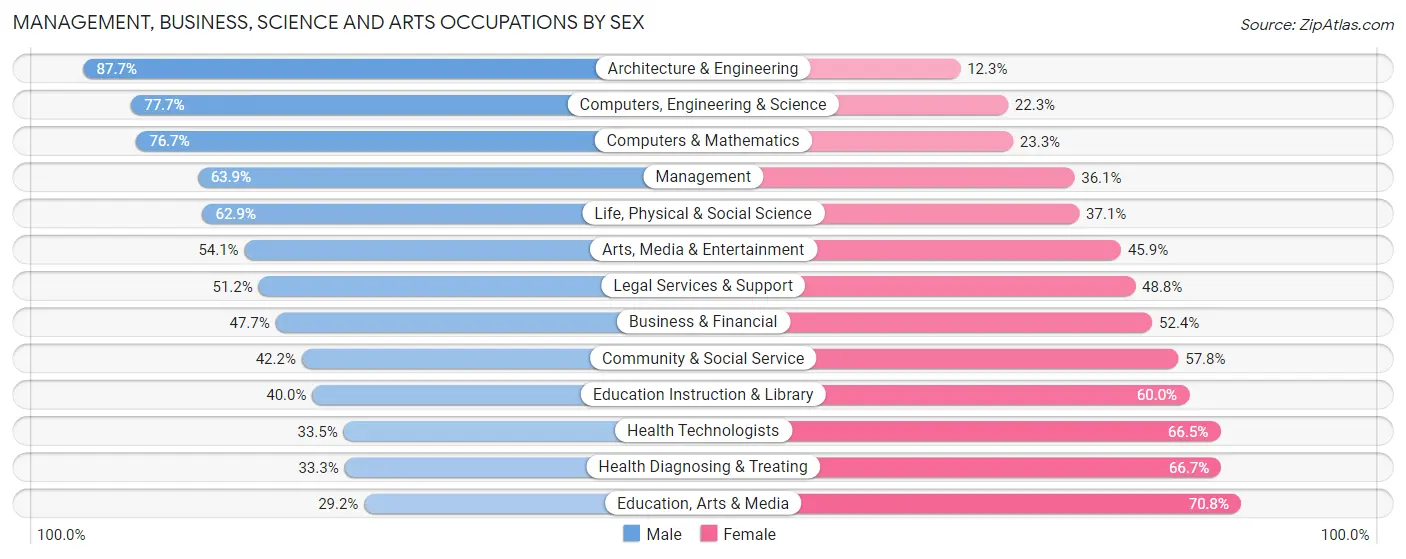
Management, Business, Science and Arts Occupations by Sex
Within the Management, Business, Science and Arts occupations in Tempe, the most male-oriented occupations are Architecture & Engineering (87.7%), Computers, Engineering & Science (77.7%), and Computers & Mathematics (76.7%), while the most female-oriented occupations are Education, Arts & Media (70.8%), Health Diagnosing & Treating (66.7%), and Health Technologists (66.5%).
| Occupation | Male | Female |
| Management | 6,092 (63.9%) | 3,445 (36.1%) |
| Business & Financial | 3,876 (47.6%) | 4,259 (52.3%) |
| Computers, Engineering & Science | 9,170 (77.7%) | 2,627 (22.3%) |
| Computers & Mathematics | 5,026 (76.7%) | 1,528 (23.3%) |
| Architecture & Engineering | 2,996 (87.7%) | 421 (12.3%) |
| Life, Physical & Social Science | 1,148 (62.9%) | 678 (37.1%) |
| Community & Social Service | 6,664 (42.2%) | 9,130 (57.8%) |
| Education, Arts & Media | 643 (29.2%) | 1,562 (70.8%) |
| Legal Services & Support | 662 (51.2%) | 631 (48.8%) |
| Education Instruction & Library | 3,666 (40.0%) | 5,503 (60.0%) |
| Arts, Media & Entertainment | 1,693 (54.1%) | 1,434 (45.9%) |
| Health Diagnosing & Treating | 1,679 (33.3%) | 3,368 (66.7%) |
| Health Technologists | 1,131 (33.5%) | 2,248 (66.5%) |
| Total (Category) | 27,481 (54.6%) | 22,829 (45.4%) |
| Total (Overall) | 59,641 (56.6%) | 45,820 (43.4%) |
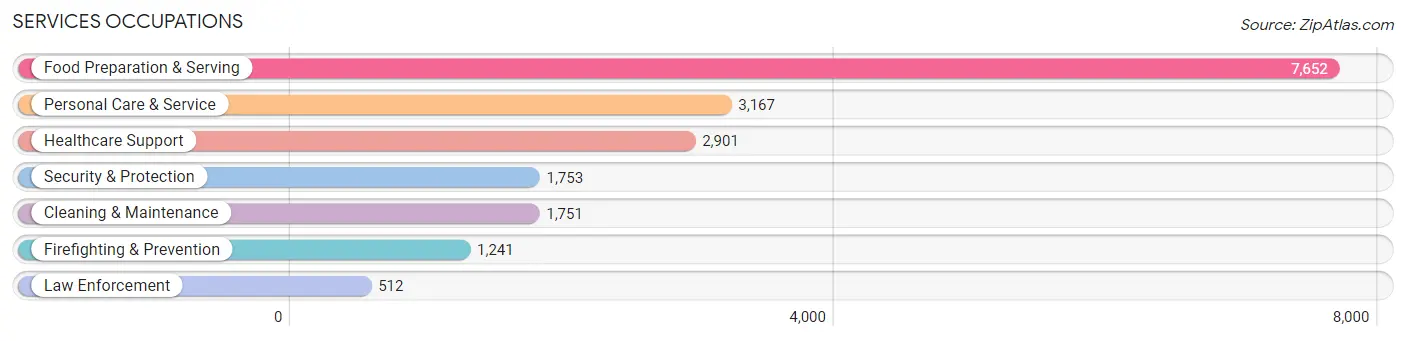
Services Occupations
The most common Services occupations in Tempe are Food Preparation & Serving (7,652 | 7.3%), Personal Care & Service (3,167 | 3.0%), Healthcare Support (2,901 | 2.8%), Security & Protection (1,753 | 1.7%), and Cleaning & Maintenance (1,751 | 1.7%).
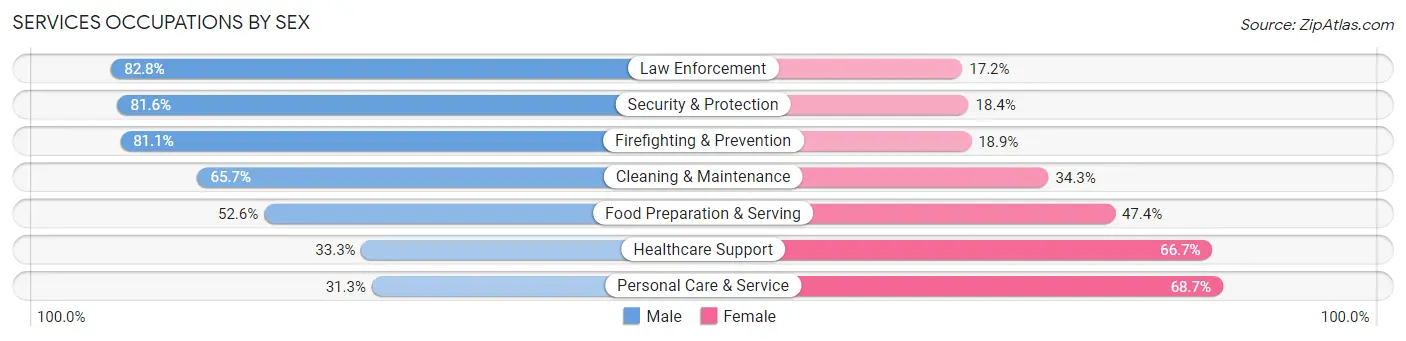
Services Occupations by Sex
Within the Services occupations in Tempe, the most male-oriented occupations are Law Enforcement (82.8%), Security & Protection (81.6%), and Firefighting & Prevention (81.1%), while the most female-oriented occupations are Personal Care & Service (68.7%), Healthcare Support (66.7%), and Food Preparation & Serving (47.4%).
| Occupation | Male | Female |
| Healthcare Support | 966 (33.3%) | 1,935 (66.7%) |
| Security & Protection | 1,430 (81.6%) | 323 (18.4%) |
| Firefighting & Prevention | 1,006 (81.1%) | 235 (18.9%) |
| Law Enforcement | 424 (82.8%) | 88 (17.2%) |
| Food Preparation & Serving | 4,024 (52.6%) | 3,628 (47.4%) |
| Cleaning & Maintenance | 1,151 (65.7%) | 600 (34.3%) |
| Personal Care & Service | 990 (31.3%) | 2,177 (68.7%) |
| Total (Category) | 8,561 (49.7%) | 8,663 (50.3%) |
| Total (Overall) | 59,641 (56.6%) | 45,820 (43.4%) |
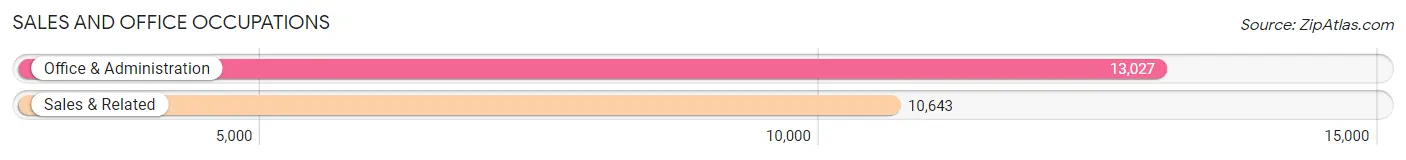
Sales and Office Occupations
The most common Sales and Office occupations in Tempe are Office & Administration (13,027 | 12.3%), and Sales & Related (10,643 | 10.1%).
Sales and Office Occupations by Sex
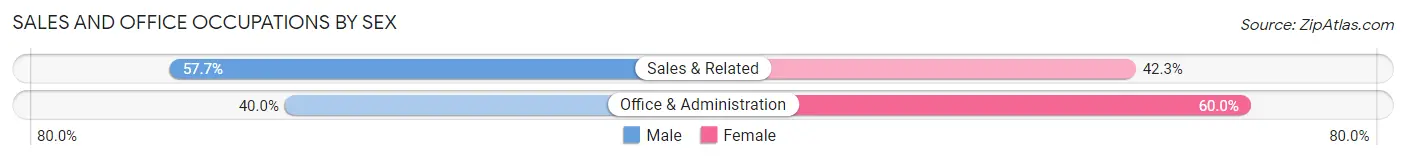
| Occupation | Male | Female |
| Sales & Related | 6,138 (57.7%) | 4,505 (42.3%) |
| Office & Administration | 5,208 (40.0%) | 7,819 (60.0%) |
| Total (Category) | 11,346 (47.9%) | 12,324 (52.1%) |
| Total (Overall) | 59,641 (56.6%) | 45,820 (43.4%) |
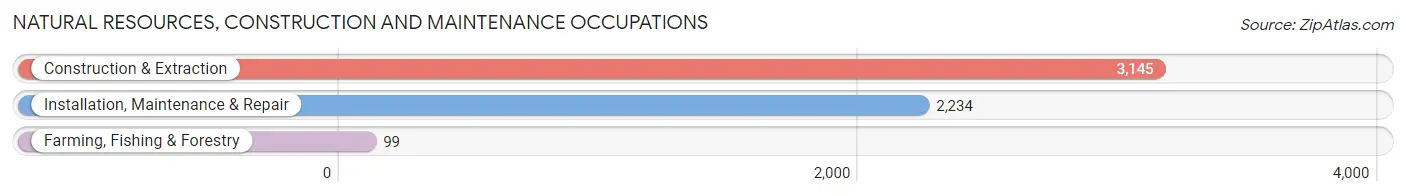
Natural Resources, Construction and Maintenance Occupations
The most common Natural Resources, Construction and Maintenance occupations in Tempe are Construction & Extraction (3,145 | 3.0%), Installation, Maintenance & Repair (2,234 | 2.1%), and Farming, Fishing & Forestry (99 | 0.1%).
Natural Resources, Construction and Maintenance Occupations by Sex
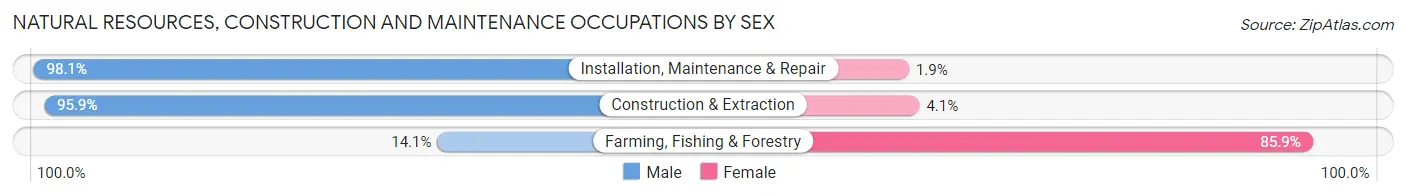
| Occupation | Male | Female |
| Farming, Fishing & Forestry | 14 (14.1%) | 85 (85.9%) |
| Construction & Extraction | 3,017 (95.9%) | 128 (4.1%) |
| Installation, Maintenance & Repair | 2,192 (98.1%) | 42 (1.9%) |
| Total (Category) | 5,223 (95.4%) | 255 (4.6%) |
| Total (Overall) | 59,641 (56.6%) | 45,820 (43.4%) |
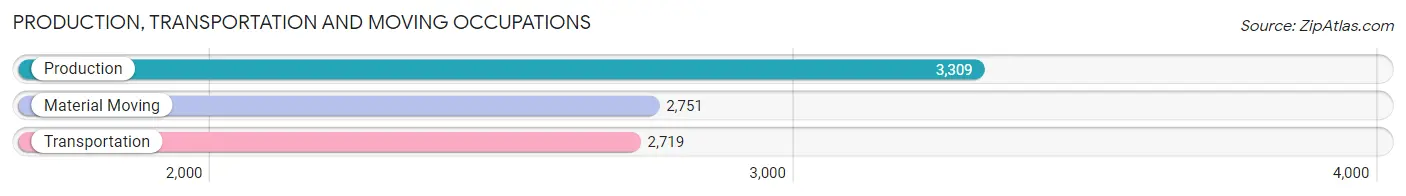
Production, Transportation and Moving Occupations
The most common Production, Transportation and Moving occupations in Tempe are Production (3,309 | 3.1%), Material Moving (2,751 | 2.6%), and Transportation (2,719 | 2.6%).
Production, Transportation and Moving Occupations by Sex
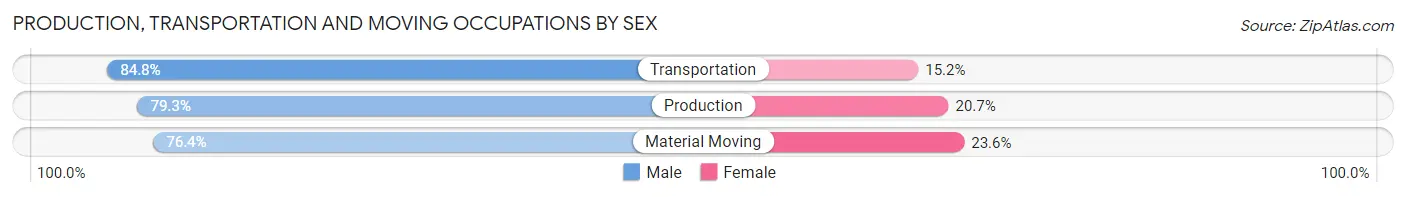
| Occupation | Male | Female |
| Production | 2,623 (79.3%) | 686 (20.7%) |
| Transportation | 2,306 (84.8%) | 413 (15.2%) |
| Material Moving | 2,101 (76.4%) | 650 (23.6%) |
| Total (Category) | 7,030 (80.1%) | 1,749 (19.9%) |
| Total (Overall) | 59,641 (56.6%) | 45,820 (43.4%) |
Employment Industries by Sex in Tempe
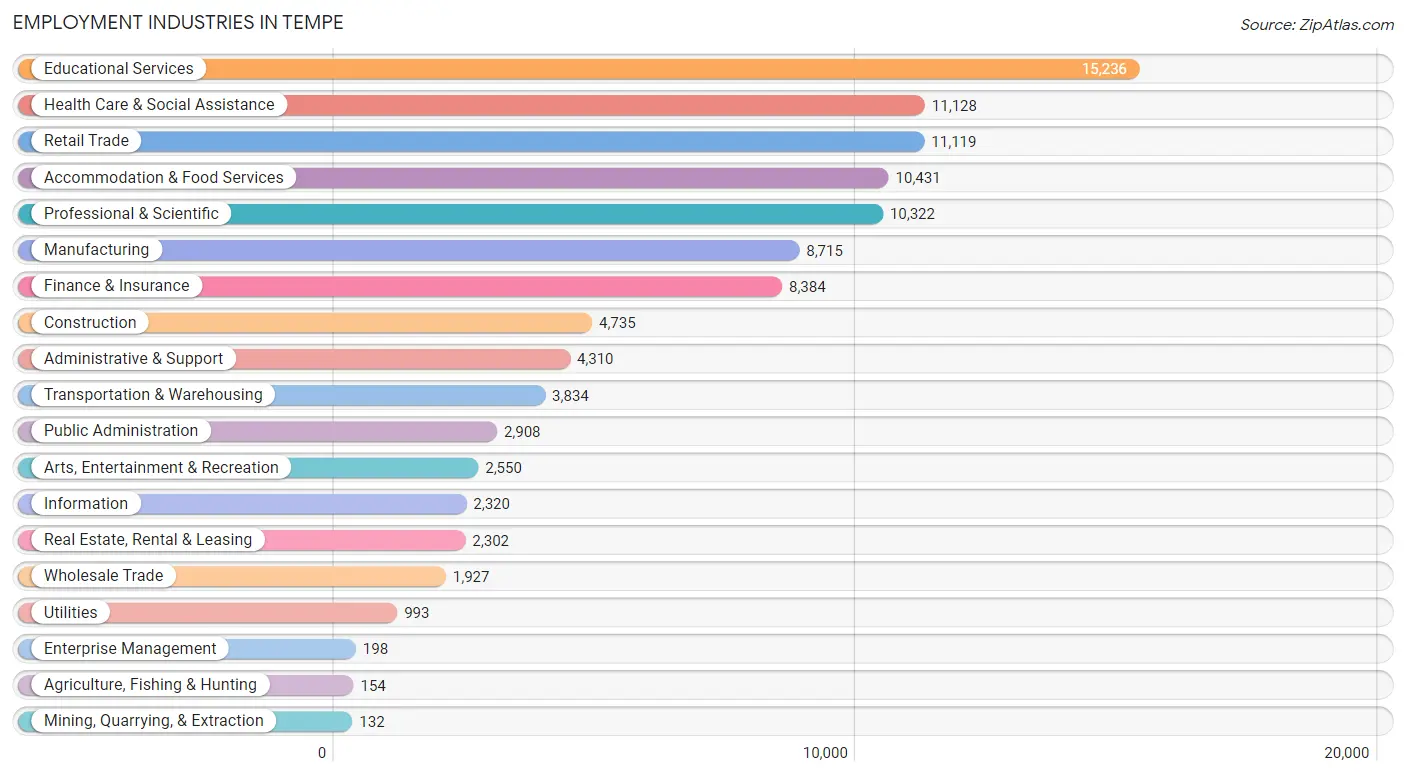
Employment Industries in Tempe
The major employment industries in Tempe include Educational Services (15,236 | 14.4%), Health Care & Social Assistance (11,128 | 10.5%), Retail Trade (11,119 | 10.5%), Accommodation & Food Services (10,431 | 9.9%), and Professional & Scientific (10,322 | 9.8%).
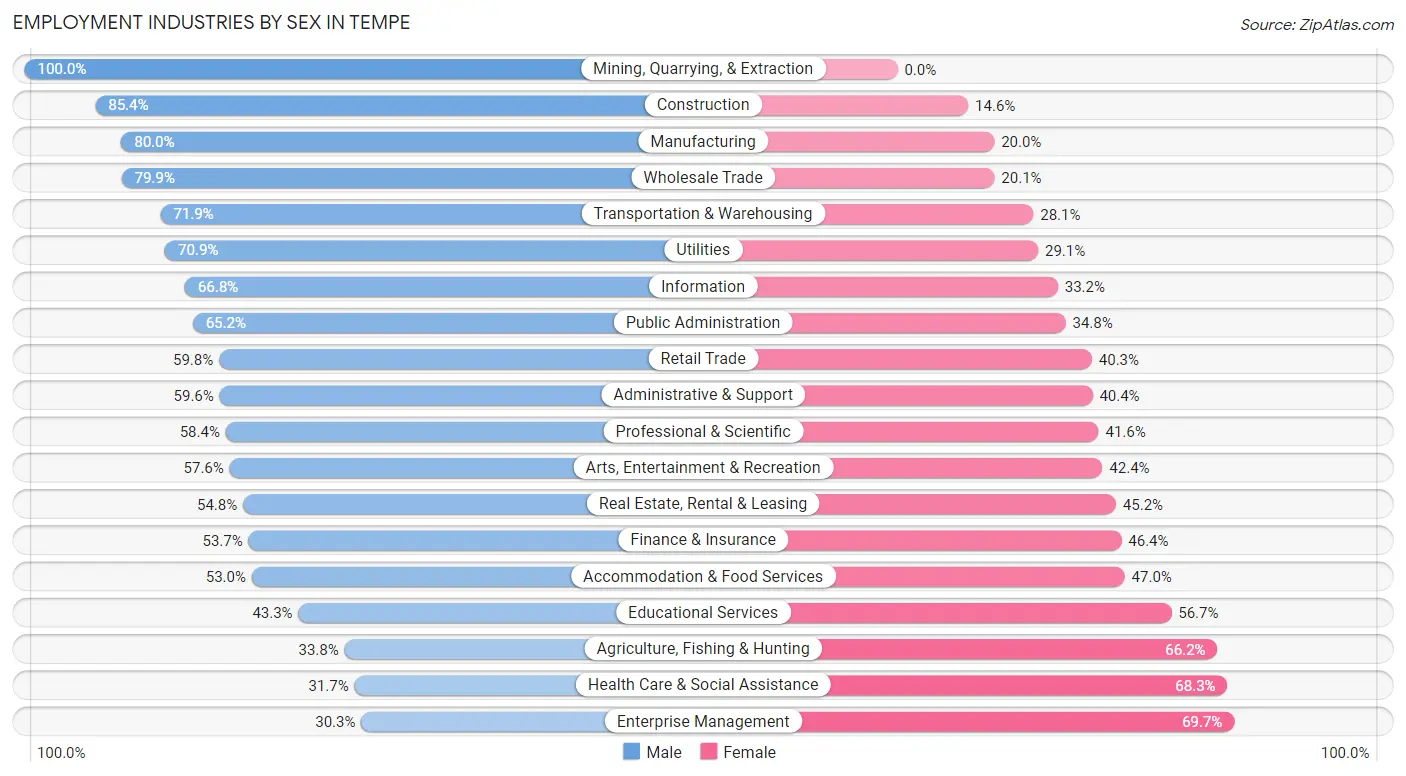
Employment Industries by Sex in Tempe
The Tempe industries that see more men than women are Mining, Quarrying, & Extraction (100.0%), Construction (85.4%), and Manufacturing (80.0%), whereas the industries that tend to have a higher number of women are Enterprise Management (69.7%), Health Care & Social Assistance (68.3%), and Agriculture, Fishing & Hunting (66.2%).
| Industry | Male | Female |
| Agriculture, Fishing & Hunting | 52 (33.8%) | 102 (66.2%) |
| Mining, Quarrying, & Extraction | 132 (100.0%) | 0 (0.0%) |
| Construction | 4,042 (85.4%) | 693 (14.6%) |
| Manufacturing | 6,969 (80.0%) | 1,746 (20.0%) |
| Wholesale Trade | 1,540 (79.9%) | 387 (20.1%) |
| Retail Trade | 6,644 (59.8%) | 4,475 (40.3%) |
| Transportation & Warehousing | 2,756 (71.9%) | 1,078 (28.1%) |
| Utilities | 704 (70.9%) | 289 (29.1%) |
| Information | 1,550 (66.8%) | 770 (33.2%) |
| Finance & Insurance | 4,498 (53.6%) | 3,886 (46.4%) |
| Real Estate, Rental & Leasing | 1,261 (54.8%) | 1,041 (45.2%) |
| Professional & Scientific | 6,025 (58.4%) | 4,297 (41.6%) |
| Enterprise Management | 60 (30.3%) | 138 (69.7%) |
| Administrative & Support | 2,570 (59.6%) | 1,740 (40.4%) |
| Educational Services | 6,600 (43.3%) | 8,636 (56.7%) |
| Health Care & Social Assistance | 3,529 (31.7%) | 7,599 (68.3%) |
| Arts, Entertainment & Recreation | 1,468 (57.6%) | 1,082 (42.4%) |
| Accommodation & Food Services | 5,525 (53.0%) | 4,906 (47.0%) |
| Public Administration | 1,896 (65.2%) | 1,012 (34.8%) |
| Total | 59,641 (56.6%) | 45,820 (43.4%) |
Education in Tempe
School Enrollment in Tempe
The most common levels of schooling among the 56,609 students in Tempe are college / undergraduate (28,482 | 50.3%), graduate / professional (8,863 | 15.7%), and high school (6,169 | 10.9%).
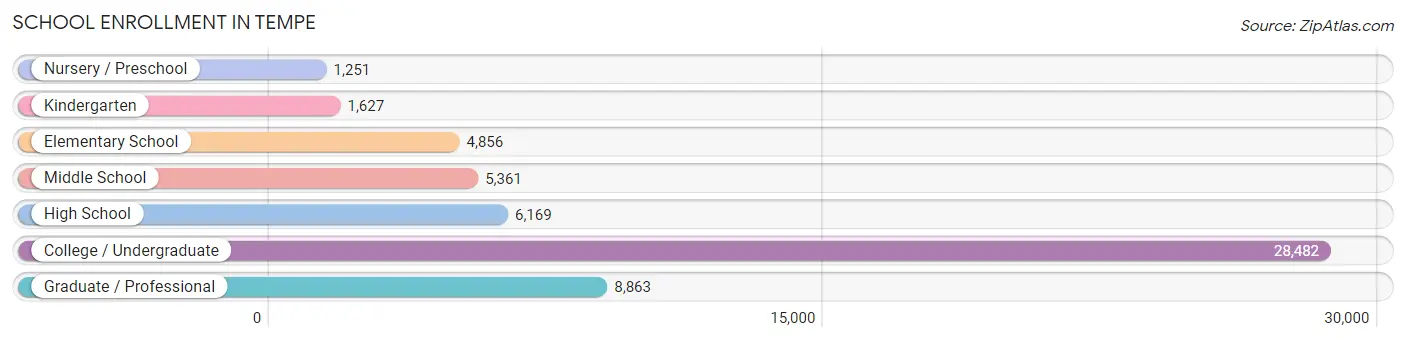
| School Level | # Students | % Students |
| Nursery / Preschool | 1,251 | 2.2% |
| Kindergarten | 1,627 | 2.9% |
| Elementary School | 4,856 | 8.6% |
| Middle School | 5,361 | 9.5% |
| High School | 6,169 | 10.9% |
| College / Undergraduate | 28,482 | 50.3% |
| Graduate / Professional | 8,863 | 15.7% |
| Total | 56,609 | 100.0% |
School Enrollment by Age by Funding Source in Tempe
Out of a total of 56,609 students who are enrolled in schools in Tempe, 5,321 (9.4%) attend a private institution, while the remaining 51,288 (90.6%) are enrolled in public schools. The age group of 3 to 4 year olds has the highest likelihood of being enrolled in private schools, with 392 (34.6% in the age bracket) enrolled. Conversely, the age group of 18 to 19 year olds has the lowest likelihood of being enrolled in a private school, with 9,186 (96.3% in the age bracket) attending a public institution.
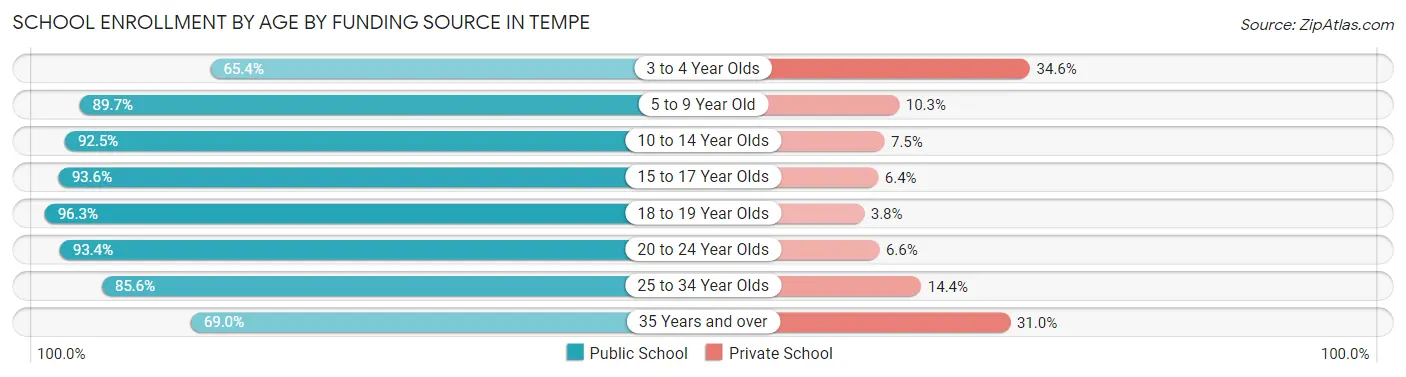
| Age Bracket | Public School | Private School |
| 3 to 4 Year Olds | 740 (65.4%) | 392 (34.6%) |
| 5 to 9 Year Old | 5,465 (89.7%) | 625 (10.3%) |
| 10 to 14 Year Olds | 5,989 (92.5%) | 487 (7.5%) |
| 15 to 17 Year Olds | 4,127 (93.6%) | 281 (6.4%) |
| 18 to 19 Year Olds | 9,186 (96.3%) | 358 (3.7%) |
| 20 to 24 Year Olds | 16,832 (93.4%) | 1,183 (6.6%) |
| 25 to 34 Year Olds | 7,137 (85.6%) | 1,199 (14.4%) |
| 35 Years and over | 1,800 (69.0%) | 808 (31.0%) |
| Total | 51,288 (90.6%) | 5,321 (9.4%) |
Educational Attainment by Field of Study in Tempe
Business (9,932 | 16.5%), engineering (7,219 | 12.0%), education (5,604 | 9.3%), social sciences (5,342 | 8.8%), and science & technology (5,175 | 8.6%) are the most common fields of study among 60,347 individuals in Tempe who have obtained a bachelor's degree or higher.
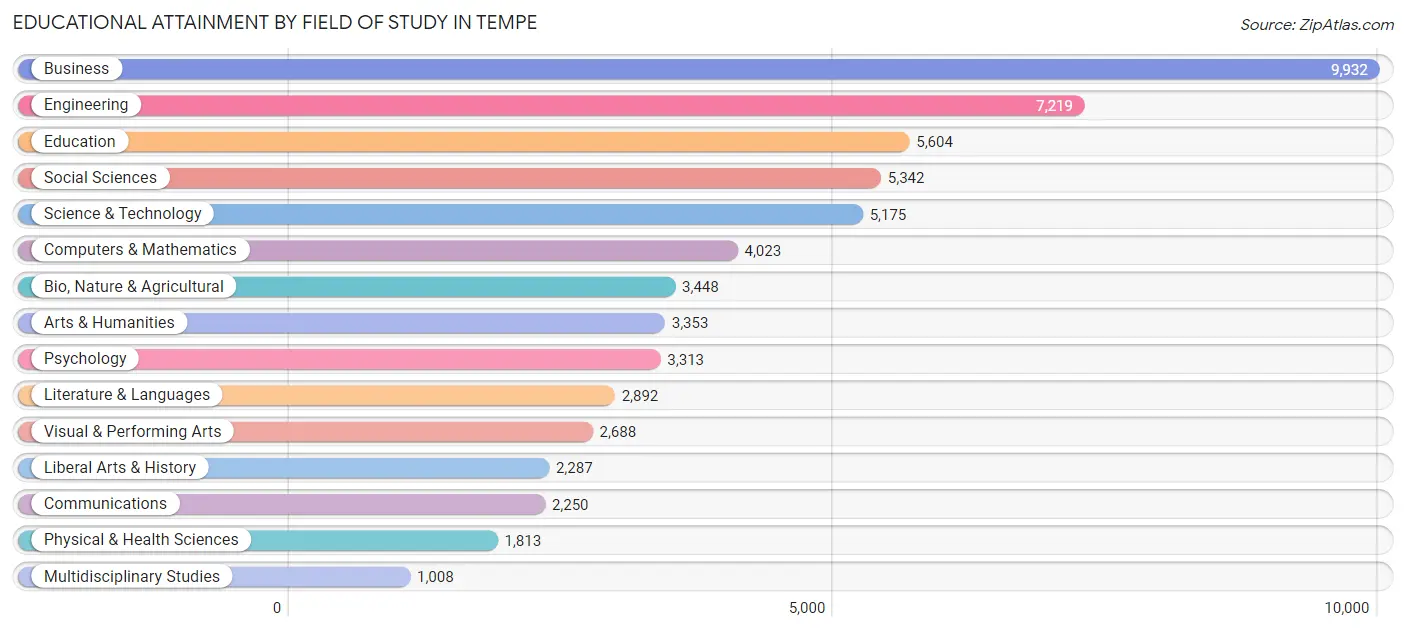
| Field of Study | # Graduates | % Graduates |
| Computers & Mathematics | 4,023 | 6.7% |
| Bio, Nature & Agricultural | 3,448 | 5.7% |
| Physical & Health Sciences | 1,813 | 3.0% |
| Psychology | 3,313 | 5.5% |
| Social Sciences | 5,342 | 8.8% |
| Engineering | 7,219 | 12.0% |
| Multidisciplinary Studies | 1,008 | 1.7% |
| Science & Technology | 5,175 | 8.6% |
| Business | 9,932 | 16.5% |
| Education | 5,604 | 9.3% |
| Literature & Languages | 2,892 | 4.8% |
| Liberal Arts & History | 2,287 | 3.8% |
| Visual & Performing Arts | 2,688 | 4.4% |
| Communications | 2,250 | 3.7% |
| Arts & Humanities | 3,353 | 5.6% |
| Total | 60,347 | 100.0% |
Transportation & Commute in Tempe
Vehicle Availability by Sex in Tempe
The most prevalent vehicle ownership categories in Tempe are males with 2 vehicles (22,930, accounting for 40.5%) and females with 2 vehicles (18,421, making up 52.4%).
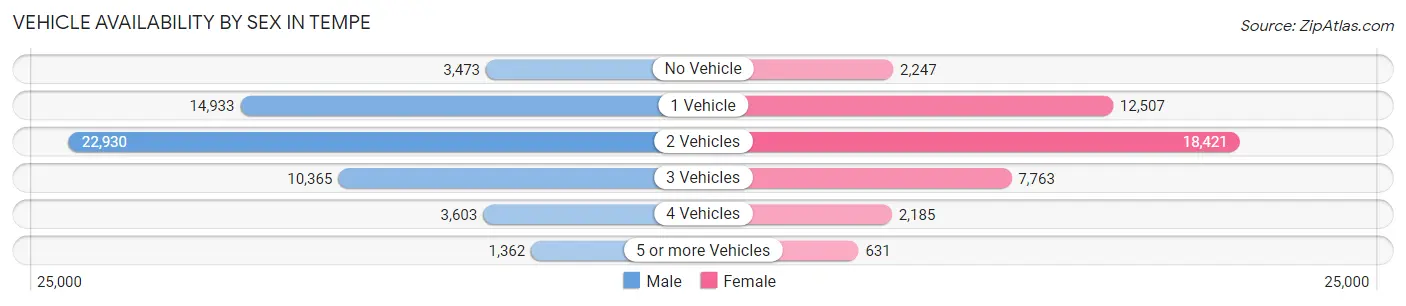
| Vehicles Available | Male | Female |
| No Vehicle | 3,473 (6.1%) | 2,247 (5.1%) |
| 1 Vehicle | 14,933 (26.4%) | 12,507 (28.6%) |
| 2 Vehicles | 22,930 (40.5%) | 18,421 (42.1%) |
| 3 Vehicles | 10,365 (18.3%) | 7,763 (17.7%) |
| 4 Vehicles | 3,603 (6.4%) | 2,185 (5.0%) |
| 5 or more Vehicles | 1,362 (2.4%) | 631 (1.4%) |
| Total | 56,666 (100.0%) | 43,754 (100.0%) |
Commute Time in Tempe
The most frequently occuring commute durations in Tempe are 15 to 19 minutes (18,620 commuters, 21.7%), 20 to 24 minutes (15,551 commuters, 18.1%), and 10 to 14 minutes (13,311 commuters, 15.5%).
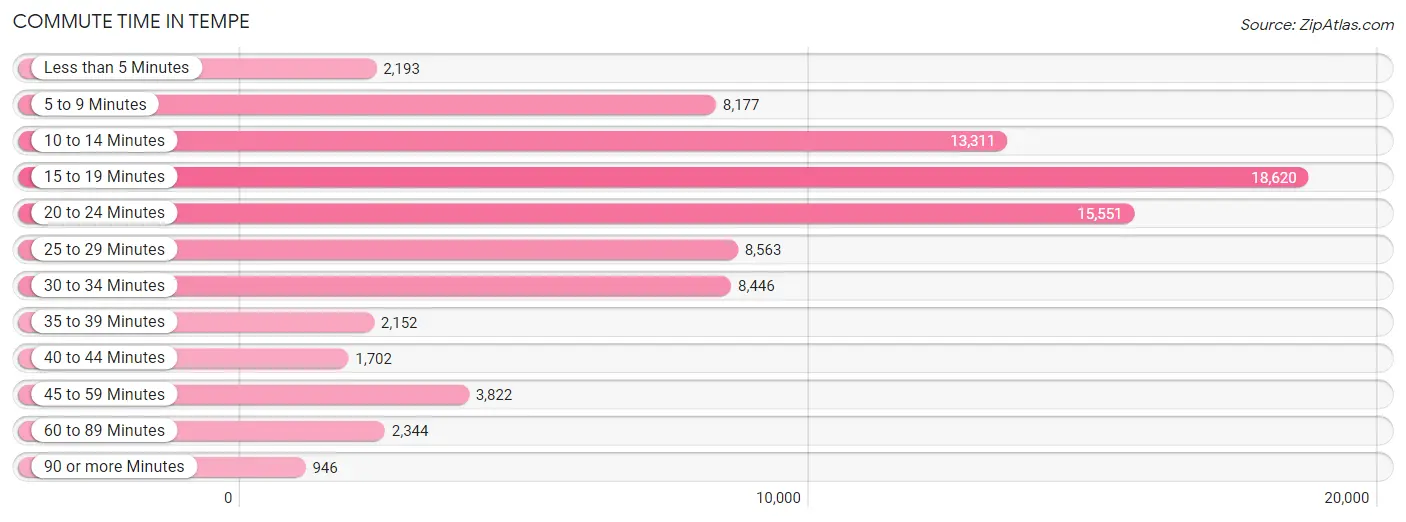
| Commute Time | # Commuters | % Commuters |
| Less than 5 Minutes | 2,193 | 2.6% |
| 5 to 9 Minutes | 8,177 | 9.5% |
| 10 to 14 Minutes | 13,311 | 15.5% |
| 15 to 19 Minutes | 18,620 | 21.7% |
| 20 to 24 Minutes | 15,551 | 18.1% |
| 25 to 29 Minutes | 8,563 | 10.0% |
| 30 to 34 Minutes | 8,446 | 9.8% |
| 35 to 39 Minutes | 2,152 | 2.5% |
| 40 to 44 Minutes | 1,702 | 2.0% |
| 45 to 59 Minutes | 3,822 | 4.4% |
| 60 to 89 Minutes | 2,344 | 2.7% |
| 90 or more Minutes | 946 | 1.1% |
Commute Time by Sex in Tempe
The most common commute times in Tempe are 15 to 19 minutes (11,564 commuters, 23.6%) for males and 20 to 24 minutes (7,282 commuters, 19.8%) for females.
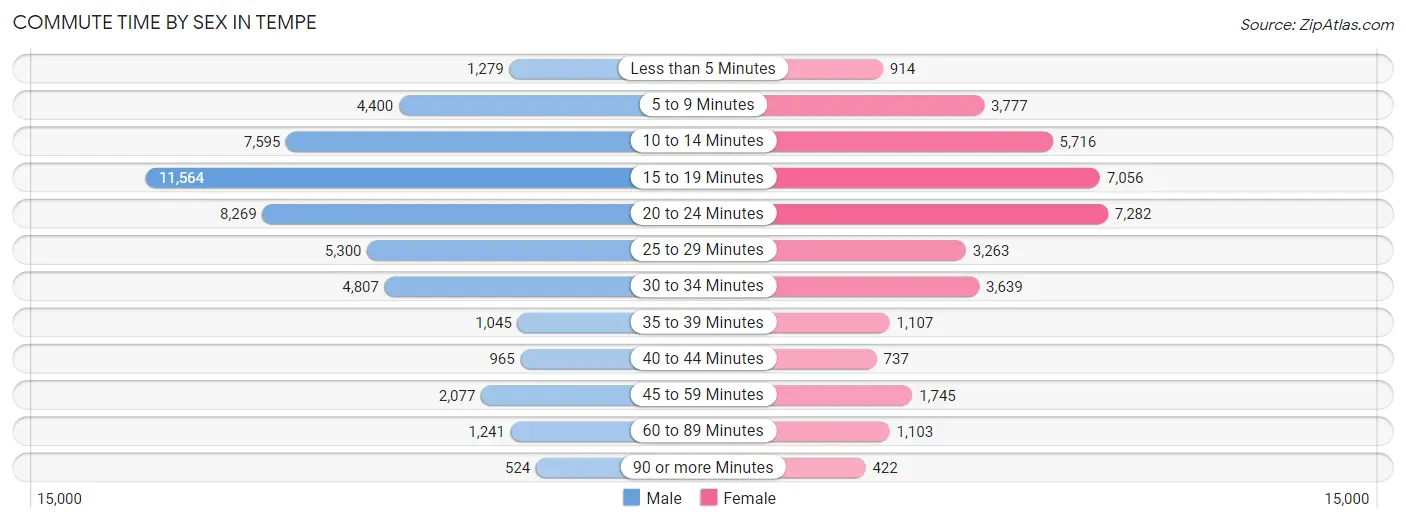
| Commute Time | Male | Female |
| Less than 5 Minutes | 1,279 (2.6%) | 914 (2.5%) |
| 5 to 9 Minutes | 4,400 (9.0%) | 3,777 (10.3%) |
| 10 to 14 Minutes | 7,595 (15.5%) | 5,716 (15.5%) |
| 15 to 19 Minutes | 11,564 (23.6%) | 7,056 (19.2%) |
| 20 to 24 Minutes | 8,269 (16.9%) | 7,282 (19.8%) |
| 25 to 29 Minutes | 5,300 (10.8%) | 3,263 (8.9%) |
| 30 to 34 Minutes | 4,807 (9.8%) | 3,639 (9.9%) |
| 35 to 39 Minutes | 1,045 (2.1%) | 1,107 (3.0%) |
| 40 to 44 Minutes | 965 (2.0%) | 737 (2.0%) |
| 45 to 59 Minutes | 2,077 (4.2%) | 1,745 (4.8%) |
| 60 to 89 Minutes | 1,241 (2.5%) | 1,103 (3.0%) |
| 90 or more Minutes | 524 (1.1%) | 422 (1.1%) |
Time of Departure to Work by Sex in Tempe
The most frequent times of departure to work in Tempe are 8:00 AM to 8:29 AM (5,673, 11.6%) for males and 8:00 AM to 8:29 AM (5,632, 15.3%) for females.
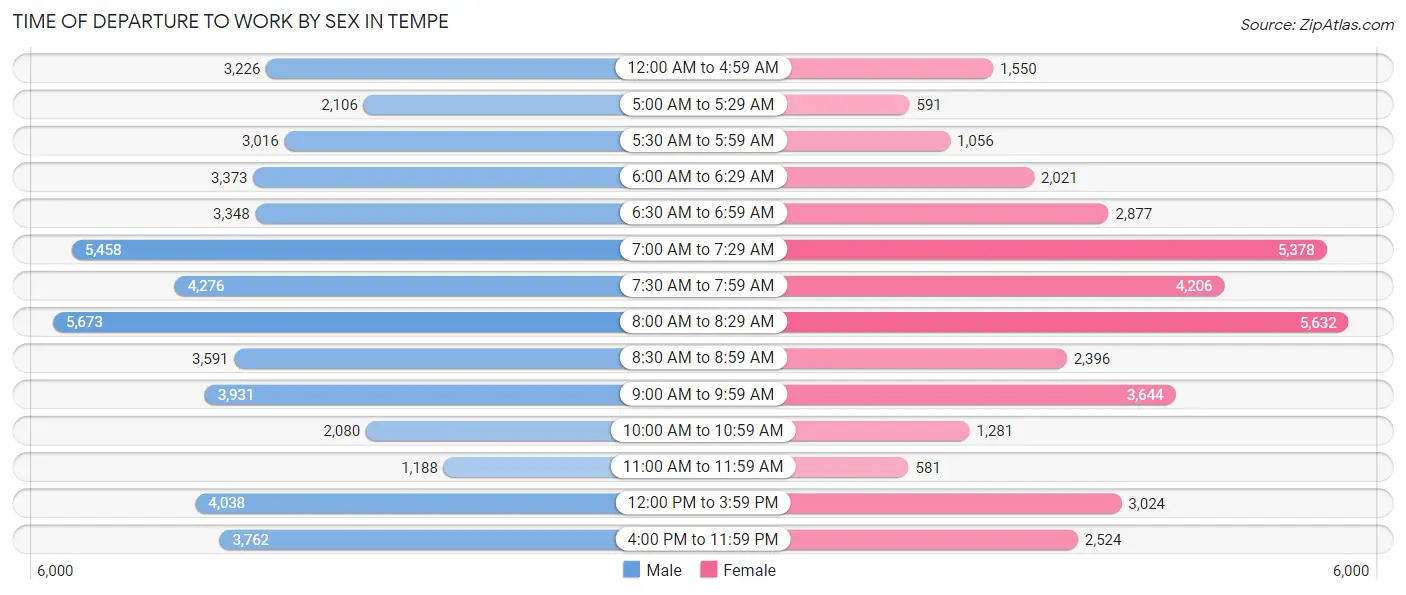
| Time of Departure | Male | Female |
| 12:00 AM to 4:59 AM | 3,226 (6.6%) | 1,550 (4.2%) |
| 5:00 AM to 5:29 AM | 2,106 (4.3%) | 591 (1.6%) |
| 5:30 AM to 5:59 AM | 3,016 (6.1%) | 1,056 (2.9%) |
| 6:00 AM to 6:29 AM | 3,373 (6.9%) | 2,021 (5.5%) |
| 6:30 AM to 6:59 AM | 3,348 (6.8%) | 2,877 (7.8%) |
| 7:00 AM to 7:29 AM | 5,458 (11.1%) | 5,378 (14.6%) |
| 7:30 AM to 7:59 AM | 4,276 (8.7%) | 4,206 (11.4%) |
| 8:00 AM to 8:29 AM | 5,673 (11.6%) | 5,632 (15.3%) |
| 8:30 AM to 8:59 AM | 3,591 (7.3%) | 2,396 (6.5%) |
| 9:00 AM to 9:59 AM | 3,931 (8.0%) | 3,644 (9.9%) |
| 10:00 AM to 10:59 AM | 2,080 (4.2%) | 1,281 (3.5%) |
| 11:00 AM to 11:59 AM | 1,188 (2.4%) | 581 (1.6%) |
| 12:00 PM to 3:59 PM | 4,038 (8.2%) | 3,024 (8.2%) |
| 4:00 PM to 11:59 PM | 3,762 (7.7%) | 2,524 (6.9%) |
| Total | 49,066 (100.0%) | 36,761 (100.0%) |
Housing Occupancy in Tempe
Occupancy by Ownership in Tempe
Of the total 75,701 dwellings in Tempe, owner-occupied units account for 30,777 (40.7%), while renter-occupied units make up 44,924 (59.3%).
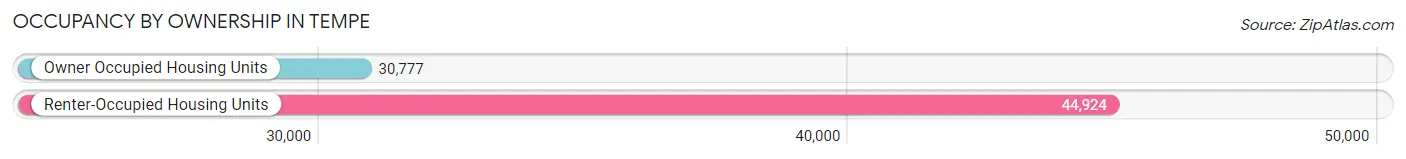
| Occupancy | # Housing Units | % Housing Units |
| Owner Occupied Housing Units | 30,777 | 40.7% |
| Renter-Occupied Housing Units | 44,924 | 59.3% |
| Total Occupied Housing Units | 75,701 | 100.0% |
Occupancy by Household Size in Tempe
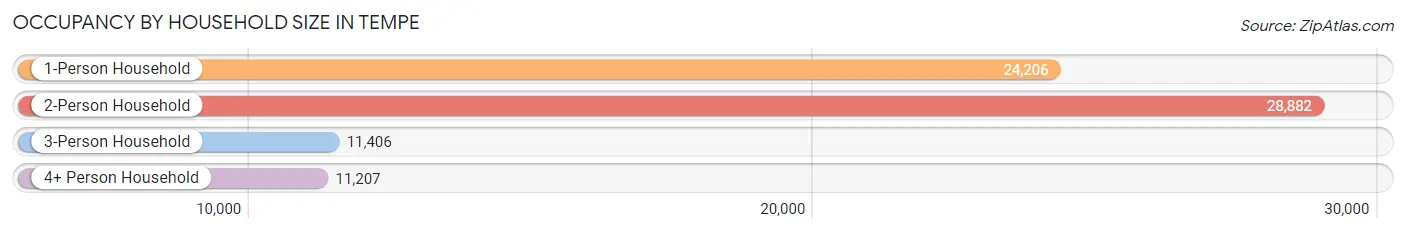
| Household Size | # Housing Units | % Housing Units |
| 1-Person Household | 24,206 | 32.0% |
| 2-Person Household | 28,882 | 38.2% |
| 3-Person Household | 11,406 | 15.1% |
| 4+ Person Household | 11,207 | 14.8% |
| Total Housing Units | 75,701 | 100.0% |
Occupancy by Ownership by Household Size in Tempe
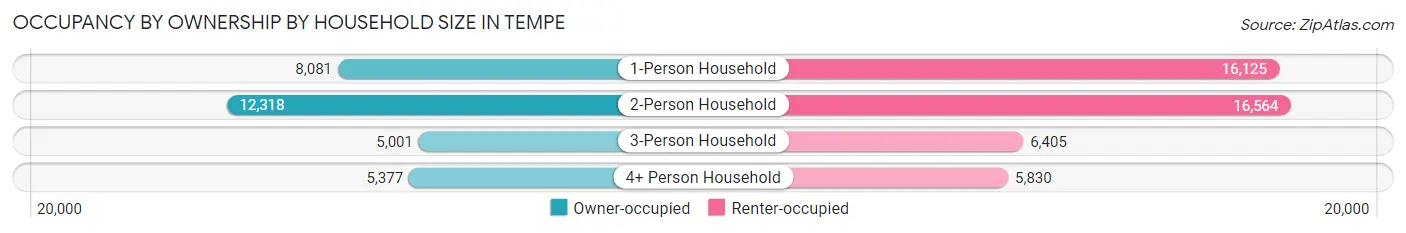
| Household Size | Owner-occupied | Renter-occupied |
| 1-Person Household | 8,081 (33.4%) | 16,125 (66.6%) |
| 2-Person Household | 12,318 (42.6%) | 16,564 (57.4%) |
| 3-Person Household | 5,001 (43.9%) | 6,405 (56.1%) |
| 4+ Person Household | 5,377 (48.0%) | 5,830 (52.0%) |
| Total Housing Units | 30,777 (40.7%) | 44,924 (59.3%) |
Occupancy by Educational Attainment in Tempe
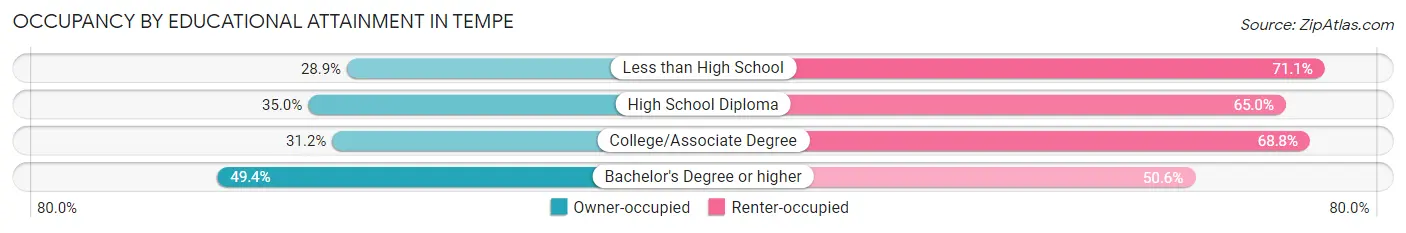
| Household Size | Owner-occupied | Renter-occupied |
| Less than High School | 902 (28.9%) | 2,222 (71.1%) |
| High School Diploma | 3,113 (35.0%) | 5,771 (65.0%) |
| College/Associate Degree | 8,089 (31.2%) | 17,820 (68.8%) |
| Bachelor's Degree or higher | 18,673 (49.4%) | 19,111 (50.6%) |
Occupancy by Age of Householder in Tempe
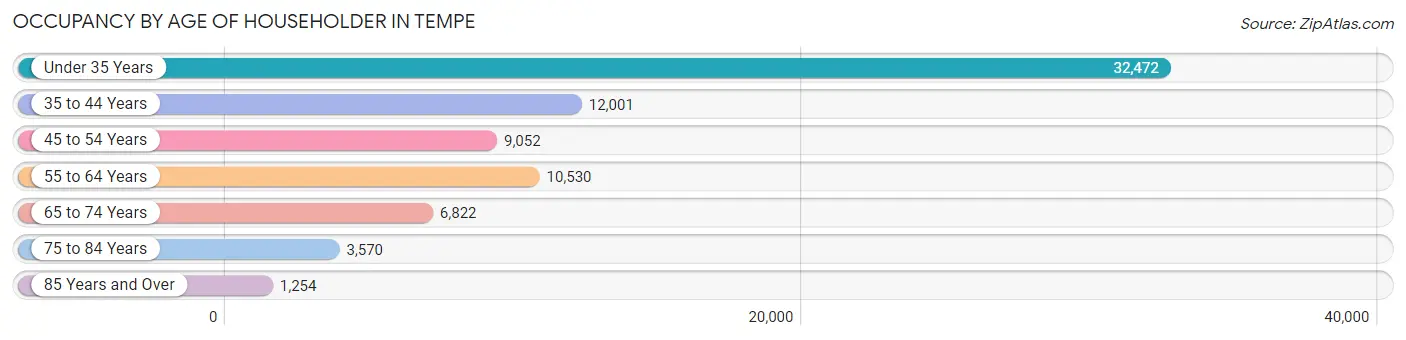
| Age Bracket | # Households | % Households |
| Under 35 Years | 32,472 | 42.9% |
| 35 to 44 Years | 12,001 | 15.9% |
| 45 to 54 Years | 9,052 | 12.0% |
| 55 to 64 Years | 10,530 | 13.9% |
| 65 to 74 Years | 6,822 | 9.0% |
| 75 to 84 Years | 3,570 | 4.7% |
| 85 Years and Over | 1,254 | 1.7% |
| Total | 75,701 | 100.0% |
Housing Finances in Tempe
Median Income by Occupancy in Tempe
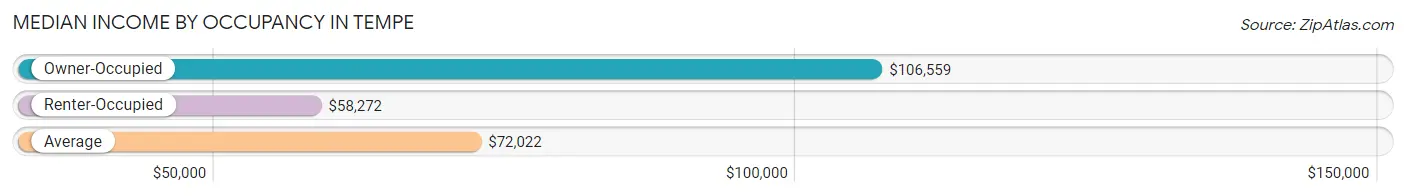
| Occupancy Type | # Households | Median Income |
| Owner-Occupied | 30,777 (40.7%) | $106,559 |
| Renter-Occupied | 44,924 (59.3%) | $58,272 |
| Average | 75,701 (100.0%) | $72,022 |
Occupancy by Householder Income Bracket in Tempe
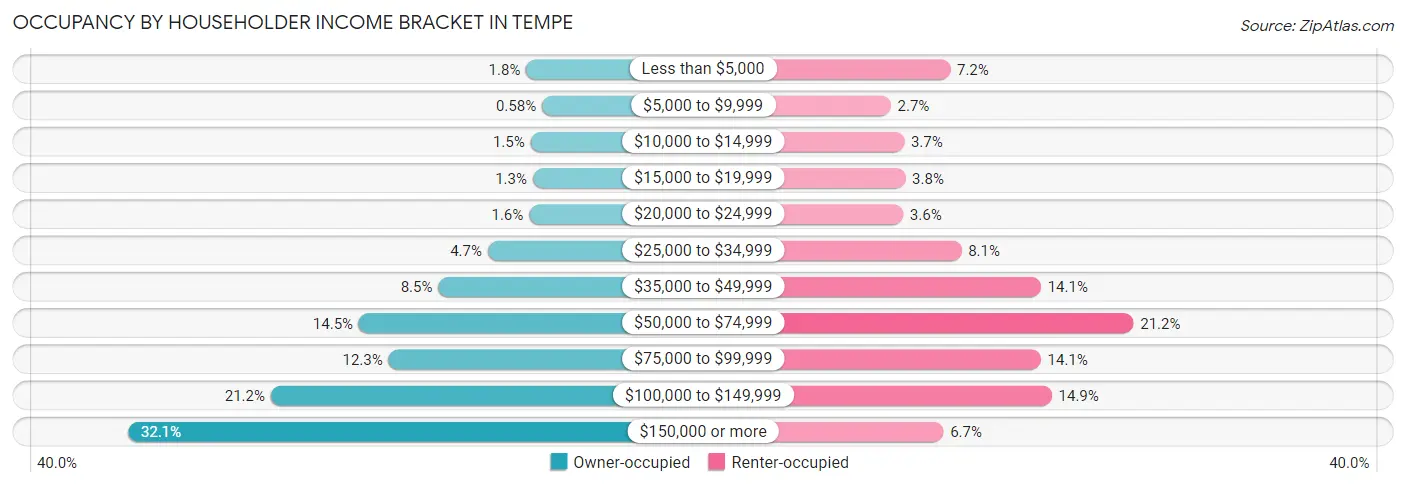
| Income Bracket | Owner-occupied | Renter-occupied |
| Less than $5,000 | 549 (1.8%) | 3,235 (7.2%) |
| $5,000 to $9,999 | 177 (0.6%) | 1,201 (2.7%) |
| $10,000 to $14,999 | 445 (1.5%) | 1,659 (3.7%) |
| $15,000 to $19,999 | 394 (1.3%) | 1,696 (3.8%) |
| $20,000 to $24,999 | 479 (1.6%) | 1,623 (3.6%) |
| $25,000 to $34,999 | 1,450 (4.7%) | 3,616 (8.1%) |
| $35,000 to $49,999 | 2,610 (8.5%) | 6,337 (14.1%) |
| $50,000 to $74,999 | 4,473 (14.5%) | 9,505 (21.2%) |
| $75,000 to $99,999 | 3,776 (12.3%) | 6,336 (14.1%) |
| $100,000 to $149,999 | 6,536 (21.2%) | 6,713 (14.9%) |
| $150,000 or more | 9,888 (32.1%) | 3,003 (6.7%) |
| Total | 30,777 (100.0%) | 44,924 (100.0%) |
Monthly Housing Cost Tiers in Tempe
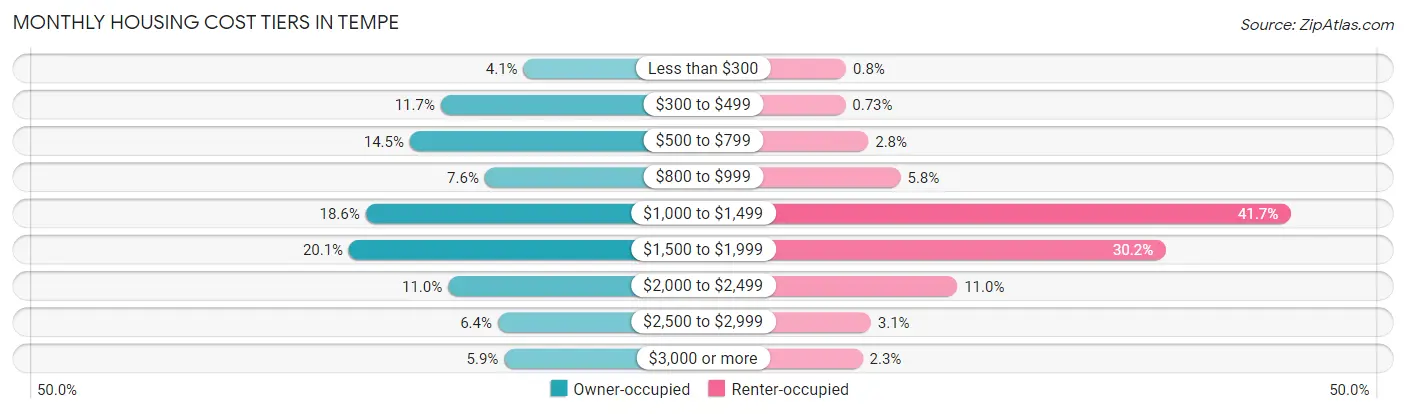
| Monthly Cost | Owner-occupied | Renter-occupied |
| Less than $300 | 1,255 (4.1%) | 359 (0.8%) |
| $300 to $499 | 3,598 (11.7%) | 326 (0.7%) |
| $500 to $799 | 4,474 (14.5%) | 1,275 (2.8%) |
| $800 to $999 | 2,350 (7.6%) | 2,609 (5.8%) |
| $1,000 to $1,499 | 5,727 (18.6%) | 18,720 (41.7%) |
| $1,500 to $1,999 | 6,199 (20.1%) | 13,548 (30.2%) |
| $2,000 to $2,499 | 3,393 (11.0%) | 4,953 (11.0%) |
| $2,500 to $2,999 | 1,981 (6.4%) | 1,385 (3.1%) |
| $3,000 or more | 1,800 (5.9%) | 1,044 (2.3%) |
| Total | 30,777 (100.0%) | 44,924 (100.0%) |
Physical Housing Characteristics in Tempe
Housing Structures in Tempe
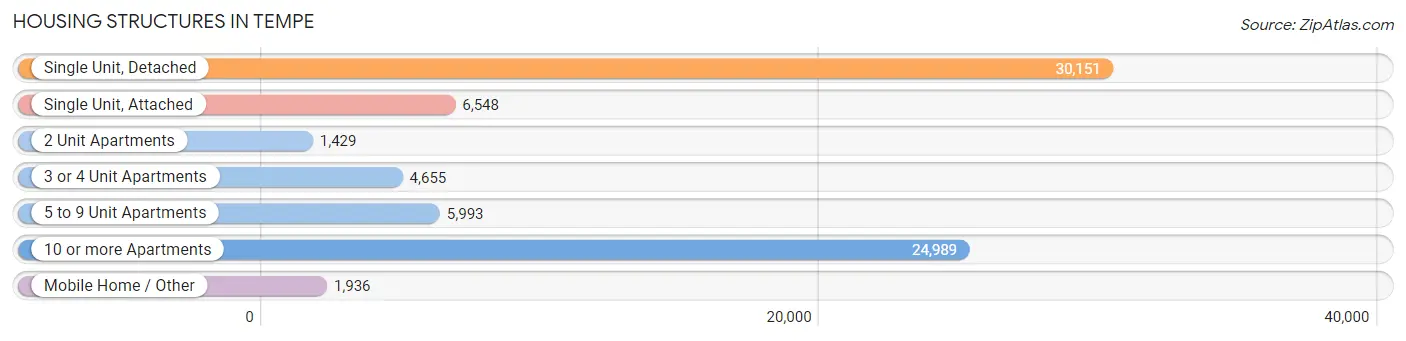
| Structure Type | # Housing Units | % Housing Units |
| Single Unit, Detached | 30,151 | 39.8% |
| Single Unit, Attached | 6,548 | 8.6% |
| 2 Unit Apartments | 1,429 | 1.9% |
| 3 or 4 Unit Apartments | 4,655 | 6.1% |
| 5 to 9 Unit Apartments | 5,993 | 7.9% |
| 10 or more Apartments | 24,989 | 33.0% |
| Mobile Home / Other | 1,936 | 2.6% |
| Total | 75,701 | 100.0% |
Housing Structures by Occupancy in Tempe
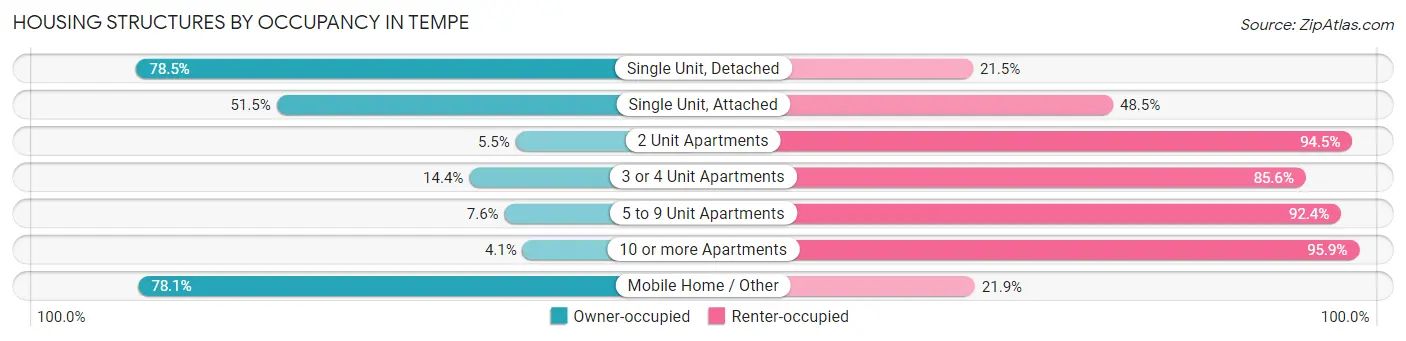
| Structure Type | Owner-occupied | Renter-occupied |
| Single Unit, Detached | 23,658 (78.5%) | 6,493 (21.5%) |
| Single Unit, Attached | 3,372 (51.5%) | 3,176 (48.5%) |
| 2 Unit Apartments | 78 (5.5%) | 1,351 (94.5%) |
| 3 or 4 Unit Apartments | 671 (14.4%) | 3,984 (85.6%) |
| 5 to 9 Unit Apartments | 456 (7.6%) | 5,537 (92.4%) |
| 10 or more Apartments | 1,030 (4.1%) | 23,959 (95.9%) |
| Mobile Home / Other | 1,512 (78.1%) | 424 (21.9%) |
| Total | 30,777 (40.7%) | 44,924 (59.3%) |
Housing Structures by Number of Rooms in Tempe
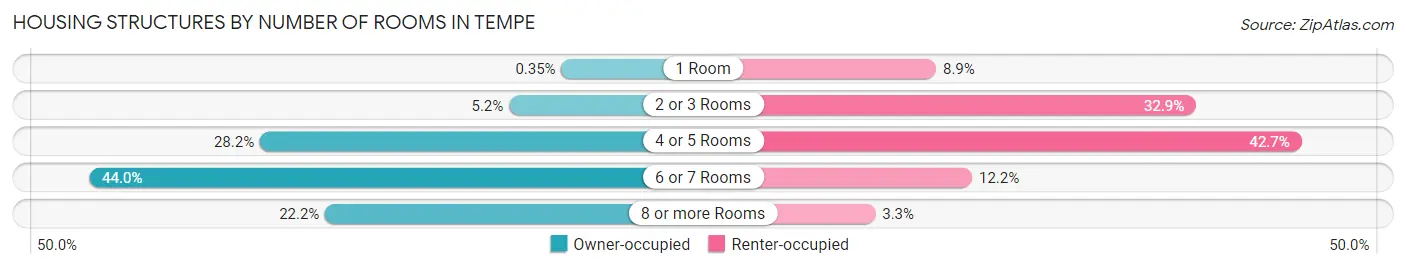
| Number of Rooms | Owner-occupied | Renter-occupied |
| 1 Room | 107 (0.4%) | 3,992 (8.9%) |
| 2 or 3 Rooms | 1,598 (5.2%) | 14,798 (32.9%) |
| 4 or 5 Rooms | 8,688 (28.2%) | 19,179 (42.7%) |
| 6 or 7 Rooms | 13,552 (44.0%) | 5,488 (12.2%) |
| 8 or more Rooms | 6,832 (22.2%) | 1,467 (3.3%) |
| Total | 30,777 (100.0%) | 44,924 (100.0%) |
Housing Structure by Heating Type in Tempe
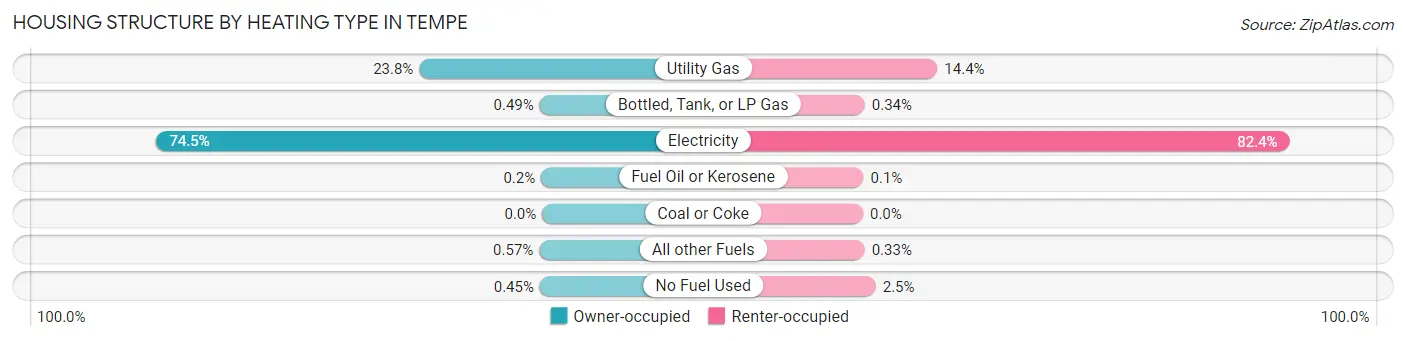
| Heating Type | Owner-occupied | Renter-occupied |
| Utility Gas | 7,311 (23.7%) | 6,457 (14.4%) |
| Bottled, Tank, or LP Gas | 151 (0.5%) | 154 (0.3%) |
| Electricity | 22,938 (74.5%) | 37,010 (82.4%) |
| Fuel Oil or Kerosene | 62 (0.2%) | 47 (0.1%) |
| Coal or Coke | 0 (0.0%) | 0 (0.0%) |
| All other Fuels | 175 (0.6%) | 150 (0.3%) |
| No Fuel Used | 140 (0.4%) | 1,106 (2.5%) |
| Total | 30,777 (100.0%) | 44,924 (100.0%) |
Household Vehicle Usage in Tempe
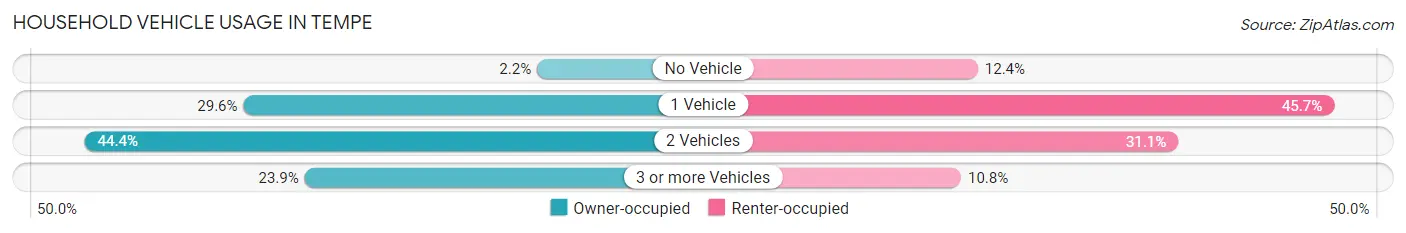
| Vehicles per Household | Owner-occupied | Renter-occupied |
| No Vehicle | 667 (2.2%) | 5,575 (12.4%) |
| 1 Vehicle | 9,104 (29.6%) | 20,509 (45.7%) |
| 2 Vehicles | 13,661 (44.4%) | 13,970 (31.1%) |
| 3 or more Vehicles | 7,345 (23.9%) | 4,870 (10.8%) |
| Total | 30,777 (100.0%) | 44,924 (100.0%) |
Real Estate & Mortgages in Tempe
Real Estate and Mortgage Overview in Tempe
| Characteristic | Without Mortgage | With Mortgage |
| Housing Units | 10,902 | 19,875 |
| Median Property Value | $368,600 | $388,900 |
| Median Household Income | $87,273 | $7,318 |
| Monthly Housing Costs | $554 | $1,708 |
| Real Estate Taxes | $2,157 | $498 |
Property Value by Mortgage Status in Tempe
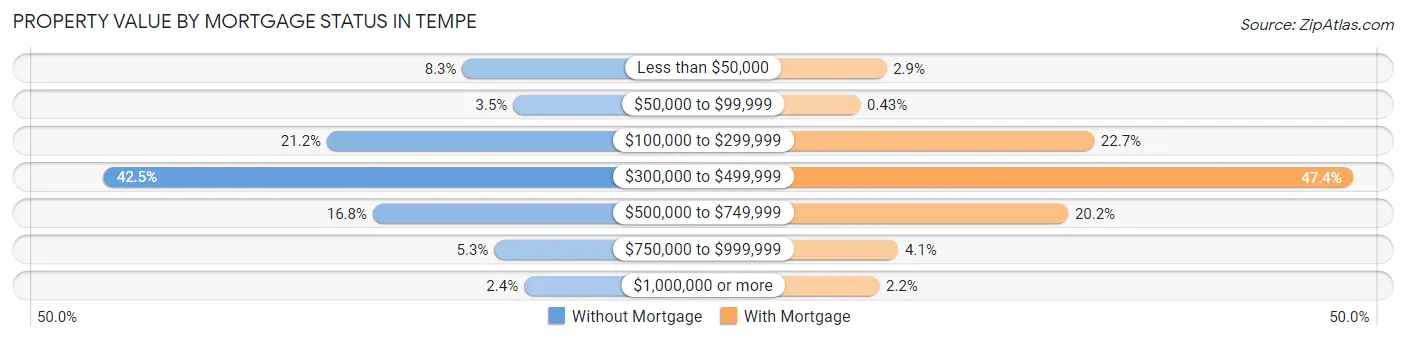
| Property Value | Without Mortgage | With Mortgage |
| Less than $50,000 | 906 (8.3%) | 580 (2.9%) |
| $50,000 to $99,999 | 378 (3.5%) | 85 (0.4%) |
| $100,000 to $299,999 | 2,312 (21.2%) | 4,512 (22.7%) |
| $300,000 to $499,999 | 4,628 (42.4%) | 9,427 (47.4%) |
| $500,000 to $749,999 | 1,836 (16.8%) | 4,021 (20.2%) |
| $750,000 to $999,999 | 576 (5.3%) | 804 (4.1%) |
| $1,000,000 or more | 266 (2.4%) | 446 (2.2%) |
| Total | 10,902 (100.0%) | 19,875 (100.0%) |
Household Income by Mortgage Status in Tempe
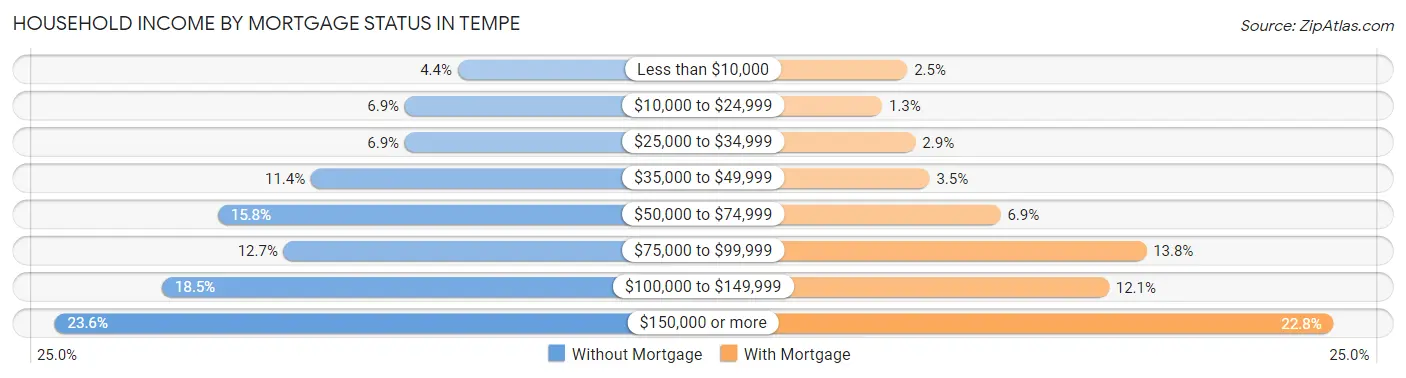
| Household Income | Without Mortgage | With Mortgage |
| Less than $10,000 | 476 (4.4%) | 488 (2.5%) |
| $10,000 to $24,999 | 751 (6.9%) | 250 (1.3%) |
| $25,000 to $34,999 | 751 (6.9%) | 567 (2.9%) |
| $35,000 to $49,999 | 1,239 (11.4%) | 699 (3.5%) |
| $50,000 to $74,999 | 1,723 (15.8%) | 1,371 (6.9%) |
| $75,000 to $99,999 | 1,380 (12.7%) | 2,750 (13.8%) |
| $100,000 to $149,999 | 2,012 (18.5%) | 2,396 (12.1%) |
| $150,000 or more | 2,570 (23.6%) | 4,524 (22.8%) |
| Total | 10,902 (100.0%) | 19,875 (100.0%) |
Property Value to Household Income Ratio in Tempe
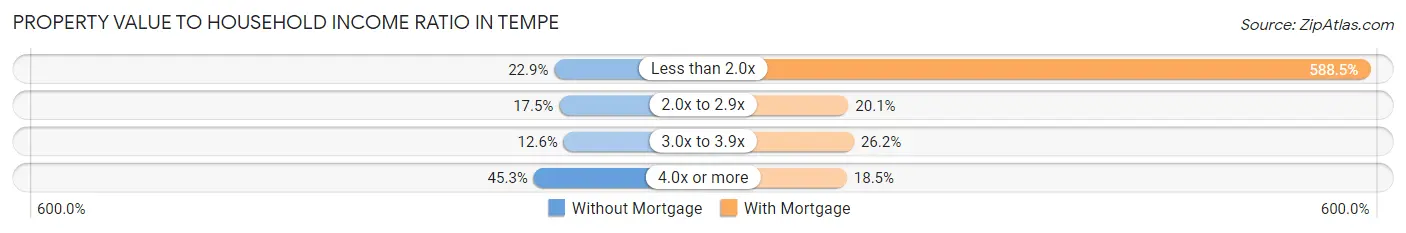
| Value-to-Income Ratio | Without Mortgage | With Mortgage |
| Less than 2.0x | 2,492 (22.9%) | 116,971 (588.5%) |
| 2.0x to 2.9x | 1,905 (17.5%) | 3,999 (20.1%) |
| 3.0x to 3.9x | 1,373 (12.6%) | 5,208 (26.2%) |
| 4.0x or more | 4,940 (45.3%) | 3,675 (18.5%) |
| Total | 10,902 (100.0%) | 19,875 (100.0%) |
Real Estate Taxes by Mortgage Status in Tempe
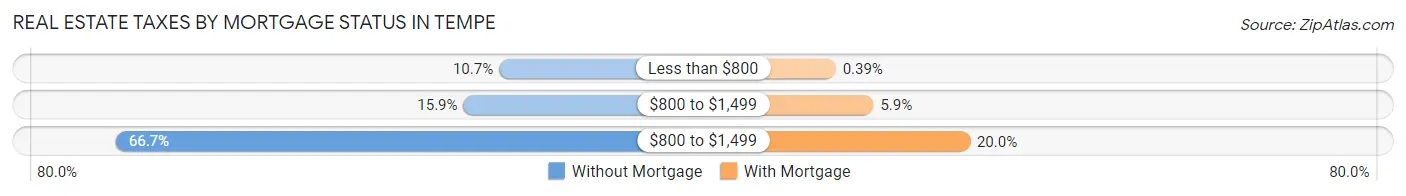
| Property Taxes | Without Mortgage | With Mortgage |
| Less than $800 | 1,164 (10.7%) | 77 (0.4%) |
| $800 to $1,499 | 1,732 (15.9%) | 1,174 (5.9%) |
| $800 to $1,499 | 7,267 (66.7%) | 3,977 (20.0%) |
| Total | 10,902 (100.0%) | 19,875 (100.0%) |
Health & Disability in Tempe
Health Insurance Coverage by Age in Tempe
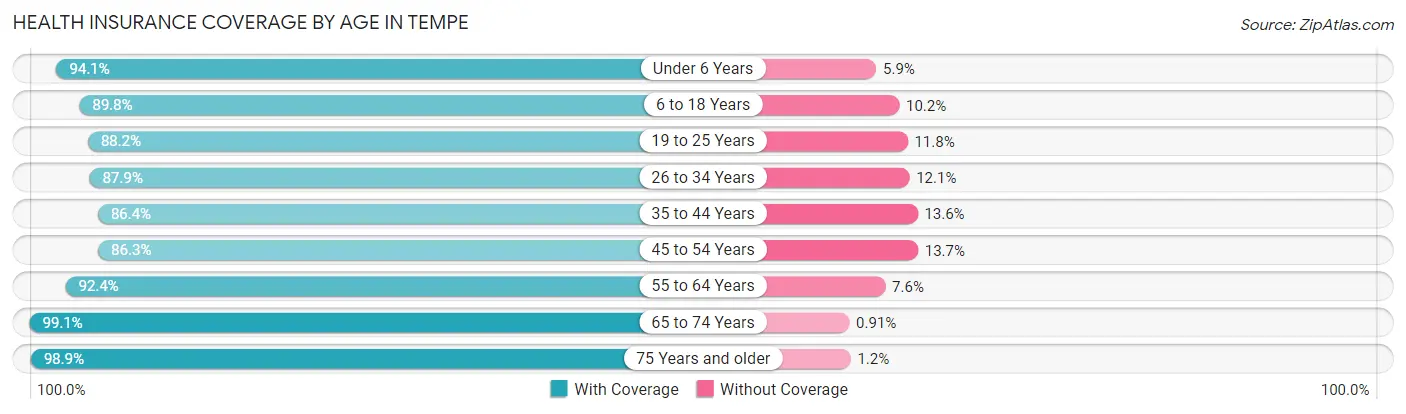
| Age Bracket | With Coverage | Without Coverage |
| Under 6 Years | 8,427 (94.1%) | 531 (5.9%) |
| 6 to 18 Years | 19,444 (89.8%) | 2,212 (10.2%) |
| 19 to 25 Years | 36,483 (88.2%) | 4,873 (11.8%) |
| 26 to 34 Years | 31,899 (87.9%) | 4,395 (12.1%) |
| 35 to 44 Years | 18,343 (86.4%) | 2,898 (13.6%) |
| 45 to 54 Years | 13,111 (86.3%) | 2,083 (13.7%) |
| 55 to 64 Years | 15,684 (92.4%) | 1,294 (7.6%) |
| 65 to 74 Years | 10,882 (99.1%) | 100 (0.9%) |
| 75 Years and older | 7,703 (98.9%) | 90 (1.1%) |
| Total | 161,976 (89.8%) | 18,476 (10.2%) |
Health Insurance Coverage by Citizenship Status in Tempe
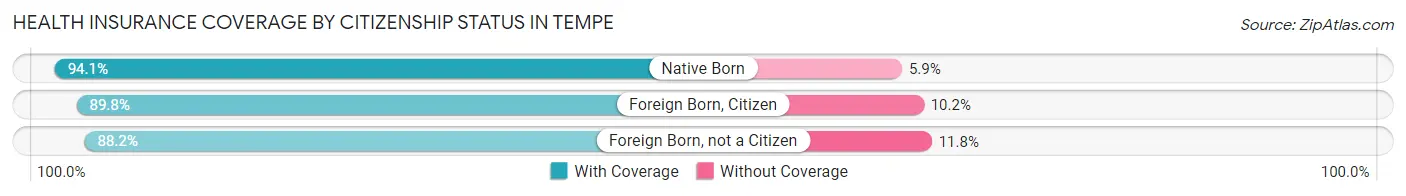
| Citizenship Status | With Coverage | Without Coverage |
| Native Born | 8,427 (94.1%) | 531 (5.9%) |
| Foreign Born, Citizen | 19,444 (89.8%) | 2,212 (10.2%) |
| Foreign Born, not a Citizen | 36,483 (88.2%) | 4,873 (11.8%) |
Health Insurance Coverage by Household Income in Tempe
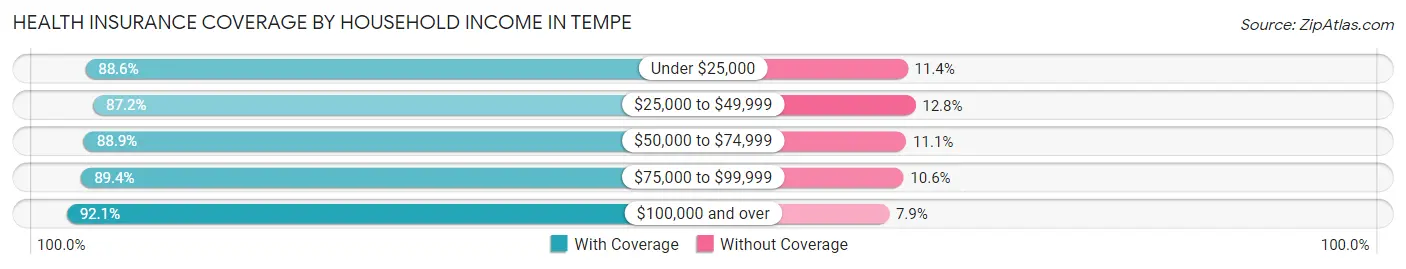
| Household Income | With Coverage | Without Coverage |
| Under $25,000 | 18,538 (88.6%) | 2,380 (11.4%) |
| $25,000 to $49,999 | 24,240 (87.2%) | 3,567 (12.8%) |
| $50,000 to $74,999 | 25,146 (88.9%) | 3,146 (11.1%) |
| $75,000 to $99,999 | 21,040 (89.4%) | 2,498 (10.6%) |
| $100,000 and over | 65,252 (92.1%) | 5,595 (7.9%) |
Public vs Private Health Insurance Coverage by Age in Tempe
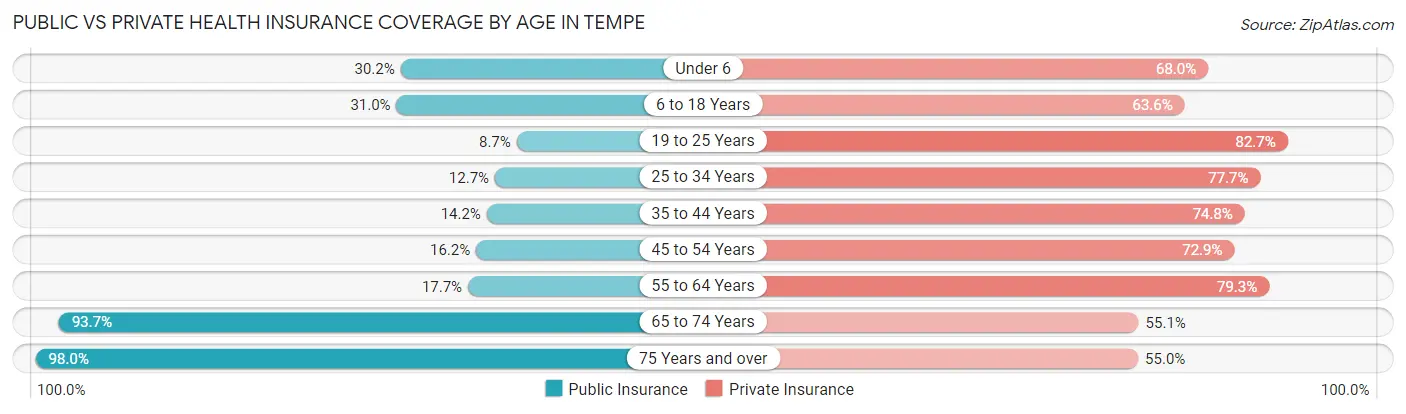
| Age Bracket | Public Insurance | Private Insurance |
| Under 6 | 2,707 (30.2%) | 6,089 (68.0%) |
| 6 to 18 Years | 6,708 (31.0%) | 13,777 (63.6%) |
| 19 to 25 Years | 3,587 (8.7%) | 34,214 (82.7%) |
| 25 to 34 Years | 4,608 (12.7%) | 28,193 (77.7%) |
| 35 to 44 Years | 3,022 (14.2%) | 15,885 (74.8%) |
| 45 to 54 Years | 2,461 (16.2%) | 11,069 (72.9%) |
| 55 to 64 Years | 3,007 (17.7%) | 13,462 (79.3%) |
| 65 to 74 Years | 10,286 (93.7%) | 6,051 (55.1%) |
| 75 Years and over | 7,635 (98.0%) | 4,287 (55.0%) |
| Total | 44,021 (24.4%) | 133,027 (73.7%) |
Disability Status by Sex by Age in Tempe
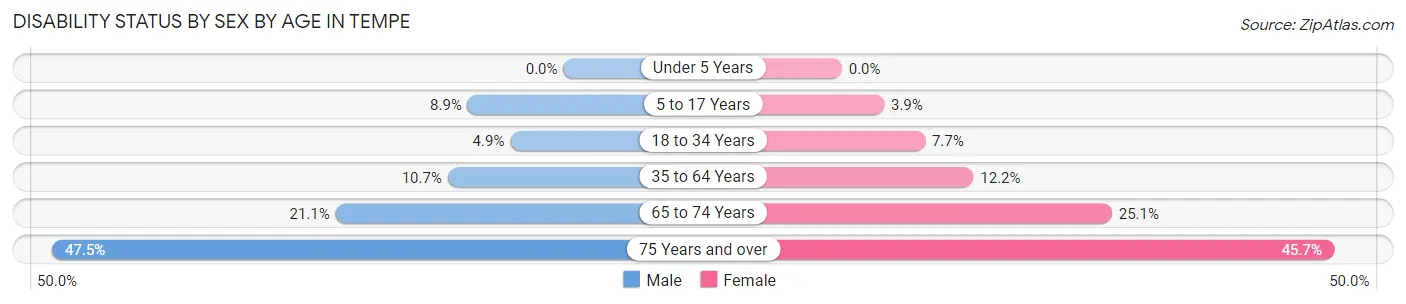
| Age Bracket | Male | Female |
| Under 5 Years | 0 (0.0%) | 0 (0.0%) |
| 5 to 17 Years | 813 (8.9%) | 363 (3.9%) |
| 18 to 34 Years | 2,261 (4.9%) | 2,811 (7.7%) |
| 35 to 64 Years | 3,005 (10.7%) | 3,104 (12.2%) |
| 65 to 74 Years | 1,116 (21.1%) | 1,429 (25.1%) |
| 75 Years and over | 1,697 (47.5%) | 1,925 (45.7%) |
Disability Class by Sex by Age in Tempe
Disability Class: Hearing Difficulty
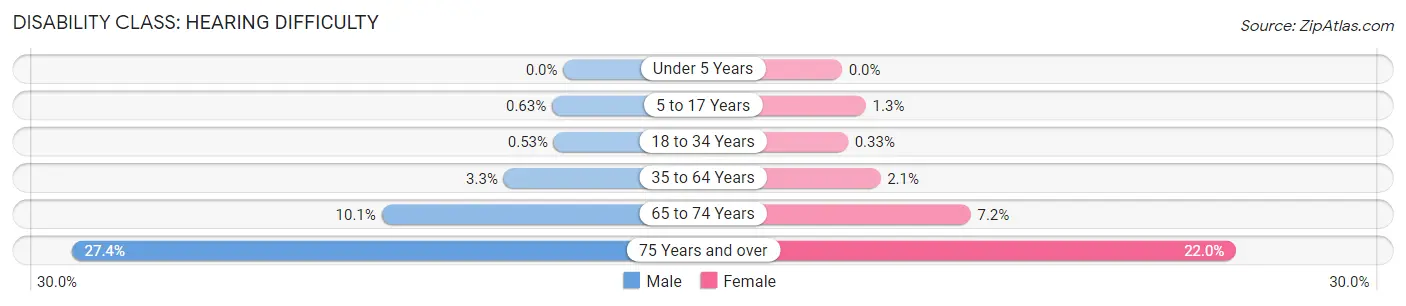
| Age Bracket | Male | Female |
| Under 5 Years | 0 (0.0%) | 0 (0.0%) |
| 5 to 17 Years | 58 (0.6%) | 123 (1.3%) |
| 18 to 34 Years | 242 (0.5%) | 120 (0.3%) |
| 35 to 64 Years | 930 (3.3%) | 543 (2.1%) |
| 65 to 74 Years | 534 (10.1%) | 409 (7.2%) |
| 75 Years and over | 979 (27.4%) | 926 (22.0%) |
Disability Class: Vision Difficulty
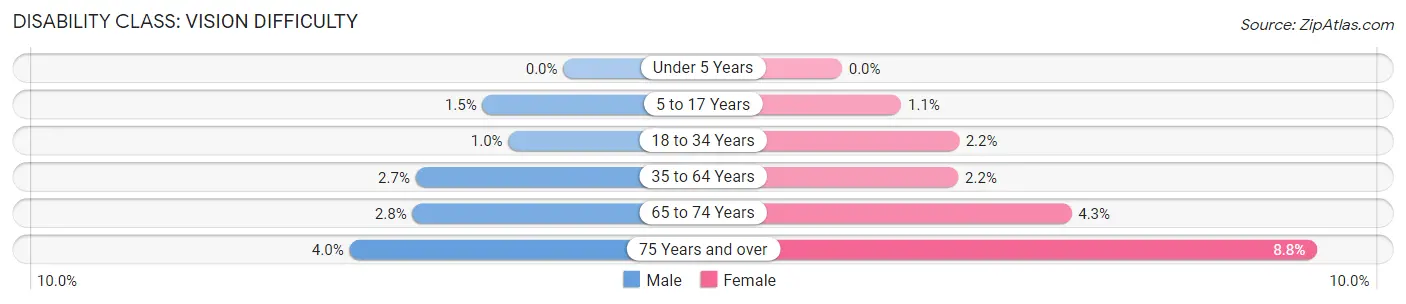
| Age Bracket | Male | Female |
| Under 5 Years | 0 (0.0%) | 0 (0.0%) |
| 5 to 17 Years | 137 (1.5%) | 102 (1.1%) |
| 18 to 34 Years | 466 (1.0%) | 792 (2.2%) |
| 35 to 64 Years | 766 (2.7%) | 550 (2.2%) |
| 65 to 74 Years | 148 (2.8%) | 243 (4.3%) |
| 75 Years and over | 142 (4.0%) | 372 (8.8%) |
Disability Class: Cognitive Difficulty
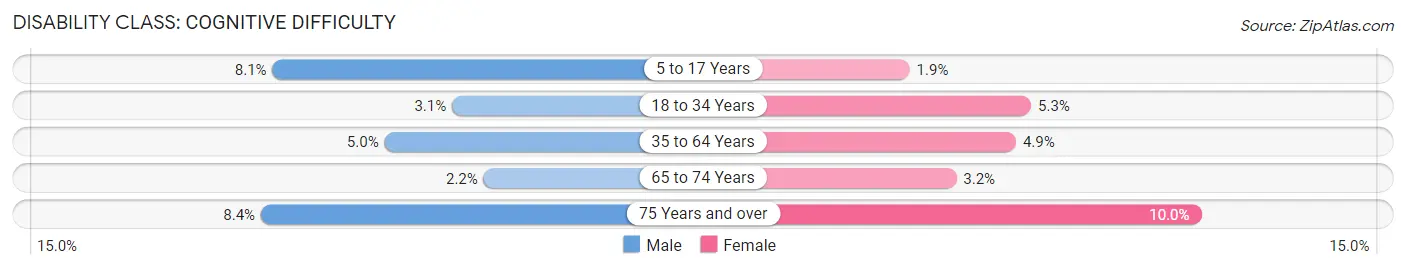
| Age Bracket | Male | Female |
| 5 to 17 Years | 742 (8.1%) | 175 (1.9%) |
| 18 to 34 Years | 1,422 (3.1%) | 1,919 (5.3%) |
| 35 to 64 Years | 1,395 (5.0%) | 1,234 (4.9%) |
| 65 to 74 Years | 117 (2.2%) | 182 (3.2%) |
| 75 Years and over | 301 (8.4%) | 422 (10.0%) |
Disability Class: Ambulatory Difficulty
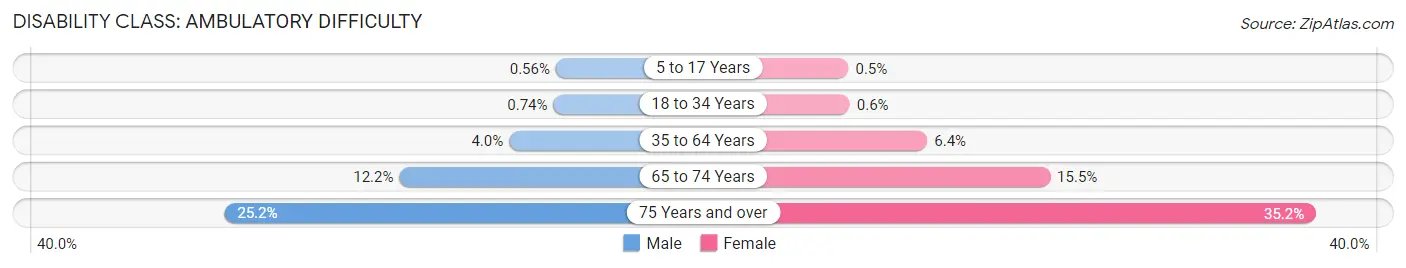
| Age Bracket | Male | Female |
| 5 to 17 Years | 51 (0.6%) | 46 (0.5%) |
| 18 to 34 Years | 340 (0.7%) | 218 (0.6%) |
| 35 to 64 Years | 1,129 (4.0%) | 1,615 (6.4%) |
| 65 to 74 Years | 643 (12.2%) | 882 (15.5%) |
| 75 Years and over | 900 (25.2%) | 1,485 (35.2%) |
Disability Class: Self-Care Difficulty
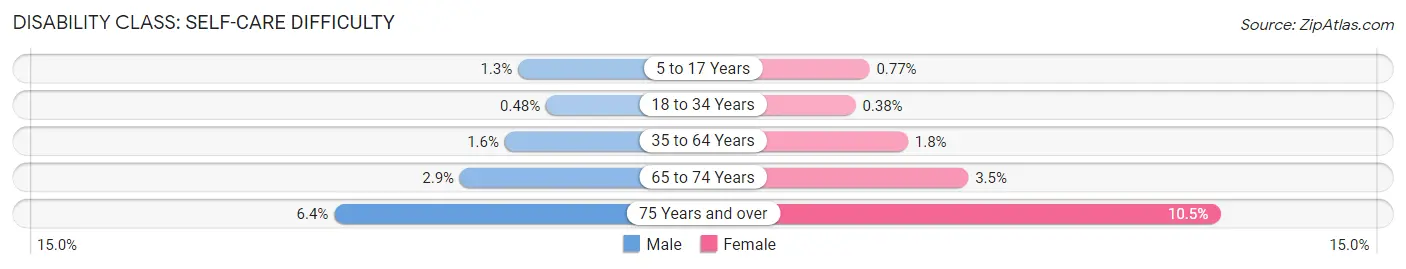
| Age Bracket | Male | Female |
| 5 to 17 Years | 115 (1.3%) | 71 (0.8%) |
| 18 to 34 Years | 221 (0.5%) | 139 (0.4%) |
| 35 to 64 Years | 455 (1.6%) | 467 (1.8%) |
| 65 to 74 Years | 152 (2.9%) | 201 (3.5%) |
| 75 Years and over | 228 (6.4%) | 444 (10.5%) |
Technology Access in Tempe
Computing Device Access in Tempe
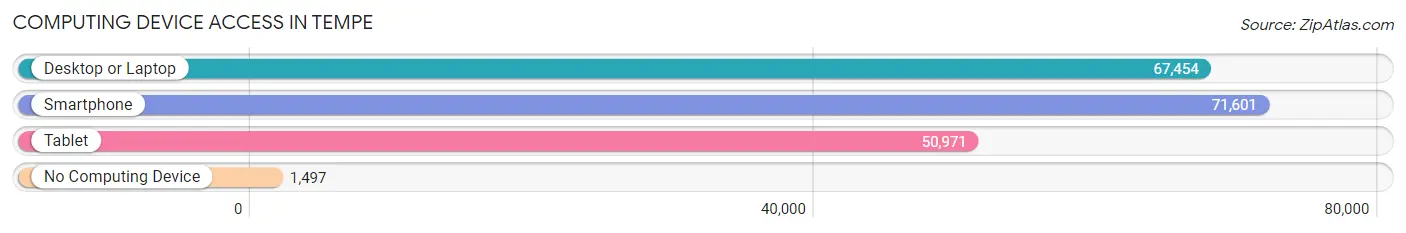
| Device Type | # Households | % Households |
| Desktop or Laptop | 67,454 | 89.1% |
| Smartphone | 71,601 | 94.6% |
| Tablet | 50,971 | 67.3% |
| No Computing Device | 1,497 | 2.0% |
| Total | 75,701 | 100.0% |
Internet Access in Tempe
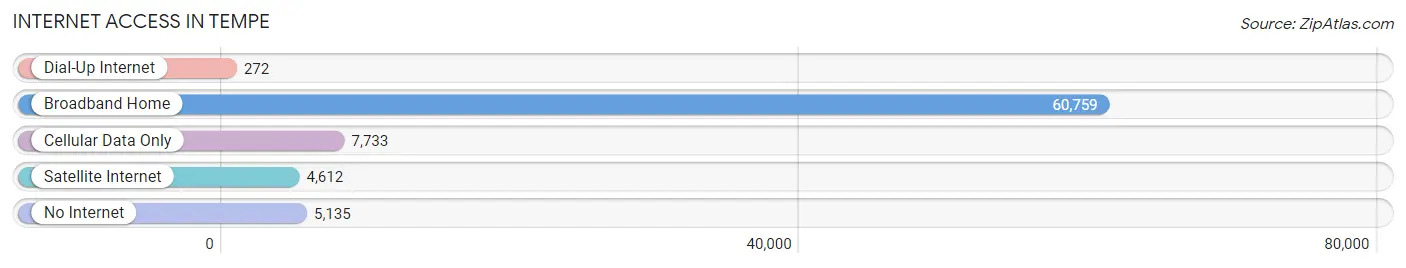
| Internet Type | # Households | % Households |
| Dial-Up Internet | 272 | 0.4% |
| Broadband Home | 60,759 | 80.3% |
| Cellular Data Only | 7,733 | 10.2% |
| Satellite Internet | 4,612 | 6.1% |
| No Internet | 5,135 | 6.8% |
| Total | 75,701 | 100.0% |
Tempe Summary
Tempe, Arizona is a city located in the Greater Phoenix metropolitan area in Maricopa County. It is the fifth largest city in Arizona and the twelfth largest city in the United States. Tempe is home to Arizona State University, one of the largest public universities in the country. The city is known for its vibrant culture, diverse economy, and excellent quality of life.
Geography
Tempe is located in the Salt River Valley, which is part of the Sonoran Desert. The city is bordered by Phoenix to the west, Scottsdale to the north, and Mesa to the east. The city is situated on the south bank of the Salt River, which is a major tributary of the Gila River. The city is located at an elevation of 1,159 feet (354 m) above sea level. The city has a total area of 40.2 square miles (104 km2), of which 39.8 square miles (103 km2) is land and 0.4 square miles (1.0 km2) is water.
Economy
Tempe is a major economic center in the Greater Phoenix area. The city is home to a number of large employers, including Arizona State University, Intel, US Airways, and Wells Fargo. The city also has a thriving technology sector, with many startups and established companies located in the city. The city is also home to a number of shopping centers, restaurants, and entertainment venues.
Demographics
As of the 2010 census, Tempe had a population of 161,719. The racial makeup of the city was 73.2% White, 5.2% African American, 0.7% Native American, 6.3% Asian, 0.2% Pacific Islander, 11.3% from other races, and 3.2% from two or more races. Hispanic or Latino of any race were 24.5% of the population.
The median income for a household in the city was $45,744, and the median income for a family was $54,844. The per capita income for the city was $24,818. About 11.2% of families and 15.3% of the population were below the poverty line, including 20.2% of those under age 18 and 8.2% of those age 65 or over.
History
Tempe was first settled by the Hohokam people in the late 13th century. The area was later inhabited by the Pima and Maricopa tribes. The first European settlers arrived in the area in the late 19th century. The city was officially incorporated in 1894.
Tempe quickly grew in the early 20th century, becoming a major center for agriculture and industry. The city was also home to a number of military bases during World War II. After the war, the city continued to grow, becoming a major center for education and technology. Today, Tempe is a vibrant and diverse city, with a thriving economy and excellent quality of life.
Common Questions
What is Per Capita Income in Tempe?
Per Capita income in Tempe is $40,495.
What is the Median Family Income in Tempe?
Median Family Income in Tempe is $94,349.
What is the Median Household income in Tempe?
Median Household Income in Tempe is $72,022.
What is Income or Wage Gap in Tempe?
Income or Wage Gap in Tempe is 13.2%.
Women in Tempe earn 86.8 cents for every dollar earned by a man.
What is Family Income Deficit in Tempe?
Family Income Deficit in Tempe is $11,941.
Families that are below poverty line in Tempe earn $11,941 less on average than the poverty threshold level.
What is Inequality or Gini Index in Tempe?
Inequality or Gini Index in Tempe is 0.45.
What is the Total Population of Tempe?
Total Population of Tempe is 181,005.
What is the Total Male Population of Tempe?
Total Male Population of Tempe is 96,435.
What is the Total Female Population of Tempe?
Total Female Population of Tempe is 84,570.
What is the Ratio of Males per 100 Females in Tempe?
There are 114.03 Males per 100 Females in Tempe.
What is the Ratio of Females per 100 Males in Tempe?
There are 87.70 Females per 100 Males in Tempe.
What is the Median Population Age in Tempe?
Median Population Age in Tempe is 29.7 Years.
What is the Average Family Size in Tempe
Average Family Size in Tempe is 2.9 People.
What is the Average Household Size in Tempe
Average Household Size in Tempe is 2.3 People.
How Large is the Labor Force in Tempe?
There are 111,857 People in the Labor Forcein in Tempe.
What is the Percentage of People in the Labor Force in Tempe?
70.8% of People are in the Labor Force in Tempe.
What is the Unemployment Rate in Tempe?
Unemployment Rate in Tempe is 5.7%.