Montgomery Village, MD Map & Demographics
Montgomery Village Map
Montgomery Village Overview
$42,361
PER CAPITA INCOME
$106,741
AVG FAMILY INCOME
$91,703
AVG HOUSEHOLD INCOME
17.1%
WAGE / INCOME GAP [ % ]
82.9¢/ $1
WAGE / INCOME GAP [ $ ]
$14,333
FAMILY INCOME DEFICIT
0.43
INEQUALITY / GINI INDEX
34,748
TOTAL POPULATION
17,574
MALE POPULATION
17,174
FEMALE POPULATION
102.33
MALES / 100 FEMALES
97.72
FEMALES / 100 MALES
36.8
MEDIAN AGE
3.5
AVG FAMILY SIZE
2.9
AVG HOUSEHOLD SIZE
19,571
LABOR FORCE [ PEOPLE ]
71.6%
PERCENT IN LABOR FORCE
6.7%
UNEMPLOYMENT RATE
Montgomery Village Zip Codes
Income in Montgomery Village
Income Overview in Montgomery Village
Per Capita Income in Montgomery Village is $42,361, while median incomes of families and households are $106,741 and $91,703 respectively.
| Characteristic | Number | Measure |
| Per Capita Income | 34,748 | $42,361 |
| Median Family Income | 8,338 | $106,741 |
| Mean Family Income | 8,338 | $131,318 |
| Median Household Income | 12,132 | $91,703 |
| Mean Household Income | 12,132 | $118,199 |
| Income Deficit | 8,338 | $14,333 |
| Wage / Income Gap (%) | 34,748 | 17.11% |
| Wage / Income Gap ($) | 34,748 | 82.89¢ per $1 |
| Gini / Inequality Index | 34,748 | 0.43 |
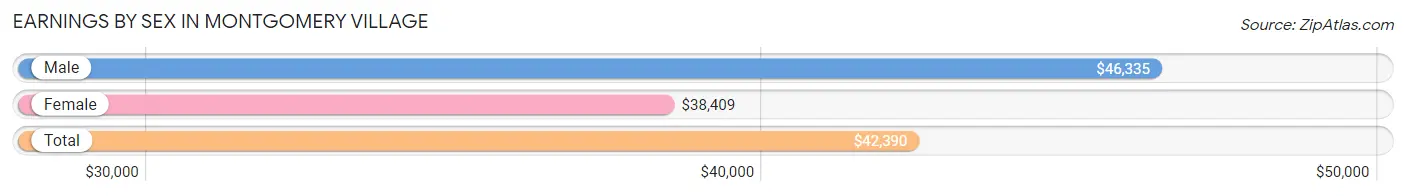
Earnings by Sex in Montgomery Village
Average Earnings in Montgomery Village are $42,390, $46,335 for men and $38,409 for women, a difference of 17.1%.
| Sex | Number | Average Earnings |
| Male | 10,561 (53.6%) | $46,335 |
| Female | 9,158 (46.4%) | $38,409 |
| Total | 19,719 (100.0%) | $42,390 |
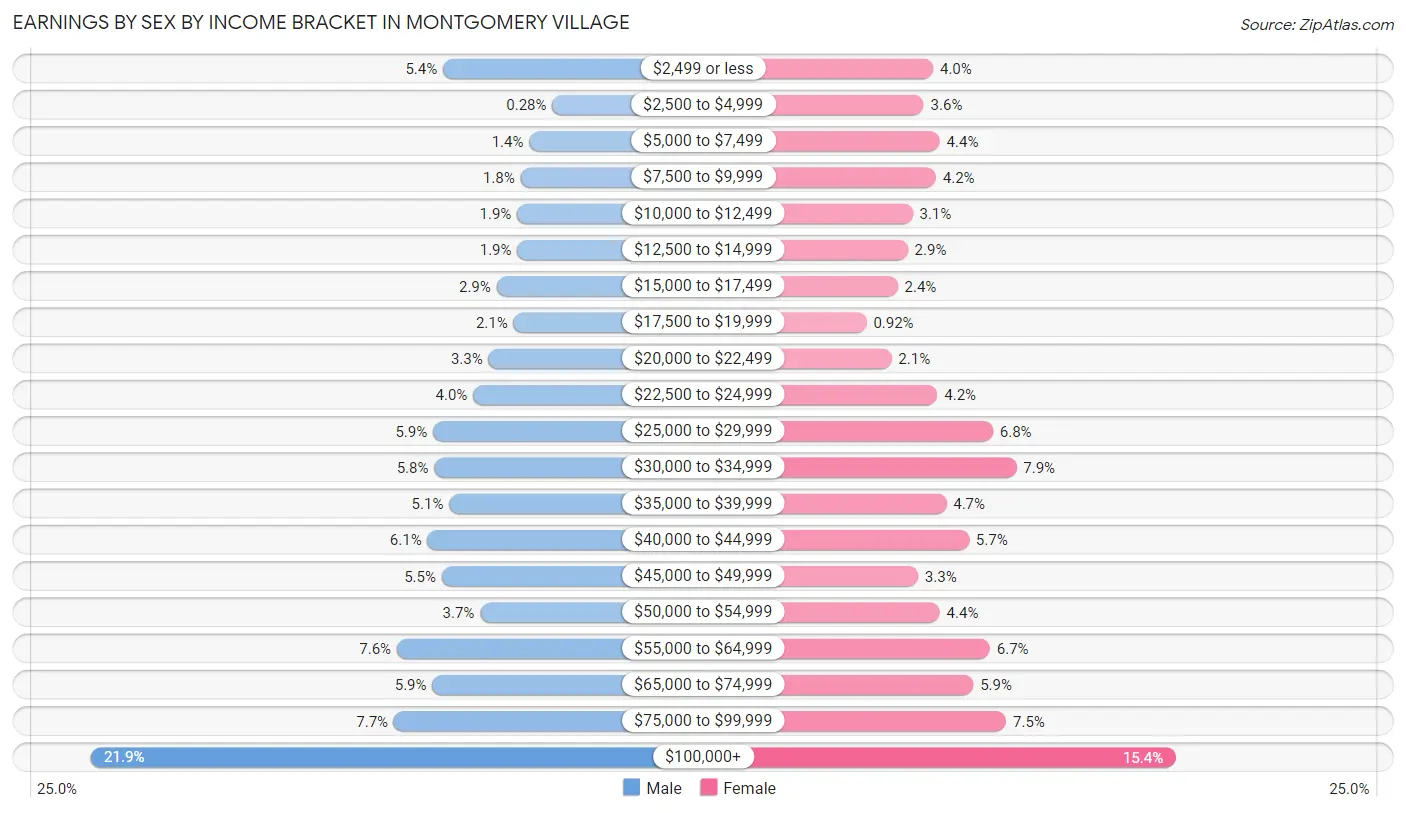
Earnings by Sex by Income Bracket in Montgomery Village
The most common earnings brackets in Montgomery Village are $100,000+ for men (2,311 | 21.9%) and $100,000+ for women (1,408 | 15.4%).
| Income | Male | Female |
| $2,499 or less | 570 (5.4%) | 370 (4.0%) |
| $2,500 to $4,999 | 30 (0.3%) | 330 (3.6%) |
| $5,000 to $7,499 | 144 (1.4%) | 398 (4.3%) |
| $7,500 to $9,999 | 187 (1.8%) | 382 (4.2%) |
| $10,000 to $12,499 | 204 (1.9%) | 282 (3.1%) |
| $12,500 to $14,999 | 203 (1.9%) | 261 (2.9%) |
| $15,000 to $17,499 | 305 (2.9%) | 218 (2.4%) |
| $17,500 to $19,999 | 222 (2.1%) | 84 (0.9%) |
| $20,000 to $22,499 | 345 (3.3%) | 191 (2.1%) |
| $22,500 to $24,999 | 421 (4.0%) | 388 (4.2%) |
| $25,000 to $29,999 | 620 (5.9%) | 626 (6.8%) |
| $30,000 to $34,999 | 614 (5.8%) | 727 (7.9%) |
| $35,000 to $39,999 | 540 (5.1%) | 427 (4.7%) |
| $40,000 to $44,999 | 647 (6.1%) | 524 (5.7%) |
| $45,000 to $49,999 | 577 (5.5%) | 305 (3.3%) |
| $50,000 to $54,999 | 387 (3.7%) | 398 (4.3%) |
| $55,000 to $64,999 | 798 (7.6%) | 614 (6.7%) |
| $65,000 to $74,999 | 623 (5.9%) | 542 (5.9%) |
| $75,000 to $99,999 | 813 (7.7%) | 683 (7.5%) |
| $100,000+ | 2,311 (21.9%) | 1,408 (15.4%) |
| Total | 10,561 (100.0%) | 9,158 (100.0%) |
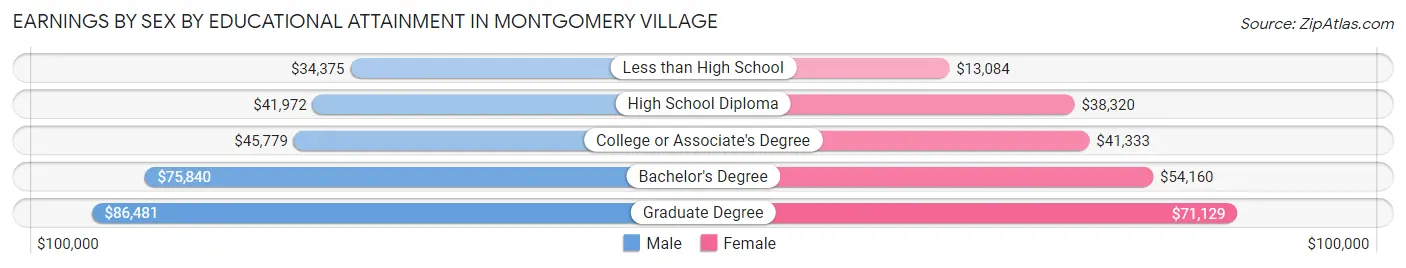
Earnings by Sex by Educational Attainment in Montgomery Village
Average earnings in Montgomery Village are $52,500 for men and $42,392 for women, a difference of 19.3%. Men with an educational attainment of graduate degree enjoy the highest average annual earnings of $86,481, while those with less than high school education earn the least with $34,375. Women with an educational attainment of graduate degree earn the most with the average annual earnings of $71,129, while those with less than high school education have the smallest earnings of $13,084.
| Educational Attainment | Male Income | Female Income |
| Less than High School | $34,375 | $13,084 |
| High School Diploma | $41,972 | $38,320 |
| College or Associate's Degree | $45,779 | $41,333 |
| Bachelor's Degree | $75,840 | $54,160 |
| Graduate Degree | $86,481 | $71,129 |
| Total | $52,500 | $42,392 |
Family Income in Montgomery Village
Family Income Brackets in Montgomery Village
According to the Montgomery Village family income data, there are 1,751 families falling into the $200,000+ income range, which is the most common income bracket and makes up 21.0% of all families. Conversely, the $10,000 to $14,999 income bracket is the least frequent group with only 58 families (0.7%) belonging to this category.
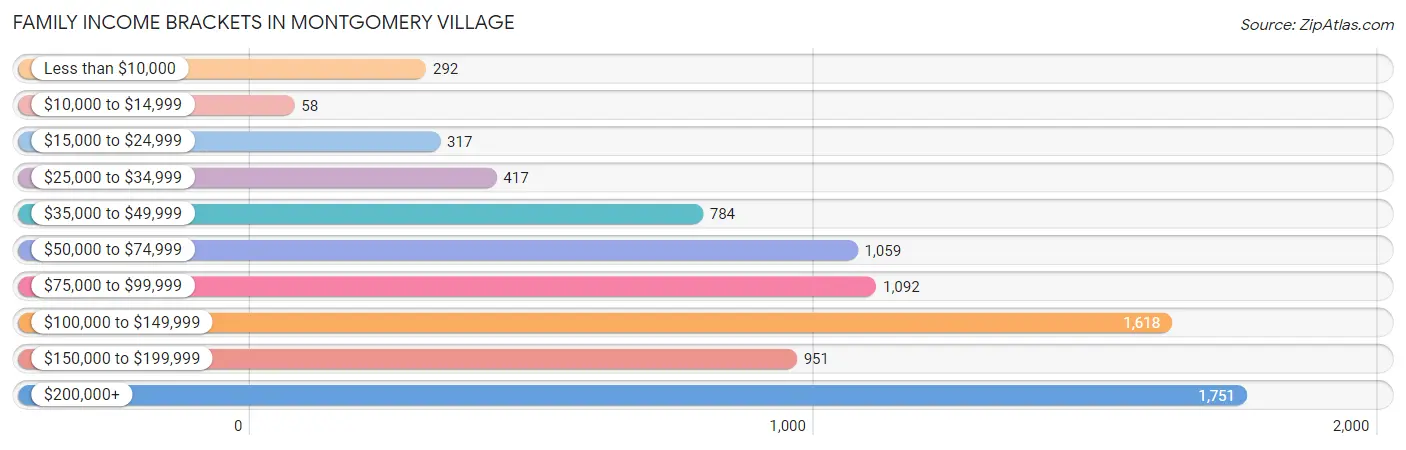
| Income Bracket | # Families | % Families |
| Less than $10,000 | 292 | 3.5% |
| $10,000 to $14,999 | 58 | 0.7% |
| $15,000 to $24,999 | 317 | 3.8% |
| $25,000 to $34,999 | 417 | 5.0% |
| $35,000 to $49,999 | 784 | 9.4% |
| $50,000 to $74,999 | 1,059 | 12.7% |
| $75,000 to $99,999 | 1,092 | 13.1% |
| $100,000 to $149,999 | 1,618 | 19.4% |
| $150,000 to $199,999 | 951 | 11.4% |
| $200,000+ | 1,751 | 21.0% |
Family Income by Famaliy Size in Montgomery Village
6-person families (283 | 3.4%) account for the highest median family income in Montgomery Village with $198,083 per family, while 2-person families (2,851 | 34.2%) have the highest median income of $52,994 per family member.
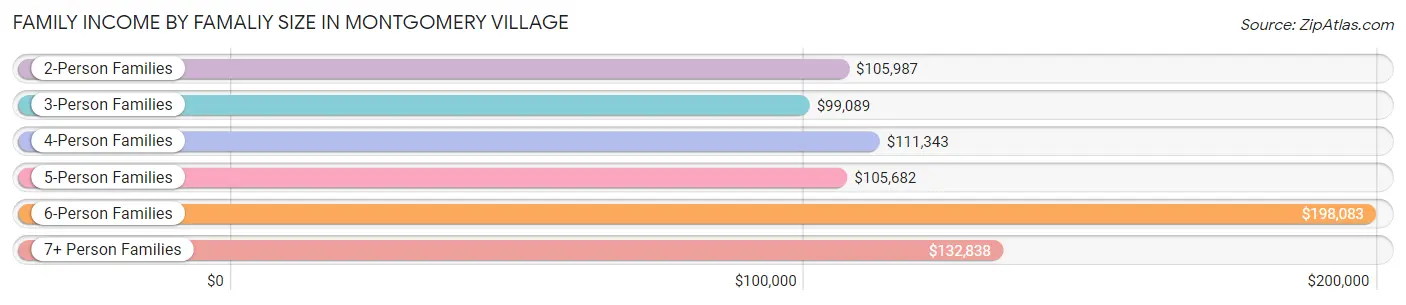
| Income Bracket | # Families | Median Income |
| 2-Person Families | 2,851 (34.2%) | $105,987 |
| 3-Person Families | 2,335 (28.0%) | $99,089 |
| 4-Person Families | 1,827 (21.9%) | $111,343 |
| 5-Person Families | 910 (10.9%) | $105,682 |
| 6-Person Families | 283 (3.4%) | $198,083 |
| 7+ Person Families | 132 (1.6%) | $132,838 |
| Total | 8,338 (100.0%) | $106,741 |
Family Income by Number of Earners in Montgomery Village
The median family income in Montgomery Village is $106,741, with families comprising 3+ earners (1,580) having the highest median family income of $144,123, while families with 1 earner (2,604) have the lowest median family income of $59,000, accounting for 19.0% and 31.2% of families, respectively.
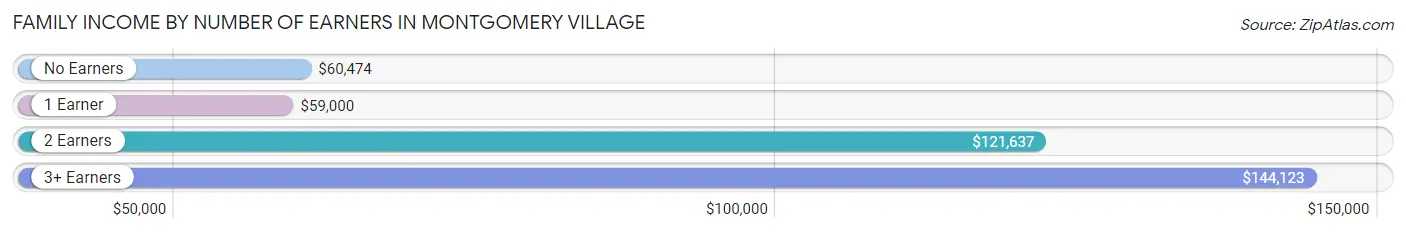
| Number of Earners | # Families | Median Income |
| No Earners | 686 (8.2%) | $60,474 |
| 1 Earner | 2,604 (31.2%) | $59,000 |
| 2 Earners | 3,468 (41.6%) | $121,637 |
| 3+ Earners | 1,580 (19.0%) | $144,123 |
| Total | 8,338 (100.0%) | $106,741 |
Household Income in Montgomery Village
Household Income Brackets in Montgomery Village
With 2,317 households falling in the category, the $100,000 to $149,999 income range is the most frequent in Montgomery Village, accounting for 19.1% of all households. In contrast, only 400 households (3.3%) fall into the $10,000 to $14,999 income bracket, making it the least populous group.
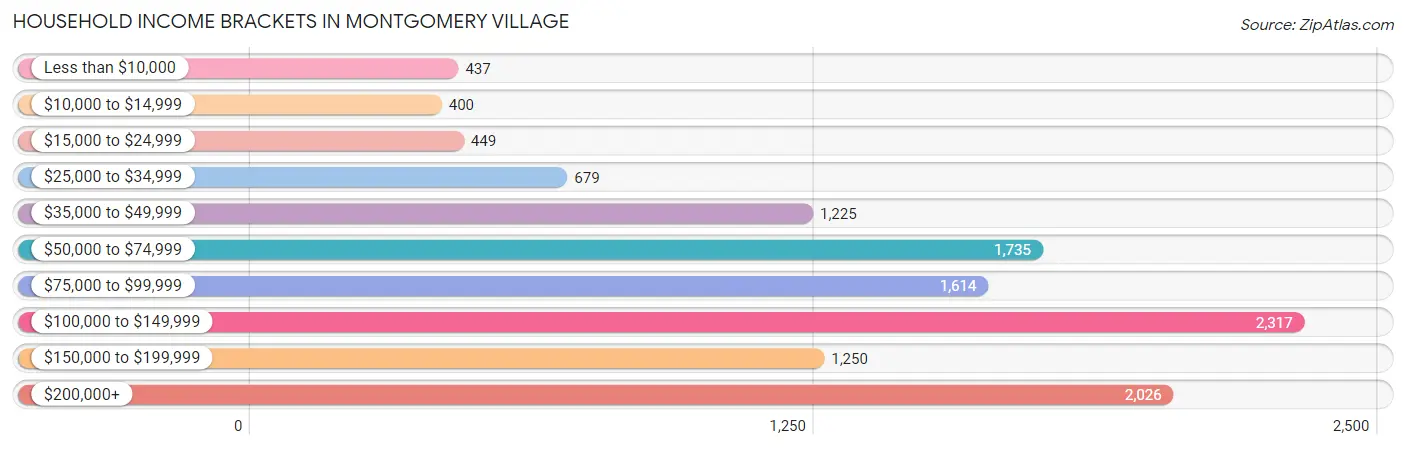
| Income Bracket | # Households | % Households |
| Less than $10,000 | 437 | 3.6% |
| $10,000 to $14,999 | 400 | 3.3% |
| $15,000 to $24,999 | 449 | 3.7% |
| $25,000 to $34,999 | 679 | 5.6% |
| $35,000 to $49,999 | 1,225 | 10.1% |
| $50,000 to $74,999 | 1,735 | 14.3% |
| $75,000 to $99,999 | 1,614 | 13.3% |
| $100,000 to $149,999 | 2,317 | 19.1% |
| $150,000 to $199,999 | 1,250 | 10.3% |
| $200,000+ | 2,026 | 16.7% |
Household Income by Householder Age in Montgomery Village
The median household income in Montgomery Village is $91,703, with the highest median household income of $108,295 found in the 45 to 64 years age bracket for the primary householder. A total of 5,292 households (43.6%) fall into this category. Meanwhile, the 15 to 24 years age bracket for the primary householder has the lowest median household income of $80,046, with 351 households (2.9%) in this group.
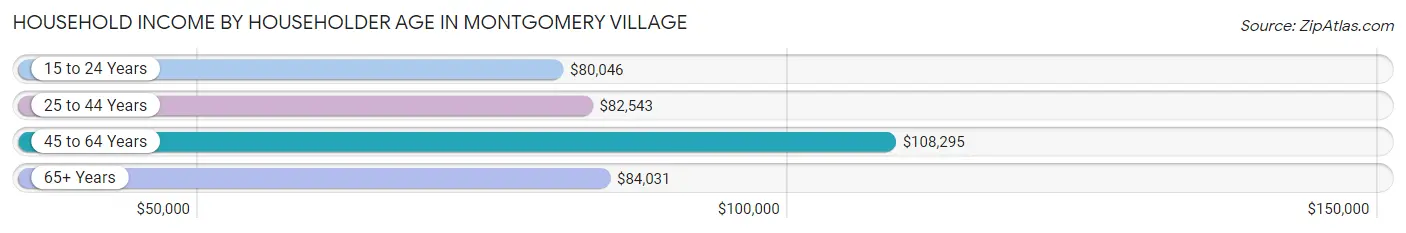
| Income Bracket | # Households | Median Income |
| 15 to 24 Years | 351 (2.9%) | $80,046 |
| 25 to 44 Years | 3,949 (32.6%) | $82,543 |
| 45 to 64 Years | 5,292 (43.6%) | $108,295 |
| 65+ Years | 2,540 (20.9%) | $84,031 |
| Total | 12,132 (100.0%) | $91,703 |
Poverty in Montgomery Village
Income Below Poverty by Sex and Age in Montgomery Village
With 10.0% poverty level for males and 10.8% for females among the residents of Montgomery Village, 6 to 11 year old males and 16 and 17 year old females are the most vulnerable to poverty, with 223 males (19.7%) and 148 females (38.3%) in their respective age groups living below the poverty level.
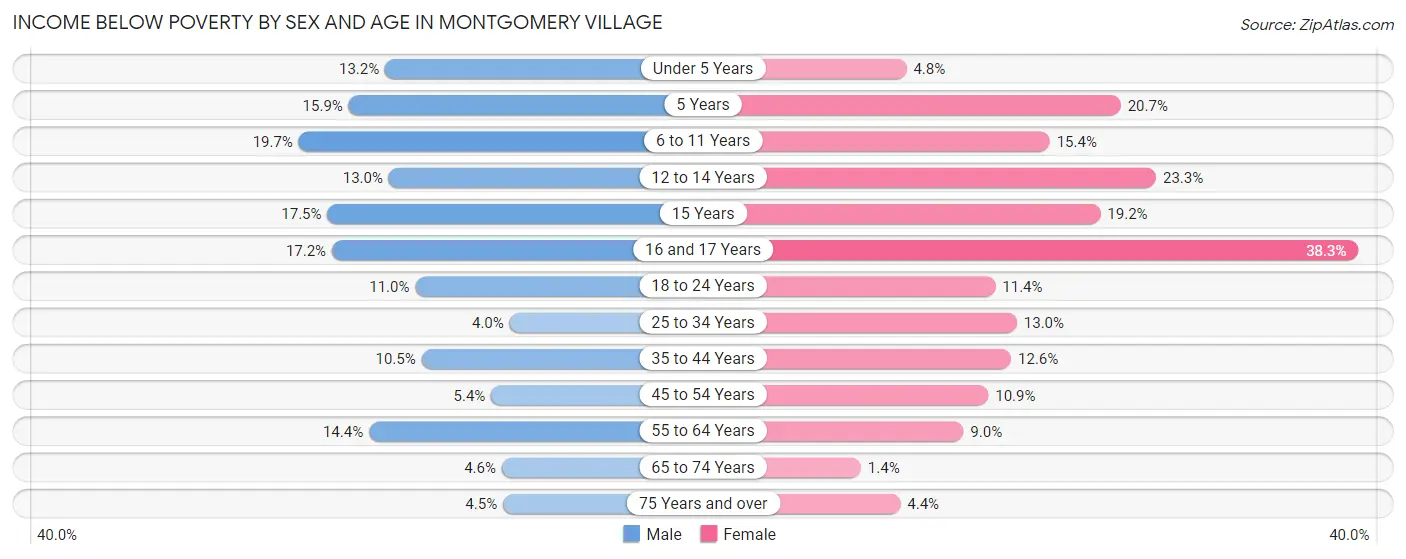
| Age Bracket | Male | Female |
| Under 5 Years | 216 (13.2%) | 74 (4.8%) |
| 5 Years | 22 (15.9%) | 41 (20.7%) |
| 6 to 11 Years | 223 (19.7%) | 191 (15.4%) |
| 12 to 14 Years | 85 (13.0%) | 84 (23.3%) |
| 15 Years | 41 (17.5%) | 43 (19.2%) |
| 16 and 17 Years | 73 (17.2%) | 148 (38.3%) |
| 18 to 24 Years | 197 (11.0%) | 137 (11.4%) |
| 25 to 34 Years | 109 (4.0%) | 313 (13.0%) |
| 35 to 44 Years | 249 (10.5%) | 272 (12.6%) |
| 45 to 54 Years | 122 (5.4%) | 249 (10.9%) |
| 55 to 64 Years | 332 (14.4%) | 210 (9.0%) |
| 65 to 74 Years | 56 (4.6%) | 20 (1.4%) |
| 75 Years and over | 26 (4.5%) | 58 (4.3%) |
| Total | 1,751 (10.0%) | 1,840 (10.8%) |
Income Above Poverty by Sex and Age in Montgomery Village
According to the poverty statistics in Montgomery Village, males aged 25 to 34 years and females aged 65 to 74 years are the age groups that are most secure financially, with 96.0% of males and 98.6% of females in these age groups living above the poverty line.
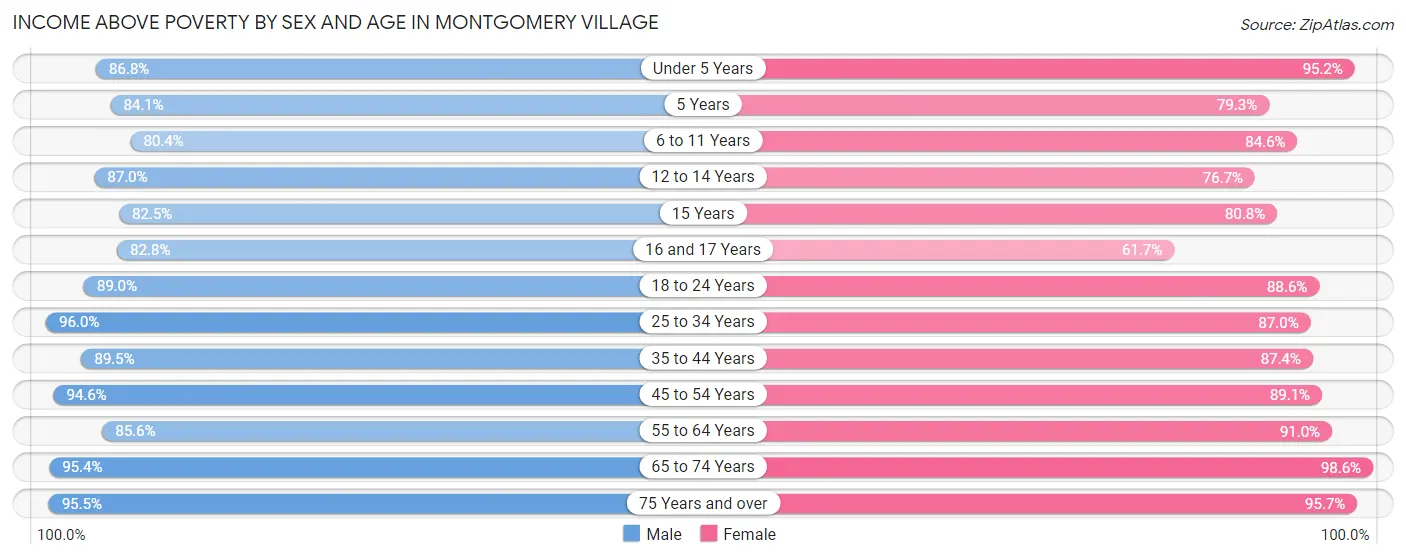
| Age Bracket | Male | Female |
| Under 5 Years | 1,415 (86.8%) | 1,467 (95.2%) |
| 5 Years | 116 (84.1%) | 157 (79.3%) |
| 6 to 11 Years | 912 (80.3%) | 1,046 (84.6%) |
| 12 to 14 Years | 571 (87.0%) | 276 (76.7%) |
| 15 Years | 193 (82.5%) | 181 (80.8%) |
| 16 and 17 Years | 352 (82.8%) | 238 (61.7%) |
| 18 to 24 Years | 1,595 (89.0%) | 1,065 (88.6%) |
| 25 to 34 Years | 2,626 (96.0%) | 2,095 (87.0%) |
| 35 to 44 Years | 2,116 (89.5%) | 1,892 (87.4%) |
| 45 to 54 Years | 2,152 (94.6%) | 2,040 (89.1%) |
| 55 to 64 Years | 1,968 (85.6%) | 2,115 (91.0%) |
| 65 to 74 Years | 1,169 (95.4%) | 1,387 (98.6%) |
| 75 Years and over | 555 (95.5%) | 1,276 (95.7%) |
| Total | 15,740 (90.0%) | 15,235 (89.2%) |
Income Below Poverty Among Married-Couple Families in Montgomery Village
The poverty statistics for married-couple families in Montgomery Village show that 4.3% or 250 of the total 5,889 families live below the poverty line. Families with 3 or 4 children have the highest poverty rate of 30.3%, comprising of 150 families. On the other hand, families with 5 or more children have the lowest poverty rate of 0.0%, which includes 0 families.
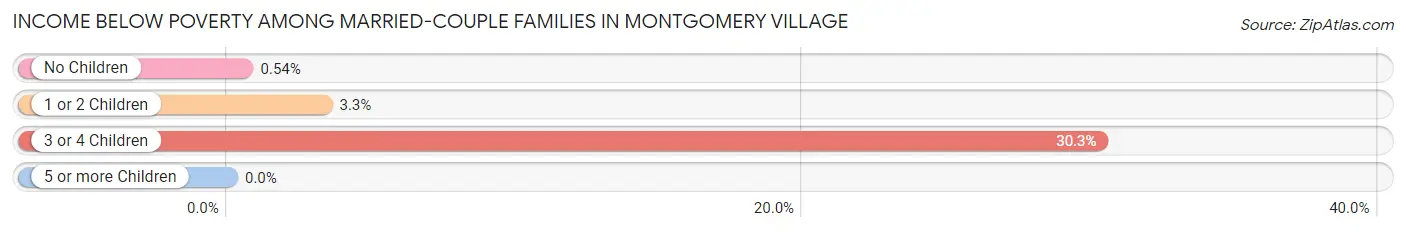
| Children | Above Poverty | Below Poverty |
| No Children | 2,772 (99.5%) | 15 (0.5%) |
| 1 or 2 Children | 2,502 (96.7%) | 85 (3.3%) |
| 3 or 4 Children | 345 (69.7%) | 150 (30.3%) |
| 5 or more Children | 20 (100.0%) | 0 (0.0%) |
| Total | 5,639 (95.8%) | 250 (4.3%) |
Income Below Poverty Among Single-Parent Households in Montgomery Village
According to the poverty data in Montgomery Village, 8.9% or 81 single-father households and 19.4% or 298 single-mother households are living below the poverty line. Among single-father households, those with 3 or 4 children have the highest poverty rate, with 19 households (19.0%) experiencing poverty. Likewise, among single-mother households, those with 3 or 4 children have the highest poverty rate, with 38 households (42.7%) falling below the poverty line.
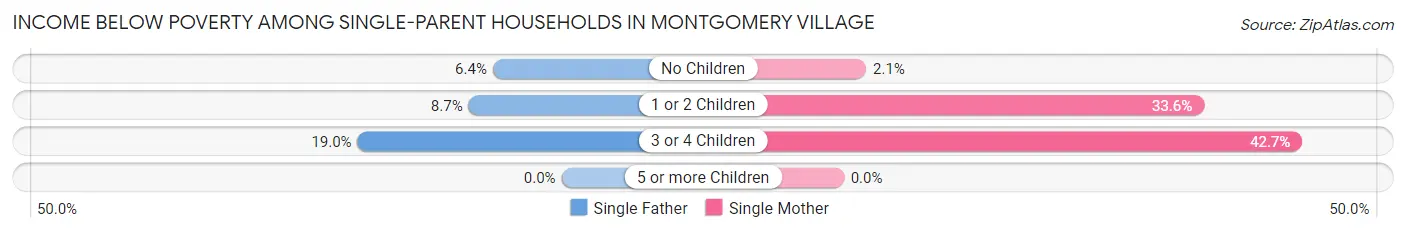
| Children | Single Father | Single Mother |
| No Children | 24 (6.4%) | 15 (2.1%) |
| 1 or 2 Children | 38 (8.7%) | 245 (33.6%) |
| 3 or 4 Children | 19 (19.0%) | 38 (42.7%) |
| 5 or more Children | 0 (0.0%) | 0 (0.0%) |
| Total | 81 (8.9%) | 298 (19.4%) |
Income Below Poverty Among Married-Couple vs Single-Parent Households in Montgomery Village
The poverty data for Montgomery Village shows that 250 of the married-couple family households (4.3%) and 379 of the single-parent households (15.5%) are living below the poverty level. Within the married-couple family households, those with 3 or 4 children have the highest poverty rate, with 150 households (30.3%) falling below the poverty line. Among the single-parent households, those with 3 or 4 children have the highest poverty rate, with 57 household (30.2%) living below poverty.
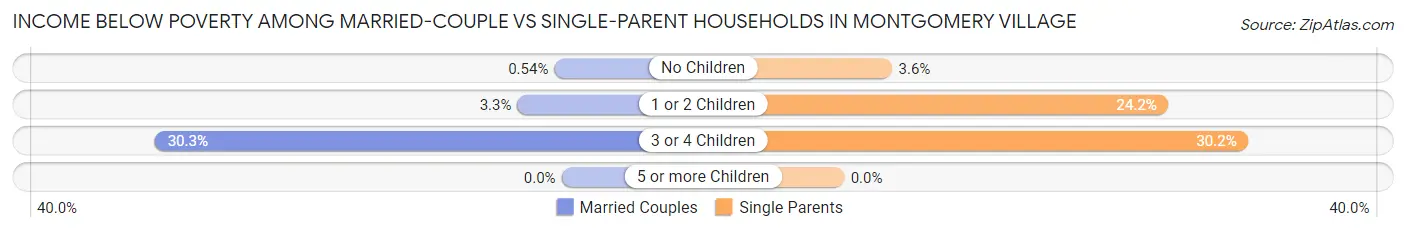
| Children | Married-Couple Families | Single-Parent Households |
| No Children | 15 (0.5%) | 39 (3.6%) |
| 1 or 2 Children | 85 (3.3%) | 283 (24.2%) |
| 3 or 4 Children | 150 (30.3%) | 57 (30.2%) |
| 5 or more Children | 0 (0.0%) | 0 (0.0%) |
| Total | 250 (4.3%) | 379 (15.5%) |
Race in Montgomery Village
The most populous races in Montgomery Village are White / Caucasian (12,594 | 36.2%), Hispanic or Latino (12,078 | 34.8%), and Black / African American (8,094 | 23.3%).
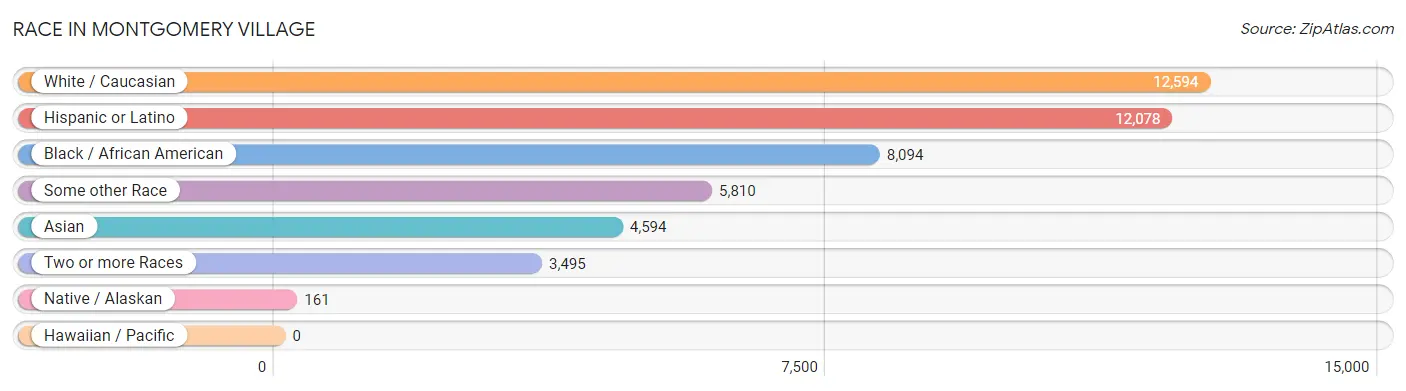
| Race | # Population | % Population |
| Asian | 4,594 | 13.2% |
| Black / African American | 8,094 | 23.3% |
| Hawaiian / Pacific | 0 | 0.0% |
| Hispanic or Latino | 12,078 | 34.8% |
| Native / Alaskan | 161 | 0.5% |
| White / Caucasian | 12,594 | 36.2% |
| Two or more Races | 3,495 | 10.1% |
| Some other Race | 5,810 | 16.7% |
| Total | 34,748 | 100.0% |
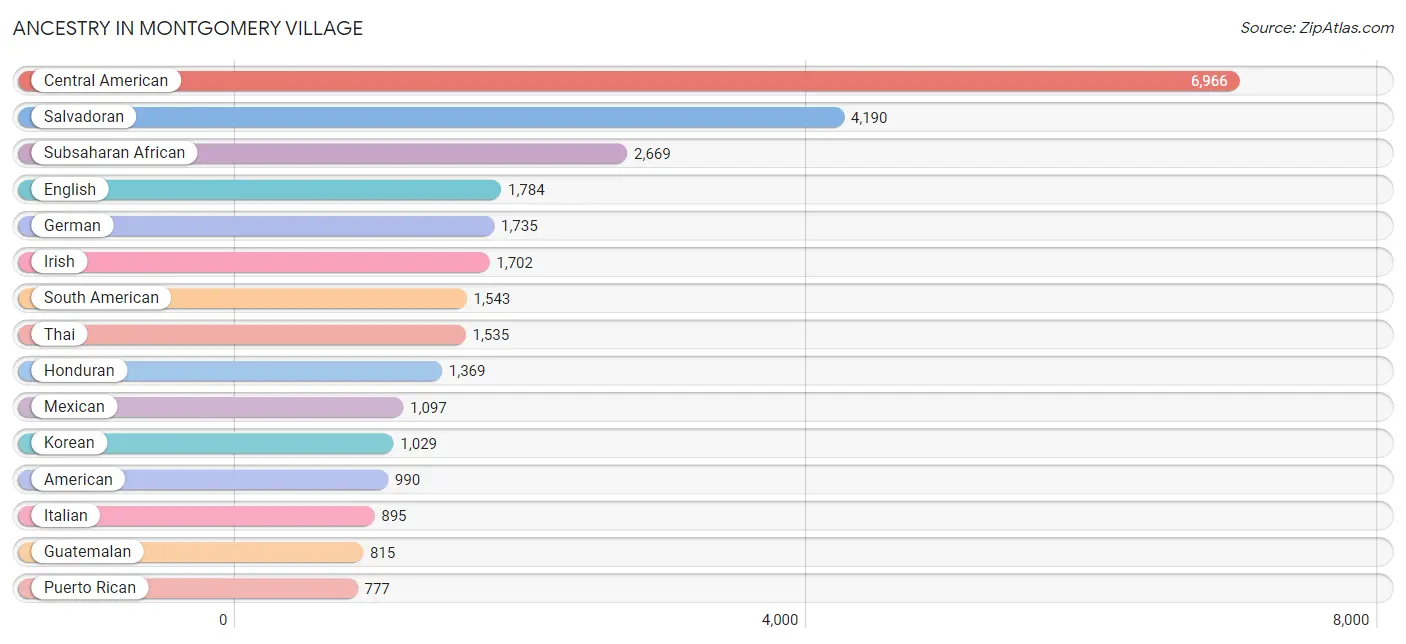
Ancestry in Montgomery Village
The most populous ancestries reported in Montgomery Village are Central American (6,966 | 20.1%), Salvadoran (4,190 | 12.1%), Subsaharan African (2,669 | 7.7%), English (1,784 | 5.1%), and German (1,735 | 5.0%), together accounting for 49.9% of all Montgomery Village residents.
| Ancestry | # Population | % Population |
| African | 764 | 2.2% |
| American | 990 | 2.9% |
| Arab | 414 | 1.2% |
| Argentinean | 37 | 0.1% |
| Armenian | 17 | 0.1% |
| Austrian | 18 | 0.1% |
| Belgian | 69 | 0.2% |
| Bermudan | 9 | 0.0% |
| Bhutanese | 7 | 0.0% |
| Blackfeet | 57 | 0.2% |
| Bolivian | 173 | 0.5% |
| Brazilian | 316 | 0.9% |
| British | 63 | 0.2% |
| British West Indian | 6 | 0.0% |
| Bulgarian | 36 | 0.1% |
| Burmese | 176 | 0.5% |
| Cambodian | 32 | 0.1% |
| Canadian | 28 | 0.1% |
| Cape Verdean | 7 | 0.0% |
| Central American | 6,966 | 20.1% |
| Central American Indian | 104 | 0.3% |
| Cherokee | 125 | 0.4% |
| Chilean | 58 | 0.2% |
| Chippewa | 9 | 0.0% |
| Colombian | 126 | 0.4% |
| Costa Rican | 31 | 0.1% |
| Croatian | 25 | 0.1% |
| Cuban | 236 | 0.7% |
| Czech | 88 | 0.3% |
| Czechoslovakian | 11 | 0.0% |
| Danish | 29 | 0.1% |
| Dominican | 505 | 1.5% |
| Dutch | 118 | 0.3% |
| Eastern European | 340 | 1.0% |
| Ecuadorian | 293 | 0.8% |
| Egyptian | 14 | 0.0% |
| English | 1,784 | 5.1% |
| Ethiopian | 273 | 0.8% |
| European | 92 | 0.3% |
| Filipino | 29 | 0.1% |
| Finnish | 15 | 0.0% |
| French | 379 | 1.1% |
| French Canadian | 56 | 0.2% |
| German | 1,735 | 5.0% |
| Ghanaian | 471 | 1.4% |
| Greek | 98 | 0.3% |
| Guamanian / Chamorro | 3 | 0.0% |
| Guatemalan | 815 | 2.4% |
| Guyanese | 151 | 0.4% |
| Haitian | 145 | 0.4% |
| Honduran | 1,369 | 3.9% |
| Hungarian | 79 | 0.2% |
| Indian (Asian) | 548 | 1.6% |
| Indonesian | 66 | 0.2% |
| Iranian | 155 | 0.4% |
| Irish | 1,702 | 4.9% |
| Iroquois | 25 | 0.1% |
| Israeli | 17 | 0.1% |
| Italian | 895 | 2.6% |
| Jamaican | 277 | 0.8% |
| Japanese | 21 | 0.1% |
| Kenyan | 32 | 0.1% |
| Korean | 1,029 | 3.0% |
| Laotian | 324 | 0.9% |
| Latvian | 10 | 0.0% |
| Lebanese | 88 | 0.3% |
| Liberian | 111 | 0.3% |
| Lithuanian | 49 | 0.1% |
| Luxembourger | 54 | 0.2% |
| Mexican | 1,097 | 3.2% |
| Mexican American Indian | 39 | 0.1% |
| Moroccan | 7 | 0.0% |
| Native Hawaiian | 14 | 0.0% |
| Nicaraguan | 460 | 1.3% |
| Nigerian | 299 | 0.9% |
| Norwegian | 22 | 0.1% |
| Pakistani | 89 | 0.3% |
| Palestinian | 198 | 0.6% |
| Panamanian | 13 | 0.0% |
| Peruvian | 676 | 1.9% |
| Polish | 488 | 1.4% |
| Portuguese | 36 | 0.1% |
| Puerto Rican | 777 | 2.2% |
| Romanian | 40 | 0.1% |
| Russian | 258 | 0.7% |
| Salvadoran | 4,190 | 12.1% |
| Scotch-Irish | 168 | 0.5% |
| Scottish | 275 | 0.8% |
| Senegalese | 238 | 0.7% |
| Serbian | 13 | 0.0% |
| Slovene | 15 | 0.0% |
| South African | 24 | 0.1% |
| South American | 1,543 | 4.4% |
| South American Indian | 17 | 0.1% |
| Spaniard | 99 | 0.3% |
| Spanish | 8 | 0.0% |
| Sri Lankan | 282 | 0.8% |
| Subsaharan African | 2,669 | 7.7% |
| Swedish | 94 | 0.3% |
| Swiss | 44 | 0.1% |
| Syrian | 10 | 0.0% |
| Thai | 1,535 | 4.4% |
| Trinidadian and Tobagonian | 59 | 0.2% |
| Turkish | 18 | 0.1% |
| Ugandan | 11 | 0.0% |
| Ukrainian | 95 | 0.3% |
| Venezuelan | 128 | 0.4% |
| Vietnamese | 217 | 0.6% |
| Welsh | 81 | 0.2% |
| West Indian | 82 | 0.2% | View All 110 Rows |
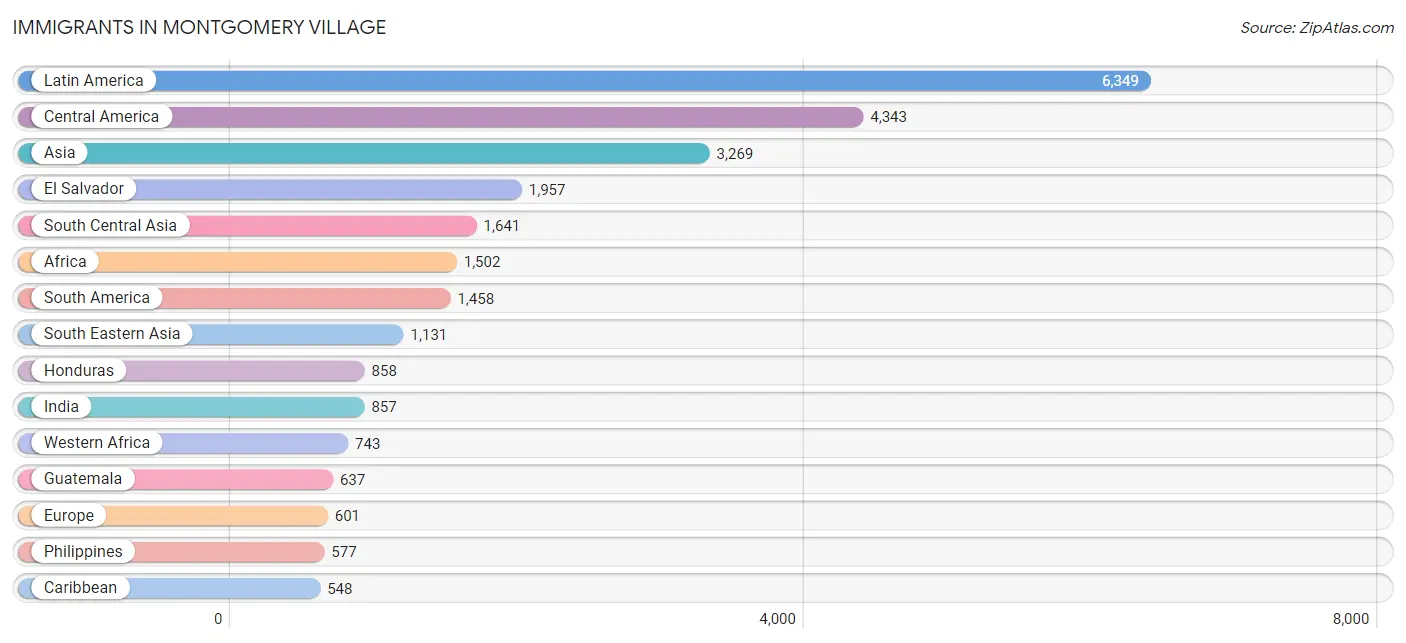
Immigrants in Montgomery Village
The most numerous immigrant groups reported in Montgomery Village came from Latin America (6,349 | 18.3%), Central America (4,343 | 12.5%), Asia (3,269 | 9.4%), El Salvador (1,957 | 5.6%), and South Central Asia (1,641 | 4.7%), together accounting for 50.5% of all Montgomery Village residents.
| Immigration Origin | # Population | % Population |
| Africa | 1,502 | 4.3% |
| Argentina | 26 | 0.1% |
| Armenia | 12 | 0.0% |
| Asia | 3,269 | 9.4% |
| Australia | 7 | 0.0% |
| Bahamas | 12 | 0.0% |
| Bangladesh | 173 | 0.5% |
| Barbados | 19 | 0.1% |
| Bolivia | 167 | 0.5% |
| Brazil | 194 | 0.6% |
| Bulgaria | 13 | 0.0% |
| Cambodia | 9 | 0.0% |
| Cameroon | 305 | 0.9% |
| Canada | 17 | 0.1% |
| Caribbean | 548 | 1.6% |
| Central America | 4,343 | 12.5% |
| Chile | 63 | 0.2% |
| China | 259 | 0.7% |
| Colombia | 146 | 0.4% |
| Costa Rica | 37 | 0.1% |
| Cuba | 90 | 0.3% |
| Czechoslovakia | 9 | 0.0% |
| Denmark | 7 | 0.0% |
| Dominican Republic | 106 | 0.3% |
| Eastern Africa | 270 | 0.8% |
| Eastern Asia | 371 | 1.1% |
| Eastern Europe | 266 | 0.8% |
| Ecuador | 203 | 0.6% |
| Egypt | 15 | 0.0% |
| El Salvador | 1,957 | 5.6% |
| England | 17 | 0.1% |
| Ethiopia | 168 | 0.5% |
| Europe | 601 | 1.7% |
| France | 135 | 0.4% |
| Germany | 44 | 0.1% |
| Ghana | 256 | 0.7% |
| Greece | 5 | 0.0% |
| Guatemala | 637 | 1.8% |
| Guyana | 107 | 0.3% |
| Haiti | 17 | 0.1% |
| Honduras | 858 | 2.5% |
| Hong Kong | 10 | 0.0% |
| Hungary | 7 | 0.0% |
| India | 857 | 2.5% |
| Indonesia | 240 | 0.7% |
| Iran | 131 | 0.4% |
| Iraq | 28 | 0.1% |
| Ireland | 12 | 0.0% |
| Israel | 9 | 0.0% |
| Italy | 87 | 0.3% |
| Jamaica | 194 | 0.6% |
| Kazakhstan | 33 | 0.1% |
| Kenya | 40 | 0.1% |
| Korea | 91 | 0.3% |
| Latin America | 6,349 | 18.3% |
| Lebanon | 10 | 0.0% |
| Malaysia | 10 | 0.0% |
| Mexico | 407 | 1.2% |
| Middle Africa | 344 | 1.0% |
| Moldova | 26 | 0.1% |
| Morocco | 7 | 0.0% |
| Nepal | 117 | 0.3% |
| Netherlands | 8 | 0.0% |
| Nicaragua | 363 | 1.0% |
| Nigeria | 151 | 0.4% |
| Northern Africa | 22 | 0.1% |
| Northern Europe | 36 | 0.1% |
| Oceania | 7 | 0.0% |
| Pakistan | 197 | 0.6% |
| Peru | 437 | 1.3% |
| Philippines | 577 | 1.7% |
| Poland | 30 | 0.1% |
| Portugal | 20 | 0.1% |
| Romania | 7 | 0.0% |
| Russia | 39 | 0.1% |
| Saudi Arabia | 29 | 0.1% |
| Senegal | 43 | 0.1% |
| Serbia | 65 | 0.2% |
| Sierra Leone | 129 | 0.4% |
| South Africa | 32 | 0.1% |
| South America | 1,458 | 4.2% |
| South Central Asia | 1,641 | 4.7% |
| South Eastern Asia | 1,131 | 3.3% |
| Southern Europe | 112 | 0.3% |
| Sri Lanka | 129 | 0.4% |
| Syria | 9 | 0.0% |
| Taiwan | 29 | 0.1% |
| Thailand | 51 | 0.2% |
| Trinidad and Tobago | 69 | 0.2% |
| Turkey | 8 | 0.0% |
| Uganda | 20 | 0.1% |
| Ukraine | 31 | 0.1% |
| Venezuela | 115 | 0.3% |
| Vietnam | 178 | 0.5% |
| West Indies | 38 | 0.1% |
| Western Africa | 743 | 2.1% |
| Western Asia | 126 | 0.4% |
| Western Europe | 187 | 0.5% |
| Zaire | 39 | 0.1% | View All 99 Rows |
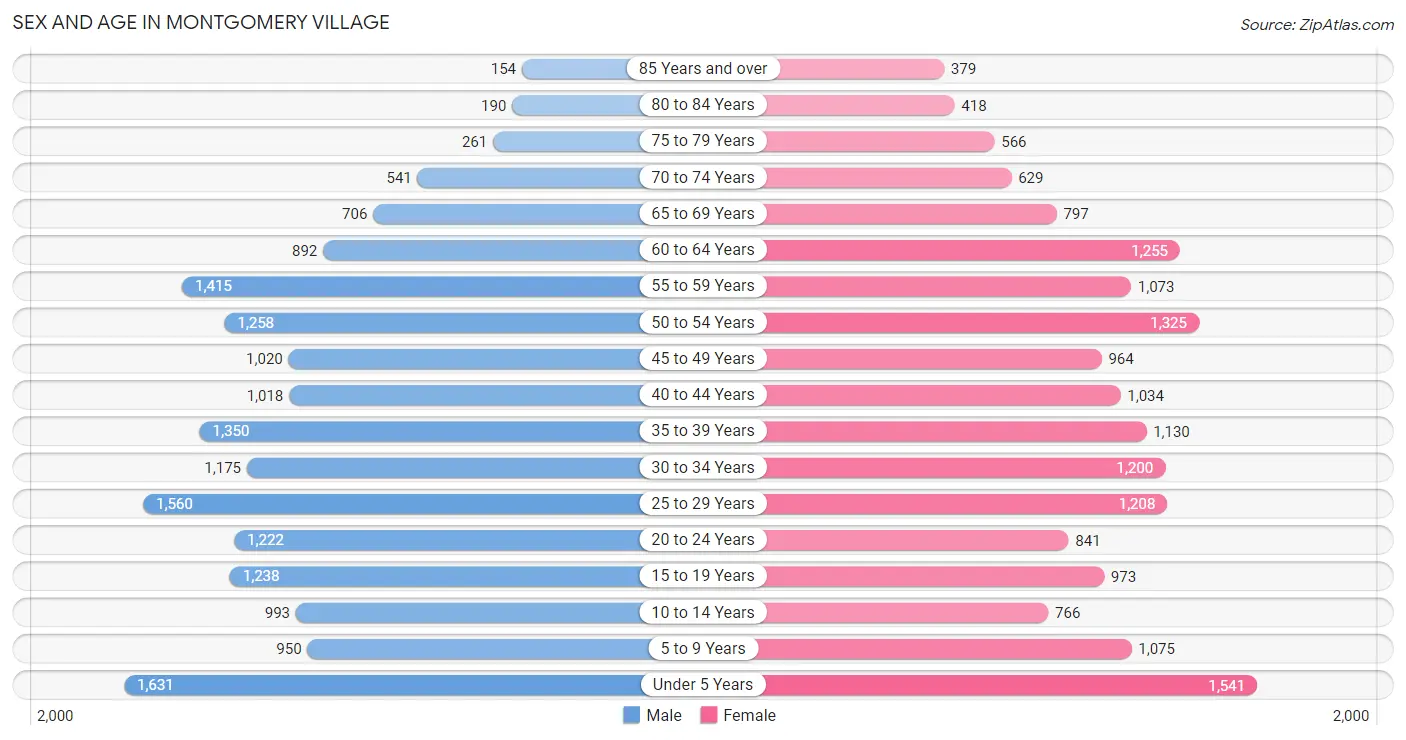
Sex and Age in Montgomery Village
Sex and Age in Montgomery Village
The most populous age groups in Montgomery Village are Under 5 Years (1,631 | 9.3%) for men and Under 5 Years (1,541 | 9.0%) for women.
| Age Bracket | Male | Female |
| Under 5 Years | 1,631 (9.3%) | 1,541 (9.0%) |
| 5 to 9 Years | 950 (5.4%) | 1,075 (6.3%) |
| 10 to 14 Years | 993 (5.7%) | 766 (4.5%) |
| 15 to 19 Years | 1,238 (7.0%) | 973 (5.7%) |
| 20 to 24 Years | 1,222 (7.0%) | 841 (4.9%) |
| 25 to 29 Years | 1,560 (8.9%) | 1,208 (7.0%) |
| 30 to 34 Years | 1,175 (6.7%) | 1,200 (7.0%) |
| 35 to 39 Years | 1,350 (7.7%) | 1,130 (6.6%) |
| 40 to 44 Years | 1,018 (5.8%) | 1,034 (6.0%) |
| 45 to 49 Years | 1,020 (5.8%) | 964 (5.6%) |
| 50 to 54 Years | 1,258 (7.2%) | 1,325 (7.7%) |
| 55 to 59 Years | 1,415 (8.1%) | 1,073 (6.2%) |
| 60 to 64 Years | 892 (5.1%) | 1,255 (7.3%) |
| 65 to 69 Years | 706 (4.0%) | 797 (4.6%) |
| 70 to 74 Years | 541 (3.1%) | 629 (3.7%) |
| 75 to 79 Years | 261 (1.5%) | 566 (3.3%) |
| 80 to 84 Years | 190 (1.1%) | 418 (2.4%) |
| 85 Years and over | 154 (0.9%) | 379 (2.2%) |
| Total | 17,574 (100.0%) | 17,174 (100.0%) |
Families and Households in Montgomery Village
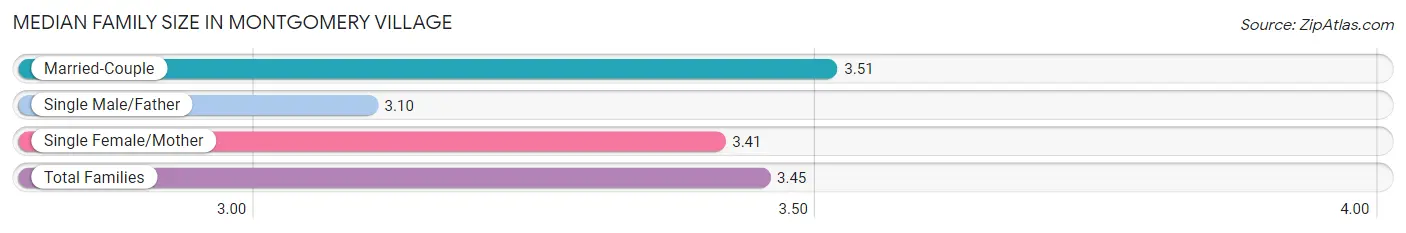
Median Family Size in Montgomery Village
The median family size in Montgomery Village is 3.45 persons per family, with married-couple families (5,889 | 70.6%) accounting for the largest median family size of 3.51 persons per family. On the other hand, single male/father families (914 | 11.0%) represent the smallest median family size with 3.10 persons per family.
| Family Type | # Families | Family Size |
| Married-Couple | 5,889 (70.6%) | 3.51 |
| Single Male/Father | 914 (11.0%) | 3.10 |
| Single Female/Mother | 1,535 (18.4%) | 3.41 |
| Total Families | 8,338 (100.0%) | 3.45 |
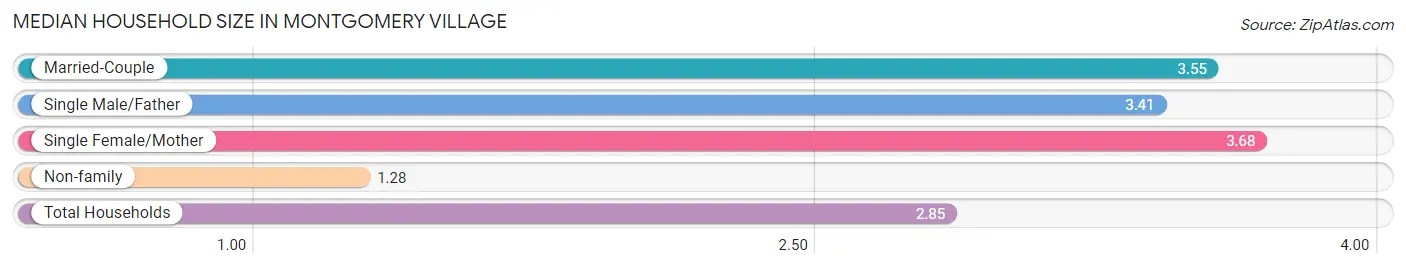
Median Household Size in Montgomery Village
The median household size in Montgomery Village is 2.85 persons per household, with single female/mother households (1,535 | 12.7%) accounting for the largest median household size of 3.68 persons per household. non-family households (3,794 | 31.3%) represent the smallest median household size with 1.28 persons per household.
| Household Type | # Households | Household Size |
| Married-Couple | 5,889 (48.5%) | 3.55 |
| Single Male/Father | 914 (7.5%) | 3.41 |
| Single Female/Mother | 1,535 (12.7%) | 3.68 |
| Non-family | 3,794 (31.3%) | 1.28 |
| Total Households | 12,132 (100.0%) | 2.85 |
Household Size by Marriage Status in Montgomery Village
Out of a total of 12,132 households in Montgomery Village, 8,338 (68.7%) are family households, while 3,794 (31.3%) are nonfamily households. The most numerous type of family households are 2-person households, comprising 2,609, and the most common type of nonfamily households are 1-person households, comprising 3,073.
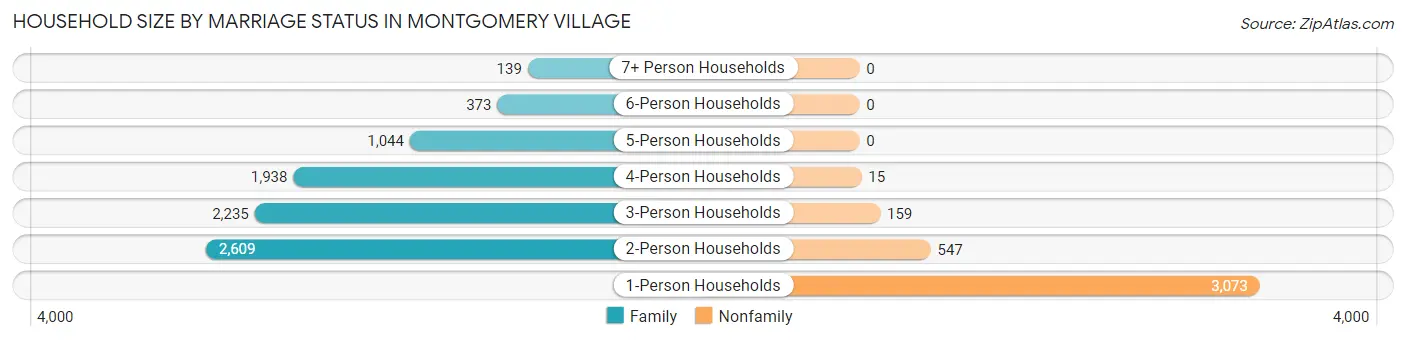
| Household Size | Family Households | Nonfamily Households |
| 1-Person Households | - | 3,073 (25.3%) |
| 2-Person Households | 2,609 (21.5%) | 547 (4.5%) |
| 3-Person Households | 2,235 (18.4%) | 159 (1.3%) |
| 4-Person Households | 1,938 (16.0%) | 15 (0.1%) |
| 5-Person Households | 1,044 (8.6%) | 0 (0.0%) |
| 6-Person Households | 373 (3.1%) | 0 (0.0%) |
| 7+ Person Households | 139 (1.1%) | 0 (0.0%) |
| Total | 8,338 (68.7%) | 3,794 (31.3%) |
Female Fertility in Montgomery Village
Fertility by Age in Montgomery Village
Average fertility rate in Montgomery Village is 74.0 births per 1,000 women. Women in the age bracket of 20 to 34 years have the highest fertility rate with 116.0 births per 1,000 women. Women in the age bracket of 20 to 34 years acount for 67.1% of all women with births.
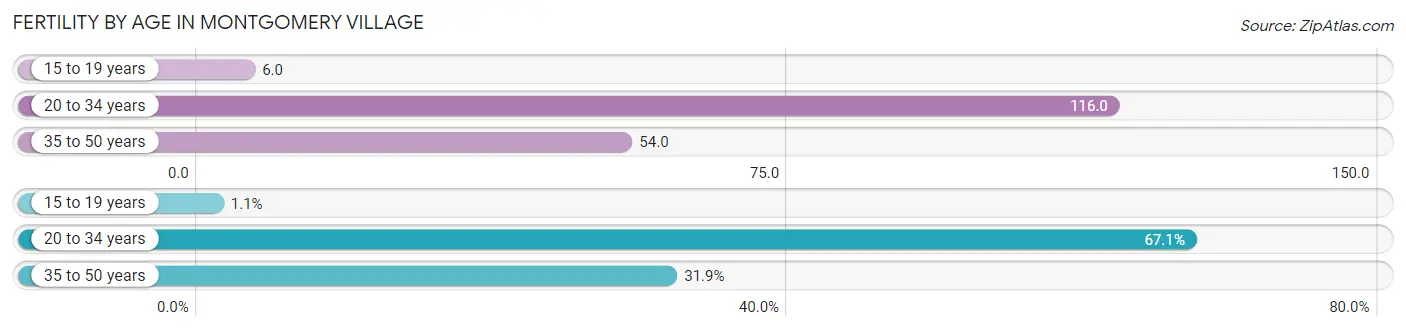
| Age Bracket | Women with Births | Births / 1,000 Women |
| 15 to 19 years | 6 (1.1%) | 6.0 |
| 20 to 34 years | 377 (67.1%) | 116.0 |
| 35 to 50 years | 179 (31.9%) | 54.0 |
| Total | 562 (100.0%) | 74.0 |
Fertility by Age by Marriage Status in Montgomery Village
78.5% of women with births (562) in Montgomery Village are married. The highest percentage of unmarried women with births falls into 20 to 34 years age bracket with 32.1% of them unmarried at the time of birth, while the lowest percentage of unmarried women with births belong to 15 to 19 years age bracket with 0.0% of them unmarried.
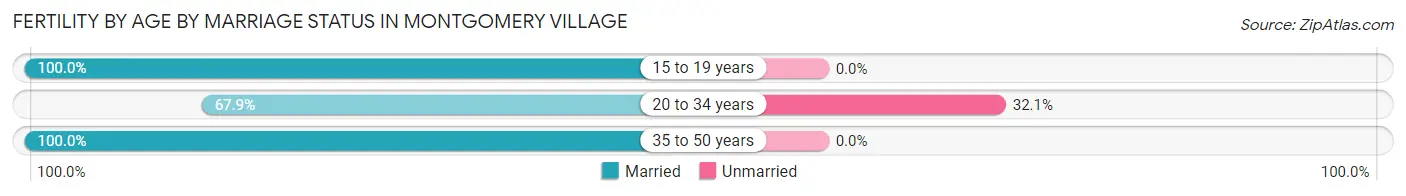
| Age Bracket | Married | Unmarried |
| 15 to 19 years | 6 (100.0%) | 0 (0.0%) |
| 20 to 34 years | 256 (67.9%) | 121 (32.1%) |
| 35 to 50 years | 179 (100.0%) | 0 (0.0%) |
| Total | 441 (78.5%) | 121 (21.5%) |
Fertility by Education in Montgomery Village
Average fertility rate in Montgomery Village is 74.0 births per 1,000 women. Women with the education attainment of graduate degree have the highest fertility rate of 125.0 births per 1,000 women, while women with the education attainment of bachelor's degree have the lowest fertility at 57.0 births per 1,000 women. Women with the education attainment of less than high school represent 25.1% of all women with births.
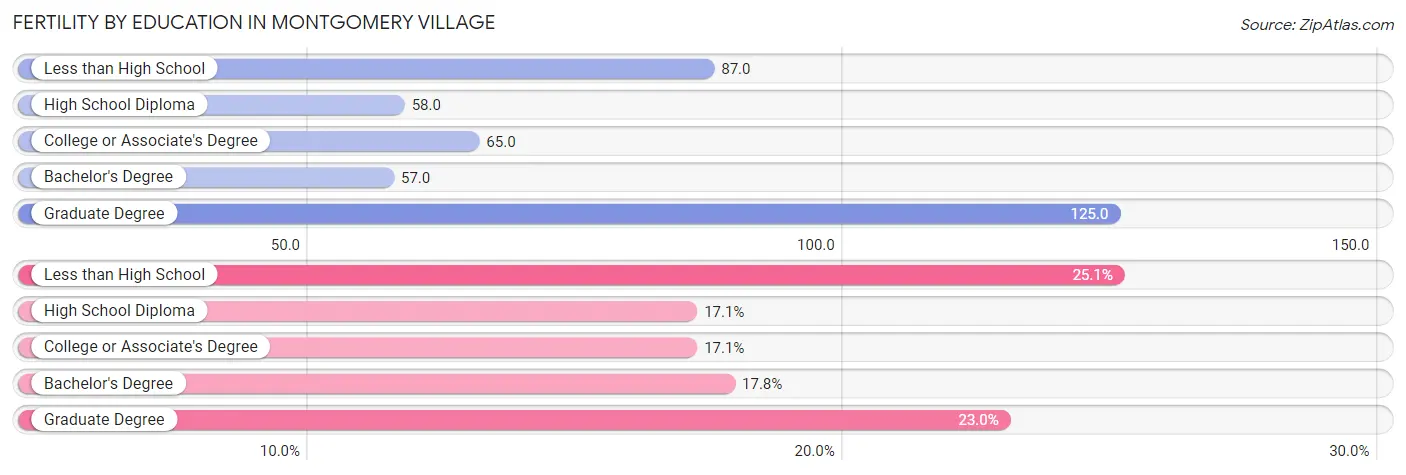
| Educational Attainment | Women with Births | Births / 1,000 Women |
| Less than High School | 141 (25.1%) | 87.0 |
| High School Diploma | 96 (17.1%) | 58.0 |
| College or Associate's Degree | 96 (17.1%) | 65.0 |
| Bachelor's Degree | 100 (17.8%) | 57.0 |
| Graduate Degree | 129 (23.0%) | 125.0 |
| Total | 562 (100.0%) | 74.0 |
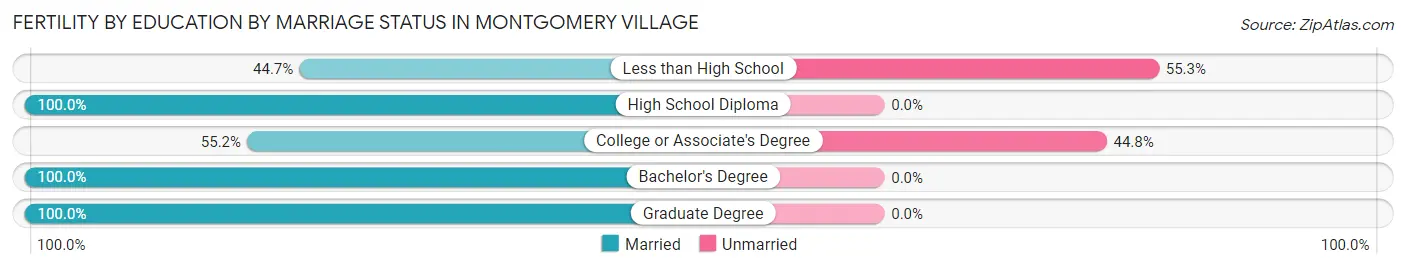
Fertility by Education by Marriage Status in Montgomery Village
21.5% of women with births in Montgomery Village are unmarried. Women with the educational attainment of high school diploma are most likely to be married with 100.0% of them married at childbirth, while women with the educational attainment of less than high school are least likely to be married with 55.3% of them unmarried at childbirth.
| Educational Attainment | Married | Unmarried |
| Less than High School | 63 (44.7%) | 78 (55.3%) |
| High School Diploma | 96 (100.0%) | 0 (0.0%) |
| College or Associate's Degree | 53 (55.2%) | 43 (44.8%) |
| Bachelor's Degree | 100 (100.0%) | 0 (0.0%) |
| Graduate Degree | 129 (100.0%) | 0 (0.0%) |
| Total | 441 (78.5%) | 121 (21.5%) |
Employment Characteristics in Montgomery Village
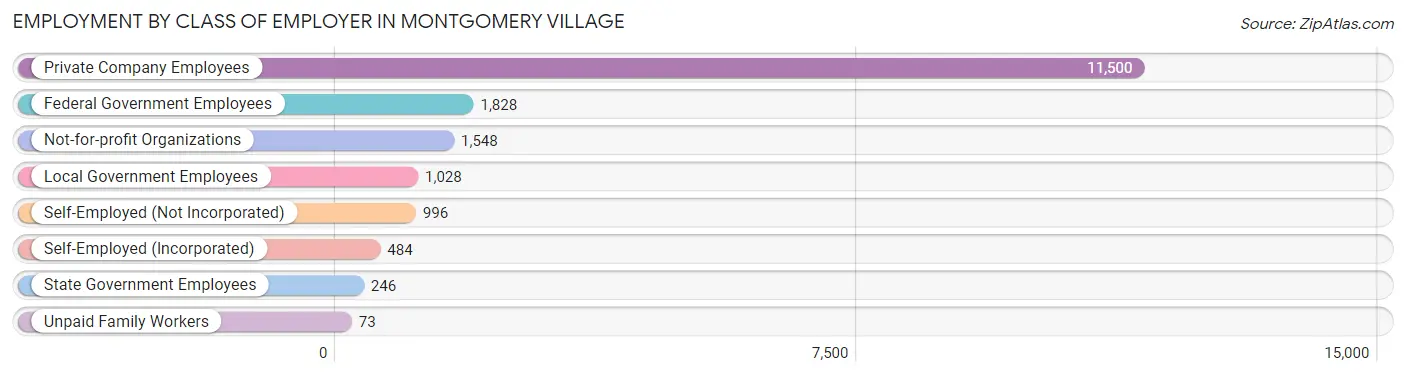
Employment by Class of Employer in Montgomery Village
Among the 17,703 employed individuals in Montgomery Village, private company employees (11,500 | 65.0%), federal government employees (1,828 | 10.3%), and not-for-profit organizations (1,548 | 8.7%) make up the most common classes of employment.
| Employer Class | # Employees | % Employees |
| Private Company Employees | 11,500 | 65.0% |
| Self-Employed (Incorporated) | 484 | 2.7% |
| Self-Employed (Not Incorporated) | 996 | 5.6% |
| Not-for-profit Organizations | 1,548 | 8.7% |
| Local Government Employees | 1,028 | 5.8% |
| State Government Employees | 246 | 1.4% |
| Federal Government Employees | 1,828 | 10.3% |
| Unpaid Family Workers | 73 | 0.4% |
| Total | 17,703 | 100.0% |
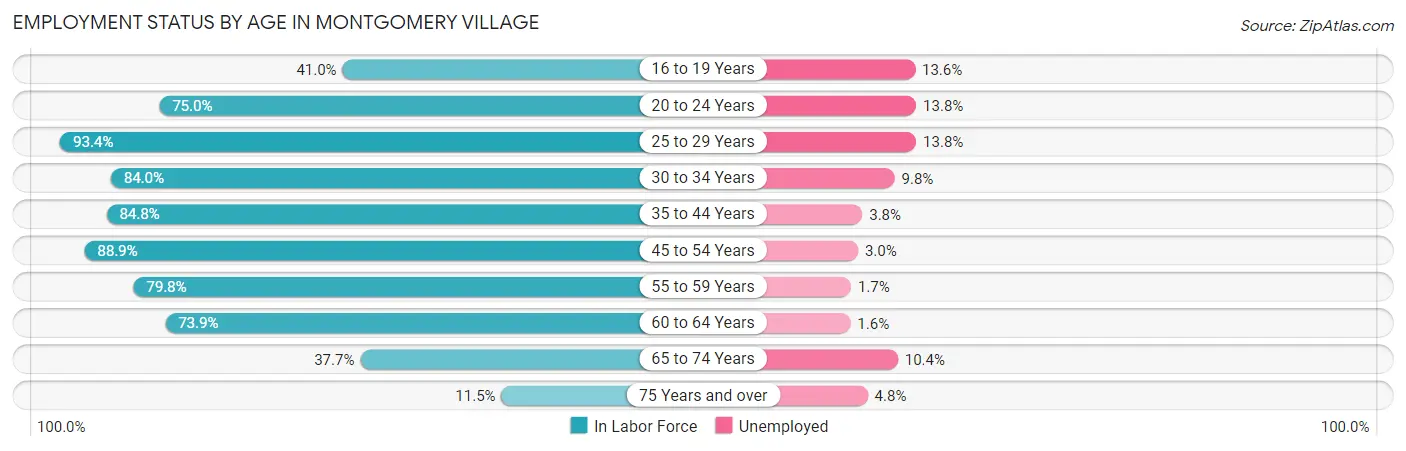
Employment Status by Age in Montgomery Village
According to the labor force statistics for Montgomery Village, out of the total population over 16 years of age (27,334), 71.6% or 19,571 individuals are in the labor force, with 6.7% or 1,311 of them unemployed. The age group with the highest labor force participation rate is 25 to 29 years, with 93.4% or 2,585 individuals in the labor force. Within the labor force, the 20 to 24 years age range has the highest percentage of unemployed individuals, with 13.8% or 213 of them being unemployed.
| Age Bracket | In Labor Force | Unemployed |
| 16 to 19 Years | 719 (41.0%) | 98 (13.6%) |
| 20 to 24 Years | 1,547 (75.0%) | 213 (13.8%) |
| 25 to 29 Years | 2,585 (93.4%) | 357 (13.8%) |
| 30 to 34 Years | 1,995 (84.0%) | 196 (9.8%) |
| 35 to 44 Years | 3,843 (84.8%) | 146 (3.8%) |
| 45 to 54 Years | 4,060 (88.9%) | 122 (3.0%) |
| 55 to 59 Years | 1,985 (79.8%) | 34 (1.7%) |
| 60 to 64 Years | 1,587 (73.9%) | 25 (1.6%) |
| 65 to 74 Years | 1,008 (37.7%) | 105 (10.4%) |
| 75 Years and over | 226 (11.5%) | 11 (4.8%) |
| Total | 19,571 (71.6%) | 1,311 (6.7%) |
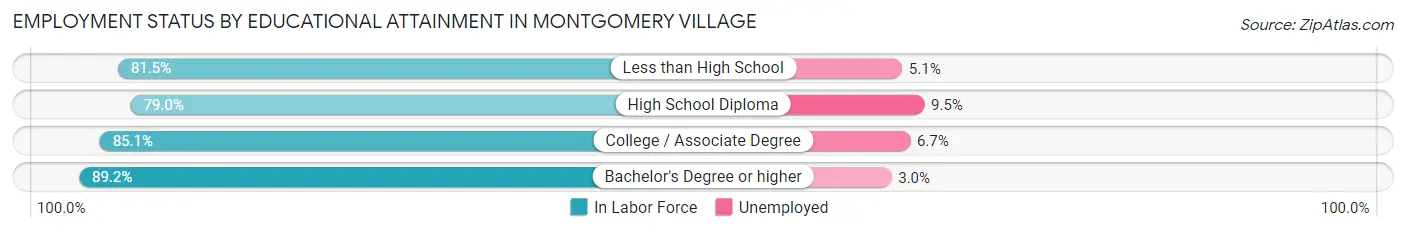
Employment Status by Educational Attainment in Montgomery Village
According to labor force statistics for Montgomery Village, 85.1% of individuals (16,064) out of the total population between 25 and 64 years of age (18,877) are in the labor force, with 5.5% or 884 of them being unemployed. The group with the highest labor force participation rate are those with the educational attainment of bachelor's degree or higher, with 89.2% or 6,842 individuals in the labor force. Within the labor force, individuals with high school diploma education have the highest percentage of unemployment, with 9.5% or 292 of them being unemployed.
| Educational Attainment | In Labor Force | Unemployed |
| Less than High School | 1,985 (81.5%) | 124 (5.1%) |
| High School Diploma | 3,073 (79.0%) | 370 (9.5%) |
| College / Associate Degree | 4,154 (85.1%) | 327 (6.7%) |
| Bachelor's Degree or higher | 6,842 (89.2%) | 230 (3.0%) |
| Total | 16,064 (85.1%) | 1,038 (5.5%) |
Employment Occupations by Sex in Montgomery Village
Management, Business, Science and Arts Occupations
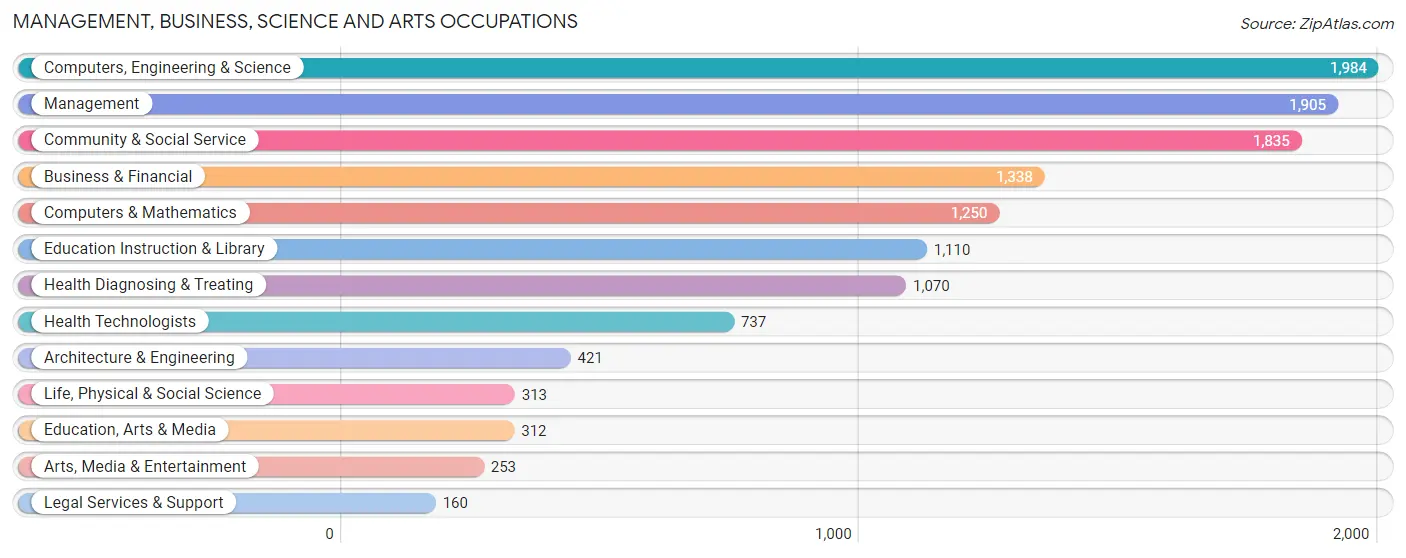
The most common Management, Business, Science and Arts occupations in Montgomery Village are Computers, Engineering & Science (1,984 | 10.9%), Management (1,905 | 10.5%), Community & Social Service (1,835 | 10.1%), Business & Financial (1,338 | 7.4%), and Computers & Mathematics (1,250 | 6.9%).
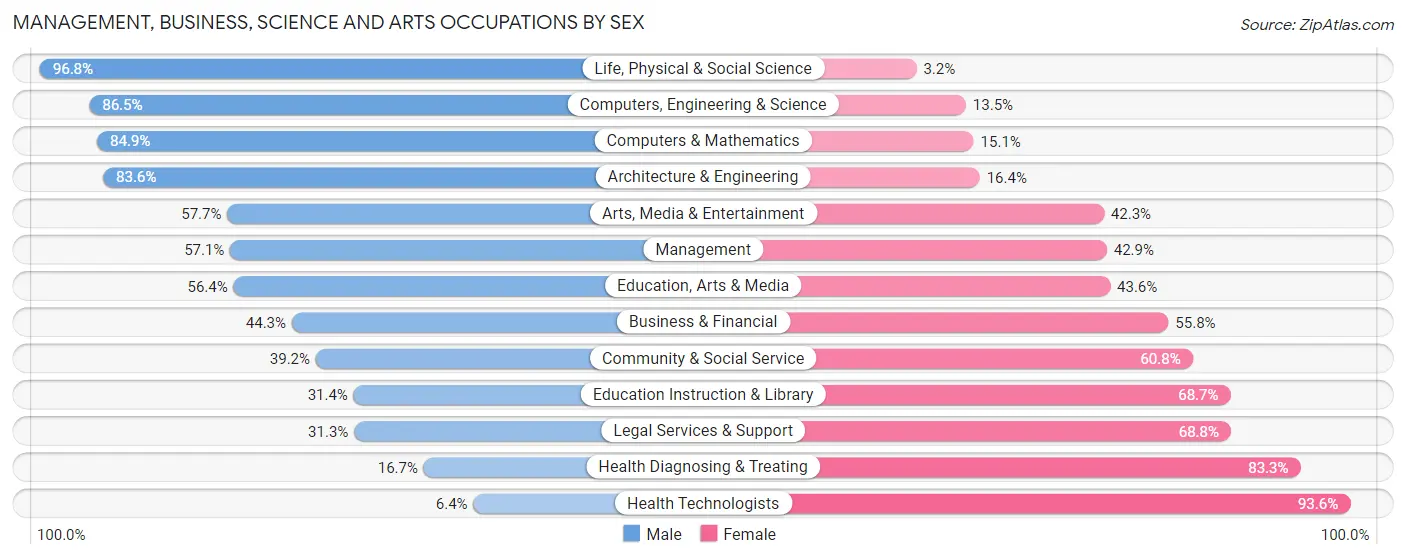
Management, Business, Science and Arts Occupations by Sex
Within the Management, Business, Science and Arts occupations in Montgomery Village, the most male-oriented occupations are Life, Physical & Social Science (96.8%), Computers, Engineering & Science (86.5%), and Computers & Mathematics (84.9%), while the most female-oriented occupations are Health Technologists (93.6%), Health Diagnosing & Treating (83.3%), and Legal Services & Support (68.8%).
| Occupation | Male | Female |
| Management | 1,088 (57.1%) | 817 (42.9%) |
| Business & Financial | 592 (44.3%) | 746 (55.7%) |
| Computers, Engineering & Science | 1,716 (86.5%) | 268 (13.5%) |
| Computers & Mathematics | 1,061 (84.9%) | 189 (15.1%) |
| Architecture & Engineering | 352 (83.6%) | 69 (16.4%) |
| Life, Physical & Social Science | 303 (96.8%) | 10 (3.2%) |
| Community & Social Service | 720 (39.2%) | 1,115 (60.8%) |
| Education, Arts & Media | 176 (56.4%) | 136 (43.6%) |
| Legal Services & Support | 50 (31.2%) | 110 (68.8%) |
| Education Instruction & Library | 348 (31.4%) | 762 (68.6%) |
| Arts, Media & Entertainment | 146 (57.7%) | 107 (42.3%) |
| Health Diagnosing & Treating | 179 (16.7%) | 891 (83.3%) |
| Health Technologists | 47 (6.4%) | 690 (93.6%) |
| Total (Category) | 4,295 (52.8%) | 3,837 (47.2%) |
| Total (Overall) | 9,789 (53.9%) | 8,386 (46.1%) |
Services Occupations
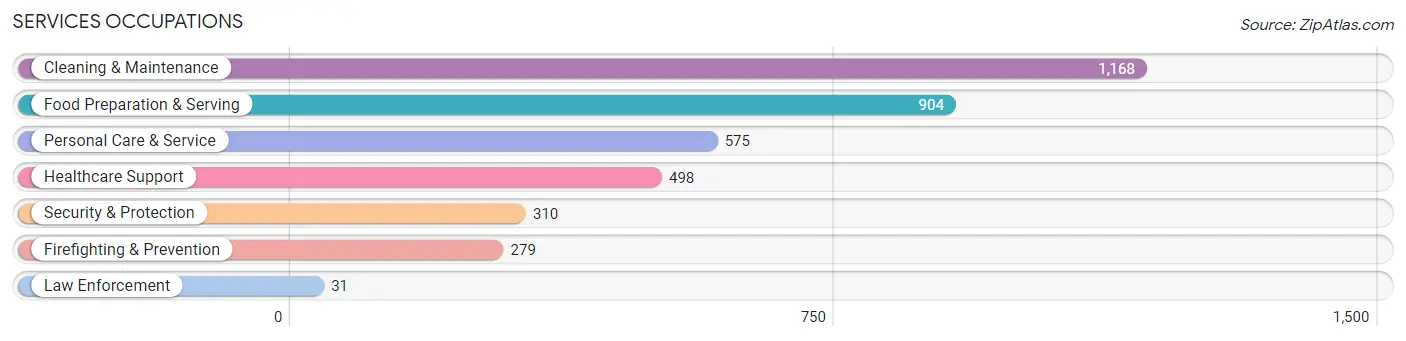
The most common Services occupations in Montgomery Village are Cleaning & Maintenance (1,168 | 6.4%), Food Preparation & Serving (904 | 5.0%), Personal Care & Service (575 | 3.2%), Healthcare Support (498 | 2.7%), and Security & Protection (310 | 1.7%).
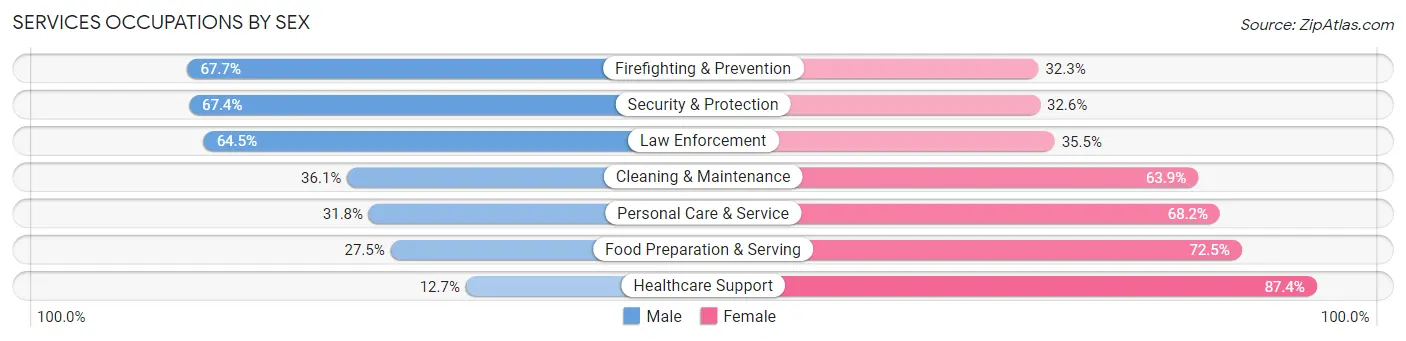
Services Occupations by Sex
Within the Services occupations in Montgomery Village, the most male-oriented occupations are Firefighting & Prevention (67.7%), Security & Protection (67.4%), and Law Enforcement (64.5%), while the most female-oriented occupations are Healthcare Support (87.4%), Food Preparation & Serving (72.5%), and Personal Care & Service (68.2%).
| Occupation | Male | Female |
| Healthcare Support | 63 (12.7%) | 435 (87.4%) |
| Security & Protection | 209 (67.4%) | 101 (32.6%) |
| Firefighting & Prevention | 189 (67.7%) | 90 (32.3%) |
| Law Enforcement | 20 (64.5%) | 11 (35.5%) |
| Food Preparation & Serving | 249 (27.5%) | 655 (72.5%) |
| Cleaning & Maintenance | 422 (36.1%) | 746 (63.9%) |
| Personal Care & Service | 183 (31.8%) | 392 (68.2%) |
| Total (Category) | 1,126 (32.6%) | 2,329 (67.4%) |
| Total (Overall) | 9,789 (53.9%) | 8,386 (46.1%) |
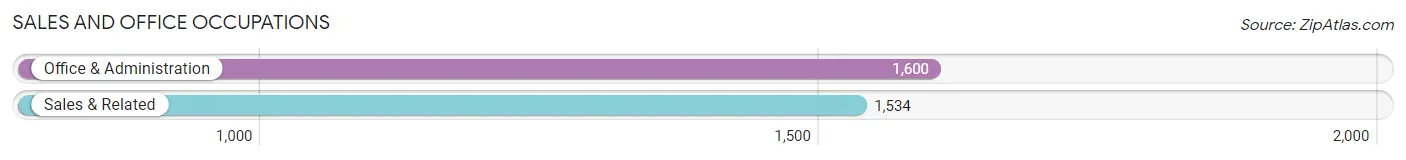
Sales and Office Occupations
The most common Sales and Office occupations in Montgomery Village are Office & Administration (1,600 | 8.8%), and Sales & Related (1,534 | 8.4%).
Sales and Office Occupations by Sex
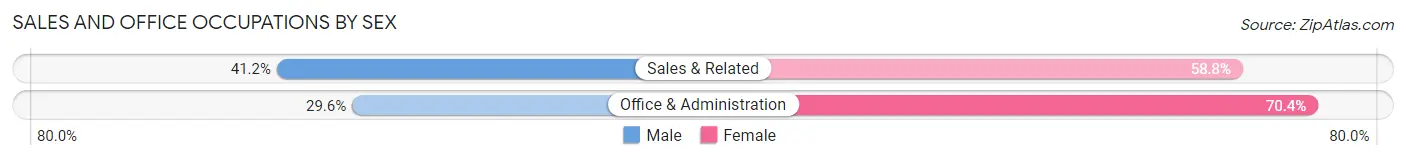
| Occupation | Male | Female |
| Sales & Related | 632 (41.2%) | 902 (58.8%) |
| Office & Administration | 474 (29.6%) | 1,126 (70.4%) |
| Total (Category) | 1,106 (35.3%) | 2,028 (64.7%) |
| Total (Overall) | 9,789 (53.9%) | 8,386 (46.1%) |
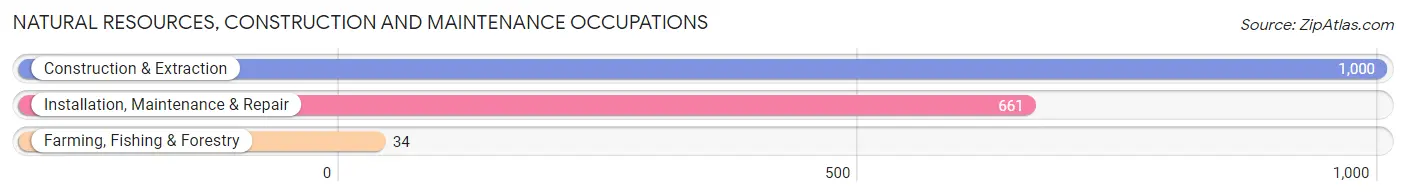
Natural Resources, Construction and Maintenance Occupations
The most common Natural Resources, Construction and Maintenance occupations in Montgomery Village are Construction & Extraction (1,000 | 5.5%), Installation, Maintenance & Repair (661 | 3.6%), and Farming, Fishing & Forestry (34 | 0.2%).
Natural Resources, Construction and Maintenance Occupations by Sex
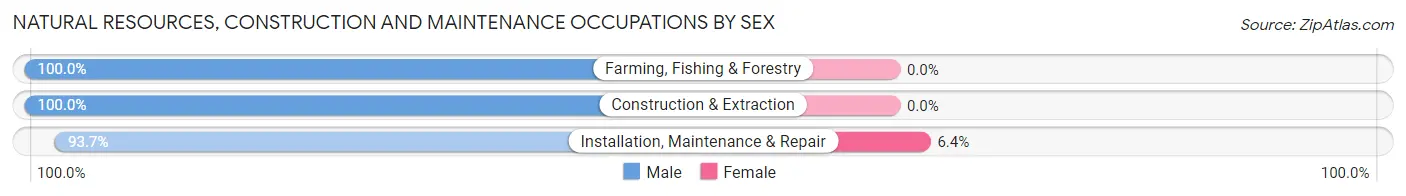
| Occupation | Male | Female |
| Farming, Fishing & Forestry | 34 (100.0%) | 0 (0.0%) |
| Construction & Extraction | 1,000 (100.0%) | 0 (0.0%) |
| Installation, Maintenance & Repair | 619 (93.6%) | 42 (6.4%) |
| Total (Category) | 1,653 (97.5%) | 42 (2.5%) |
| Total (Overall) | 9,789 (53.9%) | 8,386 (46.1%) |
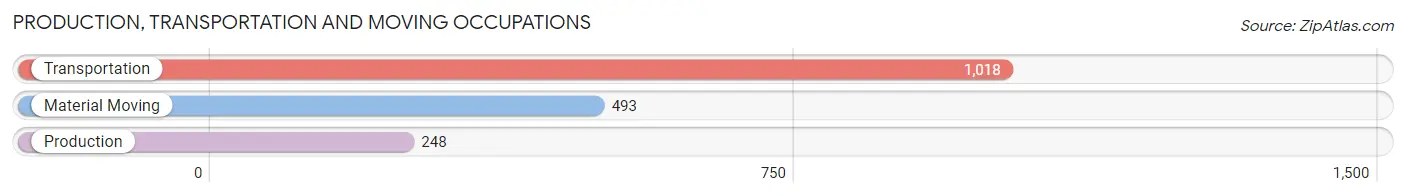
Production, Transportation and Moving Occupations
The most common Production, Transportation and Moving occupations in Montgomery Village are Transportation (1,018 | 5.6%), Material Moving (493 | 2.7%), and Production (248 | 1.4%).
Production, Transportation and Moving Occupations by Sex
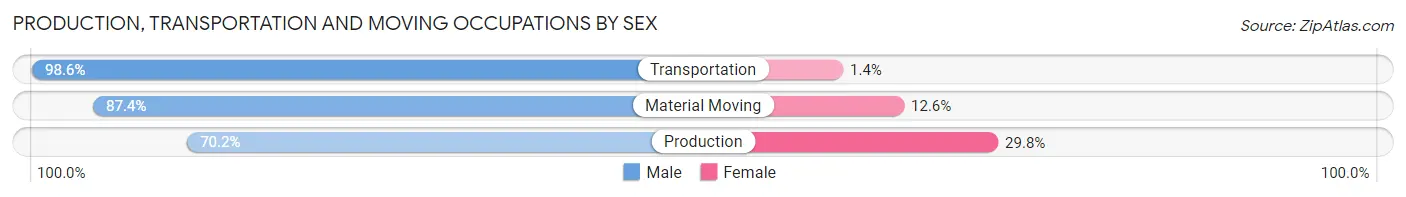
| Occupation | Male | Female |
| Production | 174 (70.2%) | 74 (29.8%) |
| Transportation | 1,004 (98.6%) | 14 (1.4%) |
| Material Moving | 431 (87.4%) | 62 (12.6%) |
| Total (Category) | 1,609 (91.5%) | 150 (8.5%) |
| Total (Overall) | 9,789 (53.9%) | 8,386 (46.1%) |
Employment Industries by Sex in Montgomery Village
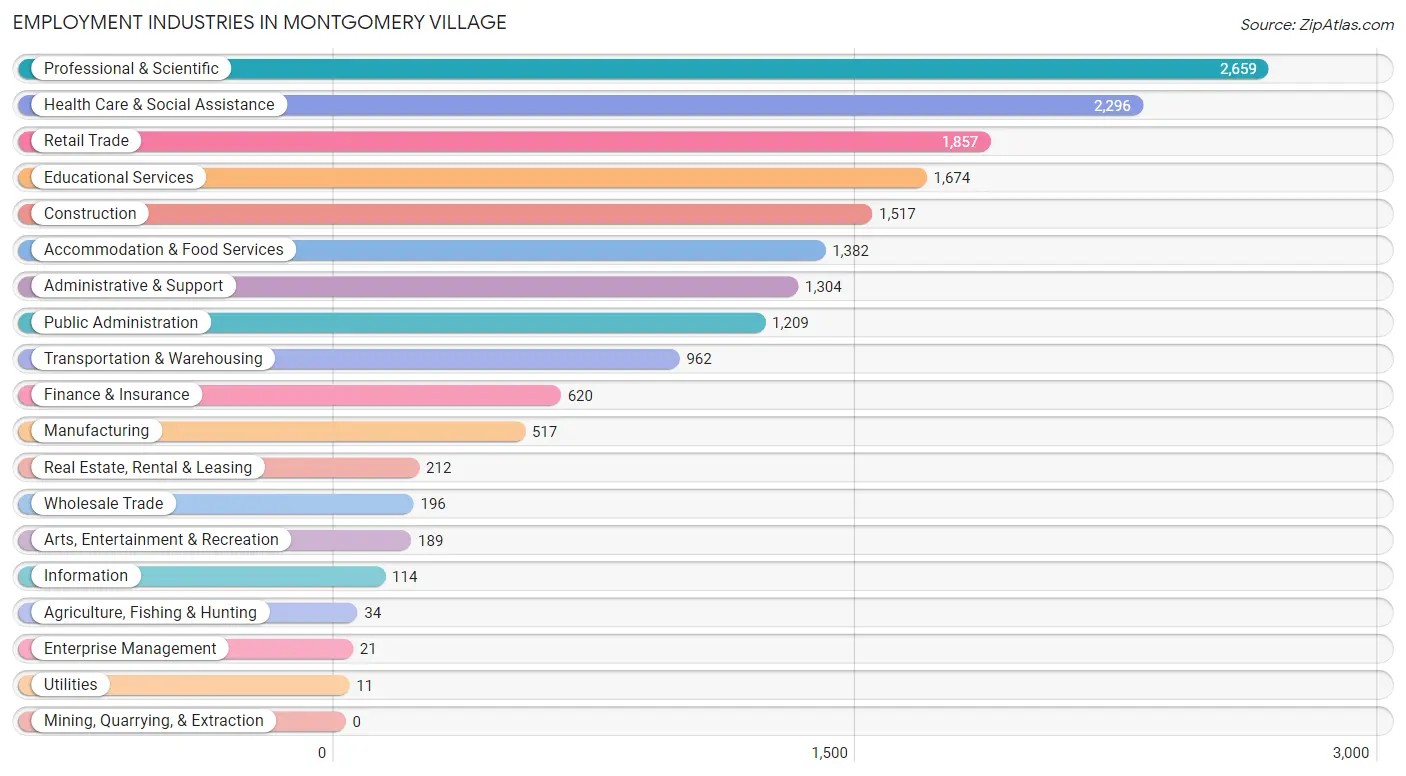
Employment Industries in Montgomery Village
The major employment industries in Montgomery Village include Professional & Scientific (2,659 | 14.6%), Health Care & Social Assistance (2,296 | 12.6%), Retail Trade (1,857 | 10.2%), Educational Services (1,674 | 9.2%), and Construction (1,517 | 8.4%).
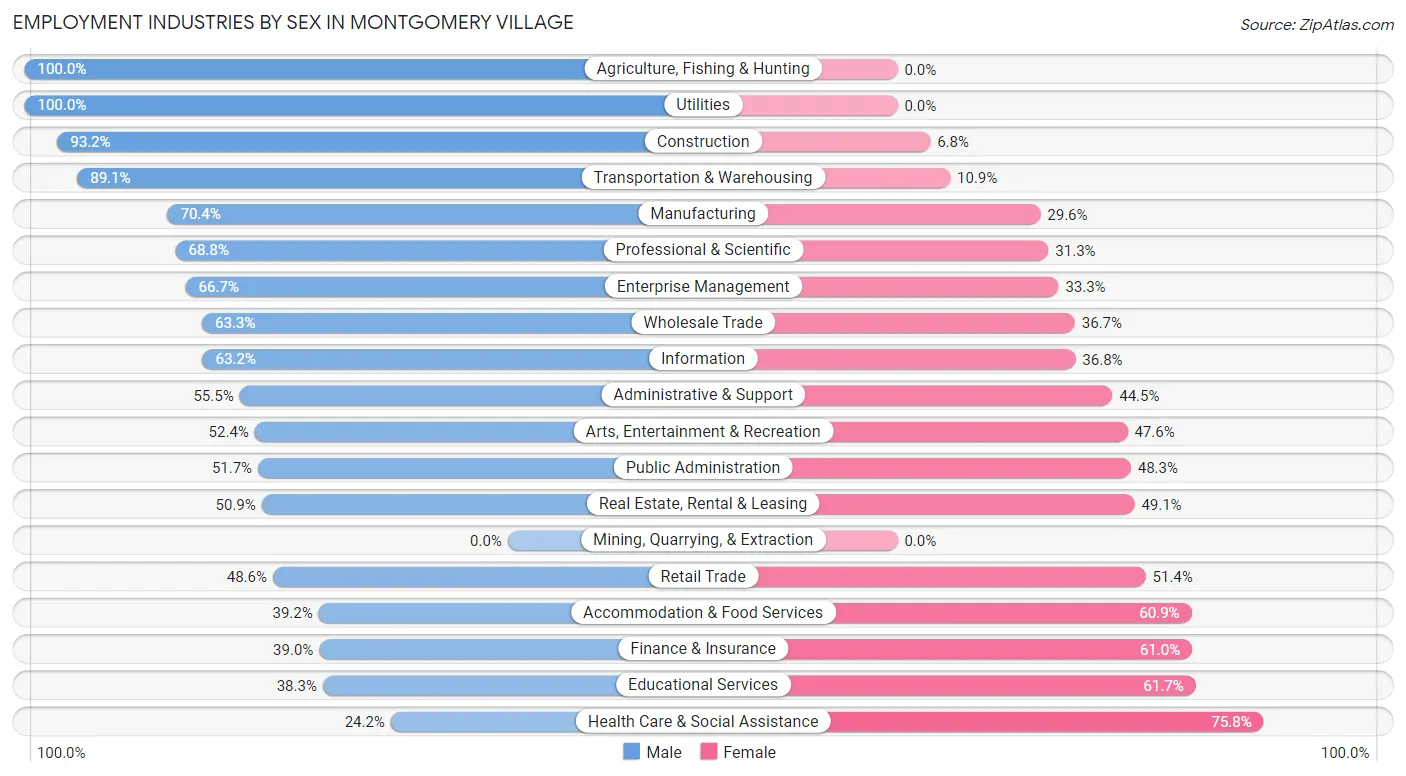
Employment Industries by Sex in Montgomery Village
The Montgomery Village industries that see more men than women are Agriculture, Fishing & Hunting (100.0%), Utilities (100.0%), and Construction (93.2%), whereas the industries that tend to have a higher number of women are Health Care & Social Assistance (75.8%), Educational Services (61.7%), and Finance & Insurance (61.0%).
| Industry | Male | Female |
| Agriculture, Fishing & Hunting | 34 (100.0%) | 0 (0.0%) |
| Mining, Quarrying, & Extraction | 0 (0.0%) | 0 (0.0%) |
| Construction | 1,414 (93.2%) | 103 (6.8%) |
| Manufacturing | 364 (70.4%) | 153 (29.6%) |
| Wholesale Trade | 124 (63.3%) | 72 (36.7%) |
| Retail Trade | 903 (48.6%) | 954 (51.4%) |
| Transportation & Warehousing | 857 (89.1%) | 105 (10.9%) |
| Utilities | 11 (100.0%) | 0 (0.0%) |
| Information | 72 (63.2%) | 42 (36.8%) |
| Finance & Insurance | 242 (39.0%) | 378 (61.0%) |
| Real Estate, Rental & Leasing | 108 (50.9%) | 104 (49.1%) |
| Professional & Scientific | 1,828 (68.8%) | 831 (31.2%) |
| Enterprise Management | 14 (66.7%) | 7 (33.3%) |
| Administrative & Support | 724 (55.5%) | 580 (44.5%) |
| Educational Services | 641 (38.3%) | 1,033 (61.7%) |
| Health Care & Social Assistance | 556 (24.2%) | 1,740 (75.8%) |
| Arts, Entertainment & Recreation | 99 (52.4%) | 90 (47.6%) |
| Accommodation & Food Services | 541 (39.2%) | 841 (60.9%) |
| Public Administration | 625 (51.7%) | 584 (48.3%) |
| Total | 9,789 (53.9%) | 8,386 (46.1%) |
Education in Montgomery Village
School Enrollment in Montgomery Village
The most common levels of schooling among the 8,264 students in Montgomery Village are high school (1,851 | 22.4%), college / undergraduate (1,830 | 22.1%), and elementary school (1,593 | 19.3%).
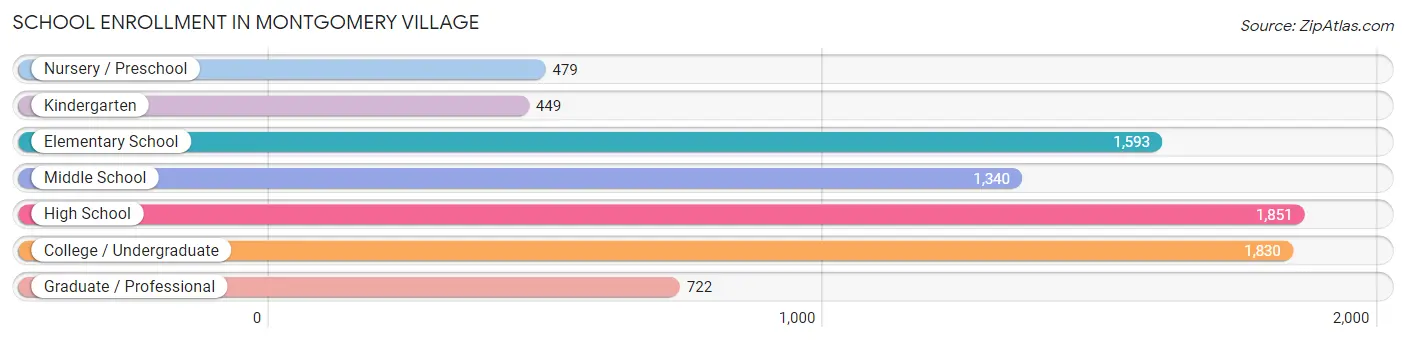
| School Level | # Students | % Students |
| Nursery / Preschool | 479 | 5.8% |
| Kindergarten | 449 | 5.4% |
| Elementary School | 1,593 | 19.3% |
| Middle School | 1,340 | 16.2% |
| High School | 1,851 | 22.4% |
| College / Undergraduate | 1,830 | 22.1% |
| Graduate / Professional | 722 | 8.7% |
| Total | 8,264 | 100.0% |
School Enrollment by Age by Funding Source in Montgomery Village
Out of a total of 8,264 students who are enrolled in schools in Montgomery Village, 1,215 (14.7%) attend a private institution, while the remaining 7,049 (85.3%) are enrolled in public schools. The age group of 3 to 4 year olds has the highest likelihood of being enrolled in private schools, with 175 (42.2% in the age bracket) enrolled. Conversely, the age group of 18 to 19 year olds has the lowest likelihood of being enrolled in a private school, with 647 (97.3% in the age bracket) attending a public institution.
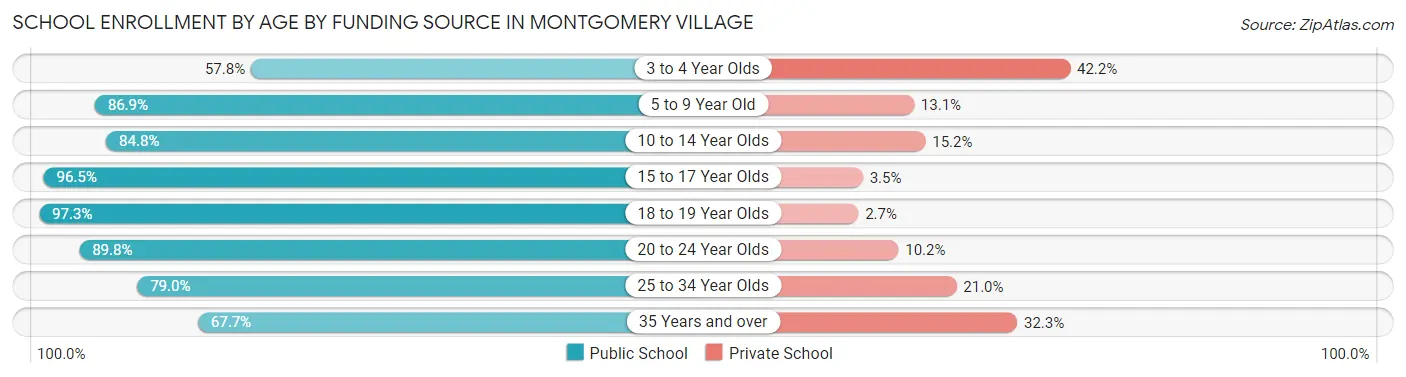
| Age Bracket | Public School | Private School |
| 3 to 4 Year Olds | 240 (57.8%) | 175 (42.2%) |
| 5 to 9 Year Old | 1,642 (86.9%) | 247 (13.1%) |
| 10 to 14 Year Olds | 1,445 (84.8%) | 259 (15.2%) |
| 15 to 17 Year Olds | 1,227 (96.5%) | 45 (3.5%) |
| 18 to 19 Year Olds | 647 (97.3%) | 18 (2.7%) |
| 20 to 24 Year Olds | 794 (89.8%) | 90 (10.2%) |
| 25 to 34 Year Olds | 576 (79.0%) | 153 (21.0%) |
| 35 Years and over | 478 (67.7%) | 228 (32.3%) |
| Total | 7,049 (85.3%) | 1,215 (14.7%) |
Educational Attainment by Field of Study in Montgomery Village
Business (1,882 | 17.6%), science & technology (1,281 | 12.0%), social sciences (1,221 | 11.4%), engineering (1,121 | 10.5%), and bio, nature & agricultural (1,037 | 9.7%) are the most common fields of study among 10,708 individuals in Montgomery Village who have obtained a bachelor's degree or higher.
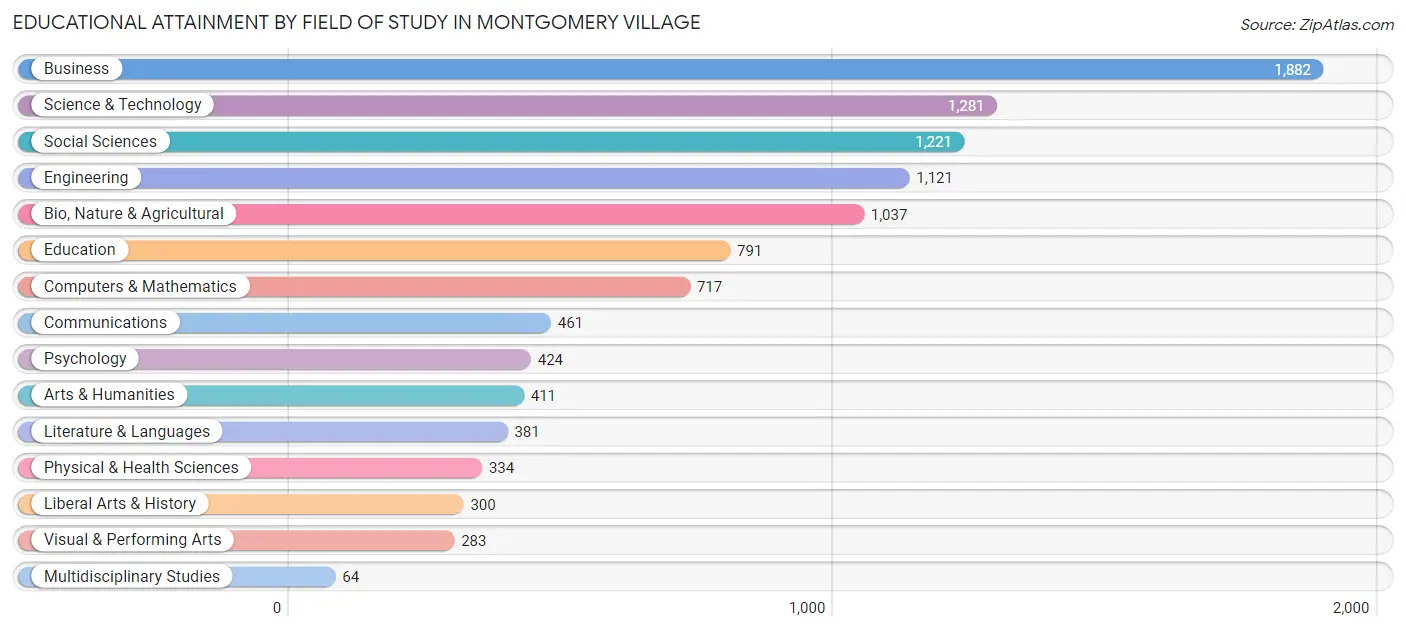
| Field of Study | # Graduates | % Graduates |
| Computers & Mathematics | 717 | 6.7% |
| Bio, Nature & Agricultural | 1,037 | 9.7% |
| Physical & Health Sciences | 334 | 3.1% |
| Psychology | 424 | 4.0% |
| Social Sciences | 1,221 | 11.4% |
| Engineering | 1,121 | 10.5% |
| Multidisciplinary Studies | 64 | 0.6% |
| Science & Technology | 1,281 | 12.0% |
| Business | 1,882 | 17.6% |
| Education | 791 | 7.4% |
| Literature & Languages | 381 | 3.6% |
| Liberal Arts & History | 300 | 2.8% |
| Visual & Performing Arts | 283 | 2.6% |
| Communications | 461 | 4.3% |
| Arts & Humanities | 411 | 3.8% |
| Total | 10,708 | 100.0% |
Transportation & Commute in Montgomery Village
Vehicle Availability by Sex in Montgomery Village
The most prevalent vehicle ownership categories in Montgomery Village are males with 2 vehicles (4,017, accounting for 42.7%) and females with 2 vehicles (3,299, making up 48.4%).
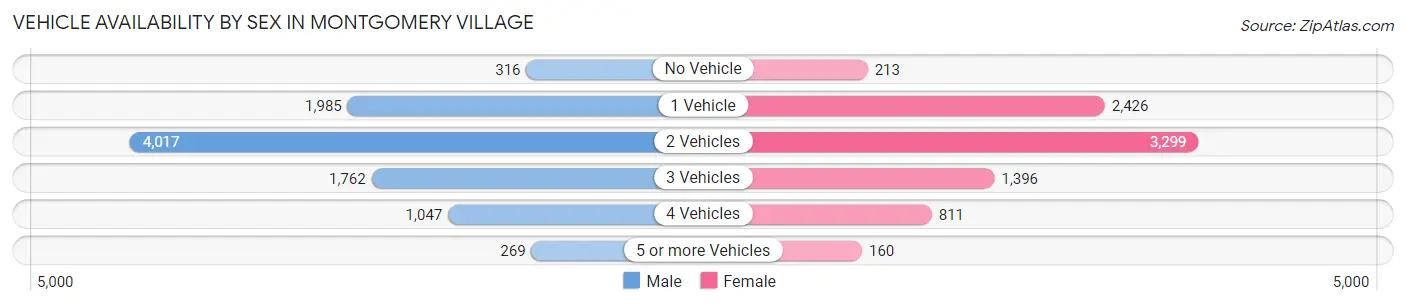
| Vehicles Available | Male | Female |
| No Vehicle | 316 (3.4%) | 213 (2.6%) |
| 1 Vehicle | 1,985 (21.1%) | 2,426 (29.2%) |
| 2 Vehicles | 4,017 (42.7%) | 3,299 (39.7%) |
| 3 Vehicles | 1,762 (18.8%) | 1,396 (16.8%) |
| 4 Vehicles | 1,047 (11.1%) | 811 (9.8%) |
| 5 or more Vehicles | 269 (2.9%) | 160 (1.9%) |
| Total | 9,396 (100.0%) | 8,305 (100.0%) |
Commute Time in Montgomery Village
The most frequently occuring commute durations in Montgomery Village are 60 to 89 minutes (2,134 commuters, 13.9%), 15 to 19 minutes (2,133 commuters, 13.9%), and 30 to 34 minutes (2,089 commuters, 13.6%).
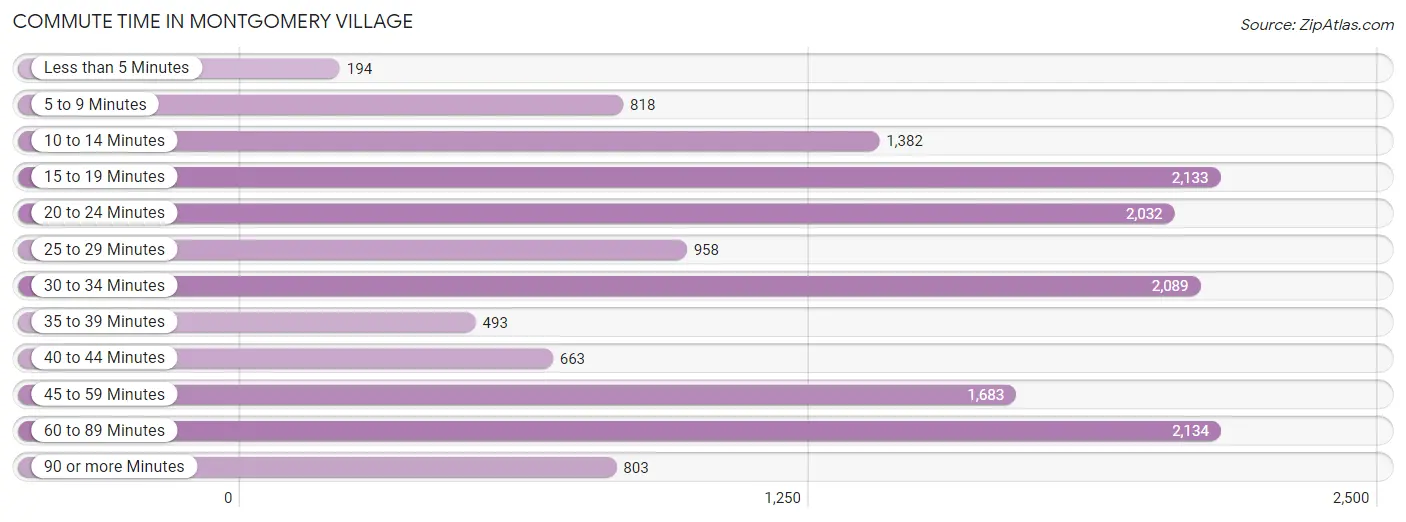
| Commute Time | # Commuters | % Commuters |
| Less than 5 Minutes | 194 | 1.3% |
| 5 to 9 Minutes | 818 | 5.3% |
| 10 to 14 Minutes | 1,382 | 9.0% |
| 15 to 19 Minutes | 2,133 | 13.9% |
| 20 to 24 Minutes | 2,032 | 13.2% |
| 25 to 29 Minutes | 958 | 6.2% |
| 30 to 34 Minutes | 2,089 | 13.6% |
| 35 to 39 Minutes | 493 | 3.2% |
| 40 to 44 Minutes | 663 | 4.3% |
| 45 to 59 Minutes | 1,683 | 10.9% |
| 60 to 89 Minutes | 2,134 | 13.9% |
| 90 or more Minutes | 803 | 5.2% |
Commute Time by Sex in Montgomery Village
The most common commute times in Montgomery Village are 60 to 89 minutes (1,271 commuters, 16.0%) for males and 15 to 19 minutes (1,142 commuters, 15.4%) for females.
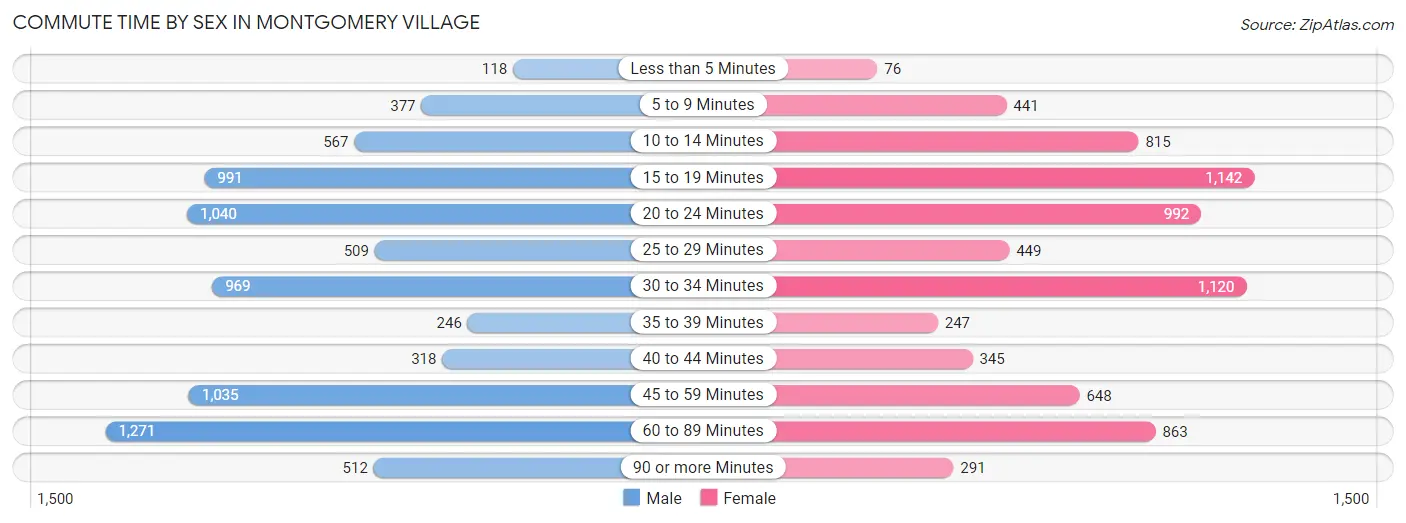
| Commute Time | Male | Female |
| Less than 5 Minutes | 118 (1.5%) | 76 (1.0%) |
| 5 to 9 Minutes | 377 (4.7%) | 441 (5.9%) |
| 10 to 14 Minutes | 567 (7.1%) | 815 (11.0%) |
| 15 to 19 Minutes | 991 (12.5%) | 1,142 (15.4%) |
| 20 to 24 Minutes | 1,040 (13.1%) | 992 (13.4%) |
| 25 to 29 Minutes | 509 (6.4%) | 449 (6.0%) |
| 30 to 34 Minutes | 969 (12.2%) | 1,120 (15.1%) |
| 35 to 39 Minutes | 246 (3.1%) | 247 (3.3%) |
| 40 to 44 Minutes | 318 (4.0%) | 345 (4.6%) |
| 45 to 59 Minutes | 1,035 (13.0%) | 648 (8.7%) |
| 60 to 89 Minutes | 1,271 (16.0%) | 863 (11.6%) |
| 90 or more Minutes | 512 (6.4%) | 291 (3.9%) |
Time of Departure to Work by Sex in Montgomery Village
The most frequent times of departure to work in Montgomery Village are 7:00 AM to 7:29 AM (1,343, 16.9%) for males and 7:00 AM to 7:29 AM (940, 12.7%) for females.
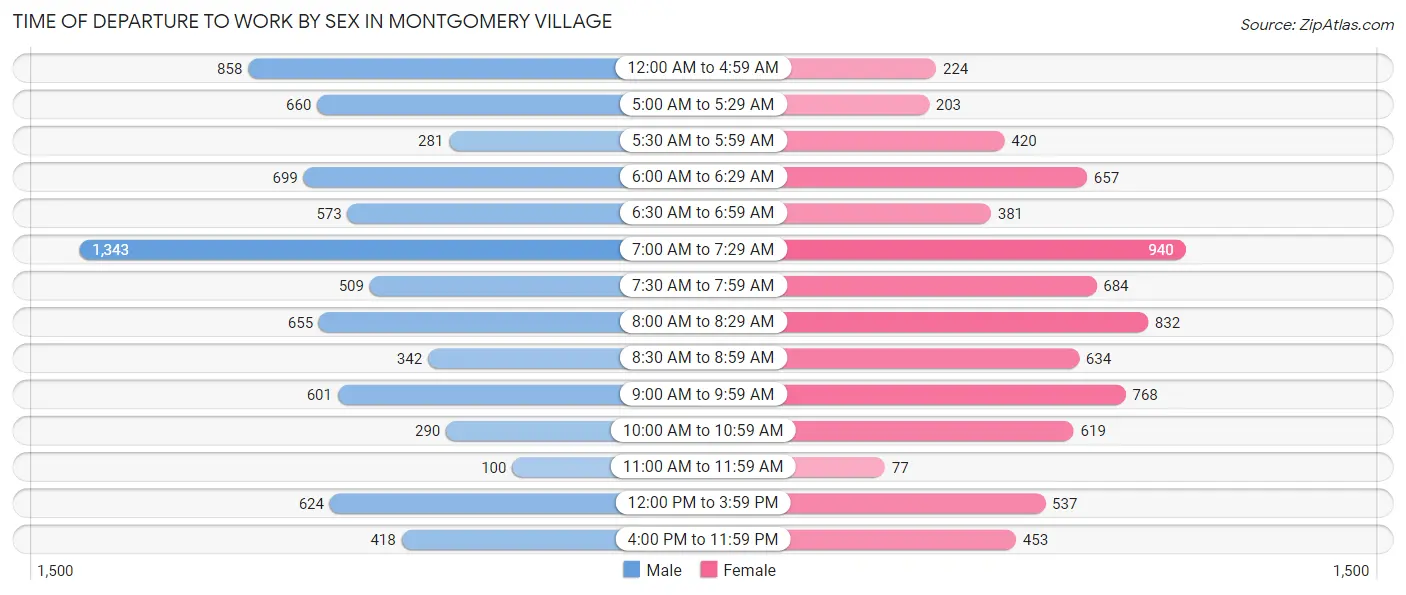
| Time of Departure | Male | Female |
| 12:00 AM to 4:59 AM | 858 (10.8%) | 224 (3.0%) |
| 5:00 AM to 5:29 AM | 660 (8.3%) | 203 (2.7%) |
| 5:30 AM to 5:59 AM | 281 (3.5%) | 420 (5.7%) |
| 6:00 AM to 6:29 AM | 699 (8.8%) | 657 (8.8%) |
| 6:30 AM to 6:59 AM | 573 (7.2%) | 381 (5.1%) |
| 7:00 AM to 7:29 AM | 1,343 (16.9%) | 940 (12.7%) |
| 7:30 AM to 7:59 AM | 509 (6.4%) | 684 (9.2%) |
| 8:00 AM to 8:29 AM | 655 (8.2%) | 832 (11.2%) |
| 8:30 AM to 8:59 AM | 342 (4.3%) | 634 (8.5%) |
| 9:00 AM to 9:59 AM | 601 (7.6%) | 768 (10.3%) |
| 10:00 AM to 10:59 AM | 290 (3.6%) | 619 (8.3%) |
| 11:00 AM to 11:59 AM | 100 (1.3%) | 77 (1.0%) |
| 12:00 PM to 3:59 PM | 624 (7.9%) | 537 (7.2%) |
| 4:00 PM to 11:59 PM | 418 (5.3%) | 453 (6.1%) |
| Total | 7,953 (100.0%) | 7,429 (100.0%) |
Housing Occupancy in Montgomery Village
Occupancy by Ownership in Montgomery Village
Of the total 12,132 dwellings in Montgomery Village, owner-occupied units account for 8,115 (66.9%), while renter-occupied units make up 4,017 (33.1%).
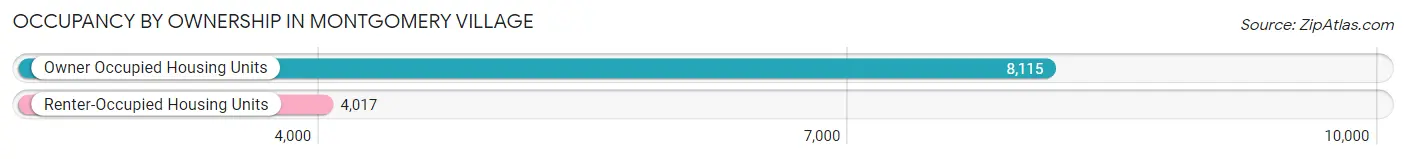
| Occupancy | # Housing Units | % Housing Units |
| Owner Occupied Housing Units | 8,115 | 66.9% |
| Renter-Occupied Housing Units | 4,017 | 33.1% |
| Total Occupied Housing Units | 12,132 | 100.0% |
Occupancy by Household Size in Montgomery Village
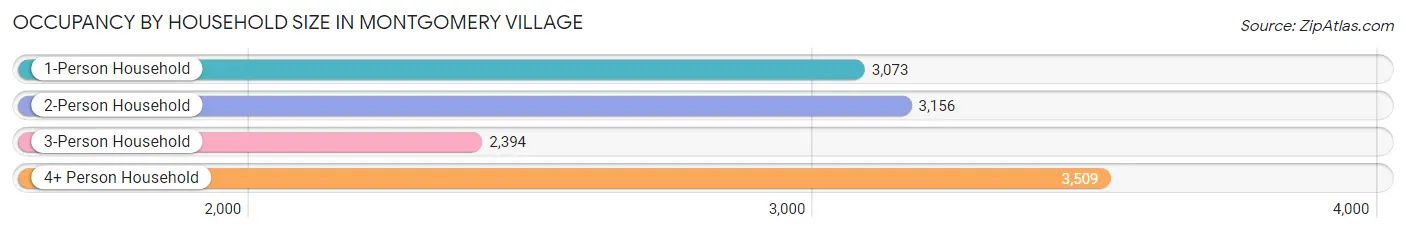
| Household Size | # Housing Units | % Housing Units |
| 1-Person Household | 3,073 | 25.3% |
| 2-Person Household | 3,156 | 26.0% |
| 3-Person Household | 2,394 | 19.7% |
| 4+ Person Household | 3,509 | 28.9% |
| Total Housing Units | 12,132 | 100.0% |
Occupancy by Ownership by Household Size in Montgomery Village
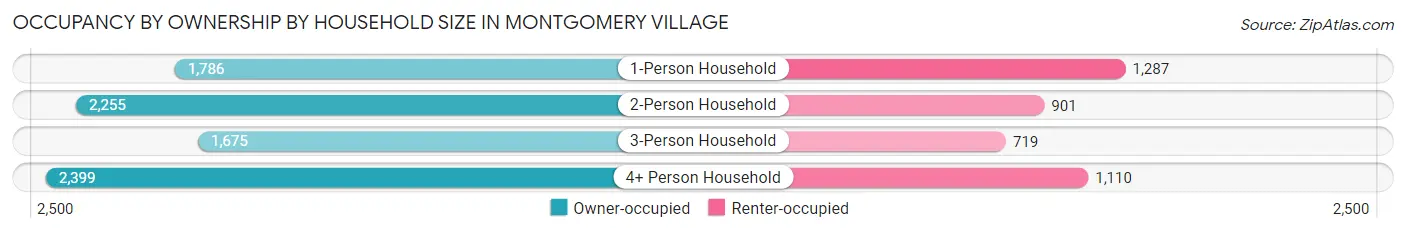
| Household Size | Owner-occupied | Renter-occupied |
| 1-Person Household | 1,786 (58.1%) | 1,287 (41.9%) |
| 2-Person Household | 2,255 (71.5%) | 901 (28.5%) |
| 3-Person Household | 1,675 (70.0%) | 719 (30.0%) |
| 4+ Person Household | 2,399 (68.4%) | 1,110 (31.6%) |
| Total Housing Units | 8,115 (66.9%) | 4,017 (33.1%) |
Occupancy by Educational Attainment in Montgomery Village
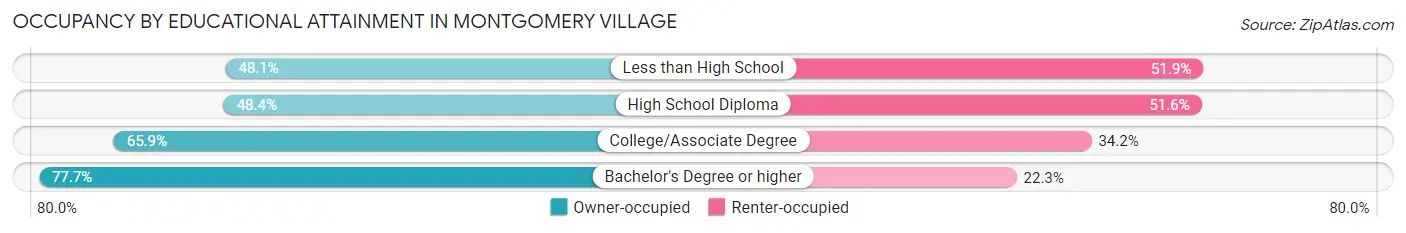
| Household Size | Owner-occupied | Renter-occupied |
| Less than High School | 634 (48.1%) | 683 (51.9%) |
| High School Diploma | 930 (48.4%) | 991 (51.6%) |
| College/Associate Degree | 2,005 (65.8%) | 1,040 (34.2%) |
| Bachelor's Degree or higher | 4,546 (77.7%) | 1,303 (22.3%) |
Occupancy by Age of Householder in Montgomery Village
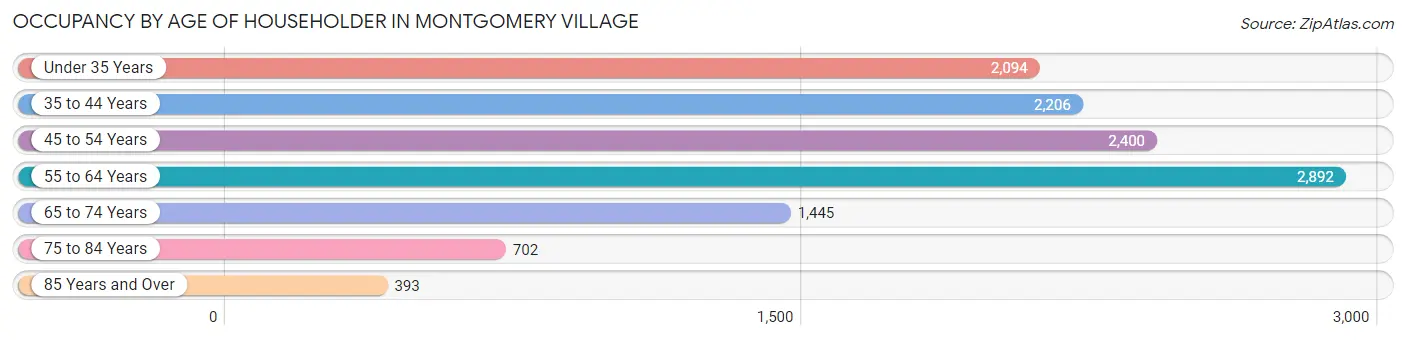
| Age Bracket | # Households | % Households |
| Under 35 Years | 2,094 | 17.3% |
| 35 to 44 Years | 2,206 | 18.2% |
| 45 to 54 Years | 2,400 | 19.8% |
| 55 to 64 Years | 2,892 | 23.8% |
| 65 to 74 Years | 1,445 | 11.9% |
| 75 to 84 Years | 702 | 5.8% |
| 85 Years and Over | 393 | 3.2% |
| Total | 12,132 | 100.0% |
Housing Finances in Montgomery Village
Median Income by Occupancy in Montgomery Village
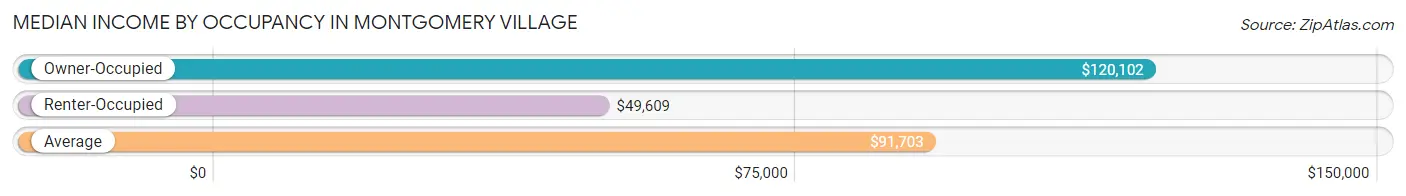
| Occupancy Type | # Households | Median Income |
| Owner-Occupied | 8,115 (66.9%) | $120,102 |
| Renter-Occupied | 4,017 (33.1%) | $49,609 |
| Average | 12,132 (100.0%) | $91,703 |
Occupancy by Householder Income Bracket in Montgomery Village
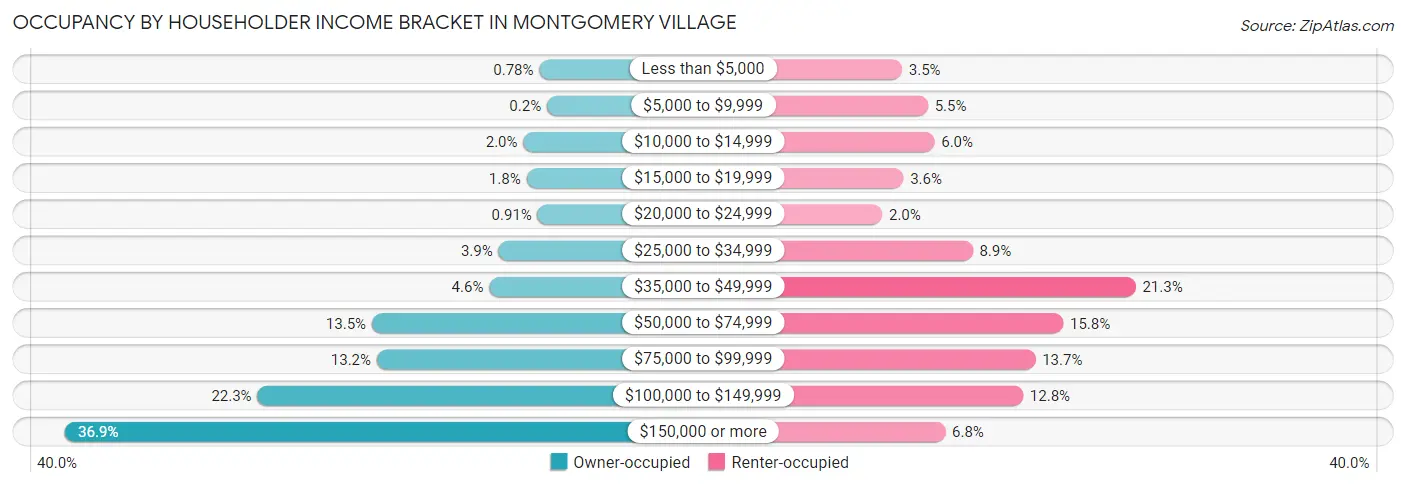
| Income Bracket | Owner-occupied | Renter-occupied |
| Less than $5,000 | 63 (0.8%) | 142 (3.5%) |
| $5,000 to $9,999 | 16 (0.2%) | 221 (5.5%) |
| $10,000 to $14,999 | 162 (2.0%) | 241 (6.0%) |
| $15,000 to $19,999 | 143 (1.8%) | 146 (3.6%) |
| $20,000 to $24,999 | 74 (0.9%) | 81 (2.0%) |
| $25,000 to $34,999 | 316 (3.9%) | 358 (8.9%) |
| $35,000 to $49,999 | 373 (4.6%) | 857 (21.3%) |
| $50,000 to $74,999 | 1,099 (13.5%) | 635 (15.8%) |
| $75,000 to $99,999 | 1,068 (13.2%) | 550 (13.7%) |
| $100,000 to $149,999 | 1,806 (22.3%) | 512 (12.8%) |
| $150,000 or more | 2,995 (36.9%) | 274 (6.8%) |
| Total | 8,115 (100.0%) | 4,017 (100.0%) |
Monthly Housing Cost Tiers in Montgomery Village
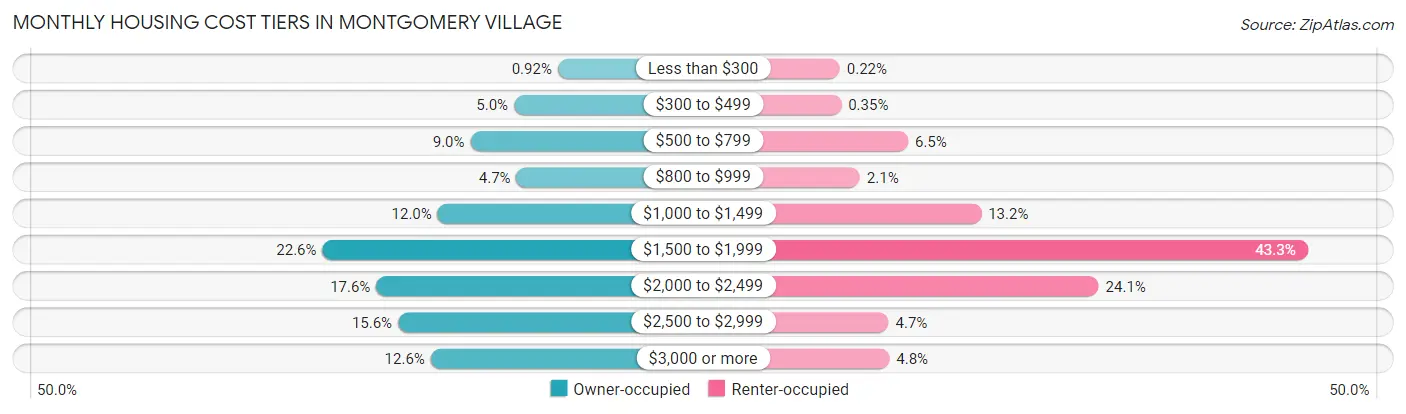
| Monthly Cost | Owner-occupied | Renter-occupied |
| Less than $300 | 75 (0.9%) | 9 (0.2%) |
| $300 to $499 | 402 (5.0%) | 14 (0.4%) |
| $500 to $799 | 727 (9.0%) | 261 (6.5%) |
| $800 to $999 | 383 (4.7%) | 83 (2.1%) |
| $1,000 to $1,499 | 972 (12.0%) | 532 (13.2%) |
| $1,500 to $1,999 | 1,833 (22.6%) | 1,738 (43.3%) |
| $2,000 to $2,499 | 1,431 (17.6%) | 966 (24.0%) |
| $2,500 to $2,999 | 1,268 (15.6%) | 189 (4.7%) |
| $3,000 or more | 1,024 (12.6%) | 192 (4.8%) |
| Total | 8,115 (100.0%) | 4,017 (100.0%) |
Physical Housing Characteristics in Montgomery Village
Housing Structures in Montgomery Village
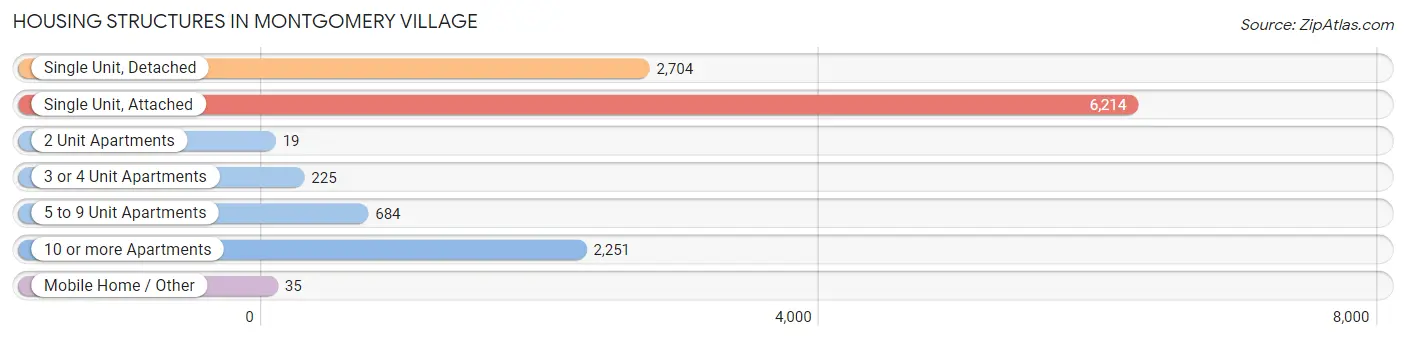
| Structure Type | # Housing Units | % Housing Units |
| Single Unit, Detached | 2,704 | 22.3% |
| Single Unit, Attached | 6,214 | 51.2% |
| 2 Unit Apartments | 19 | 0.2% |
| 3 or 4 Unit Apartments | 225 | 1.8% |
| 5 to 9 Unit Apartments | 684 | 5.6% |
| 10 or more Apartments | 2,251 | 18.5% |
| Mobile Home / Other | 35 | 0.3% |
| Total | 12,132 | 100.0% |
Housing Structures by Occupancy in Montgomery Village
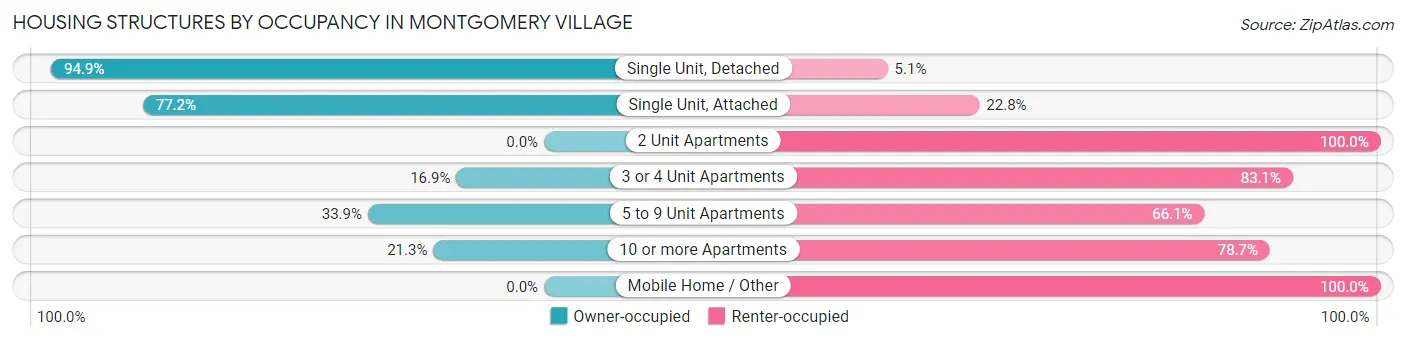
| Structure Type | Owner-occupied | Renter-occupied |
| Single Unit, Detached | 2,566 (94.9%) | 138 (5.1%) |
| Single Unit, Attached | 4,799 (77.2%) | 1,415 (22.8%) |
| 2 Unit Apartments | 0 (0.0%) | 19 (100.0%) |
| 3 or 4 Unit Apartments | 38 (16.9%) | 187 (83.1%) |
| 5 to 9 Unit Apartments | 232 (33.9%) | 452 (66.1%) |
| 10 or more Apartments | 480 (21.3%) | 1,771 (78.7%) |
| Mobile Home / Other | 0 (0.0%) | 35 (100.0%) |
| Total | 8,115 (66.9%) | 4,017 (33.1%) |
Housing Structures by Number of Rooms in Montgomery Village
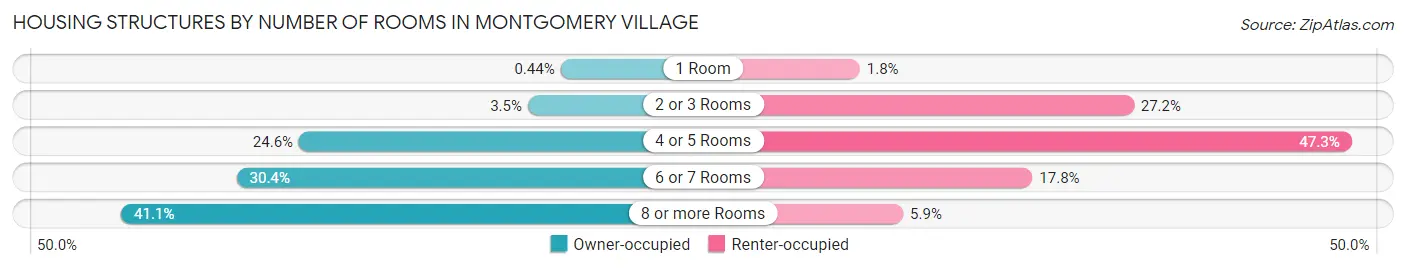
| Number of Rooms | Owner-occupied | Renter-occupied |
| 1 Room | 36 (0.4%) | 74 (1.8%) |
| 2 or 3 Rooms | 281 (3.5%) | 1,092 (27.2%) |
| 4 or 5 Rooms | 1,999 (24.6%) | 1,901 (47.3%) |
| 6 or 7 Rooms | 2,466 (30.4%) | 715 (17.8%) |
| 8 or more Rooms | 3,333 (41.1%) | 235 (5.9%) |
| Total | 8,115 (100.0%) | 4,017 (100.0%) |
Housing Structure by Heating Type in Montgomery Village
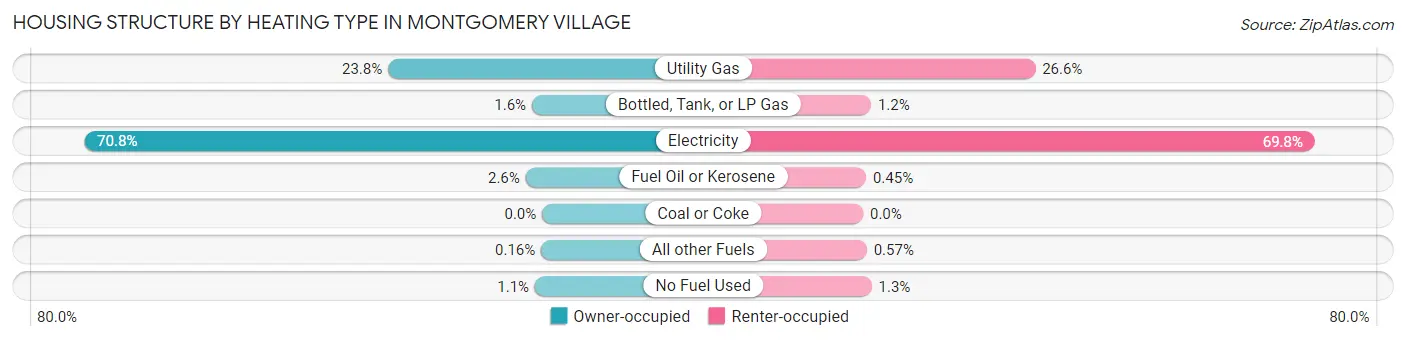
| Heating Type | Owner-occupied | Renter-occupied |
| Utility Gas | 1,933 (23.8%) | 1,069 (26.6%) |
| Bottled, Tank, or LP Gas | 127 (1.6%) | 49 (1.2%) |
| Electricity | 5,745 (70.8%) | 2,805 (69.8%) |
| Fuel Oil or Kerosene | 207 (2.5%) | 18 (0.4%) |
| Coal or Coke | 0 (0.0%) | 0 (0.0%) |
| All other Fuels | 13 (0.2%) | 23 (0.6%) |
| No Fuel Used | 90 (1.1%) | 53 (1.3%) |
| Total | 8,115 (100.0%) | 4,017 (100.0%) |
Household Vehicle Usage in Montgomery Village
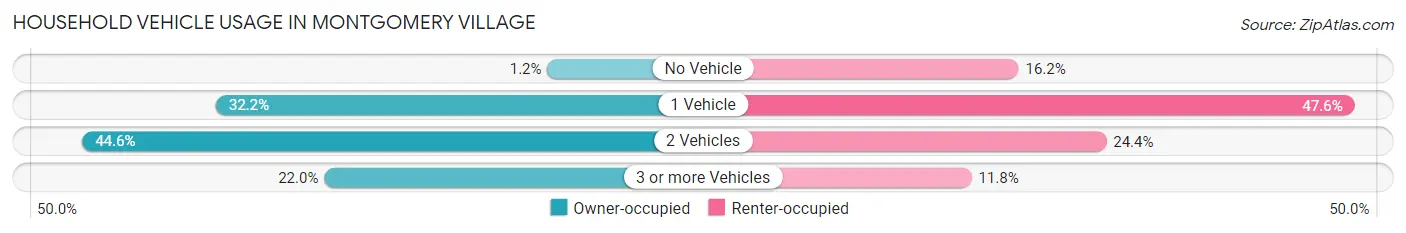
| Vehicles per Household | Owner-occupied | Renter-occupied |
| No Vehicle | 97 (1.2%) | 651 (16.2%) |
| 1 Vehicle | 2,609 (32.2%) | 1,911 (47.6%) |
| 2 Vehicles | 3,621 (44.6%) | 980 (24.4%) |
| 3 or more Vehicles | 1,788 (22.0%) | 475 (11.8%) |
| Total | 8,115 (100.0%) | 4,017 (100.0%) |
Real Estate & Mortgages in Montgomery Village
Real Estate and Mortgage Overview in Montgomery Village
| Characteristic | Without Mortgage | With Mortgage |
| Housing Units | 1,644 | 6,471 |
| Median Property Value | $348,200 | $355,900 |
| Median Household Income | $87,750 | $2,572 |
| Monthly Housing Costs | $647 | $1,024 |
| Real Estate Taxes | $2,916 | $166 |
Property Value by Mortgage Status in Montgomery Village
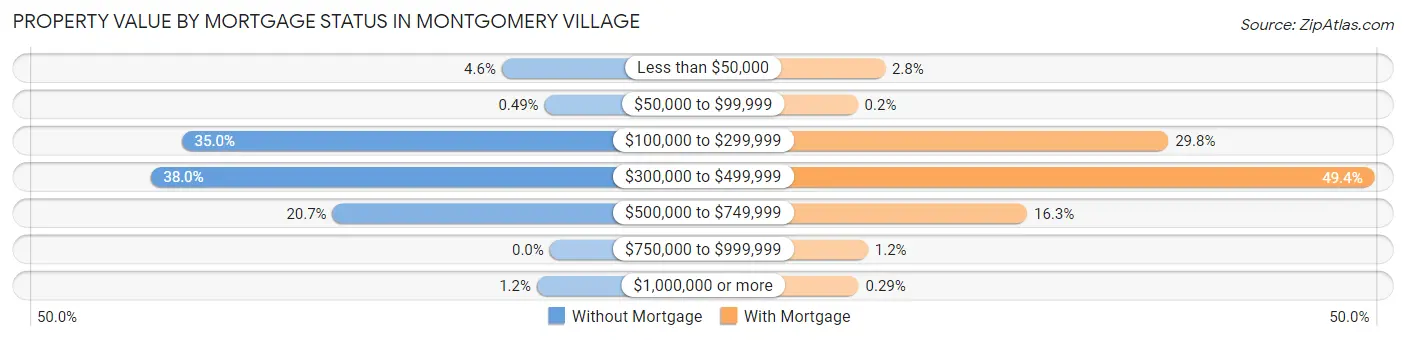
| Property Value | Without Mortgage | With Mortgage |
| Less than $50,000 | 75 (4.6%) | 181 (2.8%) |
| $50,000 to $99,999 | 8 (0.5%) | 13 (0.2%) |
| $100,000 to $299,999 | 576 (35.0%) | 1,927 (29.8%) |
| $300,000 to $499,999 | 625 (38.0%) | 3,198 (49.4%) |
| $500,000 to $749,999 | 340 (20.7%) | 1,057 (16.3%) |
| $750,000 to $999,999 | 0 (0.0%) | 76 (1.2%) |
| $1,000,000 or more | 20 (1.2%) | 19 (0.3%) |
| Total | 1,644 (100.0%) | 6,471 (100.0%) |
Household Income by Mortgage Status in Montgomery Village
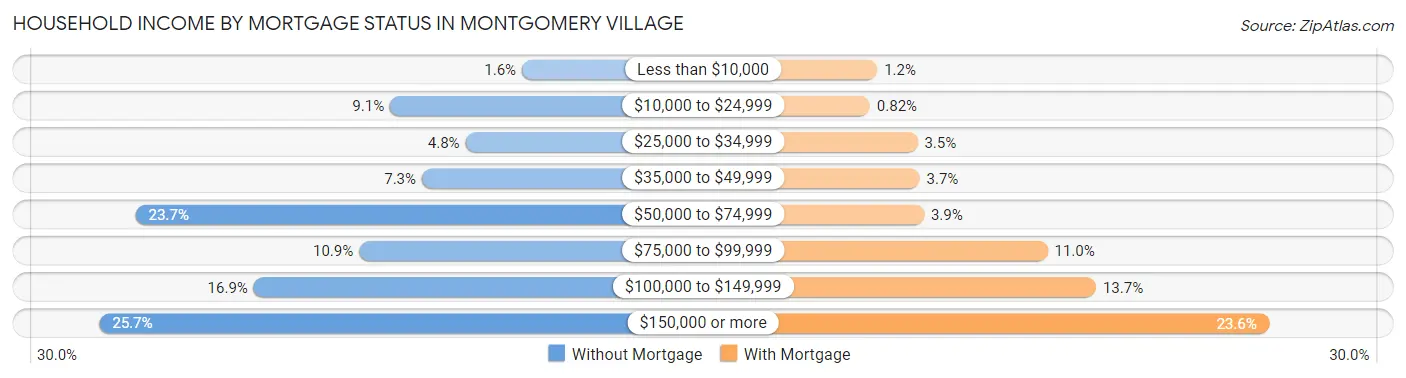
| Household Income | Without Mortgage | With Mortgage |
| Less than $10,000 | 26 (1.6%) | 80 (1.2%) |
| $10,000 to $24,999 | 150 (9.1%) | 53 (0.8%) |
| $25,000 to $34,999 | 79 (4.8%) | 229 (3.5%) |
| $35,000 to $49,999 | 120 (7.3%) | 237 (3.7%) |
| $50,000 to $74,999 | 389 (23.7%) | 253 (3.9%) |
| $75,000 to $99,999 | 179 (10.9%) | 710 (11.0%) |
| $100,000 to $149,999 | 278 (16.9%) | 889 (13.7%) |
| $150,000 or more | 423 (25.7%) | 1,528 (23.6%) |
| Total | 1,644 (100.0%) | 6,471 (100.0%) |
Property Value to Household Income Ratio in Montgomery Village
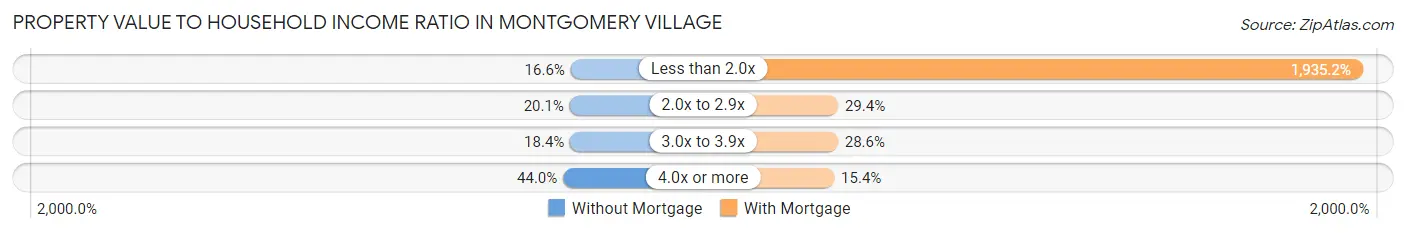
| Value-to-Income Ratio | Without Mortgage | With Mortgage |
| Less than 2.0x | 273 (16.6%) | 125,224 (1,935.2%) |
| 2.0x to 2.9x | 331 (20.1%) | 1,899 (29.3%) |
| 3.0x to 3.9x | 303 (18.4%) | 1,849 (28.6%) |
| 4.0x or more | 724 (44.0%) | 996 (15.4%) |
| Total | 1,644 (100.0%) | 6,471 (100.0%) |
Real Estate Taxes by Mortgage Status in Montgomery Village
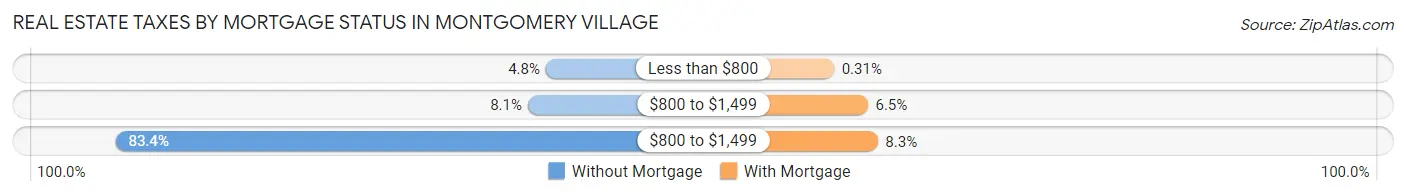
| Property Taxes | Without Mortgage | With Mortgage |
| Less than $800 | 79 (4.8%) | 20 (0.3%) |
| $800 to $1,499 | 133 (8.1%) | 419 (6.5%) |
| $800 to $1,499 | 1,371 (83.4%) | 536 (8.3%) |
| Total | 1,644 (100.0%) | 6,471 (100.0%) |
Health & Disability in Montgomery Village
Health Insurance Coverage by Age in Montgomery Village
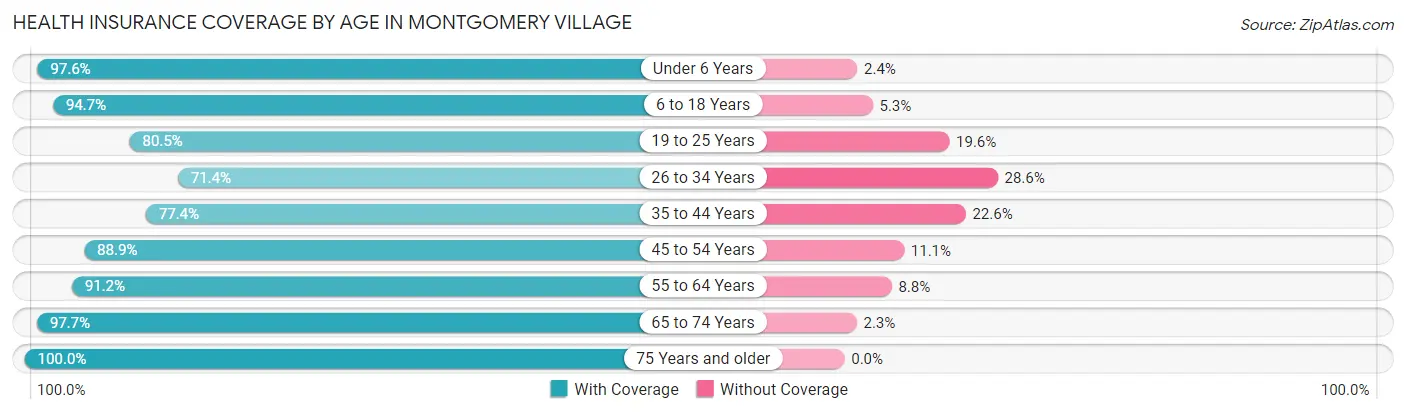
| Age Bracket | With Coverage | Without Coverage |
| Under 6 Years | 3,424 (97.6%) | 84 (2.4%) |
| 6 to 18 Years | 4,929 (94.7%) | 274 (5.3%) |
| 19 to 25 Years | 2,333 (80.4%) | 567 (19.6%) |
| 26 to 34 Years | 3,355 (71.4%) | 1,342 (28.6%) |
| 35 to 44 Years | 3,480 (77.4%) | 1,016 (22.6%) |
| 45 to 54 Years | 4,056 (88.9%) | 507 (11.1%) |
| 55 to 64 Years | 4,218 (91.2%) | 407 (8.8%) |
| 65 to 74 Years | 2,572 (97.7%) | 60 (2.3%) |
| 75 Years and older | 1,915 (100.0%) | 0 (0.0%) |
| Total | 30,282 (87.7%) | 4,257 (12.3%) |
Health Insurance Coverage by Citizenship Status in Montgomery Village
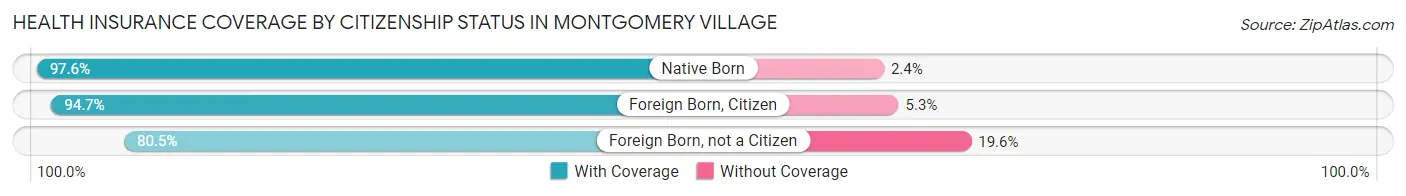
| Citizenship Status | With Coverage | Without Coverage |
| Native Born | 3,424 (97.6%) | 84 (2.4%) |
| Foreign Born, Citizen | 4,929 (94.7%) | 274 (5.3%) |
| Foreign Born, not a Citizen | 2,333 (80.4%) | 567 (19.6%) |
Health Insurance Coverage by Household Income in Montgomery Village
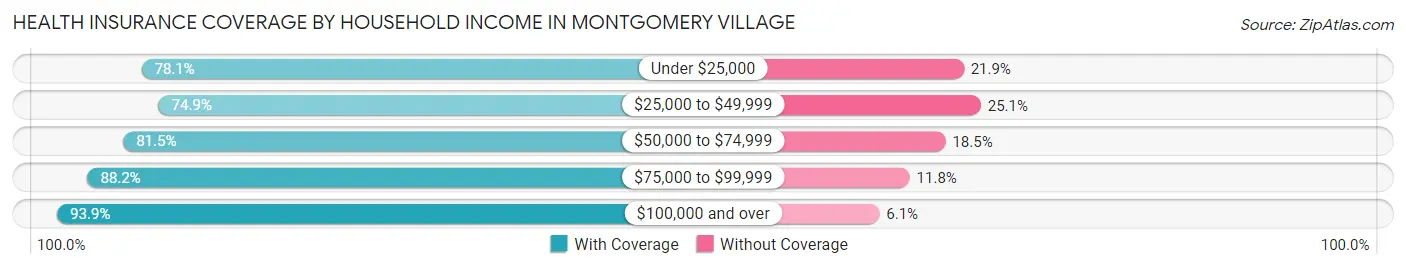
| Household Income | With Coverage | Without Coverage |
| Under $25,000 | 2,400 (78.1%) | 673 (21.9%) |
| $25,000 to $49,999 | 3,356 (74.9%) | 1,125 (25.1%) |
| $50,000 to $74,999 | 3,624 (81.5%) | 822 (18.5%) |
| $75,000 to $99,999 | 4,125 (88.2%) | 551 (11.8%) |
| $100,000 and over | 16,706 (93.9%) | 1,086 (6.1%) |
Public vs Private Health Insurance Coverage by Age in Montgomery Village
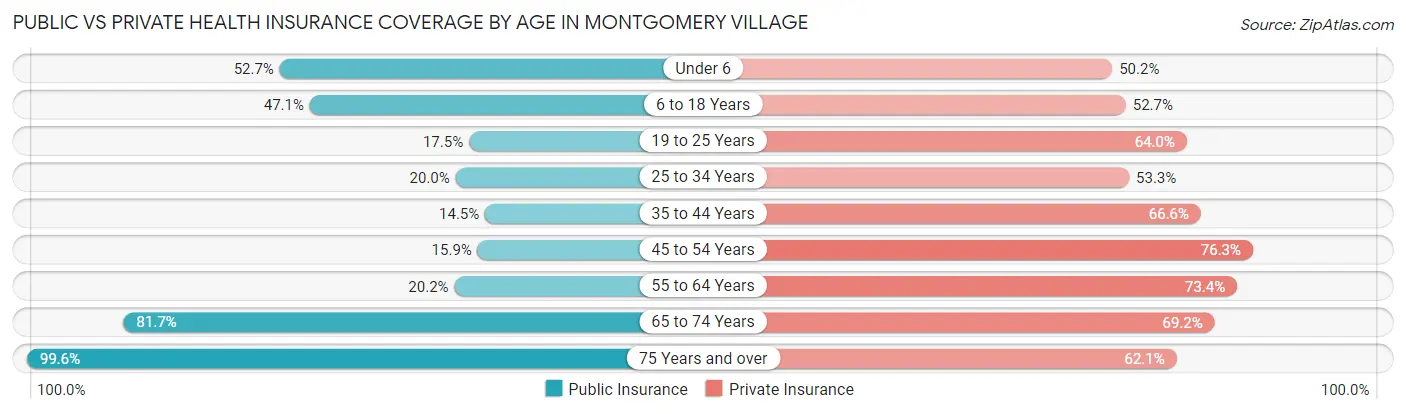
| Age Bracket | Public Insurance | Private Insurance |
| Under 6 | 1,847 (52.6%) | 1,761 (50.2%) |
| 6 to 18 Years | 2,449 (47.1%) | 2,743 (52.7%) |
| 19 to 25 Years | 508 (17.5%) | 1,857 (64.0%) |
| 25 to 34 Years | 940 (20.0%) | 2,505 (53.3%) |
| 35 to 44 Years | 653 (14.5%) | 2,996 (66.6%) |
| 45 to 54 Years | 726 (15.9%) | 3,481 (76.3%) |
| 55 to 64 Years | 935 (20.2%) | 3,393 (73.4%) |
| 65 to 74 Years | 2,149 (81.7%) | 1,821 (69.2%) |
| 75 Years and over | 1,907 (99.6%) | 1,190 (62.1%) |
| Total | 12,114 (35.1%) | 21,747 (63.0%) |
Disability Status by Sex by Age in Montgomery Village
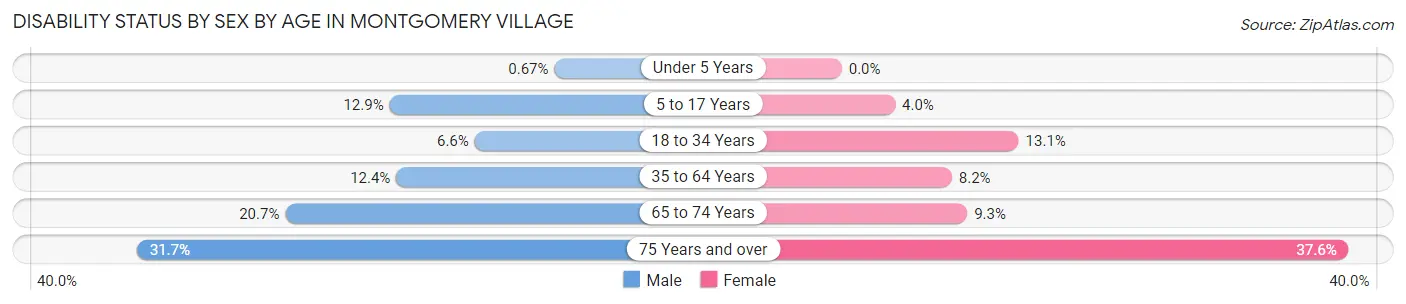
| Age Bracket | Male | Female |
| Under 5 Years | 11 (0.7%) | 0 (0.0%) |
| 5 to 17 Years | 336 (12.9%) | 97 (4.0%) |
| 18 to 34 Years | 297 (6.6%) | 470 (13.1%) |
| 35 to 64 Years | 861 (12.4%) | 551 (8.2%) |
| 65 to 74 Years | 253 (20.6%) | 131 (9.3%) |
| 75 Years and over | 184 (31.7%) | 502 (37.6%) |
Disability Class by Sex by Age in Montgomery Village
Disability Class: Hearing Difficulty
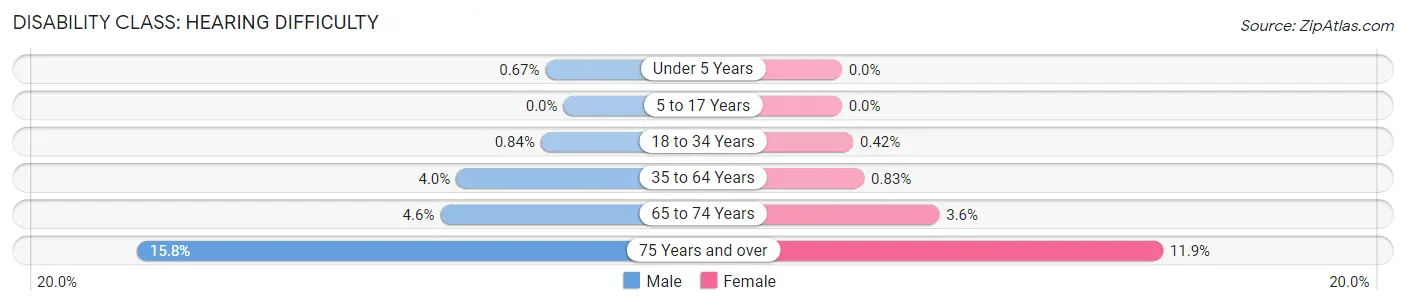
| Age Bracket | Male | Female |
| Under 5 Years | 11 (0.7%) | 0 (0.0%) |
| 5 to 17 Years | 0 (0.0%) | 0 (0.0%) |
| 18 to 34 Years | 38 (0.8%) | 15 (0.4%) |
| 35 to 64 Years | 276 (4.0%) | 56 (0.8%) |
| 65 to 74 Years | 56 (4.6%) | 51 (3.6%) |
| 75 Years and over | 92 (15.8%) | 159 (11.9%) |
Disability Class: Vision Difficulty
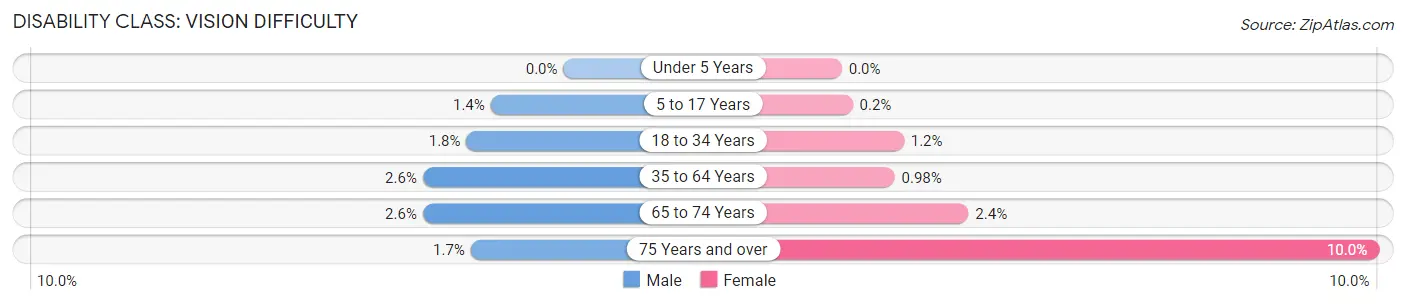
| Age Bracket | Male | Female |
| Under 5 Years | 0 (0.0%) | 0 (0.0%) |
| 5 to 17 Years | 35 (1.3%) | 5 (0.2%) |
| 18 to 34 Years | 81 (1.8%) | 41 (1.1%) |
| 35 to 64 Years | 181 (2.6%) | 66 (1.0%) |
| 65 to 74 Years | 32 (2.6%) | 33 (2.4%) |
| 75 Years and over | 10 (1.7%) | 133 (10.0%) |
Disability Class: Cognitive Difficulty
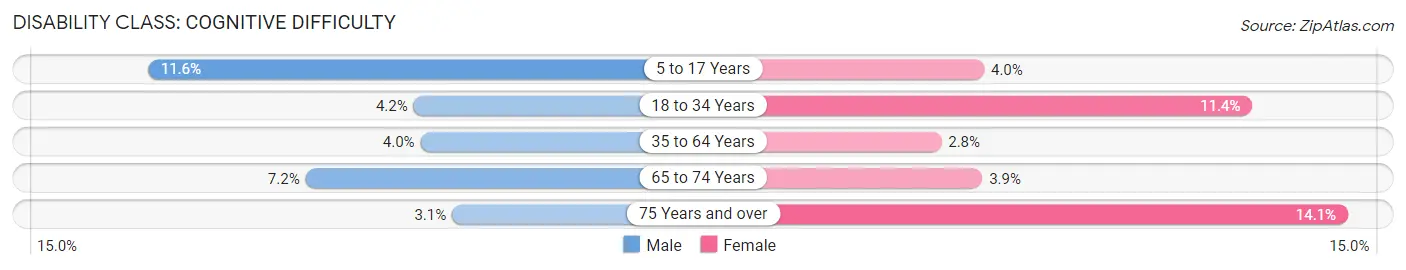
| Age Bracket | Male | Female |
| 5 to 17 Years | 301 (11.6%) | 97 (4.0%) |
| 18 to 34 Years | 188 (4.2%) | 409 (11.4%) |
| 35 to 64 Years | 276 (4.0%) | 187 (2.8%) |
| 65 to 74 Years | 88 (7.2%) | 55 (3.9%) |
| 75 Years and over | 18 (3.1%) | 188 (14.1%) |
Disability Class: Ambulatory Difficulty
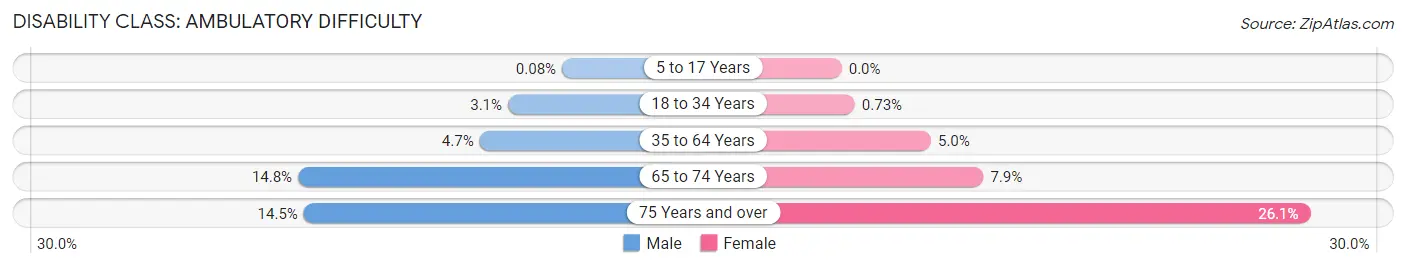
| Age Bracket | Male | Female |
| 5 to 17 Years | 2 (0.1%) | 0 (0.0%) |
| 18 to 34 Years | 139 (3.1%) | 26 (0.7%) |
| 35 to 64 Years | 324 (4.7%) | 335 (5.0%) |
| 65 to 74 Years | 181 (14.8%) | 111 (7.9%) |
| 75 Years and over | 84 (14.5%) | 348 (26.1%) |
Disability Class: Self-Care Difficulty
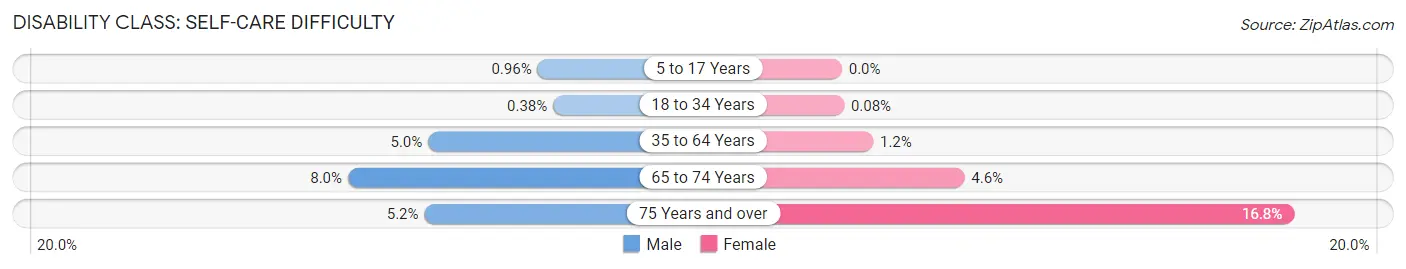
| Age Bracket | Male | Female |
| 5 to 17 Years | 25 (1.0%) | 0 (0.0%) |
| 18 to 34 Years | 17 (0.4%) | 3 (0.1%) |
| 35 to 64 Years | 348 (5.0%) | 78 (1.2%) |
| 65 to 74 Years | 98 (8.0%) | 64 (4.5%) |
| 75 Years and over | 30 (5.2%) | 224 (16.8%) |
Technology Access in Montgomery Village
Computing Device Access in Montgomery Village
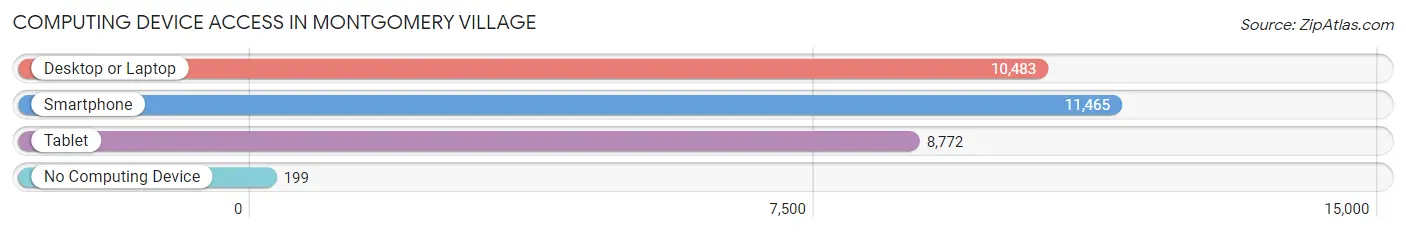
| Device Type | # Households | % Households |
| Desktop or Laptop | 10,483 | 86.4% |
| Smartphone | 11,465 | 94.5% |
| Tablet | 8,772 | 72.3% |
| No Computing Device | 199 | 1.6% |
| Total | 12,132 | 100.0% |
Internet Access in Montgomery Village
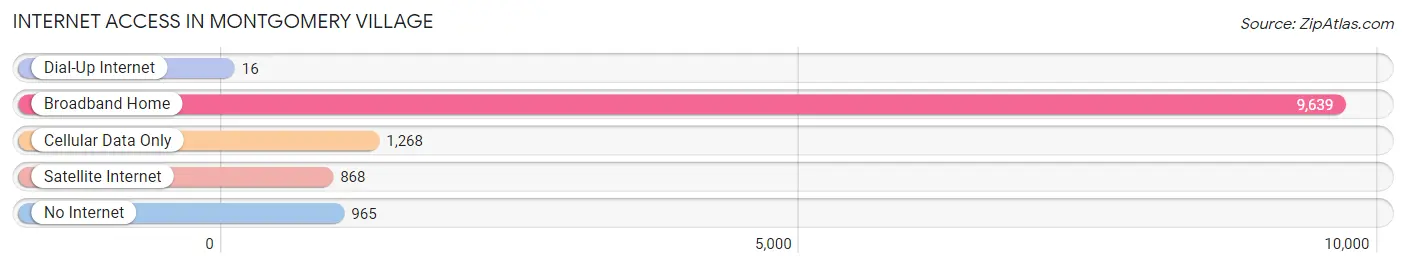
| Internet Type | # Households | % Households |
| Dial-Up Internet | 16 | 0.1% |
| Broadband Home | 9,639 | 79.4% |
| Cellular Data Only | 1,268 | 10.4% |
| Satellite Internet | 868 | 7.1% |
| No Internet | 965 | 8.0% |
| Total | 12,132 | 100.0% |
Montgomery Village Summary
Montgomery Village is a census-designated place (CDP) located in Montgomery County, Maryland, United States. It is a suburb of Washington, D.C., and part of the Washington metropolitan area. As of the 2010 census, the population of Montgomery Village was 32,032.
History
Montgomery Village was founded in 1962 by the Rouse Company, a real estate development firm. The company purchased 1,000 acres of farmland and began developing the area into a planned community. The first homes were sold in 1963 and the community was officially incorporated in 1971.
The community was designed to provide a suburban lifestyle with easy access to the city. The original plan included a shopping center, schools, churches, parks, and recreational facilities. The community was designed to be self-contained, with all the necessary amenities within walking distance.
Geography
Montgomery Village is located at 39°10'45" North, 77°13'45" West (39.179167, -77.229167). It is situated in the northern part of Montgomery County, approximately 20 miles northwest of Washington, D.C.
The CDP has a total area of 8.2 square miles, of which 8.1 square miles is land and 0.1 square miles is water. It is bordered by Gaithersburg to the north, Germantown to the east, and Clarksburg to the west.
Economy
Montgomery Village is home to a variety of businesses, including retail stores, restaurants, and professional services. The Montgomery Village Shopping Center is the largest shopping center in the area, with over 50 stores and restaurants.
The area is also home to several corporate offices, including the headquarters of the National Institutes of Health (NIH) and the National Institute of Standards and Technology (NIST).
Demographics
As of the 2010 census, there were 32,032 people, 11,845 households, and 8,717 families residing in the CDP. The population density was 3,945.3 people per square mile. The racial makeup of the CDP was 57.2% White, 18.3% African American, 0.3% Native American, 15.2% Asian, 0.1% Pacific Islander, 4.2% from other races, and 4.7% from two or more races. Hispanic or Latino of any race were 11.2% of the population.
There were 11,845 households, out of which 37.2% had children under the age of 18 living with them, 57.2% were married couples living together, 11.2% had a female householder with no husband present, and 27.2% were non-families. 21.2% of all households were made up of individuals, and 6.2% had someone living alone who was 65 years of age or older. The average household size was 2.68 and the average family size was 3.14.
In the CDP, the population was spread out, with 25.2% under the age of 18, 7.2% from 18 to 24, 33.2% from 25 to 44, 22.2% from 45 to 64, and 12.2% who were 65 years of age or older. The median age was 36 years. For every 100 females, there were 93.2 males. For every 100 females age 18 and over, there were 89.2 males.
The median income for a household in the CDP was $76,845, and the median income for a family was $86,845. Males had a median income of $60,845 versus $45,845 for females. The per capita income for the CDP was $31,845. About 3.2% of families and 4.2% of the population were below the poverty line, including 5.2% of those under age 18 and 4.2% of those age 65 or over.
Common Questions
What is Per Capita Income in Montgomery Village?
Per Capita income in Montgomery Village is $42,361.
What is the Median Family Income in Montgomery Village?
Median Family Income in Montgomery Village is $106,741.
What is the Median Household income in Montgomery Village?
Median Household Income in Montgomery Village is $91,703.
What is Income or Wage Gap in Montgomery Village?
Income or Wage Gap in Montgomery Village is 17.1%.
Women in Montgomery Village earn 82.9 cents for every dollar earned by a man.
What is Family Income Deficit in Montgomery Village?
Family Income Deficit in Montgomery Village is $14,333.
Families that are below poverty line in Montgomery Village earn $14,333 less on average than the poverty threshold level.
What is Inequality or Gini Index in Montgomery Village?
Inequality or Gini Index in Montgomery Village is 0.43.
What is the Total Population of Montgomery Village?
Total Population of Montgomery Village is 34,748.
What is the Total Male Population of Montgomery Village?
Total Male Population of Montgomery Village is 17,574.
What is the Total Female Population of Montgomery Village?
Total Female Population of Montgomery Village is 17,174.
What is the Ratio of Males per 100 Females in Montgomery Village?
There are 102.33 Males per 100 Females in Montgomery Village.
What is the Ratio of Females per 100 Males in Montgomery Village?
There are 97.72 Females per 100 Males in Montgomery Village.
What is the Median Population Age in Montgomery Village?
Median Population Age in Montgomery Village is 36.8 Years.
What is the Average Family Size in Montgomery Village
Average Family Size in Montgomery Village is 3.5 People.
What is the Average Household Size in Montgomery Village
Average Household Size in Montgomery Village is 2.9 People.
How Large is the Labor Force in Montgomery Village?
There are 19,571 People in the Labor Forcein in Montgomery Village.
What is the Percentage of People in the Labor Force in Montgomery Village?
71.6% of People are in the Labor Force in Montgomery Village.
What is the Unemployment Rate in Montgomery Village?
Unemployment Rate in Montgomery Village is 6.7%.