Chino Hills, CA Map & Demographics
Chino Hills Map
Chino Hills Overview
$46,826
PER CAPITA INCOME
$129,597
AVG FAMILY INCOME
$117,548
AVG HOUSEHOLD INCOME
20.0%
WAGE / INCOME GAP [ % ]
80.0¢/ $1
WAGE / INCOME GAP [ $ ]
$13,526
FAMILY INCOME DEFICIT
0.42
INEQUALITY / GINI INDEX
78,223
TOTAL POPULATION
39,277
MALE POPULATION
38,946
FEMALE POPULATION
100.85
MALES / 100 FEMALES
99.16
FEMALES / 100 MALES
39.4
MEDIAN AGE
3.4
AVG FAMILY SIZE
3.1
AVG HOUSEHOLD SIZE
41,124
LABOR FORCE [ PEOPLE ]
65.2%
PERCENT IN LABOR FORCE
6.2%
UNEMPLOYMENT RATE
Chino Hills Zip Codes
Income in Chino Hills
Income Overview in Chino Hills
Per Capita Income in Chino Hills is $46,826, while median incomes of families and households are $129,597 and $117,548 respectively.
| Characteristic | Number | Measure |
| Per Capita Income | 78,223 | $46,826 |
| Median Family Income | 20,785 | $129,597 |
| Mean Family Income | 20,785 | $155,384 |
| Median Household Income | 25,148 | $117,548 |
| Mean Household Income | 25,148 | $143,652 |
| Income Deficit | 20,785 | $13,526 |
| Wage / Income Gap (%) | 78,223 | 20.05% |
| Wage / Income Gap ($) | 78,223 | 79.95¢ per $1 |
| Gini / Inequality Index | 78,223 | 0.42 |
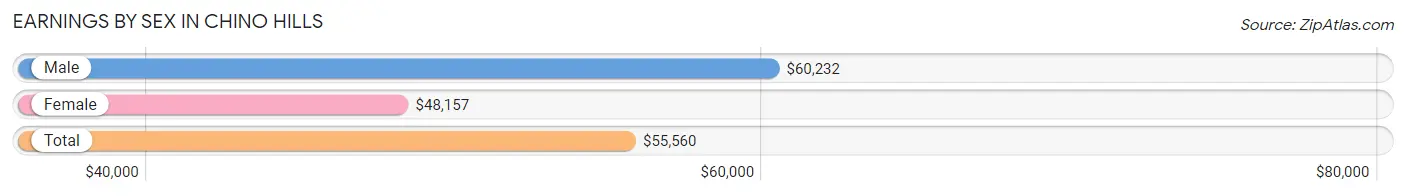
Earnings by Sex in Chino Hills
Average Earnings in Chino Hills are $55,560, $60,232 for men and $48,157 for women, a difference of 20.1%.
| Sex | Number | Average Earnings |
| Male | 23,125 (54.9%) | $60,232 |
| Female | 18,985 (45.1%) | $48,157 |
| Total | 42,110 (100.0%) | $55,560 |
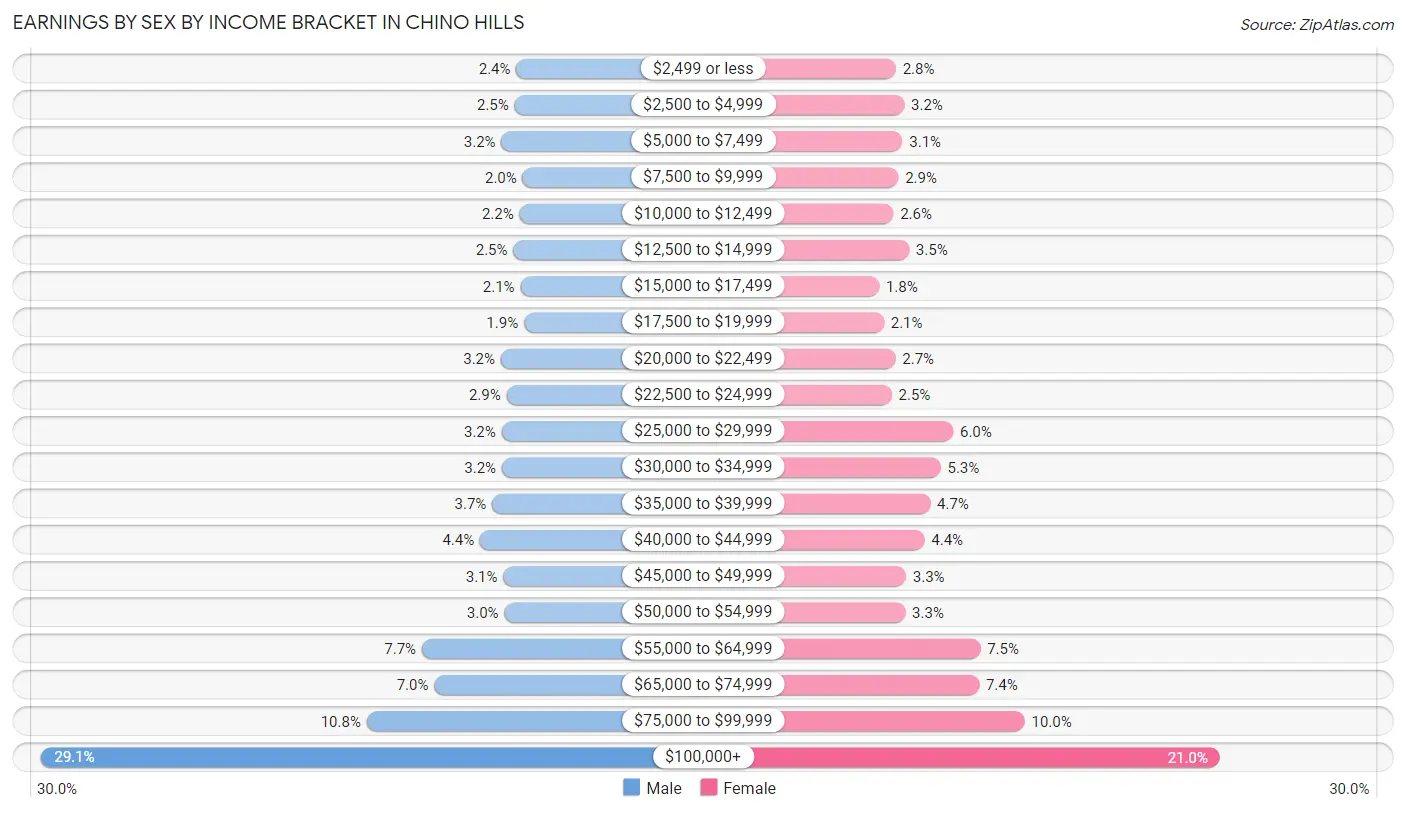
Earnings by Sex by Income Bracket in Chino Hills
The most common earnings brackets in Chino Hills are $100,000+ for men (6,721 | 29.1%) and $100,000+ for women (3,980 | 21.0%).
| Income | Male | Female |
| $2,499 or less | 546 (2.4%) | 523 (2.8%) |
| $2,500 to $4,999 | 570 (2.5%) | 612 (3.2%) |
| $5,000 to $7,499 | 740 (3.2%) | 593 (3.1%) |
| $7,500 to $9,999 | 464 (2.0%) | 549 (2.9%) |
| $10,000 to $12,499 | 504 (2.2%) | 496 (2.6%) |
| $12,500 to $14,999 | 584 (2.5%) | 663 (3.5%) |
| $15,000 to $17,499 | 492 (2.1%) | 344 (1.8%) |
| $17,500 to $19,999 | 446 (1.9%) | 394 (2.1%) |
| $20,000 to $22,499 | 747 (3.2%) | 518 (2.7%) |
| $22,500 to $24,999 | 673 (2.9%) | 478 (2.5%) |
| $25,000 to $29,999 | 738 (3.2%) | 1,133 (6.0%) |
| $30,000 to $34,999 | 733 (3.2%) | 1,001 (5.3%) |
| $35,000 to $39,999 | 861 (3.7%) | 889 (4.7%) |
| $40,000 to $44,999 | 1,017 (4.4%) | 828 (4.4%) |
| $45,000 to $49,999 | 714 (3.1%) | 630 (3.3%) |
| $50,000 to $54,999 | 700 (3.0%) | 622 (3.3%) |
| $55,000 to $64,999 | 1,773 (7.7%) | 1,424 (7.5%) |
| $65,000 to $74,999 | 1,612 (7.0%) | 1,411 (7.4%) |
| $75,000 to $99,999 | 2,490 (10.8%) | 1,897 (10.0%) |
| $100,000+ | 6,721 (29.1%) | 3,980 (21.0%) |
| Total | 23,125 (100.0%) | 18,985 (100.0%) |
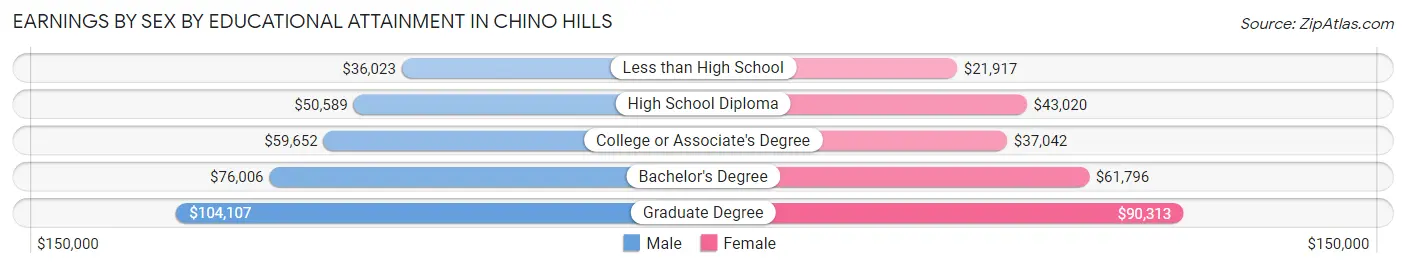
Earnings by Sex by Educational Attainment in Chino Hills
Average earnings in Chino Hills are $69,446 for men and $54,974 for women, a difference of 20.8%. Men with an educational attainment of graduate degree enjoy the highest average annual earnings of $104,107, while those with less than high school education earn the least with $36,023. Women with an educational attainment of graduate degree earn the most with the average annual earnings of $90,313, while those with less than high school education have the smallest earnings of $21,917.
| Educational Attainment | Male Income | Female Income |
| Less than High School | $36,023 | $21,917 |
| High School Diploma | $50,589 | $43,020 |
| College or Associate's Degree | $59,652 | $37,042 |
| Bachelor's Degree | $76,006 | $61,796 |
| Graduate Degree | $104,107 | $90,313 |
| Total | $69,446 | $54,974 |
Family Income in Chino Hills
Family Income Brackets in Chino Hills
According to the Chino Hills family income data, there are 5,404 families falling into the $200,000+ income range, which is the most common income bracket and makes up 26.0% of all families. Conversely, the $10,000 to $14,999 income bracket is the least frequent group with only 208 families (1.0%) belonging to this category.
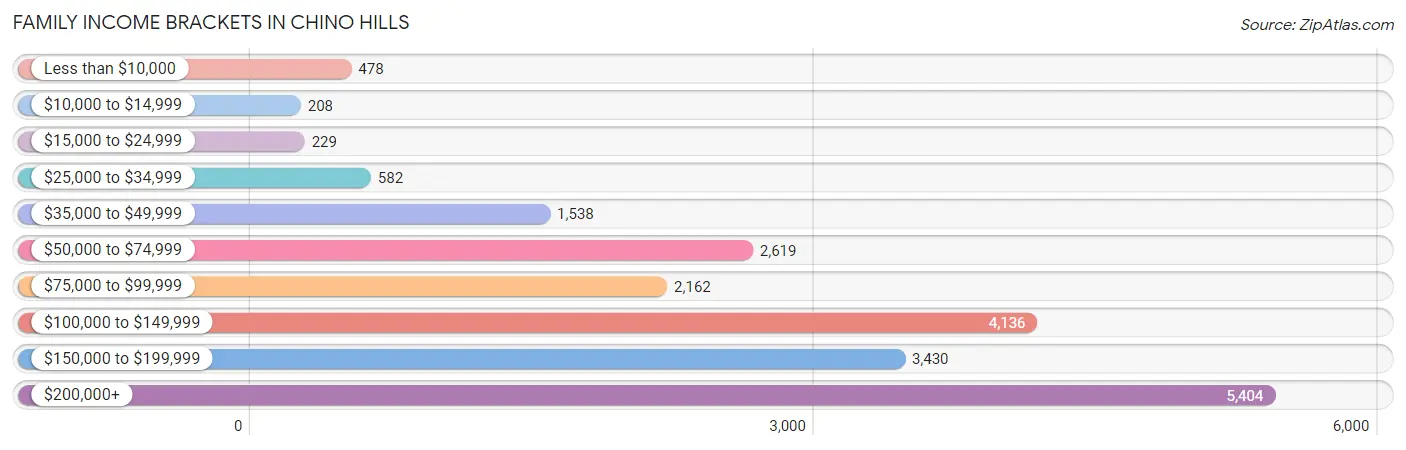
| Income Bracket | # Families | % Families |
| Less than $10,000 | 478 | 2.3% |
| $10,000 to $14,999 | 208 | 1.0% |
| $15,000 to $24,999 | 229 | 1.1% |
| $25,000 to $34,999 | 582 | 2.8% |
| $35,000 to $49,999 | 1,538 | 7.4% |
| $50,000 to $74,999 | 2,619 | 12.6% |
| $75,000 to $99,999 | 2,162 | 10.4% |
| $100,000 to $149,999 | 4,136 | 19.9% |
| $150,000 to $199,999 | 3,430 | 16.5% |
| $200,000+ | 5,404 | 26.0% |
Family Income by Famaliy Size in Chino Hills
5-person families (1,821 | 8.8%) account for the highest median family income in Chino Hills with $167,438 per family, while 2-person families (7,592 | 36.5%) have the highest median income of $53,384 per family member.
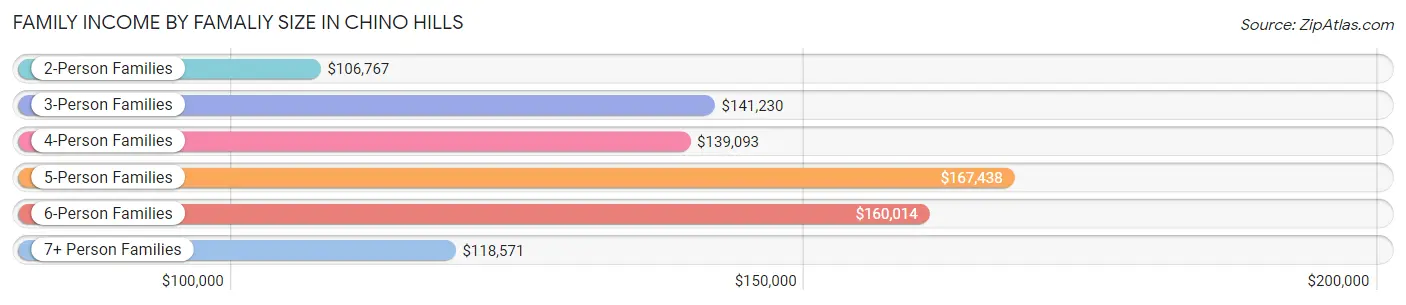
| Income Bracket | # Families | Median Income |
| 2-Person Families | 7,592 (36.5%) | $106,767 |
| 3-Person Families | 5,290 (25.5%) | $141,230 |
| 4-Person Families | 4,919 (23.7%) | $139,093 |
| 5-Person Families | 1,821 (8.8%) | $167,438 |
| 6-Person Families | 915 (4.4%) | $160,014 |
| 7+ Person Families | 248 (1.2%) | $118,571 |
| Total | 20,785 (100.0%) | $129,597 |
Family Income by Number of Earners in Chino Hills
The median family income in Chino Hills is $129,597, with families comprising 3+ earners (3,395) having the highest median family income of $204,177, while families with no earners (1,750) have the lowest median family income of $62,228, accounting for 16.3% and 8.4% of families, respectively.
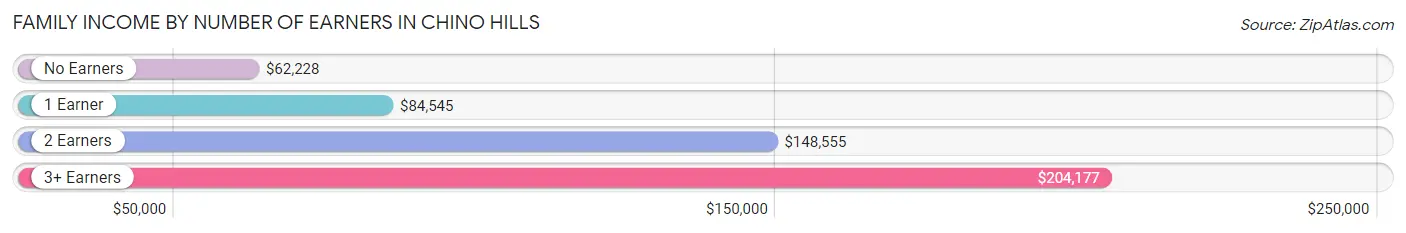
| Number of Earners | # Families | Median Income |
| No Earners | 1,750 (8.4%) | $62,228 |
| 1 Earner | 6,356 (30.6%) | $84,545 |
| 2 Earners | 9,284 (44.7%) | $148,555 |
| 3+ Earners | 3,395 (16.3%) | $204,177 |
| Total | 20,785 (100.0%) | $129,597 |
Household Income in Chino Hills
Household Income Brackets in Chino Hills
With 5,834 households falling in the category, the $200,000+ income range is the most frequent in Chino Hills, accounting for 23.2% of all households. In contrast, only 377 households (1.5%) fall into the $15,000 to $24,999 income bracket, making it the least populous group.
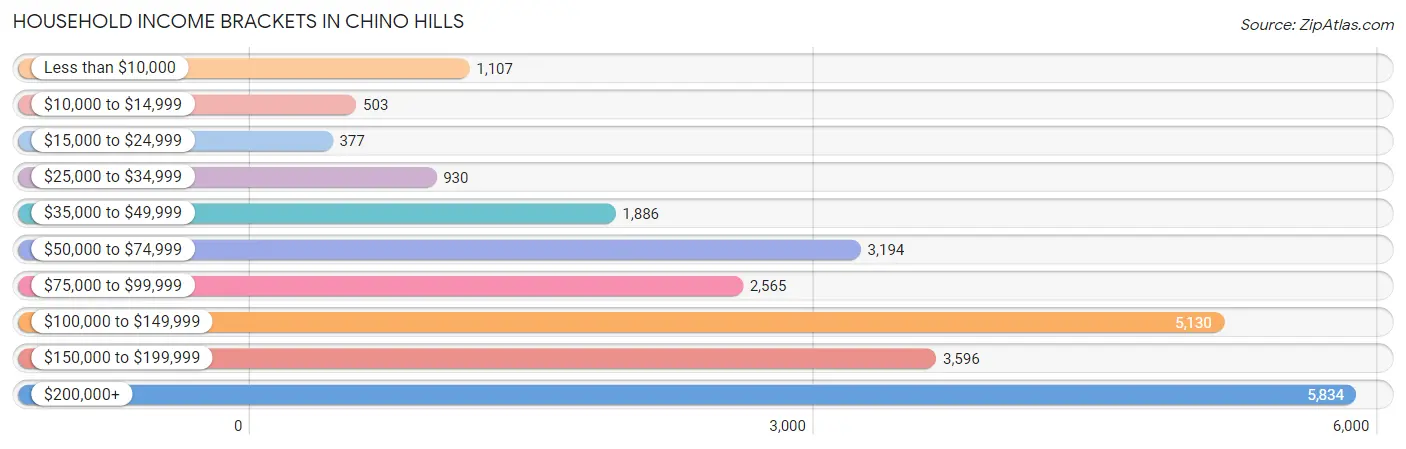
| Income Bracket | # Households | % Households |
| Less than $10,000 | 1,107 | 4.4% |
| $10,000 to $14,999 | 503 | 2.0% |
| $15,000 to $24,999 | 377 | 1.5% |
| $25,000 to $34,999 | 930 | 3.7% |
| $35,000 to $49,999 | 1,886 | 7.5% |
| $50,000 to $74,999 | 3,194 | 12.7% |
| $75,000 to $99,999 | 2,565 | 10.2% |
| $100,000 to $149,999 | 5,130 | 20.4% |
| $150,000 to $199,999 | 3,596 | 14.3% |
| $200,000+ | 5,834 | 23.2% |
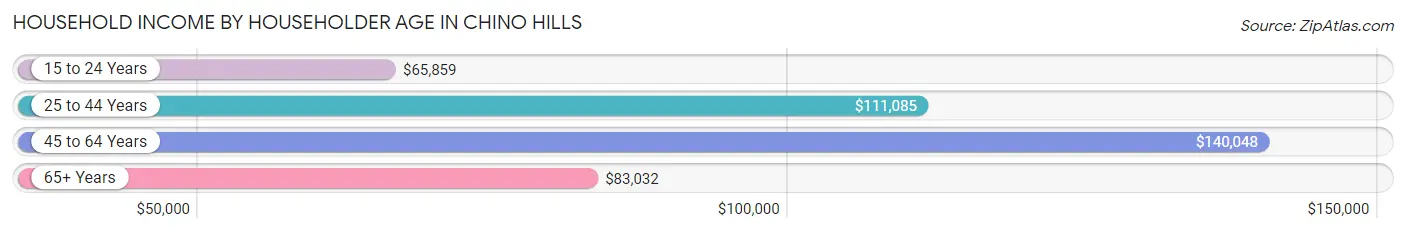
Household Income by Householder Age in Chino Hills
The median household income in Chino Hills is $117,548, with the highest median household income of $140,048 found in the 45 to 64 years age bracket for the primary householder. A total of 11,897 households (47.3%) fall into this category. Meanwhile, the 15 to 24 years age bracket for the primary householder has the lowest median household income of $65,859, with 478 households (1.9%) in this group.
| Income Bracket | # Households | Median Income |
| 15 to 24 Years | 478 (1.9%) | $65,859 |
| 25 to 44 Years | 7,652 (30.4%) | $111,085 |
| 45 to 64 Years | 11,897 (47.3%) | $140,048 |
| 65+ Years | 5,121 (20.4%) | $83,032 |
| Total | 25,148 (100.0%) | $117,548 |
Poverty in Chino Hills
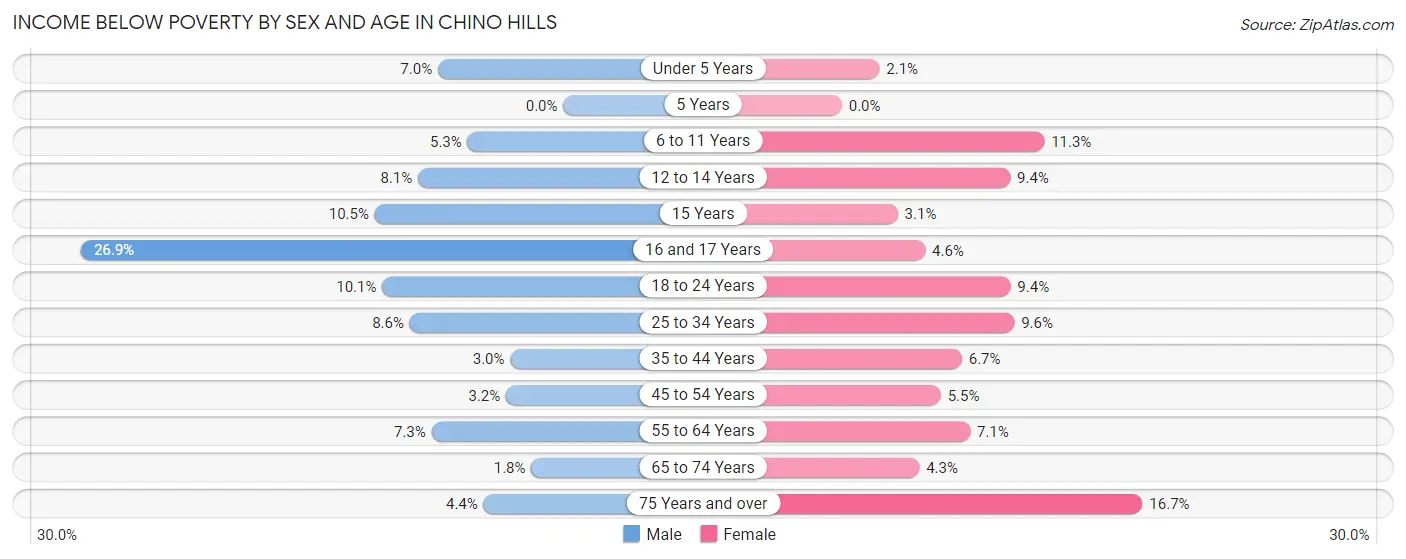
Income Below Poverty by Sex and Age in Chino Hills
With 6.7% poverty level for males and 7.6% for females among the residents of Chino Hills, 16 and 17 year old males and 75 year old and over females are the most vulnerable to poverty, with 398 males (26.9%) and 408 females (16.7%) in their respective age groups living below the poverty level.
| Age Bracket | Male | Female |
| Under 5 Years | 164 (7.0%) | 50 (2.1%) |
| 5 Years | 0 (0.0%) | 0 (0.0%) |
| 6 to 11 Years | 175 (5.3%) | 260 (11.3%) |
| 12 to 14 Years | 128 (8.1%) | 144 (9.4%) |
| 15 Years | 53 (10.5%) | 15 (3.1%) |
| 16 and 17 Years | 398 (26.9%) | 32 (4.6%) |
| 18 to 24 Years | 412 (10.1%) | 282 (9.4%) |
| 25 to 34 Years | 468 (8.6%) | 535 (9.6%) |
| 35 to 44 Years | 127 (2.9%) | 351 (6.7%) |
| 45 to 54 Years | 175 (3.2%) | 301 (5.5%) |
| 55 to 64 Years | 421 (7.3%) | 439 (7.1%) |
| 65 to 74 Years | 57 (1.8%) | 143 (4.3%) |
| 75 Years and over | 60 (4.4%) | 408 (16.7%) |
| Total | 2,638 (6.7%) | 2,960 (7.6%) |
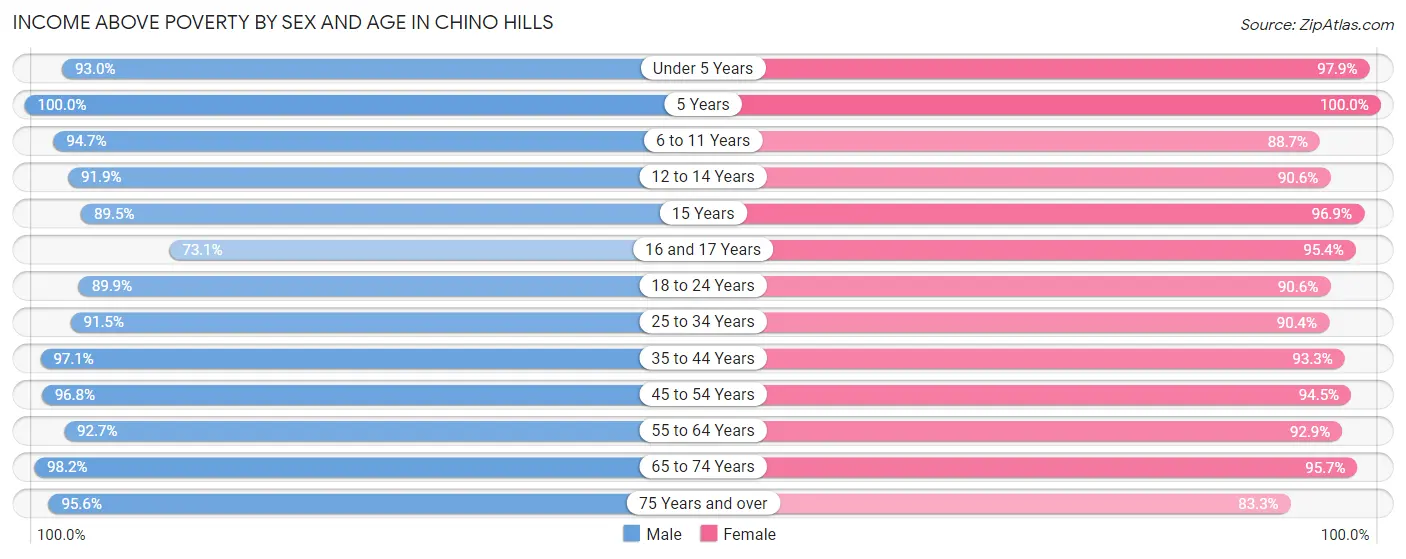
Income Above Poverty by Sex and Age in Chino Hills
According to the poverty statistics in Chino Hills, males aged 5 years and females aged 5 years are the age groups that are most secure financially, with 100.0% of males and 100.0% of females in these age groups living above the poverty line.
| Age Bracket | Male | Female |
| Under 5 Years | 2,184 (93.0%) | 2,340 (97.9%) |
| 5 Years | 362 (100.0%) | 307 (100.0%) |
| 6 to 11 Years | 3,111 (94.7%) | 2,047 (88.7%) |
| 12 to 14 Years | 1,454 (91.9%) | 1,393 (90.6%) |
| 15 Years | 452 (89.5%) | 467 (96.9%) |
| 16 and 17 Years | 1,084 (73.1%) | 657 (95.4%) |
| 18 to 24 Years | 3,674 (89.9%) | 2,721 (90.6%) |
| 25 to 34 Years | 5,008 (91.4%) | 5,037 (90.4%) |
| 35 to 44 Years | 4,172 (97.1%) | 4,907 (93.3%) |
| 45 to 54 Years | 5,313 (96.8%) | 5,160 (94.5%) |
| 55 to 64 Years | 5,316 (92.7%) | 5,708 (92.9%) |
| 65 to 74 Years | 3,145 (98.2%) | 3,178 (95.7%) |
| 75 Years and over | 1,291 (95.6%) | 2,030 (83.3%) |
| Total | 36,566 (93.3%) | 35,952 (92.4%) |
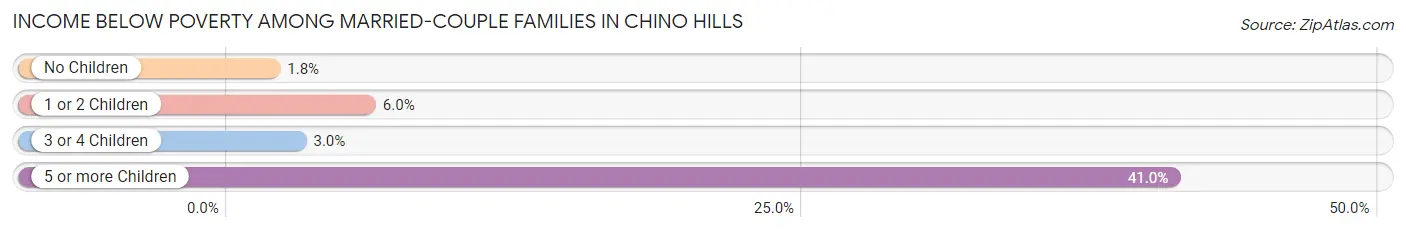
Income Below Poverty Among Married-Couple Families in Chino Hills
The poverty statistics for married-couple families in Chino Hills show that 3.7% or 624 of the total 16,727 families live below the poverty line. Families with 5 or more children have the highest poverty rate of 41.0%, comprising of 41 families. On the other hand, families with no children have the lowest poverty rate of 1.8%, which includes 171 families.
| Children | Above Poverty | Below Poverty |
| No Children | 9,134 (98.2%) | 171 (1.8%) |
| 1 or 2 Children | 6,031 (94.0%) | 385 (6.0%) |
| 3 or 4 Children | 879 (97.0%) | 27 (3.0%) |
| 5 or more Children | 59 (59.0%) | 41 (41.0%) |
| Total | 16,103 (96.3%) | 624 (3.7%) |
Income Below Poverty Among Single-Parent Households in Chino Hills
According to the poverty data in Chino Hills, 5.4% or 85 single-father households and 9.3% or 230 single-mother households are living below the poverty line. Among single-father households, those with no children have the highest poverty rate, with 59 households (5.7%) experiencing poverty. Likewise, among single-mother households, those with 3 or 4 children have the highest poverty rate, with 101 households (62.0%) falling below the poverty line.
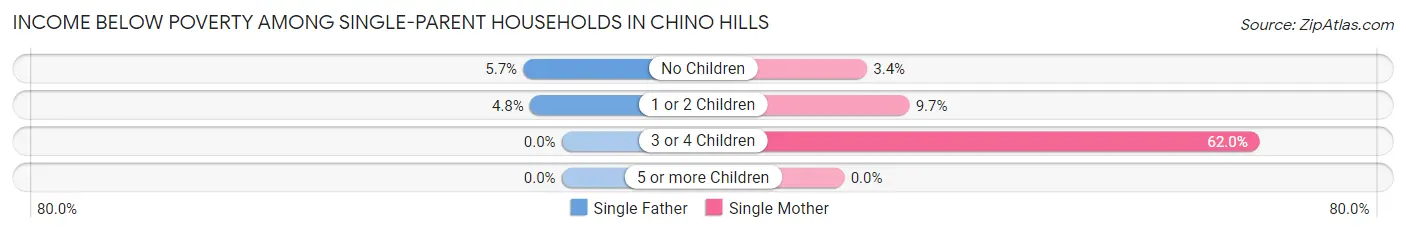
| Children | Single Father | Single Mother |
| No Children | 59 (5.7%) | 50 (3.4%) |
| 1 or 2 Children | 26 (4.8%) | 79 (9.7%) |
| 3 or 4 Children | 0 (0.0%) | 101 (62.0%) |
| 5 or more Children | 0 (0.0%) | 0 (0.0%) |
| Total | 85 (5.4%) | 230 (9.3%) |
Income Below Poverty Among Married-Couple vs Single-Parent Households in Chino Hills
The poverty data for Chino Hills shows that 624 of the married-couple family households (3.7%) and 315 of the single-parent households (7.8%) are living below the poverty level. Within the married-couple family households, those with 5 or more children have the highest poverty rate, with 41 households (41.0%) falling below the poverty line. Among the single-parent households, those with 3 or 4 children have the highest poverty rate, with 101 household (58.1%) living below poverty.
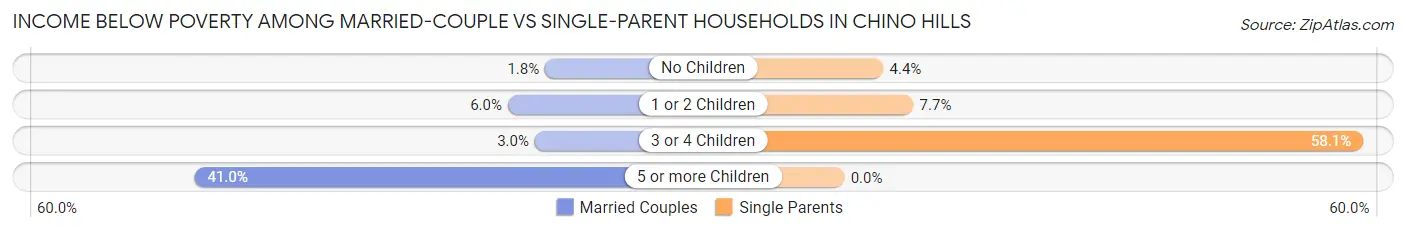
| Children | Married-Couple Families | Single-Parent Households |
| No Children | 171 (1.8%) | 109 (4.3%) |
| 1 or 2 Children | 385 (6.0%) | 105 (7.7%) |
| 3 or 4 Children | 27 (3.0%) | 101 (58.1%) |
| 5 or more Children | 41 (41.0%) | 0 (0.0%) |
| Total | 624 (3.7%) | 315 (7.8%) |
Race in Chino Hills
The most populous races in Chino Hills are Asian (31,279 | 40.0%), White / Caucasian (25,697 | 32.9%), and Hispanic or Latino (22,465 | 28.7%).
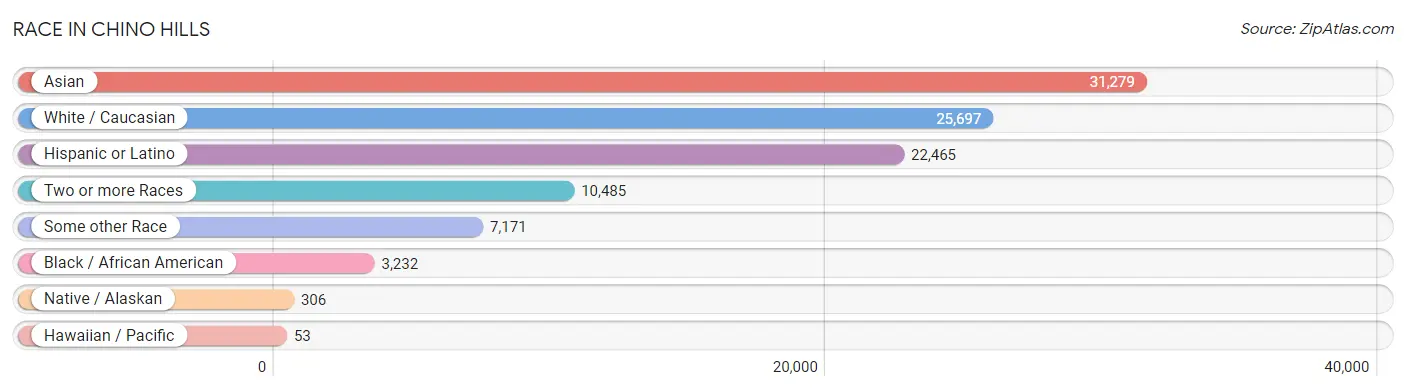
| Race | # Population | % Population |
| Asian | 31,279 | 40.0% |
| Black / African American | 3,232 | 4.1% |
| Hawaiian / Pacific | 53 | 0.1% |
| Hispanic or Latino | 22,465 | 28.7% |
| Native / Alaskan | 306 | 0.4% |
| White / Caucasian | 25,697 | 32.9% |
| Two or more Races | 10,485 | 13.4% |
| Some other Race | 7,171 | 9.2% |
| Total | 78,223 | 100.0% |
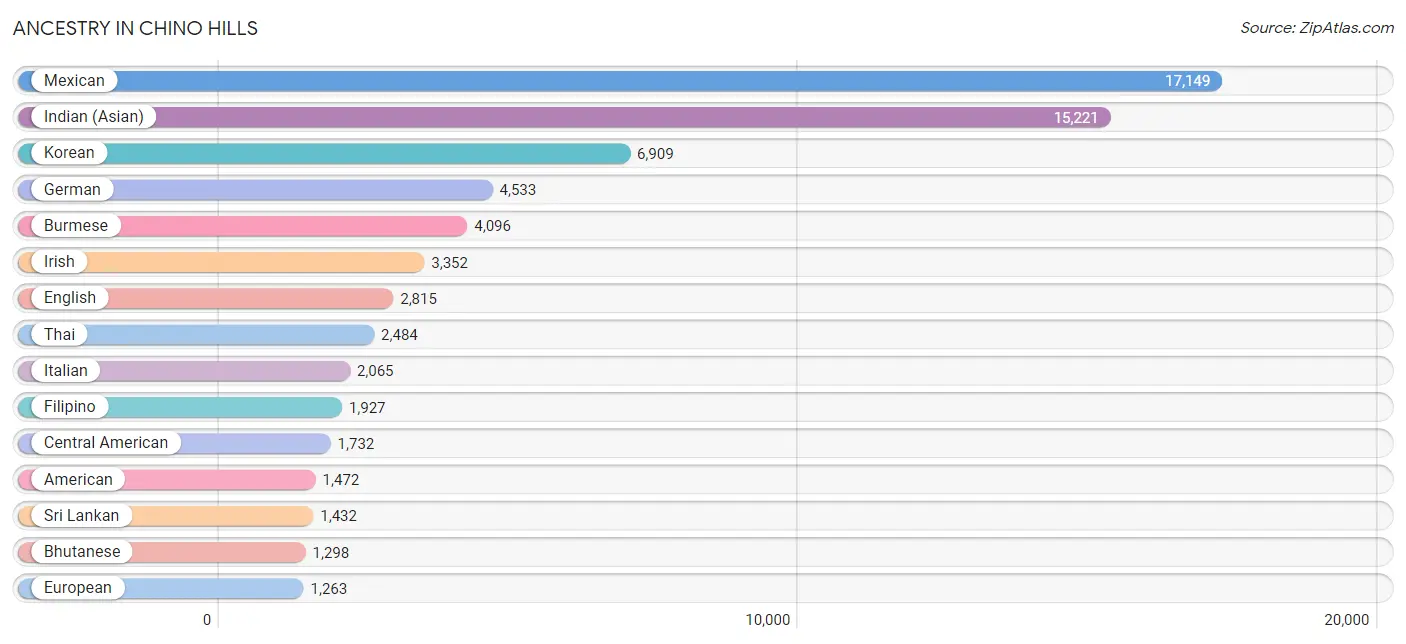
Ancestry in Chino Hills
The most populous ancestries reported in Chino Hills are Mexican (17,149 | 21.9%), Indian (Asian) (15,221 | 19.5%), Korean (6,909 | 8.8%), German (4,533 | 5.8%), and Burmese (4,096 | 5.2%), together accounting for 61.2% of all Chino Hills residents.
| Ancestry | # Population | % Population |
| African | 102 | 0.1% |
| American | 1,472 | 1.9% |
| Apache | 61 | 0.1% |
| Arab | 781 | 1.0% |
| Argentinean | 80 | 0.1% |
| Armenian | 179 | 0.2% |
| Australian | 8 | 0.0% |
| Austrian | 165 | 0.2% |
| Bangladeshi | 93 | 0.1% |
| Basque | 18 | 0.0% |
| Belgian | 73 | 0.1% |
| Belizean | 63 | 0.1% |
| Bhutanese | 1,298 | 1.7% |
| Blackfeet | 22 | 0.0% |
| Brazilian | 84 | 0.1% |
| British | 952 | 1.2% |
| Bulgarian | 31 | 0.0% |
| Burmese | 4,096 | 5.2% |
| Canadian | 55 | 0.1% |
| Celtic | 6 | 0.0% |
| Central American | 1,732 | 2.2% |
| Central American Indian | 35 | 0.0% |
| Cherokee | 84 | 0.1% |
| Cheyenne | 75 | 0.1% |
| Chilean | 105 | 0.1% |
| Chinese | 15 | 0.0% |
| Choctaw | 14 | 0.0% |
| Colombian | 187 | 0.2% |
| Comanche | 20 | 0.0% |
| Costa Rican | 73 | 0.1% |
| Croatian | 20 | 0.0% |
| Cuban | 221 | 0.3% |
| Czech | 286 | 0.4% |
| Czechoslovakian | 61 | 0.1% |
| Danish | 110 | 0.1% |
| Dominican | 62 | 0.1% |
| Dutch | 548 | 0.7% |
| Eastern European | 567 | 0.7% |
| Ecuadorian | 118 | 0.2% |
| Egyptian | 314 | 0.4% |
| English | 2,815 | 3.6% |
| Estonian | 27 | 0.0% |
| Ethiopian | 136 | 0.2% |
| European | 1,263 | 1.6% |
| Filipino | 1,927 | 2.5% |
| Finnish | 104 | 0.1% |
| French | 1,082 | 1.4% |
| French Canadian | 163 | 0.2% |
| German | 4,533 | 5.8% |
| Greek | 162 | 0.2% |
| Guatemalan | 313 | 0.4% |
| Honduran | 131 | 0.2% |
| Hopi | 8 | 0.0% |
| Hungarian | 235 | 0.3% |
| Icelander | 36 | 0.1% |
| Indian (Asian) | 15,221 | 19.5% |
| Indonesian | 30 | 0.0% |
| Iranian | 388 | 0.5% |
| Irish | 3,352 | 4.3% |
| Italian | 2,065 | 2.6% |
| Jamaican | 44 | 0.1% |
| Japanese | 101 | 0.1% |
| Korean | 6,909 | 8.8% |
| Laotian | 669 | 0.9% |
| Lebanese | 127 | 0.2% |
| Lithuanian | 32 | 0.0% |
| Luxembourger | 10 | 0.0% |
| Malaysian | 34 | 0.0% |
| Mexican | 17,149 | 21.9% |
| Mexican American Indian | 477 | 0.6% |
| Mongolian | 127 | 0.2% |
| Native Hawaiian | 108 | 0.1% |
| Navajo | 12 | 0.0% |
| Nicaraguan | 419 | 0.5% |
| Nigerian | 496 | 0.6% |
| Northern European | 105 | 0.1% |
| Norwegian | 568 | 0.7% |
| Pakistani | 576 | 0.7% |
| Palestinian | 167 | 0.2% |
| Panamanian | 26 | 0.0% |
| Peruvian | 363 | 0.5% |
| Polish | 705 | 0.9% |
| Portuguese | 208 | 0.3% |
| Pueblo | 61 | 0.1% |
| Puerto Rican | 617 | 0.8% |
| Romanian | 10 | 0.0% |
| Russian | 497 | 0.6% |
| Salvadoran | 770 | 1.0% |
| Samoan | 18 | 0.0% |
| Scandinavian | 95 | 0.1% |
| Scotch-Irish | 217 | 0.3% |
| Scottish | 361 | 0.5% |
| Serbian | 102 | 0.1% |
| Sioux | 111 | 0.1% |
| Slovak | 127 | 0.2% |
| Slovene | 87 | 0.1% |
| South American | 892 | 1.1% |
| South American Indian | 6 | 0.0% |
| Spaniard | 641 | 0.8% |
| Spanish | 357 | 0.5% |
| Spanish American Indian | 10 | 0.0% |
| Sri Lankan | 1,432 | 1.8% |
| Subsaharan African | 734 | 0.9% |
| Swedish | 366 | 0.5% |
| Swiss | 99 | 0.1% |
| Syrian | 21 | 0.0% |
| Thai | 2,484 | 3.2% |
| Ukrainian | 76 | 0.1% |
| Uruguayan | 39 | 0.1% |
| Vietnamese | 123 | 0.2% |
| Welsh | 106 | 0.1% |
| Yaqui | 174 | 0.2% |
| Yugoslavian | 19 | 0.0% | View All 113 Rows |
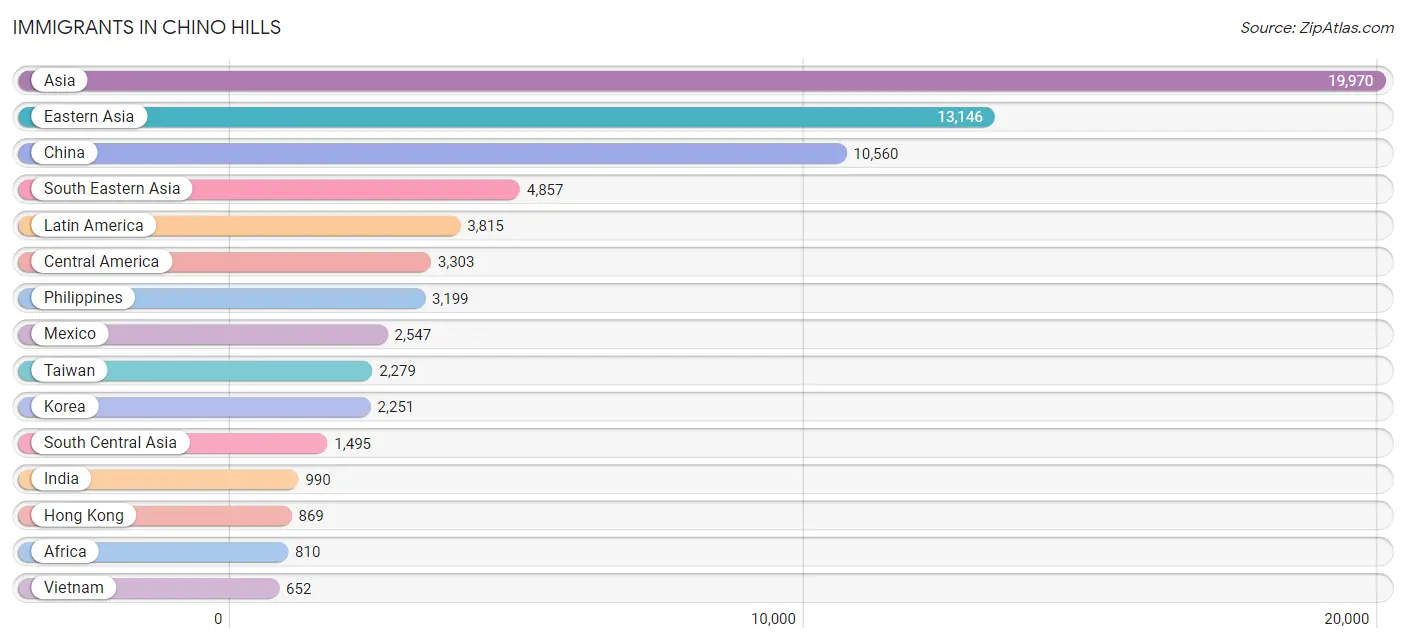
Immigrants in Chino Hills
The most numerous immigrant groups reported in Chino Hills came from Asia (19,970 | 25.5%), Eastern Asia (13,146 | 16.8%), China (10,560 | 13.5%), South Eastern Asia (4,857 | 6.2%), and Latin America (3,815 | 4.9%), together accounting for 66.9% of all Chino Hills residents.
| Immigration Origin | # Population | % Population |
| Africa | 810 | 1.0% |
| Argentina | 28 | 0.0% |
| Asia | 19,970 | 25.5% |
| Austria | 12 | 0.0% |
| Bangladesh | 103 | 0.1% |
| Bosnia and Herzegovina | 30 | 0.0% |
| Brazil | 60 | 0.1% |
| Bulgaria | 15 | 0.0% |
| Cambodia | 61 | 0.1% |
| Canada | 123 | 0.2% |
| Caribbean | 106 | 0.1% |
| Central America | 3,303 | 4.2% |
| Chile | 20 | 0.0% |
| China | 10,560 | 13.5% |
| Colombia | 33 | 0.0% |
| Costa Rica | 59 | 0.1% |
| Croatia | 14 | 0.0% |
| Cuba | 66 | 0.1% |
| Czechoslovakia | 36 | 0.1% |
| Denmark | 10 | 0.0% |
| Dominican Republic | 17 | 0.0% |
| Eastern Africa | 203 | 0.3% |
| Eastern Asia | 13,146 | 16.8% |
| Eastern Europe | 132 | 0.2% |
| Ecuador | 57 | 0.1% |
| Egypt | 221 | 0.3% |
| El Salvador | 274 | 0.4% |
| England | 72 | 0.1% |
| Ethiopia | 99 | 0.1% |
| Europe | 636 | 0.8% |
| France | 16 | 0.0% |
| Germany | 114 | 0.2% |
| Ghana | 67 | 0.1% |
| Greece | 34 | 0.0% |
| Guatemala | 272 | 0.4% |
| Honduras | 64 | 0.1% |
| Hong Kong | 869 | 1.1% |
| India | 990 | 1.3% |
| Indonesia | 406 | 0.5% |
| Iran | 217 | 0.3% |
| Ireland | 9 | 0.0% |
| Israel | 4 | 0.0% |
| Italy | 15 | 0.0% |
| Japan | 335 | 0.4% |
| Jordan | 19 | 0.0% |
| Kenya | 50 | 0.1% |
| Korea | 2,251 | 2.9% |
| Kuwait | 119 | 0.2% |
| Laos | 46 | 0.1% |
| Latin America | 3,815 | 4.9% |
| Lebanon | 69 | 0.1% |
| Malaysia | 123 | 0.2% |
| Mexico | 2,547 | 3.3% |
| Netherlands | 25 | 0.0% |
| Nicaragua | 61 | 0.1% |
| Nigeria | 233 | 0.3% |
| Northern Africa | 221 | 0.3% |
| Northern Europe | 220 | 0.3% |
| Pakistan | 169 | 0.2% |
| Panama | 26 | 0.0% |
| Peru | 180 | 0.2% |
| Philippines | 3,199 | 4.1% |
| Portugal | 68 | 0.1% |
| Romania | 10 | 0.0% |
| Saudi Arabia | 2 | 0.0% |
| Singapore | 19 | 0.0% |
| South America | 406 | 0.5% |
| South Central Asia | 1,495 | 1.9% |
| South Eastern Asia | 4,857 | 6.2% |
| Southern Europe | 117 | 0.2% |
| Sri Lanka | 16 | 0.0% |
| Sweden | 77 | 0.1% |
| Syria | 21 | 0.0% |
| Taiwan | 2,279 | 2.9% |
| Thailand | 221 | 0.3% |
| Turkey | 40 | 0.1% |
| Uganda | 20 | 0.0% |
| Ukraine | 27 | 0.0% |
| Uruguay | 17 | 0.0% |
| Vietnam | 652 | 0.8% |
| West Indies | 23 | 0.0% |
| Western Africa | 300 | 0.4% |
| Western Asia | 453 | 0.6% |
| Western Europe | 167 | 0.2% |
| Zimbabwe | 34 | 0.0% | View All 85 Rows |
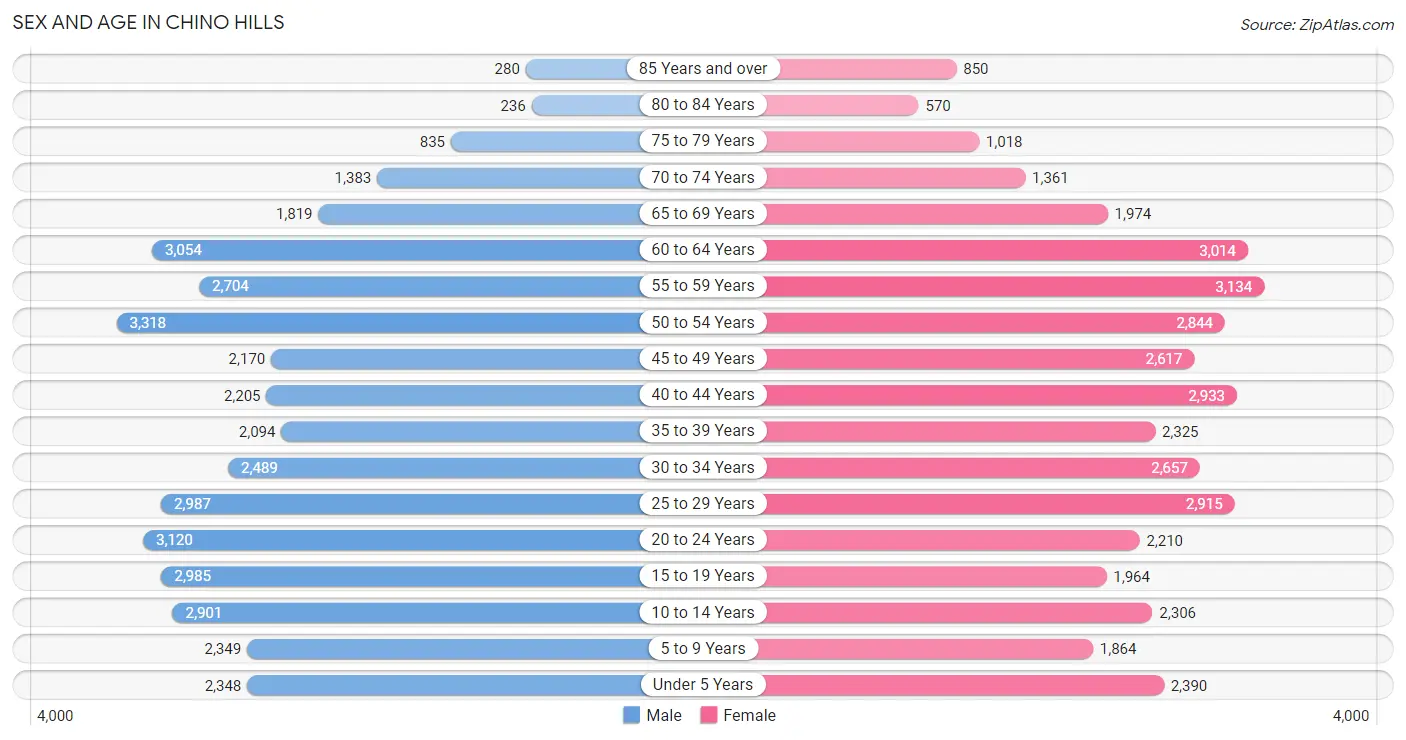
Sex and Age in Chino Hills
Sex and Age in Chino Hills
The most populous age groups in Chino Hills are 50 to 54 Years (3,318 | 8.5%) for men and 55 to 59 Years (3,134 | 8.1%) for women.
| Age Bracket | Male | Female |
| Under 5 Years | 2,348 (6.0%) | 2,390 (6.1%) |
| 5 to 9 Years | 2,349 (6.0%) | 1,864 (4.8%) |
| 10 to 14 Years | 2,901 (7.4%) | 2,306 (5.9%) |
| 15 to 19 Years | 2,985 (7.6%) | 1,964 (5.0%) |
| 20 to 24 Years | 3,120 (7.9%) | 2,210 (5.7%) |
| 25 to 29 Years | 2,987 (7.6%) | 2,915 (7.5%) |
| 30 to 34 Years | 2,489 (6.3%) | 2,657 (6.8%) |
| 35 to 39 Years | 2,094 (5.3%) | 2,325 (6.0%) |
| 40 to 44 Years | 2,205 (5.6%) | 2,933 (7.5%) |
| 45 to 49 Years | 2,170 (5.5%) | 2,617 (6.7%) |
| 50 to 54 Years | 3,318 (8.5%) | 2,844 (7.3%) |
| 55 to 59 Years | 2,704 (6.9%) | 3,134 (8.1%) |
| 60 to 64 Years | 3,054 (7.8%) | 3,014 (7.7%) |
| 65 to 69 Years | 1,819 (4.6%) | 1,974 (5.1%) |
| 70 to 74 Years | 1,383 (3.5%) | 1,361 (3.5%) |
| 75 to 79 Years | 835 (2.1%) | 1,018 (2.6%) |
| 80 to 84 Years | 236 (0.6%) | 570 (1.5%) |
| 85 Years and over | 280 (0.7%) | 850 (2.2%) |
| Total | 39,277 (100.0%) | 38,946 (100.0%) |
Families and Households in Chino Hills
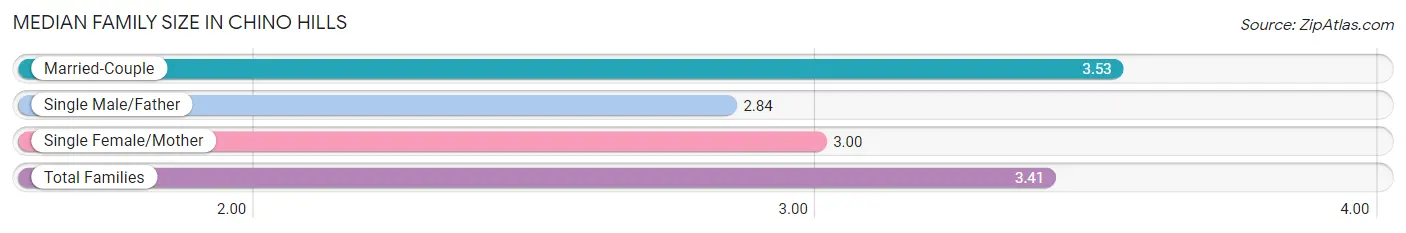
Median Family Size in Chino Hills
The median family size in Chino Hills is 3.41 persons per family, with married-couple families (16,727 | 80.5%) accounting for the largest median family size of 3.53 persons per family. On the other hand, single male/father families (1,585 | 7.6%) represent the smallest median family size with 2.84 persons per family.
| Family Type | # Families | Family Size |
| Married-Couple | 16,727 (80.5%) | 3.53 |
| Single Male/Father | 1,585 (7.6%) | 2.84 |
| Single Female/Mother | 2,473 (11.9%) | 3.00 |
| Total Families | 20,785 (100.0%) | 3.41 |
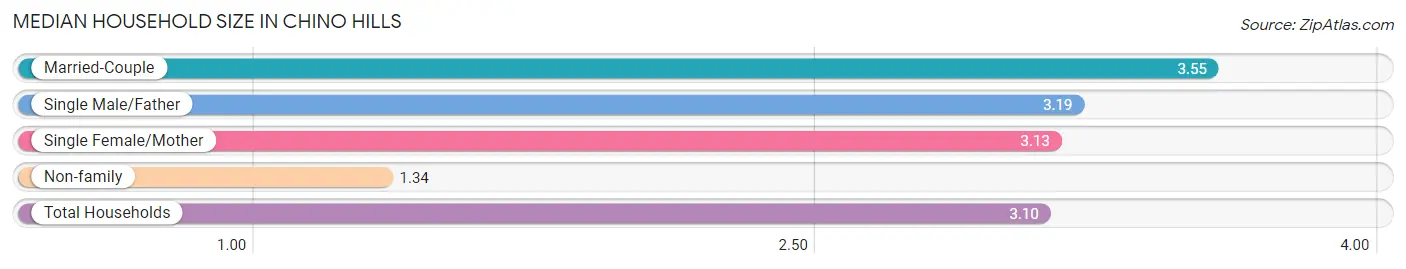
Median Household Size in Chino Hills
The median household size in Chino Hills is 3.10 persons per household, with married-couple households (16,727 | 66.5%) accounting for the largest median household size of 3.55 persons per household. non-family households (4,363 | 17.3%) represent the smallest median household size with 1.34 persons per household.
| Household Type | # Households | Household Size |
| Married-Couple | 16,727 (66.5%) | 3.55 |
| Single Male/Father | 1,585 (6.3%) | 3.19 |
| Single Female/Mother | 2,473 (9.8%) | 3.13 |
| Non-family | 4,363 (17.3%) | 1.34 |
| Total Households | 25,148 (100.0%) | 3.10 |
Household Size by Marriage Status in Chino Hills
Out of a total of 25,148 households in Chino Hills, 20,785 (82.7%) are family households, while 4,363 (17.3%) are nonfamily households. The most numerous type of family households are 2-person households, comprising 7,015, and the most common type of nonfamily households are 1-person households, comprising 3,303.
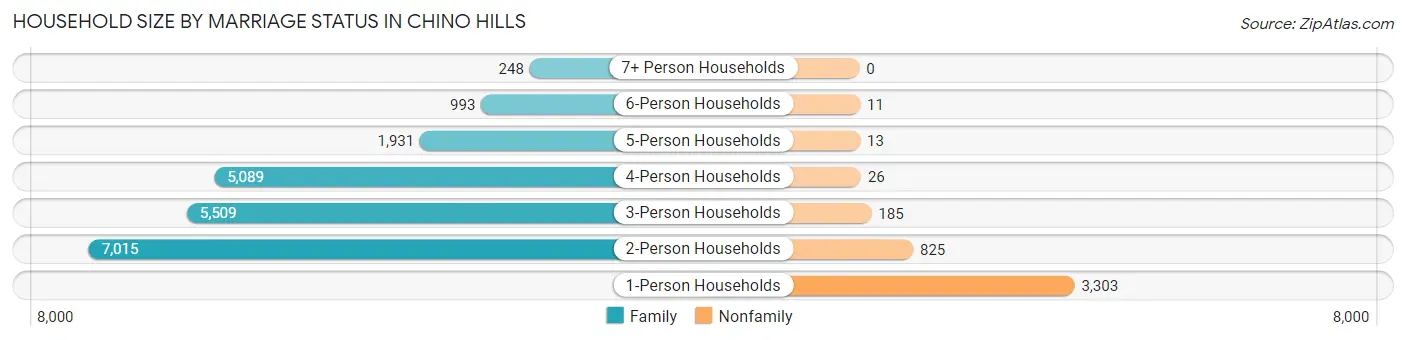
| Household Size | Family Households | Nonfamily Households |
| 1-Person Households | - | 3,303 (13.1%) |
| 2-Person Households | 7,015 (27.9%) | 825 (3.3%) |
| 3-Person Households | 5,509 (21.9%) | 185 (0.7%) |
| 4-Person Households | 5,089 (20.2%) | 26 (0.1%) |
| 5-Person Households | 1,931 (7.7%) | 13 (0.1%) |
| 6-Person Households | 993 (4.0%) | 11 (0.0%) |
| 7+ Person Households | 248 (1.0%) | 0 (0.0%) |
| Total | 20,785 (82.7%) | 4,363 (17.3%) |
Female Fertility in Chino Hills
Fertility by Age in Chino Hills
Average fertility rate in Chino Hills is 50.0 births per 1,000 women. Women in the age bracket of 20 to 34 years have the highest fertility rate with 61.0 births per 1,000 women. Women in the age bracket of 20 to 34 years acount for 52.4% of all women with births.
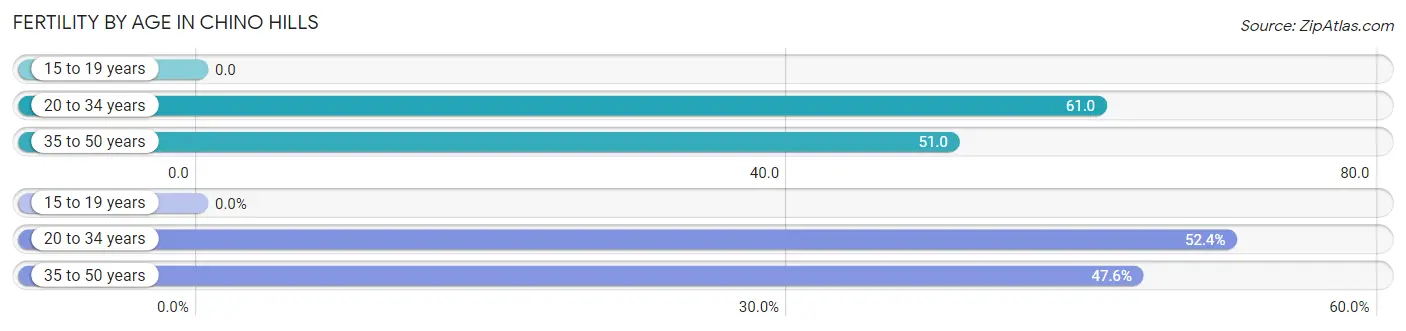
| Age Bracket | Women with Births | Births / 1,000 Women |
| 15 to 19 years | 0 (0.0%) | 0.0 |
| 20 to 34 years | 474 (52.4%) | 61.0 |
| 35 to 50 years | 431 (47.6%) | 51.0 |
| Total | 905 (100.0%) | 50.0 |
Fertility by Age by Marriage Status in Chino Hills
84.0% of women with births (905) in Chino Hills are married. The highest percentage of unmarried women with births falls into 20 to 34 years age bracket with 26.4% of them unmarried at the time of birth, while the lowest percentage of unmarried women with births belong to 35 to 50 years age bracket with 4.6% of them unmarried.
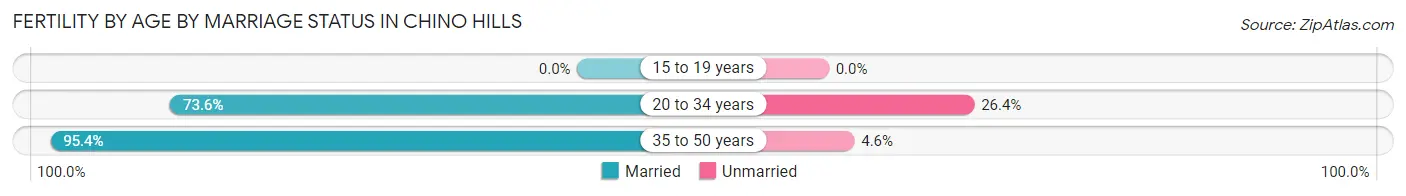
| Age Bracket | Married | Unmarried |
| 15 to 19 years | 0 (0.0%) | 0 (0.0%) |
| 20 to 34 years | 349 (73.6%) | 125 (26.4%) |
| 35 to 50 years | 411 (95.4%) | 20 (4.6%) |
| Total | 760 (84.0%) | 145 (16.0%) |
Fertility by Education in Chino Hills
Average fertility rate in Chino Hills is 50.0 births per 1,000 women. Women with the education attainment of high school diploma have the highest fertility rate of 88.0 births per 1,000 women, while women with the education attainment of less than high school have the lowest fertility at 10.0 births per 1,000 women. Women with the education attainment of bachelor's degree represent 34.9% of all women with births.
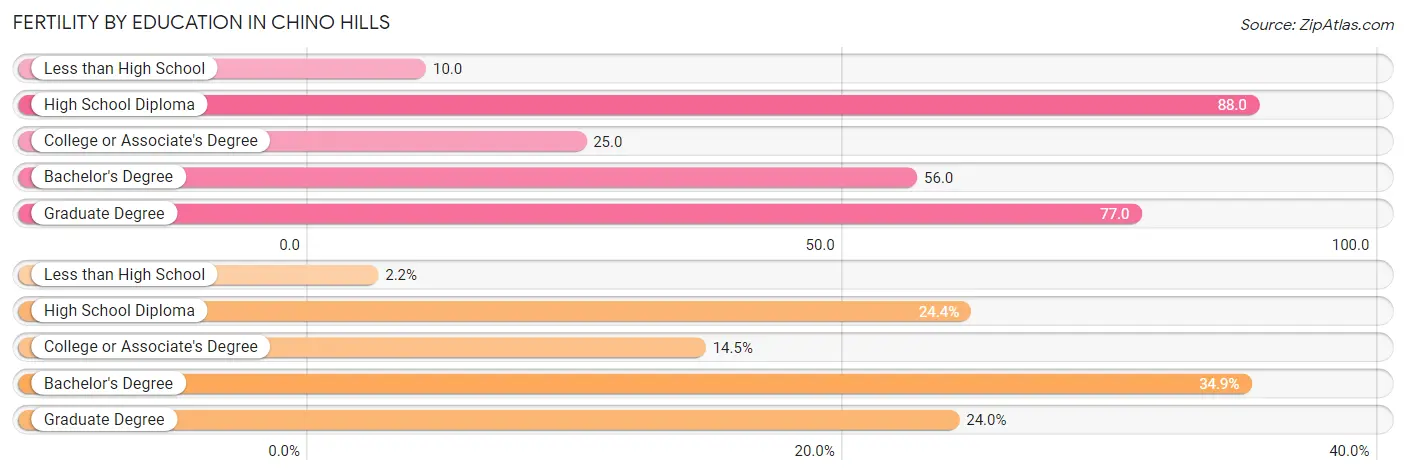
| Educational Attainment | Women with Births | Births / 1,000 Women |
| Less than High School | 20 (2.2%) | 10.0 |
| High School Diploma | 221 (24.4%) | 88.0 |
| College or Associate's Degree | 131 (14.5%) | 25.0 |
| Bachelor's Degree | 316 (34.9%) | 56.0 |
| Graduate Degree | 217 (24.0%) | 77.0 |
| Total | 905 (100.0%) | 50.0 |
Fertility by Education by Marriage Status in Chino Hills
16.0% of women with births in Chino Hills are unmarried. Women with the educational attainment of less than high school are most likely to be married with 100.0% of them married at childbirth, while women with the educational attainment of college or associate's degree are least likely to be married with 54.2% of them unmarried at childbirth.
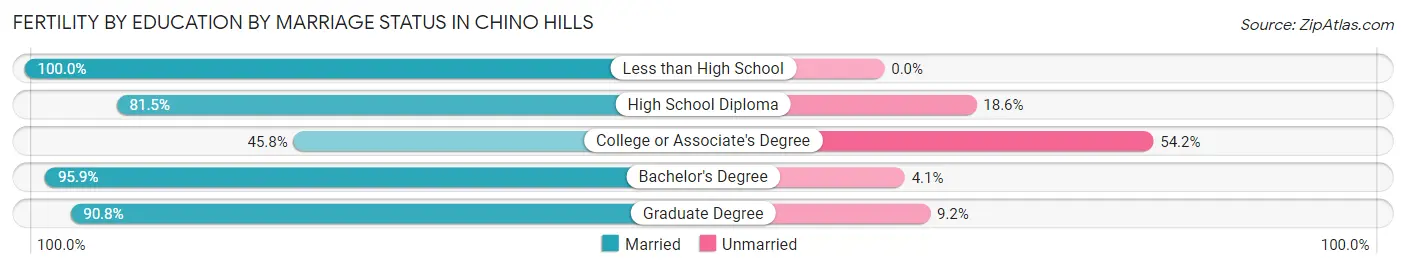
| Educational Attainment | Married | Unmarried |
| Less than High School | 20 (100.0%) | 0 (0.0%) |
| High School Diploma | 180 (81.5%) | 41 (18.5%) |
| College or Associate's Degree | 60 (45.8%) | 71 (54.2%) |
| Bachelor's Degree | 303 (95.9%) | 13 (4.1%) |
| Graduate Degree | 197 (90.8%) | 20 (9.2%) |
| Total | 760 (84.0%) | 145 (16.0%) |
Employment Characteristics in Chino Hills
Employment by Class of Employer in Chino Hills
Among the 37,941 employed individuals in Chino Hills, private company employees (25,189 | 66.4%), local government employees (3,951 | 10.4%), and self-employed (incorporated) (2,432 | 6.4%) make up the most common classes of employment.
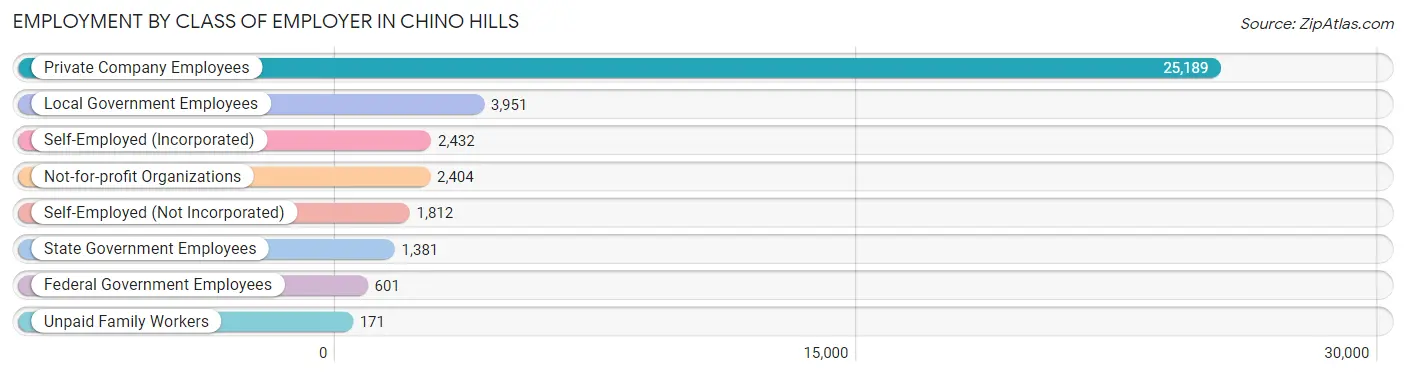
| Employer Class | # Employees | % Employees |
| Private Company Employees | 25,189 | 66.4% |
| Self-Employed (Incorporated) | 2,432 | 6.4% |
| Self-Employed (Not Incorporated) | 1,812 | 4.8% |
| Not-for-profit Organizations | 2,404 | 6.3% |
| Local Government Employees | 3,951 | 10.4% |
| State Government Employees | 1,381 | 3.6% |
| Federal Government Employees | 601 | 1.6% |
| Unpaid Family Workers | 171 | 0.4% |
| Total | 37,941 | 100.0% |
Employment Status by Age in Chino Hills
According to the labor force statistics for Chino Hills, out of the total population over 16 years of age (63,073), 65.2% or 41,124 individuals are in the labor force, with 6.2% or 2,550 of them unemployed. The age group with the highest labor force participation rate is 45 to 54 years, with 83.8% or 9,175 individuals in the labor force. Within the labor force, the 16 to 19 years age range has the highest percentage of unemployed individuals, with 21.3% or 274 of them being unemployed.
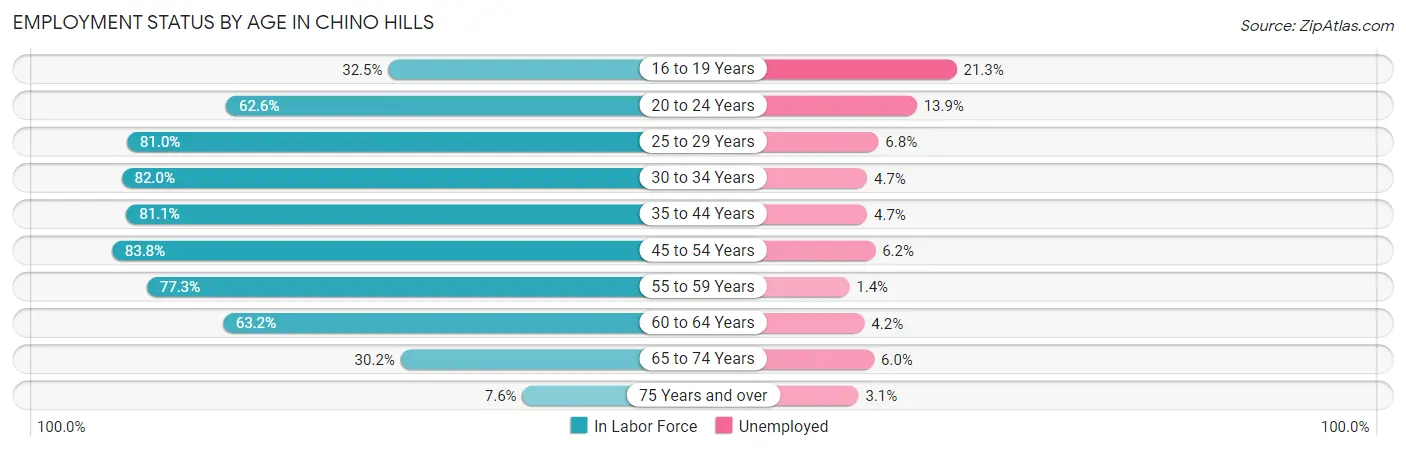
| Age Bracket | In Labor Force | Unemployed |
| 16 to 19 Years | 1,286 (32.5%) | 274 (21.3%) |
| 20 to 24 Years | 3,337 (62.6%) | 464 (13.9%) |
| 25 to 29 Years | 4,781 (81.0%) | 325 (6.8%) |
| 30 to 34 Years | 4,220 (82.0%) | 198 (4.7%) |
| 35 to 44 Years | 7,751 (81.1%) | 364 (4.7%) |
| 45 to 54 Years | 9,175 (83.8%) | 569 (6.2%) |
| 55 to 59 Years | 4,513 (77.3%) | 63 (1.4%) |
| 60 to 64 Years | 3,835 (63.2%) | 161 (4.2%) |
| 65 to 74 Years | 1,974 (30.2%) | 118 (6.0%) |
| 75 Years and over | 288 (7.6%) | 9 (3.1%) |
| Total | 41,124 (65.2%) | 2,550 (6.2%) |
Employment Status by Educational Attainment in Chino Hills
According to labor force statistics for Chino Hills, 78.8% of individuals (34,246) out of the total population between 25 and 64 years of age (43,460) are in the labor force, with 4.9% or 1,678 of them being unemployed. The group with the highest labor force participation rate are those with the educational attainment of college / associate degree, with 82.7% or 10,192 individuals in the labor force. Within the labor force, individuals with college / associate degree education have the highest percentage of unemployment, with 7.0% or 713 of them being unemployed.
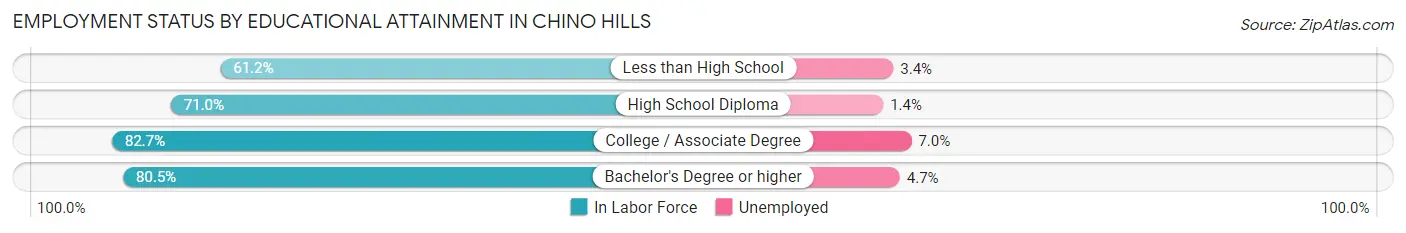
| Educational Attainment | In Labor Force | Unemployed |
| Less than High School | 1,234 (61.2%) | 69 (3.4%) |
| High School Diploma | 4,543 (71.0%) | 90 (1.4%) |
| College / Associate Degree | 10,192 (82.7%) | 863 (7.0%) |
| Bachelor's Degree or higher | 18,290 (80.5%) | 1,068 (4.7%) |
| Total | 34,246 (78.8%) | 2,130 (4.9%) |
Employment Occupations by Sex in Chino Hills
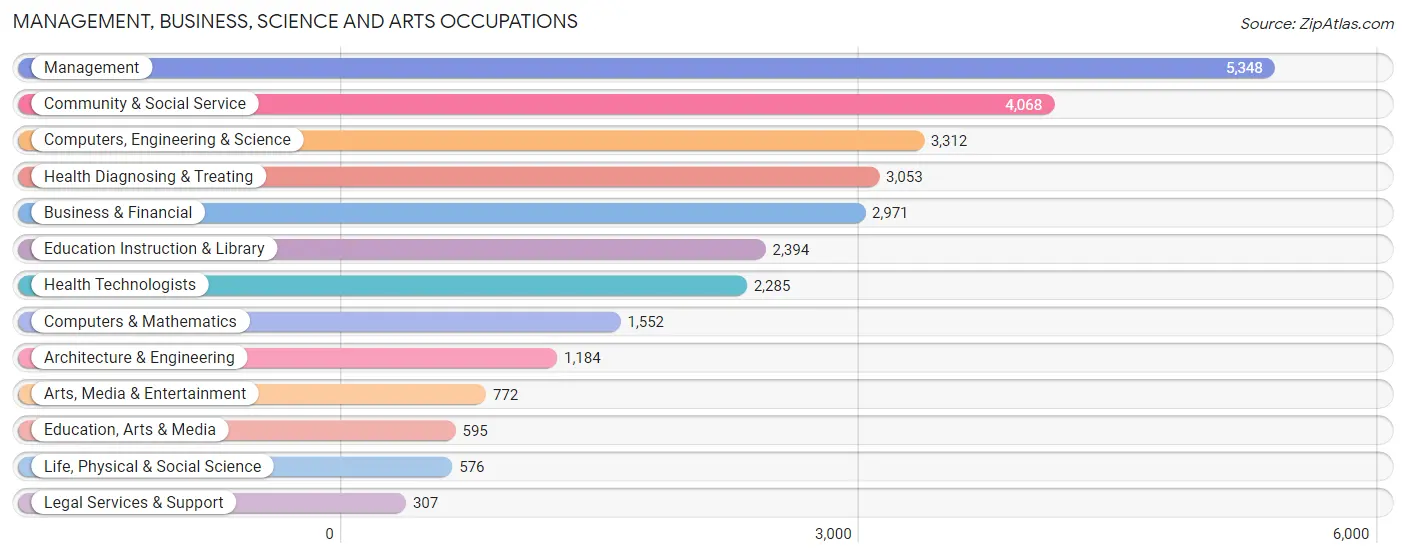
Management, Business, Science and Arts Occupations
The most common Management, Business, Science and Arts occupations in Chino Hills are Management (5,348 | 13.9%), Community & Social Service (4,068 | 10.5%), Computers, Engineering & Science (3,312 | 8.6%), Health Diagnosing & Treating (3,053 | 7.9%), and Business & Financial (2,971 | 7.7%).
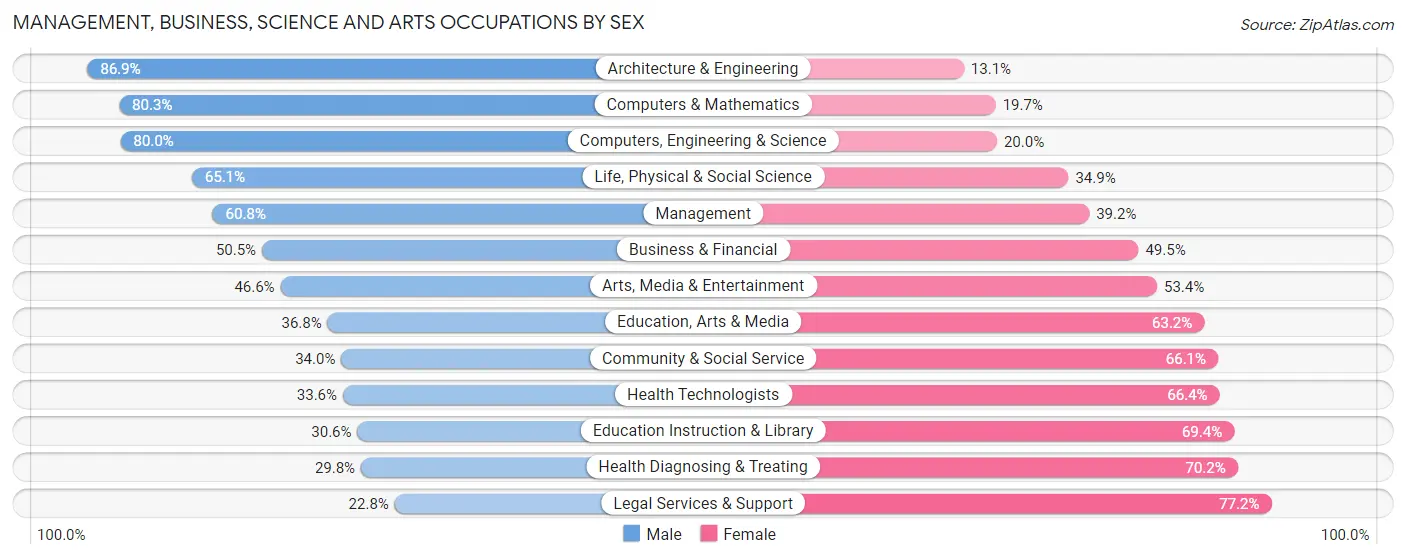
Management, Business, Science and Arts Occupations by Sex
Within the Management, Business, Science and Arts occupations in Chino Hills, the most male-oriented occupations are Architecture & Engineering (86.9%), Computers & Mathematics (80.3%), and Computers, Engineering & Science (80.0%), while the most female-oriented occupations are Legal Services & Support (77.2%), Health Diagnosing & Treating (70.2%), and Education Instruction & Library (69.4%).
| Occupation | Male | Female |
| Management | 3,250 (60.8%) | 2,098 (39.2%) |
| Business & Financial | 1,500 (50.5%) | 1,471 (49.5%) |
| Computers, Engineering & Science | 2,650 (80.0%) | 662 (20.0%) |
| Computers & Mathematics | 1,246 (80.3%) | 306 (19.7%) |
| Architecture & Engineering | 1,029 (86.9%) | 155 (13.1%) |
| Life, Physical & Social Science | 375 (65.1%) | 201 (34.9%) |
| Community & Social Service | 1,381 (34.0%) | 2,687 (66.0%) |
| Education, Arts & Media | 219 (36.8%) | 376 (63.2%) |
| Legal Services & Support | 70 (22.8%) | 237 (77.2%) |
| Education Instruction & Library | 732 (30.6%) | 1,662 (69.4%) |
| Arts, Media & Entertainment | 360 (46.6%) | 412 (53.4%) |
| Health Diagnosing & Treating | 911 (29.8%) | 2,142 (70.2%) |
| Health Technologists | 768 (33.6%) | 1,517 (66.4%) |
| Total (Category) | 9,692 (51.7%) | 9,060 (48.3%) |
| Total (Overall) | 21,279 (55.2%) | 17,264 (44.8%) |
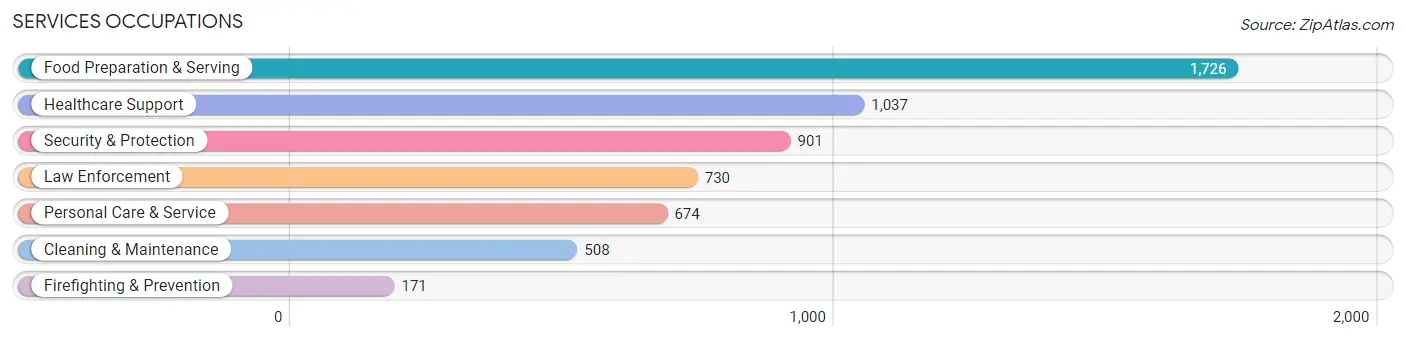
Services Occupations
The most common Services occupations in Chino Hills are Food Preparation & Serving (1,726 | 4.5%), Healthcare Support (1,037 | 2.7%), Security & Protection (901 | 2.3%), Law Enforcement (730 | 1.9%), and Personal Care & Service (674 | 1.8%).
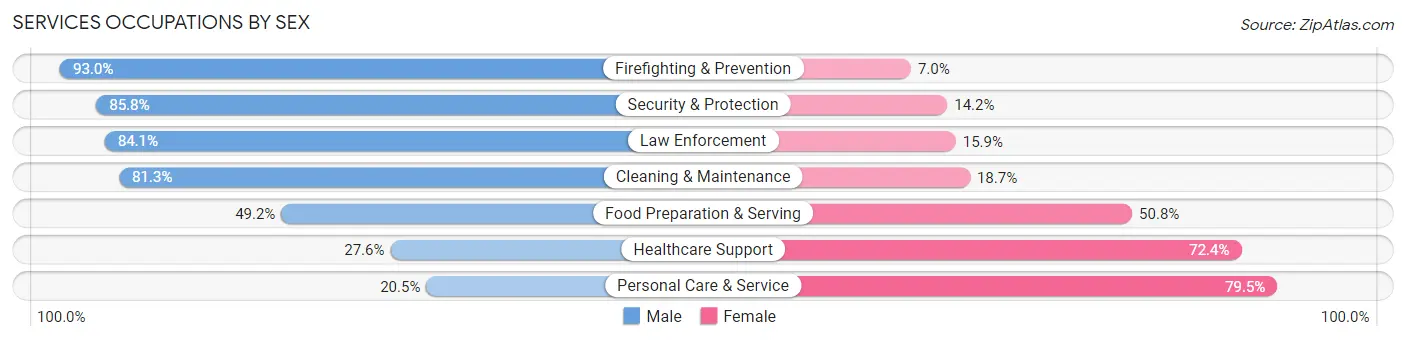
Services Occupations by Sex
Within the Services occupations in Chino Hills, the most male-oriented occupations are Firefighting & Prevention (93.0%), Security & Protection (85.8%), and Law Enforcement (84.1%), while the most female-oriented occupations are Personal Care & Service (79.5%), Healthcare Support (72.4%), and Food Preparation & Serving (50.8%).
| Occupation | Male | Female |
| Healthcare Support | 286 (27.6%) | 751 (72.4%) |
| Security & Protection | 773 (85.8%) | 128 (14.2%) |
| Firefighting & Prevention | 159 (93.0%) | 12 (7.0%) |
| Law Enforcement | 614 (84.1%) | 116 (15.9%) |
| Food Preparation & Serving | 849 (49.2%) | 877 (50.8%) |
| Cleaning & Maintenance | 413 (81.3%) | 95 (18.7%) |
| Personal Care & Service | 138 (20.5%) | 536 (79.5%) |
| Total (Category) | 2,459 (50.7%) | 2,387 (49.3%) |
| Total (Overall) | 21,279 (55.2%) | 17,264 (44.8%) |
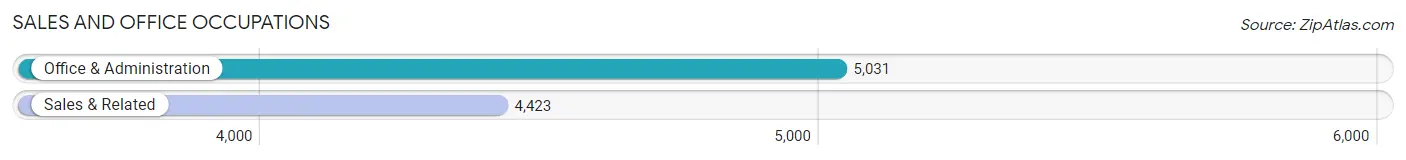
Sales and Office Occupations
The most common Sales and Office occupations in Chino Hills are Office & Administration (5,031 | 13.1%), and Sales & Related (4,423 | 11.5%).
Sales and Office Occupations by Sex
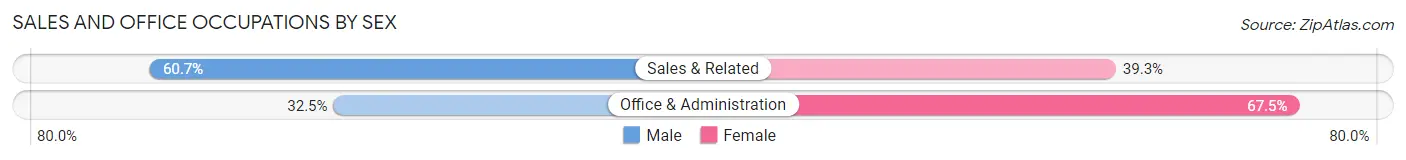
| Occupation | Male | Female |
| Sales & Related | 2,685 (60.7%) | 1,738 (39.3%) |
| Office & Administration | 1,635 (32.5%) | 3,396 (67.5%) |
| Total (Category) | 4,320 (45.7%) | 5,134 (54.3%) |
| Total (Overall) | 21,279 (55.2%) | 17,264 (44.8%) |
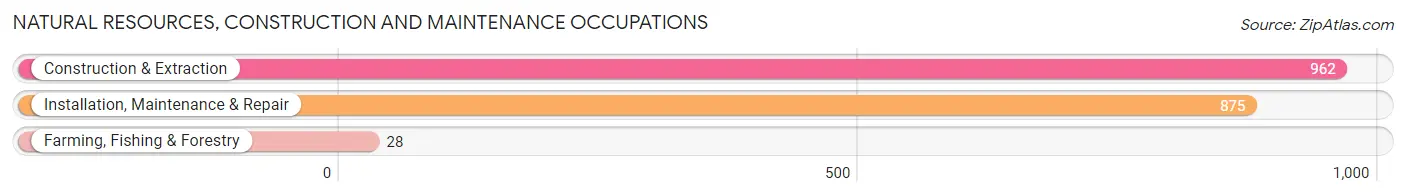
Natural Resources, Construction and Maintenance Occupations
The most common Natural Resources, Construction and Maintenance occupations in Chino Hills are Construction & Extraction (962 | 2.5%), Installation, Maintenance & Repair (875 | 2.3%), and Farming, Fishing & Forestry (28 | 0.1%).
Natural Resources, Construction and Maintenance Occupations by Sex
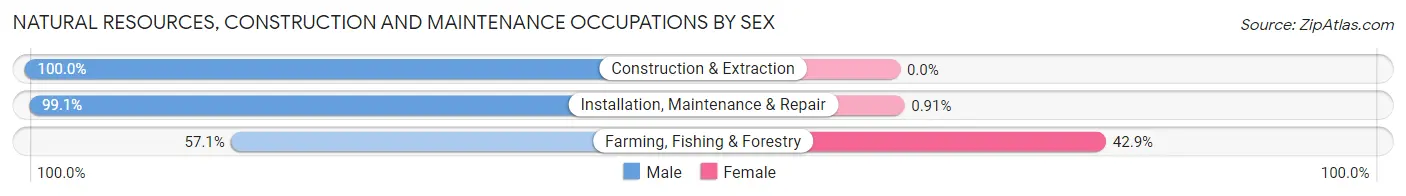
| Occupation | Male | Female |
| Farming, Fishing & Forestry | 16 (57.1%) | 12 (42.9%) |
| Construction & Extraction | 962 (100.0%) | 0 (0.0%) |
| Installation, Maintenance & Repair | 867 (99.1%) | 8 (0.9%) |
| Total (Category) | 1,845 (98.9%) | 20 (1.1%) |
| Total (Overall) | 21,279 (55.2%) | 17,264 (44.8%) |
Production, Transportation and Moving Occupations
The most common Production, Transportation and Moving occupations in Chino Hills are Transportation (1,351 | 3.5%), Production (1,257 | 3.3%), and Material Moving (1,018 | 2.6%).
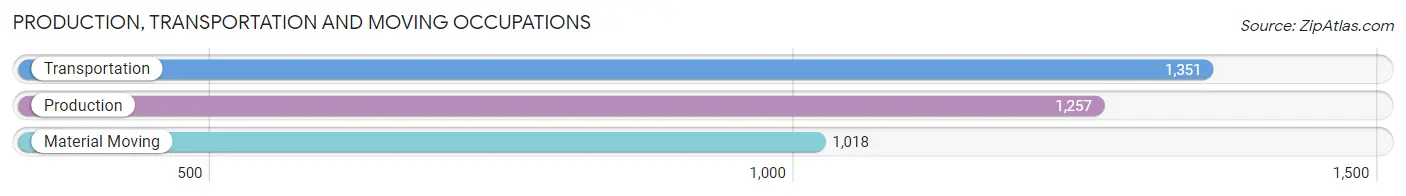
Production, Transportation and Moving Occupations by Sex
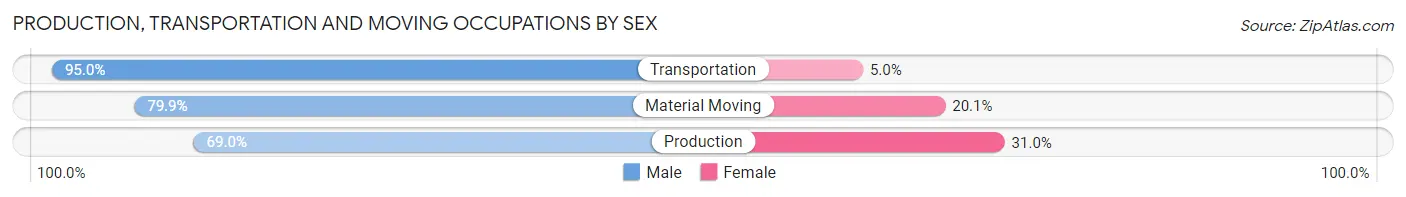
| Occupation | Male | Female |
| Production | 867 (69.0%) | 390 (31.0%) |
| Transportation | 1,283 (95.0%) | 68 (5.0%) |
| Material Moving | 813 (79.9%) | 205 (20.1%) |
| Total (Category) | 2,963 (81.7%) | 663 (18.3%) |
| Total (Overall) | 21,279 (55.2%) | 17,264 (44.8%) |
Employment Industries by Sex in Chino Hills
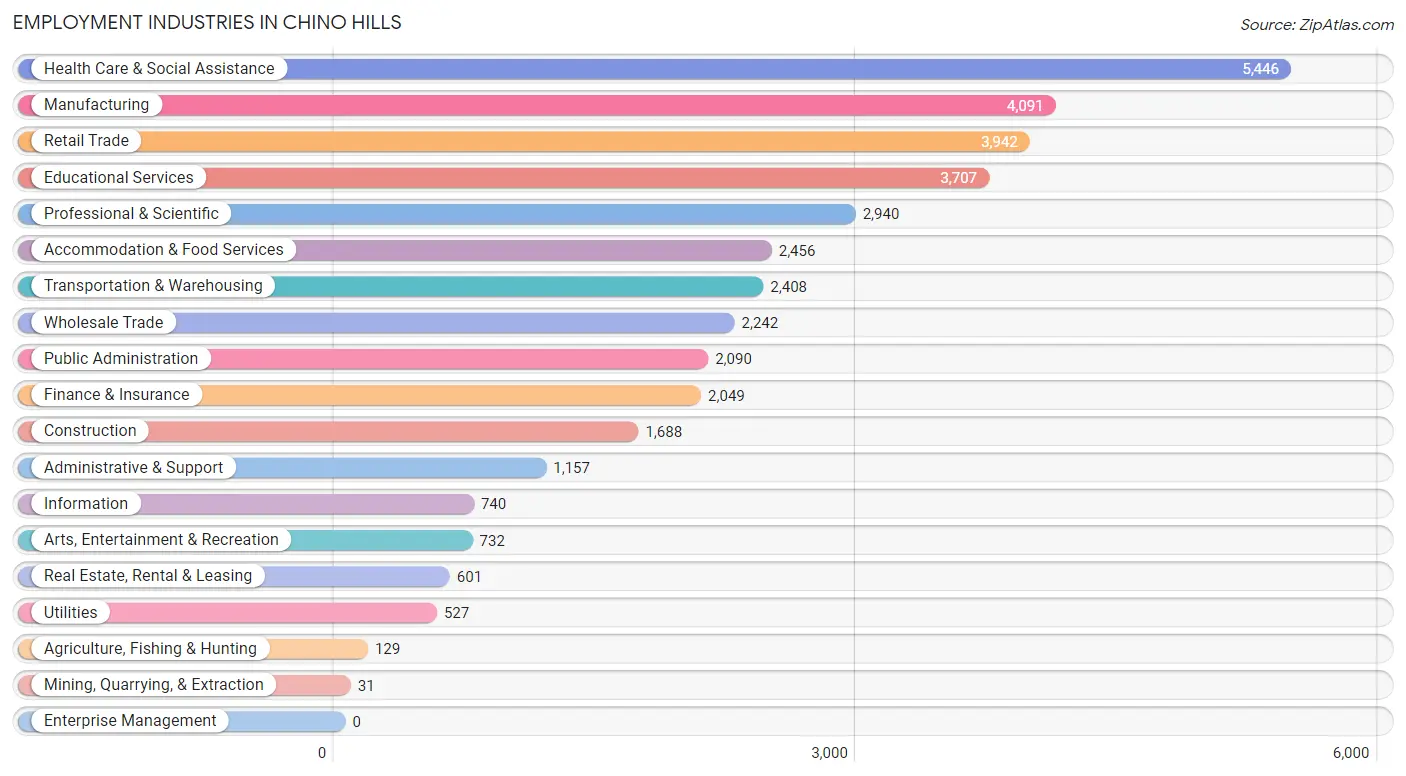
Employment Industries in Chino Hills
The major employment industries in Chino Hills include Health Care & Social Assistance (5,446 | 14.1%), Manufacturing (4,091 | 10.6%), Retail Trade (3,942 | 10.2%), Educational Services (3,707 | 9.6%), and Professional & Scientific (2,940 | 7.6%).
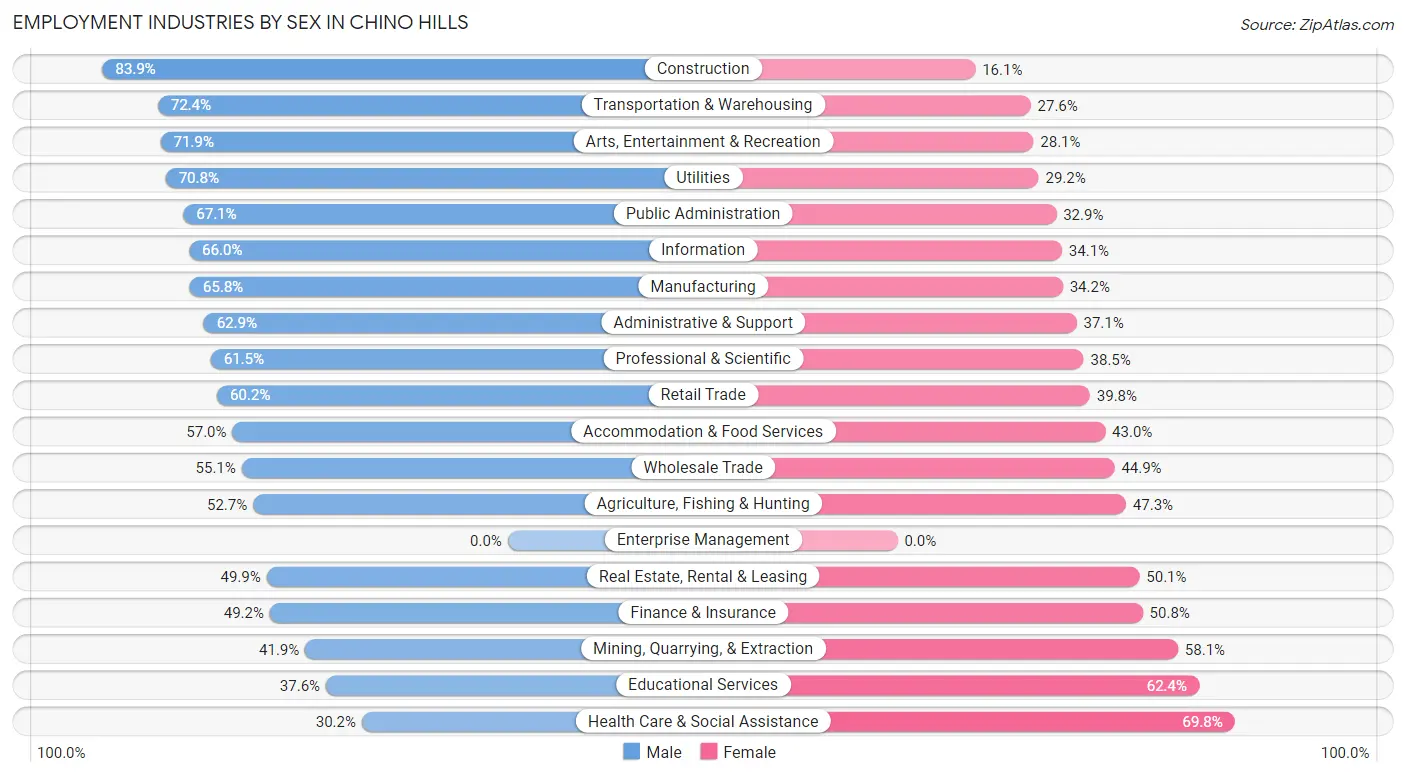
Employment Industries by Sex in Chino Hills
The Chino Hills industries that see more men than women are Construction (83.9%), Transportation & Warehousing (72.4%), and Arts, Entertainment & Recreation (71.9%), whereas the industries that tend to have a higher number of women are Health Care & Social Assistance (69.8%), Educational Services (62.4%), and Mining, Quarrying, & Extraction (58.1%).
| Industry | Male | Female |
| Agriculture, Fishing & Hunting | 68 (52.7%) | 61 (47.3%) |
| Mining, Quarrying, & Extraction | 13 (41.9%) | 18 (58.1%) |
| Construction | 1,416 (83.9%) | 272 (16.1%) |
| Manufacturing | 2,691 (65.8%) | 1,400 (34.2%) |
| Wholesale Trade | 1,235 (55.1%) | 1,007 (44.9%) |
| Retail Trade | 2,372 (60.2%) | 1,570 (39.8%) |
| Transportation & Warehousing | 1,744 (72.4%) | 664 (27.6%) |
| Utilities | 373 (70.8%) | 154 (29.2%) |
| Information | 488 (65.9%) | 252 (34.1%) |
| Finance & Insurance | 1,009 (49.2%) | 1,040 (50.8%) |
| Real Estate, Rental & Leasing | 300 (49.9%) | 301 (50.1%) |
| Professional & Scientific | 1,807 (61.5%) | 1,133 (38.5%) |
| Enterprise Management | 0 (0.0%) | 0 (0.0%) |
| Administrative & Support | 728 (62.9%) | 429 (37.1%) |
| Educational Services | 1,395 (37.6%) | 2,312 (62.4%) |
| Health Care & Social Assistance | 1,645 (30.2%) | 3,801 (69.8%) |
| Arts, Entertainment & Recreation | 526 (71.9%) | 206 (28.1%) |
| Accommodation & Food Services | 1,400 (57.0%) | 1,056 (43.0%) |
| Public Administration | 1,403 (67.1%) | 687 (32.9%) |
| Total | 21,279 (55.2%) | 17,264 (44.8%) |
Education in Chino Hills
School Enrollment in Chino Hills
The most common levels of schooling among the 21,007 students in Chino Hills are college / undergraduate (5,638 | 26.8%), high school (4,253 | 20.3%), and elementary school (3,761 | 17.9%).
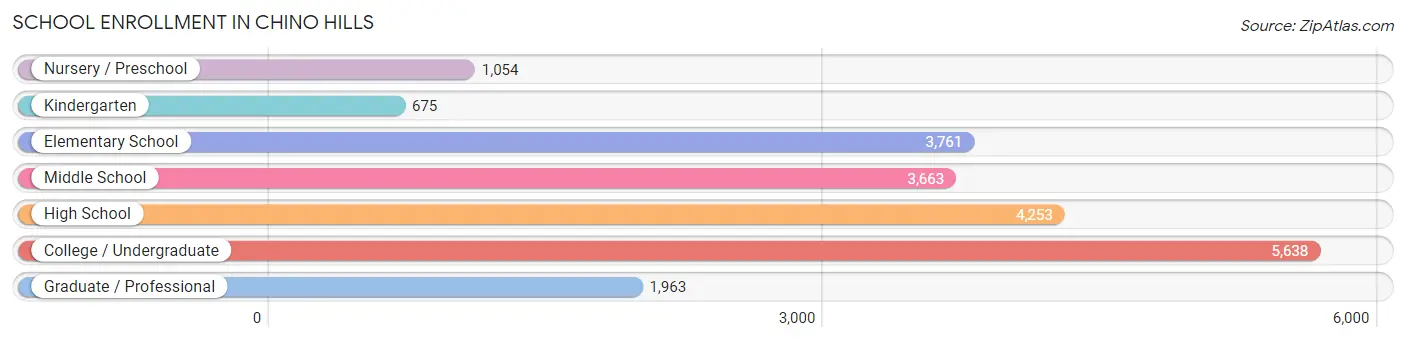
| School Level | # Students | % Students |
| Nursery / Preschool | 1,054 | 5.0% |
| Kindergarten | 675 | 3.2% |
| Elementary School | 3,761 | 17.9% |
| Middle School | 3,663 | 17.4% |
| High School | 4,253 | 20.3% |
| College / Undergraduate | 5,638 | 26.8% |
| Graduate / Professional | 1,963 | 9.3% |
| Total | 21,007 | 100.0% |
School Enrollment by Age by Funding Source in Chino Hills
Out of a total of 21,007 students who are enrolled in schools in Chino Hills, 4,243 (20.2%) attend a private institution, while the remaining 16,764 (79.8%) are enrolled in public schools. The age group of 3 to 4 year olds has the highest likelihood of being enrolled in private schools, with 684 (90.0% in the age bracket) enrolled. Conversely, the age group of 15 to 17 year olds has the lowest likelihood of being enrolled in a private school, with 2,852 (92.1% in the age bracket) attending a public institution.
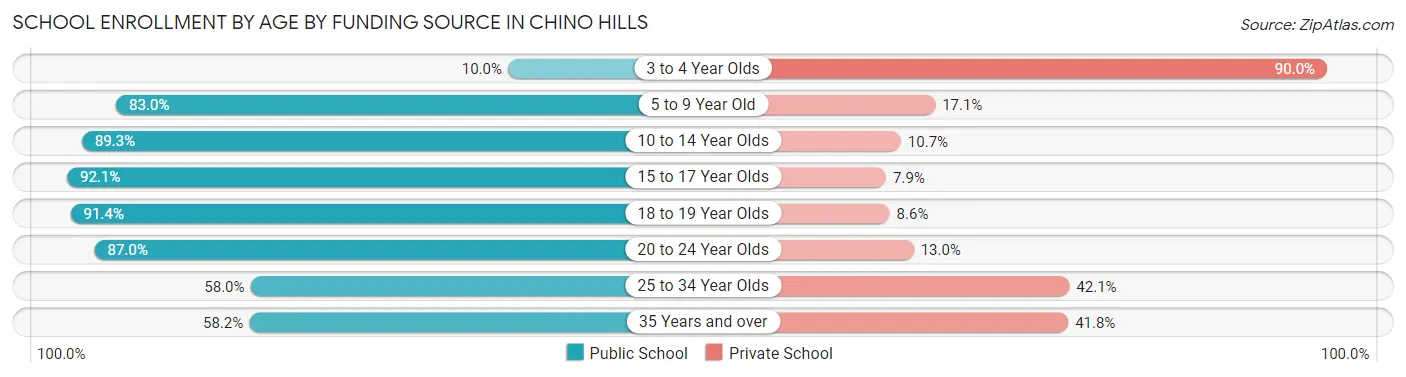
| Age Bracket | Public School | Private School |
| 3 to 4 Year Olds | 76 (10.0%) | 684 (90.0%) |
| 5 to 9 Year Old | 3,390 (83.0%) | 697 (17.1%) |
| 10 to 14 Year Olds | 4,425 (89.3%) | 528 (10.7%) |
| 15 to 17 Year Olds | 2,852 (92.1%) | 245 (7.9%) |
| 18 to 19 Year Olds | 1,429 (91.4%) | 134 (8.6%) |
| 20 to 24 Year Olds | 2,408 (87.0%) | 361 (13.0%) |
| 25 to 34 Year Olds | 1,297 (58.0%) | 941 (42.0%) |
| 35 Years and over | 896 (58.2%) | 644 (41.8%) |
| Total | 16,764 (79.8%) | 4,243 (20.2%) |
Educational Attainment by Field of Study in Chino Hills
Business (6,644 | 23.7%), engineering (3,202 | 11.4%), science & technology (2,803 | 10.0%), social sciences (2,163 | 7.7%), and computers & mathematics (1,959 | 7.0%) are the most common fields of study among 27,995 individuals in Chino Hills who have obtained a bachelor's degree or higher.
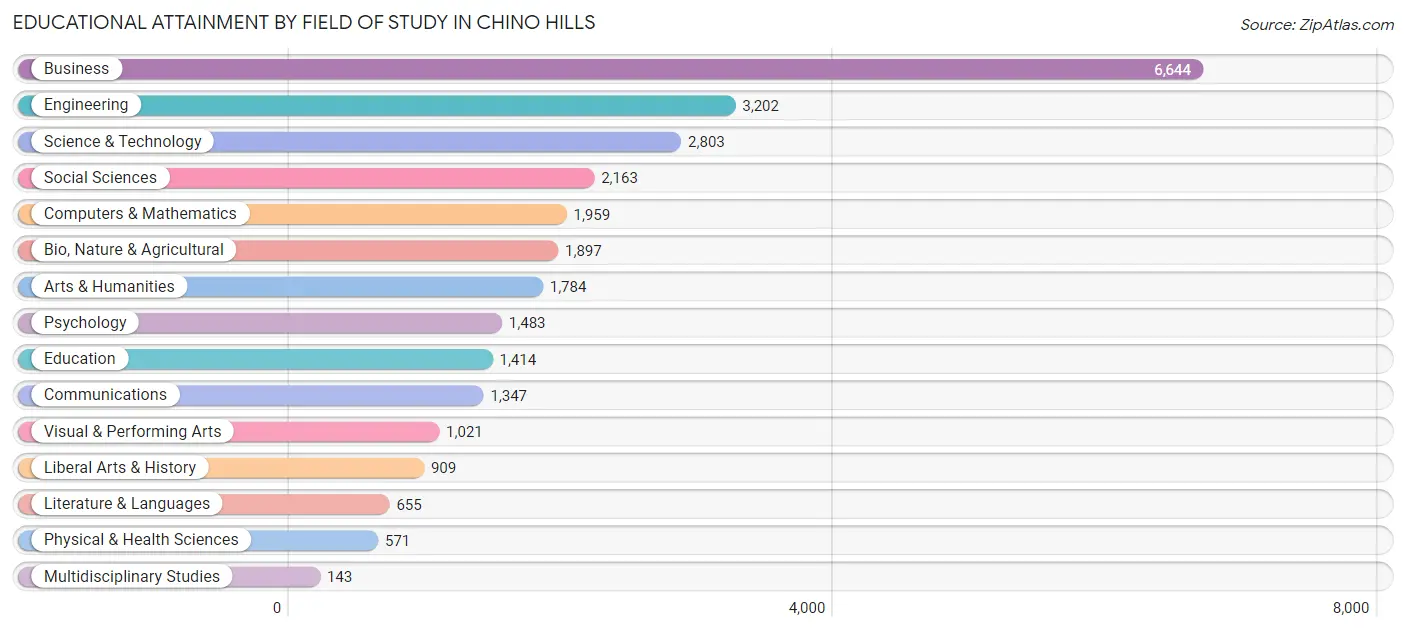
| Field of Study | # Graduates | % Graduates |
| Computers & Mathematics | 1,959 | 7.0% |
| Bio, Nature & Agricultural | 1,897 | 6.8% |
| Physical & Health Sciences | 571 | 2.0% |
| Psychology | 1,483 | 5.3% |
| Social Sciences | 2,163 | 7.7% |
| Engineering | 3,202 | 11.4% |
| Multidisciplinary Studies | 143 | 0.5% |
| Science & Technology | 2,803 | 10.0% |
| Business | 6,644 | 23.7% |
| Education | 1,414 | 5.1% |
| Literature & Languages | 655 | 2.3% |
| Liberal Arts & History | 909 | 3.3% |
| Visual & Performing Arts | 1,021 | 3.6% |
| Communications | 1,347 | 4.8% |
| Arts & Humanities | 1,784 | 6.4% |
| Total | 27,995 | 100.0% |
Transportation & Commute in Chino Hills
Vehicle Availability by Sex in Chino Hills
The most prevalent vehicle ownership categories in Chino Hills are males with 2 vehicles (7,935, accounting for 37.7%) and females with 2 vehicles (6,082, making up 47.0%).
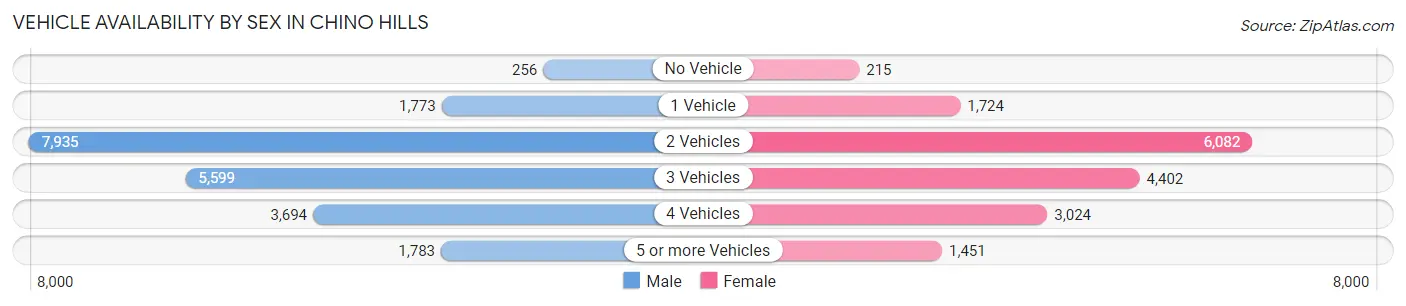
| Vehicles Available | Male | Female |
| No Vehicle | 256 (1.2%) | 215 (1.3%) |
| 1 Vehicle | 1,773 (8.4%) | 1,724 (10.2%) |
| 2 Vehicles | 7,935 (37.7%) | 6,082 (36.0%) |
| 3 Vehicles | 5,599 (26.6%) | 4,402 (26.1%) |
| 4 Vehicles | 3,694 (17.6%) | 3,024 (17.9%) |
| 5 or more Vehicles | 1,783 (8.5%) | 1,451 (8.6%) |
| Total | 21,040 (100.0%) | 16,898 (100.0%) |
Commute Time in Chino Hills
The most frequently occuring commute durations in Chino Hills are 30 to 34 minutes (5,073 commuters, 15.7%), 60 to 89 minutes (4,713 commuters, 14.6%), and 45 to 59 minutes (4,298 commuters, 13.3%).
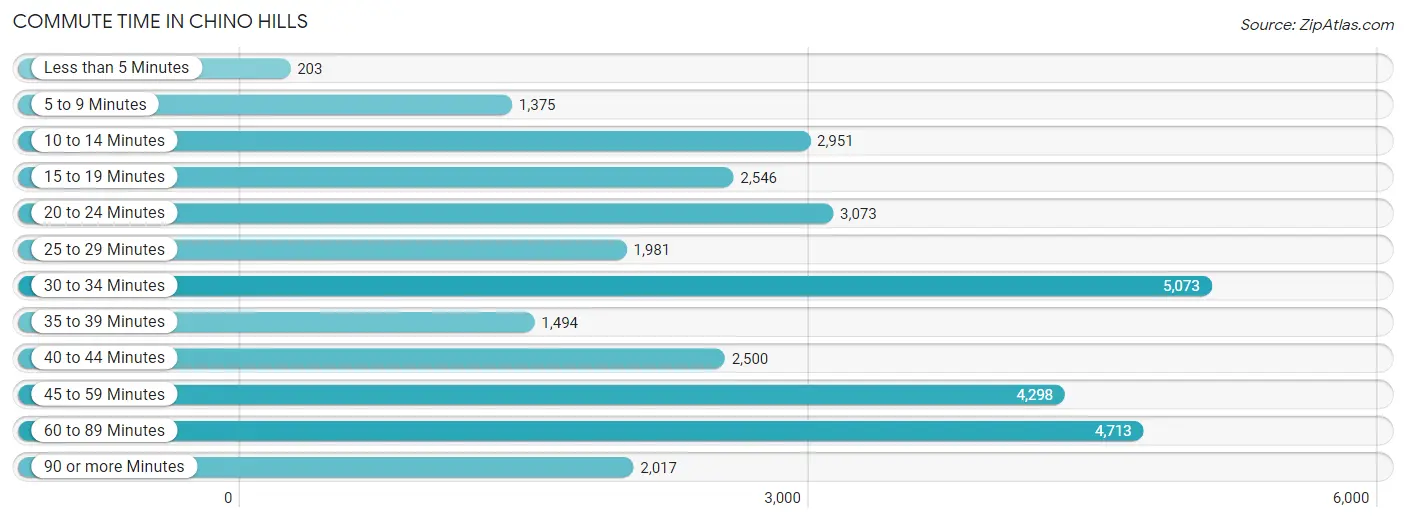
| Commute Time | # Commuters | % Commuters |
| Less than 5 Minutes | 203 | 0.6% |
| 5 to 9 Minutes | 1,375 | 4.3% |
| 10 to 14 Minutes | 2,951 | 9.2% |
| 15 to 19 Minutes | 2,546 | 7.9% |
| 20 to 24 Minutes | 3,073 | 9.5% |
| 25 to 29 Minutes | 1,981 | 6.1% |
| 30 to 34 Minutes | 5,073 | 15.7% |
| 35 to 39 Minutes | 1,494 | 4.6% |
| 40 to 44 Minutes | 2,500 | 7.8% |
| 45 to 59 Minutes | 4,298 | 13.3% |
| 60 to 89 Minutes | 4,713 | 14.6% |
| 90 or more Minutes | 2,017 | 6.3% |
Commute Time by Sex in Chino Hills
The most common commute times in Chino Hills are 30 to 34 minutes (3,109 commuters, 17.1%) for males and 30 to 34 minutes (1,964 commuters, 14.0%) for females.
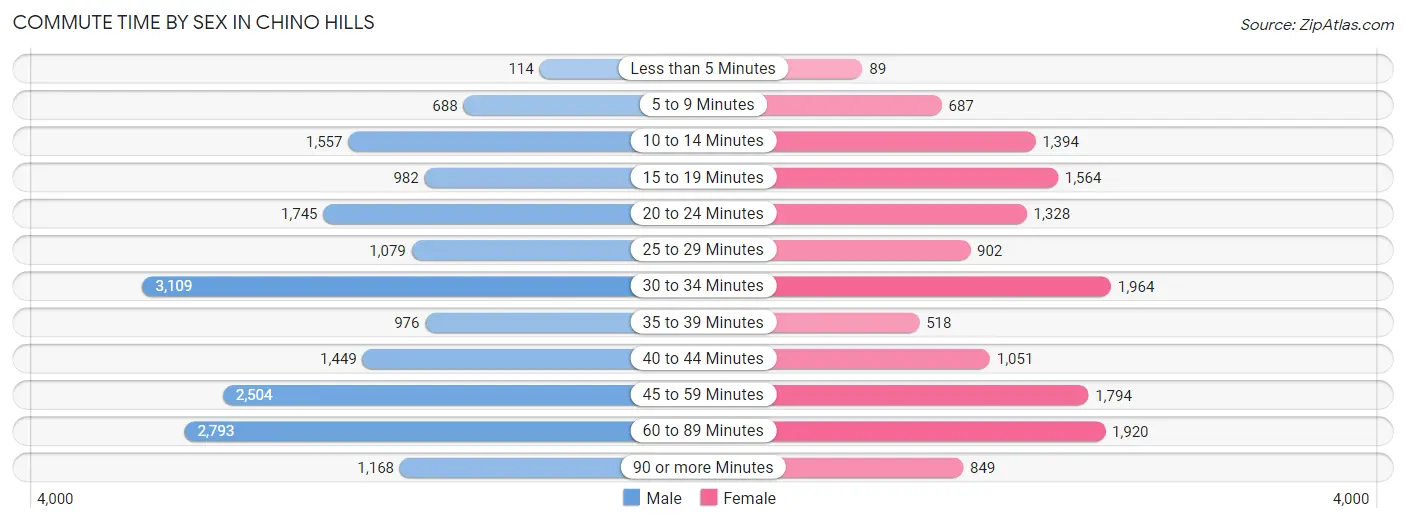
| Commute Time | Male | Female |
| Less than 5 Minutes | 114 (0.6%) | 89 (0.6%) |
| 5 to 9 Minutes | 688 (3.8%) | 687 (4.9%) |
| 10 to 14 Minutes | 1,557 (8.6%) | 1,394 (9.9%) |
| 15 to 19 Minutes | 982 (5.4%) | 1,564 (11.1%) |
| 20 to 24 Minutes | 1,745 (9.6%) | 1,328 (9.5%) |
| 25 to 29 Minutes | 1,079 (5.9%) | 902 (6.4%) |
| 30 to 34 Minutes | 3,109 (17.1%) | 1,964 (14.0%) |
| 35 to 39 Minutes | 976 (5.4%) | 518 (3.7%) |
| 40 to 44 Minutes | 1,449 (8.0%) | 1,051 (7.5%) |
| 45 to 59 Minutes | 2,504 (13.8%) | 1,794 (12.8%) |
| 60 to 89 Minutes | 2,793 (15.4%) | 1,920 (13.7%) |
| 90 or more Minutes | 1,168 (6.4%) | 849 (6.0%) |
Time of Departure to Work by Sex in Chino Hills
The most frequent times of departure to work in Chino Hills are 7:00 AM to 7:29 AM (2,373, 13.1%) for males and 8:00 AM to 8:29 AM (2,158, 15.3%) for females.
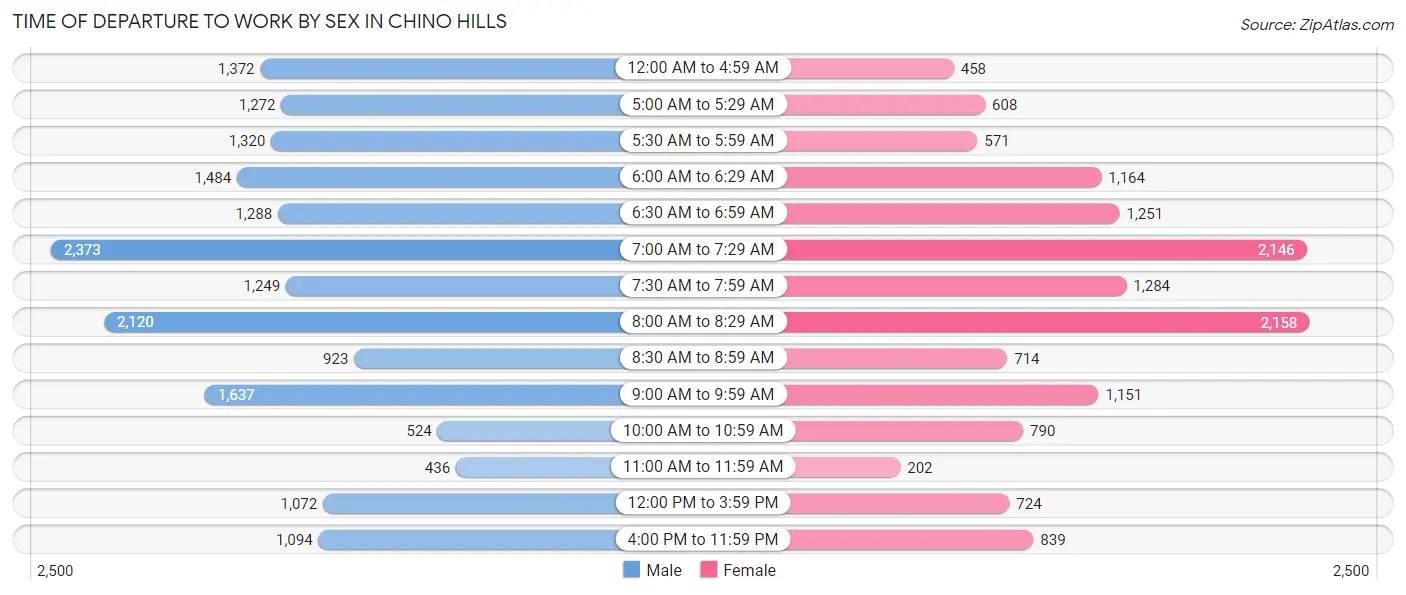
| Time of Departure | Male | Female |
| 12:00 AM to 4:59 AM | 1,372 (7.5%) | 458 (3.3%) |
| 5:00 AM to 5:29 AM | 1,272 (7.0%) | 608 (4.3%) |
| 5:30 AM to 5:59 AM | 1,320 (7.3%) | 571 (4.1%) |
| 6:00 AM to 6:29 AM | 1,484 (8.2%) | 1,164 (8.3%) |
| 6:30 AM to 6:59 AM | 1,288 (7.1%) | 1,251 (8.9%) |
| 7:00 AM to 7:29 AM | 2,373 (13.1%) | 2,146 (15.3%) |
| 7:30 AM to 7:59 AM | 1,249 (6.9%) | 1,284 (9.1%) |
| 8:00 AM to 8:29 AM | 2,120 (11.7%) | 2,158 (15.3%) |
| 8:30 AM to 8:59 AM | 923 (5.1%) | 714 (5.1%) |
| 9:00 AM to 9:59 AM | 1,637 (9.0%) | 1,151 (8.2%) |
| 10:00 AM to 10:59 AM | 524 (2.9%) | 790 (5.6%) |
| 11:00 AM to 11:59 AM | 436 (2.4%) | 202 (1.4%) |
| 12:00 PM to 3:59 PM | 1,072 (5.9%) | 724 (5.1%) |
| 4:00 PM to 11:59 PM | 1,094 (6.0%) | 839 (6.0%) |
| Total | 18,164 (100.0%) | 14,060 (100.0%) |
Housing Occupancy in Chino Hills
Occupancy by Ownership in Chino Hills
Of the total 25,148 dwellings in Chino Hills, owner-occupied units account for 17,723 (70.5%), while renter-occupied units make up 7,425 (29.5%).
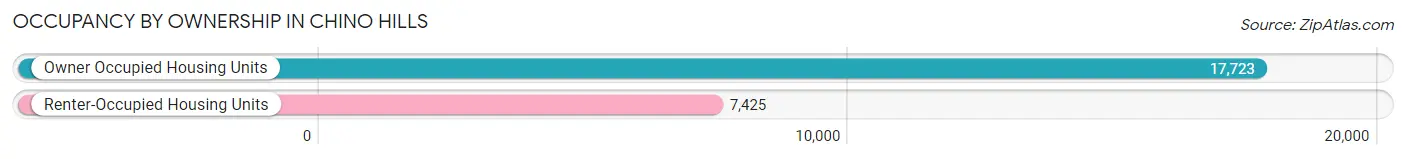
| Occupancy | # Housing Units | % Housing Units |
| Owner Occupied Housing Units | 17,723 | 70.5% |
| Renter-Occupied Housing Units | 7,425 | 29.5% |
| Total Occupied Housing Units | 25,148 | 100.0% |
Occupancy by Household Size in Chino Hills
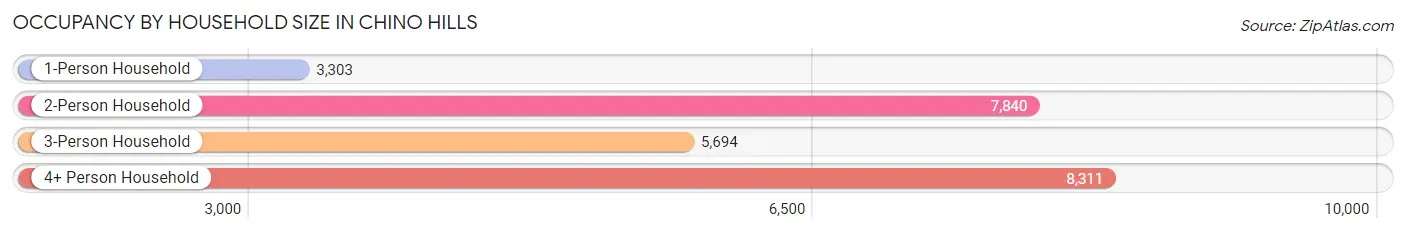
| Household Size | # Housing Units | % Housing Units |
| 1-Person Household | 3,303 | 13.1% |
| 2-Person Household | 7,840 | 31.2% |
| 3-Person Household | 5,694 | 22.6% |
| 4+ Person Household | 8,311 | 33.1% |
| Total Housing Units | 25,148 | 100.0% |
Occupancy by Ownership by Household Size in Chino Hills
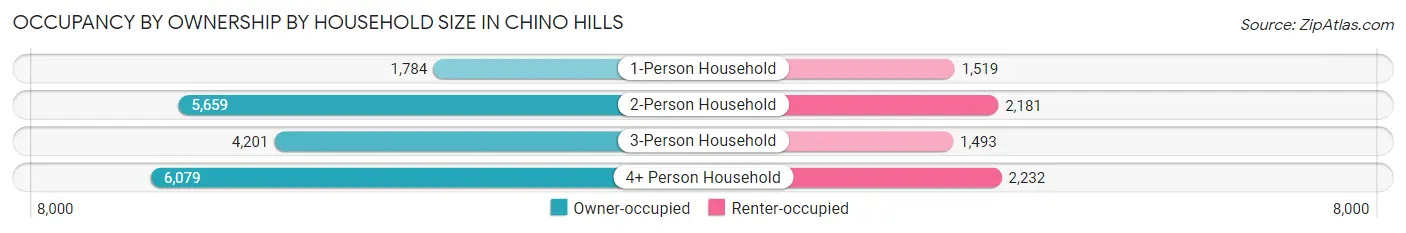
| Household Size | Owner-occupied | Renter-occupied |
| 1-Person Household | 1,784 (54.0%) | 1,519 (46.0%) |
| 2-Person Household | 5,659 (72.2%) | 2,181 (27.8%) |
| 3-Person Household | 4,201 (73.8%) | 1,493 (26.2%) |
| 4+ Person Household | 6,079 (73.1%) | 2,232 (26.9%) |
| Total Housing Units | 17,723 (70.5%) | 7,425 (29.5%) |
Occupancy by Educational Attainment in Chino Hills
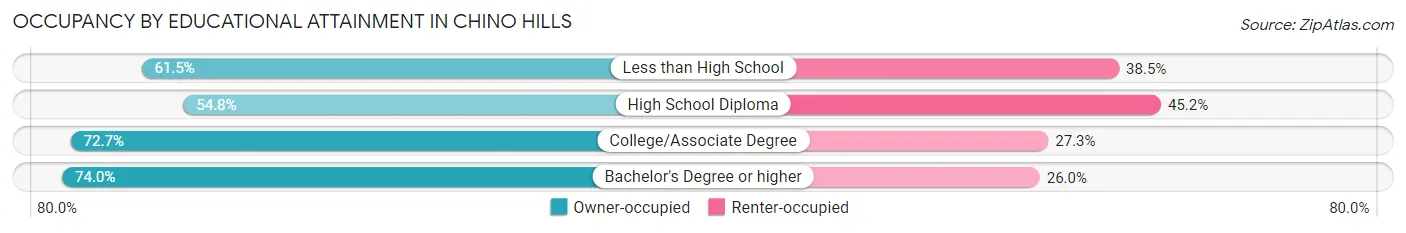
| Household Size | Owner-occupied | Renter-occupied |
| Less than High School | 697 (61.5%) | 437 (38.5%) |
| High School Diploma | 1,870 (54.8%) | 1,542 (45.2%) |
| College/Associate Degree | 5,233 (72.7%) | 1,966 (27.3%) |
| Bachelor's Degree or higher | 9,923 (74.0%) | 3,480 (26.0%) |
Occupancy by Age of Householder in Chino Hills
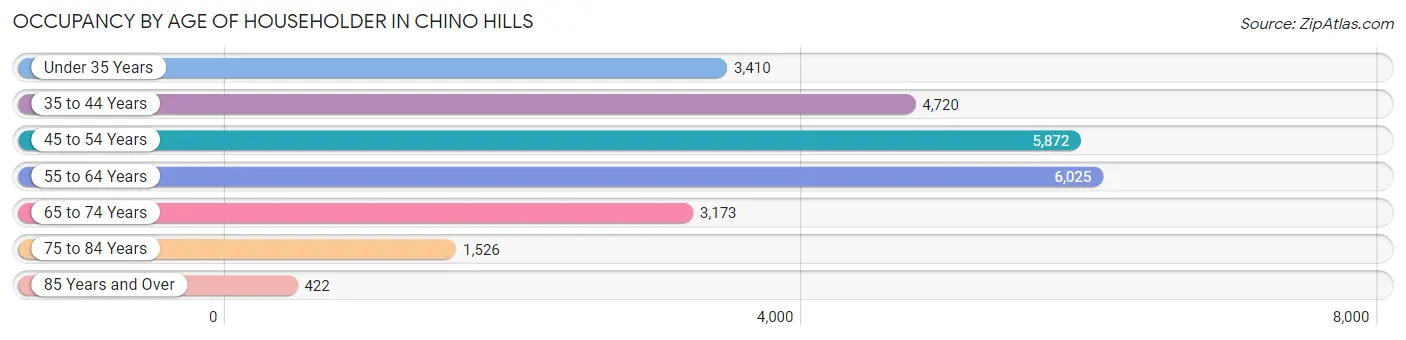
| Age Bracket | # Households | % Households |
| Under 35 Years | 3,410 | 13.6% |
| 35 to 44 Years | 4,720 | 18.8% |
| 45 to 54 Years | 5,872 | 23.4% |
| 55 to 64 Years | 6,025 | 24.0% |
| 65 to 74 Years | 3,173 | 12.6% |
| 75 to 84 Years | 1,526 | 6.1% |
| 85 Years and Over | 422 | 1.7% |
| Total | 25,148 | 100.0% |
Housing Finances in Chino Hills
Median Income by Occupancy in Chino Hills
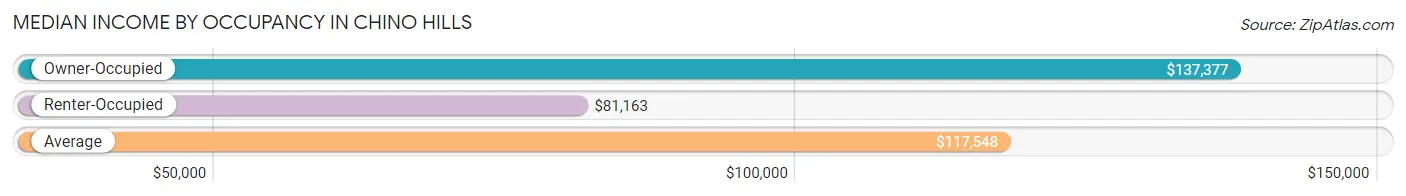
| Occupancy Type | # Households | Median Income |
| Owner-Occupied | 17,723 (70.5%) | $137,377 |
| Renter-Occupied | 7,425 (29.5%) | $81,163 |
| Average | 25,148 (100.0%) | $117,548 |
Occupancy by Householder Income Bracket in Chino Hills
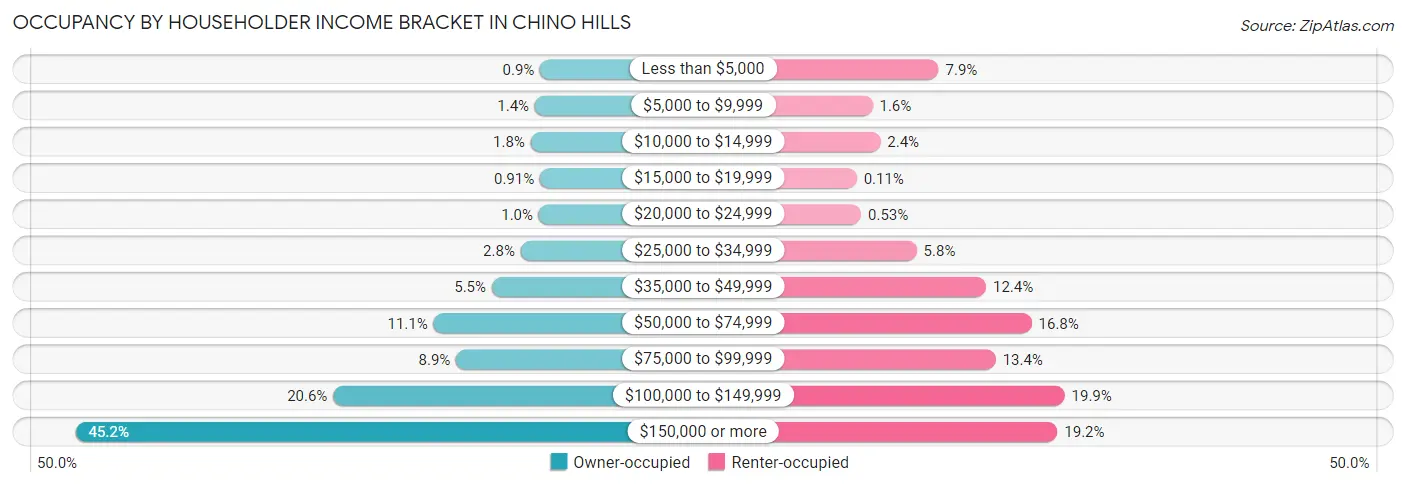
| Income Bracket | Owner-occupied | Renter-occupied |
| Less than $5,000 | 159 (0.9%) | 587 (7.9%) |
| $5,000 to $9,999 | 249 (1.4%) | 120 (1.6%) |
| $10,000 to $14,999 | 319 (1.8%) | 175 (2.4%) |
| $15,000 to $19,999 | 162 (0.9%) | 8 (0.1%) |
| $20,000 to $24,999 | 180 (1.0%) | 39 (0.5%) |
| $25,000 to $34,999 | 487 (2.8%) | 432 (5.8%) |
| $35,000 to $49,999 | 975 (5.5%) | 923 (12.4%) |
| $50,000 to $74,999 | 1,959 (11.1%) | 1,245 (16.8%) |
| $75,000 to $99,999 | 1,578 (8.9%) | 991 (13.4%) |
| $100,000 to $149,999 | 3,653 (20.6%) | 1,478 (19.9%) |
| $150,000 or more | 8,002 (45.2%) | 1,427 (19.2%) |
| Total | 17,723 (100.0%) | 7,425 (100.0%) |
Monthly Housing Cost Tiers in Chino Hills
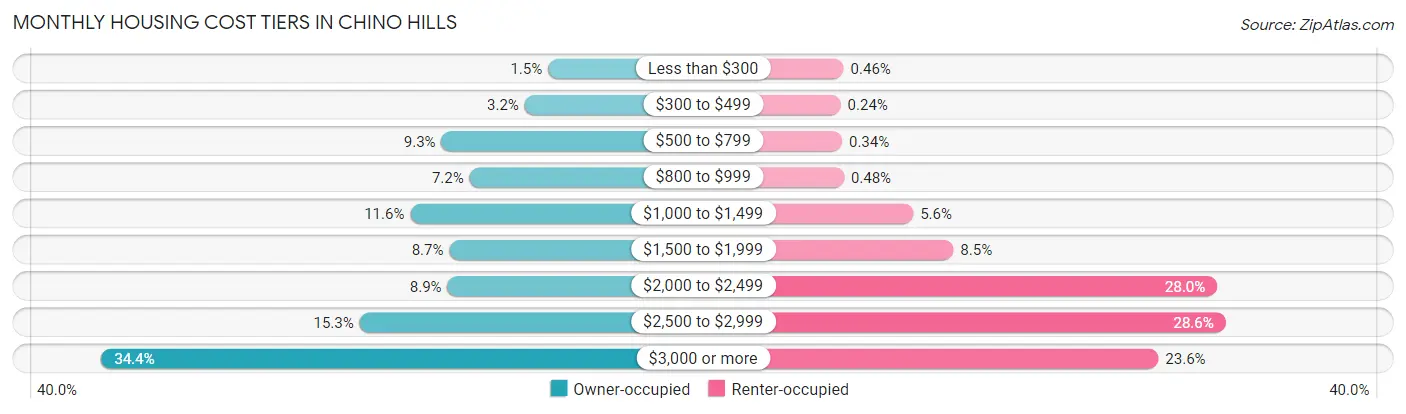
| Monthly Cost | Owner-occupied | Renter-occupied |
| Less than $300 | 257 (1.5%) | 34 (0.5%) |
| $300 to $499 | 561 (3.2%) | 18 (0.2%) |
| $500 to $799 | 1,649 (9.3%) | 25 (0.3%) |
| $800 to $999 | 1,281 (7.2%) | 36 (0.5%) |
| $1,000 to $1,499 | 2,055 (11.6%) | 414 (5.6%) |
| $1,500 to $1,999 | 1,545 (8.7%) | 634 (8.5%) |
| $2,000 to $2,499 | 1,571 (8.9%) | 2,076 (28.0%) |
| $2,500 to $2,999 | 2,717 (15.3%) | 2,122 (28.6%) |
| $3,000 or more | 6,087 (34.4%) | 1,755 (23.6%) |
| Total | 17,723 (100.0%) | 7,425 (100.0%) |
Physical Housing Characteristics in Chino Hills
Housing Structures in Chino Hills
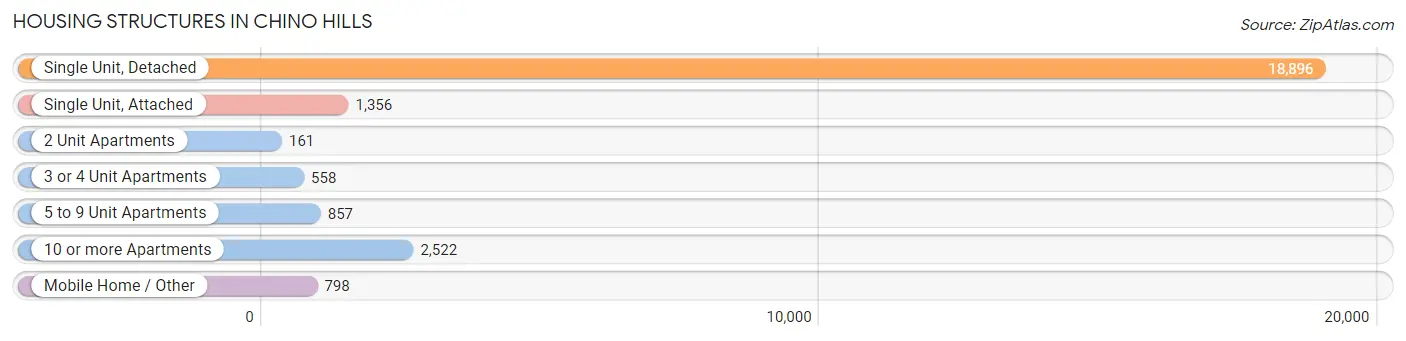
| Structure Type | # Housing Units | % Housing Units |
| Single Unit, Detached | 18,896 | 75.1% |
| Single Unit, Attached | 1,356 | 5.4% |
| 2 Unit Apartments | 161 | 0.6% |
| 3 or 4 Unit Apartments | 558 | 2.2% |
| 5 to 9 Unit Apartments | 857 | 3.4% |
| 10 or more Apartments | 2,522 | 10.0% |
| Mobile Home / Other | 798 | 3.2% |
| Total | 25,148 | 100.0% |
Housing Structures by Occupancy in Chino Hills
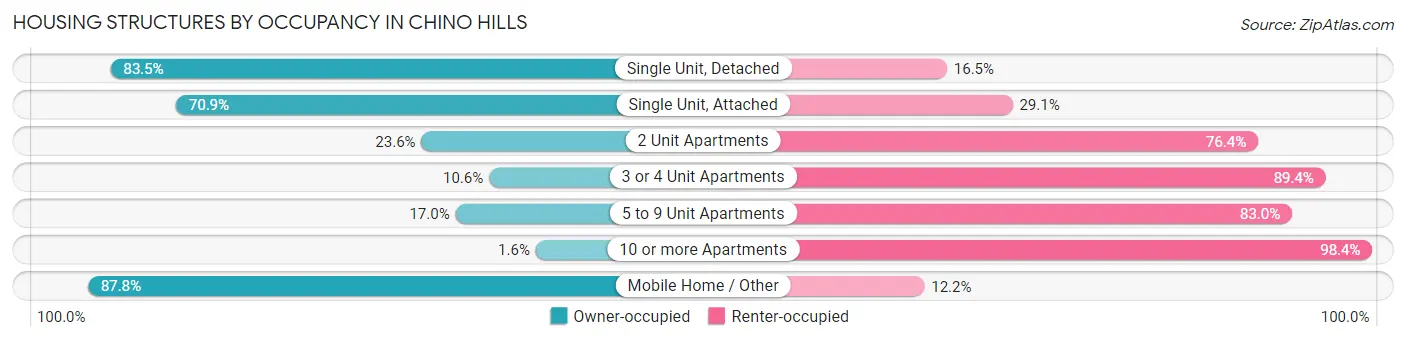
| Structure Type | Owner-occupied | Renter-occupied |
| Single Unit, Detached | 15,778 (83.5%) | 3,118 (16.5%) |
| Single Unit, Attached | 961 (70.9%) | 395 (29.1%) |
| 2 Unit Apartments | 38 (23.6%) | 123 (76.4%) |
| 3 or 4 Unit Apartments | 59 (10.6%) | 499 (89.4%) |
| 5 to 9 Unit Apartments | 146 (17.0%) | 711 (83.0%) |
| 10 or more Apartments | 40 (1.6%) | 2,482 (98.4%) |
| Mobile Home / Other | 701 (87.8%) | 97 (12.2%) |
| Total | 17,723 (70.5%) | 7,425 (29.5%) |
Housing Structures by Number of Rooms in Chino Hills
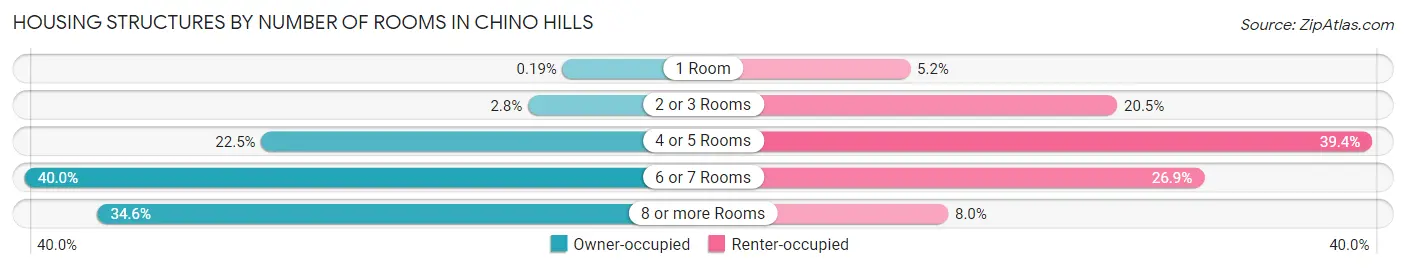
| Number of Rooms | Owner-occupied | Renter-occupied |
| 1 Room | 33 (0.2%) | 385 (5.2%) |
| 2 or 3 Rooms | 487 (2.8%) | 1,523 (20.5%) |
| 4 or 5 Rooms | 3,985 (22.5%) | 2,923 (39.4%) |
| 6 or 7 Rooms | 7,085 (40.0%) | 2,000 (26.9%) |
| 8 or more Rooms | 6,133 (34.6%) | 594 (8.0%) |
| Total | 17,723 (100.0%) | 7,425 (100.0%) |
Housing Structure by Heating Type in Chino Hills
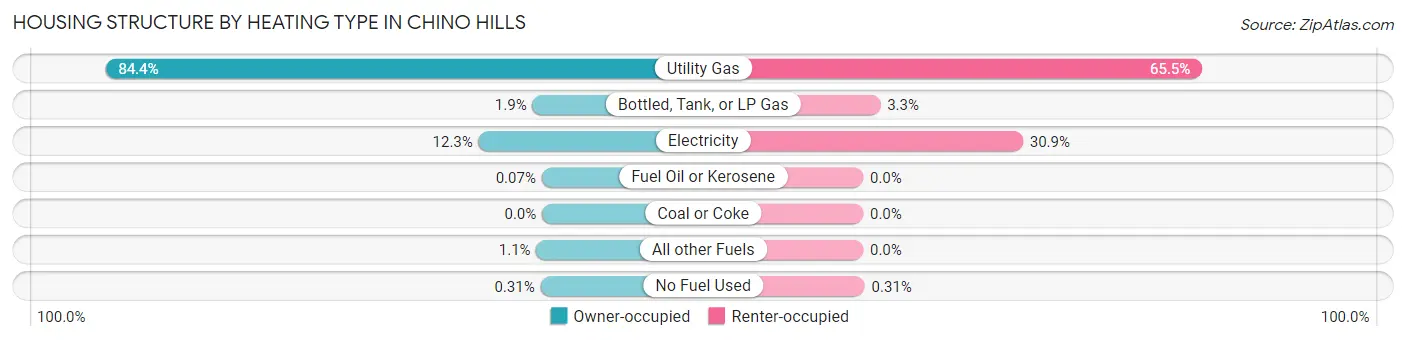
| Heating Type | Owner-occupied | Renter-occupied |
| Utility Gas | 14,958 (84.4%) | 4,864 (65.5%) |
| Bottled, Tank, or LP Gas | 329 (1.9%) | 246 (3.3%) |
| Electricity | 2,174 (12.3%) | 2,292 (30.9%) |
| Fuel Oil or Kerosene | 12 (0.1%) | 0 (0.0%) |
| Coal or Coke | 0 (0.0%) | 0 (0.0%) |
| All other Fuels | 195 (1.1%) | 0 (0.0%) |
| No Fuel Used | 55 (0.3%) | 23 (0.3%) |
| Total | 17,723 (100.0%) | 7,425 (100.0%) |
Household Vehicle Usage in Chino Hills
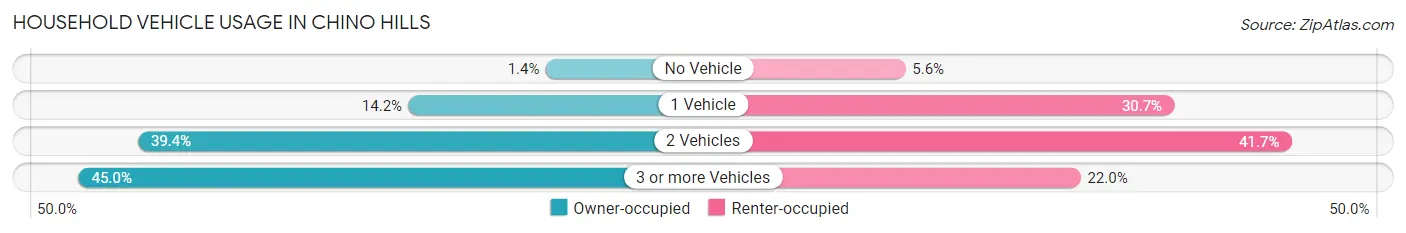
| Vehicles per Household | Owner-occupied | Renter-occupied |
| No Vehicle | 246 (1.4%) | 419 (5.6%) |
| 1 Vehicle | 2,521 (14.2%) | 2,280 (30.7%) |
| 2 Vehicles | 6,988 (39.4%) | 3,093 (41.7%) |
| 3 or more Vehicles | 7,968 (45.0%) | 1,633 (22.0%) |
| Total | 17,723 (100.0%) | 7,425 (100.0%) |
Real Estate & Mortgages in Chino Hills
Real Estate and Mortgage Overview in Chino Hills
| Characteristic | Without Mortgage | With Mortgage |
| Housing Units | 5,495 | 12,228 |
| Median Property Value | $724,500 | $797,000 |
| Median Household Income | $104,970 | $6,506 |
| Monthly Housing Costs | $868 | $6,024 |
| Real Estate Taxes | $5,224 | $370 |
Property Value by Mortgage Status in Chino Hills
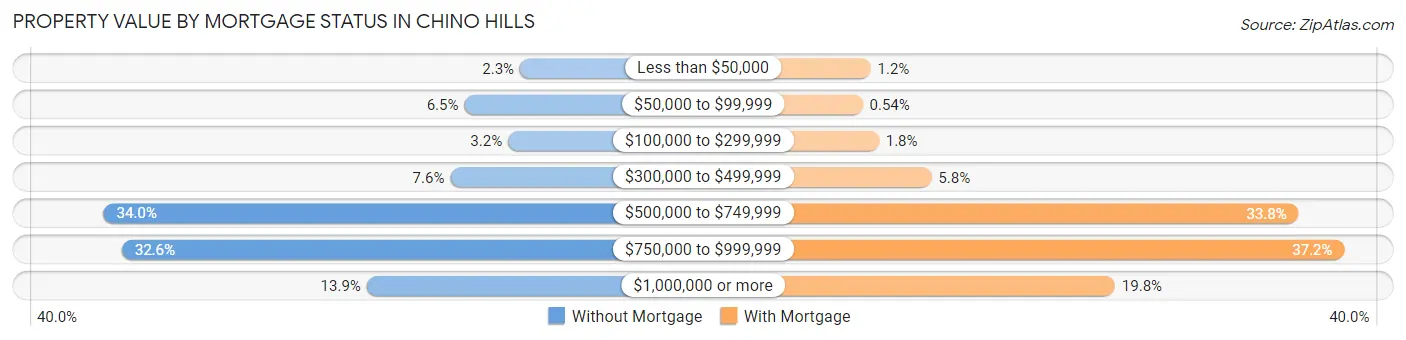
| Property Value | Without Mortgage | With Mortgage |
| Less than $50,000 | 124 (2.3%) | 141 (1.1%) |
| $50,000 to $99,999 | 357 (6.5%) | 66 (0.5%) |
| $100,000 to $299,999 | 174 (3.2%) | 216 (1.8%) |
| $300,000 to $499,999 | 416 (7.6%) | 707 (5.8%) |
| $500,000 to $749,999 | 1,867 (34.0%) | 4,128 (33.8%) |
| $750,000 to $999,999 | 1,791 (32.6%) | 4,554 (37.2%) |
| $1,000,000 or more | 766 (13.9%) | 2,416 (19.8%) |
| Total | 5,495 (100.0%) | 12,228 (100.0%) |
Household Income by Mortgage Status in Chino Hills
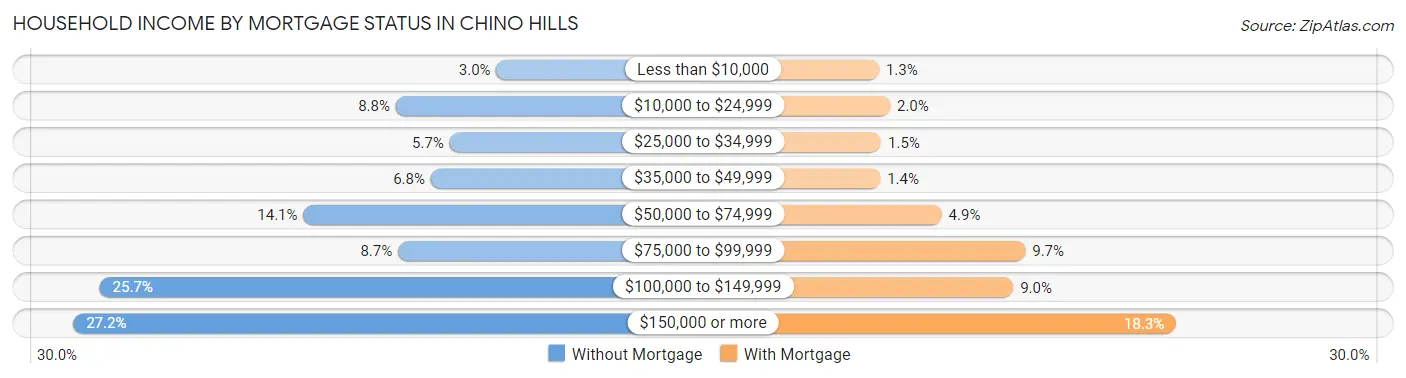
| Household Income | Without Mortgage | With Mortgage |
| Less than $10,000 | 167 (3.0%) | 164 (1.3%) |
| $10,000 to $24,999 | 483 (8.8%) | 241 (2.0%) |
| $25,000 to $34,999 | 314 (5.7%) | 178 (1.5%) |
| $35,000 to $49,999 | 373 (6.8%) | 173 (1.4%) |
| $50,000 to $74,999 | 773 (14.1%) | 602 (4.9%) |
| $75,000 to $99,999 | 476 (8.7%) | 1,186 (9.7%) |
| $100,000 to $149,999 | 1,413 (25.7%) | 1,102 (9.0%) |
| $150,000 or more | 1,496 (27.2%) | 2,240 (18.3%) |
| Total | 5,495 (100.0%) | 12,228 (100.0%) |
Property Value to Household Income Ratio in Chino Hills
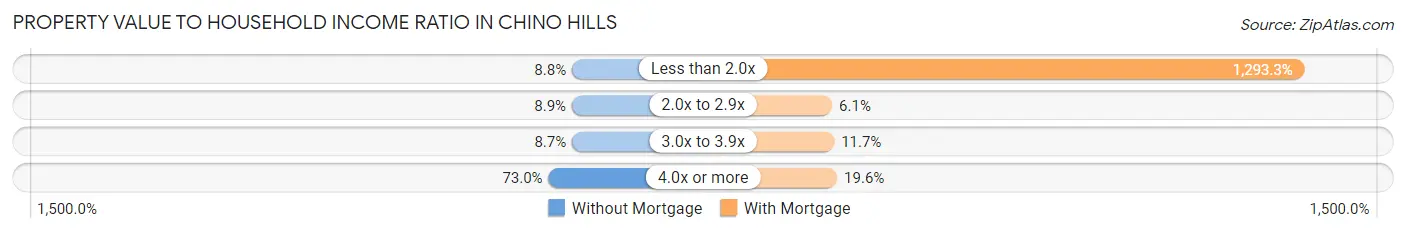
| Value-to-Income Ratio | Without Mortgage | With Mortgage |
| Less than 2.0x | 484 (8.8%) | 158,144 (1,293.3%) |
| 2.0x to 2.9x | 489 (8.9%) | 747 (6.1%) |
| 3.0x to 3.9x | 478 (8.7%) | 1,427 (11.7%) |
| 4.0x or more | 4,010 (73.0%) | 2,401 (19.6%) |
| Total | 5,495 (100.0%) | 12,228 (100.0%) |
Real Estate Taxes by Mortgage Status in Chino Hills
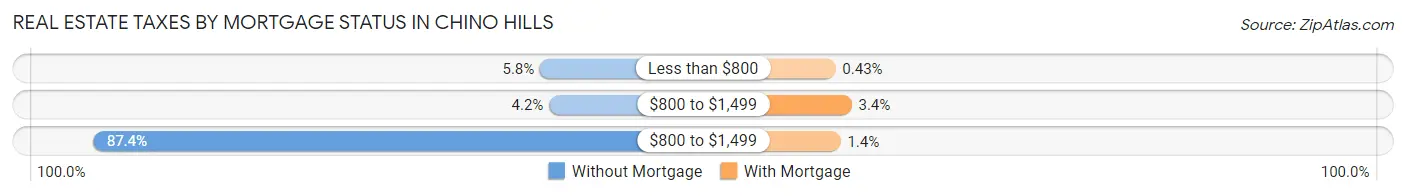
| Property Taxes | Without Mortgage | With Mortgage |
| Less than $800 | 321 (5.8%) | 53 (0.4%) |
| $800 to $1,499 | 230 (4.2%) | 413 (3.4%) |
| $800 to $1,499 | 4,800 (87.4%) | 165 (1.3%) |
| Total | 5,495 (100.0%) | 12,228 (100.0%) |
Health & Disability in Chino Hills
Health Insurance Coverage by Age in Chino Hills
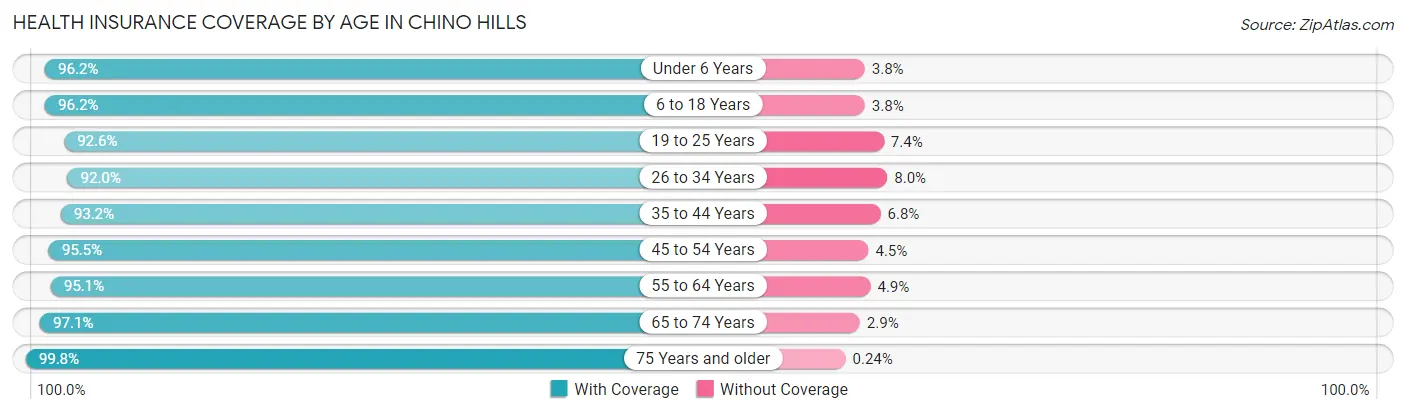
| Age Bracket | With Coverage | Without Coverage |
| Under 6 Years | 5,200 (96.2%) | 207 (3.8%) |
| 6 to 18 Years | 12,479 (96.2%) | 498 (3.8%) |
| 19 to 25 Years | 6,892 (92.6%) | 550 (7.4%) |
| 26 to 34 Years | 8,817 (92.0%) | 770 (8.0%) |
| 35 to 44 Years | 8,910 (93.2%) | 647 (6.8%) |
| 45 to 54 Years | 10,421 (95.5%) | 493 (4.5%) |
| 55 to 64 Years | 11,303 (95.1%) | 581 (4.9%) |
| 65 to 74 Years | 6,333 (97.1%) | 190 (2.9%) |
| 75 Years and older | 3,780 (99.8%) | 9 (0.2%) |
| Total | 74,135 (95.0%) | 3,945 (5.1%) |
Health Insurance Coverage by Citizenship Status in Chino Hills
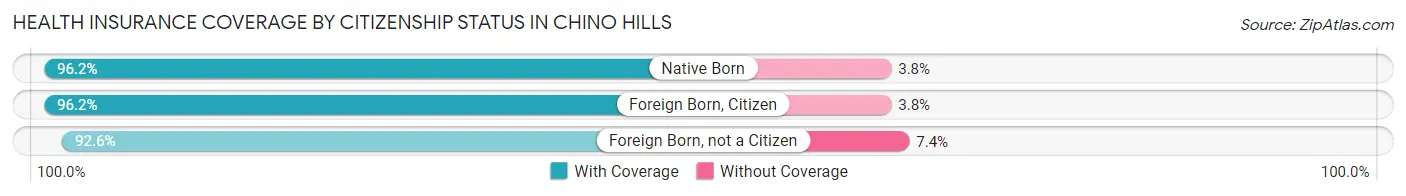
| Citizenship Status | With Coverage | Without Coverage |
| Native Born | 5,200 (96.2%) | 207 (3.8%) |
| Foreign Born, Citizen | 12,479 (96.2%) | 498 (3.8%) |
| Foreign Born, not a Citizen | 6,892 (92.6%) | 550 (7.4%) |
Health Insurance Coverage by Household Income in Chino Hills
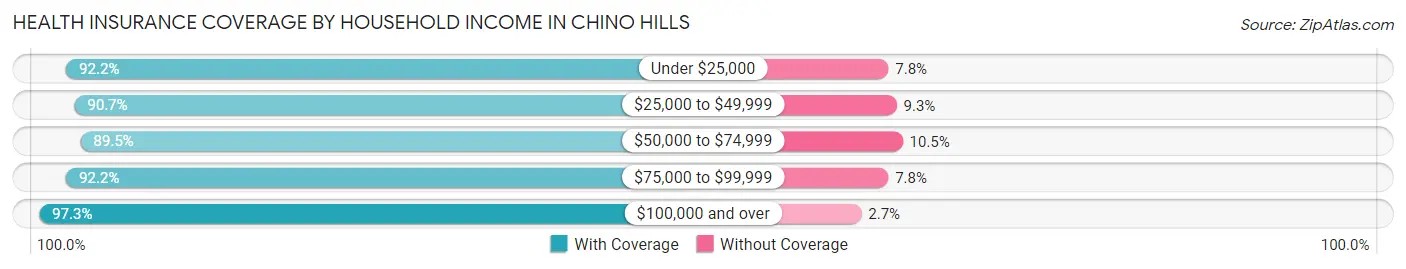
| Household Income | With Coverage | Without Coverage |
| Under $25,000 | 3,892 (92.2%) | 329 (7.8%) |
| $25,000 to $49,999 | 6,907 (90.7%) | 711 (9.3%) |
| $50,000 to $74,999 | 8,355 (89.5%) | 976 (10.5%) |
| $75,000 to $99,999 | 6,989 (92.2%) | 588 (7.8%) |
| $100,000 and over | 47,914 (97.3%) | 1,338 (2.7%) |
Public vs Private Health Insurance Coverage by Age in Chino Hills
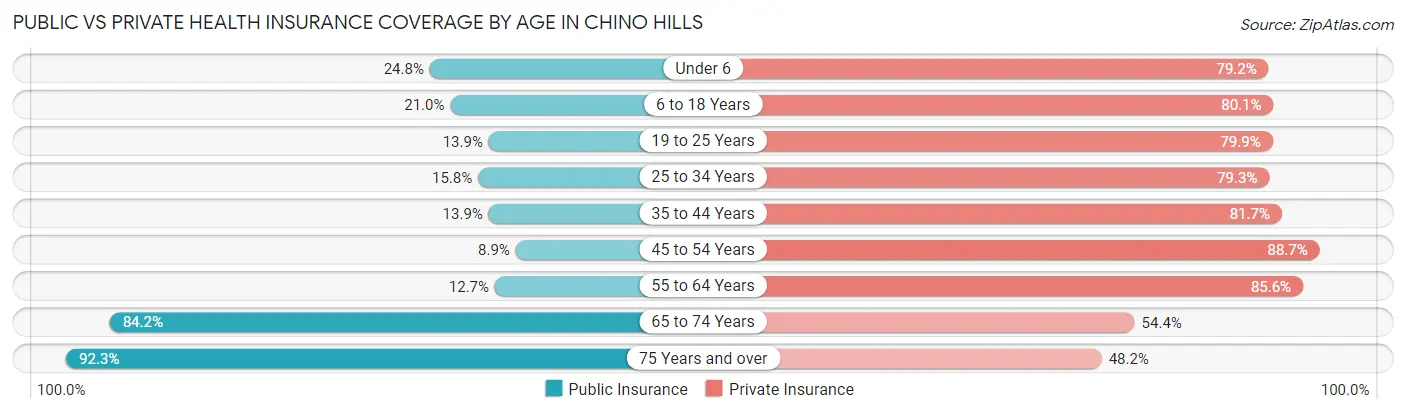
| Age Bracket | Public Insurance | Private Insurance |
| Under 6 | 1,341 (24.8%) | 4,283 (79.2%) |
| 6 to 18 Years | 2,722 (21.0%) | 10,394 (80.1%) |
| 19 to 25 Years | 1,031 (13.9%) | 5,949 (79.9%) |
| 25 to 34 Years | 1,519 (15.8%) | 7,605 (79.3%) |
| 35 to 44 Years | 1,325 (13.9%) | 7,803 (81.7%) |
| 45 to 54 Years | 966 (8.8%) | 9,678 (88.7%) |
| 55 to 64 Years | 1,511 (12.7%) | 10,172 (85.6%) |
| 65 to 74 Years | 5,492 (84.2%) | 3,546 (54.4%) |
| 75 Years and over | 3,497 (92.3%) | 1,828 (48.2%) |
| Total | 19,404 (24.8%) | 61,258 (78.5%) |
Disability Status by Sex by Age in Chino Hills
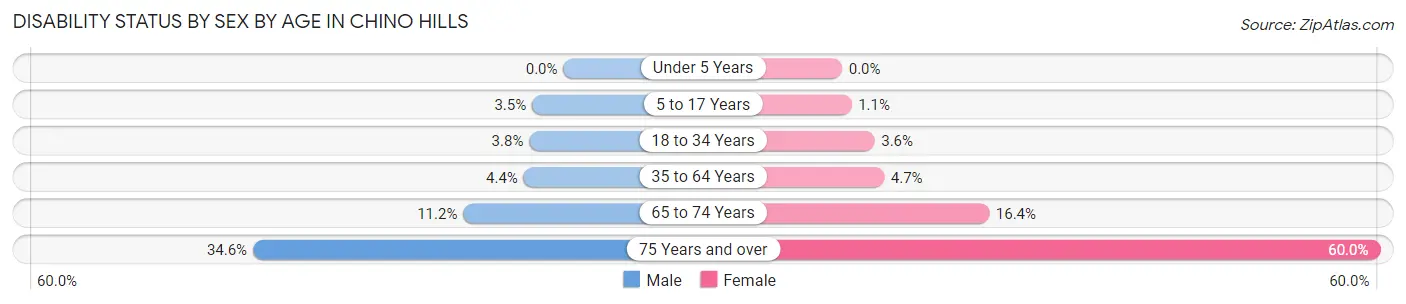
| Age Bracket | Male | Female |
| Under 5 Years | 0 (0.0%) | 0 (0.0%) |
| 5 to 17 Years | 252 (3.5%) | 56 (1.1%) |
| 18 to 34 Years | 362 (3.8%) | 310 (3.6%) |
| 35 to 64 Years | 686 (4.4%) | 788 (4.7%) |
| 65 to 74 Years | 357 (11.2%) | 544 (16.4%) |
| 75 Years and over | 467 (34.6%) | 1,462 (60.0%) |
Disability Class by Sex by Age in Chino Hills
Disability Class: Hearing Difficulty
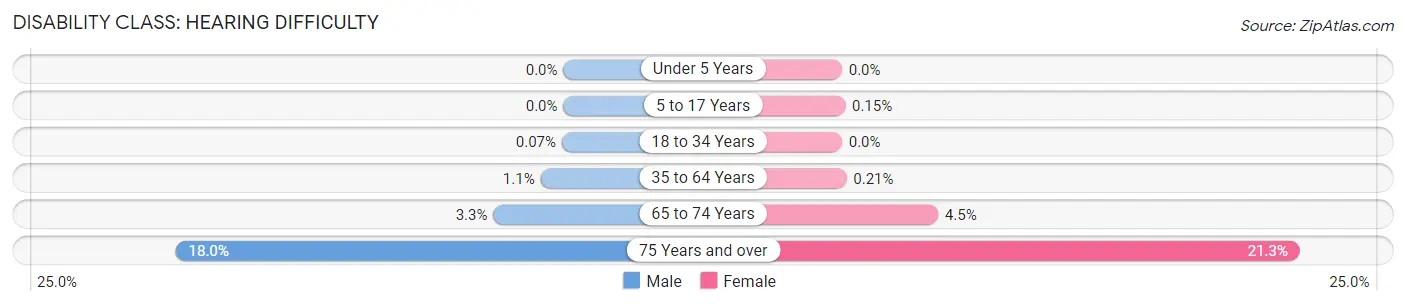
| Age Bracket | Male | Female |
| Under 5 Years | 0 (0.0%) | 0 (0.0%) |
| 5 to 17 Years | 0 (0.0%) | 8 (0.2%) |
| 18 to 34 Years | 7 (0.1%) | 0 (0.0%) |
| 35 to 64 Years | 164 (1.1%) | 36 (0.2%) |
| 65 to 74 Years | 104 (3.3%) | 148 (4.5%) |
| 75 Years and over | 243 (18.0%) | 518 (21.2%) |
Disability Class: Vision Difficulty
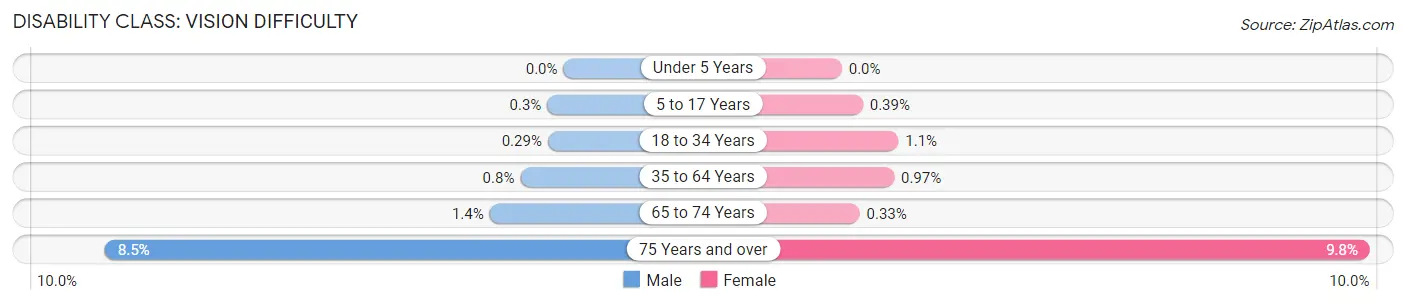
| Age Bracket | Male | Female |
| Under 5 Years | 0 (0.0%) | 0 (0.0%) |
| 5 to 17 Years | 22 (0.3%) | 21 (0.4%) |
| 18 to 34 Years | 28 (0.3%) | 90 (1.1%) |
| 35 to 64 Years | 124 (0.8%) | 164 (1.0%) |
| 65 to 74 Years | 44 (1.4%) | 11 (0.3%) |
| 75 Years and over | 115 (8.5%) | 239 (9.8%) |
Disability Class: Cognitive Difficulty
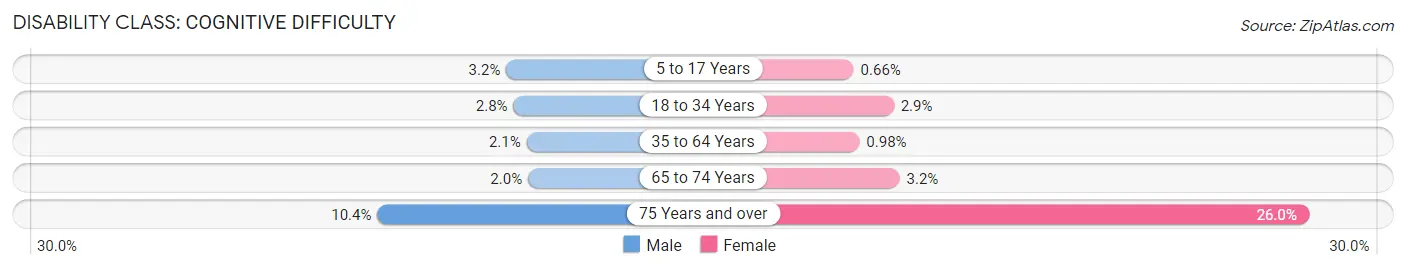
| Age Bracket | Male | Female |
| 5 to 17 Years | 230 (3.2%) | 35 (0.7%) |
| 18 to 34 Years | 265 (2.8%) | 248 (2.9%) |
| 35 to 64 Years | 319 (2.1%) | 165 (1.0%) |
| 65 to 74 Years | 63 (2.0%) | 107 (3.2%) |
| 75 Years and over | 140 (10.4%) | 634 (26.0%) |
Disability Class: Ambulatory Difficulty
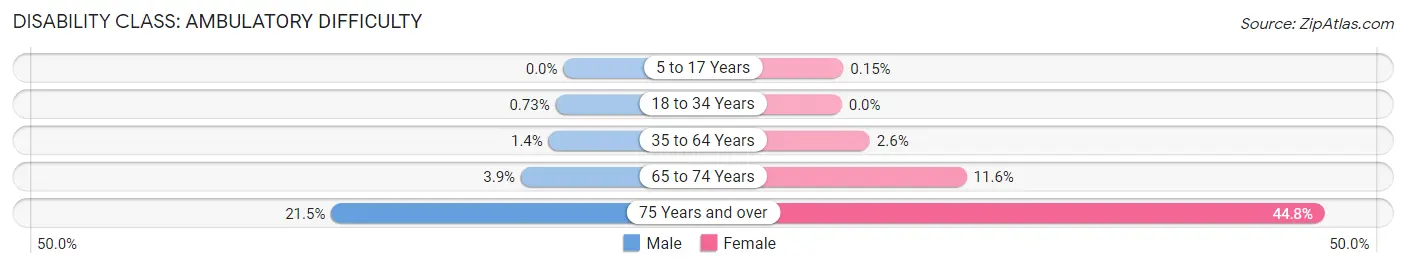
| Age Bracket | Male | Female |
| 5 to 17 Years | 0 (0.0%) | 8 (0.2%) |
| 18 to 34 Years | 70 (0.7%) | 0 (0.0%) |
| 35 to 64 Years | 212 (1.4%) | 439 (2.6%) |
| 65 to 74 Years | 126 (3.9%) | 385 (11.6%) |
| 75 Years and over | 291 (21.5%) | 1,093 (44.8%) |
Disability Class: Self-Care Difficulty
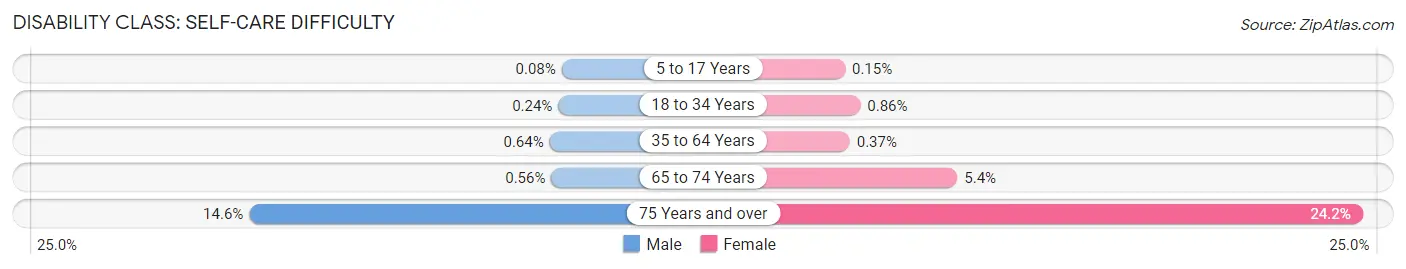
| Age Bracket | Male | Female |
| 5 to 17 Years | 6 (0.1%) | 8 (0.2%) |
| 18 to 34 Years | 23 (0.2%) | 74 (0.9%) |
| 35 to 64 Years | 100 (0.6%) | 63 (0.4%) |
| 65 to 74 Years | 18 (0.6%) | 178 (5.4%) |
| 75 Years and over | 197 (14.6%) | 589 (24.2%) |
Technology Access in Chino Hills
Computing Device Access in Chino Hills
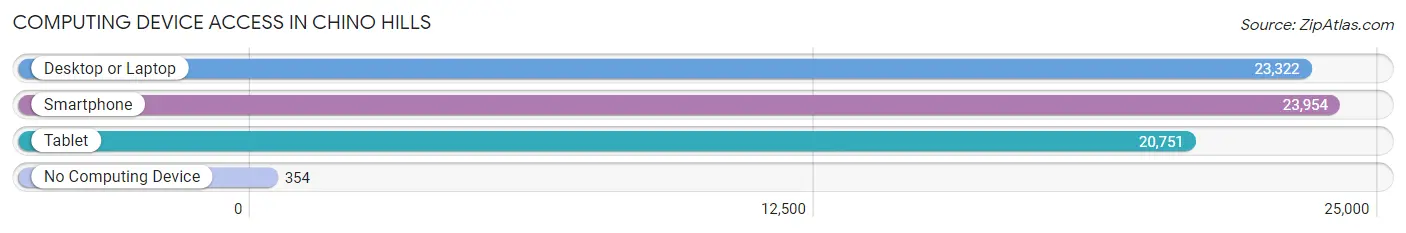
| Device Type | # Households | % Households |
| Desktop or Laptop | 23,322 | 92.7% |
| Smartphone | 23,954 | 95.3% |
| Tablet | 20,751 | 82.5% |
| No Computing Device | 354 | 1.4% |
| Total | 25,148 | 100.0% |
Internet Access in Chino Hills
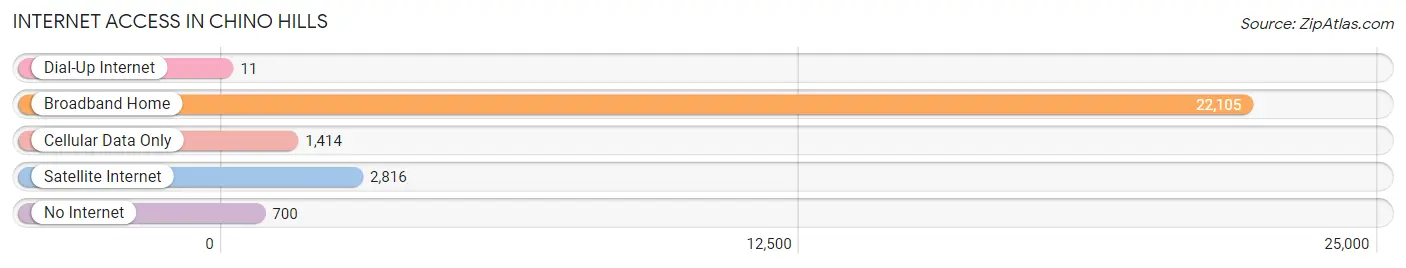
| Internet Type | # Households | % Households |
| Dial-Up Internet | 11 | 0.0% |
| Broadband Home | 22,105 | 87.9% |
| Cellular Data Only | 1,414 | 5.6% |
| Satellite Internet | 2,816 | 11.2% |
| No Internet | 700 | 2.8% |
| Total | 25,148 | 100.0% |
Chino Hills Summary
Chino Hills is a city located in the southwestern corner of San Bernardino County, California, United States. The city borders Los Angeles County on its northwest side, Orange County to its south, and Riverside County to its southeast. As of the 2010 census, the city had a population of 74,799.
History
The area that is now Chino Hills was originally inhabited by the Tongva Native American tribe. The first Europeans to visit the area were the Spanish, who arrived in 1771. The area was part of the Rancho Santa Ana del Chino, a Mexican land grant given to Antonio Maria Lugo in 1841. The area was then acquired by John Rowland and William Workman in 1845.
In the late 1800s, the area was used for cattle grazing and farming. The area was known as "South Chaffey" and was part of the Chaffey Ranch. In the early 1900s, the area was subdivided and developed for residential use. The first subdivision was called "Chino Hills" and was developed in the 1920s.
Geography
Chino Hills is located in the southwestern corner of San Bernardino County, California. It is bordered by Los Angeles County to the northwest, Orange County to the south, and Riverside County to the southeast. The city covers an area of approximately 27.8 square miles and has an elevation of 1,189 feet.
The city is located in the Chino Valley, which is part of the larger Inland Empire region of Southern California. The city is located in the foothills of the San Gabriel Mountains and is part of the San Bernardino-Riverside metropolitan area.
Climate
Chino Hills has a Mediterranean climate, with hot, dry summers and mild, wet winters. The average annual temperature is 68°F, with an average high of 88°F in the summer and an average low of 48°F in the winter. The average annual precipitation is 17.5 inches.
Economy
Chino Hills is a primarily residential city, with a strong retail and commercial sector. The city is home to several large employers, including the Chino Valley Medical Center, Chino Valley Unified School District, and the Chino Valley Fire District.
The city is also home to several shopping centers, including the Chino Hills Marketplace, Chino Spectrum Towne Center, and the Shoppes at Chino Hills. The city is also home to several industrial parks, including the Chino Business Park and the Chino Valley Industrial Park.
Demographics
As of the 2010 census, the city had a population of 74,799. The racial makeup of the city was 57.2% White, 2.3% African American, 0.7% Native American, 24.3% Asian, 0.2% Pacific Islander, 11.2% from other races, and 4.2% from two or more races. Hispanic or Latino of any race were 25.7% of the population.
The median household income in Chino Hills was $90,837 in 2019. The per capita income was $37,845. The median age was 36.3 years. The city had a poverty rate of 5.2%.
Conclusion
Chino Hills is a city located in the southwestern corner of San Bernardino County, California. The city has a population of 74,799 and is primarily residential, with a strong retail and commercial sector. The city has a Mediterranean climate, with hot, dry summers and mild, wet winters. The city is home to several large employers, shopping centers, and industrial parks. The median household income in Chino Hills was $90,837 in 2019, and the median age was 36.3 years.
Common Questions
What is Per Capita Income in Chino Hills?
Per Capita income in Chino Hills is $46,826.
What is the Median Family Income in Chino Hills?
Median Family Income in Chino Hills is $129,597.
What is the Median Household income in Chino Hills?
Median Household Income in Chino Hills is $117,548.
What is Income or Wage Gap in Chino Hills?
Income or Wage Gap in Chino Hills is 20.0%.
Women in Chino Hills earn 80.0 cents for every dollar earned by a man.
What is Family Income Deficit in Chino Hills?
Family Income Deficit in Chino Hills is $13,526.
Families that are below poverty line in Chino Hills earn $13,526 less on average than the poverty threshold level.
What is Inequality or Gini Index in Chino Hills?
Inequality or Gini Index in Chino Hills is 0.42.
What is the Total Population of Chino Hills?
Total Population of Chino Hills is 78,223.
What is the Total Male Population of Chino Hills?
Total Male Population of Chino Hills is 39,277.
What is the Total Female Population of Chino Hills?
Total Female Population of Chino Hills is 38,946.
What is the Ratio of Males per 100 Females in Chino Hills?
There are 100.85 Males per 100 Females in Chino Hills.
What is the Ratio of Females per 100 Males in Chino Hills?
There are 99.16 Females per 100 Males in Chino Hills.
What is the Median Population Age in Chino Hills?
Median Population Age in Chino Hills is 39.4 Years.
What is the Average Family Size in Chino Hills
Average Family Size in Chino Hills is 3.4 People.
What is the Average Household Size in Chino Hills
Average Household Size in Chino Hills is 3.1 People.
How Large is the Labor Force in Chino Hills?
There are 41,124 People in the Labor Forcein in Chino Hills.
What is the Percentage of People in the Labor Force in Chino Hills?
65.2% of People are in the Labor Force in Chino Hills.
What is the Unemployment Rate in Chino Hills?
Unemployment Rate in Chino Hills is 6.2%.