Union City, CA Map & Demographics
Union City Map
Union City Overview
$52,646
PER CAPITA INCOME
$150,302
AVG FAMILY INCOME
$138,013
AVG HOUSEHOLD INCOME
15.3%
WAGE / INCOME GAP [ % ]
84.7¢/ $1
WAGE / INCOME GAP [ $ ]
$10,561
FAMILY INCOME DEFICIT
0.40
INEQUALITY / GINI INDEX
69,502
TOTAL POPULATION
35,351
MALE POPULATION
34,151
FEMALE POPULATION
103.51
MALES / 100 FEMALES
96.61
FEMALES / 100 MALES
41.3
MEDIAN AGE
3.6
AVG FAMILY SIZE
3.3
AVG HOUSEHOLD SIZE
38,114
LABOR FORCE [ PEOPLE ]
65.3%
PERCENT IN LABOR FORCE
4.6%
UNEMPLOYMENT RATE
Union City Zip Codes
Union City Area Codes
Income in Union City
Income Overview in Union City
Per Capita Income in Union City is $52,646, while median incomes of families and households are $150,302 and $138,013 respectively.
| Characteristic | Number | Measure |
| Per Capita Income | 69,502 | $52,646 |
| Median Family Income | 16,897 | $150,302 |
| Mean Family Income | 16,897 | $178,565 |
| Median Household Income | 20,860 | $138,013 |
| Mean Household Income | 20,860 | $166,089 |
| Income Deficit | 16,897 | $10,561 |
| Wage / Income Gap (%) | 69,502 | 15.29% |
| Wage / Income Gap ($) | 69,502 | 84.71¢ per $1 |
| Gini / Inequality Index | 69,502 | 0.40 |
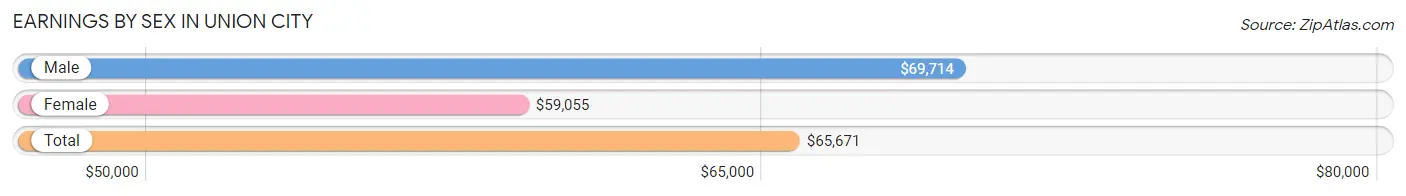
Earnings by Sex in Union City
Average Earnings in Union City are $65,671, $69,714 for men and $59,055 for women, a difference of 15.3%.
| Sex | Number | Average Earnings |
| Male | 21,235 (55.3%) | $69,714 |
| Female | 17,131 (44.7%) | $59,055 |
| Total | 38,366 (100.0%) | $65,671 |
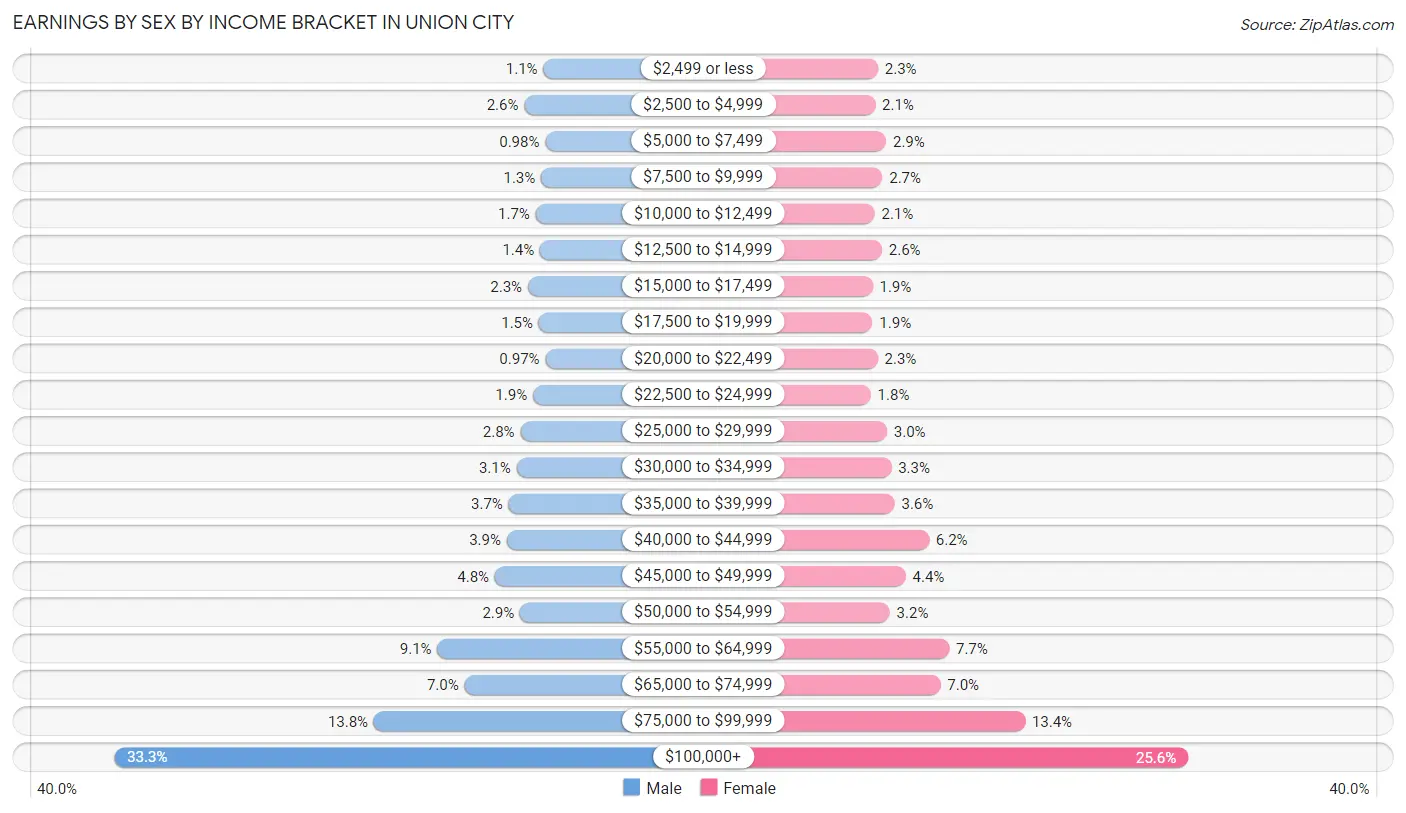
Earnings by Sex by Income Bracket in Union City
The most common earnings brackets in Union City are $100,000+ for men (7,070 | 33.3%) and $100,000+ for women (4,381 | 25.6%).
| Income | Male | Female |
| $2,499 or less | 238 (1.1%) | 400 (2.3%) |
| $2,500 to $4,999 | 541 (2.5%) | 363 (2.1%) |
| $5,000 to $7,499 | 209 (1.0%) | 503 (2.9%) |
| $7,500 to $9,999 | 273 (1.3%) | 456 (2.7%) |
| $10,000 to $12,499 | 362 (1.7%) | 357 (2.1%) |
| $12,500 to $14,999 | 290 (1.4%) | 451 (2.6%) |
| $15,000 to $17,499 | 485 (2.3%) | 331 (1.9%) |
| $17,500 to $19,999 | 310 (1.5%) | 329 (1.9%) |
| $20,000 to $22,499 | 205 (1.0%) | 395 (2.3%) |
| $22,500 to $24,999 | 404 (1.9%) | 307 (1.8%) |
| $25,000 to $29,999 | 603 (2.8%) | 514 (3.0%) |
| $30,000 to $34,999 | 665 (3.1%) | 571 (3.3%) |
| $35,000 to $39,999 | 790 (3.7%) | 614 (3.6%) |
| $40,000 to $44,999 | 820 (3.9%) | 1,054 (6.1%) |
| $45,000 to $49,999 | 1,008 (4.8%) | 755 (4.4%) |
| $50,000 to $54,999 | 610 (2.9%) | 550 (3.2%) |
| $55,000 to $64,999 | 1,924 (9.1%) | 1,312 (7.7%) |
| $65,000 to $74,999 | 1,493 (7.0%) | 1,201 (7.0%) |
| $75,000 to $99,999 | 2,935 (13.8%) | 2,287 (13.4%) |
| $100,000+ | 7,070 (33.3%) | 4,381 (25.6%) |
| Total | 21,235 (100.0%) | 17,131 (100.0%) |
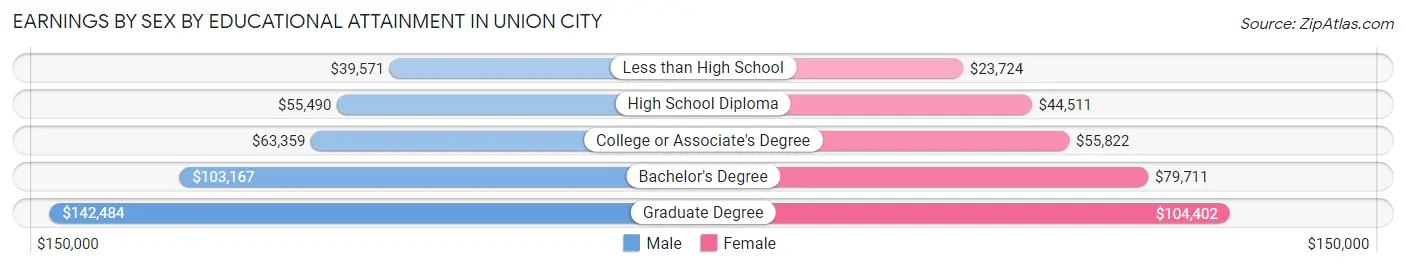
Earnings by Sex by Educational Attainment in Union City
Average earnings in Union City are $77,263 for men and $66,099 for women, a difference of 14.4%. Men with an educational attainment of graduate degree enjoy the highest average annual earnings of $142,484, while those with less than high school education earn the least with $39,571. Women with an educational attainment of graduate degree earn the most with the average annual earnings of $104,402, while those with less than high school education have the smallest earnings of $23,724.
| Educational Attainment | Male Income | Female Income |
| Less than High School | $39,571 | $23,724 |
| High School Diploma | $55,490 | $44,511 |
| College or Associate's Degree | $63,359 | $55,822 |
| Bachelor's Degree | $103,167 | $79,711 |
| Graduate Degree | $142,484 | $104,402 |
| Total | $77,263 | $66,099 |
Family Income in Union City
Family Income Brackets in Union City
According to the Union City family income data, there are 5,965 families falling into the $200,000+ income range, which is the most common income bracket and makes up 35.3% of all families. Conversely, the $10,000 to $14,999 income bracket is the least frequent group with only 135 families (0.8%) belonging to this category.
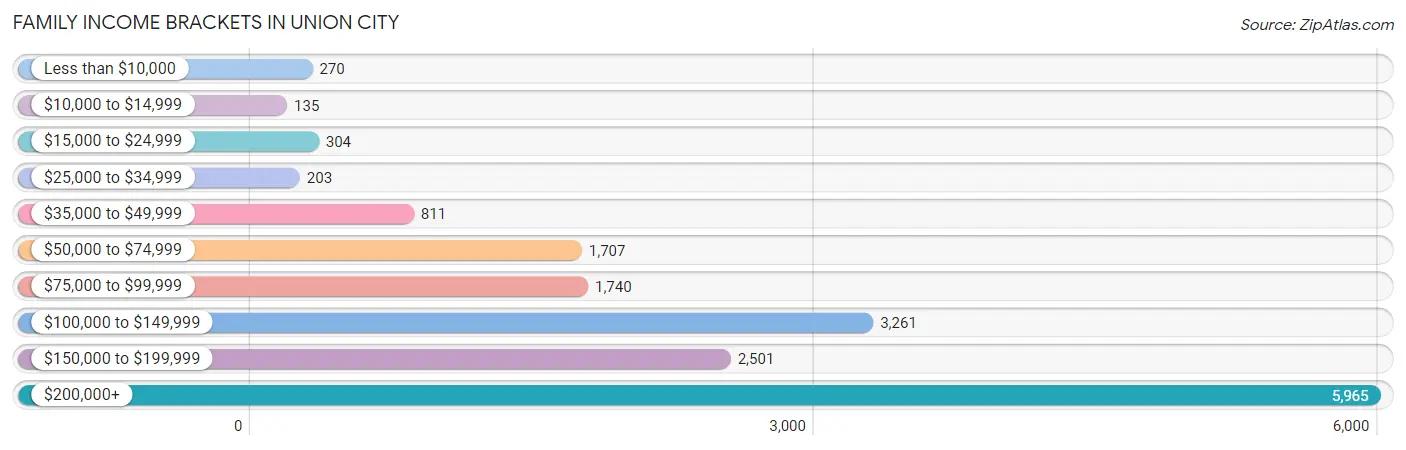
| Income Bracket | # Families | % Families |
| Less than $10,000 | 270 | 1.6% |
| $10,000 to $14,999 | 135 | 0.8% |
| $15,000 to $24,999 | 304 | 1.8% |
| $25,000 to $34,999 | 203 | 1.2% |
| $35,000 to $49,999 | 811 | 4.8% |
| $50,000 to $74,999 | 1,707 | 10.1% |
| $75,000 to $99,999 | 1,740 | 10.3% |
| $100,000 to $149,999 | 3,261 | 19.3% |
| $150,000 to $199,999 | 2,501 | 14.8% |
| $200,000+ | 5,965 | 35.3% |
Family Income by Famaliy Size in Union City
6-person families (827 | 4.9%) account for the highest median family income in Union City with $226,693 per family, while 2-person families (5,873 | 34.8%) have the highest median income of $62,308 per family member.
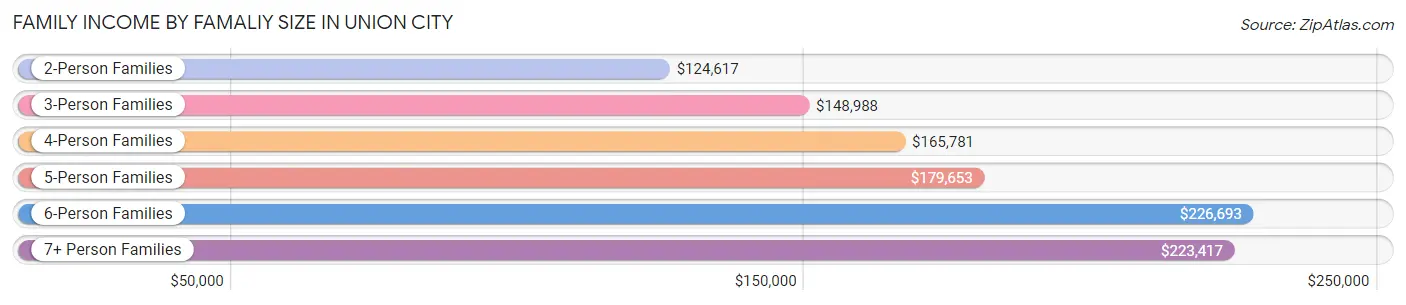
| Income Bracket | # Families | Median Income |
| 2-Person Families | 5,873 (34.8%) | $124,617 |
| 3-Person Families | 3,807 (22.5%) | $148,988 |
| 4-Person Families | 4,041 (23.9%) | $165,781 |
| 5-Person Families | 1,813 (10.7%) | $179,653 |
| 6-Person Families | 827 (4.9%) | $226,693 |
| 7+ Person Families | 536 (3.2%) | $223,417 |
| Total | 16,897 (100.0%) | $150,302 |
Family Income by Number of Earners in Union City
The median family income in Union City is $150,302, with families comprising 3+ earners (3,591) having the highest median family income of $221,659, while families with no earners (1,637) have the lowest median family income of $54,764, accounting for 21.2% and 9.7% of families, respectively.
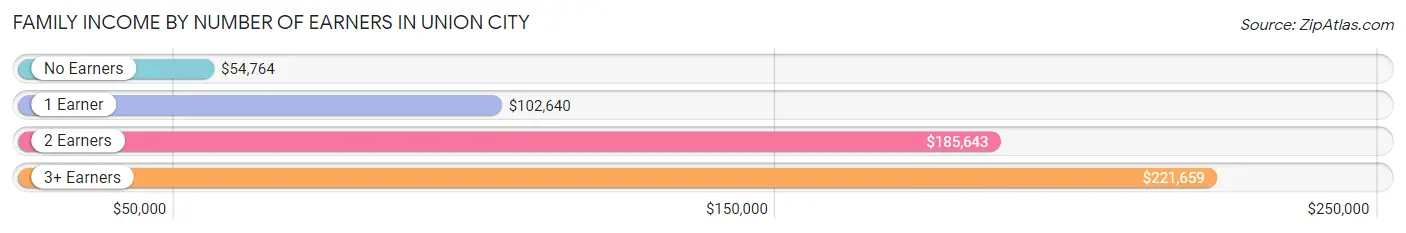
| Number of Earners | # Families | Median Income |
| No Earners | 1,637 (9.7%) | $54,764 |
| 1 Earner | 4,671 (27.6%) | $102,640 |
| 2 Earners | 6,998 (41.4%) | $185,643 |
| 3+ Earners | 3,591 (21.2%) | $221,659 |
| Total | 16,897 (100.0%) | $150,302 |
Household Income in Union City
Household Income Brackets in Union City
With 6,675 households falling in the category, the $200,000+ income range is the most frequent in Union City, accounting for 32.0% of all households. In contrast, only 292 households (1.4%) fall into the $10,000 to $14,999 income bracket, making it the least populous group.
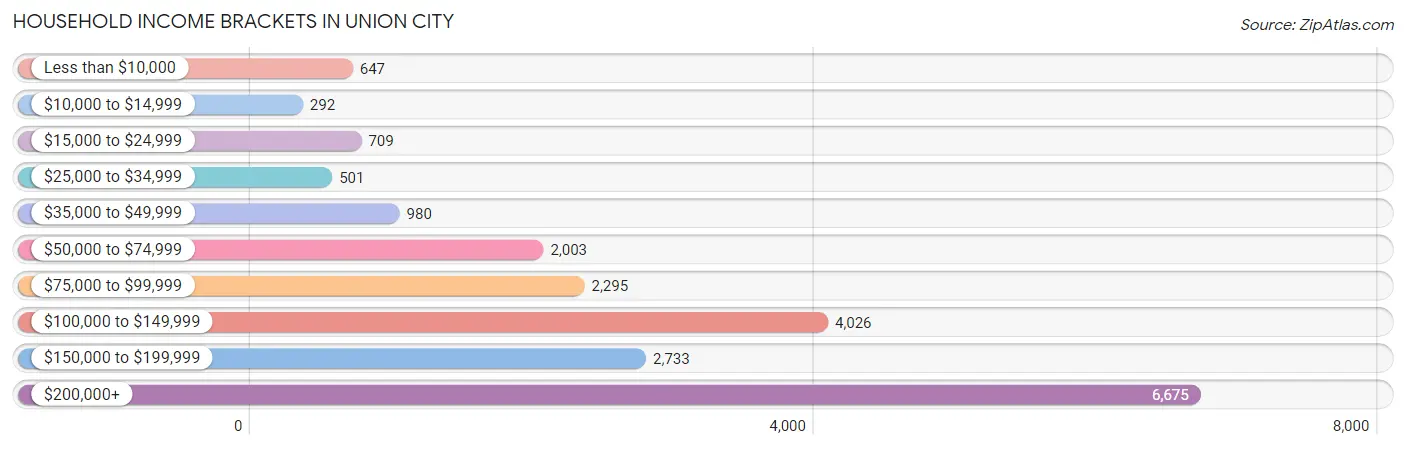
| Income Bracket | # Households | % Households |
| Less than $10,000 | 647 | 3.1% |
| $10,000 to $14,999 | 292 | 1.4% |
| $15,000 to $24,999 | 709 | 3.4% |
| $25,000 to $34,999 | 501 | 2.4% |
| $35,000 to $49,999 | 980 | 4.7% |
| $50,000 to $74,999 | 2,003 | 9.6% |
| $75,000 to $99,999 | 2,295 | 11.0% |
| $100,000 to $149,999 | 4,026 | 19.3% |
| $150,000 to $199,999 | 2,733 | 13.1% |
| $200,000+ | 6,675 | 32.0% |
Household Income by Householder Age in Union City
The median household income in Union City is $138,013, with the highest median household income of $173,879 found in the 25 to 44 years age bracket for the primary householder. A total of 6,966 households (33.4%) fall into this category. Meanwhile, the 15 to 24 years age bracket for the primary householder has the lowest median household income of $0, with 212 households (1.0%) in this group.
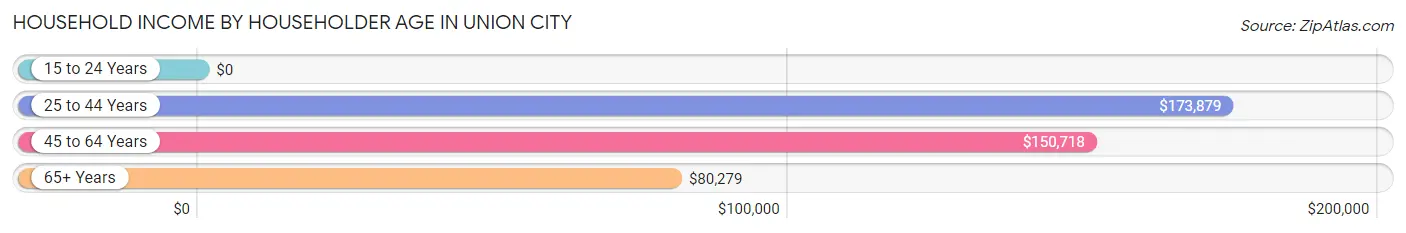
| Income Bracket | # Households | Median Income |
| 15 to 24 Years | 212 (1.0%) | $0 |
| 25 to 44 Years | 6,966 (33.4%) | $173,879 |
| 45 to 64 Years | 8,117 (38.9%) | $150,718 |
| 65+ Years | 5,565 (26.7%) | $80,279 |
| Total | 20,860 (100.0%) | $138,013 |
Poverty in Union City
Income Below Poverty by Sex and Age in Union City
With 6.1% poverty level for males and 7.1% for females among the residents of Union City, 18 to 24 year old males and 75 year old and over females are the most vulnerable to poverty, with 394 males (13.8%) and 405 females (13.6%) in their respective age groups living below the poverty level.
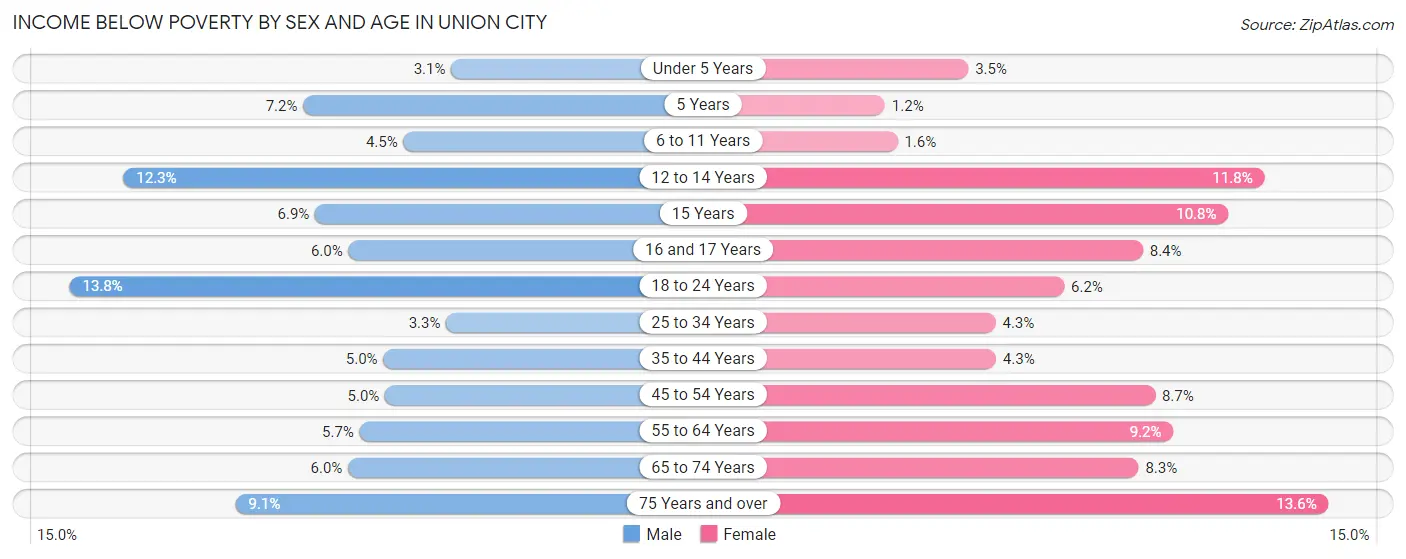
| Age Bracket | Male | Female |
| Under 5 Years | 58 (3.1%) | 44 (3.5%) |
| 5 Years | 22 (7.2%) | 3 (1.2%) |
| 6 to 11 Years | 98 (4.4%) | 30 (1.5%) |
| 12 to 14 Years | 163 (12.2%) | 119 (11.8%) |
| 15 Years | 26 (6.9%) | 47 (10.8%) |
| 16 and 17 Years | 35 (6.0%) | 46 (8.4%) |
| 18 to 24 Years | 394 (13.8%) | 158 (6.2%) |
| 25 to 34 Years | 174 (3.3%) | 205 (4.3%) |
| 35 to 44 Years | 283 (5.0%) | 215 (4.3%) |
| 45 to 54 Years | 207 (5.0%) | 422 (8.7%) |
| 55 to 64 Years | 277 (5.7%) | 423 (9.2%) |
| 65 to 74 Years | 203 (6.0%) | 316 (8.3%) |
| 75 Years and over | 200 (9.1%) | 405 (13.6%) |
| Total | 2,140 (6.1%) | 2,433 (7.1%) |
Income Above Poverty by Sex and Age in Union City
According to the poverty statistics in Union City, males aged under 5 years and females aged 5 years are the age groups that are most secure financially, with 96.9% of males and 98.8% of females in these age groups living above the poverty line.
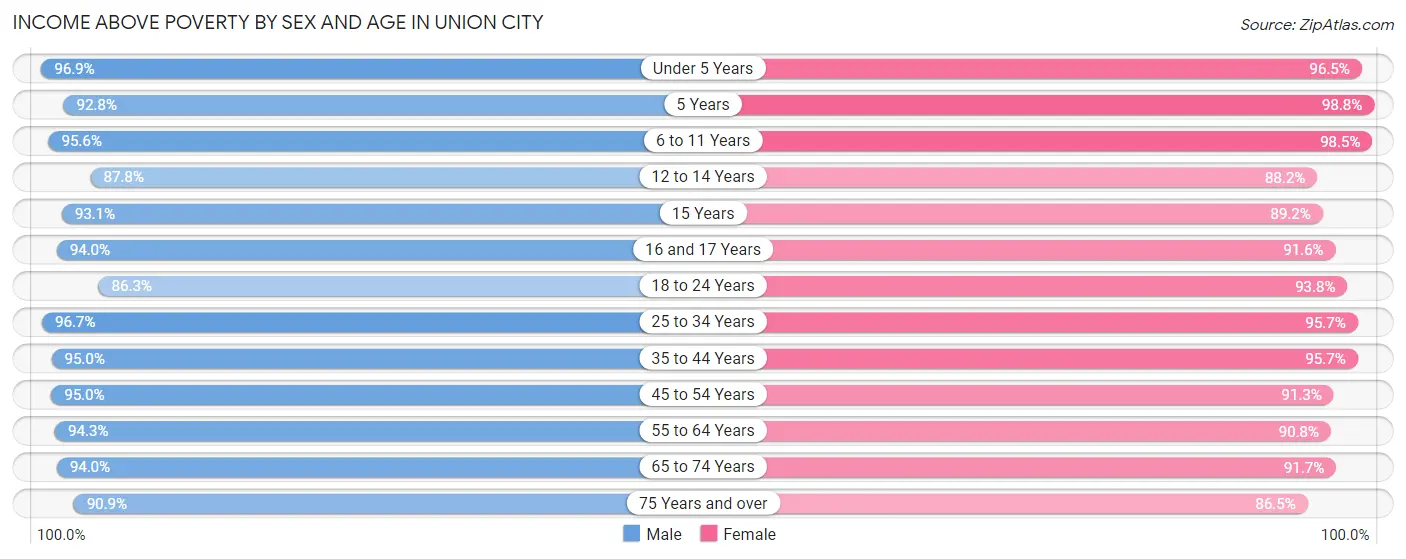
| Age Bracket | Male | Female |
| Under 5 Years | 1,801 (96.9%) | 1,205 (96.5%) |
| 5 Years | 282 (92.8%) | 247 (98.8%) |
| 6 to 11 Years | 2,104 (95.6%) | 1,901 (98.5%) |
| 12 to 14 Years | 1,168 (87.7%) | 892 (88.2%) |
| 15 Years | 350 (93.1%) | 390 (89.2%) |
| 16 and 17 Years | 550 (94.0%) | 503 (91.6%) |
| 18 to 24 Years | 2,472 (86.3%) | 2,396 (93.8%) |
| 25 to 34 Years | 5,169 (96.7%) | 4,584 (95.7%) |
| 35 to 44 Years | 5,363 (95.0%) | 4,801 (95.7%) |
| 45 to 54 Years | 3,970 (95.0%) | 4,418 (91.3%) |
| 55 to 64 Years | 4,611 (94.3%) | 4,160 (90.8%) |
| 65 to 74 Years | 3,185 (94.0%) | 3,511 (91.7%) |
| 75 Years and over | 1,991 (90.9%) | 2,583 (86.5%) |
| Total | 33,016 (93.9%) | 31,591 (92.8%) |
Income Below Poverty Among Married-Couple Families in Union City
The poverty statistics for married-couple families in Union City show that 3.2% or 433 of the total 13,651 families live below the poverty line. Families with 3 or 4 children have the highest poverty rate of 4.9%, comprising of 40 families. On the other hand, families with 5 or more children have the lowest poverty rate of 0.0%, which includes 0 families.
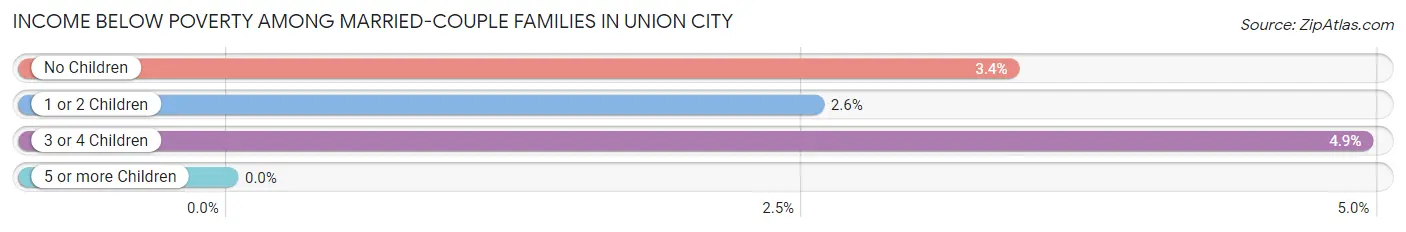
| Children | Above Poverty | Below Poverty |
| No Children | 7,638 (96.6%) | 269 (3.4%) |
| 1 or 2 Children | 4,735 (97.5%) | 124 (2.5%) |
| 3 or 4 Children | 770 (95.1%) | 40 (4.9%) |
| 5 or more Children | 75 (100.0%) | 0 (0.0%) |
| Total | 13,218 (96.8%) | 433 (3.2%) |
Income Below Poverty Among Single-Parent Households in Union City
According to the poverty data in Union City, 6.3% or 77 single-father households and 9.1% or 184 single-mother households are living below the poverty line. Among single-father households, those with 1 or 2 children have the highest poverty rate, with 38 households (9.1%) experiencing poverty. Likewise, among single-mother households, those with 1 or 2 children have the highest poverty rate, with 154 households (20.6%) falling below the poverty line.
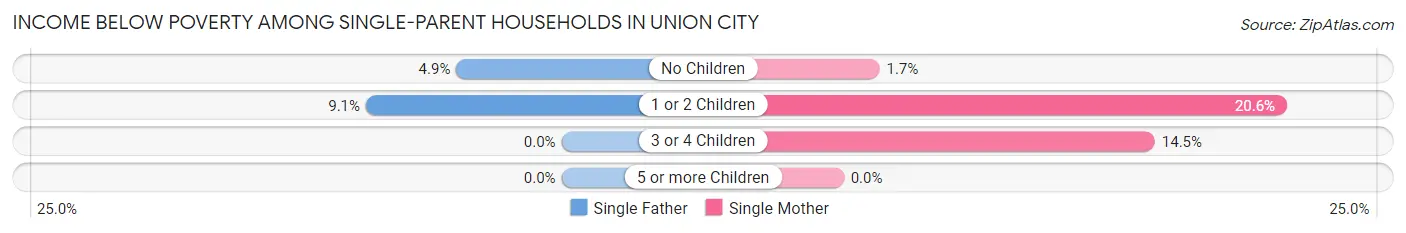
| Children | Single Father | Single Mother |
| No Children | 39 (4.9%) | 20 (1.7%) |
| 1 or 2 Children | 38 (9.1%) | 154 (20.6%) |
| 3 or 4 Children | 0 (0.0%) | 10 (14.5%) |
| 5 or more Children | 0 (0.0%) | 0 (0.0%) |
| Total | 77 (6.3%) | 184 (9.1%) |
Income Below Poverty Among Married-Couple vs Single-Parent Households in Union City
The poverty data for Union City shows that 433 of the married-couple family households (3.2%) and 261 of the single-parent households (8.0%) are living below the poverty level. Within the married-couple family households, those with 3 or 4 children have the highest poverty rate, with 40 households (4.9%) falling below the poverty line. Among the single-parent households, those with 1 or 2 children have the highest poverty rate, with 192 household (16.5%) living below poverty.
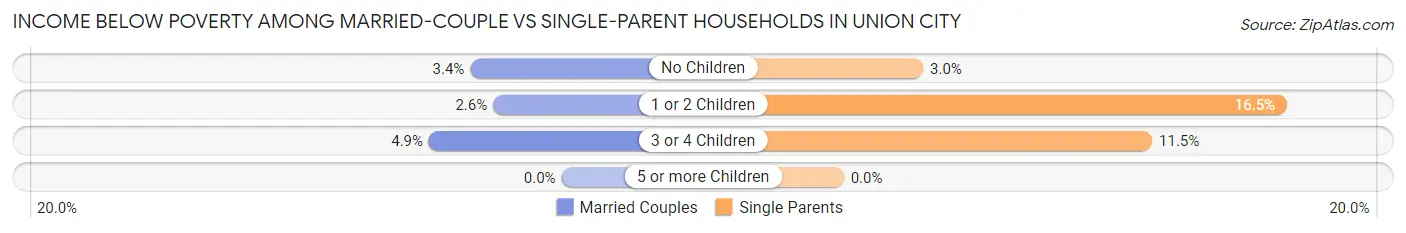
| Children | Married-Couple Families | Single-Parent Households |
| No Children | 269 (3.4%) | 59 (3.0%) |
| 1 or 2 Children | 124 (2.5%) | 192 (16.5%) |
| 3 or 4 Children | 40 (4.9%) | 10 (11.5%) |
| 5 or more Children | 0 (0.0%) | 0 (0.0%) |
| Total | 433 (3.2%) | 261 (8.0%) |
Race in Union City
The most populous races in Union City are Asian (38,809 | 55.8%), Hispanic or Latino (13,986 | 20.1%), and White / Caucasian (12,248 | 17.6%).
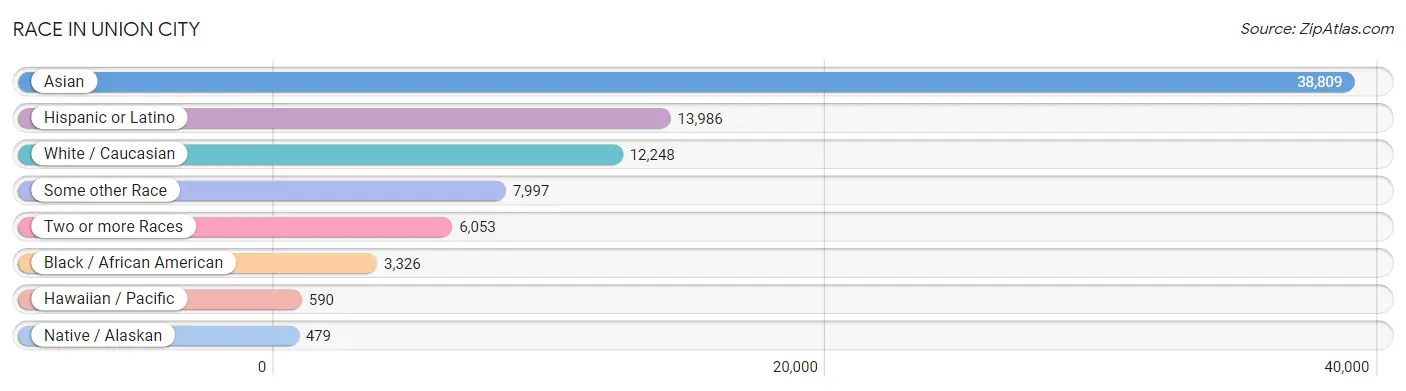
| Race | # Population | % Population |
| Asian | 38,809 | 55.8% |
| Black / African American | 3,326 | 4.8% |
| Hawaiian / Pacific | 590 | 0.9% |
| Hispanic or Latino | 13,986 | 20.1% |
| Native / Alaskan | 479 | 0.7% |
| White / Caucasian | 12,248 | 17.6% |
| Two or more Races | 6,053 | 8.7% |
| Some other Race | 7,997 | 11.5% |
| Total | 69,502 | 100.0% |
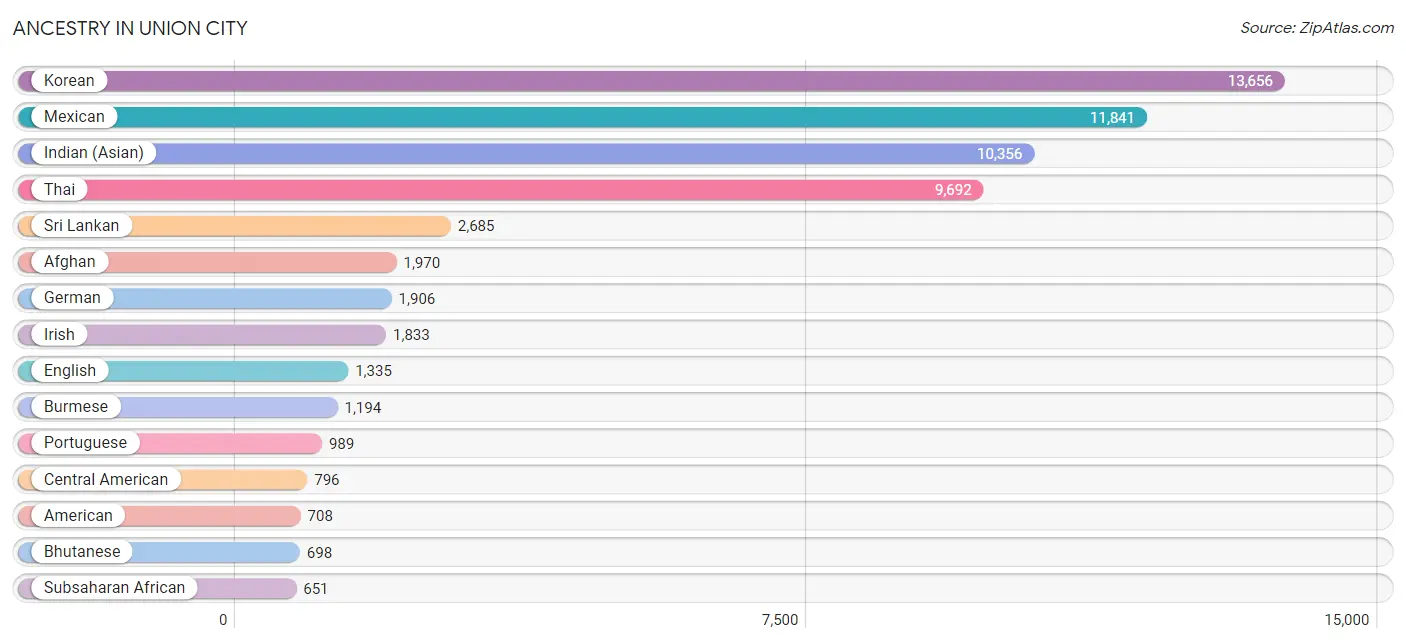
Ancestry in Union City
The most populous ancestries reported in Union City are Korean (13,656 | 19.7%), Mexican (11,841 | 17.0%), Indian (Asian) (10,356 | 14.9%), Thai (9,692 | 13.9%), and Sri Lankan (2,685 | 3.9%), together accounting for 69.4% of all Union City residents.
| Ancestry | # Population | % Population |
| Afghan | 1,970 | 2.8% |
| African | 336 | 0.5% |
| American | 708 | 1.0% |
| Apache | 54 | 0.1% |
| Arab | 367 | 0.5% |
| Assyrian / Chaldean / Syriac | 46 | 0.1% |
| Australian | 9 | 0.0% |
| Austrian | 48 | 0.1% |
| Bangladeshi | 5 | 0.0% |
| Barbadian | 4 | 0.0% |
| Basque | 27 | 0.0% |
| Bhutanese | 698 | 1.0% |
| Blackfeet | 7 | 0.0% |
| Bolivian | 14 | 0.0% |
| Brazilian | 19 | 0.0% |
| British | 161 | 0.2% |
| Bulgarian | 18 | 0.0% |
| Burmese | 1,194 | 1.7% |
| Canadian | 18 | 0.0% |
| Cape Verdean | 22 | 0.0% |
| Central American | 796 | 1.1% |
| Central American Indian | 88 | 0.1% |
| Cherokee | 61 | 0.1% |
| Chickasaw | 11 | 0.0% |
| Chilean | 32 | 0.1% |
| Chinese | 5 | 0.0% |
| Choctaw | 20 | 0.0% |
| Colombian | 19 | 0.0% |
| Costa Rican | 6 | 0.0% |
| Creek | 47 | 0.1% |
| Croatian | 6 | 0.0% |
| Cuban | 147 | 0.2% |
| Cypriot | 8 | 0.0% |
| Czech | 22 | 0.0% |
| Danish | 111 | 0.2% |
| Dominican | 41 | 0.1% |
| Dutch | 300 | 0.4% |
| Ecuadorian | 14 | 0.0% |
| English | 1,335 | 1.9% |
| Ethiopian | 192 | 0.3% |
| European | 249 | 0.4% |
| Filipino | 261 | 0.4% |
| Finnish | 32 | 0.1% |
| French | 156 | 0.2% |
| French Canadian | 24 | 0.0% |
| German | 1,906 | 2.7% |
| Ghanaian | 10 | 0.0% |
| Greek | 108 | 0.2% |
| Guamanian / Chamorro | 159 | 0.2% |
| Guatemalan | 76 | 0.1% |
| Honduran | 164 | 0.2% |
| Hopi | 17 | 0.0% |
| Hungarian | 59 | 0.1% |
| Indian (Asian) | 10,356 | 14.9% |
| Indonesian | 545 | 0.8% |
| Iranian | 105 | 0.2% |
| Iraqi | 12 | 0.0% |
| Irish | 1,833 | 2.6% |
| Iroquois | 10 | 0.0% |
| Italian | 582 | 0.8% |
| Japanese | 341 | 0.5% |
| Jordanian | 6 | 0.0% |
| Korean | 13,656 | 19.7% |
| Laotian | 461 | 0.7% |
| Latvian | 9 | 0.0% |
| Lebanese | 53 | 0.1% |
| Liberian | 39 | 0.1% |
| Lithuanian | 5 | 0.0% |
| Malaysian | 223 | 0.3% |
| Maltese | 26 | 0.0% |
| Mexican | 11,841 | 17.0% |
| Mexican American Indian | 230 | 0.3% |
| Native Hawaiian | 555 | 0.8% |
| Navajo | 3 | 0.0% |
| Nicaraguan | 321 | 0.5% |
| Nigerian | 49 | 0.1% |
| Northern European | 108 | 0.2% |
| Norwegian | 294 | 0.4% |
| Okinawan | 14 | 0.0% |
| Pakistani | 205 | 0.3% |
| Palestinian | 191 | 0.3% |
| Pennsylvania German | 5 | 0.0% |
| Peruvian | 67 | 0.1% |
| Polish | 176 | 0.3% |
| Portuguese | 989 | 1.4% |
| Puerto Rican | 381 | 0.5% |
| Romanian | 4 | 0.0% |
| Russian | 121 | 0.2% |
| Salvadoran | 229 | 0.3% |
| Samoan | 543 | 0.8% |
| Scandinavian | 58 | 0.1% |
| Scotch-Irish | 184 | 0.3% |
| Scottish | 321 | 0.5% |
| Sioux | 19 | 0.0% |
| Slavic | 12 | 0.0% |
| Slovak | 50 | 0.1% |
| Slovene | 33 | 0.1% |
| South American | 188 | 0.3% |
| Spaniard | 217 | 0.3% |
| Spanish | 230 | 0.3% |
| Spanish American Indian | 29 | 0.0% |
| Sri Lankan | 2,685 | 3.9% |
| Subsaharan African | 651 | 0.9% |
| Sudanese | 3 | 0.0% |
| Swedish | 97 | 0.1% |
| Swiss | 103 | 0.2% |
| Thai | 9,692 | 13.9% |
| Tongan | 5 | 0.0% |
| Turkish | 150 | 0.2% |
| Ukrainian | 65 | 0.1% |
| Uruguayan | 42 | 0.1% |
| Vietnamese | 57 | 0.1% |
| Welsh | 46 | 0.1% |
| Yaqui | 21 | 0.0% | View All 114 Rows |
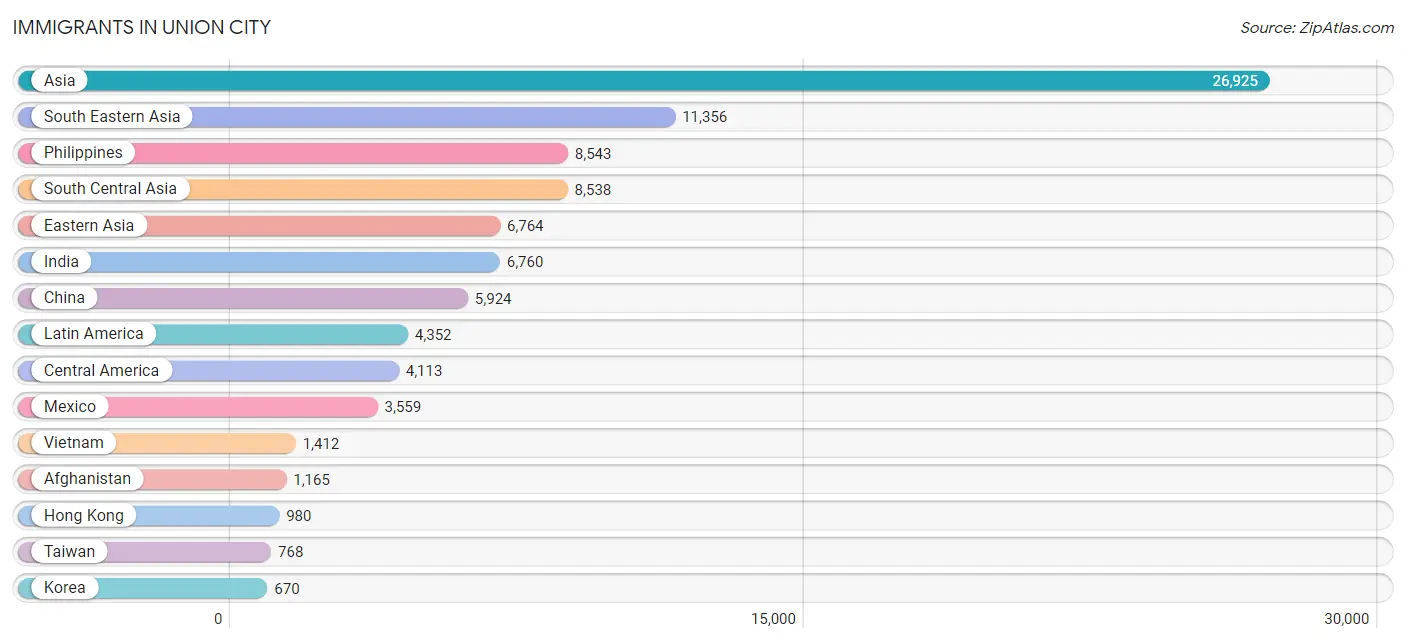
Immigrants in Union City
The most numerous immigrant groups reported in Union City came from Asia (26,925 | 38.7%), South Eastern Asia (11,356 | 16.3%), Philippines (8,543 | 12.3%), South Central Asia (8,538 | 12.3%), and Eastern Asia (6,764 | 9.7%), together accounting for 89.4% of all Union City residents.
| Immigration Origin | # Population | % Population |
| Afghanistan | 1,165 | 1.7% |
| Africa | 528 | 0.8% |
| Asia | 26,925 | 38.7% |
| Australia | 36 | 0.1% |
| Austria | 8 | 0.0% |
| Azores | 26 | 0.0% |
| Bahamas | 5 | 0.0% |
| Bangladesh | 67 | 0.1% |
| Bolivia | 14 | 0.0% |
| Brazil | 35 | 0.1% |
| Bulgaria | 18 | 0.0% |
| Cambodia | 178 | 0.3% |
| Canada | 161 | 0.2% |
| Caribbean | 74 | 0.1% |
| Central America | 4,113 | 5.9% |
| Chile | 18 | 0.0% |
| China | 5,924 | 8.5% |
| Colombia | 9 | 0.0% |
| Costa Rica | 19 | 0.0% |
| Croatia | 8 | 0.0% |
| Cuba | 41 | 0.1% |
| Czechoslovakia | 41 | 0.1% |
| Dominican Republic | 28 | 0.0% |
| Eastern Africa | 282 | 0.4% |
| Eastern Asia | 6,764 | 9.7% |
| Eastern Europe | 227 | 0.3% |
| El Salvador | 148 | 0.2% |
| England | 81 | 0.1% |
| Eritrea | 187 | 0.3% |
| Ethiopia | 1 | 0.0% |
| Europe | 634 | 0.9% |
| Fiji | 158 | 0.2% |
| France | 28 | 0.0% |
| Germany | 122 | 0.2% |
| Greece | 15 | 0.0% |
| Guatemala | 59 | 0.1% |
| Honduras | 88 | 0.1% |
| Hong Kong | 980 | 1.4% |
| India | 6,760 | 9.7% |
| Indonesia | 468 | 0.7% |
| Iran | 113 | 0.2% |
| Israel | 25 | 0.0% |
| Italy | 8 | 0.0% |
| Japan | 170 | 0.2% |
| Jordan | 24 | 0.0% |
| Kenya | 5 | 0.0% |
| Korea | 670 | 1.0% |
| Kuwait | 49 | 0.1% |
| Laos | 48 | 0.1% |
| Latin America | 4,352 | 6.3% |
| Lebanon | 49 | 0.1% |
| Liberia | 1 | 0.0% |
| Malaysia | 109 | 0.2% |
| Mexico | 3,559 | 5.1% |
| Moldova | 63 | 0.1% |
| Morocco | 9 | 0.0% |
| Nepal | 58 | 0.1% |
| Nicaragua | 240 | 0.4% |
| Nigeria | 85 | 0.1% |
| Northern Africa | 12 | 0.0% |
| Northern Europe | 123 | 0.2% |
| Oceania | 257 | 0.4% |
| Pakistan | 363 | 0.5% |
| Peru | 47 | 0.1% |
| Philippines | 8,543 | 12.3% |
| Portugal | 72 | 0.1% |
| Russia | 48 | 0.1% |
| Singapore | 37 | 0.1% |
| South America | 165 | 0.2% |
| South Central Asia | 8,538 | 12.3% |
| South Eastern Asia | 11,356 | 16.3% |
| Southern Europe | 114 | 0.2% |
| Spain | 19 | 0.0% |
| Sri Lanka | 12 | 0.0% |
| Sudan | 3 | 0.0% |
| Switzerland | 12 | 0.0% |
| Syria | 6 | 0.0% |
| Taiwan | 768 | 1.1% |
| Thailand | 117 | 0.2% |
| Turkey | 58 | 0.1% |
| Ukraine | 49 | 0.1% |
| Uruguay | 42 | 0.1% |
| Vietnam | 1,412 | 2.0% |
| Western Africa | 86 | 0.1% |
| Western Asia | 239 | 0.3% |
| Western Europe | 170 | 0.2% | View All 86 Rows |
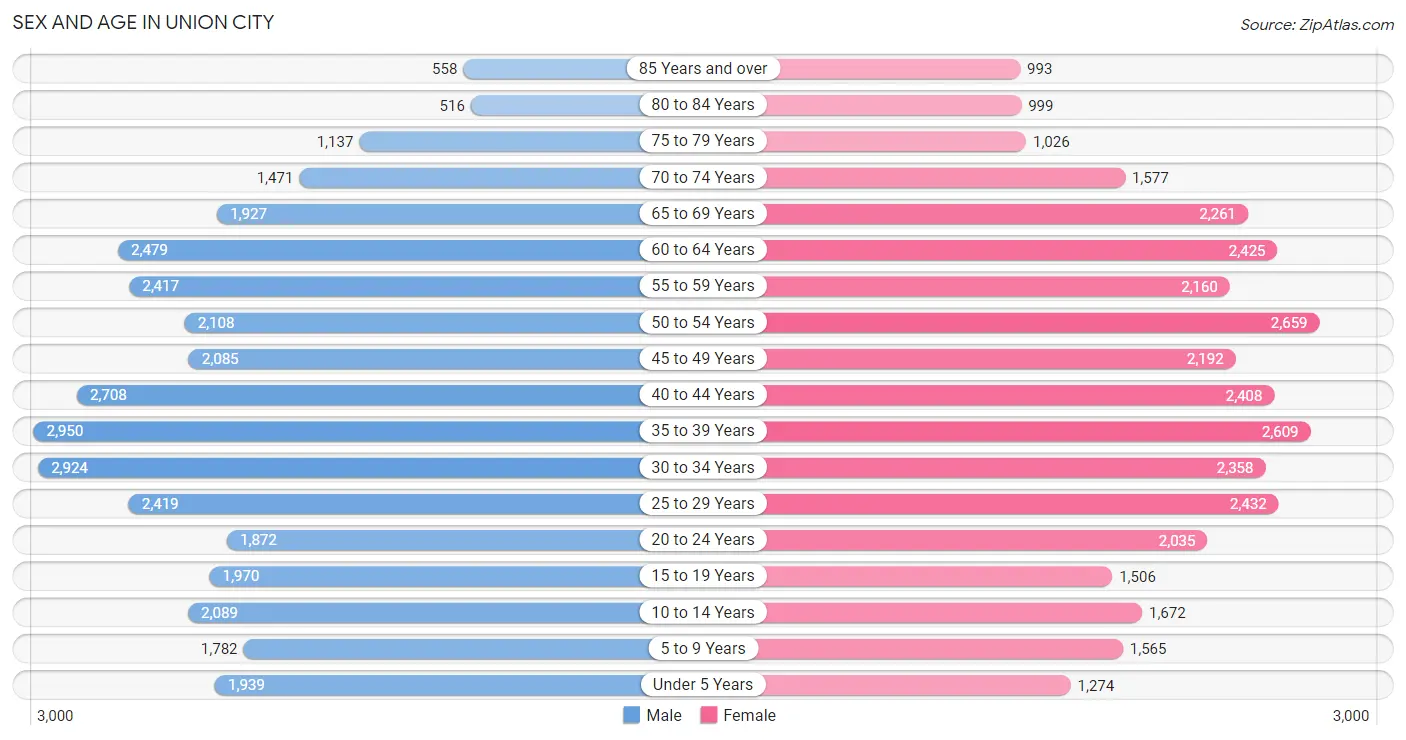
Sex and Age in Union City
Sex and Age in Union City
The most populous age groups in Union City are 35 to 39 Years (2,950 | 8.3%) for men and 50 to 54 Years (2,659 | 7.8%) for women.
| Age Bracket | Male | Female |
| Under 5 Years | 1,939 (5.5%) | 1,274 (3.7%) |
| 5 to 9 Years | 1,782 (5.0%) | 1,565 (4.6%) |
| 10 to 14 Years | 2,089 (5.9%) | 1,672 (4.9%) |
| 15 to 19 Years | 1,970 (5.6%) | 1,506 (4.4%) |
| 20 to 24 Years | 1,872 (5.3%) | 2,035 (6.0%) |
| 25 to 29 Years | 2,419 (6.8%) | 2,432 (7.1%) |
| 30 to 34 Years | 2,924 (8.3%) | 2,358 (6.9%) |
| 35 to 39 Years | 2,950 (8.3%) | 2,609 (7.6%) |
| 40 to 44 Years | 2,708 (7.7%) | 2,408 (7.0%) |
| 45 to 49 Years | 2,085 (5.9%) | 2,192 (6.4%) |
| 50 to 54 Years | 2,108 (6.0%) | 2,659 (7.8%) |
| 55 to 59 Years | 2,417 (6.8%) | 2,160 (6.3%) |
| 60 to 64 Years | 2,479 (7.0%) | 2,425 (7.1%) |
| 65 to 69 Years | 1,927 (5.4%) | 2,261 (6.6%) |
| 70 to 74 Years | 1,471 (4.2%) | 1,577 (4.6%) |
| 75 to 79 Years | 1,137 (3.2%) | 1,026 (3.0%) |
| 80 to 84 Years | 516 (1.5%) | 999 (2.9%) |
| 85 Years and over | 558 (1.6%) | 993 (2.9%) |
| Total | 35,351 (100.0%) | 34,151 (100.0%) |
Families and Households in Union City
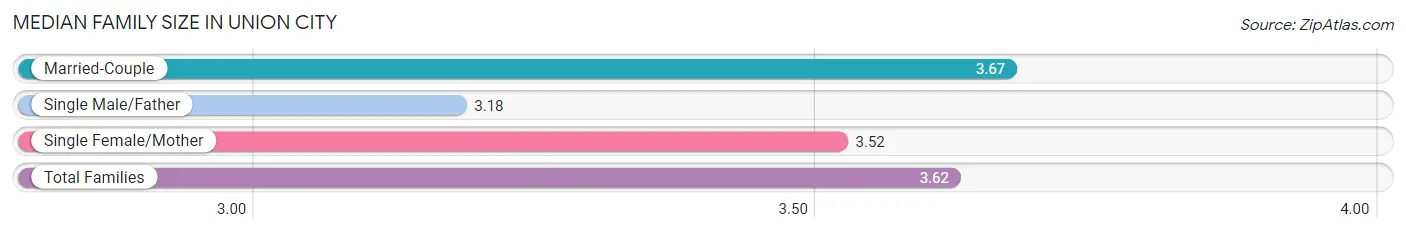
Median Family Size in Union City
The median family size in Union City is 3.62 persons per family, with married-couple families (13,651 | 80.8%) accounting for the largest median family size of 3.67 persons per family. On the other hand, single male/father families (1,231 | 7.3%) represent the smallest median family size with 3.18 persons per family.
| Family Type | # Families | Family Size |
| Married-Couple | 13,651 (80.8%) | 3.67 |
| Single Male/Father | 1,231 (7.3%) | 3.18 |
| Single Female/Mother | 2,015 (11.9%) | 3.52 |
| Total Families | 16,897 (100.0%) | 3.62 |
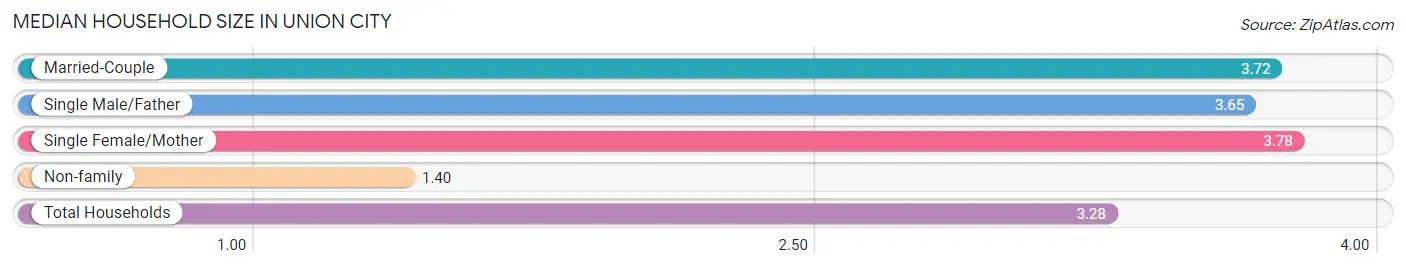
Median Household Size in Union City
The median household size in Union City is 3.28 persons per household, with single female/mother households (2,015 | 9.7%) accounting for the largest median household size of 3.78 persons per household. non-family households (3,963 | 19.0%) represent the smallest median household size with 1.40 persons per household.
| Household Type | # Households | Household Size |
| Married-Couple | 13,651 (65.4%) | 3.72 |
| Single Male/Father | 1,231 (5.9%) | 3.65 |
| Single Female/Mother | 2,015 (9.7%) | 3.78 |
| Non-family | 3,963 (19.0%) | 1.40 |
| Total Households | 20,860 (100.0%) | 3.28 |
Household Size by Marriage Status in Union City
Out of a total of 20,860 households in Union City, 16,897 (81.0%) are family households, while 3,963 (19.0%) are nonfamily households. The most numerous type of family households are 2-person households, comprising 5,410, and the most common type of nonfamily households are 1-person households, comprising 3,116.
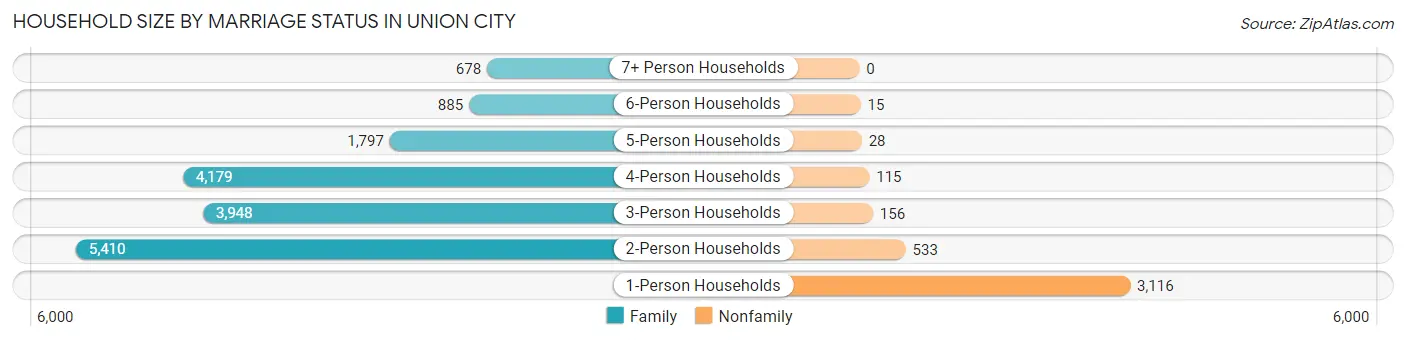
| Household Size | Family Households | Nonfamily Households |
| 1-Person Households | - | 3,116 (14.9%) |
| 2-Person Households | 5,410 (25.9%) | 533 (2.6%) |
| 3-Person Households | 3,948 (18.9%) | 156 (0.7%) |
| 4-Person Households | 4,179 (20.0%) | 115 (0.5%) |
| 5-Person Households | 1,797 (8.6%) | 28 (0.1%) |
| 6-Person Households | 885 (4.2%) | 15 (0.1%) |
| 7+ Person Households | 678 (3.3%) | 0 (0.0%) |
| Total | 16,897 (81.0%) | 3,963 (19.0%) |
Female Fertility in Union City
Fertility by Age in Union City
Average fertility rate in Union City is 34.0 births per 1,000 women. Women in the age bracket of 20 to 34 years have the highest fertility rate with 41.0 births per 1,000 women. Women in the age bracket of 20 to 34 years acount for 51.2% of all women with births.
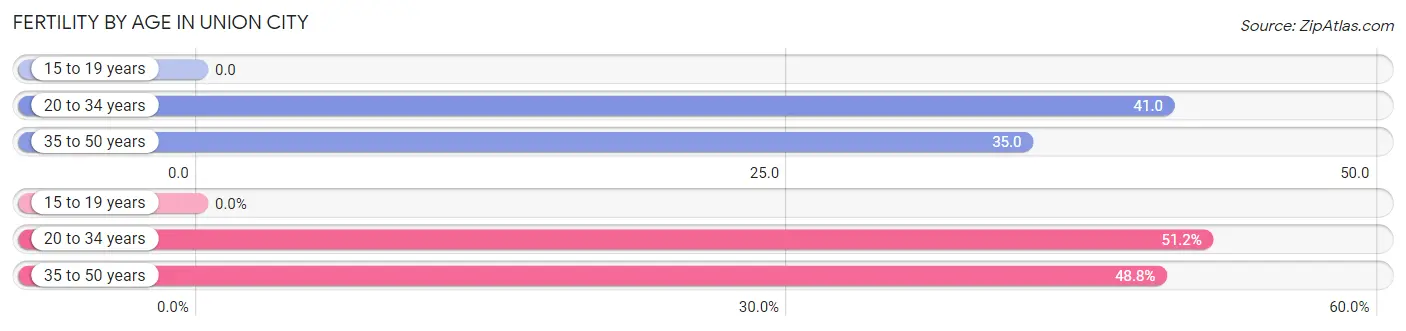
| Age Bracket | Women with Births | Births / 1,000 Women |
| 15 to 19 years | 0 (0.0%) | 0.0 |
| 20 to 34 years | 283 (51.2%) | 41.0 |
| 35 to 50 years | 270 (48.8%) | 35.0 |
| Total | 553 (100.0%) | 34.0 |
Fertility by Age by Marriage Status in Union City
91.5% of women with births (553) in Union City are married. The highest percentage of unmarried women with births falls into 35 to 50 years age bracket with 14.4% of them unmarried at the time of birth, while the lowest percentage of unmarried women with births belong to 20 to 34 years age bracket with 2.8% of them unmarried.
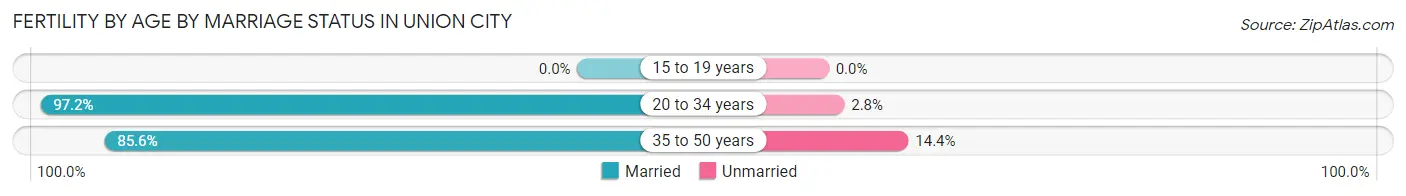
| Age Bracket | Married | Unmarried |
| 15 to 19 years | 0 (0.0%) | 0 (0.0%) |
| 20 to 34 years | 275 (97.2%) | 8 (2.8%) |
| 35 to 50 years | 231 (85.6%) | 39 (14.4%) |
| Total | 506 (91.5%) | 47 (8.5%) |
Fertility by Education in Union City
Average fertility rate in Union City is 34.0 births per 1,000 women. Women with the education attainment of graduate degree have the highest fertility rate of 76.0 births per 1,000 women, while women with the education attainment of less than high school have the lowest fertility at 10.0 births per 1,000 women. Women with the education attainment of bachelor's degree represent 38.5% of all women with births.
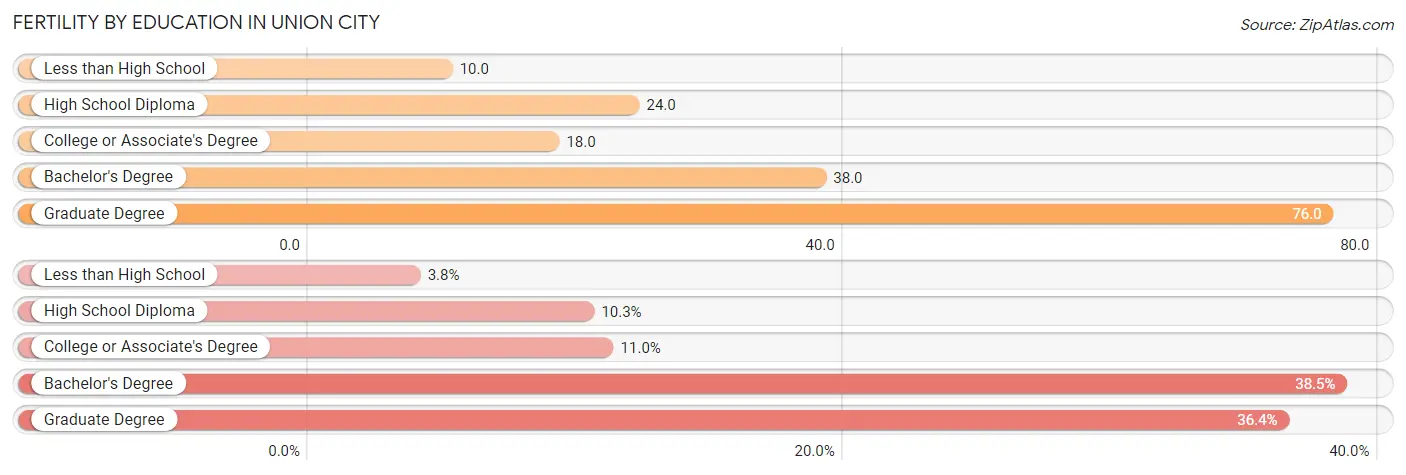
| Educational Attainment | Women with Births | Births / 1,000 Women |
| Less than High School | 21 (3.8%) | 10.0 |
| High School Diploma | 57 (10.3%) | 24.0 |
| College or Associate's Degree | 61 (11.0%) | 18.0 |
| Bachelor's Degree | 213 (38.5%) | 38.0 |
| Graduate Degree | 201 (36.3%) | 76.0 |
| Total | 553 (100.0%) | 34.0 |
Fertility by Education by Marriage Status in Union City
8.5% of women with births in Union City are unmarried. Women with the educational attainment of high school diploma are most likely to be married with 100.0% of them married at childbirth, while women with the educational attainment of less than high school are least likely to be married with 38.1% of them unmarried at childbirth.
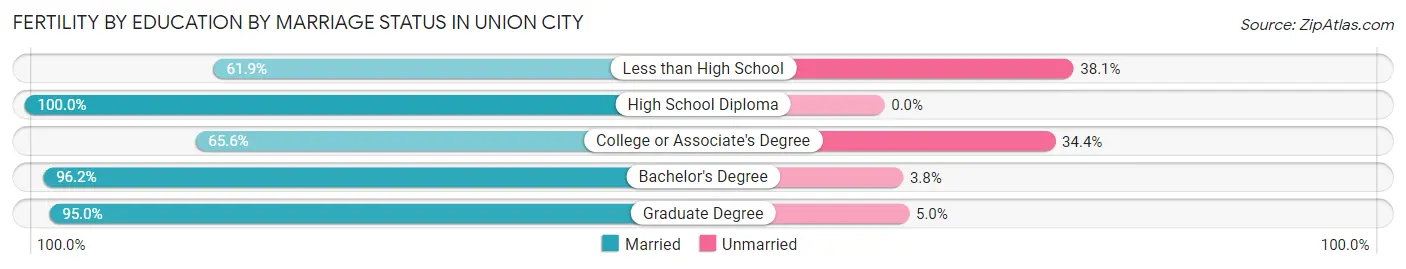
| Educational Attainment | Married | Unmarried |
| Less than High School | 13 (61.9%) | 8 (38.1%) |
| High School Diploma | 57 (100.0%) | 0 (0.0%) |
| College or Associate's Degree | 40 (65.6%) | 21 (34.4%) |
| Bachelor's Degree | 205 (96.2%) | 8 (3.8%) |
| Graduate Degree | 191 (95.0%) | 10 (5.0%) |
| Total | 506 (91.5%) | 47 (8.5%) |
Employment Characteristics in Union City
Employment by Class of Employer in Union City
Among the 31,436 employed individuals in Union City, private company employees (23,663 | 75.3%), not-for-profit organizations (2,267 | 7.2%), and local government employees (2,100 | 6.7%) make up the most common classes of employment.
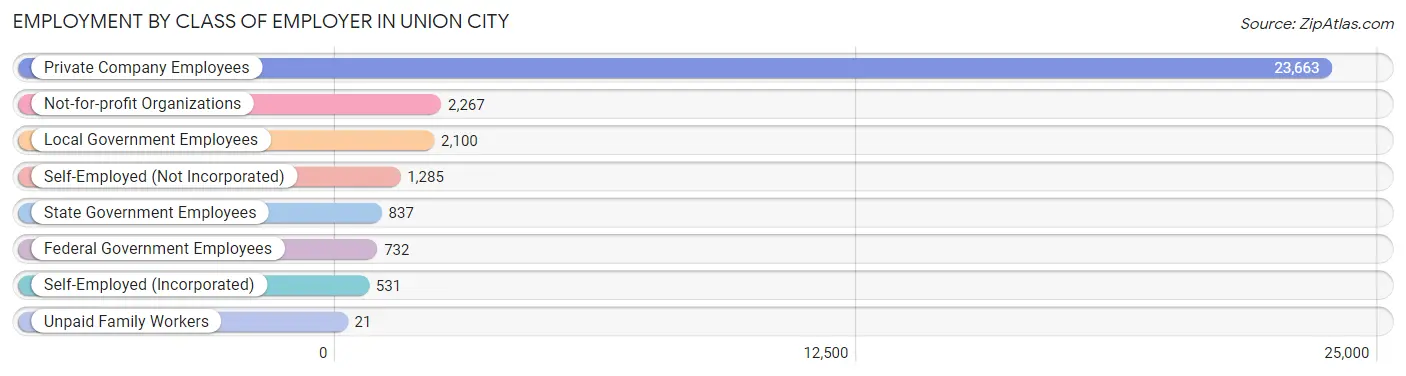
| Employer Class | # Employees | % Employees |
| Private Company Employees | 23,663 | 75.3% |
| Self-Employed (Incorporated) | 531 | 1.7% |
| Self-Employed (Not Incorporated) | 1,285 | 4.1% |
| Not-for-profit Organizations | 2,267 | 7.2% |
| Local Government Employees | 2,100 | 6.7% |
| State Government Employees | 837 | 2.7% |
| Federal Government Employees | 732 | 2.3% |
| Unpaid Family Workers | 21 | 0.1% |
| Total | 31,436 | 100.0% |
Employment Status by Age in Union City
According to the labor force statistics for Union City, out of the total population over 16 years of age (58,367), 65.3% or 38,114 individuals are in the labor force, with 4.6% or 1,753 of them unemployed. The age group with the highest labor force participation rate is 30 to 34 years, with 87.0% or 4,595 individuals in the labor force. Within the labor force, the 16 to 19 years age range has the highest percentage of unemployed individuals, with 31.8% or 292 of them being unemployed.
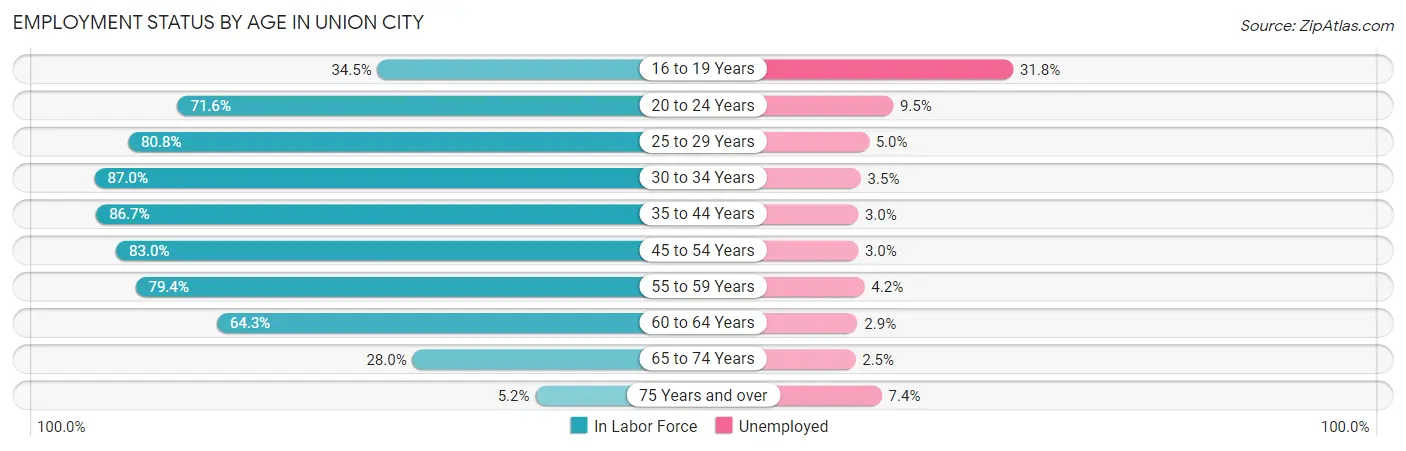
| Age Bracket | In Labor Force | Unemployed |
| 16 to 19 Years | 918 (34.5%) | 292 (31.8%) |
| 20 to 24 Years | 2,797 (71.6%) | 266 (9.5%) |
| 25 to 29 Years | 3,920 (80.8%) | 196 (5.0%) |
| 30 to 34 Years | 4,595 (87.0%) | 161 (3.5%) |
| 35 to 44 Years | 9,255 (86.7%) | 278 (3.0%) |
| 45 to 54 Years | 7,507 (83.0%) | 225 (3.0%) |
| 55 to 59 Years | 3,634 (79.4%) | 153 (4.2%) |
| 60 to 64 Years | 3,153 (64.3%) | 91 (2.9%) |
| 65 to 74 Years | 2,026 (28.0%) | 51 (2.5%) |
| 75 Years and over | 272 (5.2%) | 20 (7.4%) |
| Total | 38,114 (65.3%) | 1,753 (4.6%) |
Employment Status by Educational Attainment in Union City
According to labor force statistics for Union City, 81.5% of individuals (32,056) out of the total population between 25 and 64 years of age (39,333) are in the labor force, with 3.4% or 1,090 of them being unemployed. The group with the highest labor force participation rate are those with the educational attainment of bachelor's degree or higher, with 89.7% or 17,640 individuals in the labor force. Within the labor force, individuals with high school diploma education have the highest percentage of unemployment, with 5.0% or 262 of them being unemployed.
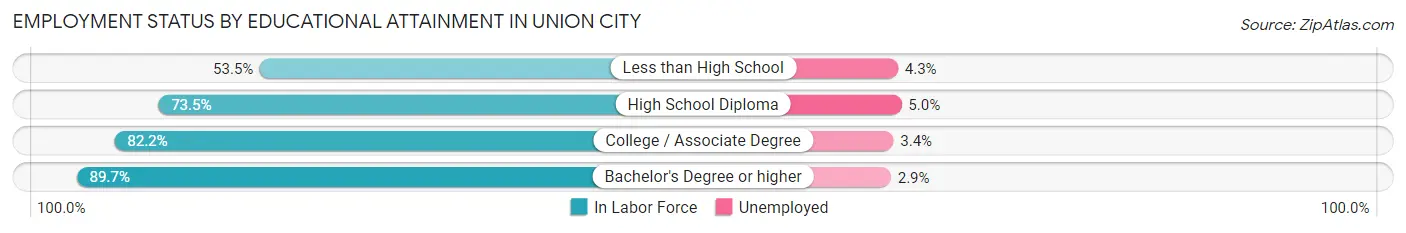
| Educational Attainment | In Labor Force | Unemployed |
| Less than High School | 2,063 (53.5%) | 166 (4.3%) |
| High School Diploma | 5,246 (73.5%) | 357 (5.0%) |
| College / Associate Degree | 7,129 (82.2%) | 295 (3.4%) |
| Bachelor's Degree or higher | 17,640 (89.7%) | 570 (2.9%) |
| Total | 32,056 (81.5%) | 1,337 (3.4%) |
Employment Occupations by Sex in Union City
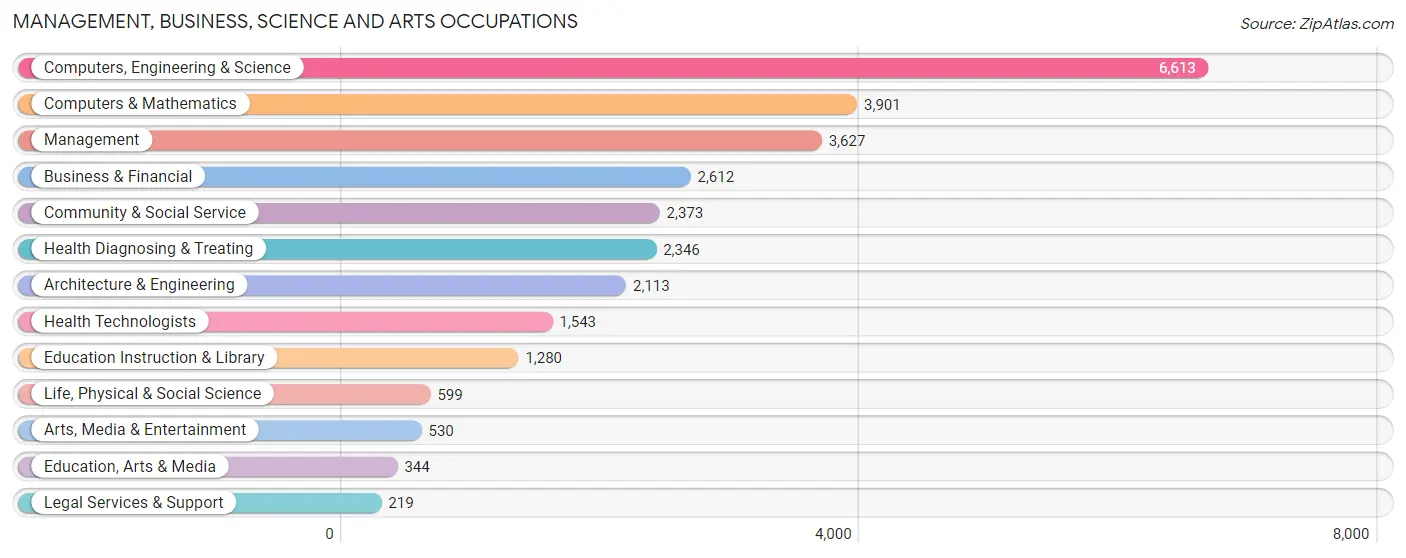
Management, Business, Science and Arts Occupations
The most common Management, Business, Science and Arts occupations in Union City are Computers, Engineering & Science (6,613 | 18.2%), Computers & Mathematics (3,901 | 10.7%), Management (3,627 | 10.0%), Business & Financial (2,612 | 7.2%), and Community & Social Service (2,373 | 6.5%).
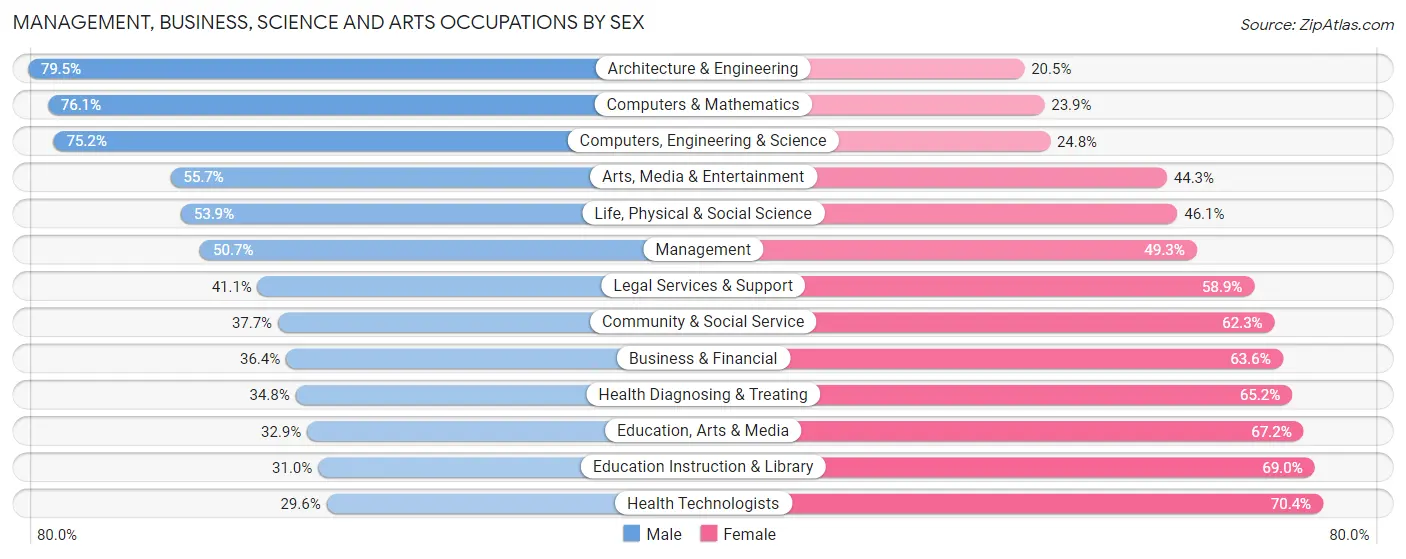
Management, Business, Science and Arts Occupations by Sex
Within the Management, Business, Science and Arts occupations in Union City, the most male-oriented occupations are Architecture & Engineering (79.5%), Computers & Mathematics (76.1%), and Computers, Engineering & Science (75.2%), while the most female-oriented occupations are Health Technologists (70.4%), Education Instruction & Library (69.0%), and Education, Arts & Media (67.1%).
| Occupation | Male | Female |
| Management | 1,839 (50.7%) | 1,788 (49.3%) |
| Business & Financial | 950 (36.4%) | 1,662 (63.6%) |
| Computers, Engineering & Science | 4,971 (75.2%) | 1,642 (24.8%) |
| Computers & Mathematics | 2,969 (76.1%) | 932 (23.9%) |
| Architecture & Engineering | 1,679 (79.5%) | 434 (20.5%) |
| Life, Physical & Social Science | 323 (53.9%) | 276 (46.1%) |
| Community & Social Service | 895 (37.7%) | 1,478 (62.3%) |
| Education, Arts & Media | 113 (32.9%) | 231 (67.1%) |
| Legal Services & Support | 90 (41.1%) | 129 (58.9%) |
| Education Instruction & Library | 397 (31.0%) | 883 (69.0%) |
| Arts, Media & Entertainment | 295 (55.7%) | 235 (44.3%) |
| Health Diagnosing & Treating | 816 (34.8%) | 1,530 (65.2%) |
| Health Technologists | 457 (29.6%) | 1,086 (70.4%) |
| Total (Category) | 9,471 (53.9%) | 8,100 (46.1%) |
| Total (Overall) | 20,086 (55.3%) | 16,217 (44.7%) |
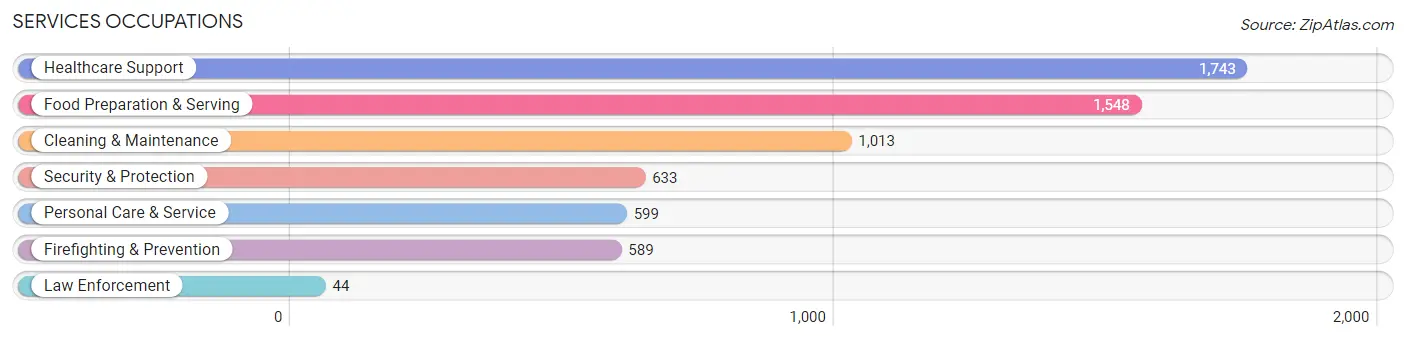
Services Occupations
The most common Services occupations in Union City are Healthcare Support (1,743 | 4.8%), Food Preparation & Serving (1,548 | 4.3%), Cleaning & Maintenance (1,013 | 2.8%), Security & Protection (633 | 1.7%), and Personal Care & Service (599 | 1.7%).
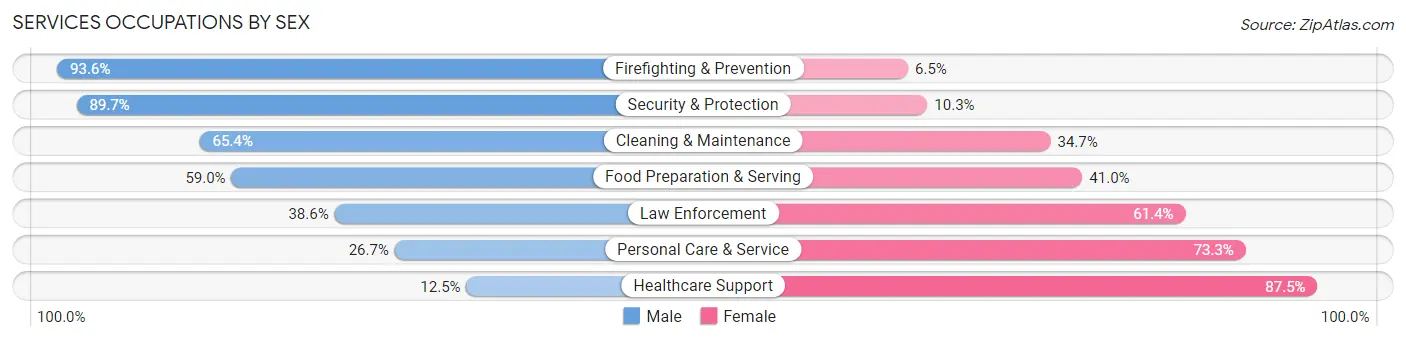
Services Occupations by Sex
Within the Services occupations in Union City, the most male-oriented occupations are Firefighting & Prevention (93.5%), Security & Protection (89.7%), and Cleaning & Maintenance (65.3%), while the most female-oriented occupations are Healthcare Support (87.5%), Personal Care & Service (73.3%), and Law Enforcement (61.4%).
| Occupation | Male | Female |
| Healthcare Support | 218 (12.5%) | 1,525 (87.5%) |
| Security & Protection | 568 (89.7%) | 65 (10.3%) |
| Firefighting & Prevention | 551 (93.5%) | 38 (6.5%) |
| Law Enforcement | 17 (38.6%) | 27 (61.4%) |
| Food Preparation & Serving | 914 (59.0%) | 634 (41.0%) |
| Cleaning & Maintenance | 662 (65.3%) | 351 (34.6%) |
| Personal Care & Service | 160 (26.7%) | 439 (73.3%) |
| Total (Category) | 2,522 (45.6%) | 3,014 (54.4%) |
| Total (Overall) | 20,086 (55.3%) | 16,217 (44.7%) |
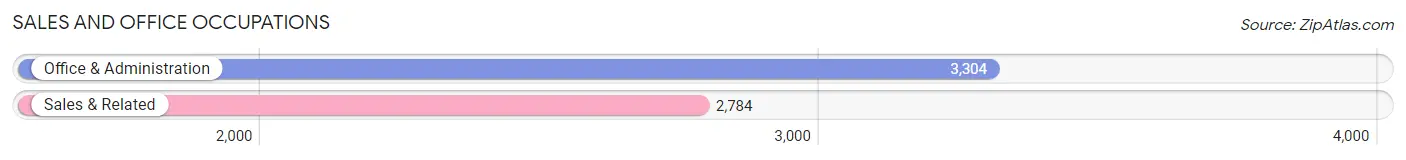
Sales and Office Occupations
The most common Sales and Office occupations in Union City are Office & Administration (3,304 | 9.1%), and Sales & Related (2,784 | 7.7%).
Sales and Office Occupations by Sex
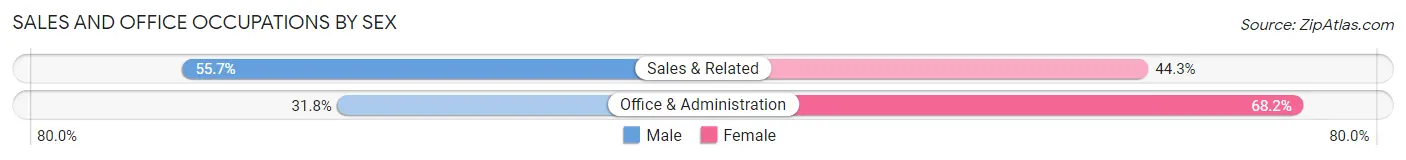
| Occupation | Male | Female |
| Sales & Related | 1,551 (55.7%) | 1,233 (44.3%) |
| Office & Administration | 1,052 (31.8%) | 2,252 (68.2%) |
| Total (Category) | 2,603 (42.8%) | 3,485 (57.2%) |
| Total (Overall) | 20,086 (55.3%) | 16,217 (44.7%) |
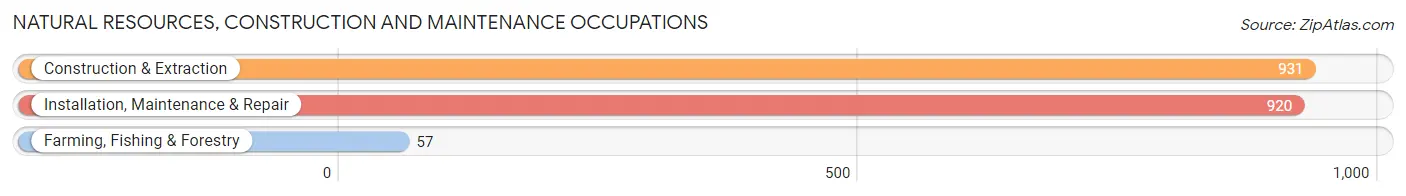
Natural Resources, Construction and Maintenance Occupations
The most common Natural Resources, Construction and Maintenance occupations in Union City are Construction & Extraction (931 | 2.6%), Installation, Maintenance & Repair (920 | 2.5%), and Farming, Fishing & Forestry (57 | 0.2%).
Natural Resources, Construction and Maintenance Occupations by Sex
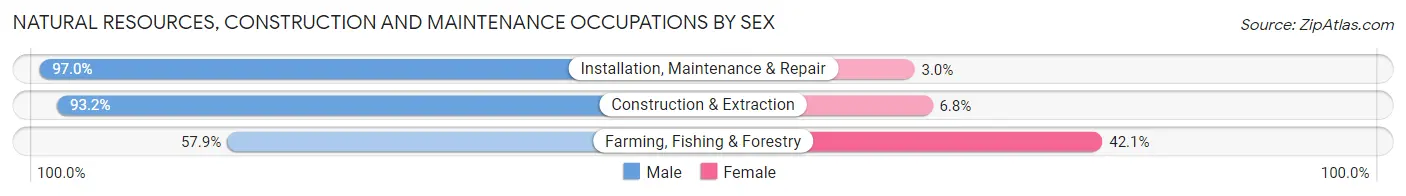
| Occupation | Male | Female |
| Farming, Fishing & Forestry | 33 (57.9%) | 24 (42.1%) |
| Construction & Extraction | 868 (93.2%) | 63 (6.8%) |
| Installation, Maintenance & Repair | 892 (97.0%) | 28 (3.0%) |
| Total (Category) | 1,793 (94.0%) | 115 (6.0%) |
| Total (Overall) | 20,086 (55.3%) | 16,217 (44.7%) |
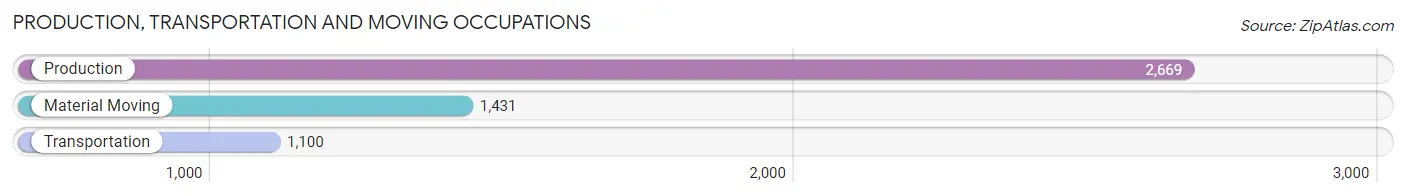
Production, Transportation and Moving Occupations
The most common Production, Transportation and Moving occupations in Union City are Production (2,669 | 7.3%), Material Moving (1,431 | 3.9%), and Transportation (1,100 | 3.0%).
Production, Transportation and Moving Occupations by Sex
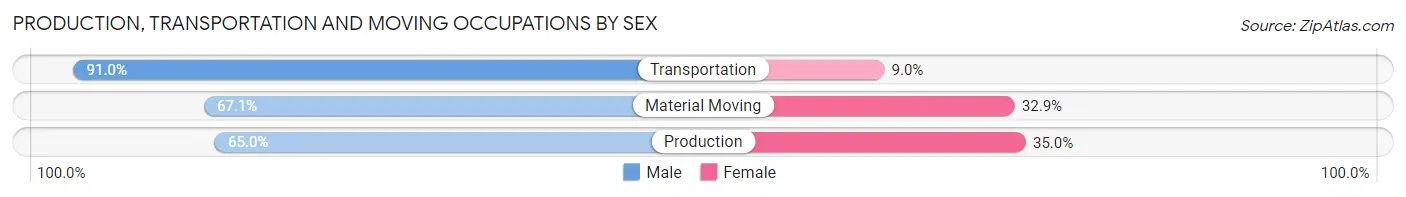
| Occupation | Male | Female |
| Production | 1,736 (65.0%) | 933 (35.0%) |
| Transportation | 1,001 (91.0%) | 99 (9.0%) |
| Material Moving | 960 (67.1%) | 471 (32.9%) |
| Total (Category) | 3,697 (71.1%) | 1,503 (28.9%) |
| Total (Overall) | 20,086 (55.3%) | 16,217 (44.7%) |
Employment Industries by Sex in Union City
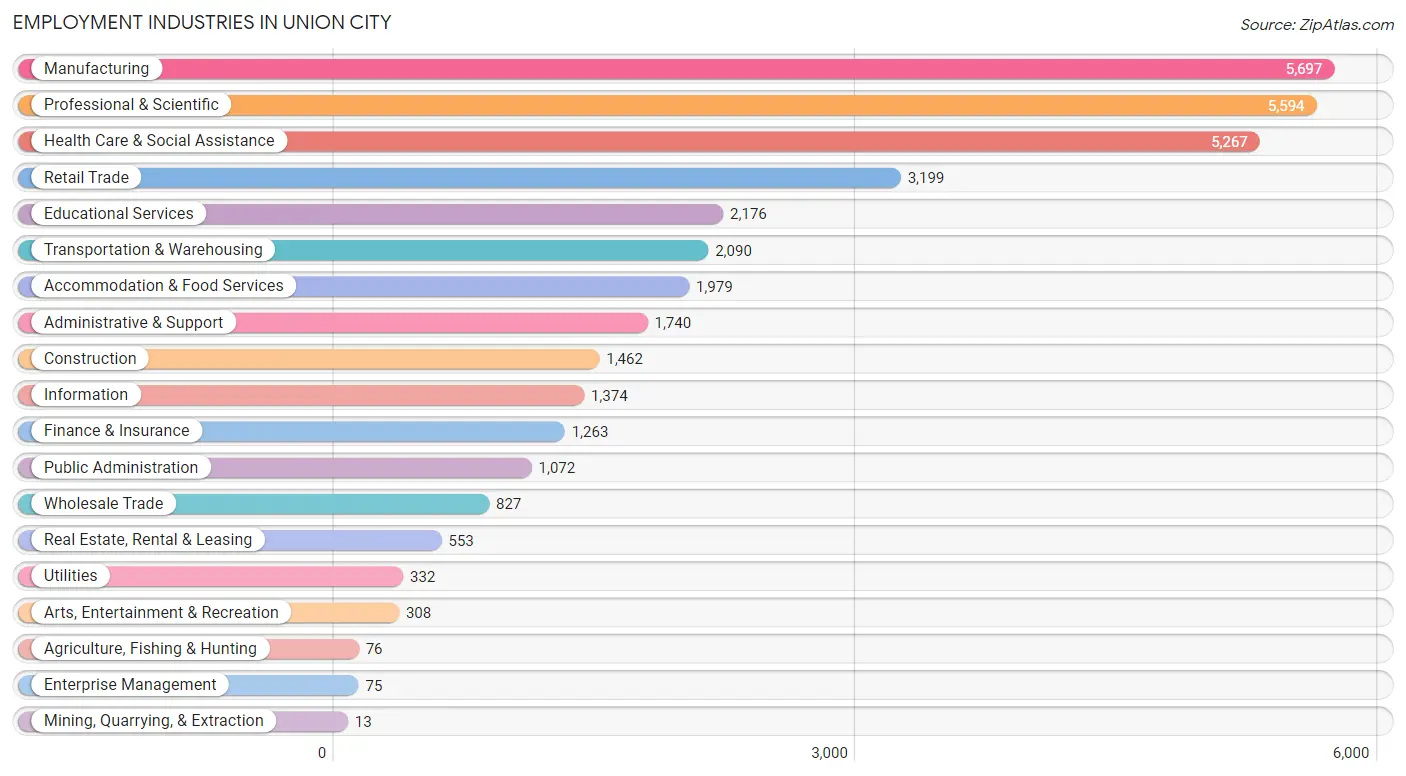
Employment Industries in Union City
The major employment industries in Union City include Manufacturing (5,697 | 15.7%), Professional & Scientific (5,594 | 15.4%), Health Care & Social Assistance (5,267 | 14.5%), Retail Trade (3,199 | 8.8%), and Educational Services (2,176 | 6.0%).
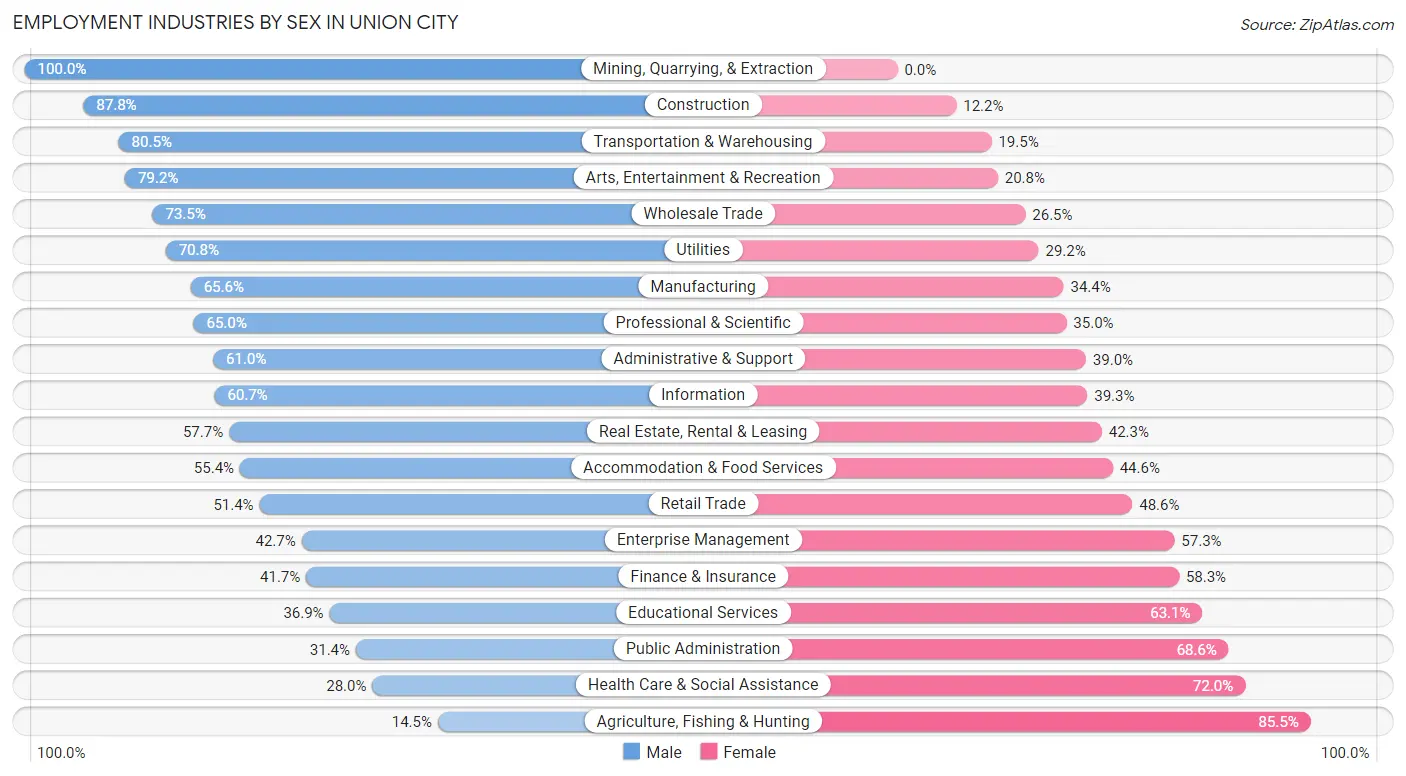
Employment Industries by Sex in Union City
The Union City industries that see more men than women are Mining, Quarrying, & Extraction (100.0%), Construction (87.8%), and Transportation & Warehousing (80.5%), whereas the industries that tend to have a higher number of women are Agriculture, Fishing & Hunting (85.5%), Health Care & Social Assistance (72.0%), and Public Administration (68.6%).
| Industry | Male | Female |
| Agriculture, Fishing & Hunting | 11 (14.5%) | 65 (85.5%) |
| Mining, Quarrying, & Extraction | 13 (100.0%) | 0 (0.0%) |
| Construction | 1,284 (87.8%) | 178 (12.2%) |
| Manufacturing | 3,738 (65.6%) | 1,959 (34.4%) |
| Wholesale Trade | 608 (73.5%) | 219 (26.5%) |
| Retail Trade | 1,644 (51.4%) | 1,555 (48.6%) |
| Transportation & Warehousing | 1,683 (80.5%) | 407 (19.5%) |
| Utilities | 235 (70.8%) | 97 (29.2%) |
| Information | 834 (60.7%) | 540 (39.3%) |
| Finance & Insurance | 527 (41.7%) | 736 (58.3%) |
| Real Estate, Rental & Leasing | 319 (57.7%) | 234 (42.3%) |
| Professional & Scientific | 3,637 (65.0%) | 1,957 (35.0%) |
| Enterprise Management | 32 (42.7%) | 43 (57.3%) |
| Administrative & Support | 1,061 (61.0%) | 679 (39.0%) |
| Educational Services | 803 (36.9%) | 1,373 (63.1%) |
| Health Care & Social Assistance | 1,477 (28.0%) | 3,790 (72.0%) |
| Arts, Entertainment & Recreation | 244 (79.2%) | 64 (20.8%) |
| Accommodation & Food Services | 1,097 (55.4%) | 882 (44.6%) |
| Public Administration | 337 (31.4%) | 735 (68.6%) |
| Total | 20,086 (55.3%) | 16,217 (44.7%) |
Education in Union City
School Enrollment in Union City
The most common levels of schooling among the 14,351 students in Union City are college / undergraduate (3,481 | 24.3%), middle school (2,926 | 20.4%), and high school (2,906 | 20.3%).
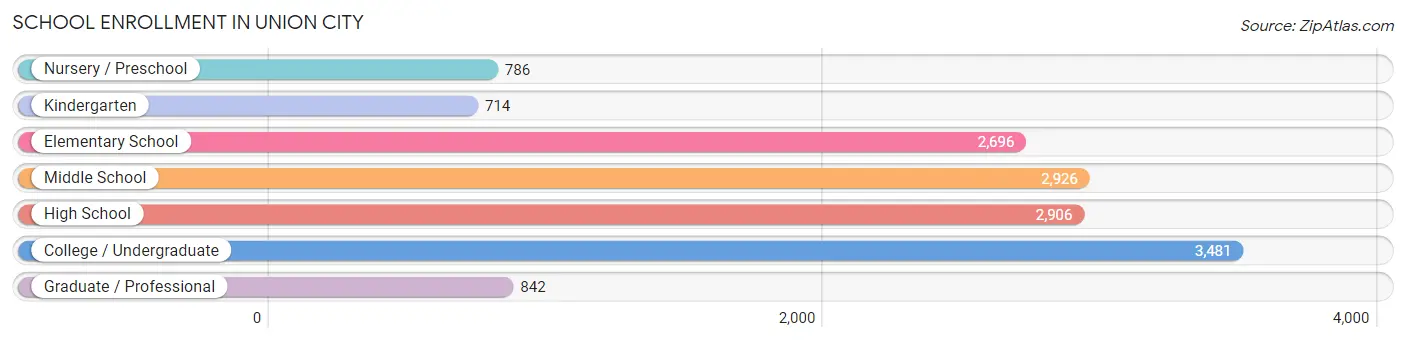
| School Level | # Students | % Students |
| Nursery / Preschool | 786 | 5.5% |
| Kindergarten | 714 | 5.0% |
| Elementary School | 2,696 | 18.8% |
| Middle School | 2,926 | 20.4% |
| High School | 2,906 | 20.3% |
| College / Undergraduate | 3,481 | 24.3% |
| Graduate / Professional | 842 | 5.9% |
| Total | 14,351 | 100.0% |
School Enrollment by Age by Funding Source in Union City
Out of a total of 14,351 students who are enrolled in schools in Union City, 2,282 (15.9%) attend a private institution, while the remaining 12,069 (84.1%) are enrolled in public schools. The age group of 3 to 4 year olds has the highest likelihood of being enrolled in private schools, with 371 (54.5% in the age bracket) enrolled. Conversely, the age group of 18 to 19 year olds has the lowest likelihood of being enrolled in a private school, with 1,197 (91.2% in the age bracket) attending a public institution.
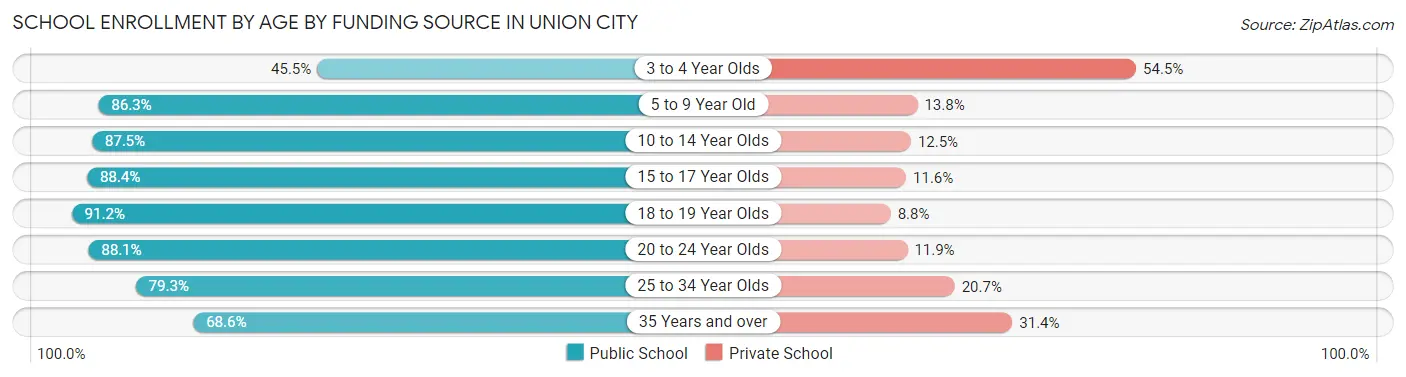
| Age Bracket | Public School | Private School |
| 3 to 4 Year Olds | 310 (45.5%) | 371 (54.5%) |
| 5 to 9 Year Old | 2,772 (86.3%) | 442 (13.8%) |
| 10 to 14 Year Olds | 3,154 (87.5%) | 452 (12.5%) |
| 15 to 17 Year Olds | 1,717 (88.4%) | 226 (11.6%) |
| 18 to 19 Year Olds | 1,197 (91.2%) | 115 (8.8%) |
| 20 to 24 Year Olds | 1,588 (88.1%) | 214 (11.9%) |
| 25 to 34 Year Olds | 786 (79.3%) | 205 (20.7%) |
| 35 Years and over | 550 (68.6%) | 252 (31.4%) |
| Total | 12,069 (84.1%) | 2,282 (15.9%) |
Educational Attainment by Field of Study in Union City
Engineering (4,438 | 18.1%), business (4,414 | 18.0%), computers & mathematics (3,190 | 13.0%), science & technology (2,541 | 10.4%), and social sciences (2,053 | 8.4%) are the most common fields of study among 24,456 individuals in Union City who have obtained a bachelor's degree or higher.
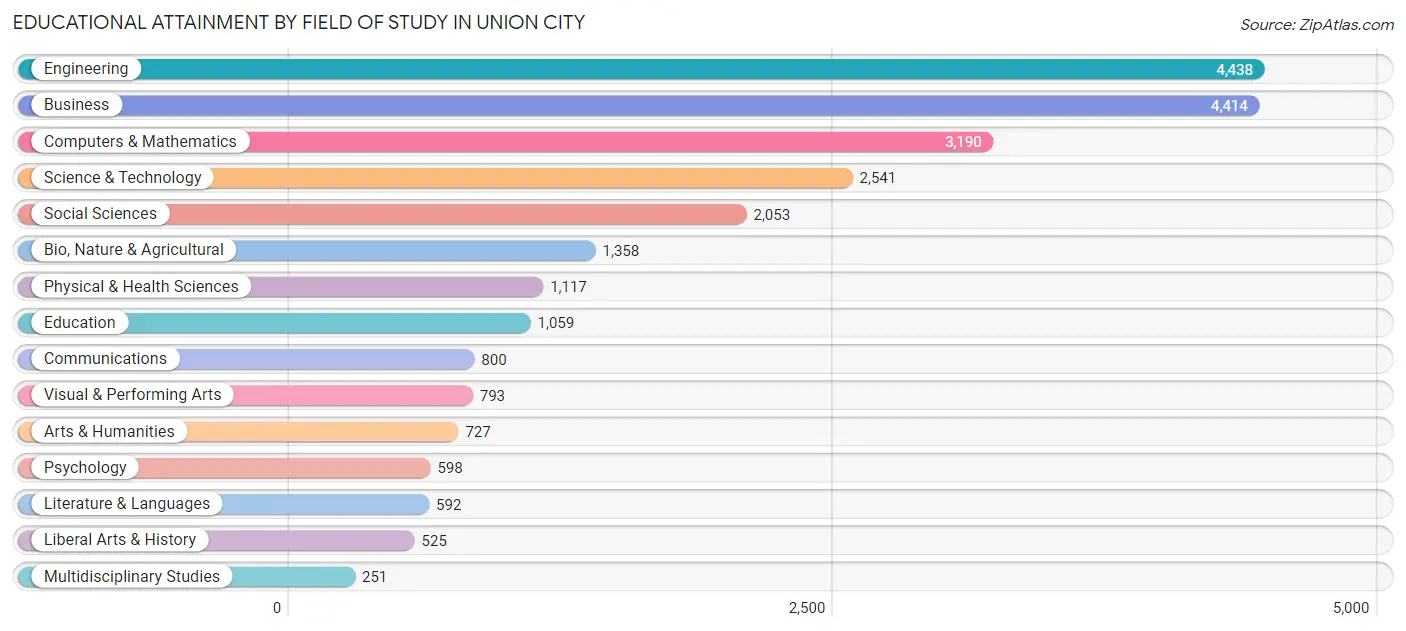
| Field of Study | # Graduates | % Graduates |
| Computers & Mathematics | 3,190 | 13.0% |
| Bio, Nature & Agricultural | 1,358 | 5.6% |
| Physical & Health Sciences | 1,117 | 4.6% |
| Psychology | 598 | 2.5% |
| Social Sciences | 2,053 | 8.4% |
| Engineering | 4,438 | 18.1% |
| Multidisciplinary Studies | 251 | 1.0% |
| Science & Technology | 2,541 | 10.4% |
| Business | 4,414 | 18.0% |
| Education | 1,059 | 4.3% |
| Literature & Languages | 592 | 2.4% |
| Liberal Arts & History | 525 | 2.1% |
| Visual & Performing Arts | 793 | 3.2% |
| Communications | 800 | 3.3% |
| Arts & Humanities | 727 | 3.0% |
| Total | 24,456 | 100.0% |
Transportation & Commute in Union City
Vehicle Availability by Sex in Union City
The most prevalent vehicle ownership categories in Union City are males with 2 vehicles (5,451, accounting for 31.7%) and females with 2 vehicles (4,577, making up 38.5%).
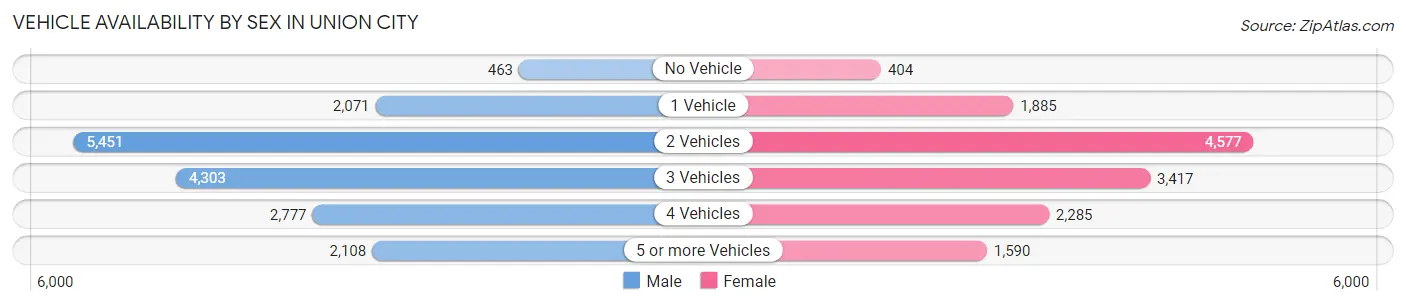
| Vehicles Available | Male | Female |
| No Vehicle | 463 (2.7%) | 404 (2.9%) |
| 1 Vehicle | 2,071 (12.1%) | 1,885 (13.3%) |
| 2 Vehicles | 5,451 (31.7%) | 4,577 (32.3%) |
| 3 Vehicles | 4,303 (25.1%) | 3,417 (24.1%) |
| 4 Vehicles | 2,777 (16.2%) | 2,285 (16.1%) |
| 5 or more Vehicles | 2,108 (12.3%) | 1,590 (11.2%) |
| Total | 17,173 (100.0%) | 14,158 (100.0%) |
Commute Time in Union City
The most frequently occuring commute durations in Union City are 30 to 34 minutes (4,245 commuters, 16.3%), 15 to 19 minutes (3,432 commuters, 13.2%), and 45 to 59 minutes (3,410 commuters, 13.1%).
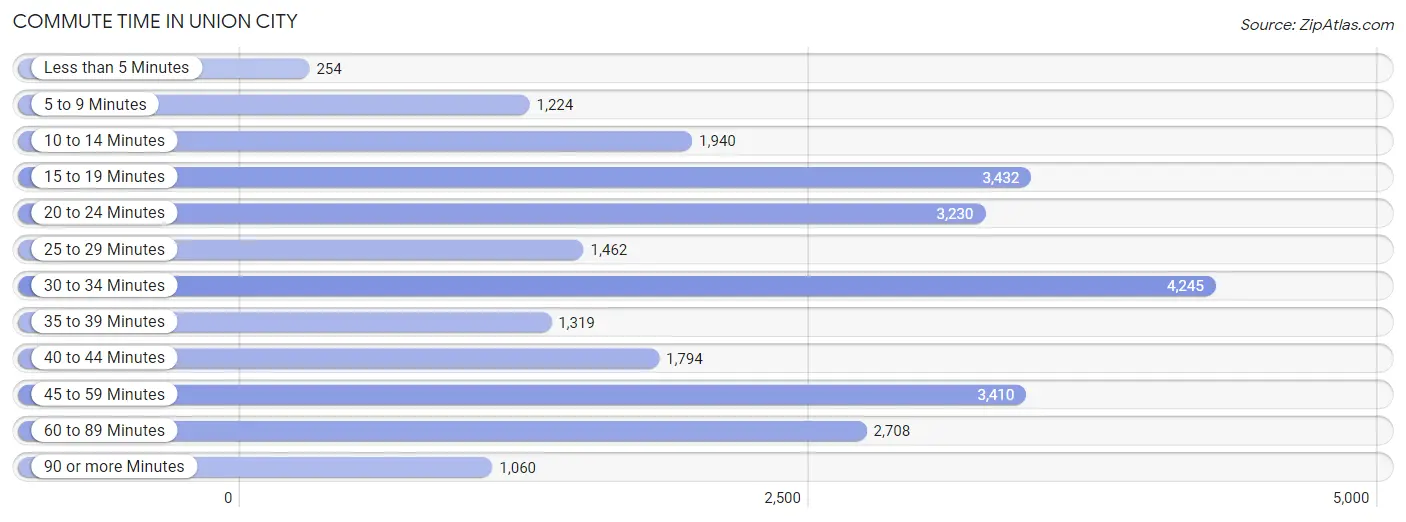
| Commute Time | # Commuters | % Commuters |
| Less than 5 Minutes | 254 | 1.0% |
| 5 to 9 Minutes | 1,224 | 4.7% |
| 10 to 14 Minutes | 1,940 | 7.4% |
| 15 to 19 Minutes | 3,432 | 13.2% |
| 20 to 24 Minutes | 3,230 | 12.4% |
| 25 to 29 Minutes | 1,462 | 5.6% |
| 30 to 34 Minutes | 4,245 | 16.3% |
| 35 to 39 Minutes | 1,319 | 5.1% |
| 40 to 44 Minutes | 1,794 | 6.9% |
| 45 to 59 Minutes | 3,410 | 13.1% |
| 60 to 89 Minutes | 2,708 | 10.4% |
| 90 or more Minutes | 1,060 | 4.1% |
Commute Time by Sex in Union City
The most common commute times in Union City are 30 to 34 minutes (2,373 commuters, 16.4%) for males and 30 to 34 minutes (1,872 commuters, 16.1%) for females.
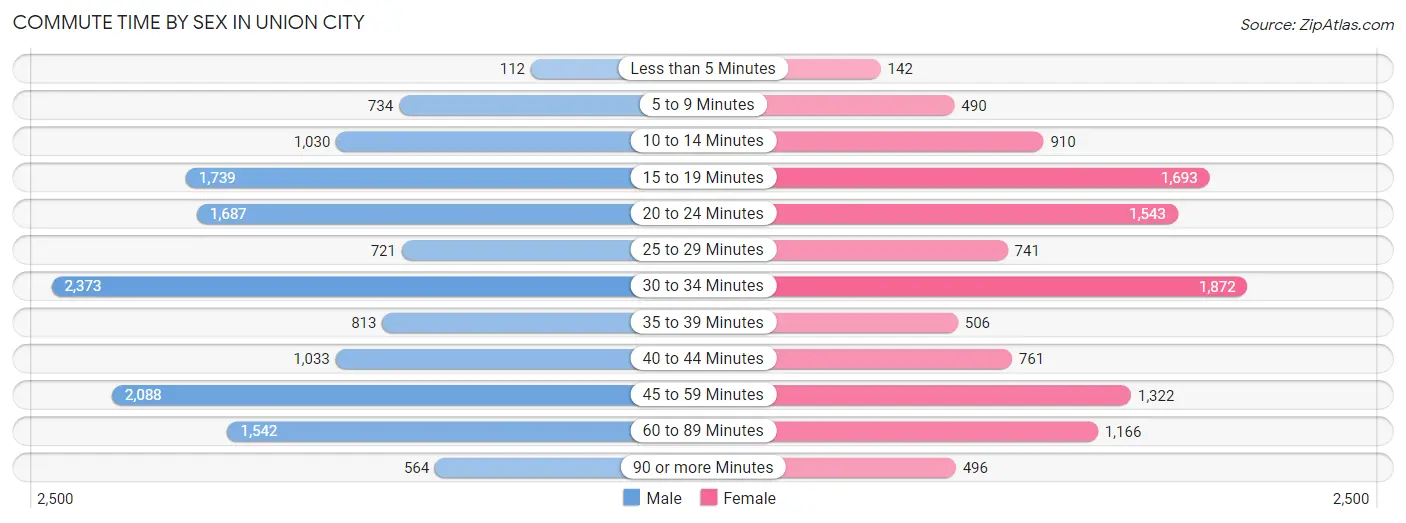
| Commute Time | Male | Female |
| Less than 5 Minutes | 112 (0.8%) | 142 (1.2%) |
| 5 to 9 Minutes | 734 (5.1%) | 490 (4.2%) |
| 10 to 14 Minutes | 1,030 (7.1%) | 910 (7.8%) |
| 15 to 19 Minutes | 1,739 (12.0%) | 1,693 (14.5%) |
| 20 to 24 Minutes | 1,687 (11.7%) | 1,543 (13.3%) |
| 25 to 29 Minutes | 721 (5.0%) | 741 (6.4%) |
| 30 to 34 Minutes | 2,373 (16.4%) | 1,872 (16.1%) |
| 35 to 39 Minutes | 813 (5.6%) | 506 (4.3%) |
| 40 to 44 Minutes | 1,033 (7.2%) | 761 (6.5%) |
| 45 to 59 Minutes | 2,088 (14.5%) | 1,322 (11.4%) |
| 60 to 89 Minutes | 1,542 (10.7%) | 1,166 (10.0%) |
| 90 or more Minutes | 564 (3.9%) | 496 (4.3%) |
Time of Departure to Work by Sex in Union City
The most frequent times of departure to work in Union City are 7:00 AM to 7:29 AM (1,929, 13.4%) for males and 7:00 AM to 7:29 AM (1,763, 15.1%) for females.
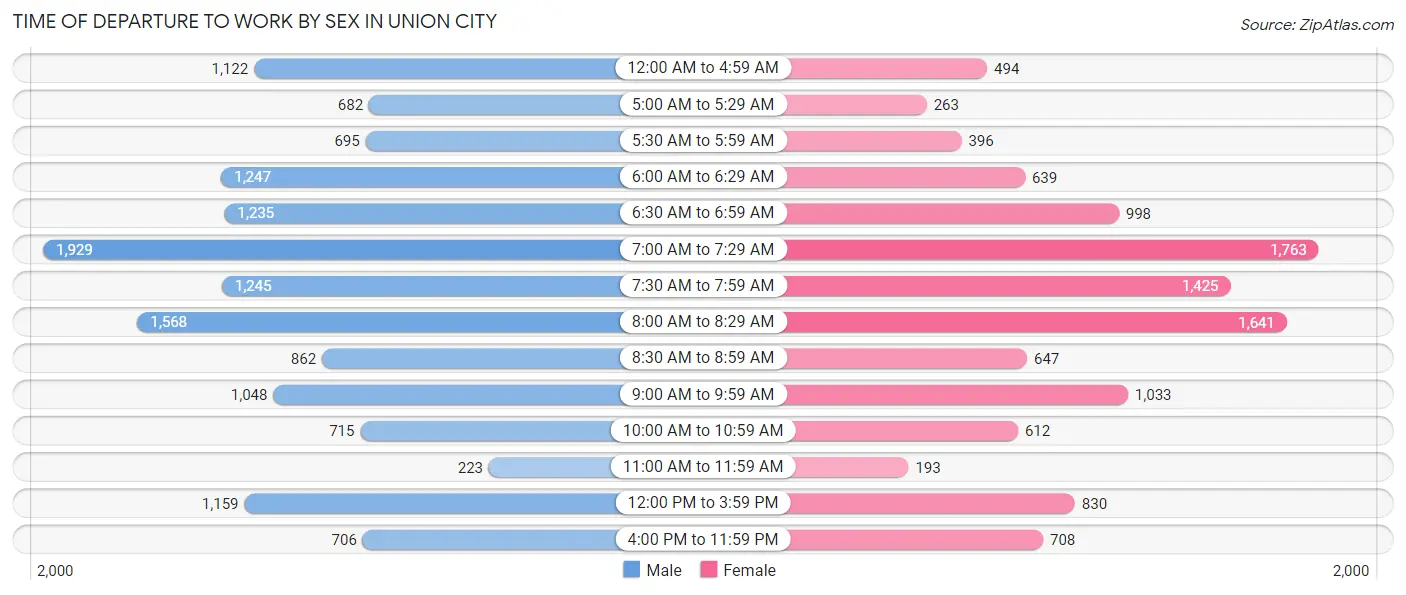
| Time of Departure | Male | Female |
| 12:00 AM to 4:59 AM | 1,122 (7.8%) | 494 (4.2%) |
| 5:00 AM to 5:29 AM | 682 (4.7%) | 263 (2.3%) |
| 5:30 AM to 5:59 AM | 695 (4.8%) | 396 (3.4%) |
| 6:00 AM to 6:29 AM | 1,247 (8.6%) | 639 (5.5%) |
| 6:30 AM to 6:59 AM | 1,235 (8.6%) | 998 (8.6%) |
| 7:00 AM to 7:29 AM | 1,929 (13.4%) | 1,763 (15.1%) |
| 7:30 AM to 7:59 AM | 1,245 (8.6%) | 1,425 (12.2%) |
| 8:00 AM to 8:29 AM | 1,568 (10.9%) | 1,641 (14.1%) |
| 8:30 AM to 8:59 AM | 862 (6.0%) | 647 (5.6%) |
| 9:00 AM to 9:59 AM | 1,048 (7.3%) | 1,033 (8.9%) |
| 10:00 AM to 10:59 AM | 715 (5.0%) | 612 (5.3%) |
| 11:00 AM to 11:59 AM | 223 (1.5%) | 193 (1.7%) |
| 12:00 PM to 3:59 PM | 1,159 (8.0%) | 830 (7.1%) |
| 4:00 PM to 11:59 PM | 706 (4.9%) | 708 (6.1%) |
| Total | 14,436 (100.0%) | 11,642 (100.0%) |
Housing Occupancy in Union City
Occupancy by Ownership in Union City
Of the total 20,860 dwellings in Union City, owner-occupied units account for 13,758 (65.9%), while renter-occupied units make up 7,102 (34.1%).
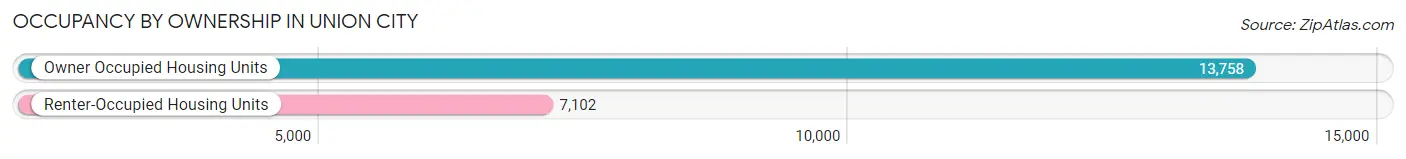
| Occupancy | # Housing Units | % Housing Units |
| Owner Occupied Housing Units | 13,758 | 65.9% |
| Renter-Occupied Housing Units | 7,102 | 34.1% |
| Total Occupied Housing Units | 20,860 | 100.0% |
Occupancy by Household Size in Union City
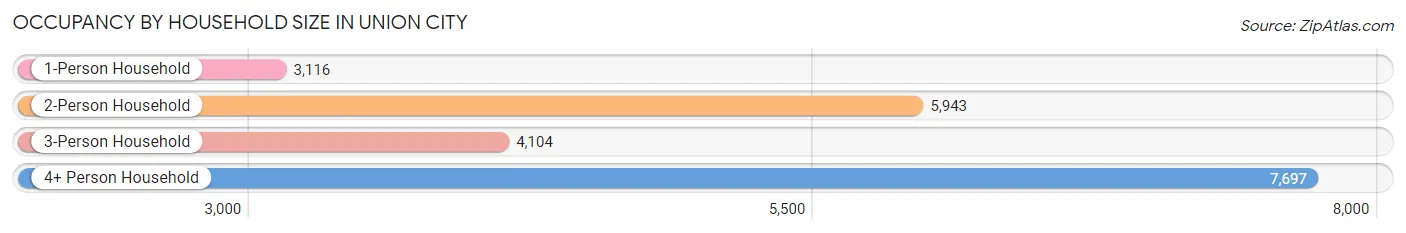
| Household Size | # Housing Units | % Housing Units |
| 1-Person Household | 3,116 | 14.9% |
| 2-Person Household | 5,943 | 28.5% |
| 3-Person Household | 4,104 | 19.7% |
| 4+ Person Household | 7,697 | 36.9% |
| Total Housing Units | 20,860 | 100.0% |
Occupancy by Ownership by Household Size in Union City
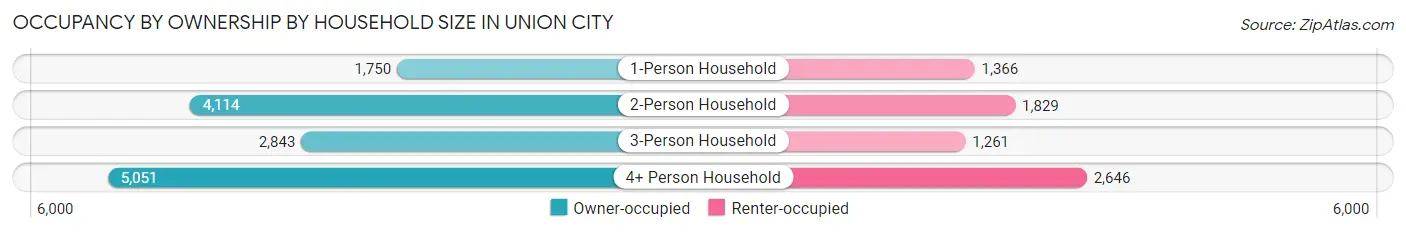
| Household Size | Owner-occupied | Renter-occupied |
| 1-Person Household | 1,750 (56.2%) | 1,366 (43.8%) |
| 2-Person Household | 4,114 (69.2%) | 1,829 (30.8%) |
| 3-Person Household | 2,843 (69.3%) | 1,261 (30.7%) |
| 4+ Person Household | 5,051 (65.6%) | 2,646 (34.4%) |
| Total Housing Units | 13,758 (65.9%) | 7,102 (34.1%) |
Occupancy by Educational Attainment in Union City
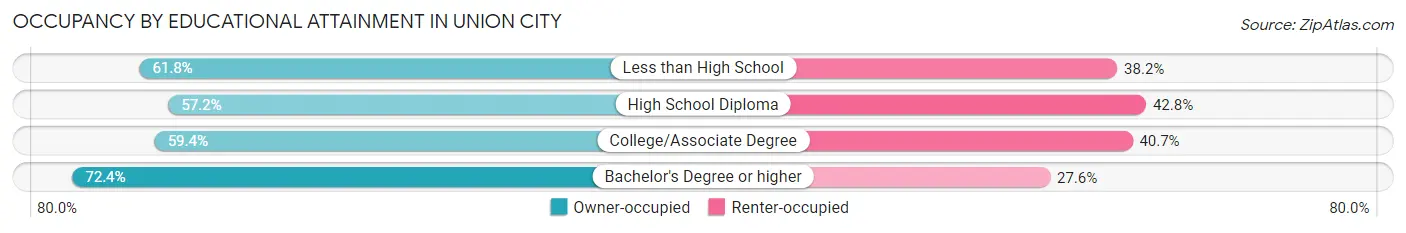
| Household Size | Owner-occupied | Renter-occupied |
| Less than High School | 1,358 (61.8%) | 840 (38.2%) |
| High School Diploma | 1,974 (57.2%) | 1,477 (42.8%) |
| College/Associate Degree | 2,679 (59.4%) | 1,835 (40.6%) |
| Bachelor's Degree or higher | 7,747 (72.4%) | 2,950 (27.6%) |
Occupancy by Age of Householder in Union City
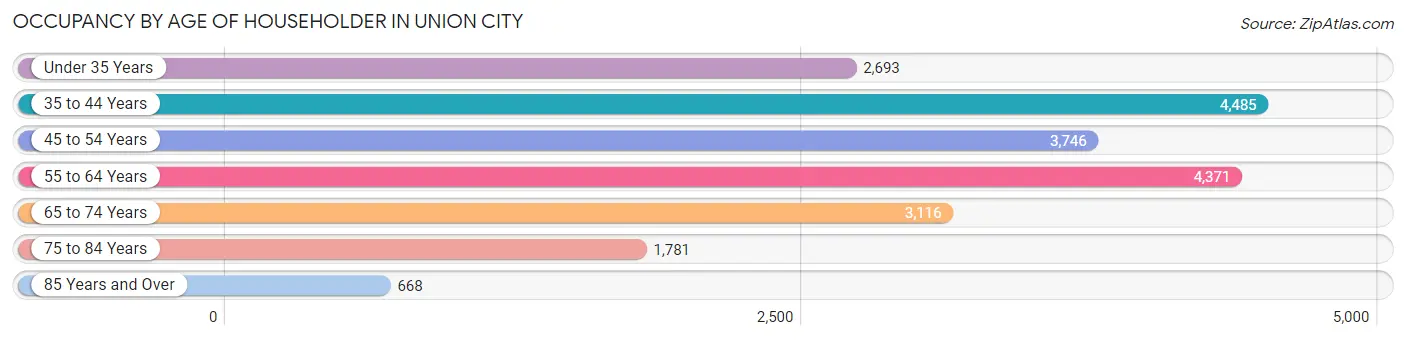
| Age Bracket | # Households | % Households |
| Under 35 Years | 2,693 | 12.9% |
| 35 to 44 Years | 4,485 | 21.5% |
| 45 to 54 Years | 3,746 | 18.0% |
| 55 to 64 Years | 4,371 | 20.9% |
| 65 to 74 Years | 3,116 | 14.9% |
| 75 to 84 Years | 1,781 | 8.5% |
| 85 Years and Over | 668 | 3.2% |
| Total | 20,860 | 100.0% |
Housing Finances in Union City
Median Income by Occupancy in Union City
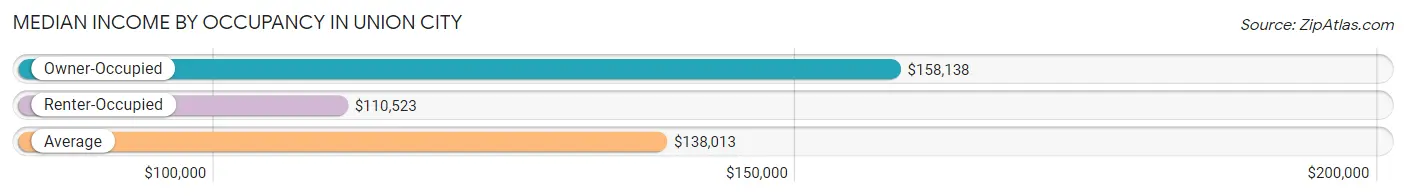
| Occupancy Type | # Households | Median Income |
| Owner-Occupied | 13,758 (65.9%) | $158,138 |
| Renter-Occupied | 7,102 (34.1%) | $110,523 |
| Average | 20,860 (100.0%) | $138,013 |
Occupancy by Householder Income Bracket in Union City
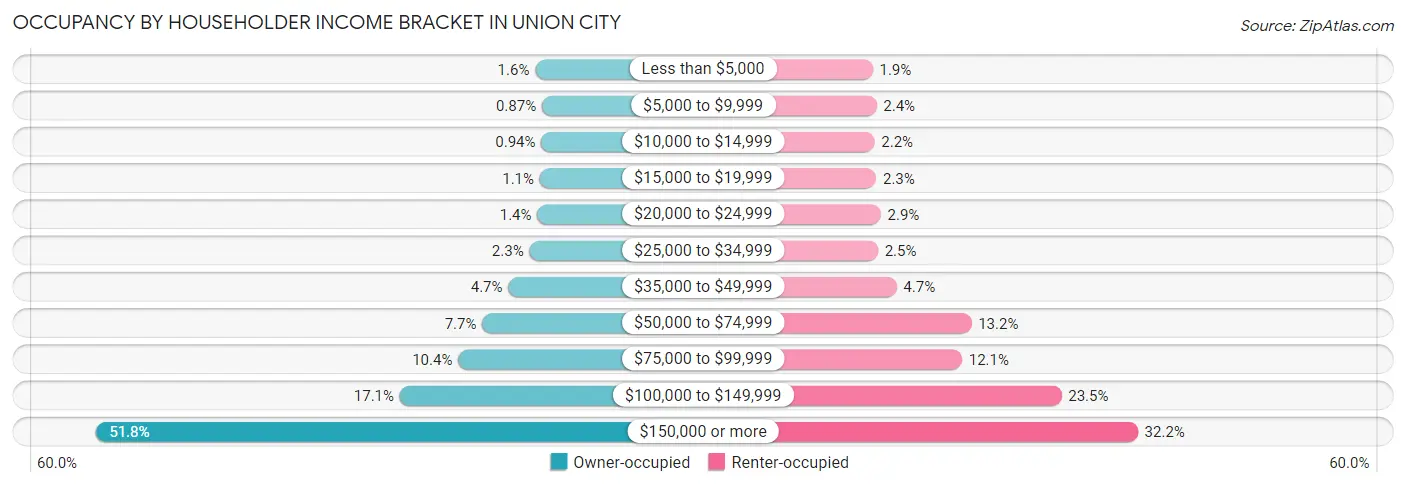
| Income Bracket | Owner-occupied | Renter-occupied |
| Less than $5,000 | 225 (1.6%) | 138 (1.9%) |
| $5,000 to $9,999 | 120 (0.9%) | 169 (2.4%) |
| $10,000 to $14,999 | 130 (0.9%) | 153 (2.1%) |
| $15,000 to $19,999 | 153 (1.1%) | 166 (2.3%) |
| $20,000 to $24,999 | 192 (1.4%) | 203 (2.9%) |
| $25,000 to $34,999 | 316 (2.3%) | 180 (2.5%) |
| $35,000 to $49,999 | 648 (4.7%) | 332 (4.7%) |
| $50,000 to $74,999 | 1,058 (7.7%) | 939 (13.2%) |
| $75,000 to $99,999 | 1,436 (10.4%) | 862 (12.1%) |
| $100,000 to $149,999 | 2,354 (17.1%) | 1,670 (23.5%) |
| $150,000 or more | 7,126 (51.8%) | 2,290 (32.2%) |
| Total | 13,758 (100.0%) | 7,102 (100.0%) |
Monthly Housing Cost Tiers in Union City
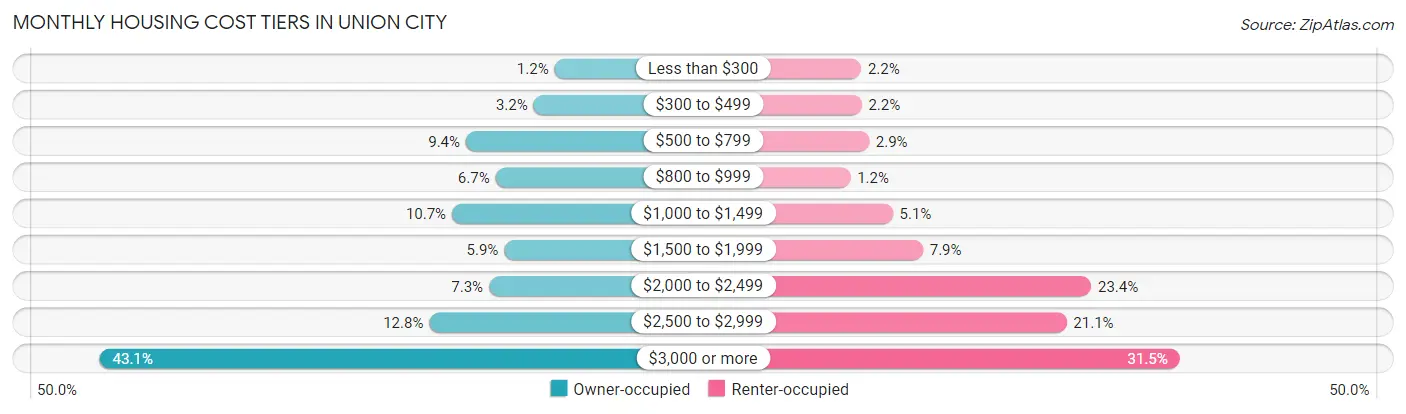
| Monthly Cost | Owner-occupied | Renter-occupied |
| Less than $300 | 168 (1.2%) | 154 (2.2%) |
| $300 to $499 | 434 (3.2%) | 157 (2.2%) |
| $500 to $799 | 1,290 (9.4%) | 205 (2.9%) |
| $800 to $999 | 915 (6.7%) | 84 (1.2%) |
| $1,000 to $1,499 | 1,466 (10.7%) | 361 (5.1%) |
| $1,500 to $1,999 | 805 (5.9%) | 558 (7.9%) |
| $2,000 to $2,499 | 997 (7.2%) | 1,658 (23.4%) |
| $2,500 to $2,999 | 1,754 (12.8%) | 1,497 (21.1%) |
| $3,000 or more | 5,929 (43.1%) | 2,237 (31.5%) |
| Total | 13,758 (100.0%) | 7,102 (100.0%) |
Physical Housing Characteristics in Union City
Housing Structures in Union City
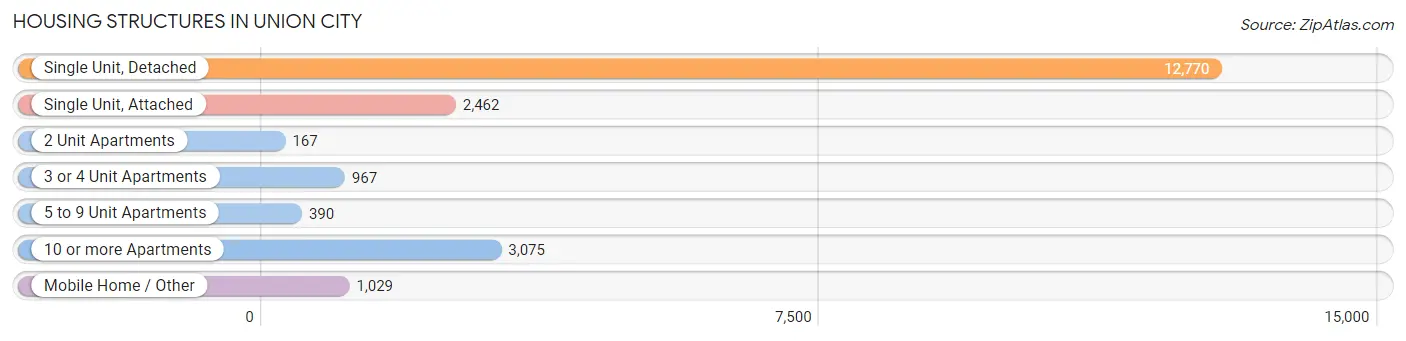
| Structure Type | # Housing Units | % Housing Units |
| Single Unit, Detached | 12,770 | 61.2% |
| Single Unit, Attached | 2,462 | 11.8% |
| 2 Unit Apartments | 167 | 0.8% |
| 3 or 4 Unit Apartments | 967 | 4.6% |
| 5 to 9 Unit Apartments | 390 | 1.9% |
| 10 or more Apartments | 3,075 | 14.7% |
| Mobile Home / Other | 1,029 | 4.9% |
| Total | 20,860 | 100.0% |
Housing Structures by Occupancy in Union City
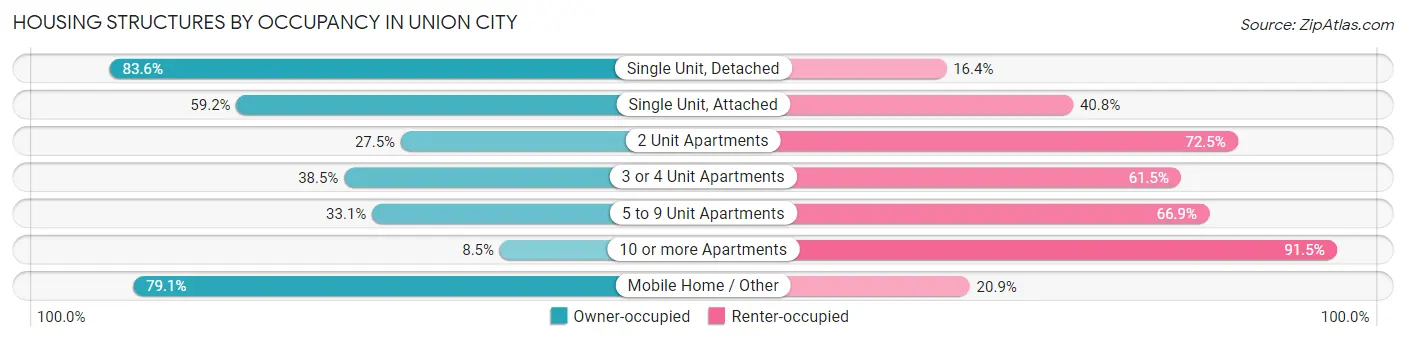
| Structure Type | Owner-occupied | Renter-occupied |
| Single Unit, Detached | 10,678 (83.6%) | 2,092 (16.4%) |
| Single Unit, Attached | 1,458 (59.2%) | 1,004 (40.8%) |
| 2 Unit Apartments | 46 (27.5%) | 121 (72.5%) |
| 3 or 4 Unit Apartments | 372 (38.5%) | 595 (61.5%) |
| 5 to 9 Unit Apartments | 129 (33.1%) | 261 (66.9%) |
| 10 or more Apartments | 261 (8.5%) | 2,814 (91.5%) |
| Mobile Home / Other | 814 (79.1%) | 215 (20.9%) |
| Total | 13,758 (65.9%) | 7,102 (34.1%) |
Housing Structures by Number of Rooms in Union City
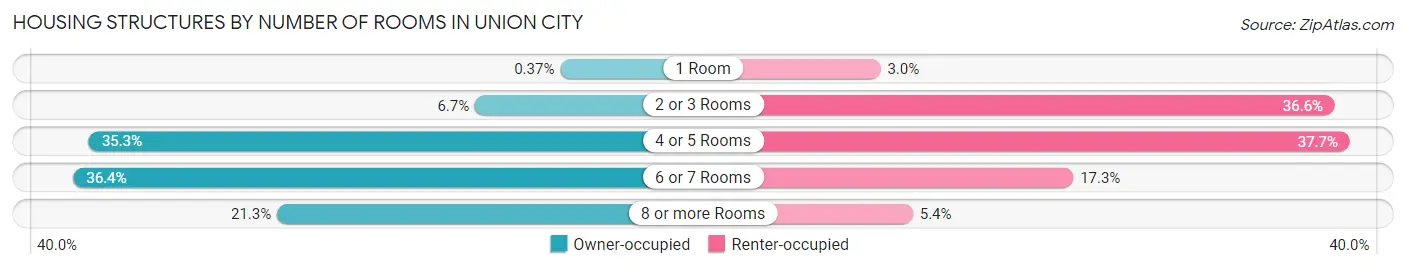
| Number of Rooms | Owner-occupied | Renter-occupied |
| 1 Room | 51 (0.4%) | 213 (3.0%) |
| 2 or 3 Rooms | 918 (6.7%) | 2,601 (36.6%) |
| 4 or 5 Rooms | 4,850 (35.2%) | 2,679 (37.7%) |
| 6 or 7 Rooms | 5,006 (36.4%) | 1,226 (17.3%) |
| 8 or more Rooms | 2,933 (21.3%) | 383 (5.4%) |
| Total | 13,758 (100.0%) | 7,102 (100.0%) |
Housing Structure by Heating Type in Union City
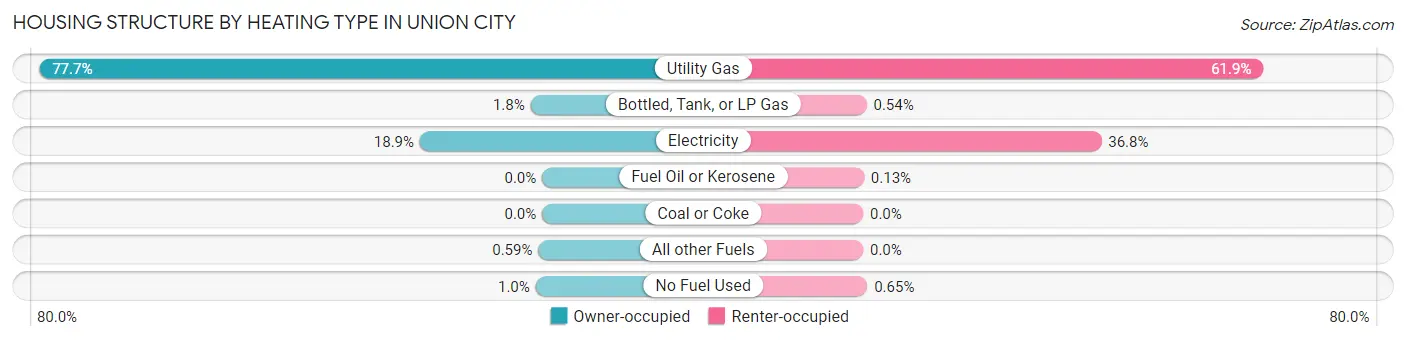
| Heating Type | Owner-occupied | Renter-occupied |
| Utility Gas | 10,694 (77.7%) | 4,393 (61.9%) |
| Bottled, Tank, or LP Gas | 246 (1.8%) | 38 (0.5%) |
| Electricity | 2,600 (18.9%) | 2,616 (36.8%) |
| Fuel Oil or Kerosene | 0 (0.0%) | 9 (0.1%) |
| Coal or Coke | 0 (0.0%) | 0 (0.0%) |
| All other Fuels | 81 (0.6%) | 0 (0.0%) |
| No Fuel Used | 137 (1.0%) | 46 (0.6%) |
| Total | 13,758 (100.0%) | 7,102 (100.0%) |
Household Vehicle Usage in Union City
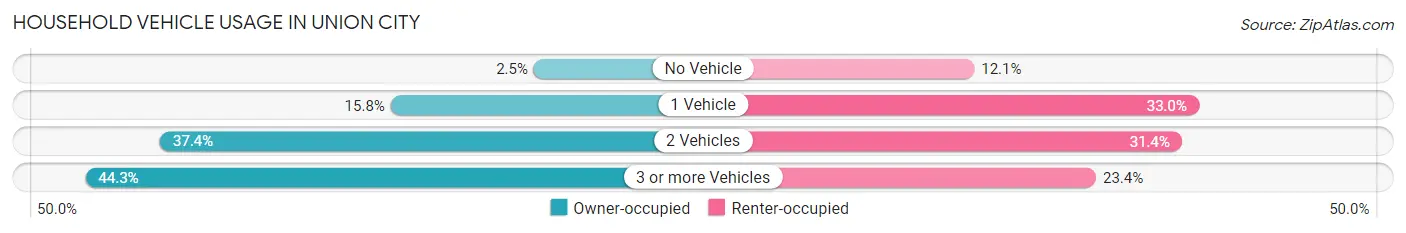
| Vehicles per Household | Owner-occupied | Renter-occupied |
| No Vehicle | 340 (2.5%) | 858 (12.1%) |
| 1 Vehicle | 2,178 (15.8%) | 2,346 (33.0%) |
| 2 Vehicles | 5,142 (37.4%) | 2,233 (31.4%) |
| 3 or more Vehicles | 6,098 (44.3%) | 1,665 (23.4%) |
| Total | 13,758 (100.0%) | 7,102 (100.0%) |
Real Estate & Mortgages in Union City
Real Estate and Mortgage Overview in Union City
| Characteristic | Without Mortgage | With Mortgage |
| Housing Units | 4,127 | 9,631 |
| Median Property Value | $876,000 | $1,047,000 |
| Median Household Income | $103,057 | $5,813 |
| Monthly Housing Costs | $860 | $5,902 |
| Real Estate Taxes | $5,757 | $97 |
Property Value by Mortgage Status in Union City
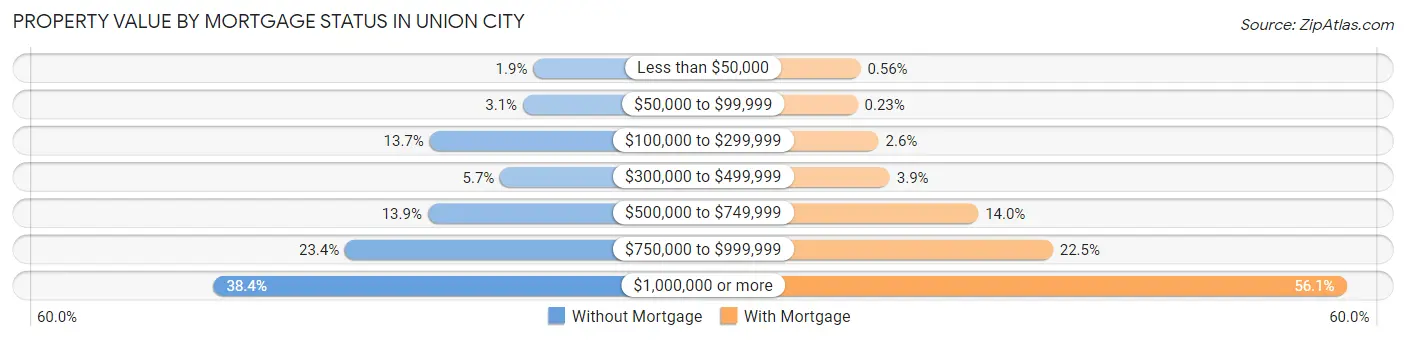
| Property Value | Without Mortgage | With Mortgage |
| Less than $50,000 | 77 (1.9%) | 54 (0.6%) |
| $50,000 to $99,999 | 126 (3.0%) | 22 (0.2%) |
| $100,000 to $299,999 | 566 (13.7%) | 253 (2.6%) |
| $300,000 to $499,999 | 233 (5.7%) | 378 (3.9%) |
| $500,000 to $749,999 | 575 (13.9%) | 1,350 (14.0%) |
| $750,000 to $999,999 | 965 (23.4%) | 2,171 (22.5%) |
| $1,000,000 or more | 1,585 (38.4%) | 5,403 (56.1%) |
| Total | 4,127 (100.0%) | 9,631 (100.0%) |
Household Income by Mortgage Status in Union City
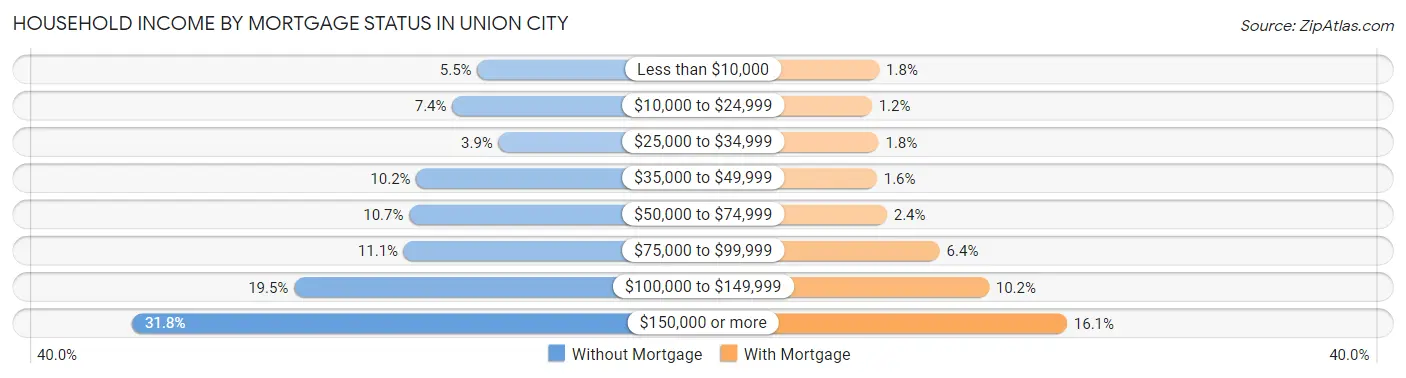
| Household Income | Without Mortgage | With Mortgage |
| Less than $10,000 | 227 (5.5%) | 173 (1.8%) |
| $10,000 to $24,999 | 306 (7.4%) | 118 (1.2%) |
| $25,000 to $34,999 | 160 (3.9%) | 169 (1.8%) |
| $35,000 to $49,999 | 419 (10.2%) | 156 (1.6%) |
| $50,000 to $74,999 | 441 (10.7%) | 229 (2.4%) |
| $75,000 to $99,999 | 458 (11.1%) | 617 (6.4%) |
| $100,000 to $149,999 | 803 (19.5%) | 978 (10.2%) |
| $150,000 or more | 1,313 (31.8%) | 1,551 (16.1%) |
| Total | 4,127 (100.0%) | 9,631 (100.0%) |
Property Value to Household Income Ratio in Union City
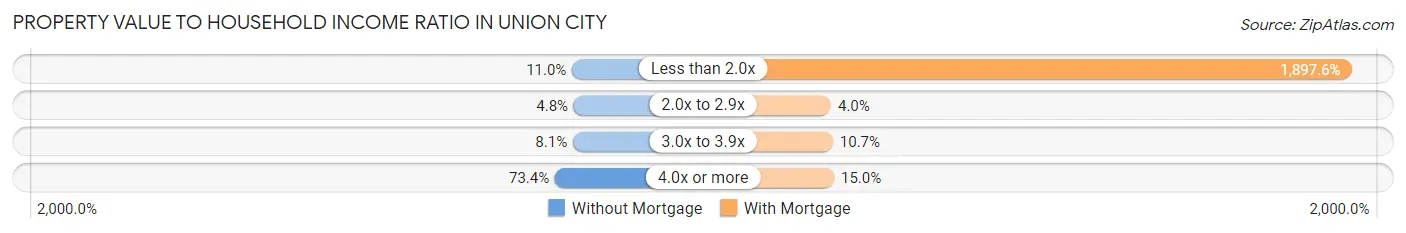
| Value-to-Income Ratio | Without Mortgage | With Mortgage |
| Less than 2.0x | 455 (11.0%) | 182,760 (1,897.6%) |
| 2.0x to 2.9x | 196 (4.8%) | 388 (4.0%) |
| 3.0x to 3.9x | 333 (8.1%) | 1,034 (10.7%) |
| 4.0x or more | 3,028 (73.4%) | 1,443 (15.0%) |
| Total | 4,127 (100.0%) | 9,631 (100.0%) |
Real Estate Taxes by Mortgage Status in Union City
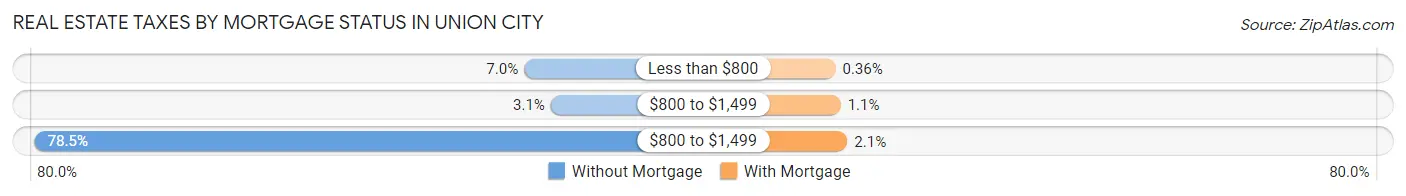
| Property Taxes | Without Mortgage | With Mortgage |
| Less than $800 | 290 (7.0%) | 35 (0.4%) |
| $800 to $1,499 | 129 (3.1%) | 108 (1.1%) |
| $800 to $1,499 | 3,241 (78.5%) | 202 (2.1%) |
| Total | 4,127 (100.0%) | 9,631 (100.0%) |
Health & Disability in Union City
Health Insurance Coverage by Age in Union City
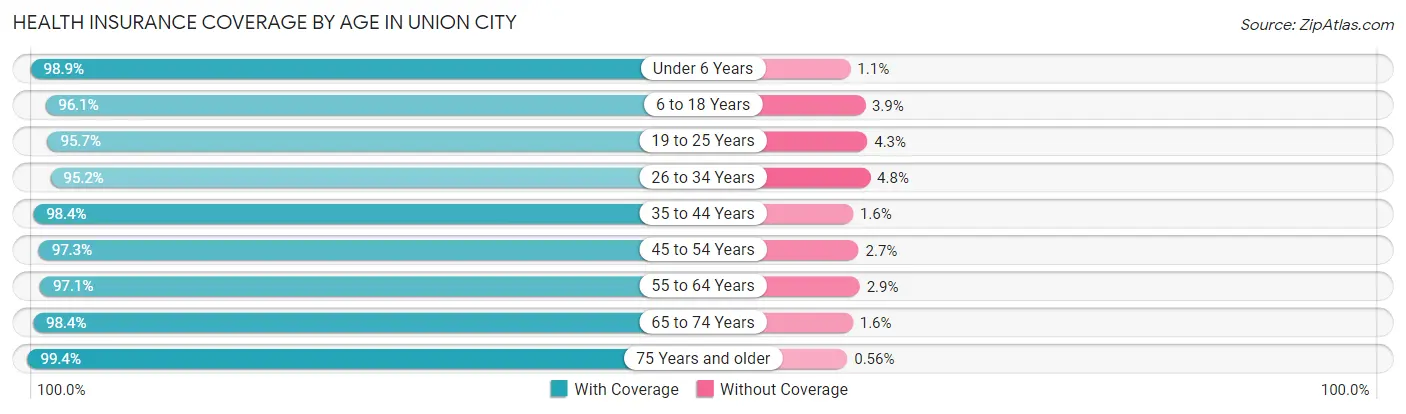
| Age Bracket | With Coverage | Without Coverage |
| Under 6 Years | 3,724 (98.9%) | 43 (1.1%) |
| 6 to 18 Years | 9,020 (96.1%) | 362 (3.9%) |
| 19 to 25 Years | 5,225 (95.7%) | 234 (4.3%) |
| 26 to 34 Years | 8,767 (95.2%) | 444 (4.8%) |
| 35 to 44 Years | 10,441 (98.4%) | 171 (1.6%) |
| 45 to 54 Years | 8,777 (97.3%) | 240 (2.7%) |
| 55 to 64 Years | 9,198 (97.1%) | 273 (2.9%) |
| 65 to 74 Years | 7,101 (98.4%) | 114 (1.6%) |
| 75 Years and older | 5,150 (99.4%) | 29 (0.6%) |
| Total | 67,403 (97.2%) | 1,910 (2.8%) |
Health Insurance Coverage by Citizenship Status in Union City
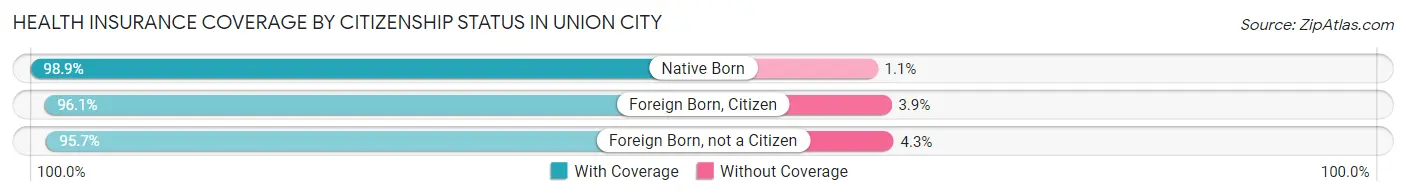
| Citizenship Status | With Coverage | Without Coverage |
| Native Born | 3,724 (98.9%) | 43 (1.1%) |
| Foreign Born, Citizen | 9,020 (96.1%) | 362 (3.9%) |
| Foreign Born, not a Citizen | 5,225 (95.7%) | 234 (4.3%) |
Health Insurance Coverage by Household Income in Union City
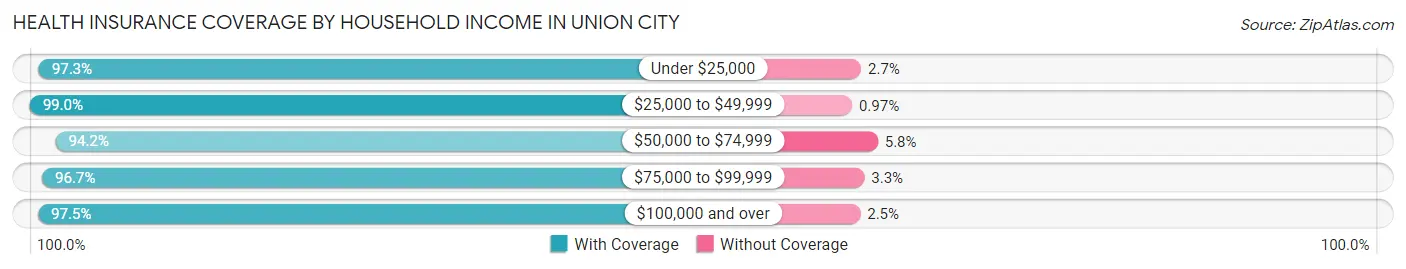
| Household Income | With Coverage | Without Coverage |
| Under $25,000 | 3,163 (97.3%) | 87 (2.7%) |
| $25,000 to $49,999 | 3,578 (99.0%) | 35 (1.0%) |
| $50,000 to $74,999 | 5,308 (94.2%) | 327 (5.8%) |
| $75,000 to $99,999 | 6,029 (96.7%) | 205 (3.3%) |
| $100,000 and over | 48,393 (97.5%) | 1,256 (2.5%) |
Public vs Private Health Insurance Coverage by Age in Union City
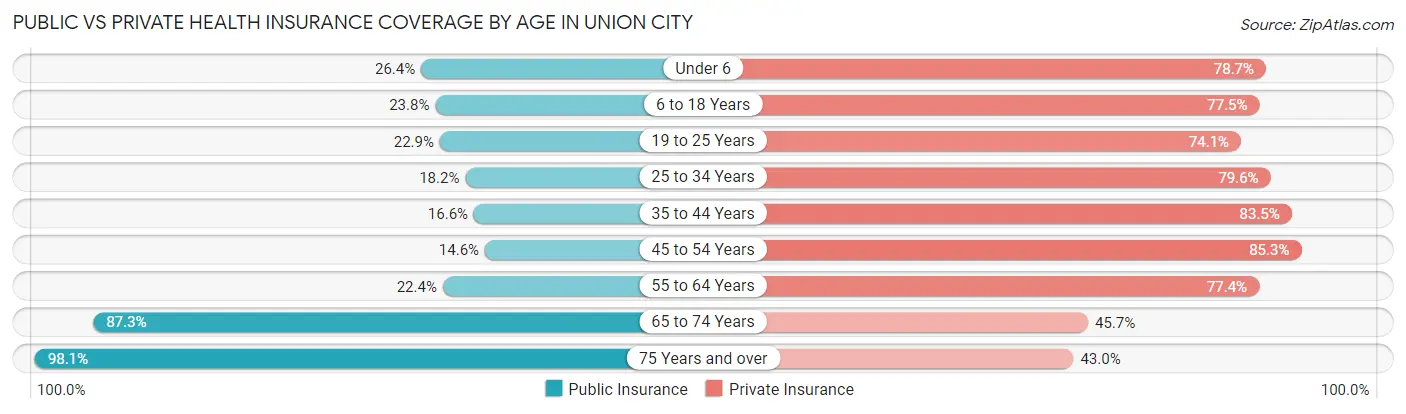
| Age Bracket | Public Insurance | Private Insurance |
| Under 6 | 995 (26.4%) | 2,965 (78.7%) |
| 6 to 18 Years | 2,231 (23.8%) | 7,271 (77.5%) |
| 19 to 25 Years | 1,252 (22.9%) | 4,044 (74.1%) |
| 25 to 34 Years | 1,677 (18.2%) | 7,328 (79.6%) |
| 35 to 44 Years | 1,762 (16.6%) | 8,859 (83.5%) |
| 45 to 54 Years | 1,313 (14.6%) | 7,689 (85.3%) |
| 55 to 64 Years | 2,121 (22.4%) | 7,332 (77.4%) |
| 65 to 74 Years | 6,295 (87.3%) | 3,298 (45.7%) |
| 75 Years and over | 5,080 (98.1%) | 2,227 (43.0%) |
| Total | 22,726 (32.8%) | 51,013 (73.6%) |
Disability Status by Sex by Age in Union City
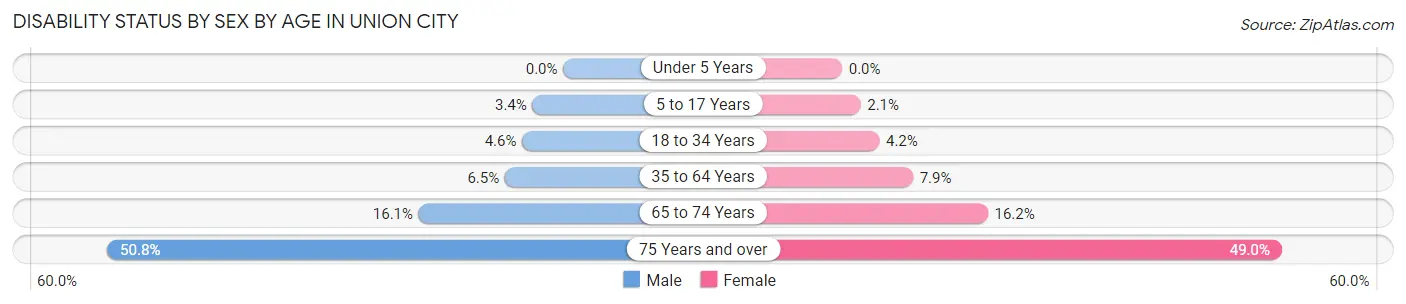
| Age Bracket | Male | Female |
| Under 5 Years | 0 (0.0%) | 0 (0.0%) |
| 5 to 17 Years | 165 (3.4%) | 87 (2.1%) |
| 18 to 34 Years | 375 (4.6%) | 305 (4.2%) |
| 35 to 64 Years | 952 (6.5%) | 1,141 (7.9%) |
| 65 to 74 Years | 545 (16.1%) | 621 (16.2%) |
| 75 Years and over | 1,113 (50.8%) | 1,464 (49.0%) |
Disability Class by Sex by Age in Union City
Disability Class: Hearing Difficulty
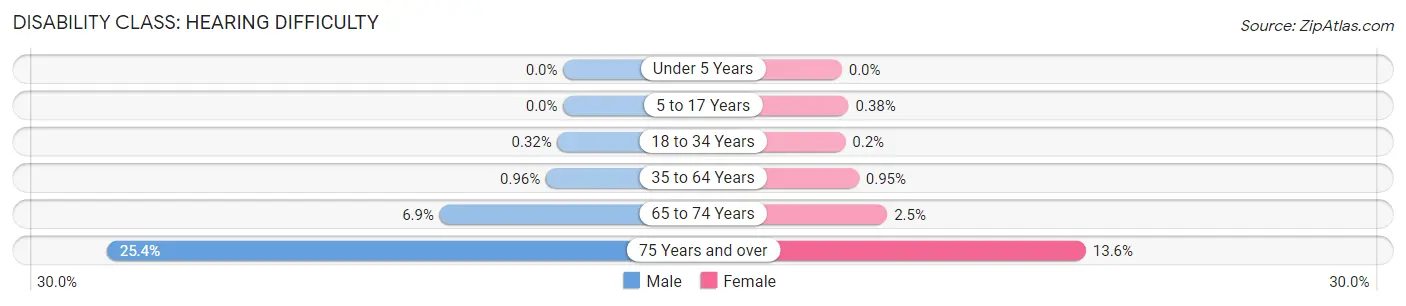
| Age Bracket | Male | Female |
| Under 5 Years | 0 (0.0%) | 0 (0.0%) |
| 5 to 17 Years | 0 (0.0%) | 16 (0.4%) |
| 18 to 34 Years | 26 (0.3%) | 15 (0.2%) |
| 35 to 64 Years | 141 (1.0%) | 137 (0.9%) |
| 65 to 74 Years | 233 (6.9%) | 97 (2.5%) |
| 75 Years and over | 557 (25.4%) | 406 (13.6%) |
Disability Class: Vision Difficulty
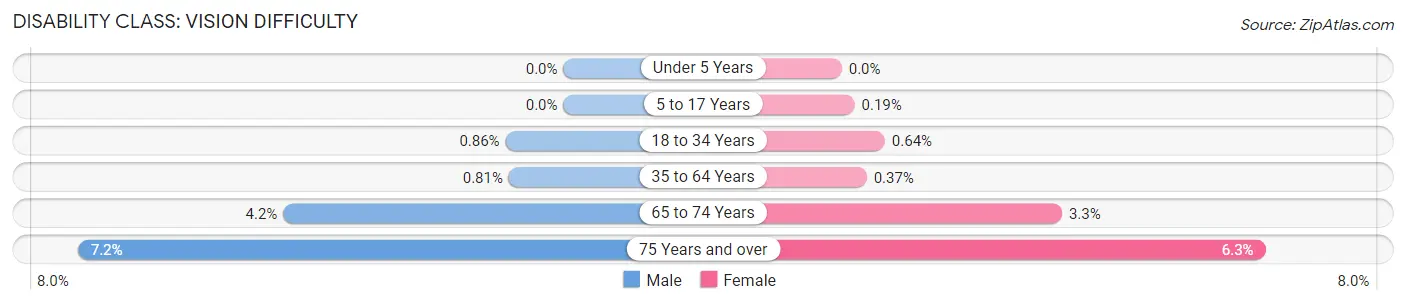
| Age Bracket | Male | Female |
| Under 5 Years | 0 (0.0%) | 0 (0.0%) |
| 5 to 17 Years | 0 (0.0%) | 8 (0.2%) |
| 18 to 34 Years | 71 (0.9%) | 47 (0.6%) |
| 35 to 64 Years | 119 (0.8%) | 54 (0.4%) |
| 65 to 74 Years | 141 (4.2%) | 125 (3.3%) |
| 75 Years and over | 158 (7.2%) | 188 (6.3%) |
Disability Class: Cognitive Difficulty
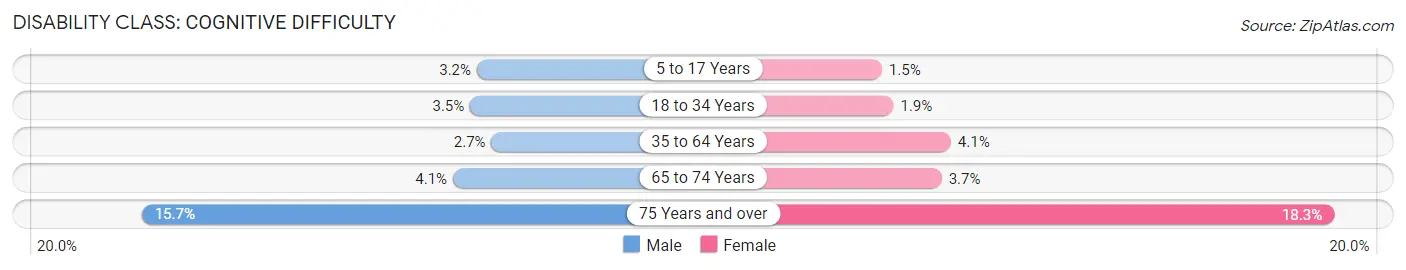
| Age Bracket | Male | Female |
| 5 to 17 Years | 155 (3.2%) | 63 (1.5%) |
| 18 to 34 Years | 284 (3.5%) | 141 (1.9%) |
| 35 to 64 Years | 391 (2.7%) | 585 (4.1%) |
| 65 to 74 Years | 139 (4.1%) | 142 (3.7%) |
| 75 Years and over | 343 (15.7%) | 546 (18.3%) |
Disability Class: Ambulatory Difficulty
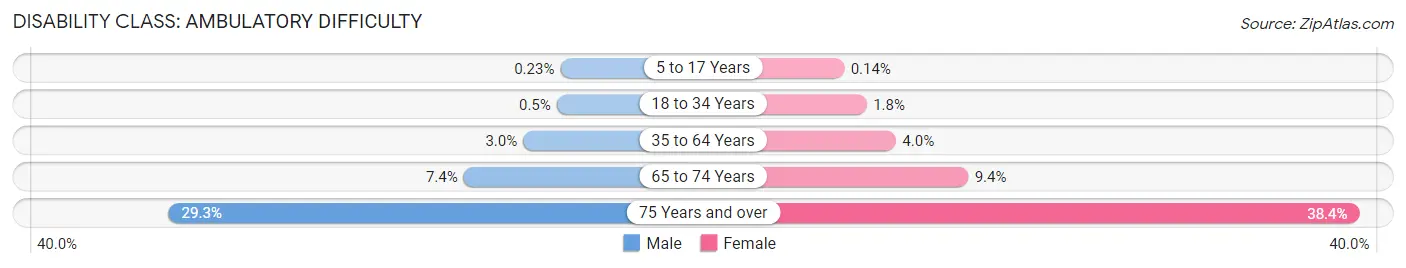
| Age Bracket | Male | Female |
| 5 to 17 Years | 11 (0.2%) | 6 (0.1%) |
| 18 to 34 Years | 41 (0.5%) | 133 (1.8%) |
| 35 to 64 Years | 438 (3.0%) | 574 (4.0%) |
| 65 to 74 Years | 251 (7.4%) | 358 (9.3%) |
| 75 Years and over | 642 (29.3%) | 1,148 (38.4%) |
Disability Class: Self-Care Difficulty
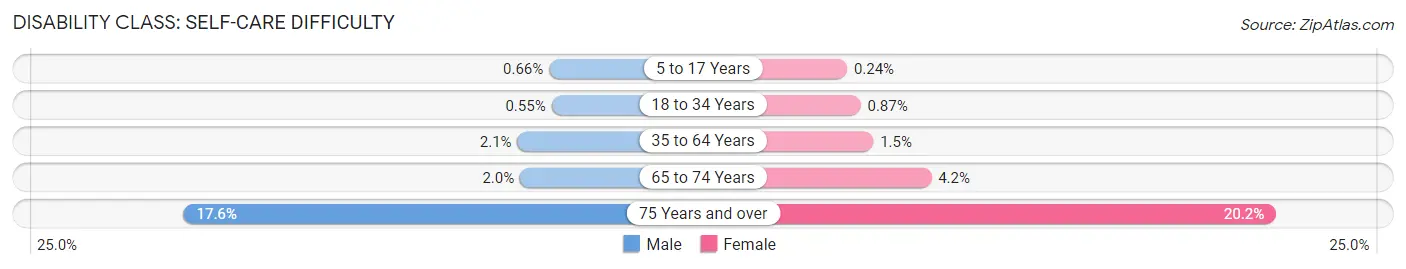
| Age Bracket | Male | Female |
| 5 to 17 Years | 32 (0.7%) | 10 (0.2%) |
| 18 to 34 Years | 45 (0.5%) | 64 (0.9%) |
| 35 to 64 Years | 313 (2.1%) | 211 (1.5%) |
| 65 to 74 Years | 68 (2.0%) | 159 (4.2%) |
| 75 Years and over | 386 (17.6%) | 602 (20.2%) |
Technology Access in Union City
Computing Device Access in Union City
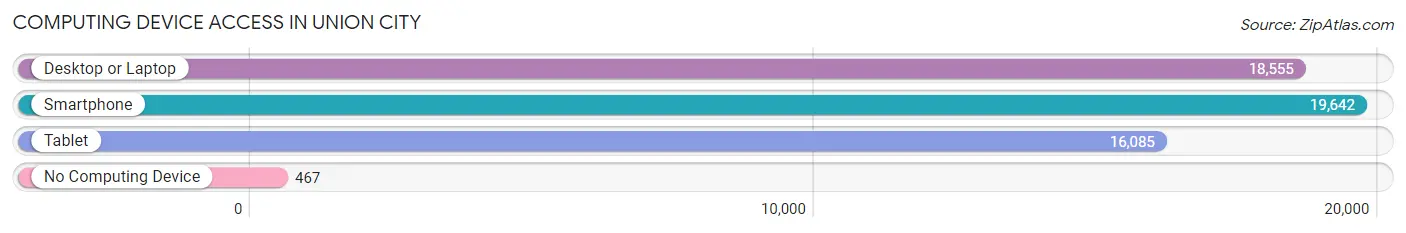
| Device Type | # Households | % Households |
| Desktop or Laptop | 18,555 | 88.9% |
| Smartphone | 19,642 | 94.2% |
| Tablet | 16,085 | 77.1% |
| No Computing Device | 467 | 2.2% |
| Total | 20,860 | 100.0% |
Internet Access in Union City
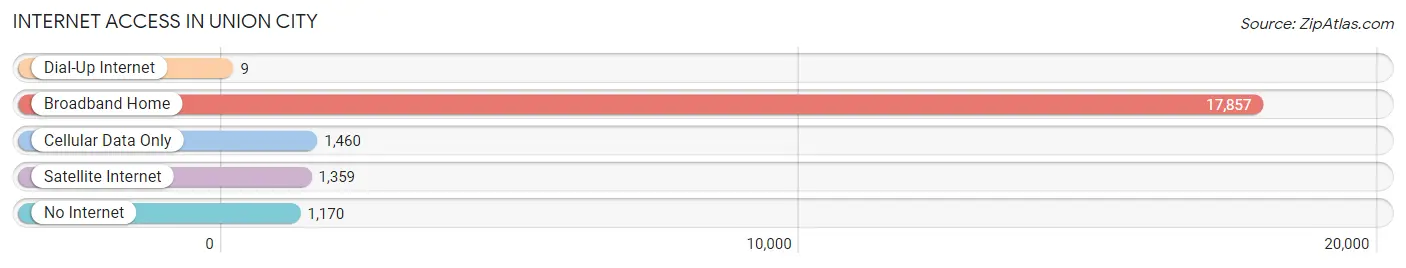
| Internet Type | # Households | % Households |
| Dial-Up Internet | 9 | 0.0% |
| Broadband Home | 17,857 | 85.6% |
| Cellular Data Only | 1,460 | 7.0% |
| Satellite Internet | 1,359 | 6.5% |
| No Internet | 1,170 | 5.6% |
| Total | 20,860 | 100.0% |
Union City Summary
Introduction
Union City is a city located in Alameda County, California, United States. It is situated in the San Francisco Bay Area, and is part of the East Bay region. Union City is the most populous city in Alameda County, with a population of 72,814 as of the 2010 census. The city was incorporated in 1959, and is known for its diverse population and vibrant culture.
History
Union City was first settled in the 1850s by settlers from the East Coast. The city was originally known as Decoto, and was later renamed Union City in 1959. The city was incorporated in 1959, and has since grown to become the most populous city in Alameda County.
Geography
Union City is located in the San Francisco Bay Area, and is part of the East Bay region. The city is situated on the eastern shore of San Francisco Bay, and is bordered by Hayward to the north, Fremont to the south, and Newark to the east. Union City covers an area of 19.2 square miles, and has a population density of 3,741 people per square mile.
Economy
Union City is home to a diverse economy, with a variety of industries represented. The city is home to several major employers, including the Union City Unified School District, the Union City Police Department, and the Union City Fire Department. The city is also home to several large retail stores, including Walmart, Target, and Costco.
Demographics
As of the 2010 census, Union City had a population of 72,814. The population is diverse, with a variety of ethnic and racial backgrounds represented. The largest racial group is Hispanic or Latino, making up 44.3% of the population. Other racial groups include White (25.3%), Asian (19.2%), African American (7.2%), and Native American (1.2%). The median household income in Union City is $76,845, and the median age is 36.
Conclusion
Union City is a vibrant and diverse city located in Alameda County, California. The city has a rich history, and is home to a diverse population and economy. Union City is the most populous city in Alameda County, with a population of 72,814 as of the 2010 census. The city is home to a variety of industries, and is a major employer in the region. Union City is also home to a diverse population, with a variety of ethnic and racial backgrounds represented.
Common Questions
What is Per Capita Income in Union City?
Per Capita income in Union City is $52,646.
What is the Median Family Income in Union City?
Median Family Income in Union City is $150,302.
What is the Median Household income in Union City?
Median Household Income in Union City is $138,013.
What is Income or Wage Gap in Union City?
Income or Wage Gap in Union City is 15.3%.
Women in Union City earn 84.7 cents for every dollar earned by a man.
What is Family Income Deficit in Union City?
Family Income Deficit in Union City is $10,561.
Families that are below poverty line in Union City earn $10,561 less on average than the poverty threshold level.
What is Inequality or Gini Index in Union City?
Inequality or Gini Index in Union City is 0.40.
What is the Total Population of Union City?
Total Population of Union City is 69,502.
What is the Total Male Population of Union City?
Total Male Population of Union City is 35,351.
What is the Total Female Population of Union City?
Total Female Population of Union City is 34,151.
What is the Ratio of Males per 100 Females in Union City?
There are 103.51 Males per 100 Females in Union City.
What is the Ratio of Females per 100 Males in Union City?
There are 96.61 Females per 100 Males in Union City.
What is the Median Population Age in Union City?
Median Population Age in Union City is 41.3 Years.
What is the Average Family Size in Union City
Average Family Size in Union City is 3.6 People.
What is the Average Household Size in Union City
Average Household Size in Union City is 3.3 People.
How Large is the Labor Force in Union City?
There are 38,114 People in the Labor Forcein in Union City.
What is the Percentage of People in the Labor Force in Union City?
65.3% of People are in the Labor Force in Union City.
What is the Unemployment Rate in Union City?
Unemployment Rate in Union City is 4.6%.