Olathe, KS Map & Demographics
Olathe Map
Olathe Overview
$46,299
PER CAPITA INCOME
$118,875
AVG FAMILY INCOME
$108,077
AVG HOUSEHOLD INCOME
32.9%
WAGE / INCOME GAP [ % ]
67.1¢/ $1
WAGE / INCOME GAP [ $ ]
$9,981
FAMILY INCOME DEFICIT
0.40
INEQUALITY / GINI INDEX
142,114
TOTAL POPULATION
70,741
MALE POPULATION
71,373
FEMALE POPULATION
99.11
MALES / 100 FEMALES
100.89
FEMALES / 100 MALES
36.3
MEDIAN AGE
3.2
AVG FAMILY SIZE
2.8
AVG HOUSEHOLD SIZE
80,135
LABOR FORCE [ PEOPLE ]
73.6%
PERCENT IN LABOR FORCE
3.2%
UNEMPLOYMENT RATE
Olathe Area Codes
Income in Olathe
Income Overview in Olathe
Per Capita Income in Olathe is $46,299, while median incomes of families and households are $118,875 and $108,077 respectively.
| Characteristic | Number | Measure |
| Per Capita Income | 142,114 | $46,299 |
| Median Family Income | 37,961 | $118,875 |
| Mean Family Income | 37,961 | $140,325 |
| Median Household Income | 51,021 | $108,077 |
| Mean Household Income | 51,021 | $126,598 |
| Income Deficit | 37,961 | $9,981 |
| Wage / Income Gap (%) | 142,114 | 32.90% |
| Wage / Income Gap ($) | 142,114 | 67.10¢ per $1 |
| Gini / Inequality Index | 142,114 | 0.40 |
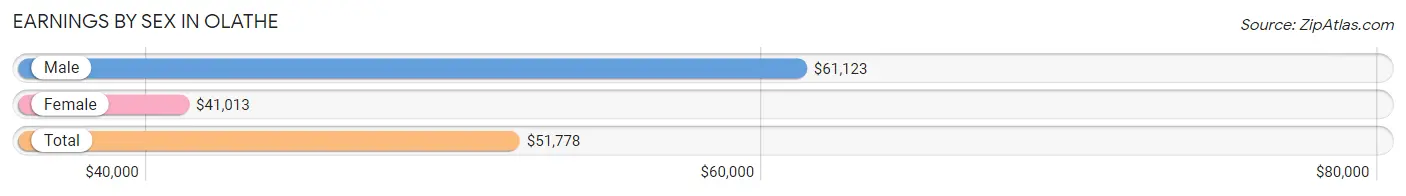
Earnings by Sex in Olathe
Average Earnings in Olathe are $51,778, $61,123 for men and $41,013 for women, a difference of 32.9%.
| Sex | Number | Average Earnings |
| Male | 44,131 (52.2%) | $61,123 |
| Female | 40,341 (47.8%) | $41,013 |
| Total | 84,472 (100.0%) | $51,778 |
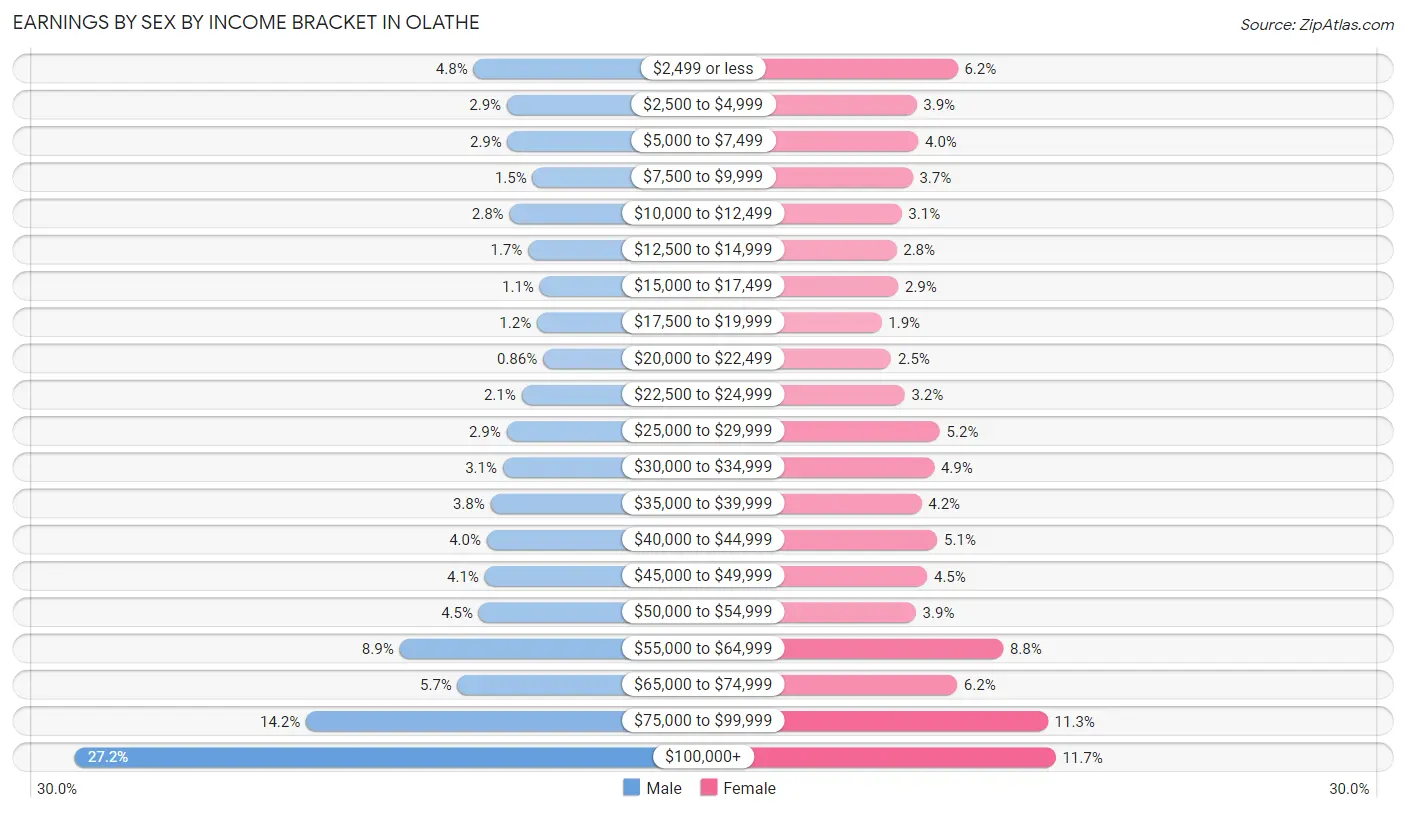
Earnings by Sex by Income Bracket in Olathe
The most common earnings brackets in Olathe are $100,000+ for men (11,989 | 27.2%) and $100,000+ for women (4,731 | 11.7%).
| Income | Male | Female |
| $2,499 or less | 2,104 (4.8%) | 2,511 (6.2%) |
| $2,500 to $4,999 | 1,275 (2.9%) | 1,579 (3.9%) |
| $5,000 to $7,499 | 1,256 (2.9%) | 1,617 (4.0%) |
| $7,500 to $9,999 | 641 (1.5%) | 1,489 (3.7%) |
| $10,000 to $12,499 | 1,212 (2.8%) | 1,240 (3.1%) |
| $12,500 to $14,999 | 752 (1.7%) | 1,122 (2.8%) |
| $15,000 to $17,499 | 464 (1.1%) | 1,163 (2.9%) |
| $17,500 to $19,999 | 528 (1.2%) | 781 (1.9%) |
| $20,000 to $22,499 | 379 (0.9%) | 1,003 (2.5%) |
| $22,500 to $24,999 | 913 (2.1%) | 1,309 (3.2%) |
| $25,000 to $29,999 | 1,286 (2.9%) | 2,105 (5.2%) |
| $30,000 to $34,999 | 1,378 (3.1%) | 1,978 (4.9%) |
| $35,000 to $39,999 | 1,682 (3.8%) | 1,690 (4.2%) |
| $40,000 to $44,999 | 1,774 (4.0%) | 2,049 (5.1%) |
| $45,000 to $49,999 | 1,825 (4.1%) | 1,820 (4.5%) |
| $50,000 to $54,999 | 1,974 (4.5%) | 1,562 (3.9%) |
| $55,000 to $64,999 | 3,940 (8.9%) | 3,540 (8.8%) |
| $65,000 to $74,999 | 2,500 (5.7%) | 2,498 (6.2%) |
| $75,000 to $99,999 | 6,259 (14.2%) | 4,554 (11.3%) |
| $100,000+ | 11,989 (27.2%) | 4,731 (11.7%) |
| Total | 44,131 (100.0%) | 40,341 (100.0%) |
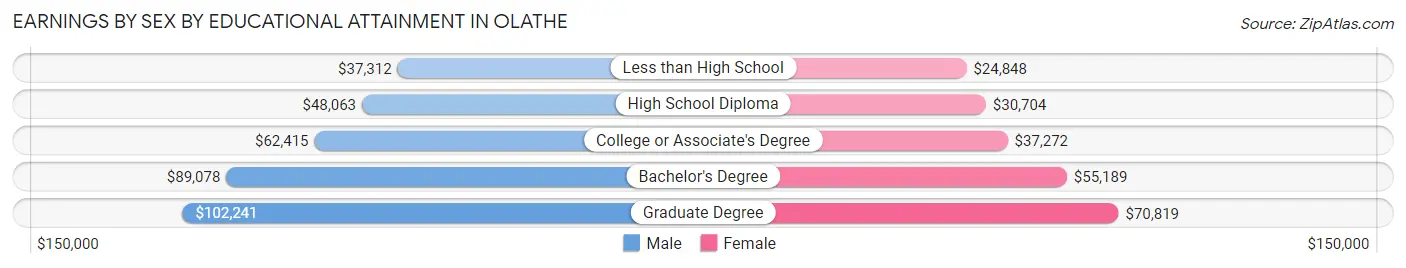
Earnings by Sex by Educational Attainment in Olathe
Average earnings in Olathe are $72,151 for men and $47,316 for women, a difference of 34.4%. Men with an educational attainment of graduate degree enjoy the highest average annual earnings of $102,241, while those with less than high school education earn the least with $37,312. Women with an educational attainment of graduate degree earn the most with the average annual earnings of $70,819, while those with less than high school education have the smallest earnings of $24,848.
| Educational Attainment | Male Income | Female Income |
| Less than High School | $37,312 | $24,848 |
| High School Diploma | $48,063 | $30,704 |
| College or Associate's Degree | $62,415 | $37,272 |
| Bachelor's Degree | $89,078 | $55,189 |
| Graduate Degree | $102,241 | $70,819 |
| Total | $72,151 | $47,316 |
Family Income in Olathe
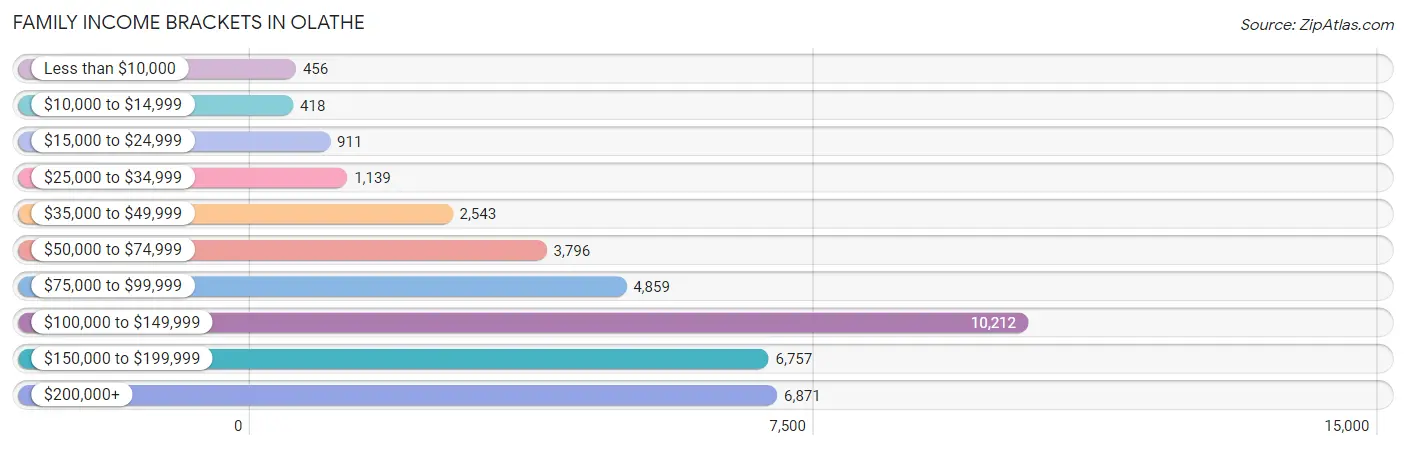
Family Income Brackets in Olathe
According to the Olathe family income data, there are 10,212 families falling into the $100,000 to $149,999 income range, which is the most common income bracket and makes up 26.9% of all families. Conversely, the $10,000 to $14,999 income bracket is the least frequent group with only 418 families (1.1%) belonging to this category.
| Income Bracket | # Families | % Families |
| Less than $10,000 | 456 | 1.2% |
| $10,000 to $14,999 | 418 | 1.1% |
| $15,000 to $24,999 | 911 | 2.4% |
| $25,000 to $34,999 | 1,139 | 3.0% |
| $35,000 to $49,999 | 2,543 | 6.7% |
| $50,000 to $74,999 | 3,796 | 10.0% |
| $75,000 to $99,999 | 4,859 | 12.8% |
| $100,000 to $149,999 | 10,212 | 26.9% |
| $150,000 to $199,999 | 6,757 | 17.8% |
| $200,000+ | 6,871 | 18.1% |
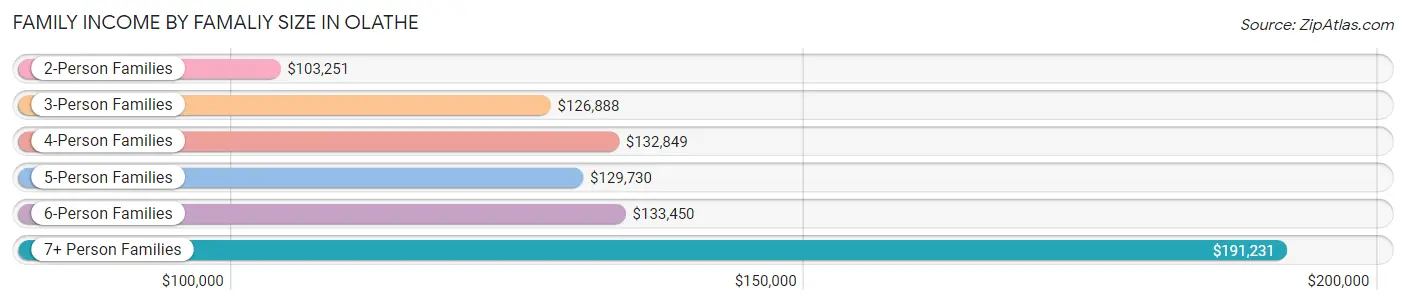
Family Income by Famaliy Size in Olathe
7+ person families (650 | 1.7%) account for the highest median family income in Olathe with $191,231 per family, while 2-person families (15,642 | 41.2%) have the highest median income of $51,626 per family member.
| Income Bracket | # Families | Median Income |
| 2-Person Families | 15,642 (41.2%) | $103,251 |
| 3-Person Families | 8,805 (23.2%) | $126,888 |
| 4-Person Families | 8,651 (22.8%) | $132,849 |
| 5-Person Families | 3,082 (8.1%) | $129,730 |
| 6-Person Families | 1,131 (3.0%) | $133,450 |
| 7+ Person Families | 650 (1.7%) | $191,231 |
| Total | 37,961 (100.0%) | $118,875 |
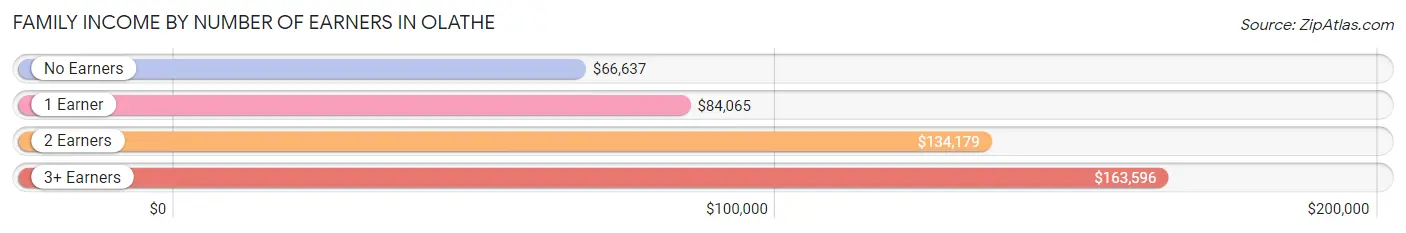
Family Income by Number of Earners in Olathe
The median family income in Olathe is $118,875, with families comprising 3+ earners (5,586) having the highest median family income of $163,596, while families with no earners (3,273) have the lowest median family income of $66,637, accounting for 14.7% and 8.6% of families, respectively.
| Number of Earners | # Families | Median Income |
| No Earners | 3,273 (8.6%) | $66,637 |
| 1 Earner | 9,298 (24.5%) | $84,065 |
| 2 Earners | 19,804 (52.2%) | $134,179 |
| 3+ Earners | 5,586 (14.7%) | $163,596 |
| Total | 37,961 (100.0%) | $118,875 |
Household Income in Olathe
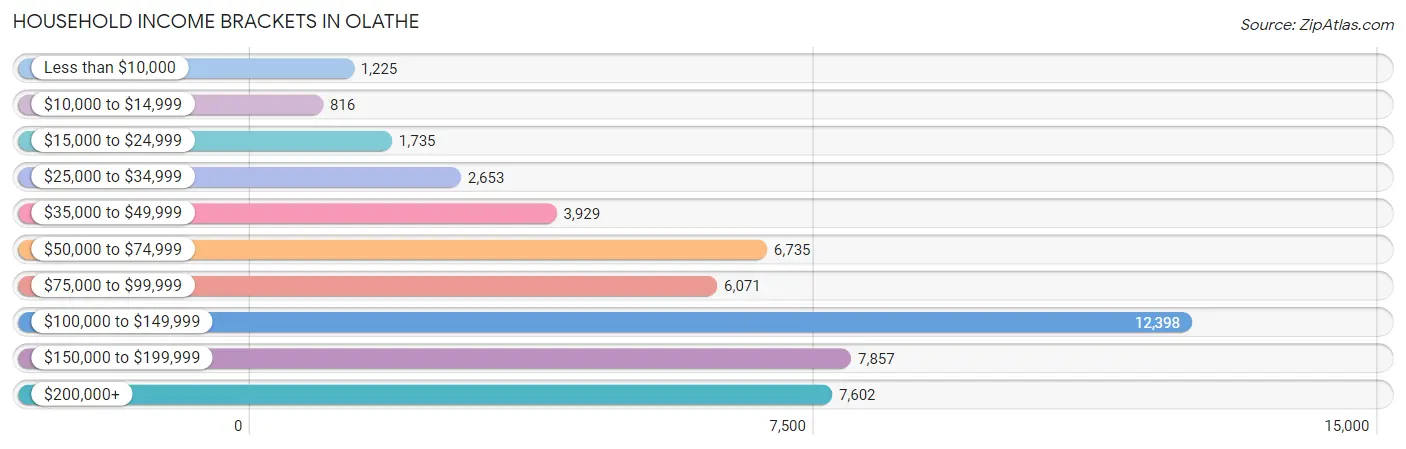
Household Income Brackets in Olathe
With 12,398 households falling in the category, the $100,000 to $149,999 income range is the most frequent in Olathe, accounting for 24.3% of all households. In contrast, only 816 households (1.6%) fall into the $10,000 to $14,999 income bracket, making it the least populous group.
| Income Bracket | # Households | % Households |
| Less than $10,000 | 1,225 | 2.4% |
| $10,000 to $14,999 | 816 | 1.6% |
| $15,000 to $24,999 | 1,735 | 3.4% |
| $25,000 to $34,999 | 2,653 | 5.2% |
| $35,000 to $49,999 | 3,929 | 7.7% |
| $50,000 to $74,999 | 6,735 | 13.2% |
| $75,000 to $99,999 | 6,071 | 11.9% |
| $100,000 to $149,999 | 12,398 | 24.3% |
| $150,000 to $199,999 | 7,857 | 15.4% |
| $200,000+ | 7,602 | 14.9% |
Household Income by Householder Age in Olathe
The median household income in Olathe is $108,077, with the highest median household income of $125,712 found in the 45 to 64 years age bracket for the primary householder. A total of 18,964 households (37.2%) fall into this category. Meanwhile, the 15 to 24 years age bracket for the primary householder has the lowest median household income of $45,824, with 1,627 households (3.2%) in this group.
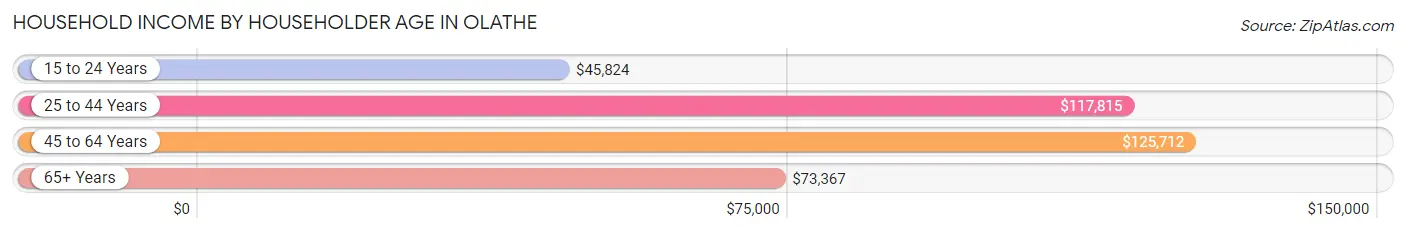
| Income Bracket | # Households | Median Income |
| 15 to 24 Years | 1,627 (3.2%) | $45,824 |
| 25 to 44 Years | 19,710 (38.6%) | $117,815 |
| 45 to 64 Years | 18,964 (37.2%) | $125,712 |
| 65+ Years | 10,720 (21.0%) | $73,367 |
| Total | 51,021 (100.0%) | $108,077 |
Poverty in Olathe
Income Below Poverty by Sex and Age in Olathe
With 5.4% poverty level for males and 6.7% for females among the residents of Olathe, 18 to 24 year old males and 75 year old and over females are the most vulnerable to poverty, with 677 males (11.0%) and 555 females (14.0%) in their respective age groups living below the poverty level.
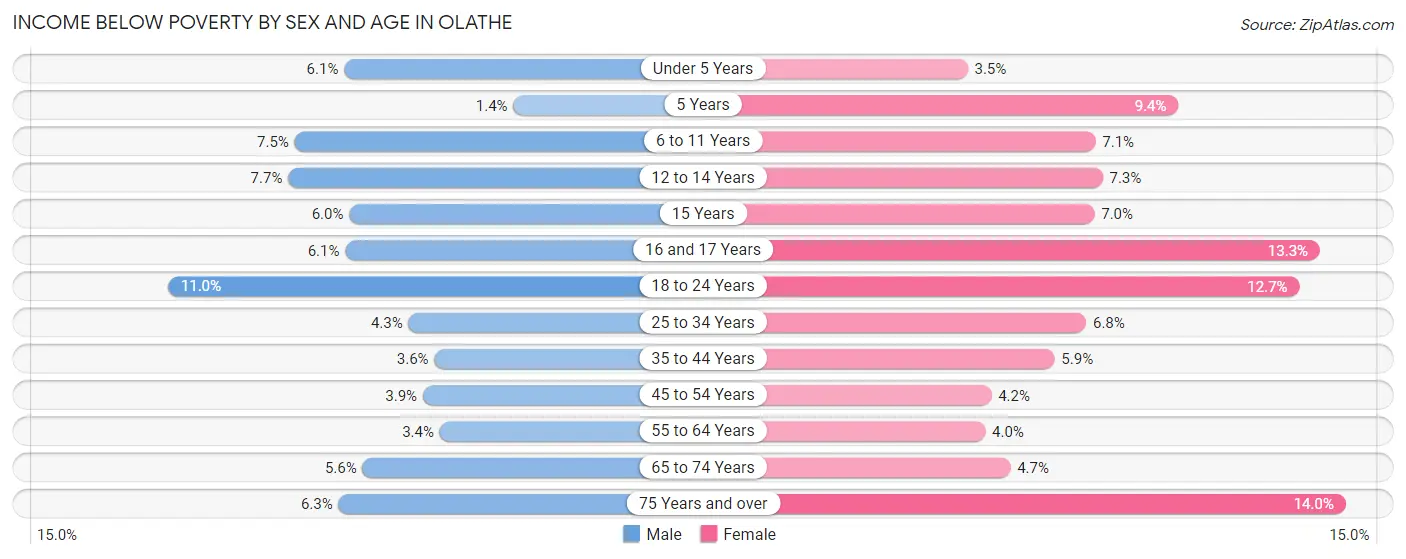
| Age Bracket | Male | Female |
| Under 5 Years | 265 (6.1%) | 156 (3.5%) |
| 5 Years | 19 (1.4%) | 91 (9.4%) |
| 6 to 11 Years | 501 (7.5%) | 452 (7.1%) |
| 12 to 14 Years | 246 (7.7%) | 221 (7.3%) |
| 15 Years | 57 (6.0%) | 81 (7.0%) |
| 16 and 17 Years | 162 (6.1%) | 285 (13.3%) |
| 18 to 24 Years | 677 (11.0%) | 633 (12.7%) |
| 25 to 34 Years | 373 (4.3%) | 619 (6.8%) |
| 35 to 44 Years | 408 (3.6%) | 688 (5.9%) |
| 45 to 54 Years | 366 (3.9%) | 408 (4.2%) |
| 55 to 64 Years | 246 (3.4%) | 291 (4.0%) |
| 65 to 74 Years | 302 (5.6%) | 255 (4.7%) |
| 75 Years and over | 159 (6.3%) | 555 (14.0%) |
| Total | 3,781 (5.4%) | 4,735 (6.7%) |
Income Above Poverty by Sex and Age in Olathe
According to the poverty statistics in Olathe, males aged 5 years and females aged under 5 years are the age groups that are most secure financially, with 98.6% of males and 96.5% of females in these age groups living above the poverty line.
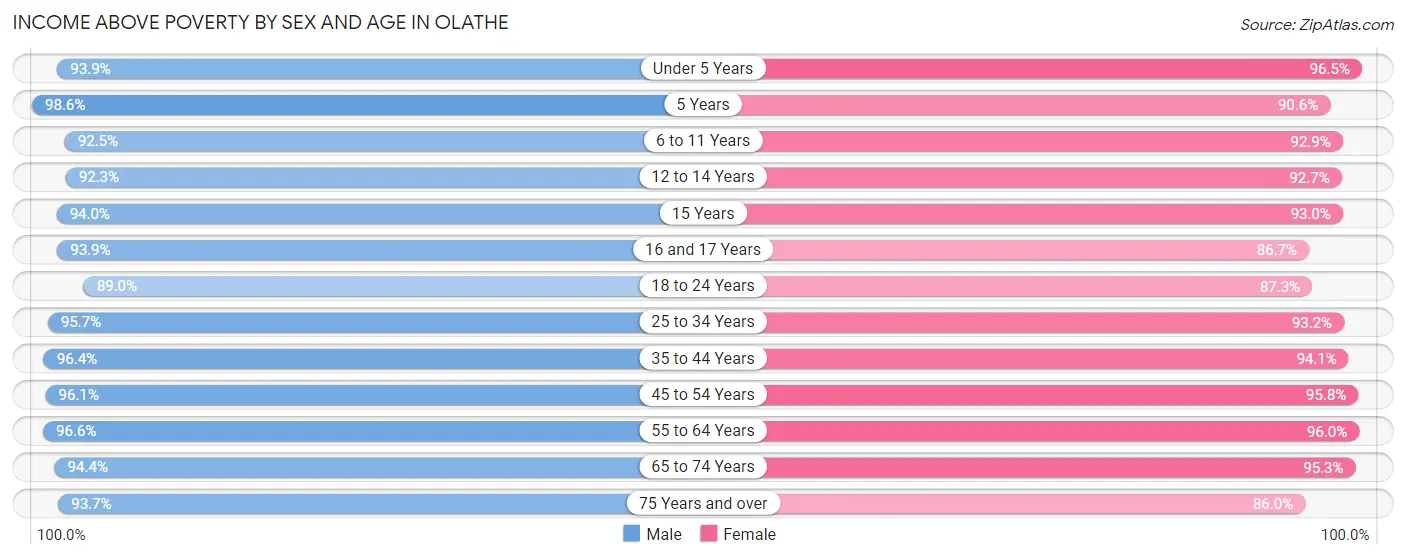
| Age Bracket | Male | Female |
| Under 5 Years | 4,076 (93.9%) | 4,299 (96.5%) |
| 5 Years | 1,345 (98.6%) | 880 (90.6%) |
| 6 to 11 Years | 6,201 (92.5%) | 5,947 (92.9%) |
| 12 to 14 Years | 2,967 (92.3%) | 2,822 (92.7%) |
| 15 Years | 899 (94.0%) | 1,071 (93.0%) |
| 16 and 17 Years | 2,505 (93.9%) | 1,856 (86.7%) |
| 18 to 24 Years | 5,474 (89.0%) | 4,334 (87.3%) |
| 25 to 34 Years | 8,272 (95.7%) | 8,490 (93.2%) |
| 35 to 44 Years | 10,942 (96.4%) | 10,937 (94.1%) |
| 45 to 54 Years | 8,983 (96.1%) | 9,404 (95.8%) |
| 55 to 64 Years | 6,897 (96.6%) | 6,995 (96.0%) |
| 65 to 74 Years | 5,096 (94.4%) | 5,181 (95.3%) |
| 75 Years and over | 2,379 (93.7%) | 3,402 (86.0%) |
| Total | 66,036 (94.6%) | 65,618 (93.3%) |
Income Below Poverty Among Married-Couple Families in Olathe
The poverty statistics for married-couple families in Olathe show that 1.8% or 551 of the total 30,516 families live below the poverty line. Families with 5 or more children have the highest poverty rate of 3.9%, comprising of 14 families. On the other hand, families with 1 or 2 children have the lowest poverty rate of 1.5%, which includes 180 families.
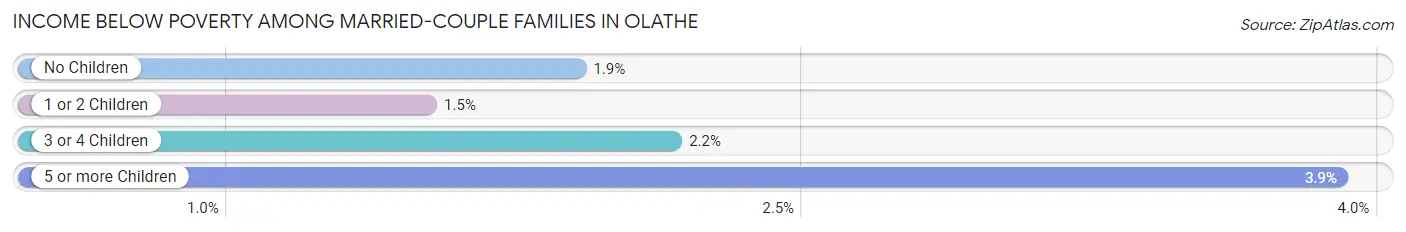
| Children | Above Poverty | Below Poverty |
| No Children | 14,962 (98.1%) | 291 (1.9%) |
| 1 or 2 Children | 11,671 (98.5%) | 180 (1.5%) |
| 3 or 4 Children | 2,987 (97.8%) | 66 (2.2%) |
| 5 or more Children | 345 (96.1%) | 14 (3.9%) |
| Total | 29,965 (98.2%) | 551 (1.8%) |
Income Below Poverty Among Single-Parent Households in Olathe
According to the poverty data in Olathe, 10.1% or 235 single-father households and 15.6% or 800 single-mother households are living below the poverty line. Among single-father households, those with 1 or 2 children have the highest poverty rate, with 134 households (10.9%) experiencing poverty. Likewise, among single-mother households, those with 5 or more children have the highest poverty rate, with 71 households (92.2%) falling below the poverty line.
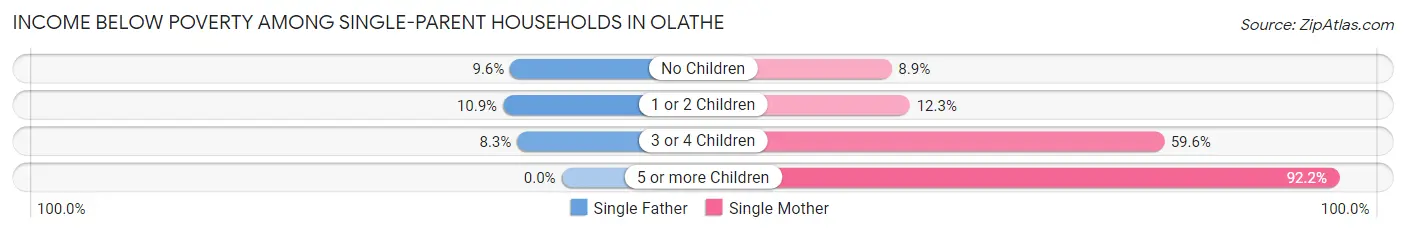
| Children | Single Father | Single Mother |
| No Children | 81 (9.6%) | 162 (8.9%) |
| 1 or 2 Children | 134 (10.9%) | 353 (12.3%) |
| 3 or 4 Children | 20 (8.3%) | 214 (59.6%) |
| 5 or more Children | 0 (0.0%) | 71 (92.2%) |
| Total | 235 (10.1%) | 800 (15.6%) |
Income Below Poverty Among Married-Couple vs Single-Parent Households in Olathe
The poverty data for Olathe shows that 551 of the married-couple family households (1.8%) and 1,035 of the single-parent households (13.9%) are living below the poverty level. Within the married-couple family households, those with 5 or more children have the highest poverty rate, with 14 households (3.9%) falling below the poverty line. Among the single-parent households, those with 5 or more children have the highest poverty rate, with 71 household (92.2%) living below poverty.
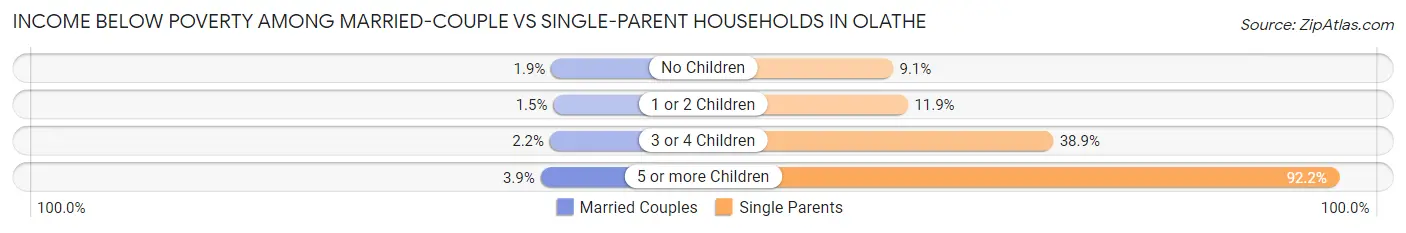
| Children | Married-Couple Families | Single-Parent Households |
| No Children | 291 (1.9%) | 243 (9.1%) |
| 1 or 2 Children | 180 (1.5%) | 487 (11.9%) |
| 3 or 4 Children | 66 (2.2%) | 234 (38.9%) |
| 5 or more Children | 14 (3.9%) | 71 (92.2%) |
| Total | 551 (1.8%) | 1,035 (13.9%) |
Race in Olathe
The most populous races in Olathe are White / Caucasian (115,524 | 81.3%), Hispanic or Latino (16,618 | 11.7%), and Two or more Races (9,941 | 7.0%).
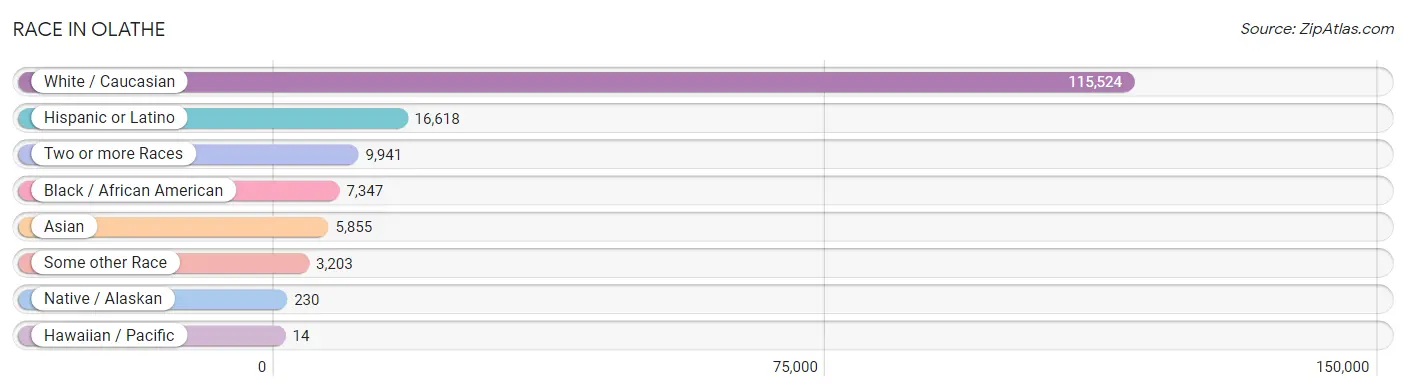
| Race | # Population | % Population |
| Asian | 5,855 | 4.1% |
| Black / African American | 7,347 | 5.2% |
| Hawaiian / Pacific | 14 | 0.0% |
| Hispanic or Latino | 16,618 | 11.7% |
| Native / Alaskan | 230 | 0.2% |
| White / Caucasian | 115,524 | 81.3% |
| Two or more Races | 9,941 | 7.0% |
| Some other Race | 3,203 | 2.2% |
| Total | 142,114 | 100.0% |
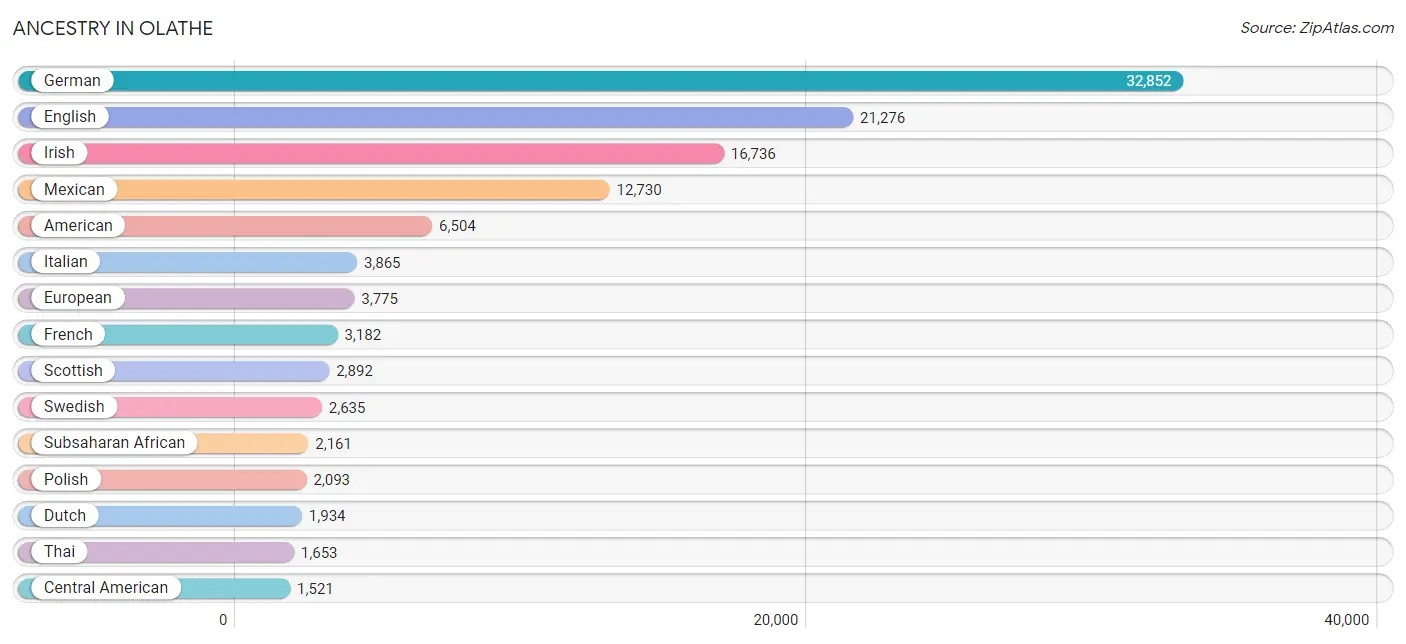
Ancestry in Olathe
The most populous ancestries reported in Olathe are German (32,852 | 23.1%), English (21,276 | 15.0%), Irish (16,736 | 11.8%), Mexican (12,730 | 9.0%), and American (6,504 | 4.6%), together accounting for 63.4% of all Olathe residents.
| Ancestry | # Population | % Population |
| African | 776 | 0.5% |
| Albanian | 12 | 0.0% |
| American | 6,504 | 4.6% |
| Apache | 44 | 0.0% |
| Arab | 1,411 | 1.0% |
| Argentinean | 39 | 0.0% |
| Armenian | 99 | 0.1% |
| Austrian | 407 | 0.3% |
| Bangladeshi | 122 | 0.1% |
| Basque | 23 | 0.0% |
| Belgian | 341 | 0.2% |
| Bhutanese | 528 | 0.4% |
| Blackfeet | 134 | 0.1% |
| Bolivian | 66 | 0.1% |
| Brazilian | 418 | 0.3% |
| British | 1,217 | 0.9% |
| Bulgarian | 51 | 0.0% |
| Burmese | 524 | 0.4% |
| Cajun | 30 | 0.0% |
| Canadian | 315 | 0.2% |
| Celtic | 58 | 0.0% |
| Central American | 1,521 | 1.1% |
| Central American Indian | 74 | 0.1% |
| Cherokee | 513 | 0.4% |
| Chickasaw | 57 | 0.0% |
| Chilean | 4 | 0.0% |
| Chippewa | 25 | 0.0% |
| Choctaw | 81 | 0.1% |
| Colombian | 188 | 0.1% |
| Colville | 7 | 0.0% |
| Costa Rican | 25 | 0.0% |
| Cree | 37 | 0.0% |
| Creek | 22 | 0.0% |
| Croatian | 468 | 0.3% |
| Cuban | 100 | 0.1% |
| Czech | 892 | 0.6% |
| Czechoslovakian | 178 | 0.1% |
| Danish | 935 | 0.7% |
| Delaware | 103 | 0.1% |
| Dominican | 78 | 0.1% |
| Dutch | 1,934 | 1.4% |
| Eastern European | 559 | 0.4% |
| Ecuadorian | 126 | 0.1% |
| Egyptian | 17 | 0.0% |
| English | 21,276 | 15.0% |
| Ethiopian | 248 | 0.2% |
| European | 3,775 | 2.7% |
| Filipino | 179 | 0.1% |
| Finnish | 113 | 0.1% |
| French | 3,182 | 2.2% |
| French Canadian | 273 | 0.2% |
| German | 32,852 | 23.1% |
| German Russian | 57 | 0.0% |
| Greek | 216 | 0.2% |
| Guamanian / Chamorro | 1 | 0.0% |
| Guatemalan | 685 | 0.5% |
| Haitian | 99 | 0.1% |
| Honduran | 338 | 0.2% |
| Hungarian | 190 | 0.1% |
| Indian (Asian) | 1,339 | 0.9% |
| Indonesian | 83 | 0.1% |
| Inupiat | 12 | 0.0% |
| Iranian | 475 | 0.3% |
| Iraqi | 46 | 0.0% |
| Irish | 16,736 | 11.8% |
| Iroquois | 128 | 0.1% |
| Italian | 3,865 | 2.7% |
| Jamaican | 32 | 0.0% |
| Jordanian | 67 | 0.1% |
| Kenyan | 647 | 0.5% |
| Korean | 548 | 0.4% |
| Laotian | 345 | 0.2% |
| Latvian | 18 | 0.0% |
| Lebanese | 324 | 0.2% |
| Liberian | 11 | 0.0% |
| Lithuanian | 74 | 0.1% |
| Luxembourger | 15 | 0.0% |
| Malaysian | 378 | 0.3% |
| Mexican | 12,730 | 9.0% |
| Mexican American Indian | 63 | 0.0% |
| Native Hawaiian | 157 | 0.1% |
| Navajo | 7 | 0.0% |
| Nicaraguan | 200 | 0.1% |
| Nigerian | 143 | 0.1% |
| Northern European | 190 | 0.1% |
| Norwegian | 1,402 | 1.0% |
| Osage | 21 | 0.0% |
| Pakistani | 235 | 0.2% |
| Palestinian | 216 | 0.2% |
| Panamanian | 73 | 0.1% |
| Pennsylvania German | 35 | 0.0% |
| Peruvian | 79 | 0.1% |
| Polish | 2,093 | 1.5% |
| Portuguese | 34 | 0.0% |
| Potawatomi | 31 | 0.0% |
| Puerto Rican | 1,055 | 0.7% |
| Romanian | 66 | 0.1% |
| Russian | 1,009 | 0.7% |
| Salvadoran | 200 | 0.1% |
| Samoan | 3 | 0.0% |
| Scandinavian | 665 | 0.5% |
| Scotch-Irish | 1,437 | 1.0% |
| Scottish | 2,892 | 2.0% |
| Serbian | 12 | 0.0% |
| Sioux | 29 | 0.0% |
| Slavic | 73 | 0.1% |
| Slovak | 78 | 0.1% |
| Slovene | 181 | 0.1% |
| South American | 624 | 0.4% |
| South American Indian | 8 | 0.0% |
| Spaniard | 50 | 0.0% |
| Spanish | 174 | 0.1% |
| Sri Lankan | 1,429 | 1.0% |
| Subsaharan African | 2,161 | 1.5% |
| Swedish | 2,635 | 1.8% |
| Swiss | 488 | 0.3% |
| Syrian | 55 | 0.0% |
| Thai | 1,653 | 1.2% |
| Turkish | 45 | 0.0% |
| Ukrainian | 472 | 0.3% |
| Uruguayan | 46 | 0.0% |
| Venezuelan | 76 | 0.1% |
| Vietnamese | 35 | 0.0% |
| Welsh | 1,202 | 0.9% |
| West Indian | 29 | 0.0% |
| Yugoslavian | 27 | 0.0% |
| Yup'ik | 5 | 0.0% | View All 127 Rows |
Immigrants in Olathe
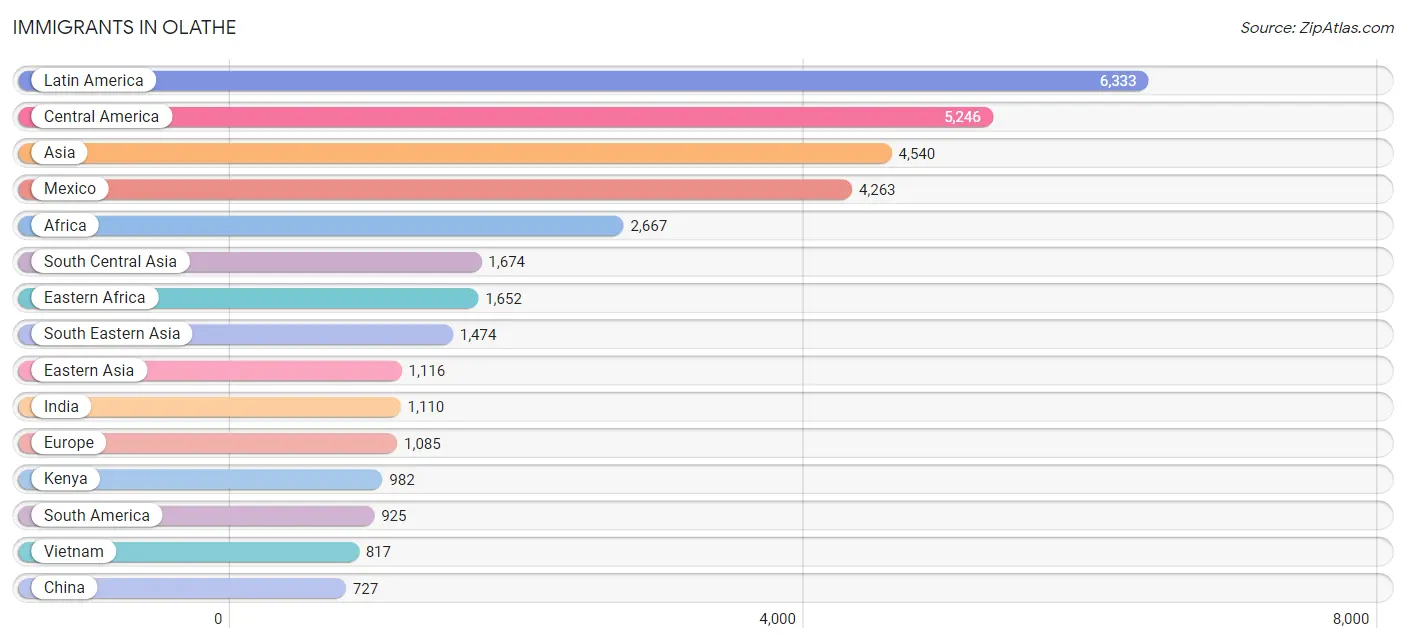
The most numerous immigrant groups reported in Olathe came from Latin America (6,333 | 4.5%), Central America (5,246 | 3.7%), Asia (4,540 | 3.2%), Mexico (4,263 | 3.0%), and Africa (2,667 | 1.9%), together accounting for 16.2% of all Olathe residents.
| Immigration Origin | # Population | % Population |
| Africa | 2,667 | 1.9% |
| Argentina | 13 | 0.0% |
| Asia | 4,540 | 3.2% |
| Australia | 16 | 0.0% |
| Belarus | 35 | 0.0% |
| Belgium | 10 | 0.0% |
| Bolivia | 66 | 0.1% |
| Bosnia and Herzegovina | 10 | 0.0% |
| Brazil | 472 | 0.3% |
| Bulgaria | 44 | 0.0% |
| Canada | 341 | 0.2% |
| Caribbean | 162 | 0.1% |
| Central America | 5,246 | 3.7% |
| China | 727 | 0.5% |
| Colombia | 102 | 0.1% |
| Congo | 45 | 0.0% |
| Cuba | 46 | 0.0% |
| Czechoslovakia | 11 | 0.0% |
| Dominican Republic | 26 | 0.0% |
| Eastern Africa | 1,652 | 1.2% |
| Eastern Asia | 1,116 | 0.8% |
| Eastern Europe | 592 | 0.4% |
| Ecuador | 115 | 0.1% |
| Egypt | 89 | 0.1% |
| El Salvador | 127 | 0.1% |
| England | 132 | 0.1% |
| Ethiopia | 652 | 0.5% |
| Europe | 1,085 | 0.8% |
| Fiji | 29 | 0.0% |
| France | 39 | 0.0% |
| Germany | 99 | 0.1% |
| Ghana | 11 | 0.0% |
| Greece | 24 | 0.0% |
| Guatemala | 502 | 0.4% |
| Haiti | 84 | 0.1% |
| Honduras | 180 | 0.1% |
| Hong Kong | 109 | 0.1% |
| India | 1,110 | 0.8% |
| Indonesia | 142 | 0.1% |
| Iran | 384 | 0.3% |
| Iraq | 46 | 0.0% |
| Israel | 7 | 0.0% |
| Italy | 4 | 0.0% |
| Jamaica | 6 | 0.0% |
| Japan | 174 | 0.1% |
| Jordan | 55 | 0.0% |
| Kenya | 982 | 0.7% |
| Korea | 215 | 0.2% |
| Kuwait | 51 | 0.0% |
| Laos | 161 | 0.1% |
| Latin America | 6,333 | 4.5% |
| Lebanon | 60 | 0.0% |
| Liberia | 7 | 0.0% |
| Malaysia | 12 | 0.0% |
| Mexico | 4,263 | 3.0% |
| Micronesia | 3 | 0.0% |
| Middle Africa | 45 | 0.0% |
| Moldova | 56 | 0.0% |
| Nepal | 19 | 0.0% |
| Netherlands | 18 | 0.0% |
| Nicaragua | 124 | 0.1% |
| Nigeria | 110 | 0.1% |
| Northern Africa | 352 | 0.3% |
| Northern Europe | 264 | 0.2% |
| Oceania | 48 | 0.0% |
| Pakistan | 70 | 0.1% |
| Panama | 50 | 0.0% |
| Peru | 59 | 0.0% |
| Philippines | 211 | 0.2% |
| Poland | 6 | 0.0% |
| Russia | 186 | 0.1% |
| Saudi Arabia | 22 | 0.0% |
| Scotland | 14 | 0.0% |
| Sierra Leone | 70 | 0.1% |
| South Africa | 34 | 0.0% |
| South America | 925 | 0.6% |
| South Central Asia | 1,674 | 1.2% |
| South Eastern Asia | 1,474 | 1.0% |
| Southern Europe | 46 | 0.0% |
| Spain | 18 | 0.0% |
| Syria | 18 | 0.0% |
| Taiwan | 176 | 0.1% |
| Thailand | 95 | 0.1% |
| Turkey | 9 | 0.0% |
| Ukraine | 216 | 0.2% |
| Uruguay | 23 | 0.0% |
| Uzbekistan | 76 | 0.1% |
| Venezuela | 75 | 0.1% |
| Vietnam | 817 | 0.6% |
| Western Africa | 269 | 0.2% |
| Western Asia | 276 | 0.2% |
| Western Europe | 183 | 0.1% | View All 92 Rows |
Sex and Age in Olathe
Sex and Age in Olathe
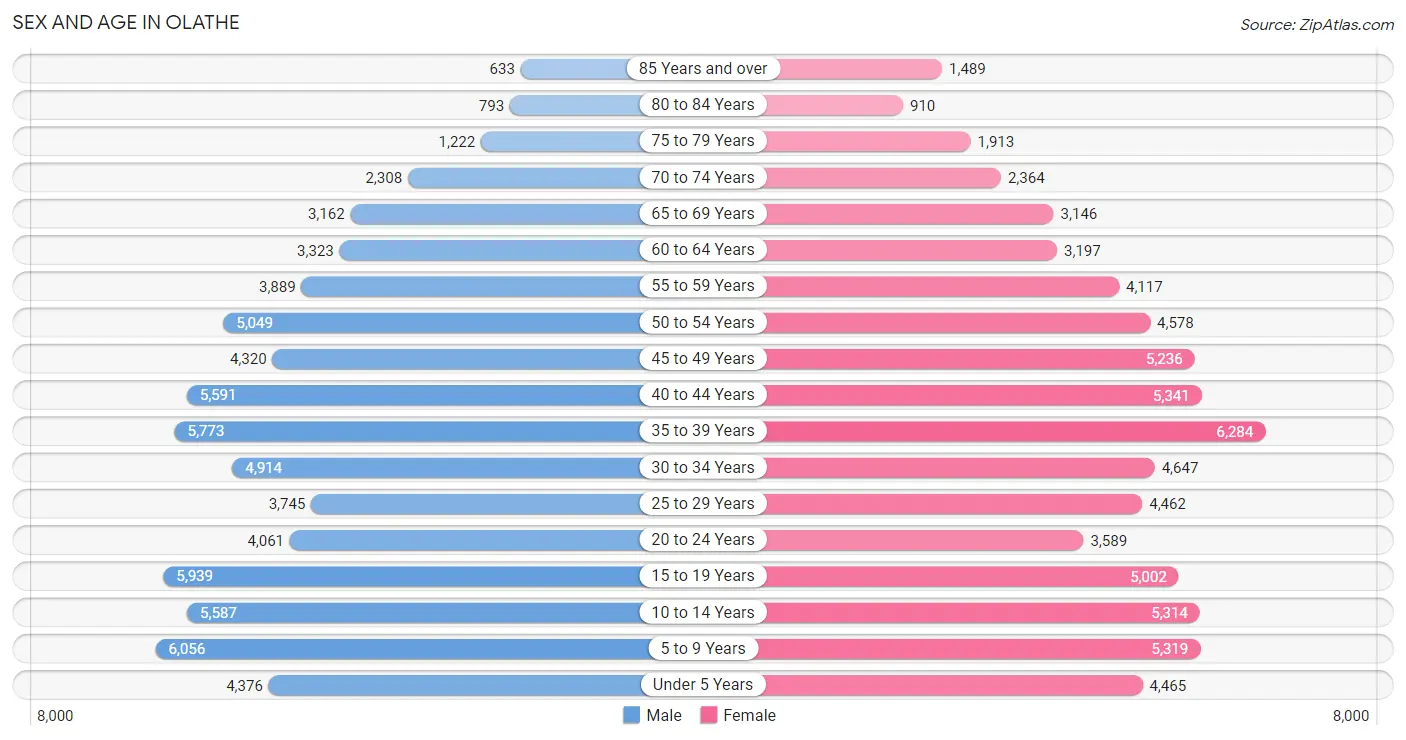
The most populous age groups in Olathe are 5 to 9 Years (6,056 | 8.6%) for men and 35 to 39 Years (6,284 | 8.8%) for women.
| Age Bracket | Male | Female |
| Under 5 Years | 4,376 (6.2%) | 4,465 (6.3%) |
| 5 to 9 Years | 6,056 (8.6%) | 5,319 (7.4%) |
| 10 to 14 Years | 5,587 (7.9%) | 5,314 (7.4%) |
| 15 to 19 Years | 5,939 (8.4%) | 5,002 (7.0%) |
| 20 to 24 Years | 4,061 (5.7%) | 3,589 (5.0%) |
| 25 to 29 Years | 3,745 (5.3%) | 4,462 (6.2%) |
| 30 to 34 Years | 4,914 (7.0%) | 4,647 (6.5%) |
| 35 to 39 Years | 5,773 (8.2%) | 6,284 (8.8%) |
| 40 to 44 Years | 5,591 (7.9%) | 5,341 (7.5%) |
| 45 to 49 Years | 4,320 (6.1%) | 5,236 (7.3%) |
| 50 to 54 Years | 5,049 (7.1%) | 4,578 (6.4%) |
| 55 to 59 Years | 3,889 (5.5%) | 4,117 (5.8%) |
| 60 to 64 Years | 3,323 (4.7%) | 3,197 (4.5%) |
| 65 to 69 Years | 3,162 (4.5%) | 3,146 (4.4%) |
| 70 to 74 Years | 2,308 (3.3%) | 2,364 (3.3%) |
| 75 to 79 Years | 1,222 (1.7%) | 1,913 (2.7%) |
| 80 to 84 Years | 793 (1.1%) | 910 (1.3%) |
| 85 Years and over | 633 (0.9%) | 1,489 (2.1%) |
| Total | 70,741 (100.0%) | 71,373 (100.0%) |
Families and Households in Olathe
Median Family Size in Olathe
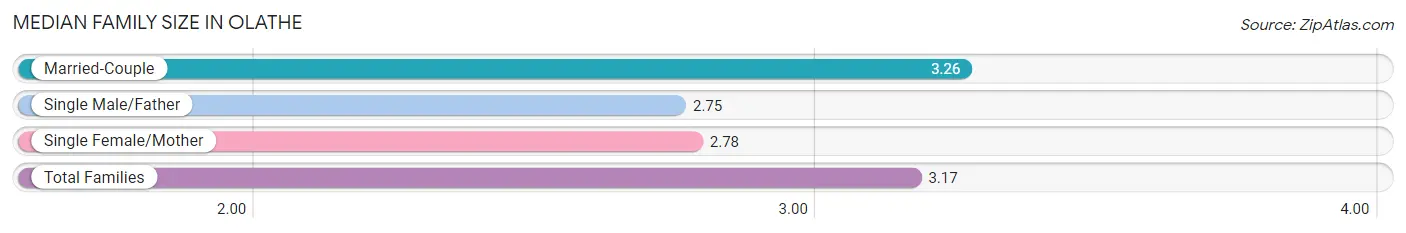
The median family size in Olathe is 3.17 persons per family, with married-couple families (30,516 | 80.4%) accounting for the largest median family size of 3.26 persons per family. On the other hand, single male/father families (2,317 | 6.1%) represent the smallest median family size with 2.75 persons per family.
| Family Type | # Families | Family Size |
| Married-Couple | 30,516 (80.4%) | 3.26 |
| Single Male/Father | 2,317 (6.1%) | 2.75 |
| Single Female/Mother | 5,128 (13.5%) | 2.78 |
| Total Families | 37,961 (100.0%) | 3.17 |
Median Household Size in Olathe
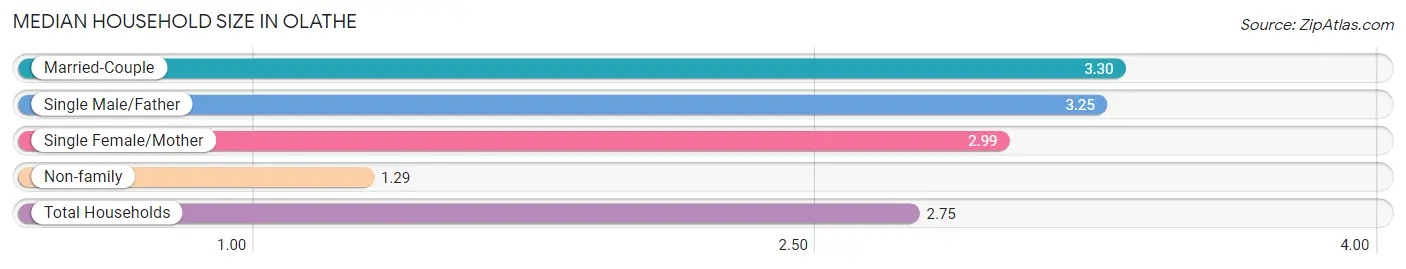
The median household size in Olathe is 2.75 persons per household, with married-couple households (30,516 | 59.8%) accounting for the largest median household size of 3.3 persons per household. non-family households (13,060 | 25.6%) represent the smallest median household size with 1.29 persons per household.
| Household Type | # Households | Household Size |
| Married-Couple | 30,516 (59.8%) | 3.30 |
| Single Male/Father | 2,317 (4.5%) | 3.25 |
| Single Female/Mother | 5,128 (10.1%) | 2.99 |
| Non-family | 13,060 (25.6%) | 1.29 |
| Total Households | 51,021 (100.0%) | 2.75 |
Household Size by Marriage Status in Olathe
Out of a total of 51,021 households in Olathe, 37,961 (74.4%) are family households, while 13,060 (25.6%) are nonfamily households. The most numerous type of family households are 2-person households, comprising 14,862, and the most common type of nonfamily households are 1-person households, comprising 10,134.
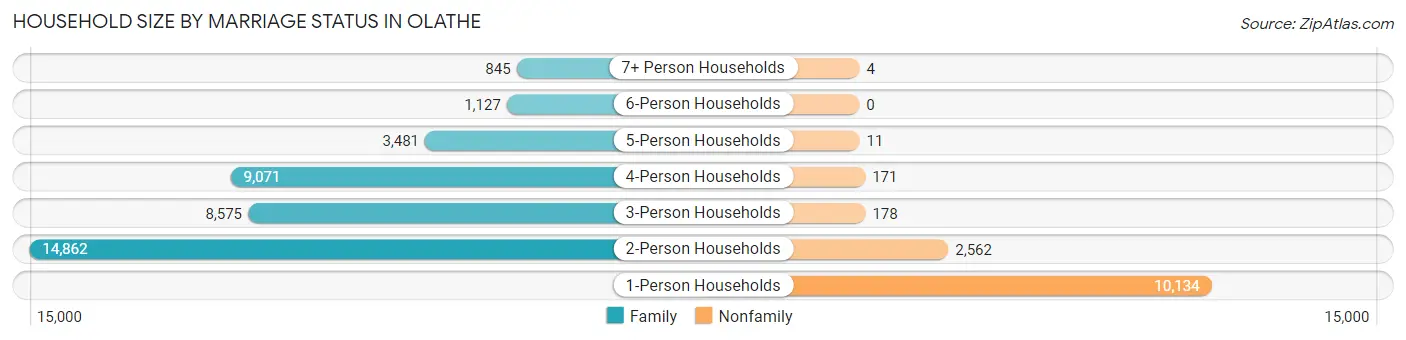
| Household Size | Family Households | Nonfamily Households |
| 1-Person Households | - | 10,134 (19.9%) |
| 2-Person Households | 14,862 (29.1%) | 2,562 (5.0%) |
| 3-Person Households | 8,575 (16.8%) | 178 (0.4%) |
| 4-Person Households | 9,071 (17.8%) | 171 (0.3%) |
| 5-Person Households | 3,481 (6.8%) | 11 (0.0%) |
| 6-Person Households | 1,127 (2.2%) | 0 (0.0%) |
| 7+ Person Households | 845 (1.7%) | 4 (0.0%) |
| Total | 37,961 (74.4%) | 13,060 (25.6%) |
Female Fertility in Olathe
Fertility by Age in Olathe
Average fertility rate in Olathe is 48.0 births per 1,000 women. Women in the age bracket of 20 to 34 years have the highest fertility rate with 96.0 births per 1,000 women. Women in the age bracket of 20 to 34 years acount for 71.0% of all women with births.
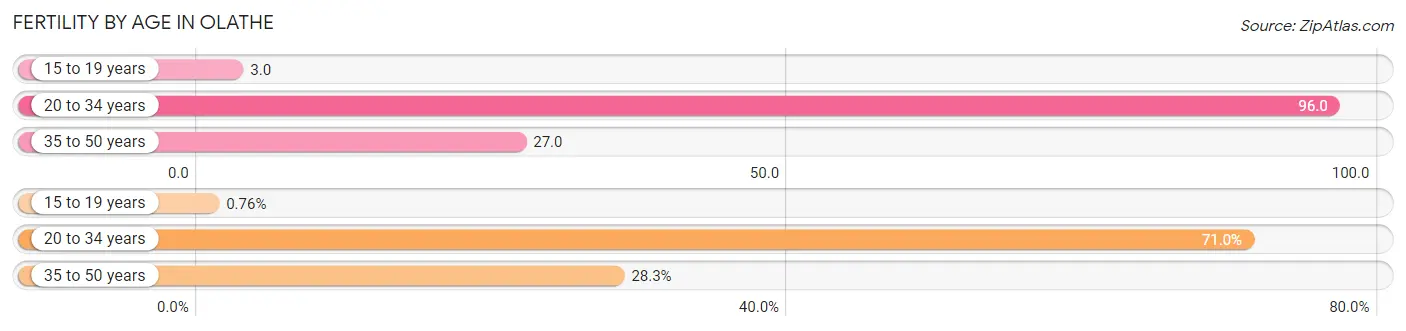
| Age Bracket | Women with Births | Births / 1,000 Women |
| 15 to 19 years | 13 (0.8%) | 3.0 |
| 20 to 34 years | 1,213 (71.0%) | 96.0 |
| 35 to 50 years | 483 (28.3%) | 27.0 |
| Total | 1,709 (100.0%) | 48.0 |
Fertility by Age by Marriage Status in Olathe
84.6% of women with births (1,709) in Olathe are married. The highest percentage of unmarried women with births falls into 15 to 19 years age bracket with 100.0% of them unmarried at the time of birth, while the lowest percentage of unmarried women with births belong to 35 to 50 years age bracket with 11.0% of them unmarried.
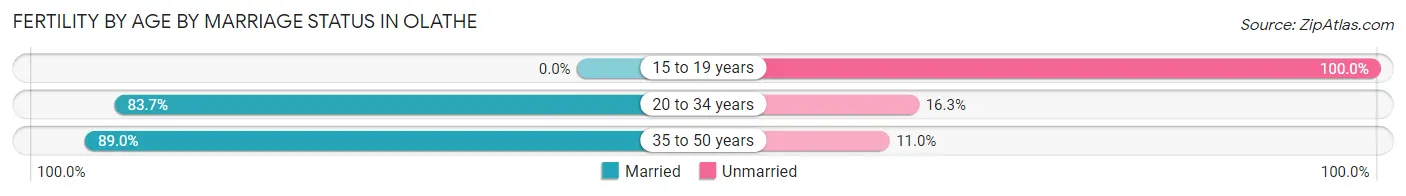
| Age Bracket | Married | Unmarried |
| 15 to 19 years | 0 (0.0%) | 13 (100.0%) |
| 20 to 34 years | 1,015 (83.7%) | 198 (16.3%) |
| 35 to 50 years | 430 (89.0%) | 53 (11.0%) |
| Total | 1,446 (84.6%) | 263 (15.4%) |
Fertility by Education in Olathe
Average fertility rate in Olathe is 48.0 births per 1,000 women. Women with the education attainment of bachelor's degree have the highest fertility rate of 64.0 births per 1,000 women, while women with the education attainment of less than high school have the lowest fertility at 15.0 births per 1,000 women. Women with the education attainment of bachelor's degree represent 38.2% of all women with births.
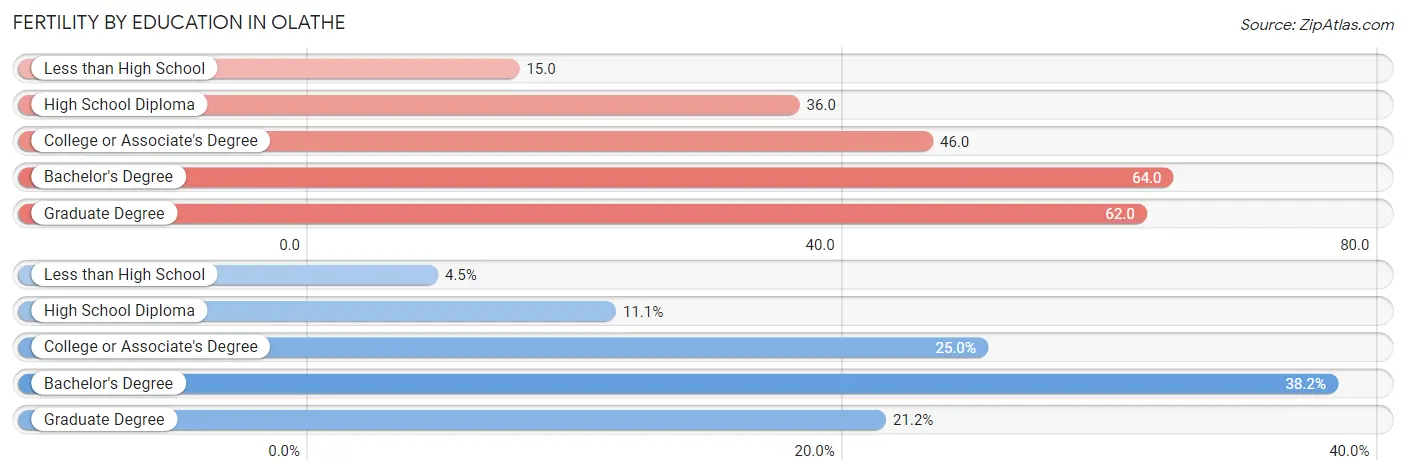
| Educational Attainment | Women with Births | Births / 1,000 Women |
| Less than High School | 76 (4.4%) | 15.0 |
| High School Diploma | 190 (11.1%) | 36.0 |
| College or Associate's Degree | 428 (25.0%) | 46.0 |
| Bachelor's Degree | 652 (38.2%) | 64.0 |
| Graduate Degree | 363 (21.2%) | 62.0 |
| Total | 1,709 (100.0%) | 48.0 |
Fertility by Education by Marriage Status in Olathe
15.4% of women with births in Olathe are unmarried. Women with the educational attainment of bachelor's degree are most likely to be married with 97.9% of them married at childbirth, while women with the educational attainment of less than high school are least likely to be married with 53.9% of them unmarried at childbirth.
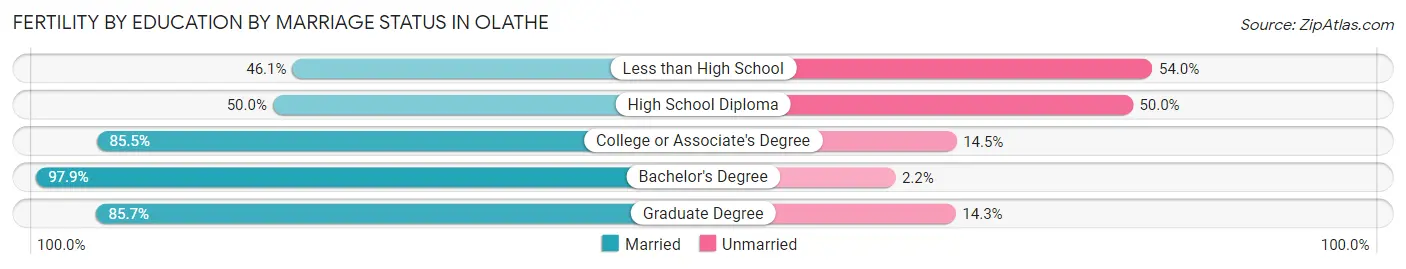
| Educational Attainment | Married | Unmarried |
| Less than High School | 35 (46.1%) | 41 (53.9%) |
| High School Diploma | 95 (50.0%) | 95 (50.0%) |
| College or Associate's Degree | 366 (85.5%) | 62 (14.5%) |
| Bachelor's Degree | 638 (97.9%) | 14 (2.1%) |
| Graduate Degree | 311 (85.7%) | 52 (14.3%) |
| Total | 1,446 (84.6%) | 263 (15.4%) |
Employment Characteristics in Olathe
Employment by Class of Employer in Olathe
Among the 75,926 employed individuals in Olathe, private company employees (54,046 | 71.2%), local government employees (5,775 | 7.6%), and not-for-profit organizations (5,726 | 7.5%) make up the most common classes of employment.
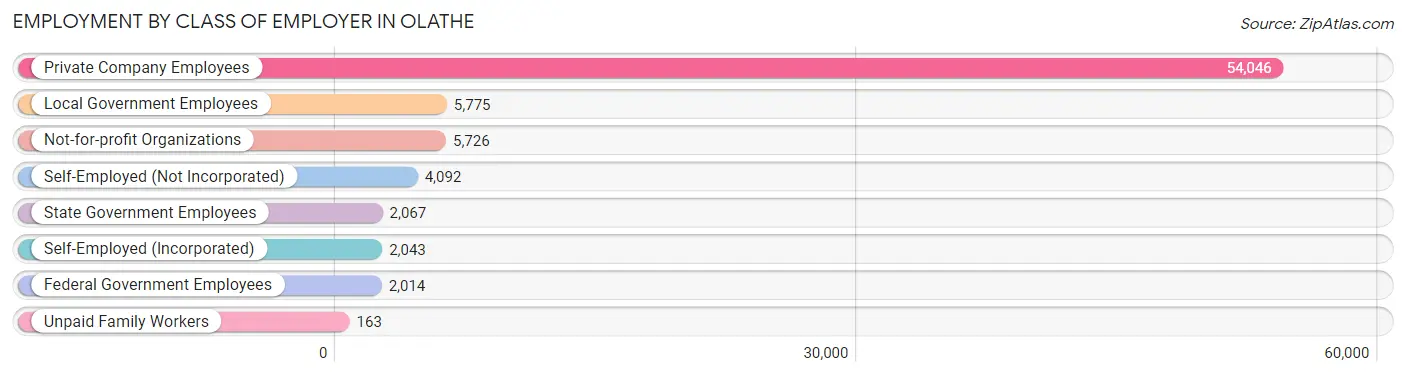
| Employer Class | # Employees | % Employees |
| Private Company Employees | 54,046 | 71.2% |
| Self-Employed (Incorporated) | 2,043 | 2.7% |
| Self-Employed (Not Incorporated) | 4,092 | 5.4% |
| Not-for-profit Organizations | 5,726 | 7.5% |
| Local Government Employees | 5,775 | 7.6% |
| State Government Employees | 2,067 | 2.7% |
| Federal Government Employees | 2,014 | 2.6% |
| Unpaid Family Workers | 163 | 0.2% |
| Total | 75,926 | 100.0% |
Employment Status by Age in Olathe
According to the labor force statistics for Olathe, out of the total population over 16 years of age (108,879), 73.6% or 80,135 individuals are in the labor force, with 3.2% or 2,564 of them unemployed. The age group with the highest labor force participation rate is 35 to 44 years, with 90.6% or 20,828 individuals in the labor force. Within the labor force, the 16 to 19 years age range has the highest percentage of unemployed individuals, with 11.8% or 594 of them being unemployed.
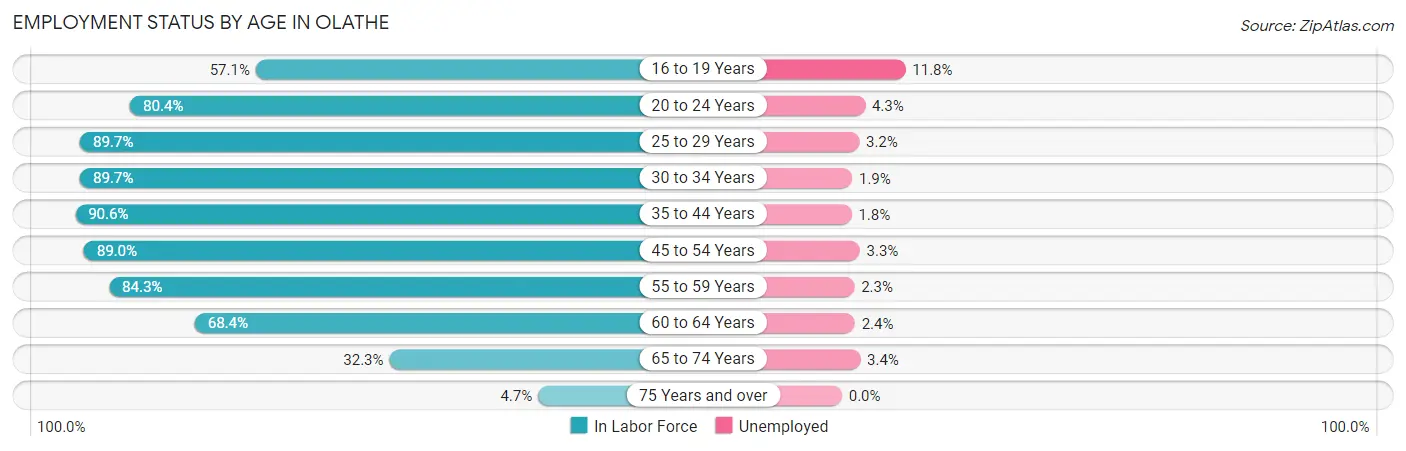
| Age Bracket | In Labor Force | Unemployed |
| 16 to 19 Years | 5,038 (57.1%) | 594 (11.8%) |
| 20 to 24 Years | 6,151 (80.4%) | 264 (4.3%) |
| 25 to 29 Years | 7,362 (89.7%) | 236 (3.2%) |
| 30 to 34 Years | 8,576 (89.7%) | 163 (1.9%) |
| 35 to 44 Years | 20,828 (90.6%) | 375 (1.8%) |
| 45 to 54 Years | 17,073 (89.0%) | 563 (3.3%) |
| 55 to 59 Years | 6,749 (84.3%) | 155 (2.3%) |
| 60 to 64 Years | 4,460 (68.4%) | 107 (2.4%) |
| 65 to 74 Years | 3,547 (32.3%) | 121 (3.4%) |
| 75 Years and over | 327 (4.7%) | 0 (0.0%) |
| Total | 80,135 (73.6%) | 2,564 (3.2%) |
Employment Status by Educational Attainment in Olathe
According to labor force statistics for Olathe, 87.3% of individuals (65,009) out of the total population between 25 and 64 years of age (74,466) are in the labor force, with 2.5% or 1,625 of them being unemployed. The group with the highest labor force participation rate are those with the educational attainment of bachelor's degree or higher, with 90.3% or 35,499 individuals in the labor force. Within the labor force, individuals with less than high school education have the highest percentage of unemployment, with 8.0% or 256 of them being unemployed.
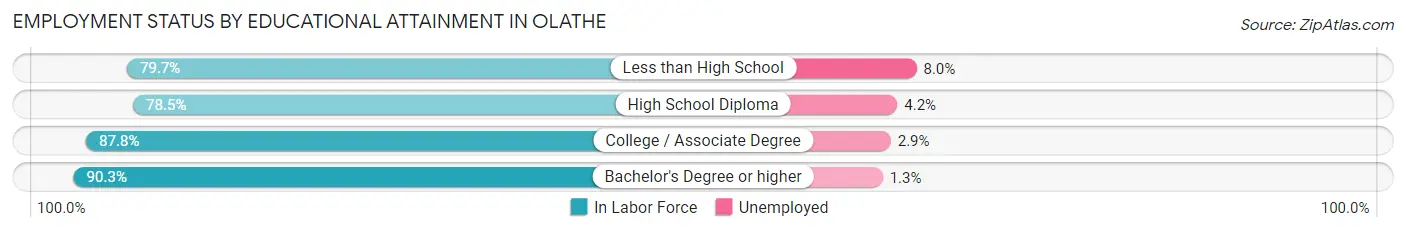
| Educational Attainment | In Labor Force | Unemployed |
| Less than High School | 3,199 (79.7%) | 321 (8.0%) |
| High School Diploma | 8,350 (78.5%) | 447 (4.2%) |
| College / Associate Degree | 18,002 (87.8%) | 595 (2.9%) |
| Bachelor's Degree or higher | 35,499 (90.3%) | 511 (1.3%) |
| Total | 65,009 (87.3%) | 1,862 (2.5%) |
Employment Occupations by Sex in Olathe
Management, Business, Science and Arts Occupations
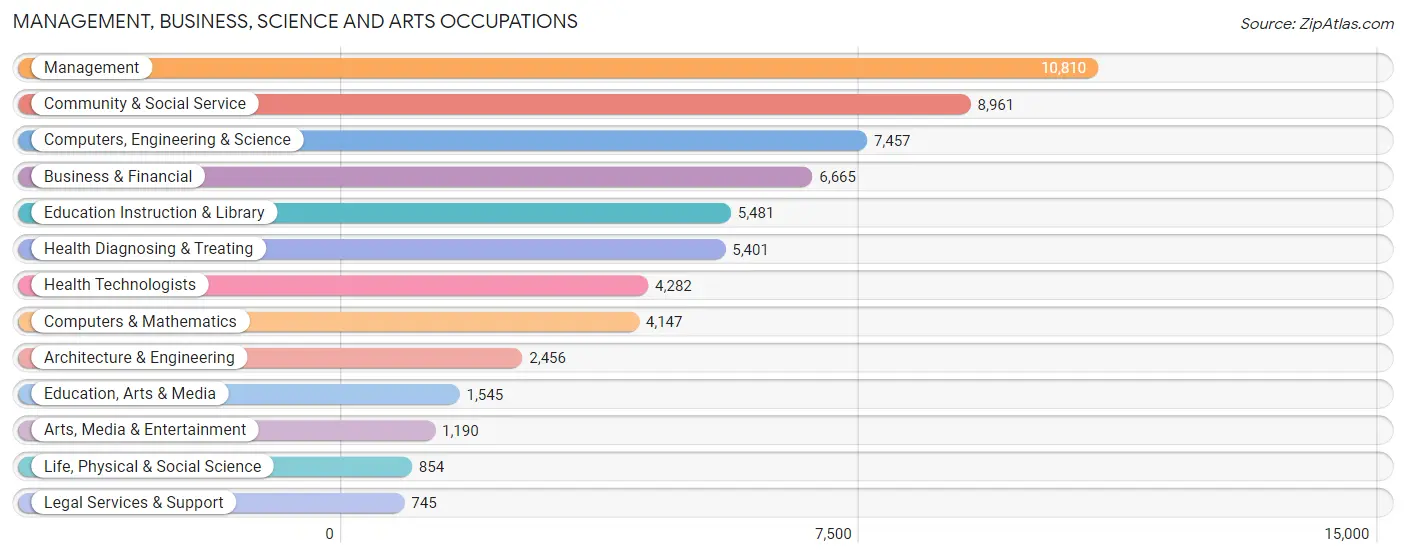
The most common Management, Business, Science and Arts occupations in Olathe are Management (10,810 | 14.0%), Community & Social Service (8,961 | 11.6%), Computers, Engineering & Science (7,457 | 9.7%), Business & Financial (6,665 | 8.6%), and Education Instruction & Library (5,481 | 7.1%).
Management, Business, Science and Arts Occupations by Sex
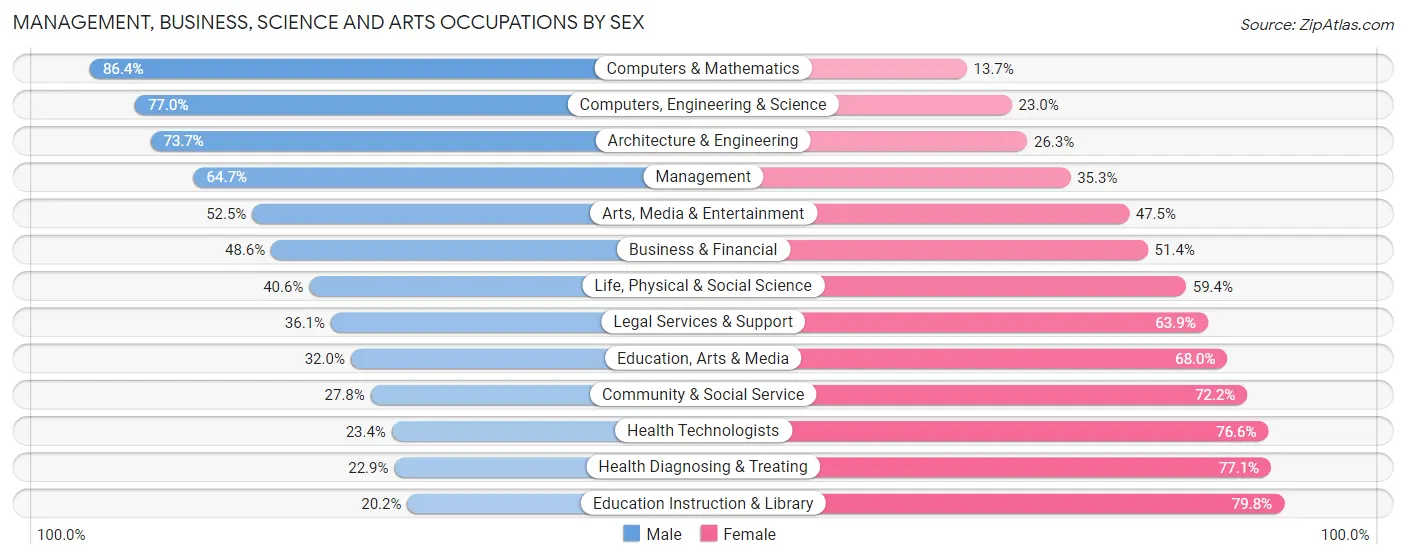
Within the Management, Business, Science and Arts occupations in Olathe, the most male-oriented occupations are Computers & Mathematics (86.4%), Computers, Engineering & Science (77.0%), and Architecture & Engineering (73.7%), while the most female-oriented occupations are Education Instruction & Library (79.8%), Health Diagnosing & Treating (77.1%), and Health Technologists (76.6%).
| Occupation | Male | Female |
| Management | 6,997 (64.7%) | 3,813 (35.3%) |
| Business & Financial | 3,238 (48.6%) | 3,427 (51.4%) |
| Computers, Engineering & Science | 5,739 (77.0%) | 1,718 (23.0%) |
| Computers & Mathematics | 3,581 (86.4%) | 566 (13.7%) |
| Architecture & Engineering | 1,811 (73.7%) | 645 (26.3%) |
| Life, Physical & Social Science | 347 (40.6%) | 507 (59.4%) |
| Community & Social Service | 2,493 (27.8%) | 6,468 (72.2%) |
| Education, Arts & Media | 494 (32.0%) | 1,051 (68.0%) |
| Legal Services & Support | 269 (36.1%) | 476 (63.9%) |
| Education Instruction & Library | 1,105 (20.2%) | 4,376 (79.8%) |
| Arts, Media & Entertainment | 625 (52.5%) | 565 (47.5%) |
| Health Diagnosing & Treating | 1,236 (22.9%) | 4,165 (77.1%) |
| Health Technologists | 1,003 (23.4%) | 3,279 (76.6%) |
| Total (Category) | 19,703 (50.1%) | 19,591 (49.9%) |
| Total (Overall) | 40,544 (52.5%) | 36,643 (47.5%) |
Services Occupations
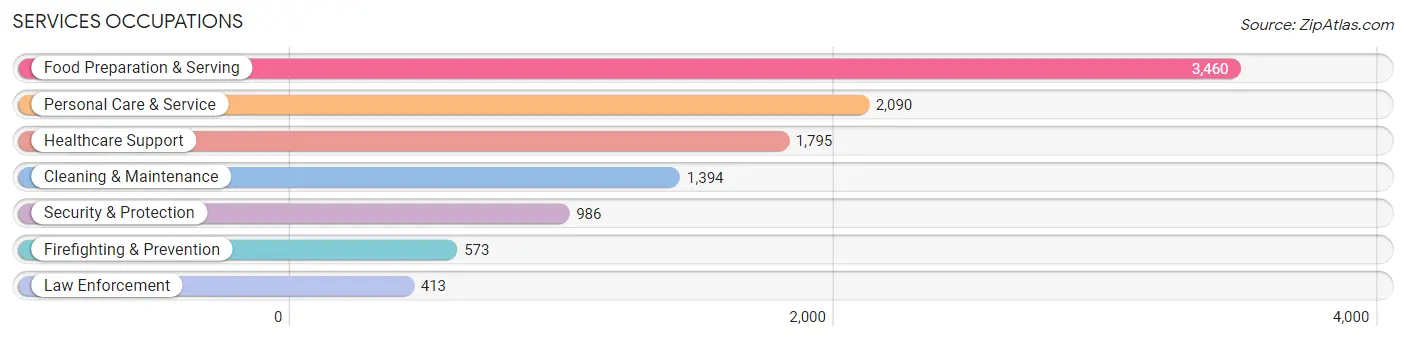
The most common Services occupations in Olathe are Food Preparation & Serving (3,460 | 4.5%), Personal Care & Service (2,090 | 2.7%), Healthcare Support (1,795 | 2.3%), Cleaning & Maintenance (1,394 | 1.8%), and Security & Protection (986 | 1.3%).
Services Occupations by Sex
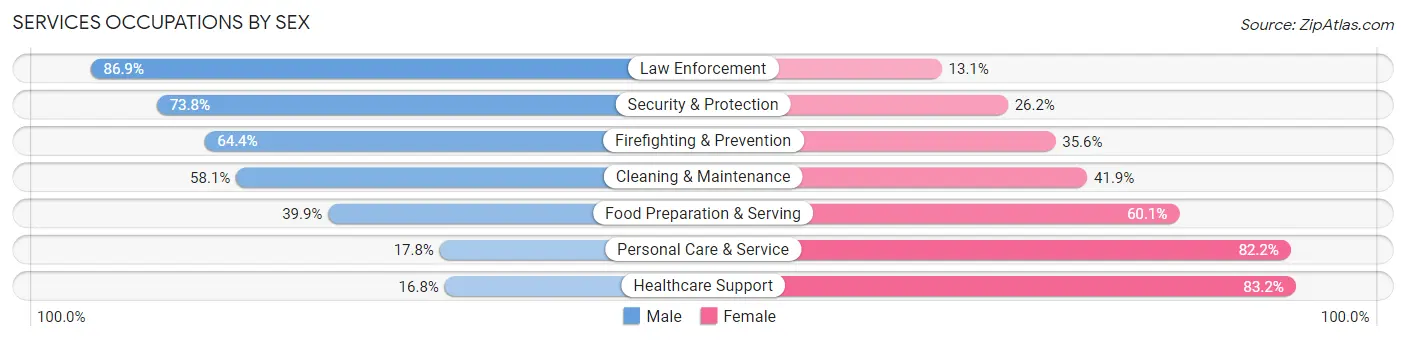
Within the Services occupations in Olathe, the most male-oriented occupations are Law Enforcement (86.9%), Security & Protection (73.8%), and Firefighting & Prevention (64.4%), while the most female-oriented occupations are Healthcare Support (83.2%), Personal Care & Service (82.2%), and Food Preparation & Serving (60.1%).
| Occupation | Male | Female |
| Healthcare Support | 302 (16.8%) | 1,493 (83.2%) |
| Security & Protection | 728 (73.8%) | 258 (26.2%) |
| Firefighting & Prevention | 369 (64.4%) | 204 (35.6%) |
| Law Enforcement | 359 (86.9%) | 54 (13.1%) |
| Food Preparation & Serving | 1,380 (39.9%) | 2,080 (60.1%) |
| Cleaning & Maintenance | 810 (58.1%) | 584 (41.9%) |
| Personal Care & Service | 372 (17.8%) | 1,718 (82.2%) |
| Total (Category) | 3,592 (36.9%) | 6,133 (63.1%) |
| Total (Overall) | 40,544 (52.5%) | 36,643 (47.5%) |
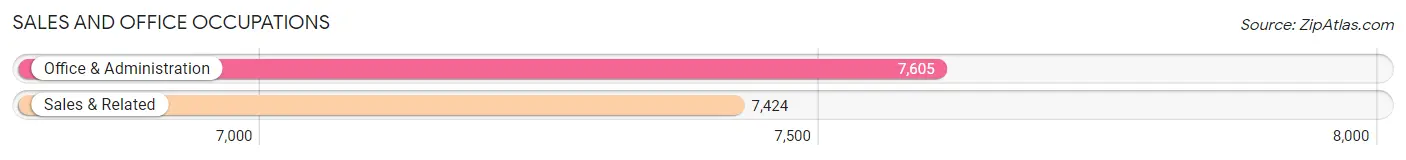
Sales and Office Occupations
The most common Sales and Office occupations in Olathe are Office & Administration (7,605 | 9.9%), and Sales & Related (7,424 | 9.6%).
Sales and Office Occupations by Sex
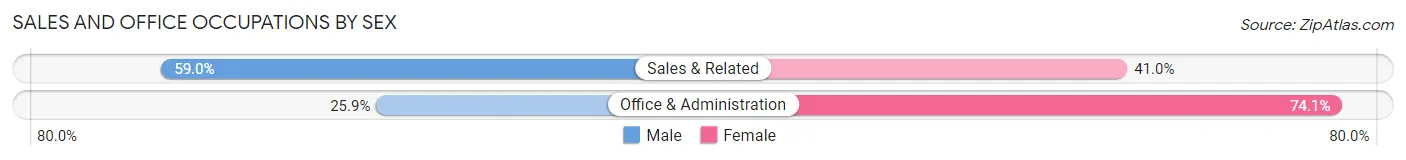
| Occupation | Male | Female |
| Sales & Related | 4,377 (59.0%) | 3,047 (41.0%) |
| Office & Administration | 1,970 (25.9%) | 5,635 (74.1%) |
| Total (Category) | 6,347 (42.2%) | 8,682 (57.8%) |
| Total (Overall) | 40,544 (52.5%) | 36,643 (47.5%) |
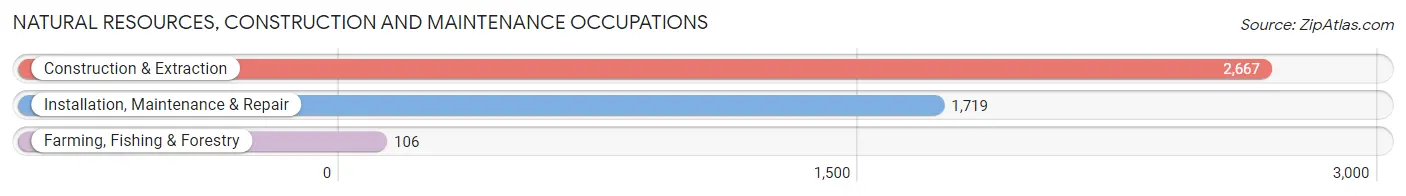
Natural Resources, Construction and Maintenance Occupations
The most common Natural Resources, Construction and Maintenance occupations in Olathe are Construction & Extraction (2,667 | 3.5%), Installation, Maintenance & Repair (1,719 | 2.2%), and Farming, Fishing & Forestry (106 | 0.1%).
Natural Resources, Construction and Maintenance Occupations by Sex
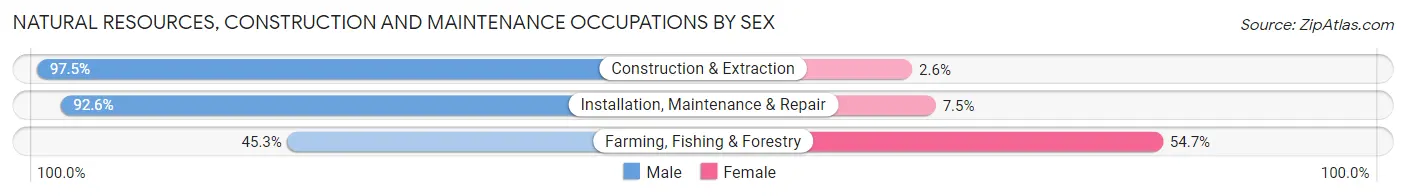
| Occupation | Male | Female |
| Farming, Fishing & Forestry | 48 (45.3%) | 58 (54.7%) |
| Construction & Extraction | 2,599 (97.5%) | 68 (2.5%) |
| Installation, Maintenance & Repair | 1,591 (92.5%) | 128 (7.4%) |
| Total (Category) | 4,238 (94.4%) | 254 (5.7%) |
| Total (Overall) | 40,544 (52.5%) | 36,643 (47.5%) |
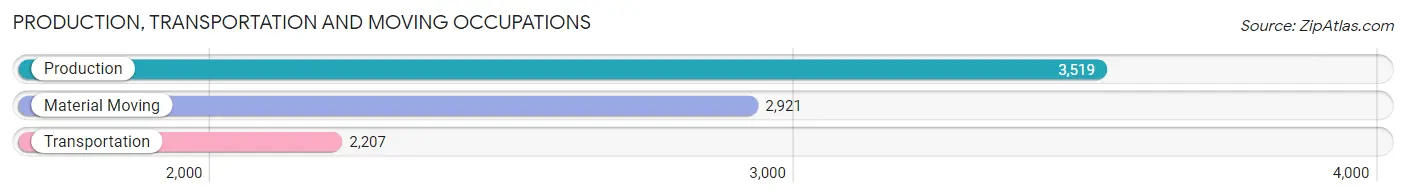
Production, Transportation and Moving Occupations
The most common Production, Transportation and Moving occupations in Olathe are Production (3,519 | 4.6%), Material Moving (2,921 | 3.8%), and Transportation (2,207 | 2.9%).
Production, Transportation and Moving Occupations by Sex
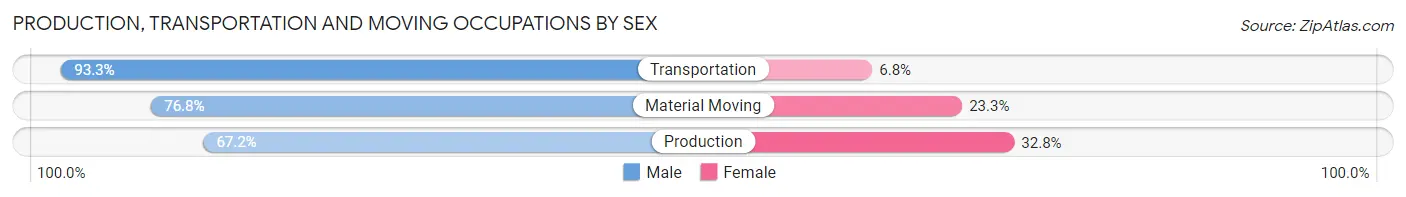
| Occupation | Male | Female |
| Production | 2,364 (67.2%) | 1,155 (32.8%) |
| Transportation | 2,058 (93.2%) | 149 (6.8%) |
| Material Moving | 2,242 (76.7%) | 679 (23.3%) |
| Total (Category) | 6,664 (77.1%) | 1,983 (22.9%) |
| Total (Overall) | 40,544 (52.5%) | 36,643 (47.5%) |
Employment Industries by Sex in Olathe
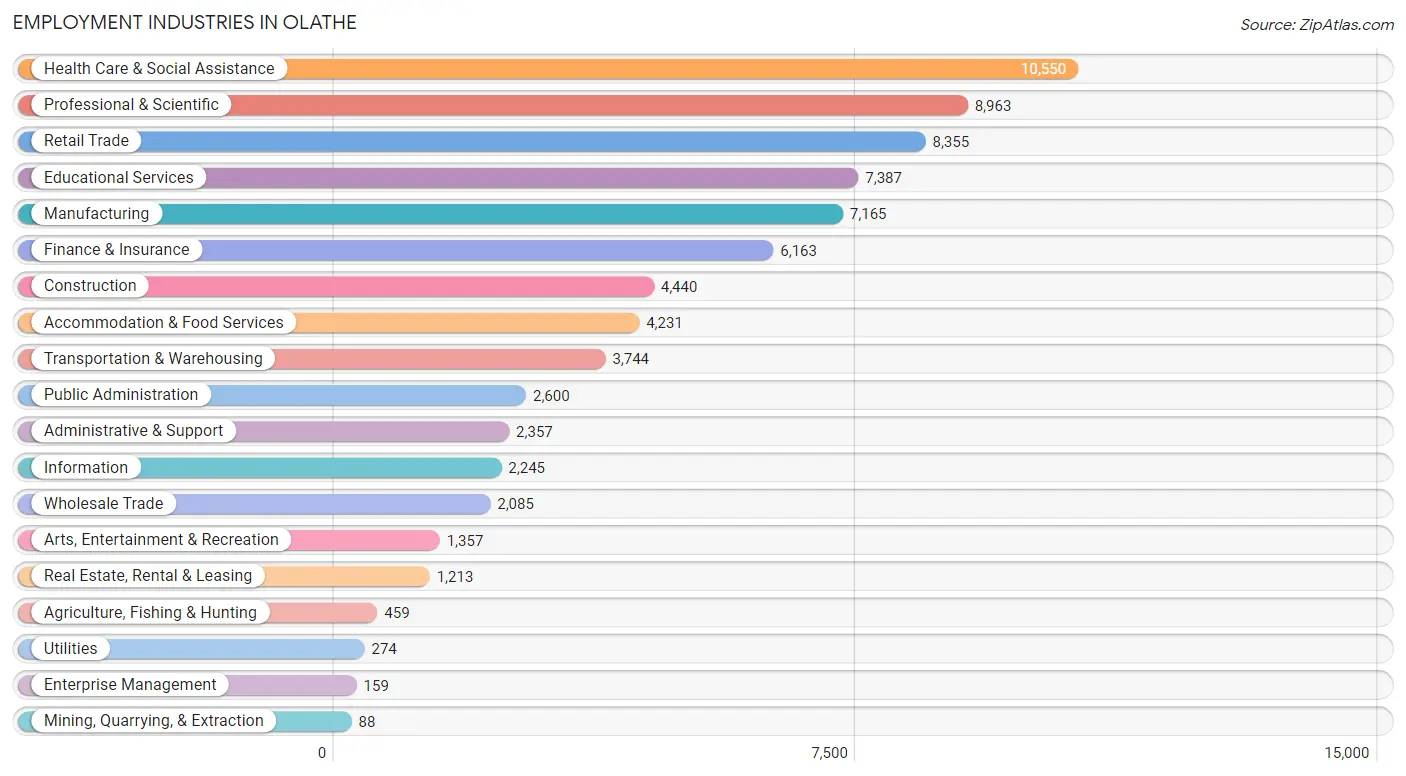
Employment Industries in Olathe
The major employment industries in Olathe include Health Care & Social Assistance (10,550 | 13.7%), Professional & Scientific (8,963 | 11.6%), Retail Trade (8,355 | 10.8%), Educational Services (7,387 | 9.6%), and Manufacturing (7,165 | 9.3%).
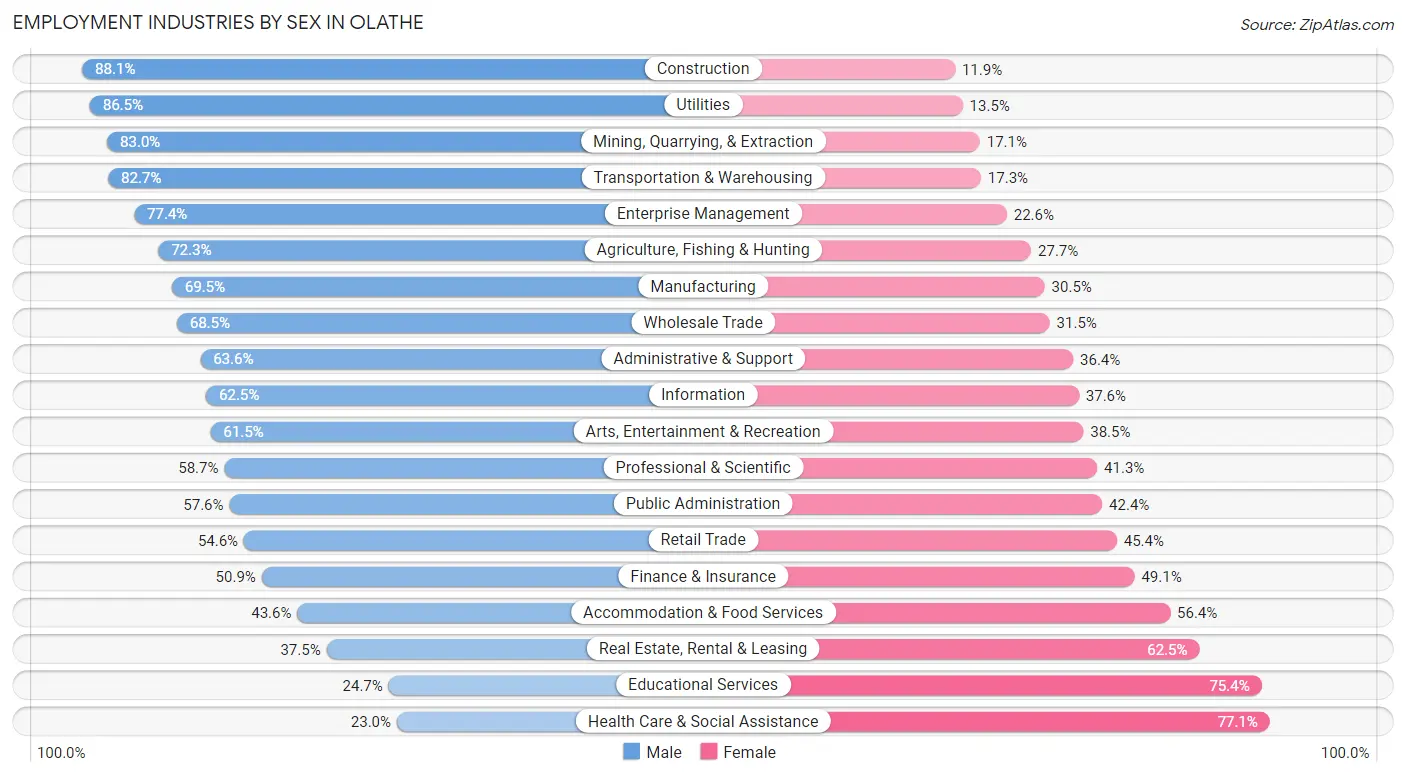
Employment Industries by Sex in Olathe
The Olathe industries that see more men than women are Construction (88.1%), Utilities (86.5%), and Mining, Quarrying, & Extraction (83.0%), whereas the industries that tend to have a higher number of women are Health Care & Social Assistance (77.0%), Educational Services (75.3%), and Real Estate, Rental & Leasing (62.5%).
| Industry | Male | Female |
| Agriculture, Fishing & Hunting | 332 (72.3%) | 127 (27.7%) |
| Mining, Quarrying, & Extraction | 73 (83.0%) | 15 (17.1%) |
| Construction | 3,911 (88.1%) | 529 (11.9%) |
| Manufacturing | 4,981 (69.5%) | 2,184 (30.5%) |
| Wholesale Trade | 1,428 (68.5%) | 657 (31.5%) |
| Retail Trade | 4,562 (54.6%) | 3,793 (45.4%) |
| Transportation & Warehousing | 3,097 (82.7%) | 647 (17.3%) |
| Utilities | 237 (86.5%) | 37 (13.5%) |
| Information | 1,402 (62.5%) | 843 (37.6%) |
| Finance & Insurance | 3,139 (50.9%) | 3,024 (49.1%) |
| Real Estate, Rental & Leasing | 455 (37.5%) | 758 (62.5%) |
| Professional & Scientific | 5,258 (58.7%) | 3,705 (41.3%) |
| Enterprise Management | 123 (77.4%) | 36 (22.6%) |
| Administrative & Support | 1,500 (63.6%) | 857 (36.4%) |
| Educational Services | 1,821 (24.6%) | 5,566 (75.3%) |
| Health Care & Social Assistance | 2,421 (23.0%) | 8,129 (77.0%) |
| Arts, Entertainment & Recreation | 835 (61.5%) | 522 (38.5%) |
| Accommodation & Food Services | 1,843 (43.6%) | 2,388 (56.4%) |
| Public Administration | 1,498 (57.6%) | 1,102 (42.4%) |
| Total | 40,544 (52.5%) | 36,643 (47.5%) |
Education in Olathe
School Enrollment in Olathe
The most common levels of schooling among the 39,262 students in Olathe are high school (9,152 | 23.3%), middle school (8,641 | 22.0%), and elementary school (8,418 | 21.4%).
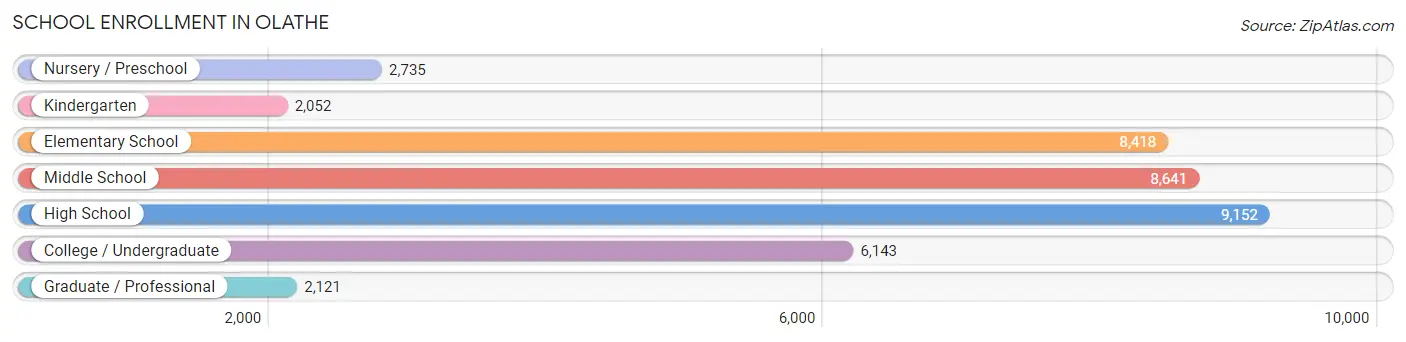
| School Level | # Students | % Students |
| Nursery / Preschool | 2,735 | 7.0% |
| Kindergarten | 2,052 | 5.2% |
| Elementary School | 8,418 | 21.4% |
| Middle School | 8,641 | 22.0% |
| High School | 9,152 | 23.3% |
| College / Undergraduate | 6,143 | 15.7% |
| Graduate / Professional | 2,121 | 5.4% |
| Total | 39,262 | 100.0% |
School Enrollment by Age by Funding Source in Olathe
Out of a total of 39,262 students who are enrolled in schools in Olathe, 5,536 (14.1%) attend a private institution, while the remaining 33,726 (85.9%) are enrolled in public schools. The age group of 3 to 4 year olds has the highest likelihood of being enrolled in private schools, with 778 (45.2% in the age bracket) enrolled. Conversely, the age group of 10 to 14 year olds has the lowest likelihood of being enrolled in a private school, with 9,750 (92.2% in the age bracket) attending a public institution.
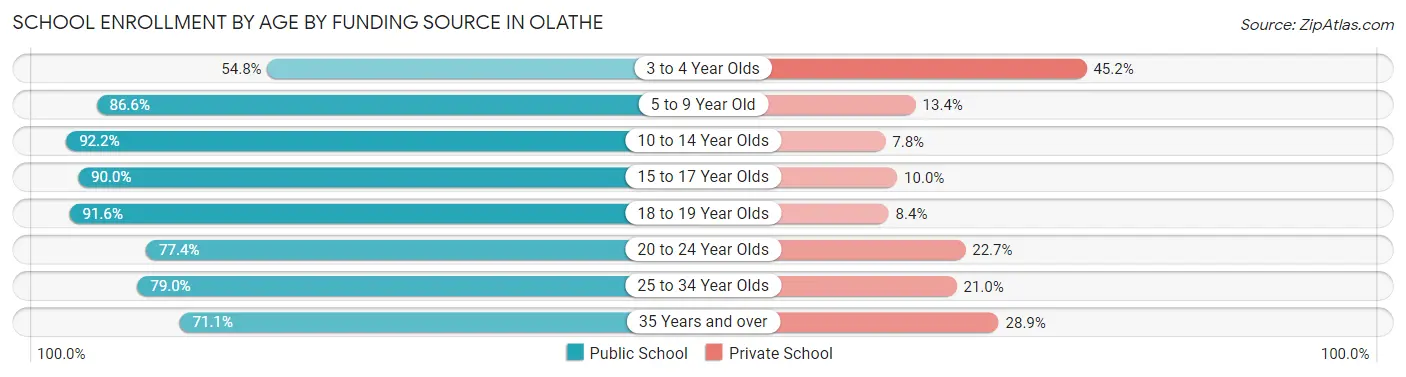
| Age Bracket | Public School | Private School |
| 3 to 4 Year Olds | 942 (54.8%) | 778 (45.2%) |
| 5 to 9 Year Old | 8,943 (86.6%) | 1,385 (13.4%) |
| 10 to 14 Year Olds | 9,750 (92.2%) | 820 (7.8%) |
| 15 to 17 Year Olds | 6,109 (90.0%) | 676 (10.0%) |
| 18 to 19 Year Olds | 3,041 (91.6%) | 278 (8.4%) |
| 20 to 24 Year Olds | 2,053 (77.3%) | 601 (22.7%) |
| 25 to 34 Year Olds | 1,304 (79.0%) | 347 (21.0%) |
| 35 Years and over | 1,590 (71.1%) | 645 (28.9%) |
| Total | 33,726 (85.9%) | 5,536 (14.1%) |
Educational Attainment by Field of Study in Olathe
Business (11,727 | 23.0%), education (6,608 | 12.9%), science & technology (5,299 | 10.4%), engineering (3,546 | 7.0%), and computers & mathematics (3,196 | 6.3%) are the most common fields of study among 51,051 individuals in Olathe who have obtained a bachelor's degree or higher.
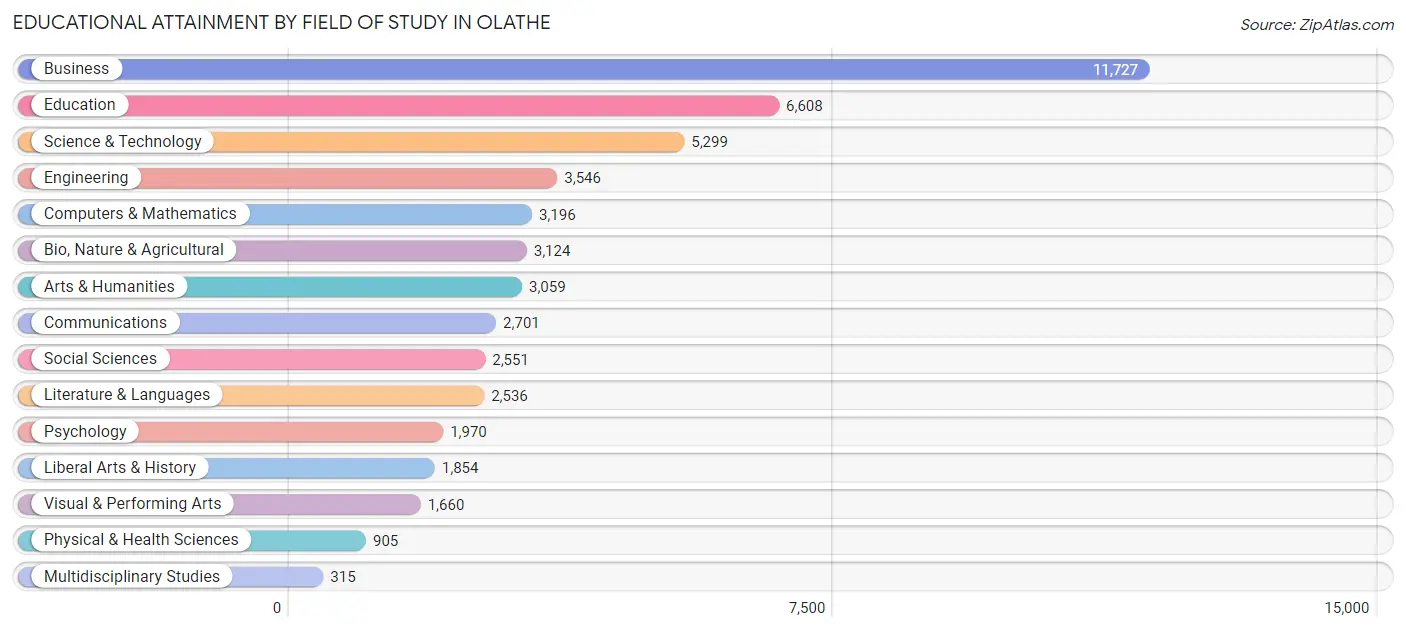
| Field of Study | # Graduates | % Graduates |
| Computers & Mathematics | 3,196 | 6.3% |
| Bio, Nature & Agricultural | 3,124 | 6.1% |
| Physical & Health Sciences | 905 | 1.8% |
| Psychology | 1,970 | 3.9% |
| Social Sciences | 2,551 | 5.0% |
| Engineering | 3,546 | 7.0% |
| Multidisciplinary Studies | 315 | 0.6% |
| Science & Technology | 5,299 | 10.4% |
| Business | 11,727 | 23.0% |
| Education | 6,608 | 12.9% |
| Literature & Languages | 2,536 | 5.0% |
| Liberal Arts & History | 1,854 | 3.6% |
| Visual & Performing Arts | 1,660 | 3.3% |
| Communications | 2,701 | 5.3% |
| Arts & Humanities | 3,059 | 6.0% |
| Total | 51,051 | 100.0% |
Transportation & Commute in Olathe
Vehicle Availability by Sex in Olathe
The most prevalent vehicle ownership categories in Olathe are males with 2 vehicles (20,432, accounting for 50.9%) and females with 2 vehicles (17,455, making up 57.8%).
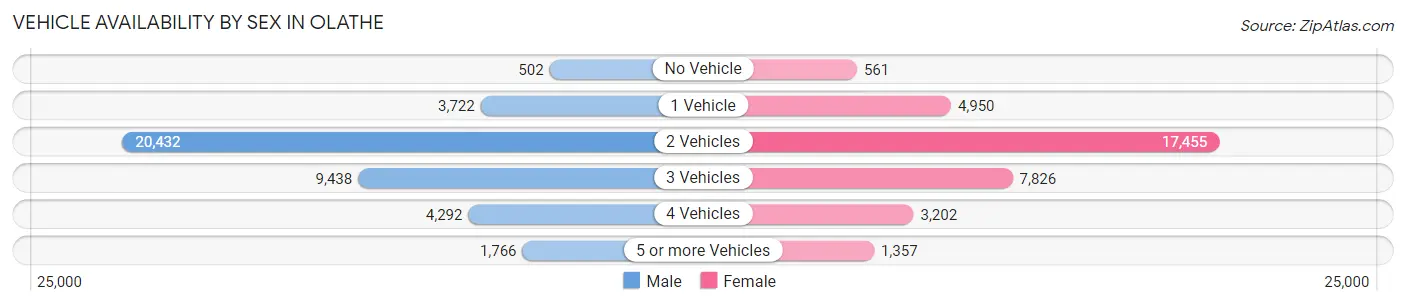
| Vehicles Available | Male | Female |
| No Vehicle | 502 (1.3%) | 561 (1.6%) |
| 1 Vehicle | 3,722 (9.3%) | 4,950 (14.0%) |
| 2 Vehicles | 20,432 (50.9%) | 17,455 (49.4%) |
| 3 Vehicles | 9,438 (23.5%) | 7,826 (22.1%) |
| 4 Vehicles | 4,292 (10.7%) | 3,202 (9.1%) |
| 5 or more Vehicles | 1,766 (4.4%) | 1,357 (3.8%) |
| Total | 40,152 (100.0%) | 35,351 (100.0%) |
Commute Time in Olathe
The most frequently occuring commute durations in Olathe are 15 to 19 minutes (13,307 commuters, 20.9%), 20 to 24 minutes (11,768 commuters, 18.5%), and 10 to 14 minutes (9,844 commuters, 15.5%).
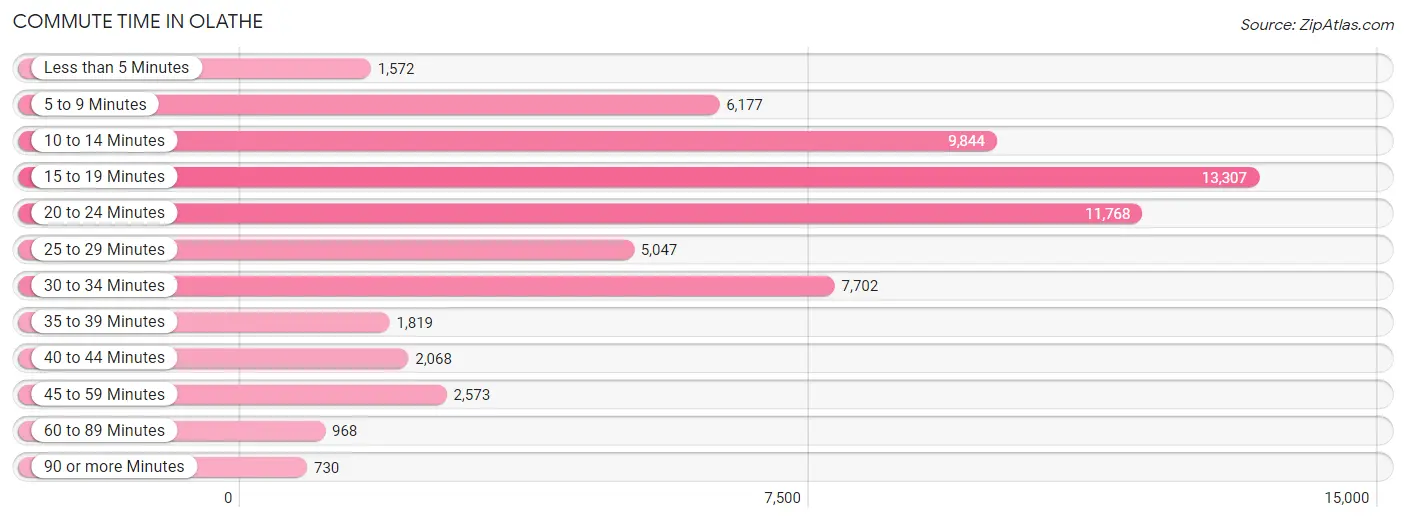
| Commute Time | # Commuters | % Commuters |
| Less than 5 Minutes | 1,572 | 2.5% |
| 5 to 9 Minutes | 6,177 | 9.7% |
| 10 to 14 Minutes | 9,844 | 15.5% |
| 15 to 19 Minutes | 13,307 | 20.9% |
| 20 to 24 Minutes | 11,768 | 18.5% |
| 25 to 29 Minutes | 5,047 | 7.9% |
| 30 to 34 Minutes | 7,702 | 12.1% |
| 35 to 39 Minutes | 1,819 | 2.9% |
| 40 to 44 Minutes | 2,068 | 3.3% |
| 45 to 59 Minutes | 2,573 | 4.1% |
| 60 to 89 Minutes | 968 | 1.5% |
| 90 or more Minutes | 730 | 1.1% |
Commute Time by Sex in Olathe
The most common commute times in Olathe are 15 to 19 minutes (6,942 commuters, 20.4%) for males and 15 to 19 minutes (6,365 commuters, 21.5%) for females.
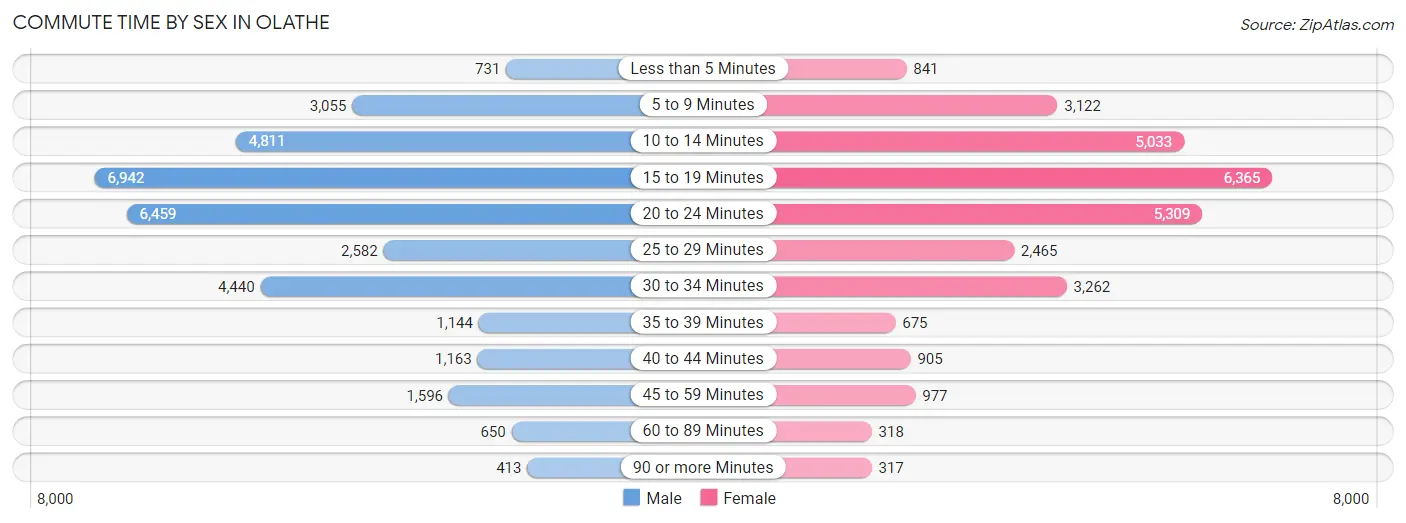
| Commute Time | Male | Female |
| Less than 5 Minutes | 731 (2.1%) | 841 (2.8%) |
| 5 to 9 Minutes | 3,055 (9.0%) | 3,122 (10.5%) |
| 10 to 14 Minutes | 4,811 (14.2%) | 5,033 (17.0%) |
| 15 to 19 Minutes | 6,942 (20.4%) | 6,365 (21.5%) |
| 20 to 24 Minutes | 6,459 (19.0%) | 5,309 (17.9%) |
| 25 to 29 Minutes | 2,582 (7.6%) | 2,465 (8.3%) |
| 30 to 34 Minutes | 4,440 (13.1%) | 3,262 (11.0%) |
| 35 to 39 Minutes | 1,144 (3.4%) | 675 (2.3%) |
| 40 to 44 Minutes | 1,163 (3.4%) | 905 (3.1%) |
| 45 to 59 Minutes | 1,596 (4.7%) | 977 (3.3%) |
| 60 to 89 Minutes | 650 (1.9%) | 318 (1.1%) |
| 90 or more Minutes | 413 (1.2%) | 317 (1.1%) |
Time of Departure to Work by Sex in Olathe
The most frequent times of departure to work in Olathe are 7:00 AM to 7:29 AM (5,348, 15.7%) for males and 7:30 AM to 7:59 AM (5,558, 18.8%) for females.
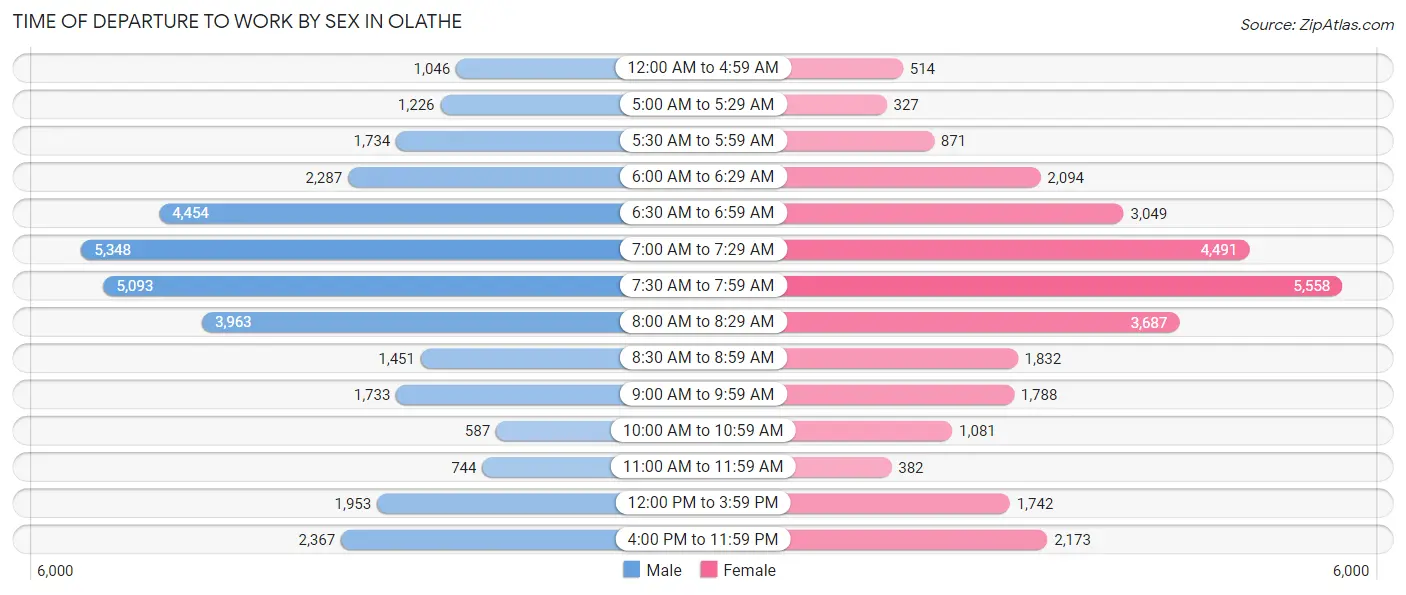
| Time of Departure | Male | Female |
| 12:00 AM to 4:59 AM | 1,046 (3.1%) | 514 (1.7%) |
| 5:00 AM to 5:29 AM | 1,226 (3.6%) | 327 (1.1%) |
| 5:30 AM to 5:59 AM | 1,734 (5.1%) | 871 (2.9%) |
| 6:00 AM to 6:29 AM | 2,287 (6.7%) | 2,094 (7.1%) |
| 6:30 AM to 6:59 AM | 4,454 (13.1%) | 3,049 (10.3%) |
| 7:00 AM to 7:29 AM | 5,348 (15.7%) | 4,491 (15.2%) |
| 7:30 AM to 7:59 AM | 5,093 (15.0%) | 5,558 (18.8%) |
| 8:00 AM to 8:29 AM | 3,963 (11.7%) | 3,687 (12.5%) |
| 8:30 AM to 8:59 AM | 1,451 (4.3%) | 1,832 (6.2%) |
| 9:00 AM to 9:59 AM | 1,733 (5.1%) | 1,788 (6.0%) |
| 10:00 AM to 10:59 AM | 587 (1.7%) | 1,081 (3.6%) |
| 11:00 AM to 11:59 AM | 744 (2.2%) | 382 (1.3%) |
| 12:00 PM to 3:59 PM | 1,953 (5.8%) | 1,742 (5.9%) |
| 4:00 PM to 11:59 PM | 2,367 (7.0%) | 2,173 (7.3%) |
| Total | 33,986 (100.0%) | 29,589 (100.0%) |
Housing Occupancy in Olathe
Occupancy by Ownership in Olathe
Of the total 51,021 dwellings in Olathe, owner-occupied units account for 37,511 (73.5%), while renter-occupied units make up 13,510 (26.5%).
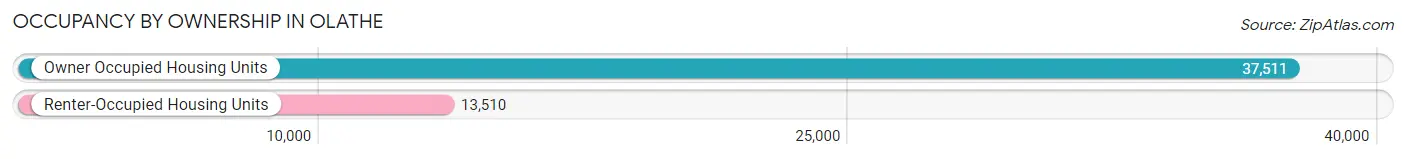
| Occupancy | # Housing Units | % Housing Units |
| Owner Occupied Housing Units | 37,511 | 73.5% |
| Renter-Occupied Housing Units | 13,510 | 26.5% |
| Total Occupied Housing Units | 51,021 | 100.0% |
Occupancy by Household Size in Olathe
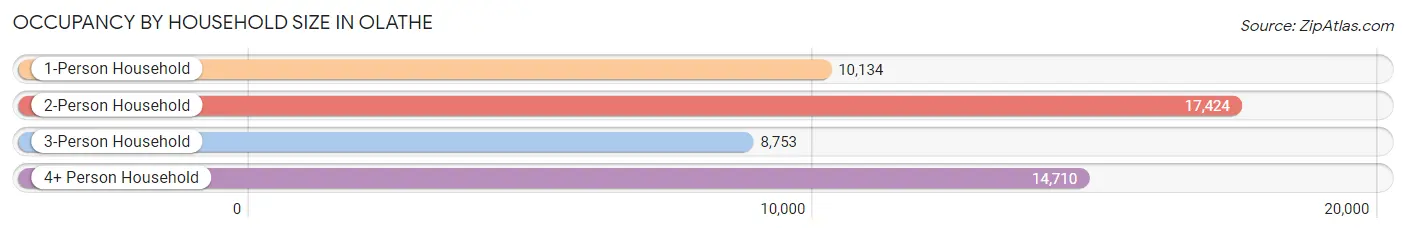
| Household Size | # Housing Units | % Housing Units |
| 1-Person Household | 10,134 | 19.9% |
| 2-Person Household | 17,424 | 34.2% |
| 3-Person Household | 8,753 | 17.2% |
| 4+ Person Household | 14,710 | 28.8% |
| Total Housing Units | 51,021 | 100.0% |
Occupancy by Ownership by Household Size in Olathe
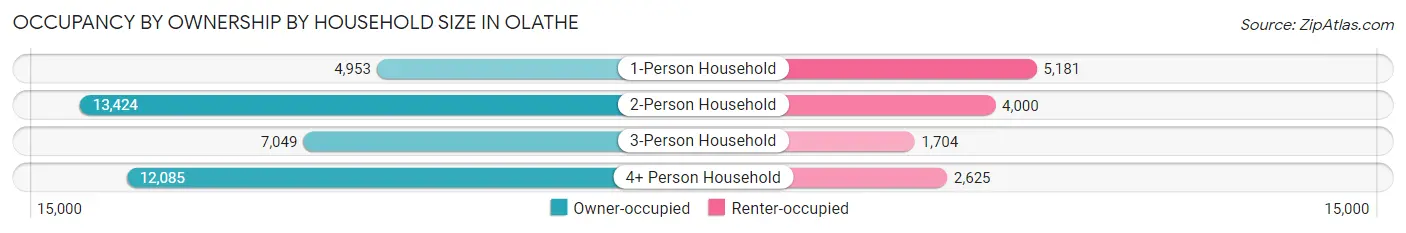
| Household Size | Owner-occupied | Renter-occupied |
| 1-Person Household | 4,953 (48.9%) | 5,181 (51.1%) |
| 2-Person Household | 13,424 (77.0%) | 4,000 (23.0%) |
| 3-Person Household | 7,049 (80.5%) | 1,704 (19.5%) |
| 4+ Person Household | 12,085 (82.2%) | 2,625 (17.8%) |
| Total Housing Units | 37,511 (73.5%) | 13,510 (26.5%) |
Occupancy by Educational Attainment in Olathe
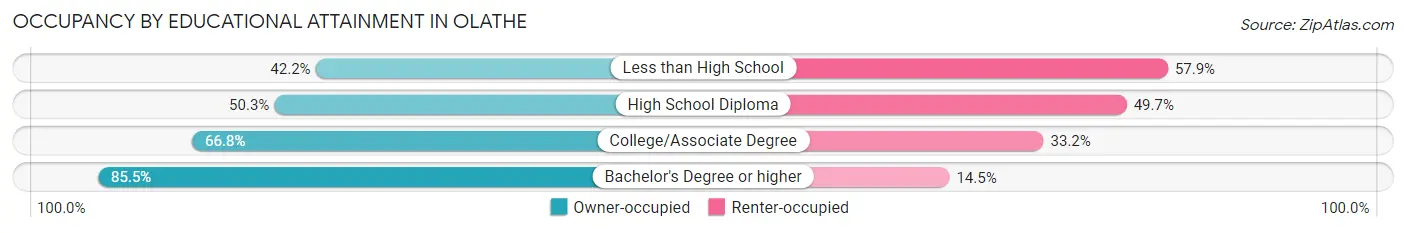
| Household Size | Owner-occupied | Renter-occupied |
| Less than High School | 875 (42.1%) | 1,201 (57.9%) |
| High School Diploma | 3,666 (50.3%) | 3,619 (49.7%) |
| College/Associate Degree | 9,422 (66.8%) | 4,683 (33.2%) |
| Bachelor's Degree or higher | 23,548 (85.5%) | 4,007 (14.5%) |
Occupancy by Age of Householder in Olathe
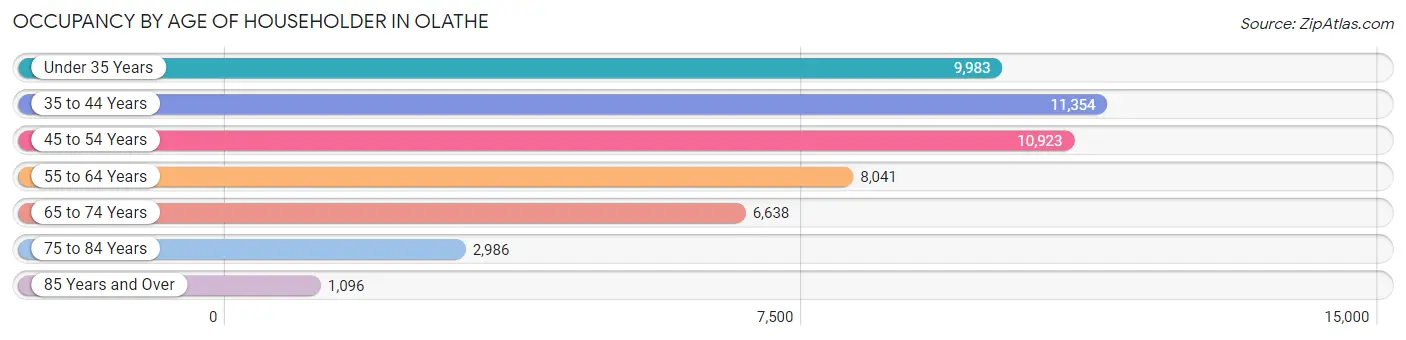
| Age Bracket | # Households | % Households |
| Under 35 Years | 9,983 | 19.6% |
| 35 to 44 Years | 11,354 | 22.3% |
| 45 to 54 Years | 10,923 | 21.4% |
| 55 to 64 Years | 8,041 | 15.8% |
| 65 to 74 Years | 6,638 | 13.0% |
| 75 to 84 Years | 2,986 | 5.9% |
| 85 Years and Over | 1,096 | 2.1% |
| Total | 51,021 | 100.0% |
Housing Finances in Olathe
Median Income by Occupancy in Olathe
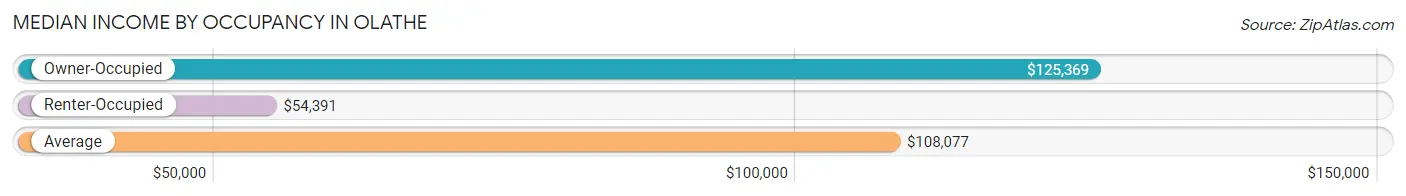
| Occupancy Type | # Households | Median Income |
| Owner-Occupied | 37,511 (73.5%) | $125,369 |
| Renter-Occupied | 13,510 (26.5%) | $54,391 |
| Average | 51,021 (100.0%) | $108,077 |
Occupancy by Householder Income Bracket in Olathe
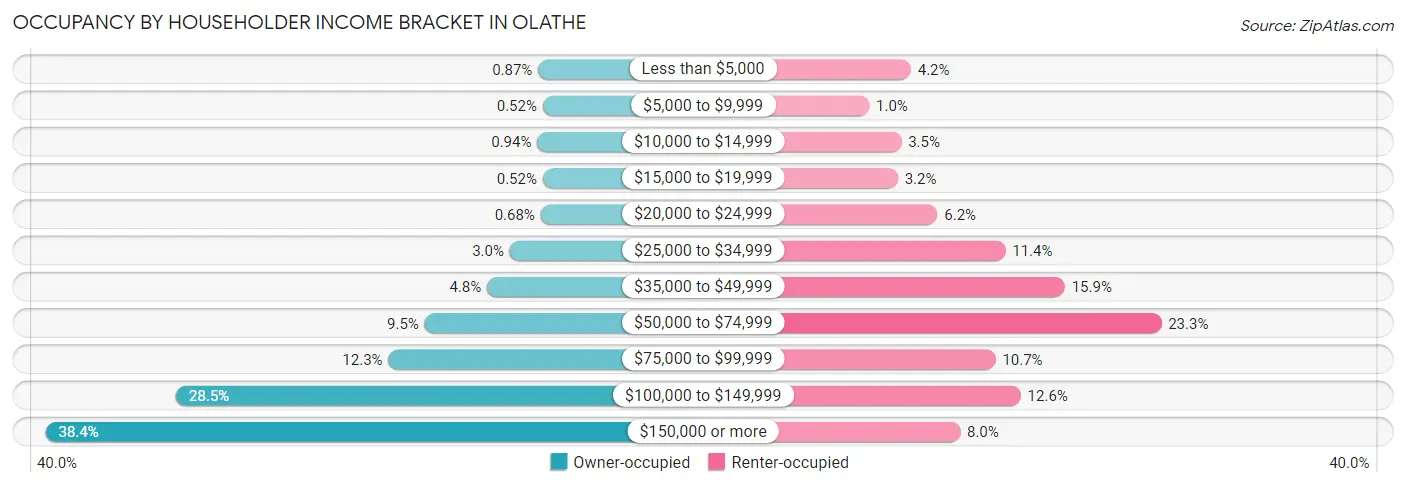
| Income Bracket | Owner-occupied | Renter-occupied |
| Less than $5,000 | 326 (0.9%) | 569 (4.2%) |
| $5,000 to $9,999 | 195 (0.5%) | 139 (1.0%) |
| $10,000 to $14,999 | 354 (0.9%) | 470 (3.5%) |
| $15,000 to $19,999 | 195 (0.5%) | 434 (3.2%) |
| $20,000 to $24,999 | 254 (0.7%) | 842 (6.2%) |
| $25,000 to $34,999 | 1,137 (3.0%) | 1,541 (11.4%) |
| $35,000 to $49,999 | 1,784 (4.8%) | 2,154 (15.9%) |
| $50,000 to $74,999 | 3,572 (9.5%) | 3,146 (23.3%) |
| $75,000 to $99,999 | 4,606 (12.3%) | 1,440 (10.7%) |
| $100,000 to $149,999 | 10,680 (28.5%) | 1,699 (12.6%) |
| $150,000 or more | 14,408 (38.4%) | 1,076 (8.0%) |
| Total | 37,511 (100.0%) | 13,510 (100.0%) |
Monthly Housing Cost Tiers in Olathe
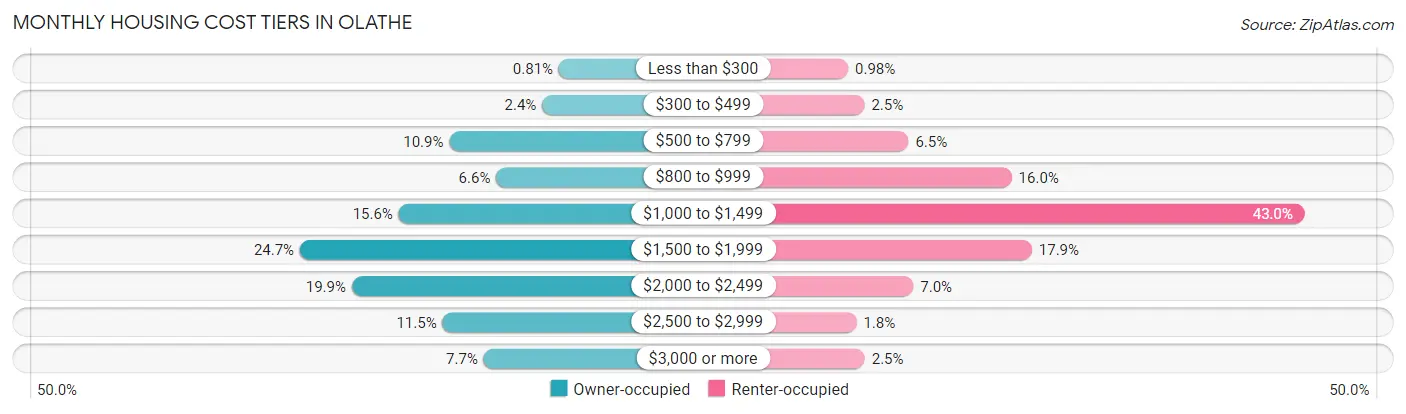
| Monthly Cost | Owner-occupied | Renter-occupied |
| Less than $300 | 304 (0.8%) | 133 (1.0%) |
| $300 to $499 | 881 (2.4%) | 337 (2.5%) |
| $500 to $799 | 4,090 (10.9%) | 884 (6.5%) |
| $800 to $999 | 2,470 (6.6%) | 2,167 (16.0%) |
| $1,000 to $1,499 | 5,838 (15.6%) | 5,812 (43.0%) |
| $1,500 to $1,999 | 9,245 (24.6%) | 2,418 (17.9%) |
| $2,000 to $2,499 | 7,457 (19.9%) | 945 (7.0%) |
| $2,500 to $2,999 | 4,326 (11.5%) | 236 (1.8%) |
| $3,000 or more | 2,900 (7.7%) | 340 (2.5%) |
| Total | 37,511 (100.0%) | 13,510 (100.0%) |
Physical Housing Characteristics in Olathe
Housing Structures in Olathe
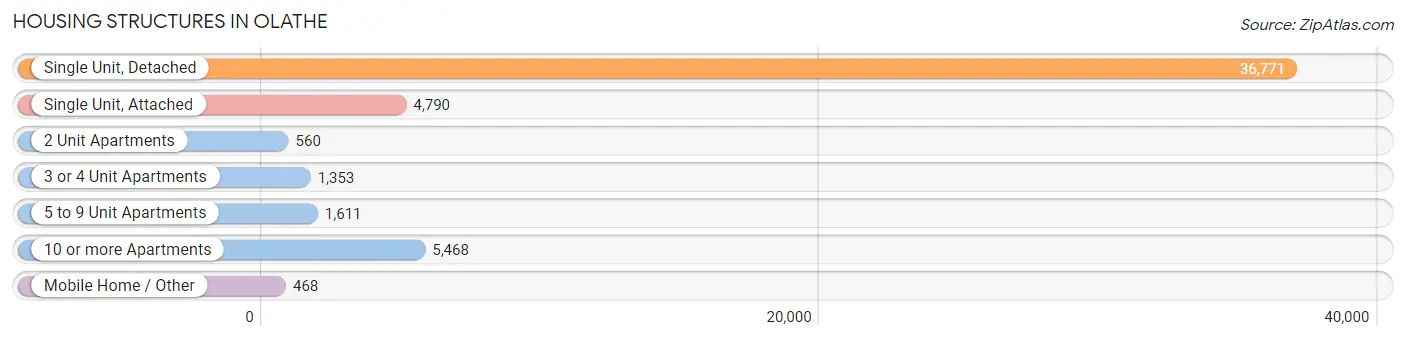
| Structure Type | # Housing Units | % Housing Units |
| Single Unit, Detached | 36,771 | 72.1% |
| Single Unit, Attached | 4,790 | 9.4% |
| 2 Unit Apartments | 560 | 1.1% |
| 3 or 4 Unit Apartments | 1,353 | 2.6% |
| 5 to 9 Unit Apartments | 1,611 | 3.2% |
| 10 or more Apartments | 5,468 | 10.7% |
| Mobile Home / Other | 468 | 0.9% |
| Total | 51,021 | 100.0% |
Housing Structures by Occupancy in Olathe
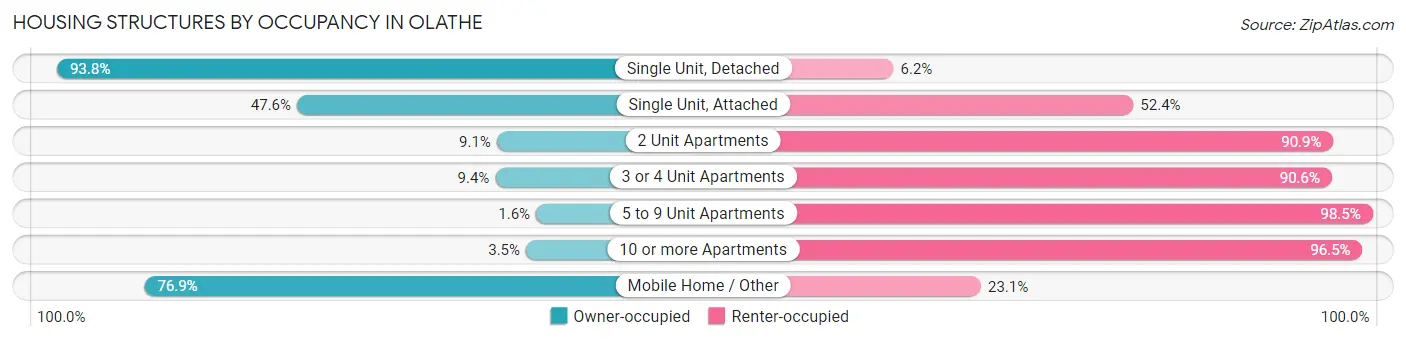
| Structure Type | Owner-occupied | Renter-occupied |
| Single Unit, Detached | 34,478 (93.8%) | 2,293 (6.2%) |
| Single Unit, Attached | 2,279 (47.6%) | 2,511 (52.4%) |
| 2 Unit Apartments | 51 (9.1%) | 509 (90.9%) |
| 3 or 4 Unit Apartments | 127 (9.4%) | 1,226 (90.6%) |
| 5 to 9 Unit Apartments | 25 (1.5%) | 1,586 (98.5%) |
| 10 or more Apartments | 191 (3.5%) | 5,277 (96.5%) |
| Mobile Home / Other | 360 (76.9%) | 108 (23.1%) |
| Total | 37,511 (73.5%) | 13,510 (26.5%) |
Housing Structures by Number of Rooms in Olathe
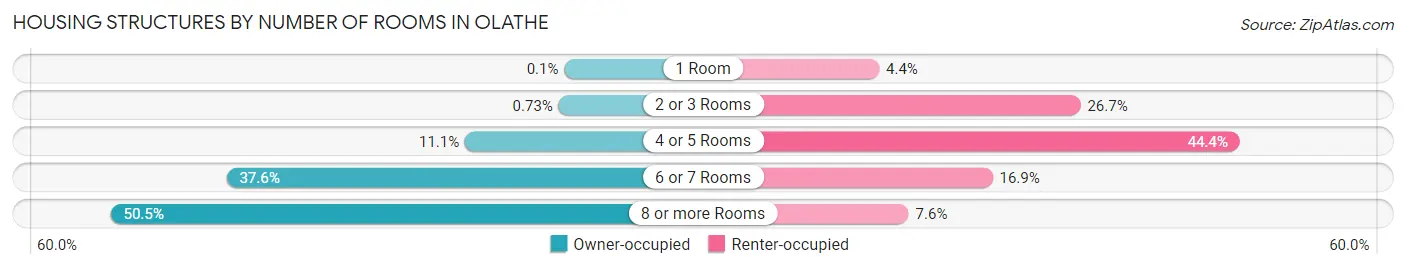
| Number of Rooms | Owner-occupied | Renter-occupied |
| 1 Room | 39 (0.1%) | 588 (4.3%) |
| 2 or 3 Rooms | 274 (0.7%) | 3,607 (26.7%) |
| 4 or 5 Rooms | 4,171 (11.1%) | 5,996 (44.4%) |
| 6 or 7 Rooms | 14,099 (37.6%) | 2,288 (16.9%) |
| 8 or more Rooms | 18,928 (50.5%) | 1,031 (7.6%) |
| Total | 37,511 (100.0%) | 13,510 (100.0%) |
Housing Structure by Heating Type in Olathe
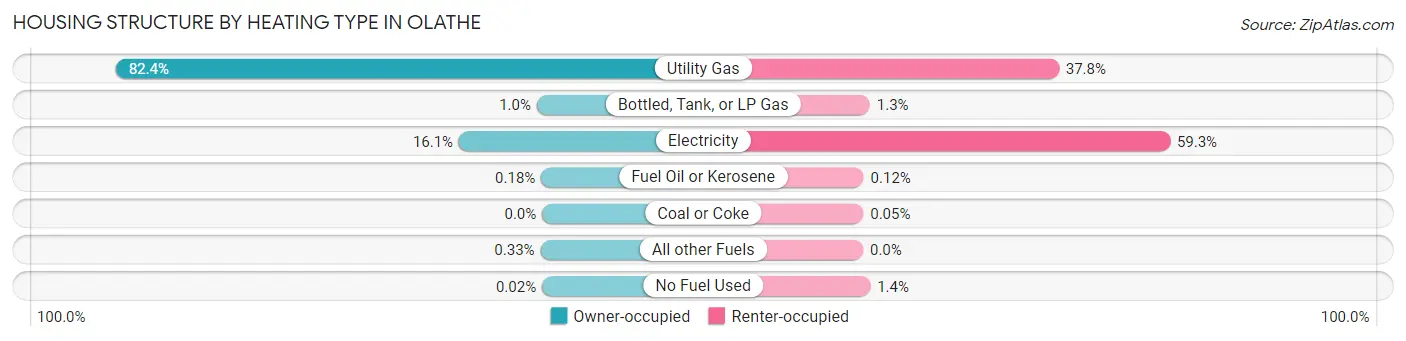
| Heating Type | Owner-occupied | Renter-occupied |
| Utility Gas | 30,906 (82.4%) | 5,109 (37.8%) |
| Bottled, Tank, or LP Gas | 381 (1.0%) | 179 (1.3%) |
| Electricity | 6,028 (16.1%) | 8,011 (59.3%) |
| Fuel Oil or Kerosene | 66 (0.2%) | 16 (0.1%) |
| Coal or Coke | 0 (0.0%) | 7 (0.1%) |
| All other Fuels | 123 (0.3%) | 0 (0.0%) |
| No Fuel Used | 7 (0.0%) | 188 (1.4%) |
| Total | 37,511 (100.0%) | 13,510 (100.0%) |
Household Vehicle Usage in Olathe
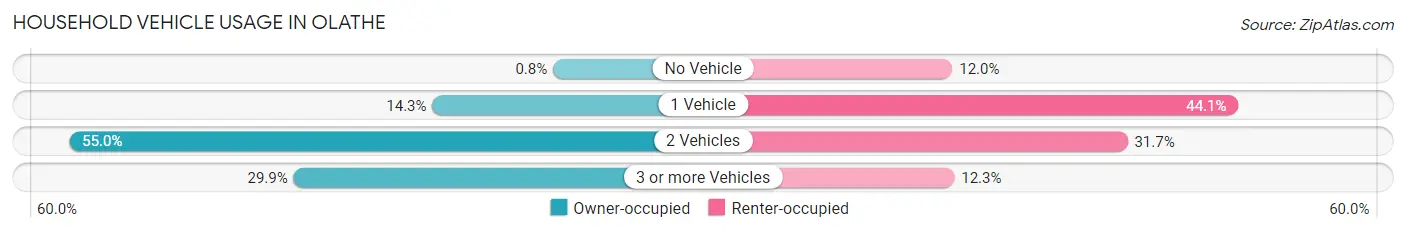
| Vehicles per Household | Owner-occupied | Renter-occupied |
| No Vehicle | 299 (0.8%) | 1,625 (12.0%) |
| 1 Vehicle | 5,371 (14.3%) | 5,954 (44.1%) |
| 2 Vehicles | 20,637 (55.0%) | 4,276 (31.7%) |
| 3 or more Vehicles | 11,204 (29.9%) | 1,655 (12.2%) |
| Total | 37,511 (100.0%) | 13,510 (100.0%) |
Real Estate & Mortgages in Olathe
Real Estate and Mortgage Overview in Olathe
| Characteristic | Without Mortgage | With Mortgage |
| Housing Units | 8,866 | 28,645 |
| Median Property Value | $303,000 | $321,600 |
| Median Household Income | $101,062 | $12,255 |
| Monthly Housing Costs | $764 | $2,843 |
| Real Estate Taxes | $3,827 | $471 |
Property Value by Mortgage Status in Olathe
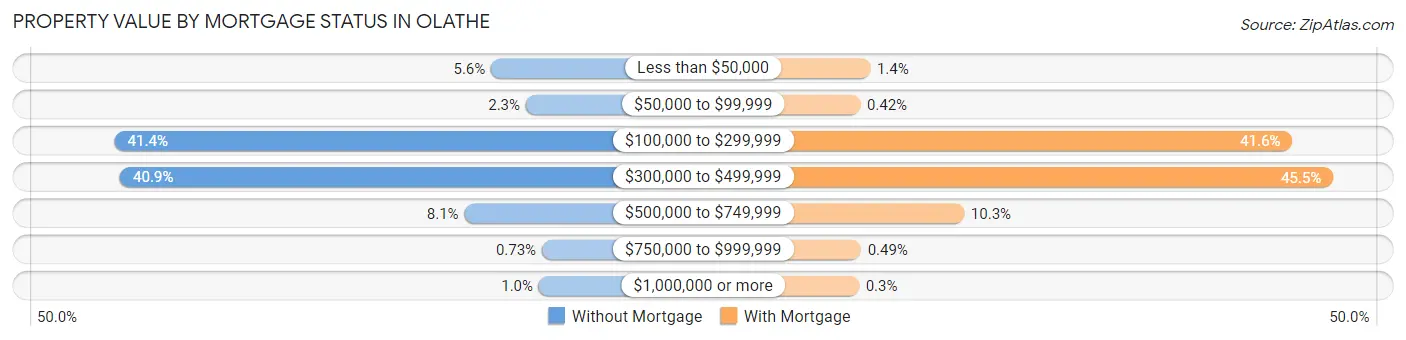
| Property Value | Without Mortgage | With Mortgage |
| Less than $50,000 | 494 (5.6%) | 393 (1.4%) |
| $50,000 to $99,999 | 200 (2.3%) | 121 (0.4%) |
| $100,000 to $299,999 | 3,672 (41.4%) | 11,917 (41.6%) |
| $300,000 to $499,999 | 3,626 (40.9%) | 13,030 (45.5%) |
| $500,000 to $749,999 | 719 (8.1%) | 2,957 (10.3%) |
| $750,000 to $999,999 | 65 (0.7%) | 140 (0.5%) |
| $1,000,000 or more | 90 (1.0%) | 87 (0.3%) |
| Total | 8,866 (100.0%) | 28,645 (100.0%) |
Household Income by Mortgage Status in Olathe
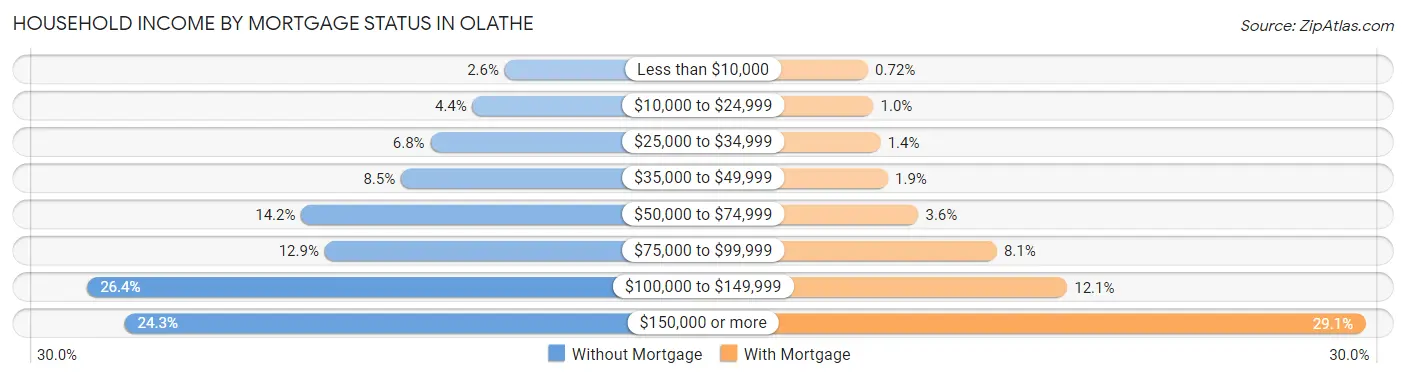
| Household Income | Without Mortgage | With Mortgage |
| Less than $10,000 | 227 (2.6%) | 206 (0.7%) |
| $10,000 to $24,999 | 390 (4.4%) | 294 (1.0%) |
| $25,000 to $34,999 | 604 (6.8%) | 413 (1.4%) |
| $35,000 to $49,999 | 753 (8.5%) | 533 (1.9%) |
| $50,000 to $74,999 | 1,258 (14.2%) | 1,031 (3.6%) |
| $75,000 to $99,999 | 1,139 (12.9%) | 2,314 (8.1%) |
| $100,000 to $149,999 | 2,342 (26.4%) | 3,467 (12.1%) |
| $150,000 or more | 2,153 (24.3%) | 8,338 (29.1%) |
| Total | 8,866 (100.0%) | 28,645 (100.0%) |
Property Value to Household Income Ratio in Olathe
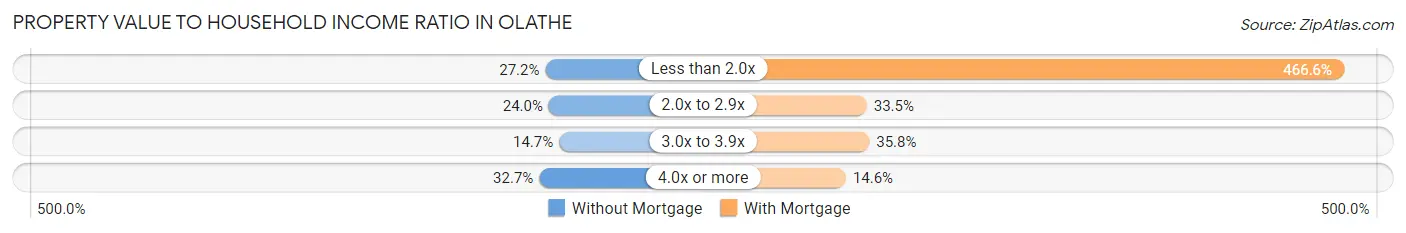
| Value-to-Income Ratio | Without Mortgage | With Mortgage |
| Less than 2.0x | 2,411 (27.2%) | 133,665 (466.6%) |
| 2.0x to 2.9x | 2,130 (24.0%) | 9,599 (33.5%) |
| 3.0x to 3.9x | 1,305 (14.7%) | 10,250 (35.8%) |
| 4.0x or more | 2,903 (32.7%) | 4,172 (14.6%) |
| Total | 8,866 (100.0%) | 28,645 (100.0%) |
Real Estate Taxes by Mortgage Status in Olathe
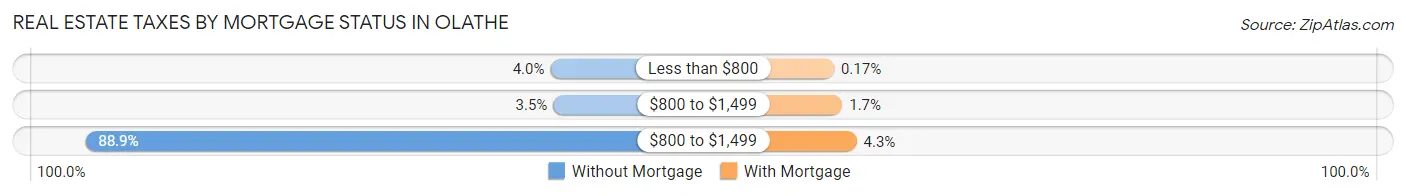
| Property Taxes | Without Mortgage | With Mortgage |
| Less than $800 | 353 (4.0%) | 50 (0.2%) |
| $800 to $1,499 | 307 (3.5%) | 484 (1.7%) |
| $800 to $1,499 | 7,883 (88.9%) | 1,231 (4.3%) |
| Total | 8,866 (100.0%) | 28,645 (100.0%) |
Health & Disability in Olathe
Health Insurance Coverage by Age in Olathe
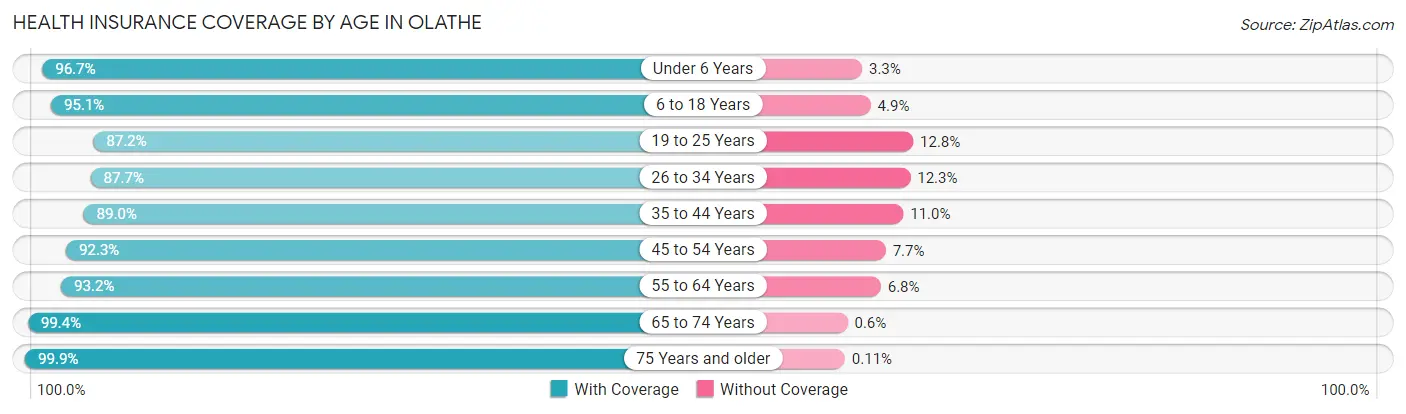
| Age Bracket | With Coverage | Without Coverage |
| Under 6 Years | 10,859 (96.7%) | 372 (3.3%) |
| 6 to 18 Years | 27,517 (95.1%) | 1,424 (4.9%) |
| 19 to 25 Years | 9,442 (87.2%) | 1,390 (12.8%) |
| 26 to 34 Years | 14,102 (87.7%) | 1,979 (12.3%) |
| 35 to 44 Years | 20,403 (89.0%) | 2,524 (11.0%) |
| 45 to 54 Years | 17,682 (92.3%) | 1,479 (7.7%) |
| 55 to 64 Years | 13,446 (93.2%) | 983 (6.8%) |
| 65 to 74 Years | 10,769 (99.4%) | 65 (0.6%) |
| 75 Years and older | 6,488 (99.9%) | 7 (0.1%) |
| Total | 130,708 (92.7%) | 10,223 (7.2%) |
Health Insurance Coverage by Citizenship Status in Olathe
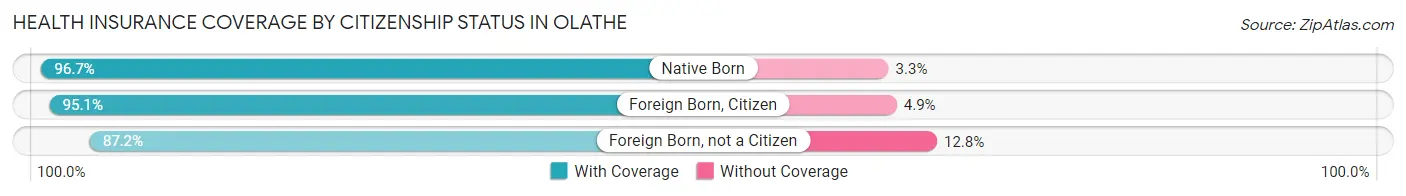
| Citizenship Status | With Coverage | Without Coverage |
| Native Born | 10,859 (96.7%) | 372 (3.3%) |
| Foreign Born, Citizen | 27,517 (95.1%) | 1,424 (4.9%) |
| Foreign Born, not a Citizen | 9,442 (87.2%) | 1,390 (12.8%) |
Health Insurance Coverage by Household Income in Olathe
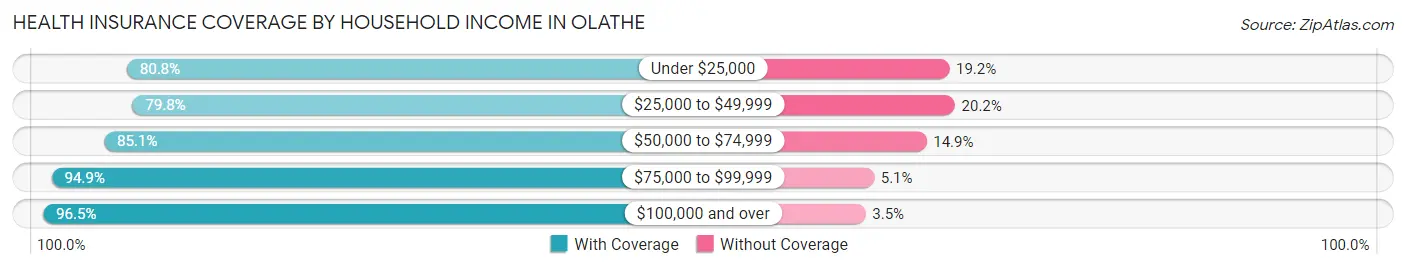
| Household Income | With Coverage | Without Coverage |
| Under $25,000 | 5,246 (80.8%) | 1,243 (19.2%) |
| $25,000 to $49,999 | 10,652 (79.8%) | 2,696 (20.2%) |
| $50,000 to $74,999 | 13,271 (85.1%) | 2,322 (14.9%) |
| $75,000 to $99,999 | 14,717 (94.9%) | 784 (5.1%) |
| $100,000 and over | 86,073 (96.5%) | 3,100 (3.5%) |
Public vs Private Health Insurance Coverage by Age in Olathe
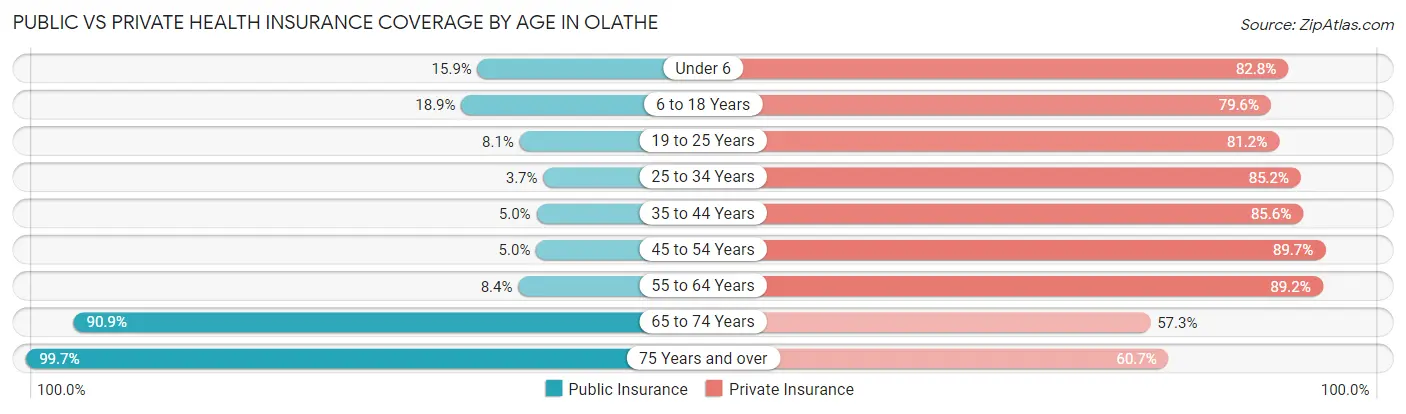
| Age Bracket | Public Insurance | Private Insurance |
| Under 6 | 1,787 (15.9%) | 9,300 (82.8%) |
| 6 to 18 Years | 5,479 (18.9%) | 23,048 (79.6%) |
| 19 to 25 Years | 877 (8.1%) | 8,790 (81.1%) |
| 25 to 34 Years | 597 (3.7%) | 13,699 (85.2%) |
| 35 to 44 Years | 1,145 (5.0%) | 19,625 (85.6%) |
| 45 to 54 Years | 964 (5.0%) | 17,185 (89.7%) |
| 55 to 64 Years | 1,206 (8.4%) | 12,874 (89.2%) |
| 65 to 74 Years | 9,849 (90.9%) | 6,202 (57.3%) |
| 75 Years and over | 6,475 (99.7%) | 3,939 (60.7%) |
| Total | 28,379 (20.1%) | 114,662 (81.4%) |
Disability Status by Sex by Age in Olathe
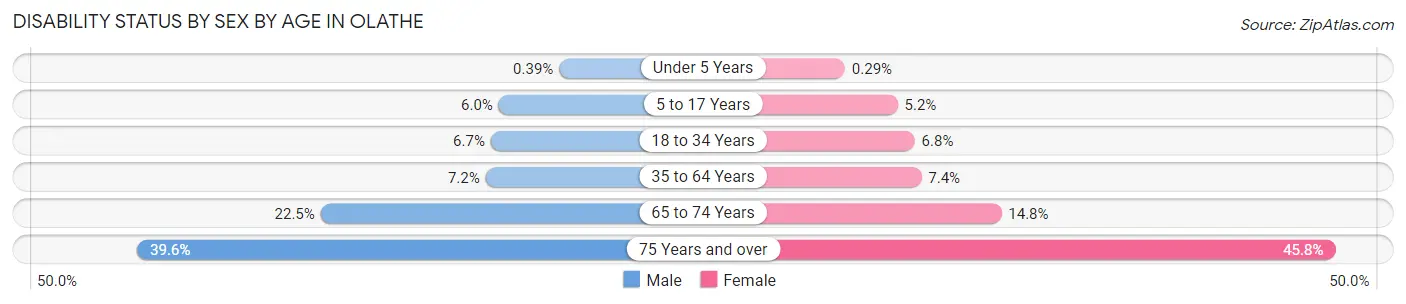
| Age Bracket | Male | Female |
| Under 5 Years | 17 (0.4%) | 13 (0.3%) |
| 5 to 17 Years | 914 (6.0%) | 721 (5.2%) |
| 18 to 34 Years | 995 (6.7%) | 969 (6.8%) |
| 35 to 64 Years | 2,007 (7.2%) | 2,120 (7.4%) |
| 65 to 74 Years | 1,216 (22.5%) | 805 (14.8%) |
| 75 Years and over | 1,004 (39.6%) | 1,812 (45.8%) |
Disability Class by Sex by Age in Olathe
Disability Class: Hearing Difficulty
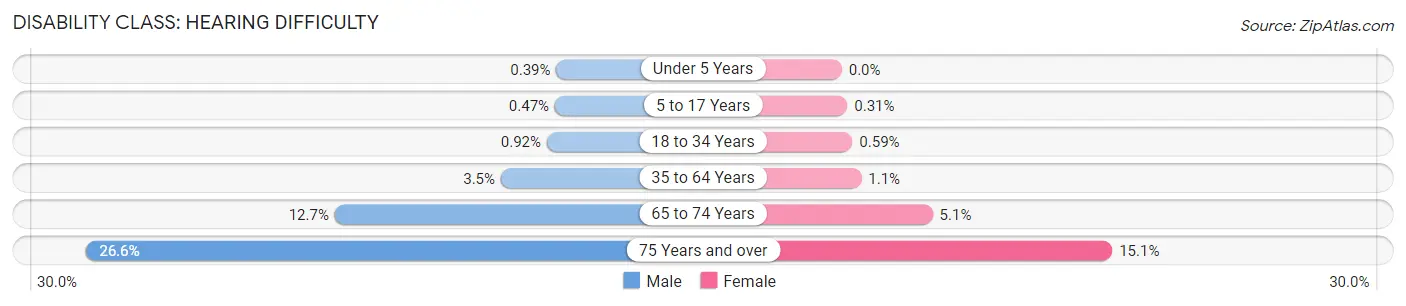
| Age Bracket | Male | Female |
| Under 5 Years | 17 (0.4%) | 0 (0.0%) |
| 5 to 17 Years | 71 (0.5%) | 43 (0.3%) |
| 18 to 34 Years | 135 (0.9%) | 85 (0.6%) |
| 35 to 64 Years | 967 (3.5%) | 313 (1.1%) |
| 65 to 74 Years | 687 (12.7%) | 275 (5.1%) |
| 75 Years and over | 674 (26.6%) | 596 (15.1%) |
Disability Class: Vision Difficulty
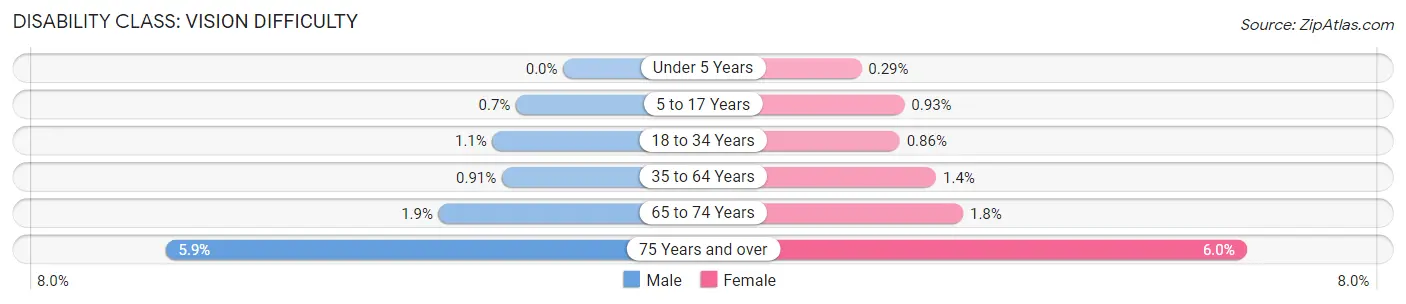
| Age Bracket | Male | Female |
| Under 5 Years | 0 (0.0%) | 13 (0.3%) |
| 5 to 17 Years | 106 (0.7%) | 129 (0.9%) |
| 18 to 34 Years | 155 (1.1%) | 123 (0.9%) |
| 35 to 64 Years | 254 (0.9%) | 402 (1.4%) |
| 65 to 74 Years | 100 (1.8%) | 98 (1.8%) |
| 75 Years and over | 150 (5.9%) | 238 (6.0%) |
Disability Class: Cognitive Difficulty
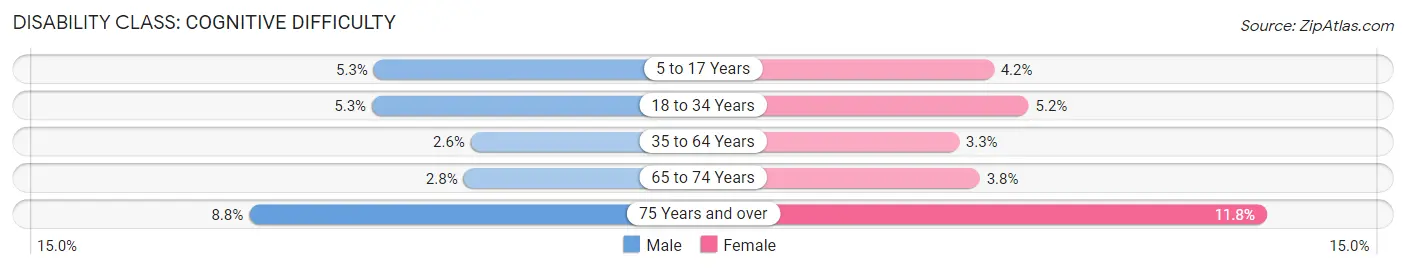
| Age Bracket | Male | Female |
| 5 to 17 Years | 804 (5.3%) | 589 (4.2%) |
| 18 to 34 Years | 786 (5.3%) | 746 (5.2%) |
| 35 to 64 Years | 717 (2.6%) | 936 (3.3%) |
| 65 to 74 Years | 150 (2.8%) | 209 (3.8%) |
| 75 Years and over | 222 (8.7%) | 468 (11.8%) |
Disability Class: Ambulatory Difficulty
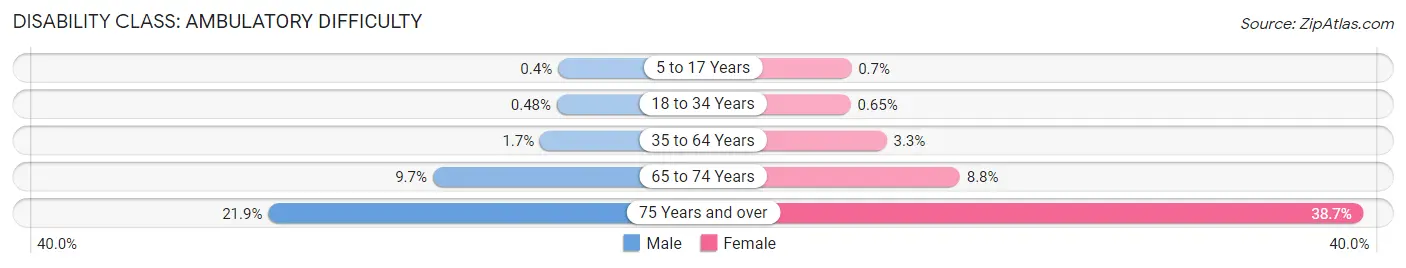
| Age Bracket | Male | Female |
| 5 to 17 Years | 61 (0.4%) | 97 (0.7%) |
| 18 to 34 Years | 71 (0.5%) | 93 (0.6%) |
| 35 to 64 Years | 482 (1.7%) | 955 (3.3%) |
| 65 to 74 Years | 523 (9.7%) | 476 (8.8%) |
| 75 Years and over | 556 (21.9%) | 1,533 (38.7%) |
Disability Class: Self-Care Difficulty
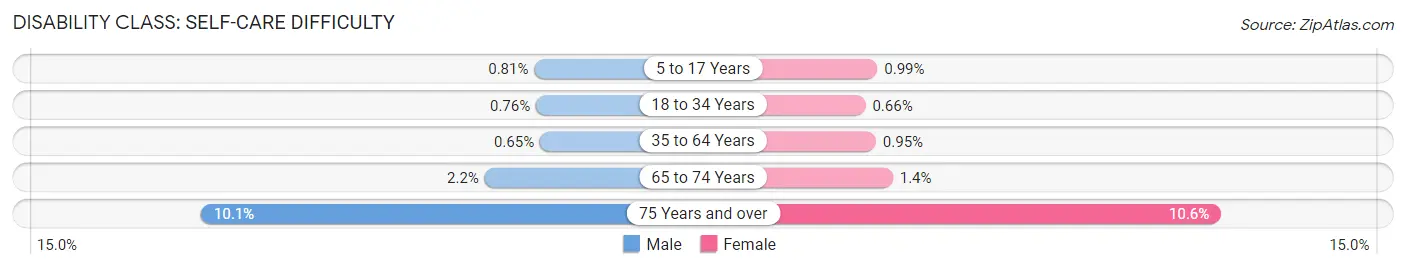
| Age Bracket | Male | Female |
| 5 to 17 Years | 123 (0.8%) | 138 (1.0%) |
| 18 to 34 Years | 112 (0.8%) | 95 (0.7%) |
| 35 to 64 Years | 181 (0.6%) | 274 (0.9%) |
| 65 to 74 Years | 118 (2.2%) | 77 (1.4%) |
| 75 Years and over | 256 (10.1%) | 418 (10.6%) |
Technology Access in Olathe
Computing Device Access in Olathe
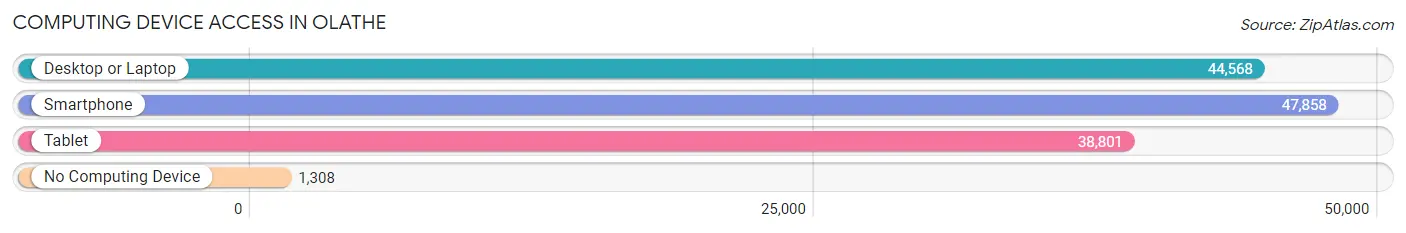
| Device Type | # Households | % Households |
| Desktop or Laptop | 44,568 | 87.4% |
| Smartphone | 47,858 | 93.8% |
| Tablet | 38,801 | 76.0% |
| No Computing Device | 1,308 | 2.6% |
| Total | 51,021 | 100.0% |
Internet Access in Olathe
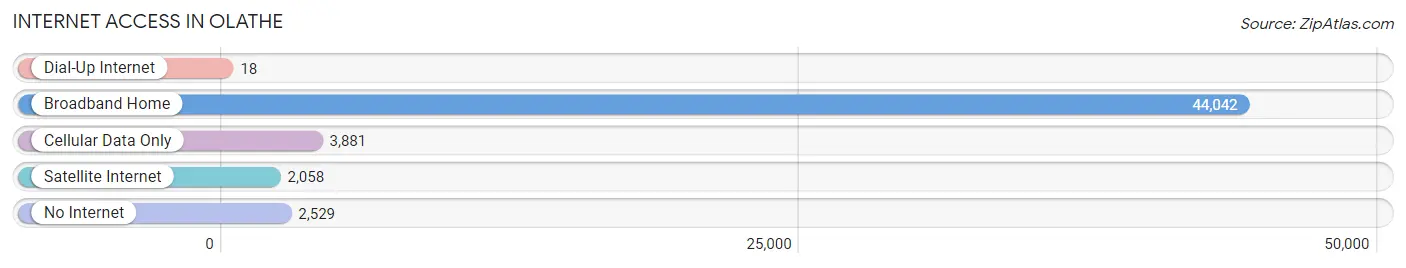
| Internet Type | # Households | % Households |
| Dial-Up Internet | 18 | 0.0% |
| Broadband Home | 44,042 | 86.3% |
| Cellular Data Only | 3,881 | 7.6% |
| Satellite Internet | 2,058 | 4.0% |
| No Internet | 2,529 | 5.0% |
| Total | 51,021 | 100.0% |
Olathe Summary
Olathe, Kansas is a city located in Johnson County, Kansas, United States. It is the county seat of Johnson County and the fourth-largest city in the state. As of the 2010 census, the city population was 125,872, making it the largest city in Johnson County. Olathe is located in the Kansas City metropolitan area and is part of the Kansas City metropolitan statistical area.
History
Olathe was founded in 1857 by Dr. John T. Barton, a physician from Ohio. He named the city after the Shawnee word for "beautiful". The city was incorporated in 1857 and was the first city in Johnson County.
In the late 19th century, Olathe was a major stop on the Santa Fe Trail. The city was also home to a large number of German immigrants, who established a number of businesses in the area.
Geography
Olathe is located in Johnson County, Kansas, at the intersection of Interstate 35 and US Highway 169. The city is situated on the banks of the Kansas River, and is bordered by the cities of Overland Park, Lenexa, and Gardner.
The city has a total area of 44.3 square miles, of which 44.2 square miles is land and 0.1 square miles is water.
Economy
Olathe is home to a number of major employers, including Garmin, Honeywell, and Johnson County Community College. The city is also home to a number of smaller businesses, including a number of technology companies.
The city's economy is largely based on the service industry, with a number of restaurants, hotels, and retail stores located in the city. Olathe is also home to a number of manufacturing companies, including a number of automotive parts suppliers.
Demographics
As of the 2010 census, the city had a population of 125,872. The racial makeup of the city was 79.2% White, 8.2% African American, 0.5% Native American, 5.2% Asian, 0.1% Pacific Islander, 3.3% from other races, and 3.5% from two or more races. Hispanic or Latino of any race were 8.7% of the population.
The median income for a household in the city was $62,945, and the median income for a family was $76,945. The per capita income for the city was $30,945. About 4.2% of families and 6.2% of the population were below the poverty line, including 8.2% of those under age 18 and 4.2% of those age 65 or over.
Conclusion
Olathe, Kansas is a city located in Johnson County, Kansas, United States. It is the county seat of Johnson County and the fourth-largest city in the state. As of the 2010 census, the city population was 125,872, making it the largest city in Johnson County. Olathe is located in the Kansas City metropolitan area and is part of the Kansas City metropolitan statistical area. The city was founded in 1857 by Dr. John T. Barton, a physician from Ohio, and was incorporated in 1857. The city has a total area of 44.3 square miles, of which 44.2 square miles is land and 0.1 square miles is water. The city's economy is largely based on the service industry, with a number of restaurants, hotels, and retail stores located in the city. As of the 2010 census, the city had a population of 125,872, with a median income for a household of $62,945 and a median income for a family of $76,945.
Common Questions
What is Per Capita Income in Olathe?
Per Capita income in Olathe is $46,299.
What is the Median Family Income in Olathe?
Median Family Income in Olathe is $118,875.
What is the Median Household income in Olathe?
Median Household Income in Olathe is $108,077.
What is Income or Wage Gap in Olathe?
Income or Wage Gap in Olathe is 32.9%.
Women in Olathe earn 67.1 cents for every dollar earned by a man.
What is Family Income Deficit in Olathe?
Family Income Deficit in Olathe is $9,981.
Families that are below poverty line in Olathe earn $9,981 less on average than the poverty threshold level.
What is Inequality or Gini Index in Olathe?
Inequality or Gini Index in Olathe is 0.40.
What is the Total Population of Olathe?
Total Population of Olathe is 142,114.
What is the Total Male Population of Olathe?
Total Male Population of Olathe is 70,741.
What is the Total Female Population of Olathe?
Total Female Population of Olathe is 71,373.
What is the Ratio of Males per 100 Females in Olathe?
There are 99.11 Males per 100 Females in Olathe.
What is the Ratio of Females per 100 Males in Olathe?
There are 100.89 Females per 100 Males in Olathe.
What is the Median Population Age in Olathe?
Median Population Age in Olathe is 36.3 Years.
What is the Average Family Size in Olathe
Average Family Size in Olathe is 3.2 People.
What is the Average Household Size in Olathe
Average Household Size in Olathe is 2.8 People.
How Large is the Labor Force in Olathe?
There are 80,135 People in the Labor Forcein in Olathe.
What is the Percentage of People in the Labor Force in Olathe?
73.6% of People are in the Labor Force in Olathe.
What is the Unemployment Rate in Olathe?
Unemployment Rate in Olathe is 3.2%.